Brintons Library of Aboriginal American Literature - Forgotten ...
Randall et al. BMC Public Health 2012, 12:281http://www.biomedcentral.com/1471-2458/12/281
RESEARCH ARTICLE Open Access
Mortality after admission for acute myocardialinfarction in Aboriginal and non-Aboriginalpeople in New South Wales, Australia: a multileveldata linkage studyDeborah A Randall1*, Louisa R Jorm1,2, Sanja Lujic1, Aiden J O’Loughlin1, Timothy R Churches2, Mary M Haines2,Sandra J Eades3 and Alastair H Leyland4
Abstract
Background: Heart disease is a leading cause of the gap in burden of disease between Aboriginal and non-Aboriginal Australians. Our study investigated short- and long-term mortality after admission for Aboriginal andnon-Aboriginal people admitted with acute myocardial infarction (AMI) to public hospitals in New South Wales,Australia, and examined the impact of the hospital of admission on outcomes.
Methods: Admission records were linked to mortality records for 60047 patients aged 25–84 years admitted with adiagnosis of AMI between July 2001 and December 2008. Multilevel logistic regression was used to estimateadjusted odds ratios (AOR) for 30- and 365-day all-cause mortality.
Results: Aboriginal patients admitted with an AMI were younger than non-Aboriginal patients, and more likely tobe admitted to lower volume, remote hospitals without on-site angiography. Adjusting for age, sex, year andhospital, Aboriginal patients had a similar 30-day mortality risk to non-Aboriginal patients (AOR: 1.07; 95% CI 0.83-1.37) but a higher risk of dying within 365 days (AOR: 1.34; 95% CI 1.10-1.63). The latter difference did not persistafter adjustment for comorbid conditions (AOR: 1.12; 95% CI 0.91-1.38). Patients admitted to more remote hospitals,those with lower patient volume and those without on-site angiography had increased risk of short and long-termmortality regardless of Aboriginal status.
Conclusions: Improving access to larger hospitals and those with specialist cardiac facilities could improveoutcomes following AMI for all patients. However, major efforts to boost primary and secondary prevention of AMIare required to reduce the mortality gap between Aboriginal and non-Aboriginal people.
Keywords: Hospital performance, Acute myocardial infarction, Ischaemic heart disease, Aboriginal health, Healthoutcomes, Multilevel modelling, Data linkage
BackgroundThe health of Aboriginal and Torres Strait Islander Aus-tralians is worse than that of other Australians acrossevery conceivable health indicator [1]. The determinantsof the disproportionate ill-health among Aboriginalpeople include higher levels of behavioural, biomedicaland psychosocial risk factors, in combination with lesser
* Correspondence: [email protected] of Medicine, University of Western Sydney, Narellan Road,Campbelltown, NSW, AustraliaFull list of author information is available at the end of the article
© 2012 Randall et al; licensee BioMed CentralCommons Attribution License (http://creativecreproduction in any medium, provided the or
access to appropriate health services and lower socio-economic status (SES) [1-5].While the determinants are complex, the results are
clear – Aboriginal Australians have a burden of diseasewhich is two-and-a-half times that of non-AboriginalAustralians [1], and an estimated gap in life expectancythat is greater than that in other developed countries [6].Ischaemic heart disease (IHD) accounts for 14% of thegap in burden of disease [2], and Aboriginal Australianshave higher age-adjusted rates of incidence, hospital ad-mission and mortality for acute myocardial infarction
Ltd. This is an Open Access article distributed under the terms of the Creativeommons.org/licenses/by/2.0), which permits unrestricted use, distribution, andiginal work is properly cited.
Randall et al. BMC Public Health 2012, 12:281 Page 2 of 11http://www.biomedcentral.com/1471-2458/12/281
(AMI), the acute form of IHD [3,7-9]. While severalstudies have compared rates of invasive interventions[7,9-11], none has quantified the impact of hospital careon variations in short-term and long-term outcomes forAboriginal and non-Aboriginal people after admissionfor AMI.This study investigated short- and long-term mortality
after admission for Aboriginal and non-Aboriginal resi-dents of New South Wales (NSW) admitted to hospitalwith AMI and also investigated the impact of hospital ofadmission on outcomes.
MethodsStudy designObservational cohort study using linked hospital andmortality data.
Data sourcesThe NSW Admitted Patients Data Collection (APDC)includes records for all NSW public and private hospitalseparations (hospital admissions ending in a discharge,transfer, type-change or death). Patient demographicsand multiple diagnoses and procedures are recorded foreach separation and coded according to the Australianmodification of the International Statistical Classificationof Diseases and Related Problems (diagnoses) and theAustralian Classification of Health Interventions (proce-dures) [12]. The NSW Register of Births, Deaths andMarriages (RBDM) captures details of all deaths regis-tered in NSW.
Probabilistic linkageThe APDC from 1 July 2000 to 31 December 2008 waslinked with the RBDM from 1 July 2000 to 31 December2009. Personal identifiers (including full name, date ofbirth, sex and address) from the datasets were linkedusing probabilistic methods by the Centre for HealthRecord Linkage [13]. The researchers were supplied withde-identified APDC and RBDM data and merged theseusing a project-specific unique person number.
SettingNSW is the most populous state in Australia with anestimated 6.8 million residents in 2006, 2.2% who iden-tify as Aboriginal and/or Torres Strait Islander [14]. Ap-proximately 30% of Australia’s Aboriginal peoples live inNSW, the largest percentage of all the States and Terri-tories in Australia. In 2006, 73% of the total NSW popu-lation lived in a major city [15] compared with 42% ofthe NSW Aboriginal population [16]. The median age ofAboriginal people in NSW in 2006 was 20.6 years [17]while the median age for non-Aboriginal people was38.6 years [18].
ParticipantsThe participants were NSW residents aged 25 to 84 whowere admitted to a public hospital with a primary diag-nosis of acute myocardial infarction (AMI, ICD-10-AMcode ‘I21’) or ischaemic heart disease (IHD, ICD-10-AMcodes ‘I20’-‘I25’) with a diagnosis of AMI in the secondor third diagnosis fields, and where the admission wasclassified as both ‘acute care’ and ‘emergency’. Only firstadmissions to public hospitals were included, becausethe linkage for private hospitals was not of the samequality as for public hospitals. The first such admissionin the period July 2001 to December 2008 was chosen asthe index admission for analysis, with at least a one-yearclearance period for previous admissions for AMI. Thecohort thus consisted of cases whose index admissionwas their first-ever as well as those who had an AMI ad-mission prior to July 2000. A sensitivity analysis exclud-ing previously-admitted cases with clearance periods ofbetween one and four years found no significant differ-ence in the Aboriginal to non-Aboriginal 30-day and365-day mortality ratios. Patients were excluded if theyhad missing data or appeared to be duplicate admissions(244 non-Aboriginal and 3 Aboriginal records). Theexcluded records had the same percentage of deathswithin 30 days as the final data set (9%). The final dataset included 60047 patients (1183 Aboriginal, 58864non-Aboriginal) admitted to 174 public hospitals inNSW.
Analysis variablesThe main outcomes were 30-day and 365-day all-causemortality after hospital admission. The main variable ofinterest was whether the patient identified as Aboriginal.This was determined based on the standard question,“Are you of Aboriginal or Torres Strait Islander origin?”,recorded in the hospital data. In 2007, an audit was con-ducted and the percentage of Aboriginal and TorresStrait Islander patients correctly identified in NSW pub-lic hospitals was estimated to be 88% [19]. While identi-fication is thought to have improved over time, therewere no audits previously published for NSW [20]. How-ever, the Australian Institute of Health and Welfare usedan under-identification factor of 30% to correct expend-iture data for 1998–99 and 2001–02 for NSW hospitaldata [20]. Probabilistic linkage provided opportunitiesfor identification across the entire admission history foreach individual but in the absence of an external sourceof Aboriginal status to validate identification algorithms,we defined Aboriginal people in our study (Aboriginaland/or Torres Strait Islander) based on the most recentpublic hospital admission recorded for each person. Thiswas thought to be the most accurate method due toimprovements in identification over time [19,20]. A sen-sitivity analysis was carried out using two alternative

Randall et al. BMC Public Health 2012, 12:281 Page 3 of 11http://www.biomedcentral.com/1471-2458/12/281
definitions: identified as Aboriginal on every admission(‘all admissions’) or on at least one admission (‘everidentified’).Comorbidities were measured with the Ontario AMI
mortality prediction rule (OAMIMPR) [21] conditions,developed in Ontario, Canada for risk adjustment specif-ically after AMI admission, and were supplemented withadditional Charlson Comorbidity Index conditions [22]that had a significant age-, sex- and year-adjusted associ-ation with 30-day or 365-day mortality. All comorbiditieswere collected with a one-year look-back that includedany comorbid conditions recorded on the APDC for eachperson for a full year before the AMI admission as well ason the admission record. Socio-economic status was clas-sified using the ABS Socio-Economic Index for AreasIndex of Relative Social Disadvantage (SEIFA IRSD) basedon Statistical Local Area (SLA) of residence, and dividedinto population quintile groups. Remoteness of residencewas ascertained using the Accessibility/Remoteness Indexof Australia (ARIA+) for SLA of residence, grouped intofour categories (major city, inner regional, outer re-gional and remote/very remote). The hospital of ana-lysis was the first hospital of admission in the AMIadmission episode. There were three hospital-levelvariables: hospital remoteness (ARIA + group of thehospital based on postcode), hospital size (the averagenumber of all acute admissions per year between2001 and 2008, calculated for each hospital anddivided into five groups at the 50th, 75th, 85th and95th percentiles for hospitals), and the presence orabsence of on-site cardiac angiography facilities.
Statistical analysisCharacteristics of Aboriginal and non-Aboriginal peopleadmitted with AMI were compared using χ2 tests.Comorbidities were additionally compared using age-,sex- and year-adjusted prevalence ratios calculated usinga log-Poisson model. A series of multilevel logistic re-gression models with 60047 AMI patients clusteredwithin 174 hospitals investigated: the relative odds of 30-day and 365-day mortality after admission for Aboriginalpeople compared with non-Aboriginal people with step-wise adjustment of individual and hospital factors; howmuch of the variation in mortality related to the hospitalof admission; what individual characteristics are asso-ciated with 30-day and 365-day mortality; and what hos-pital characteristics might explain residual variationbetween hospitals. The number of AMI patients per hos-pital in the final models ranged from 1 to 2691, with amedian of 65. Only 5% of hospitals had two or fewerpatients. Multilevel modelling accounts for the cluster-ing of patients within hospitals and also partitions theresidual variation into the between-hospital variationand within-hospital variation [23]. All multilevel models
had a random intercept allowing the hospital mortalityrate to vary, and we also tested random slope models tosee if the odds ratio for Aboriginal status varied betweenhospitals. The hospital-level variance can be expressedas a percentage of the total variance, also called theintraclass correlation coefficient (ICC), or can be con-verted into a median odds ratio (MOR), which is themedian of the odds ratios of pair-wise comparisons ofpatients with identical characteristics taken from ran-domly chosen hospitals [24]. Data analyses were carriedout using SAS 9.1.3 [25] and MLwiN 2.22 [26].
Ethics approvalApproval for the study was given by the NSW Popula-tion and Health Services Research Ethics Committee,the Aboriginal Health and Medical Research Council ofNSW Ethics Committee, and the University of WesternSydney Human Research Ethics Committee.
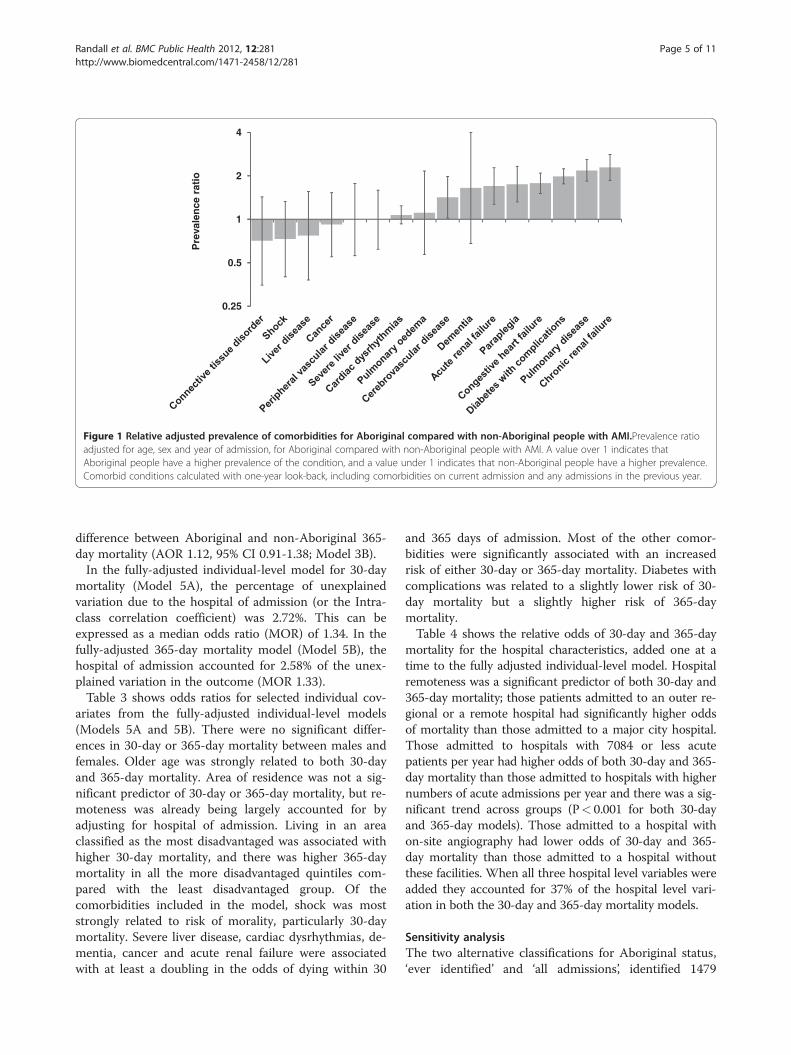
ResultsPatient characteristicsAboriginal patients with AMI were significantly youngerthan non-Aboriginal patients with just over half of theAboriginal patients aged 25–54 years compared withonly one-fifth of non-Aboriginal patients (Table 1). Abo-riginal patients were also more likely to be female, morelikely to be living in an area classified as most disadvan-taged, and more likely to be living in an outer regionalor remote area. Aboriginal patients were significantlyless likely to be admitted to a major city hospital, a hos-pital with 18400 or more average acute admissions peryear, or one with on-site angiography facilities. Due tothe marked demographic differences, age-, sex- andyear-adjusted prevalence ratios were calculated to com-pare the prevalence of comorbidities. These showed thatAboriginal patients were more likely than non-Aborigi-nal patients of the same age, sex and year of admissionto have acute and chronic renal failure, paraplegia, con-gestive heart failure, diabetes with complications, andpulmonary disease (Figure 1).
Short- and long-term mortality after admissionOf the 1183 Aboriginal patients admitted with AMI, 70died within 30 days of admission (5.9%) and 127 diedwithin one year of admission (10.7%). Of the 58864 non-Aboriginal patients admitted with AMI, 5474 diedwithin 30 days (9.3%) and 9148 died within one year(15.2%). When accounting only for hospital of admissionthrough the random intercept multilevel model, Aborigi-nal patients with AMI had lower odds of dying within30 days than non-Aboriginal patients (odds ratio (OR)0.61; 95% CI 0.48-0.78; Table 2, Model 1A). However,after adjusting for age, sex and year of admission therewas no significant difference in 30-day mortality

Table 1 Individual and hospital characteristics ofAboriginal and non-Aboriginal people admitted withacute myocardial infarction
Aboriginal(n = 1183)
Non-Aboriginal(n = 58877)
χ2
p-value
N % N %
Individual characteristic
Age group
25-34 47 4.0 421 0.7 <.001
35-44 257 21.7 2829 4.8
45-54 360 30.4 8579 14.6
55-64 265 22.4 13144 22.3
65-74 180 15.2 15410 26.2
75-84 74 6.3 18481 31.4
Sex
Male 727 61.5 39950 67.9 <.001
Female 456 38.5 18914 32.1
Comorbid conditionsa
Diabetes withcomplications
279 23.6 8903 15.1 <.001
Cardiac dysrhythmias 185 15.6 12539 21.3 <.001
Congestive heart failure 154 13.0 8350 14.2 .254
Pulmonary disease 136 11.5 5236 8.9 .002
Chronic renal failure 96 8.1 4143 7.0 .152
Acute renal failure 47 4.0 2729 4.6 .282
Cerebrovasculardisease
36 3.0 2552 4.3 .030
Paraplegia 25 2.1 1341 2.3 .707
Cancer 15 1.3 1773 3.0 0.01
Peripheral vasculardisease
12 1.0 1108 1.9 .029
Shock 11 0.9 1195 2.0 .008
Pulmonary oedema 9 0.8 685 1.2 .199
Connective tissuedisorder
8 0.7 743 1.3 .073
Dementia 5 0.4 506 0.9 .105
Severe liver disease 2 0.2 103 0.2 .962
Liver disease 1 0.1 113 0.2 .615
Socio-economic statusb
1st quintile - leastdisadvantaged
23 1.9 7832 13.3 <.001
2nd quintile 109 9.2 9946 16.9
3rd quintile 186 15.7 12726 21.6
4th quintile 299 25.3 13102 22.3
5th quintile - mostdisadvantaged
566 47.8 15258 25.9
Table 1 Individual and hospital characteristics ofAboriginal and non-Aboriginal people admitted withacute myocardial infarction (Continued)
Remoteness of residencec
Major city 307 26.0 34695 58.9 <.001
Inner regional 359 30.3 16319 27.7
Outer regional 366 30.9 7300 12.4
Remote/very remote 151 12.8 550 0.9
Hospital characteristic
Remoteness of hospitalc
Major city 389 32.9 39456 67.0 <.001
Inner regional 247 20.9 11384 19.3
Outer regional 414 35.0 7297 12.4
Remote/very remote 133 11.2 726 1.2
Average acute admissions per year
Less than 1200 88 7.4 1245 2.1 <.001
1200-3899 182 15.4 3730 6.3
3900-7084 138 11.7 3842 6.5
7085-18399 443 37.4 19977 33.9
18400 or more 332 28.1 30070 51.1
On-site angiography
Yes 315 26.6 25694 43.6 <.001
No 868 73.4 33170 56.4a Comorbid conditions with one-year look-back, including comorbidities oncurrent admission and any admissions in the previous year.b Socio-Economic Indices for Areas (SEIFA) Index of Relative Socio-EconomicDisadvantage population quintiles based on statistical local area of residence.c Accessibility/Remoteness Index of Australia (ARIA+) based on statistical localarea of residence for individuals or hospital postcode for hospitals.
Randall et al. BMC Public Health 2012, 12:281 Page 4 of 11http://www.biomedcentral.com/1471-2458/12/281
between Aboriginal and non-Aboriginal AMI patients(AOR 1.07; 95% CI 0.83-1.37; Model 2A). Accountingfor comorbidities, remoteness of residence, and socio-economic status (Model 5A) reduced the adjusted oddsratio to 0.95 (0.73-1.23), indicating no significant differ-ence in 30-day mortality. A random slope effect for Abo-riginal status was tested, but there was no significantvariation in the Aboriginal to non-Aboriginal 30-daymortality ratio across hospitals.The unadjusted results for 365-day mortality were
similar to the 30-day model: Aboriginal patients wereless likely to die within 365 days of admission than non-Aboriginal patients admitted to the same hospital (OR0.64; 95% CI 0.53-0.77; Table 2, Model 1B). However,after adjusting for age, sex, and year of admission, Abori-ginal patients had significantly higher odds of dyingwithin 365 days than non-Aboriginal patients admittedto the same hospital (AOR 1.34, 95% CI 1.10-1.63;Model 2B). Again, there was no random slope effect forAboriginal status in this model. After comorbidities wereaccounted for there was no longer a significant
0.5
1
2
4
Pre
vale
nce
rat
io
0.25
Figure 1 Relative adjusted prevalence of comorbidities for Aboriginal compared with non-Aboriginal people with AMI.Prevalence ratioadjusted for age, sex and year of admission, for Aboriginal compared with non-Aboriginal people with AMI. A value over 1 indicates thatAboriginal people have a higher prevalence of the condition, and a value under 1 indicates that non-Aboriginal people have a higher prevalence.Comorbid conditions calculated with one-year look-back, including comorbidities on current admission and any admissions in the previous year.
Randall et al. BMC Public Health 2012, 12:281 Page 5 of 11http://www.biomedcentral.com/1471-2458/12/281
difference between Aboriginal and non-Aboriginal 365-day mortality (AOR 1.12, 95% CI 0.91-1.38; Model 3B).In the fully-adjusted individual-level model for 30-day
mortality (Model 5A), the percentage of unexplainedvariation due to the hospital of admission (or the Intra-class correlation coefficient) was 2.72%. This can beexpressed as a median odds ratio (MOR) of 1.34. In thefully-adjusted 365-day mortality model (Model 5B), thehospital of admission accounted for 2.58% of the unex-plained variation in the outcome (MOR 1.33).Table 3 shows odds ratios for selected individual cov-
ariates from the fully-adjusted individual-level models(Models 5A and 5B). There were no significant differ-ences in 30-day or 365-day mortality between males andfemales. Older age was strongly related to both 30-dayand 365-day mortality. Area of residence was not a sig-nificant predictor of 30-day or 365-day mortality, but re-moteness was already being largely accounted for byadjusting for hospital of admission. Living in an areaclassified as the most disadvantaged was associated withhigher 30-day mortality, and there was higher 365-daymortality in all the more disadvantaged quintiles com-pared with the least disadvantaged group. Of thecomorbidities included in the model, shock was moststrongly related to risk of morality, particularly 30-daymortality. Severe liver disease, cardiac dysrhythmias, de-mentia, cancer and acute renal failure were associatedwith at least a doubling in the odds of dying within 30
and 365 days of admission. Most of the other comor-bidities were significantly associated with an increasedrisk of either 30-day or 365-day mortality. Diabetes withcomplications was related to a slightly lower risk of 30-day mortality but a slightly higher risk of 365-daymortality.Table 4 shows the relative odds of 30-day and 365-day
mortality for the hospital characteristics, added one at atime to the fully adjusted individual-level model. Hospitalremoteness was a significant predictor of both 30-day and365-day mortality; those patients admitted to an outer re-gional or a remote hospital had significantly higher oddsof mortality than those admitted to a major city hospital.Those admitted to hospitals with 7084 or less acutepatients per year had higher odds of both 30-day and 365-day mortality than those admitted to hospitals with highernumbers of acute admissions per year and there was a sig-nificant trend across groups (P< 0.001 for both 30-dayand 365-day models). Those admitted to a hospital withon-site angiography had lower odds of 30-day and 365-day mortality than those admitted to a hospital withoutthese facilities. When all three hospital level variables wereadded they accounted for 37% of the hospital level vari-ation in both the 30-day and 365-day mortality models.
Sensitivity analysisThe two alternative classifications for Aboriginal status,‘ever identified’ and ‘all admissions’, identified 1479
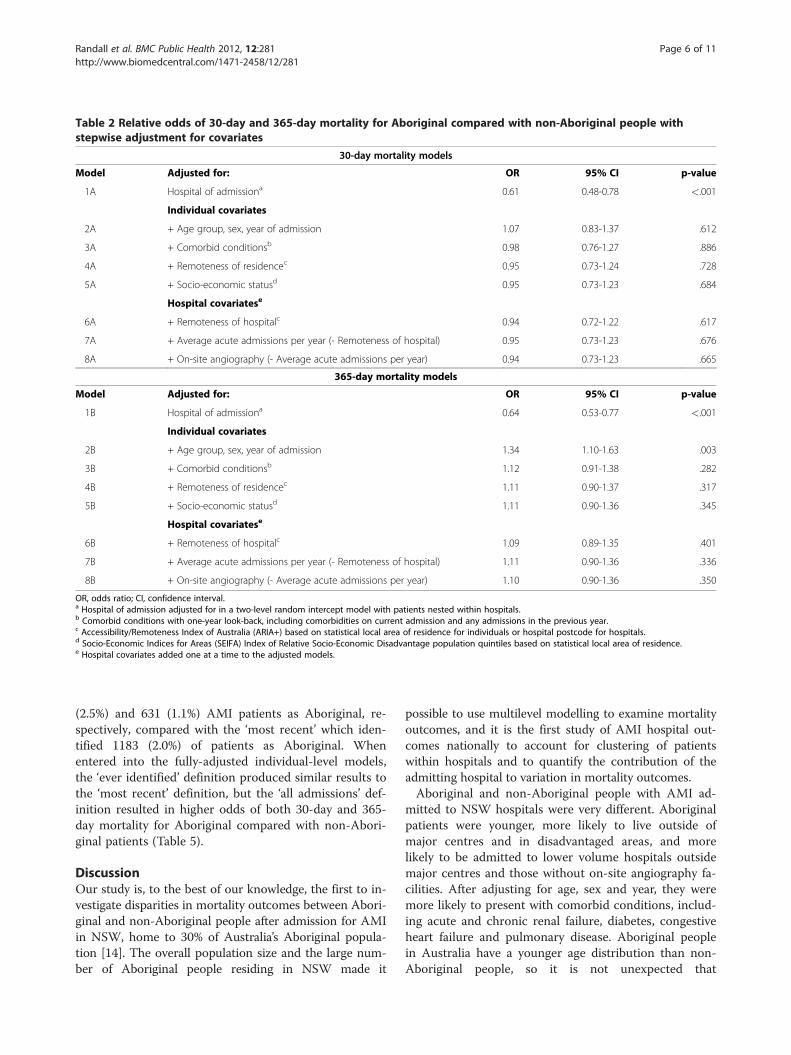
Table 2 Relative odds of 30-day and 365-day mortality for Aboriginal compared with non-Aboriginal people withstepwise adjustment for covariates
30-day mortality models
Model Adjusted for: OR 95% CI p-value
1A Hospital of admissiona 0.61 0.48-0.78 <.001
Individual covariates
2A + Age group, sex, year of admission 1.07 0.83-1.37 .612
3A + Comorbid conditionsb 0.98 0.76-1.27 .886
4A + Remoteness of residencec 0.95 0.73-1.24 .728
5A + Socio-economic statusd 0.95 0.73-1.23 .684
Hospital covariatese
6A + Remoteness of hospitalc 0.94 0.72-1.22 .617
7A + Average acute admissions per year (- Remoteness of hospital) 0.95 0.73-1.23 .676
8A + On-site angiography (- Average acute admissions per year) 0.94 0.73-1.23 .665
365-day mortality models
Model Adjusted for: OR 95% CI p-value
1B Hospital of admissiona 0.64 0.53-0.77 <.001
Individual covariates
2B + Age group, sex, year of admission 1.34 1.10-1.63 .003
3B + Comorbid conditionsb 1.12 0.91-1.38 .282
4B + Remoteness of residencec 1.11 0.90-1.37 .317
5B + Socio-economic statusd 1.11 0.90-1.36 .345
Hospital covariatese
6B + Remoteness of hospitalc 1.09 0.89-1.35 .401
7B + Average acute admissions per year (- Remoteness of hospital) 1.11 0.90-1.36 .336
8B + On-site angiography (- Average acute admissions per year) 1.10 0.90-1.36 .350
OR, odds ratio; CI, confidence interval.a Hospital of admission adjusted for in a two-level random intercept model with patients nested within hospitals.b Comorbid conditions with one-year look-back, including comorbidities on current admission and any admissions in the previous year.c Accessibility/Remoteness Index of Australia (ARIA+) based on statistical local area of residence for individuals or hospital postcode for hospitals.d Socio-Economic Indices for Areas (SEIFA) Index of Relative Socio-Economic Disadvantage population quintiles based on statistical local area of residence.e Hospital covariates added one at a time to the adjusted models.
Randall et al. BMC Public Health 2012, 12:281 Page 6 of 11http://www.biomedcentral.com/1471-2458/12/281
(2.5%) and 631 (1.1%) AMI patients as Aboriginal, re-spectively, compared with the ‘most recent’ which iden-tified 1183 (2.0%) of patients as Aboriginal. Whenentered into the fully-adjusted individual-level models,the ‘ever identified’ definition produced similar results tothe ‘most recent’ definition, but the ‘all admissions’ def-inition resulted in higher odds of both 30-day and 365-day mortality for Aboriginal compared with non-Abori-ginal patients (Table 5).
DiscussionOur study is, to the best of our knowledge, the first to in-vestigate disparities in mortality outcomes between Abori-ginal and non-Aboriginal people after admission for AMIin NSW, home to 30% of Australia’s Aboriginal popula-tion [14]. The overall population size and the large num-ber of Aboriginal people residing in NSW made it
possible to use multilevel modelling to examine mortalityoutcomes, and it is the first study of AMI hospital out-comes nationally to account for clustering of patientswithin hospitals and to quantify the contribution of theadmitting hospital to variation in mortality outcomes.Aboriginal and non-Aboriginal people with AMI ad-
mitted to NSW hospitals were very different. Aboriginalpatients were younger, more likely to live outside ofmajor centres and in disadvantaged areas, and morelikely to be admitted to lower volume hospitals outsidemajor centres and those without on-site angiography fa-cilities. After adjusting for age, sex and year, they weremore likely to present with comorbid conditions, includ-ing acute and chronic renal failure, diabetes, congestiveheart failure and pulmonary disease. Aboriginal peoplein Australia have a younger age distribution than non-Aboriginal people, so it is not unexpected that

Table 3 Adjusted odds ratios for selected individual covariates for 30-day and 365-day mortality multilevel models
30-day mortality 365-day mortality
AOR 95% CI p-value AOR 95% CI p-value
Sex
Male (ref) 1.00 .211 1.00 .853
Female 1.04 0.98-1.11 1.01 0.95-1.06
Age group
25-34 1.20 0.79-1.83 <.001 0.92 0.61-1.37 <.001
35-44 0.73 0.59-0.91 0.58 0.48-0.72
45-54 0.80 0.70-0.92 0.74 0.66-0.83
55-64 (ref) 1.00 1.00
65-74 1.52 1.38-1.68 1.70 1.57-1.85
75-84 2.30 2.10-2.53 3.09 2.86-3.34
Comorbid conditionsa
Shock 11.54 10.12-13.16 <.001 7.94 6.94-9.09 <.001
Severe liver disease 3.80 2.36-6.11 <.001 2.60 1.63-4.17 <.001
Cardiac dysrhythmias 2.69 2.53-2.86 <.001 2.18 2.06-2.30 <.001
Dementia 2.30 1.87-2.84 <.001 2.72 2.25-3.30 <.001
Cancer 2.18 1.92-2.47 <.001 4.45 4.00-4.95 <.001
Acute renal failure 2.02 1.82-2.25 <.001 2.00 1.82-2.19 <.001
Cerebrovascular disease 1.53 1.33-1.77 <.001 1.47 1.29-1.66 <.001
Peripheral vascular disease 1.32 1.11-1.57 <.001 1.30 1.12-1.51 <.001
Pulmonary disease 1.25 1.14-1.37 <.001 1.56 1.45-1.67 <.001
Pulmonary oedema 1.22 0.99-1.51 .056 1.50 1.26-1.80 <.001
Congestive heart failure 1.20 1.12-1.30 <.001 1.81 1.70-1.92 <.001
Paraplegia 1.08 0.89-1.31 .424 1.43 1.21-1.69 <.001
Chronic renal failure 1.06 0.95-1.17 .282 1.56 1.44-1.70 <.001
Liver disease 0.97 0.55-1.69 .913 2.42 1.55-3.79 <.001
Diabetes with complications 0.89 0.82-0.97 .007 1.10 1.03-1.18 .003
Connective tissue disorder 0.81 0.62-1.04 .096 1.18 0.97-1.43 .090
Remoteness of residenceb
Major city (ref) 1.00 .223 1.00 .685
Inner regional 0.95 0.86-1.06 0.95 0.87-1.04
Outer regional 1.08 0.94-1.24 1.00 0.89-1.12
Remote/very remote 1.16 0.84-1.58 0.96 0.73-1.27
Socio-economic statusc
1st quintile - least disadvantaged (ref) 1.00 .033 1.00 <.001
2nd quintile 1.15 0.99-1.32 1.11 0.98-1.25
3rd quintile 1.10 0.95-1.28 1.18 1.04-1.34
4th quintile 1.17 1.00-1.36 1.23 1.08-1.39
5th quintile - most disadvantaged 1.27 1.08-1.48 1.32 1.16-1.51
Adjusted odds ratios for selected covariates from Model 5A for 30-day mortality and Model 5B for 365-day mortality.AOR, adjusted odds ratio; CI, confidence interval; Ref, referent group in the analysis.a Comorbid conditions with one-year look-back, including comorbidities on current admission and any admissions in the previous year.b Accessibility/Remoteness Index of Australia (ARIA+) based on statistical local area of residence.c Socio-Economic Indices for Areas (SEIFA) Index of Relative Socio-Economic Disadvantage population quintiles based on statistical local area of residence.
Randall et al. BMC Public Health 2012, 12:281 Page 7 of 11http://www.biomedcentral.com/1471-2458/12/281

Table 4 Adjusted odds ratios for selected hospital covariates for 30-day and 365-day mortality multilevel models
30-day mortality 365-day mortality
AOR 95% CI p-value AOR 95% CI p-value
Added into adjusteda model separately
Remoteness of hospitalb
Major city (ref) 1.00 <.001 1.00 <.001
Inner regional 1.15 0.94-1.41 1.16 0.97-1.39
Outer regional 1.56 1.26-1.94 1.54 1.27-1.87
Remote/very remote 1.83 1.19-2.81 1.79 1.22-2.61
Average acute admissions per year
Less than 1200 2.03 1.57-2.62 <.001 1.98 1.58-2.49 <.001
1200-3899 1.72 1.39-2.13 1.55 1.28-1.88
3900-7084 1.36 1.08-1.70 1.32 1.07-1.62
7085-18399 1.14 0.96-1.35 1.14 0.97-1.34
18400 or more (ref) 1.00 1.00
On-site angiography
Yes 0.74 0.64-0.86 <.001 0.72 0.63-0.83 <.001
No (ref) 1.00 1.00
AOR, adjusted odds ratios; CI, confidence interval. Ref, referent group in the analysis.a Adjusted for Aboriginal status, age, sex, year of admission, comorbidities, remoteness of residence, socio-economic status, and a random hospital intercept, withhospital covariates added in one at a time to the model.b Accessibility/Remoteness Index of Australia (ARIA+) based on hospital postcode.
Randall et al. BMC Public Health 2012, 12:281 Page 8 of 11http://www.biomedcentral.com/1471-2458/12/281
Aboriginal people admitted with AMI would be younger;however, higher age-specific incidence of AMI particu-larly among younger Aboriginal people was recentlyreported by a study in Western Australia (WA) [8].These findings and ours point to the importance of tar-geting the early onset of AMI among Aboriginal peopleand preventing or managing chronic diseases that maycomplicate treatment or lead to poorer long-termoutcomes.Our study found that once admitted to hospital, Abo-
riginal patients with AMI were less likely to die within30 days than non-Aboriginal patients admitted to thesame hospital (Table 2, Model 1A). However, this findingwas explained by substantial age differences: after adjust-ing for age, sex and year of admission, the differences in30-day mortality was no longer significant (Model 2A).In contrast, after adjusting for age, sex and year, Aborigi-nal patients had 34% higher odds of dying within oneyear compared with non-Aboriginal patients admitted tothe same hospital (Model 2B). However, this differencewas no longer significant after adjusting for selectedcomorbidities (Model 3B), suggesting that part of thehigher one-year mortality is due to the higher comorbid-ity burden among Aboriginal people admitted with AMI.Our findings regarding short-term mortality differed
from those of the WA study, which reported higher post-admission 28-day mortality ratios for Aboriginal comparedwith non-Aboriginal patients, ranging from 1.7 in 55–
74 year-old males and females to 3.6 in 25–54 year oldmales [8]. This discrepancy might relate to the differentprofile of the WA Aboriginal population (41% resident inremote or very remote areas, compared with 5% in NSW)[18], and differences in study methodology (the WA studydid not account for hospital of admission).For longer-term mortality, our findings were similar to
those of a Queensland study that reported an age-adjusted risk ratio of 1.8 (95% CI, 1.5-2.2) for 365-daymortality in Aboriginal patients with AMI after admis-sion to Queensland public hospitals [10]. We found thatthe significantly higher one-year mortality for Aboriginalpatients did not persist after adjusting for comorbidities,but a recent study in WA found significantly higherrates of two-year cardiovascular death or recurrent AMIfor Aboriginal compared with non-Aboriginal males andfemales after adjusting for demographic characteristicsand comorbidities [27]. These findings may suggest thatthe Aboriginal to non-Aboriginal disparity in mortalityis greater in WA than in NSW. However, it is difficult tocompare these findings directly because our study had ashorter length of follow-up for all-cause mortality,adjusted for hospital of admission, and did not examinemortality and recurrent AMI as a combined outcome.An increase in the Aboriginal to non-Aboriginal mortal-ity ratio with increasing time after discharge has beenshown in the Northern Territory for those admitted withacute coronary syndrome and surviving to discharge,
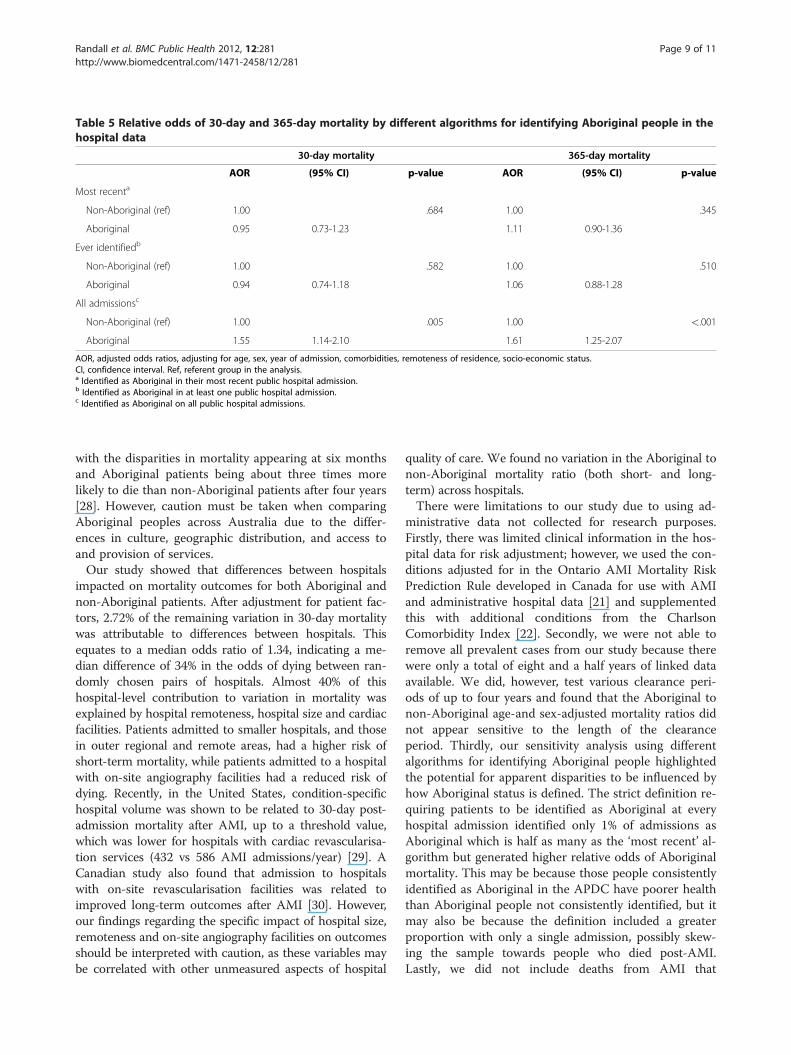
Table 5 Relative odds of 30-day and 365-day mortality by different algorithms for identifying Aboriginal people in thehospital data
30-day mortality 365-day mortality
AOR (95% CI) p-value AOR (95% CI) p-value
Most recenta
Non-Aboriginal (ref) 1.00 .684 1.00 .345
Aboriginal 0.95 0.73-1.23 1.11 0.90-1.36
Ever identifiedb
Non-Aboriginal (ref) 1.00 .582 1.00 .510
Aboriginal 0.94 0.74-1.18 1.06 0.88-1.28
All admissionsc
Non-Aboriginal (ref) 1.00 .005 1.00 <.001
Aboriginal 1.55 1.14-2.10 1.61 1.25-2.07
AOR, adjusted odds ratios, adjusting for age, sex, year of admission, comorbidities, remoteness of residence, socio-economic status.CI, confidence interval. Ref, referent group in the analysis.a Identified as Aboriginal in their most recent public hospital admission.b Identified as Aboriginal in at least one public hospital admission.c Identified as Aboriginal on all public hospital admissions.
Randall et al. BMC Public Health 2012, 12:281 Page 9 of 11http://www.biomedcentral.com/1471-2458/12/281
with the disparities in mortality appearing at six monthsand Aboriginal patients being about three times morelikely to die than non-Aboriginal patients after four years[28]. However, caution must be taken when comparingAboriginal peoples across Australia due to the differ-ences in culture, geographic distribution, and access toand provision of services.Our study showed that differences between hospitals
impacted on mortality outcomes for both Aboriginal andnon-Aboriginal patients. After adjustment for patient fac-tors, 2.72% of the remaining variation in 30-day mortalitywas attributable to differences between hospitals. Thisequates to a median odds ratio of 1.34, indicating a me-dian difference of 34% in the odds of dying between ran-domly chosen pairs of hospitals. Almost 40% of thishospital-level contribution to variation in mortality wasexplained by hospital remoteness, hospital size and cardiacfacilities. Patients admitted to smaller hospitals, and thosein outer regional and remote areas, had a higher risk ofshort-term mortality, while patients admitted to a hospitalwith on-site angiography facilities had a reduced risk ofdying. Recently, in the United States, condition-specifichospital volume was shown to be related to 30-day post-admission mortality after AMI, up to a threshold value,which was lower for hospitals with cardiac revascularisa-tion services (432 vs 586 AMI admissions/year) [29]. ACanadian study also found that admission to hospitalswith on-site revascularisation facilities was related toimproved long-term outcomes after AMI [30]. However,our findings regarding the specific impact of hospital size,remoteness and on-site angiography facilities on outcomesshould be interpreted with caution, as these variables maybe correlated with other unmeasured aspects of hospital
quality of care. We found no variation in the Aboriginal tonon-Aboriginal mortality ratio (both short- and long-term) across hospitals.There were limitations to our study due to using ad-
ministrative data not collected for research purposes.Firstly, there was limited clinical information in the hos-pital data for risk adjustment; however, we used the con-ditions adjusted for in the Ontario AMI Mortality RiskPrediction Rule developed in Canada for use with AMIand administrative hospital data [21] and supplementedthis with additional conditions from the CharlsonComorbidity Index [22]. Secondly, we were not able toremove all prevalent cases from our study because therewere only a total of eight and a half years of linked dataavailable. We did, however, test various clearance peri-ods of up to four years and found that the Aboriginal tonon-Aboriginal age-and sex-adjusted mortality ratios didnot appear sensitive to the length of the clearanceperiod. Thirdly, our sensitivity analysis using differentalgorithms for identifying Aboriginal people highlightedthe potential for apparent disparities to be influenced byhow Aboriginal status is defined. The strict definition re-quiring patients to be identified as Aboriginal at everyhospital admission identified only 1% of admissions asAboriginal which is half as many as the ‘most recent’ al-gorithm but generated higher relative odds of Aboriginalmortality. This may be because those people consistentlyidentified as Aboriginal in the APDC have poorer healththan Aboriginal people not consistently identified, but itmay also be because the definition included a greaterproportion with only a single admission, possibly skew-ing the sample towards people who died post-AMI.Lastly, we did not include deaths from AMI that
Randall et al. BMC Public Health 2012, 12:281 Page 10 of 11http://www.biomedcentral.com/1471-2458/12/281
occurred before the patient was admitted to hospital, ei-ther sudden death or death in ambulance or EmergencyDepartment. It is possible that Aboriginal people wouldbe overrepresented in these early deaths from AMI, dueto higher comorbidity rates or living a greater distancefrom the nearest hospital, but this was outside the scopeof our study examining outcomes after hospitaladmission.Our study and others point to the importance of preven-
tion and early intervention to target the early onset ofAMI among Aboriginal Australians. These efforts musttarget risk factor prevalence among Aboriginal people, in-cluding higher rates of smoking and overweight and obes-ity, and the earlier onset of comorbidities like diabetes andrenal failure [1]. However, poor health behaviours may bea way of coping for people living under chronically stress-ful conditions, so psychosocial and emotional factors mustalso be taken into account [31,32]. Importantly, our studyhas demonstrated that there are gains to be made—bothfor Aboriginal and non-Aboriginal people—by improvingaccess to larger hospitals and hospitals with on-site angi-ography or by improving the cardiac care facilities at smal-ler hospitals.The population density and geographic distances in
Australia pose difficult policy questions about whether itis best to transfer patients as quickly as possible to majorcity hospitals or whether it is efficient to increase ser-vices in less densely population areas. Our resultsshowed that the difference in outcomes for inner re-gional compared with major city hospitals was small andnot significant, so boosting resources in regional centresmay reduce the difference altogether, and reduce traveltimes to cardiac facilities for those living in regional andremote areas. One challenge is to ensure that any inter-ventions are culturally appropriate for Aboriginalpatients. While transfers can be very stressful for Abori-ginal people living in remote areas, an action researchstudy concluded that small interventions such as havingdedicated liaison officers in the health system could im-prove cultural awareness of practitioners as well as com-munication and continuity of care and improve outcomesfor Aboriginal patients [33].The higher mortality among Aboriginal patients in the
first year after admission also highlights the importanceof improved post-AMI care including appropriate medi-cation and lifestyle interventions. This period after dis-charge warrants further investigation to disentangle theimpacts on mortality of comorbidity burden and differ-ences in access to, or adherence with, follow-up careand secondary prevention.
ConclusionsImproving access to larger hospitals or those with special-ist treatment facilities could improve outcomes following
AMI for residents of rural and regional areas, both Abori-ginal and non-Aboriginal. However, major efforts to boostprimary and secondary prevention of AMI are required toreduce the mortality gap between Aboriginal and non-Aboriginal people.
Competing interestsThe authors declare that they have no competing interest.
Authors’ contributionsDR had overall responsibility for the design of this study, data management,statistical analysis and drafting this paper. LJ initiated the IHOPE project andprovided overall oversight. LJ, SL, TC, MH, SE and AL contributed to theconception and design of the IHOPE project. SL provided advice on datamanagement and statistical analysis. AO provided advice on clinical aspectsand on hospital levels of service. AL provided oversight and advice for thedesign and interpretation of the statistical analyses. All authors contributedto the interpretation of findings, the writing of the paper and approved thefinal draft.
AcknowledgementsWe would like to acknowledge the NSW Ministry of Health and NSWRegister of Births, Deaths and Marriages for allowing access to the data, andthe Centre for Health Record Linkage for conducting the probabilistic linkageof records. We would also like to thank the reviewers for their thoughtfulcomments on earlier drafts of this paper. The Indigenous Health OutcomesPatient Evaluation (IHOPE) study is funded by a National Health and MedicalResearch Council Project Grant (#573113). The funding body had no role inthe research project.
Author details1School of Medicine, University of Western Sydney, Narellan Road,Campbelltown, NSW, Australia. 2The Sax Institute, Quay Street, Sydney, NSW,Australia. 3Baker IDI Heart and Diabetes Institute, Commercial Road,Melbourne, Victoria, Australia. 4Medical Research Council/Chief ScientistOffice Social and Public Health Sciences Unit, Lilybank Gardens, Glasgow, UK.
Received: 17 October 2011 Accepted: 3 April 2012Published: 10 April 2012
References1. Australian Institute of Health and Welfare, Australian Bureau of Statistics: The
Health and Welfare of Australia’s Aboriginal and Torres Strait Islander Peoples,2008. Canberra, Australia: Australian Institute of Health and Welfare andAustralian Bureau of Statistics; 2008.
2. Vos T, Barker B, Begg S, Stanley L, Lopez AD: Burden of disease and injuryin Aboriginal and Torres Strait Islander Peoples: the Indigenous healthgap. Int J Epidemiol 2009, 38:470–477.
3. Thomson N, Ride K: Summary of the cardiovascular health status ofIndigenous peoples. [accessed 17 June 2011]; [http://www.healthinfonet.ecu.edu.au/chronic-conditions/cvd/reviews/our-review.]
4. Hayman NE, White NE, Spurling GK: Improving Indigenous patients’ accessto mainstream health services: the Inala experience. Med J Aust 2009,190:604–606.
5. Turrell G, Kavanagh A, Draper G, Subramanian SV: Do places affect theprobability of death in Australia? A multilevel study of area-leveldisadvantage, individual-level socioeconomic position and all-causemortality, 1998–2000. J Epidemiol Community Health 2007, 61:13–19.
6. Hill K, Barker B, Vos T: Excess indigenous mortality: are indigenousAustralians more severely disadvantaged than other Indigenouspopulations? Int J Epidemiol 2007, 36:580–589.
7. Mathur S, Moon L, Leigh S: Aboriginal and Torres Strait Islander people withcoronary heart disease: further perspectives on health status and treatment.Canberra, Australia: Australian Institute of Health and Welfare; 2006.
8. Katzenellenbogen JM, Sanfilippo FM, Hobbs MST, Briffa TG, Ridout SC,Knuiman MW, Dimer L, Taylor KP, Thompson PL, Thompson SC: Incidenceof and case fatality following acute myocardial infarction in Aboriginaland non-Aboriginal Western Australians (2000–2004): a linked datastudy. Heart Lung Circ 2010, 19:717–725.
Randall et al. BMC Public Health 2012, 12:281 Page 11 of 11http://www.biomedcentral.com/1471-2458/12/281
9. Brown A: Acute coronary syndromes in Indigenous Australians:opportunities for improving outcomes across the continuum of care.Heart Lung Circ 2010, 19:325–336.
10. Coory MD, Walsh WF: Rates of percutaneous coronary interventions andbypass surgery after acute myocardial infarction in Indigenous patients.Med J Aust 2005, 182:507–512.
11. Bradshaw PJ, Alfonso HS, Finn J, Owen J, Thompson PL: The use ofcoronary revascularisation procedures in urban Australian Aboriginalsand a matched general population: coronary procedures in Aboriginals.Heart Lung Circ 2010, 19:247–250.
12. National Centre for Classification in Health: International StatisticalClassification of Diseases and Related Health Problems, 10th Revision,Australian Modification (ICD-10-AM), Australian Classification of HealthInterventions (ACHI) and Australian Coding Standards (ACS). 5th edition.Sydney: National Centre for Classification in Health; 2006.
13. Centre for Health Record Linkage [http://www.cherel.org.au]14. Australian Bureau of Statistics: 3238.0.55.001 - Experimental Estimates of
Aboriginal and Torres Strait Islander Australians, Jun 2006. Canberra, Australia:ABS; 2008 [accessed September 17 2010]; [http://www.abs.gov.au/ausstats/[email protected]/Latestproducts/3238.0.55.001Main%20Features1Jun%202006?opendocument&tabname=Summary&prodno=3238.0.55.001&issue=Jun%202006&num=&view=]
15. Population Health Division: The health of the people of New South Wales -Report of the Chief Health Officer. Sydney. NSW Department of Health; 2006[accessed 7 April 2011]; [http://www.health.nsw.gov.au/publichealth/chorep/rur/rur_pop_aria_atsi.asp]
16. Australian Bureau of Statistics: 4705.0 Population distribution, Aboriginal andTorres Strait Islander Australians. Canberra, Australia: ABS; 2006 [accessed 31March 2011]; [http://www.ausstats.abs.gov.au/ausstats/subscriber.nsf/0/377284127F903297CA25733700241AC0/$File/47050_2006.pdf]
17. Australian Bureau of Statistics. 3238.0 - Experimental Estimates andProjections, Aboriginal and Torres Strait Islander Australians, 1991 to 2021.Canberra, Australia: ABS; 2009 [accessed 14 March 2012]; [http://www.abs.gov.au/ausstats/[email protected]/0/DDAB99776D7ABDC7CA25762A001CC066?opendocument]
18. Australian Bureau of Statistics. 3235.0 - Population by age and sex, Australia,2006. Canberra, Australia: ABS; 2007 [accessed 14 March 2012]; [http://www.abs.gov.au/ausstats/[email protected]/Products/3235.0~2006~Main+Features~New+South+Wales?OpenDocument]
19. Australian Institute of Health and Welfare: Indigenous identification inhospital separations data - quality report. Canberra, Australia: AustralianInstitute of Health and Welfare; 2010.
20. Australian Institute of Health and Welfare: Improving the quality ofIndigenous identification in hospital separations data. Canberra, Australia:Australian Institute of Health and Welfare; 2005.
21. Vermeulen MJ, Tu JV, Schull MJ: ICD-10 adaptations of the Ontario acutemyocardial infarction mortality prediction rules performed as well as theoriginal versions. J Clin Epidemiol 2007, 60:971–974.
22. Sundararajan V, Henderson T, Perry C, Muggivan A, Quan H, Ghali WA: NewICD-10 version of the Charlson comorbidity index predicted in-hospitalmortality. J Clin Epidemiol 2004, 57:1288–1294.
23. Leyland AH, Groenewegen PP: Multilevel modelling and public healthpolicy. Scand J Public Health 2003, 31:267–274.
24. Merlo J, Chaix B, Ohlsson H, Beckman A, Johnell K, Hjerpe P, Råstam L,Larsen K: A brief conceptual tutorial of multilevel analysis in socialepidemiology: using measures of clustering in multilevel logisticregression to investigate contextual phenomena. J Epidemiol CommunityHealth 2006, 60:290–297.
25. SAS Institute Inc: SAS Version 9.1.3 [software]. Cary, North Carolina: SAS; 2003.26. Rasbash J, Browne WJ, Healy M, Cameron B, Charlton C: MLwiN Version 2.22
[software]. Bristol: Centre for Multilevel Modelling, University of Bristol; 2010.27. Katzenellenbogen JM, Sanfilippo FM, Hobbs MST, Briffa TG, Ridout SC,
Knuiman MW, Dimer L, Taylor KP, Thompson PL, Thompson SC: Aboriginalto non-Aboriginal differentials in 2-year outcomes following non-fatalfirst-ever acute MI persist after adjustment for comorbidity. Eur JCardiovasc Prev Rehabil [published online ahead of print 28 July 2011].
28. Brown A: Bridging the survival gap between Indigenous and non-Indigenous Australians: priorities for the road ahead. Heart Lung Circ2009, 18:96–100.
29. Ross JS, Normand SLT, Wang Y, Ko DT, Chen J, Drye EE, Keenan PS,Lichtman JH, Bueno H, Schreiner GC, Krumholz HM: Hospital volume and
30-day mortality for three common medical conditions. N Engl J Med2010, 362:1110–1118.
30. Alter DA, Naylor CD, Austin PC, Tu JV: Long-term MI outcomes at hospitalswith or without on-site revascularization. JAMA 2001, 285:2101–2108.
31. Wood L, France K, Hunt K, Eades S, Slack-Smith L: Indigenous women andsmoking during pregnancy: knowledge, cultural contexts and barriers tocessation. Soc Sci Med 2008, 66:2378–2389.
32. Mezuk B, Rafferty JA, Kershaw KN, Hudson D, Abdou CM, Lee H, Eaton WW,Jackson JS: Reconsidering the role of social disadvantage in physical andmental health: stressful life events, health behaviors, race, anddepression. Am J Epidemiol 2010, 172:1238–1249.
33. Lawrence M, Dodd Z, Mohor S, Dunn S, de Crespigny C, Power C, MacKeanL: Improving the Patient Journey: Achieving Positive Outcomes for RemoteAboriginal Cardiac Patients. Darwin, Australia: Cooperative Research Centrefor Aboriginal Health, Darwin; 2009.
doi:10.1186/1471-2458-12-281Cite this article as: Randall et al: Mortality after admission for acutemyocardial infarction in Aboriginal and non-Aboriginal people in NewSouth Wales, Australia: a multilevel data linkage study. BMC Public Health2012 12:281.
Submit your next manuscript to BioMed Centraland take full advantage of:
• Convenient online submission
• Thorough peer review
• No space constraints or color figure charges
• Immediate publication on acceptance
• Inclusion in PubMed, CAS, Scopus and Google Scholar
• Research which is freely available for redistribution
Submit your manuscript at www.biomedcentral.com/submit
Copyright © 2022 FDOKUMEN