Relations between variability in the Mediterranean region and mid-latitude variability
Upload
unisalentoCategory
view
4download
0
Global and Planetary Change 63 (2008) 90–104
Contents lists available at ScienceDirect
Global and Planetary Change
j ourna l homepage: www.e lsev ie r.com/ locate /g lop lacha
Climate change projections for the Mediterranean region
Filippo Giorgi a,⁎, Piero Lionello b
a Earth System Physics Section, The Abdus Salam International Centre for Theoretical Physics, P.O. Box 586, (Strada Costiera 11 for courier mail), 34100 Trieste, Italyb Universita' di Lecce, Lecce, Italy
⁎ Corresponding author. Tel.: +39 040 2240 425; fax:E-mail address: [email protected] (F. Giorgi).
0921-8181/$ – see front matter © 2007 Published by Edoi:10.1016/j.gloplacha.2007.09.005
a b s t r a c t
a r t i c l e i n f oArticle history:
We present a review of clim Received 12 October 2006Accepted 11 August 2007Available online 4 October 2007Keywords:climate changeMediterranean climateprecipitation changetemperature change
ate change projections over the Mediterranean region based on the most recentand comprehensive ensembles of global and regional climate change simulations completed as part ofinternational collaborative projects. A robust and consistent picture of climate change over theMediterranean emerges, consisting of a pronounced decrease in precipitation, especially in the warmseason, except for the northern Mediterranean areas (e.g. the Alps) in winter. This drying is due to increasedanticyclonic circulation that yields increasingly stable conditions and is associated with a northward shift ofthe Atlantic storm track. A pronounced warming is also projected, maximum in the summer season. Inter-annual variability is projected to mostly increase especially in summer, which, along with the meanwarming,would lead to a greater occurrence of extremely high temperature events. The projections by the global andregional model simulations are generally consistent with each other at the broad scale. However, theprecipitation change signal produced by the regional models shows substantial orographically-induced finescale structure absent in the global models. Overall, these change signals are robust across forcing scenariosand future time periods, with the magnitude of the signal increasing with the intensity of the forcing. Theintensity and robustness of the climate change signals produced by a range of global and regional climatemodels suggest that the Mediterranean might be an especially vulnerable region to global change.
© 2007 Published by Elsevier B.V.
1. Introduction
The Mediterranean region lies in a transition zone between thearid climate of North Africa and the temperate and rainy climate ofcentral Europe and it is affected by interactions between mid-latitudeand tropical processes. Because of these features, even relativelyminor modifications of the general circulation, e.g. shifts in thelocation of mid-latitude storm tracks or sub-tropical high pressurecells, can lead to substantial changes in the Mediterranean climate.This makes the Mediterranean a potentially vulnerable region toclimatic changes as induced, for example, by increasing concentra-tions of greenhouse gases (e.g. Lionello et al., 2006a; Ulbrich et al.,2006). Indeed, the Mediterranean region has shown large climateshifts in the past (Luterbacher et al., 2006) and it has been identified asone of the most prominent “Hot-Spots” in future climate changeprojections (Giorgi 2006).
The climate of the Mediterranean is mild and wet during thewinter and hot and dry during the summer. Winter climate is mostlydominated by the westward movement of storms originating over theAtlantic and impinging upon the western European coasts. The winterMediterranean climate, and most importantly precipitation, is thusaffected by the North Atlantic Oscillation (NAO) over its western areas
+39 040 2240 449.
lsevier B.V.
(e.g. Hurrell 1995), the East Atlantic (EA) and other patterns over itsnorthern and eastern areas (Trigo et al., 2006). The El Nino SouthernOscillation (ENSO) has also been suggested to significantly affectwinter rainfall variability over the Eastern Mediterranean (along withspring and fall precipitation over Iberia and North-western Africa,Alpert et al., 2006). In addition to Atlantic storms, Mediterraneanstorms can be produced internally to the region in correspondence ofcyclogenetic areas such as the lee of the Alps, the Gulf of Lyon and theGulf of Genoa (Lionello et al., 2006b).
In the summer, high pressure and descending motions dominateover the region, leading to dry conditions particularly over thesouthern Mediterranean. Summer Mediterranean climate variabilityhas been found to be connected with both the Asian and Africanmonsoons (Alpert et al., 2006) and with strong geopotential blockinganomalies over central Europe (Xoplaki et al., 2004; Trigo et al., 2006).
In addition to planetary scale processes and teleconnections, theclimate of the Mediterranean is affected by local processes induced bythe complex physiography of the region and the presence of a largebody of water (the Mediterranean Sea). For example, the Alpine chainis a strong factor in modifying traveling synoptic and mesoscalesystems and theMediterranean Sea is an important source of moistureand energy for storms (Lionello et al., 2006a,b). The complextopography, coastline and vegetation cover of the region are wellknown to modulate the regional climate signal at small spatial scales(e.g. Lionello et al., 2006a). In addition, anthropogenic and naturalaerosols of central European, African and Asian origin can reach the
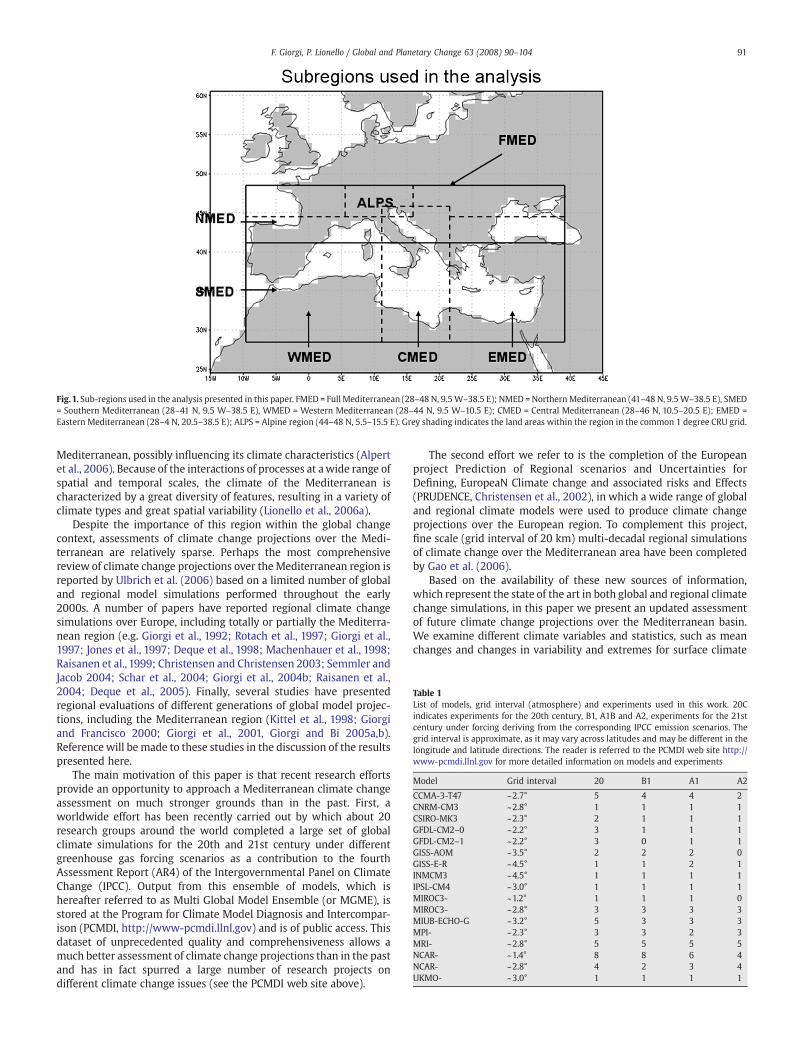
Fig.1. Sub-regions used in the analysis presented in this paper. FMED = Full Mediterranean (28–48 N, 9.5W–38.5 E); NMED = NorthernMediterranean (41–48 N, 9.5W–38.5 E), SMED= Southern Mediterranean (28–41 N, 9.5 W–38.5 E), WMED = Western Mediterranean (28–44 N, 9.5 W–10.5 E); CMED = Central Mediterranean (28–46 N, 10.5–20.5 E); EMED =Eastern Mediterranean (28–4 N, 20.5–38.5 E); ALPS = Alpine region (44–48 N, 5.5–15.5 E). Grey shading indicates the land areas within the region in the common 1 degree CRU grid.
Table 1List of models, grid interval (atmosphere) and experiments used in this work. 20Cindicates experiments for the 20th century, B1, A1B and A2, experiments for the 21stcentury under forcing deriving from the corresponding IPCC emission scenarios. Thegrid interval is approximate, as it may vary across latitudes and may be different in thelongitude and latitude directions. The reader is referred to the PCMDI web site http://www-pcmdi.llnl.gov for more detailed information on models and experiments
Model Grid interval 20 B1 A1 A2
CCMA-3-T47 ~2.7° 5 4 4 2CNRM-CM3 ~2.8° 1 1 1 1CSIRO-MK3 ~2.3° 2 1 1 1GFDL-CM2–0 ~2.2° 3 1 1 1GFDL-CM2–1 ~2.2° 3 0 1 1GISS-AOM ~3.5° 2 2 2 0GISS-E-R ~4.5° 1 1 2 1INMCM3 ~4.5° 1 1 1 1IPSL-CM4 ~3.0° 1 1 1 1MIROC3- ~1.2° 1 1 1 0MIROC3- ~2.8° 3 3 3 3MIUB-ECHO-G ~3.2° 5 3 3 3MPI- ~2.3° 3 3 2 3MRI- ~2.8° 5 5 5 5NCAR- ~1.4° 8 8 6 4NCAR- ~2.8° 4 2 3 4UKMO- ~3.0° 1 1 1 1
91F. Giorgi, P. Lionello / Global and Planetary Change 63 (2008) 90–104
Mediterranean, possibly influencing its climate characteristics (Alpertet al., 2006). Because of the interactions of processes at awide range ofspatial and temporal scales, the climate of the Mediterranean ischaracterized by a great diversity of features, resulting in a variety ofclimate types and great spatial variability (Lionello et al., 2006a).
Despite the importance of this region within the global changecontext, assessments of climate change projections over the Medi-terranean are relatively sparse. Perhaps the most comprehensivereview of climate change projections over the Mediterranean region isreported by Ulbrich et al. (2006) based on a limited number of globaland regional model simulations performed throughout the early2000s. A number of papers have reported regional climate changesimulations over Europe, including totally or partially the Mediterra-nean region (e.g. Giorgi et al., 1992; Rotach et al., 1997; Giorgi et al.,1997; Jones et al., 1997; Deque et al., 1998; Machenhauer et al., 1998;Raisanen et al., 1999; Christensen and Christensen 2003; Semmler andJacob 2004; Schar et al., 2004; Giorgi et al., 2004b; Raisanen et al.,2004; Deque et al., 2005). Finally, several studies have presentedregional evaluations of different generations of global model projec-tions, including the Mediterranean region (Kittel et al., 1998; Giorgiand Francisco 2000; Giorgi et al., 2001, Giorgi and Bi 2005a,b).Reference will be made to these studies in the discussion of the resultspresented here.
The main motivation of this paper is that recent research effortsprovide an opportunity to approach a Mediterranean climate changeassessment on much stronger grounds than in the past. First, aworldwide effort has been recently carried out by which about 20research groups around the world completed a large set of globalclimate simulations for the 20th and 21st century under differentgreenhouse gas forcing scenarios as a contribution to the fourthAssessment Report (AR4) of the Intergovernmental Panel on ClimateChange (IPCC). Output from this ensemble of models, which ishereafter referred to as Multi Global Model Ensemble (or MGME), isstored at the Program for Climate Model Diagnosis and Intercompar-ison (PCMDI, http://www-pcmdi.llnl.gov) and is of public access. Thisdataset of unprecedented quality and comprehensiveness allows amuch better assessment of climate change projections than in the pastand has in fact spurred a large number of research projects ondifferent climate change issues (see the PCMDI web site above).
The second effort we refer to is the completion of the Europeanproject Prediction of Regional scenarios and Uncertainties forDefining, EuropeaN Climate change and associated risks and Effects(PRUDENCE, Christensen et al., 2002), in which a wide range of globaland regional climate models were used to produce climate changeprojections over the European region. To complement this project,fine scale (grid interval of 20 km) multi-decadal regional simulationsof climate change over the Mediterranean area have been completedby Gao et al. (2006).
Based on the availability of these new sources of information,which represent the state of the art in both global and regional climatechange simulations, in this paper we present an updated assessmentof future climate change projections over the Mediterranean basin.We examine different climate variables and statistics, such as meanchanges and changes in variability and extremes for surface climate

92 F. Giorgi, P. Lionello / Global and Planetary Change 63 (2008) 90–104
variables as well as circulation patterns. We do not address issues ofimpacts, adaptation and mitigation, although we hope that ourassessment might provide useful information for such issues.
Our assessment is based on both a new analysis of the abovementioned data and a review of published material deriving from theMGME and PRUDENCE data. Therefore, we begin this paper with abrief description of these datasets.
2. Definitions and datasets
In this paper we define the Mediterranean region as roughlyencompassing the area between 28–48 N and 10 W–39 E (Fig. 1). Itincludes, fully or partially, over 20 countries (from the Alpine region inthe north to the North African countries in the south, from the IberianPeninsula in the west to the Middle East countries in the east) and awide range of climatic types, from the north-African desert to the Alps.
Our assessment/analysis of global simulations with coupledAtmosphere–Ocean General Circulation Models (AOGCMs) utilizeswhat we have called theMGME. This is described in Table 1. It includes17 models from laboratories around the World spanning a relativelywide range of resolutions, from 1 to 4°. Note that three of the originalMGME models were neglected because they did not have simulationsfor the A1B scenario or because of their poor performance over theMediterranean region (the FGOALS, BCC and HADGEM models).
The following simulations are available from the MGME dataset(see Table 1): 20 century climate using observed GHG and aerosolforcing (referred to as 20C experiments), 21st century climate using
Fig. 2.MGME ensemble average change in sea level pressure (SLP) for the four seasons, 2071–MAM is March–April–May, JJA is June–July–August, SON is September–October–November.
GHGand aerosol forcing from the A1B, A2 and B1 emission scenarios ofIPCC (1990) (referred to as A1B, A2 and B1 experiments, respectively).This set of scenarios spans almost the entire IPCC scenario range, withthe B1 being close to the low end of the range (CO2 concentration ofabout 550 ppm by 2100), the A2 to the high end of the range (CO2
concentration of about 850 ppm by 2100) and the A1B to themiddle ofthe range (CO2 concentration of about 700 ppm by 2100). As shown inTable 1, some models include multiple realizations for the sameexperiment, in which case we utilize the ensemble average of therealizations.
Monthly data for the MGME experiments were obtained from thePCMDIweb site (see above) and the reader is referred to thisweb site toobtain more information about the participating models. To facilitatethemodel inter-comparison, the data are interpolated onto a common1-degree grid. A common 1-degree land mask grid is also defined (seeFig. 1), based on the half-degree grid of the observed dataset from theClimatic Research Unit (CRU) of the University of East Anglia (New etal., 2000). This implies that, when land-only or ocean-only analysis ispresented, some uncertainty is present from the different landdefinitions at the different model grids. Except for two models, thisis the same dataset used by Giorgi and Bi (2005a,b) and Giorgi (2006).
Because of the complex topography and coastlines of theMediterranean basin, AOGCMs can only provide broad scale type ofinformation. More detailed spatial information can be obtained fromregional climate models, or RCMs, and therefore we examine results(mostly already published) from recent regional climate changesimulations completed as part of the PRUDENCE project. This includes
2100minus 1961–1990, A1B scenario. Units aremb. DJF is December–January–February,

93F. Giorgi, P. Lionello / Global and Planetary Change 63 (2008) 90–104
an ensemble of four AOGCMs and nine RCMs. The PRUDENCE RCMsimulations are 30-year time slices, one for the present day referenceperiod of 1961–1990, and the others for the future period of 2071–2100 with forcing from the A2 and B2 IPCC (2000) emission scenarios.Similar to the B1, the B2 scenario also lies towards the low end of theIPCC range, with a CO2 concentration of about 620 ppm by 2100. ThePRUDENCE RCM simulations cover the European region at a gridspacing of 50 km and are driven at the lateral boundaries by differentglobal model forcing fields, althoughmost of them utilize forcing fromtime-slice simulations completed with the Hadley Centre atmosphericmodel HadAM3H at a horizontal resolution of 1.25×2.75°. The readeris referred to the PRUDENCE web site (http://www.dmi.dk/f+ u/klima/prudence/) for more information on the PRUDENCE project andexperiment set up.
Finally, in order to address issues of fine scale structure of theclimate change signal, we also review some results from recentsimulations completed by Gao et al. (2006) in which a regional model(the RegCM of Giorgi et al., 1993a,b and Pal et al., 2000) was run at agrid spacing of 20 km for present day (1961–1990) and future (2071–2100, A2 and B2 emission scenarios) climate simulations for a regionencompassing the Mediterranean basin. The regional model was usedin the so-called double nested mode, i.e. it was driven at the lateralboundaries by meteorological fields obtained from the PRUDENCEsimulations at 50 km grid spacing of Giorgi et al. (2004a,b).
3. Assessment of global model simulations
In this section we discuss climate change projections for theMediterranean region as obtained from the MGME models. We
Fig. 3.MGME ensemble average change in 500 hPa geopotential height (Gph) for the four seasFebruary, MAM is March–April–May, JJA is June–July–August, SON is September–October–N
analyze mean change patterns over the Mediterranean (Section 3.1),changes over different Mediterranean sub-regions (Section 3.2) andchanges in inter-annual variability (Section 3.3).
3.1. Mean changes
Figs. 2–5 first show the ensemble average change in seasonal sealevel pressure (SLP), 500 hPa geopotential height (Gph), precipitationand surface air temperature for the period 2071–2100 and the A1Bscenario compared to 1961–1990 over the European region. Note thatthe changes in 500 hPa Gph are always positive because theatmosphere below 500 hPa is warmer, and thus thicker, in thefuture scenarios than present day conditions. What matters in termsof the circulation are the horizontal gradients in the changes of500 hPa Gph.
In DJF the models show an area of increased SLP (Fig. 2), and thusincreased anticyclonic circulation, centered over the central Mediter-ranean, with a pronounced ridge in the 500 hPa Gph change pattern.In the other seasons, the area of increased SLP and 500 hPa Gphextends from the northeastern Atlantic to central Europe and theMediterranean. The main effect of this circulation change pattern is anorthward shift of the Atlantic storm track, with a deflection of stormsnorth of the Mediterranean region into higher latitude areas. We alsonote that increased high pressure and anticyclonic conditionsgenerally lead to greater stability and thus conditions less favorableto storm generation.
As a consequence of these circulation change patterns theMediterranean region exhibits a general reduction in precipitation,while the northern European regions show an increase in
ons, 2071–2100minus 1961–1990, A1B scenario. Units arem. DJF is December–January–ovember.

Fig. 4.MGME ensemble average change in precipitation for the four seasons, 2071–2100 minus 1961–1990, A1B scenario. Units are % of 1961–1990 value. DJF is December–January–February, MAM is March–April–May, JJA is June–July–August, SON is September–October–November.
94 F. Giorgi, P. Lionello / Global and Planetary Change 63 (2008) 90–104
precipitation (Fig. 4). The area of precipitation reduction has amaximum northward extension in the summer, encompassing mostof the western European continental areas, consistently with the SLPand 500 Gph change patterns, which present their largest positivevalues over the northeast Atlantic in this season. In JJA, MAM and SONessentially the entire Mediterranean region and most of WesternEurope show a pronounced decrease in precipitation. In winter thetransition area between positive and negative precipitation changemoves southward and crosses the northern Iberian, Italian and Balkanpeninsulas. In the east–west direction we find that the largestprecipitation reduction occurs over the western and eastern Medi-terranean, partially in association with local topographical features(such as the Iberian Plateau and Atlas mountains in the west and theBalkan peninsula in the East), with a more irregular inter-seasonalbehavior in the east.
Concerning temperature (Fig. 5), the Mediterranean regionexhibits a warming maximum in summer. In winter and spring, themaximum warming magnitudes are found over continental north-eastern Europe, at least partially in response to reduced snow coverthere. In the fall the warming is more equally distributed throughoutthe European land areas. In general the mitigating effect of theMediterranean Sea and the reduced warming over the sea areas ispresent in all seasons.
Figs. 2–5 thus give us an overall picture of increasingly drier andwarmer conditions over the Mediterranean in the future climatescenarios, with this pattern being particularly pronounced in thesummer season. These results are generally consistent withprevious studies using both this ensemble of models (Giorgi andBi, 2005b) and previous generations of AOGCM simulations (Kittel
et al., 1998; Giorgi and Francisco 2000; Giorgi et al., 2001; Ulbrichet al., 2006).
The patterns of SLP, precipitation and temperature change shownin Figs. 2–5 are robust across scenarios and future periods. Forexample, Figs. 6 and 7 show the ensemble average precipitationchange patterns for the B1 and A2 scenarios and the same timeperiod (2071–2100) while Fig. 8 shows the DJF and JJA changes forthe A1B scenario but different time slices (2011–2040 and 2041–2070). The patterns are remarkably similar in shape but withdifferent magnitudes tied to the greenhouse gas forcing: the higherthe forcing the larger the magnitude of change. It is worth notingthat this result, which has been found in previous studies (e.g.Mitchell 2003; Giorgi, 2005) is not obvious, especially for precipita-tion, since both the GHG and aerosol forcings vary markedly acrosstime slices and scenarios.
3.2. Sub-regional analysis
For a more quantitative analysis of the MGME simulations wedivide the Mediterranean area into a number of sub-regions (see Fig.1) and investigate results for the sub-regional averages. Beforeshowing the change projections over these sub-regions we analyzethe performance of the MGME over our area of interest. To do so wecompare the MGME climatology over the various Mediterranean sub-regions to the CRU observations by including only land grid pointsbased on the CRU land mask. Also, in order to assess issues of multi-decadal variability and temporal trends, in our sub-regional analysiswe examine averages for 20-year periods (rather than 30 years). As areference period we use 1961–1980 since this is the latest period of

Fig. 5.MGME ensemble average change in surface air temperature for the four seasons, 2071–2100 minus 1961–1990, A1B scenario. Units are °C. DJF is December–January–February,MAM is March–April–May, JJA is June–July–August, SON is September–October–November.
95F. Giorgi, P. Lionello / Global and Planetary Change 63 (2008) 90–104
the 20th century in which the anthropogenic signal is not dominant(e.g. Mitchell et al., 2001).
Fig. 9 shows the seasonal precipitation and temperature biasesfor the full MGME over the full Mediterranean region and the 6 sub-regions of Fig. 1 for the reference period 1961–1980. Although weonly present biases for the 1961–1980 period, the biases for other20-year periods of the 20th century have similar values. It is evidentthat, as an ensemble, the MGME reproduces well the observedclimatology of the region. Precipitation is mostly underestimated,but in the majority of cases the biases are less than 20% inmagnitude. In addition, the biases do not vary much for thedifferent sub-regions and seasons, which indicates that both thecontrast between semi-arid southern areas and northern wet alpineareas and the seasonal cycle of precipitation, with a wintermaximum and a summer minimum, are captured by the simula-tions. This gives good confidence on the capability of the models tosimulate correctly the climate change signal. The only instances ofrelatively high precipitation bias, over 40%, occur in the summerover the southern and western Mediterranean. However, summerprecipitation over these regions is extremely small and this inflatesthe percentage bias.
The temperature biases for the MGME are also generally small,mostly less than 1 °C. The ensemble of models appears to predomi-nantly underestimate temperature, with cold biases especially in theintermediate seasons (MAM and SON). The largest positive ensemblebiases, in excess of 1 °C, occur over the Alps and northernMediterranean region and might be tied to an underprediction ofwinter snow cover at the relatively coarse model resolutions.
As also indicated in IPCC (2001), the last decades of the 20thcentury showed trends in some climate variables, most noticeablytemperature, likely attributable to anthropogenic greenhouse gasforcing. As an attempt to assess whether the MGME at leastqualitatively captures these trends over the Mediterranean region,Fig. 10 compares the differences in Mediterranean seasonal precipita-tion and temperature between the last 2 decades of the century(1981–2000) and the reference period 1961–1980 in the CRU datasetand in the MGME.
The CRU observed precipitation over the Mediterranean shows adecrease in 1981–2000 in DJF, MAM and JJA, while it shows a smallincrease in SON. The DJF decrease has been attributed to the influenceof an increasingly positive phase of the NAOwhich occurred in the latedecades of the 20th century (Hurrell 1995). The MGME does notreproduce the changes found in the CRU observations except for thesummer drying. The ability of model projections to simulate thissummer drying trend consistently with CRU observations was alsofound by Pal et al. (2004).
The disagreement between observed and simulated precipitationtrends in winter and spring deserves some specific discussion. Onthe one hand, this is not necessarily an indication of poor modelperformance. It could simply be an indication that the observedprecipitation changes are not related to greenhouse gas forcing butare due to natural variability. The largest contribution to the totalMediterranean precipitation comes from the northern areas, whereprecipitation presents a negative correlation with the NAO phase.The increase in the positive NAO phase and the associated decreaseof precipitation in the 1980s and 90s could simply be a random

Fig. 6. MGME ensemble average change in precipitation for the four seasons, 2071–2100 minus 1961–1990, B1 scenario. Units are % of 1961–1990 value. DJF is December–January–February, MAM is March–April–May, JJA is June–July–August, SON is September–October–November.
96 F. Giorgi, P. Lionello / Global and Planetary Change 63 (2008) 90–104
multi-decadal event. On the other hand a shift of NAO towardspositive values is suggested by several scenario simulations (e.g.Terray et al., 2004; Coppola et al., 2005), and the disagreementbetween observed and simulated precipitation trends could showan inadequate reproduction by the models of the early stage of thisbehavior. It should also be added that some uncertainty is presentin precipitation observations, especially in areas of sparse stationdensity, so that the changes indicated by the CRU dataset shouldbe taken with caution. However, while the trends in the otherseasons are generally found not to be significant in other datasets,the winter reduction of precipitation is generally confirmed(Jacobeit et al., 2005; Xoplaki 2002; Xoplaki et al., 2004). Wefinally note that the models and observations show oppositeprecipitation trends in Autumn (Fig. 10), although these trends arerelatively small.
Surface warming in the late 20th century has been clearlyassociated to greenhouse gas forcing, both at the global (Mitchell etal., 2001) and sub-continental (Stott, 2003) scales. Fig. 10 indeedshows that the MGME captures the observed late 20th centurywarming and in particular its seasonality (maximum in summerand minimum in winter). This gives encouraging indicationstowards the use of the MGME for climate change projections overthe region.
Moving now our attention to the projections for the 21st century,Fig. 11 first shows the projected changes (A1B scenario compared to1961–1980) in surface air temperature and precipitation by the modelensemble over the entire Mediterranean region for different 20-yearperiods. Consistently with Figs. 4 and 5, for both variables the change
signal persists of the same sign and increases in magnitudethroughout the century in response to increased greenhouse gasforcing. For the whole basin, precipitation decreases in all seasons andperiods. Summer shows the greatest decrease, from about −7% in2001–2020 to ∼−28% in 2081–2100. In the other seasons thedecreases are ∼−2 to −8% in DJF, −2 to −14% in MAM and −3 to−15% in SON. The surface warming also steadily increases throughoutthe century, being maximum in summer (∼1.2 in 2001–2020 to 4.6 in2081–2100) and minimum in winter (∼0.7 to 3.1 °C). Fig. 11 thusclearly shows that summer is the most responsive season to green-house gas forcing over the Mediterranean.
Also shown in Fig. 11 is the inter-model variability of the changesignal as measured by the standard deviation of the changessimulated by each individual model. With one exception (precipita-tion in DJF), the inter-model standard deviation (and therefore theinter-model spread) increases with time and thus with forcing andintensity of the signal. In other words, the models tend to deviatemore from each other as the simulation progresses and the forcingand change signals increase. The seasonality of the standarddeviation also generally follows the seasonality of the signal, with amarked summer maximum.
In terms of magnitude, the temperature inter-model standarddeviation is much smaller than the ensemble average warmingsignals, indicating that the signals are robust. For precipitation, theinter-model standard deviation of the seasonal precipitation isgenerally smaller than the signal in the late decades of the 21stcentury. In particular, the summer drying signal for the decades 2081–2100 is more than twice as large as the corresponding inter-model

Fig. 7. MGME ensemble average change in precipitation for the four seasons, 2071–2100 minus 1961–1990, A2 scenario. Units are % of 1961–1990 value. DJF is December–January–February, MAM is March–April–May, JJA is June–July–August, SON is September–October–November.
97F. Giorgi, P. Lionello / Global and Planetary Change 63 (2008) 90–104
standard deviation, showing that almost all models agree in projectingdrying over the region.
The sensitivity of the changes to the forcing scenarios is shown inFig. 12. Again we see the same signal in all scenarios (precipitationdecrease and surface warming) with magnitude increasing withincreasing greenhouse gas forcing: the A2 scenario shows the largestchanges while the B1 shows the smallest. The seasonality of thechanges (maximum in summer andminimum inwinter) is retained inall scenarios. Note that the changes are large particularly in thesummer, over 4 °Cwarming and over −25% precipitation reduction, forthe A1B and A2 scenarios.
Fig. 13 shows a comparison of precipitation and temperaturechanges for land and sea areas in the Mediterranean domain. The signand seasonality of the changes are the same over land and sea. Asalready noted, the warming is larger over land than over sea (by about1° in all seasons). Conversely, the precipitation decrease is morepronounced over the sea areas, despite the greater evaporation fromthe sea in the future warmer climate conditions. The pronounceddecrease over sea could be due to the greater distance of most of theMediterranean Sea surface from the northward shifted storm trackand from the areas where the topographic effect on cyclogenesis andprecipitation remains large in the future climate scenarios.
The disaggregation of the precipitation and temperature changesignals by sub-regions within the Mediterranean (see Fig. 1) for theA1B scenario is given in Fig. 14. The temperature change signal isessentially the same in the northern and southern Mediterranean inall seasons (Fig. 14), with maximum differences of only a few tenths ofa degree. For precipitation however, the northern and southernMediterranean change signals show some important differences. In
MAM, JJA and SON both sub-regions exhibit a precipitation decrease,but this is much more pronounced over the southern Mediterraneanregion. In DJF, this different behavior is more marked, with thesouthernMediterranean showing a substantial drying (about −20% forthe A1B scenario), while the northern Mediterranean shows essen-tially no change. These differences in the behavior of the southern andnorthern Mediterranean areas can be ascribed to the seasonaloscillation of the region of increased anticyclonic circulation discussedabove (see Fig. 2) and to the mitigating role of the Alps.
Fig. 14 analyzes the Mediterranean along sub-regions in the east–west direction, with the Alps being treated separately. Again thetemperature change signal shows only modest variability acrossregions (less than a half degree), with the warming being slightlymore pronounced over the western Mediterranean (except forwinter). Greater differences are found for precipitation. Consistentlywith what found in the case of the northern Mediterranean sub-region, the Alps show the least pronounced drying in MAM, JJA andSON and an increase of precipitation in DJF. The other regions show adrying signal in all seasons, least pronounced over the centralMediterranean. This different behavior of the central Mediterraneanarea is consistent with the role of the Alps in mitigating the changetowards drier climate, which does not reach the eastern and westernMediterranean areas.
3.3. Changes in inter-annual variability
Previous analyses of the MGME have also addressed the issue ofchanges in inter-annual variability (Giorgi and Bi 2005a; Giorgi 2006).This was measured by the inter-annual standard deviation for

Fig. 8.MGME ensemble average change in precipitation for the four seasons and different future time periods. Units are % of 1961–1990 value. 1970s is 1961–1990, 2020s is 2011–204,2050s is 2041–2070, 2080s is 2071–2100.
98 F. Giorgi, P. Lionello / Global and Planetary Change 63 (2008) 90–104
temperature and the coefficient of variation (standard deviationdivided by the mean) for precipitation. In the latter case, use of thecoefficient of variation removes the well known dependency of theprecipitation standard deviation on the mean. The results for theentire Mediterranean region are summarized in Table 2 for 6-monthperiods covering the wet/cold season (October–March, or O–M) anddry/warm season (April–September, or A–S).
For precipitation we find a general increase in variability duringboth the wet/cold season and the dry/warm season, therefore thisincrease is found regardless of the magnitude of changes in meanprecipitation. Similarly to the mean, the magnitude of the change inprecipitation variability generally increases with the intensity of theforcing, i.e. they increase with time in the 21st century and areminimum in the B1 scenario. Table 2 also shows that the precipitationvariability change signal is greater in the dry season than the wetseason and that it becomes substantial only in the late decades of thecentury. This increase in precipitation variability appears to begenerally consistent with an intensified hydrological cycle expectedunder warmer conditions. During wet periods the precipitationintensities increase in response to greater atmospheric water holdingcapacity while the wet periods are separated by longer dry periodsdue to feedback with generally drier land areas (IPCC 2001).
For temperature, we find a different variability change signal in thewarm and cold seasons. In the warm season the inter-annualvariability increases, which is consistent with the increase inprecipitation variability and the associated feedbacks between thesurface water and energy budgets. The increase in variability, alongwith the large mean warming, is expected to produce a much more
frequent occurrence of extremely high temperature events and heatwaves (Schar et al., 2004). In the cold season the temperaturevariability shows only small changes, and mostly negative in the latedecades of the century. This has been at least partially attributed to thedecrease of snow cover under warmer conditions, which decreasesthe effectiveness of the snow-albedo feedback mechanism (Raisanen2002; Giorgi and Bi 2005a).
4. Assessment of the PRUDENCE simulations
In this sectionwe review results of regional climate projections forthe European region, including the Mediterranean, produced withinthe framework of the PRUDENCE project. The PRUDENCE strategyentails the use of multiple scenarios (A2 and B2), multiple GCMs (4)and multiple RCMs (9) to assess issues of uncertainty in regionalclimate change projections over Europe. Different RCMs were drivenat the lateral boundaries by either the same or different GCMs. MostPRUDENCE simulations covered the future climate period 2071–2100under the A2 and B2 IPCC scenarios and the changes were calculatedwith respect to the present day period 1961–1990. It should be notedthat, unfortunately, most PRUDENCE RCMdomains did not include theextreme eastern and southern areas of the Mediterranean.
4.1. Mean changes
Fig.15 summarizes the projections by the PRUDENCE full ensembleof models (both regional and global) over different sub-regions ofEurope (adapted from Deque et al., 2005), and in particular it reports

Fig. 10. Observed (CRU data) and MGME ensemble average change in precipitation(upper panel) and surface air temperature (lower panel) for the four seasons over thefull Mediterranean region (see Fig. 1), land only, 1981–2000minus 1961–1980. Units are% of 1961–1980 value for precipitation and °C for temperature.
Fig. 9.MGME ensemble average precipitation (% of present day value, upper panel) andsurface air temperature (°C) bias for the period 1961–1980 and the sub-regions of Fig. 1.The bias is calculated with respect to CRU land observations.
99F. Giorgi, P. Lionello / Global and Planetary Change 63 (2008) 90–104
the range of projections by the PRUDENCE ensemble including allmodels and scenarios. These projections can be roughly comparedwith those obtained from the MGME, although the comparison issomewhat limited by the fact that the definition of the PRUDENCEregions is not the same as the one we adopted in Section 3. A broadagreement between the PRUDENCE and MGME projections over theMediterranean region can be observed. The summer drying andmaximumwarming in all Mediterranean sub-regions is evident also inthe PRUDENCE projections. The only discrepancy with the MGME dataseemingly occurs when comparing the winter precipitation changeover the Iberian Peninsula in PRUDENCE (Fig. 15) with that producedby the MGME over the western European region (Fig. 14). While theformer shows a (small) increase, the latter shows a decrease, i.e. thearea of increased precipitation extends farther south in the PRUDENCEmodels than in theMGME. An important aspect of the results in Fig. 15is that in nearly every case all models agree on the sign of theprecipitation change signal.
Fig. 16 addresses the issue of the relative importance of the sourceof uncertainty in the simulated range of change projections. Thisfigure is derived from the data reported by Deque et al. (2005), whodisaggregated the projection uncertainty (as defined by the range ofmodel projections) into four sources: different GCMs, RCMs andscenarios, and internal GCM variability (i.e. variability associated withdifferent realizations of the same scenario simulation). In evaluatingthe results in Fig. 16, it should be kept in mind that the PRUDENCEscenarios only cover about half of the full IPCC range and thePRUDENCE GCMs are only a small set of the full MGME set.
Fig. 16 first shows that, both for temperature and precipitation, theinternal model variability is a minor source of uncertainty in allseasonal cases and both for temperature and precipitation. In general,for temperature the uncertainty due to the use of different GCMsrepresents the largest contribution to the total uncertainty range,followed by that associated with the scenarios. The uncertaintyassociated with the use of different RCMs (for the same boundaryforcing) is secondary for temperature, implying that the boundaryforcing is dominant in determining the temperature RCM response, atleast at the European-wide scale.
Different conclusions are however found for precipitation. Espe-cially in summer, when local processes (e.g. convection) and sub-regional circulation features are more important than in winter, thecontribution to the total uncertainty deriving from the use of differentRCMs is comparable to that associated with GCM boundary conditionsand scenarios. This implies that the internal RCM physics anddynamics are as important as the boundary forcing in determiningprecipitation. A consequence of this result is that ensembles of RCMsimulations (for the same GCM boundary forcing) may be needed toassess the uncertainty in simulated climate change projections overEurope.
4.2. Changes is variability, extremes and storms
A primary advantage of using RCMs is that their increasedresolution should allow a better simulation of variability andextremes. A few of studies within the PRUDENCE project addressedthe issue of projected changes in variability and extremes over Europe.Inter-annual variability in the control and future climate simulationswas analyzed for example by Giorgi et al. (2004b) and Schar et al.(2004). They found that, especially during the summer, inter-annualvariability increased over the Mediterranean region in the scenarioruns, a result in general agreement with what found in the MGME. Inparticular, Schar et al. (2004) pointed out how the increase of summervariability in conjunctionwith themeanwarming would lead tomuchmore frequent heat waves of magnitude similar or even greater thanthat occurred in the summer of 2003.
Changes in extreme events were analyzed by Christensen andChristensen (2003), Pal et al. (2004), Semmler and Jacob (2004),Kjellstrom (2004), Sanchez et al. (2004), Beniston et al. (2007) andKjellstrom et al. (2007). High temperature extremes and droughtevents were found to increase substantially in summer while winterlow temperature extremes were found to decrease (Beniston et al.,2007; Kjellstrom 2004; Kjellstrom et al., 2007). Concerning

Fig. 11. MGME ensemble average change in mean precipitation (upper left panel), precipitation inter-model standard deviation (upper right panel), mean surface air temperature(lower left panel) and surface air temperature inter-model standard deviation (lower right panel) for the full Mediterranean region (see Fig. 1), the four seasons and different futuretime periods. The changes are calculated with respect to the 1961–1980 reference period and include only land points. Units are % of 1961–1980 value for mean precipitation,coefficient of variation and standard deviation, and °C for mean temperature.
100 F. Giorgi, P. Lionello / Global and Planetary Change 63 (2008) 90–104
precipitation, the overall substantial decrease in the summer meanwas not accompanied by a corresponding decrease in the intensity ofevents, but rather a decrease in their frequency. In particular, the
Fig. 12.MGME ensemble average change in mean precipitation (upper panel) and meansurface air temperature (lower panel) for the full Mediterranean region (see Fig. 1), thefour seasons and different scenario. The changes are calculated between the periods2081–2100 and 1961–1980 and include only land points. Units are % of 1961–1980 valuefor precipitation and °C for temperature.
frequency of extreme summer precipitation events increased overlarge regions of the Mediterranean (Christensen and Christensen2003; Pal et al., 2004). These results imply not just a an overall
Fig. 13.MGME ensemble average change areas in mean precipitation (upper panel) andmean surface air temperature (lower panel) over land and sea areas within the fullMediterranean region (see Fig. 1) and the four seasons. The changes are calculatedbetween the periods 2081–2100 and 1961–1980. Units are % of 1961–1980 value forprecipitation and °C for temperature.

Fig. 14.MGME ensemble average change in mean precipitation (upper panels) and mean surface air temperature (lower panels) for the different Mediterranean sub-regions of Fig. 1,the four seasons and the A1B scenario. The changes are calculated between the periods 2081–2100 and 1961–1980 and include only land points. Units are % of 1961–1980 value forprecipitation and °C for temperature.
Table 2Change in precipitation coefficient of variation (Δσ(P)) and surface air temperaturestandard deviation (Δσ(T)) averaged over the Mediterranean for the wet (October–March, O–M) and dry (April–September, A–S) seasons, different future time slices anddifferent scenarios. The changes are calculated with respect to the 1961–1980 valuesand are expressed as percentage of the 1961–1980 value. Only land points are includedin the calculations
2001–2020 2021–2040 2041–2060 2061–2080 2081–2100
Ds(P) O–M B1 3.69 8.36 10.81 11.54 16.18A1B 7.61 9.64 13.68 17.31 21.57A2 3.86 14.98 9.80 26.80 37.08
Ds(P) A-S B1 10.40 15.29 32.87 22.96 28.01A1B 9.11 11.35 24.05 34.70 48.78A2 7.81 20.45 22.09 34.09 43.19
Ds(T) O–M B1 0.00 4.84 5.71 −2.33 −6.01A1B 3.46 1.90 −2.66 0.31 0.46A2 2.49 1.24 −7.61 −0.27 −4.73
Ds(T) A–S B1 −0.54 4.63 7.46 3.13 10.48A1B 4.66 3.88 5.80 13.05 20.72A2 −0.18 −5.39 6.73 9.82 14.56
101F. Giorgi, P. Lionello / Global and Planetary Change 63 (2008) 90–104
decreased probability of precipitation but also a change of shape of itsprobability distribution, with an increased skewness determining atthe same time higher probability for intense events and a lower valueof average precipitation. On a yearly basis, a prevailing increase inprecipitation extremes over the Mediterranean was found, particu-larly over and around the Alpine region, by Beniston et al. (2007) andSemmler and Jacob (2004).
The RCM simulations by Giorgi et al. (2004a,b) were used for ananalysis of changes in different cyclone statistics under A2 scenarioconditions by Lionello et al. (2006a,b). Among these statistics were thesynoptic signal (the standard deviation of the 1–7 day band passfiltered sea level pressure maps) and the cyclone trajectories. For theMediterranean region the results suggested a weaker synoptic signalthan in present climate (Lionello et al., 2006a,b), except over thenorth-western regions in winter and spring and some continentalareas in summer. The number of cyclone centers decreased in the A2scenario except in summer, where it increased significantly because ofincreased levels of activity over land areas (mainly the Iberian andBalkan peninsulas). Fig. 17 shows the change of synoptic signalbetween the A2 and present climate simulations. The results confirm achange towards more stable conditions over most of the Mediterra-nean, except over the north-western areas during the cold season.These changes appear to be consistent with trends already detectedduring the second half of the 20th century (e.g. Trigo et al., 2006) andwith what has been suggested by previous analyses of GCM output(Lionello et al. 2002; Pinto et al. in press).
4.3. High resolution simulation
In this sub-section, we refer to the recent work of Gao et al.(2006), who reported on a high resolution (grid spacing of 20 km)climate change experiment over the Mediterranean region, which todate is the finest scale climate change scenario produced over theregion.
One of the important messages of the work by Gao et al. (2006) isthat the climate change signal over the Mediterranean showssubstantial fine scale structure in response to the forcing of thecomplex topography of the region. This is illustrated by Fig. 18, whichshows the simulated winter precipitation change and relates it to thechange in low level circulation. Fig. 18 shows significant gradients inthe magnitude and sign of the precipitation change signal acrosstopographical systems, for example the Apennines in central Italy, thenortheastern Alps and the Iberian plateau. These gradients are clearlyassociated with the low level circulation changes. The largest positiveincreases are found in the upwind sides of the topographical chainswith respect to the direction of the prevailing circulation change,where precipitation is produced by uplift of humid air against themountain slopes. Conversely, aminimum increase or even a decrease is

Fig. 15. Minimum and maximum change in surface air temperature (DT) and precipitation (DP) simulated by the ensemble of global and regional climate models in the PRUDENCEproject over different PRUDENCE sub-regions (land only points), 2071–2100minus 1961–1990, A2 scenario. Units are °C for temperature andmm/day for precipitation. Adapted fromthe data in Deque et al. (2005).
Fig. 16. Relative magnitude of the sources of uncertainty in the simulation of seasonalsurface air temperature and precipitation change within the ensemble of PRUDENCEexperiments for the whole European region. Adapted from the data in Deque et al.(2005).
102 F. Giorgi, P. Lionello / Global and Planetary Change 63 (2008) 90–104
found on the corresponding lee side of the mountain chains. A similarfine scale forcing of the change signalwas found also for the occurrenceof drought and extreme precipitation events (Gao et al., 2006).
Comparison of the precipitation changes in Fig. 18 with thosebased on the MGME in Fig. 3 clearly shows that current AOGCMs arestill too coarse to capture the fine scale structure of the climate changesignal over the Mediterranean region. This has the importantconsequence that high resolution modeling is necessary to simulatesurface climate change over the region for use in impact assessmentstudies. In this regard, it is worth mentioning that the quality ofcurrent RCM projections is often deemed sufficient to use RCM outputin impact assessment studies (e.g. Mearns et al., 2001; Adams et al.,2003; Stone et al., 2003; Kleinn 2005).
5. Summary considerations and discussion
In this paper we have presented a review of climate changeprojections over the Mediterranean region based on the latest andmost advanced sets of global and regional climate model simulations.These simulations give a collective picture of a substantial drying andwarming of the Mediterranean region, especially in the warm season(precipitation decrease exceeding −25–30% and warming exceeding4–5 °C). The only exception to this picture is an increase ofprecipitation during the winter over some areas of the northernMediterranean basin, most noticeably the Alps. Inter-annual varia-bility is projected to generally increase as is the occurrence of extremeheat and drought events. These signals are robust in that they arepresent inmost projections from both global and regional models, andare consistent across emission scenarios and future time slices. Inaddition, this general signal has been found quite consistently also inprevious generations of global (Kittel et al., 1998; Giorgi and Francisco2000; Giorgi et al., 2001; Ulbrich et al., 2006) and regional (e.g. Giorgiet al., 1992; Jones et al., 1997; Deque et al., 1998; Machenhauer et al.,1998; Raisanen et al., 1999; Christensen and Christensen 2003;Semmler and Jacob 2004; Kjellstrom 2004; Schar et al., 2004; Giorgi
et al., 2004b; Raisanen et al., 2004; Deque et al., 2005) modelprojections. In this regard, we should recall that we have mostlyanalyzed the signal from ensembles of simulations. By definition, thisfilters out inter-decadal variability. As pointed out by Giorgi (2005),actual climate change will be only one “realization” possiblycharacterized by multi-decadal variability that should be superposedto the mean projected changes found here.
What are the physical processes underlying these projectedchanges? We have seen that the drying of the Mediterranean isassociated with increasing anticyclonic circulation over the regionwhich causes a northward shift of the mid-latitude storm track. Thisnorthward shift has a seasonal migration and it is maximum insummer and minimum in winter. The winter change pattern hascharacteristics consistent with those found during the positive phaseof the NAO. Indeed, at least two previous studies (Terray et al., 2004;

Fig. 17. Change in synoptic activity between A2 scenario and present day conditions in the simulations of Giorgi et al. (2004a,b). Colored areas indicate statistically significantdifferences at the 95% confidence level on the basis of a Mann–Whitney test. (For interpretation of the references to colour in this figure legend, the reader is referred to the webversion of this article.)
Fig. 18. Winter (DJF) precipitation change simulated over the Mediterranean region inthe high resolution (20 km grid spacing) experiment of Gao et al. (2006). The changesare calculated between the periods of 2071–200 and 1961–1990 for the A2 scenario.Units are % of 1961–1990 value. The arrows indicate the corresponding change in850 mb wind.
103F. Giorgi, P. Lionello / Global and Planetary Change 63 (2008) 90–104
Coppola et al., 2005) found an increase in the occurrence of positiveNAO conditions in future climate simulations. In particular, Coppola etal. (2005) found the emergence of a bimodal distribution of NAOevents in greenhouse gas forced scenario simulations, with the secondmode located in the region of high positive NAO values. This wouldyield a tendency to increased occurrence of extreme seasons in thescenario projections, which would be consistent with the increasedvariability found in this study.
The causes for the large summer drying signal have beeninvestigated by Rowell and Jones (2006), who examined four possiblemechanisms: (1) Low spring soil moisture conditions leading toreduced summer convection; (2) large land-sea contrast in warmingleading to reduced relative humidity and precipitation over thecontinent; (3) positive summer soil moisture precipitation feedback;and (4) remote influences (e.g. descending motions induced by thestrengthening of the Asian monsoon). The first two were found toprovide the dominant contributions, while remote effects were foundto be only of minor importance. It is also possible that the greenhousegas forcing is triggering a change in large scale wave patterns thatenhance the occurrence of blocking like anticyclonic circulations overthe northeastern Atlantic (Pal et al., 2004).
The change signals projected by current models for the Mediterra-nean region are large, consistent and increase with the magnitude ofthe forcing. As mentioned, the comparative analysis of Giorgi (2006)indeed places the Mediterranean among the most responsive regionsto global climate change. Given that the Mediterranean is a transitionarea between the temperate climate of central Europe and the aridclimate of northern Africa, such changes have the potential toprofoundly modify the climate characteristics of the Mediterranean.
This, alongwith the potential of pronounced sea level rise under globalwarming, could have devastating effects on water resources, naturalecosystems (both terrestrial and marine), human activities (e.g.agriculture, recreation, tourism) and health. The evidence frommodel projections thus indicates that the Mediterranean might be anespecially vulnerable region to global climate change and that this

104 F. Giorgi, P. Lionello / Global and Planetary Change 63 (2008) 90–104
issue cannot be underestimated by the scientific and policy makingcommunity.
Acknowledgements
We would like to thank X. Bi for technical support in producingsome of the figures included in this paper and two anonymousreviewers for their constructive and useful comments.
References
Adams, R.M., McCarl, B.A., Mearns, L.O., 2003. The effects of spatial scales of climatescenarios on economic assessments: an example from U.S. agriculture. Clim.Change 60, 131–148.
Alpert, P., et al., 2006. Relations between climate variability in theMediterranean regionand the Tropics: ENSO, South Asian and African monsoons, hurricanes and Saharandust. In: Lionello, P., Malanotte-Rizzoli, P., Boscolo, R. (Eds.), Mediterranean ClimateVariability. Elsevier, Amsterdam, pp. 149–177.
Beniston, M., et al., 2007. Current and future extreme climatic events in Europe:observations and modeling studies conducted within the EU PRUDENCE project.Clim. Change 81, 71–95.
Christensen, J.H., Christensen, O.B., 2003. Climate modeling: severe summertimeflooding in Europe. Nature 421, 805–806.
Christensen, J.H., Carter, T.R., Giorgi, F., 2002. PRUDENCE employs new methods toassess European climate change. EOS 83, 147.
Coppola, E., Kucharski, F., Giorgi, F., Molteni, F., 2005. Bimodality of the North AtlanticOscillation in simulations with greenhouse gas forcing. Geophys. Res. Lett. 32,L23709.
Deque, M., Marquet, P., Jones, R.G.,1998. Simulation of climate change over Europe usinga global variable resolution general circulation model. Clim. Dyn. 14, 173–189.
Deque, M., et al., 2005. Global high resolution vs. regional climate model climate changescenarios over Europe: quantifying confidence level from PRUDENCE results. Clim.Dyn. 25, 653–670.
Gao, X., Pal, J.S., Giorgi, F., 2006. Projected changes in mean and extreme precipitationover the Mediterranean region from high resolution double nested RCMsimulations. Geophys. Res. Lett. 33, L03706.
Giorgi, F., 2005. Interdecadal variability of regional climate change: implications for thedevelopment of regional climate change scenarios. Meteorol. Atmos. Phys. 89, 1–15.
Giorgi, F., 2006. Climate change Hot-spots. Geophys. Res. Lett. 33, L08707.Giorgi, F., Francisco, R., 2000. Evaluating uncertainties in the prediction of regional
climate change. Geophys. Res. Lett. 27, 1295–1298.Giorgi, F., Bi, X., 2005a. Regional changes in surface climate interannual variability for
the 21st century from ensembles of global model simulations. Geophys. Res. Lett.32, L13701.
Giorgi, F., Bi, X., 2005b. Updated regional precipitation and temperature changes for the21st century from ensembles of recent AOGCM simulations. Geophys. Res. Lett. 32,L21715.
Giorgi, F., Marinucci, M.R., Visconti, G., 1992. A 2XCO2 climate change scenario overEurope generated using a limited area model nested in a general circulation model.II: climate change scenario. J. Geophys. Res. 97, 10011–10028.
Giorgi, F., Marinucci, M.R., Bates, G.T., 1993a. Development of a second generationregional climate model (RegCM2). Part I: boundary layer and radiative transferprocesses. Mon. Weather Rev. 121, 2794–2813.
Giorgi, F., Marinucci, M.R., Bates, G.T., DeCanio, G., 1993b. Development of a secondgeneration regional climate model (RegCM2). Part II: convective processes andassimilation of lateral boundary conditions. Mon. Weather Rev. 121, 2814–2832.
Giorgi, F., Hurrell, J.W., Marinucci, M.R., Beniston, M., 1997. Elevation signal in surfaceclimate change: a model study. J. Clim. 10, 288–296.
Giorgi, F., et al., 2001. Emerging patterns of simulated regional climatic changes for the21st century due to anthropogenic forcings. Geophys. Res. Lett. 28, 3317–3320.
Giorgi, F., Bi, X., Pal, J.S., 2004a. Mean, interannual variability and trends in a regionalclimate change experiment over Europe. Part I: present day climate (1961–1990).Clim. Dyn. 22, 733–756.
Giorgi, F., Bi, X., Pal, J.S., 2004b. Mean, interannual variability and trends in a regionalclimate change experiment over Europe. Part II: future climate scenarios (2071–2100). Clim. Dyn. 23, 839–858.
Hurrell, J.W., 1995. Decadal trends in the North Atlantic Oscillation: regionaltemperature and precipitation. Science 269, 676–679.
Intergovernmental Panel on Climate Change, 2000. In: Nakicenovic, N., et al. (Ed.),Special Report on Emission Scenarios. CambridgeUniversity Pres, NewYork. 599 pp.
Intergovernmental Panel on Climate Change, 2001. In: Houghton, J.T., Ding, Y., Griggs, D.J., Noguer, M., van der Linden, P.J., Dai, X., Maskell, K., Johnson, C.A. (Eds.), ClimateChange 2001: The Scientific Basis. Contribution of Working Group I to the ThirdAssessment Report of the Intergovernmental Panel on Climate Change. CambridgeUniversity Press, Cambridge. 881 pp.
Jacobeit, J., Dünkeloh, A., Hertig, E., 2005. Mediterranean rainfall changes and theircauses. In: Losan, J., et al. (Ed.), WarnsignalKlima: GenugWasser für alle? Hamburg,pp. 192–196.
Jones, R.G., Murphy, J.M., Noguer, M., Keen, A.B., 1997. Simulation of climate change overEurope using a nested regional climate model. II: comparison of driving andregional model responses to a doubling of carbon dioxide. Q. J. R. Meteorol. Soc. 123,265–292.
Kittel, T.G.F., Giorgi, F., Meehl, G.A., 1998. Intercomparison of regional biases anddoubled CO2 sensitivities of coupled atmosphere–ocean general circulation modelexperiments. Clim. Dyn. 14, 1–15.
Kjellstrom, E., 2004. Recent and future signatures of climate change in Europe. Ambio33, 193–198.
Kjellstrom, E., et al., 2007. Modeling daily temperature extremes: recent climate andfuture changes over Europe. Clim. Change 81, 249–265.
Kleinn, J., 2005. Hydrologic simulations in the Rhine basin driven by a regional climatemodel. J. Geophys. Res. 110, D05108.
Lionello, P., Dalan, F., Elvini, E., 2002. Cyclones in the Mediterranean region: the presentand doubled CO2 climate scenarios. Clim. Res. 22, 147–159.
Lionello, P., et al., 2006a. The Mediterranean climate: an overview of the maincharacteristics and issues. In: Lionello, P., Malanotte-Rizzoli, P., Boscolo, R. (Eds.),Mediterranean Climate Variability. Elsevier, Amsterdam, pp. 1–26.
Lionello, P., et al., 2006b. Cyclones in the Mediterranean region: climatology and effectson the environment. In: Lionello, P., Malanotte-Rizzoli, P., Boscolo, R. (Eds.),Mediterranean Climate Variability. Elsevier, Amsterdam, pp. 325–372.
Luterbacher, J., et al., 2006. Mediterranean climate variability over the last centuries. Areview. In: Lionello, P., Malanotte-Rizzoli, P., Boscolo, R. (Eds.), MediterraneanClimate Variability. Elsevier, Amsterdam, pp. 27–148.
Machenhauer, B., et al., 1998. Validation and Analysis of Regional Present-day Climateand Climate Change Simulations over Europe. . MPI Report No, 275. MPI, Hamburg,Germany.
Mearns, L.O., Easterling, W., Hays, C., Marx, D., 2001. Comparison of agricultural impactsof climate change calculated from high and low resolution climate changescenarios. Part I: the uncertainty due to spatial scale. Clim. Change 51, 131–172.
Mitchell, J.F.B., et al., 2001. Detection of climate change and attribution of causes.Chapter 12 of Intergovernmental Panel on Climate Change (IPCC), 2001: climatechange 2001: the scientific basis. In: Houghton, J.T., Ding, Y., Griggs, D.J., Noguer, M.,van der Linden, P.J., Dai, X., Maskell, K., Johnson, C.A. (Eds.), Contribution ofWorkingGroup I to the Third Assessment Report of the Intergovernmental Panel on ClimateChange. Cambridge University Press, Cambridge, pp. 695–738.
Mitchell, T.D., 2003. Pattern scaling. An examination of the accuracy of the technique fordescribing future climates. Clim. Change 60, 217–242.
New, M.G., Hulme, M., Jones, P.D., 2000. Representing twentieth century space timeclimate fields. Part II: development of a 1901–1996 mean monthly terrestrialclimatology. J. Clim. 13, 2217–2238.
Pal, J.S., Small, E.E., Eltahir, E.A.B., 2000. Simulation of regional scale water and energybudgets: representation of sub-grid cloud and precipitation processes withinRegCM. J. Geophys. Res. 29579–29594.
Pal, J.S., Giorgi, F., Bi, X., 2004. Consistency of recent summer European precipitationtrends an extremes with future regional climate projections. Geophys. Res. Lett. 31,L13202.
Pinto, J.G., Spangehl, T., Ulbrich, U., Speth, P., in press. Assessment of winter cycloneactivity in a transient ECHAM4-OPYC3 GHG experiment. Meteorol. Zeitschrift.
Raisanen, J., 2002. CO2 induced changes in interannual temperature and precipitationvariability in 19 CMIP2 experiments. J. Clim. 15, 2395–2411.
Raisanen, J., et al., 1999. The First Rossby Centre Regional Climate Scenario— DynamicalDownscaling of CO2-induced Climate Change in the HadCM2 GCM. . SHMI ReportsMeteorology and Climatology No, 85. Swedish Meteorological and HydrologicalInstitute, Norrkoping, Sweden. 56 pp., SE-601 76.
Raisanen, J., et al., 2004. European climate in the late twenty-first century: regionalsimulations with two driving global models and two forcing scenarios. Clim. Dyn.22, 13–31.
Rotach, M.W., et al., 1997. Nested regional simulation of climate change over the Alps forthe scenario of doubled greenhouse gas forcing. Theor. Appl. Climatol. 57, 209–227.
Rowell, D.P., Jones, R.G., 2006. Causes and uncertainty of future summer drying overEurope. Clim. Dyn. 27, 281–299.
Sanchez, E., Gallardo, C., Gaertner, M.A., Arribas, A., Castro, M., 2004. Future climateextreme events in the Mediterranean simulated by a regional climate model: a firstapproach. Glob. Planet. Change 44, 163–180.
Schar, C., et al., 2004. The role of increasing temperature variability in Europeansummer heatwaves. Nature 427, 332–336.
Semmler, T., Jacob, D., 2004. Modeling extreme precipitation events— a climate changesimulation for Europe. Glob. Planet. Change 44, 119–127.
Stone, M.C., Hotchkiss, R.H., Mearns, L.O., 2003. Water yield response to high and lowspatial resolution climate change scenarios in the Missouri River Basin. Geophys.Res. Lett. 30, 1186.
Stott, P.A., 2003. Attribution of regional scale temperature changes to anthropogenicand natural causes. Geophys. Res. Lett. 30, 1728.
Terray, L., Demory, M.E., Deque, M., de Coetlogon, G., Maisonnave, E., 2004. Simulationof late 21st century changes inwintertime atmospheric circulation over Europe dueto anthropogenic causes. J. Clim. 17, 4630–4645.
Trigo, R., et al., 2006. Relations between variability in the Mediterranean region andmid-latitude variability. In: Lionello, P., Malanotte-Rizzoli, P., Boscolo, R. (Eds.),Mediterranean Climate Variability. Elsevier, Amsterdam, pp. 179–226.
Xoplaki, E., 2002. Climate variability over the Mediterranean, PhD thesis, University ofBern, Switzerland, Available through: http://sinus.unibe.ch/ klimet/docs/phd_xo-plaki.pdf.
Xoplaki, E., González-Rouco, J.F., Luterbacher, J., Wanner, H., 2004. Wet seasonMediterranean precipitation variability: influence of large-scale dynamics andtrends. Clim. Dyn. 23, 63–78.
Ulbrich, U., et al., 2006. The Mediterranean climate change under global warming. In:Lionello, P., Malanotte-Rizzoli, P., Boscolo, R. (Eds.), Mediterranean ClimateVariability. Elsevier, Amsterdam, pp. 398–415.
Copyright © 2022 FDOKUMEN