
Teleconnection–extreme precipitation relationships over the Mediterranean region
14
ORIGINAL PAPER Teleconnection–extreme precipitation relationships over the Mediterranean region Simon O. Krichak & Joseph S. Breitgand & Silvio Gualdi & Steven B. Feldstein Received: 14 June 2012 /Accepted: 16 October 2013 /Published online: 6 November 2013 # Springer-Verlag Wien 2013 Abstract The relationship between five teleconnection patterns (North Atlantic Oscillation (NAO), Arctic Oscillation (AO), East Atlantic/Western Russian (EAWR) pattern, Scandinavian (SCAND) pattern, and El Niño Southern Oscillation (ENSO)) and the frequency of occurrence of days (per month) with extreme precipitation in the Euro-Mediterranean region is investigated with National Centers for Environmental Prediction–National Center for Atmospheric Research reanalysis data. To quantify the teleconnection–precipitation relationships over the Euro- Mediterranean region, linear correlations are calculated between the monthly teleconnection indices for the five patterns and time series at each grid point of the monthly frequency of days with extreme precipitation, focusing on daily precipitation amounts that exceed a particular threshold value (a 90 % threshold is used). To evaluate dynamical processes, the teleconnection indices are also correlated with the frequencies of days with extreme values of dynamic tropopause pressure and precipitable water. The former quantity is used as a proxy for potential vorticity intrusions and the latter to identify regions of enhanced moisture. The results of this analysis indicates positive, statistically significant correlations between the NAO, AO, and SCAND indices and the frequency of extreme precipitation in the western Mediterranean; positive (negative) correlations between the EAWR index and the extreme precipitation frequency in the eastern (western) Mediterranean; and a positive correlation between the Niño3.4 index and the extreme precipitation frequency over the Iberian Peninsula and the Middle East. For all of the teleconnection patterns other than ENSO, the dynamic tropopause pressure correlation patterns resemble those for the precipitation. In contrast, similar precipitation and precipitable water correlation patterns are observed only for ENSO. These findings suggest that the teleconnections affect the interannual variation of the frequency of days with extreme precipitation over a large part of the Euro-Mediterranean region through their impact on the spatial distribution of regions with enhanced potential vorticity and air moisture. 1 Introduction A change in the character of precipitation over Europe during the second half of the 20th century has been recently identified (Zolina et al. 2010). Over much of the area wet episodes are now lasting longer and are more intense than 60 years ago. Furthermore, this trend in the intensity of precipitation events was found to be correlated with a trend in the frequency of occurrence of days with extreme precipitation (Zolina et al. 2010). The above findings provide the basis for the application of a frequency perspective in the analysis of climate variations over the Mediterranean region (MR), which is defined in this study as that region which includes the Mediterranean Sea, southeastern Europe, and near coastal areas of northern Africa and the Arabian Peninsula. The path that cyclones take through the MR typically depends upon the large-scale atmospheric conditions associated with several teleconnection patterns, or climate S. O. Krichak (*) : J. S. Breitgand Department of Geophysics and Planetary Sciences, Raymond and Beverly Sackler Faculty of Exact Sciences, Tel Aviv University, Tel Aviv, Israel e-mail: [email protected] S. Gualdi Istituto Nazionale di Geofisica e Vulcanologia, INGV, Centro Euro-Mediterraneo per i Cambiamenti Climatici CMCC, Bologna, Italy S. B. Feldstein Department of Meteorology, The Pennsylvania State University, University Park, PA, USA Theor Appl Climatol (2014) 117:679–692 DOI 10.1007/s00704-013-1036-4
Transcript of Teleconnection–extreme precipitation relationships over the Mediterranean region
ORIGINAL PAPER
Teleconnection–extreme precipitation relationshipsover the Mediterranean region
Simon O. Krichak & Joseph S. Breitgand & Silvio Gualdi &Steven B. Feldstein
Received: 14 June 2012 /Accepted: 16 October 2013 /Published online: 6 November 2013# Springer-Verlag Wien 2013
Abstract The relationship between five teleconnectionpatterns (North Atlantic Oscillation (NAO), ArcticOscillation (AO), East Atlantic/Western Russian (EAWR)pattern, Scandinavian (SCAND) pattern, and El NiñoSouthern Oscillation (ENSO)) and the frequency ofoccurrence of days (per month) with extreme precipitation inthe Euro-Mediterranean region is investigated with NationalCenters for Environmental Prediction–National Center forAtmospheric Research reanalysis data. To quantify theteleconnection–precipitation relationships over the Euro-Mediterranean region, linear correlations are calculatedbetween the monthly teleconnection indices for the fivepatterns and time series at each grid point of the monthlyfrequency of days with extreme precipitation, focusing ondaily precipitation amounts that exceed a particular thresholdvalue (a 90 % threshold is used). To evaluate dynamicalprocesses, the teleconnection indices are also correlated withthe frequencies of days with extreme values of dynamictropopause pressure and precipitable water. The formerquantity is used as a proxy for potential vorticity intrusionsand the latter to identify regions of enhanced moisture. Theresults of this analysis indicates positive, statisticallysignificant correlations between the NAO, AO, and SCAND
indices and the frequency of extreme precipitation in thewestern Mediterranean; positive (negative) correlationsbetween the EAWR index and the extreme precipitationfrequency in the eastern (western) Mediterranean; and apositive correlation between the Niño3.4 index and theextreme precipitation frequency over the Iberian Peninsulaand the Middle East. For all of the teleconnection patternsother than ENSO, the dynamic tropopause pressurecorrelation patterns resemble those for the precipitation. Incontrast, similar precipitation and precipitable watercorrelation patterns are observed only for ENSO. Thesefindings suggest that the teleconnections affect the interannualvariation of the frequency of days with extreme precipitationover a large part of the Euro-Mediterranean region throughtheir impact on the spatial distribution of regions withenhanced potential vorticity and air moisture.
1 Introduction
A change in the character of precipitation over Europe duringthe second half of the 20th century has been recently identified(Zolina et al. 2010). Over much of the area wet episodes arenow lasting longer and are more intense than 60 years ago.Furthermore, this trend in the intensity of precipitation eventswas found to be correlated with a trend in the frequency ofoccurrence of days with extreme precipitation (Zolina et al.2010). The above findings provide the basis for theapplication of a frequency perspective in the analysis ofclimate variations over the Mediterranean region (MR), whichis defined in this study as that region which includes theMediterranean Sea, southeastern Europe, and near coastalareas of northern Africa and the Arabian Peninsula.
The path that cyclones take through the MR typicallydepends upon the large-scale atmospheric conditionsassociated with several teleconnection patterns, or climate
S. O. Krichak (*) : J. S. BreitgandDepartment of Geophysics and Planetary Sciences, Raymond andBeverly Sackler Faculty of Exact Sciences, Tel Aviv University,Tel Aviv, Israele-mail: [email protected]
S. GualdiIstituto Nazionale di Geofisica e Vulcanologia, INGV, CentroEuro-Mediterraneo per i Cambiamenti Climatici CMCC, Bologna,Italy
S. B. FeldsteinDepartment of Meteorology, The Pennsylvania State University,University Park, PA, USA
Theor Appl Climatol (2014) 117:679–692DOI 10.1007/s00704-013-1036-4
anomalies. Furthermore, several studies have shown that anumber of teleconnection patterns play an important role indetermining the transport of moisture into the MR (e.g.,Mariotti et al. 2002; Lionello et al. 2006a, b). In particular, ithas been found that the anomalous flows associated withteleconnection patterns can result in some parts of the regionlacking precipitation at the expense of excessively wetconditions elsewhere. For example, high-pressure conditionsin southeastern Europe tend to divert the Mediterranean stormtrack southwards, resulting in increased precipitation in theeastern Mediterranean (EM) (Ulbrich and Christoph 1999). Incontrast, an increase in the number of northern Mediterraneanstorms results in fewer cyclones and hence lower precipitationin the EM.
Among those teleconnections that have been found toinfluence the monthly mean precipitation in the MR region,the following five patterns are most important—the NorthAtlantic Oscillation (NAO), Arctic Oscillation (AO), EastAtlantic/Western Russia pattern (EAWR), ScandinavianOscillation (SCAND), and El Niño Southern Oscillation(ENSO), as specified below.
The NAO is associated with a meridional dipole structurein sea level pressure, with its two centers of action beinglocated near Iceland and the Azores. The results of analyses(Hurrell 1995; Lionello et al. 2006a, b) demonstrate anincreased frequency of occurrence of strong cyclones andabove normal precipitation amounts during negative NAOmonths over the northern and western MR. The impacts ofboth the positive and negative NAO show a decreasinginfluence in the eastern and especially in the southeasternparts of the MR (Trigo et al. 2006).
The Arctic Oscillation (AO) is quite similar to the NAO(Wallace and Gutzler 1981; Thompson and Wallace 1998;Ambaum et al. 2001), except for the presence of an additionalcenter of action over the northeast Pacific. As with the NAO,the AO is a major source of intra-seasonal variability over theNorth Atlantic and Europe during winter, but its influenceremains detectable throughout other seasons. The relationshipbetween the NAO and AO is not fully understood (e.g., Cohenand Barlow 2005; Givati and Rosenfeld 2013). Although thesetwo patterns are highly correlated with each other (ThompsonandWallace 2000; Wallace 2000), as we will see, the impact ofthese two patterns on MR precipitation may be different.
The EAWR pattern is associated with a positivegeopotential height anomalies over western Europe andnorthern China and negative geopotential height anomaliesover the North Atlantic and north of the Caspian Sea. It isuseful to note that the strength of the negative height anomalycenter over the North Atlantic is at its maximum during theautumn months and weakens into the cool season (http://www.cpc.ncep.noaa.gov/). Significant positive correlationshave been observed between the EAWR index andprecipitation over northeastern Africa, the Near East, eastern
Turkey, and the Black Sea, whereas negative correlations arefound over the northwestern Mediterranean and westernEurope (Quadrelli et al. 2001; Krichak et al. 2002; Xoplakiet al. 2004; Krichak and Alpert 2005a, b; Trigo et al. 2006;Feldstein and Dayan 2008).
The Scandinavian pattern (SCAND) consists of one centerof action which spans Scandinavia and the adjacent ArcticOcean and a second, weaker, center with opposite sign thatextends across southern Europe, the MR, and western Siberia(Barnston and Livezey 1987). Positive SCAND months aretypically associated with above normal precipitation acrosscentral and southern Europe including Italy, the easternAdriatic coast, and the southern Alps and below-averageprecipitation across Scandinavia (Quadrelli et al. 2001;Xoplaki et al. 2004; Lionello et al. 2006a, b; Trigo et al.2006, 2008).
The ENSO phenomenon is characterized by a 3- to 7-yearquasi-periodic climate pattern in the tropical Pacific Ocean.During positive ENSO (i.e., El Niño) events, the tropicalatmosphere warms and the subtropical jet stream strengthenson its equatorial flank and shifts toward the equator. TheHadley circulation intensifies and also contracts equatorward.Poleward of the tropical warming there is a latitudinal belt ofmarked cooling, extending from the surface to the tropopause(Fraedrich and Muller 1992). The ENSO has also been foundto affect synoptic processes over Europe (Seager et al. 2003;Pozo-Vazcuez et al. 2005). It has been shown that during theautumn and early winter periods preceding positive ENSOyears, the western MR receives about 10 % more rainfall thanaverage (Mariotti et al. 2002; Shaman and Tziperman 2011).For the EM, the relationship is less clear. A statisticallysignificant ENSO–EM rainfall correlation during late autumnhas been found for the time period after the mid-1970s (Priceet al. 1998; Alpert et al. 2006). No statistically significantcorrelation has been detected, however, for the time periodfrom the early 1950s to the mid-1970s. Awell-based physicalexplanation for the change in the precipitation response toENSO has not been found. The change in the EMprecipitation–ENSO response (Price et al. 1998) could be aconsequence of the fact that the Indian Ocean experienced asudden surface warming after 1976–77. The evolution ofENSO was also different before and after the 1976–77 regimeshift (Terray and Dominiak 2005).
Some inconsistencies in the results of the previous studiesof the relationship between the teleconnections and EMprecipitation have to be indicated. Ben-Gai et al. (2001) andZiv et al. (2006) reported that rainfall over Israel is notcorrelated with the NAO. However, Eshel and Farrell (2000,2001) suggest that rainfall over the EM is modulated by theNAO. Krichak et al. (2002) found a link between EM rainfalland the NAO and EAWR patterns with maximumprecipitation taking place during positive EAWR and NAOmonths. Krichak et al. (2002) and Krichak and Alpert (2005a,
680 S.O. Krichak et al.

b) suggest that precipitation variability in this region isprimarily affected by the EAWR, with a secondary influencefrom the NAO. The results of Black (2011), however, provideevidence for the NAO playing the primary role.
The inconsistencies may partly be a consequence ofinsufficient accuracy and scarcity of the data available, as wellas differences in the precipitation data (reanalysis versus raingauge) and the areas of evaluation used in the analyses.Indeed, a large number of the earlier investigations ofprecipitation–teleconnection relationships in the MR havebeen based on daily rain gauge observations (e.g., Xoplakiet al. 2004; Toreti et al. 2010; Black 2011). Although raingauge data are quite reliable on average, this strategy is notfree of problems. The data are not sufficiently accurate forextreme precipitation events due to wind extremes, whichprevent rain from entering the gauge (Observer’s Handbook2000). The spatial distribution of the stations is also quiteirregular, and their density is typically insufficient overcomplex terrain regions, such as the deserts of northernAfrica and the Near East (e.g., Haylock et al. 2008). Inaddition, the results from rain gauge measurements are lessreliable in areas that lack precipitation (Nicholson et al. 2003),where rainy events are mainly due to small-scale convection.Similar problems also characterize the gridded data archives(CRU, E-OBS, VASClimO) that are based on rain gaugemeasurements (Beck et al. 2005; Mitchell and Jones 2005;Haylock et al. 2008).
Another strategy for the study of MR precipitation whichinvolves the use ofmodel-produced precipitation data, which arecurrently available from homogeneously distributed, multi-year,daily precipitation datasets such as reanalyses is also not free ofits own limitations (Bengtsson et al. 2004a, b), in particular as aconsequence of significant changes in the operationalobservation system during the second half of the past century.
The effect of teleconnections on MR precipitation with aspecial emphasis to the EM is re-visited in the current studyusing a frequency approach, which is capable, in part, ofovercoming the above problems. In Section 2, the data andmethodology are described. The impact of teleconnections onprecipitation throughout the MR is presented in Section 3. InSection 4, the influence of teleconnections on upper-tropospheric features and moisture is examined. A discussionand concluding remarks are given in Section 5.
2 Methodology and data
Implicit in earlier studies that relate teleconnections to MRprecipitation is that changes in the background wind andtemperature fields associated with the teleconnection patternsalter the environment in which storms develop, which in turnleads to changes in precipitation. An important factor in thedevelopment of extreme precipitation events is the interaction
between smaller-scale features that are embedded within thelarger synoptic-scale storm systems (Browning 1997).Examples of such phenomena are the southward intrusion ofbands of high potential vorticity (PV) air in the uppertroposphere/lower stratosphere. These are often referred toas PV intrusions or PV streamers, which are typicallyaccompanied by a local lowering of the tropopause (includingtropopause folds), intense vertical motion, regions with a highconcentration of vertically integrated water vapor, rapidcyclogenesis, intense convection, and heavy rainfall (seeBrowning 1997). Because of case-to-case variability in theirpositioning, it is generally rather difficult to identifymesoscale features associated with teleconnections usingcomposite or correlation analysis (Benedict et al. 2004;Franzke et al. 2011). The frequency approach, adopted in thisstudy, circumvents this problem.
Precipitation and precipitable water (vertically integratedatmospheric moisture content) from the multiyear griddeddataset of the National Centers for EnvironmentalPrediction–National Center for Atmospheric ResearchReanalysis Project (NNRP) (Kalnay et al. 1996) are used.This choice of dataset for the evaluation is motivated by itssuccessful application in a large number of earlierclimatological investigations for the Euro-Mediterraneanregion (e.g., Zolina et al. 2004; Krichak and Alpert 2005a, b;Lionello et al. 2006a, b). The NNRP data are available for theentire globe with a 2.5×2.5° spatial resolution for the timeperiod from 1948 to the present. Daily data for the 1961–2000are adopted.
The data from the NNRP archive are supplemented byvalues of dynamic tropopause pressure (DynTroP) calculatedfrom the wind and temperature data defined on isobaricsurfaces. For these calculations, the hydrostatic form of theErtel (1942) potential voricity is used (Hoskins et al. 1985;Krichak et al. 2004). Dynamic tropopause pressure values atall grid-points (except for a 10° belt in the tropics) aredetermined in a downward search of the first atmosphericpressure level corresponding to the 2.0 PVU surface, startingfrom 100 hPa (1 PVU=10−6m2s−1 K kg−1).
The methodology for determining the frequency of dayswithin each month with extreme values of precipitation(ExtPrecF), dynamic tropopause pressure (DynTroPF), andprecipitable water (PrecWatF) is essentially that used byCarril et al. (2008). For each of the above three variables, atall grid points within the Euro-Mediterranean region, the totalnumbers of days within each month that the variables arefound to exceed a particular threshold value have beencounted. For each variable, the threshold value is determinedby separating the data into quantiles. This division intoquantiles is performed separately for each grid point and eachday for the 1961–2000 time period. In this study, we choosethe 90 % threshold, that is, a value that is exceeded by only10 % of the days within the time period of this study. The
Theoretical and applied climatology 681
choice allows the current study to be focused on the weatherevents that are extreme (i.e., well above normal values at eachgrid point) for the variables of interest (Krichak et al. 2009a, b;Gualdi et al. 2012). For the ExtPrecF calculations, all nonzeroprecipitation amounts are used. It must be pointed out herethat over dry regions, such as for example over northernAfrica and the Middle East, the above normal precipitationamounts may actually be quite low. Monthly time series of thefrequency [number of days within each month] of extremevalues of the above three variables at each grid point in theEuro-Mediterranean region have been constructed.
The spatial patterns of the linear correlations between theExtPrecF, DynTroPF, and PrecWatF fields and theteleconnection indices are computed. The monthly NAO,AO, EAWR, SCAND, and Niño3.4 (defined as the sea surfacetemperature averaged over the region 5°S–5°N, 170°W–120°W in the tropical Pacific, is commonly used tocharacterize the amplitude of the ENSO) indices are obtainedfrom the National Oceanic and Atmospheric Administration/Climate Prediction Center. The calculations are performedseparately for three groups of months of the MR rainy season(October–November, December–January, February–March).
Increased values of the frequency of days with large valuesof dynamic tropopause pressure are considered as a proxy fortropopause folds and PV intrusions, and increased values of thefrequency of days with large values of precipitable water(PrecWat) are regarded as a proxy for intense moisture transportinto the region.We have calculated correlations based on thePearson’s r method. Statistical significance of the correlationmaps is tested following the Student’s t test with a nullhypothesis of zero. Following Carril et al. (2008), correlationmaps are tested at p <0.05. In the figures to be presented below,the regions with positive statistically significant correlations arerepresented by cold (green-to-violet) colors and negativestatistically significant correlations by warm (yellow-to-red)colors.
3 The relationship between teleconnectionsand the frequency of days with extreme precipitation
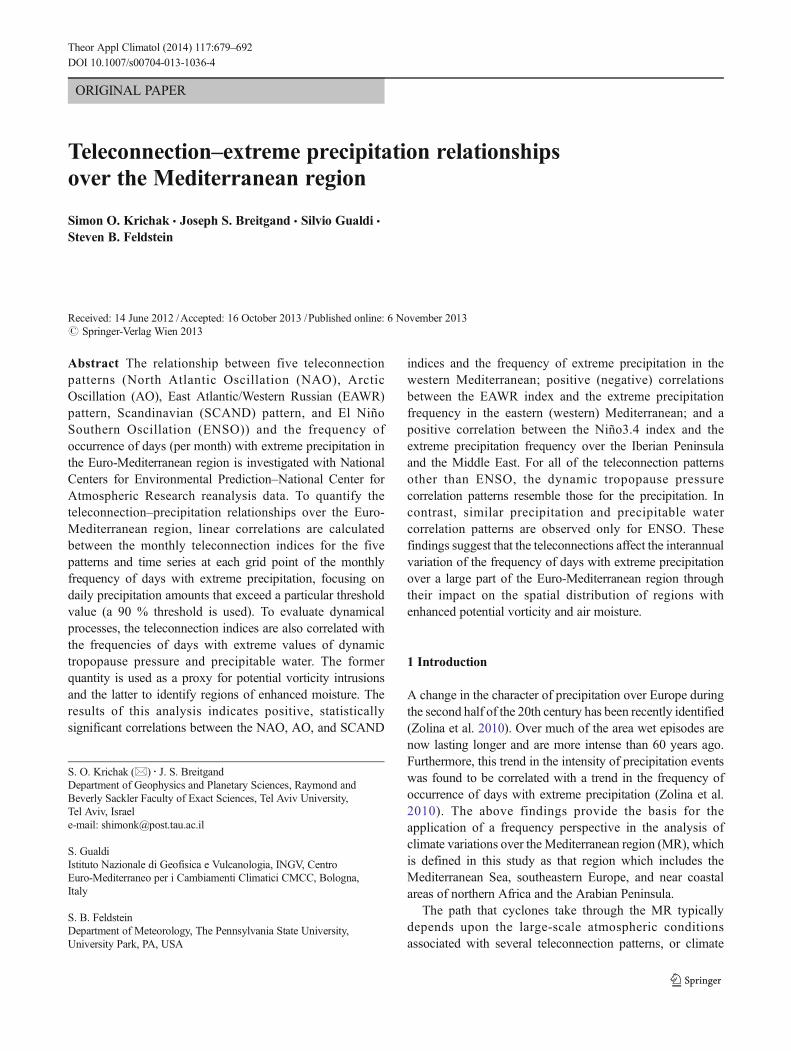
Figure 1a–c presents patterns with the correlations betweenthe ExtPrecF at each grid point and the NAO index. Thecorrelations are rather small during autumn (October–November, Fig. 1a) but are quite considerable during the restof the rainy season (Fig. 1b, c). As can be seen, the NAO indexis positively (negatively) correlated with the frequency ofextreme precipitation (ExtPrec) days over western Europe(the northwestern MR) These changes in the frequency ofExtPrec days may be seen as a consequence of changes inthe location of the cyclone tracks (Lionello et al. 2006a, b). Itis worth noting here that based on the patterns (Fig. 1a–c),practically no NAO role (except for a small zone with positive
correlation in Fig. 1b) in determining frequency of ExtPrecdays may be detected in the EM–Near East area.
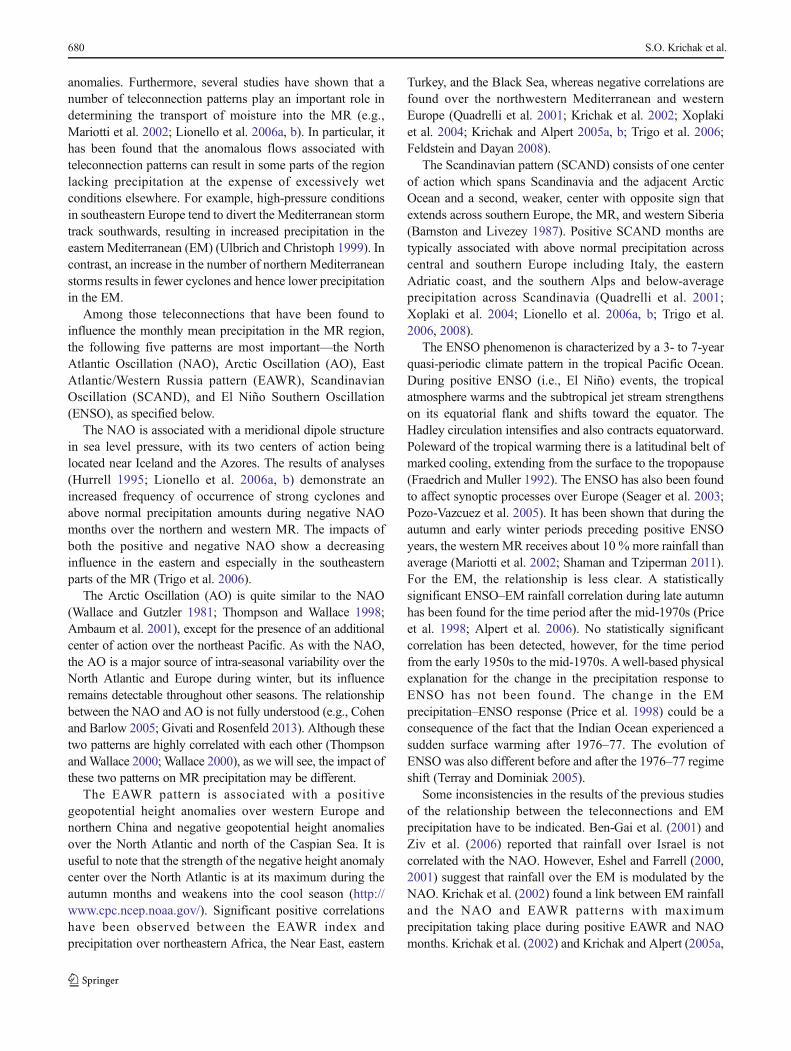
Figure 2a–c shows the correlations between the ExtPrecFand the AO index. The spatial patterns are generally similar tothose for the NAO. As for the NAO, the relationship betweenthe AO and the frequency of ExtPrec days is strongest fromDecember through March (Fig. 2b,c). It may be noted,however, that the zone with positive statistically significantAO–ExtPrecF correlations over the EM and Near East for
Fig. 1 a–c Spatial distribution of linear correlations between the NAOtime series and ExtPrecF a October–November, b December–January, cFebruary–March (here and in the following figures the shaded areasdepict regions with the correlations statistically significant at greater thanthe 5 % level)
682 S.O. Krichak et al.
February–March is also present in Fig. 2b and is larger thanthat for the NAO (Fig. 1b).
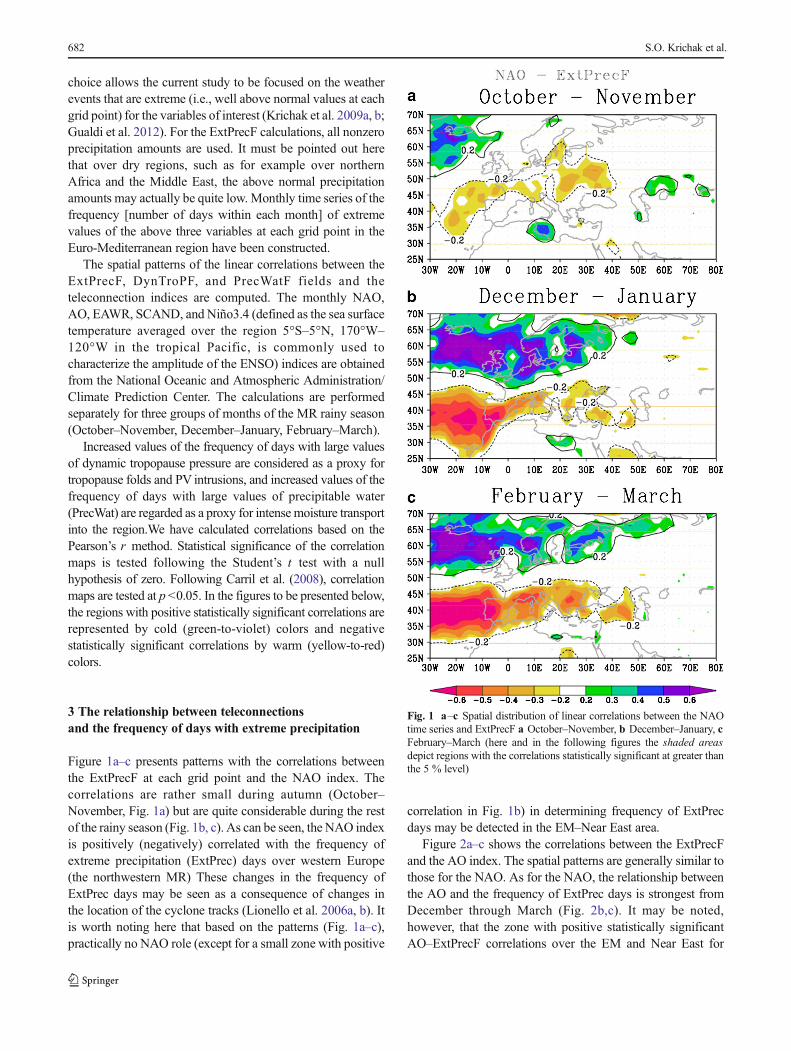
The results for the EAWR are given in Fig. 3a–c. Tworegions with strong EAWR–ExtPrecF correlations duringOctober–November and December–January are found. One(with negative correlations) is located over the northeasternAtlantic and western and southwestern Europe and the other(positive) over a large area from northern Russia to theCaspian Sea. For the EM, this relationship is strongest duringDecember–January (Fig. 3b), when a positive (over thesouthern part of the region) statistically significant correlationof ExtPrecF with the EAWR index is found.
The corresponding SCAND–ExtPrecF correlations aregiven in Fig. 4a–c. The patterns are characterized by tworegions of statistically significant SCAND–ExtPrecFcorrelations, one negative over northern Europe and the otherpositive over southwestern Europe and the MR. A narrowzone with strong positive SCAND–ExtPrecF correlationsduring December–January (Fig. 4b) over the Near East ispresent.
The correlation patterns associated with the Niño3.4 indexare shown in Fig. 5a–c. The patterns indicate the existence ofseveral areas over the eastern Atlantic, Iberian Peninsula, andthe Near East characterized by statistically significant positive
Fig. 2 a–c Same as in Fig. 1, but for AO Fig. 3 a–c Same as in Fig. 1, but for EAWR
Theoretical and applied climatology 683
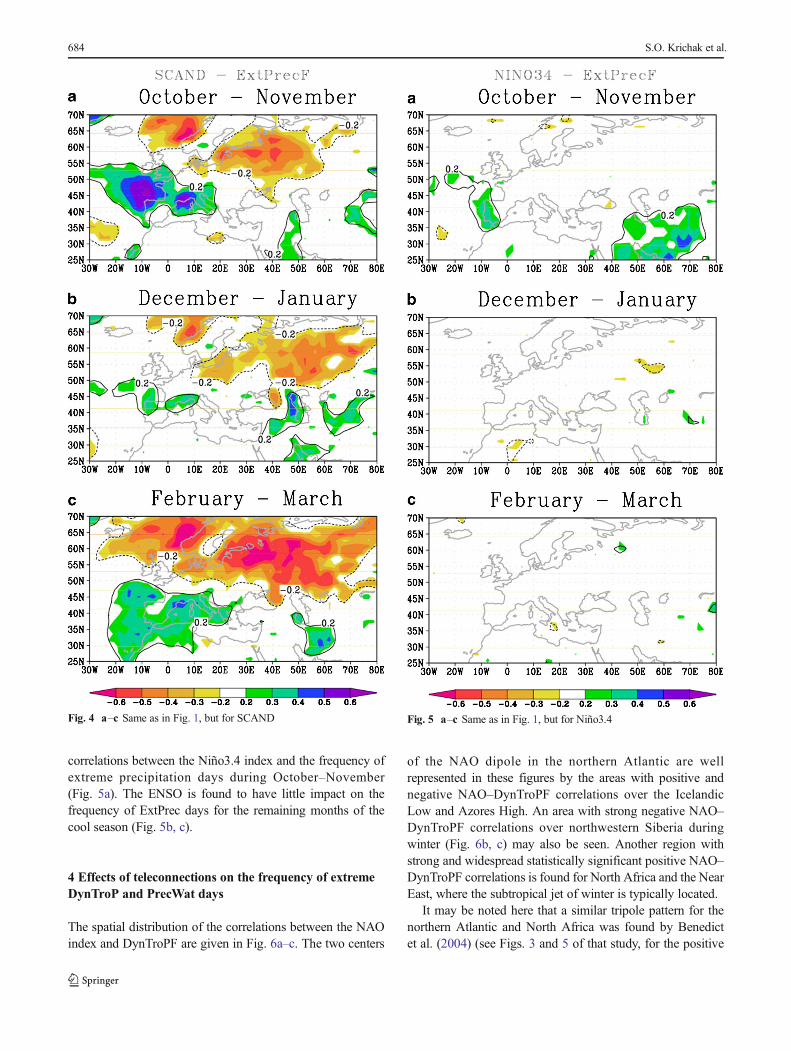
correlations between the Niño3.4 index and the frequency ofextreme precipitation days during October–November(Fig. 5a). The ENSO is found to have little impact on thefrequency of ExtPrec days for the remaining months of thecool season (Fig. 5b, c).
4 Effects of teleconnections on the frequency of extremeDynTroP and PrecWat days
The spatial distribution of the correlations between the NAOindex and DynTroPF are given in Fig. 6a–c. The two centers
of the NAO dipole in the northern Atlantic are wellrepresented in these figures by the areas with positive andnegative NAO–DynTroPF correlations over the IcelandicLow and Azores High. An area with strong negative NAO–DynTroPF correlations over northwestern Siberia duringwinter (Fig. 6b, c) may also be seen. Another region withstrong and widespread statistically significant positive NAO–DynTroPF correlations is found for North Africa and the NearEast, where the subtropical jet of winter is typically located.
It may be noted here that a similar tripole pattern for thenorthern Atlantic and North Africa was found by Benedictet al. (2004) (see Figs. 3 and 5 of that study, for the positive
Fig. 4 a–c Same as in Fig. 1, but for SCAND Fig. 5 a–c Same as in Fig. 1, but for Niño3.4
684 S.O. Krichak et al.
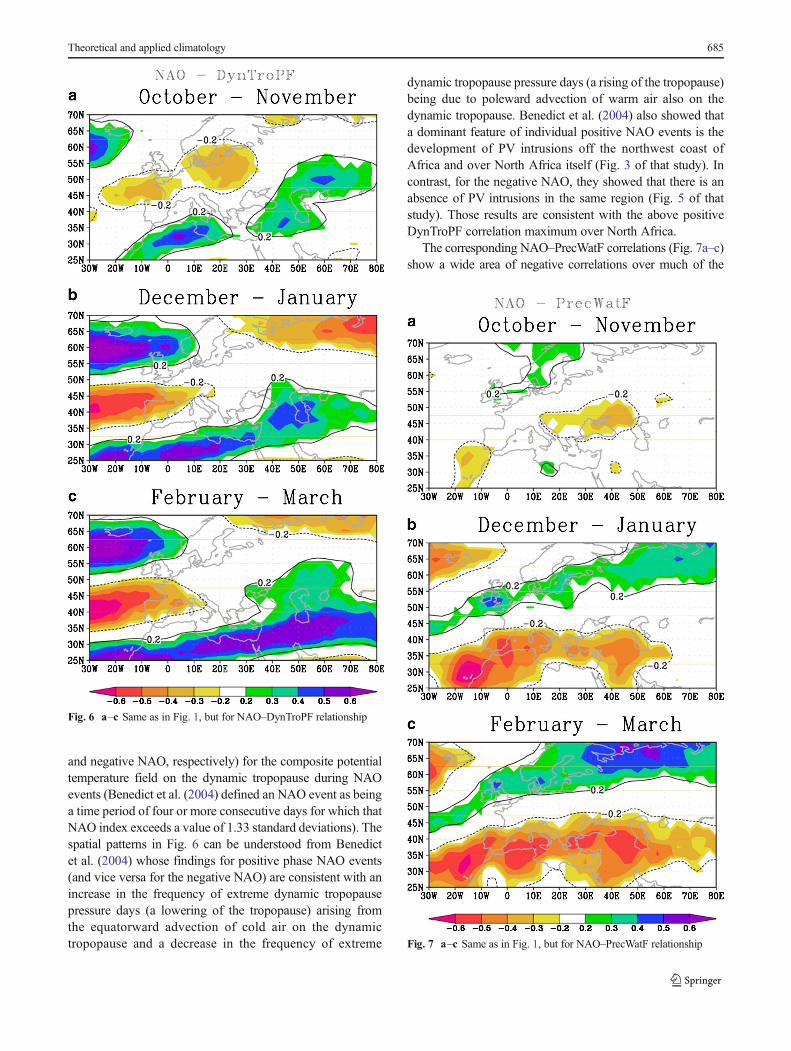
and negative NAO, respectively) for the composite potentialtemperature field on the dynamic tropopause during NAOevents (Benedict et al. (2004) defined an NAO event as beinga time period of four or more consecutive days for which thatNAO index exceeds a value of 1.33 standard deviations). Thespatial patterns in Fig. 6 can be understood from Benedictet al. (2004) whose findings for positive phase NAO events(and vice versa for the negative NAO) are consistent with anincrease in the frequency of extreme dynamic tropopausepressure days (a lowering of the tropopause) arising fromthe equatorward advection of cold air on the dynamictropopause and a decrease in the frequency of extreme
dynamic tropopause pressure days (a rising of the tropopause)being due to poleward advection of warm air also on thedynamic tropopause. Benedict et al. (2004) also showed thata dominant feature of individual positive NAO events is thedevelopment of PV intrusions off the northwest coast ofAfrica and over North Africa itself (Fig. 3 of that study). Incontrast, for the negative NAO, they showed that there is anabsence of PV intrusions in the same region (Fig. 5 of thatstudy). Those results are consistent with the above positiveDynTroPF correlation maximum over North Africa.
The corresponding NAO–PrecWatF correlations (Fig. 7a–c)show a wide area of negative correlations over much of the
Fig. 6 a–c Same as in Fig. 1, but for NAO–DynTroPF relationship
Fig. 7 a–c Same as in Fig. 1, but for NAO–PrecWatF relationship
Theoretical and applied climatology 685

Mediterranean Sea that is located northward of the region ofpositive DynTroPF correlations over northern Africa (Fig. 6a–c), particularly during December–March. Also, there is a broadarea of positive NAO–PrecWatF correlations over northwesternSiberia that strengthens throughout the winter (Fig. 7b, c).These NAO–PrecWatF correlations are also consistent withBenedict et al. (2004) (Figs. 3 and 5 of that study). This isbecause, as that study shows, relative to the climatology, thepositive NAO is associated with an eddy-driven jet over theNorth Atlantic that is displaced poleward and a subtropical jetover North Africa that is weaker and displaced equatorward.This results in the two jets being well separated, and stormsfrom the North Atlantic are less likely to reach theMediterranean during the NAO-positive months. In contrast,for the negative NAO, the eddy-driven jet is displacedequatorward and the subtropical jet poleward relative to theclimatology. This results in a merger of the two jets over thenorthwest Atlantic and westernMediterranean, which increasesthe likelihood that North Atlantic storms reach theMediterranean during the NAO negative months.
The patterns presenting the relationship between the AOand DynTroPF and PrecWatF (Figs. 8a–c and 9a–c) aresimilar to those for the NAO (Figs. 6a–c and 7a–c). It isinteresting to note, however, that the correlations for AO–DynTroPF in the EM are larger and extend over a greater areathose for the NAO–DynTroPF for the same region. Theselarger AO–DynTroPF correlations may be related to theAO–ExtPrecF correlations (Fig. 2a–c) being larger than thosefor the NAO (Fig. 1a–c) for the Near East and EM. As is thecase with the NAO, there are also statistically significant AO–DynTroPF and AO–ExtPrecF correlations for northernEurope and northwestern Siberia which are strongest duringthe winter months.
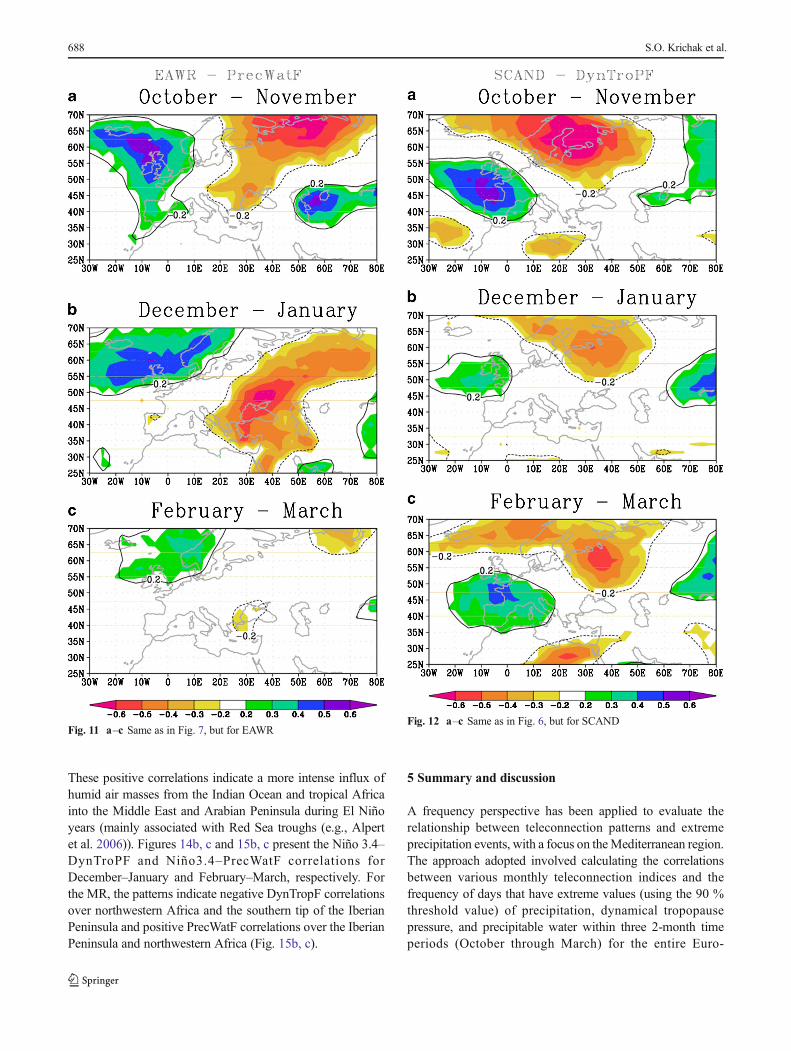
The DynTroPF and PrecWatF correlations with the EAWRindex are given in Figs. 10a–c and 11a–c, respectively.Figure 10a–c shows good agreement with the EAWR–ExtPrecF correlations in Fig. 3a–c. The main feature that canbe seen in the EAWR–DynTroPF correlation patterns(Fig. 10a–c) is a negative extremum over the northeastAtlantic/western Europe (associated with the positivegeopotential height anomaly that characterizes the EAWRpattern) and a positive extremum (associated with the negativeEAWR anomaly center) over southeastern Europe and the EM(which is in agreement with Krichak et al. 2002). The EAWRpattern shows similar relationships as those found for theNAO and AO, with (1) the ExtPrec correlations resemblingthose of DynTroPF, and (2) regions with positive DynTroPcorrelations being located equatorward of those regions withnegative PrecWat correlations. In contrast with the NAO andAO, the amplitude of the EAWR correlations is strongestduring the autumn months which may be seen as aconsequence of the earlier presented characteristics of theteleconnection patterns.
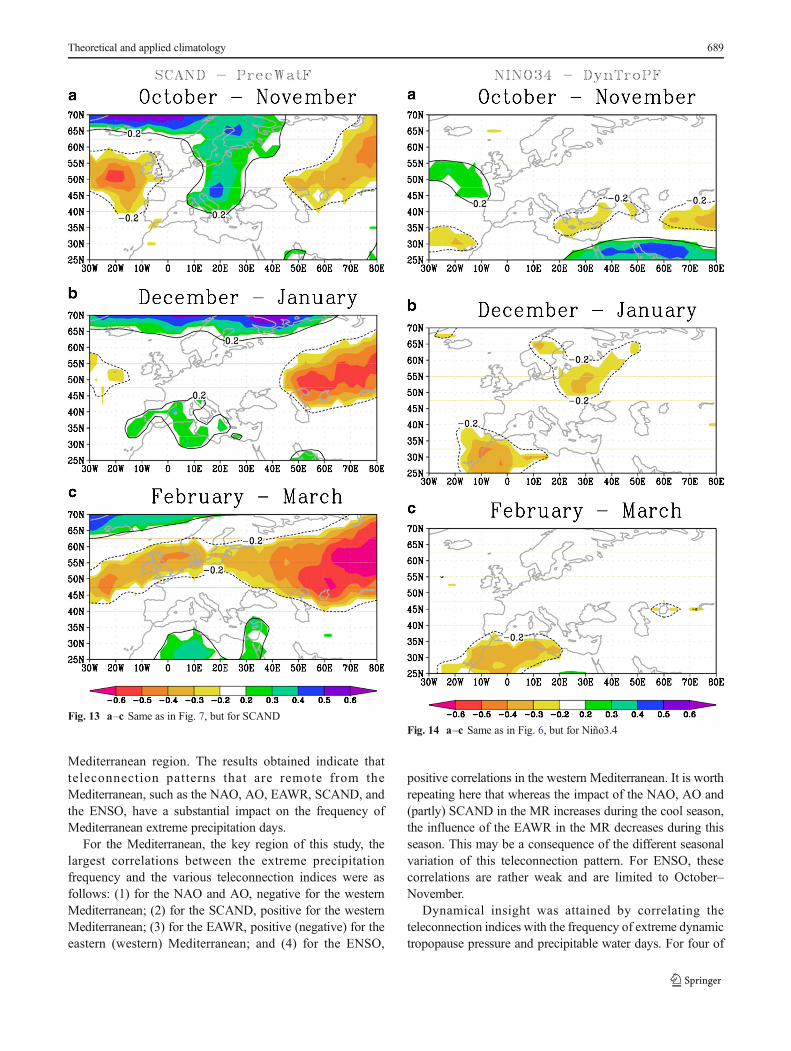
The correlations between the frequencies of extremeDynTroP and PrecWat values and the SCAND index arepresented in Figs. 12a–c and 13a–c, respectively. As can be seen,the pattern for October–November (Fig. 12a) is characterized byhigh positive SCAND–DynTroPF correlations over themidlatitude northeastern Atlantic, southwestern Europe, and partof the western MR and strong negative SCAND–DynTroPFcorrelations over Scandinavia and northeastern Europe(Fig. 12a). A region with negative SCAND–DynTroPFcorrelations characterizes the southeastern MR (Fig. 12c).Overall, it may be concluded here that these correlation patternsresemble the SCAND–ExtPrecF correlations in Fig. 4a–c. Withregard to the SCAND–PrecWatF correlations (Fig. 13b–c), a
Fig. 8 a–c Same as in Fig. 6, but for AO
686 S.O. Krichak et al.

region with negative values extending from the northeasternAtlantic to western Siberia can be seen. Over the MR, positiveSCAND–PrecWatF correlations are found for the western andcentral parts of the region for December–January and for the EMduring February–March.
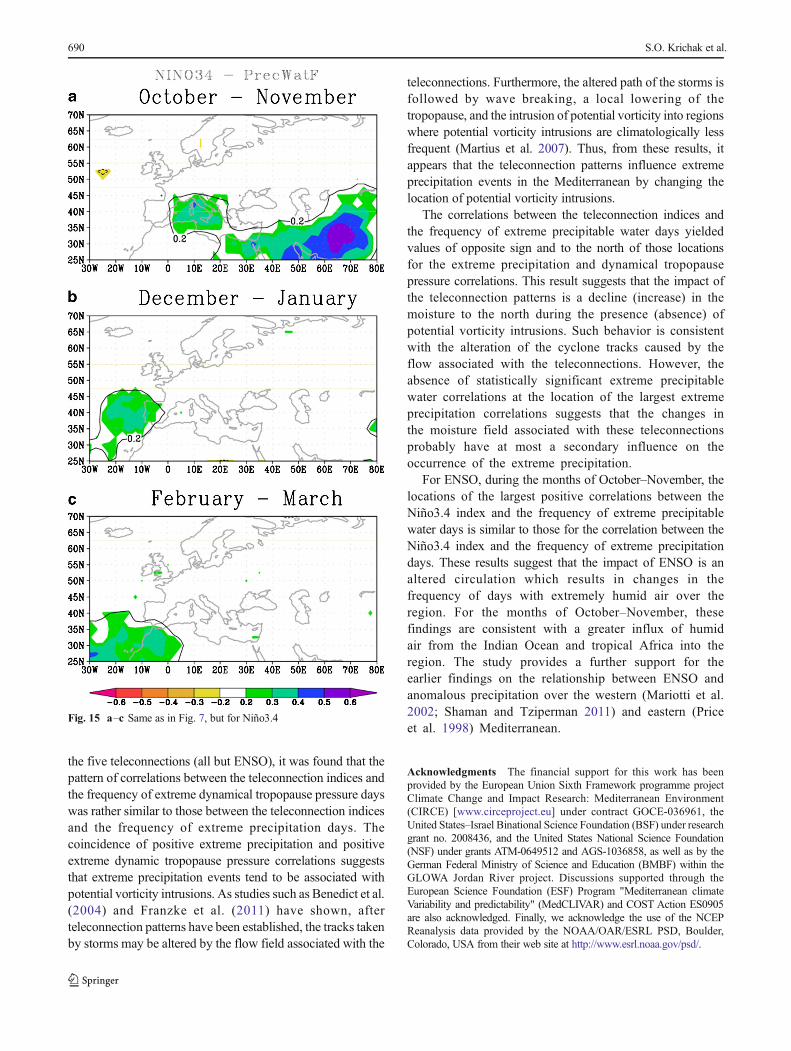
The patterns for the Niño3.4–DynTroPF and Niño3.4–PrecWAtF spatial correlations are presented in Figs. 14a–cand 15a–c, respectively. It is important to note that theintensity of the ENSO correlations is much smaller than thosefor the other teleconnections considered. Nevertheless, thepatterns demonstrate the existence of a notable impact of theENSO on the MR. Namely, for October–November
(Fig. 14a), bands of positive Niño3.4–DynTroPF correlationsare found to the northwest of the Iberian Peninsula and muchof the Middle East and negative Niño3.4–DynTroPFcorrelations are observed for the northeast Atlantic, thenortheast Mediterranean, and to the east of the Caspian Sea.
A comparison with Fig. 5a indicates that regions withpositive Niño3.4–ExtPrecF correlations exhibit only partialoverlap with those characterized by positive DynTroPFcorrelations during the October–November months. TheNiño3.4–PrecWatF correlations for October–November(Fig. 15a) indicate positive values over the western and centralMediterranean, northeastern Africa, and the Middle East.
Fig. 9 a–c Same as in Fig. 7, but for AO Fig. 10 a–c Same as in Fig. 6, but for EAWR
Theoretical and applied climatology 687
These positive correlations indicate a more intense influx ofhumid air masses from the Indian Ocean and tropical Africainto the Middle East and Arabian Peninsula during El Niñoyears (mainly associated with Red Sea troughs (e.g., Alpertet al. 2006)). Figures 14b, c and 15b, c present the Niño 3.4–DynTroPF and Niño3.4–PrecWatF correlations forDecember–January and February–March, respectively. Forthe MR, the patterns indicate negative DynTropF correlationsover northwestern Africa and the southern tip of the IberianPeninsula and positive PrecWatF correlations over the IberianPeninsula and northwestern Africa (Fig. 15b, c).
5 Summary and discussion
A frequency perspective has been applied to evaluate therelationship between teleconnection patterns and extremeprecipitation events, with a focus on theMediterranean region.The approach adopted involved calculating the correlationsbetween various monthly teleconnection indices and thefrequency of days that have extreme values (using the 90 %threshold value) of precipitation, dynamical tropopausepressure, and precipitable water within three 2-month timeperiods (October through March) for the entire Euro-
Fig. 11 a–c Same as in Fig. 7, but for EAWRFig. 12 a–c Same as in Fig. 6, but for SCAND
688 S.O. Krichak et al.
Mediterranean region. The results obtained indicate thatteleconnection patterns that are remote from theMediterranean, such as the NAO, AO, EAWR, SCAND, andthe ENSO, have a substantial impact on the frequency ofMediterranean extreme precipitation days.
For the Mediterranean, the key region of this study, thelargest correlations between the extreme precipitationfrequency and the various teleconnection indices were asfollows: (1) for the NAO and AO, negative for the westernMediterranean; (2) for the SCAND, positive for the westernMediterranean; (3) for the EAWR, positive (negative) for theeastern (western) Mediterranean; and (4) for the ENSO,
positive correlations in the western Mediterranean. It is worthrepeating here that whereas the impact of the NAO, AO and(partly) SCAND in the MR increases during the cool season,the influence of the EAWR in the MR decreases during thisseason. This may be a consequence of the different seasonalvariation of this teleconnection pattern. For ENSO, thesecorrelations are rather weak and are limited to October–November.
Dynamical insight was attained by correlating theteleconnection indices with the frequency of extreme dynamictropopause pressure and precipitable water days. For four of
Fig. 13 a–c Same as in Fig. 7, but for SCANDFig. 14 a–c Same as in Fig. 6, but for Niño3.4
Theoretical and applied climatology 689
the five teleconnections (all but ENSO), it was found that thepattern of correlations between the teleconnection indices andthe frequency of extreme dynamical tropopause pressure dayswas rather similar to those between the teleconnection indicesand the frequency of extreme precipitation days. Thecoincidence of positive extreme precipitation and positiveextreme dynamic tropopause pressure correlations suggeststhat extreme precipitation events tend to be associated withpotential vorticity intrusions. As studies such as Benedict et al.(2004) and Franzke et al. (2011) have shown, afterteleconnection patterns have been established, the tracks takenby storms may be altered by the flow field associated with the
teleconnections. Furthermore, the altered path of the storms isfollowed by wave breaking, a local lowering of thetropopause, and the intrusion of potential vorticity into regionswhere potential vorticity intrusions are climatologically lessfrequent (Martius et al. 2007). Thus, from these results, itappears that the teleconnection patterns influence extremeprecipitation events in the Mediterranean by changing thelocation of potential vorticity intrusions.
The correlations between the teleconnection indices andthe frequency of extreme precipitable water days yieldedvalues of opposite sign and to the north of those locationsfor the extreme precipitation and dynamical tropopausepressure correlations. This result suggests that the impact ofthe teleconnection patterns is a decline (increase) in themoisture to the north during the presence (absence) ofpotential vorticity intrusions. Such behavior is consistentwith the alteration of the cyclone tracks caused by theflow associated with the teleconnections. However, theabsence of statistically significant extreme precipitablewater correlations at the location of the largest extremeprecipitation correlations suggests that the changes inthe moisture field associated with these teleconnectionsprobably have at most a secondary influence on theoccurrence of the extreme precipitation.
For ENSO, during the months of October–November, thelocations of the largest positive correlations between theNiño3.4 index and the frequency of extreme precipitablewater days is similar to those for the correlation between theNiño3.4 index and the frequency of extreme precipitationdays. These results suggest that the impact of ENSO is analtered circulation which results in changes in thefrequency of days with extremely humid air over theregion. For the months of October–November, thesefindings are consistent with a greater influx of humidair from the Indian Ocean and tropical Africa into theregion. The study provides a further support for theearlier findings on the relationship between ENSO andanomalous precipitation over the western (Mariotti et al.2002; Shaman and Tziperman 2011) and eastern (Priceet al. 1998) Mediterranean.
Acknowledgments The financial support for this work has beenprovided by the European Union Sixth Framework programme projectClimate Change and Impact Research: Mediterranean Environment(CIRCE) [www.circeproject.eu] under contract GOCE-036961, theUnited States–Israel Binational Science Foundation (BSF) under researchgrant no. 2008436, and the United States National Science Foundation(NSF) under grants ATM-0649512 and AGS-1036858, as well as by theGerman Federal Ministry of Science and Education (BMBF) within theGLOWA Jordan River project. Discussions supported through theEuropean Science Foundation (ESF) Program "Mediterranean climateVariability and predictability" (MedCLIVAR) and COST Action ES0905are also acknowledged. Finally, we acknowledge the use of the NCEPReanalysis data provided by the NOAA/OAR/ESRL PSD, Boulder,Colorado, USA from their web site at http://www.esrl.noaa.gov/psd/.
Fig. 15 a–c Same as in Fig. 7, but for Niño3.4
690 S.O. Krichak et al.
References
Alpert P, Baldi M, Ilani R, Krichak SO, Price C, Rodo X, Saaroni H, ZivB, Kishcha P, Barkan J, Mariotti A, Xoplaki E (2006) Relationsbetween climate variability in the Mediterranean region and thetropics: ENSO, South Asian and African monsoons, hurricanesand Saharan dust. In: Lionello P, Malanotte-Rizzoli P, Boscolo R(eds) Mediterranean climate variability, 4. Elsevier, Amsterdam, pp149–177
Amraum MHP, Hoskins BJ, Stephenson DB (2001) Arctic oscillation orNorth Atlantic Oscillation? J Clim 14:3495–3507
Barnston A, Livezey RE (1987) Classification, seasonality andpersistence of low-frequency circulation patterns. Mon WeatherRev 115:1083–1126
Beck C, Grieser J, Rudolf B (2005) A new monthly precipitationclimatology for the global land areas for the period 1951 to 2000.Climate Status Report 2004:181–190, German Weather Service,Offenbach
Benedict JJ, Lee S, Feldstein SB (2004) Synoptic view of the NorthAtlantic Oscillation. J Atmos Sci 61(2):121–144
Ben-Gai T, Bitan A, Manes A, Alpert P, Kushnir Y (2001) Temperatureand surface pressure anomalies in Israel and the North AtlanticOscillation. Theor Appl Climatol 69:171–177
Bengtsson L, Hagemann S, Hodges KI. 2004a. Can climate trends becalculated from reanalysis data? J Geophys Res Atmos 109:D11111. doi:10.1029/2004JD004536
Bengtsson L, Hodges KI, Hagemann S (2004b) Sensitivity of large scaleatmospheric analyses to humidity observations and its impact on theglobal water cycle and tropical and extratropical weather systems inERA40. Tellus 56:202–217
Black E (2011) The influence of the North Atlantic Oscillation andEuropean circulation regimes on the daily to interannual variabilityof winter precipitation in Israel. Int J Climatol. doi: 10.1002/joc.2383
Browning KA (1997) The dry intrusion perspective of extra-tropicalcyclone development. Meteorol Appl 4:317–324
Carril AF, Gualdi S, Cherchi A, Navarra A (2008) Heat waves in Europe:areas of homogeneous variability and links with the regional tolarge-scale atmospheric and SSTs anomalies. Clim Dyn 30:77–98
Cohen J, BarlowM (2005) The NAO, the AO, and global warming: howclosely related? J Clim 18:4498–4513
Ertel H (1942) Ein neuer hydrodynamischer Wirbelansatz. Meteorol Z59:277–281
Eshel G, Farrell BF (2000) Mechanisms of eastern Mediterranean rainfallvariability. J Atmos Sci 57:3219–3232
Eshel G, Farrell BF (2001) Thermodynamics of Eastern Mediterraneanrainfall variability. J Atmos Sci 58:87–92
Feldstein SB, Dayan U (2008) Circumglobal teleconnections and wavepackets associated with Israeli winter precipitation. Q J R MeteorolSoc 134:455–467
Franzke C, Feldstein SB, Lee S (2011) Synoptic analysis of the Pacific-North American teleconnection pattern. Q J R Meteorol 137:329–346
Fraedrich K, Muller K (1992) Climate anomalies in Europe associatedwith ENSO extremes. Int J Climatol 12:25–31
Givati A, Rosenfeld D (2013) The Arctic Oscillation, climate change andthe effects on precipitation in Israel. Atmospheric Research 132–133, 114–124
Gualdi S, Somot S, May W, Castellari S, Déqué M, Adani M, Artale V,Bellucci A, Breitgand JS, Carillo A, Cornes R, Dell’Aquila A,Dubois C, Efthymiadis D, Elizalde A, Gimeno L, Goodess CM,Harzallah A, Krichak SO, Kuglitsch FG, Leckebusch GC,L’Heveder B, Li L, Lionello P, Luterbacher J, Mariotti A, Nieto R,Nissen KM, Oddo P, Ruti P, Sanna A, Sannino G, Scoccimarro E,Sevault F, Struglia MV, Toreti A, Ulbrich U, Xoplaki E (2012)
Future climate projections. In: Navarra A, Tubiana L (eds)Regional assessment of climate change in the Mediterranean.Springer, Dordrecht, 870 pp
Haylock MR, Hofstra N, Klein Tank AMG, Klok EJ, Jones PD, New M(2008) A European daily high-resolution gridded dataset of surfacetemperature and precipitation. J Geophys Res (Atmospheres) 113:D20119. doi:10.1029/2008JD10201
Hoskins BJ, McIntyre ME, Robertson AW (1985) On the use andsignificance of isentropic potential vorticity maps. Q J R MeteorolSoc 111:877–946
Hurrell JW (1995) Decadal trends in the North Atlantic Oscillation:regional temperatures and precipitation. Science 269:676–679
Kalnay E, Kanamitsu M, Kistler R, Collins D, Deaven D, Gandin L,Iredell M, Saha S, White G, Woolen J, Zhu Y, Chelliah M, EbisuzakiW, Higgins W, Janowiak J, Mo KC, Kopelewski C, Wang J, LeetmaaA, Reynolds R, Jeene R, Joseph D (1996) The NCEP/NCAR 40-yearreanalysis. Proj Bull Am Meteorol Soc 77(3):437–471
Krichak SO, Alpert P (2005a) Decadal trends in the East Atlantic/WestRussia pattern and the Mediterranean precipitation. Int J Climatol25:183–192
Krichak SO, Alpert P (2005b) Signatures of the NAO in the atmosphericcirculation during wet winter months over theMediterranean region.Theor Appl Climatol 82(1–2):27–39
Krichak SO, Alpert P, DayanM (2004) The role of atmospheric processesassociated with hurricane Olga in the December 2001 floods inIsrael. J Hydrometeorol 5:1259–1270
Krichak SO, Breitgand JS, Alpert P (2009a). Frequency of extremeprecipitation climate events over the Mediterranean regionaccording to NNRP data for 1961–2000, 2009,WMO CAS/JSCWGNE report, April, section 2, 15–16
Krichak SO, Breitgand JS, Alpert P (2009b) Trends in frequency ofextreme precipitation climate events in the Mediterranean regionaccording to NNRP data, 2009,WMO CAS/JSC WGNE report,April, section 2, 17–18
Krichak SO, Kishcha P, Alpert P (2002) Decadal trends of main Eurasianoscillations and the Mediterranean precipitation. Theor ApplClimatol 72:29–220
Lionello P, Malanotte-Rizzoli P, Boscolo R, Alpert P, Artale V, Li L,Luterbacher J, May W, Trigo R, Tsimplis M, Ulbrich U, Xoplaki E(2006a) The Mediterranean climate: an overview of the maincharacteristics and issues. In: Lionello P, Malanotte-Rizzoli P,Boscolo R (eds) Mediterranean climate variability, 4. Elsevier,Amsterdam, pp 1–25
Lionello P, Bhend J, Buzzi A, Della-Marta PM, Krichak SO, Jansa A,Maheras P, Sanna A, Trigo IF, Trigo R (2006b) Cyclones in theMediterranean region: climatology and effects on theenvironment. In: Lionello P, Malanotte-Rizzoli P, Boscolo R(eds) Mediterranean climate variability, 4. Elsevier, Amsterdam,pp 325–372
Mariotti A, Zeng N, Lau K-M (2002) Euro-Mediterranean rainfall andENSO—a seasonally varying relationship. Geophys Res Lett 29:1621. doi:10.1029/2001GL014248
Martius O, Schwierz C, Davies HC (2007) Breaking waves at thetropopause in the wintertime Northern Hemisphere: climatologicalanalyses of the orientation and the theoretical LC1/2 classification. JAtmos Sci 64:2576–2592
Mitchell TD, Jones PD (2005) An improved method of constructing adatabase of monthly climate observations and associated high-resolution grids. Int J Climatol 25:693–712
Nicholson SE, Some B,McCollum J, Nelkin E, Klotter D, Berte Y, DialloBM, Gaye I, Kpabeba G, Ndiaye O, Noukpozounkou JN, TanuMM, Thiam A, Toure AA, Traore AK (2003) Validation ofTRMM and other rainfall estimates with a high density gaugedataset for West Africa. Part 1: Validation of GPCC rainfall productand pre-TRMM satellite and blended products. J Appl Meteorol 42:1337–1354
Theoretical and applied climatology 691

Observer’s Handbook (2000) The Met Office, Met.O. 128, Fourthedition, 220 p
Pozo-Vazquez D, Gamiz-Fortis SR, Tovar-Pescador E-P, Castro-Diez Y(2005) El Nino Southern oscillation events and associated Europeanwinter precipitation anomalies. Int J Climatol 25:17–31
Price C, Stone L, Huppert A, Rajagopalan B, Alpert P (1998) A possiblelink between El Niño and precipitation in Israel. Geophys Res Lett25:3963–3966
Quadrelli R, Pavan V, Molteni F (2001) Winter-time variability ofMediterranean precipitation and its links with large-scale circulationanomalies. Clim Dyn 17(5–6):457–466
Seager R, Harnik N, Kushnir Y, Robinson W, Miller J (2003)Mechanisms of hemispherically symmetric climate variability. JClim 16:2960–2978
Shaman J, Tzipperman E (2011) An Atmospheric teleconnection linkingENSO and Southwestern European precipitation. J Clim 24:124–139
Terray P, Dominiak S (2005) Indian Ocean sea surface temperature and ElNiño Southern Oscillation: a new perspective. J Clim 18:1351–1368
Thompson DWJ, Wallace JM (1998) The Arctic oscillation signature inwintertime geopotential height and temperature fields. Geophys ResLett 25:1297–1300
Thompson DWJ, Wallace JM (2000) Annular modes in the extratropicalcirculation. Part I: Month-to-month variability. J Clim 13:1000–1016
Toreti A, Xoplaki E, Maraun D, Kuglitsch FG, Wanner H, Luterbacher J(2010) Characterization of extreme winter precipitation inMediterranean coastal sites and associated anomalous atmosphericcirculation patterns. Nat. Hazards Earth Syst Sci 10:1037–1050.www.nat-hazards-earth-syst-sci.net/10/1037/2010/ doi:10.5194/nhess-10-1037-2010
Trigo R, Xoplaki E, Zorita E, Luterbacher J, Krichak SO, Alpert P,Jacobeit J, Saenz J, Fernandez J, Gonzalez-Rouco F, Garcia-
Herrera R, Rodo X, Brunetti M, Nanni T, Maugeri M, Turkes M,Gimeno L, Ribera P, Brunet M, Trigo IF, Crepon M, Mariotti A(2006) Relations between variability in the Mediterranean regionand mid-latitude variability. In: Lionello P, Malanotte-Rizzoli P,Boscolo R (eds) Mediterranean climate variability, 4. Elsevier,Amsterdam, pp 179–226
Trigo RM, Valente MA, Trigo IF, Miranda P, Ramos AM, Paredes D,Garcıa-Herrera R (2008) North Atlantic wind and cyclone trendsand their impact in the European precipitation and Atlanticsignificant wave height. Ann NYAcad Sci 1146:212–234
Ulbrich U, Christoph M (1999) A shift of the NAO and increasing stormtrack activity over Europe due to anthropogenic greenhouse gasforcing. Clim Dyn 15:551–559
Wallace JM, Gutzler DS (1981) Teleconnections in the geopotentialheight field during the Northern Hemisphere winter. Mon WeatherRev 109:784–812
Wallace JM (2000) North Atlantic Oscillation/annular mode: twoparadigms—one phenomenon. Q J R Meteorol Soc 126:791–805
Xoplaki E, Gonzalez-Rouco JF, Luterbacher J, Wanner H (2004) Wetseason Mediterranean precipitation variability: influence of large-scale dynamics and trends. Clim Dyn 23:63–78. doi:10.1007/s00382-004-0422-0
Ziv B, Dayan U, Rot C, Kushnir Y, Enzel Y (2006) Regional and globalatmospheric patterns governing rainfall in the EM. Int J Clim 26:55–73
Zolina O, Kapala A, Simmer C, Gulev SK (2004) Analysis of extremeprecipitation over Europe from different reanalyses: a comparativeassessment. Glob Planet Chang 44:129–161
Zolina O, Simmer C, Gulev SK, Kollet S (2010) Changing structure ofEuropean precipitation: longer wet periods leading to moreabundant rainfalls. Geoph Res. Lett 37:L06704. doi:10.1029/2010GL042468
692 S.O. Krichak et al.