xMAN: extreme MApping of OligoNucleotides
10
BioMed Central Page 1 of 10 (page number not for citation purposes) BMC Genomics Open Access Research xMAN: extreme MApping of OligoNucleotides Wei Li 1 , Jason S Carroll 2 , Myles Brown 2 and X Shirley Liu* 1 Address: 1 Department of Biostatistics and Computational Biology, Dana-Farber Cancer Institute; Department of Biostatistics, Harvard School of Public Health, Boston, MA, USA and 2 Department of Medical Oncology, Dana-Farber Cancer Institute, Harvard Medical School, 44 Binney St, Boston, MA 02115, USA Email: Wei Li - [email protected]; Jason S Carroll - [email protected]; Myles Brown - [email protected]; X Shirley Liu* - [email protected] * Corresponding author Abstract Background: The ability to rapidly map millions of oligonucleotide fragments to a reference genome is crucial to many high throughput genomic technologies. Results: We propose an intuitive and efficient algorithm, titled ex treme MA pping of OligoN ucleotide (xMAN), to rapidly map millions of oligonucleotide fragments to a genome of any length. By converting oligonucleotides to integers hashed in RAM, xMAN can scan through genomes using bit shifting operation and achieve at least one order of magnitude speed increase over existing tools. xMAN can map the 42 million 25-mer probes on the Affymetrix whole human genome tiling arrays to the entire genome in less than 6 CPU hours. Conclusions: In addition to the speed advantage, we found the probe mapping of xMAN to substantially improve the final analysis results in both a spike-in experiment on ENCODE tiling arrays and an estrogen receptor ChIP-chip experiment on whole human genome tiling arrays. Those improvements were confirmed by direct ChIP and real-time PCR assay. xMAN can be further extended for application to other high-throughput genomic technologies for oligonucleotide mapping. Background The ability to rapidly map millions of oligonucleotide fragments to a reference genome is crucial to many high throughput genomic technologies. For example, Affyme- trix, Nimblegen, and Agilent have recently developed oli- gonucleotide arrays to tile all the non-repetitive genomic sequences of complex eukaryotic genomes. Since the arrays were usually designed based on an older genome assembly, it is important to remap all the probes to the newest genome assembly or transcriptome annotation during data analysis [1], under the assumption that the current genome and transcriptome are more precise than the earlier ones. It is not uncommon for a probe to map to multiple locations in the genome. As a result, the probe could give rise to unexpected behaviour if information on its genome copy number is unknown or ignored. Other examples are the next-generation sequencing approaches to annotate novel transcripts [2,3] and regulatory ele- from The 2007 International Conference on Bioinformatics & Computational Biology (BIOCOMP'07) Las Vegas, NV, USA. 25-28 June 2007 Published: 20 March 2008 BMC Genomics 2008, 9(Suppl 1):S20 doi:10.1186/1471-2164-9-S1-S20 <supplement> <title> <p>The 2007 International Conference on Bioinformatics & Computational Biology (BIOCOMP'07)</p> </title> <editor>Jack Y Jang, Mary Qu Yang, Mengxia (Michelle) Zhu, Youping Deng and Hamid R Arabnia</editor> <note>Research</note> </supplement> This article is available from: http://www.biomedcentral.com/1471-2164/9/S1/S20 © 2008 Li et al.; licensee BioMed Central Ltd. This is an open access article distributed under the terms of the Creative Commons Attribution License (http://creativecommons.org/licenses/by/2.0 ), which permits unrestricted use, distribution, and reproduction in any medium, provided the original work is properly cited.
-
Upload
hms-harvard -
Category
Documents
-
view
1 -
download
0
Transcript of xMAN: extreme MApping of OligoNucleotides

BioMed CentralBMC Genomics
ss
Open AcceResearchxMAN: extreme MApping of OligoNucleotidesWei Li1, Jason S Carroll2, Myles Brown2 and X Shirley Liu*1Address: 1Department of Biostatistics and Computational Biology, Dana-Farber Cancer Institute; Department of Biostatistics, Harvard School of Public Health, Boston, MA, USA and 2Department of Medical Oncology, Dana-Farber Cancer Institute, Harvard Medical School, 44 Binney St, Boston, MA 02115, USA
Email: Wei Li - [email protected]; Jason S Carroll - [email protected]; Myles Brown - [email protected]; X Shirley Liu* - [email protected]
* Corresponding author
AbstractBackground: The ability to rapidly map millions of oligonucleotide fragments to a referencegenome is crucial to many high throughput genomic technologies.
Results: We propose an intuitive and efficient algorithm, titled extreme MApping ofOligoNucleotide (xMAN), to rapidly map millions of oligonucleotide fragments to a genome of anylength. By converting oligonucleotides to integers hashed in RAM, xMAN can scan throughgenomes using bit shifting operation and achieve at least one order of magnitude speed increaseover existing tools. xMAN can map the 42 million 25-mer probes on the Affymetrix whole humangenome tiling arrays to the entire genome in less than 6 CPU hours.
Conclusions: In addition to the speed advantage, we found the probe mapping of xMAN tosubstantially improve the final analysis results in both a spike-in experiment on ENCODE tilingarrays and an estrogen receptor ChIP-chip experiment on whole human genome tiling arrays.Those improvements were confirmed by direct ChIP and real-time PCR assay. xMAN can befurther extended for application to other high-throughput genomic technologies foroligonucleotide mapping.
BackgroundThe ability to rapidly map millions of oligonucleotidefragments to a reference genome is crucial to many highthroughput genomic technologies. For example, Affyme-trix, Nimblegen, and Agilent have recently developed oli-gonucleotide arrays to tile all the non-repetitive genomicsequences of complex eukaryotic genomes. Since thearrays were usually designed based on an older genomeassembly, it is important to remap all the probes to the
newest genome assembly or transcriptome annotationduring data analysis [1], under the assumption that thecurrent genome and transcriptome are more precise thanthe earlier ones. It is not uncommon for a probe to mapto multiple locations in the genome. As a result, the probecould give rise to unexpected behaviour if information onits genome copy number is unknown or ignored. Otherexamples are the next-generation sequencing approachesto annotate novel transcripts [2,3] and regulatory ele-
from The 2007 International Conference on Bioinformatics & Computational Biology (BIOCOMP'07)Las Vegas, NV, USA. 25-28 June 2007
Published: 20 March 2008
BMC Genomics 2008, 9(Suppl 1):S20 doi:10.1186/1471-2164-9-S1-S20
<supplement> <title> <p>The 2007 International Conference on Bioinformatics & Computational Biology (BIOCOMP'07)</p> </title> <editor>Jack Y Jang, Mary Qu Yang, Mengxia (Michelle) Zhu, Youping Deng and Hamid R Arabnia</editor> <note>Research</note> </supplement>
This article is available from: http://www.biomedcentral.com/1471-2164/9/S1/S20
© 2008 Li et al.; licensee BioMed Central Ltd. This is an open access article distributed under the terms of the Creative Commons Attribution License (http://creativecommons.org/licenses/by/2.0), which permits unrestricted use, distribution, and reproduction in any medium, provided the original work is properly cited.
Page 1 of 10(page number not for citation purposes)
BMC Genomics 2008, 9(Suppl 1):S20 http://www.biomedcentral.com/1471-2164/9/S1/S20
ments [4]. In these applications, millions of short oligo-nucleotide fragments are generated and mapped to areference genome to identify the transcript or cis-elementclusters.
The current algorithms available for fast sequence similar-ity search such as BLAST [5], MegaBLAST [6], BLAT [7] andMUMmer [8] were not specifically designed for mappingmillions of query sequences. As a result, using such algo-rithms often take very long time, even on computer clus-ters with fast processors and big memory. For example, inthe recent MicroArray Quality Control project [9], it tookapproximately two days to map the half a million probeson the Affymetrix U133 expression microarray to the Ref-Seq mRNA database of approximately 70 MB size on aBeowulf cluster with 248 AMD Opteron Dual Processornodes. This translates into inhibitive time and resourcesrequired to map the 42 million probes on Affymetrixgenome tiling microarrays to complete mammaliangenomes.
We propose an intuitive and efficient method xMAN(namely extreme MApping of OligoNucleotide) for therapid mapping of millions of query oligonucleotide frag-ments to the reference genome of any given length. xMANdiffers significantly from existing algorithms. First, insteadof indexing the reference genome which is memoryexpensive, xMAN transforms all the query sequences intointegers and stores them in RAM as a hash table. Secondly,when scanning through a genome of any size for querymapping, xMAN hinges on bit shifting operation oversliding windows to boost its search speed. In this paper,we will explain xMAN's underlying algorithm, compare itsperformance with other methods, and discuss its applica-tion in tiling microarray data analysis.
ResultsTiling microarray probes remappingTiling microarrays have probes that cover essentially theentire non-redundant genome in an unbiased fashion.Such arrays have diverse applications, including chroma-tin-immunoprecipitation coupled with DNA microarrayanalysis (ChIP-chip), comparative genome hybridization,empirical detection of novel transcripts and polymor-phism discovery [10]. The average nucleotides spacingbetween centres of neighbouring probes defines the tiling‘resolution’. There are several tiling array platforms withdifferent probe length, resolution, and manufacturingcharacteristics. We focus our study on Affymetrix tilingarrays since they have the highest probe density, withapproximate 42 million 25-mer probes covering the non-repetitive human genome at 35 bp resolution. The sheeramount of raw data generated on these arrays poses chal-lenges for data analysis.
Despite extensive efforts to design statistical algorithms toanalyze Affymetrix tiling microarray [11-16], potentialprobe mapping problems exist and might have seriousdownstream consequences. Early assessments [1] onAffymetrix expression arrays revealed that remappingprobe sets to the newest genome could create as much as50% discrepancy in predicted differentially expressedgenes, regardless of the analysis methods used. Therefore,it is crucial to remap all the tiling array probes to the cur-rent genome to ensure more precise downstream analyses.Furthermore, one primary objective in microarray analy-sis is to minimize probe cross-hybridization. Most tilingmicroarrays are designed based on repeat-maskedgenome, which still contains many repetitive elementsincluding tandem repeats [17] with period longer than 12bp and segmental duplications [18]. Affymetrix tilingprobe selection operates in a local fashion, which doesnot check whether a probe matches elsewhere in thewhole genome (S. Cawley, pers. commun.). It does map allthe probes to the genome afterwards, although only to therepeat-masked genome which could be problematic. Thisapproach also sometimes maps the same probe to multi-ple locations in a short genomic region. When calculationon the region is performed assuming all the probe meas-ures are independent, this mapping is likely to inflate thep-value of the region and create a false positive. Theseproblems could be potentially addressed by taking intoaccount each probe's copy number [14] and filtering outrepetitive probes [15] in the analysis.
Affymetrix Human Tiling 1.0 arrays were designed basedon build NCBIv34 of the human genome, and we down-loaded the Affymetrix probe mapping (BPMAP) files fromhttp://www.affymetrix.com. We used xMAN to remap the~42 million probes to build NCBIv35 of the humangenome, in both Watson and Creek strands withoutrepeat-masking (designated as xMAN BPMAP). xMANstores the number of times a probe's 25-mer sequencemaps to the genome, so as to aid probe cross-hybridiza-tion estimation. The whole process took less than sixhours on an AMD Opteron single-CPU Linux computer,including importing probe sequences into hash table,scanning the genome, and writing the result BPMAP file.There are a total of 41,370,900 unique 25-mers on thewhole human tiling microarrays, among which 301,947have been synthesized on the arrays multiple times,resulting in a total of 41,782,720 array spots (Table 1). Anunexpected observation is that 13,120 (0.03%) probes nolonger maps to the NCBIv35 genome, thereby should beexcluded from downstream analysis. Another surprise isthat although the tiling probes are selected from the‘repeat-masked’ genome, 1,215,226 (2.94%) of theprobes have multiple genomic copies (Fig. 1). For exam-ple, one probe with sequence TCGGCCTCCCAAAGTGCT-GGGATTA, which was designed to interrogate a non-
Page 2 of 10(page number not for citation purposes)

BMC Genomics 2008, 9(Suppl 1):S20 http://www.biomedcentral.com/1471-2164/9/S1/S20
repetitive sequence on chromosome 19, mapped to114,450 locations in the genome. It is worth noting that atypical transcription factor only binds less than 1% of thegenome. Thus, the ~3% probes with multiple genomecopies could bring substantial influence to a ChIP-chipanalysis.
Similar situation was observed when xMAN was appliedto remap several other Affymetrix tiling arrays for human,mouse and Arabidopsis (Table 1).
Based on the above observation, xMAN used the follow-ing rules to remove probe redundancy in the humangenome tiling array BPMAP: 1) all the probes with copynumber more than 10 are filtered out; 2) the same 25-meris mapped only once within a 1 kb window along thegenome; 3) the remaining probes with multiple copynumbers are not mapped unless it is at least 30bp apartfrom the previous probe (the average probe spacing forthe array is 35 bp). The correct whole genome probe copynumber is stored with each probe's 25-mer sequence,regardless of whether it is mapped to a certain region ornot by rules 2) and 3).
Comparison with existing toolsMany tools are available for sequence similarity search,among which BLAST [5], MegaBLAST [6], BLAT [7] andMUMmer [8] are probably the most widely used. We com-pared the performance of xMAN with these tools in thesame Linux computer to map the 42 million humangenome tiling probes to the human genome. BLASTN [5]scans for short matches (usually 11-mer) in the genomeand extends those matches into high-scoring pairs (HSPs).
MegaBLAST utilizes a greedy algorithm [6] to search fornucleotide sequence alignment and is optimized foraligning slightly different sequences. BLAT [7] indexesnon-overlapping K-mers in the genome and hashes theminside the computer RAM, then scans linearly through thequery sequence. MUMmer [8] adopts a suffix tree datastructure for rapid sequence alignment, but is memoryintensive. MUMmer 3.0 uses approximately 17 bytes foreach nucleotide in the reference genome, thus requires~51 GB (3 G* 17) of RAM to create the human genomedata structure. We do not have access to a computer thatmeets this RAM requirement, thus did not include MUM-mer in our comparison.
It took BLAST 2,482 minutes, BLAT 19 minutes, andMegaBLAST (with an optimal word size of 20) 0.8 minuteto search the first 10 thousand probes against the humangenome. Since search time is approximately proportionalto the query size, extrapolating these numbers predictsthat the three algorithms will take about 173,740, 1,330and 56 CPU hours to map all 42 million probes, respec-tively. MegaBLAST appears to be a proper solution to thisspecific probe-mapping problem, and is extremely effi-cient with this word size of 20. Nevertheless, its advantagediminishes when mapping shorter fragments with smallerword size. For instance, MegaBLAST requires almost 2CPU minutes to search 10 thousand 18-mer probesagainst the genome with word size of 12, i.e. 140 CPUhours for the 42 million 18-mer probes. In comparison,word size in xMAN, which is the minimal length of anidentical match, is always equal to the length of the queryoligonucleotide and has no effect on the searching time.In any case, xMAN needs less than 6 CPU hours in com-
Table 1: xMAN probe mapping of various Affymetrix tiling arrays to the most recent genome assembly
Affymetrix tiling arrays #UniqSeq #Seq. MEntries #Query Entries #Seq. MGenomeMatches #Seq.NoGenomeMatch #Total Entries
Human ENCODE 1.0a 721,043 14,322 756,555 16,444 506 884,634Human Chr21/22a 979,553 21,930 1,054,324 49,316 75 1,627,746Human Promoterb 4,220,999 40,099 4,275,079 251,460 2,537 5,706,819Human Tiling 1.0 & 2.0b 41,370,900 301,947 41,782,720 1,215,226 13,120 48,332,137Mouse Tiling 1.0 & 2.0c 38,788,060 431,551 39,576,383 993,890 437,877 51,036,801Mouse Promoterc 4,096,798 30,835 4,154,546 192,119 37,483 5,716,068Arabidopsis thaliana 1.0d 3,046,178 7,275 3,053,686 164,728 0 3,772,912
Table head line:#UniqSeq: Number of unique 25-mer in the original BPMAP file#Seq.MEntries: Number of 25-mer with multiple spots in the array#QueryEntries: Number of array spots in the original BPMAP file#Seq.MGenomeMatches: Number of 25-mer with multiple genomic copies#Seq.NoGenomeMatch: Number of 25-mer with no match in the genome#TotalEntries: Number of total entries in the xMAN mappingaThe original Affymetrix probe mapping is from the NCBIv33 human genome. The new xMAN probe mapping is based on NCBIv35 human genome.bThe original Affymetrix probe mapping is from the NCBIv34 human genome. The new xMAN probe mapping is based on the NCBIv35 human genome.cThe original Affymetrix probe mapping is from the NCBIv33 mouse genome. The new xMAN probe mapping is based on the NCBIv35 mouse genome.dBoth the original Affymetrix probe mapping and xMAN probe mapping are based on the TIGRv5 Arabidopsis genome.
Page 3 of 10(page number not for citation purposes)

BMC Genomics 2008, 9(Suppl 1):S20 http://www.biomedcentral.com/1471-2164/9/S1/S20
pleting the 42 million probe mapping, and is at least anorder of magnitude faster than other popular algorithms.
Impact of the updated probe mapping on the tiling array analysisWe aim to systemically investigate the impact of theupdated probe mapping on tiling array data analysis. Werecently developed a Model-based Analysis of Tilingarrays (MAT) algorithm [14] to reliably detect ChIP-enriched regions on Affymetrix tiling arrays. MAT employsa linear model to estimate the baseline probe behaviourbased on probe sequence and copy number. To our
knowledge, it is the only algorithm that considers probecopy number information in tiling array analysis. As ourgoal here is to assess the pure effect of probe mapping ontiling array data analysis, we only used MAT to investigatethe impact of xMAN probe mapping. Since the AffymetrixBPMAP does not contain probe copy number informa-tion, we used 1 copy for every probe.
We applied MAT to the estrogen receptor (ER) wholegenome ChIP-chip data [19] using both Affymetrix andxMAN BPMAPs (Table 2). Regardless of the thresholds,the consistency between the ChIP-regions from the two
Copy number histogram of ~42 million probes on the Affymetrix human genome 1.0 tiling arrays.Figure 1Copy number histogram of ~42 million probes on the Affymetrix human genome 1.0 tiling arrays. Only probes with more than one match in the genome are shown.
Den
sity
2 3 4 5 6 7 8 9 10 >10Copy Number
Page 4 of 10(page number not for citation purposes)

BMC Genomics 2008, 9(Suppl 1):S20 http://www.biomedcentral.com/1471-2164/9/S1/S20
probe mappings is usually around 95%. Our analysis sug-gested that at the same false discovery rate (FDR: expectedpercentage of false positives in a set of predictions) thresh-old, xMAN BPMAP can significantly increase the numberof detected ChIP-regions compared to Affymetrix BPMAP.At 0% FDR threshold, MAT identified 635 (24%) moreregions with xMAN BPMAP, among which 123 could notbe identified even at 5% FDR using Affymetrix BPMAP.We randomly selected 10 out of the 123 xMAN-specificregions to conduct site-specific ER ChIP and real-timequantitative PCR assay (qPCR), and found 9 out of the 10regions to be ChIP-enriched (> 4 fold) in an estrogen-dependent manner (Fig. 2). This indicated that most ofthe xMAN-specific ER binding sites are real, suggesting areduced false negative rate in the analyses using xMANBPMAP. On the contrary, only 53 regions were found at0% FDR using Affymetrix BPMAP but not found usingxMAN BPMAP at 5% FDR. All 53 Affymetrix-specificChIP-regions reside in repetitive sequences, suggestingthat they are most likely false positives, due to the inflatedsignals on the repetitive probes in Affymetrix BPMAP.
We conducted another comparison using a spike-in exper-iment, in which the position and concentration of everyspike-in target was known. The spike-in sample represent-ing a mock ChIP is a mixture of human genomic DNA and96 clones of approximately ~500 bp, which are 2, 4-, … ,256-fold enriched (12 clones at each concentration) rela-tive to genomic DNA. Genomic DNA without spike-inclones serves as a mock input control. The samples werehybridized to Affymetrix tiling arrays in 5 replicates (GEOaccession number GSE5053). With xMAN BPMAP, MATachieved 100% accuracy for predicting the spike-in cloneswith 0 false positive and 0 false negative. MAT withAffymetrix BPMAP, however, would yield one false posi-tive prediction (Fig. 3). A scrutiny into this false positiveregion revealed that most of the probes there had multiplecopies in the genome. So by using xMAN BPMAP to con-trol the cross-hybridization effect, MAT successfully elim-inated this false positive.
ConclusionsAs many genome sequencing projects continuouslyupdate the genome assembly, and high-throughputsequencing/microarray technologies frequently introducemillions of oligonucleotides, algorithm for fast mappingof oligonucleotides to the newest genome is needed. Weintroduce an intuitive and effective algorithm xMAN,which is optimized for mapping millions of oligonucle-otide fragments to the genome simultaneously and is atleast an order of magnitude faster than other popularalgorithms. It also works on mapping long oligonucle-otide probes from NimbleGen and Agilent, and can befurther adopted to map the short sequence tags from highthroughput sequencing technologies. xMAN can also beused to convert probe genome coordinate between closelyrelated species for analysis, e.g. when Chimpanzee DNA ishybridized to human tiling arrays.
Although the LiftOver program from UCSC can convertgenome coordinates, it relies on library files which are notavailable for all the possible genome assemblies. xMAN,on the other hand, could be used for any coordinate con-version when the query and reference genome sequencesare available. In addition, LiftOver only transfers coordi-nates to a new version without the ability to find othermatches of the query DNA sequence. For example, thepreviously mentioned probe on chromosome 19 whichmatches ~100 thousand genome locations, will only beconverted to a single new genome coordinate by LiftOver.
Most index-based sequence similarity search programsinvolve two major stages, a heuristic search stage to locatepotential similar blocks (anchors) and an alignment stageto combine the anchors. Since xMAN only finds exactmatches of short fragments, it simplifies the index-basedmethod by eliminating the second stage. xMAN encodesthe query sequences into hash table in RAM and linearlyscans through the genome for the exact matches. Querysize only affects hash table generation and output writingtime, but not genome scanning time. xMAN does requireRAM to hash all the query sequences, which is muchsmaller than the genome size and often available with cur-
Table 2: Whole genome ER ChIP-chip results based on either Affymetrix or xMAN probe mapping under different FDR thresholds
FDR thresholds (%) 0 1 2 5
Affymetrixa 2,646 (2,312) 5,221 (4,572) 5,714 (4,993) 7,293 (6,413)xMANa 3,281 (2929) 6,544 (5,820) 7,563 (6,760) 8,890 (7,925)Shared Regionsb 2,475 (2,217) 5,006 (4,481) 5,436 (4,876) 6,871 (6,184)Percentage of Shared Regionsc 93.5 (95.9) 95.9 (98.0) 95.1 (97.6) 94.2 (96.5)
aThe numbers of ChIP-regions identified by MAT are shown in the table. A ChIP-region is annotated as repeat if more than 70% of the region is within RepeatMasker repeats, simple repeats, or segmental duplications. The numbers of non-repeat regions are shown in the parentheses.bChIP-regions identified from Affymetrix_NCBIv34 probe mapping were converted into NCBIv35 version using LiftOver program (http://genome.ucsc.edu/cgi-bin/hgLiftOver). Two regions are considered the same if they overlap by more than 50%.cThe percentage of shared regions was defined as the number of shared regions divided by the number of regions identified using Affymetrix probe mapping.
Page 5 of 10(page number not for citation purposes)

BMC Genomics 2008, 9(Suppl 1):S20 http://www.biomedcentral.com/1471-2164/9/S1/S20
rent computing capacity. Besides, when query sequencesare too big, they can be split to multiple files, so xMANcan be carried out sequentially on each smaller query files.
Using xMAN to generate probe mapping BPMAP is impor-tant for tiling array data analysis. It not only converts theprobe coordinates to newer genome assemblies, but alsoremoves many redundant probes, and allows algorithmssuch as MAT to consider and control probe cross-hybridi-zation effect. During the BPMAP comparison analysis on
ER ChIP-chip data, we not only removed several false-pos-itive ChIP-regions residing in highly repetitive sequences
We observed an interesting phenomenon that xMANBPAMP allows more ChIP-regions to be identified at thesame FDR cutoff (Fig. 4). After probe standardization,MAT uses a sliding window approach to calculate a MAT-score for each window (e.g. 1KB genomic region) basedon the standardized value of all the probes in the window.Assuming the background NULL distribution to be nor-mally and symmetric distributed about the median m
Characterization of ER binding sites identified only through xMAN probe mapping.Figure 2Characterization of ER binding sites identified only through xMAN probe mapping. Standard ChIP assays of ER were performed with anti-ER antibody. Immunoprecipitated DNA was quantified by qPCR using primers spanning 10 randomly selected regions identified by MAT only with xMAN probe mapping. The results are shown as vehicle (control, white bars) or estrogen (black bars) fold enrichment over input and are the average of three replicates±SE. The 10 regions are provided as NCBIv35 chromosomal coordinates: Site 1(chr10:94549192-94550690), Site 2(chr11:46253821-46255330), Site 3(chr11:100812061-100813479), Site 4(chr4:188058695-188060091), Site 5(chr5:52253648-52254807), Site 6(chr5:133383322-133384523), Site 7(chr7:150991115-150992368), Site 8(chr8:88996063-88997399), Site 9(chr8:99413611-99415262), Site 10(chr8:102555348-102556385).
0
10
20
30
40
50
60
Site1
Site2
Site3
Site4
Site5
Site6
Site7
Site8
Site9
Site10
Fo
ld v
ersu
s in
pu
t
Page 6 of 10(page number not for citation purposes)

BMC Genomics 2008, 9(Suppl 1):S20 http://www.biomedcentral.com/1471-2164/9/S1/S20
(often close to 0), MAT estimates the NULL distributionusing all the MATscores less than the median. At eachMATscore cutoff (m + x), the number of peaks below (m-x) over the number of peaks above (m + x) gives the empir-ical estimate of FDR. xMAN's more accurate probe map-ping and filtering removes the noise from many windowswith multiple copy number probes, thereby reducing theoverall variance of the MATscore NULL distribution. Thisleads to a higher signal to noise ratio, and eventually morepredictions under the same FDR cutoff.
Materials and methodsHash table for query sequencesxMAN seeks to eliminate the time-consuming disk accessoperations by creating a query sequence hash table thatresides entirely in the computer RAM. Each nucleotide isencoded as two bits, i.e. A: 00; C: 01; G: 10; T: 11 (denotedas BaseIndex), thus any N-mer sequence can be converted
into a 2N-bits integer, which is a key in the hash table. Inorder to avoid encoding ambiguities, all the querysequences are restricted to have the same length. The valueof each key in the hash table is a feature associated withthe corresponding sequence. The feature can be the X andY coordinates of a given probe on the microarray, or theposition of a sequence in the query file. Redundant querysequences (e.g. if multiple array spots have the sameprobe sequence) share the same key, with multiple fea-tures (e.g. different X and Y coordinates on the array). Thememory requirement is proportional to the total size ofthe query sequence.
Scanning the genomexMAN scans the reference genome using a sliding windowof size N (query sequence length) at steps of size 1. Toaccelerate search speed, xMAN also encodes each nucle-otide in the genome sequence in 2 bits, and takes advan-
ROC-like curve for ENCODE spike-in data using either xMAN or Affymetrix probe mapping.Figure 3ROC-like curve for ENCODE spike-in data using either xMAN or Affymetrix probe mapping. We applied MAT with either xMAN or Affymetrix probe mapping to the spike-in data. xMAN and Affymetrix mapping achieved 100% and 96% True Positive Rate (TPR) at 0% False Discovery Rate (FDR) cutoff, respectively. A MAT prediction is considered correct if the center of the predicted region lies in the actual spike-in fragment. Please note that False Discovery Rate instead of False Posi-tive Rate is used in this ROC-like curve.
False Discovery Rate (FDR)
TruePositiveRate(TPR)
MAT_xMAN_ProbeMapping
MAT_Affymetrix_ProbeMapping
Page 7 of 10(page number not for citation purposes)

BMC Genomics 2008, 9(Suppl 1):S20 http://www.biomedcentral.com/1471-2164/9/S1/S20
tage of the fastest bit-shifting operation for the encoding,as described below:
Denote the 2N bits integer from the previous window as A
Reset the two left-most bits of A to 0 (i.e. remove the leftmost base in the previous window)
Left-shift A by 2 bits
Read one more base and add its BaseIndex to A to formthe new 2N bits integer for the current window
If this new A is a key in the query hash table, xMAN storesthe corresponding chromosome, strand and genomicposition.
Estrogen receptor whole-genome ChIP-chip experiment using xMAN or Affymetrix probe mapping.Figure 4Estrogen receptor whole-genome ChIP-chip experiment using xMAN or Affymetrix probe mapping. We applied MAT with xMAN or Affymetrix probe mapping to the estrogen receptor ChIP-chip experiment on Affymetrix human genome 1.0 tiling array set, which consists of 14 arrays covering the non-repetitive human genome at 35 bp resolution.A) MATscore histogram: The standard deviations estimated from the background NULL distribution are 1.07 and 1.09 using xMAN and Affymetrix probe mapping, respectively. Only the bottom part of the histogram was shown.B) Scatter plot of false discovery rate (FDR) versus number of true positives. Under each cutoff, the number of true positive is estimated as the number of positive peaks minus the number of negative peaks; the FDR is estimated as the number of negative peaks divided by number of positive peaks. Under the same FDR cutoff, MAT predicts more true positive peaks using xMAN probe mapping than using Affymetrix probe mapping.
A
B
MATscore MATscore
xMAN Probe Mapping Affymetrix Probe Mapping
% False Discovery Rate
Background
Enriched
Background
Enriched
MATscore
% False Discovery Rate
Page 8 of 10(page number not for citation purposes)
BMC Genomics 2008, 9(Suppl 1):S20 http://www.biomedcentral.com/1471-2164/9/S1/S20
Step one base 5′ to 3′, and repeat steps 1-5 until the endof the genome
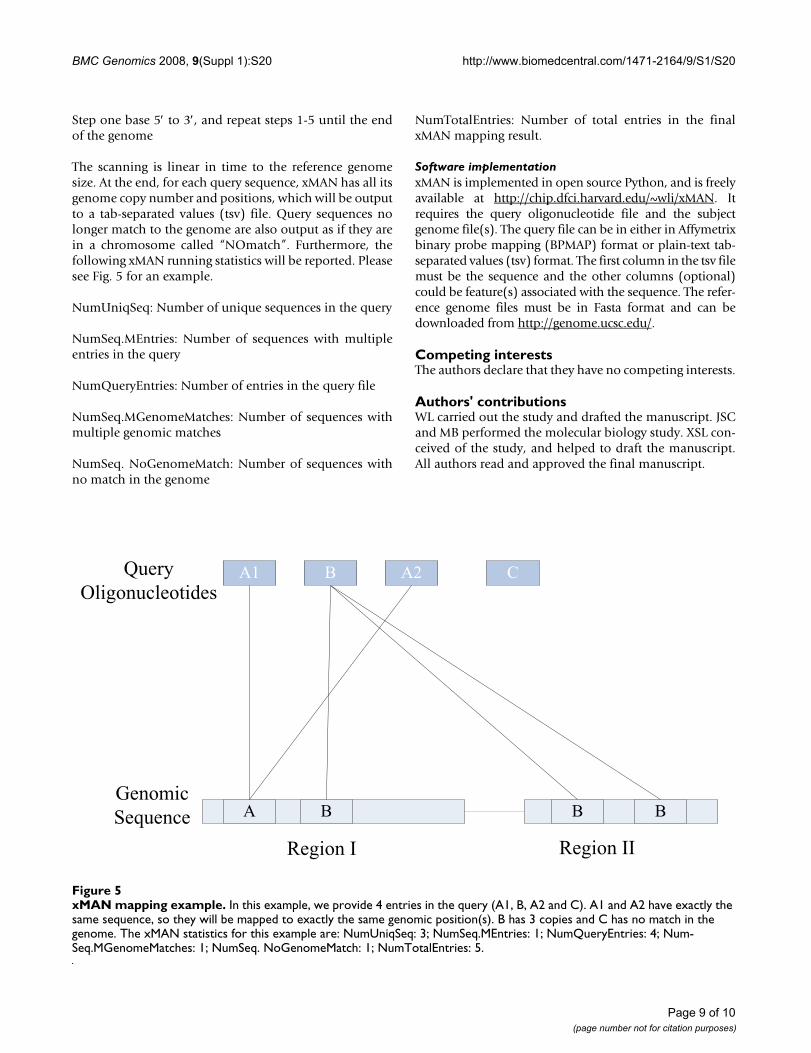
The scanning is linear in time to the reference genomesize. At the end, for each query sequence, xMAN has all itsgenome copy number and positions, which will be outputto a tab-separated values (tsv) file. Query sequences nolonger match to the genome are also output as if they arein a chromosome called “NOmatch”. Furthermore, thefollowing xMAN running statistics will be reported. Pleasesee Fig. 5 for an example.
NumUniqSeq: Number of unique sequences in the query
NumSeq.MEntries: Number of sequences with multipleentries in the query
NumQueryEntries: Number of entries in the query file
NumSeq.MGenomeMatches: Number of sequences withmultiple genomic matches
NumSeq. NoGenomeMatch: Number of sequences withno match in the genome
NumTotalEntries: Number of total entries in the finalxMAN mapping result.
Software implementationxMAN is implemented in open source Python, and is freelyavailable at http://chip.dfci.harvard.edu/~wli/xMAN. Itrequires the query oligonucleotide file and the subjectgenome file(s). The query file can be in either in Affymetrixbinary probe mapping (BPMAP) format or plain-text tab-separated values (tsv) format. The first column in the tsv filemust be the sequence and the other columns (optional)could be feature(s) associated with the sequence. The refer-ence genome files must be in Fasta format and can bedownloaded from http://genome.ucsc.edu/.
Competing interestsThe authors declare that they have no competing interests.
Authors' contributionsWL carried out the study and drafted the manuscript. JSCand MB performed the molecular biology study. XSL con-ceived of the study, and helped to draft the manuscript.All authors read and approved the final manuscript.
xMAN mapping example.Figure 5xMAN mapping example. In this example, we provide 4 entries in the query (A1, B, A2 and C). A1 and A2 have exactly the same sequence, so they will be mapped to exactly the same genomic position(s). B has 3 copies and C has no match in the genome. The xMAN statistics for this example are: NumUniqSeq: 3; NumSeq.MEntries: 1; NumQueryEntries: 4; Num-Seq.MGenomeMatches: 1; NumSeq. NoGenomeMatch: 1; NumTotalEntries: 5.
A B B B
A1Query
Oligonucleotides
Genomic
Sequence
A2
Region I Region II
B C
Page 9 of 10(page number not for citation purposes)

BMC Genomics 2008, 9(Suppl 1):S20 http://www.biomedcentral.com/1471-2164/9/S1/S20
Publish with BioMed Central and every scientist can read your work free of charge
"BioMed Central will be the most significant development for disseminating the results of biomedical research in our lifetime."
Sir Paul Nurse, Cancer Research UK
Your research papers will be:
available free of charge to the entire biomedical community
peer reviewed and published immediately upon acceptance
cited in PubMed and archived on PubMed Central
yours — you keep the copyright
Submit your manuscript here:http://www.biomedcentral.com/info/publishing_adv.asp
BioMedcentral
AcknowledgementsThis project was funded by NIH grant 1R01 HG004069-01. The authors would like to thank Kevin Struhl, Clifford A. Meyer and Jun Song for the helpful discussions and insights.
This article has been published as part of BMC Genomics Volume 9 Supple-ment 1, 2008: The 2007 International Conference on Bioinformatics & Computational Biology (BIOCOMP'07). The full contents of the supple-ment are available online at http://www.biomedcentral.com/1471-2164/9?issue=S1.
References1. Dai M, Wang P, Boyd AD, Kostov G, Athey B, Jones EG, Bunney WE,
Myers RM, Speed TP, Akil H, et al.: Evolving gene/transcript defi-nitions significantly alter the interpretation of GeneChipdata. Nucleic Acids Res 2005, 33:e175.
2. Margulies M, Egholm M, Altman WE, Attiya S, Bader JS, Bemben LA,Berka J, Braverman MS, Chen YJ, Chen Z, et al.: Genome sequenc-ing in microfabricated high-density picolitre reactors. Nature2005, 437:376-380.
3. Cheng J, Kapranov P, Drenkow J, Dike S, Brubaker S, Patel S, Long J,Stern D, Tammana H, Helt G, et al.: Transcriptional Maps of 10Human Chromosomes at 5-Nucleotide Resolution. Science2005, 308(5725):1149-1154.
4. Wei CL, Wu Q, Vega VB, Chiu KP, Ng P, Zhang T, Shahab A, YongHC, Fu Y, Weng Z, et al.: A global map of p53 transcription-fac-tor binding sites in the human genome. Cell 2006, 124:207-219.
5. Altschul SF, Gish W, Miller W, Myers EW, Lipman DJ: Basic localalignment search tool. J Mol Biol 1990, 215:403-410.
6. Zhang Z, Schwartz S, Wagner L, Miller W: A greedy algorithm foraligning DNA sequences. J Comput Biol 2000, 7:203-214.
7. Kent WJ: BLAT--the BLAST-like alignment tool. Genome Res2002, 12:656-664.
8. Kurtz S, Phillippy A, Delcher AL, Smoot M, Shumway M, AntonescuC, Salzberg SL: Versatile and open software for comparinglarge genomes. Genome Biol 2004, 5:R12.
9. Shi L, Reid LH, Jones WD, Shippy R, Warrington JA, Baker SC, CollinsPJ, de Longueville F, Kawasaki ES, Lee KY, et al.: The MicroArrayQuality Control (MAQC) project shows inter- and intraplat-form reproducibility of gene expression measurements. NatBiotechnol 2006, 24:1151-1161.
10. Mockler TC, Chan S, Sundaresan A, Chen H, Jacobsen SE, Ecker JR:Applications of DNA tiling arrays for whole-genome analy-sis. Genomics 2005, 85:1-15.
11. Ji H, Wong WH: TileMap: create chromosomal map of tilingarray hybridizations. Bioinformatics 2005, 21:3629-3636.
12. David L, Huber W, Granovskaia M, Toedling J, Palm CJ, Bofkin L,Jones T, Davis RW, Steinmetz LM: A high-resolution map of tran-scription in the yeast genome. Proc Natl Acad Sci U S A 2006,103:5320-5325.
13. Cawley S, Bekiranov S, Ng HH, Kapranov P, Sekinger EA, Kampa D,Piccolboni A, Sementchenko V, Cheng J, Williams AJ, et al.: Unbiasedmapping of transcription factor binding sites along humanchromosomes 21 and 22 points to widespread regulation ofnoncoding RNAs. Cell 2004, 116:499-509.
14. Johnson WE, Li W, Meyer CA, Gottardo R, Carroll JS, Brown M, LiuXS: Model-based analysis of tiling-arrays for ChIP-chip. ProcNatl Acad Sci U S A 2006, 103:12457-12462.
15. Li W, Meyer CA, Liu XS, et al.: A hidden Markov model for ana-lyzing ChiP-chip experiments on genome tiling arrays and itsapplication to p53 binding sequences. Bioinformatics 2005,21(Suppl 1):i274-i282.
16. Keles S, van der Laan MJ, Dudoit S, Cawley SE: Multiple testingmethods for ChIP-Chip high density oligonucleotide arraydata. J Comput Biol 2006, 13:579-613.
17. Benson G: Tandem repeats finder: a program to analyze DNAsequences. Nucleic Acids Res 1999, 27:573-580.
18. Bailey JA, Yavor AM, Massa HF, Trask BJ, Eichler EE: Segmentalduplications: organization and impact within the currenthuman genome project assembly. Genome Res 2001,11:1005-1017.
19. Carroll JS, Meyer CA, Song J, Li W, Geistlinger TR, Eeckhoute J, Brod-sky AS, Keeton EK, Fertuck KC, Hall GF, et al.: Genome-wide anal-
ysis of estrogen receptor binding sites. Nat Genet 2006,38:1289-1297.
Page 10 of 10(page number not for citation purposes)
http://www.ncbi.nlm.nih.gov/entrez/query.fcgi?cmd=Retrieve&db=PubMed&dopt=Abstract&list_uids=2231712
http://www.ncbi.nlm.nih.gov/entrez/query.fcgi?cmd=Retrieve&db=PubMed&dopt=Abstract&list_uids=2231712
http://www.ncbi.nlm.nih.gov/entrez/query.fcgi?cmd=Retrieve&db=PubMed&dopt=Abstract&list_uids=9862982