Extreme bounds of democracy
49
econstor www.econstor.eu Der Open-Access-Publikationsserver der ZBW – Leibniz-Informationszentrum Wirtschaft The Open Access Publication Server of the ZBW – Leibniz Information Centre for Economics Nutzungsbedingungen: Die ZBW räumt Ihnen als Nutzerin/Nutzer das unentgeltliche, räumlich unbeschränkte und zeitlich auf die Dauer des Schutzrechts beschränkte einfache Recht ein, das ausgewählte Werk im Rahmen der unter → http://www.econstor.eu/dspace/Nutzungsbedingungen nachzulesenden vollständigen Nutzungsbedingungen zu vervielfältigen, mit denen die Nutzerin/der Nutzer sich durch die erste Nutzung einverstanden erklärt. Terms of use: The ZBW grants you, the user, the non-exclusive right to use the selected work free of charge, territorially unrestricted and within the time limit of the term of the property rights according to the terms specified at → http://www.econstor.eu/dspace/Nutzungsbedingungen By the first use of the selected work the user agrees and declares to comply with these terms of use. zbw Leibniz-Informationszentrum Wirtschaft Leibniz Information Centre for Economics Gassebner, Martin; Lamla, Michael J.; Vreeland, James Raymond Working Paper Extreme bounds of democracy KOF working papers // KOF Swiss Economic Institute, ETH Zurich, No. 224 Provided in Cooperation with: KOF Swiss Economic Institute, ETH Zurich Suggested Citation: Gassebner, Martin; Lamla, Michael J.; Vreeland, James Raymond (2009) : Extreme bounds of democracy, KOF working papers // KOF Swiss Economic Institute, ETH Zurich, No. 224, http://dx.doi.org/10.3929/ethz-a-005788389 This Version is available at: http://hdl.handle.net/10419/50372
Transcript of Extreme bounds of democracy
econstor www.econstor.eu
Der Open-Access-Publikationsserver der ZBW – Leibniz-Informationszentrum WirtschaftThe Open Access Publication Server of the ZBW – Leibniz Information Centre for Economics
Nutzungsbedingungen:Die ZBW räumt Ihnen als Nutzerin/Nutzer das unentgeltliche,räumlich unbeschränkte und zeitlich auf die Dauer des Schutzrechtsbeschränkte einfache Recht ein, das ausgewählte Werk im Rahmender unter→ http://www.econstor.eu/dspace/Nutzungsbedingungennachzulesenden vollständigen Nutzungsbedingungen zuvervielfältigen, mit denen die Nutzerin/der Nutzer sich durch dieerste Nutzung einverstanden erklärt.
Terms of use:The ZBW grants you, the user, the non-exclusive right to usethe selected work free of charge, territorially unrestricted andwithin the time limit of the term of the property rights accordingto the terms specified at→ http://www.econstor.eu/dspace/NutzungsbedingungenBy the first use of the selected work the user agrees anddeclares to comply with these terms of use.
zbw Leibniz-Informationszentrum WirtschaftLeibniz Information Centre for Economics
Gassebner, Martin; Lamla, Michael J.; Vreeland, James Raymond
Working Paper
Extreme bounds of democracy
KOF working papers // KOF Swiss Economic Institute, ETH Zurich, No. 224
Provided in Cooperation with:KOF Swiss Economic Institute, ETH Zurich
Suggested Citation: Gassebner, Martin; Lamla, Michael J.; Vreeland, James Raymond (2009) :Extreme bounds of democracy, KOF working papers // KOF Swiss Economic Institute, ETHZurich, No. 224, http://dx.doi.org/10.3929/ethz-a-005788389
This Version is available at:http://hdl.handle.net/10419/50372

KOF Working Papers
No. 224April 2009
Extreme Bounds of Democracy
Martin Gassebner, Michael J. Lamla and James Raymond Vreeland

ETH ZurichKOF Swiss Economic InstituteWEH D 4Weinbergstrasse 358092 ZurichSwitzerland
Phone +41 44 632 42 39Fax +41 44 632 12 [email protected]
Extreme Bounds of Democracy
Martin Gassebner∗, Michael J. Lamla† and James Raymond Vreeland‡
April 14, 2009
Abstract
There are many stories of democracy but little consensus over which variables
robustly determine its emergence and survival. We apply extreme bounds analysis
to test the robustness of 59 factors proposed in the literature, evaluating over 3 million
regressions. The most robust determinants of the transition to democracy are GDP
growth (a negative effect), past transitions (a positive effect), and OECD membership
(a positive effect). There is some evidence that fuel exporters and Muslim countries
are less likely to see democracy emerge, although the latter finding is driven entirely
by oil producing Muslim countries. Regarding the survival of democracy, the most
robust determinants are GDP per capita (a positive effect) and past transitions (a
negative effect). There is some evidence that having a former military leader as the
chief executive has a negative effect, while having other democracies as neighbors has
a reinforcing effect.
JEL classification: C23; F59; O11; P16; P48
Keywords: democracy; extreme bounds analysis; regime transition
∗ETH Zurich, KOF Swiss Economic Institute, [email protected]†ETH Zurich, KOF Swiss Economic Institute, [email protected]‡Georgetown University, Edmund A. Walsh School of Foreign Service, [email protected]
1
1 Introduction
There are many stories of democracy. Efforts to test the empirical implications of various
theories of why democracy emerges or breaks down have produced a long list of variables
that purportedly explain these transitions. There is, however, little consensus over which
variables robustly determine democracy. We address this issue by applying extreme bounds
analysis (EBA) as suggested by Leamer (1983) and Levine and Renelt (1992) and modified
by Sala-i-Martin (1997) to test the robustness of 59 proposed factors. We assess both
the factors leading to the emergence of democracy as well as the factors explaining the
persistence of democracy. To be clear from the outset, our approach is extreme. We
evaluate over 1.7 million regressions of the emergence of democracy, and over 1.5 million
regressions for the survival of democracy.
The most striking of our findings is that most of the variables suggested in the lit-
erature do not survive EBA. While many of these factors are shown elsewhere to have
significant effects in plausible and well-specified models, when put to the rigors of being
tested alongside many other plausible variables, the significance simply does not survive.
We do not suggest that this implies these factors are unimportant. Many of the findings
that fail our EBA test are valid within the confines of the original statistical model proposed
in the literature. Our empirical approach focuses on reduced form models. Moreover, to
the extent that some variables fail our test, this could be because they are poor proxies for
otherwise strong theories of democracy. The standard of surviving the test of EBA is just
a very a high one, and only the strongest of relationships survive it.
And some variables do indeed survive. We suggest that these variables may be the
most important factors determining democracy. Regarding transitions to democracy, we
find that economic growth has a robust negative effect. This finding, standing in stark con-
trast to modernization theory, suggests that autocracies with strong economic performance
2
are unlikely to see democracy emerge. Instead, economic contraction causes dictatorships
to break down. Also in contrast to modernization theory, but consistent with the argument
of Przeworski et al. (2000), the level of GDP per capita does not have a robust relationship
with the emergence of democracy. Following the literature on the diffusion of democracy
through membership in international organizations (e.g., Pevehouse 2002a,b), we find ev-
idence that membership in one specific international organization has a positive effect on
transitions to democracy: the Organisation for Economic Co-operation and Development
(OECD). This, of course, could be endogenous or due to reverse causality (we discuss
this below). Previous regime transitions also increase the likelihood of the emergence of
democracy. The only other variables for which we find any evidence of a robustly signif-
icant effect are fuel exports (confirming Ross 2001, 2008; Jensen and Wantchekon 2004;
Boix and Stokes 2003; and Boix 2003) and the share of the population that is Muslim (as
cultural theorists argue). Both lose some statistical significance when included exclusively
with the other highly robust variables, however, and we suspect that they may be fixed
effects of the Middle East. Tests certainly show that the effect of Islam is driven by fuel
exports as the effect does not exist among non-fuel exporting Muslim countries.
Regarding the survival of democracy, the most robust determinants are level of economic
development (a positive effect) and, interestingly, the number of past transitions (a negative
effect) – indicating that both supporters and subverters of democracy learn from history.
These findings confirm Przeworski et al. (2000) and Przeworski (2005). There is also some
evidence that having a former military leader as the chief executive has a negative effect
on democratic survival (in line with Cheibub 2006). Finally, again following the diffusion
literature, having other democracies as neighbors has a reinforcing effect (consistent with
Gleditsch 2002). These latter two findings, however, lose significance in the presence of the
number of past transitions.
We conclude that while there are many plausible theories of democracy, there are few
3
robust predictors that we can trust as reliable. For policymakers interested in promoting
democracy based on such reliable predictors, we suggest that there is little difference policy
can make when it comes to the emergence of democracy. But promoting investment in
dictatorships – encouraging vigorous economic growth – is certainly not likely to cause
a dictatorial regime to fall.1 Yet, when it comes to promoting the survival of nascent
democracies, raising the level of development helps. So it seems that if the leader of a
wealthy democracy decided to make the promotion of democracy a foreign policy goal,
and he was willing to spend, say, $500 billion, the money would be better spent helping
poor, established democracies develop economically rather than devoted to a country where
democracy had never previously existed.
The paper proceeds as follows. We begin with a brief review of the literature. We then
introduce the EBA method in detail and subsequently present the results. We conclude
by summarizing our findings and deriving policy conclusions.
2 Background
The earliest large-n studies of democracy are culturalist. Almond and Verba (1963), for
example, use survey-based research in five countries to show that a “participant” culture
(as opposed to a “subject” or “parochial” culture) is required for democracy. This “civic
culture” argument is tested cross-nationally in the work of Inglehart (1988), who finds that
democracy is correlated with the percentage of people reporting high levels of interpersonal
trust, low levels of support for revolutionary change, and high levels of life satisfaction.
These culturalist findings are disputed by Seligson (2002), who shows that the cultural
connections to democracy disappear when one controls for level of economic development.
Przeworski et al. (2000) test a full range of other cultural variables, finding that none has a
1See Rosendorff (2001) for a formal presentation as to why. Also see Boix (2003) and Acemoglu andRobinson (2006).
4
robust relationship with democracy once one accounts for level of economic development.
Economic explanations of democracy date back to Lipset (1959) who is often cited as
the first “modernization theorist.” Modernization theory argues that as countries develop
economically, social structures become too complex for authoritarian regimes to manage
– technological change endows owners of capital with some autonomy and private infor-
mation, complex labor processes require active cooperation rather than coercion, and civil
society emerges.2 At some point in this process, dictatorship collapses and democracy
emerges as the alternative.
Critical of modernization theory, Huntington (1968) adds that sustainable democracy
requires political development along with economic development. While he basically agrees
that economic development is a prerequisite for democracy, without political development,
rapid economic development can also destabilize democracies.
In their expansive large-n study of democracy and development, Przeworski et al. (2000)
thoroughly explore this relationship. They begin with the observation that the correlation
between level of economic development and democracy is strong. They question, however,
the process by which this correlation is driven. They suggest, in contrast to modernization
theorists, that this correlation is possible even if the emergence of democracy is completely
random with respect to economic development. The correlation may be driven instead by
a relationship between economic development and the survival of democracy.
This is in fact what their book argues. The emergence of democracy has no relationship
with level of economic development; the correlation instead is entirely driven by the survival
of democracy. In another work, Przeworski (2005, p.253) argues that “democracy prevails
in developed societies because too much is at stake in turning against it.” Conversely, in
poor democracies, “the value of becoming a dictator is greater and the accumulated cost
of destroying capital stock is lower” (Przeworski and Limongi 1997, p.166 fn.1).
2See Przeworski et al. (2000).
5

It should be noted, however, that while Przeworski et al. (2000) show that transitions to
democracy are not well predicted by economic development and survival of democracy is,
the estimated effect of economic development on the transition to democracy is statistically
significant in their specification.3 We suspect (and show below) that it is not a robust
relationship.
One important drawback of the Przeworski et al. (2000) study is that it ignores the oil
rich countries of the Middle East. As these scholars were originally interested in estimating
the effect of regime on economic growth, they chose not to include oil rich countries, whose
process of augmenting GDP per capita is much different from that of other countries.
Nevertheless, these dictatorships – with their high levels of GDP per capita – present a
real challenge to modernization theory that should be considered.
Some argue that political regime itself depends on the availability of oil and other
natural resources. Ross (2001), as well as Jensen and Wantchekon (2004) argue that there
is a resource curse whereby the rents from natural resources enable dictatorial regimes to
use low taxes and high spending to maintain power.4 This finding is confirmed by Ross
(2008) using a more precise measure of oil rents and a richer dataset.
Boix (2003) provides a compelling story with a game theoretic mechanism to explain
the effect of natural resources.5 He argues that level of economic development, income
distribution, and – importantly – asset specificity together impact the probability of the
emergence of democracy. Where asset specificity is high and the income distribution is
highly skewed, such as in many oil-rich countries, the rich face severe redistributional
3The insignificant coefficient reported indicates that the difference between the coefficients for theemergence and survival of democracy is not significant.
4Note that the claim is a direct causal relationship between natural resources and the survival ofdictatorship. This is distinct from a “Dutch disease” argument, where the presence of natural resourceexports leads to an overvalued exchange rate, which hurts the development of other exports, therebyweakening the overall economic development of the country and diminishing prospects for sustainableeconomic growth. The latter mechanism could lead natural resources to have an indirect influence onregime transition, but this should be captured by other economic variables.
5See also Boix and Stokes (2003) and Rosendorff (2001) on this matter.
6
consequences for allowing popular sovereignty, and they have no credible threat to flee the
country taking their productive capacity with them. Thus, it is in their interest to pay high
costs of repressing democracy, maintaining dictatorial rule. Note that if asset specificity is
low, as in South Africa, for example, the rich have a credible exit threat. If the rich flee
the country, taking the productive capacity along with them, they can severely harm the
national economy. This credible threat restrains the redistributional demands of the poor
and may make democracy possible even in countries with relatively low levels of economic
development, such as India. Asset specificity aside, if redistributional demands diminish
at higher levels of economic development, Boix argues that economic development should
make democracy more likely both to emerge and to survive.
Acemoglu and Robinson (2006) also propose a theory of democracy where elites may
prefer dictatorship but must pay the costs of repression as the masses threaten disorder.
Where repression costs are high and elites cannot credibly promise concessions otherwise,
democracy can offer a compelling alternative under specific conditions. Factors identi-
fied by their theory of democracy include measures of civil society, political institutions,
economic crises, income distribution, the structure of the economy, and the forces of glob-
alization.6
Another approach that has implications for the Middle East considers the effects of
“diffusion.” Consider the work of Gleditsch (2002), summarized nicely by the title of
his book: All (International) Politics are Local. Diffusion theorists suggest that through
various forces that spill over borders – political, cultural, and economic – the political
regime of one country is likely to be correlated with regimes of neighboring countries.7
Thus we have solidly democratic regions, such as Europe, dictatorial regions, such as the
Middle East, and regions where countries tend to transition together in waves, such as
6For a challenge to the empirical findings of Acemoglu and Robinson (2006), see Freeman and Quinn(2008).
7Also see Simmons and Elkins (2004), Elkins and Simmons (2005), Meseguer (2005), Gilardi (2005),and Way (2005).
7

Latin America.
A related story is suggested by Pevehouse (2002a,b), who argues that participation in
regional international organizations with many democratic members influences both the
emergence and survival of democracy. He develops an innovative mechanism by which
regional diffusion may operate – participation in regional organizations provides incentives
for countries to encourage democratic standards amongst the membership. Domestic elites
with a preference for democracy pressure governments to enter into regional international
organizations with many democratic members. They prefer other members to have demo-
cratic political institutions as well. Participation in the regional international organization
provides various benefits to the country, but these benefits can be taken away if democracy
is either not achieved or is subverted. Thus the incentives for establishing and maintaining
democracy can change if a country participates in an organization with a highly democratic
membership. Political regime may therefore be correlated with the number of democracies
in a region – particularly as they participate in regional international organizations.
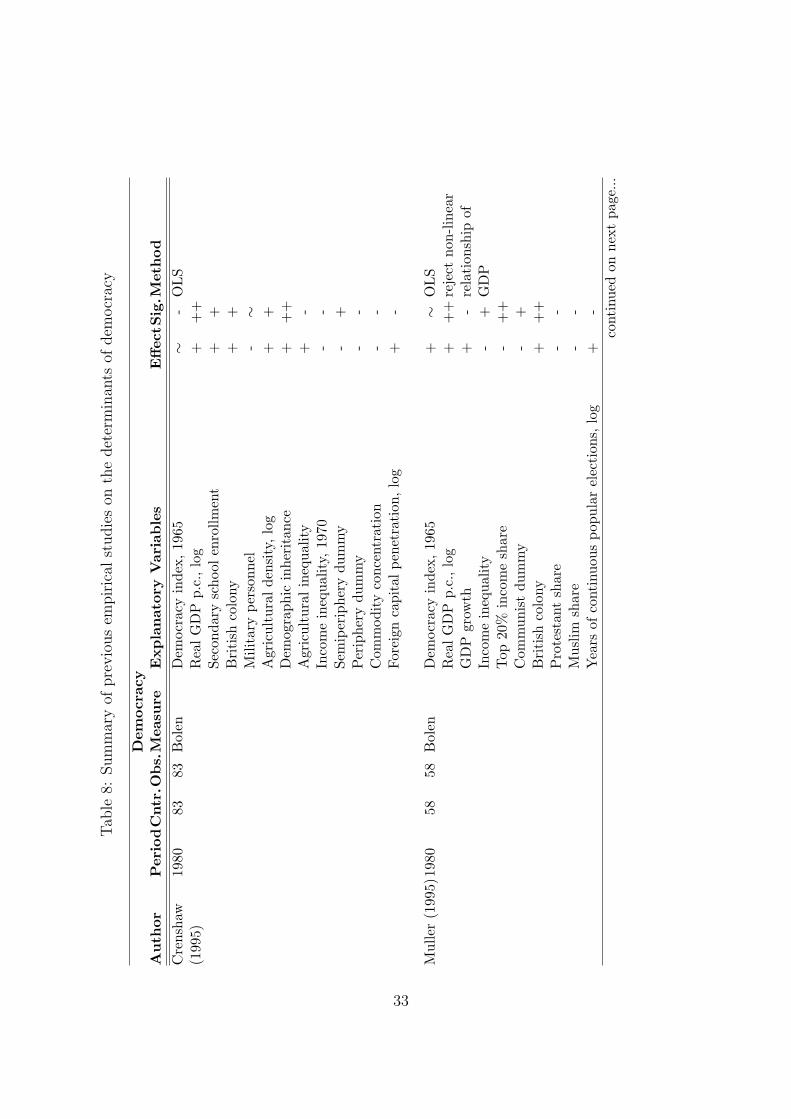
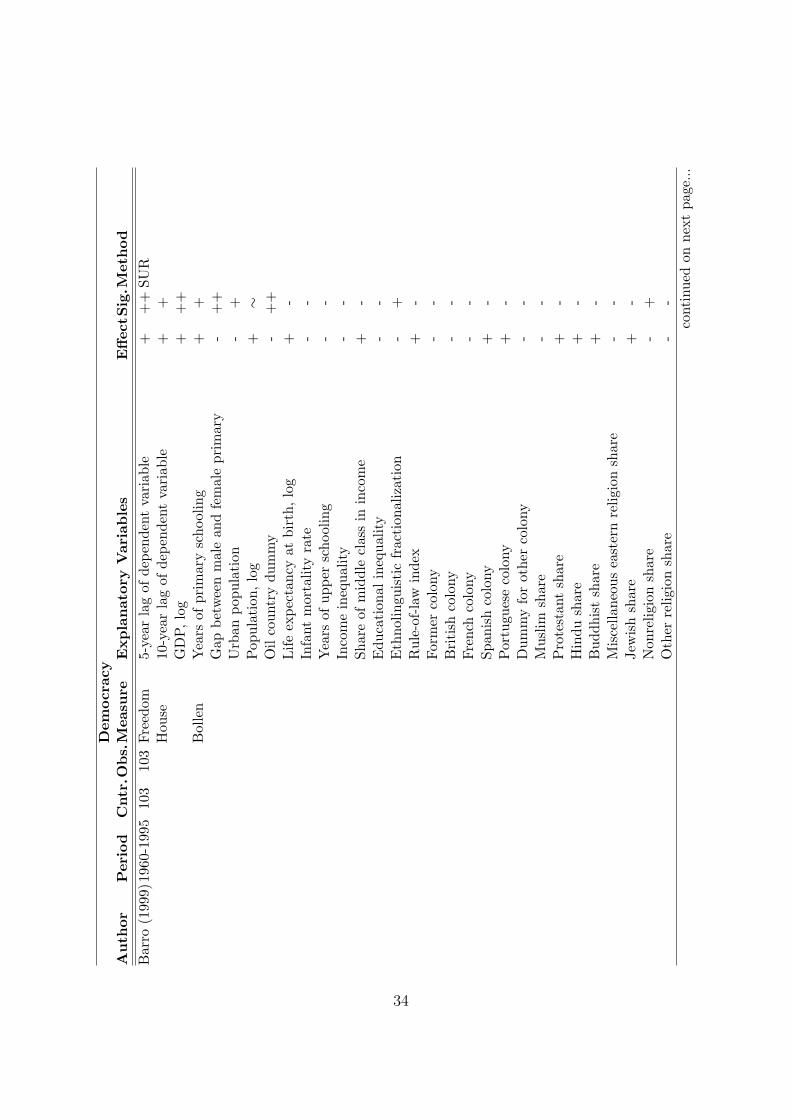
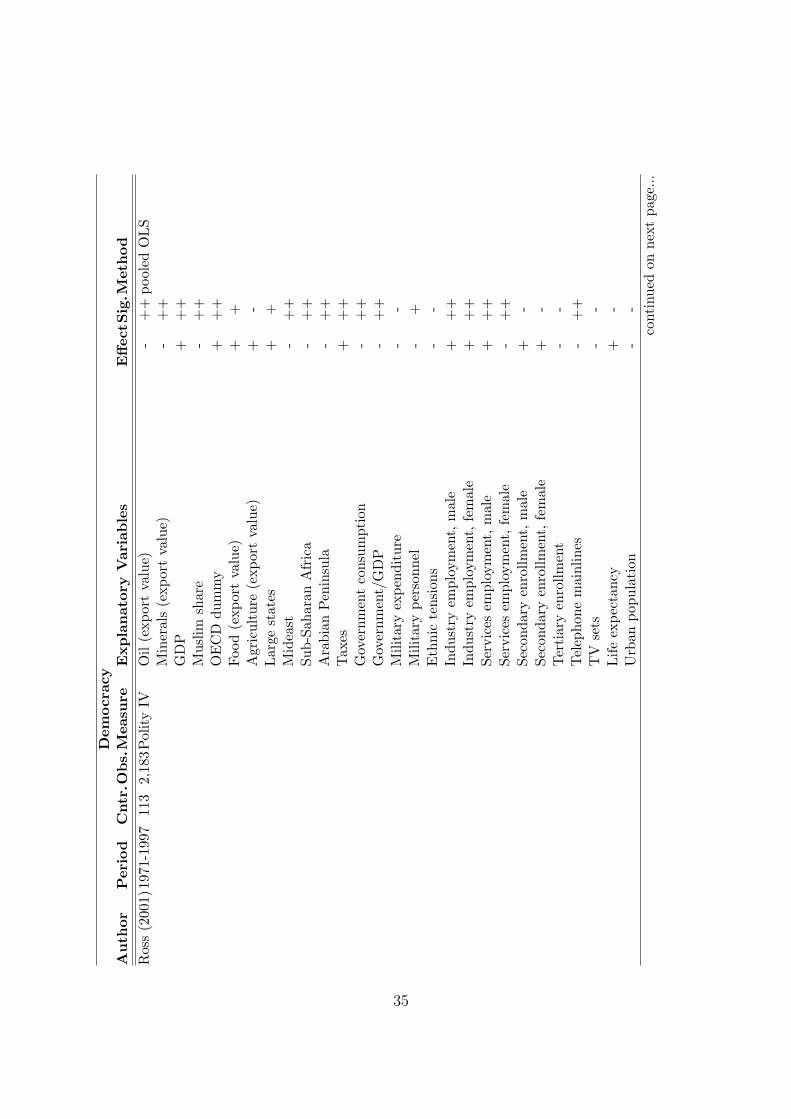
This stylized and brief sketch of the literature on the determinants of democracy demon-
strates that there is a vigorous debate. In addition to the “culturalist,” “modernization,”
“credible threat,” and “diffusion” stories of democracy that we have briefly outlined, Ta-
ble 8 in the Appendix presents a summary of 16 panel studies on the determinants of
democracy. Most of these studies, however, present but a handful of potential specifica-
tions, controlling for very few of the possible combinations of different variables. Many of
them simply ignore other theories when testing their own central arguments. Of course,
each study presents valid theoretical justifications for how their particular specifications
are chosen. But looking across the literature, there appears to be little consensus on the
theory. The only factor that all seem to agree is important is level of economic develop-
ment, and even here scholars disagree as to how it matters. As for the effects of other
proposed factors, findings that are presented as statistically significant in the presence of
8
some variables may not be significant in the presence of other variables proposed by differ-
ent scholars. We, therefore, suggest testing the bounds of the significance of all previously
considered variables.
3 Empirical Method
The purpose of EBA is to validate the statistical significance of the effect of a potential
explanatory variable in the presence of different combinations of other control variables.
We do not merely check the significance of a variable’s coefficient from some specifications –
rather, we keep track of its coefficient in all possible specifications with additional control
variables entering in groups of one, two, and three at a time (along with a core set of
standard control variables over which there is a consensus in the literature, included in
all regressions). In the end, we present summary statistics reporting the proportion of
the coefficient’s distribution that is greater than or less than 0 (whichever is larger), the
proportion of times the coefficient is significant at the 5% level, the median coefficient, and
its median standard error.
We apply the EBA on a basic model of democracy which assumes that the probability
of observing democracy at time t (measured in years in our data) follows a first order
Markov process. Let D be a dummy variable coded 1 if a country is a democracy, and 0
otherwise. Then,
Pr (Di,t|Di,t−1) = (1−Di,t−1) · Pr (Di, t|Di,t−1 = 0) + (Di,t−1) · Pr (Di, t|Di,t−1 = 1) (1)
As the likelihood function for this model is additively separable, it can be easily estimated
as two logistic functions with the transition probabilities defined as follows:
9
Pr (Di,t|Di,t−1 = 0) = Λ(βAD′
xi,t−1
)(2)
Pr (Di,t|Di,t−1 = 1) = Λ(βDD′
xi,t−1
), (3)
where Λ is the cumulative distribution function of the logistic distribution, xi,t−1 is the
vector of (lagged) variables that determine democracy, βAD is a vector of coefficients cap-
turing the effects of these variables on the probability of transition from Authoritarianism
to Democracy, and βDD is a vector of coefficients capturing the effects of these variables
on the survival of democracy (“transitioning” from Democracy to Democracy). While it
is of course not necessary to assume that the same variables determine both the emergence
and survival of democracy, most scholars in practice do, and we will be testing all variables
in both setups.
To conduct an EBA, we define:
βAD′xt−1 = βAD′
M Mt−1 + βAD′
F Ft−1 + βAD′
Z Zt−1 (4)
βDD′xt−1 = βDD′
M Mt−1 + βDD′
F Ft−1 + βDD′
Z Zt−1, (5)
where M is a vector of “commonly accepted” explanatory variables; and F is a vector
containing the variable of interest; and Z is a vector containing up to three possible addi-
tional explanatory variables which, according to the broader literature, are related to the
dependent variable (as in Levine and Renelt, 1992).
Using this setup, we conduct a long series of regressions. The commonly accepted
variables in M are included as control variables in every regression. All other variables
enter one at a time into F . The variable in F is then tested while controlling for M and,
following Levine and Renelt (1992), (up to) three control variables at a time in Z. The
variables included in the Z vector change for each regression as all possible permutations
of the remaining control variables are tested. The values of the coefficient βF along with
10
the corresponding standard error and its cumulative distribution are recorded (the same is
done for the coefficients of the variables in M). After this, a new control variable replaces
the previous in F , and the procedure is repeated. The process continues until all variables
have been tested in F .
According to the original EBA test as proposed by Leamer (1983), the effect of a variable
is considered robust only if the lower extreme bound for βF – defined as the lowest value
for βF minus two standard deviations – and the upper extreme bound for βF – defined as
the highest value for βF plus two standard deviations – both have the same sign.
Sala-i-Martin (1997) argues that this testing criterion is far too strong for most vari-
ables. Even if the vast bulk of the distribution of the parameter of interest lies to one side
of zero, if the distribution has some positive and negative support, then a researcher will
likely find that the estimated coefficient - plus or minus two standard deviations - changes
sign in at least one regression model. Consequently, we report the percentage of the re-
gressions in which the coefficient of the variable F is statistically different from zero at the
5% significance level. Furthermore, instead of only analyzing the extreme bounds of the
estimates of the coefficient of a particular variable, we follow Sala-i-Martin’s (1997) rec-
ommended procedure and analyze the entire distribution of βF . Thus, we report CDF(0),
the proportion of all of the cumulative distribution functions of the different estimates of
βF lying on one side of zero. CDF(0) indicates the larger of the areas under the density
function either above or below zero (whether this happens to be CDF(0) or 1 - CDF(0)).
So CDF(0) is always between 0.5 and 1.0. We report the median parameter estimate of
βF and the corresponding median standard error.8
8In contrast to Sala-i-Martin, who suggests weighting results according to the goodness-of-fit of eachregression, we use the unweighted median parameter estimate of βF , median standard error, and CDF(0).This is because missing data pose a problem. The number of observations changes depending on whichvariables are included in each regression. Thus, the dataset is not identical over all permutations. In thiscontext, Sturm and de Haan (2002) show that the goodness-of-fit measure may not be a good indicator ofthe probability that a model is the true model and that the weights constructed in this way are not invariantto linear transformations of the dependent variable. Note that sometimes the algorithm breaks down and
11
One important question as to how to proceed with EBA is what variables belong in
the vector M of “commonly accepted” variables, included in every regression. In our
view, GDP per capita (measured in purchasing power parities) is the only non-contentious
regressor. Beyond this variable, none other is included in all other studies. Thus, in
order not to prejudge the importance of other explanatory variables for the outcome of
the EBA we choose to test all other variables by including them in the F vector and test
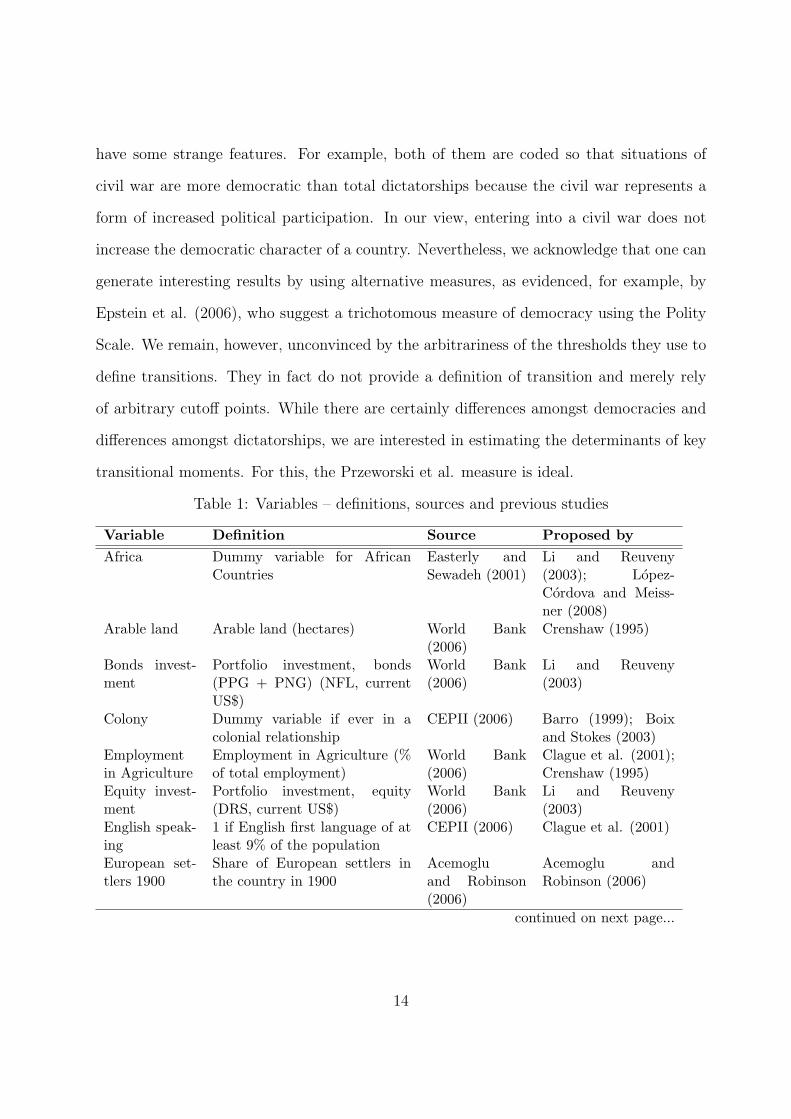
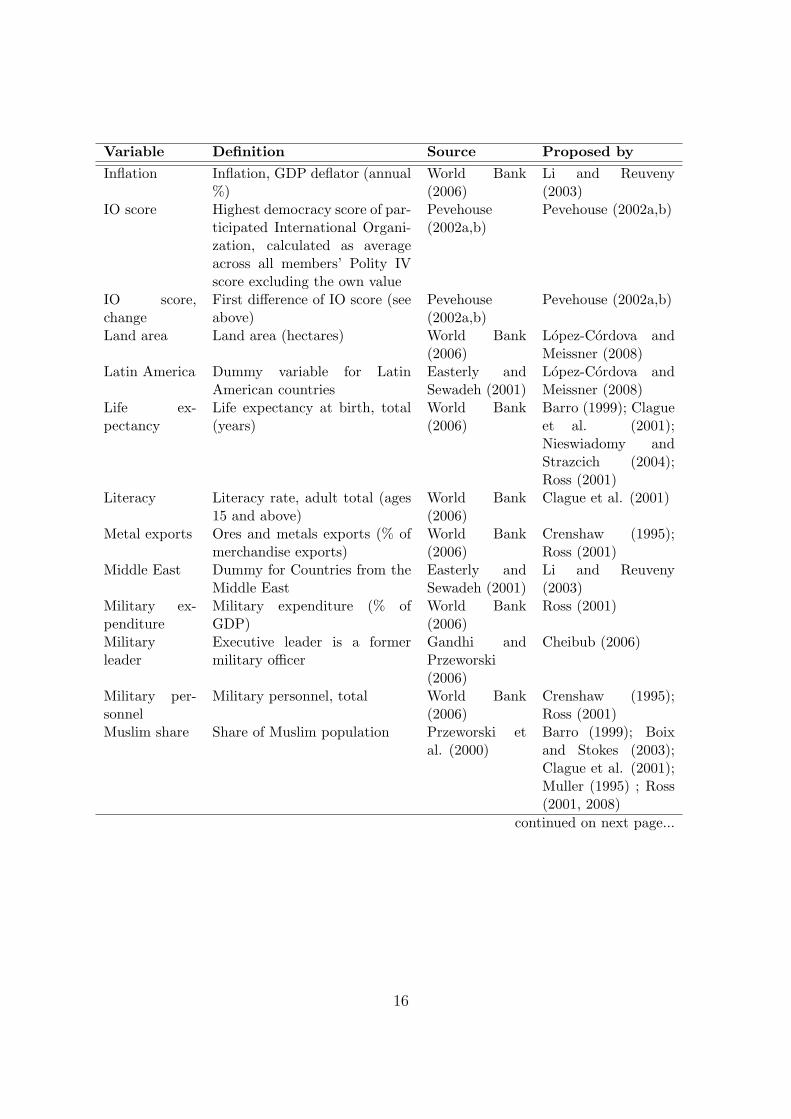
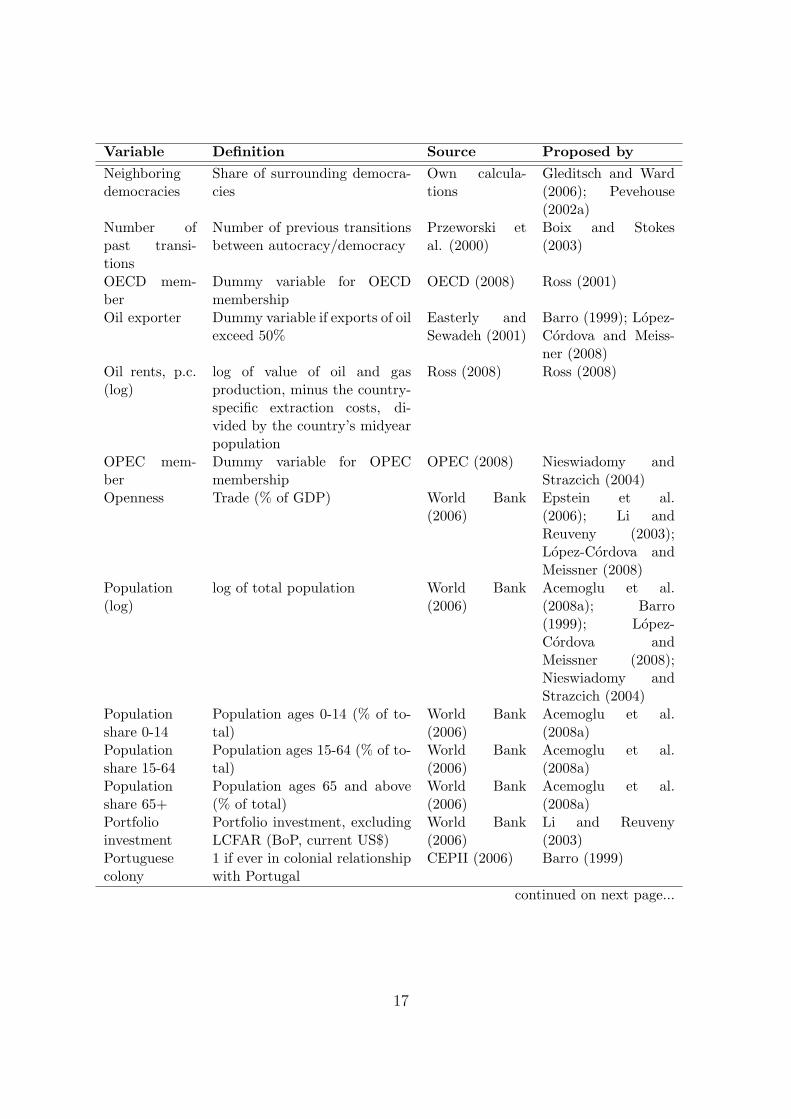
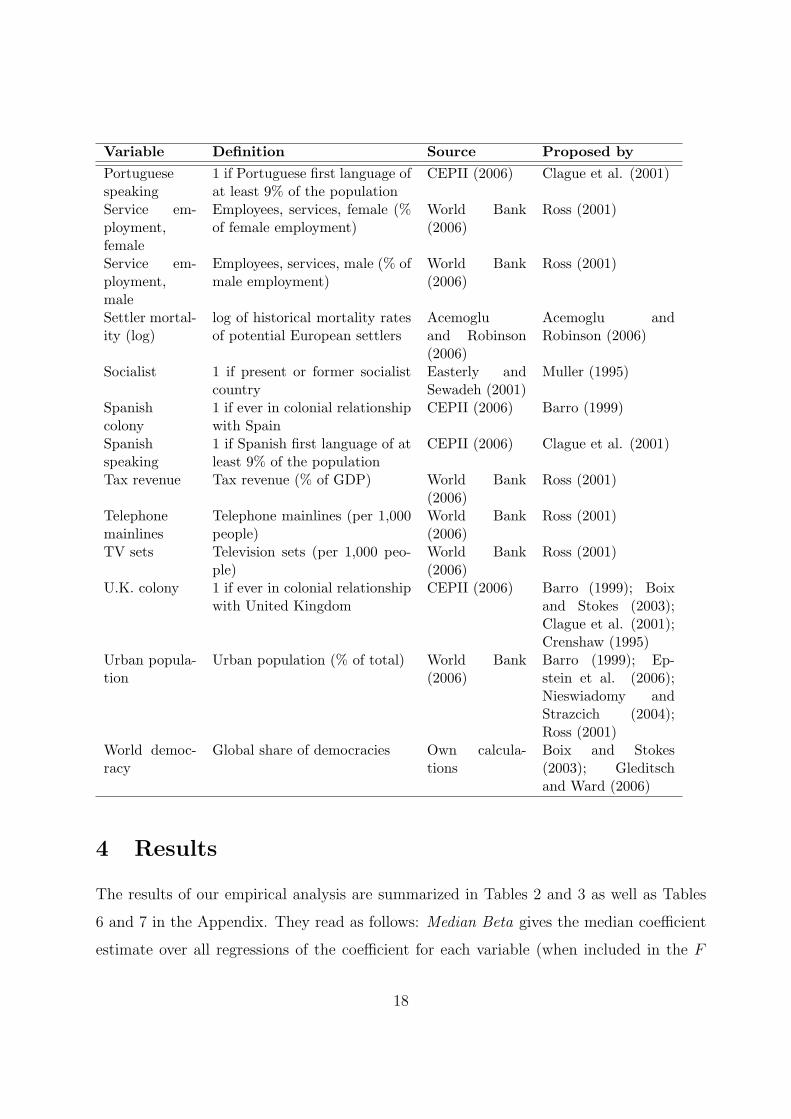
their relevance individually. The list of all variables, their definitions, and sources is given
in Table 1.9 We followed the literature and lagged nearly all variables one year. The
exception is the contagion variable; following the proponents of this variable, Pevehouse
(2002a,b) and Gleditsch (2002), we do not lag the share of neighboring countries that are
democracies. This allows the variable to have a contemporaneous effect.10 Obviously for
time-invariant variables, lagging is not an issue.
As it is pervasive in the literature, we use pooled country-year data in our logit re-
gressions. We include all time-invariant variables previously proposed in the literature
to proxy for fixed country effects. Including fixed country effects directly (via conditional
fixed effects logit estimations) reduces the sample size to only 200 observations which makes
inference unreliable and meaningless (which is indeed why so many studies in the literature
do not use the fixed effects approach).
So, to summarize, the basic idea of the EBA is to run many regressions continuously
reports back extraordinarly high coefficients, so we refrain from using the average parameter estimateand its corresponding average standard error, instead reporting their respective medians to increase therobustness of our results.
9As we deal with so many variables, multicollinearity could potentially be a problem. We thus checkedthe correlations between all our explanatory variables. There are only 10 (out of 1,712) pairwise correlationsabove 0.8. Some of them are very obvious candidates. All are reported as follows: oil producing countriesand OPEC; Spanish colony and Spanish language; GDP per capita and life expectancy; GDP per capita andtelephone mainlines; GDP per capita and globalization; infant mortality and employment in agriculture;television sets and telephone mainlines; globalization and telephone mainlines; globalization and televisionsets; European settlers 1900 and population share 16-51. Otherwise, the pairwise correlations were quitelow.
10Analysis of our final results shows that results are actually stronger when we do lag the variable.Results are available on request.
12

permutating through combinations of explanatory variables, testing how the variable in
the center of attention “behaves.” Each regression estimation equation includes GDP per
capita as well as a combination of up to three further control variables. This tests the
significance of GDP per capita. In the F vector regressions, GDP per capita is included
as well the variable in focus plus up to three additional variables out of the Z vector.
Overall, we estimate a total of 1,779,457 specifications for the emergence of democracy
and 1,554,172 specifications for the survival of democracy.11
As a measure of democracy, we use the Przeworski et al. (2000) dichotomous variable
(which follows Schumpeter’s (1942) conception of regime): democracy is the political sys-
tem in which key government offices are filled through contested elections. The definition
has two parts: “key government office,” which they define as the executive and the legis-
lature; and “contested,” which implies that more than one party has some probability of
winning office through election.12 Elections must be associated with some ex ante uncer-
tainty, and be subject to ex post irreversibility. Put succinctly, “democracy is a system in
which incumbents lose elections and leave office when the rules so dictate” (Przeworski et
al. 2000, p.54).
Our preference for this variable has to do with the theoretical and empirical crispness
with which regime transitions are defined. Since our interest is precisely these transitional
moments, this is of utmost importance. Alternative measures of democracy with many
categories, for example, Polity and Freedom House, require the researcher to use arbitrary
thresholds to distinguish regime types and define transitions. Since these measures conflate
several features of political systems into an overall index, countries can “transition” for
different reasons, thus the definition of transition lacks clarity. Moreover, the indexes
11The number of regressions differ because some estimations break down due to a the lack of observations.3% of all possible combinations break down for the emergence of democracy while 18% were problematicfor the survival of democracy.
12Sometimes this is obvious, such as when incumbents lose elections and relinquish power (Przeworski1991). Sometimes it is not, such as when incumbents successively win contested elections.
13
have some strange features. For example, both of them are coded so that situations of
civil war are more democratic than total dictatorships because the civil war represents a
form of increased political participation. In our view, entering into a civil war does not
increase the democratic character of a country. Nevertheless, we acknowledge that one can
generate interesting results by using alternative measures, as evidenced, for example, by
Epstein et al. (2006), who suggest a trichotomous measure of democracy using the Polity
Scale. We remain, however, unconvinced by the arbitrariness of the thresholds they use to
define transitions. They in fact do not provide a definition of transition and merely rely
of arbitrary cutoff points. While there are certainly differences amongst democracies and
differences amongst dictatorships, we are interested in estimating the determinants of key
transitional moments. For this, the Przeworski et al. measure is ideal.
Table 1: Variables – definitions, sources and previous studies
Variable Definition Source Proposed by
Africa Dummy variable for AfricanCountries
Easterly andSewadeh (2001)
Li and Reuveny(2003); Lopez-Cordova and Meiss-ner (2008)
Arable land Arable land (hectares) World Bank(2006)
Crenshaw (1995)
Bonds invest-ment
Portfolio investment, bonds(PPG + PNG) (NFL, currentUS$)
World Bank(2006)
Li and Reuveny(2003)
Colony Dummy variable if ever in acolonial relationship
CEPII (2006) Barro (1999); Boixand Stokes (2003)
Employmentin Agriculture
Employment in Agriculture (%of total employment)
World Bank(2006)
Clague et al. (2001);Crenshaw (1995)
Equity invest-ment
Portfolio investment, equity(DRS, current US$)
World Bank(2006)
Li and Reuveny(2003)
English speak-ing
1 if English first language of atleast 9% of the population
CEPII (2006) Clague et al. (2001)
European set-tlers 1900
Share of European settlers inthe country in 1900
Acemogluand Robinson(2006)
Acemoglu andRobinson (2006)
continued on next page...
14

Variable Definition Source Proposed by
FDI net in-flows
Foreign direct investment, netinflows (% of GDP)
World Bank(2006)
Li and Reuveny(2003)
French colony 1 if ever in colonial relationshipwith France
CEPII (2006) Barro (1999)
French speak-ing
1 if French first language of atleast 9% of the population
CEPII (2006) Clague et al. (2001)
Fuel exports Fuel exports (% of merchandiseexports)
World Bank(2006)
Ross (2001)
GDP growth,PPP
GDP growth, PPP (annual %) World Bank(2006)
Boix and Stokes(2003); Epstein etal. (2006); Fidr-muc (2003); Li andReuveny (2003);Muller (1995); Ross(2008)
GDP p.c.,PPP
GDP per capita, PPP (currentinternational $)
World Bank(2006)
Acemoglu et al.(2008a); Boix andStokes (2003); Cren-shaw (1995); Epsteinet al. (2006); Gled-itsch and Ward(2006); Muller(1995); Nieswiadomyand Strazicich(2004), Ross (2008)
Globalization KOF Index of Globalization Dreher (2006) This paperIncome taxes Taxes on income, profits and
capital gains (% of total taxes)World Bank(2006)
Ross (2001)
Industry em-ployment, fe-male
Employees, industry, female (%of female employment)
World Bank(2006)
Ross (2001)
Industry em-ployment,male
Employees, industry, male (%of male employment)
World Bank(2006)
Ross (2001)
Inequality Industrial pay-inequality basedon UNIDO’s database of pay-ments
UTIP (2001) Barro (1999); Cren-shaw (1995)
Infant mortal-ity
Mortality rate, infant (per 1,000live births)
World Bank(2006)
Barro (1999);Nieswiadomy andStrazcich (2004)
continued on next page...
15
Variable Definition Source Proposed by
Inflation Inflation, GDP deflator (annual%)
World Bank(2006)
Li and Reuveny(2003)
IO score Highest democracy score of par-ticipated International Organi-zation, calculated as averageacross all members’ Polity IVscore excluding the own value
Pevehouse(2002a,b)
Pevehouse (2002a,b)
IO score,change
First difference of IO score (seeabove)
Pevehouse(2002a,b)
Pevehouse (2002a,b)
Land area Land area (hectares) World Bank(2006)
Lopez-Cordova andMeissner (2008)
Latin America Dummy variable for LatinAmerican countries
Easterly andSewadeh (2001)
Lopez-Cordova andMeissner (2008)
Life ex-pectancy
Life expectancy at birth, total(years)
World Bank(2006)
Barro (1999); Clagueet al. (2001);Nieswiadomy andStrazcich (2004);Ross (2001)
Literacy Literacy rate, adult total (ages15 and above)
World Bank(2006)
Clague et al. (2001)
Metal exports Ores and metals exports (% ofmerchandise exports)
World Bank(2006)
Crenshaw (1995);Ross (2001)
Middle East Dummy for Countries from theMiddle East
Easterly andSewadeh (2001)
Li and Reuveny(2003)
Military ex-penditure
Military expenditure (% ofGDP)
World Bank(2006)
Ross (2001)
Militaryleader
Executive leader is a formermilitary officer
Gandhi andPrzeworski(2006)
Cheibub (2006)
Military per-sonnel
Military personnel, total World Bank(2006)
Crenshaw (1995);Ross (2001)
Muslim share Share of Muslim population Przeworski etal. (2000)
Barro (1999); Boixand Stokes (2003);Clague et al. (2001);Muller (1995) ; Ross(2001, 2008)
continued on next page...
16
Variable Definition Source Proposed by
Neighboringdemocracies
Share of surrounding democra-cies
Own calcula-tions
Gleditsch and Ward(2006); Pevehouse(2002a)
Number ofpast transi-tions
Number of previous transitionsbetween autocracy/democracy
Przeworski etal. (2000)
Boix and Stokes(2003)
OECD mem-ber
Dummy variable for OECDmembership
OECD (2008) Ross (2001)
Oil exporter Dummy variable if exports of oilexceed 50%
Easterly andSewadeh (2001)
Barro (1999); Lopez-Cordova and Meiss-ner (2008)
Oil rents, p.c.(log)
log of value of oil and gasproduction, minus the country-specific extraction costs, di-vided by the country’s midyearpopulation
Ross (2008) Ross (2008)
OPEC mem-ber
Dummy variable for OPECmembership
OPEC (2008) Nieswiadomy andStrazcich (2004)
Openness Trade (% of GDP) World Bank(2006)
Epstein et al.(2006); Li andReuveny (2003);Lopez-Cordova andMeissner (2008)
Population(log)
log of total population World Bank(2006)
Acemoglu et al.(2008a); Barro(1999); Lopez-Cordova andMeissner (2008);Nieswiadomy andStrazcich (2004)
Populationshare 0-14
Population ages 0-14 (% of to-tal)
World Bank(2006)
Acemoglu et al.(2008a)
Populationshare 15-64
Population ages 15-64 (% of to-tal)
World Bank(2006)
Acemoglu et al.(2008a)
Populationshare 65+
Population ages 65 and above(% of total)
World Bank(2006)
Acemoglu et al.(2008a)
Portfolioinvestment
Portfolio investment, excludingLCFAR (BoP, current US$)
World Bank(2006)
Li and Reuveny(2003)
Portuguesecolony
1 if ever in colonial relationshipwith Portugal
CEPII (2006) Barro (1999)
continued on next page...
17
Variable Definition Source Proposed by
Portuguesespeaking
1 if Portuguese first language ofat least 9% of the population
CEPII (2006) Clague et al. (2001)
Service em-ployment,female
Employees, services, female (%of female employment)
World Bank(2006)
Ross (2001)
Service em-ployment,male
Employees, services, male (% ofmale employment)
World Bank(2006)
Ross (2001)
Settler mortal-ity (log)
log of historical mortality ratesof potential European settlers
Acemogluand Robinson(2006)
Acemoglu andRobinson (2006)
Socialist 1 if present or former socialistcountry
Easterly andSewadeh (2001)
Muller (1995)
Spanishcolony
1 if ever in colonial relationshipwith Spain
CEPII (2006) Barro (1999)
Spanishspeaking
1 if Spanish first language of atleast 9% of the population
CEPII (2006) Clague et al. (2001)
Tax revenue Tax revenue (% of GDP) World Bank(2006)
Ross (2001)
Telephonemainlines
Telephone mainlines (per 1,000people)
World Bank(2006)
Ross (2001)
TV sets Television sets (per 1,000 peo-ple)
World Bank(2006)
Ross (2001)
U.K. colony 1 if ever in colonial relationshipwith United Kingdom
CEPII (2006) Barro (1999); Boixand Stokes (2003);Clague et al. (2001);Crenshaw (1995)
Urban popula-tion
Urban population (% of total) World Bank(2006)
Barro (1999); Ep-stein et al. (2006);Nieswiadomy andStrazcich (2004);Ross (2001)
World democ-racy
Global share of democracies Own calcula-tions
Boix and Stokes(2003); Gleditschand Ward (2006)
4 Results
The results of our empirical analysis are summarized in Tables 2 and 3 as well as Tables
6 and 7 in the Appendix. They read as follows: Median Beta gives the median coefficient
estimate over all regressions of the coefficient for each variable (when included in the F
18
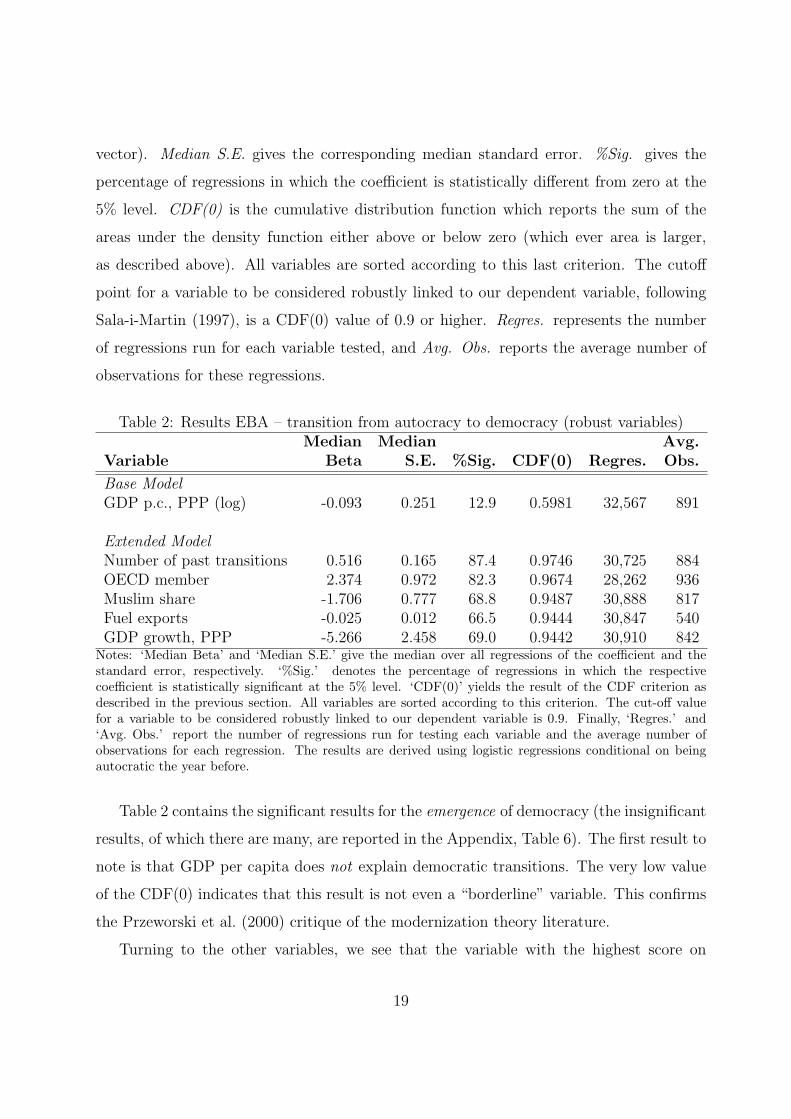
vector). Median S.E. gives the corresponding median standard error. %Sig. gives the
percentage of regressions in which the coefficient is statistically different from zero at the
5% level. CDF(0) is the cumulative distribution function which reports the sum of the
areas under the density function either above or below zero (which ever area is larger,
as described above). All variables are sorted according to this last criterion. The cutoff
point for a variable to be considered robustly linked to our dependent variable, following
Sala-i-Martin (1997), is a CDF(0) value of 0.9 or higher. Regres. represents the number
of regressions run for each variable tested, and Avg. Obs. reports the average number of
observations for these regressions.
Table 2: Results EBA – transition from autocracy to democracy (robust variables)Median Median Avg.
Variable Beta S.E. %Sig. CDF(0) Regres. Obs.
Base ModelGDP p.c., PPP (log) -0.093 0.251 12.9 0.5981 32,567 891
Extended ModelNumber of past transitions 0.516 0.165 87.4 0.9746 30,725 884OECD member 2.374 0.972 82.3 0.9674 28,262 936Muslim share -1.706 0.777 68.8 0.9487 30,888 817Fuel exports -0.025 0.012 66.5 0.9444 30,847 540GDP growth, PPP -5.266 2.458 69.0 0.9442 30,910 842
Notes: ‘Median Beta’ and ‘Median S.E.’ give the median over all regressions of the coefficient and thestandard error, respectively. ‘%Sig.’ denotes the percentage of regressions in which the respectivecoefficient is statistically significant at the 5% level. ‘CDF(0)’ yields the result of the CDF criterion asdescribed in the previous section. All variables are sorted according to this criterion. The cut-off valuefor a variable to be considered robustly linked to our dependent variable is 0.9. Finally, ‘Regres.’ and‘Avg. Obs.’ report the number of regressions run for testing each variable and the average number ofobservations for each regression. The results are derived using logistic regressions conditional on beingautocratic the year before.
Table 2 contains the significant results for the emergence of democracy (the insignificant
results, of which there are many, are reported in the Appendix, Table 6). The first result to
note is that GDP per capita does not explain democratic transitions. The very low value
of the CDF(0) indicates that this result is not even a “borderline” variable. This confirms
the Przeworski et al. (2000) critique of the modernization theory literature.
Turning to the other variables, we see that the variable with the highest score on
19

the CDF criterion is the number of previous transitions. Having had past experience
with regime transitions increases the probability of democracy emerging again. One could
interpret this as a learning effect.
Being an OECD member also increases the likelihood of a change towards a democracy.
We include this variable following Ross (2001) and confirm his finding. It also confirms
Pevehouse’s (2002a,b) idea that membership in democratic international organizations in-
creases the probability of a transition to democracy. The OECD result could certainly be
endogenous or due to reverse causality. In principle, the OECD requires members to be
democracies. Clearly, however, this has not always been the case. There are five cases
in which OECD members experienced a transition to democracy: Greece 1974, Portugal
1976, Spain 1977, Turkey 1983 and Mexico 2000. Considering that transitions to democ-
racy are not common (there are 79 of them in the data), this number is notable. Now,
it is possible that these countries were admitted to the OECD because democracy was on
the horizon. Yet, Greece, Portugal, Spain, and Turkey were all founding members in 1961,
many years before transiting to democracy; and Mexico joined in 1994 before making the
electoral reforms (in 1997) that helped bring about a change in the incumbent party. The
OECD espouses democracy explicitly, and members pressure one another to follow demo-
cratic values. So the incentive effect of regional international organizations described by
Pevehouse (2002a,b) is also a plausible explanation for the correlation (though we note that
Pevehouse himself did not focus on the OECD as it is not, strictly speaking, regional – the
variable was originally proposed by Ross 2001). We thus caution readers that future case
study research would be required to examine whether this correlation is driven by reverse
causality or if the OECD actually has an influence in bringing about democratic transi-
tions. For now we underscore that this is one of very few robust effects on the emergence
of democracies and that it holds even if one accounts for level of economic development.
We next find that democratic transitions are less likely in Islamic countries, as measured
by the (time-invariant) percentage of the population that is Muslim. We are not convinced
from this finding that Islam is incompatible with democracy.13 Turkey is a notable example.
One possibility is that several Muslim countries are fuel exporters. We find the larger the
13As argued, e.g., by Borooah and Paldam (2007).
20

share of fuel exports, the less likely a country is to become a democracy. This is in part
driven by the Arabic oil-producing countries which all have long non-democratic traditions.
The finding is consistent with the resource-curse literature (e.g., Ross 2001, 2008; Jensen
and Wantchekon 2004). Note that we used three alternative measures to account for fuel
producing countries. Besides the two standard measures (the share of fuel in merchandise
exports and a dummy for an export share above 50%) we use a newly developed oil rent
variable which is defined as (log of) value of oil and gas production, minus the country-
specific extraction costs, divided by the country’s midyear population (see Ross 2008).
The share of Muslims and fuel exports findings require further investigation, which we
undertake below.
The final variable fulfilling the CDF criterion is annual GDP growth. Countries that
perform better economically are less likely to see democracy emerge. In good times, the
“need” for a change might not be felt in the population, and autocratic rulers can justify
their position. This may seem intuitive, but it defies a basic idea in modernization theory
that as a country develops, democracy should become more likely. Economic growth is
good for the survival of dictatorships. No other variable tested passes the CDF criterion
(see Appendix Table 6).
Table 3 presents the significant results for the survival of democracy. (Again, insignifi-
cant results, of which there are many, are presented in the Appendix, Table 7.)
GDP per capita plays a central role. Richer countries are more likely to remain democ-
racies. This confirms the findings in the previous literature. It is perhaps the most agreed
upon finding in the literature, and we confirm the consensus. Development is good for the
survival of democracy.
Of the remaining variables, we find that having a (former) military leader as the current
chief executive to have the strongest performance according to the CDF criterion. The
result implies that democracies that have a leader with a military background have a lower
probability of sustaining a democracy. This confirms the argument of Cheibub (2006).14
The next strongest performer is the neighboring democracy variable. This indicates
that there are positive spillover effects from democracies as the probability of remaining a
14For a formal argument as to why, see Acemoglu et al. (2008b).
21
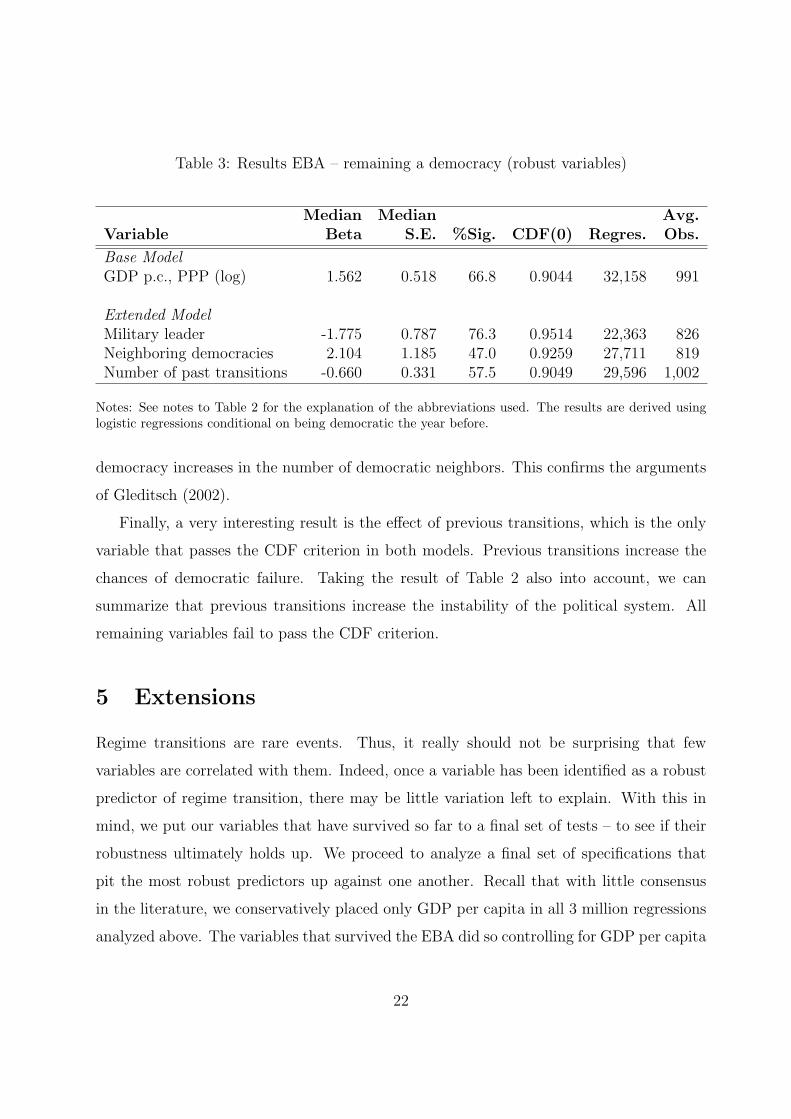
Table 3: Results EBA – remaining a democracy (robust variables)
Median Median Avg.Variable Beta S.E. %Sig. CDF(0) Regres. Obs.
Base ModelGDP p.c., PPP (log) 1.562 0.518 66.8 0.9044 32,158 991
Extended ModelMilitary leader -1.775 0.787 76.3 0.9514 22,363 826Neighboring democracies 2.104 1.185 47.0 0.9259 27,711 819Number of past transitions -0.660 0.331 57.5 0.9049 29,596 1,002
Notes: See notes to Table 2 for the explanation of the abbreviations used. The results are derived usinglogistic regressions conditional on being democratic the year before.
democracy increases in the number of democratic neighbors. This confirms the arguments
of Gleditsch (2002).
Finally, a very interesting result is the effect of previous transitions, which is the only
variable that passes the CDF criterion in both models. Previous transitions increase the
chances of democratic failure. Taking the result of Table 2 also into account, we can
summarize that previous transitions increase the instability of the political system. All
remaining variables fail to pass the CDF criterion.
5 Extensions
Regime transitions are rare events. Thus, it really should not be surprising that few
variables are correlated with them. Indeed, once a variable has been identified as a robust
predictor of regime transition, there may be little variation left to explain. With this in
mind, we put our variables that have survived so far to a final set of tests – to see if their
robustness ultimately holds up. We proceed to analyze a final set of specifications that
pit the most robust predictors up against one another. Recall that with little consensus
in the literature, we conservatively placed only GDP per capita in all 3 million regressions
analyzed above. The variables that survived the EBA did so controlling for GDP per capita
22
and up to only three other variables at a time. This was already too much for most of the
variables we considered, so all of the variables that have survived so far are noteworthy. But
with little variation to explain, it is not obvious that the surviving variables will survive
when pitted exclusively against one another. So far, they have faced each other directly
in only a handful of literally thousands of specifications, and the precise results have not
been checked. We do this below. The results are presented in Tables 4 and 5.
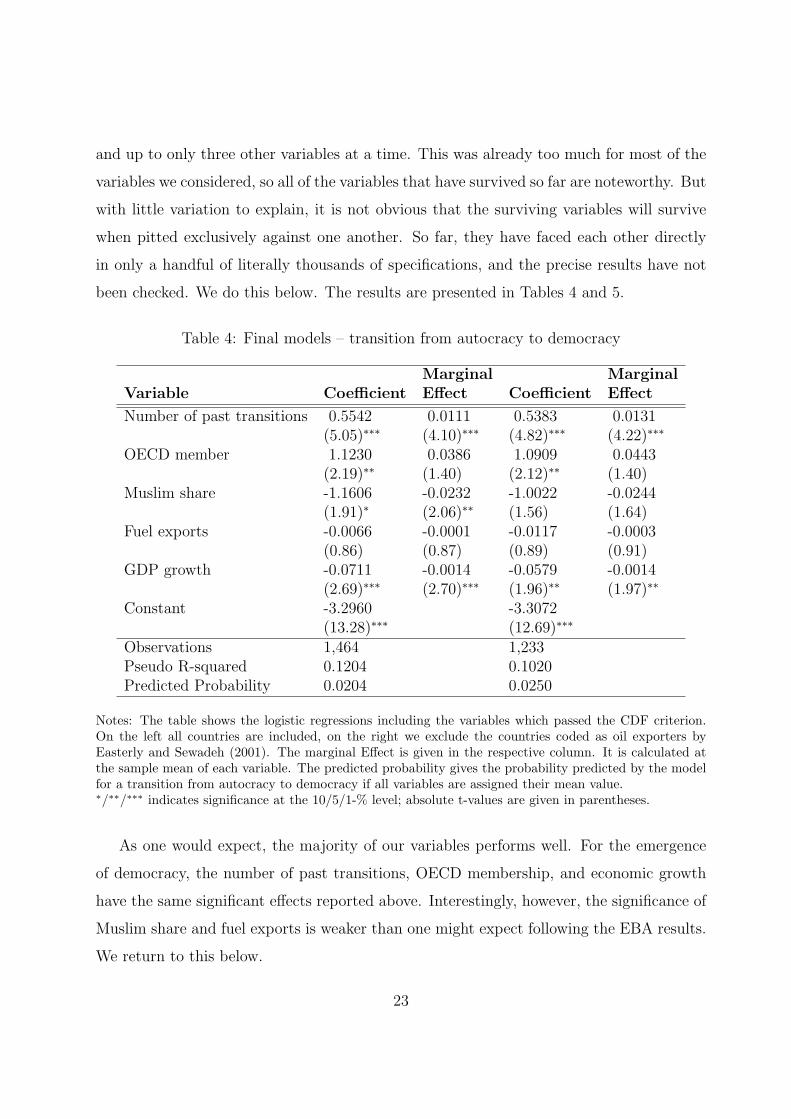
Table 4: Final models – transition from autocracy to democracy
Marginal MarginalVariable Coefficient Effect Coefficient Effect
Number of past transitions 0.5542 0.0111 0.5383 0.0131(5.05)∗∗∗ (4.10)∗∗∗ (4.82)∗∗∗ (4.22)∗∗∗
OECD member 1.1230 0.0386 1.0909 0.0443(2.19)∗∗ (1.40) (2.12)∗∗ (1.40)
Muslim share -1.1606 -0.0232 -1.0022 -0.0244(1.91)∗ (2.06)∗∗ (1.56) (1.64)
Fuel exports -0.0066 -0.0001 -0.0117 -0.0003(0.86) (0.87) (0.89) (0.91)
GDP growth -0.0711 -0.0014 -0.0579 -0.0014(2.69)∗∗∗ (2.70)∗∗∗ (1.96)∗∗ (1.97)∗∗
Constant -3.2960 -3.3072(13.28)∗∗∗ (12.69)∗∗∗
Observations 1,464 1,233Pseudo R-squared 0.1204 0.1020Predicted Probability 0.0204 0.0250
Notes: The table shows the logistic regressions including the variables which passed the CDF criterion.On the left all countries are included, on the right we exclude the countries coded as oil exporters byEasterly and Sewadeh (2001). The marginal Effect is given in the respective column. It is calculated atthe sample mean of each variable. The predicted probability gives the probability predicted by the modelfor a transition from autocracy to democracy if all variables are assigned their mean value.∗/∗∗/∗∗∗ indicates significance at the 10/5/1-% level; absolute t-values are given in parentheses.
As one would expect, the majority of our variables performs well. For the emergence
of democracy, the number of past transitions, OECD membership, and economic growth
have the same significant effects reported above. Interestingly, however, the significance of
Muslim share and fuel exports is weaker than one might expect following the EBA results.
We return to this below.
23
As for the marginal effects, they are weak but understandable. Our model predicts that
the baseline probability of a democratic transition is only 2% holding all our explanatory
variables to their mean values.15 Given this low probability, it is actually quite remark-
able that each additional prior transition increases this chance by roughly 1%, while each
percentage point of GDP growth reduces this probability by roughly 0.1%.
Now, to test whether our finding for the share of the population that is Muslim is really
driven by oil, we re-analyze our final model excluding countries classified as oil exporters
according to Easterly and Sewadeh (2001).16 The result is presented on the right hand
side of Table 4. We see that upon the exclusion of primary oil exporters the result for the
Muslim share vanishes while all other results remain almost unchanged. We conclude that
the Islam finding is actually driven by the coincidence of oil and Islam or some other fixed
effect of these countries.
Regarding the survival of democracy, only GDP per capita and the number of past
transitions have the expected significant effects, while military leader and neighboring
democracy do not. So what is going on here?
The effect of military leader turns out to depend on three cases in our estimation sample
where democracy breaks down under a chief executive who is a former military leader.17
The variable survives EBA analysis, but does not survive a particular specification which
includes the number of past transitions (of course, number of past transitions was included
in some of the regressions of the EBA, but not all). The reason for this is quite easy to see
when one scrutinizes the data. Number of past transitions explains all three of the cases
that military leader explains, and also explains further cases.18
With neighboring democracy, the results also appear to be disappointing at first. Recall
15The unconditional transition probability in our sample is 2.1%.16In the sample of our final model these are: Algeria, Bahrain, Gabon, Indonesia, Iran, Kuwait, Nigeria,
Oman, Saudi Arabia, United Arab Emirates. Note that Easterly and Sewadeh classify countries as oilexporters if more than 50% of total exports of goods and services come from fuels (to be precise, fuelslisted under the Standard International Trade Classification category 3 – mineral fuels, lubricants andrelated materials), so the remaining countries include some that have positive oil exports. Hence we caninclude our fuel exports variable.
17The cases are Guatemala 1982, Thailand 1991, and Sierra Leone 1997.18Democracy breaks down when sum of past transitions is greater than 0 in nine cases: Argentina 1976,
Pakistan 1977, Ghana 1981, Guatemala 1982, Nigeria 1983, Sudan 1989, Peru 1990, Thailand 1991, andSierra Leone 1997.
24
from Table 3 that while most of the mass of the cumulative distribution function, CDF(0), is
positive (0.9259), the coefficient is significant at the 5% level in only 47% of the regressions
analyzed. So, for about half of the regressions, neighboring democracy is not significant
at conventional levels. It turns out that the specifications that include military leader are
among those where neighboring democracy is not significant. Nevertheless, we still consider
this variable to be among the more robust determinants of the survival of democracy.
Indeed, when we remove the military leader variable (which itself is not significant in the
presence of the number of transitions variable), neighboring democracy obtains a positive
significant effect.
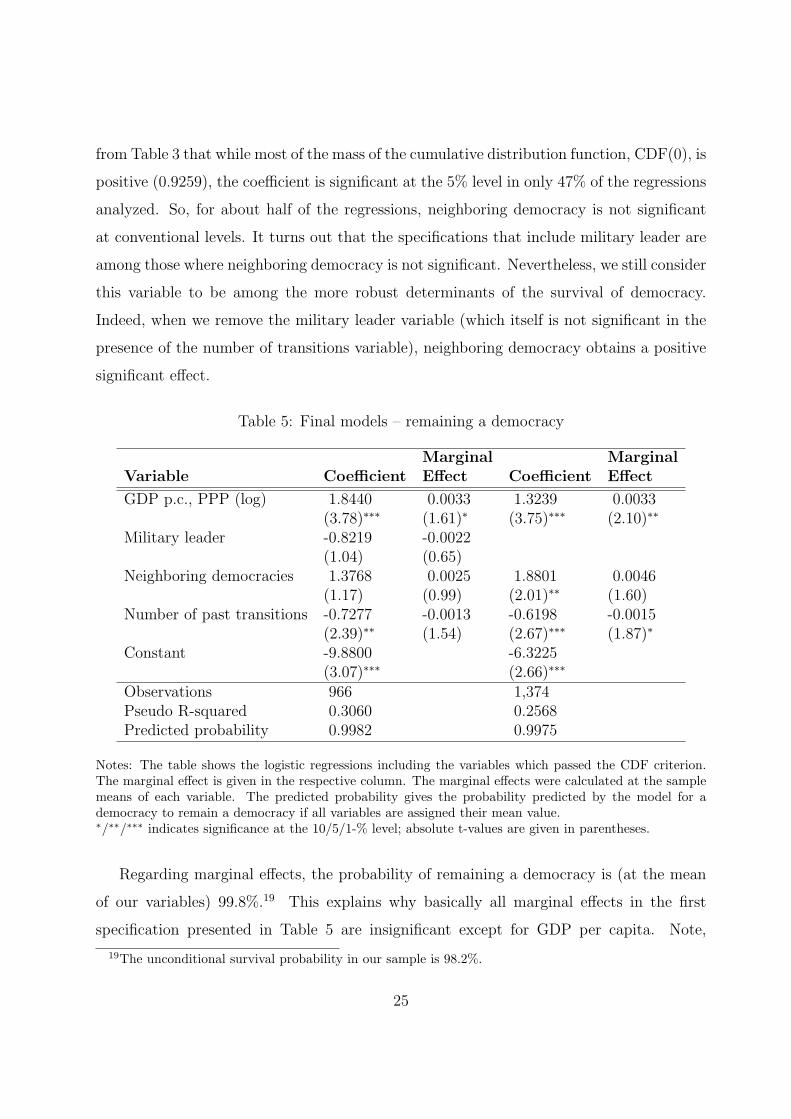
Table 5: Final models – remaining a democracy
Marginal MarginalVariable Coefficient Effect Coefficient Effect
GDP p.c., PPP (log) 1.8440 0.0033 1.3239 0.0033(3.78)∗∗∗ (1.61)∗ (3.75)∗∗∗ (2.10)∗∗
Military leader -0.8219 -0.0022(1.04) (0.65)
Neighboring democracies 1.3768 0.0025 1.8801 0.0046(1.17) (0.99) (2.01)∗∗ (1.60)
Number of past transitions -0.7277 -0.0013 -0.6198 -0.0015(2.39)∗∗ (1.54) (2.67)∗∗∗ (1.87)∗
Constant -9.8800 -6.3225(3.07)∗∗∗ (2.66)∗∗∗
Observations 966 1,374Pseudo R-squared 0.3060 0.2568Predicted probability 0.9982 0.9975
Notes: The table shows the logistic regressions including the variables which passed the CDF criterion.The marginal effect is given in the respective column. The marginal effects were calculated at the samplemeans of each variable. The predicted probability gives the probability predicted by the model for ademocracy to remain a democracy if all variables are assigned their mean value.∗/∗∗/∗∗∗ indicates significance at the 10/5/1-% level; absolute t-values are given in parentheses.
Regarding marginal effects, the probability of remaining a democracy is (at the mean
of our variables) 99.8%.19 This explains why basically all marginal effects in the first
specification presented in Table 5 are insignificant except for GDP per capita. Note,
19The unconditional survival probability in our sample is 98.2%.
25

however, that once the military leader variable is removed from the specification, the
marginal effects for all variables become more significant (the weakest is the effect of
neighboring democracies, which is borderline significant at the 0.10 level). Considering
the rarity of democracy breakdowns, we are most impressed by the significance of these
marginal effects.
Looming large over what we have done here, however, is precisely the question of rare
events. Although ignored, as far as we know, by the transitions literature, there remains
the issue of whether the analysis should be adjusted because regime transitions are rare
events. As shown by King and Zeng (2001), using standard logit regressions in such
a setting might lead to an estimation bias. To check the robustness of our results we
analyze our final model specifications using the implementation of the rare events logistic
regression module provided by Tomz et al. (1999). It turns out that our findings do
not depend on the estimator we employ. Using the rare events estimator, our predicted
probability of a transition from autocracy to democracy changes from 2.04% to 2.21%,
and significance levels of the effects of the individual variables are not affected. For the
survival of democracy, the probability changes from 99.82% to 99.74%, and – again – the
significance levels of the effects of the individual variables are not affected. These results
are available on request.
6 Conclusions
We consider 59 variables that have been proposed as determinants of democracy. Using
dynamic logit regressions in combination with the extreme bounds analysis, we test the
robustness of these factors as determinants of both the emergence and survival of democ-
racy, which we define, following Schumpeter (1942) as the political system that determines
leadership through contested elections.
We find a humbling result: only five variables robustly determine the emergence of
democracy while just four are reliable predictors of the survival of democracy. Remarkably,
they are distinctly different. One central variable proposed is GDP per capita. Contrary
to modernization theory, we find that richer countries are not more likely to become demo-
26
cratic. They are, however, more likely to remain democracies. Both findings are in line
with Przeworski et al. (2000). The other key finding is that previous political transitions
facilitate future changes. This finding explains the frequent changes in the political land-
scape of Latin America. We find that previous transitions on the one hand increase the
likelihood of a move towards democratization but on the other hand reduce the survival
probability. Learning cuts both ways: people learn how to set up democracy but also how
to subvert it (Przeworski et al. 2000). We have an interesting finding for economic growth:
it makes dictatorships more likely to survive and lowers the chances for democracy to
emerge. This stands in contrast to modernization theory. Instead, association with other
democracies in the OECD appears to have facilitated democratic transitions (we caution
readers that causality may run in the other direction with respect to this finding, but we
do find the incentive effect that international organizations may provide, as described by
Pevehouse 2002a,b, to be a plausible explanation for the correlation). Having democracies
as neighboring countries also increases the chances that democracy survives. The addi-
tional variables that may help to explain democratic transitions are not quite as robust:
Muslim share and fuel export share (which lower the probability of democracy emerging),
and having a former military leader as the chief executive (which lowers the survival rate
of democracy). The most dubious of these appears to be Muslim share, whose effect dis-
appears when oil producing countries are removed from the sample. The military leader
finding is highly co-linear with the number of past transitions findings, so, while it may
have an effect, the past transitions variable trumps it.
Our standard of robustness is a strong one: a version of Leamer’s (1983) extreme bounds
analysis. Other variables that we test may be significant in specific theoretical models, but
they do not survive the rigors of our tests. This does not imply that they are unimportant,
but it does imply that the variables that do survive may be the most important factors on
which to base policy, since we can be most certain of their effects.
So what policy conclusions we can draw from our analysis? First of all, regime tran-
sitions are rare, and most policies variables do not have a robustly systematic impact.
Indeed, most of the handful of variables we do find significant are beyond the control of
policymakers. Yet, international organizations and Western countries often want to sup-
27
port democratization processes around the world. Our results imply that giving aid or
other forms of transfers in order to increase a country’s wealth might not be a good idea
prior to a democratic transition. Only after a country democracy has been established can
such assistance be beneficial for the promotion of democracy. Efforts may be best spent
by targeting poor democracies. Short-term growth, however, is not the solution. Only
sustained development can help democracy survive. This calls for a serious commitment
to poor democracies. Transfers should be designed to help make the payoffs for complying
with the rules of democracy more lucrative than the payoffs from subverting the regime.
28
Appendix
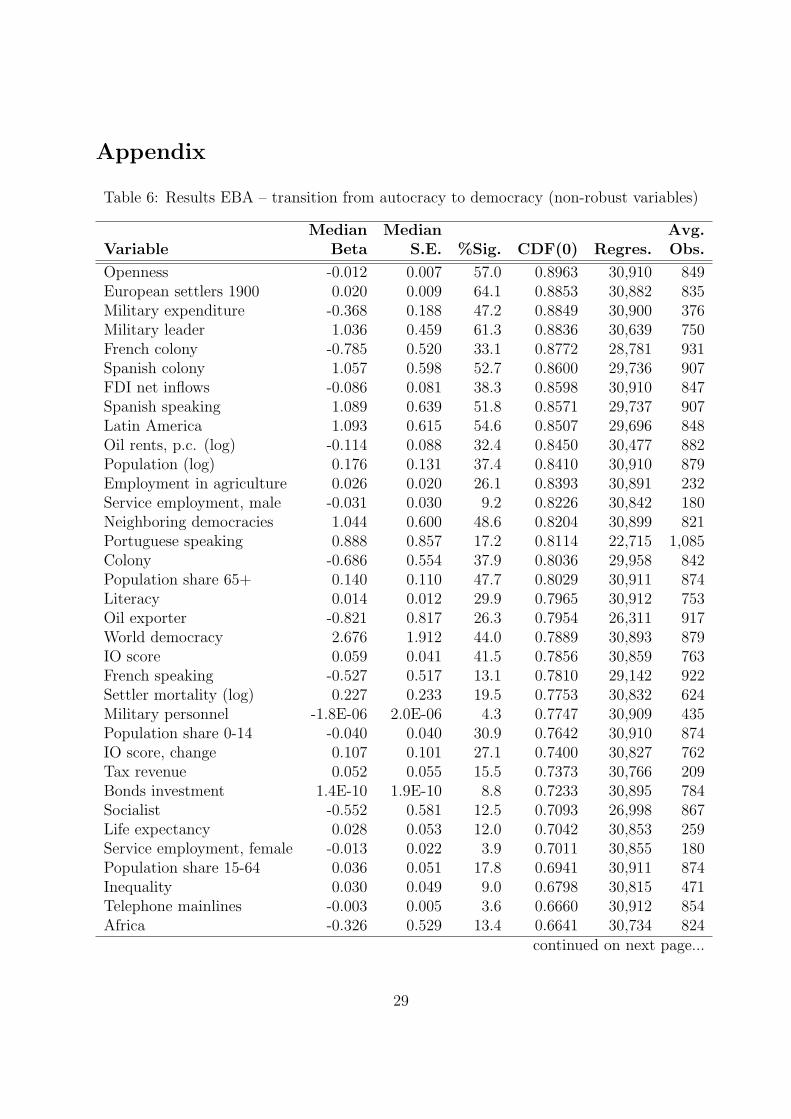
Table 6: Results EBA – transition from autocracy to democracy (non-robust variables)
Median Median Avg.Variable Beta S.E. %Sig. CDF(0) Regres. Obs.
Openness -0.012 0.007 57.0 0.8963 30,910 849European settlers 1900 0.020 0.009 64.1 0.8853 30,882 835Military expenditure -0.368 0.188 47.2 0.8849 30,900 376Military leader 1.036 0.459 61.3 0.8836 30,639 750French colony -0.785 0.520 33.1 0.8772 28,781 931Spanish colony 1.057 0.598 52.7 0.8600 29,736 907FDI net inflows -0.086 0.081 38.3 0.8598 30,910 847Spanish speaking 1.089 0.639 51.8 0.8571 29,737 907Latin America 1.093 0.615 54.6 0.8507 29,696 848Oil rents, p.c. (log) -0.114 0.088 32.4 0.8450 30,477 882Population (log) 0.176 0.131 37.4 0.8410 30,910 879Employment in agriculture 0.026 0.020 26.1 0.8393 30,891 232Service employment, male -0.031 0.030 9.2 0.8226 30,842 180Neighboring democracies 1.044 0.600 48.6 0.8204 30,899 821Portuguese speaking 0.888 0.857 17.2 0.8114 22,715 1,085Colony -0.686 0.554 37.9 0.8036 29,958 842Population share 65+ 0.140 0.110 47.7 0.8029 30,911 874Literacy 0.014 0.012 29.9 0.7965 30,912 753Oil exporter -0.821 0.817 26.3 0.7954 26,311 917World democracy 2.676 1.912 44.0 0.7889 30,893 879IO score 0.059 0.041 41.5 0.7856 30,859 763French speaking -0.527 0.517 13.1 0.7810 29,142 922Settler mortality (log) 0.227 0.233 19.5 0.7753 30,832 624Military personnel -1.8E-06 2.0E-06 4.3 0.7747 30,909 435Population share 0-14 -0.040 0.040 30.9 0.7642 30,910 874IO score, change 0.107 0.101 27.1 0.7400 30,827 762Tax revenue 0.052 0.055 15.5 0.7373 30,766 209Bonds investment 1.4E-10 1.9E-10 8.8 0.7233 30,895 784Socialist -0.552 0.581 12.5 0.7093 26,998 867Life expectancy 0.028 0.053 12.0 0.7042 30,853 259Service employment, female -0.013 0.022 3.9 0.7011 30,855 180Population share 15-64 0.036 0.051 17.8 0.6941 30,911 874Inequality 0.030 0.049 9.0 0.6798 30,815 471Telephone mainlines -0.003 0.005 3.6 0.6660 30,912 854Africa -0.326 0.529 13.4 0.6641 30,734 824
continued on next page...
29

Median Median Avg.Variable Beta S.E. %Sig. CDF(0) Regres. Obs.
Metal exports 0.006 0.012 3.5 0.6546 30,785 568Land area -7.7E-10 2.5E-09 3.6 0.6540 30,913 875U.K. colony -0.205 0.417 7.3 0.6292 30,807 882Portuguese colony 0.338 1.028 3.6 0.6289 22,122 1,091Infant mortality -0.006 0.019 0.4 0.6117 30,734 168Portfolio investment -2.9E-11 9.8E-11 0.0 0.6100 30,910 724Arable land 2.1E-09 1.4E-08 17.3 0.5995 30,913 875OPEC member -0.303 0.749 9.7 0.5994 26,439 983Income taxes 0.007 0.027 4.3 0.5957 30,768 207TV sets -0.001 0.003 3.5 0.5939 30,912 842Industry employment, female -0.010 0.039 0.1 0.5859 30,859 180Urban population 0.004 0.014 4.1 0.5822 30,913 868Middle East -0.171 0.594 1.8 0.5814 28,786 868Globalization -0.006 0.023 7.1 0.5793 30,899 719Industry employment, male -0.003 0.048 3.7 0.5412 30,843 180English speaking -0.048 0.418 2.9 0.5301 30,752 883Inflation -0.001 0.003 14.1 0.5163 30,892 862Equity investment 2.9E-11 2.0E-10 4.2 0.5051 30,883 814
Notes: See notes to Table 2 for the explanation of the abbreviations used. The results are derived usinglogistic regressions conditional on being autocratic the year before.
30
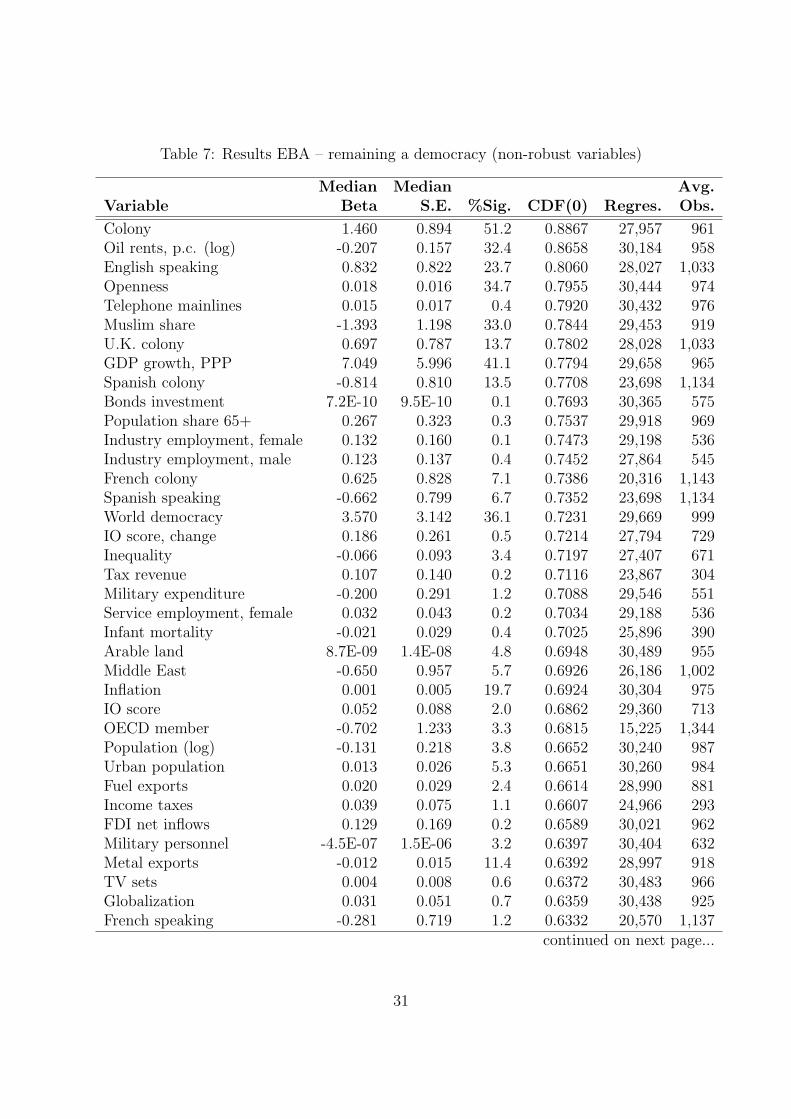
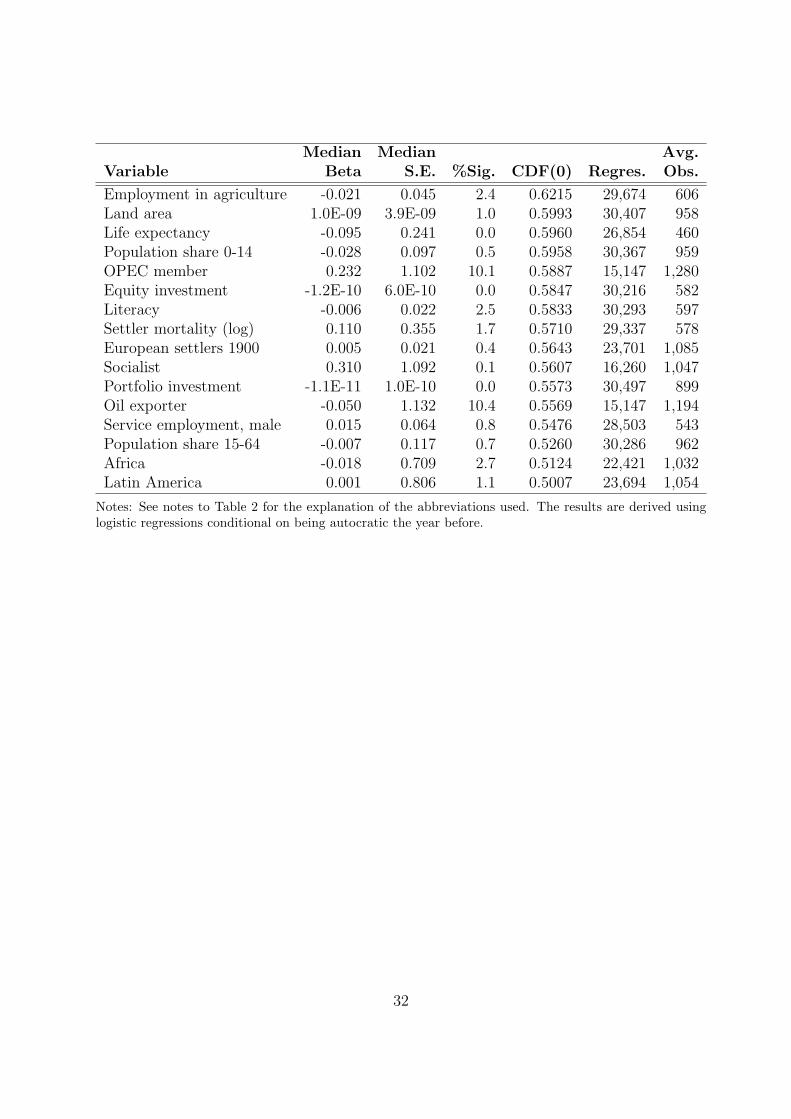
Table 7: Results EBA – remaining a democracy (non-robust variables)
Median Median Avg.Variable Beta S.E. %Sig. CDF(0) Regres. Obs.
Colony 1.460 0.894 51.2 0.8867 27,957 961Oil rents, p.c. (log) -0.207 0.157 32.4 0.8658 30,184 958English speaking 0.832 0.822 23.7 0.8060 28,027 1,033Openness 0.018 0.016 34.7 0.7955 30,444 974Telephone mainlines 0.015 0.017 0.4 0.7920 30,432 976Muslim share -1.393 1.198 33.0 0.7844 29,453 919U.K. colony 0.697 0.787 13.7 0.7802 28,028 1,033GDP growth, PPP 7.049 5.996 41.1 0.7794 29,658 965Spanish colony -0.814 0.810 13.5 0.7708 23,698 1,134Bonds investment 7.2E-10 9.5E-10 0.1 0.7693 30,365 575Population share 65+ 0.267 0.323 0.3 0.7537 29,918 969Industry employment, female 0.132 0.160 0.1 0.7473 29,198 536Industry employment, male 0.123 0.137 0.4 0.7452 27,864 545French colony 0.625 0.828 7.1 0.7386 20,316 1,143Spanish speaking -0.662 0.799 6.7 0.7352 23,698 1,134World democracy 3.570 3.142 36.1 0.7231 29,669 999IO score, change 0.186 0.261 0.5 0.7214 27,794 729Inequality -0.066 0.093 3.4 0.7197 27,407 671Tax revenue 0.107 0.140 0.2 0.7116 23,867 304Military expenditure -0.200 0.291 1.2 0.7088 29,546 551Service employment, female 0.032 0.043 0.2 0.7034 29,188 536Infant mortality -0.021 0.029 0.4 0.7025 25,896 390Arable land 8.7E-09 1.4E-08 4.8 0.6948 30,489 955Middle East -0.650 0.957 5.7 0.6926 26,186 1,002Inflation 0.001 0.005 19.7 0.6924 30,304 975IO score 0.052 0.088 2.0 0.6862 29,360 713OECD member -0.702 1.233 3.3 0.6815 15,225 1,344Population (log) -0.131 0.218 3.8 0.6652 30,240 987Urban population 0.013 0.026 5.3 0.6651 30,260 984Fuel exports 0.020 0.029 2.4 0.6614 28,990 881Income taxes 0.039 0.075 1.1 0.6607 24,966 293FDI net inflows 0.129 0.169 0.2 0.6589 30,021 962Military personnel -4.5E-07 1.5E-06 3.2 0.6397 30,404 632Metal exports -0.012 0.015 11.4 0.6392 28,997 918TV sets 0.004 0.008 0.6 0.6372 30,483 966Globalization 0.031 0.051 0.7 0.6359 30,438 925French speaking -0.281 0.719 1.2 0.6332 20,570 1,137
continued on next page...
31
Median Median Avg.Variable Beta S.E. %Sig. CDF(0) Regres. Obs.
Employment in agriculture -0.021 0.045 2.4 0.6215 29,674 606Land area 1.0E-09 3.9E-09 1.0 0.5993 30,407 958Life expectancy -0.095 0.241 0.0 0.5960 26,854 460Population share 0-14 -0.028 0.097 0.5 0.5958 30,367 959OPEC member 0.232 1.102 10.1 0.5887 15,147 1,280Equity investment -1.2E-10 6.0E-10 0.0 0.5847 30,216 582Literacy -0.006 0.022 2.5 0.5833 30,293 597Settler mortality (log) 0.110 0.355 1.7 0.5710 29,337 578European settlers 1900 0.005 0.021 0.4 0.5643 23,701 1,085Socialist 0.310 1.092 0.1 0.5607 16,260 1,047Portfolio investment -1.1E-11 1.0E-10 0.0 0.5573 30,497 899Oil exporter -0.050 1.132 10.4 0.5569 15,147 1,194Service employment, male 0.015 0.064 0.8 0.5476 28,503 543Population share 15-64 -0.007 0.117 0.7 0.5260 30,286 962Africa -0.018 0.709 2.7 0.5124 22,421 1,032Latin America 0.001 0.806 1.1 0.5007 23,694 1,054
Notes: See notes to Table 2 for the explanation of the abbreviations used. The results are derived usinglogistic regressions conditional on being autocratic the year before.
32
Tab
le8:
Sum
mar
yof
pre
vio
us
empir
ical
studie
son
the
det
erm
inan
tsof
dem
ocr
acy
Dem
ocr
acy
Au
thor
Per
iod
Cntr
.Ob
s.M
easu
reE
xp
lan
ator
yV
aria
ble
sE
ffec
tSig
.Met
hod
Cre
nsha
w19
8083
83B
olen
Dem
ocra
cyin
dex,
1965
∼-
OL
S(1
995)
Rea
lG
DP
p.c.
,lo
g+
++
Seco
ndar
ysc
hool
enro
llmen
t+
+B
riti
shco
lony
++
Mili
tary
pers
onne
l-
∼A
gric
ultu
ral
dens
ity,
log
++
Dem
ogra
phic
inhe
rita
nce
++
+A
gric
ultu
ral
ineq
ualit
y+
-In
com
ein
equa
lity,
1970
--
Sem
iper
iphe
rydu
mm
y-
+P
erip
hery
dum
my
--
Com
mod
ity
conc
entr
atio
n-
-Fo
reig
nca
pita
lpe
netr
atio
n,lo
g+
-
Mul
ler
(199
5)19
8058
58B
olen
Dem
ocra
cyin
dex,
1965
+∼
OL
SR
eal
GD
Pp.
c.,
log
++
+re
ject
non-
linea
rG
DP
grow
th+
-re
lati
onsh
ipof
Inco
me
ineq
ualit
y-
+G
DP
Top
20%
inco
me
shar
e-
++
Com
mun
ist
dum
my
-+
Bri
tish
colo
ny+
++
Pro
test
ant
shar
e-
-M
uslim
shar
e-
-Y
ears
ofco
ntin
uous
popu
lar
elec
tion
s,lo
g+
-co
ntin
ued
onne
xtpa
ge...
33
Dem
ocr
acy
Au
thor
Per
iod
Cntr
.Ob
s.M
easu
reE
xp
lan
ator
yV
aria
ble
sE
ffec
tSig
.Met
hod
Bar
ro(1
999)
1960
-199
510
310
3Fr
eedo
m5-
year
lag
ofde
pend
ent
vari
able
++
+SU
RH
ouse
10-y
ear
lag
ofde
pend
ent
vari
able
++
GD
P,lo
g+
++
Bol
len
Yea
rsof
prim
ary
scho
olin
g+
+G
apbe
twee
nm
ale
and
fem
ale
prim
ary
-+
+U
rban
popu
lati
on-
+P
opul
atio
n,lo
g+
∼O
ilco
untr
ydu
mm
y-
++
Life
expe
ctan
cyat
birt
h,lo
g+
-In
fant
mor
talit
yra
te-
-Y
ears
ofup
per
scho
olin
g-
-In
com
ein
equa
lity
--
Shar
eof
mid
dle
clas
sin
inco
me
+-
Edu
cati
onal
ineq
ualit
y-
-E
thno
lingu
isti
cfr
acti
onal
izat
ion
-+
Rul
e-of
-law
inde
x+
-Fo
rmer
colo
ny-
-B
riti
shco
lony
--
Fren
chco
lony
--
Span
ish
colo
ny+
-P
ortu
gues
eco
lony
+-
Dum
my
for
othe
rco
lony
--
Mus
limsh
are
--
Pro
test
ant
shar
e+
-H
indu
shar
e+
-B
uddh
ist
shar
e+
-M
isce
llane
ous
east
ern
relig
ion
shar
e-
-Je
wis
hsh
are
+-
Non
relig
ion
shar
e-
+O
ther
relig
ion
shar
e-
-co
ntin
ued
onne
xtpa
ge...
34
Dem
ocr
acy
Au
thor
Per
iod
Cntr
.Ob
s.M
easu
reE
xp
lan
ator
yV
aria
ble
sE
ffec
tSig
.Met
hod
Ros
s(2
001)
1971
-199
711
32,
183P
olit
yIV
Oil
(exp
ort
valu
e)-
++
pool
edO
LS
Min
eral
s(e
xpor
tva
lue)
-+
+G
DP
++
+M
uslim
shar
e-
++
OE
CD
dum
my
++
+Fo
od(e
xpor
tva
lue)
++
Agr
icul
ture
(exp
ort
valu
e)+
-L
arge
stat
es+
+M
idea
st-
++
Sub-
Saha
ran
Afr
ica
-+
+A
rabi
anP
enin
sula
-+
+T
axes
++
+G
over
nmen
tco
nsum
ptio
n-
++
Gov
ernm
ent/
GD
P-
++
Mili
tary
expe
ndit
ure
--
Mili
tary
pers
onne
l-
+E
thni
cte
nsio
ns-
-In
dust
ryem
ploy
men
t,m
ale
++
+In
dust
ryem
ploy
men
t,fe
mal
e+
++
Serv
ices
empl
oym
ent,
mal
e+
++
Serv
ices
empl
oym
ent,
fem
ale
-+
+Se
cond
ary
enro
llmen
t,m
ale
+-
Seco
ndar
yen
rollm
ent,
fem
ale
+-
Ter
tiar
yen
rollm
ent
--
Tel
epho
nem
ainl
ines
-+
+T
Vse
ts-
-L
ifeex
pect
ancy
+-
Urb
anpo
pula
tion
--
cont
inue
don
next
page
...
35
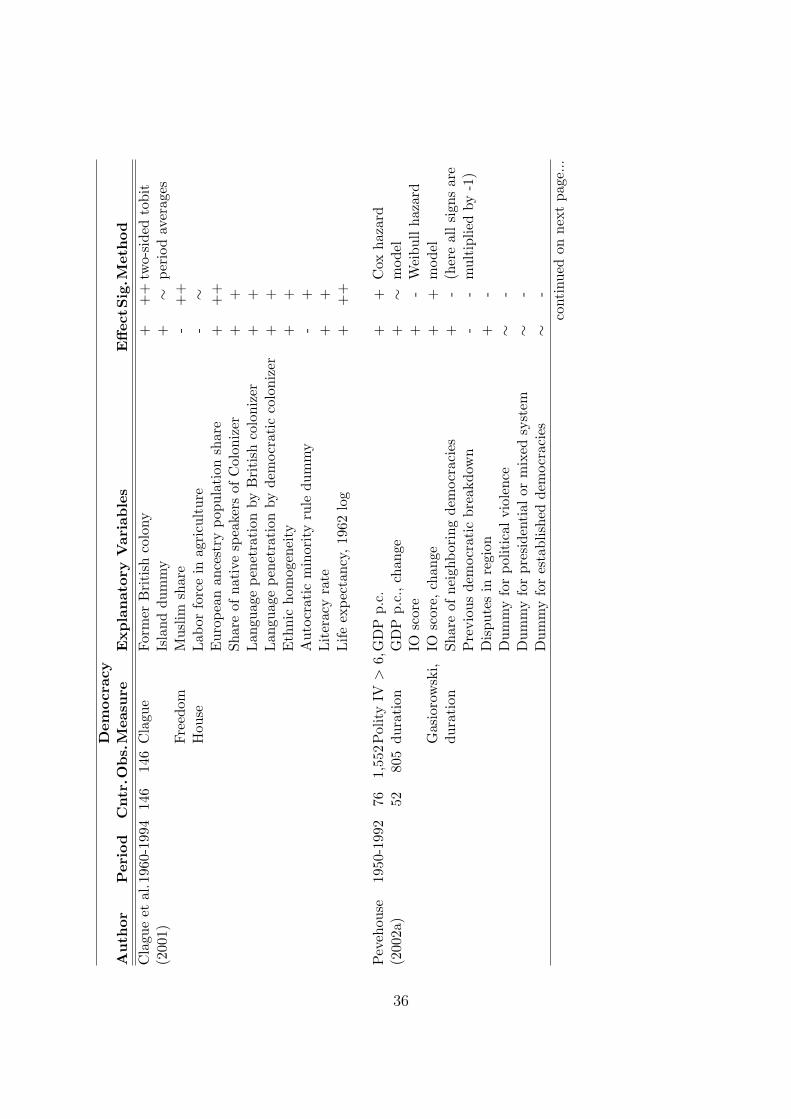
Dem
ocr
acy
Au
thor
Per
iod
Cntr
.Ob
s.M
easu
reE
xpla
nat
ory
Var
iab
les
Eff
ectS
ig.M
eth
od
Cla
gue
etal
.196
0-19
9414
614
6C
lagu
eFo
rmer
Bri
tish
colo
ny+
++
two-
side
dto
bit
(200
1)Is
land
dum
my
+∼
peri
odav
erag
esFr
eedo
mM
uslim
shar
e-
++
Hou
seL
abor
forc
ein
agri
cult
ure
-∼
Eur
opea
nan
cest
rypo
pula
tion
shar
e+
++
Shar
eof
nati
vesp
eake
rsof
Col
oniz
er+
+L
angu
age
pene
trat
ion
byB
riti
shco
loni
zer
++
Lan
guag
epe
netr
atio
nby
dem
ocra
tic
colo
nize
r+
+E
thni
cho
mog
enei
ty+
+A
utoc
rati
cm
inor
ity
rule
dum
my
-+
Lit
erac
yra
te+
+L
ifeex
pect
ancy
,19
62lo
g+
++
Pev
ehou
se19
50-1
992
761,
552P
olit
yIV
>6,
GD
Pp.
c.+
+C
oxha
zard
(200
2a)
5280
5du
rati
onG
DP
p.c.
,ch
ange
+∼
mod
elIO
scor
e+
-W
eibu
llha
zard
Gas
ioro
wsk
i,IO
scor
e,ch
ange
++
mod
eldu
rati
onSh
are
ofne
ighb
orin
gde
moc
raci
es+
-(h
ere
all
sign
sar
eP
revi
ous
dem
ocra
tic
brea
kdow
n-
-m
ulti
plie
dby
-1)
Dis
pute
sin
regi
on+
-D
umm
yfo
rpo
litic
alvi
olen
ce∼
-D
umm
yfo
rpr
esid
enti
alor
mix
edsy
stem
∼-
Dum
my
for
esta
blis
hed
dem
ocra
cies
∼-
cont
inue
don
next
page
...
36

Dem
ocr
acy
Au
thor
Per
iod
Cntr
.Ob
s.M
easu
reE
xp
lan
ator
yV
aria
ble
sE
ffec
tSig
.Met
hod
Pev
ehou
se19
50-1
992
106
2,77
6Pol
ity
IV>
6GD
Pp.
c.-
-lo
git
(200
2b)
862,
299
GD
Pp.
c.,
chan
ge∼
-G
asio
row
ski
IOsc
ore
++
+IO
scor
e,ch
ange
∼-
Num
ber
ofde
moc
raci
esin
regi
on+
+P
revi
ousl
yde
moc
rati
c+
++
Dis
pute
sin
regi
on-
∼D
umm
yfo
rpo
litic
alvi
olen
ce+
++
Dum
my
for
mili
tary
cont
rol
-+
+Y
ears
ofin
depe
nden
ce+
-
Boi
xan
d19
50-1
990
135
3,99
1Prz
ewor
ski
GD
Pp.
c.+
++
dyna
mic
prob
itSt
okes
(200
3)18
50-1
990
6,14
3G
DP
grow
th+
-T
urno
ver
rate
ofch
ief
exec
utiv
es-
++
Rel
igio
usfr
agm
enta
tion
-+
+Sh
are
Cat
holic
+-
Shar
eP
rote
stan
t+
-Sh
are
Mus
lim-
-Fo
rmer
colo
ny+
-P
revi
ous
dem
ocra
tic
brea
kdow
ns-
++
Bri
tish
colo
ny+
++
Wor
ldde
moc
racy
++
Edu
cati
onin
dex
+∼
Per
cent
age
offa
mily
farm
s+
-O
ccup
atio
nal
dive
rsifi
cati
on-
-co
ntin
ued
onne
xtpa
ge...
37
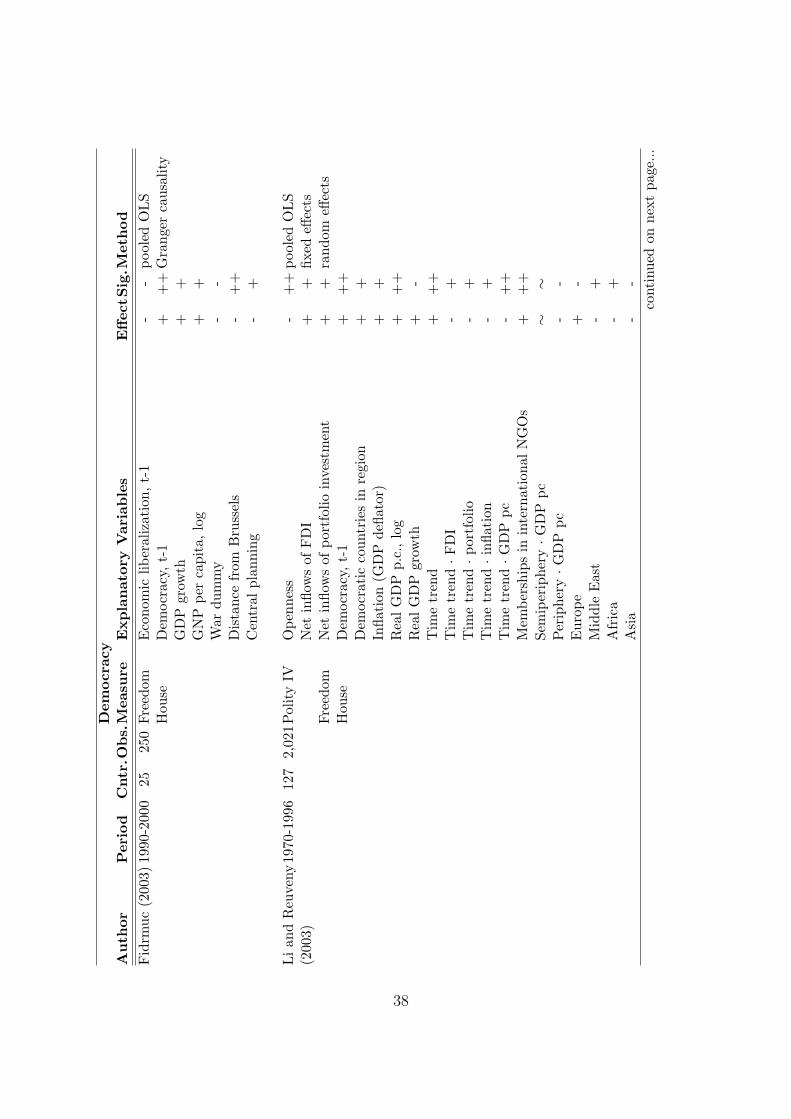
Dem
ocr
acy
Au
thor
Per
iod
Cntr
.Ob
s.M
easu
reE
xp
lan
ator
yV
aria
ble
sE
ffec
tSig
.Met
hod
Fid
rmuc
(200
3)19
90-2
000
2525
0Fr
eedo
mE
cono
mic
liber
aliz
atio
n,t-
1-
-po
oled
OL
SH
ouse
Dem
ocra
cy,
t-1
++
+G
rang
erca
usal
ity
GD
Pgr
owth
++
GN
Ppe
rca
pita
,lo
g+
+W
ardu
mm
y-
-D
ista
nce
from
Bru
ssel
s-
++
Cen
tral
plan
ning
-+
Li
and
Reu
veny
1970
-199
612
72,
021P
olit
yIV
Ope
nnes
s-
++
pool
edO
LS
(200
3)N
etin
flow
sof
FD
I+
+fix
edeff
ects
Free
dom
Net
inflo
ws
ofpo
rtfo
lioin
vest
men
t+
+ra
ndom
effec
tsH
ouse
Dem
ocra
cy,
t-1
++
+D
emoc
rati
cco
untr
ies
inre
gion
++
Infla
tion
(GD
Pde
flato
r)+
+R
eal
GD
Pp.
c.,
log
++
+R
eal
GD
Pgr
owth
+-
Tim
etr
end
++
+T
ime
tren
d·F
DI
-+
Tim
etr
end·p
ortf
olio
-+
Tim
etr
end·i
nflat
ion
-+
Tim
etr
end·G
DP
pc-
++
Mem
bers
hips
inin
tern
atio
nal
NG
Os
++
+Se
mip
erip
hery·G
DP
pc∼
∼P
erip
hery·G
DP
pc-
-E
urop
e+
-M
iddl
eE
ast
-+
Afr
ica
-+
Asi
a-
-co
ntin
ued
onne
xtpa
ge...
38
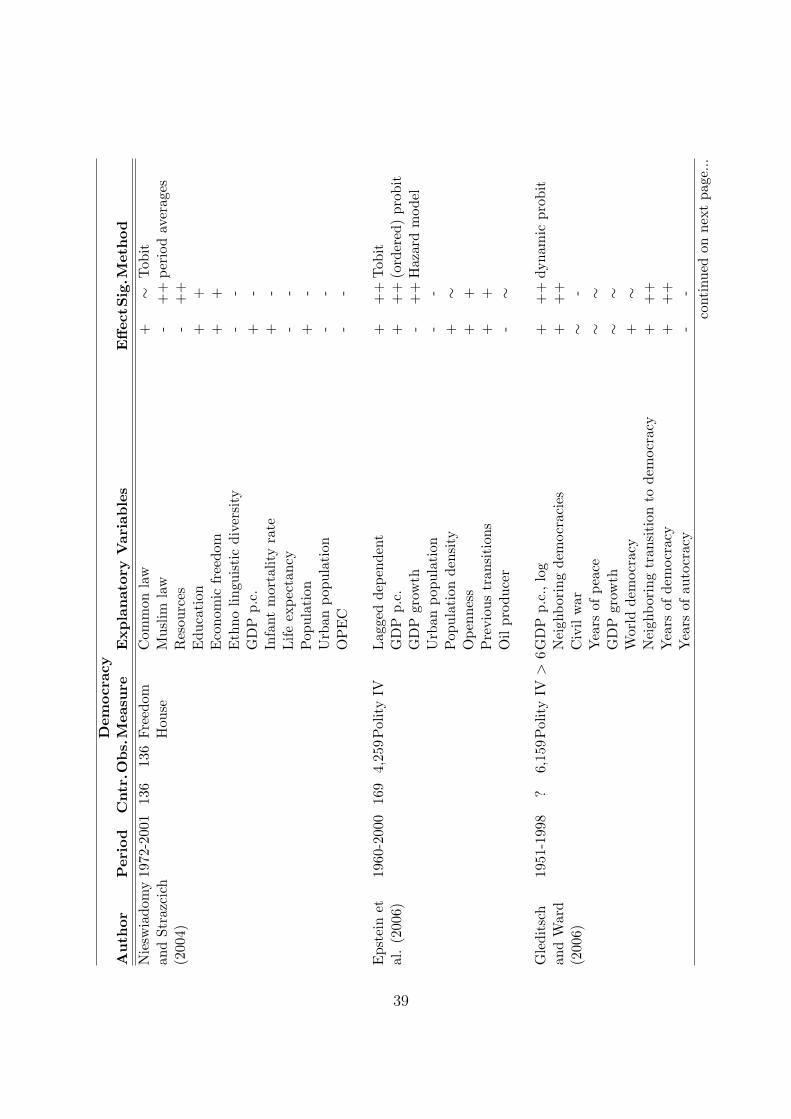
Dem
ocr
acy
Au
thor
Per
iod
Cntr
.Ob
s.M
easu
reE
xp
lan
ator
yV
aria
ble
sE
ffec
tSig
.Met
hod
Nie
swia
dom
y19
72-2
001
136
136
Free
dom
Com
mon
law
+∼
Tob
itan
dSt
razc
ich
Hou
seM
uslim
law
-+
+pe
riod
aver
ages
(200
4)R
esou
rces
-+
+E
duca
tion
++
Eco
nom
icfr
eedo
m+
+E
thno
lingu
isti
cdi
vers
ity
--
GD
Pp.
c.+
-In
fant
mor
talit
yra
te+
-L
ifeex
pect
ancy
--
Pop
ulat
ion
+-
Urb
anpo
pula
tion
--
OP
EC
--
Eps
tein
et19
60-2
000
169
4,25
9Pol
ity
IVL
agge
dde
pend
ent
++
+T
obit
al.
(200
6)G
DP
p.c.
++
+(o
rder
ed)
prob
itG
DP
grow
th-
++
Haz
ard
mod
elU
rban
popu
lati
on-
-P
opul
atio
nde
nsit
y+
∼O
penn
ess
++
Pre
viou
str
ansi
tion
s+
+O
ilpr
oduc
er-
∼
Gle
dits
ch19
51-1
998
?6,
159P
olit
yIV
>6G
DP
p.c.
,lo
g+
++
dyna
mic
prob
itan
dW
ard
Nei
ghbo
ring
dem
ocra
cies
++
+(2
006)
Civ
ilw
ar∼
-Y
ears
ofpe
ace
∼∼
GD
Pgr
owth
∼∼
Wor
ldde
moc
racy
+∼
Nei
ghbo
ring
tran
siti
onto
dem
ocra
cy+
++
Yea
rsof
dem
ocra
cy+
++
Yea
rsof
auto
crac
y-
-co
ntin
ued
onne
xtpa
ge...
39
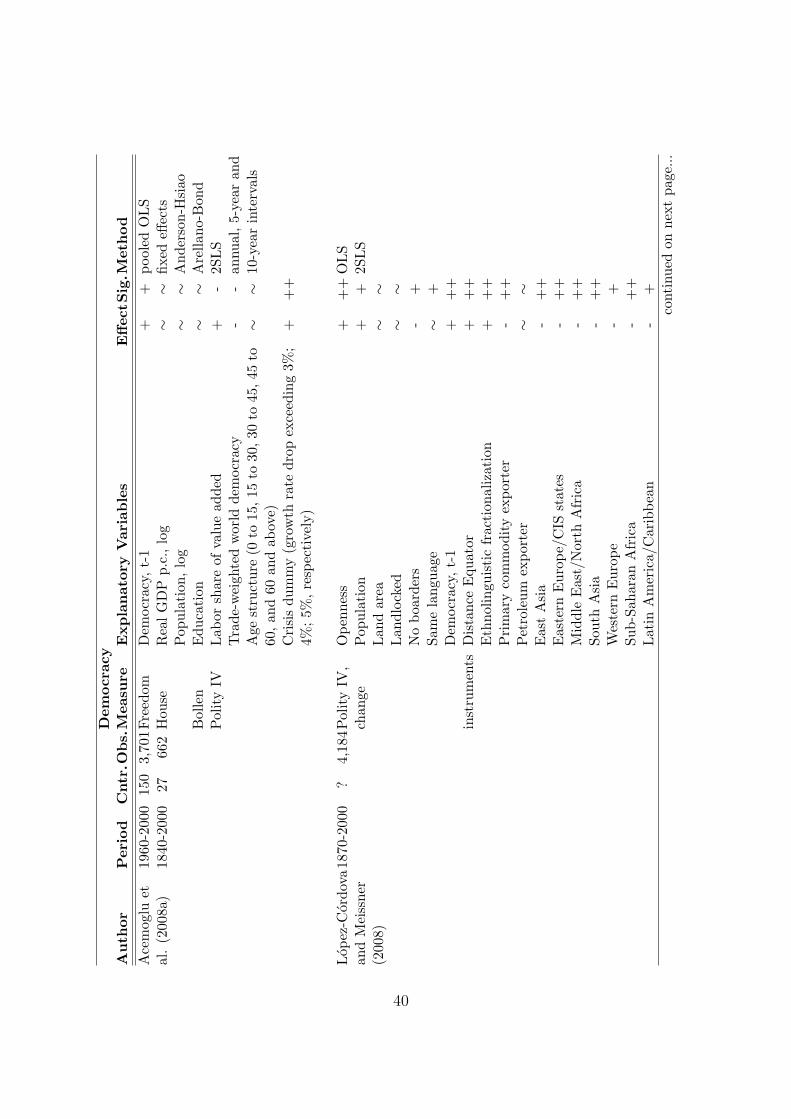
Dem
ocr
acy
Au
thor
Per
iod
Cntr
.Ob
s.M
easu
reE
xp
lan
ator
yV
aria
ble
sE
ffec
tSig
.Met
hod
Ace
mog
luet
1960
-200
015
03,
701F
reed
omD
emoc
racy
,t-
1+
+po
oled
OL
Sal
.(2
008a
)18
40-2
000
2766
2H
ouse
Rea
lG
DP
p.c.
,lo
g∼
∼fix
edeff
ects
Pop
ulat
ion,
log
∼∼
And
erso
n-H
siao
Bol
len
Edu
cati
on∼
∼A
rella
no-B
ond
Pol
ity
IVL
abor
shar
eof
valu
ead
ded
+-
2SL
ST
rade
-wei
ghte
dw
orld
dem
ocra
cy-
-an
nual
,5-
year
and
Age
stru
ctur
e(0
to15
,15
to30
,30
to45
,45
to60
,an
d60
and
abov
e)∼
∼10
-yea
rin
terv
als
Cri
sis
dum
my
(gro
wth
rate
drop
exce
edin
g3%
;4%
;5%
,re
spec
tive
ly)
++
+
Lop
ez-C
ordo
va18
70-2
000
?4,
184P
olit
yIV
,O
penn
ess
++
+O
LS
and
Mei
ssne
rch
ange
Pop
ulat
ion
++
2SL
S(2
008)
Lan
dar
ea∼
∼L
andl
ocke
d∼
∼N
obo
arde
rs-
+Sa
me
lang
uage
∼+
Dem
ocra
cy,
t-1
++
+in
stru
men
tsD
ista
nce
Equ
ator
++
+E
thno
lingu
isti
cfr
acti
onal
izat
ion
++
+P
rim
ary
com
mod
ity
expo
rter
-+
+P
etro
leum
expo
rter
∼∼
Eas
tA
sia
-+
+E
aste
rnE
urop
e/C
ISst
ates
-+
+M
iddl
eE
ast/
Nor
thA
fric
a-
++
Sout
hA
sia
-+
+W
este
rnE
urop
e-
+Su
b-Sa
hara
nA
fric
a-
++
Lat
inA
mer
ica/
Car
ibbe
an-
+co
ntin
ued
onne
xtpa
ge...
40
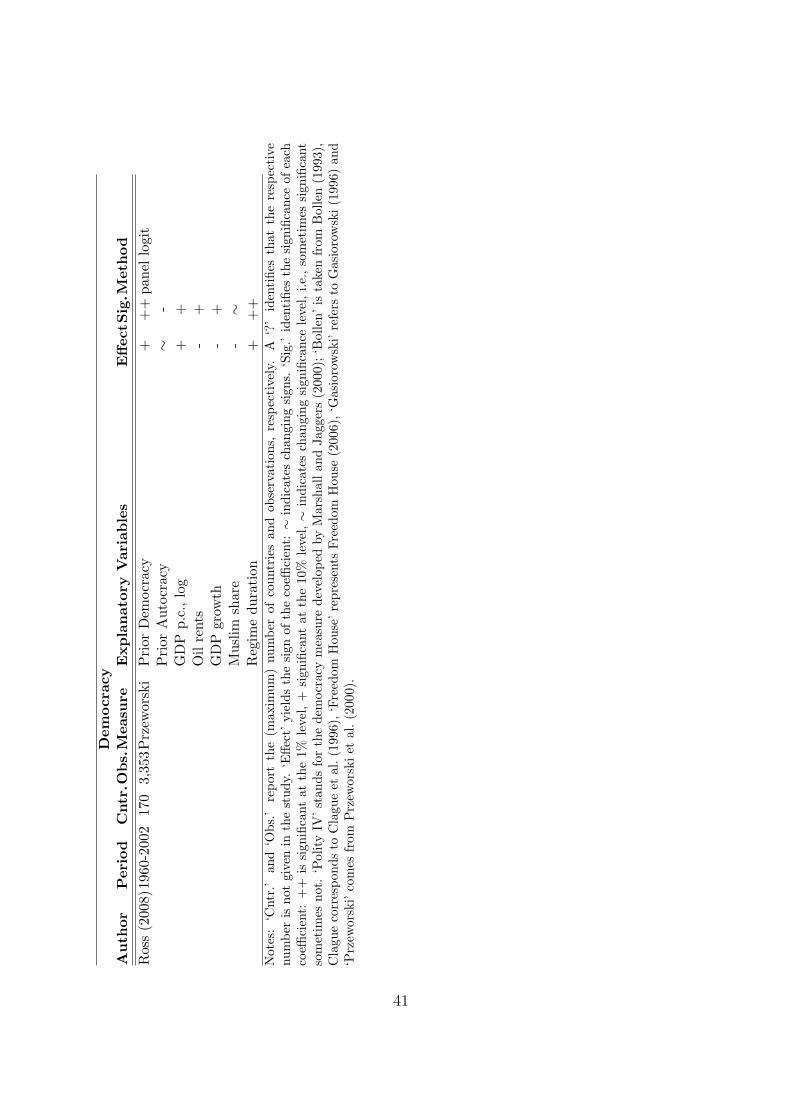
Dem
ocr
acy
Au
thor
Per
iod
Cntr
.Ob
s.M
easu
reE
xp
lan
ator
yV
aria
ble
sE
ffec
tSig
.Met
hod
Ros
s(2
008)
1960
-200
217
03,
353P
rzew
orsk
iP
rior
Dem
ocra
cy+
++
pane
llo
git
Pri
orA
utoc
racy
∼-
GD
Pp.
c.,
log
++
Oil
rent
s-
+G
DP
grow
th-
+M
uslim
shar
e-
∼R
egim
edu
rati
on+
++
Not
es:
‘Cnt
r.’
and
‘Obs
.’re
port
the
(max
imum
)nu
mbe
rof
coun
trie
san
dob
serv
atio
ns,
resp
ecti
vely
.A
‘?’
iden
tifie
sth
atth
ere
spec
tive
num
ber
isno
tgi
ven
inth
est
udy.
‘Effe
ct’
yiel
dsth
esi
gnof
the
coeffi
cien
t:∼
indi
cate
sch
angi
ngsi
gns.
‘Sig
.’id
enti
fies
the
sign
ifica
nce
ofea
chco
effici
ent:
++
issi
gnifi
cant
atth
e1%
leve
l,+
sign
ifica
ntat
the
10%
leve
l,∼
indi
cate
sch
angi
ngsi
gnifi
canc
ele
vel,
i.e.,
som
etim
essi
gnifi
cant
som
etim
esno
t.‘P
olit
yIV
’sta
nds
for
the
dem
ocra
cym
easu
rede
velo
ped
byM
arsh
alla
ndJa
gger
s(2
000)
;‘B
olle
n’is
take
nfr
omB
olle
n(1
993)
,C
lagu
eco
rres
pond
sto
Cla
gue
etal
.(19
96),
‘Fre
edom
Hou
se’r
epre
sent
sFr
eedo
mH
ouse
(200
6),‘
Gas
ioro
wsk
i’re
fers
toG
asio
row
ski(
1996
)an
d‘P
rzew
orsk
i’co
mes
from
Prz
ewor
ski
etal
.(2
000)
.
41
References
Acemoglu, D., Johnson, S., Robinson, J. A., and Yared, P. (2008a). Income and democracy.
American Economic Review, 98:808–842.
Acemoglu, D. and Robinson, J. A. (2006). Economic Origins of Dictatorship and Democ-
racy. Cambridge University Press, New York.
Acemoglu, D., Ticchi, D., and Vindigni, A. (2008b). A theory of military dictatorships.
Working Paper 13915, NBER.
Almond, G. and Verba, S. (1963). The Civic Culture. Princeton University Press, Prince-
ton.
Barro, R. J. (1999). Determinants of democracy. Journal of Political Economy, 107:S158–
S183.
Boix, C. (2003). Democracy and Redistribution. Cambridge University Press, New York.
Boix, C. and Stokes, S. C. (2003). Endogenous democratization. World Politics, 55:517–
549.
Bollen, K. A. (1993). Liberal democracy: Validity and method factors in cross-national
measures. American Journal of Political Science, 37:1207–1230.
Borooah, V. K. and Paldam, M. (2007). Why is the world short of democracy? A cross-
country analysis of barriers to representative government. European Journal of Political
Economy, 23:582–604.
Centre d’Etudes Prospectives et d’Informations Internationales (CEPII) (2006). Distances
database. Available at http://www.cepii.fr/anglaisgraph/bdd/distances.htm.
Cheibub, J. A. (2006). Presidentialism, Parliamentarism, and Democracy. Cambridge
University Press, New York.
42
Clague, C., Gleason, S., and Knack, S. (2001). Determinants of lasting democracy in poor
countries: Culture, development, and institutions. Annals of the American Academy of
Political and Social Science, 573:16–41.
Clague, C., Keefer, P., Knack, S., and Olson, M. (1996). Property and contract rights
under autocracy and democracy. Journal of Economic Growth, 1:243–276.
Crenshaw, E. M. (1995). Democracy and demographic inheritance: The influence of moder-
nity and proto-modernity on political and civil rights, 1965 to 1980. American Sociolog-
ical Review, 60:702–718.
Dreher, A. (2006). Does globalization affect growth? Evidence from a new index of glob-
alization. Applied Economics, 38:1091–1100.
Easterly, W. and Sewadeh, M. (2001). Global Development Network Growth Database.
World Bank Economic and Development Research Group, Washington, D.C.
Elkins, Z. and Simmons, B. (2005). On waves, clusters, and diffusion: A conceptual
framework. Annals of the American Academy of Political and Social Science, 598:33–51.
Epstein, D., Bates, R., Goldstone, J., Kristensen, I., and O’Halloran, S. (2006). Democratic
transitions. American Journal of Political Science, 50:551–569.
Fidrmuc, J. (2003). Economic reform, democracy and growth during post-communist
transition. European Journal of Political Economy, 19:583–604.
Freedom House (2006). Freedom in the World 2006: The Annual Survey of Political Rights
and Civil Liberties. Freedom House, Washington, D.C.
Freeman, J. R. and Quinn, D. (2008). The economic origins of democracy reconsidered.
mimeo. Paper presented at the Annual Meeting of the American Political Science Asso-
ciation.
Gandhi, J. and Przeworski, A. (2006). Cooperation, cooptation, and rebellion under dic-
tatorship. Economics & Politics, 19:1–26.
43

Gasiorowski, M. J. (1996). An overview of the political regime change dataset. Comparative
Political Studies, 29:469–483.
Gilardi, F. (2005). The institutional foundations of regulatory capitalism: The diffusion of
independent regulatory agencies in Western Europe. Annals of the American Academy
of Political and Social Science, 598:84–101.
Gleditsch, K. S. (2002). All International Politics is Local: The Diffusion of Conflict,
Integration, and Democratization. University of Michigan Press, Ann Arbor.
Gleditsch, K. S. and Ward, M. D. (2006). Diffusion and the international context of
democratization. International Organization, 60:911–933.
Huntington, S. P. (1968). Political Order in Changing Societies. Yale University Press,
New Haven.
Inglehart, R. (1988). The renaissance of political culture. American Political Science
Review, 82:1203–1230.
Jensen, N. and Wantchekon, L. (2004). Resource wealth and political regimes in Africa.
Comparative Political Studies, 37:816–841.
King, G. and Zeng, L. (2001). Logistic regression in rare events data. Political Analysis,
9:137–163.
Leamer, E. E. (1983). Let’s take the con out of econometrics. American Economic Review,
73:31–43.
Levine, R. and Renelt, D. (1992). A sensitivity analysis of cross-county growth regressions.
American Economic Review, 92:942–963.
Li, Q. and Reuveny, R. (2003). Economic globalization and democracy: An empirical
analysis. British Journal of Political Science, 33:29–54.
Lipset, S. M. (1959). Some social requisites of democracy: Economic development and
political legitimacy. American Political Science Review, 53:69–105.
44
Lopez-Cordova, J. E. and Meisner, C. M. (2008). The impact of international trade on
democracy: A long-run perspective. World Politics, 60:539–575.
Marshall, M. G. and Jaggers, K. (2000). Polity IV Project: Political regime characteristics
and transitions, 1800-2000. Available at: http://www.cidcm.umd.edu/inscr/ polity/.
Meseguer, C. (2005). Policy learning, policy diffusion, and the making of a new order.
Annals of the American Academy of Political and Social Science, 598:67–82.
Muller, E. N. (1995). Economic determinants of democracy. American Sociological Review,
60:966–982.
Nieswiadomy, M. L. and Strazicich, M. C. (2004). Are political freedoms converging?
Economic Inquiry, 42:323–340.
Organization for Economic Co-operation and Development (OECD) (2008). OECD web-
page. Available at: http://www.oecd.org/.
Organization of the Petroleum Exporting Countries (OPEC) (2008). OPEC webpage.
Available at: http://www.opec.org/.
Pevehouse, J. C. (2002a). With a little help from my friends? Regional organizations and
the consolidation of democracy. American Journal of Political Science, 46:611–626.
Pevehouse, J. C. (2002b). Democracy from the outside-in? International organizations and
democratization. International Organization, 56:515–549.
Przeworski, A. (1991). Democracy and the Market: Political and Economic Reforms in
Eastern Europe and Latin America. Cambridge University Press, New York.
Przeworski, A. (2005). Democracy as an equilibrium. Public Choice, 123:253–273.
Przeworski, A., Alvarez, M., Cheibub, J. A., and Limongi, F. (2000). Democracy and De-
velopment: Political Regimes and Economic Well-being in the World, 1950-1990. Cam-
bridge University Press, New York.
45
Przeworski, A. and Limongi, F. (1997). Modernization: Theories and facts. World Politics,
49:155–183.
Rosendorff, B. P. (2001). Choosing democracy. Economics & Politics, 13:1–29.
Ross, M. L. (2001). Does oil hinder democracy? World Politics, 53:325–361.
Ross, M. L. (2008). But seriously: Does oil really hinder democracy? UCLA Department
of Political Science, mimeo.
Sala-i-Martin, X. (1997). I just ran two million regressions. American Economic Review,
87:178–183.
Schumpeter, J. (1942). Capitalism, Socialism, and Democracy. Harper, New York.
Seligson, M. A. (2002). The renaissance of political culture or the renaissance of the
ecological fallacy? Comparative Politics, 34:273–292.
Simmons, B. A. and Elkins, Z. (2004). The globalization of liberalization: Policy diffusion
in the international political economy. American Political Science Review, 98:171–189.
Sturm, J.-E. and de Haan, J. (2002). How robust is Sala-i-Martin’s robustness analysis?
University of Konstanz, mimeo.
Tomz, M., King, G., and Zeng, L. (1999). RELOGIT: Rare events logistic regression.
http://gking.harvard.edu/stats.shtml#relogit.
University of Texas Inequality Project (UTIP) (2007). UTIP-UNIDO dataset. Available
at: http://utip.gov.utexas.edu/data/UTIP UNIDO2001rv3.xls.
Way, C. R. (2005). Political insecurity and the diffusion of financial market regulation.
Annals of the American Academy of Political and Social Science, 598:125–144.
World Bank (2006). World Development Indicators. World Bank, Washington, D.C.
46