Report on Ambient Noise Levels & Ambient Air Quality during ...
Upload
independentCategory
view
3download
0
Creating Ambient Visualisations using Extreme Prototyping
Jennifer G. Sheridan, Alan Dix, Simon Lock, Michael Twidale with the Scrapheap Teams and Judges
Department of Computing, Lancaster University, Lancaster LA1 4YR
{sheridaj, lock}@comp.lancs.ac.uk, [email protected], [email protected]
Abstract. In this paper we report on an exciting exploratory experiment that lead to a number of ambient
visualisations of passively sensed human activity. Ambient displays offer those around some sense of activity
or information without explicitly focusing on the display itself. We present a number of radically different
visualisations using forms of situated display or installation. Each tries to give a sense of current human activity
in other places or past human presence in the same place. These visualisations were produced during a series of
one-day design and build exercises based on various existing hardware and software components. This form of
'extreme' prototyping means that we have visualisations covering a broad range of the design space and so can
explore various attributes of this design space. The restricted design regime also promotes innovative and
creative solutions – rigid constraints seem to lead to serendipitous discoveries.
Keywords: Information Visualisation, ambient displays, arts installation.
1. Introduction Visualisation is not an exact science. New visualisation techniques are based on a combination of experience,
mathematical or other scientific knowledge, and inspiration. After working hard, often for many months or
years, on a novel technique, the analysis one does has a natural bias towards justifying the decisions one has
made.
In this paper we describe an exciting experiment, the Scrapheap (Computing) Challenge, that enabled the
production of a number of diverse visualisations that together explored the design space in a way that a single
visualisation could never do. This offers multiple techniques that each could be used in different circumstances
or can act as inspiration for further visualisations. However, in addition, the fact that we have a number of
visualisations within the same space allows us to analyse the dimensions and attributes of that space in detail.
The particular area we are looking at is ambient displays giving awareness of human activity. These are not
visualisations intended for a sole analyst to examine huddled over a computer screen, but instead installations
for public spaces that are intended to both give some gestalt feeling of activity and also have an aesthetic appeal.
In the next section we will briefly review some work in ambient displays. Then, in section 3, we will look at the
process we used and in the following section the six visualisations that arose. Sections 5 and 6 analyse these
first am individual critique of each visualisation and then an analysis of the dimensions and attributes of the
design space revealed by the multiple examples. Finally we return to the process itself and discuss the ways in
which this extreme prototyping has fostered design creativity.

2. Background Awareness is fundamentally an experience. While an understanding of awareness can include issues of
psychological mind content such as personality and ego and is bounded by our culturally-constructed intellect,
in this study we are particularly concerned with awareness as having or showing realization, perception, or
knowledge of some kind of activity.
The nature of conventional, task-based computing applications often requires users’ constant, focused attention
on a computer screen. These kinds of displays work well for systems that display critical information, such as
air-traffic control systems. However, when information to be displayed on the screen is non-critical and can sit
in a users’ periphery, ambient displays offer a good alternative to the traditional desktop computer, keyboard
and mouse.
Ambient displays move information away from conventional displays and instead place the information in the
physical environment, blurring the boundary between the physical and the digital. The concept was first
described by Weiser [Weiser] and is a child of the Tangible Bits vision [Ishii, 97]. While there are many natural
ambient displays, one of the first computing-based ambient displays was Natalie Jeremijenko’s Dangling String.
Ambient displays portray background, or periphery, non-critical information and make use of ambient media
such as subtle changes in the environment (temperature, movement, sound, etc.). Because of this, they are a
good method for keeping people aware of ambient activity, such as activity in a building [Ishii, 98], network
traffic [Jeremijenko], weather [Weathermobile] or for connecting remote people [Pedersen].
However, rather than producing simple translation of information, ambient displays often express information
using Ambient Fixtures [Wisneski]. Ambient Fixtures are often aesthetically beautiful artefacts [Dahley, Heiner]
and can be humorous [Allanson], intimate [Kuzuoka, Strong], or educational [Weinberg].
While work has begun on defining a set of heuristics for designing, developing and evaluating [Mankoff]
ambient displays, much work is still needed in this area.
3. The Challenge Process
3.1 About the event
In August 2003, the several people in the Department of Computing at Lancaster University participated in
Scrapheap (Computing) Challenge, an extreme prototyping event which challenged participants to design,
prototype and present working computing artefacts as solutions to specific computing challenges. We refer to
the activities during this event as “extreme” because all comprehension, investigation, brainstorming,
conceptualisation and realisation of prototypes had to be completed within a single working day. Teams
competed for the Scrapheap (Computing) Challenge cup (Figure 1) and the opportunity to display their systems
as installations in department’s new building, InfoLab21, which opens in July 2004.
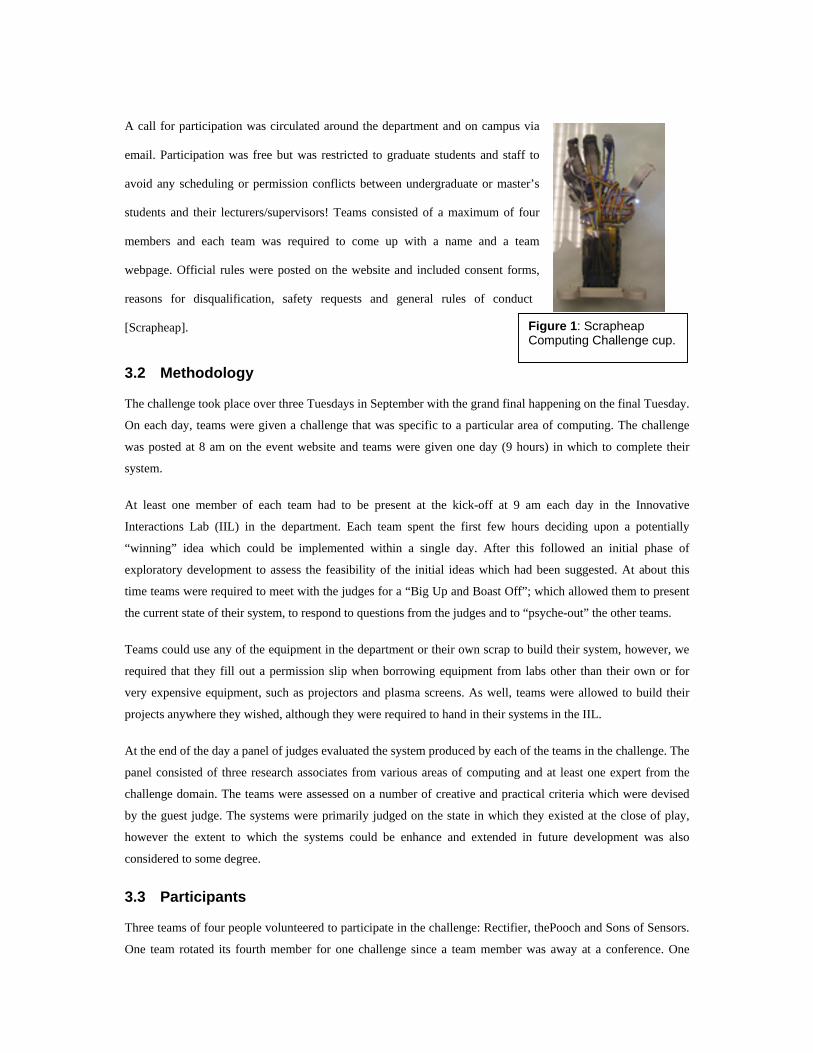
Figure 1: Scrapheap Computing Challenge cup.
A call for participation was circulated around the department and on campus via
email. Participation was free but was restricted to graduate students and staff to
avoid any scheduling or permission conflicts between undergraduate or master’s
students and their lecturers/supervisors! Teams consisted of a maximum of four
members and each team was required to come up with a name and a team
webpage. Official rules were posted on the website and included consent forms,
reasons for disqualification, safety requests and general rules of conduct
[Scrapheap].
3.2 Methodology
The challenge took place over three Tuesdays in September with the grand final happening on the final Tuesday.
On each day, teams were given a challenge that was specific to a particular area of computing. The challenge
was posted at 8 am on the event website and teams were given one day (9 hours) in which to complete their
system.
At least one member of each team had to be present at the kick-off at 9 am each day in the Innovative
Interactions Lab (IIL) in the department. Each team spent the first few hours deciding upon a potentially
“winning” idea which could be implemented within a single day. After this followed an initial phase of
exploratory development to assess the feasibility of the initial ideas which had been suggested. At about this
time teams were required to meet with the judges for a “Big Up and Boast Off”; which allowed them to present
the current state of their system, to respond to questions from the judges and to “psyche-out” the other teams.
Teams could use any of the equipment in the department or their own scrap to build their system, however, we
required that they fill out a permission slip when borrowing equipment from labs other than their own or for
very expensive equipment, such as projectors and plasma screens. As well, teams were allowed to build their
projects anywhere they wished, although they were required to hand in their systems in the IIL.
At the end of the day a panel of judges evaluated the system produced by each of the teams in the challenge. The
panel consisted of three research associates from various areas of computing and at least one expert from the
challenge domain. The teams were assessed on a number of creative and practical criteria which were devised
by the guest judge. The systems were primarily judged on the state in which they existed at the close of play,
however the extent to which the systems could be enhance and extended in future development was also
considered to some degree.
3.3 Participants
Three teams of four people volunteered to participate in the challenge: Rectifier, thePooch and Sons of Sensors.
One team rotated its fourth member for one challenge since a team member was away at a conference. One

member of staff participated on a team, and four staff members participated as expert judges and three research
associates organized the event and acted as official judges. Participants were from England, Wales, Scotland,
Columbia, USA and Germany. All three teams were a mix of close friends and new acquaintances, some of
whom had worked together on previous computing projects.
3.4 Challenges
Although the event consisted of three challenges, we selected the two challenges which are particularly relevant
to visualization.
3.4.1 Absent Presence
Absent Presence focused on the field of human-computer interaction (HCI). Teams were asked to create a
system that for some environment, virtual or physical, where visitors are normally alone or have few people
around, can in some way sense the presence of those who have gone before and also the visitors' own presence
in some way is taken forward. The aim of this challenge was not to establish contact with past people (although
that was not prohibited), but just to give visitors to the space (museum, web page, monument) a sense that others
have been there. Teams were asked that the system capture an aspect of the previous visitors' behaviour (sound,
mouse movement, link history, physical movement) and use this to make the absent presence more life-like.
Teams were judged on experience, usability, disruption, robustness and scalability. However, since the guest
judge was himself away during the challenge, he asked that the teams install their system, whether on computer,
on a web site, or at physical location and then collect 'visitations' over a few days so that the judge and
organisers could 'visit' the spaces to experience the effect of presence.
3.4.2 Informated Artefact
Informated Artefact focused on information visualization, art and technology. Participants were asked to create
an idea for a piece of dynamic artefact for the entrance foyer of Infolab21. Inspiration for this challenge came
from Xerox PARC’s water fountain. The fountain accesses the stock market via the net; when Xerox stock rises,
the water flow increases.
The design had to be an artefact that changed in some way in reaction to activity in the building. The source of
the information, how to obtain, process and represent the information was up to the team as well as the timescale
and rate of change.
The artefact had to be something people could just look at, without having to try and understand what it may
mean. The artefact was not meant to be a conventional piece of information visualization, where we try to make
the meanings as instantly interpretable as possible. At least some of the information contained was to be
obscure, so that it needed some explanation, or a person could only figure it out by watching carefully and for a
while.
The artefact had to be a physical artefact that moved in some way, or purely virtual, existing on a computer
screen or projection, or any combination. It had to have a visual component, and it had to involve some sort of

Figure 2: Mood floor lit up by user activity.
Figure 3: Kirlian table after object is moved.
change derived from data obtained somehow. Sounds or other effects were optional but teams had to have more
than one stimulus represented in the piece.
Marks were awarded for: a working system that could operate autonomously and could change dynamically
based on changing circumstances; robustness - could it reasonably be expected to function without extensive
support for long periods (months to years); creativity in the choice of input sources, and output forms; potential
of the idea to intrigue visitors and be a focus for conversations; Scrapheap challenge as inspiration generator.
4. The Visualisations
4.1 Mood Floor
Sons of Sensors developed the Mood Floor. A wooden floor is place in the
interactions lab on the way to the coffee machine. As users walk over the
floor green squares light up where their feet touch the floor (Figure 2).
When users reach the coffee machine, they can “register” their mood as
either red or blue by pressing either a blue panel or a red panel on a weight
table. Then when they walk across the floor a second time, the colour that
they’ve selected will appear underneath their feet.
Mood is expressed through valence, which comes in three primary forms:
red mood (valence is not explicitly defined); blue mood (valence is not
explicitly defined); neutral – (no valence attached). Secondary colours
appear when primary moods crossover. For example, the colour purple
indicates when a person who has selected blue walks over a red area.
Valence information decays over a period of several hours, and therefore
gives an impression of the mood of the previous visitors. The longer the user stands in one spot, the stronger the
valence imprint and the longer the imprint will take to decay (max of 2 hrs 40 minutes).
4.2 Kirlian Table
For this challenge, thePooch took inspiration from the images
found in Kirlian photography, a technique that reportedly allows
you to view the psychic aura of the person or object being
photographed. The Kirlian Table reproduces this effect by
showing the psychic aura of objects placed on the table (Figure 3).
The longer the object is present, the more ‘psychic’ energy is
stored in the table and the more intense the aura. On removal of an
object, the psychic aura lingers and slowly dissipates - items that
have charged the table for longer take the longest to fade. The

Figure 4: Custom-built sensor equipment for household
Figure 5: The Activity Hat.
patterns of aura evident on the table represent a stratified ‘archaeology’ of activity centred around the table. At
any one time, these patterns indicate the artefacts of discussion, work and recreation which have been previously
place on the table.
4.3 Fairies
The Rectifier team chose to build a means of enabling a piece of
contributory art work that detects a participant's physical presence at a
location. Users generate "presence events" using custom-built sensor
equipment installed in household furniture (Figure 4). Presence events
in the demo application simply describe whether a participant is
seated at a location, or is no longer seated.
The custom-built sensor sits under a sofa cushion and when users sit on the cushion, they generate a virtual fairy
which appears on a display that is situated next to the sofa. Every time someone sits on the cushion, they
generate new fairies. As a participant remains at a location, the fairy’s form changes until the user moves away.
Over time, the entities that embody presences decay, making way for fresher more recent presence
interpretations.
4.4 The Activity Hat
The Sons of Sensors’ Activity Hat is an abstract sculpture that provides a
sense of the level of activity in the department. The hat reacts to the amount
of noise and movement happening throughout the building; measured using
distributed wireless sensors that feed this information back to the Hat. Sound
level was chosen as a measure of activity since it is representative of social
interaction: conversations taking place, things being moved around, music
being played can all be associated with human activity within the building.
Movement is also an interesting factor to look at – the number people moving
in and out of offices, walking through the corridors and gathering in
communal areas illustrates quite literally how busy the department is at any
one time.
The hat itself is a conical shaped object, a witch’s hat, made out of flexible rubberized material and standing
about 2 feet high (Figure 5). Strips of glowing electroluminescent ultra blue material hang from its tip,
resembling cascading light emanating from the top of the hat. The hat shakes, contracts and distorts in response
to the cumulative movement information. The greater the level of human movement detected by the sensors, the
faster and more pronounced are the movements of the hat. The base on which its stands is made of semi-
translucent white acrylic, and projector mounted underneath this base beams a blue aura that surrounds the base
of the cone. This aura is made up of particles that stream outwards from the base of the hat and is representative
of the sound levels as detected by the sensors. Increased amounts of noise are shown as more concentrated
bursts of particles that slowly fade as they reach the edges of the base.

Figure 7: Mr. Linear Nailer.
Figure 6: Inconecievable.
4.5 Inconeceivable
thePooch created an installation which harvested real-time information on a
spectrum of different work oriented activities around the department. The
aim was to provide an abstract visualisation that would illustrate the ebb and
flow of work going on in the department. Work was categorised into four
elemental areas:
• Creation (fire / red) – This channel of data monitored the “burning fire of
creation” for such tasks as document writing, presentation preparation,
programming and so on. A simple key logger was used to monitor typing
activity (no keystrokes were captured; only the fact that keys were being
pressed).
• Exploration (water / blue) – This channel of data monitored the “life-
giving water of exploration” of such tasks as downloading research papers, performing web searches and
participating in discussion forums. Web usage was monitored via a purpose written web proxy.
• Reading (earth/ green) – This channel of data monitored the “nutrient rich earth” provided by the written
work of others. Network printer activity was taken to be representative of consuming information that had
been discovered.
• Interaction (air / white) – This channel of data monitored the “oxygen of life” provided by discussion and
interaction with colleague. A social space was monitored using a web cam to detect motion.
The display was deliberately abstract, taking the form of an inverted cone with rising and fading bands of colour
representing the different activities. This visualization was reminiscent of expanding bubble of the rising sparks
of a Jacobs Ladder. Although abstract, a person knowing the way that information was encoded could easily
learn to distinguish the levels of activity. For example flurry of white bands would indicate that a lot of
movement was occurring in the meeting area. Using these mechanisms, an experienced observer could
distinguish between the varying patterns of work over a day or even a week and is thus able to identify abnormal
or unprecedented patterns of work as they occur.
4.6 Mr Linear Nailer: The Average PhD Student
Team Rectifier constructed an ‘emotional' PhD student for the Infomated
Artefact challenge. Rectifier wished to reflect Infolab21’s positive
research atmosphere but rather than construct some abstract pretence of a
positive atmosphere, they chose to create an artefact that is ‘honest’;
people's emotions are not always apparent, especially if they are tucked
away in offices, and so it is nice to know when things are going well, and
important to know when they are not.
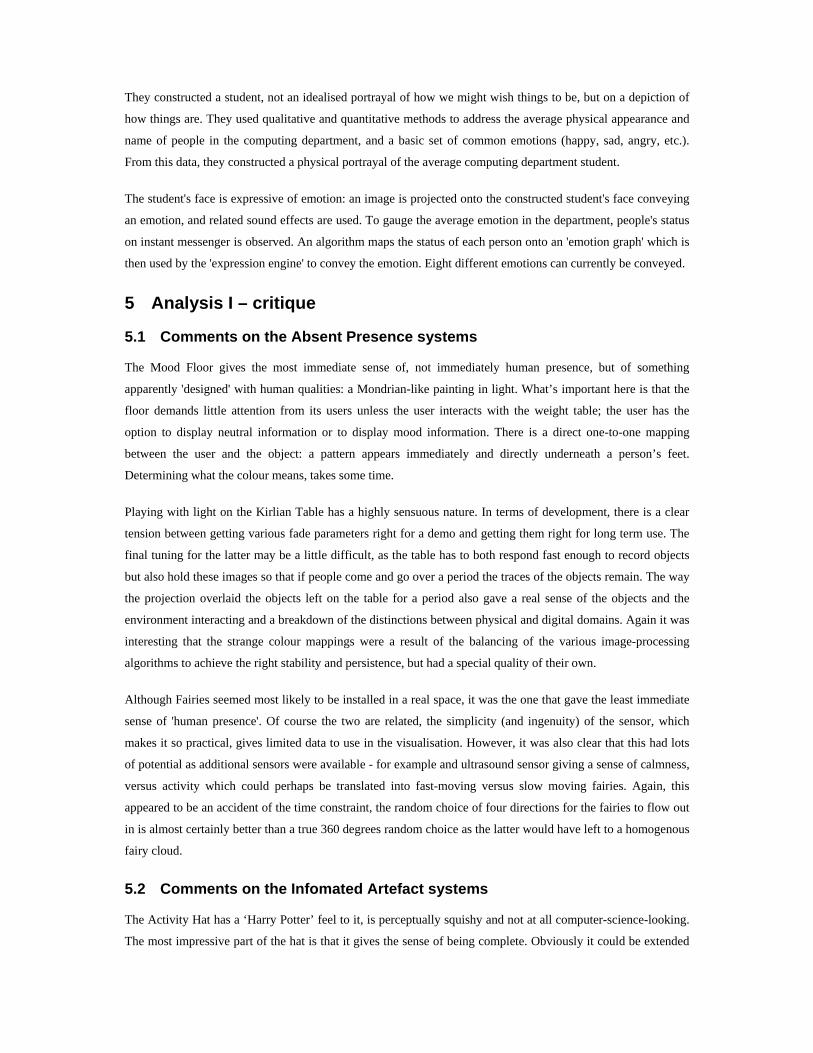
They constructed a student, not an idealised portrayal of how we might wish things to be, but on a depiction of
how things are. They used qualitative and quantitative methods to address the average physical appearance and
name of people in the computing department, and a basic set of common emotions (happy, sad, angry, etc.).
From this data, they constructed a physical portrayal of the average computing department student.
The student's face is expressive of emotion: an image is projected onto the constructed student's face conveying
an emotion, and related sound effects are used. To gauge the average emotion in the department, people's status
on instant messenger is observed. An algorithm maps the status of each person onto an 'emotion graph' which is
then used by the 'expression engine' to convey the emotion. Eight different emotions can currently be conveyed.
5 Analysis I – critique
5.1 Comments on the Absent Presence systems
The Mood Floor gives the most immediate sense of, not immediately human presence, but of something
apparently 'designed' with human qualities: a Mondrian-like painting in light. What’s important here is that the
floor demands little attention from its users unless the user interacts with the weight table; the user has the
option to display neutral information or to display mood information. There is a direct one-to-one mapping
between the user and the object: a pattern appears immediately and directly underneath a person’s feet.
Determining what the colour means, takes some time.
Playing with light on the Kirlian Table has a highly sensuous nature. In terms of development, there is a clear
tension between getting various fade parameters right for a demo and getting them right for long term use. The
final tuning for the latter may be a little difficult, as the table has to both respond fast enough to record objects
but also hold these images so that if people come and go over a period the traces of the objects remain. The way
the projection overlaid the objects left on the table for a period also gave a real sense of the objects and the
environment interacting and a breakdown of the distinctions between physical and digital domains. Again it was
interesting that the strange colour mappings were a result of the balancing of the various image-processing
algorithms to achieve the right stability and persistence, but had a special quality of their own.
Although Fairies seemed most likely to be installed in a real space, it was the one that gave the least immediate
sense of 'human presence'. Of course the two are related, the simplicity (and ingenuity) of the sensor, which
makes it so practical, gives limited data to use in the visualisation. However, it was also clear that this had lots
of potential as additional sensors were available - for example and ultrasound sensor giving a sense of calmness,
versus activity which could perhaps be translated into fast-moving versus slow moving fairies. Again, this
appeared to be an accident of the time constraint, the random choice of four directions for the fairies to flow out
in is almost certainly better than a true 360 degrees random choice as the latter would have left to a homogenous
fairy cloud.
5.2 Comments on the Infomated Artefact systems
The Activity Hat has a ‘Harry Potter’ feel to it, is perceptually squishy and not at all computer-science-looking.
The most impressive part of the hat is that it gives the sense of being complete. Obviously it could be extended

in various ways, but it already feels like a polished product. That really is incredible in just a few hours. The
input-processing-and-output create a sense of unity that normally only comes after a lot of refining of an initial
prototype. Of course behind the scenes it may be all tied together with duct tape, but it definitely gives a sense
of robustness. The integration and combination of two different kinds of activity information (sound and
movement) is very neat and pleasing. People move a lot - it moves a lot. People talk a lot - the star pattern gets
noisier. I think the patterns arising from the sound input are really interesting. How much of this is happenstance
is unclear, but definitely with 1 speaker you get a sense of pulses of conversational activity. With the sensors
nearby, it is a bit more interactive than the other two, and that does have a positive engagement effect.
Mr Linear Nailer: The Average PhD Student is best described as a modern art video installation. This one
definitely wins the award for 'most likely to appear on show in the Tate Modern and be bought by Charles
Saatchi for a hundred thousand quid'. It was definitely the funniest too and probably the most controversial one,
raising ethical issues that the group noted about the desirability of considering and representing 'the average
student'. But some modern art is deliberately provocative. Other issues include contributions to affective
computing and the meaningfulness of certain averaging actions (as distinct from the ethical considerations just
noted). An average student name is a wonderful idea to throw at people to force them to consider if their number
crunching makes any sense at all. The high speed data gathering and crayon power-point presentation again re-
emphasise how in normal work we dither around when we might get some good-enough to get going data really
fast.
Inconeceivable looks like it belongs in a 1950s sci-fi movie. The choice and use of input sources is particularly
impressive in this creation; four very different sources of activity information integrated into the cone display.
What the resulting display means is more subtle than in the other projects, but you really do get to see something
like a pulse of the department flowing up over the cone. The periodic nature of when or indeed if you are going
to see a particular rarer colour appearing adds to the interest and to the potential for initiating conversations if
say a blue band suddenly appears. As one of the designers pointed out, it would be interesting to see how a
frequent 'user' of the artefact gradually gets a sense of different levels of activity from day to day. The printer
data source was truly a data amalgamation, in all other cases, for the purposes of the demo we had single data
sources with ideas and sometimes mechanisms for how multiple data sources might in the future be aggregated.
Another designer noted the unexploited potential of accessible printer data to create different kinds of
awareness.
6 Analysis II – dimensions of the design space
As we have a wide range of designs all addressing the ambient display of human activity, we can use them to
unpack the many dimensions or attributes of this rich design space.
We will examine some of these dimensions in this section:
• Spatial and temporal directness – the extent to which the visualisation matches the spatial and temporal
properties of the phenomena being sensed

• Computational directness – the level of processing relating the sensed phenomena and visualisation
• Computational directness – the physical vs. virtual nature of the phenomena and visualisations
• Density and sampling – the way in which the visualisations deal with the twin problems of empty displays
when sensed phenomena are spares or saturation when they are frequent.
• Noise – the extent to which the visualisations contain attributes which are not related to a sensed
phenomena
• Time – the rich temporal properties of the visualisations and sensed phenomena
For each dimension there is no 'right' direction, but in examining these we can produce a design vocabulary and
highlight common issues.
6.1 Directness: place and time
Whilst both challenges were about awareness and ambient visualisation they in some sense were focused on
opposite poles of the space. Absent Presence is about awareness of past activity in the current location whereas
Informated Artefact is about awareness of current activity at remote locations. This is reminiscent of the
familiar time–space matrix used in CSCW to classify groupware (Figure 8).
differentplace
sameplace
sametime
differentplace
Figure 8. Groupware time–space matrix
However, within these broad areas there seems to be a richer sense of distinctions. For example, the Kirlian
table is far more 'same place' than the Fairies as the visualisation of the objects on the table are literally in the
same location and have the same shape as the objects themselves. The Mood Floor sits somewhere between the
two as the illuminated squares are where the feet stepped, but are not the same shape as feet. This gives us a
continuum of spatial directness:

visualisationin same place as
phenomenon
visualisationdistant from
phenomenon
indirect direct
InformatedArtefacts Kirlian TableFairies
Mood Floor
Figure 9. Spatial directness
Similarly we can consider temporal directness – how direct is the relationship between when events occur and
when they are visualised. All the visualisations initially displayed events nearly instantaneously, but varied in
how long they persisted visually so that when you looked at the Absent Presence displays the effects seen could
be hours or days ago.
Amongst the Informated Artefact visualisations Mr Linear Nailer stood out in that the expressions displayed
depended on the overall instant messenger status of all the participating members of the department. So a single
member changing their status would not necessarily lead to a change in emotion but would simply contribute
towards a pressure to change.
In the Absent Presence visualisations, the Fairies system was perhaps furthest towards the 'indirect' end of the
temporal dimension. It retained a fixed number of fairies on the display at any moment which meant that it was
impossible to know whether a particular fairy represented an event minutes or hours ago. In contrast the Mood
Floor and Kirlian table had fixed fade periods so that the level of brightness was a good indicator of the time
since the recorded event.
visualisationat same time as
phenomenon
visualisationsome time afterphenomenon
indirect direct
Mr Linear NailerFairiesMood Floor
Kirlian TableActivity Hat
Inconceivable
Figure 10. Temporal directness

6.2 Computational Directness
The visualisations differed too in how computationally 'distant' the visualisation was from the human activity it
represents. One of the distinctions made between multi-media and multi-modal interaction is the extent to
which the input is processed and interpreted before being output. For example, replaying a video, no matter
how complex the compression used for its storage, does not require any interpretation of the images. We can
see a similar 'level of processing' dimension based on the extent of interpretation. There is also another 'level of
processing' difference based on the actual amount of manipulation of he input data to give rise to the output.
Finally, whether or not there is actually a large amount of processing, the resulting visualisation may appear
more or less ‘like’ the phenomenon it represents – that is it may appear to the user to have a great computational
distance.
Using these criteria we can see that the Kirlian Table uses quite extensive image processing in order to persist
the image, but does not involve any interpretation of the sensed data. In contrast, Mr Linear Nailer probably
uses slightly computationally lighter algorithms than those needed for image processing, but has to ‘reinterpret’
the instant messenger status as averaged departmental ‘emotions’.
The Mood Floor also processes raw weight sensor data, then needs to convert this to a location for each footfall,
so involves extensive interpretation and computation, but for the users the effect is very simple –m where their
feet fall the square light up.
6.3 Physicality
Some of the visualisations used sensors of physical activity; others used measures based on human activity
within information spaces. Table 1 lists the physical and virtual activities recorded by each visualisation.
Table 1. Phenomena sensed – physical vs. virtual
Physical Virtual Mood Floor footsteps mood button Kirlian Table objects' locations Fairies sitting on chair Activity Hat sound, movement Inconceivable web cam (movement) keystrokes, web
usage, printer activity Mr Linear Nailer instant messenger
The systems also differ in the level of physicality of the visualisations. Clearly all must impinge on the physical
world in order to be seen by the users (or passers-by), but some are more like traditional displays, to be looked
at from a distance (e.g. the Fairies and Inconceivable), whilst others are more clearly projected into the lived
space of those observing them (e.g. Mt Linear Nailer and Mood Floor). The Activity Hat was the only one of
the systems that attempted to physically interact in the environment as it moved and wriggled. However, many
other examples of ambient displays, such as the Dangling String or AwareBots [Gross, 2002] do use more
physical movements within space.

Part of the reason that these were less heavily used in our systems is that actuators are less commonly used in
general and hence the participant’s had less experience and the parts were less available. Solutions, such as the
AwareBot, that use Lego or similar physical prototyping means, run the risk of appearing ‘clunky’ and less
suitable for more aesthetic displays.
LCD projectors were used in four of the six visualisations (projecting from above in Mood Floor and Kirlian
Table and form below in Inconceivable and Activity Hat. These harnessed the knowledge of the teams in
driving standard displays and could also be easily physically manipulated to give various less ‘hard-edged’
ambient displays.
6.4 Density and Sampling
The Mood has a fixed fade time. If the room is used rarely then the display will have very few coloured
squares. However, if the room is heavily used, perhaps a corridor, then the floor would quickly become simply
a solidly coloured area and not be very engaging. In both Mood Table and Kirlian table the balance of density is
maintained by careful setting of parameters for the situation the visualisation is placed in. Other visualisations
deal with this density issue differently. The Fairies system maintains density by having a fixed number of
fairies. Each fairy fades more quickly if there are more events. Unfortunately this fixed density means that
there is little sense of the business of the room. The Activity Hat also has a fixed number of displayed dots of
light around the hat. These are lit up if the sound sensor exceeds a certain volume and move outwards. Because
of the fixed number if there is a prolonged period of loud noise the system ‘runs out’ of dots and so ignores the
sound until some of the live dots reach the edge and disappear. This means that periods of constant sound
instead of being a consistently lit background become a moving wave of light and dark bands. for its sound
sensor. It appears that this quite powerful design feature was an ‘accident’; of the implementation process.
6.5 Noise
Some of the visualisations involve aspects that are not directly related to the phenomena sensed – a form of
‘noise’. In the Activity Hat the hat moves when movement is detected elsewhere, but the exact direction of the
movement is not controlled. The hat is simply pulled together top-to-bottom and collapses in one direction or
other. In Fairies the direction that the fairies move out from the centre of the screen is random, so that this also
is a form of ‘noise’. In a traditional visualisation any such noise would be regarded as distracting the user from
understanding the visualised phenomena, however in these ambient visualisations there is part of a richer design
trade-off. For example, in Fairies, the ‘noiseless’ alternative would be to have the fairies appear and then move
at a constant speed all in the same direction – whilst this simple ‘shopping queue’ visualisation would be very
directly related to the phenomena, it would not produce an interesting or engaging display.
6.6 Time
Time is a crucial part of the visualisations and also the underlying human activities being visualised. We have
already discussed temporal directness: this is largely determined by the persistence of the phenomena in the
visualisation allowing a delay between occurrence and perception of the phenomena. Delays also may occur of
there is a gap between the phenomena occurring and being sensed by the system.

timeoccurrence persistence of
visualisation
observationdelay
sensing
Figure 11. Temporal properties of visualization
The phenomena themselves also differ in other aspects of the time domain: the rate of occurrence phenomena
(rate of variability of gross properties), the duration of phenomena and the frequency of variation
time
variation frequency
occurrencefrequency (varies) duration
Figure 12. Temporal properties of phenomena
The Mood Floor measures footsteps. These only occur when someone enters the room, depending on where this
is placed the timescale of this occurrence may be from minutes to hours. The duration is then how long it takes
to walk across the floor, typically five to ten seconds. Whilst walking footsteps occur around once per second.
The printing sensor in Inconceivable looks for printer activity. In the university are about 900 academic staff
plus administrative staff and researchers. Looking at the 900 academics, if each printed twice a day this would
lead to 1800 documents a day or one every 16 seconds. However, we are not picking up every personal printer,
just networked ones ... but there are lots of students too!! Overall this leads to occurrence frequencies of the
order of tens of seconds. During printing pages are printed at tens of pages per minute, so strictly the duration
will also be tens of seconds to minutes also and the variation frequency (page-by-page time) of the order of 5-10
seconds. In fact, the sensing only picks up completed jobs, so the sensed phenomena are effectively
instantaneous.
In the Activity Hat the sound sensor pick up ambient sounds. The frequency of occurrence for this again
depends on location, but may be from minutes to hours, however within this the level of sound varies with
loudness changing in the order of seconds and the actual frequency of vibration being of the order of hundreds
of hertz.

7 Creativity
7.1 Team organisation
The time pressure and competitive nature of the challenge tended to bring the teams together to form solid and
focused development units. Although disagreements did occur these had to be resolved quickly for the good of
the team. Discussion tended to be fast and conclusive, with “any decision” being better than a protracted
argument.
In some teams, a clear leader naturally emerged and this was usually the person who presented the project
during the final judging. Other clearly defined roles also arouse, often demarcated by technological boundaries.
For example, “the server guy”, the “front end person” and the “hardware bod” could all be identified during the
challenges. This specialisation was partly due to the experience and knowledge that each team member had of
the various technologies being used to complete that challenge.
The partitioning of packets of work between the members of the group was a common management practice.
However some teams worked independently of each other in distributed locations around the department,
attempting to “bring it together” at the end of the day. This method didn’t work well and the teams that worked
the best spent most of the day in close proximity to each other – the same room. One team event experimented
with a basic form of pair programming and this proved very fruitful, allowing significant accuracy and
productivity gains when there were more team members than work packages.
7.2 Approaches to development
The extreme time pressures and competitive environment resulted in a number of interesting phenomena that are
not usually experience in the development of interactive system. The overall development paradigm was one of
“enforced pragmatism” where the main priority was the completion of the work by the end of the day.
The teams in the challenge generally employed a hybrid “top down plus bottom up” development strategy. Each
team first attempted to devise one or more “winning concepts” which they hoped would score highly for all of
the criteria. Due to the practicality of actually developing an implementation the teams tried to make use of
existing components as much as possible. Although trying not to reduce the point scoring potential of the
original concept a certain degree of compromise must take place. This took the form of avoiding or replacing
functionality, which would take too much time and effort to complete, and for which existing components did
not exist.
In the beginning some teams spent a lot of time discussing design and then found that they didn’t have enough
time to achieve an adequate implementation. The main motivation for this was that, due to the limited time
available, it was essential to get the design right first – there was not time to fix mistakes. However, by the time
of the second challenge, it had become clear that the teams could not afford the luxury of being sure about the
design before commencing implementation. This led to some exhilarating development processes.
In many cases, teams resorted to “gut feeling” when assessing and selecting potential concepts and designs.
Although often necessary, this was a risky if problems arose late in the day since there was no time to

experiment and assess the designs. This did however result in the development of pure and unconstrained
concepts, not tainted or watering down by revisions and committee decisions. There is also no scope for
“concept drift” where the main focus or point of the system evolves or shifts over time. Obviously this does
have some potentially negative implications for usability of the systems. However, due to the simplistic and
abstracted modes of interaction involved in these systems this is of marginal importance.
Even though the design and implementation time was so short, a basic form of incremental development was
observed. Teams would often focus on a particular subsystem and leave decisions about how the remainder of
the system should be implemented until later. This was partly due to the fact that until the subsystem had been
developed, it was not possible to determine what would be required to complete the functionality and aesthetics
of the system.
7.3 Team Psychology
Previously un-experienced levels of motivation and concentration result from the extreme pressures placed upon
the teams. Although this resulted in high productivity, it was not always pleasant for the team members
themselves. A chief motivator for the teams resulted from the fact that the challenges were closely related to
some of their areas of research – thus the challenges became more than just a game, but a matter of professional
pride.
Internal conflict between the members of a team was rare due to the fact that the competitive aspects of the
challenge brought them together in a common cause, with a common enemy. This “them and us” attitude
pervaded all aspects of the challenge and resulted in a stronger group mentality.
Another symptom of the competitiveness associated with the challenges was the phenomenon of tactical
development and careful use of the “big up and boast off” sessions. During such sessions team members were
caution not to give away too much about their chosen concepts designs. This not only prevented other teams
from poaching potentially useful concepts and ideas, but also allowed one team to attempt to mislead the other
teams in potentially unfruitful or difficult directions. In addition to this, some teams tried to propagate a “false
sense of security” in the other teams by vocalising their admiration for others work and complaining about the
inadequacy of there own. This all goes to illustrate the fact that the teams got very competitive by the end of the
last day!
7.4 The systems produced
The limited time available for development resulted in a set of systems with very lean functionality. These
minimal systems did all that was required to fulfil the demands of the challenge, but very little in addition to
this. This is in stark contrast to the bloated systems, which are common today with their overloaded
functionality.
On the first challenge (a non-visualisation challenge, not presented here), all of the teams left the aesthetics until
the very end, as a result, the systems were difficult to explain since they either didn’t have an interface or the
interface was minimal. This resulted from the focus on functionality and backend infrastructure and the

intension to retrofit aesthetics at a later date (a later date which never arrived). This perhaps reflects the
technical background of team members involved in developing the systems. However, it was clear from the later
challenges that they had learned from their lesson and this aspect of the system received much more attention.
7.5 Serendipity
Several times, whilst presenting their work, the teams explained how, if given time, their design would have
been different. Sometimes it was clear how the constraints of the short design time had prevented a more
extensive and complete solution. However, just as often the ‘ideal’ solution being worked towards seemed to be
less good than the actual design obtained within the available time.
One example of this was in the Mood Floor where the intention of the design team was to have footsteps drawn
as small dots of the floor rather than the checkerboard grid actually used. Whilst this may have produced a very
direct visualisation the Mondrian-like aspects of the Mood Floor were perhaps the most immediately striking of
all the visualisations. The abstract quality of the checkerboard of colours seemed to be more a constraint of
quick implementation rather than deliberate design; however, this discovery through constraint seemed to be a
valuable lesson for the teams.
Also in Fairies, the small coloured circles (the fairies) that appeared on the screen each time someone sat down
moved outwards along four axes, giving a cross-like picture of slowly moving images. The direction was
randomly calculated for each fairy and the design team said that given time they would have allocated a
direction in the full 360 degrees for movement direction. If they had done this however, the screen would have
been simply filled with a cloud of fairies with no apparent ‘sense’. Whilst the four random directions were
randomly calculated, the fact that they were at right angles gave a sense of human purpose, like watching cars
move on a US city grid plan.
The teams are forced to produce ‘good enough’ solutions within the time, using existing expertise and materials.
It may appear that this would lead to slight reworking of conventional ideas. However, paradoxically, this
additional constraint somehow produces ideas that are often better than those that the teams would have
‘ideally’ produced.
8. Conclusion
The idea of producing a novel visualisation, especially an ambient visualisation that impinge on the physical
environment, within one day seems at first ludicrous. This is the sort of thing that a substantial research project
might spend several person-years to produce. However, the results of doing this exercise for real refute this.
Clearly each visualisation would need additional work to ‘productise’ it; they were each remarkable on the
sophistication they achieved. More important the extreme prototyping methodology enabled an exploration of
the design space that is very unusual. It is not uncommon tom examine extreme alternatives on paper, but rare
to produce so many design concepts as working systems.

This spread within the design space has allowed us to produce a vocabulary of conceptual dimensions within the
design space: spatial, temporal and computational directness; and also allowed us to explore common issues:
density, noise and time.
We have also analysed some of the aspects of the process that fostered design creativity. It seems that the
challenge of producing systems within, what appears a punishingly tight timescale, is extremely productive:
both in terms of the novelty and quality of the designs produced.
Acknowledgements
We would like to thank the Scrapheap Teams and judges without whose effort this challenge would not have
been possible.
References Allanson, J., Lock, S. and Phillips, P. Tangerine, A Tangible Awareness Landscape. Proceedings of the
Distributed and Disappearing Interfaces in Ubiquitious Computing Workshop at ACM Conference on
Computer Human Interaction (CHI2001), Seattle, USA, pp.57-62, April 2001.
Dahley, A., Wisneski, C. and Ishii, H., Water Lamp and Pinwheels: Ambient Projection of Digital Information
into Architectural Space, in Summary of CHI '98, Los Angeles, USA, pp. 269-270, April 1998.
Gross, T. Ambient Interfaces in a Web-Based Theatre of Work. In Proceedings of the Tenth Euromicro
Workshop on Parallel, Distributed, and Network-Based Processing - PDP 2002 (Jan. 9-11, Gran Canaria,
Spain). IEEE Computer Society Press, Los Alamitos, CA, 2002. pp. 55-62. (ISBN: 0-7695-1444-8).
Heiner, J., Hudson, S., and Tanaka, K.The Information Percolator: Ambient Information Display in a Decorative
Object. In Proceedings of UIST'99, pp. 141-148, 1999.
Ishii H. and Ullmer, B. Tangible Bits: Towards Seamless Interfaces between People, Bits and Atoms.
Proceedings of CHI’97, Atlanta, USA, pp 234-241, March 1997.
Ishii, H., Wisneski, C., Brave, S., Dahley, A., Gorbet, M., Ullmer, B., and Yarin, P. (1998). ambientROOM:
Integrating Ambient Media with Architectural Space (video). In Summary of CHI '98, Los Angeles, USA, pp
173-174, April 1998.
Kuzuoka, H. and Greenberg, S. Mediating Awareness and Communication Through Digital But Physical
Surrogates. In Proceedings of CHI'99 Companion, pp. 11-12, 1999.
Lock, S., Allanson, J. and Phillips, P. User-Driven Design of a Tangible Awareness Landscape. In Proceedings
of ACM Conference on Designing Interactive Systems: Processes Practices Methods Techniques (DIS2000),
New York City, USA, pp. 434-440, August 2002.
Mankoff, J., Dey, A.K., Hsieh, G., Kientz, J., Ames, M., Lederer, S. Heuristic evaluation of ambient displays.
CHI 2003, ACM Conference on Human Factors in Computing Systems, CHI Letters 5(1): 169-176. 2003.
Pedersen, E. and Sokoler, T. AROMA: Abstract Representation Of Presence Supporting Mutual Awareness. In
Proceedings of CHI '97, Atlanta, USA, pp 51-58, March 1997.
Scrapheap. Scrapheap (Computing) Challenge. [online] http://polo.lancs.ac.uk/scrapheap. (Accessed December
11, 2003).
Strong, R. and Bill Gaver, B. Feather, Scent and Shaker: Supporting Simple Intimacy in Videos, Demos and
Short Papers of CSCW '96, Boston, USA, pp 29-30, November 1996.
Weathermobile. http://www.cs.berkeley.edu/projects/jmankoff/ambient/weather.html [Online] (Accessed
December 11, 2003).
Weinberg, G., Fletcher, R. and Gan, S. The Baby Sense Environment: Enriching and Monitoring Infants’
Experiences and Communication. In Summary of CHI '98, Los Angeles, USA, pp 325-326, April 1998.
Weiser, M. and Brown, J.S. Designing calm technology. [Online]
http://www.ubiq.com/weiser/calmtech/calmtech.htm (Accessed December 13, 2003).
Wisneski, C., Ishii, H., Bahley, A., Gorbet, M., Braver, S., Ullmer, B. and Yarin, P.: Ambient Displays: Turning
Architectural Space into an Interface between People and Digital Information. International Workshop on
Cooperative Buildings (CoBuild ’98). Springer Verlag, February 1998.
Copyright © 2022 FDOKUMEN