Report on Ambient Noise Levels & Ambient Air Quality during ...
43
Report on Ambient Noise Levels & Ambient Air Quality during Deepawali Festival - 2020. CENTRAL POLLUTION CONTROL BOARD Ministry of Environment, Forest & Climate Change Website: www.cpcb.nic.in May - 2021
-
Upload
khangminh22 -
Category
Documents
-
view
2 -
download
0
Transcript of Report on Ambient Noise Levels & Ambient Air Quality during ...

Report on Ambient Noise Levels &
Ambient Air Quality during Deepawali Festival - 2020.
CENTRAL POLLUTION CONTROL BOARD Ministry of Environment, Forest & Climate Change
Website: www.cpcb.nic.in
May - 2021


ACKNOWLEDGEMENT
Central Pollution Control Board acknowledges the efforts of all its
Regional Directorates, State Pollution Control Boards, Pollution Control
Committees and their officials associated with the work for monitoring of
noise levels & Ambient air Quality on Deepawali festival as per the
protocol prescribed by CPCB. It would not have been possible to compile
and complete this report on Ambient Noise and Ambient Air Quality
without their sincere support and efforts.

CONTRIBUTIONS
Overall Guidance : Dr. Prashant Gargava, Member Secretary
Overall Supervision & Report Editing
: Shri Gurnam Singh, Addl. Director
Project Co-ordinator : Shri P. Krishnamurthy, Sc. ‘D’
Report Preparation : Shri P. Krishnamurthy, Sc. ‘D’ Shri A. Pathak, Sc. ‘D’
Data Compilation : Dr. Dolly Kulshreshta, SSA Shri K.P. Rathi, JSA Shri Vivekanand, DEO
Laboratory Co-ordinators : Dr. R.C. Srivastava, Sc.‘D’ Shri A. Pathak, Sc. ‘D’
Noise Instruments Calibration : Shri Subhash Chand, STS
Noise Monitoring Team : Shri D. Gupta, Sc. ‘C’ Dr. Basant Shubhankar, SSA Shri Subhash Chand, STS Shri Vinod Sharma, SSA Shri K.P. Rathi, JSA Shri Nirmal Sharma, JSA Shri Alok kumar, JSA Shri Babulal Meena, SLA Shri Arun Sharma, OA(S) Shri Naresh Kumar, OA(S)
Ambient Air Quality Team : Shri M. Satheesh, Sc. ‘C’ Shri Navkant Juyal, SSA Shri Amit Kumar Sharma, JSA Shri G.M. Khan, SSA Shri V.P. Singh, SLA Shri Surendra Prasad, SLA Shri S.S. Rawat, SLA Shri Sanjay Joshi, JLA Shri Nandu Prasad, JLA Shri C.P. Singh, JLA Shri.Amit Gupta, JRF Shri Manu Mishra, FA
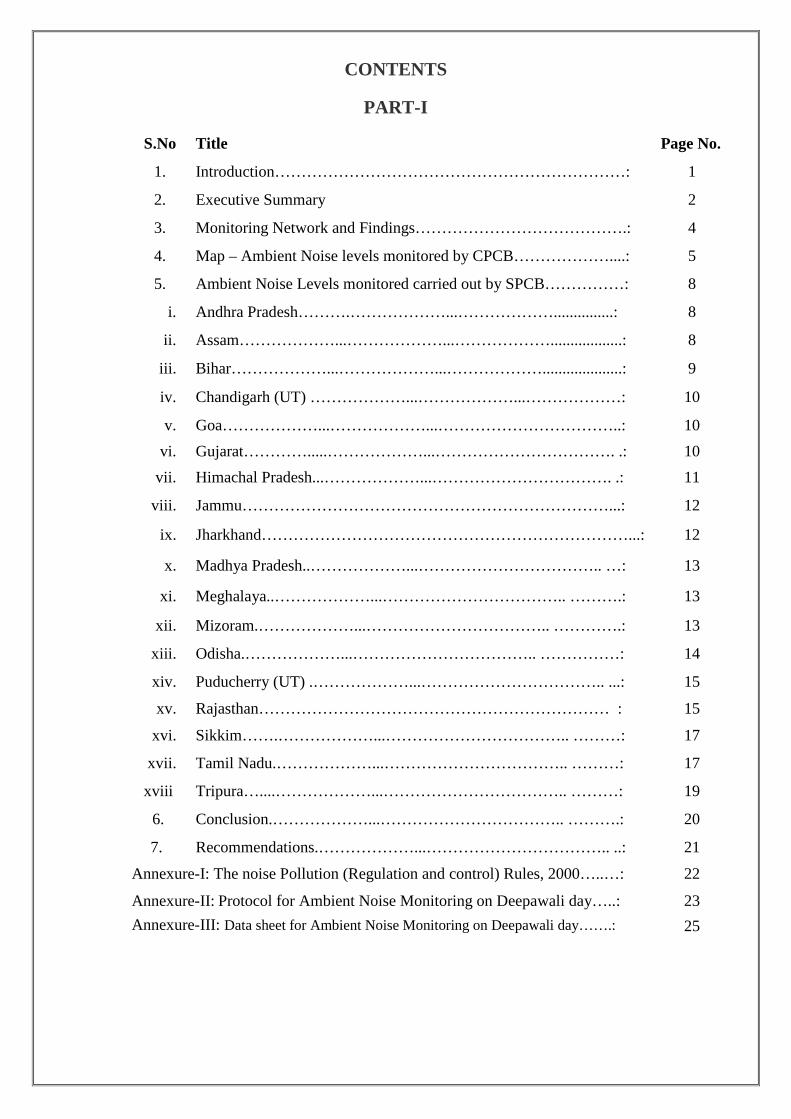
CONTENTS
PART-I
S.No Title Page No.
1. Introduction…………………………………………………………: 1
2. Executive Summary 2
3. Monitoring Network and Findings………………………………….: 4
4. Map – Ambient Noise levels monitored by CPCB………………....: 5
5. Ambient Noise Levels monitored carried out by SPCB……………: 8
i. Andhra Pradesh……….………………...………………...............: 8
ii. Assam………………...………………...………………..................: 8
iii. Bihar………………...………………...………………....................: 9
iv. Chandigarh (UT) ………………...………………...………………: 10
v. Goa………………...………………...……………………………..: 10 vi. Gujarat………….....………………...……………………………. .: 10
vii. Himachal Pradesh...………………...……………………………. .: 11
viii. Jammu……………………………………………………………...: 12
ix. Jharkhand……………………………………………………………...: 12
x. Madhya Pradesh..………………...…………………………….. …: 13
xi. Meghalaya..………………...…………………………….. ……….: 13
xii. Mizoram.………………...…………………………….. ………….: 13
xiii. Odisha.………………...…………………………….. ……………: 14
xiv. Puducherry (UT) .………………...…………………………….. ...: 15
xv. Rajasthan………………………………………………………… : 15
xvi. Sikkim…….………………...…………………………….. ………: 17
xvii. Tamil Nadu.………………...…………………………….. ………: 17
xviii Tripura…....………………...…………………………….. ………: 19
6. Conclusion.………………...…………………………….. ……….: 20
7. Recommendations.………………...…………………………….. ..: 21
Annexure-I: The noise Pollution (Regulation and control) Rules, 2000…..…: 22
Annexure-II: Protocol for Ambient Noise Monitoring on Deepawali day…..: 23 Annexure-III: Data sheet for Ambient Noise Monitoring on Deepawali day…….: 25

PART- II
S.No Title Page No.
1. Background………………………………………………………...: 26
2. Monitoring Locations………………………………….…………...: 27
3. Results and Discussion………………....…………………………..: 27
4. Summary…………………………………………………………...: 33

Central Pollution Control Board Page 1
1.0 Introduction Central Pollution Control Board (CPCB) is monitoring ambient air quality and noise levels during
Deepawali day festival from past many years to assess the status of air & noise pollution levels in
environment caused by burning of crackers. The main objective of monitoring ambient air quality and
noise levels is to ensure compliance of the Hon’ble Supreme Court directions dated October 5, 1999
& September 27, 2001 and also to examine the status & trend of pollution over the years during
Deepawali day festival.
Hon’ble Supreme Court in its order dated October 20, 2018 directed as follows:
“CPCB and respective State Pollution Control Boards/Pollution Control Committees (SPCBs/PCCs)
of the States and Union Territories shall carry out short –term monitoring in the cities for 15 days
(commencing from 7 days prior to Deepawali day and ending 7 days after Deepawali day) for
parameters namely Aluminum, Barium, Iron apart from the regulatory parameters against the short
term ambient air quality criteria values (AAQCVs) proposed by CPCB with regard to bursting of
firecrackers. This will help in generation of data on pollution caused by the bursting of firecrackers
and would be helpful for regulation and control quantity of Aluminum, Barium and Iron used in the
manufacture of firecrackers”.
In view of above CPCB informed all SPCBs/PCCs and RDs via letters dated September 17, 2020 to
carry out noise monitoring on pre-Deepawali day (November 09, 2020) and Deepawali day
(November 14, 2020) & ambient air quality monitoring from November 07, 2020 to November 21,
2020 in state capital at least for two locations and to submit the report by December 11, 2020. In
addition to the general parameters like PM10, PM2.5, SO2, NO2 and metals (Pb, Ni & As in PM10)
selected metals/elements like Al, Ba, and Fe in PM2.5 are also to be monitored to assess the impact of
fire crackers bursting during Deepawali day festival.
Accordingly, CPCB, SPCBs and PCCs has carried out AAQM 15 days continuously for the
compliance of Hon’ble supreme court and the final report has been submitted by the respective
SPCBs and PCCs individually in the Hon’ble Supreme court of India. Therefore, this year Deepawali
2020 report focused on Ambient Noise during the two year period i.e 2019 and 2020 and Ambient Air
data for the year 2020 across the country conducted by CPCB. This report divided in the following
two Parts:
Part-I: Ambient Noise Levels -2020, Part-II: Ambient Air Quality during - 2020.

Central Pollution Control Board Page 2
2.0 Executive Summary
In order to assess the impact of bursting of fire crackers during Deepawali festival, Central Pollution
Control Board (CPCB) along with all its subordinate offices & SPCBs/UTs had conducted Ambient
noise monitoring on Normal and Deepawali Day 2020.
Ambient noise monitoring data from 93 cities for 251 locations have been received in year 2020.
On pre-Deepawali day (09th November 2020) noise level ranged between 32 and 87 Leq.dB(A)
while same on the festival day (14th November 2020) ranged between 33 and 97 Leq.dB(A). On pre-
Deepawali Day, the minimum noise level 32 Leq.dB(A) was reported at SVR College, Surat
(Gujarat) and the maximum noise level 87 Leq.dB(A) was reported at Christanpatty (R), Nagaon
(Assam) while on Deepawali day minimum noise level 33 Leq.dB(A) was reported at SVR
College, Surat (Gujarat) and the maximum noise level 97 Leq.dB(A) was reported at two locations
i.e. Bank More, Dhanbad (Jharkhand) and Birla Visram (C), Madurai, Tamil Nadu. Over all, noise
level shows some improvements in this year 2020 as compared to the last year noise level.
In compliance to Hon’ble Supreme Court in the year 2018, like last year (2019), this year also
CPCB conducted Ambient air quality monitoring in 2020 at eight cities namely Delhi (CPCB Head
Quarter), Agra, Bhopal, Bengaluru, Kolkata, Lucknow, shillong and Vadodara where its Regional
Directorates are situated. 15 days monitoring (7th November to 21st November); 7 days prior (7th
November to 13th October – Pre-Deepawali period); Deepawali day (14th November) and 7 days
after Deepawali (15th November to 21st November – Post-Deepawali period) were conducted.
In addition to the NAAQS parameters (PM10, PM2.5, SO2 and NO2 and metals such as Pb, Ni &As
in PM10) and elements (Al, Ba, and Fe) used in composition of fire crackers, which may have
harmful effects on inhalation, are also included in monitoring plan. Al, Ba, and Fe are monitored in
PM2.5 fraction as proposed in short term AAQCVs.
City wise increase/decrease in PM10 and PM2.5 on Diwali day compared to Pre-Diwali period (in%).
Highest increment in PM10 on Deepawali day was reported in Lucknow (114%) followed by
Bhopal (86.2%), Delhi (67.1%), Shillong (53.7) and Kolkata (22.6%). PM2.5 was increased by 26 –
82.9% compared to Pre-Deepawali period among the various cities monitored. Highest increment
was recorded in Delhi (82.9%), followed by Bhopal (81.3%), Lucknow (67.6%), Kolkata (53.6%),
Shillong (30.5%) and Vadodara (26%).
The concentrations of criteria gaseous pollutants (SO2 and NO2) at all cities have been highlighted.
Increase in SO2 concentration on Deepawali day at cities like Delhi, Lucknow, Bhopal and
Vadodara are evident. Increase on Deepawali day may be attributed to oxidation of sulphur due to
bursting of cracker. Bengaluru and Shillong reported SO2 at Below Detection Limit (4 µg/m3). NO2
was reported within prescribed std limit (80 µg/m3) in all the cities except Delhi during Pre-
Deepawali, Deepawali and post Deepawali days. During the Pre-Deepawali period and on

Central Pollution Control Board Page 3
Deepawali day NO2 was found to above NAAQS in Delhi. Delhi, Bhopal, Lucknow and Bengaluru
reported increase in NO2 on Deepawali day compared to Pre-Deepawali period.
Lead (Pb), Nickel (Ni) and Arsenic (As) in ambient air (PM10) in various cities during the study
period has been made. Lead found to remain always within 24 hourly average standard limits during
Deepawali days (15 days monitoring period) at all cities except in Bhopal on Deepawali day
compared to pre and post Deepawali period may be a matter of further investigation. The
concentration of Nickel found higher during pre-Deepawali days in Agra, Delhi, Kolkata, Bhopal
and Vadodara may be attributed to general urban sources MSW burning. Arsenic was found to
increase and crossed the prescribed annual concentration limit on Deepawali day in Agra, Delhi,
Lucknow, Kolkata and Bhopal and it may be attributed to fireworks.
Year-wise comparison (2017 – 2020) of PM2.5 and elements in PM2.5 in Delhi during Deepawali
has been made. Reduction in Aluminium and Barium concentrations were observed in 2020
compared to 2019. Gradual betterment in ambient air metal concentrations in PM2.5 was observed
every year since 2017 after the implementations of regulatory mechanisms as suggested by Hon’ble
Courts for either restricting / banning of firecrackers or development of “Green Crackers” was
initiated in 2018. In 2020 Aluminium and Iron found within proposed AAQCVs concentrations.
Barium found exceeding proposed AAQCVs concentrations on Deepawali day in Delhi; still a
reduction of 38.8% was observed in 2020 compared to 2019.

PART-I
Ambient Noise Levels during Deepawali festival - 2020

[AMBIENT NOISE LEVELS DURING DEEPAWALI FESTIVAL 2020]
Central Pollution Control Board Page 4
2.0 Monitoring Network and Findings:
Ambient Noise Levels: With the view to maintain the uniformity in monitoring across the country, CPCB prepared protocol for monitoring of ambient noise levels and circulated it to all SPCBs, RDs and PCCs in the country. A total number of 19 locations in 08 different cities covering 06 States and 01 UT across the country were monitored for ambient noise level during Deepawali festival- 2020 by CPCB-Head Office and its 07 Regional Directorates. The monitoring network is given in the table-1(a).
Ambient noise level monitoring to see the impact of bursting of crackers on environment during Deepawali festival, 2020 was conducted by SPCBs/PCCs as per protocol of CPCB. Out of which Ambient noise level monitoring data of pre Deepawali and Deepawali day in the year, 2020 for 232 locations in 85 different cities of 15 states and 3 UTs have been received from respective SPCBs/PCCs. The monitoring network is given in the table-1(b).
Table -1(a) : State/City-wise No. of locations monitored by CPCB & RDs during Deepawali Festival - 2020
S. No. State/UT City No. of Locations 1. Delhi(UT) Delhi 06 2. Gujarat Vadodara 02 3. Karnataka Bangaluru 02 4. Madhya Pradesh Bhopal 02 5. Meghalaya Shillong 01
6. Uttar Pradesh Agra 02 Lucknow 02
7. West Bengal Kolkatta 02 Total 19
Table –1(b): State/City-wise No. of locations monitored by SPCBs during Deepawali Festival, 2020
S. No. State Ambient Noise Monitoring 2020
No. of Cities No. of Locations 1. Andhra Pradesh 05 15 2. Assam 08 22 3. Bihar 01 06 4. Chandigarh (UT) 01 04 5. Goa 04 04 6. Gujarat 05 16 7. Himachal Pradesh 10 10 8. Jharkhand 01 03 9. Jammu (UT) 01 04 10. Madhya Pradesh 01 03 11. Meghalaya 01 04 12. Mizoram 01 04 13. Odisha 14 53 14. Puducherry (UT) 01 01 15. Rajasthan 14 30 16. Sikkim 01 01 17. Tamil Nadu 12 25 18. Tripura 04 27
Total 85 232

[AMBIENT NOISE LEVELS DURING DEEPAWALI FESTIVAL 2020]
Central Pollution Control Board Page 5
3(A) Ambient Noise Monitoring carried out by CPCB:
Comparison of Ambient noise levels during Deepawali festival 2019 & 2020 (Pre-Deepawali & Deepawali day) data received from the Regional Directorates of CPCB is given in the Map. The results are compared with previous year data (2019).
Map: Ambient Noise Monitoring Data during Pre-Deepawali & Deepawali day 2020 monitored by CPCB
Pre-Deepawali Day Deepawali Day
Lucknow
Bangaluru
LUCKNOW (Ambient Noise Levels) Locations 2019 2020 Mayur Vihar Indra Ng.(R) 67 81 59↓ 76↓ Vikas Khand Gomti Ng(R) 61 68 57↓ 58↓
DELHI (Ambient Noise Levels) Locations 2019 2020 Lajpat Nagar(R) 63 69 60↓ 71↑ Mayur Vihar Ph-II(R) 63 68 60↓ 72↑ Pitampura(R) 49 68 55↑ 57↓ Kamla Nagar(R) 62 70 62= 70= Janakpuri(R) 57 71 56↓ 72↑ Okhla (C) 59 66 59= 62↓
AGRA (Ambient Noise Levels) Locations 2019 2020 Kamla Nagar(R) 58 81 - - HR Estate(R) 55 82 70↑ 81↓ GPRA Colony (R) - - 60 69
Vadodara
Bhopal Kolkatta
Shillong
Agra
Delhi
KOLKATTA (Ambient Noise Levels) Locations 2019 2020 Salt Lake, North Kolkata(R) 56 67 54↓ 60↓ Kasba, South Kolkata(C) 55 70 57↑ 59↓
VADODARA (Ambient Noise Levels) Locations 2019 2020 MS University(R) 54 65 56↑ 65= Harinagar(R) 67 80 64↓ 80=
SHILLONG (Ambient Noise Levels) Locations 2019 2020 Lower Motinagar(R)
55 71 53↓ 67↓
BHOPAL (Ambient Noise Levels)
Locations 2019 2020 Nehru Nagar(R) 58 69 59↑ 77↑ North T.T. Nagar(C) 69 75 63↓ 74↓
BANGALURU (Ambient Noise Levels) Locations 2019 2020 Rajarajeshwari Nagar(R) 62 67 - - Basaveshwar Nagar(R) 58 76 64↑ 66↓ Nagarabhavi - - 67 75

[AMBIENT NOISE LEVELS DURING DEEPAWALI FESTIVAL 2020]
Central Pollution Control Board Page 6
In Delhi, in addition to the manual sampling locations, Real time noise level monitoring also conducted by CPCB at 10 various locations in Delhi for comparison as follows. (B) Real-time Noise Monitoring Data: Round the clock (24X7) noise level monitoring at ten locations in Delhi is being conducted by CPCB.
The data of selected pre-Deepawali day (2019-2020) is tabulated at Table 2a. The data reveals that
day time noise levels have decreased in 2020 as compared to pre-deepawali day of 2019 at seven out
of 10 locations. Only NSIT Dwarka, R. K. Puram and ITO stations have recorded slight increase in
day time noise. The night time noise found increased at Anand Vihar and ITO only (both traffic area).
Table 2(a): Online Ambient Noise Level data during Pre-Deepawali (2019-2020) Monitoring Stations Pre-Deepawali Day (All values are in Leq dB(A)
21.10.2019 09.11.2020 Day Time Night Time Day Time Night Time
1 Anand Vihar (C) 66 63 65↓ 78↑
2 Punjabi Bagh (R) 60 50 56↓ 50= 3 CPCB HQ (C) 67 59 66↓ 54↓ 4 Civil Lines (C) 62 58 60↓ 57↓ 5 DCE, Bawana (S) 60 58 51↓ 50↓
6 Dilshad Garden(S) 85 79 74↓ 74↓ 7 ITO (C) 73 70 74↑ 74↑ 8 Mandir Marg (S) 70 53 49↓ 48↓ 9 NSIT, Dwarka (S) 56 55 58↑ 54↓
10 R.K. Puram (S) 62 66 69↑ 65↓ Area Designation (C) – Commercial, (R) – Residential, (S) – Sensitive
Prescribed Standards in Leq dB(A): (C) – 65 (Day time) 55 (night time); (R) - 55 (Day time) 45 (night time) and (S) - 50 (Day time) 40 (night time)
Day Time – 0600 hrs to 2200 hrs and Night time – 2200 hrs to 0600 hours
[AMBIENT NOISE LEVELS DURING DEEPAWALI FESTIVAL 2020]
Central Pollution Control Board Page 7
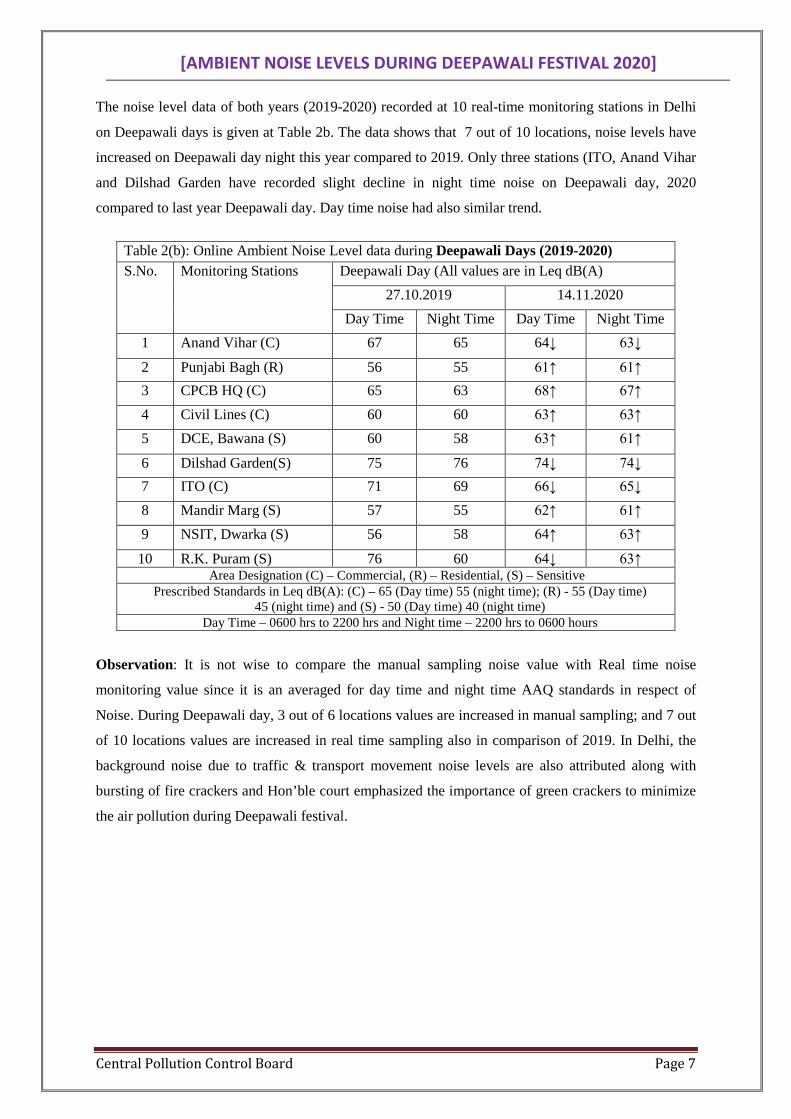
The noise level data of both years (2019-2020) recorded at 10 real-time monitoring stations in Delhi
on Deepawali days is given at Table 2b. The data shows that 7 out of 10 locations, noise levels have
increased on Deepawali day night this year compared to 2019. Only three stations (ITO, Anand Vihar
and Dilshad Garden have recorded slight decline in night time noise on Deepawali day, 2020
compared to last year Deepawali day. Day time noise had also similar trend.
Table 2(b): Online Ambient Noise Level data during Deepawali Days (2019-2020) S.No. Monitoring Stations Deepawali Day (All values are in Leq dB(A)
27.10.2019 14.11.2020 Day Time Night Time Day Time Night Time
1 Anand Vihar (C) 67 65 64↓ 63↓
2 Punjabi Bagh (R) 56 55 61↑ 61↑ 3 CPCB HQ (C) 65 63 68↑ 67↑ 4 Civil Lines (C) 60 60 63↑ 63↑ 5 DCE, Bawana (S) 60 58 63↑ 61↑
6 Dilshad Garden(S) 75 76 74↓ 74↓ 7 ITO (C) 71 69 66↓ 65↓ 8 Mandir Marg (S) 57 55 62↑ 61↑ 9 NSIT, Dwarka (S) 56 58 64↑ 63↑
10 R.K. Puram (S) 76 60 64↓ 63↑ Area Designation (C) – Commercial, (R) – Residential, (S) – Sensitive
Prescribed Standards in Leq dB(A): (C) – 65 (Day time) 55 (night time); (R) - 55 (Day time) 45 (night time) and (S) - 50 (Day time) 40 (night time)
Day Time – 0600 hrs to 2200 hrs and Night time – 2200 hrs to 0600 hours
Observation: It is not wise to compare the manual sampling noise value with Real time noise
monitoring value since it is an averaged for day time and night time AAQ standards in respect of
Noise. During Deepawali day, 3 out of 6 locations values are increased in manual sampling; and 7 out
of 10 locations values are increased in real time sampling also in comparison of 2019. In Delhi, the
background noise due to traffic & transport movement noise levels are also attributed along with
bursting of fire crackers and Hon’ble court emphasized the importance of green crackers to minimize
the air pollution during Deepawali festival.

[AMBIENT NOISE LEVELS DURING DEEPAWALI FESTIVAL 2020]
Central Pollution Control Board Page 8
4. Ambient Noise Monitoring carried out by SPCBs & PCCs:
Andhra Pradesh
Observations: This year 2020, ambient noise monitoring has been carried out at fifteen locations in five cities. On pre-Deepawali-day noise level ranged between 50 and 78 Leq.dB(A), while on the festival day it ranged between 53 and 93 Leq.dB(A). The maximum noise level value of 93 Leq.dB(A) was reported at Laxmi Puram (R), Guntur city on the festival day. Since, the last year (2019) data has not received, the comparison was not made and as such data of this year has given in table-3.
Table 3 : Ambient Noise Levels in Leq.dB(A) at different locations during Pre-Deepawali & Deepawali day 2020 in Andhra Pradesh
S. No.
Cities Locations Pre-Deepawali day 2020
Deepawali day 2020
1. Vijaywada Benz Circle (C) 69 87 2. IMAH (C) 62 83 3. Yenamalakuduru (R ) 61 80 4. Nellore Terrace of Regional Office (R) 62 61 5. Chandramouli Nagar (R) 51 54 6. Dr. P.V. Ramchandra Reddy
Hospital (C/S ) 50 53
7. Ongole Terrace of Municipal Corporation (C/R)
67 77
8. Terrace of Sri Nilayam, Sambasiva Nagar (R)
78 81
9. Terrace of Prakasam Milk Prodcue Company (R )
78 77
10. Guntur Laxmi Puruam (R ) 73 93 11. Brodipet, Guntur (C ) 77 89 12. Brundhavan Garden (S) 71 91 13. Kurnool Govt. Hospital (S) 72 78 14. Montessori High Schoo (S) 69 71 15. Venkatramana Colony (R ) 71 74
Assam
Observations: This year 2020, ambient noise monitoring has been carried out at twenty two locations in eight cities. On pre-Deepawali-day noise level ranged between 47 and 87 Leq.dB(A), while on the festival day it ranged between 50 and 88 Leq.dB(A). The maximum noise level value of 88 Leq.dB(A) was reported at Christanpatty (R) and Haibargaon Bazar(C), Nagaon city on the festival day. The data of this year has compared with previous year and the same has given in table-4.
Table 4 : Ambient Noise Levels in Leq.dB(A) at different locations during Pre-Deepawali & Deepawali day 2019 & 2020 in Assam
S. No.
Cities Locations Pre-Deepawali day Deepawali day 2019 2020 2019 2020
1. Guwahati Panbazar MMC (S) 58 57↓ 79 70↓ 2. Ganeshguri(C) 68 65↓ 71 68↓ 3. Ulubari, Charial 67 66↓ 79 75↓

[AMBIENT NOISE LEVELS DURING DEEPAWALI FESTIVAL 2020]
Central Pollution Control Board Page 9
S. No.
Cities Locations Pre-Deepawali day Deepawali day 2019 2020 2019 2020
4. Silchar Ambicapatty(R) 58 56↓ 69 61↓ 5. Silchar Medical Collage(S) 51 - 59 - 6. Tarapur(C) 63 - 72 - 7. Janiganj Bazar (C) - 58 - 68 8. Near Court Complex (S) - 50 - 60 9. Bongaigaon Barapara(R) 53 48↓ 61 56↓ 10. Paulpara(R) 52 - 65 - 11. Civil Hospital(S) 49 47↓ 60 50↓ 12. Paglasthan(C) - 69 - 71 13. Dibrugarh Maruwipatty(C) 64 - 91 - 14. Assam Medical Collage &
Hospital(S) 51 51= 64 56↓
15. Milan Nagar (R) 62 62= 79 73↓ 16. H.S. Road (C) - 64 - 84 17. Tezpur Main Bazar (C) 70 73↑ 86 79↓ 18. Mazgaon (R) 60 61↑ 80 76↓ 19. Civil Hosppital (S) 62 63↑ 78 76↓ 20. Nagaon Civil Hospital (S) 66 73↑ 72 73↑ 21. Christanpatty (R) 73 87↑ 73 88↑ 22. Haibargaon Bazar(C) 71 85↑ 87 88↑ 23. Sivasagar Melachakar (R) 56 57↑ 71 70↓ 24. Central Market(C) 60 63↑ 82 81↓ 25. Sivadol Near DC office(S) 51 52↑ 66 62↓ 26. Golaghat Market Area, Golaghatz(C) 67 63↓ 71 69↓
Note: (-) indicates data not received.
Bihar Observations: In this state, this year 2020, ambient noise monitoring has been carried out at six locations in Patna city. On pre-Deepawali day noise level ranged between 56 and 80 Leq.dB(A), while on the festival day it ranged between 67 and 82 Leq.dB(A). The maximum noise level value of 82 Leq.dB(A) was reported at Boring Road Crossing, on the festival day. Since, the last year (2019) data has not received, the comparison was not made and as such data of this year has given in table-5.
Table 5 : Ambient Noise Levels in Leq.dB(A) at different locations during Pre-Deepawali & Deepawali day 2020 in Bihar
S.No. City Locations Pre-Deepawali day 2020
Deepawali day 2020
1. Patna Boring Road Crossing 80 82
2. Parivesh Bhawan, Patliputra, IA 56 78
3. Betron Bhawan, Shastri Nagar, 61 76
4. Hindustan Coca Cola Beverage Pvt. Ltd, Patliputra (I)
69 68
5. Planetarium (IGSC) Adalatganj 62 67
6. IGIMS, Main Gate, Sheikhpura, Bailey Road
57 68

[AMBIENT NOISE LEVELS DURING DEEPAWALI FESTIVAL 2020]
Central Pollution Control Board Page 10
Chandigarh (UT)
Observations: In this UT, this year 2020, ambient noise monitoring was carried out at four locations in Chandigarh city. On pre-Deepawali day noise level ranged between 51 and 61 Leq.dB(A), while on the festival day it ranged between 54 and 63. The maximum noise value 63 Leq.dB(A) was reported at Sector - 22 on the festival day. The data of this year has compared with previous year and the same has given in table-6.
Goa
Observations: In this state, this year 2020, ambient noise monitoring was carried out at four locations in four cities. On pre-Deepawali day noise level ranged between 58 and 67 Leq.dB(A), while on the festival day, noise level ranged between 61 and 75 Leq.dB(A). The maximum noise level value 75 Leq.dB(A) was reported at Margo Municipality Garden (C), Margo on Deepawali day. The data of this year has compared with previous year and the same has given in table-7.
Table-7 : Ambient Noise Levels in Leq.dB(A) at different locations during Pre-Deepawali & Deepawali day 2019 & 2020 in Goa
S. No. Cities Locations
Pre-Deepawali day Deepawali day 2019 2020 2019 2020
1. Mapusa Mapusa Municipality(C) 72 64↓ - 67 2. Panjim Panjim(C) 32 58↑ 67 61↓ 3. Vasco Fuse Call Office(C) 60 63↑ 66.8 71↑
4. Margao Margao Municipality Garden(C) 67 67= 67.3 75↑
Note: (-) indicates data not received.
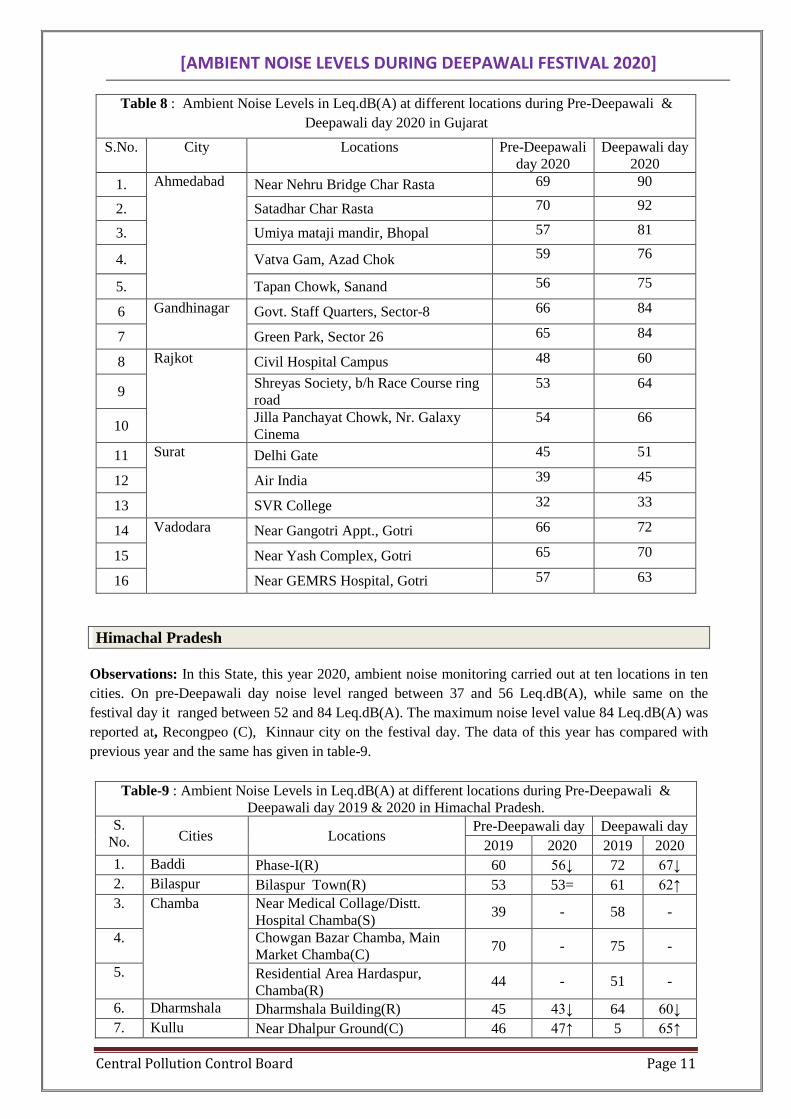
Gujarat
Observations: In this State, this year 2020, ambient noise monitoring carried out at sixteen locations in five cities. On pre-Deepawali day noise level ranged between 32 and 70 Leq.dB(A), while same on the festival day it ranged between 33 and 92 Leq.dB(A). The maximum noise level value 92 Leq.dB(A) was reported at, Recongpeo Satadhar Char Rasta, Ahmedabad city on the festival day. Since, the last year (2019) data has not received, the comparison was not made and as such data of this year has given in table-8.
Table 6 : Ambient Noise Levels in Leq.dB(A) at different locations during Pre-Deepawali & Deepawali day 2019 & 2020 in Chandigarh
S.No. City Locations Pre-Deepawali day Deepawali day 2019 2020 2019 2020
1. Chandigarh Sector – 22 58 54↓ 77 63↓ 2. Sector – 17 55 51↓ 63 54↓ 3. IMTECH 56 55↓ 63 61↓ 4. PEC – 12 63 61↓ 64 56↓
[AMBIENT NOISE LEVELS DURING DEEPAWALI FESTIVAL 2020]
Central Pollution Control Board Page 11
Himachal Pradesh
Observations: In this State, this year 2020, ambient noise monitoring carried out at ten locations in ten cities. On pre-Deepawali day noise level ranged between 37 and 56 Leq.dB(A), while same on the festival day it ranged between 52 and 84 Leq.dB(A). The maximum noise level value 84 Leq.dB(A) was reported at, Recongpeo (C), Kinnaur city on the festival day. The data of this year has compared with previous year and the same has given in table-9.
Table-9 : Ambient Noise Levels in Leq.dB(A) at different locations during Pre-Deepawali & Deepawali day 2019 & 2020 in Himachal Pradesh.
S. No. Cities Locations
Pre-Deepawali day Deepawali day 2019 2020 2019 2020
1. Baddi Phase-I(R) 60 56↓ 72 67↓ 2. Bilaspur Bilaspur Town(R) 53 53= 61 62↑ 3. Chamba Near Medical Collage/Distt.
Hospital Chamba(S) 39 - 58 -
4. Chowgan Bazar Chamba, Main Market Chamba(C) 70 - 75 -
5. Residential Area Hardaspur, Chamba(R) 44 - 51 -
6. Dharmshala Dharmshala Building(R) 45 43↓ 64 60↓ 7. Kullu Near Dhalpur Ground(C) 46 47↑ 5 65↑
Table 8 : Ambient Noise Levels in Leq.dB(A) at different locations during Pre-Deepawali & Deepawali day 2020 in Gujarat
S.No. City Locations Pre-Deepawali day 2020
Deepawali day 2020
1. Ahmedabad Near Nehru Bridge Char Rasta 69 90
2. Satadhar Char Rasta 70 92
3. Umiya mataji mandir, Bhopal 57 81
4. Vatva Gam, Azad Chok 59 76
5. Tapan Chowk, Sanand 56 75
6 Gandhinagar Govt. Staff Quarters, Sector-8 66 84
7 Green Park, Sector 26 65 84
8 Rajkot Civil Hospital Campus 48 60
9 Shreyas Society, b/h Race Course ring road
53 64
10 Jilla Panchayat Chowk, Nr. Galaxy Cinema
54 66
11 Surat Delhi Gate 45 51
12 Air India 39 45
13 SVR College 32 33
14 Vadodara Near Gangotri Appt., Gotri 66 72
15 Near Yash Complex, Gotri 65 70
16 Near GEMRS Hospital, Gotri 57 63

[AMBIENT NOISE LEVELS DURING DEEPAWALI FESTIVAL 2020]
Central Pollution Control Board Page 12
8. Kinnaur Recongpeo(C) 53 54↑ 76 84↑ 9. Parwanoo Sector IV(R) 52 48↓ 62 68↑
10. Paonta Sahib Himuda Colony, Shubkhera,(R) 50 50= 64 62↓ 11. Rampur Bhushar (C) 53 55↑ 81 81= 12. Shimla Rigde (C) 47 47= 79 78↓ 13. Una Rotary Chowk (R) 71 - 92 - 14. Rakkar Colony (R) 42 37↓ 45 52↑ 15. Govt. Hospital (S) 46 - 66 -
Note: (-) indicates data not received.
Jammu
Observations: In this state, this year 2020, ambient noise monitoring was carried out at four locations in Jammu city. On pre-Deepawali day noise level ranged between 77 and 78 Leq.dB(A), while on the festival day, it ranged between 85 and 94 Leq.dB(A). The maximum noise level value 94 Leq.dB(A) was reported at Gole Market, Gandhi Nagar (C ) on the festival day. The data of this year has compared with previous year and the same has given in table-10.
Table-10 : Noise Levels in Leq.dB(A) at different locations during Pre-Deepawali & Deepawali day 2019 & 2020 in Jammu
S. No. City Locations
Pre-Deepawali day Deepawali day 2019 2020 2019 2020
1.
Jam
mu
Rehari Chungi(C) 75 77↑ 86 90↑ 2. Gole Market Gandhi Nagar(C) 75 78↑ 93 94↑ 3. Bakshi Nagar(Govt. Medical
College) 77 77= 83 85↑
4. Kachi Chowini/ Parade(C) 78 77↓ 87 91↑
Jharkhand Observations: In this state, this year 2020, ambient noise monitoring was carried out at three locations in Dhanbad city. On pre-Deepawali day noise level ranged between 65 and 72 Leq.dB(A), while on festival day it ranged between 93 and 97 Leq.dB(A). The maximum noise level value 97 Leq.dB(A) was reported at Bank More, Dhanbad on the festival day. Since, the last year (2019) data has not received, the comparison was not made and as such data of this year has given in table-11.
Table 11 : Ambient Noise Levels in Leq.dB(A) at different locations during Pre-Deepawali & Deepawali day 2020 in Jharkhand State
S. No.
City Locations Pre-Deepawali day 2020
Deepawali day 2020
1. Dhanbad Bartand 69 93
2. Hirapur 65 96
3. Bank More 72 97

[AMBIENT NOISE LEVELS DURING DEEPAWALI FESTIVAL 2020]
Central Pollution Control Board Page 13
Madhya Pradesh Observations: In this state, this year 2020, ambient noise monitoring was carried out at three locations in Guna city. The pre-Deepawali day noise level ranged between 39 and 47 Leq.dB(A), while s on Deepawali day it ranged between 52 and 81 Leq.dB(A). The maximum noise level value 81 Leq.dB(A) was reported at Jai Stambh Chauraha Near Traffic Police Centre (C ), Guna on the festival day. Since, the last year (2019) data has not received, the comparison was not made and as such data of this year has given in table-12.
Meghalaya
Observations: In this state, this year 2020, ambient noise monitoring carried out at four locations in Shillong city. On pre-Deepawali day noise level ranged between 47 and 51 Leq.dB(A), while on festival day, it ranged between 54 and 64 Leq.dB(A). The maximum noise level value of 64 Leq.dB(A) was reported at Lumpyngngad, (R) and Police Bazar (C) and in Shillong on the festival day. The data of this year has compared with previous year and the same has given in table-13.
Table-13: Ambient Noise Levels in Leq.dB(A) at different locations during Pre-Deepawali & Deepawali day 2019 & 2020 in Meghalaya
S.No. City Locations Pre-Deepawali day Deepawali day 2019 2020 2019 2020
1. Shillong Lumpyngngad (R) 52 50↓ 64 64= 2. Police Bazar (C) 63 51↓ 73 64↓ 3. Lawmali (S) 55 47↓ 68 58↓ 4. EPIT, Byrnihat - 50 - 54
Note: (-) indicates data not received. Mizoram
Observations: In this State, this year 2020, ambient noise monitoring was carried out at four locations in Aizawl city. On pre-Deepawali day noise level ranged between 37 and 55 Leq.dB(A), while on festival day, it ranged between 36 and 57 Leq.dB(A). The maximum noise level value of 57 Leq.dB(A) was reported at Bawngkawn, Aizawl on Deepawali day. The data of this year has compared with previous year and the same has given in table-14.
Table-12: Ambient Noise Levels in Leq.dB(A) at different locations during Pre-Deepawali & Deepawali day 2020 in Madhya Pradesh
S. No.
Cities Locations Pre-Deepawali day 2020
Deepawali day 2020
1. Guna Debu Colony (R) 43 79 2. Jai Stambh Chauraha Near Traffic Police
Centre, (C ) 47 81
3. District Hospital 39 52

[AMBIENT NOISE LEVELS DURING DEEPAWALI FESTIVAL 2020]
Central Pollution Control Board Page 14
Table-14 : Ambient Noise Levels in Leq.dB(A) at different locations during Pre-Deepawali &
Deepawali day 2019 & 2020 in Mizoram
S.No. City Locations Pre-Deepawali day Deepawali day
2019 2020 2019 2020
1. Aizawl Laipuitlang 49 44↓ 49 41↓
2. Dawrpui 57 55↓ 56 54↓
3. Khatla - 37 - 36
4. Bawngkawn - 42 - 57
Note: (-) indicates data not received.
Odisha
Observations: In this State, this year 2020, ambient noise monitoring was carried out at fifty three locations in fourteen cities. On pre-Deepawali day noise level ranged between 47 and 80 Leq.dB(A), while same on the festival day it ranged between 46 and 80 Leq.dB(A). The maximum noise level value as 80 Leq.dB(A) was reported at Kalinganagar Industrial Complex, Kalinganagar on pre-Deepawali Day and Nayapalli, Bhubaneswar on festival day. The data of this year has compared with previous year and the same has given in table-15.
Table-15: Ambient Noise Levels in Leq.dB(A) at different locations during Pre-Deepawali & Deepawali day 2019 & 2020 in Odisha State
S.No. Cities Locations Pre-Deepawali day Deepawali day 2019 2020 2019 2020
1.
Ang
ul Amalpada (R) 63 58↓ 73 66↓
2. Bazar Chhak (C) 74 60↓ 82 63↓ 3. District HQ (S) 65 70↑ 66 73↓ 4. Hakimpada, East Angul (I) 61 63↑ 67 66↓ 5.
Bal
asor
e Sahadevkhunta (R) 63 55↓ 79 64↓ 6. Motiganj (C) 80 73↓ 87 76↓ 7. District HQ Hos. (I) 60 59↓ 66 60↓ 8. Balasore Industrial Estate I) 58 60↑ 73 64↓ 9.
Ber
ham
pur Brahmanagar (R) 55 49↓ 73 62↓
10. Girija Market Square (C) 76 70↓ 76 75↓
11. MKCG Medical College Hospital Campus (S) 64 61↓ 67 58↓
12. Ankuli Industrial Estate (I) 65 67↑ 67 60↓ 13.
Bhu
bane
sw
ar
Nayapalli (R) 65 65= 67 80↑ 14. Sahid Nagar (C) 61 74↑ 72 79↑ 15. Capital Hospital (S) 55 49↓ 63 61↓ 16. Rasulgarh (I) 58 61↑ 69 70↑ 17.
Cut
tack
Suryaihar Link (R) 67 64↓ 76 70↓ 18. Badambadi (C) 76 70↓ 77 71↓
19. SCB Medical College & Hospital (S) 67 65↓ 69 67↓
20. Khapuria Industrial Estate(I) 71 66↓ 76 65↓

[AMBIENT NOISE LEVELS DURING DEEPAWALI FESTIVAL 2020]
Central Pollution Control Board Page 15
S.No. Cities Locations Pre-Deepawali day Deepawali day
2019 2020 2019 2020 21.
Jhar
sugu
da Cox Colony(R) 68 50↓ 88 68↓
22. Jhanda Chowk (C) 70 67↓ 82 72↓ 23. Near Mangala Bazar(S) 67 86 - 24. Bombay Chowk (I) 71 72↑ 80 66↓ 25.
Kal
inga
naga
r Sapagadia (R) 71 70↓ 84 65↓ 26. Gopabandhu Chhak (C) 77 77= 83 76↓ 27. CHC Hospital (S) 71 72↑ 78 69↓ 28. Duburi Chowk, Kalignagar 68 - 78 -
29. Kalinganagar Industrial Complex - 80 - 72
30.
Keo
njha
r Baniapat Chowk (R) 72 62↓ 75 76↓ 31. Punjabi Chowk (C) 76 68↓ 81 72↓ 32. Govt. Hospital (S) 64 60↓ 71 66↓ 33. Drupada I/E 70 74 34.
Kon
ark Madhipur(R) 58 47↓ 64 57↓
35. NAC Market (C) 75 57↓ 72 60↓ 36. Public Health Center(I) 60 50↓ 60 46↓ 37.
Pard
eep
PPT colony, Madhuban (R) 64 54↓ 72 58↓ 38. Badpadia Market (C) 70 65↓ 76 65↓
39. Biji Memorial Hos., Atharbanki(S) 58 56↓ 73 63↓
40. IFFCO Ltd. (I) 67 59↓ 78 64↓ 41.
Puri
Kumutisahi, Old Sadar lane(R) 71 72↑ 77 64↓ 42. Sri Mandir, Puri(C) 77 78↑ 84 75↓ 43. District HQ Hospital (S) 65 65= 74 60↓ 44.
Ray
agad
a Indira Nagar 74 69↓ 89 68↓ 45. Main Market 74 68↓ 83 72↓ 46. Dist. HQ Hospital 72 64↓ 81 64↓ 47. JESCO(I) 68 76↓ 80 75↓ 48.
Rou
rkel
a
Sec- 6(R) 51 48↓ 71 66↓ 49. Amabagan(C) 64 60↓ 72 64↓ 50. IGH, Steel Township(S) 49 49= 62 55↓ 51. Main Gate of RSP (SAIL)(I) 67 72↑ 68 62↓ 52. Sector-4(R) - - - - 53. Bisra Chowk(C) - - - - 54.
Sam
balp
ur Ainthapall(R) 59 60↑ 78 65↓
55. Goal Bazar Chowk(C) 75 74↓ 83 74↓
56. Dist. HQ Hospital, Modipara(S)
53 54↑ 71 60↓
57. Bareipali (I) 67 59↓ 84 70↓ Note: (-) indicates data not received.

[AMBIENT NOISE LEVELS DURING DEEPAWALI FESTIVAL 2020]
Central Pollution Control Board Page 16
Puducherry (UT)
Observations: In this UT, this year 2020, ambient noise monitoring was carried out at only one location i.e. Mudaliarpet R). On pre-Deepawali day, noise level was 69 Leq.dB(A), while on the festival day it was reported 86 Leq.dB(A). The data of this year has compared with previous year and the same has given in table-16.
Table-16: Ambient Noise Levels in Leq.dB(A) at different locations during Pre-Deepawali & Deepawali day 2019 & 2020 in Puducherry
S.No. City Location Pre-Deepawali day Deepawali day 2019 2020 2019 2020
1. Puducherry Mudaliarpet (R) 70 69↓ 91 86↓
Rajasthan
Observations: In this State, this year 2020, ambient noise was monitoring carried out at thirty locations in fourteen cities. On pre-Deepawali day noise level ranged between 49 and 75 Leq.dB(A), while same on the Deepawali day noise level ranged between 56 and 78 Leq.dB(A). The maximum noise level 78 Leq.dB (A) was reported at two locations i.e. Pole Gate (C), Udaipur and Kala Kuan (R), Alwar on the festival day. The data of this year has compared with previous year and the same has given in table-17.
Table-17: Ambient Noise Levels in Leq.dB(A) at different locations during Pre-Deepawali & Deepawali day 2019 & 2020 in Rajasthan
S. No. Cities Locations
Pre-Deepawali day Deepawali day 2019 2020 2019 2020
1.
Jaipur
Gandhi Nagar (R) 57 67↑ 93 67↓ 2. Jawahar Nagar (R) 63 55↓ 81 60↓ 3. Raja Park (C) 66 61↓ 80 67↓ 4. Mansarovar (C) 57 49↓ 83 66↓ 5. SDM Hospital (S) 65 62↓ 72 60↓ 6. Civil Line (S) 67 65↓ 71 68↓ 7. Ajmer Kutchery Road (R) 73 71↓ 74 76↑ 8.
Bhilwara Azad Nagar (R) 70 51↓ 91 61↓
9. Kumbha Circle Azad Ngr (C) 66 70↑ 76 75↓ 10.
Pali Maharaja Shree Umed Mils (R) 69 67↓ 68 73↑
11. Surajpol,Townhall (C) 67 67= 68 74↑ 12. Bangur Hospital (S) 65 72↑ 68 76↑ 13. Bikaner Junagarh (C) 71 71= 79 73↓ 14.
Jodhpur Shashtri Ngr P.Station (C) 64 64= 79 67↓
15. Maha Mandir Police Station(R) 64 63↓ 81 62↓ 16.
Kota MBS Hospital(S) 69 66↓ 74 74=
17. Dadawada(R) 56 53↓ 67 63↓ 18. Gumanpura(C) 70 69↓ 86 77↓

[AMBIENT NOISE LEVELS DURING DEEPAWALI FESTIVAL 2020]
Central Pollution Control Board Page 17
Sikkim
Observations: In this State, this year 2020, ambient noise monitoring was carried out at one location, M.G. Marg in Sikkim. On Pre-Deepawali Day it was reported as 61 Leq dB(A) whereas it was reported as 60 Leq DB(A) on Deepawali day. Since, the last year (2019) data has not received, the comparison was not made and as such data of this year has given in table-18.
Tamil Nadu
Observations: In this State, this year 2020, ambient noise monitoring was carried out at twenty five locations in twelve cities. On pre-Deepawali day noise level ranged between 50 and 78 Leq.dB(A), while on festival day it ranged between 67 and 97 Leq.dB(A). The maximum noise level as 97 Leq.dB (A) was reported at Birla Visram(C), Madurai on festival day. The data of this year has compared with previous year and the same has given in table-19.
S. No.
Cities Locations Pre-Deepawali day Deepawali day
2019 2020 2019 2020 19.
Udaipur Pole Gate (C) 76 75↓ 83 78↓
20. M.B. Hospital (S) 68 69↑ 69 71↑ 21. Amba Mata Scheme (R) 69 70↑ 79 73↓ 22.
Alwar Kala Kuan (R) 64 51↓ 91 78↓
23. General Hospital (S) 61 62↑ 71 66↓ 24.
Bhiwadi Ashiana Garden Society (R) 62 63↑ 78 70↓
25. Star Hospital (S) 60 57↓ 73 60↓ 26. Sikar Nawalgarh Road 59 52↓ 71 56↓ 27.
Chitorgarh Public Park (C) 63 60↓ 77 63↓
28. Guard Ofc. Kumbha 60 65↑ 80 70↓ 29. Bharatpur laxmi Mandir Shouwk (C) 61 62↑ 71 66↓
30. Balotra Maheshwari railway Crossing (C) 59 52↓ 76 73↓
Table-18 : Ambient Noise Level in Leq.dB(A) during Pre-Deepawali & Deepawali day, 2020 in Sikkim
S. No. Cities Locations
Pre-Deepawali day 2020
Deepawali day 2020
1. Sikkim M.G. Marg 61 60

[AMBIENT NOISE LEVELS DURING DEEPAWALI FESTIVAL 2020]
Central Pollution Control Board Page 18
Table-19 : Ambient Noise Levels in Leq.dB(A) at different locations during Pre-Deepawali & Deepawali day 2019 & 2020 in Tamil Nadu
S. No.
Cities Locations Pre-Deepawali day Deepawali day
2019 2020 2019 2020 1. Chennai Besant Nagar(R) 55 68↑ 76 84↑ 2. Nungambakkam(R) 57 64↑ 79 75↓ 3. Sowcarpt(C) 73 55↓ 84 78↓ 4. T. Nagar(C) 80 64↓ 80 79↓ 5. Triplicane(R) - 60 - 78 6. Coimbatore Kavundampalayam(R) 68 61↓ 79 73↓ 7. District Collector Office(M) 62 60↓ 66 67↑ 8. Cuddalore Imperial Road (C) 77 77= 81 82↑ 9. Pudupalayam Village(R) 65 71↑ 77 80↑
10. Dindigul Nagal Pudhur(R) 55 59↑ 64 72↑ 11. Rajagopal(C) 72 72= 79 74↓ 12. Hosur INEL Transit House(R) 51 54↑ 80 81↑ 13. ESI Hospital(S) 50 73↑ 79 75↓ 14. Madurai Thirunagar(R) 65 61↓ 88 75↓ 15. Birla Visram(C) 68 64↓ 71 97↑ 16. Salem Sri Saradha Balamandhir(R) 55 57↑ 72↓ 67↓ 17. Siva Tower(C&I) 58 64↑ 71 78↑ 18. Thoothukudi Raju Nagar, Thoothukudi(R ) 59 78↑ 75 73↓ 19. Tiruppur Rayapuram(R) 55 50↓ 81 73↓ 20. Kumaran Complex(C) 63 55↓ 86 88↑ 21. Trichy Thillai Nagar(R) 61 64↑ 82 85↑ 22. Arulanatha ammal Nagar(R) 59 - 81 - 23. Tirunelveli Pettai Nearer to nursing home(S) 56 54↓ 60 91↑ 24. Vannarpettai(C) 59 61↑ 64 92↑ 25. Vellore Gandhi Nagar (R) 57 59↑ 74 72↓ 26. SIDCO Thiru Nagar (C) 50 58↑ 67 68↑
Note: (-) indicates data not received.

[AMBIENT NOISE LEVELS DURING DEEPAWALI FESTIVAL 2020]
Central Pollution Control Board Page 19
Tripura
Observations: In this State, this year 2020, ambient noise monitoring was carried out at twenty seven locations in 04 cities. On pre-Deepawali day noise level ranged between 36 and 69 Leq.dB(A), while on festival day it ranged between 52 and 78 Leq.dB(A). The maximum noise level 78 Leq.dB (A) was reported at Ambassa Bazar (C), Ambassa on festival day. Since, the last year (2019) data has not received, the comparison was not made and as such data of this year has given in table-20.
Table-20 : Ambient Noise Level in Leq.dB(A) during Pre-Deepawali & Deepawali day, 2020 in Tripura
S. No.
Cities Locations Pre-Deepawali day 2020
Deepawali day 2020
1.
Dharmanagar
Railway Station (C) 58 68 2. Dharmanagar circuit house
(R) 50 55
3. SDM and judges quarter (R) 65 65 4. Dharmanagar Hospital (S) 49 54 5. D.N. Vidyamandir (S) 66 65 6.
Ambassa
Ambassa District Hospital (S) 44 52 7. Kulai Class XII School (S) 53 65 8. Bauli Basti (R) 54 60 9. Ambassa Bazar (C) 63 78 10. Dalubari Gate (S) 59 69 11.
Agartala
Ashram chowmuhani (C) 60 72 12. Capital complex (R) 36 54 13. Circuit House (R) 59 65 14. Indranagar (R) 55 63 15. G.B Hospital (S) 57 57 16. M.B.B. Collage (S) 42 57 17. Battala (C) 69 71 18. Astabal (C) 68 72 19. Duraga Chowmuhani (C) 64 64 20. Netaji Chowmuhani (C) 63 67 21. A. D. Nagar (R) 52 59 22. I.G.M Hospital (S) 61 59 23.
Udaipur
Brahmabari (C) 63 69 24. Bridge Chowmuhani (R) 57 69 25. West Bank of Amar Sagar (R) 63 61 26. Hospital Area (S) 54 68 27. Matabari/Tripureswari
Temple(S) 55 72

[AMBIENT NOISE LEVELS DURING DEEPAWALI FESTIVAL 2020]
Central Pollution Control Board Page 20
5. Conclusion:
This year 2020, across the country, due to lock down & pandemic (covid-19) situations, no. of noise monitoring locations are decreased significantly comparing with last year-2019. Across the nation, we have received ambient noise monitoring data from 93 cities for 251 locations in this year 2020.
This year 2020, on pre-Deepawali day noise level ranged between 32 and 87 Leq.dB(A) while same on the festival day ranged between 33 and 97 Leq.dB(A). On pre-Deepawali Day, the minimum noise level 32 Leq.dB(A) was reported at SVR College, Surat (Gujarat) and the maximum noise level 87 Leq.dB(A) was reported at Christanpatty (R), Nagaon (Assam) while on Deepawali day minimum noise level 33 Leq.dB(A) was reported at SVR College, Surat (Gujarat) and the maximum noise level 97 Leq.dB(A) was reported at two locations i.e. Bank More, Dhanbad (Jharkhand) and Birla Visram (C), Madurai, Tamil Nadu.
Out of 251 locations, 168 locations monitoring conducted in the same location of last year and it is compared with this year on pre-Deepawali Day and 167 locations are compared on Deepawali day, as these locations are remain same in both the year (2019 & 2020). On pre-Deepawali day, out of 168 locations, noise level increased at 58 locations, decreased at 92 locations and 18 locations are equal to the previous year noise levels. On Deepawali day, out of 167 locations, noise level increased at 39 locations, decreased at 122 locations and 06 locations are equal to the previous year noise levels. In general, a noise levels at same locations (last year & this year) shows some improvements as compared to the last year (2019). Over all, the percentage distributions of noise level in terms of increase, decrease, & equal with respect to the number of locations for the year 2019 & 2020 are depicted in the following in pie charts.
The percentage distribution of Noise level with respect to locations during pre-Deepawali and Deepawali day (2019 & 2020)

[AMBIENT NOISE LEVELS DURING DEEPAWALI FESTIVAL 2020]
Central Pollution Control Board Page 21
6. Recommendations:
1. The Noise standards for fire-crackers were notified by MoEF under the Environment (Protection) (Second Amendment) Rules, 1999 vide G.S.R.682(E), dated the 5th October, 1999 and inserted as serial no. 89 of Schedule I of the Environment (Protection) Rules, 1986. Subsequently these Rules were amended by the Environment (Protection) Second Amendment Rules, 2006 vide G.S.R. 640(E), dated the 16th October, 2006, under the Environment (Protection) Act, 1986 guidelines should be followed by the manufacturer and the Department of Explosives to implement the following standards
(i) The manufacture, sale or use of fire-crackers generating noise level exceeding 125
dB(AI) or 145 dB(C)pk at 4 meters distance from the point of bursting should be prohibited.
(ii) For individual fire-cracker constituting the series (joined fire-crackers), the above mentioned limit be reduced by 5 log10(N)dB, where N = number of crackers joined together.
2. The State Government shall take measures for abatement of air pollution including noise
emanating from various zones during Deepawali day festival and ensure that the existing level do not exceed the Ambient Air Quality Standards and Ambient Noise Standards.
3. All concerned agencies like Electronic, print media, Central & State Governments, Central &
State Pollution Control Boards or Pollution Control Committees, Educational institutions & NGOs should create awareness among students & public at large to avoid bursting of fire-crackers to reduce air pollution & noise during festival of Deepawali day.
4. The order of the Hon’ble Supreme Court of India, dated September 27, 2001, prohibiting the
use of fireworks between 10.00 p.m. and 06.00 a.m. should be strictly enforced. 5. Enforcement of legal action on un-authorized manufacturing, processing and selling of
fireworks should be strictly ensured. 6. Designed places for burning of fire-crackers/fireworks may be identified by the local authority,
so that fire-crackers could be played at community level and not at individual houses. 7. Recognition for fire-crackers noise under criteria of cruelty to animals should be incorporated
under relevant acts and rules.

[AMBIENT NOISE LEVELS DURING DEEPAWALI FESTIVAL 2020]
Central Pollution Control Board Page 22
Annexure-I
The Noise Pollution {Regulation and Control) Rules, 2000 SCHEDULE (see rule 3(1) and 4(1)}
Ambient Air Quality Standards in respect of Noise
Area Code Category of Area / Zone Limits in dB(A) Leq* Day Time Night Time
A Industrial area 75 70 B Commercial area 65 55 C Residential area 55 45 D Silence Zone 50 40
Note:
(a) Day time shall mean from 6.00 a.m. to 10.00 p.m.
(b) Night time shall mean from 10.00 p.m. to 6.00 a.m.
(c) Silence zone is an area comprising not less than 100 meters around hospitals,
educational institutions, courts, religious places or any other area which is declared as such by the competent authority.
(d) Mixed categories of areas may be declared as one of the four above mentioned categories by the competent authority.
* dB(A) Leq denotes the time weighted average of the level of sound in decibels on scale A which is relatable to human hearing.
A “decibel” is a unit in which noise is measured.
“A”, in dB (A) Leq, denotes the frequency weighting in the measurement of noise and corresponds to frequency response characteristics of the human ear.
Leq: It is an energy mean of the noise level over a specified period

[AMBIENT NOISE LEVELS DURING DEEPAWALI FESTIVAL 2020]
Central Pollution Control Board Page 23
Annexure-II
Protocol for Ambient Noise Monitoring on Deepawali day
1.0 Purpose of Monitoring
This protocol presents the method for Ambient Noise monitoring during Deepawali day Festival. The objective is to see the impact of bursting crackers on Environment and whether ambient noise level is within prescribed noise level standard limit.
2.0 Monitoring Locations/Site Selection: • Site in a city shall be selected such that each category (Residential, Commercial and
Silence Zones) should be covered. • Instrument should be placed considering following points : Instrument must be away from fascades Instrument must be away from obstacles Microphone must be placed 1.2 -1.5 m above the ground level In dry conditions with a wind speed of less than 5 m/s Isolate the instrument from strong vibration and shock
• Close to any domestic premises, Hotel, Hostel, Hospital, Educational institution etc. do not keep the noise level meter and the measurement.
3.0 Monitoring Equipments
Noise measurements will be made with a Type 1 integrating sound level meter with free-field microphone which meets the Accuracy of noise measurement as per IEC 804 (BS 6698) Grade I or ANSI Type I or equivalent IEC 61672-1(2002-05) Class-I.
4.0 Monitoring frequency: Noise Monitoring on Deepawali day Day is to be carried out from 18.00 Hrs to 24.00 Hrs continuously at each location.
5.0 Sampling Frequency/rate: Duration is of 6 hours from 18.00 Hrs to 24.00 Hrs with 1 sec sampling period.
6.0 Monitoring Parameters: Leq, L10, L90, L50, Lmax, Lmin, LAI (with 1sec sampling period at all locations).
7.0 Criteria for monitoring:
The following criteria will be observed when undertaking the noise monitoring:
a) During Deepawali day sound comes from more than one direction, it is important to choose a microphone and mounting which gives the best possible Omni directional characteristics;
b) The noise measurement equipment will be supervised continuously during the monitoring period and notes will be made of the date, time and prevailing weather conditions;
c) Immediately prior to and following each noise measurement session the accuracy of the noise level meter shall be checked using an acoustic calibrator generating a known sound pressure level at a known frequency. Make sure that the instrument is properly

[AMBIENT NOISE LEVELS DURING DEEPAWALI FESTIVAL 2020]
Central Pollution Control Board Page 24
calibrated. The sound level meter and calibrator will hold a current calibration certificate traceable to national standards;
d) Noise measurements should not be made in fog and rain; e) A wind shield will be used at all times to prevent interference with sound levels; f) As far as is practicable, the pause facility on the noise measurement equipment will be
used to exclude extraneous noise (e.g. low flying aircraft and road traffic passing in front of the microphone) so that the results recorded are representative of the site noise or if possible for road traffic/other source background noise can be eliminated from final reading by using the following formula:
Lpressure = 10.log [10(Lp/10) - 10(LpBackground/10)]
8.0 The following details will be recorded:
(i) The date, time, location and duration of the measurement; (ii) All predominant noise sources will be noted, which may include
extraneous noise such as road traffic, aero-planes and other activity; (iii) Weather conditions will be recorded including wind speed and
approximate direction, cloud cover, rain and ground frost;
9.0 Noise Monitoring Records
The particulars of the measurements recorded by the noise level meter shall be furnished in the monitoring data sheet, which is attached at Annexure VII.

[AMBIENT NOISE LEVELS DURING DEEPAWALI FESTIVAL 2020]
Central Pollution Control Board Page 25
Annexure-III
Data sheet for Ambient Noise Monitoring on Deepawali day
Lmax. and Lmin. between (18:00 to 24:00 Hrs).
Location: Date:
Noise Level Meter Make : Model : Serial No. : Calibration Result of Noise Level Meter Calibration 94 dB at 1000 Hz 114 dB at 1000 Hz Initial Final Sampling rate S. No. Time duration File No. L equivalent dB(A)
18:00 Hrs. to 19:00 Hrs 19:00 Hrs. to 20:00 Hrs 20:00 Hrs. to 21:00 Hrs 21:00 Hrs. to 22:00 Hrs 22:00 Hrs. to 23:00 Hrs 23:00 Hrs. to 24:00 Hrs
Average L equivalent dB(A) Between (18:00 to 24:00 Hrs)
Name & signature of Official on Duty

PART-II
Ambient Air Quality during Deepawali festival 2020

[AMBIENT AIR QUALITY DURING DEEPAWALI FESTIVAL 2020]
Central Pollution Control Board Page 26
REPORT ON AMBIENT AIR QUALITY DURING DEEPAWALI FESTIVAL 2020
1.0 Background
Hon’ble Supreme Court in its order dated October 23, 2018 in the matter of Arjun
Gopal and Others Versus Union of India and Others Writ Petition (Civil) No. 728 of
2015, directed as follows:
“CPCB and respective State Pollution Control Boards/Pollution Control Committees
(SPCBs/PCCs) of the States and Union Territories shall carry out short –term
monitoring in the cities for 14 days (commencing from 7 days prior to Deepawali
and ending 7 days after Deepawali) for parameters namely Aluminium, Barium,
Iron apart from the regulatory parameters against the short-term Ambient Air
Quality Criteria Values (AAQCVs) proposed by CPCB with regard to bursting of
firecrackers. This will help in generation of data on pollution caused by the bursting
of firecrackers and would be helpful for regulation and control quantity of
Aluminium, Barium and Iron used in the manufacture of firecrackers”.
In compliance of above, like last year (2019) CPCB conducted monitoring in 2020 at
eight cities namely Delhi (CPCB Head Quarter) and Agra, Bhopal, Bengaluru,
Kolkata, Lucknow, Shillong and Vadodara where its Regional Directorates are
situated and Diwali is widely celebrated. 15 days monitoring (07th November to 21st
November); 7 days prior (07th November to 13th November – Pre-Diwali period);
Diwali day (14th November) and 7 days after Diwali (15th November to 21st
November – Post-Diwali period); was conducted by CPCB.
In addition to the NAAQS parameters (PM10, PM2.5, SO2 and NO2 and metals such
as Pb, Ni & As in PM10) and elements (Al, Ba, and Fe) used in composition of
firecrackers, which may have harmful effects on inhalation, are also included in
monitoring plan. Al, Ba, and Fe are monitored in PM2.5 fraction as proposed in
AAQCVs.

[AMBIENT AIR QUALITY DURING DEEPAWALI FESTIVAL 2020]
Central Pollution Control Board Page 27
2.0 Monitoring locations City wise locations covered for monitoring is presented in Table 1.
Table 1: Locations Covered in Deepawali Special Monitoring
S. No. States City Name of the location Parameters covered
01 Delhi Delhi NCT 1) Pitampura 2) Janakpuri, 3) ITO
Regulatory Parameters like PM10, PM2.5, SO2, NO2, Metals (Pb, Ni, As in PM10) and parameters related to AAQCVs (Al, Fe and Ba in PM2.5)
02 Gujarat Vadodara 1) Gotri Water Tank 2) M.S. University Campus
03 Karnataka Bengaluru 1) Rajarajeshwari Nagar 2) Basaveshwara Nagar
04 Madhya Pradesh
Bhopal 1) North T.T.Nagar, 2) Nehru Nagar
05 Uttar Pradesh
Agra 1) Taj Mahal 2) Nunhi
Lucknow 1) Viksh Khand, Gomt Nagar,
2) Mayur Vihar, Indira Nagar
06 West Bengal
Kolkata 1) Kasba 2) Behala 3) North avenue
07 Meghalaya Shillong 1) Lower Motinagar 2) ICI Church Compound,
Happy Valley
3.0 Results and Discussion Data were analysed for Pre-Diwali (07th November to 13th November, Diwali (14th
November and Post Diwali period (15th November to 21st November). Parameter-
wise results are discussed as under:
3.1 NAAQS parameters (PM10, PM2.5, SO2, NO2 and metals (Pb, Ni & As) in PM10
a) Particulate Matter (PM10 and PM2.5)
PM10 and PM2.5 data of representative stations in respective cities are
averaged to assess the overall air quality of the city with respect to Particulate
matter during pre-Diwali, Diwali day and post Diwali is depicted in Figure 1.

[AMBIENT AIR QUALITY DURING DEEPAWALI FESTIVAL 2020]
Central Pollution Control Board Page 28
From Figure 1 it may be seen that during 15 days (07th November to 21st November ,
2020) Diwali monitoring period, 24 hourly averages of both PM10 and PM2.5 found
above the NAAQS (National Ambient Air Quality Standard) i.e 100 µg/m3 (PM10)
and 60 µg/m3 (PM2.5) in all cities except Bengaluru and Shillong. These two cities
didn’t cross NAAQS for PM10 and PM2.5 on Diwali day even.
Average PM10 and PM2.5 in Agra during Pre-Diwali days were higher than Diwali
and Post Diwali days. During pre deepawali days the whole north India was
receiving particulates from north-west direction and elevated levels of particulates
may be attributed to biomass or stubble burning. Surprisingly on Deepawali day the
average wind speed in Agra was increased from 0.8 m/s to 1.9 m/s and that might
have caused rapid dispersion. Reduction in PM10 observed in Vadodara may be
attributed to restricted vehicular movement and local meteorology.
Substantial addition of Particulates (both PM10 and PM2.5) was observed on Diwali
days in Delhi, Lucknow and Bhopal.
Post Diwali Monitoring has revealed that particulates (both PM10 and PM2.5) in all
the cities declined in similar pattern.
City-wise increase/decrease in PM10 and PM2.5 on Diwali day is presented in Table
2.
Table 2: City-wise increase in PM10 and PM2.5 on Diwali day compared to Pre-Diwali period (in %)
Agra Delhi Kolkata Bengaluru Bhopal Lucknow Vadodara Shillong
PM10 -41.5 67.1 22.6 -24.8 86.2 114.0 -10.0 53.7

[AMBIENT AIR QUALITY DURING DEEPAWALI FESTIVAL 2020]
Central Pollution Control Board Page 29
PM2.5 -34.8 82.9 53.6 -41.4 81.3 67.6 26.0 30.5
Both PM10 and PM2.5 were increased in cities like Delhi, Kolkata, Bhopal, Lucknow
and Shillong. PM2.5 found higher in Vadodara; however, Agra and Bengaluru
recorded decline in both PM10 and PM2.5. The increase in PM10 was recorded by
22.6 % to 114% on 14th November, 2020 (Diwali day) compared to Pre-Diwali period
among various cities monitored. Highest increment in PM10 on Diwali day was
reported in Lucknow (114%) followed by Bhopal (86.2%), Delhi (67.1%), Shillong
(53.7%) and Kolkata (22.6%).
On Diwali day, PM2.5 was increased by 26 – 82.9% compared to Pre-Diwali period
among the various cities monitored. Highest increment was recorded in Delhi
(82.9%), followed by Bhopal (81.3%), Lucknow (67.6%), Kolkata (53.6%), Shillong
(30.5%) and Vadodara (26%).
b) Sulphur di oxide (SO2) and Nitrogen di oxide (NO2)
Fig 2 depicts the concentrations of criteria gaseous pollutants (SO2 and NO2) at all
cities. SO2 was found always within the prescribed 24 hourly NAAQS (80µg/m3)
throughout the monitoring period including Diwali day. Increase in SO2
concentration on Diwali day at cities like Delhi, Lucknow, Bhopal and Vadodara are
evident. Increase on Diwali day may be attributed to oxidation of sulphur due to
bursting of cracker. Bengaluru and Shillong reported SO2 at Below Detection Limit
(4 µg/m3).

[AMBIENT AIR QUALITY DURING DEEPAWALI FESTIVAL 2020]
Central Pollution Control Board Page 30
NO2 was reported within prescribed 24 hourly NAAQS (80µg/m3) in all the cities
except Delhi during Pre-Diwali, Diwali and post Diwali days. During Pre Diwali
period and on Diwali day NO2 was found to above NAAQS in Delhi. Delhi, Bhopal,
Lucknow and Bengaluru reported increase in NO2 on Diwali day compared to Pre-
Diwali period.
3.2 Metals in PM10 (NAAQS Parameters)
Lead Nickel and Arsenic (Pb, Ni and As) concentrations are prescribed in NAAQS
2009. The value of these metals found during Diwali 2020 in Delhi is presented in
Table 3.
Table 3: Lead Nickel and Arsenic in PM10 in Delhi during Diwali - 2020 Nickel (Ni) Lead (Pb) Arsenic (As)
Pre Diwali (7 days) 6.57 558 7.52 Diwali 4.67 326 19.67
Post Diwali (7 Days) 4.24 125 3.81 NAAQS 20 1000 6
Notes: (i) All values are in ng/m3 ; (ii) Nickel and Arsenic has only annual standard and (iii) Pb have both 24 hourly (1000 ng/m3) and annual standards (500 ng/m3)
Comparison of 24 hourly average values obtained during 15 days monitoring period
may not be logically correct against annual prescribed standards. The increase in
Arsenic concentration on Diwali day is a point of concern as major additional
activity is fireworks.
Lead (Pb), Nickel (Ni) and Arsenic in ambient air (PM10) in various cities during the
study period are depicted in Figure 3, Figure 4 and Figure 5. Comparison of 24
hourly average values obtained during 15 days monitoring period may not be
logically correct against annual prescribed standards.

[AMBIENT AIR QUALITY DURING DEEPAWALI FESTIVAL 2020]
Central Pollution Control Board Page 31
Lead (Figure 3) found to remain always within 24 hourly prescribed NAAQS limit
during Diwali days (15 days monitoring period) at all cities. Higher lead
concentrations in Bhopal on Diwali day compared to pre and post diwali period may
be a matter of further investigation and might be due to bursting of spurious
crackers.
Nickel (Ni): As depicted in Figure 4 concentration of Nickel found higher during
pre-Diwali days in Agra, Delhi, Kolkata, Bhopal and Vadodara may be attributed to
general urban sources MSW burning. It remained always within 20 ng/m3 (NAAQS
– Annual average value) in all the cities during the period except pre-Diwali
averages in Bhopal and Vadodara.

[AMBIENT AIR QUALITY DURING DEEPAWALI FESTIVAL 2020]
Central Pollution Control Board Page 32
Arsenic was found to increase and crossed the prescribed annual concentration limit
on Diwali day in Agra, Delhi, Lucknow, Kolkata and Bhopal. It may not be
considered as an exceedence as these are 24 hourly values; however the sharp
increase in Arsenic on Diwali day may be correlated to fireworks (contamination in
raw material or intrusion of non-approved chemicals in spurious crackers).
3.3 Elements in PM2.5
Three parameters (Aluminium, Barium and Iron) used in manufacturing of
firecrackers for which short term Ambient Air Quality Criteria Values (AAQCVs)
were proposed due to possible health impact. City-wise summary of 15 days data of
prescribed elements in PM2.5 for Pre-Diwali period, Diwali day and Post Diwali
period is presented in Table 3.
Table 3: Comparison of Metal concentrations in PM2.5 at various Indian Cities during Diwali 2020 Agra Bhopal Bengaluru Delhi
Al Ba Fe Al Ba Fe Al Ba Fe Al Ba Fe Pre Diwali 1.3 0.1 0.6 1.3 0.2 1.0 0.2 0.02 0.3 2.0 0.1 1.6
Diwali 4.4 2.3 0.2 22.5 23.8 1.5 1.8 1.1 0.3 27.6 11.5 1.6
Post Diwali 1.1 0.4 0.4 1.1 0.5 0.5 0.5 0.3 0.2 1.0 0.2 0.7
Kolkata Lucknow Vadodara Shillong
Al Ba Fe Al Ba Fe Al Ba Fe Al Ba Fe
Pre Diwali 0.6 0.03 0.8 0.8 0.1 0.7 1.2 0.3 0.9 0.10 0.10 0.10
Diwali 4.6 3.5 0.9 19.2 17.2 1.0 8.3 5.3 0.6 1.50 0.80 0.10
Post Diwali 1.3 0.6 0.8 2.0 1.3 0.4 1.4 0.6 0.5 0.30 0.10 0.20 Note: (a) All Values are in µg/m3 in PM2.5 (b) Short Term Critical Ambient Air Quality Critical Values (CAAQVs) are: Al - 40 µg/m3; Ba - 4.0 µg/m3 and Fe - 40.0 µg/m3 (All these are given for 24 hourly averages)

[AMBIENT AIR QUALITY DURING DEEPAWALI FESTIVAL 2020]
Central Pollution Control Board Page 33
From the above Table it is evident that Aluminium and Iron in PM2.5 fraction are
well within the prescribed short term AAQCVs in all cities; however, the violation
occurred in Barium in various cities on Diwali day. Barium exceeded AAQCVs (4.0
µg/m3) in Bhopal, Delhi, Lucknow and Vadodara.
Year wise comparison (2017 – 2020) of Diwali day’s data of Delhi is presented in
Table 4. Reduction in Aluminum and Barium concentrations were observed in 2020
compared to 2019. Gradual betterment in ambient air metal concentrations in PM2.5
Table 4: Comparison of PM2.5 and elements in PM2.5 in Delhi during Diwali 2017, 2018, 2019 and 2020
All Concentrations are in µg/m3
PM2.5 Aluminum (Al) Barium (Ba) Iron (Fe)
2017 2018 2019 2020 2017 2018 2019 2020 2017 2018 2019 2020 2017 2018 2019 2020
Pitampura 677 831 513 865 165 3.1 25.8 48.9 34.5 53.7 16.3 22.6 1.5 1.4 1.0 2.2
Janakpuri 638 988 511 535 177 3.8 39.9 20.4 45.7 56.5 21.2 11.6 1.5 1.5 1.2 1.4
CPCB / ITO
(in 2020) 496 990 NM 454 136 4.4 NM 13.4 23.7 52.2 NM 0.3 1.1 1.3 1.3
City Average 604 936 512 618 159 3.8 32.9 27.6 34.7 54.2 18.8 11.5 1.4 1.4 1.1 1.6
Notes: a) NM - Not Measured and b) AAQCVs: Al – 40 µg/m3, Ba – 4.0 µg/m3 and Fe – 40 µg/m3
was observed every year since 2017 after the implementation of regulatory
mechanisms as suggested by Hon’ble Courts for either restricting / banning of
firecrackers or development of “Green Crackers” was initiated in 2018. In 2020
Aluminum and Iron found within proposed AACQVs concentrations. Barium found
exceeding proposed AACQVs concentrations on Diwali day in Delhi; still a
reduction of 38.8% was observed in 2020 compared to 2019.
4.0 SUMMARY
1) On Diwali day PM2.5 concentrations were found to increase in six out of
eight cities monitored. Only Agra and Bengaluru reported lesser PM2.5 on
Diwali day in 2020. Maximum increase was observed in Lucknow (2.14
times) followed by Delhi (1.83 times), Bhopal (1.81 times), Lucknow (1.68
times), Kolkata (1.54 times) Shillong (1.3 times) and Vadodara (1.26 times).

[AMBIENT AIR QUALITY DURING DEEPAWALI FESTIVAL 2020]
Central Pollution Control Board Page 34
Overall the increase in PM2.5 level across the cities were lower than last
year Diwali (2019)
2) SO2 was found within prescribed NAAQS (80 µg/m3) limits during the
entire monitoring period including 27th October, 2019 (Diwali day).
3) Similarly NO2 was also found to be within prescribed NAAQS limit in all
the cities during monitoring period.
4) During post Diwali period PM10 concentration was reduced by about 1 %
to 74% in different cities compared to Diwali day level. Maximum
reduction was observed in Delhi (74%) and minimum at Shillong (1%).
Lucknow (72%) and Bhopal (67%) recorded similar PM10 reduction as
Delhi. About 28% reduction in PM10 was observed in Agra in post diwali
period compared to Diwali peak. Kolkata and Vadodara recorded upto
11% reduction during post Diwali compared to Diwali day. Bengaluru has
recorded about 16% increase in PM10 during post Diwali period, which
may be attributed to local conditions.
5) Similarly, PM2.5 concentrations were reduced by about 4 % to 77% in
different cities during post Diwali period compared to Diwali day level.
Maximum reduction was observed in Delhi (77%) and minimum at
Kolkata (4.4%). Bhopal (73%), Lucknow (66%), Vadodara (37%) and Agra
(26%) reductions were recorded in PM2.5 during post Diwali period.
Shillong and Bengaluru recorded slight increase in PM2.5 during post
Diwali period, which may be attributed to local conditions.
6) Aluminium (Al) and Iron (Fe) in PM2.5 fraction were well within the
prescribed short term AAQCVs in all cities in 2020; however, the
violation occurred in Barium in various cities on Diwali day. Barium
exceeded AAQCVs (4.0 µg/m3) in Bhopal, Delhi, Lucknow and Vadodara
in Diwali 2020.
7) Reduction in Aluminum and Barium concentrations were observed in
2020 compared to 2019. Gradual betterment in ambient air metal
concentrations in PM2.5 every year since 2017 after the implementation of
regulatory mechanisms as suggested by Hon’ble Courts for either

[AMBIENT AIR QUALITY DURING DEEPAWALI FESTIVAL 2020]
Central Pollution Control Board Page 35
restricting / banning of firecrackers or development of “Green Crackers”
was initiated in 2018.
8) Despite banning of firecrackers by Hon’ble NGT and introduction of
Green Crackers in selected cities the presence and elevation of Pb, Ni, As
invite attention on spurious crackers in market.