Management-of-POPs-and-Other-Priority-Chemicals-in-Textile ...
Upload
independentCategory
view
3download
0
1 23
Arabian Journal for Science andEngineering ISSN 1319-8025 Arab J Sci EngDOI 10.1007/s13369-014-1485-9
Occurrence of High Levels of PersistentOrganic Pollutants (POPs) in ParticulateMatter of the Ambient Air of Riyadh, SaudiArabia
Aarif H. El-Mubarak, Ahmed I. Rushdi,Khalid F. Al-Mutlaq, AbdulqaderY. Bazeyad, Staci L. M. Simonich &Bernd R. T. Simoneit
1 23
Your article is protected by copyright and
all rights are held exclusively by King Fahd
University of Petroleum and Minerals. This e-
offprint is for personal use only and shall not
be self-archived in electronic repositories. If
you wish to self-archive your article, please
use the accepted manuscript version for
posting on your own website. You may
further deposit the accepted manuscript
version in any repository, provided it is only
made publicly available 12 months after
official publication or later and provided
acknowledgement is given to the original
source of publication and a link is inserted
to the published article on Springer's
website. The link must be accompanied by
the following text: "The final publication is
available at link.springer.com”.
Arab J Sci EngDOI 10.1007/s13369-014-1485-9
RESEARCH ARTICLE - CHEMISTRY
Occurrence of High Levels of Persistent Organic Pollutants (POPs)in Particulate Matter of the Ambient Air of Riyadh, Saudi Arabia
Aarif H. El-Mubarak · Ahmed I. Rushdi ·Khalid F. Al-Mutlaq · Abdulqader Y. Bazeyad ·Staci L. M. Simonich · Bernd R. T. Simoneit
Received: 16 December 2013 / Accepted: 30 May 2014© King Fahd University of Petroleum and Minerals 2014
Abstract There are no research reports on the presence ofpersistent organic pollutants (POPs), in the ambient air ofSaudi Arabia. POP emissions represent an environmentalhazard negatively affecting public health and productivity.The complex interrelated sources and the heavy load of airpollutants are due to accelerated developmental activities andeconomic growth in Saudi Arabia over the past three decades.Such development included both agricultural and industrialprogress. The consequences found in this study reveal thatPAHs, pesticides and PCBs are present at elevated concen-trations in the ambient air of Riyadh. The average concen-trations of pesticides range from 2 to 8,216 ng/m3, indicatingtheir heavy use around the city and possibly long-range trans-port. The average concentrations of PAHs range from 18 to1,003 ng/m3 and of PCBs from <1 to 20 ng/m3. Some ofthese POPs were originated locally, while others might betransported over long distances. These POP concentrations
A. H. El-Mubarak (B) · A. I. Rushdi · K. F. Al-Mutlaq ·A. Y. Bazeyad · B. R. T. SimoneitDepartment of Plant Protection, Pesticides and EnvironmentalToxicology Unit and Chair of Green Energy Research, Collegeof Food and Agriculture Sciences, King Saud University,P.O. Box 2460, Riyadh 11451, Saudi Arabiae-mail: [email protected]
A. I. RushdiCollege of Earth, Oceanic and Atmospheric Sciences,Oregon State University, Corvallis, OR 97331, USA
S. L. M. SimonichDepartment of Environmental and Molecular Toxicology,Oregon State University, Corvallis, OR 97331, USA
S. L. M. Simonich · B. R. T. SimoneitDepartment of Chemistry, Oregon State University, Corvallis,OR 97331, USA
were noticeably high; therefore, Saudi Arabia should focuson reducing such emissions through concerted efforts at thenational level.
Keywords POPs · GCMS · Particulate matter ·Ambient air · Riyadh · Saudi Arabia
1 Introduction
Polycyclic aromatic hydrocarbons (PAHs), pesticides andpolychlorinated biphenyls (PCBs) are persistent organic pol-lutants (POPs) among many others, whose presence in par-ticulate matter of ambient air is of profound environmen-tal and health concerns. POPs are organic compounds thatresist biological and chemical degradation including pho-tolytic breakdown. They are characterized by low water sol-ubility and high lipid solubility, leading to their bioaccu-mulation in fatty tissues [1]. POPs persist in the environ-ment, disperse by long-range transport, bioaccumulate inhuman and animal tissue, biomagnify in food chains andhave potentially significant impacts on human health and theenvironment [1,2]. They also have semi-volatile characteris-tics, enabling them to move long distances in the atmospherebefore deposition or removal occur. POPs may be both nat-ural and anthropogenic. Some of these compounds, suchas PCBs, persist in the environment for years and biocon-centrate by factors of up to 70,000-fold [1,3]. POP back-ground concentrations and the seasonal variability of theirconcentrations are two factors to be considered when esti-mating population exposure via inhalation. Information onthe seasonality of POPs is available for urban air, but is lack-ing for background areas. The annual trends for PAHs wereinvestigated for several urban sites [4–9]. Measurements ofPAH emissions from air pollution sources originating from
123
Author's personal copy
Arab J Sci Eng
different types of urban activities were reported earlier [10–24]. Ambient air quality refers to the air in the immediateurban surroundings and describes the levels of air pollu-tants in that particular region. Poor ambient air quality meanspollutant levels are high enough to raise concerns. Ambientair quality is measured near ground level, away from directsources of pollution. Harmful emissions into the air repre-sent an environmental pressure that adversely affects humanhealth and productivity. To assess the presence, concentra-tions and sources of atmospheric anthropogenic organic com-pounds, the organic multi-tracer concept and specific para-meters utilized in organic geochemistry have been appliedsuccessfully(e.g., [19]). In this study, only the respirable sus-pended particulate phase (PM) was collected using filters dueto its higher carcinogenicity and mutagenicity effects. Thegas phase was neglected since the PAHs sampled in this phasehave weaker carcinogenic and mutagenic properties, and theycan react with other pollutants to form secondary derivatives.
The World Health Organization (WHO) recognizes theimportance of atmospheric PM monitoring in order to protectpublic health. The WHO air quality guidelines (AQG) rec-ommend standards that every government should considerwhen formulating policy targets after evaluating the localconditions. Limit values for PM in ambient air were set inmany countries considering the WHO reference values [25–32]. A limit value of 20 µg/m3 (annual limit) and 50 µg/m3
(24 h mean) for PM10 in ambient air was recommended [28].The objectives of this work are to identify, characterize and
determine the concentrations of POPs in the total suspendedPM of ambient air in Riyadh, Saudi Arabia, and to highlightthe implication of POPs. Therefore, air PM samples werecollected in winter 2010 in Riyadh and analyzed to determinethe concentrations of PAHs, pesticides and PCBs.
2 Experimental Methods
2.1 Sampling Site
The sampling location was selected to represent the Riyadhmetropolitan area of about more than 1,815 km2 and a cityarea of 1,200 km2. It was located at the College of Food andAgriculture Sciences of King Saud University (KSU, 24◦43′ 30.53′′N, 46◦ 37′ 06.74′′E), (Fig. 1) away from areas ofpoint source emissions or fugitive aerosol transport condi-tions. Riyadh is situated in the center of the Arabian Peninsulaon a large plateau with an urban area of 1,000 km2. It is rela-tively flat which causes high dispersion of air masses. Soils inand around the city are made of an alluvium of gravel, sand,silt, clay deposits and a limestone subsoil. Riyadh is hometo ∼5.3 million people and the urban center of a region witha population close to 7 million. The air sampler was placedon the roof top of a two-story building for the ease of access,
power supply and security reasons. Possible traffic pollu-tion is expected since approximately 35,000 of the universityemployees and students are driving their own vehicles withina limited area of KSU campus. The sampling point is about1 km from a motorway ring road and not far from traffic net-work nodes. The second largest industrial complex of SaudiArabia is located southeast of Riyadh, about 30 km fromthe sampling location and hosts more than 1,000 industrialfacilities around a refinery and cement factory.
2.2 Sampler
A high volume air sampler (Precision Hi-Volume Air Sam-pler, GCA Corp., Precision Scientific Group, Chicago, IL,USA) was used to collect PM. The sampler was fitted withquartz microfiber filters (QMA, 20.3 × 25.4 cm). Prior toinstallation in the sampler, filters were annealed in an ovenat 550 ◦C for 12 h. A batch of 21 samples was taken withthe HVS at flow rate of 1.2 m3/min for typically 24 h onsequential days in winter from December 13, 2010, to Jan-uary 2, 2011. The total atmospheric suspended particulatematter (PM) was used here because the gas phase is more dif-ficult to sample and analyze. Other studies have reported bothgaseous and PM organic matter [20–24], and thus partition-ing could be modeled based on temperature. After sampling,the filters were removed from the sampler, wrapped withaluminum foil, placed in glass line envelope filter media andbrought to the laboratory. The filters were transferred intodesiccator, then weighed and stored at −20 ◦C until time ofanalysis. A blank sample was also acquired for analysis.
2.3 Sample Preparation
2.3.1 Extraction
Briefly, the filter samples wrapped in aluminum foil wereremoved from the freezer at the time of sample preparationand allowed to warm at room temperature for approximately1 h in sealed polytetrafluoroethylene (PTFE) bags. Then, aquarter of each filter was cut, weighed on an analytical bal-ance, folded and placed in a 100-mL stainless steel Acceler-ated Solvent Extractor (ASE) cell (Dionex, Sunnyvale, CA,USA). A blank quarter filter was also extracted. Prior to use,each ASE cell had been pre-cleaned by rinsing with organicsolvents and baking overnight for 12 h. Each ASE cell wasfilled with anhydrous sodium sulfate and 15 µl of isotopi-cally labeled recovery surrogates in 1.25–10 ng/µL solutions(equivalent to 12.5–150 ng) which distributed equally amongthe top of the cells. The cells were capped, put in the ASEand extracted with dichloromethane (DCM) (100 ◦C, 1,500psi, 2 cycles of 5 min and 150 % flush volume). The extractwas concentrated to 0.5 mL in a TurboVap II (Zymark, Hop-kinton, MA, USA) with nitrogen and solvent exchanged to
123
Author's personal copy

Arab J Sci Eng
Fig. 1 Map of Saudi Arabia showing a part of Riyadh city with the location of the sampling site
Table 1 General characteristics of ambient air PM and weather conditions in Riyadh during the sample collection period
Sample ID Date 24 h time Air vol. PM wt PM Conc. Mean temp.a Mean pressurea Mean HRa Wind speeda Wind directiona
(min) (m3/24 h) (mg) (µg/m3) (◦C) (mbar) (%) (m/s)
HV-1 13/12/2010 1,442 1,730 2,198 1,271 15.2 946.5 35 4.1 N
HV-2 14/12/2010 1,455 1,746 2,121 1,215 12.3 952.2 37 3.1 N
HV-3 15/12/2010 1,425 1,710 1,316 770 12.6 950.3 42 1.0 SE
HV-4 16/12/2010 360 432 159 370 16.5 949.9 37 1.5 SE
HV-5 17/12/2010 1,425 1,710 579 339 17.3 948.0 26 1.5 SE
HV-6 18/12/2010 1,440 1,728 781 452 14.5 947.6 31 1.0 S
HV-7 19/12/2010 1,440 1,728 1,002 580 18.9 947.8 32 0.5 N/NE
HV-8 20/12/2010 1,462 1,754 1,038 592 8.10 950.8 39 1.5 E
HV-9 21/12/2010 1,420 1,704 966 567 7.80 952.2 47 1.5 N/NW
HV-10 22/12/2010 1,451 1,741 990 569 13.6 950.2 43 2.1 N/NW
HV-11 23/12/2010 1,557 1,868 552 296 13.1 947.4 43 1.5 NE
HV-12 24/12/2010 1,294 1,553 911 587 13.0 947.0 42 1.0 E
HV-13 25/12/2010 1,500 1,800 1,090 606 14.2 947.3 43 1.0 NE
HV-14 26/12/2010 1,400 1,680 934 556 13.6 942.9 45 1.5 NW
HV-15 27/12/2010 1,427 1,712 945 552 11.6 949.1 37 1.5 W
HV-16 28/12/2010 1,440 1,728 979 567 9.50 949.6 39 1.0 SE
HV-17 29/12/2010 1,414 1,697 896 528 10.7 950.1 36 1.5 SE
HV-18 30/12/2010 1,430 1,716 497 290 14.1 948.1 41 4.6 S/SE
HV-19 31/12/2010 1,450 1,740 1,031 593 16.6 945.9 40 3.6 N
HV-20 2011-01-01 1,405 1,686 868 515 13.1 948.8 57 3.0 E
HV-21 2011-02-01 1,455 1,746 474 272 12.8 948.8 51 1.0 E
a Data were provided by the office of the Presidency for Meteorology and Environment at King Khalid International Airport, Riyadh, Saudi Arabia
123
Author's personal copy

Arab J Sci Eng
hexane. Each sample was spiked with isotopically labeledPAHs for quantifying the recovery.
2.3.2 Clean-Up and Purification
Interferants were removed from the extracts using silicaadsorption chromatography utilizing a solid-phase extrac-tion (SPE) cartridge packed with 20 g silica. Fractions wereeluted with 50 ml hexane for the first fraction (F1), 100 mldichloromethane (DCM) for the second fraction (F2) and 50ml ethyl acetate for the third fraction (F3). Extract volumeswere reduced using a TurboVap II. The target fractions (F1-F3) were concentrated to 0.3 ml with ethyl acetate rinsesunder a gentle stream of nitrogen and spiked with 15 µL ofa 10 ng/µL isotopically labeled internal standard solutionprior to analysis. Blank extracts were carried through theentire method together with batches of 3 to 5 samples.
2.3.3 Analysis
Analyte separation, detection and identification were per-formed by gas chromatography mass spectrometry (GC-MS)on an Agilent (Palo Alto, CA) 6890N gas chromatographequipped with an Agilent HP-5MS column (30 m × 0.25 mm×0.25µm film thickness) and 5973N mass selective detec-tor. The oven temperature was ramped from 60 ◦C (2 min)to 320 ◦C (20 min) at a rate of 6 ◦C/min. POP concentra-tions in filter extracts were determined in the selected-ion-monitoring (SIM) mode using both electron impact (EI) andnegative chemical ionization (NCI) mass spectrometry. Thetarget analyte list was comprised of 83 PAHs, pesticides,isotopic surrogates and pesticide degradation products. Inaddition, another 50 pesticides and PCBs, and compounddegradation products were included. Target analyte loss wascorrected with surrogate recovery by using target analyte tosurrogate response ratios in calibration curves. The meanrecovery over the entire analytical method for all surrogatesin all samples was more than 69 %.
3 Results
The sampling location, general characteristics of the PM, andmeteorological conditions for Riyadh are given in Table 1and Fig. 1. The analytical characteristics and concentrationsof the POPs determined are shown in Fig. 2. The concen-trations of PAHs, pesticides and PCBs (as ng/m3) in PMare given in Tables 2, 3 and 4, respectively, and summarizedin Fig. 3. The mean concentrations for all individual PAHsranged from 18±8 to 1,003±597 ng/m3. The minimum andmaximum ranges for PAHs were 4–134 and 40–2,281 ng/m3,respectively. Total PAHs (TPAHs) ranged from 1,762 to13,470 ng/m3 with a mean of 5,938 ± 2,766 ng/m3. The
Fig. 2 Daily concentrations of a total PM, total DDTs and total PCBs,and b total PM, total PAHs and total pesticides in Riyadh air duringDecember 2010–January 2011
mean concentrations for all reported individual pesticidesranged from 2 ±5 to 833±2,202 ng/m3, with minimum andmaximum range of 0–108 and 16–10,398 ng/m3, respectively(Table 3; Fig. 3). The mean concentration for all reportedindividual pesticides ranged from 1±1 to 20±24 ng/m3, withminimum and maximum ranges of 0–7 and 1–122 ng/m3,respectively (Table 3; Fig. 3). The mean concentration for allPCB congeners ranged from 1 ± 1 to 8 ± 6 ng/m3, with min-imum and maximum range of 0–2 and 4–51 ng/m3, respec-tively (Table 4; Fig. 3).
4 Discussion
There was a significant variation in the POP concentrationsover the one-month sampling period. The high standard devi-ations reflect the extensive variability in daily concentrations.
123
Author's personal copy
Arab J Sci Eng
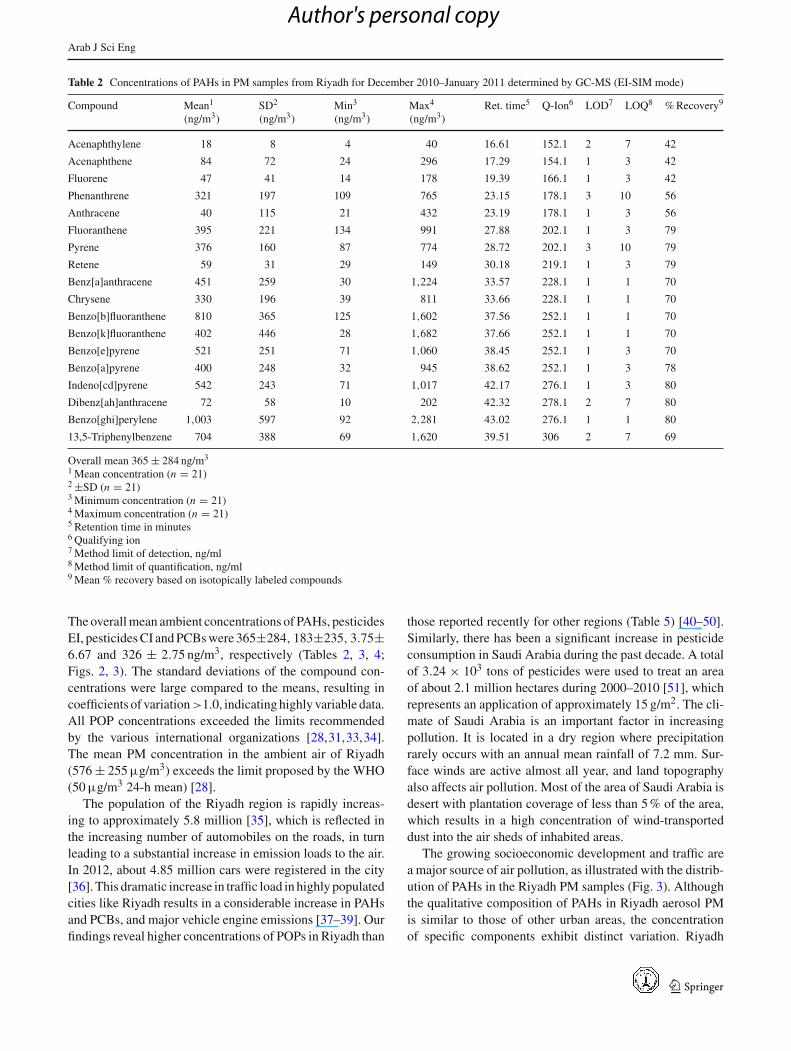
Table 2 Concentrations of PAHs in PM samples from Riyadh for December 2010–January 2011 determined by GC-MS (EI-SIM mode)
Compound Mean1
(ng/m3)SD2
(ng/m3)Min3
(ng/m3)Max4
(ng/m3)Ret. time5 Q-Ion6 LOD7 LOQ8 % Recovery9
Acenaphthylene 18 8 4 40 16.61 152.1 2 7 42
Acenaphthene 84 72 24 296 17.29 154.1 1 3 42
Fluorene 47 41 14 178 19.39 166.1 1 3 42
Phenanthrene 321 197 109 765 23.15 178.1 3 10 56
Anthracene 40 115 21 432 23.19 178.1 1 3 56
Fluoranthene 395 221 134 991 27.88 202.1 1 3 79
Pyrene 376 160 87 774 28.72 202.1 3 10 79
Retene 59 31 29 149 30.18 219.1 1 3 79
Benz[a]anthracene 451 259 30 1,224 33.57 228.1 1 1 70
Chrysene 330 196 39 811 33.66 228.1 1 1 70
Benzo[b]fluoranthene 810 365 125 1,602 37.56 252.1 1 1 70
Benzo[k]fluoranthene 402 446 28 1,682 37.66 252.1 1 1 70
Benzo[e]pyrene 521 251 71 1,060 38.45 252.1 1 3 70
Benzo[a]pyrene 400 248 32 945 38.62 252.1 1 3 78
Indeno[cd]pyrene 542 243 71 1,017 42.17 276.1 1 3 80
Dibenz[ah]anthracene 72 58 10 202 42.32 278.1 2 7 80
Benzo[ghi]perylene 1,003 597 92 2,281 43.02 276.1 1 1 80
13,5-Triphenylbenzene 704 388 69 1,620 39.51 306 2 7 69
Overall mean 365 ± 284 ng/m3
1 Mean concentration (n = 21)2 ±SD (n = 21)3 Minimum concentration (n = 21)4 Maximum concentration (n = 21)5 Retention time in minutes6 Qualifying ion7 Method limit of detection, ng/ml8 Method limit of quantification, ng/ml9 Mean % recovery based on isotopically labeled compounds
The overall mean ambient concentrations of PAHs, pesticidesEI, pesticides CI and PCBs were 365±284, 183±235, 3.75±6.67 and 326 ± 2.75 ng/m3, respectively (Tables 2, 3, 4;Figs. 2, 3). The standard deviations of the compound con-centrations were large compared to the means, resulting incoefficients of variation>1.0, indicating highly variable data.All POP concentrations exceeded the limits recommendedby the various international organizations [28,31,33,34].The mean PM concentration in the ambient air of Riyadh(576 ± 255 µg/m3) exceeds the limit proposed by the WHO(50 µg/m3 24-h mean) [28].
The population of the Riyadh region is rapidly increas-ing to approximately 5.8 million [35], which is reflected inthe increasing number of automobiles on the roads, in turnleading to a substantial increase in emission loads to the air.In 2012, about 4.85 million cars were registered in the city[36]. This dramatic increase in traffic load in highly populatedcities like Riyadh results in a considerable increase in PAHsand PCBs, and major vehicle engine emissions [37–39]. Ourfindings reveal higher concentrations of POPs in Riyadh than
those reported recently for other regions (Table 5) [40–50].Similarly, there has been a significant increase in pesticideconsumption in Saudi Arabia during the past decade. A totalof 3.24 × 10³ tons of pesticides were used to treat an areaof about 2.1 million hectares during 2000–2010 [51], whichrepresents an application of approximately 15 g/m2. The cli-mate of Saudi Arabia is an important factor in increasingpollution. It is located in a dry region where precipitationrarely occurs with an annual mean rainfall of 7.2 mm. Sur-face winds are active almost all year, and land topographyalso affects air pollution. Most of the area of Saudi Arabia isdesert with plantation coverage of less than 5 % of the area,which results in a high concentration of wind-transporteddust into the air sheds of inhabited areas.
The growing socioeconomic development and traffic area major source of air pollution, as illustrated with the distrib-ution of PAHs in the Riyadh PM samples (Fig. 3). Althoughthe qualitative composition of PAHs in Riyadh aerosol PMis similar to those of other urban areas, the concentrationof specific components exhibit distinct variation. Riyadh
123
Author's personal copy
Arab J Sci Eng
Table 3 Concentrations of pesticides in PM samples from Riyadh during December 2010–January 2011 determined by GC-MS (EI- and CI-SIMmodes)
Compound Mean1 (ng/m3) SD2(ng/m3) Min3 (ng/m3) Max4(ng/m3) Ret. time5 Q-Ion6 LOD7 LOQ8 % Recovery9
EPTC 91 49 0 190 14.38 128.1 1 3 69
Pebulate 282 163 107 911 16.72 128.1 1 3 69
Propachlor 47 122 0 437 19.60 120.1 2 7 69
Atrazine desethyl 238 502 0 2,227 21.07 172.0 1 3 69
Simazine 409 1,410 0 6, 447 22.41 201.1 2 7 69
Atrazine 587 809 0 3,225 22.31 200.1 1 3 69
Alachlor 833 2,202 0 10,398 25.15 188.1 2 7 69
Metolachlor 44 47 −1 189 26.07 162.1 1 3 69
Triallate 242 349 0 1,366 23.78 268.0 2 7 69
Malathion 358 417 0 1,603 26.16 173.1 3 10 69
Methyl parathion 2 5 0 16 24.46 263.0 3 10 69
Parathion 39 34 20 171 26.70 291.0 3 10 69
Ethion 22 25 3 93 30.79 231.0 2 7 69
p,p′-DDE 15 25 0 123 29.58 317.9 1 3 69
o,p′-DDD 10 10 0 37 29.87 235.0 2 7 69
p,p′-DDD 14 31 2 147 30.86 235.0 2 7 69
o,p′-DDT 14 27 2 131 30.86 235.0 2 7 69
Methoxychlor 49 84 4 347 33.89 227.1 2 7 69
Trifluralina 1 1 0 3 14.23 335.1 1.0 1.0 77
Hexachlorobenzenea 2 2 1 12 15.06 283.8 0.3 0.3 77
g-HCH (Lindane)a 3 2 0 5 16.53 71.00 1.0 1.0 77
Dacthala 0 0 0 1 21.98 332.0 0.5 0.5 77
Chlorpyrifosa 20 24 7 122 21.80 313.0 1.0 1.0 77
Endosulfan Ia 3 8 0 36 25.31 403.9 1.0 1.0 77
Trans-Nonachlora 0 0 0 1 25.47 443.9 0.5 0.5 77
Endosulfan sulfatea 1 0 0 2 29.82 385.9 0.5 0.5 77
Pesticides determined by GC-MS-EI-SIM mode, overall mean 183 ± 235 ng/m3
a Pesticides determined by GC-MS-CI-SIM mode, overall mean 3.75 ± 6.67 ng/m3
1−9 as in Table 2
Table 4 Concentrations of PCBs in PM samples from Riyadh during December 2010–January 2011 determined by GC-MS (EI-SIM mode)
Compound Mean1 (ng/m3) SD2 (ng/m3) Min3(ng/m3) Max4(ng/m3) Ret. time5 Q-Ion6 LOD7 LOQ8 % Recovery9
PCB 118 4.20 11.47 0.00 51.09 28.02 325.9 0.5 0.5 77
PCB 153 2.70 1.97 1.12 9.470 29.01 359.9 0.3 0.3 77
PCB 138 7.52 5.90 2.10 26.69 30.18 359.9 3.0 3.0 77
PCB 187 1.10 1.00 0.49 5.250 30.85 393.9 0.5 0.5 77
PCB 183 0.76 0.88 0.24 4.320 31.10 393.9 0.3 0.3 77
Overall mean 3.26 ± 2.75 ng/m3
1−9 as in Table 2
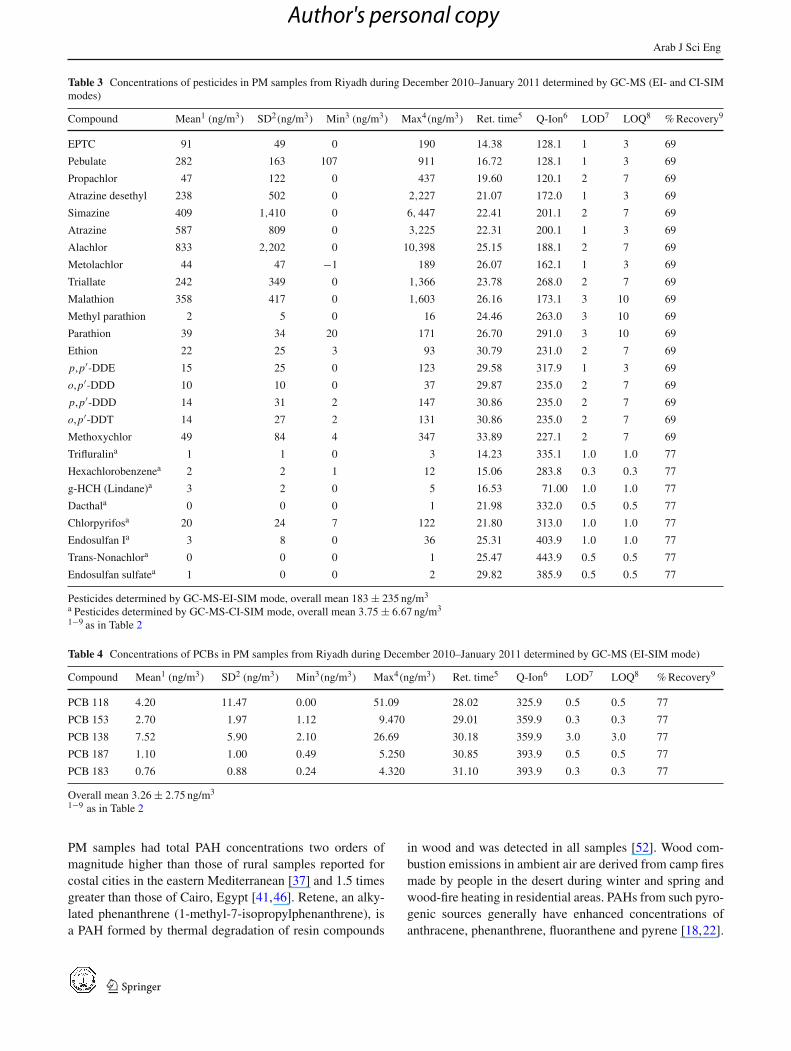
PM samples had total PAH concentrations two orders ofmagnitude higher than those of rural samples reported forcostal cities in the eastern Mediterranean [37] and 1.5 timesgreater than those of Cairo, Egypt [41,46]. Retene, an alky-lated phenanthrene (1-methyl-7-isopropylphenanthrene), isa PAH formed by thermal degradation of resin compounds
in wood and was detected in all samples [52]. Wood com-bustion emissions in ambient air are derived from camp firesmade by people in the desert during winter and spring andwood-fire heating in residential areas. PAHs from such pyro-genic sources generally have enhanced concentrations ofanthracene, phenanthrene, fluoranthene and pyrene [18,22].
123
Author's personal copy
Arab J Sci Eng
(b)
-200
300
800
1300
1800
2300
2800
3300
EPTC
Pebu
late
Prop
achl
or
Atra
zine
des
ethy
l
Sim
azin
e
Atra
zine
Alac
hlor
Met
olac
hlor
Tria
llate
Mal
athi
on
Met
hyl p
arat
hion
Para
thio
n
Ethi
on
p,p'
-DDE
o,p'
-DDD
p,p'
-DDD
1,3,
5-
o,p'
-DDT
Met
hoxy
chlo
r
Pesticide (EI)
(c)
-5
0
5
10
15
20
25
Tri
flu
rali
n
Hexach
loro
ben
zen
e
g-H
CH
(L
ind
an
e)
Dacth
al
Ch
lorp
yri
fos
En
do
su
lfan
I
tran
s-N
on
ach
lor
En
do
su
lfan
su
lfate
Pesticide (CI)
(a)
-200
0
200
400
600
800
1000
1200
1400
1600
1800
Ace
naph
thyl
ene
Ace
naph
then
e
Fluo
rene
Phe
nant
hren
e
Ant
hrac
ene
Fluo
rant
hene
Pyr
ene
Ret
ene
Ben
z[a]
anth
race
ne
Chr
ysen
e
Ben
zo[b
]flu
oran
then
e
Ben
zo[k
]flu
oran
then
e
Ben
zo[e
]pyr
ene
Ben
zo[a
]pyr
ene
Inde
no[c
d]py
rene
Dib
enz[
ah]a
nthr
acen
e
Ben
zo[g
hi]p
eryl
ene
1,3,
5-Tr
iphe
nylb
enze
ne
PAH
ng/m
3ng
/m3
ng/m
3ng
/m3
(d)
-8
-3
2
7
12
17
PCB 118 PCB 153 PCB 138 PCB 187 PCB 183
PCB congener
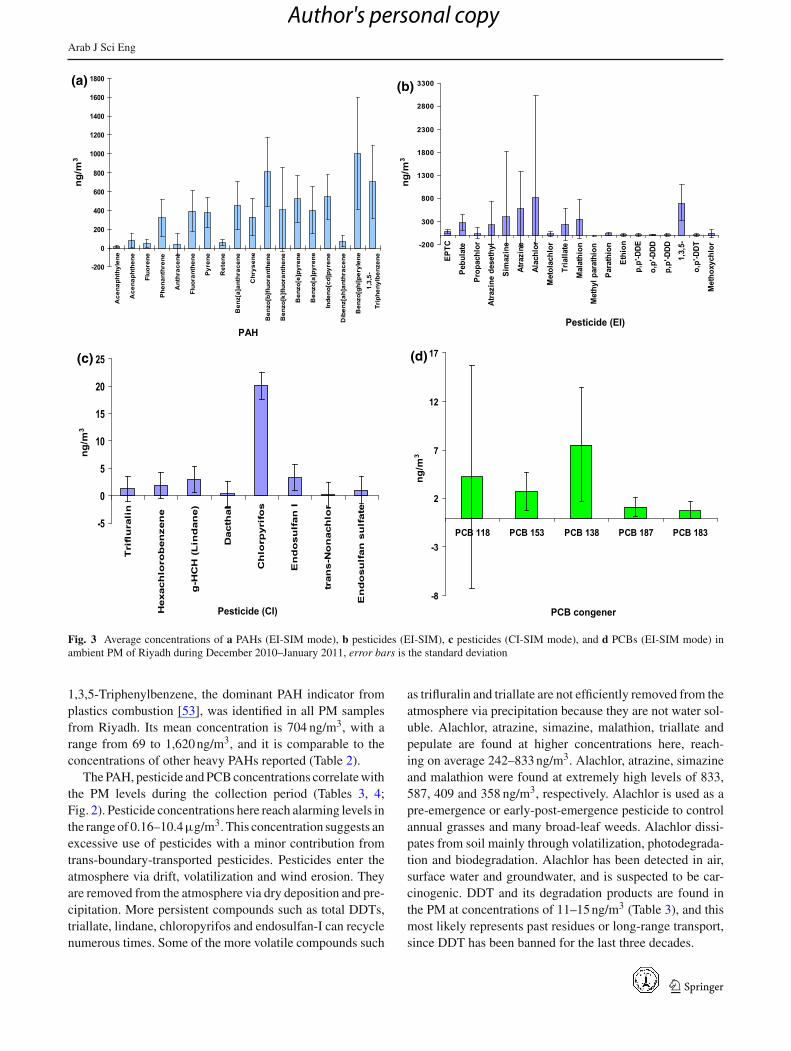
Fig. 3 Average concentrations of a PAHs (EI-SIM mode), b pesticides (EI-SIM), c pesticides (CI-SIM mode), and d PCBs (EI-SIM mode) inambient PM of Riyadh during December 2010–January 2011, error bars is the standard deviation
1,3,5-Triphenylbenzene, the dominant PAH indicator fromplastics combustion [53], was identified in all PM samplesfrom Riyadh. Its mean concentration is 704 ng/m3, with arange from 69 to 1,620 ng/m3, and it is comparable to theconcentrations of other heavy PAHs reported (Table 2).
The PAH, pesticide and PCB concentrations correlate withthe PM levels during the collection period (Tables 3, 4;Fig. 2). Pesticide concentrations here reach alarming levels inthe range of 0.16–10.4µg/m3. This concentration suggests anexcessive use of pesticides with a minor contribution fromtrans-boundary-transported pesticides. Pesticides enter theatmosphere via drift, volatilization and wind erosion. Theyare removed from the atmosphere via dry deposition and pre-cipitation. More persistent compounds such as total DDTs,triallate, lindane, chloropyrifos and endosulfan-I can recyclenumerous times. Some of the more volatile compounds such
as trifluralin and triallate are not efficiently removed from theatmosphere via precipitation because they are not water sol-uble. Alachlor, atrazine, simazine, malathion, triallate andpepulate are found at higher concentrations here, reach-ing on average 242–833 ng/m3. Alachlor, atrazine, simazineand malathion were found at extremely high levels of 833,587, 409 and 358 ng/m3, respectively. Alachlor is used as apre-emergence or early-post-emergence pesticide to controlannual grasses and many broad-leaf weeds. Alachlor dissi-pates from soil mainly through volatilization, photodegrada-tion and biodegradation. Alachlor has been detected in air,surface water and groundwater, and is suspected to be car-cinogenic. DDT and its degradation products are found inthe PM at concentrations of 11–15 ng/m3 (Table 3), and thismost likely represents past residues or long-range transport,since DDT has been banned for the last three decades.
123
Author's personal copy
Arab J Sci Eng
Table 5 Comparison of mean total POP concentrations in urban atmospheric PM from different locations in the region, Asia, Europe and USA(ng/m3)
CairoEgypt1
(regional)
KonyaTurkey2
(regional)
(Vilnius)Lithuania3
(Europe)
ChicagoIL4, USA
GuangzhouChina5, Asia
Riyadh,SaudiArabia
Acenaphthylene 448.19 0.80 0.78 76.9 4 18
Acenaphthene 378.31 0.40 0.58 NA 0.8 84
Fluorene 503.59 0.90 3.46 74.8 22.2 47
Phenanthrene 257.18 7.80 9.73 200 198 321
Anthracene 187.27 2.70 0.43 14.0 30 40
Fluoranthene 216.79 11.2 2.27 44.0 36.9 395
Pyrene 188.09 9.50 1.28 24.0 22.8 376
Retene NA NA NA NA NA 59
Benz[a]anthracene 175.99 7.00 0.03 2.10 2 451
Chrysene 211.56 11.7 0.08 3.6.0 3.6 330
Benzo[b]fluoranthene 230.15 6.40 0.04 2.30 2.6 810
Benzo[k]fluoranthene NA 7.70 0.02 NA NA 402
Benzo[e]pyrene NA NA 0.03 NA NA 521
Benzo[a]pyrene 159.55 5.30 0.03 1.60 2.3 400
Indeno[cd]pyrene 123.08 3.50 0.03 1.20 2.7 542
Dibenz[ah]anthracene 174.97 2.40 <DL NA 0.3 72
Benzo[ghi]perylene 219.23 2.00 0.06 1.10 3.1 1,003
1,3,5-Triphenylbenzene NA NA NA NA NA 704
EPTC NA NA NA NA NA 91
Pebulate NA NA NA NA NA 282
Propachlor NA NA NA NA NA 47
Atrazine desethyl NA NA NA NA NA 238
Simazine NA NA NA NA NA 409
Atrazine NA NA NA NA NA 587
Alachlor NA NA NA NA NA 833
Metolachlor NA NA NA NA NA 44
Triallate NA NA NA NA NA 242
Malathion NA NA NA NA NA 358
Methyl parathion NA NA NA NA NA 2
Parathion NA NA NA NA NA 39
Ethion NA NA NA NA NA 22
p,p′-DDE NA 0.05 NA NA 0.5 15
o,p′-DDD NA NA NA NA <dl 10
p,p′-DDD NA 0.30 NA 0.1 0.9 14
o,p′-DDT 38.3 <dl NA 0.07 0.2 14
Methoxychlor 1.40 NA NA NA NA 49
Trifluralina NA NA NA NA NA 1
Hexachlorobenzenea 17.8 0.13 NA 0.11 <dl 2
g-HCH (Lindane)a 60.3 0.12 0.071 0.15 <dl 3
Dacthala NA NA NA NA NA 0
Chlorpyrifosa NA NA NA NA NA 20
Endosulfan Ia 69.5 0.37 NA NA NA 3
trans-Nonachlora NA NA NA NA NA 0
123
Author's personal copy

Arab J Sci Eng
Table 5 continued
CairoEgypt1
(regional)
KonyaTurkey2
(regional)
(Vilnius)Lithuania3
(Europe)
ChicagoIL4, USA
GuangzhouChina5, Asia
Riyadh,SaudiArabia
Endosulfan sulfatea NA 0.49 NA NA NA 1
PCB 118 5 NA 0.013 0.140 0.252 4.20
PCB 153 1 NA 0.010 0.006 0.286 2.70
PCB 138 3 NA 0.006 0.690 NA 7.52
PCB 187 14 NA 0.006 0.220 0.120 1.10
PCB 183 16 NA NA 0.002 0.110 0.76
<DL below detection limitNA not available1 Klánová et al. [41], Hassan and Khoder [46]2 Ozcan and Aydin [42]3 Milukaite et al. [43]4 Odabasi et al. [44], Sofuoglu et al. [47], Hu et al. [48]5 Li et al. [45], Yang et al. [49], Chen [50]
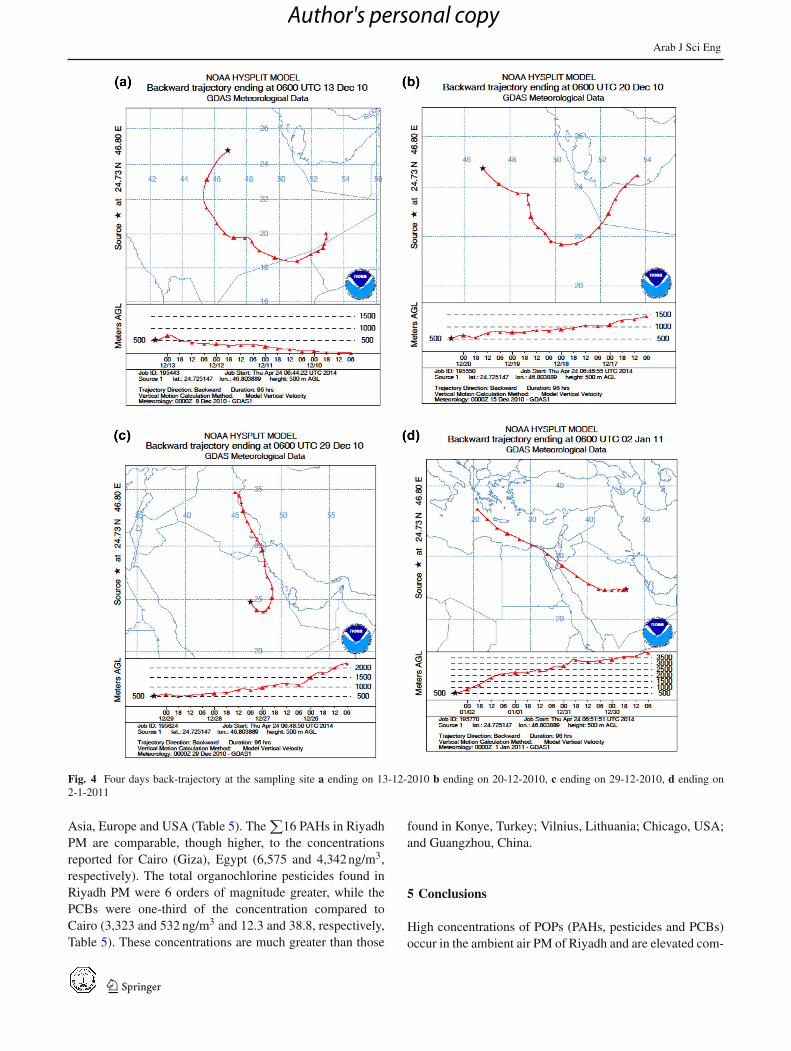
Back trajectories taken in Riyadh during December 2010to January 2011 were generated using the HYbrid Single-Particle Lagrangian Integrated Trajectory (HYSPLIT) model(http://www.arl.noaa.gov/ready/hysplit4.html) (Fig. 4). Asthe trajectories are calculated 96 h back in time, each oneis usually defined by 96 hourly segment endpoints. The tra-jectories were generated at a starting height of 500 m aboveground level. This level is frequently used and ensures that thetrajectory starts in the atmospheric boundary layer (ABL).Its depth is taken as 1,000 m. Air mass trajectory statisticssuggest long-range transport and are explicitly mentioned inthe guidance for the Global Monitoring Plan for POPs ofthe Stockholm Convention as a tool to support the detec-tion and interpretation of trends of POP concentrations inair [54].
Organochlorinated pesticides (OCP) and PCBs are emit-ted from primary and, being semivolatile, also from sec-ondary sources including re-volatilization. Soil resuspen-sion with degraded POPs from old usage in the Riyadhregion may contribute to the air concentration of POPs. Theback trajectories suggest long-range transport from local andregional areas (Fig. 4). Soils have a huge retention capac-ity for organic compounds, and they may act as re-emissionsources to the atmosphere (e.g., [55]). Volatilization fromcontaminated water, freshwater and shelf seas is anotherimportant source for the presence of POPs in the Europeanatmosphere [56]. The ratios of DDT isomers have been usedto identify the possible DDT sources (e.g., [57]). The ratioof DDT/(DDE+DDD) is generally used as an indicator ofaged DDT. A value <1 for DDT/(DDE+DDD) indicates agedDDT, and a value >1 is fresh application [57]. Here, the ratioof the mean of all samples for DDT/(DDE+DDD) was 0.36at the PM sampling point, indicating aged DDT in the Riyadhregion. Since DDT has been banned and regulated by Saudi
Arabia, the suggested source of DDT here is old usage orlong-range transport.
PCB compounds were widely used in transformer oil,capacitors, printing inks and many other applications. Theirproduction was due to their thermal and chemical stabil-ities, and their electrical insulation properties. PCBs maybe emitted to the air from industrial or municipal wasteburning processes in addition to other point sources. FivePCBs congeners were found at low concentrations rang-ing from 1 to 8 ng/m3, with the PCB 138 congener beingthe predominant compound in all samples (Table 4). AllPCB congeners are lipophilic which increases with increas-ing degree of chlorination. However, they have very lowwater solubilities. Congeners with a lower degree of chlo-rination are more volatile than those with a higher degree.PCBs determined in Riyadh ambient air PM were assumedto originate from plastic burning in solid waste landfills.Another suspected source could be burning of used tires andtransformer oils. Few studies have been conducted to mea-sure ambient air levels of PCBs, but concentrations appearto differ markedly between locations [40]. Owing to thevariations in the analytical procedures used, the concen-trations reported in independent studies must be evaluatedwith caution. The lowest levels, 0.002 ng/m3, are found innon-industrialized and non-contaminated areas (e.g., [43]),whereas the levels of 3.3 ng/m3 have been measured in theRuhr area of Germany [54]. The toxic equivalency fac-tors (TEF) for human intake of dioxin-like mono-ortho-PCB 118 (2,3′,4,4′,5-pentachlorobiphenyl) was set to be 1.0× 10⁻³ [25].
Riyadh has much higher POP concentrations than any-where else reported when compared with mean total POPconcentrations for similar cities (mega-cities with regard topopulation and traffic) at different locations in the region,
123
Author's personal copy
Arab J Sci Eng
Fig. 4 Four days back-trajectory at the sampling site a ending on 13-12-2010 b ending on 20-12-2010, c ending on 29-12-2010, d ending on2-1-2011
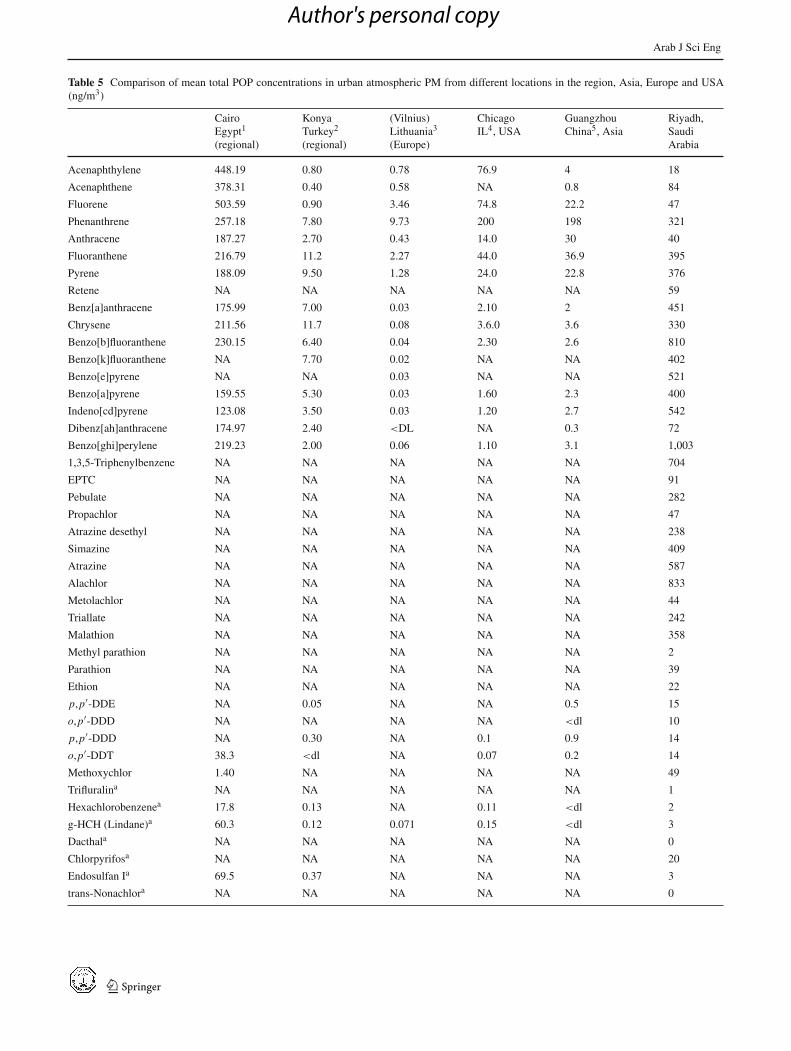
Asia, Europe and USA (Table 5). The∑
16 PAHs in RiyadhPM are comparable, though higher, to the concentrationsreported for Cairo (Giza), Egypt (6,575 and 4,342 ng/m3,respectively). The total organochlorine pesticides found inRiyadh PM were 6 orders of magnitude greater, while thePCBs were one-third of the concentration compared toCairo (3,323 and 532 ng/m3 and 12.3 and 38.8, respectively,Table 5). These concentrations are much greater than those
found in Konye, Turkey; Vilnius, Lithuania; Chicago, USA;and Guangzhou, China.
5 Conclusions
High concentrations of POPs (PAHs, pesticides and PCBs)occur in the ambient air PM of Riyadh and are elevated com-
123
Author's personal copy
Arab J Sci Eng
pared to other cities in the world. Most have a local origin,while a portion is likely to be long-range transported. Roadtraffic, petrochemical industry, agribusiness and waste burn-ing are responsible for most of the air pollution in Riyadh.Efforts should be made by the authorities to monitor and reg-ulate harmful emissions. Initiatives for research and devel-opment toward a clean air act are essential and encouraged.
Acknowledgments The authors acknowledge the support of theNational Plan for Sciences and Technology (NPST 09-ENV-841-02)at King Saud University. This work was also supported in part by theResearch Center of the College of Food and Agriculture Sciences, andthe Saudi Society of Agriculture Sciences. We thank Jill Schrlau, LeahChibwe and Christopher Walsh of the Environmental and MolecularToxicology Department, Oregon State University, USA, for their assis-tance and help during sample analysis.
References
1. Jones, K.C., de Voogt, P.: Persistent organic pollutants (POPs):state of the science. Environ. Pollut. 100, 209–221 (1999)
2. Aristizábal, B.H., Gonzalez, C.M., Morales, L., Abalos, M., Abad,E.: Polychlorinated dibenzo-p-dioxin and dibenzofuran in urbanair of an Andean city. Chemosphere 85, 170–178 (2011)
3. Bieser, J., Aulinger, A., Matthias, V., Quante, M.: Impact ofemission reductions between 1980 and 2020 on atmosphericbenzo[a]pyrene concentrations over Europe. Water Air Soil Pol-lut. 223, 1393–1414 (2012)
4. Menichini, E.: Urban air pollution by polycyclic aromatic hydro-carbons: levels and sources of variability. Sci. Total Envi-ron. 116, 109–135 (1992)
5. Brown, J.R., Field, R.A., Goldstone, M.E., Lester, J.N., Perry,R.: Polycyclic aromatic hydrocarbons in central London air dur-ing 1991 and 1992. Sci. Total Environ. 177, 73–84 (1996)
6. Dorr, G., Hippelein, M., Kaupp, H., Hutzinger, O.: Baseline con-tamination assessment for a new resource recovery facility in Ger-many: Part VI: levels and profiles of polycyclic aromatic hydrocar-bons (PAH) in ambient air. Chemosphere 33, 1569–1578 (1996)
7. Valerio, F., Pala, M., Lazzaretto, A., Stella, A., Ciccarelli, F., Cal-ducci, D.: Air quality standard for benzo(a)pyrene (BaP) in Genoa(1994–1995). Polycycl. Aromat. Compd. 9, 61–66 (1996)
8. Menichini, E., Monfredini, F., Merli, F.: The temporal variabilityof the profile of carcinogenic polycyclic aromatic hydrocarbons inurban air: a study in a medium traffic area in Rome, 1998. Atmos.Environ. 33, 3739–3750 (1998)
9. Lodovici, M., Venturini, M., Marini, E., Grechi, D., Dolara,P.: Polycyclic aromatic hydrocarbon air levels in Flo-rence, Italy, and their correlation with other air pollu-tants. Chemosphere 50, 377–382 (2003)
10. Rogge, W.F., Hildmann, L.M., Mazurek, M.A., Cass, G.R.,Simoneit, B.R.T.: Sources of fine organic aerosol: 1-charbroilerand meat cooking operations. Environ. Sci. Technol. 25, 1112–1125 (1991)
11. Rogge, W.F., Hildemann, L.M., Mazurek, M.A., Cass, G.R.,Simoneit, B.R.T.: Sources of fine organic aerosol: 2. Noncat-alyst and catalyst-equipped automobiles and heavy-duty dieseltrucks. Environ. Sci. Technol. 27, 636–651 (1993)
12. Rogge, W.F., Hildemann, L.M., Mazurek, M.A., Cass, G.R.,Simoneit, B.R.T.: Sources of fine organic aerosol: 3. Road dust,tire debris and organometallic brake lining dust, roads as sourcesand sinks. Environ. Sci. Technol. 27, 1892–1904 (1993)
13. Rogge, W.F., Hildemann, L.M., Mazurek, M.A., Cass, G.R.,Simoneit, B.R.T.: Sources of fine organic aerosol: 4. Particulateabrasion products from leaf surfaces of urban plants. Environ. Sci.Technol. 27, 2700–2711 (1993)
14. Rogge, W.F., Hildemann, L.M., Mazurek, M.A., Cass, G.R.,Simoneit, B.R.T.: Sources of fine organic aerosol: 5. Natural gashome appliances. Environ. Sci. Technol. 27, 2736–2744 (1993)
15. Rogge, W.F., Hildemann, L.M., Mazurek, M.A., Cass, G.R.,Simoneit, B.R.T.: Sources of fine organic aerosol. 6. Cigarettesmoke in the urban atmosphere. Environ. Sci. Technol. 28, 1375–1388 (1994)
16. Rogge, W.F., Hildemann, L.M., Mazurek, M.A., Cass, G.R.,Simoneit, B.R.T.: Sources of fine organic aerosol: 7. Hot asphaltroofing tar pot fumes. Environ. Sci. Technol. 31, 2726–2730 (1997)
17. Rogge, W.F., Hildemann, L.M., Mazurek, M.A., Cass, G.R.,Simoneit, B.R.T.: Sources of fine organic aerosol: 8. Boilers burn-ing No. 2 distillate fuel oil. Environ. Sci. Technol. 31, 2731–2737 (1997)
18. Rogge, W.F., Hildemann, L.M., Mazurek, M.A., Cass, G.R.,Simoneit, B.R.T.: Sources of fine organic aerosol: 9. Pine, oak andsynthetic log combustion in residential fireplaces. Environ. Sci.Technol. 32, 13–22 (1998)
19. Schauer, J.J., Rogge, W.F., Hildemann, L.M., Mazurek, M.A.,Cass, G.R., Simoneit, B.R.T.: Source apportionment of airborneparticulate matter using organic compounds as tracers. Atmos. Env-iron. 30, 3837–3855 (1996)
20. Schauer, J.J., Kleeman, M.J., Cass, G.R., Simoneit, B.R.T.: Mea-surement of emissions from air pollution sources: 1. C1–C29organic compounds from meat charbroiling. Environ. Sci. Tech-nol. 33, 1566–1577 (1999)
21. Schauer, J.J., Kleeman, M.J., Cass, G.R., Simoneit, B.R.T.: Mea-surement of emissions from air pollution sources. 2. C1 throughC30 organic compounds from medium duty diesel trucks. Environ.Sci. Technol. 33, 1578–1587 (1999)
22. Schauer, J.J., Kleeman, M.J., Cass, G.R., Simoneit, B.R.T.: Mea-surement of emissions from air pollution sources: 3. C1–C29organic compounds from fireplace combustion of wood. Environ.Sci. Technol. 35, 1716–1728 (2001)
23. Schauer, J.J., Kleeman, M.J., Cass, G.R., Simoneit, B.R.T.: Mea-surement of emissions from air pollution sources: 4. C1–C27organic compounds from cooking with seed oils. Environ. Sci.Technol. 36, 567–575 (2002)
24. Schauer, J.J., Kleeman, M.J., Cass, G.R., Simoneit, B.R.T.: Mea-surement of emissions from air pollution sources: 5. C1 throughC32 organic compounds from gasoline powered motor vehi-cles. Environ. Sci. Technol. 36, 1169–1180 (2002)
25. World Health Organization (WHO): International Agency forResearch on Cancer. IARC Monographs on the Evaluationof Carcinogenic Risks to Humans. Polychlorinated dibenzo-p-dioxins and polychlorinated dibenzofurans, vol. 69, Lyon(1997)
26. World Health Organization (WHO): Air Quality Guidelinesfor Europe, 2nd edn. Copenhagen, World Health OrganizationRegional Office for Europe, 2000 (WHO Regional Publications),European Series No. 91 9 (2000)
27. World Health Organization (WHO): Health Aspects of Air Pollu-tion with Particulate Matter, Ozone and Nitrogen Dioxide. Reporton a WHO Working Group, 13–15 January 2003, Bonn, Germany(2003)
28. World Health Organization (WHO): WHO Air Quality Guidelinesfor Particulate Matter, Ozone, Nitrogen Dioxide and Sulfur Diox-ide. Summary of Risk Assessment (2005)
29. United States Environmental Protection Agency (US EPA):Method 40 CFR Pt. 50, App. J, Reference Method for theDetermination of Particulate Matter as PM in the Atmosphere(1987)
123
Author's personal copy
Arab J Sci Eng
30. United States Environmental Protection Agency (US EPA):Method TO-9A—Determination of Polychlorinated, Polybromi-nated and Brominated/Chlorinated Dibenzo-p-dioxins and Diben-zofurans in Ambient Air (1999)
31. United States Environmental Protection Agency (US EPA): AirQuality Index. A Guide to Air Quality and Your Health. Office ofAir Quality Planning and Standards (2009)
32. Sloss, L.L.; Smith, I.M.: PM and PM2.5: an international perspec-tive. Fuel Process. Technol. 65–66:127–141 (2000)
33. UNEP (United Nations Environment Program): Stockholm Con-vention on Persistent Organic Pollutants. Geneva, Switzerland(2002)
34. UNEP (United Nations Environment Program): Ridding the Worldof POPs: A Guide to the Stockholm Convention on PersistentOrganic Pollutants (2005)
35. http://www.moa.gov.sa/36. http://www.moa.gov.sa/files/stat24/5/24.htm (Imported pestici
des)37. Gogou, A., Stephanou, E.G., Stratigakis, N., Grimalt, J.O., Simo,
R., Aceves, M., Albaiges, J.: Differences in lipid and organic saltconstituents of aerosols from Eastern and Western Mediterraneancoastal cities. Atmos. Environ. 28, 1301–1310 (1994)
38. Zhou, L., Zhao, W.: Source apportionment of airborne particulatematter for the speciation trends network site in Cleveland, OH. J.Air Waste Manag. Assoc. 59, 321–331 (2009)
39. Robinson, A.L., Subramanian, R., Donahue, N.M., Bernardo-Bricker, A., Rogge, W.F.: Source apportionment of molecularmarkers and organic aerosol. 1. Polycyclic aromatic hydrocar-bons and meteorology for data visualization. Environ. Sci. Tech-nol. 40, 7803–7810 (2006)
40. Broz, J., Grabic, R., Kili, J., Lojkasek, M., Marklund, S., Ocelka,T., Pekarek, V., Pribyl, J., Tydliat, V., Vyska, J.: The effect of oilson PAH, PCDD, PCDF, and PCB emissions from a spark enginefueled with leaded gasoline. Chemosphere 41, 1905–1911 (2000)
41. Klánová, J.; Cupr, P.; Holoubek, I.; Boruvková; Pribylová, P.;Kareš, R.; Tomšej, T.; Ocelka, T.: Monitoring of persistent organicpollutants in Africa. Part 1: passive air sampling across the conti-nent in 2008. J. Environ. Monit. 11, 1952–1963 (2009)
42. Ozcan, S., Aydin, M.: PAHs, PCBs and OCP in urban air of Konya,Turkey. Atmos. Res. 93, 715–722 (2009)
43. Milukaite, A., Klánová, J., Holoubek, I., Rimšelyte, I., Kvietkus,K.: POPs in Lithuania: assessment of air and soil contamina-tion. Lith. J. Phys. 48, 357–366 (2008)
44. Odabasi, M., Vardar, N., Sofuoglu, A., Tasdemir, Y., Holsen,T.M.: Polycyclic aromatic hydrocarbons (PAHs) in Chicagoair. Sci. Total Environ. 27, 57–67 (1999)
45. Li, J., Zhang, G., Li, X.D., Qi, S.H., Liu, G.Q., Peng, X.Z.: Sourceseasonality of polycyclic aromatic hydrocarbons (PAHs) in asubtropical city, Guangzhou, South China. Sci. Total Envi-ron. 355, 145–155 (2006)
46. Hassan, S., Khoder, M.I.: Gas-particle concentration, distribution,and health risk assessment of polycyclic aromatic hydrocarbons ata traffic area of Giza, Egypt. Environ. Monit. Assess. 184, 3593–3612 (2012)
47. Sofuoglu, A., Odabasi, M., Tasdemir, Y., Khalili, N.R., Holsen,T.M.: Temperature dependence of gas-phase PAH and organochlo-rine pesticide concentrations in Chicago air. Atmos. Envi-ron. 35, 6503–6510 (2001)
48. Hu, D.F., Lehmler, H.-J., Martinez, A., Wang, K., Hornbuckle,K.C.: Atmospheric PCB congeners across Chicago. Atmos. Envi-ron. 44, 1550–1557 (2010)
49. Yang, Y.Y., Li, D.L., Mu, D.H.: Levels, seasonal variations andsources of organochlorine pesticides in ambient air of Guangzhou,China. Atmos. Environ. 42, 677–687 (2008)
50. Chen, L.: Polychlorinated biphenyls in the atmosphere of an urbancity: levels, distribution, and emissions. Arch. Environ. Contam.Toxicol. 57, 437–446 (2009)
51. http://www.moa.gov.sa/files/stat24/5/16.htm (MOA services con-sumed pesticides)
52. Ramdahl, T.: Retene—a molecular marker of wood smoke in ambi-ent air. Nature 306, 580–582 (1983)
53. Simoneit, B.R.T., Medeiros, P.M., Didyk, B.M.: Combustionproducts of plastics as indicators for refuse burning in theatmosphere. Environ. Sci. Technol. 39, 6961–6970 (2005)
54. World Health Organization (WHO): Polychlorinated Biphenylsand Terphenyls, 2nd edn. Geneva, (Environmental Health Crite-ria, No. 140) (1993)
55. Simoneit, B.R.T., Elias, V.O., Kobayashi, M., Kawamura, K.,Rushdi, A.I., Medeiros, P.M., Rogge, W.F., Didyk, B.M.: Sugars—dominant water-soluble organic compounds in soils and character-ization as tracers in atmospheric particulate matter. Environ. Sci.Technol. 38, 5939–5949 (2004)
56. UNEP (United Nations Environment Program): Guidance on theGlobal Monitoring Plan for Persistent Organic Pollutants, Prelim-inary Version February 2007. Amended in May 2007. StockholmConvention Secretariat, Geneva, 147pp (2007)
57. Li, J., Guo, Z., Xu, W., Li, X., Lee, C., Ding, A., Wang,T.: Organochlorine pesticides in the atmosphere of Guangzhou andHong Kong: regional sources and long-range atmospheric trans-port. Atmos. Environ. 41, 3889–3903 (2007)
123
Author's personal copy
Copyright © 2022 FDOKUMEN