Historical and future changes in air pollutants from CMIP6 ...
41
1 Historical and future changes in air pollutants from CMIP6 models Steven T. Turnock 1 , Robert J. Allen 2 , Martin Andrews 1 , Susanne E. Bauer 3,4 , Makoto Deushi 5 , Louisa Emmons 6 , Peter Good 1 , Larry Horowitz 7 , Jasmin G. John 7 , Martine Michou 8 , Pierre Nabat 8 , Vaishali Naik 7 , David Neubauer 9 , Fiona M. O’Connor 1 , Dirk Olivié 10 , Naga Oshima 5 , Michael Schulz 10 , Alistair Sellar 1 , Sungbo Shim 11 , Toshihiko Takemura 12 , Simone Tilmes 6 , Kostas Tsigaridis 3,4 , Tongwen Wu 13 , Jie 5 Zhang 13 1 Met Office Hadley Centre, Exeter, UK 2 Department of Earth and Planetary Sciences, University of California Riverside, Riverside, California, USA 3 Center for Climate Systems Research, Columbia University, New York, NY, USA 4 NASA Goddard Institute for Space Studies, New York, NY, USA 10 5 Meteorological Research Institute, Tsukuba, Japan 6 Atmospheric Chemistry Observations and Modelling Lab, National Center for Atmospheric Research, Boulder, CO, USA 7 NOAA Geophysical Fluid Dynamics Laboratory, Princeton, USA 8 Centre National de Recherches Météorologiques (CNRM), Université de Toulouse, Météo‐France, CNRS, Toulouse, France 9 Institute of Atmospheric and Climate Science, ETH Zurich, Zurich, Switzerland 15 10 Division for Climate Modelling and Air Pollution, Norwegian Meteorological Institute, Oslo, Norway 11 National Institute of Meteorological Sciences, Seogwipo-si, Jeju-do, Korea 12 Research Institute for Applied Mechanics, Kyushu University, Fukuoka, Japan 13 Beijing Climate Center, China Meteorological Administration, Beijing, China Correspondence to: Steven Turnock ([email protected]) 20 Abstract. Poor air quality is currently responsible for large impacts on human health across the world. In addition, the air pollutants, ozone (O3) and particulate matter less than 2.5 microns in diameter (PM2.5), are also radiatively active in the atmosphere and can influence Earth’s climate. It is important to understand the effect of air quality and climate mitigation measures over the historical period and in different future scenarios to ascertain any impacts from air pollutants on both climate and human 25 health. The 6 th Coupled Model Intercomparison Project (CMIP6) presents an opportunity to analyse the change in air pollutants simulated by the current generation of climate and Earth system models that include a representation of chemistry and aerosols (particulate matter). The shared socio-economic pathways (SSPs) used within CMIP6 encompass a wide range of trajectories in precursor emissions and climate change, allowing for an improved analysis of future changes to air pollutants. Firstly, we conduct an evaluation of the available CMIP6 models against surface observations of O3 and PM2.5. CMIP6 models 30 consistently overestimate observed surface O3 concentrations across most regions and in most seasons by up to 16 ppb, with a large diversity in simulated values over northern hemisphere continental regions. Conversely, observed surface PM2.5 concentrations are consistently underestimated in CMIP6 models by up to 10 µg m -3 , particularly for the northern hemisphere winter months, with the largest model diversity near natural emission source regions. The biases in CMIP6 models when compared to observations of O3 and PM2.5 are similar to those found in previous studies. Over the historical period (1850- 35 2014) large increases in both surface O3 and PM2.5 are simulated by the CMIP6 models across all regions, particularly over the mid to late 20 th Century when anthropogenic emissions increase markedly. Large regional historical changes are simulated for both pollutants, across East and South Asia, with an annual mean increase of up to 40 ppb for O3 and 12 µg m -3 for PM2.5. In future scenarios containing strong air quality and climate mitigation measures (ssp126), annual mean concentrations of air pollutants are substantially reduced across all regions by up to 15 ppb for O3 and 12 µg m -3 for PM2.5. However, for scenarios 40 that encompass weak action on mitigating climate and reducing air pollutant emissions (ssp370), annual mean increases of both surface O3 (up 10 ppb) and PM2.5 (up to 8 µg m -3 ) are simulated across most regions, although, for regions like North America and Europe small reductions in PM2.5 are simulated due to the regional reduction of precursor emissions in this scenario. A comparison of simulated regional changes in both surface O3 and PM2.5 from individual CMIP6 models highlights important regional differences due to the simulated interaction of aerosols, chemistry, climate and natural emission sources 45
-
Upload
khangminh22 -
Category
Documents
-
view
1 -
download
0
Transcript of Historical and future changes in air pollutants from CMIP6 ...
1
Historical and future changes in air pollutants from CMIP6 models
Steven T. Turnock1, Robert J. Allen2, Martin Andrews1, Susanne E. Bauer3,4, Makoto Deushi5, Louisa Emmons6, Peter Good1, Larry Horowitz7, Jasmin G. John7, Martine Michou8, Pierre Nabat8, Vaishali Naik7, David Neubauer9, Fiona M. O’Connor1, Dirk Olivié10, Naga Oshima5, Michael Schulz10, Alistair Sellar1, Sungbo Shim11, Toshihiko Takemura12, Simone Tilmes6, Kostas Tsigaridis3,4, Tongwen Wu13, Jie 5
Zhang13 1Met Office Hadley Centre, Exeter, UK 2Department of Earth and Planetary Sciences, University of California Riverside, Riverside, California, USA 3Center for Climate Systems Research, Columbia University, New York, NY, USA 4NASA Goddard Institute for Space Studies, New York, NY, USA 10 5 Meteorological Research Institute, Tsukuba, Japan 6Atmospheric Chemistry Observations and Modelling Lab, National Center for Atmospheric Research, Boulder, CO, USA 7NOAA Geophysical Fluid Dynamics Laboratory, Princeton, USA 8Centre National de Recherches Météorologiques (CNRM), Université de Toulouse, Météo‐France, CNRS, Toulouse, France 9Institute of Atmospheric and Climate Science, ETH Zurich, Zurich, Switzerland 15 10Division for Climate Modelling and Air Pollution, Norwegian Meteorological Institute, Oslo, Norway 11 National Institute of Meteorological Sciences, Seogwipo-si, Jeju-do, Korea
12Research Institute for Applied Mechanics, Kyushu University, Fukuoka, Japan 13Beijing Climate Center, China Meteorological Administration, Beijing, China
Correspondence to: Steven Turnock ([email protected]) 20
Abstract.
Poor air quality is currently responsible for large impacts on human health across the world. In addition, the air pollutants,
ozone (O3) and particulate matter less than 2.5 microns in diameter (PM2.5), are also radiatively active in the atmosphere and
can influence Earth’s climate. It is important to understand the effect of air quality and climate mitigation measures over the
historical period and in different future scenarios to ascertain any impacts from air pollutants on both climate and human 25
health. The 6th Coupled Model Intercomparison Project (CMIP6) presents an opportunity to analyse the change in air pollutants
simulated by the current generation of climate and Earth system models that include a representation of chemistry and aerosols
(particulate matter). The shared socio-economic pathways (SSPs) used within CMIP6 encompass a wide range of trajectories
in precursor emissions and climate change, allowing for an improved analysis of future changes to air pollutants. Firstly, we
conduct an evaluation of the available CMIP6 models against surface observations of O3 and PM2.5. CMIP6 models 30
consistently overestimate observed surface O3 concentrations across most regions and in most seasons by up to 16 ppb, with a
large diversity in simulated values over northern hemisphere continental regions. Conversely, observed surface PM2.5
concentrations are consistently underestimated in CMIP6 models by up to 10 µg m-3, particularly for the northern hemisphere
winter months, with the largest model diversity near natural emission source regions. The biases in CMIP6 models when
compared to observations of O3 and PM2.5 are similar to those found in previous studies. Over the historical period (1850-35
2014) large increases in both surface O3 and PM2.5 are simulated by the CMIP6 models across all regions, particularly over the
mid to late 20th Century when anthropogenic emissions increase markedly. Large regional historical changes are simulated for
both pollutants, across East and South Asia, with an annual mean increase of up to 40 ppb for O3 and 12 µg m-3 for PM2.5. In
future scenarios containing strong air quality and climate mitigation measures (ssp126), annual mean concentrations of air
pollutants are substantially reduced across all regions by up to 15 ppb for O3 and 12 µg m-3 for PM2.5. However, for scenarios 40
that encompass weak action on mitigating climate and reducing air pollutant emissions (ssp370), annual mean increases of
both surface O3 (up 10 ppb) and PM2.5 (up to 8 µg m-3) are simulated across most regions, although, for regions like North
America and Europe small reductions in PM2.5 are simulated due to the regional reduction of precursor emissions in this
scenario. A comparison of simulated regional changes in both surface O3 and PM2.5 from individual CMIP6 models highlights
important regional differences due to the simulated interaction of aerosols, chemistry, climate and natural emission sources 45
2
within models. The projection of regional air pollutant concentrations from the latest climate and Earth system models used
within CMIP6 shows that the particular future trajectory of climate and air quality mitigation measures could have important
consequences for regional air quality, human health and near-term climate. Differences between individual models emphasises
the importance of understanding how future Earth system feedbacks influence natural emission sources e.g. response of
biogenic emissions under climate change. 50
1 Introduction
Air pollutants are important atmospheric constituents as they have large impacts on human health (Lelieveld et al., 2015),
damage ecosystems (Fowler et al., 2009) and can also influence climate through changes in the Earth’s radiative balance
(Boucher et al., 2013; Myhre et al., 2013). Two major components of air pollution at the surface are ozone (O3) and particulate
matter less than 2.5 microns in diameter (PM2.5). Exposure to present day ambient concentrations of these two air pollutants 55
was estimated as causing up to 4 million premature deaths per year (Apte et al., 2015; Malley et al., 2017). Over recent decades,
the impact on human health from exposure to air pollutants has been increasing (Butt et al., 2017; Cohen et al., 2017).
Additionally, elevated levels of air pollutants over recent decades have also been responsible for ecosystem damage to crops
and vegetation, although there have been recent improvements in environmental health (de Wit et al., 2015).
In terms of climate impact, tropospheric O3 has a positive radiative forcing on climate over the industrial period and is the 60
third most important greenhouse gas in terms of radiative forcing (Myhre et al., 2013). However, depletion of O3 in the
stratosphere has resulted in a net negative top of atmosphere radiative forcing over recent decades (Checa‐Garcia et al., 2018).
Particulate matter (PM), also referred to as aerosols, has an overall negative radiative forcing on climate, both directly and
indirectly through the modification of cloud properties (Boucher et al., 2013). Both O3 and PM are relatively short lived in the
troposphere, with a typical lifetime of less than 2 weeks in the lower atmosphere and are commonly referred to as Short-lived 65
Climate Forcers (SLCFs). Future air pollutant concentrations and distributions are driven by changes to both precursor
emissions and climate. Emission control measures on a national and international level can both influence future changes to
air pollutants, with global increases in CH4 abundance potentially offsetting benefits to surface O3 from local emission
reductions (Fiore et al., 2002; Shindell et al., 2012; Wild et al., 2012). For PM2.5, changes in concentrations are dependent on
both emission rates and levels of atmospheric oxidants, although changes in specific aerosol components can be more directly 70
related to emissions, e.g. black carbon. In a warming world, background O3 concentrations over remote locations are likely to
decrease (Johnson et al., 1999; Isaksen et al., 2009; Fiore et al., 2012; Doherty et al., 2013), whereas over anthropogenic source
regions, which have higher average surface O3 concentrations, an increase is anticipated (Rasmussen et al., 2013; Colette et
al., 2015). The climate impact on PM2.5 is much more uncertain and variable across regions, with both increases and decreases
predicted due to the uncertainty of future meteorological effects (Jacob and Winner, 2009; Allen et al., 2016; Shen et al., 2017). 75
However, any such climate change impacts on PM2.5 are considered to be smaller than the effect from implementing emission
mitigation measures (Westervelt et al., 2016).
Experiments conducted as part of the 5th Coupled Model Intercomparison Project (CMIP5; Taylor et al., 2012) and the
Atmospheric Chemistry and Climate Model Intercomparison Project (ACCMIP, Lamarque et al., 2013) contributed to a multi-
model assessment of future trends in air pollutants. Global annual mean surface O3 concentrations were predicted to increase 80
by up to 5 ppb in 2100 using RCP8.5 (Representative Concentration Pathway with an anthropogenic radiative forcing of 8.5
W m-2 in 2100); the RCP with largest increases in methane (CH4) abundances and the largest climate change signal used in
CMIP5 (Kirtman et al., 2013). The other RCPs used in CMIP5 had a lower climate forcing and smaller changes in CH4
abundance with models predicting global annual mean surface O3 concentrations that showed little change in the short term
(up to 2050) but decreased by around 5 ppb in 2100. The scenario differences in the global mean response for surface O3 were 85
generally reflected across other regions, although with a larger magnitude of change over the northern hemisphere continental
3
regions. The predicted range of future surface O3 concentrations was previously found to be dominated by changes in precursor
emissions (Fiore et al., 2012). However, in regions remote from pollution sources (low-NOx) future climate change was shown
to result in a small reduction in surface O3 concentrations. For PM2.5, results from CMIP5 and ACCMIP models showed annual
mean concentrations declining in most regions and across all scenarios due to the reduction in aerosol emissions. Globally, 90
PM2.5 concentrations reduced by ~1 µg m-3 by 2100, whereas larger regional reductions of up to 6 µg m-3 were predicted by
2100. Exceptions to this occurred over South and East Asia where PM2.5 concentrations increased by up to 3 µg m-3 in the
near-term (up to 2050), after which concentrations reduced by 2100. The largest difference in the response of PM2.5 across the
scenarios was also shown across East and South Asia due to differences in the carbonaceous and sulphur dioxide (SO2)
emission trajectories (Fiore et al., 2012). Future PM2.5 concentrations over Africa and the Middle East were shown to be quite 95
noisy due to the large meteorological variability that influences dust emissions over these regions.
The current set of experiments conducted for the 6th Coupled Model Intercomparison Project (CMIP6; Eyring et al., 2016)
represent an opportunity to update the assessment of current and future levels of air pollutants using the latest generation of
Earth system and climate models. A new set of future scenarios have been generated for CMIP6, the Shared Socio-economic
Pathways (SSPs), which combine different trends in social, economic and environmental developments (O’Neill et al., 2014). 100
Varying amounts of emission mitigation to SLCFs are applied on top of the baseline social and economic developments to
meet predefined climate and air quality targets in the future, allowing for a wider range of future air pollutant trajectories to
be assessed than occurred in CMIP5 (Rao et al., 2017; Riahi et al., 2017). Initial assessments have been made of future changes
to air pollutants in the SSPs using simplified models (Reis et al., 2018; Turnock et al., 2018, 2019). The sustainability pathway
(SSP1) leads to improvements in both air quality and climate, whereas SSP3 (regional rivalry) is not compatible with achieving 105
air quality and climate goals, and the conventional fuels (SSP5) pathway improves air quality at the expense of climate (Reis
et al., 2018). Strong climate and air pollutant mitigation measures in SSP1 were shown to reduce global annual mean surface
O3 concentrations by more than 3.5 ppb, whereas for SSP3 O3 concentrations over Asia were predicted to increase by 6 ppb
(Turnock et al., 2019). These studies highlighted the potential large regional variability in the response of air pollutants to the
different assumptions in the future pathways and also the need for a full model assessment using the current generation of 110
Earth System Models (ESMs) that take into account both changes in emissions and climate.
In this study, we use results from experiments conducted as part of CMIP6 to make a first assessment of historical and future
changes in air pollutants. First, we assess the performance of CMIP6 models in simulating present day air pollutants by
conducting an evaluation against observations of O3 and PM2.5. Regional changes in surface O3 and PM2.5 are computed over
the historical period (1850-2014) to provide context with future changes. We are then able to show future projections of air 115
pollutants over different world regions under different Shared Socio-economic Pathways used in the CMIP6 experiments.
Finally, a comparison is made of individual CMIP6 models for a single future scenario (ssp370) to identify potential reasons
for model discrepancies.
2 Methods
2.1 Air Pollutant Emissions 120
A new set of historical and future anthropogenic air pollutant emissions has been developed and used as part of CMIP6. The
historical anthropogenic emissions are from the Community Emissions Data System (CEDS) and a new dataset was developed
for biomass burning emissions, both of which provides information on emissions from 1750 to 2014 (van Marle et al., 2017;
Hoesly et al., 2018). The SSPs used in future CMIP6 experiments represent an update from the RCPs used in CMIP5, as they
combine pathways of socio-economic development with targets to achieve a certain level of climate mitigation (O’Neill et al., 125
2014; van Vuuren et al., 2014; Riahi et al., 2017). The SSPs are divided into the following 5 different pathways depending on
their social, economic and environmental development: SSP1 – sustainability, SSP2 - middle-of-the-road, SSP3 – regional

4
rivalry, SSP4 - inequality, SSP5 – fossil fuel development. An assumption about the degree of air pollution control (strong,
medium or weak) is included on top of the baseline pathway, with stricter air pollution controls assumed to be tied to economic
development (Rao et al., 2016). Weak air pollution controls occur in SSP3 and SSP4, with medium controls in SSP2 and strong 130
air pollution controls in SSP1 and SSP5 (Gidden et al., 2019). A particular climate mitigation target, in terms of an
anthropogenic radiative forcing by 2100, and the range of emission mitigation measures associated with achieving it are
included in addition to the existing policy measures within each baseline SSP scenario. Climate mitigation targets vary from a
weak mitigation scenario with an anthropogenic radiative forcing of 8.5 W m-2 by 2100, comparable with a 5 °C temperature
change (Riahi et al., 2017), to a strong mitigation scenario with a radiative forcing of 1.9 W m-2 by 2100, in accordance with 135
the Paris agreement for keeping temperatures below 2 °C (United Nations, 2016). Some climate mitigation targets are
comparable with those of the RCPs used in CMIP5 (2.6, 4.5 and 6.0), whilst others are new, e.g. ssp534-over is included as a
delayed mitigation scenario. A scenario specific to the Aerosol and Chemistry Model Intercomparison Project (AerChemMIP),
ssp370-lowNTCF, is also included to study the impact of mitigation measures to specifically control SLCFs on top of ssp370.
Future biomass burning emissions vary in each scenario, depending on the particular land-use assumptions (Rao et al., 2017). 140
Whilst future anthropogenic and biomass burning emissions are prescribed in each CMIP6 model from the same dataset, other
natural emissions, e.g. dust, biogenic volatile organic compounds (BVOCs) etc., will be different and depend on the individual
model configuration.
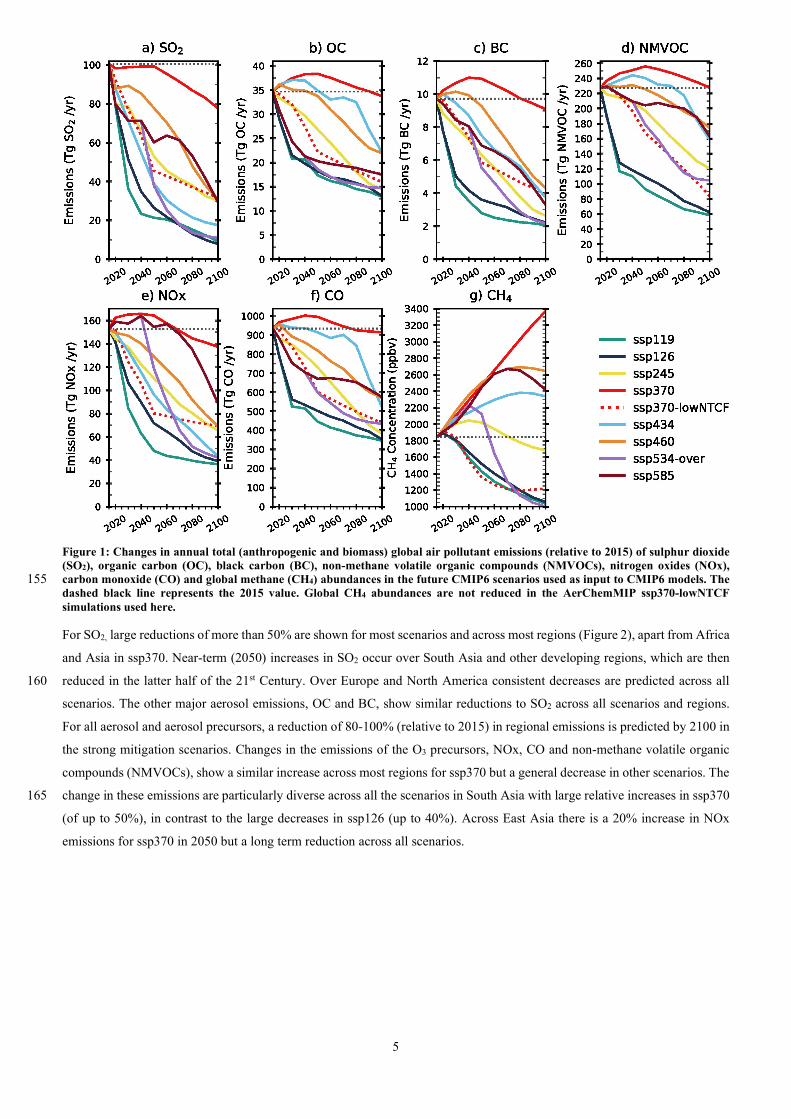
Figure 1 shows the future changes in global total (anthropogenic and biomass) emissions of the major air pollutant precursors
across all of the CMIP6 scenarios, provided as input to the CMIP6 models. The overlying feature is that global air pollutant 145
emissions are predicted to reduce across the majority of scenarios by 2100. The exception to this is that global and regional
emissions increase or remain at present day levels for ssp370 (Figs. 1 and 2). Some air pollutant emissions increase in the near-
term in other scenarios e.g. nitrogen oxides (NOx) in ssp585 (by up to 15%), but by 2100 these have been reduced. Future CH4
abundances show the largest diversity amongst the SSPs. Large increases in global CH4 abundances of more than 50% are
predicted for the fossil fuel dominated pathways of ssp370 and ssp585, whereas large reductions of ~50% are predicted to 150
occur in the strong mitigation scenarios of SSP1.
5
Figure 1: Changes in annual total (anthropogenic and biomass) global air pollutant emissions (relative to 2015) of sulphur dioxide (SO2), organic carbon (OC), black carbon (BC), non-methane volatile organic compounds (NMVOCs), nitrogen oxides (NOx), carbon monoxide (CO) and global methane (CH4) abundances in the future CMIP6 scenarios used as input to CMIP6 models. The 155 dashed black line represents the 2015 value. Global CH4 abundances are not reduced in the AerChemMIP ssp370-lowNTCF simulations used here.
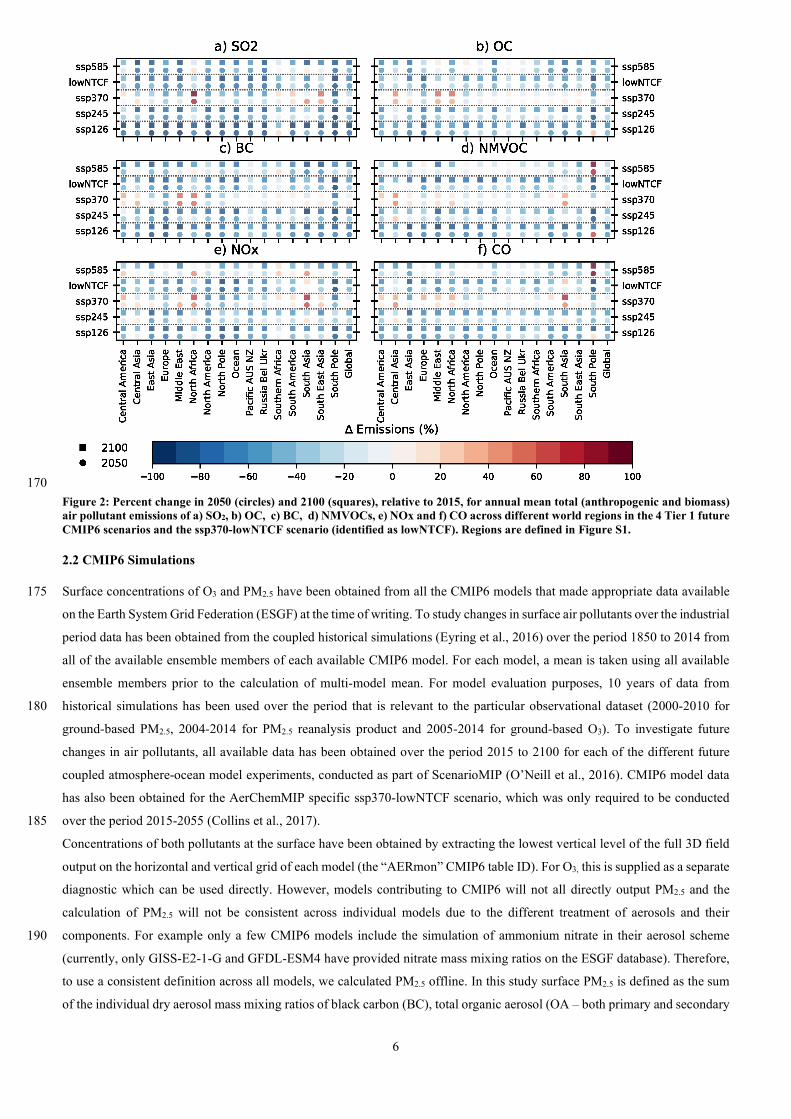
For SO2, large reductions of more than 50% are shown for most scenarios and across most regions (Figure 2), apart from Africa
and Asia in ssp370. Near-term (2050) increases in SO2 occur over South Asia and other developing regions, which are then
reduced in the latter half of the 21st Century. Over Europe and North America consistent decreases are predicted across all 160
scenarios. The other major aerosol emissions, OC and BC, show similar reductions to SO2 across all scenarios and regions.
For all aerosol and aerosol precursors, a reduction of 80-100% (relative to 2015) in regional emissions is predicted by 2100 in
the strong mitigation scenarios. Changes in the emissions of the O3 precursors, NOx, CO and non-methane volatile organic
compounds (NMVOCs), show a similar increase across most regions for ssp370 but a general decrease in other scenarios. The
change in these emissions are particularly diverse across all the scenarios in South Asia with large relative increases in ssp370 165
(of up to 50%), in contrast to the large decreases in ssp126 (up to 40%). Across East Asia there is a 20% increase in NOx
emissions for ssp370 in 2050 but a long term reduction across all scenarios.
6
170
Figure 2: Percent change in 2050 (circles) and 2100 (squares), relative to 2015, for annual mean total (anthropogenic and biomass) air pollutant emissions of a) SO2, b) OC, c) BC, d) NMVOCs, e) NOx and f) CO across different world regions in the 4 Tier 1 future CMIP6 scenarios and the ssp370-lowNTCF scenario (identified as lowNTCF). Regions are defined in Figure S1.
2.2 CMIP6 Simulations
Surface concentrations of O3 and PM2.5 have been obtained from all the CMIP6 models that made appropriate data available 175
on the Earth System Grid Federation (ESGF) at the time of writing. To study changes in surface air pollutants over the industrial
period data has been obtained from the coupled historical simulations (Eyring et al., 2016) over the period 1850 to 2014 from
all of the available ensemble members of each available CMIP6 model. For each model, a mean is taken using all available
ensemble members prior to the calculation of multi-model mean. For model evaluation purposes, 10 years of data from
historical simulations has been used over the period that is relevant to the particular observational dataset (2000-2010 for 180
ground-based PM2.5, 2004-2014 for PM2.5 reanalysis product and 2005-2014 for ground-based O3). To investigate future
changes in air pollutants, all available data has been obtained over the period 2015 to 2100 for each of the different future
coupled atmosphere-ocean model experiments, conducted as part of ScenarioMIP (O’Neill et al., 2016). CMIP6 model data
has also been obtained for the AerChemMIP specific ssp370-lowNTCF scenario, which was only required to be conducted
over the period 2015-2055 (Collins et al., 2017). 185
Concentrations of both pollutants at the surface have been obtained by extracting the lowest vertical level of the full 3D field
output on the horizontal and vertical grid of each model (the “AERmon” CMIP6 table ID). For O3, this is supplied as a separate
diagnostic which can be used directly. However, models contributing to CMIP6 will not all directly output PM2.5 and the
calculation of PM2.5 will not be consistent across individual models due to the different treatment of aerosols and their
components. For example only a few CMIP6 models include the simulation of ammonium nitrate in their aerosol scheme 190
(currently, only GISS-E2-1-G and GFDL-ESM4 have provided nitrate mass mixing ratios on the ESGF database). Therefore,
to use a consistent definition across all models, we calculated PM2.5 offline. In this study surface PM2.5 is defined as the sum
of the individual dry aerosol mass mixing ratios of black carbon (BC), total organic aerosol (OA – both primary and secondary
7
sources), sulphate (SO4), sea salt (SS) and dust (DU) from the lowest model level extracted from the full 3D model fields. All
BC, OA and SO4 aerosol mass is assumed to be present in the fine size fraction (< 2.5 µm), whereas a factor of 0.25 for SS 195
and 0.1 for DU has been used to calculate the approximate contribution from these components to the fine aerosol size fraction
(Eq. 1).
𝑃𝑀 . = 𝐵𝐶 + 𝑂𝐴 + 𝑆𝑂 + (0.25 × 𝑆𝑆) + (0.1 × 𝐷𝑈) (1)
200
The factors used to calculate the contribution of SS and DU concentrations to the PM2.5 size fraction are likely to depend on
the individual aerosol scheme and the simulated aerosol size distribution within a particular model. The calculation of an
approximate PM2.5 concentration using Eq. (1) is therefore likely to introduce some errors but it does provide an estimate that
is consistent across models and also with that previously used in CMIP5 and ACCMIP (Fiore et al., 2012; Silva et al., 2013,
2017). For the CNRM-ESM2-1 model, anomalously large concentrations were obtained from the sea salt mass mixing ratios. 205
Sensitivity tests with this model suggested that a much smaller factor of 0.01 was more appropriate to use for SS, which takes
into account the non-dry nature of the sea salt aerosols and the large possible size range, up to 20 µm in diameter, of sea salt
particles within the CNRM-ESM2-1 model (P Nabat 2019, personal communication, 27th November).
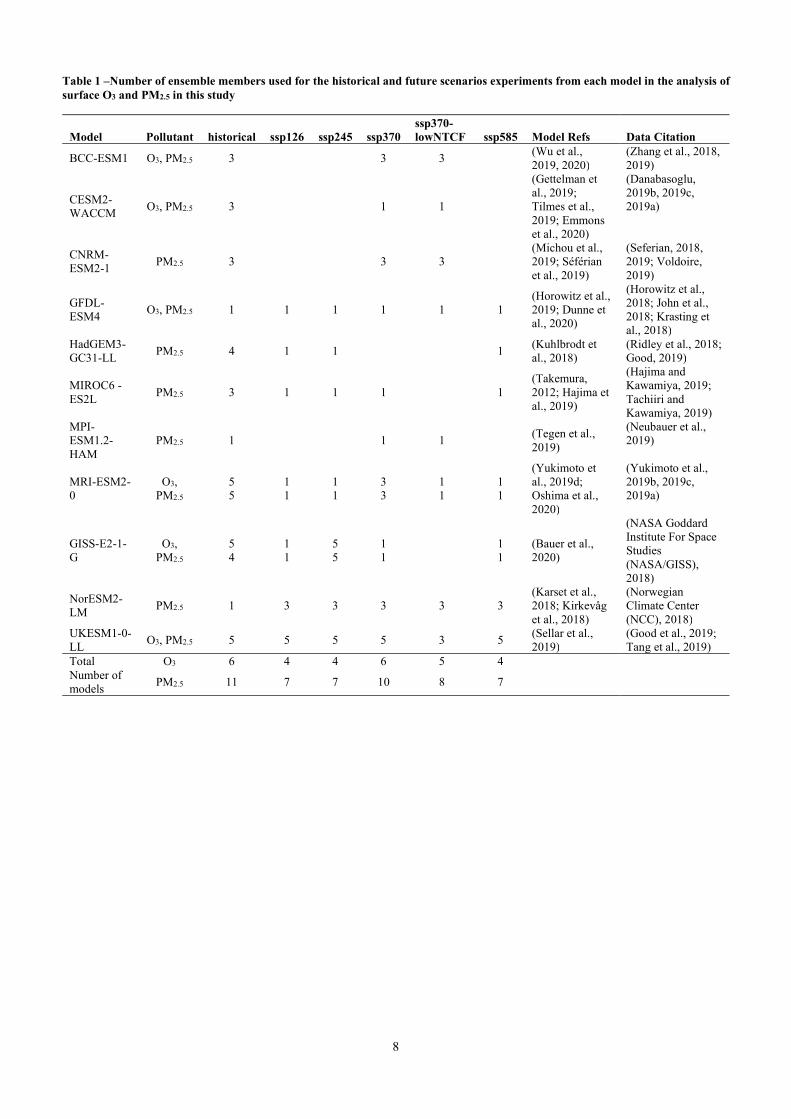
Details of the data used in this study from different CMIP6 models, in both the historical and future scenarios, is presented
below in Table 1. For the historical period, data was available from 5 different CMIP6 models for O3 and 10 models for PM2.5. 210
The future scenario with the most data available was ssp370, with 4 models suppling data for O3 and 7 models for PM2.5. For
the other Tier 1 CMIP6 scenarios (ssp126, ssp245 and ssp585), data was only available for 2 models for O3 and 4 for PM2.5
(all components). It was decided to focus the analysis on ssp370 and other Tier 1 scenarios due to the limited availability of
model data for Tier 2 scenarios (ssp119, ssp434, ssp460 and ssp534-over). The results from an O3 parameterisation (Turnock
et al., 2018, 2019), referred to in this study as HTAP_param, have also been included in the analysis of surface O3 from CMIP6 215
models for both the historical and future scenarios. The HTAP_param was previously developed based upon the source-
receptor relationships of O3 derived from perturbation experiments of regional precursor emissions and global CH4 abundances
(Wild et al., 2012; Turnock et al., 2018). The HTAP_param applies the fractional change in global CH4 abundance and regional
emission precursors (NOx, CO and NMVOCs) for a particular scenario to the ozone response from each individual model used
in the parameterisation. The total O3 response is obtained by summing up the response from each of the individual models to 220
all precursor changes across all source regions. The surface O3 response previously calculated from the HTAP_param in both
the historical and future CMIP6 scenarios is compared to that from the CMIP6 models (Turnock et al., 2019). The O3
parameterisation does not take into account the effects of climate change on surface O3 concentrations and therefore provides
an estimate of the emission-only driven changes to surface O3, which we compare to the climate and Earth System models.
225
8
Table 1 –Number of ensemble members used for the historical and future scenarios experiments from each model in the analysis of surface O3 and PM2.5 in this study
Model Pollutant historical ssp126 ssp245 ssp370 ssp370-lowNTCF ssp585 Model Refs Data Citation
BCC-ESM1 O3, PM2.5 3 3 3 (Wu et al., 2019, 2020)
(Zhang et al., 2018, 2019)
CESM2-WACCM
O3, PM2.5 3 1 1
(Gettelman et al., 2019; Tilmes et al., 2019; Emmons et al., 2020)
(Danabasoglu, 2019b, 2019c, 2019a)
CNRM-ESM2-1
PM2.5 3 3 3 (Michou et al., 2019; Séférian et al., 2019)
(Seferian, 2018, 2019; Voldoire, 2019)
GFDL-ESM4
O3, PM2.5 1 1 1 1 1 1 (Horowitz et al., 2019; Dunne et al., 2020)
(Horowitz et al., 2018; John et al., 2018; Krasting et al., 2018)
HadGEM3-GC31-LL
PM2.5 4 1 1 1 (Kuhlbrodt et al., 2018)
(Ridley et al., 2018; Good, 2019)
MIROC6 -ES2L
PM2.5 3 1 1 1 1 (Takemura, 2012; Hajima et al., 2019)
(Hajima and Kawamiya, 2019; Tachiiri and Kawamiya, 2019)
MPI-ESM1.2-HAM
PM2.5 1 1 1 (Tegen et al., 2019)
(Neubauer et al., 2019)
MRI-ESM2-0
O3, PM2.5
5 5
1 1
1 1
3 3
1 1
1 1
(Yukimoto et al., 2019d; Oshima et al., 2020)
(Yukimoto et al., 2019b, 2019c, 2019a)
GISS-E2-1-G
O3, PM2.5
5 4
1 1
5 5
1 1
1 1
(Bauer et al., 2020)
(NASA Goddard Institute For Space Studies (NASA/GISS), 2018)
NorESM2-LM
PM2.5 1 3 3 3 3 3 (Karset et al., 2018; Kirkevåg et al., 2018)
(Norwegian Climate Center (NCC), 2018)
UKESM1-0-LL
O3, PM2.5 5 5 5 5 3 5 (Sellar et al., 2019)
(Good et al., 2019; Tang et al., 2019)
Total Number of models
O3 6 4 4 6 5 4
PM2.5 11 7 7 10 8 7
9
2.3 Surface Observations 230
Present day surface O3 and PM2.5 simulated by all of the CMIP6 models is evaluated against surface observations to ascertain
model biases and inter-model discrepancies. Surface O3 observations are obtained from the database of the Tropospheric Ozone
Assessment Report (TOAR) (Schultz et al., 2017). The TOAR database provides a gridded product of surface O3 observations
over the period 1970 to 2015. The majority of measurement sites are located in North America and Europe, with a smaller
number of other sites in East Asia, Australia, New Zealand, South America, Southern Africa, Antarctica and remote ocean 235
locations. Here we compile a monthly mean climatology of all available O3 observations over the period 2005-2014 from
measurement locations that are classified as rural in the TOAR database (Schultz et al., 2017). The rural locations were selected
to be representative of background (i.e. non-urban) O3 concentrations and are considered to be more appropriate in evaluating
the simulated values obtained at the relatively coarse horizontal resolution of the global ESMs. Simulated surface O3
concentrations from the CMIP6 models are re-gridded onto the same resolution of the observational product (2° x 2°) for 240
evaluation purposes.
Surface PM2.5 observations have been obtained from all of the locations compiled in the database of the Global Aerosol
Synthesis and Science Project (GASSP: http://gassp.org.uk/data/, Reddington et al., 2017) to evaluate CMIP6 models.
Background, non-urban, PM2.5 data is compiled in the GASSP database from three major networks: the Interagency Monitoring
of Protected Visual Environments (IMPROVE) network in North America, the European Monitoring and Evaluation 245
Programme (EMEP) and Asia-Pacific Aerosol Database (A-PAD). Again, like for O3, the networks/observations for PM2.5
were selected to be representative of non-urban environments, which are more appropriate for the evaluation of global ESMs.
With the exception of the IMPROVE network, most measurements of PM2.5 began after the year 2000. Like for O3, we compile
a monthly mean climatology of PM2.5 but now over the period of 2000 to 2010, selected as the GASSP database contained the
most observations within this period. Simulated surface PM2.5 was computed from CMIP6 models over the same time period 250
as the observations and linearly interpolated to each measurement location. Whilst the surface observations measure total PM2.5
mass, the computed PM2.5 from CMIP6 models use Eq. 1 and does not include all observable PM2.5 aerosol components (e.g.
nitrate aerosol). Therefore, it is anticipated that the CMIP6 models will underrepresent the PM2.5 observations in this
comparison.
To address the anticipated disparity between the observed ground based PM2.5 and the approximate PM2.5 from CMIP6 models, 255
a further comparison has been made between the CMIP6 models and the Modern-Era Retrospective Analysis for Research and
Applications, version 2 (MERRA-2), aerosol reanalysis product (Buchard et al., 2017; Randles et al., 2017). The MERRA-2
aerosol product assimilates observations of Aerosol Optical Depth (AOD) from ground based and satellite remote sensing
platforms into model simulations that use the GEOS-5 atmospheric model coupled to the GOCART aerosol module. The data
assimilation used in MERRA-2 generally improves comparisons of PM2.5 with observations but there are still overestimations 260
due to dust and sea salt and underestimations over East Asia (Buchard et al., 2017; Provençal et al., 2017). Separate mass
mixing ratios for BC, OA, SO4, SS and DU aerosol components are provided from MERRA-2, which are then combined using
the formula in Eq. 1 to make an approximate PM2.5. Monthly mean approximate PM2.5 concentrations are then computed over
the period 2005-2014 from the MERRA-2 reanalysis product to provide a more direct comparison and enhanced spatial
coverage against the approximate PM2.5 concentrations calculated from the CMIP6 models calculated over the same time 265
period.
10
3 Present-day Model Evaluation of Air Pollutants
3.1 Surface Ozone
The 6 CMIP6 models with data available for the historical experiments are evaluated against surface O3 observations from the
TOAR database over the period 2005-2014. A long-term evaluation of surface O3 concentrations from CMIP6 models using 270
observations compiled over the 20th Century is presented separately in Griffiths et al., (2020). Figure 3 shows the annual and
seasonal multi-model mean in surface O3 over the period 2005-2014 and the standard deviation across the 6 CMIP6 models.
The annual and seasonal mean surface O3 concentrations and evaluation against observations for individual CMIP6 models
are shown in Figures S2–S7. Higher surface O3 concentrations are simulated in the northern hemisphere summer (June, July,
August- JJA) when O3 formation is enhanced by increased photolytic activity and levels of oxidants, as well as larger biogenic 275
emissions. The hemispheric difference in surface O3 is smaller in December, January and February (DJF) when O3 production
is less in the northern hemisphere but higher in the southern hemisphere. However, model diversity is larger in DJF (Fig. 3b)
due to individual models simulating different seasonal cycles of O3, particularly UKESM1-0-LL which has the most
pronounced seasonal cycle of all 6 models (Fig. S2).
The multi-model mean of CMIP6 models overestimates surface O3 concentrations by up to 16 ppb annually and in both seasons 280
when compared to observations from the TOAR database, although they do capture the broad hemispheric gradient in O3
concentrations (Fig. 3c, 3f and 3i). The model observational comparison of CMIP6 models to the TOAR observations are
consistent across all models and with the previous evaluation of ACCMIP models (Young et al., 2018). This indicates a
common source of error within models for example uncertainties in emission inventories, deposition processes or vertical
mixing (Wild et al., 2020). In addition, the coarse resolution of the ESMs could lead to an overproduction of O3 across polluted 285
regions, with finer resolutions exhibiting improvements in the simulation of surface O3 (Wild and Prather, 2006; Neal et al.,
2017). Smaller model biases exist in DJF (<5 ppb) than in JJA (5-15 ppb), mostly attributed to the strong seasonal cycle
simulated by UKESM1-0-LL. In contrast to other models (Fig. S2 – S7), UKESM1-0-LL underpredicts surface O3 in DJF over
most continental northern hemisphere locations, potentially indicating there is excessive NOx titration of O3 in this model,
which is also shown by the large sensitivity of O3 formation to NOx concentrations over the historical period (Fig. S17). 290

11
Figure 3 – Multi-model (6 CMIP6 models) annual and seasonal mean surface O3 concentrations in a) Annual mean, d) December January, February (DJF) and g) June, July, August (JJA) over the 2005-2014 period. The standard deviation in the multi-model mean in b) Annual mean, e) DJF and h) JJA. The difference between the multi-model mean and TOAR observations in c) Annual 295 mean, f) DJF and i) JJA (colour bar saturates).
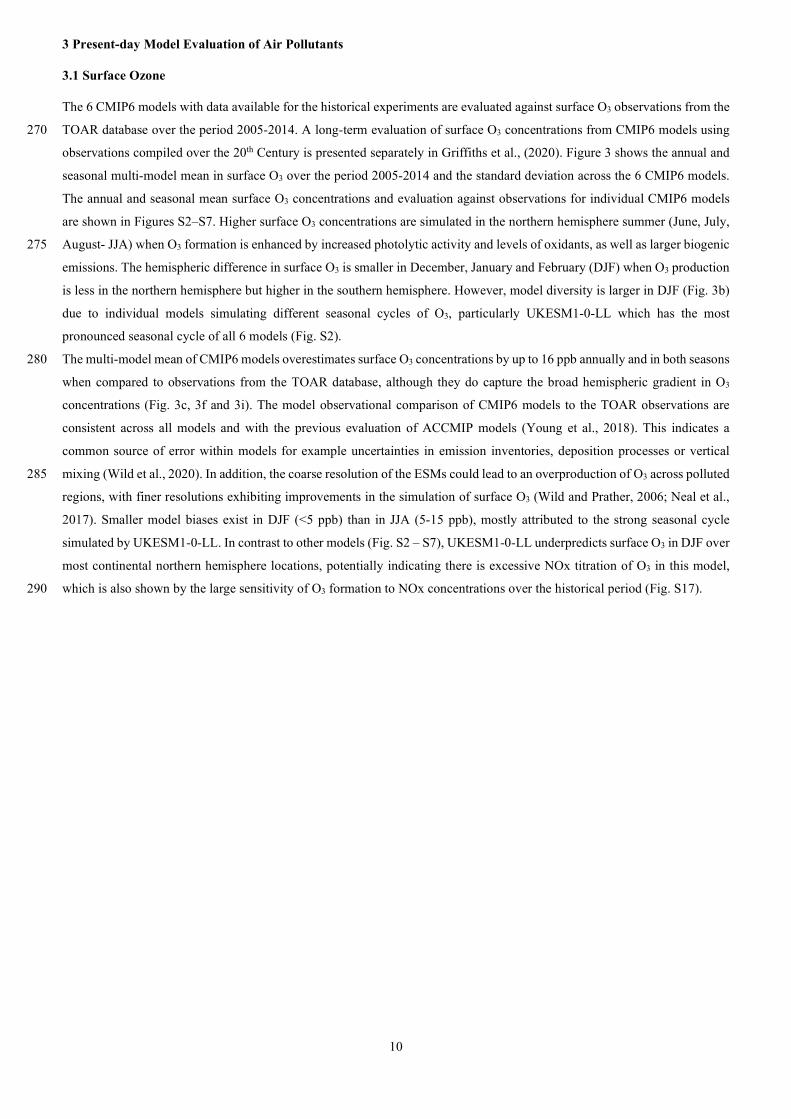
The observed annual cycle in surface O3 averaged across measurement locations within different regions is compared to that
simulated by CMIP6 models (Figure 4). Across most regions, the mean annual cycle from CMIP6 models compares relatively
well to that observed. The overprediction of surface O3 values in JJA is evident across most regions, as is the large
concentrations in BCC-ESM1 and GISS-E2-1-G and the strong seasonal cycle in UKESM1-0-LL across northern hemisphere 300
continental regions. Additionally, the timing of peak O3 over continental northern hemisphere locations occurs earlier in the
observations (springtime) than in the CMIP6 models (spring and summer), which is consistent with that from ACCMIP models
(Young et al., 2018). At oceanic observation locations, surface O3 is overestimated in CMIP6 models by up to 20 ppb across
all seasons, indicating that O3 deposition rate could be underestimated here (Clifton et al., 2020). There is also a large
overestimation (~20 ppb) in all models at the one observation location in South East Asia, potentially due to difficulty in 305
simulating O3 in the maritime continental boundary layer using lower resolution global ESMs. In contrast to this, CMIP6
models, particularly UKESM1-0-LL and GISS-E2-1-G, tend to underpredict the observed surface O3 concentrations at
locations in the South Pole region in JJA by ~5 ppb. This could be due to lack of long range transport of O3 to these sites,
inaccuracies in southern hemisphere precursor emissions, or because of the difficulty in simulating O3 concentrations at the
appropriate elevation of measurement sites located on the Antarctic ice sheet. 310
12
Figure 4 – Individual and multi-model (6 CMIP6 models and HTAP_param) monthly mean surface O3 concentrations across different world regions compared with the regional monthly values from all the TOAR observations within the region for the period 2005-2014. The number of observations within a region is shown in parenthesis. The shading shows variability in observations across 315 all sites within the region.
3.2 Surface PM2.5
3.2.1 Ground Based Observations
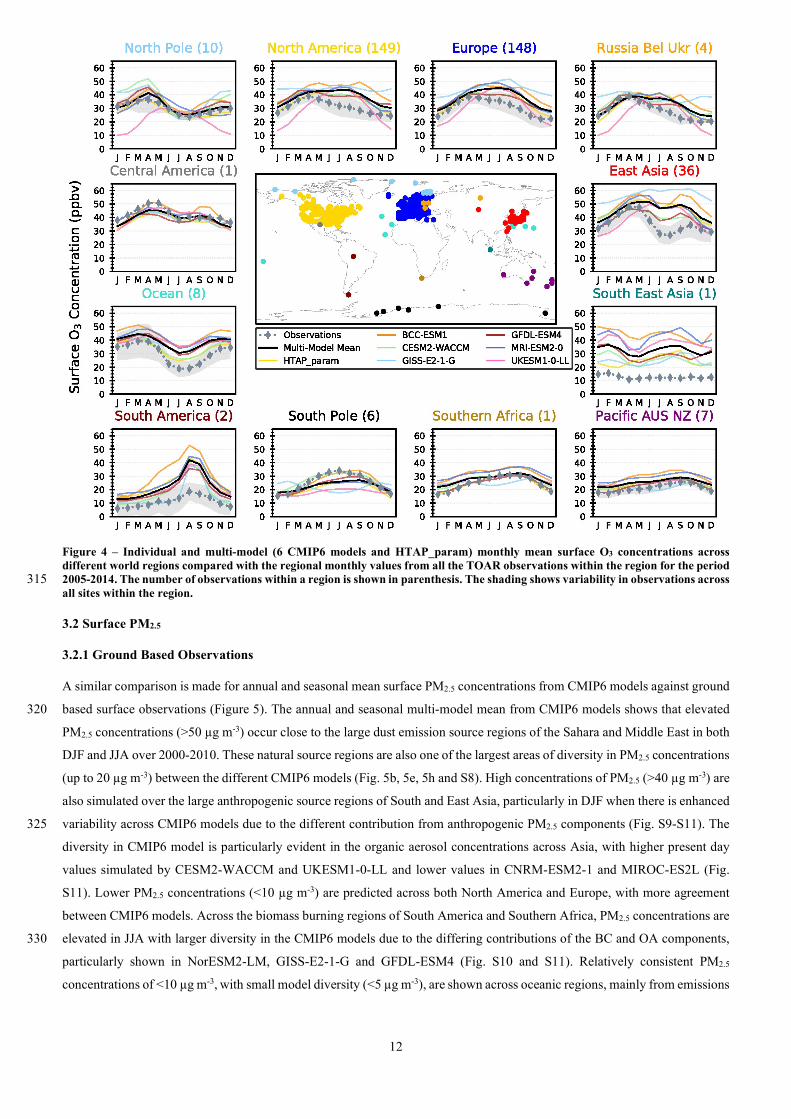
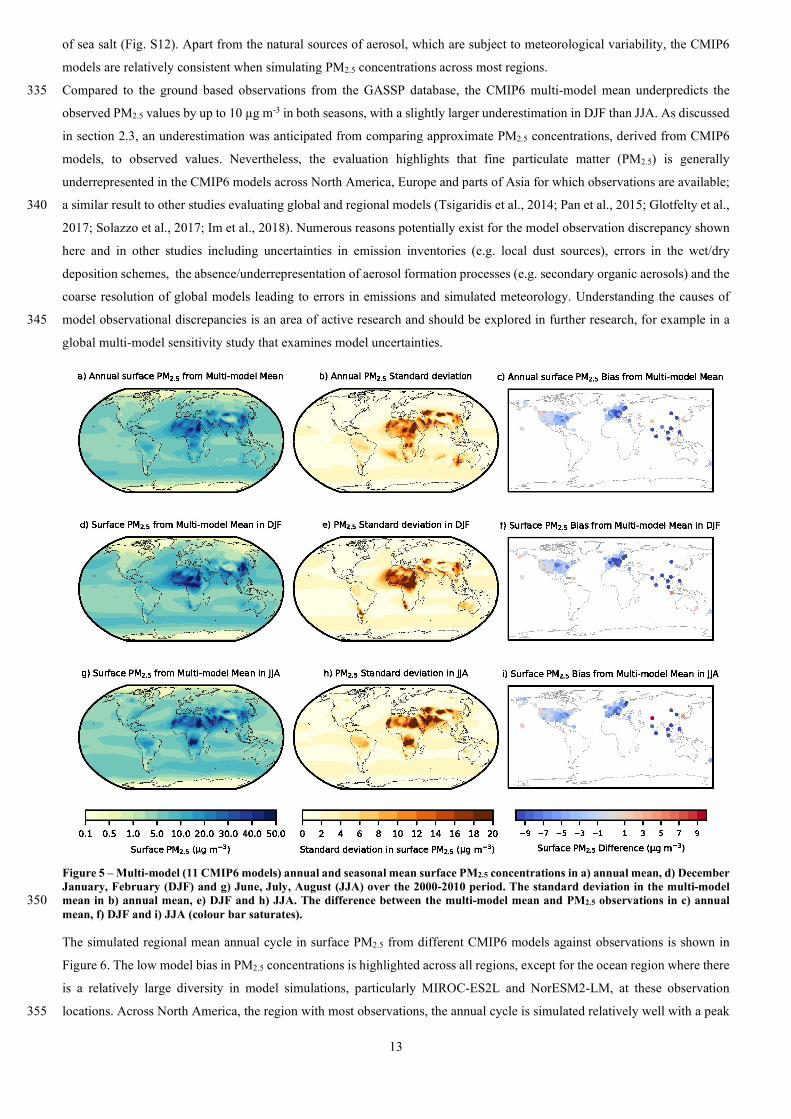
A similar comparison is made for annual and seasonal mean surface PM2.5 concentrations from CMIP6 models against ground
based surface observations (Figure 5). The annual and seasonal multi-model mean from CMIP6 models shows that elevated 320
PM2.5 concentrations (>50 µg m-3) occur close to the large dust emission source regions of the Sahara and Middle East in both
DJF and JJA over 2000-2010. These natural source regions are also one of the largest areas of diversity in PM2.5 concentrations
(up to 20 µg m-3) between the different CMIP6 models (Fig. 5b, 5e, 5h and S8). High concentrations of PM2.5 (>40 µg m-3) are
also simulated over the large anthropogenic source regions of South and East Asia, particularly in DJF when there is enhanced
variability across CMIP6 models due to the different contribution from anthropogenic PM2.5 components (Fig. S9-S11). The 325
diversity in CMIP6 model is particularly evident in the organic aerosol concentrations across Asia, with higher present day
values simulated by CESM2-WACCM and UKESM1-0-LL and lower values in CNRM-ESM2-1 and MIROC-ES2L (Fig.
S11). Lower PM2.5 concentrations (<10 µg m-3) are predicted across both North America and Europe, with more agreement
between CMIP6 models. Across the biomass burning regions of South America and Southern Africa, PM2.5 concentrations are
elevated in JJA with larger diversity in the CMIP6 models due to the differing contributions of the BC and OA components, 330
particularly shown in NorESM2-LM, GISS-E2-1-G and GFDL-ESM4 (Fig. S10 and S11). Relatively consistent PM2.5
concentrations of <10 µg m-3, with small model diversity (<5 µg m-3), are shown across oceanic regions, mainly from emissions
13
of sea salt (Fig. S12). Apart from the natural sources of aerosol, which are subject to meteorological variability, the CMIP6
models are relatively consistent when simulating PM2.5 concentrations across most regions.
Compared to the ground based observations from the GASSP database, the CMIP6 multi-model mean underpredicts the 335
observed PM2.5 values by up to 10 µg m-3 in both seasons, with a slightly larger underestimation in DJF than JJA. As discussed
in section 2.3, an underestimation was anticipated from comparing approximate PM2.5 concentrations, derived from CMIP6
models, to observed values. Nevertheless, the evaluation highlights that fine particulate matter (PM2.5) is generally
underrepresented in the CMIP6 models across North America, Europe and parts of Asia for which observations are available;
a similar result to other studies evaluating global and regional models (Tsigaridis et al., 2014; Pan et al., 2015; Glotfelty et al., 340
2017; Solazzo et al., 2017; Im et al., 2018). Numerous reasons potentially exist for the model observation discrepancy shown
here and in other studies including uncertainties in emission inventories (e.g. local dust sources), errors in the wet/dry
deposition schemes, the absence/underrepresentation of aerosol formation processes (e.g. secondary organic aerosols) and the
coarse resolution of global models leading to errors in emissions and simulated meteorology. Understanding the causes of
model observational discrepancies is an area of active research and should be explored in further research, for example in a 345
global multi-model sensitivity study that examines model uncertainties.
Figure 5 – Multi-model (11 CMIP6 models) annual and seasonal mean surface PM2.5 concentrations in a) annual mean, d) December January, February (DJF) and g) June, July, August (JJA) over the 2000-2010 period. The standard deviation in the multi-model mean in b) annual mean, e) DJF and h) JJA. The difference between the multi-model mean and PM2.5 observations in c) annual 350 mean, f) DJF and i) JJA (colour bar saturates).
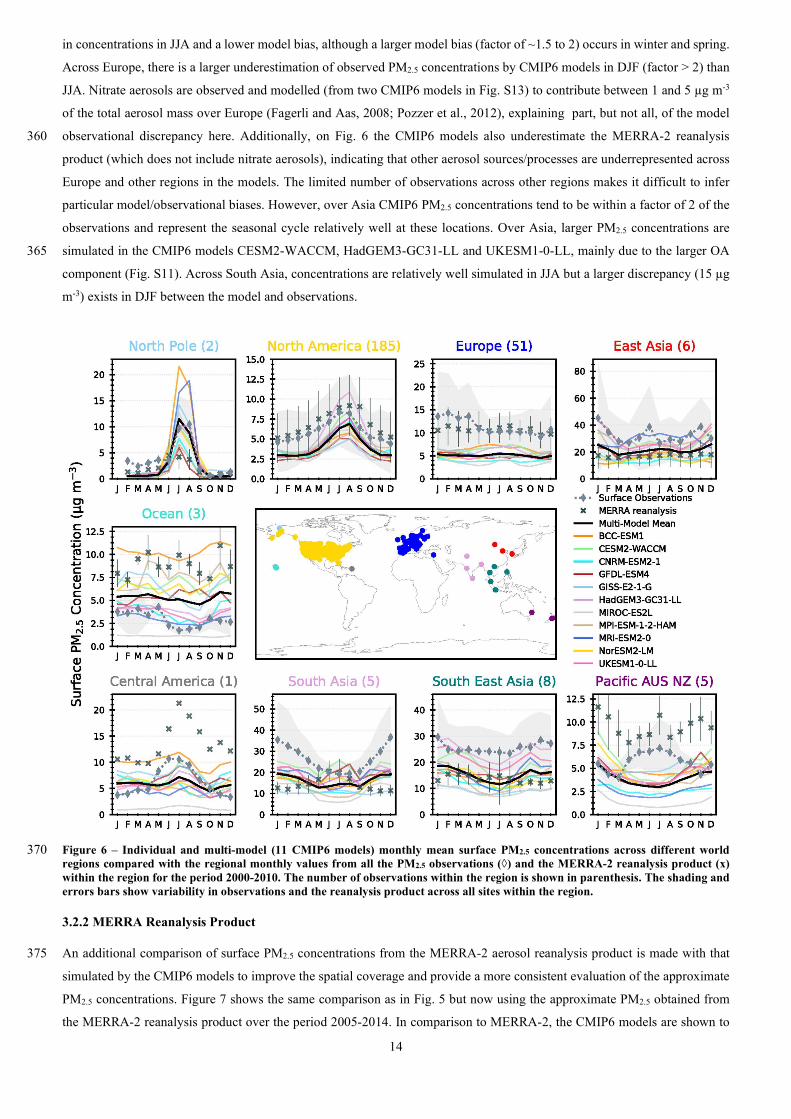
The simulated regional mean annual cycle in surface PM2.5 from different CMIP6 models against observations is shown in
Figure 6. The low model bias in PM2.5 concentrations is highlighted across all regions, except for the ocean region where there
is a relatively large diversity in model simulations, particularly MIROC-ES2L and NorESM2-LM, at these observation
locations. Across North America, the region with most observations, the annual cycle is simulated relatively well with a peak 355
14
in concentrations in JJA and a lower model bias, although a larger model bias (factor of ~1.5 to 2) occurs in winter and spring.
Across Europe, there is a larger underestimation of observed PM2.5 concentrations by CMIP6 models in DJF (factor > 2) than
JJA. Nitrate aerosols are observed and modelled (from two CMIP6 models in Fig. S13) to contribute between 1 and 5 µg m-3
of the total aerosol mass over Europe (Fagerli and Aas, 2008; Pozzer et al., 2012), explaining part, but not all, of the model
observational discrepancy here. Additionally, on Fig. 6 the CMIP6 models also underestimate the MERRA-2 reanalysis 360
product (which does not include nitrate aerosols), indicating that other aerosol sources/processes are underrepresented across
Europe and other regions in the models. The limited number of observations across other regions makes it difficult to infer
particular model/observational biases. However, over Asia CMIP6 PM2.5 concentrations tend to be within a factor of 2 of the
observations and represent the seasonal cycle relatively well at these locations. Over Asia, larger PM2.5 concentrations are
simulated in the CMIP6 models CESM2-WACCM, HadGEM3-GC31-LL and UKESM1-0-LL, mainly due to the larger OA 365
component (Fig. S11). Across South Asia, concentrations are relatively well simulated in JJA but a larger discrepancy (15 µg
m-3) exists in DJF between the model and observations.
Figure 6 – Individual and multi-model (11 CMIP6 models) monthly mean surface PM2.5 concentrations across different world 370 regions compared with the regional monthly values from all the PM2.5 observations (◊) and the MERRA-2 reanalysis product (x) within the region for the period 2000-2010. The number of observations within the region is shown in parenthesis. The shading and errors bars show variability in observations and the reanalysis product across all sites within the region.
3.2.2 MERRA Reanalysis Product
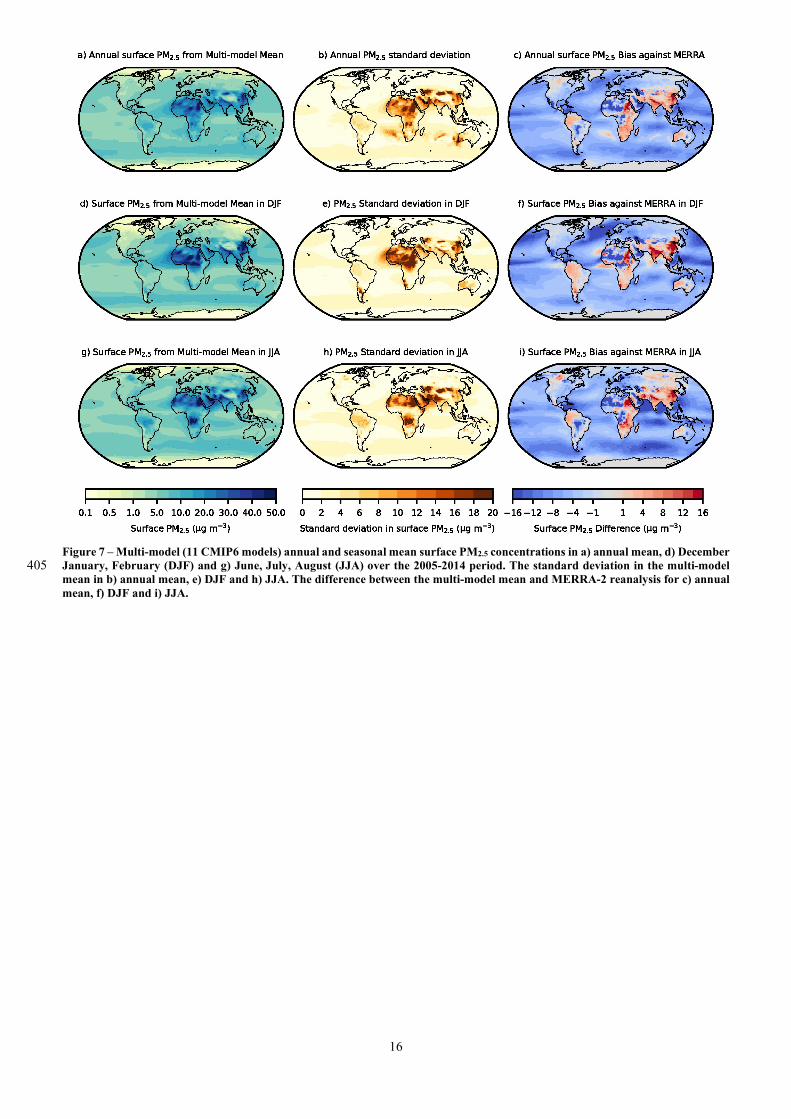
An additional comparison of surface PM2.5 concentrations from the MERRA-2 aerosol reanalysis product is made with that 375
simulated by the CMIP6 models to improve the spatial coverage and provide a more consistent evaluation of the approximate
PM2.5 concentrations. Figure 7 shows the same comparison as in Fig. 5 but now using the approximate PM2.5 obtained from
the MERRA-2 reanalysis product over the period 2005-2014. In comparison to MERRA-2, the CMIP6 models are shown to

15
underpredict PM2.5 concentrations across North America, Europe and Eurasia, but by a smaller amount than in comparison to
ground-based observations. A similar seasonal cycle comparison is shown for Europe and North America (regions with most 380
ground based observations) in both Fig. 6 and 8, providing confidence that the underestimation of PM2.5 by CMIP6 models is
robust over these regions. Across all other regions, the MERRA-2 reanalysis product provides much greater spatial coverage
for each region and therefore the features shown in the site-level comparison (Fig. 6) will not necessarily apply here. A large
overestimation of the MERRA-2 reanalysis product by the CMIP6 multi-model mean is shown across East and South Asia.
Figure 8 shows that on a regional mean basis most CMIP6 models are within the spread of the MERRA-2 concentrations for 385
East Asia, although MERRA-2 was previously shown to underestimate PM2.5 concentrations across East Asia (Buchard et al.,
2017; Provençal et al., 2017) and also on Fig. 6. CESM2-WACCM and MRI-ESM2-0 are the exceptions to this with distinctly
higher PM2.5 concentrations over East Asia, potentially due to larger OA concentrations and more dust aerosols within the
western side of this region (Fig. S8 and S11). Across the South Asian region, CMIP6 models consistently overestimate
MERRA-2 by more than 10 µg m-3 in certain months. UKESM1-0-LL, MRI-ESM2-0 and CESM2-WACCM simulate 390
particularly high monthly PM2.5 concentrations of 20-40 µg m-3 over South Asia, due to large contributions from SO4, dust and
OA. Across North Africa there is considerable variability in PM2.5 within this region, as CMIP6 models both under and over-
estimate the MERRA-2 PM2.5 concentrations, although this results in a relatively good regional mean representation (Fig. 7
and 8). The annual mean cycle in MERRA-2 PM2.5 concentrations across South America is well represented by the CMIP6
models, although the peak in the biomass burning season is underestimated by 5-10 µg m-3 in some models. A more pronounced 395
annual cycle is exhibited by UKESM1-0-LL across Southern Africa, due to the larger contributions from the OA fraction (Fig.
S11), potentially from enhanced biogenic emissions that result in secondary OA formation (SOA). Across oceanic locations
all of the CMIP6 models underestimate the MERRA-2 PM2.5 concentrations by 5 µg m-3, although MERRA-2 was previously
shown to overestimate sea-salt concentrations (Buchard et al., 2017; Provençal et al., 2017), accounting for some of this
discrepancy. Overall, comparisons of CMIP6 models with the MERRA-2 reanalysis product show biases across Europe and 400
North America that are consistent with the comparison to ground-based observations. Additionally, similar comparisons are
shown in annual mean cycles across other regions, for which appropriate ground based data is lacking.
16
Figure 7 – Multi-model (11 CMIP6 models) annual and seasonal mean surface PM2.5 concentrations in a) annual mean, d) December January, February (DJF) and g) June, July, August (JJA) over the 2005-2014 period. The standard deviation in the multi-model 405 mean in b) annual mean, e) DJF and h) JJA. The difference between the multi-model mean and MERRA-2 reanalysis for c) annual mean, f) DJF and i) JJA.

17
Figure 8 – Individual and multi-model (11 CMIP6 models) monthly mean surface PM2.5 concentrations across different world regions compared with the regional monthly values from the PM2.5 MERRA-2 reanalysis within the region for the period 2005-2014. 410 The number of reanalysis points within the region is shown in parenthesis. The shading shows variability in the values of the MERRA-2 reanalysis products across the region.
4 Air Pollutants from Pre-Industrial to Present-day
4.1 Surface Ozone
The simulated changes in surface O3 across 6 CMIP6 models and the HTAP_param are shown in Figure 9 and S14-S15 over 415
the historical period of 1850 to 2014. The CMIP6 multi-model mean shows that global annual mean surface O3 has increased
by 11.7 +/- 2.3 ppb since 1850 (+/- 1 standard deviation), although the change could be as large as 14 ppb (from BCC-ESM1)
or as little as 7 ppb (from UKESM1-0-LL). Globally and over most regions there has been a larger historical increase in surface
O3 in JJA than in DJF (Figure S16). The 1850 to 2000 multi-model annual mean change in surface O3 from the CMIP6 models
of 10.6 ppb is in good agreement with the 10 +/- 1.6 ppb simulated by the CMIP5 models used in ACCMIP (Young et al., 420
2013). An evaluation of the long-term changes in surface O3 over the historical period simulated by the CMIP6 models at
specific measurement locations is presented separately in the tropospheric O3 CMIP6 companion paper of Griffiths et al.,
(2020). This shows that CMIP6 models can reasonably represent long term changes in surface ozone since the 1960s, providing
a degree of confidence in the future projections of changes in the CMIP6 scenarios. However, long term changes in simulated
surface O3 from the previous generation of global coupled chemistry-climate models (used in CMIP5) were found to 425
underestimate the observed trend at northern hemisphere monitoring locations (Parrish et al., 2014). Further comparisons of
historical surface O3 simulated by CMIP6 models with long-term historical observations is outside the scope of the current
work but will be the subject of future research.

18
A large diversity in the simulated historical changes is shown across the different regions analysed here, with UKESM1-0-LL
tending to simulate the smallest historical change and GISS-E2-1-G or BCC-ESM1 the largest. The large diversity across 430
CMIP6 models in the surface O3 response over the historical period can be attributed to the different magnitude of simulated
O3 concentrations in the 1850 period (Figure S14) and the rate of change in regional mean O3 concentrations (Figure S15),
which is related to the different chemical sensitivity of O3 formation in each model to changing NOx concentrations (Figure
S17). Larger differences between CMIP6 models are shown in the DJF mean historical changes over northern hemisphere
regions than occurred in JJA (Figure S16), reflecting the differences shown in the model evaluation (Fig. 4) and the strong 435
seasonality of the changes. Even, though the historical surface O3 response is small in UKESM1-0-LL, it is shown to have
larger tropospheric changes in O3 over the historical period compared to other CMIP6 models (Griffiths et al., 2020).
South Asia is the region with the largest diversity in simulated historical changes in surface O3 of between 16 and 40 ppb, with
a larger range in DJF (10-40 ppb) than in JJA (19-36 ppb). The large diversity in CMIP6 models is attributed to the large
differences in simulated NOx concentrations, and hence chemical sensitivities of O3 formation, occurring across South Asia 440
over the historical period (Figure S17). In addition, the large historical change in PM2.5 over this region (Fig. S18) could alter
the heterogeneous loss rate of radicals to aerosols and therefore also affect O3 formation. Surface O3 is simulated to have
increased by between 10 to 30 ppb on an annual mean basis and by a larger amount in JJA (12 to 37 ppb) over the major
northern anthropogenic source regions since 1850, driven mainly by the large increases in anthropogenic precursor emissions
of CH4, NOx, CO, and NMVOCs over this period. 445
A qualitative estimate of the influence of non-emission driven processes (chemistry and climate change) can be ascertained by
comparing results from the HTAP_param, an emission-only driven model, to those of the CMIP6-models. Simulated historical
changes in surface O3 from UKESM1-0-LL are comparable to those from the HTAP_param, indicating that the magnitude of
change simulated by UKESM1-0-LL is similar to that solely from changes in precursor emissions. However, the global annual
mean surface O3 response of 7.6 +/- 0.7 ppb from HTAP_param over the historical period is 4.1 ppb lower than the CMIP6 450
multi-model mean, indicating globally that non-emission driven processes have contributed to approximately 30% of the
change in surface O3, although this contribution varies regionally. The different magnitude of response across models could
be due to non-emission driven process, e.g. from different chemistry schemes and climate change signals within models.
19
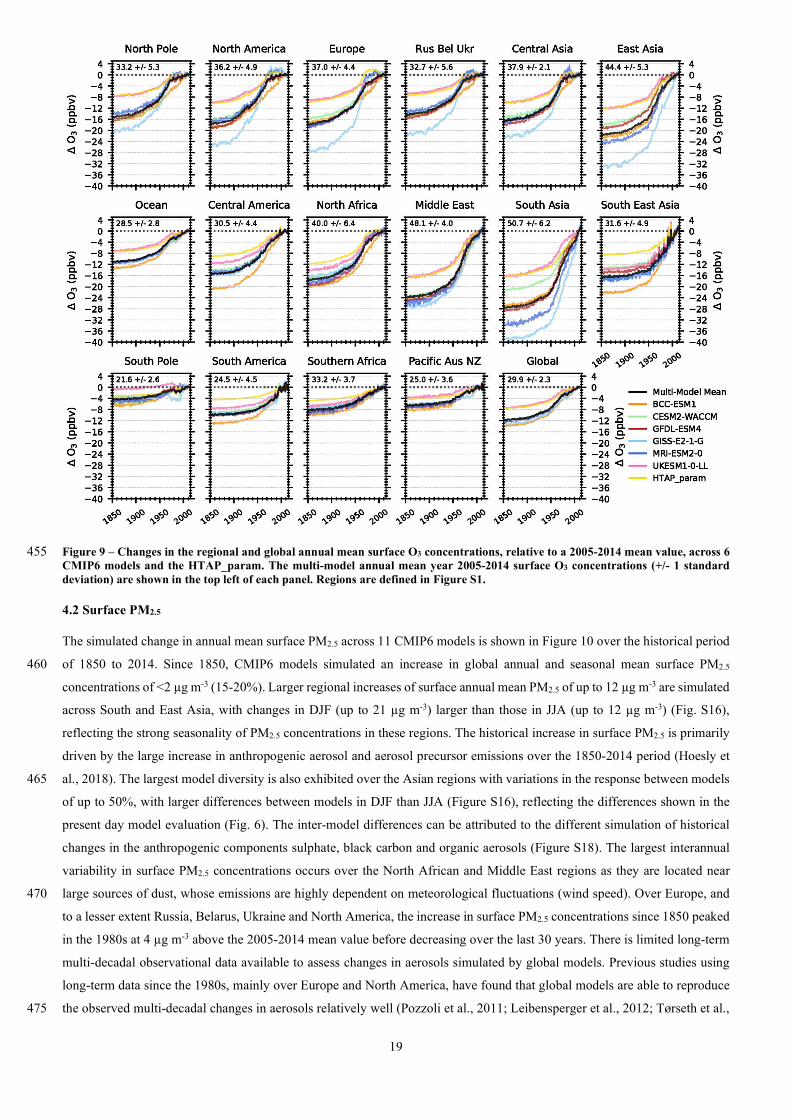
Figure 9 – Changes in the regional and global annual mean surface O3 concentrations, relative to a 2005-2014 mean value, across 6 455 CMIP6 models and the HTAP_param. The multi-model annual mean year 2005-2014 surface O3 concentrations (+/- 1 standard deviation) are shown in the top left of each panel. Regions are defined in Figure S1.
4.2 Surface PM2.5
The simulated change in annual mean surface PM2.5 across 11 CMIP6 models is shown in Figure 10 over the historical period
of 1850 to 2014. Since 1850, CMIP6 models simulated an increase in global annual and seasonal mean surface PM2.5 460
concentrations of <2 µg m-3 (15-20%). Larger regional increases of surface annual mean PM2.5 of up to 12 µg m-3 are simulated
across South and East Asia, with changes in DJF (up to 21 µg m-3) larger than those in JJA (up to 12 µg m-3) (Fig. S16),
reflecting the strong seasonality of PM2.5 concentrations in these regions. The historical increase in surface PM2.5 is primarily
driven by the large increase in anthropogenic aerosol and aerosol precursor emissions over the 1850-2014 period (Hoesly et
al., 2018). The largest model diversity is also exhibited over the Asian regions with variations in the response between models 465
of up to 50%, with larger differences between models in DJF than JJA (Figure S16), reflecting the differences shown in the
present day model evaluation (Fig. 6). The inter-model differences can be attributed to the different simulation of historical
changes in the anthropogenic components sulphate, black carbon and organic aerosols (Figure S18). The largest interannual
variability in surface PM2.5 concentrations occurs over the North African and Middle East regions as they are located near
large sources of dust, whose emissions are highly dependent on meteorological fluctuations (wind speed). Over Europe, and 470
to a lesser extent Russia, Belarus, Ukraine and North America, the increase in surface PM2.5 concentrations since 1850 peaked
in the 1980s at 4 µg m-3 above the 2005-2014 mean value before decreasing over the last 30 years. There is limited long-term
multi-decadal observational data available to assess changes in aerosols simulated by global models. Previous studies using
long-term data since the 1980s, mainly over Europe and North America, have found that global models are able to reproduce
the observed multi-decadal changes in aerosols relatively well (Pozzoli et al., 2011; Leibensperger et al., 2012; Tørseth et al., 475

20
2012; Chin et al., 2014; Turnock et al., 2015; Aas et al., 2019). More recently, global composition models, including some
CMIP6 models, were shown to be able to reproduce the observed changes in AOD, sulphate and particulate matter over the
last two decades (Mortier et al., 2020). The ability of global composition models to reproduce historical changes in aerosols
provides a degree of confidence in the future projections under the CMIP6 scenarios. Further model observational comparisons
of multi-decadal changes in aerosols will need to be undertaken to improve the understanding of changing aerosol properties 480
and processes.
Figure 10 – Changes in the regional and global annual mean surface PM2.5 concentrations, relative to a 2005-2014 mean value, across 11 CMIP6 models. Changes for each region are computed as 10 year running means over the historical period. The multi-model mean 2005-2014 surface PM2.5 concentrations (+/- 1 standard deviation) are shown in the top left of each panel. Regions are defined 485 in Figure S1.
5 Air Pollutants from Present-day to 2100
An analysis is now made of the future projections of air pollutants in the CMIP6 Tier 1 scenarios, including ssp370-lowNTCF.
A comparison is made of the projected future changes in 2050 and 2100 from the four CMIP6 models (CESM2-WACCM,
GFDL-ESM4 and UKESM1-0-LL for both O3 and PM2.5, along with BCC-ESM1 for O3 and MIROC-ES2L for PM2.5) that 490
had the most data available for the ssp370 scenario.
5.1 Surface Ozone
Global annual mean surface O3 is reduced by more than 5 +/- 1.2 ppb (+/- 1 standard deviation value of the multi-model mean)
in the near-term (2050) and by 9 +/- 1.6 ppb in 2100 in the strong air pollutant and climate mitigation scenario ssp126 (Figure
11). Smaller reductions in global annual mean surface O3 are predicted for the middle of the road pathway (ssp245) of 4 +/- 495
1.7 ppb by 2100. Whereas for the weak climate and air pollutant mitigation scenario ssp370, a global annual mean increase in
21
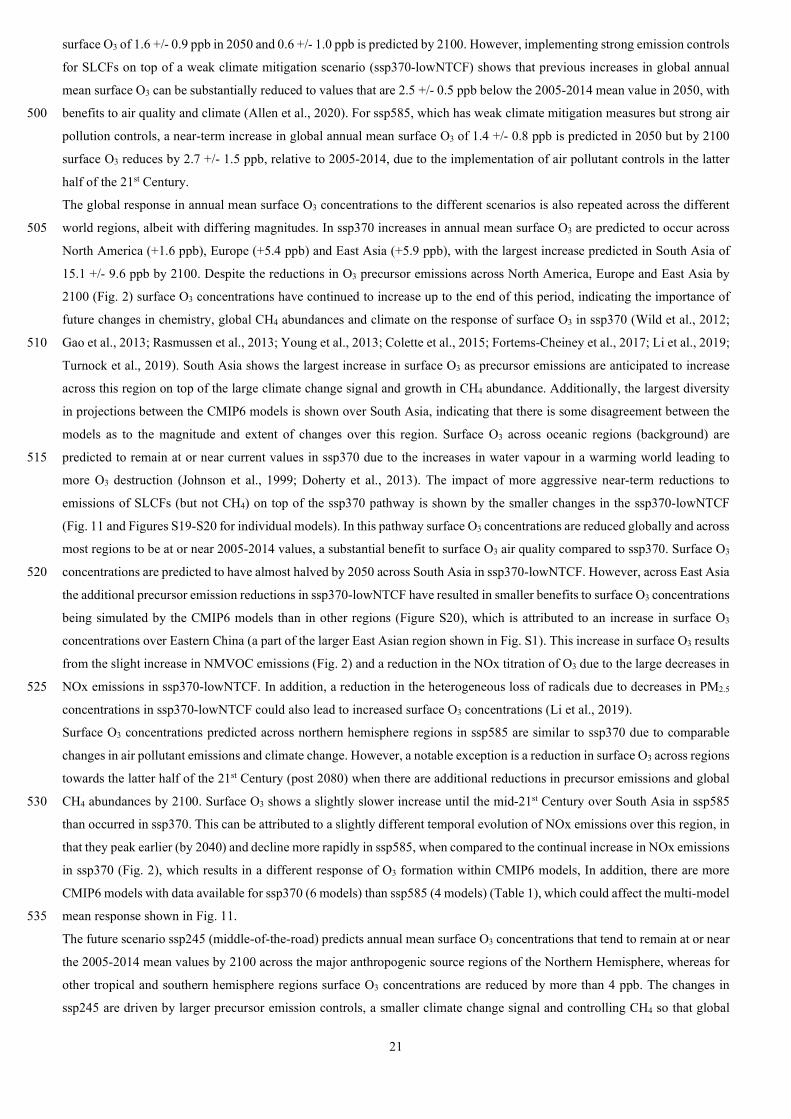
surface O3 of 1.6 +/- 0.9 ppb in 2050 and 0.6 +/- 1.0 ppb is predicted by 2100. However, implementing strong emission controls
for SLCFs on top of a weak climate mitigation scenario (ssp370-lowNTCF) shows that previous increases in global annual
mean surface O3 can be substantially reduced to values that are 2.5 +/- 0.5 ppb below the 2005-2014 mean value in 2050, with
benefits to air quality and climate (Allen et al., 2020). For ssp585, which has weak climate mitigation measures but strong air 500
pollution controls, a near-term increase in global annual mean surface O3 of 1.4 +/- 0.8 ppb is predicted in 2050 but by 2100
surface O3 reduces by 2.7 +/- 1.5 ppb, relative to 2005-2014, due to the implementation of air pollutant controls in the latter
half of the 21st Century.
The global response in annual mean surface O3 concentrations to the different scenarios is also repeated across the different
world regions, albeit with differing magnitudes. In ssp370 increases in annual mean surface O3 are predicted to occur across 505
North America (+1.6 ppb), Europe (+5.4 ppb) and East Asia (+5.9 ppb), with the largest increase predicted in South Asia of
15.1 +/- 9.6 ppb by 2100. Despite the reductions in O3 precursor emissions across North America, Europe and East Asia by
2100 (Fig. 2) surface O3 concentrations have continued to increase up to the end of this period, indicating the importance of
future changes in chemistry, global CH4 abundances and climate on the response of surface O3 in ssp370 (Wild et al., 2012;
Gao et al., 2013; Rasmussen et al., 2013; Young et al., 2013; Colette et al., 2015; Fortems-Cheiney et al., 2017; Li et al., 2019; 510
Turnock et al., 2019). South Asia shows the largest increase in surface O3 as precursor emissions are anticipated to increase
across this region on top of the large climate change signal and growth in CH4 abundance. Additionally, the largest diversity
in projections between the CMIP6 models is shown over South Asia, indicating that there is some disagreement between the
models as to the magnitude and extent of changes over this region. Surface O3 across oceanic regions (background) are
predicted to remain at or near current values in ssp370 due to the increases in water vapour in a warming world leading to 515
more O3 destruction (Johnson et al., 1999; Doherty et al., 2013). The impact of more aggressive near-term reductions to
emissions of SLCFs (but not CH4) on top of the ssp370 pathway is shown by the smaller changes in the ssp370-lowNTCF
(Fig. 11 and Figures S19-S20 for individual models). In this pathway surface O3 concentrations are reduced globally and across
most regions to be at or near 2005-2014 values, a substantial benefit to surface O3 air quality compared to ssp370. Surface O3
concentrations are predicted to have almost halved by 2050 across South Asia in ssp370-lowNTCF. However, across East Asia 520
the additional precursor emission reductions in ssp370-lowNTCF have resulted in smaller benefits to surface O3 concentrations
being simulated by the CMIP6 models than in other regions (Figure S20), which is attributed to an increase in surface O3
concentrations over Eastern China (a part of the larger East Asian region shown in Fig. S1). This increase in surface O3 results
from the slight increase in NMVOC emissions (Fig. 2) and a reduction in the NOx titration of O3 due to the large decreases in
NOx emissions in ssp370-lowNTCF. In addition, a reduction in the heterogeneous loss of radicals due to decreases in PM2.5 525
concentrations in ssp370-lowNTCF could also lead to increased surface O3 concentrations (Li et al., 2019).
Surface O3 concentrations predicted across northern hemisphere regions in ssp585 are similar to ssp370 due to comparable
changes in air pollutant emissions and climate change. However, a notable exception is a reduction in surface O3 across regions
towards the latter half of the 21st Century (post 2080) when there are additional reductions in precursor emissions and global
CH4 abundances by 2100. Surface O3 shows a slightly slower increase until the mid-21st Century over South Asia in ssp585 530
than occurred in ssp370. This can be attributed to a slightly different temporal evolution of NOx emissions over this region, in
that they peak earlier (by 2040) and decline more rapidly in ssp585, when compared to the continual increase in NOx emissions
in ssp370 (Fig. 2), which results in a different response of O3 formation within CMIP6 models, In addition, there are more
CMIP6 models with data available for ssp370 (6 models) than ssp585 (4 models) (Table 1), which could affect the multi-model
mean response shown in Fig. 11. 535
The future scenario ssp245 (middle-of-the-road) predicts annual mean surface O3 concentrations that tend to remain at or near
the 2005-2014 mean values by 2100 across the major anthropogenic source regions of the Northern Hemisphere, whereas for
other tropical and southern hemisphere regions surface O3 concentrations are reduced by more than 4 ppb. The changes in
ssp245 are driven by larger precursor emission controls, a smaller climate change signal and controlling CH4 so that global
22
abundances are below 2015 values by 2100 (Fig. 1g). In ssp245 a near-term (up to 2040) increase in surface O3 is shown across 540
East Asia and South Asia, which could be attributed to the peaking of global CH4 abundances at this point, prior to then
reducing.
The Tier1 future scenario with the strongest climate and air pollutant mitigation measures, ssp126, shows substantial decreases
in surface O3 concentrations across most regions due to the large reduction in precursor emissions, global CH4 abundances,
and small climate change signal. Reductions in surface O3 of more than 10 ppb are predicted across anthropogenic emission 545
source regions of the northern hemisphere, with smaller reductions across southern hemisphere regions.
Projections from the CMIP6 models show that to achieve global benefits for regional surface O3 it is important to control O3
precursor emissions (including CH4) in addition to limiting future climate change. However, scenarios with large climate
change signals (ssp370 and ssp585) but different post 2050 controls on O3 precursors (most notably CH4 and NOx), show
different long-term changes in regional surface O3 concentrations, which could have important consequences for any potential 550
human health impacts.
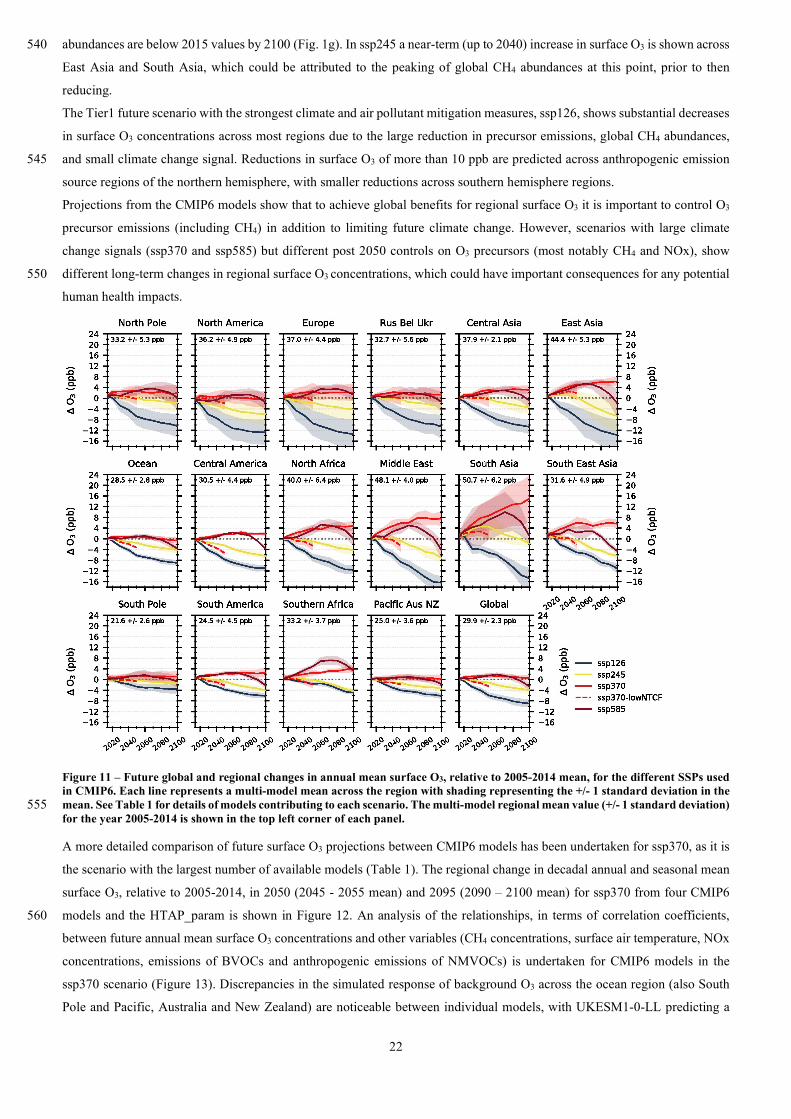
Figure 11 – Future global and regional changes in annual mean surface O3, relative to 2005-2014 mean, for the different SSPs used in CMIP6. Each line represents a multi-model mean across the region with shading representing the +/- 1 standard deviation in the mean. See Table 1 for details of models contributing to each scenario. The multi-model regional mean value (+/- 1 standard deviation) 555 for the year 2005-2014 is shown in the top left corner of each panel.
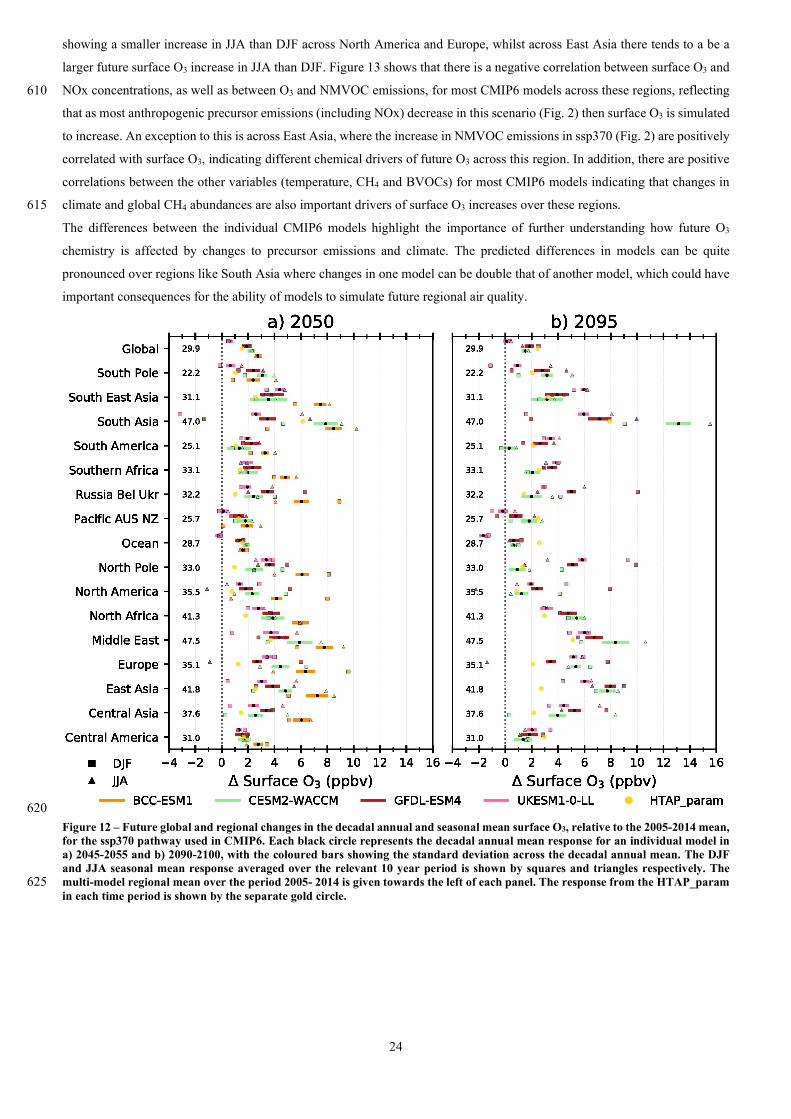
A more detailed comparison of future surface O3 projections between CMIP6 models has been undertaken for ssp370, as it is
the scenario with the largest number of available models (Table 1). The regional change in decadal annual and seasonal mean
surface O3, relative to 2005-2014, in 2050 (2045 - 2055 mean) and 2095 (2090 – 2100 mean) for ssp370 from four CMIP6
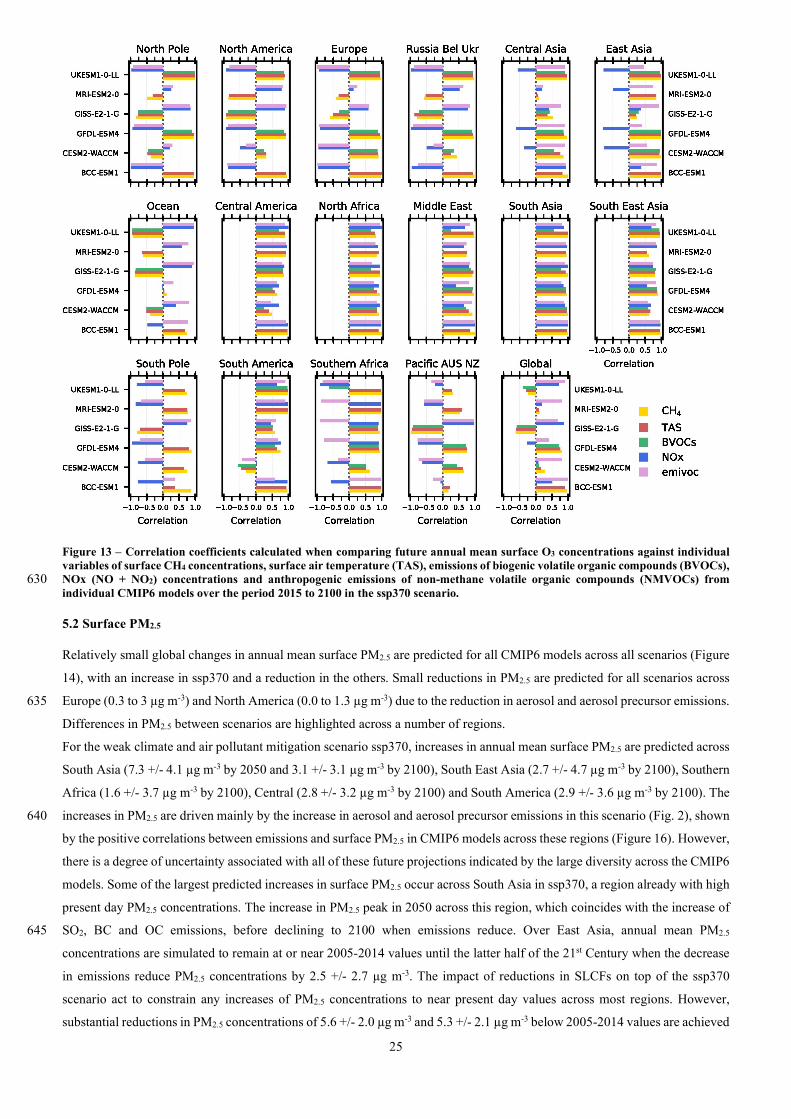
models and the HTAP_param is shown in Figure 12. An analysis of the relationships, in terms of correlation coefficients, 560
between future annual mean surface O3 concentrations and other variables (CH4 concentrations, surface air temperature, NOx
concentrations, emissions of BVOCs and anthropogenic emissions of NMVOCs) is undertaken for CMIP6 models in the
ssp370 scenario (Figure 13). Discrepancies in the simulated response of background O3 across the ocean region (also South
Pole and Pacific, Australia and New Zealand) are noticeable between individual models, with UKESM1-0-LL predicting a
23
decrease in surface O3 compared to the small increase from the HTAP_param and most other models in both 2050 and 2095 565
(Figure S19). The future surface O3 response in UKESM1-0-LL over the ocean region exhibits a large negative correlation
with surface temperature changes (Figure 13), indicating the importance of future climate change in this model over remote
regions. UKESM1-0-LL is a model with high equilibrium climate sensitivity (ECS, 5.4 K) compared to other CMIP6 models
(Forster et al., 2019; Sellar et al., 2019), and therefore will exhibit a larger climate response (surface temperature and water
vapour), leading to enhanced background O3 destruction via water vapour and the hydroxyl radical (OH). Over the North Pole 570
region all models show surface O3 increases that are larger than the HTAP_param, with a larger increase in DJF than JJA. The
large future temperature response over the Arctic, as well as changes in NOx concentrations and emissions of NMVOCs are
particularly important drivers of surface O3 changes across most CMIP6 models in this region with comparatively low local
emissions (Figure 13).
Differences in the predicted surface O3 between models exist across South Asia where CESM2-WACCM (and BCC-ESM1 in 575
2050) predict a response that is twice as large as UKESM1-0-LL and GFDL-ESM4. The lower annual mean response over
South Asia in UKESM1-0-LL and GFDL-ESM4 is driven by a reduction in DJF in these models (Fig. S21), which results in
the DJF change in 2050 being lower than the 2005-2014 annual mean value (Fig. 12). The large increase in NOx emissions in
ssp370 over South Asia (~80%) has resulted in areas of NOx titration, particularly in DJF, near the Indo-Gangetic plain in both
UKESM1-0-LL and GFDL-ESM4, reducing surface O3 concentrations (Fig. S19 and S21). This strong feature of NOx titration 580
of O3 in DJF is absent in both CESM2-WACCM and BCC-ESM1, resulting in larger O3 production over South Asia. The
comparison in Fig. 12 shows how the O3 chemistry within models responds differently across a particular area in a future
scenario with a large climate change signal and over a region with large increases in local precursor emissions, but that all the
drivers related to regional O3 change in South Asia are similarly important across all models (Figure 13).
Over South America and Southern Africa, particularly the tropical areas (Fig. S19), larger future changes in surface O3, 585
particularly by 2100, are predicted by GFDL-ESM4 and UKESM1-0-LL than by CESM2-WACCM. These changes over South
America are larger in JJA in all models, with small seasonal differences over Southern Africa. Over this region, biogenic
emissions (particularly isoprene) are an important source of O3 formation. Discrepancies in the future response of these BVOC
emissions between models could be occurring due to the differing magnitudes of climate and land-use change and how they
are coupled within individual CMIP6 models (Table S1), which could affect future surface O3. Future changes in the total 590
emissions of BVOCs) and those solely from isoprene obtained from five CMIP6 models (Figure S22 and S23) show that
CESM2-WACCM has larger total BVOC emissions over the period 2005-2014 (due to the inclusion of more BVOCs), which
then increase in the future ssp370 scenario, along with isoprene emissions, resulting in a smaller increase (and even decrease
in some parts of the region) in O3. Whereas, UKESM1-0-LL shows a larger increase in O3 and a reduction in BVOC emissions,
mainly from isoprene (Fig. 23), over parts of South America and tropical Africa. Figure 13 shows that there are differing 595
relationships between future surface O3 concentrations, BVOC emissions and NOx concentrations across CMIP6 models over
South America and Southern Africa. Over Southern Africa, UKESM1-0-LL shows a different relationship between BVOC
emissions and surface O3 concentrations than other CMIP6 models, indicating that this could be leading to the different future
O3 response in this model over this region. Similarly, Figure 13 shows that over South America, CESM2-WACCM has a
different relationship between surface O3 and the variables considered here than in other CMIP6 models, particularly for 600
BVOCs, leading to the different future responses in this model over this region. Figure 13 shows that there are differences
between models in the surface O3 response over regions such as South America and Southern Africa, which are potentially
linked to the land-surface response and are important to understand more in future work.
Whilst there are disagreements between models over some regions, there is also substantial consistency in the predicted
increase to annual mean surface O3 in ssp370 over North America, Europe and East Asia, which is larger than that from 605
HTAP_param. However, BCC-ESM1 tends to predict a larger increase than the other three models, potentially due to the
coarser resolution of this ESM. There are differences in simulated seasonal response across these regions, with all models
24
showing a smaller increase in JJA than DJF across North America and Europe, whilst across East Asia there tends to a be a
larger future surface O3 increase in JJA than DJF. Figure 13 shows that there is a negative correlation between surface O3 and
NOx concentrations, as well as between O3 and NMVOC emissions, for most CMIP6 models across these regions, reflecting 610
that as most anthropogenic precursor emissions (including NOx) decrease in this scenario (Fig. 2) then surface O3 is simulated
to increase. An exception to this is across East Asia, where the increase in NMVOC emissions in ssp370 (Fig. 2) are positively
correlated with surface O3, indicating different chemical drivers of future O3 across this region. In addition, there are positive
correlations between the other variables (temperature, CH4 and BVOCs) for most CMIP6 models indicating that changes in
climate and global CH4 abundances are also important drivers of surface O3 increases over these regions. 615
The differences between the individual CMIP6 models highlight the importance of further understanding how future O3
chemistry is affected by changes to precursor emissions and climate. The predicted differences in models can be quite
pronounced over regions like South Asia where changes in one model can be double that of another model, which could have
important consequences for the ability of models to simulate future regional air quality.
620
Figure 12 – Future global and regional changes in the decadal annual and seasonal mean surface O3, relative to the 2005-2014 mean, for the ssp370 pathway used in CMIP6. Each black circle represents the decadal annual mean response for an individual model in a) 2045-2055 and b) 2090-2100, with the coloured bars showing the standard deviation across the decadal annual mean. The DJF and JJA seasonal mean response averaged over the relevant 10 year period is shown by squares and triangles respectively. The multi-model regional mean over the period 2005- 2014 is given towards the left of each panel. The response from the HTAP_param 625 in each time period is shown by the separate gold circle.
25
Figure 13 – Correlation coefficients calculated when comparing future annual mean surface O3 concentrations against individual variables of surface CH4 concentrations, surface air temperature (TAS), emissions of biogenic volatile organic compounds (BVOCs), NOx (NO + NO2) concentrations and anthropogenic emissions of non-methane volatile organic compounds (NMVOCs) from 630 individual CMIP6 models over the period 2015 to 2100 in the ssp370 scenario.
5.2 Surface PM2.5
Relatively small global changes in annual mean surface PM2.5 are predicted for all CMIP6 models across all scenarios (Figure
14), with an increase in ssp370 and a reduction in the others. Small reductions in PM2.5 are predicted for all scenarios across
Europe (0.3 to 3 µg m-3) and North America (0.0 to 1.3 µg m-3) due to the reduction in aerosol and aerosol precursor emissions. 635
Differences in PM2.5 between scenarios are highlighted across a number of regions.
For the weak climate and air pollutant mitigation scenario ssp370, increases in annual mean surface PM2.5 are predicted across
South Asia (7.3 +/- 4.1 µg m-3 by 2050 and 3.1 +/- 3.1 µg m-3 by 2100), South East Asia (2.7 +/- 4.7 µg m-3 by 2100), Southern
Africa (1.6 +/- 3.7 µg m-3 by 2100), Central (2.8 +/- 3.2 µg m-3 by 2100) and South America (2.9 +/- 3.6 µg m-3 by 2100). The
increases in PM2.5 are driven mainly by the increase in aerosol and aerosol precursor emissions in this scenario (Fig. 2), shown 640
by the positive correlations between emissions and surface PM2.5 in CMIP6 models across these regions (Figure 16). However,
there is a degree of uncertainty associated with all of these future projections indicated by the large diversity across the CMIP6
models. Some of the largest predicted increases in surface PM2.5 occur across South Asia in ssp370, a region already with high
present day PM2.5 concentrations. The increase in PM2.5 peak in 2050 across this region, which coincides with the increase of
SO2, BC and OC emissions, before declining to 2100 when emissions reduce. Over East Asia, annual mean PM2.5 645
concentrations are simulated to remain at or near 2005-2014 values until the latter half of the 21st Century when the decrease
in emissions reduce PM2.5 concentrations by 2.5 +/- 2.7 µg m-3. The impact of reductions in SLCFs on top of the ssp370
scenario act to constrain any increases of PM2.5 concentrations to near present day values across most regions. However,
substantial reductions in PM2.5 concentrations of 5.6 +/- 2.0 µg m-3 and 5.3 +/- 2.1 µg m-3 below 2005-2014 values are achieved
26
by 2050 across East and South Asia respectively, by implementing these measures. Due to the short lifetime of aerosols in the 650
atmosphere PM2.5 concentrations respond rapidly to the large cuts in emissions that occur in ssp370-lowNTCF and show the
benefits to targeting these emissions, although there could be a potential climate impact (Allen et al., 2020).
Reductions in annual mean surface PM2.5 are simulated across all regions for ssp126, ssp245 and ssp585. Differences exist in
the magnitude and timing of PM2.5 reductions across regions linked to the changes in emissions. The largest reductions in
PM2.5 occur over South Asia in 2100 and range from 11.1 +/- 2.8 µg m-3 in ssp126 to 8.6 +/- 2.9 µg m-3 in ssp585, a substantial 655
benefit to regional air quality. Similar benefits to PM2.5 are achieved over East Asia by 2100 although the more rapid
improvements occur over this region in the first part of the 21st Century.
The response of PM2.5 concentrations is more variable, with a larger diversity across CMIP6 models within regions that are
close to natural aerosol emission sources. This is particularly noticeable over North Africa where the variability across CMIP6
models in dust emissions from the Saharan source region (Fig. S8) results in an uncertain PM2.5 response across this region. A 660
similar response is also exhibited across the Middle East and Central Asia. The potential influence of BVOCs on SOA
formation (Fig. S22 and S26) could also be contributing to the diversity in the CMIP6 model responses across the South
America and Southern Africa regions.
The CMIP6 models show that future reductions in aerosols and aerosol precursors will lead to a decrease in surface PM2.5
concentrations across most world regions and a benefit to regional air quality (and human health), consistent with that from 665
CMIP5. However, if emissions are not controlled over economically developing regions such as South America, Asia and
Africa then surface PM2.5 is anticipated to increase and worsen future regional air quality. Targeting emission reductions of
SLCFs in the short-term shows the potential for rapid improvements in surface PM2.5 and air quality.
670
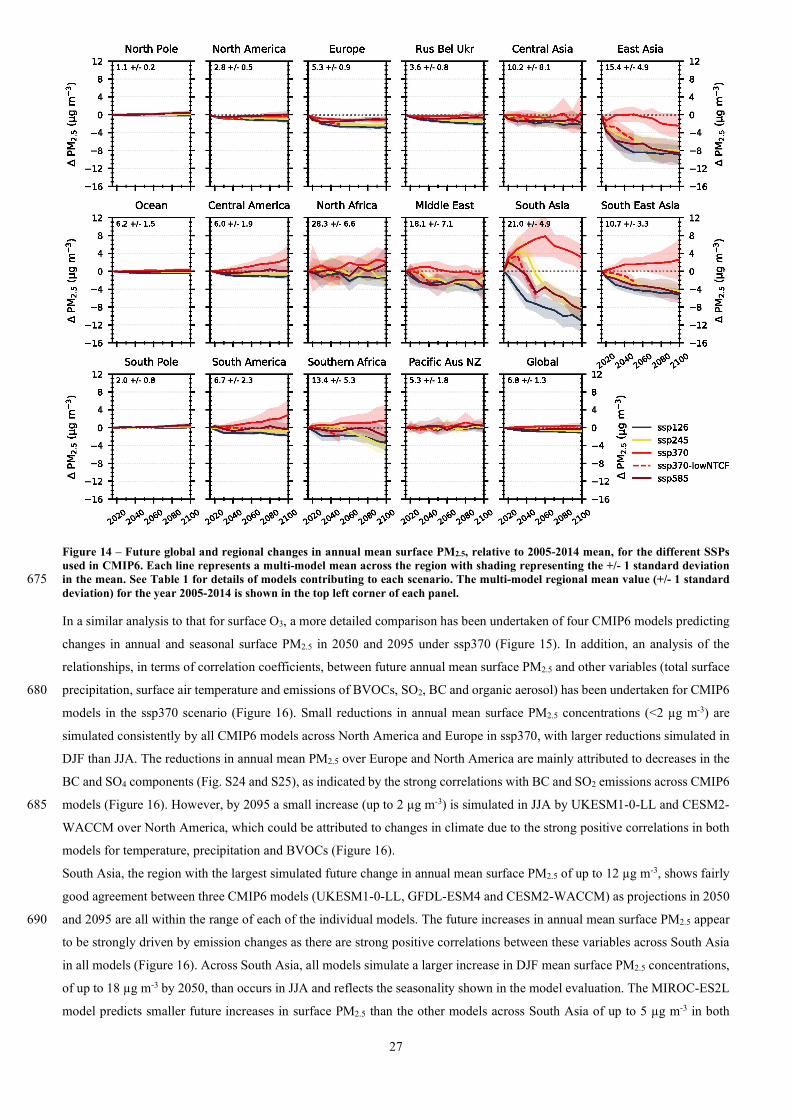
27
Figure 14 – Future global and regional changes in annual mean surface PM2.5, relative to 2005-2014 mean, for the different SSPs used in CMIP6. Each line represents a multi-model mean across the region with shading representing the +/- 1 standard deviation in the mean. See Table 1 for details of models contributing to each scenario. The multi-model regional mean value (+/- 1 standard 675 deviation) for the year 2005-2014 is shown in the top left corner of each panel.
In a similar analysis to that for surface O3, a more detailed comparison has been undertaken of four CMIP6 models predicting
changes in annual and seasonal surface PM2.5 in 2050 and 2095 under ssp370 (Figure 15). In addition, an analysis of the
relationships, in terms of correlation coefficients, between future annual mean surface PM2.5 and other variables (total surface
precipitation, surface air temperature and emissions of BVOCs, SO2, BC and organic aerosol) has been undertaken for CMIP6 680
models in the ssp370 scenario (Figure 16). Small reductions in annual mean surface PM2.5 concentrations (<2 µg m-3) are
simulated consistently by all CMIP6 models across North America and Europe in ssp370, with larger reductions simulated in
DJF than JJA. The reductions in annual mean PM2.5 over Europe and North America are mainly attributed to decreases in the
BC and SO4 components (Fig. S24 and S25), as indicated by the strong correlations with BC and SO2 emissions across CMIP6
models (Figure 16). However, by 2095 a small increase (up to 2 µg m-3) is simulated in JJA by UKESM1-0-LL and CESM2-685
WACCM over North America, which could be attributed to changes in climate due to the strong positive correlations in both
models for temperature, precipitation and BVOCs (Figure 16).
South Asia, the region with the largest simulated future change in annual mean surface PM2.5 of up to 12 µg m-3, shows fairly
good agreement between three CMIP6 models (UKESM1-0-LL, GFDL-ESM4 and CESM2-WACCM) as projections in 2050
and 2095 are all within the range of each of the individual models. The future increases in annual mean surface PM2.5 appear 690
to be strongly driven by emission changes as there are strong positive correlations between these variables across South Asia
in all models (Figure 16). Across South Asia, all models simulate a larger increase in DJF mean surface PM2.5 concentrations,
of up to 18 µg m-3 by 2050, than occurs in JJA and reflects the seasonality shown in the model evaluation. The MIROC-ES2L
model predicts smaller future increases in surface PM2.5 than the other models across South Asia of up to 5 µg m-3 in both

28
2050 and 2095. This is a result of smaller changes in the BC, OA and sulphate aerosol components in the MIROC-ES2L model 695
despite increases in aerosols and aerosol precursor emissions across South Asia in ssp370 (Figure S24-S26).
Disagreements in both the sign and magnitude of simulated future annual and seasonal mean surface PM2.5 changes between
CMIP6 models are also exhibited across East Asia. Small regional annual mean increases are predicted in 2050 due to PM2.5
increases in JJA from all models apart from GFDL-ESM4. A larger reduction in the SO4 component is simulated over East
Asia by GFDL-ESM4 than in other models (Fig S25), resulting in an overall decrease in PM2.5. In 2095 most models , simulate 700
a reduction in PM2.5 concentrations in both seasons across East Asia, apart from CESM2-WACCM due to the increase in JJA.
All models simulate continual reductions out to 2100 for SO4 across this region, whereas BC increases in the near-term before
decreasing out to 2100. For OA, CESM2-WACCM shows larger increases over East Asia in both 2050 and 2095 compared to
the other models, which show a smaller increase in 2050 and a reduction by 2095 (Fig. S26). CESM2-WACCM includes a
more complex treatment of SOA formation, showing a strong response to climate and historical trends in OA (Tilmes et al., 705
2019). Positive correlations are shown for CESM2-WACCM between surface PM2.5 and emissions of BVOC and temperature
(Fig. 16), which are not present in other models and could explain the differences between this model and others across East
Asia. The discrepancies in CMIP6 models are not as obvious over South Asia as the effect of the increase in OA over South
Asia in CESM2-WACCM is masked by coincident increases in other components across other models, as indicated by the
strong correlations with emissions here. CESM2-WACCM also shows larger simulated increases in PM2.5 over South America, 710
Central America, Southern Africa and South East Asia than other models, which can be attributed to the larger increase in the
OA fraction (Fig. S26) and the strong correlations in this model with changes in temperature and emissions (BVOCs and SO2).
Over Southern Africa UKESM1-0-LL shows a reduction in future PM2.5, in contrast to other models, due to a reduction in the
BC, OA and dust aerosol components (Fig. S24, S26 and S27). UKESM1-0-LL exhibits particularly strong negative
correlations for surface PM2.5 when compared with temperature and precipitation. These relationships over Southern Africa 715
are quite different to other CMIP6 models, which is also highlighted in the model evaluation over this region (Fig. 8) and
indicates that climate change influences aerosol concentrations differently over this region in this model (Figure 16). In
addition, there is a slight positive correlation of PM2.5 with BVOC emissions in UKESM1-0-LL over Southern Africa. Future
biogenic emissions (including monoterpenes) reduce here in ssp370 (Fig. S22), potentially due to land-use vegetation change
as UKESM1-0-LL has dynamic vegetation coupled to BVOC emissions (Table S1). This could also reduce PM2.5 720
concentrations over this region because monoterpene emissions are the main precursor to SOA formation in UKESM1-0-LL
(Mulcahy et al., 2019).
The decadal annual and seasonal mean PM2.5 response is variable across individual CMIP6 models over regions close to natural
sources of particulate matter (North Africa, Central Asia and Pacific, Australia and New Zealand). Over these regions there is
a large range in both the sign and magnitude of the annual and seasonal PM2.5 response, which can be mainly attributed to the 725
dust fraction (Fig. S27) and the fact that this aerosol source has a large inter-annual variability in its emission strength. There
is also a lack of consistency across CMIP6 models in the correlations of PM2.5 with any individual driver, indicating the
variability of aerosol sources in these regions within models. Interestingly, the CMIP6 models do not agree in the sign and
magnitude of future changes to dust concentrations in ssp370 (Fig. S27).
Across the ocean and North Pole regions all the CMIP6 models tend to simulate a small increase in PM2.5 concentrations, 730
which can be attributed to increases in sea salt concentrations (Fig. S28). A strong increase in sea salt concentrations is
simulated in all models across the Southern Ocean (and other oceans), potentially driven by changes to meteorological
conditions (reflected by the positive correlations of PM2.5 with the climate variables temperatures and precipitation in Fig. 16),
which increase wind speed and sea salt emissions. As ssp370 is a scenario with a large climate change signal, the increases in
PM2.5 across the North Pole, particularly in 2100, can be attributed to the melting of sea ice increasing sea salt emissions, 735
which again is reflected in the positive correlations of PM2.5 with climate variables over this region. However, the magnitude
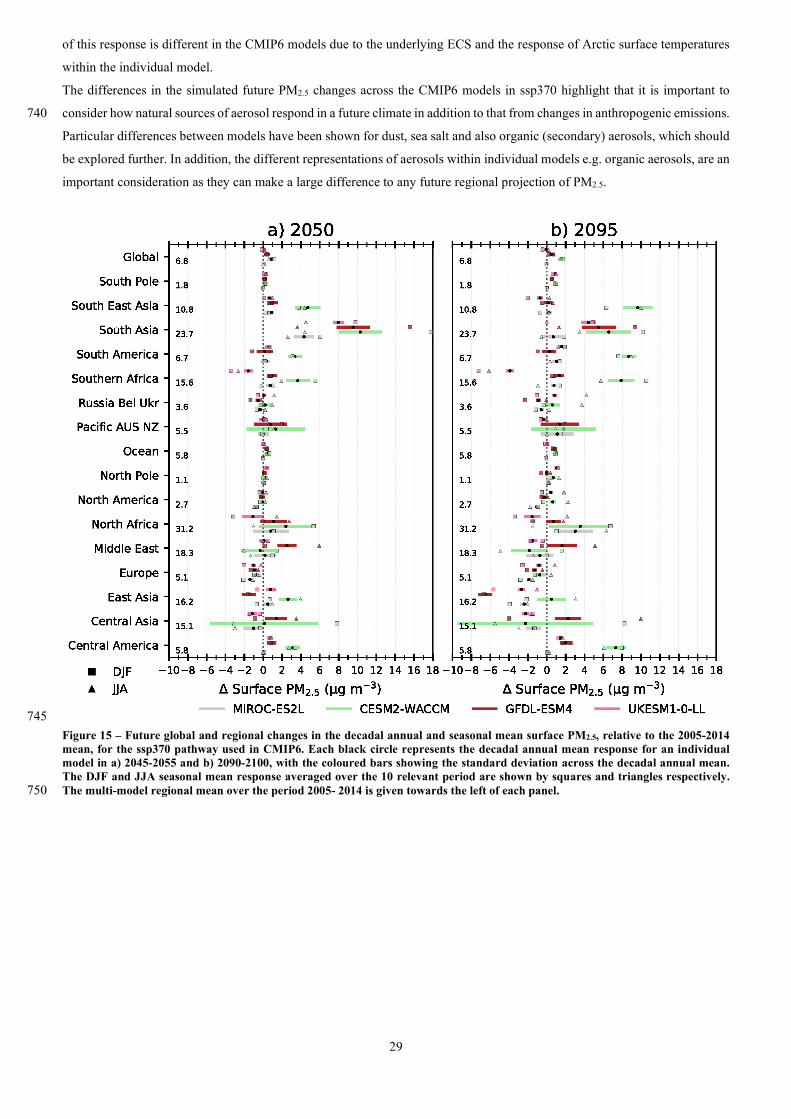
29
of this response is different in the CMIP6 models due to the underlying ECS and the response of Arctic surface temperatures
within the individual model.
The differences in the simulated future PM2.5 changes across the CMIP6 models in ssp370 highlight that it is important to
consider how natural sources of aerosol respond in a future climate in addition to that from changes in anthropogenic emissions. 740
Particular differences between models have been shown for dust, sea salt and also organic (secondary) aerosols, which should
be explored further. In addition, the different representations of aerosols within individual models e.g. organic aerosols, are an
important consideration as they can make a large difference to any future regional projection of PM2.5.
745
Figure 15 – Future global and regional changes in the decadal annual and seasonal mean surface PM2.5, relative to the 2005-2014 mean, for the ssp370 pathway used in CMIP6. Each black circle represents the decadal annual mean response for an individual model in a) 2045-2055 and b) 2090-2100, with the coloured bars showing the standard deviation across the decadal annual mean. The DJF and JJA seasonal mean response averaged over the 10 relevant period are shown by squares and triangles respectively. The multi-model regional mean over the period 2005- 2014 is given towards the left of each panel. 750
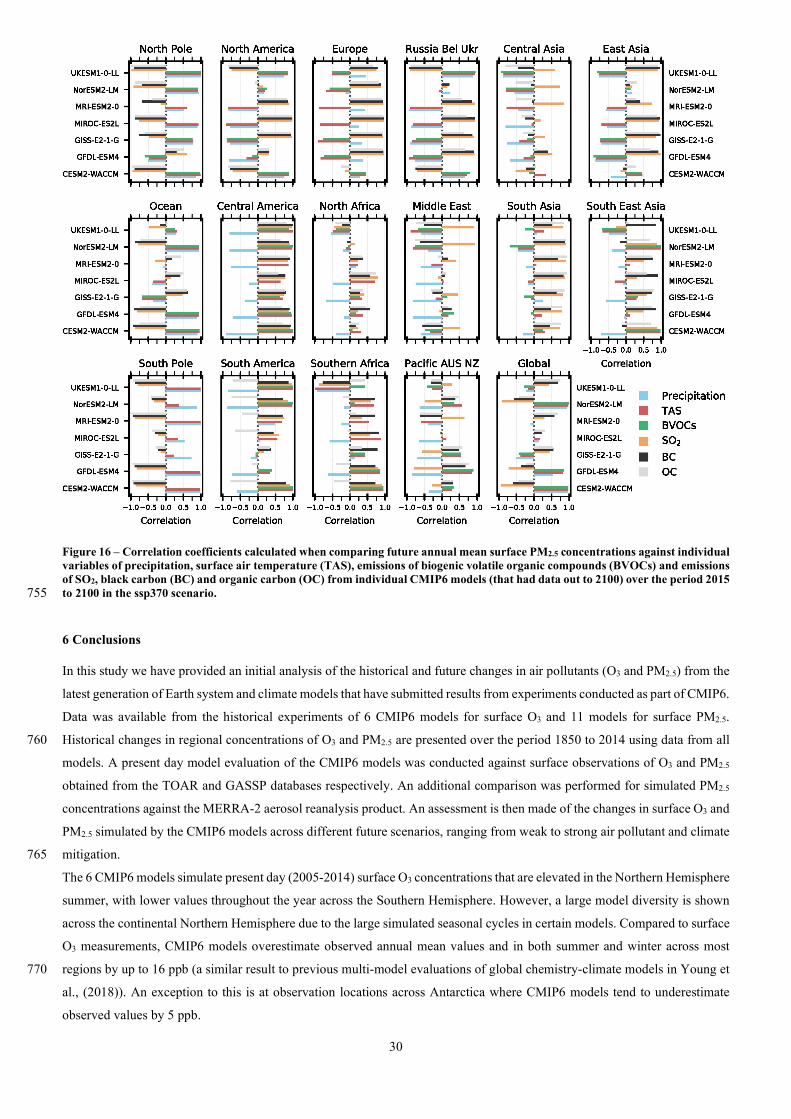
30
Figure 16 – Correlation coefficients calculated when comparing future annual mean surface PM2.5 concentrations against individual variables of precipitation, surface air temperature (TAS), emissions of biogenic volatile organic compounds (BVOCs) and emissions of SO2, black carbon (BC) and organic carbon (OC) from individual CMIP6 models (that had data out to 2100) over the period 2015 to 2100 in the ssp370 scenario. 755
6 Conclusions
In this study we have provided an initial analysis of the historical and future changes in air pollutants (O3 and PM2.5) from the
latest generation of Earth system and climate models that have submitted results from experiments conducted as part of CMIP6.
Data was available from the historical experiments of 6 CMIP6 models for surface O3 and 11 models for surface PM2.5.
Historical changes in regional concentrations of O3 and PM2.5 are presented over the period 1850 to 2014 using data from all 760
models. A present day model evaluation of the CMIP6 models was conducted against surface observations of O3 and PM2.5
obtained from the TOAR and GASSP databases respectively. An additional comparison was performed for simulated PM2.5
concentrations against the MERRA-2 aerosol reanalysis product. An assessment is then made of the changes in surface O3 and
PM2.5 simulated by the CMIP6 models across different future scenarios, ranging from weak to strong air pollutant and climate
mitigation. 765
The 6 CMIP6 models simulate present day (2005-2014) surface O3 concentrations that are elevated in the Northern Hemisphere
summer, with lower values throughout the year across the Southern Hemisphere. However, a large model diversity is shown
across the continental Northern Hemisphere due to the large simulated seasonal cycles in certain models. Compared to surface
O3 measurements, CMIP6 models overestimate observed annual mean values and in both summer and winter across most
regions by up to 16 ppb (a similar result to previous multi-model evaluations of global chemistry-climate models in Young et 770
al., (2018)). An exception to this is at observation locations across Antarctica where CMIP6 models tend to underestimate
observed values by 5 ppb.
31
Large surface PM2.5 concentrations are simulated in CMIP6 models near dust and anthropogenic emission source regions.
Model diversity across the CMIP6 models is largest near the dust source regions due to their sensitivity to meteorological
variability, whereas across other regions the CMIP6 models are relatively similar in their simulation of PM2.5 concentrations. 775
Evaluating the approximate PM2.5 calculated from CMIP6 models (excluding nitrate aerosols) against ground based PM2.5
observations shows an underestimation across most regions of up to 10 µg m-3. The underestimation of observations by models
is larger in the northern hemisphere winter than summer, in part due to the absence of nitrate aerosols within most CMIP6
models and also due to underrepresentation of other aerosol processes within global models (a similar result to other multi-
model assessments). To improve the spatial coverage and consistency of the PM2.5 evaluation with CMIP6 models an additional 780
comparison was made to the MERRA-2 aerosol reanalysis product. A similar, but slightly smaller, underestimation of PM2.5
concentrations over Europe and North America was found in the comparison of CMIP6 models and MERRA-2, providing
further confidence in the result from the ground-based comparison. CMIP6 models overestimated the monthly PM2.5
concentrations in MERRA-2 over South and East Asia by up 15 µg m-3, in contrast to the evaluation using ground based
observations. Mean annual cycles simulated by CMIP6 models and MERRA-2 tend to agree across other regions for which 785
there are no suitable ground-based observations. The comparison of surface O3 and PM2.5 simulated by CMIP6 models to
observations shows similar biases to previous generations of global composition-climate models. Further studies are required
(e.g. global sensitivity or process studies) to explore uncertainties in models and the differences with observations.
Across the historical period (1850-2014), the CMIP6 models simulated a global annual increase in surface O3 of between 7
and 14 ppb, with a larger increase in JJA than DJF. A global multi-model mean increase of 11.7 +/- 2.3 ppb was simulated by 790
the CMIP6 models which agrees well with the change previously simulated by CMIP5 models. A large diversity in the
historical change of surface O3 was simulated by CMIP6 models across South Asia and other Northern Hemisphere regions.
CMIP6 models predicted larger historical changes in surface O3 than those from an emission-only driven parameterisation,
indicating a potential climate change impact (Wu et al., 2008; Bloomer et al., 2009; Weaver et al., 2009; Rasmussen et al.,
2013; Colette et al., 2015) on surface O3 over the historical period. Small global increases in surface PM2.5 are simulated over 795
the historical period by CMIP6 models, with larger regional changes of up to 12 µg m-3 on an annual mean basis and up to 18
µg m-3 in DJF across East and South Asia. The largest diversity in the response of CMIP6 models occurs over Asian regions,
with large interannual variabilities near dust source regions. CMIP6 models simulate the peak in PM2.5 concentrations in the
1980s across Europe and North America, prior to simulating the observed decline in concentrations to present day
(Leibensperger et al., 2012; Tørseth et al., 2012; Turnock et al., 2015), attributed to the implementation of air pollutant emission 800
controls over these regions.
The CMIP6 models predict surface O3 to increase across most regions in the weak mitigation scenarios (ssp370 and ssp585),
particularly over South and East Asia (up to 16 ppb by 2100) due to a combination of increases in air pollutant emissions,
increases in global CH4 abundances and climate change. Discrepancies exist in the regional surface O3 response in ssp370
between individual CMIP6 models due to differences in the response of chemistry (NOx – Fig. S17), climate (temperature) 805
and biogenic precursor emissions (Fig. S22). Benefits to regional air quality from large reductions in surface O3 are possible
across all regions for scenarios that contain strong climate and air pollutant mitigation measures, including those targeting
CH4.
CMIP6 models predict surface PM2.5 concentrations to decreases across all regions in both the middle-of-the-road (ssp245)
and strong mitigation scenarios (ssp126) by up to 12 µg m-3 due to the reduction in anthropogenic aerosols and aerosol 810
precursor emissions, yielding a benefit to regional air quality. Whereas for the weak climate and air pollutant mitigation
scenario (ssp370), annual and seasonal mean surface PM2.5 is simulated to increase across a number of regions. Implementing
mitigation measures specifically targeting SLCFs on top of the ssp370 scenario shows immediate improvements in PM2.5
concentrations, restricting any changes to below present day values. The largest change in regional mean PM2.5 concentrations,
and also largest diversity across CMIP6 models, is predicted in ssp370 across South Asia, an area with already poor air quality. 815
32
Disagreements in the projection of future changes to regional surface PM2.5 concentrations between individual CMIP6 models
can be attributed to differences in the complexity of the aerosol schemes implemented within models, in particular the
formation mechanisms of organic aerosols and emission of BVOCs over certain regions, along with the strength of the climate
change signal (temperature and precipitation) simulated by models and the impact this has on natural aerosol emissions via
Earth system couplings. 820
The results from CMIP6 provide an opportunity to assess the simulation of historical and future changes in air pollutants within
the latest generation of Earth system and climate models using up to date scenarios of future socio-economic development.
Large changes in air pollutants were simulated over the historical period, primarily in response to changes in anthropogenic
emissions. Future regional concentrations of air pollutants depend on the particular trajectory of climate and air pollutant
mitigation that the world follows, with important consequences for regional air quality and human health. Substantial benefits 825
can be achieved across most world regions by implementing measures to mitigate the extent of climate change, as well as from
large reductions in air pollutants emissions, including CH4 which is particularly important for controlling O3. In future
scenarios which do not mitigate climate change and air pollutant emissions, the regional concentrations of air pollutants are
anticipated to increase. Important differences between individual CMIP6 models have been identified in terms of how they
simulate air pollutants from the interaction of chemistry (O3 and NOx), climate (temperature and precipitation) and natural 830
precursor emissions (BVOCs) in the future. Further research and understanding is necessary of these processes to improve the
robustness of regional projections of air pollutants on climate change timescales (decadal to centennial).
Data Availability
CMIP6 data is archived at the Earth System Grid Federation and is freely available to download. A list of the model datasets
used in this study are provided in Table 1. 835
Author Contributions
S.T.T. conducted the analysis and wrote the paper with contributions from R.J.A. T.W. and J.Z. performed BCC-ESM1
simulations. L.E. and S.T. performed CESM2-WACCM simulations. P.N. and M.M. performed CNRM-ESM2-1 simulations.
L.W. H. and J.G.J. performed GFDL-ESM4 simulations. S.B. and K.T. performed GISS-E2-1-G simulations. M.A and P.G. 840
performed HadGEM3-GC31-LL simulations. T.T. performed MIROC6-ES2L simulations. D.N. performed MPI-ESM1.2-
HAM simulations. M.D. and N.O. performed MRI-ESM2-0 simulations. D.O. and M.S. performed NorESM2-LM simulations.
A.S. and F.M.O’C. performed UKESM1-0-LL simulations. All co-authors have been involved in providing comments and
editing the manuscript.
Competing Interests 845
The author declares that there are no conflicts of interest.
Acknowledgements
S.T.T. and F.M.O’C. would like to acknowledge that support for this work came from the BEIS and DEFRA Met Office
Hadley Centre Climate Programme (GA01101). S.T.T. would also like to acknowledge the UK-China Research and Innovation
Partnership Fund through the Met Office Climate Science for Service Partnership (CSSP) China as part of the Newton Fund. 850
FMO’C also acknowledge the EU Horizon 2020 Research Programme CRESCENDO project, grant agreement number
33
641816. T.T. was supported by the supercomputer system of the National Institute for Environmental Studies, Japan, and JSPS
KAKENHI Grant Number JP19H05669. K.T. and S.B. acknowledge resources supporting this work were provided by the
NASA High-End Computing (HEC) Program through the NASA Center for Climate Simulation (NCCS) at Goddard Space
Flight Center. M.D. and NO were supported by the Japan Society for the Promotion of Science (grant numbers: JP18H03363, 855
JP18H05292, and JP20K04070) and the Environment Research and Technology Development Fund (JPMEERF20172003,
JPMEERF20202003, and JPMEERF20205001) of the Environmental Restoration and Conservation Agency of Japan.
For making their measurement data available to be used in this study we would like to acknowledge the providers who supplied
their data to the GASSP database and TOAR database. David Neubauer acknowledges funding from the European Union’s
Horizon 2020 research and innovation programme project FORCeS under grant agreement No 821205 and a grant from the 860
Deutsches Klimarechenzentrum (DKRZ) under project ID 1051. S.S was supported by Korea Meteorological Administration
Research and Development Program “Development and Assessment of IPCC AR6 Climate change scenario” under grant
(KMA2018-00321)
References
Aas, W., Mortier, A., Bowersox, V., Cherian, R., Faluvegi, G., Fagerli, H., Hand, J., Klimont, Z., Galy-Lacaux, C., Lehmann, C. M. B., 865
Myhre, C. L., Myhre, G., Olivié, D., Sato, K., Quaas, J., Rao, P. S. P., Schulz, M., Shindell, D., Skeie, R. B., Stein, A., Takemura, T., Tsyro,
S., Vet, R. and Xu, X.: Global and regional trends of atmospheric sulfur, Sci. Rep., 9(1), 953, doi:10.1038/s41598-018-37304-0, 2019.
Allen, R. J., Landuyt, W. and Rumbold, S. T.: An increase in aerosol burden and radiative effects in a warmer world, Nat. Clim. Chang.,
6(3), 269–274, doi:10.1038/nclimate2827, 2016.
Allen, R. J., Turnock, S., Nabat, P., Neubauer, D., Lohmann, U., Olivie, D., Oshima, N., Michou, M., Wu, T., Zhang, J., Takemura, T., 870
Schulz, M., Tsigaridis, K., Bauer, S., Emmons, L., Horowitz, L., Naik, V., van Noije, T., Bergman, T., Lamarque, J.-F., Zanis, P., Tegen, I.,
Westervelt, D. M., Le Sager, P., Good, P., Shim, S., O’Connor, F., Akritidis, D., Georgoulias, A. K., Deushi, M., Sentman, L., Fujimori, S.
and Collins, W. J.: Climate and air quality impacts due to mitigation of non-methane near-term climate forcers, Atmos. Chem. Phys. Discuss.,
In review, doi:https://doi.org/10.5194/acp-2019-1209, 2020.
Apte, J. S., Marshall, J. D., Cohen, A. J. and Brauer, M.: Addressing Global Mortality from Ambient PM 2.5, Environ. Sci. Technol., 49, 875
8057–8066, doi:10.1021/acs.est.5b01236, 2015.
Bauer, S. E., Tsigaridis, K., Faluvegi, G., Kelley, M., Lo, K. K., Miller, R. L., Nazarenko, L., Schmidt, G. A. and Wu, J.: Historical (1850‐
2014) aerosol evolution and role on climate forcing using the GISS ModelE2.1 contribution to CMIP6, J. Adv. Model. Earth Syst.,
doi:10.1029/2019ms001978, 2020.
Bloomer, B. J., Stehr, J. W., Piety, C. A., Salawitch, R. J. and Dickerson, R. R.: Observed relationships of ozone air pollution with 880
temperature and emissions, Geophys. Res. Lett., 36(9), 1–5, doi:10.1029/2009GL037308, 2009.
Boucher, O., Randall, P., Artaxo, P., Bretherton, C., Feingold, G., Forster, P., Kerminen, V.-M., Kondo, Y., Liao, H., Lohmann, U., Rasch,
P., Satheesh, S. K., Sherwood, S., Stevens, B. and Zhang, X. Y.: Clouds and Aerosols. In: Climate Change 2013: The Physical Science Basis.
Contribution of Working Group I to the Fifth Assessment Report of the Intergovernmental Panel on Climate Change, Cambridge University
Press., 2013. 885
Buchard, V., Randles, C. A., da Silva, A. M., Darmenov, A., Colarco, P. R., Govindaraju, R., Ferrare, R., Hair, J., Beyersdorf, A. J., Ziemba,
L. D., Yu, H., Buchard, V., Randles, C. A., Silva, A. M. da, Darmenov, A., Colarco, P. R., Govindaraju, R., Ferrare, R., Hair, J., Beyersdorf,
A. J., Ziemba, L. D. and Yu, H.: The MERRA-2 Aerosol Reanalysis, 1980 Onward. Part II: Evaluation and Case Studies, J. Clim., 30(17),
6851–6872, doi:10.1175/JCLI-D-16-0613.1, 2017.
Butt, E. W., Turnock, S. T., Rigby, R., Reddington, C. L., Yoshioka, M., Johnson, J. S., Regayre, L. A., Pringle, K. J., Mann, G. W. and 890
Spracklen, D. V.: Global and regional trends in particulate air pollution and attributable health burden over the past 50 years, Environ. Res.
Lett., 12(10), doi:10.1088/1748-9326/aa87be, 2017.
Checa‐Garcia, R., Hegglin, M. I., Kinnison, D., Plummer, D. A. and Shine, K. P.: Historical Tropospheric and Stratospheric Ozone Radiative
Forcing Using the CMIP6 Database, Geophys. Res. Lett., 45(7), 3264–3273, doi:10.1002/2017GL076770, 2018.
Chin, M., Diehl, T., Tan, Q., Prospero, J. M., Kahn, R. A., Remer, L. A., Yu, H., Sayer, A. M., Bian, H., Geogdzhayev, I. V., Holben, B. N., 895
Howell, S. G., Huebert, B. J., Hsu, N. C., Kim, D., Kucsera, T. L., Levy, R. C., Mishchenko, M. I., Pan, X., Quinn, P. K., Schuster, G. L.,
34
Streets, D. G., Strode, S. A., Torres, O. and Zhao, X.-P.: Multi-decadal aerosol variations from 1980 to 2009: a perspective from observations
and a global model, Atmos. Chem. Phys., 14(7), 3657–3690, doi:10.5194/acp-14-3657-2014, 2014.
Clifton, O. E., Paulot, F., Fiore, A. M., Horowitz, L. W., Correa, G., Baublitz, C. B., Fares, S., Goded, I., Goldstein, A. H., Gruening, C.,
Hogg, A. J., Loubet, B., Mammarella, I., Munger, J. W., Neil, L., Stella, P., Uddling, J., Vesala, T. and Weng, E.: Influence of Dynamic 900
Ozone Dry Deposition on Ozone Pollution, J. Geophys. Res. Atmos., 125(8), doi:10.1029/2020JD032398, 2020.
Cohen, A. J., Brauer, M., Burnett, R., Anderson, H. R., Frostad, J., Estep, K., Balakrishnan, K., Brunekreef, B., Dandona, L., Dandona, R.,
Feigin, V., Freedman, G., Hubbell, B., Jobling, A., Kan, H., Knibbs, L., Liu, Y., Martin, R., Morawska, L., Pope, C. A., Shin, H., Straif, K.,
Shaddick, G., Thomas, M., van Dingenen, R., van Donkelaar, A., Vos, T., Murray, C. J. L. and Forouzanfar, M. H.: Estimates and 25-year
trends of the global burden of disease attributable to ambient air pollution: an analysis of data from the Global Burden of Diseases Study 905
2015., Lancet (London, England), 389(10082), 1907–1918, doi:10.1016/S0140-6736(17)30505-6, 2017.
Colette, A., Andersson, C., Baklanov, A., Bessagnet, B., Brandt, J., Christensen, J. H., Doherty, R., Engardt, M., Geels, C., Giannakopoulos,
C., Hedegaard, G. B., Katragkou, E., Langner, J., Lei, H., Manders, A., Melas, D., Meleux, F., Rouïl, L., Sofiev, M., Soares, J., Stevenson,
D. S., Tombrou-Tzella, M., Varotsos, K. V and Young, P.: Is the ozone climate penalty robust in Europe?, Environ. Res. Lett., 10(8), 084015,
doi:10.1088/1748-9326/10/8/084015, 2015. 910
Collins, J. W., Lamarque, J. F., Schulz, M., Boucher, O., Eyring, V., Hegglin, I. M., Maycock, A., Myhre, G., Prather, M., Shindell, D. and
Smith, J. S.: AerChemMIP: Quantifying the effects of chemistry and aerosols in CMIP6, Geosci. Model Dev., 10(2), 585–607,
doi:10.5194/gmd-10-585-2017, 2017.
Danabasoglu, G.: NCAR CESM2-WACCM model output prepared for CMIP6 AerChemMIP, , doi:10.22033/ESGF/CMIP6.10023, 2019a.
Danabasoglu, G.: NCAR CESM2-WACCM model output prepared for CMIP6 CMIP, , doi:10.22033/ESGF/CMIP6.10024, 2019b. 915
Danabasoglu, G.: NCAR CESM2-WACCM model output prepared for CMIP6 ScenarioMIP, , doi:10.22033/ESGF/CMIP6.10026, 2019c.
Doherty, R. M., Wild, O., Shindell, D. T., Zeng, G., MacKenzie, I. A., Collins, W. J., Fiore, A. M., Stevenson, D. S., Dentener, F. J., Schultz,
M. G., Hess, P., Derwent, R. G. and Keating, T. J.: Impacts of climate change on surface ozone and intercontinental ozone pollution: A
multi-model study, J. Geophys. Res. Atmos., 118(9), 3744–3763, doi:10.1002/jgrd.50266, 2013.
Dunne, J. P., Horowitz, L. W., Adcroft, A. J., Ginoux, P., Held, I. M., John, J. G., Krasting, J. P., Malyshev, S., Naik, V., Paulot, F., 920
Shevliakova, E., Stock, C. A., Zadeh, N., Balaji, V., Blanton, C., Dunne, K. A., Dupuis, C., Durachta, J., Dussin, R., Gauthier, P. P. G.,
Griffies, S. M., Guo, H., Hallberg, R. W., Harrison, M., He, J., Hurlin, W., McHugh, C., Menzel, R., Milly, P. C. D., Nikonov, S., Paynter,
D. J., Ploshay, J., Radhakrishnan, A., Rand, K., Reichl, B. G., Robinson, T., Schwarzkopf, D. M., Sentman, L. T., Underwood, S.,
Vahlenkamp, H., Winton, M., Wittenberg, A. T., Wyman, B., Zeng, Y. and Zhao, M.: The GFDL Earth System Model version 4.1 (GFDL-
ESM4.1): Model 1 description and simulation characteristics, J. Adv. Model. Earth Syst., Submitted, 2020. 925
Emmons, L. K., Schwantes, R. H., Orlando, J. J., Tyndall, G., Kinnison, D., Lamarque, J., Marsh, D., Mills, M. J., Tilmes, S., Bardeen, C.,
Buchholz, R. R., Conley, A., Gettelman, A., Garcia, R., Simpson, I., Blake, D. R., Meinardi, S. and Pétron, G.: The Chemistry Mechanism
in the Community Earth System Model Version 2 (CESM2), J. Adv. Model. Earth Syst., 12(4), 1–21, doi:10.1029/2019ms001882, 2020.
Eyring, V., Bony, S., Meehl, G. A., Senior, C. A., Stevens, B., Stouffer, R. J. and Taylor, K. E.: Overview of the Coupled Model
Intercomparison Project Phase 6 (CMIP6) experimental design and organization, Geosci. Model Dev., 9(5), 1937–1958, doi:10.5194/gmd-930
9-1937-2016, 2016.
Fagerli, H. and Aas, W.: Trends of nitrogen in air and precipitation: Model results and observations at EMEP sites in Europe, 1980–2003,
Environ. Pollut., 154(3), 448–461 [online] Available from: http://www.sciencedirect.com/science/article/pii/S0269749108000523
(Accessed 9 December 2013), 2008.
Fiore, A. M., Jacob, D. J., Field, B. D., Streets, D. G., Fernandes, S. D. and Jang, C.: Linking ozone pollution and climate change: The case 935
for controlling methane, Geophys. Res. Lett., 29(19), 25–1, doi:10.1029/2002GL015601, 2002.
Fiore, A. M., Naik, V., Spracklen, D. V, Steiner, A., Unger, N., Prather, M., Bergmann, D., Cameron-Smith, P. J., Cionni, I., Collins, W. J.,
Dalsøren, S., Eyring, V., Folberth, G. a, Ginoux, P., Horowitz, L. W., Josse, B., Lamarque, J.-F., MacKenzie, I. a, Nagashima, T., O’Connor,
F. M., Righi, M., Rumbold, S. T., Shindell, D. T., Skeie, R. B., Sudo, K., Szopa, S., Takemura, T. and Zeng, G.: Global air quality and
climate., Chem. Soc. Rev., 41(19), 6663–83, doi:10.1039/c2cs35095e, 2012. 940
Forster, P. M., Maycock, A. C., McKenna, C. M. and Smith, C. J.: Latest climate models confirm need for urgent mitigation, Nat. Clim.
Chang., 1–4, doi:10.1038/s41558-019-0660-0, 2019.
Fortems-Cheiney, A., Foret, G., Siour, G., Vautard, R., Szopa, S., Dufour, G., Colette, A., Lacressonniere, G. and Beekmann, M.: A 3 °C
global RCP8.5 emission trajectory cancels benefits of European emission reductions on air quality, Nat. Commun., 8(89), 1–5,
35
doi:10.1038/s41467-017-00075-9, 2017. 945
Fowler, D., Pilegaard, K., Sutton, M. A., Ambus, P., Raivonen, M., Duyzer, J., Simpson, D., Fagerli, H., Fuzzi, S., Schjoerring, J. K., Granier,
C., Neftel, A., Isaksen, I. S. A., Laj, P., Maione, M., Monks, P. S., Burkhardt, J., Daemmgen, U., Neirynck, J., Personne, E., Wichink-Kruit,
R., Butterbach-Bahl, K., Flechard, C., Tuovinen, J. P., Coyle, M., Gerosa, G., Loubet, B., Altimir, N., Gruenhage, L., Ammann, C., Cieslik,
S., Paoletti, E., Mikkelsen, T. N., Ro-Poulsen, H., Cellier, P., Cape, J. N., Horváth, L., Loreto, F., Niinemets, Ü., Palmer, P. I., Rinne, J.,
Misztal, P., Nemitz, E., Nilsson, D., Pryor, S., Gallagher, M. W., Vesala, T., Skiba, U., Brüggemann, N., Zechmeister-Boltenstern, S., 950
Williams, J., O’Dowd, C., Facchini, M. C., de Leeuw, G., Flossman, A., Chaumerliac, N. and Erisman, J. W.: Atmospheric composition
change: Ecosystems–Atmosphere interactions, Atmos. Environ., 43(33), 5193–5267, doi:10.1016/j.atmosenv.2009.07.068, 2009.
Gao, Y., Fu, J. S., Drake, J. B., Lamarque, J.-F. and Liu, Y.: The impact of emission and climate change on ozone in the United States under
representative concentration pathways (RCPs), Atmos. Chem. Phys., 13(18), 9607–9621, doi:10.5194/acp-13-9607-2013, 2013.
Gettelman, A., Mills, M. J., Kinnison, D. E., Garcia, R. R., Smith, A. K., Marsh, D. R., Tilmes, S., Vitt, F., Bardeen, C. G., McInerny, J., 955
Liu, H. L., Solomon, S. C., Polvani, L. M., Emmons, L. K., Lamarque, J. F., Richter, J. H., Glanville, A. S., Bacmeister, J. T., Phillips, A.
S., Neale, R. B., Simpson, I. R., DuVivier, A. K., Hodzic, A. and Randel, W. J.: The Whole Atmosphere Community Climate Model Version
6 (WACCM6), J. Geophys. Res. Atmos., 124(23), 12380–12403, doi:10.1029/2019JD030943, 2019.
Gidden, M. J., Riahi, K., Smith, S. J., Fujimori, S., Luderer, G., Kriegler, E., van Vuuren, D. P., van den Berg, M., Feng, L., Klein, D.,
Calvin, K., Doelman, J. C., Frank, S., Fricko, O., Harmsen, M., Hasegawa, T., Havlik, P., Hilaire, J., Hoesly, R., Horing, J., Popp, A., 960
Stehfest, E. and Takahashi, K.: Global emissions pathways under different socioeconomic scenarios for use in CMIP6: a dataset of
harmonized emissions trajectories through the end of the century, Geosci. Model Dev., 12(4), 1443–1475, doi:10.5194/gmd-12-1443-2019,
2019.
Glotfelty, T., He, J. and Zhang, Y.: Impact of future climate policy scenarios on air quality and aerosol-cloud interactions using an advanced
version of CESM/CAM5: Part I. model evaluation for the current decadal simulations, Atmos. Environ., 152, 222–239, 965
doi:10.1016/J.ATMOSENV.2016.12.035, 2017.
Good, P.: MOHC HadGEM3-GC31-LL model output prepared for CMIP6 ScenarioMIP, , doi:10.22033/ESGF/CMIP6.10845, 2019.
Good, P., Sellar, A., Tang, Y., Rumbold, S., Ellis, R., Kelley, D., Kuhlbrodt, T. and Walton, J.: MOHC UKESM1.0-LL model output
prepared for CMIP6 ScenarioMIP, , doi:10.22033/ESGF/CMIP6.1567, 2019.
Griffiths, P. T., Murray, L. T., Zeng, G., Archibald, A. T., Emmons, L. K., Galbally, I., Hassler, B., Horowitz, L. W., Keeble, J., Liu, J., 970
Moeini, O., Naik, V., O’Connor, F. M., Shin, Y. M., Tarasick, D., Tilmes, S., Turnock, S. T., Wild, O., Young, P. J. and Zanis, P.:
Tropospheric ozone in CMIP6 Simulations, Atmos. Chem. Phys. Discuss., (February), doi:https://doi.org/10.5194/acp-2019-1216, 2020.
Hajima, T. and Kawamiya, M.: MIROC MIROC-ES2L model output prepared for CMIP6 CMIP, , doi:10.22033/ESGF/CMIP6.902, 2019.
Hajima, T., Watanabe, M., Yamamoto, A., Tatebe, H., Noguchi, A., Abe, M., Ohgaito, R., Ito, A., Yamazaki, D., Ito, A., Takata, K., Ogochi,
K. and Watanabe, S.: Description of the MIROC-ES2L Earth system model and evaluation of its climate – biogeochemical processes and 975
feedbacks, Geosci. Model Dev. Discuss., 5(October), 2019.
Hoesly, R. M., Smith, S. J., Feng, L., Klimont, Z., Janssens-Maenhout, G., Pitkanen, T., Seibert, J. J., Vu, L., Andres, R. J., Bolt, R. M.,
Bond, T. C., Dawidowski, L., Kholod, N., Kurokawa, J., Li, M., Liu, L., Lu, Z., Moura, M. C. P., O&apos;Rourke, P. R. and Zhang,
Q.: Historical (1750–2014) anthropogenic emissions of reactive gases and aerosols from the Community Emissions Data System (CEDS),
Geosci. Model Dev., 11(1), 369–408, doi:10.5194/gmd-11-369-2018, 2018. 980
Horowitz, L. W., Naik, V., Sentman, L. T., Paulot, F., Blanton, C., McHugh, C., Radhakrishnan, A., Rand, K., Vahlenkamp, H., Zadeh, N.
T., Wilson, C., Ginoux, P., He, J., John, J. G., Lin, M., Paynter, D. J., Ploshay, J., Zhang, A. and Zeng, Y.: NOAA-GFDL GFDL-ESM4
model output prepared for CMIP6 AerChemMIP ssp370-lowNTCF, , Version 20180701, Earth System Grid Federation,
doi:10.22033/ESGF/CMIP6.8693, 2018.
Horowitz, L. W., Naik, V., Paulot, F., Ginoux, P. A., Dunne, J. P., Mao, J., Schnell, J., Chen, X., He, J., John, J. G., Lin, M., Lin, P., 985
Malyshev, S., Paynter, D., Shevliakova, E. and Zhao, M.: The GFDL Global Atmospheric Chemistry-Climate Model AM4.1: Model
Description and Simulation Characteristics, J. Adv. Model. Earth Syst., Submitted, 2019.
Im, U., Christensen, J. H., Geels, C., Hansen, K. M., Brandt, J., Solazzo, E., Alyuz, U., Balzarini, A., Baro, R., Bellasio, R., Bianconi, R.,
Bieser, J., Colette, A., Curci, G., Farrow, A., Flemming, J., Fraser, A., Jimenez-Guerrero, P., Kitwiroon, N., Liu, P., Nopmongcol, U.,
Palacios-Peña, L., Pirovano, G., Pozzoli, L., Prank, M., Rose, R., Sokhi, R., Tuccella, P., Unal, A., Vivanco, M. G., Yarwood, G., Hogrefe, 990
C. and Galmarini, S.: Influence of anthropogenic emissions and boundary conditions on multi-model simulations of major air pollutants over
Europe and North America in the framework of AQMEII3, Atmos. Chem. Phys., 18(12), 8929–8952, doi:10.5194/acp-18-8929-2018, 2018.
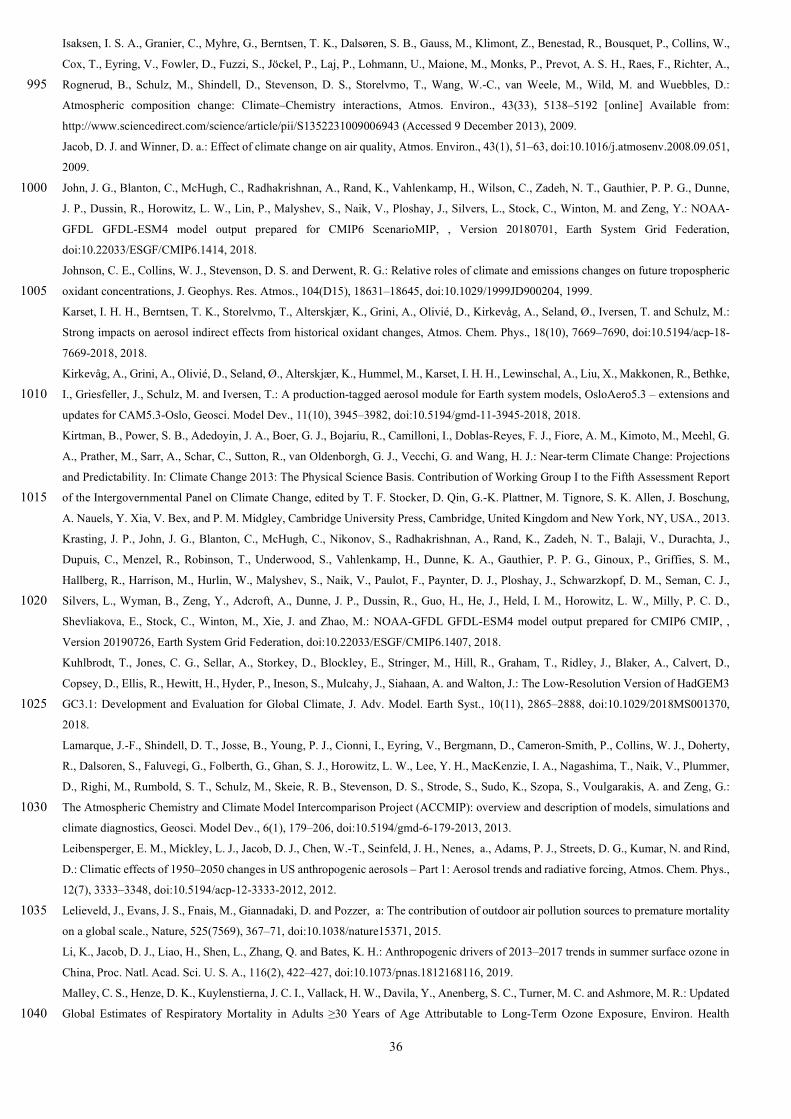
36
Isaksen, I. S. A., Granier, C., Myhre, G., Berntsen, T. K., Dalsøren, S. B., Gauss, M., Klimont, Z., Benestad, R., Bousquet, P., Collins, W.,
Cox, T., Eyring, V., Fowler, D., Fuzzi, S., Jöckel, P., Laj, P., Lohmann, U., Maione, M., Monks, P., Prevot, A. S. H., Raes, F., Richter, A.,
Rognerud, B., Schulz, M., Shindell, D., Stevenson, D. S., Storelvmo, T., Wang, W.-C., van Weele, M., Wild, M. and Wuebbles, D.: 995
Atmospheric composition change: Climate–Chemistry interactions, Atmos. Environ., 43(33), 5138–5192 [online] Available from:
http://www.sciencedirect.com/science/article/pii/S1352231009006943 (Accessed 9 December 2013), 2009.
Jacob, D. J. and Winner, D. a.: Effect of climate change on air quality, Atmos. Environ., 43(1), 51–63, doi:10.1016/j.atmosenv.2008.09.051,
2009.
John, J. G., Blanton, C., McHugh, C., Radhakrishnan, A., Rand, K., Vahlenkamp, H., Wilson, C., Zadeh, N. T., Gauthier, P. P. G., Dunne, 1000
J. P., Dussin, R., Horowitz, L. W., Lin, P., Malyshev, S., Naik, V., Ploshay, J., Silvers, L., Stock, C., Winton, M. and Zeng, Y.: NOAA-
GFDL GFDL-ESM4 model output prepared for CMIP6 ScenarioMIP, , Version 20180701, Earth System Grid Federation,
doi:10.22033/ESGF/CMIP6.1414, 2018.
Johnson, C. E., Collins, W. J., Stevenson, D. S. and Derwent, R. G.: Relative roles of climate and emissions changes on future tropospheric
oxidant concentrations, J. Geophys. Res. Atmos., 104(D15), 18631–18645, doi:10.1029/1999JD900204, 1999. 1005
Karset, I. H. H., Berntsen, T. K., Storelvmo, T., Alterskjær, K., Grini, A., Olivié, D., Kirkevåg, A., Seland, Ø., Iversen, T. and Schulz, M.:
Strong impacts on aerosol indirect effects from historical oxidant changes, Atmos. Chem. Phys., 18(10), 7669–7690, doi:10.5194/acp-18-
7669-2018, 2018.
Kirkevåg, A., Grini, A., Olivié, D., Seland, Ø., Alterskjær, K., Hummel, M., Karset, I. H. H., Lewinschal, A., Liu, X., Makkonen, R., Bethke,
I., Griesfeller, J., Schulz, M. and Iversen, T.: A production-tagged aerosol module for Earth system models, OsloAero5.3 – extensions and 1010
updates for CAM5.3-Oslo, Geosci. Model Dev., 11(10), 3945–3982, doi:10.5194/gmd-11-3945-2018, 2018.
Kirtman, B., Power, S. B., Adedoyin, J. A., Boer, G. J., Bojariu, R., Camilloni, I., Doblas-Reyes, F. J., Fiore, A. M., Kimoto, M., Meehl, G.
A., Prather, M., Sarr, A., Schar, C., Sutton, R., van Oldenborgh, G. J., Vecchi, G. and Wang, H. J.: Near-term Climate Change: Projections
and Predictability. In: Climate Change 2013: The Physical Science Basis. Contribution of Working Group I to the Fifth Assessment Report
of the Intergovernmental Panel on Climate Change, edited by T. F. Stocker, D. Qin, G.-K. Plattner, M. Tignore, S. K. Allen, J. Boschung, 1015
A. Nauels, Y. Xia, V. Bex, and P. M. Midgley, Cambridge University Press, Cambridge, United Kingdom and New York, NY, USA., 2013.
Krasting, J. P., John, J. G., Blanton, C., McHugh, C., Nikonov, S., Radhakrishnan, A., Rand, K., Zadeh, N. T., Balaji, V., Durachta, J.,
Dupuis, C., Menzel, R., Robinson, T., Underwood, S., Vahlenkamp, H., Dunne, K. A., Gauthier, P. P. G., Ginoux, P., Griffies, S. M.,
Hallberg, R., Harrison, M., Hurlin, W., Malyshev, S., Naik, V., Paulot, F., Paynter, D. J., Ploshay, J., Schwarzkopf, D. M., Seman, C. J.,
Silvers, L., Wyman, B., Zeng, Y., Adcroft, A., Dunne, J. P., Dussin, R., Guo, H., He, J., Held, I. M., Horowitz, L. W., Milly, P. C. D., 1020
Shevliakova, E., Stock, C., Winton, M., Xie, J. and Zhao, M.: NOAA-GFDL GFDL-ESM4 model output prepared for CMIP6 CMIP, ,
Version 20190726, Earth System Grid Federation, doi:10.22033/ESGF/CMIP6.1407, 2018.
Kuhlbrodt, T., Jones, C. G., Sellar, A., Storkey, D., Blockley, E., Stringer, M., Hill, R., Graham, T., Ridley, J., Blaker, A., Calvert, D.,
Copsey, D., Ellis, R., Hewitt, H., Hyder, P., Ineson, S., Mulcahy, J., Siahaan, A. and Walton, J.: The Low‐Resolution Version of HadGEM3
GC3.1: Development and Evaluation for Global Climate, J. Adv. Model. Earth Syst., 10(11), 2865–2888, doi:10.1029/2018MS001370, 1025
2018.
Lamarque, J.-F., Shindell, D. T., Josse, B., Young, P. J., Cionni, I., Eyring, V., Bergmann, D., Cameron-Smith, P., Collins, W. J., Doherty,
R., Dalsoren, S., Faluvegi, G., Folberth, G., Ghan, S. J., Horowitz, L. W., Lee, Y. H., MacKenzie, I. A., Nagashima, T., Naik, V., Plummer,
D., Righi, M., Rumbold, S. T., Schulz, M., Skeie, R. B., Stevenson, D. S., Strode, S., Sudo, K., Szopa, S., Voulgarakis, A. and Zeng, G.:
The Atmospheric Chemistry and Climate Model Intercomparison Project (ACCMIP): overview and description of models, simulations and 1030
climate diagnostics, Geosci. Model Dev., 6(1), 179–206, doi:10.5194/gmd-6-179-2013, 2013.
Leibensperger, E. M., Mickley, L. J., Jacob, D. J., Chen, W.-T., Seinfeld, J. H., Nenes, a., Adams, P. J., Streets, D. G., Kumar, N. and Rind,
D.: Climatic effects of 1950–2050 changes in US anthropogenic aerosols – Part 1: Aerosol trends and radiative forcing, Atmos. Chem. Phys.,
12(7), 3333–3348, doi:10.5194/acp-12-3333-2012, 2012.
Lelieveld, J., Evans, J. S., Fnais, M., Giannadaki, D. and Pozzer, a: The contribution of outdoor air pollution sources to premature mortality 1035
on a global scale., Nature, 525(7569), 367–71, doi:10.1038/nature15371, 2015.
Li, K., Jacob, D. J., Liao, H., Shen, L., Zhang, Q. and Bates, K. H.: Anthropogenic drivers of 2013–2017 trends in summer surface ozone in
China, Proc. Natl. Acad. Sci. U. S. A., 116(2), 422–427, doi:10.1073/pnas.1812168116, 2019.
Malley, C. S., Henze, D. K., Kuylenstierna, J. C. I., Vallack, H. W., Davila, Y., Anenberg, S. C., Turner, M. C. and Ashmore, M. R.: Updated
Global Estimates of Respiratory Mortality in Adults ≥30 Years of Age Attributable to Long-Term Ozone Exposure, Environ. Health 1040
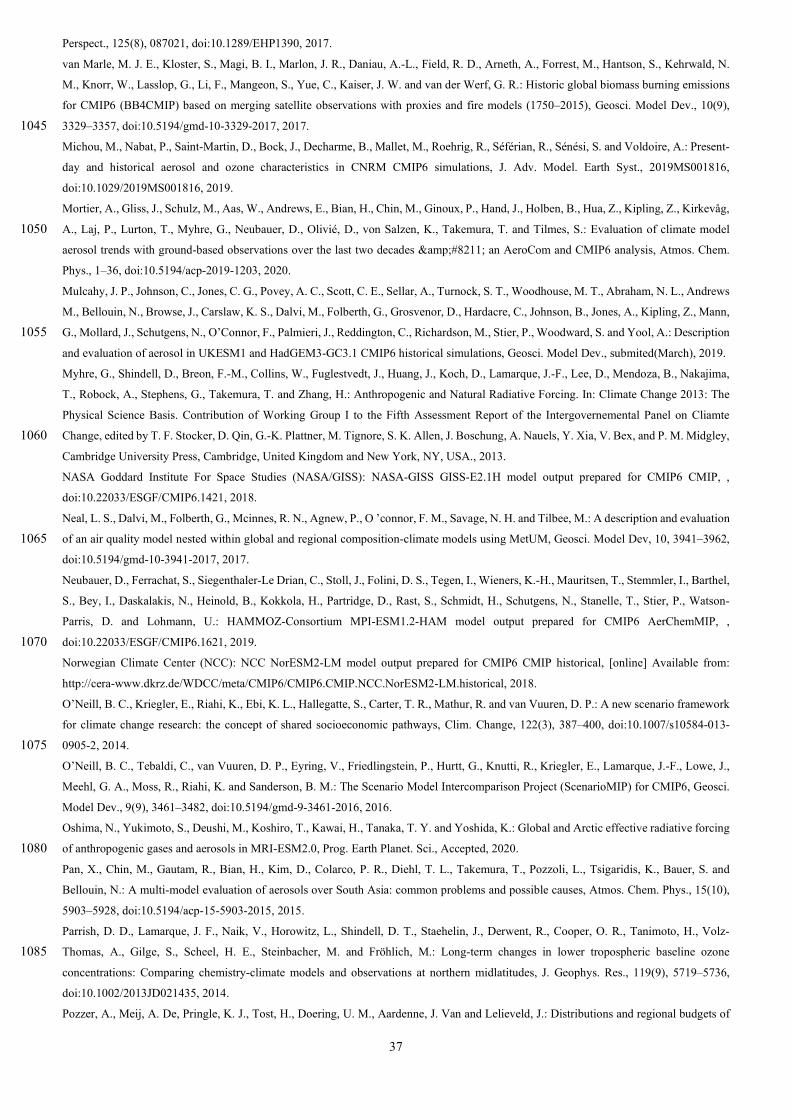
37
Perspect., 125(8), 087021, doi:10.1289/EHP1390, 2017.
van Marle, M. J. E., Kloster, S., Magi, B. I., Marlon, J. R., Daniau, A.-L., Field, R. D., Arneth, A., Forrest, M., Hantson, S., Kehrwald, N.
M., Knorr, W., Lasslop, G., Li, F., Mangeon, S., Yue, C., Kaiser, J. W. and van der Werf, G. R.: Historic global biomass burning emissions
for CMIP6 (BB4CMIP) based on merging satellite observations with proxies and fire models (1750–2015), Geosci. Model Dev., 10(9),
3329–3357, doi:10.5194/gmd-10-3329-2017, 2017. 1045
Michou, M., Nabat, P., Saint‐Martin, D., Bock, J., Decharme, B., Mallet, M., Roehrig, R., Séférian, R., Sénési, S. and Voldoire, A.: Present‐
day and historical aerosol and ozone characteristics in CNRM CMIP6 simulations, J. Adv. Model. Earth Syst., 2019MS001816,
doi:10.1029/2019MS001816, 2019.
Mortier, A., Gliss, J., Schulz, M., Aas, W., Andrews, E., Bian, H., Chin, M., Ginoux, P., Hand, J., Holben, B., Hua, Z., Kipling, Z., Kirkevåg,
A., Laj, P., Lurton, T., Myhre, G., Neubauer, D., Olivié, D., von Salzen, K., Takemura, T. and Tilmes, S.: Evaluation of climate model 1050
aerosol trends with ground-based observations over the last two decades &#8211; an AeroCom and CMIP6 analysis, Atmos. Chem.
Phys., 1–36, doi:10.5194/acp-2019-1203, 2020.
Mulcahy, J. P., Johnson, C., Jones, C. G., Povey, A. C., Scott, C. E., Sellar, A., Turnock, S. T., Woodhouse, M. T., Abraham, N. L., Andrews
M., Bellouin, N., Browse, J., Carslaw, K. S., Dalvi, M., Folberth, G., Grosvenor, D., Hardacre, C., Johnson, B., Jones, A., Kipling, Z., Mann,
G., Mollard, J., Schutgens, N., O’Connor, F., Palmieri, J., Reddington, C., Richardson, M., Stier, P., Woodward, S. and Yool, A.: Description 1055
and evaluation of aerosol in UKESM1 and HadGEM3-GC3.1 CMIP6 historical simulations, Geosci. Model Dev., submited(March), 2019.
Myhre, G., Shindell, D., Breon, F.-M., Collins, W., Fuglestvedt, J., Huang, J., Koch, D., Lamarque, J.-F., Lee, D., Mendoza, B., Nakajima,
T., Robock, A., Stephens, G., Takemura, T. and Zhang, H.: Anthropogenic and Natural Radiative Forcing. In: Climate Change 2013: The
Physical Science Basis. Contribution of Working Group I to the Fifth Assessment Report of the Intergovernemental Panel on Cliamte
Change, edited by T. F. Stocker, D. Qin, G.-K. Plattner, M. Tignore, S. K. Allen, J. Boschung, A. Nauels, Y. Xia, V. Bex, and P. M. Midgley, 1060
Cambridge University Press, Cambridge, United Kingdom and New York, NY, USA., 2013.
NASA Goddard Institute For Space Studies (NASA/GISS): NASA-GISS GISS-E2.1H model output prepared for CMIP6 CMIP, ,
doi:10.22033/ESGF/CMIP6.1421, 2018.
Neal, L. S., Dalvi, M., Folberth, G., Mcinnes, R. N., Agnew, P., O ’connor, F. M., Savage, N. H. and Tilbee, M.: A description and evaluation
of an air quality model nested within global and regional composition-climate models using MetUM, Geosci. Model Dev, 10, 3941–3962, 1065
doi:10.5194/gmd-10-3941-2017, 2017.
Neubauer, D., Ferrachat, S., Siegenthaler-Le Drian, C., Stoll, J., Folini, D. S., Tegen, I., Wieners, K.-H., Mauritsen, T., Stemmler, I., Barthel,
S., Bey, I., Daskalakis, N., Heinold, B., Kokkola, H., Partridge, D., Rast, S., Schmidt, H., Schutgens, N., Stanelle, T., Stier, P., Watson-
Parris, D. and Lohmann, U.: HAMMOZ-Consortium MPI-ESM1.2-HAM model output prepared for CMIP6 AerChemMIP, ,
doi:10.22033/ESGF/CMIP6.1621, 2019. 1070
Norwegian Climate Center (NCC): NCC NorESM2-LM model output prepared for CMIP6 CMIP historical, [online] Available from:
http://cera-www.dkrz.de/WDCC/meta/CMIP6/CMIP6.CMIP.NCC.NorESM2-LM.historical, 2018.
O’Neill, B. C., Kriegler, E., Riahi, K., Ebi, K. L., Hallegatte, S., Carter, T. R., Mathur, R. and van Vuuren, D. P.: A new scenario framework
for climate change research: the concept of shared socioeconomic pathways, Clim. Change, 122(3), 387–400, doi:10.1007/s10584-013-
0905-2, 2014. 1075
O’Neill, B. C., Tebaldi, C., van Vuuren, D. P., Eyring, V., Friedlingstein, P., Hurtt, G., Knutti, R., Kriegler, E., Lamarque, J.-F., Lowe, J.,
Meehl, G. A., Moss, R., Riahi, K. and Sanderson, B. M.: The Scenario Model Intercomparison Project (ScenarioMIP) for CMIP6, Geosci.
Model Dev., 9(9), 3461–3482, doi:10.5194/gmd-9-3461-2016, 2016.
Oshima, N., Yukimoto, S., Deushi, M., Koshiro, T., Kawai, H., Tanaka, T. Y. and Yoshida, K.: Global and Arctic effective radiative forcing
of anthropogenic gases and aerosols in MRI-ESM2.0, Prog. Earth Planet. Sci., Accepted, 2020. 1080
Pan, X., Chin, M., Gautam, R., Bian, H., Kim, D., Colarco, P. R., Diehl, T. L., Takemura, T., Pozzoli, L., Tsigaridis, K., Bauer, S. and
Bellouin, N.: A multi-model evaluation of aerosols over South Asia: common problems and possible causes, Atmos. Chem. Phys., 15(10),
5903–5928, doi:10.5194/acp-15-5903-2015, 2015.
Parrish, D. D., Lamarque, J. F., Naik, V., Horowitz, L., Shindell, D. T., Staehelin, J., Derwent, R., Cooper, O. R., Tanimoto, H., Volz-
Thomas, A., Gilge, S., Scheel, H. E., Steinbacher, M. and Fröhlich, M.: Long-term changes in lower tropospheric baseline ozone 1085
concentrations: Comparing chemistry-climate models and observations at northern midlatitudes, J. Geophys. Res., 119(9), 5719–5736,
doi:10.1002/2013JD021435, 2014.
Pozzer, A., Meij, A. De, Pringle, K. J., Tost, H., Doering, U. M., Aardenne, J. Van and Lelieveld, J.: Distributions and regional budgets of

38
aerosols and their precursors simulated with the EMAC chemistry-climate model, Atmos. Chem. Phys., 12, 961–987, doi:10.5194/acp-12-
961-2012, 2012. 1090
Pozzoli, L., Janssens-Maenhout, G., Diehl, T., Bey, I., Schultz, M. G., Feichter, J., Vignati, E. and Dentener, F.: Re-analysis of tropospheric
sulfate aerosol and ozone for the period 1980–2005 using the aerosol-chemistry-climate model ECHAM5-HAMMOZ, Atmos. Chem. Phys.,
11(18), 9563–9594, doi:10.5194/acp-11-9563-2011, 2011.
Provençal, S., Buchard, V., da Silva, A. M., Leduc, R., Barrette, N., Elhacham, E. and Wang, S.-H.: Evaluation of PM2.5 surface
concentration simulated by Version 1 of the NASA’s MERRA Aerosol Reanalysis over Israel and Taiwan., Aerosol air Qual. Res., 17(1), 1095
253–261, doi:10.4209/aaqr.2016.04.0145, 2017.
Randles, C. A., da Silva, A. M., Buchard, V., Colarco, P. R., Darmenov, A., Govindaraju, R., Smirnov, A., Holben, B., Ferrare, R., Hair, J.,
Shinozuka, Y., Flynn, C. J., Randles, C. A., Silva, A. M. da, Buchard, V., Colarco, P. R., Darmenov, A., Govindaraju, R., Smirnov, A.,
Holben, B., Ferrare, R., Hair, J., Shinozuka, Y. and Flynn, C. J.: The MERRA-2 Aerosol Reanalysis, 1980 Onward. Part I: System
Description and Data Assimilation Evaluation, J. Clim., 30(17), 6823–6850, doi:10.1175/JCLI-D-16-0609.1, 2017. 1100
Rao, S., Klimont, Z., Leitao, J., Riahi, K., Van Dingenen, R., Reis, L. A., Calvin, K., Dentener, F., Drouet, L., Fujimori, S., Harmsen, M.,
Luderer, G., Heyes, C., Strefler, J., Tavoni, M. and Van Vuuren, D. P.: A multi-model assessment of the co-benefits of climate mitigation
for global air quality, Environ. Res. Lett., 11(12), 124013, doi:10.1088/1748-9326/11/12/124013, 2016.
Rao, S., Klimont, Z., Smith, S. J., Dingenen, R. Van, Dentener, F., Bouwman, L., Riahi, K., Amann, M., Bodirsky, B. L., Van Vuuren, D.
P., Reis, L. A., Calvin, K., Drouet, L., Fricko, O., Fujimori, S., Gernaat, D., Havlik, P., Harmsen, M., Hasegawa, T., Heyes, C., Hilaire, J., 1105
Luderer, G., Masui, T., Stehfest, E., Strefler, J., Van Der Sluis, S. and Tavoni, M.: Future air pollution in the Shared Socio-economic
Pathways, Glob. Environ. Chang., 42, 346–358, doi:10.1016/j.gloenvcha.2016.05.012, 2017.
Rasmussen, D. J., Hu, J., Mahmud, A. and Kleeman, J. M.: The Ozone Climate Penalty: past, present and future, Environ. Sci. Technol.,
47(24), 14258–14266, doi:10.1109/TMI.2012.2196707.Separate, 2013.
Reddington, C. L., Carslaw, K. S., Stier, P., Schutgens, N., Coe, H., Liu, D., Allan, J., Browse, J., Pringle, K. J., Lee, L. A., Yoshioka, M., 1110
Johnson, J. S., Regayre, L. A., Spracklen, D. V., Mann, G. W., Clarke, A., Hermann, M., Henning, S., Wex, H., Kristensen, T. B., Leaitch,
W. R., Pöschl, U., Rose, D., Andreae, M. O., Schmale, J., Kondo, Y., Oshima, N., Schwarz, J. P., Nenes, A., Anderson, B., Roberts, G. C.,
Snider, J. R., Leck, C., Quinn, P. K., Chi, X., Ding, A., Jimenez, J. L. and Zhang, Q.: The global aerosol synthesis and science project
(GASSP): Measurements and modeling to reduce uncertainty, Bull. Am. Meteorol. Soc., 98(9), 1857–1877, doi:10.1175/BAMS-D-15-
00317.1, 2017. 1115
Reis, L. A., Drouet, L., van Dingenen, R. and Emmerling, J.: Future global air quality indices under different socioeconomic and climate
assumptions, Sustain., 10(10), 1–27, doi:10.3390/su10103645, 2018.
Riahi, K., Van Vuuren, D. P., Kriegler, E., Edmonds, J., O ’neill, B. C., Fujimori, S., Bauer, N., Calvin, K., Dellink, R., Fricko, O., Lutz,
W., Popp, A., Cuaresma, J. C., Kc, S., Leimbach, M., Jiang, L., Kram, T., Rao, S., Emmerling, J., Ebi, K., Hasegawa, T., Havlik, P.,
Humpenöder, F., Aleluia, L., Silva, D., Smith, S., Stehfest, E., Bosetti, V., Eom, J., Gernaat, D., Masui, T., Rogelj, J., Strefler, J., Drouet, 1120
L., Krey, V., Luderer, G., Harmsen, M., Takahashi, K., Baumstark, L., Doelman, J. C., Kainuma, M., Klimont, Z., Marangoni, G., Lotze-
Campen, H., Obersteiner, M., Tabeau, A. and Tavoni, M.: The Shared Socioeconomic Pathways and their energy, land use, and greenhouse
gas emissions implications: An overview, Glob. Environ. Chang., 42, 153–168, doi:10.1016/j.gloenvcha.2016.05.009, 2017.
Ridley, J., Menary, M., Kuhlbrodt, T., Andrews, M. and Andrews, T.: MOHC HadGEM3-GC31-LL model output prepared for CMIP6
CMIP, , doi:10.22033/ESGF/CMIP6.419, 2018. 1125
Schultz, M. G., Schröder, S., Lyapina, O., Cooper, O., Galbally, I., Petropavlovskikh, I., Von Schneidemesser, E., Tanimoto, H., Elshorbany,
Y., Naja, M., Seguel, R., Dauert, U., Eckhardt, P., Feigenspahn, S., Fiebig, M., Hjellbrekke, A.-G., Hong, Y.-D., Christian Kjeld, P., Koide,
H., Lear, G., Tarasick, D., Ueno, M., Wallasch, M., Baumgardner, D., Chuang, M.-T., Gillett, R., Lee, M., Molloy, S., Moolla, R., Wang,
T., Sharps, K., Adame, J. A., Ancellet, G., Apadula, F., Artaxo, P., Barlasina, M., Bogucka, M., Bonasoni, P., Chang, L., Colomb, A.,
Cuevas, E., Cupeiro, M., Degorska, A., Ding, A., Fröhlich, M., Frolova, M., Gadhavi, H., Gheusi, F., Gilge, S., Gonzalez, M. Y., Gros, V., 1130
Hamad, S. H., Helmig, D., Henriques, D., Hermansen, O., Holla, R., Huber, J., Im, U., Jaffe, D. A., Komala, N., Kubistin, D., Lam, K.-S.,
Laurila, T., Lee, H., Levy, I., Mazzoleni, C., Mazzoleni, L., McClure-Begley, A., Mohamad, M., Murovic, M., Navarro-Comas, M., Nicodim,
F., Parrish, D., Read, K. A., Reid, N., Ries, L., Saxena, P., Schwab, J. J., Scorgie, Y., Senik, I., Simmonds, P., Sinha, V., Skorokhod, A.,
Spain, G., Spangl, W., Spoor, R., Springston, S. R., Steer, K., Steinbacher, M., Suharguniyawan, E., Torre, P., Trickl, T., Weili, L., Weller,
R., Xu, X., Xue, L. and Zhiqiang, M.: Tropospheric Ozone Assessment Report: Database and Metrics Data of Global Surface Ozone 1135
Observations, Elem Sci Anth, 5(0), 58, doi:10.1525/elementa.244, 2017.
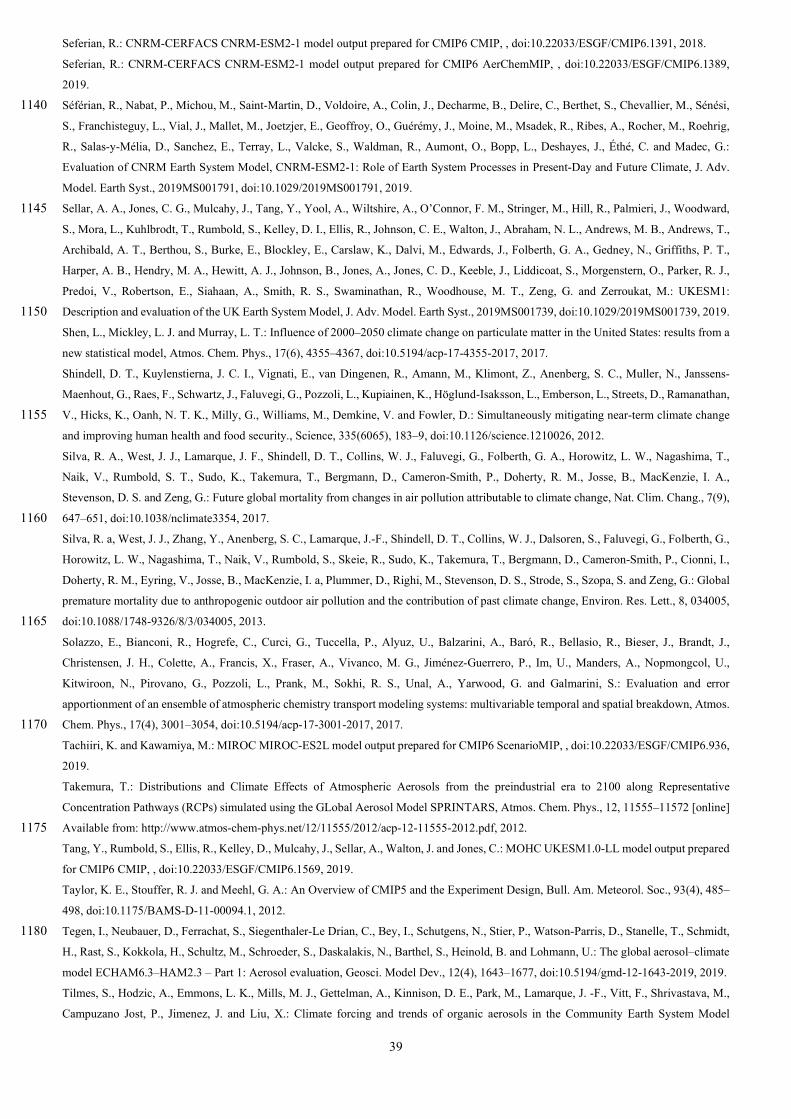
39
Seferian, R.: CNRM-CERFACS CNRM-ESM2-1 model output prepared for CMIP6 CMIP, , doi:10.22033/ESGF/CMIP6.1391, 2018.
Seferian, R.: CNRM-CERFACS CNRM-ESM2-1 model output prepared for CMIP6 AerChemMIP, , doi:10.22033/ESGF/CMIP6.1389,
2019.
Séférian, R., Nabat, P., Michou, M., Saint‐Martin, D., Voldoire, A., Colin, J., Decharme, B., Delire, C., Berthet, S., Chevallier, M., Sénési, 1140
S., Franchisteguy, L., Vial, J., Mallet, M., Joetzjer, E., Geoffroy, O., Guérémy, J., Moine, M., Msadek, R., Ribes, A., Rocher, M., Roehrig,
R., Salas‐y‐Mélia, D., Sanchez, E., Terray, L., Valcke, S., Waldman, R., Aumont, O., Bopp, L., Deshayes, J., Éthé, C. and Madec, G.:
Evaluation of CNRM Earth System Model, CNRM‐ESM2‐1: Role of Earth System Processes in Present‐Day and Future Climate, J. Adv.
Model. Earth Syst., 2019MS001791, doi:10.1029/2019MS001791, 2019.
Sellar, A. A., Jones, C. G., Mulcahy, J., Tang, Y., Yool, A., Wiltshire, A., O’Connor, F. M., Stringer, M., Hill, R., Palmieri, J., Woodward, 1145
S., Mora, L., Kuhlbrodt, T., Rumbold, S., Kelley, D. I., Ellis, R., Johnson, C. E., Walton, J., Abraham, N. L., Andrews, M. B., Andrews, T.,
Archibald, A. T., Berthou, S., Burke, E., Blockley, E., Carslaw, K., Dalvi, M., Edwards, J., Folberth, G. A., Gedney, N., Griffiths, P. T.,
Harper, A. B., Hendry, M. A., Hewitt, A. J., Johnson, B., Jones, A., Jones, C. D., Keeble, J., Liddicoat, S., Morgenstern, O., Parker, R. J.,
Predoi, V., Robertson, E., Siahaan, A., Smith, R. S., Swaminathan, R., Woodhouse, M. T., Zeng, G. and Zerroukat, M.: UKESM1:
Description and evaluation of the UK Earth System Model, J. Adv. Model. Earth Syst., 2019MS001739, doi:10.1029/2019MS001739, 2019. 1150
Shen, L., Mickley, L. J. and Murray, L. T.: Influence of 2000–2050 climate change on particulate matter in the United States: results from a
new statistical model, Atmos. Chem. Phys., 17(6), 4355–4367, doi:10.5194/acp-17-4355-2017, 2017.
Shindell, D. T., Kuylenstierna, J. C. I., Vignati, E., van Dingenen, R., Amann, M., Klimont, Z., Anenberg, S. C., Muller, N., Janssens-
Maenhout, G., Raes, F., Schwartz, J., Faluvegi, G., Pozzoli, L., Kupiainen, K., Höglund-Isaksson, L., Emberson, L., Streets, D., Ramanathan,
V., Hicks, K., Oanh, N. T. K., Milly, G., Williams, M., Demkine, V. and Fowler, D.: Simultaneously mitigating near-term climate change 1155
and improving human health and food security., Science, 335(6065), 183–9, doi:10.1126/science.1210026, 2012.
Silva, R. A., West, J. J., Lamarque, J. F., Shindell, D. T., Collins, W. J., Faluvegi, G., Folberth, G. A., Horowitz, L. W., Nagashima, T.,
Naik, V., Rumbold, S. T., Sudo, K., Takemura, T., Bergmann, D., Cameron-Smith, P., Doherty, R. M., Josse, B., MacKenzie, I. A.,
Stevenson, D. S. and Zeng, G.: Future global mortality from changes in air pollution attributable to climate change, Nat. Clim. Chang., 7(9),
647–651, doi:10.1038/nclimate3354, 2017. 1160
Silva, R. a, West, J. J., Zhang, Y., Anenberg, S. C., Lamarque, J.-F., Shindell, D. T., Collins, W. J., Dalsoren, S., Faluvegi, G., Folberth, G.,
Horowitz, L. W., Nagashima, T., Naik, V., Rumbold, S., Skeie, R., Sudo, K., Takemura, T., Bergmann, D., Cameron-Smith, P., Cionni, I.,
Doherty, R. M., Eyring, V., Josse, B., MacKenzie, I. a, Plummer, D., Righi, M., Stevenson, D. S., Strode, S., Szopa, S. and Zeng, G.: Global
premature mortality due to anthropogenic outdoor air pollution and the contribution of past climate change, Environ. Res. Lett., 8, 034005,
doi:10.1088/1748-9326/8/3/034005, 2013. 1165
Solazzo, E., Bianconi, R., Hogrefe, C., Curci, G., Tuccella, P., Alyuz, U., Balzarini, A., Baró, R., Bellasio, R., Bieser, J., Brandt, J.,
Christensen, J. H., Colette, A., Francis, X., Fraser, A., Vivanco, M. G., Jiménez-Guerrero, P., Im, U., Manders, A., Nopmongcol, U.,
Kitwiroon, N., Pirovano, G., Pozzoli, L., Prank, M., Sokhi, R. S., Unal, A., Yarwood, G. and Galmarini, S.: Evaluation and error
apportionment of an ensemble of atmospheric chemistry transport modeling systems: multivariable temporal and spatial breakdown, Atmos.
Chem. Phys., 17(4), 3001–3054, doi:10.5194/acp-17-3001-2017, 2017. 1170
Tachiiri, K. and Kawamiya, M.: MIROC MIROC-ES2L model output prepared for CMIP6 ScenarioMIP, , doi:10.22033/ESGF/CMIP6.936,
2019.
Takemura, T.: Distributions and Climate Effects of Atmospheric Aerosols from the preindustrial era to 2100 along Representative
Concentration Pathways (RCPs) simulated using the GLobal Aerosol Model SPRINTARS, Atmos. Chem. Phys., 12, 11555–11572 [online]
Available from: http://www.atmos-chem-phys.net/12/11555/2012/acp-12-11555-2012.pdf, 2012. 1175
Tang, Y., Rumbold, S., Ellis, R., Kelley, D., Mulcahy, J., Sellar, A., Walton, J. and Jones, C.: MOHC UKESM1.0-LL model output prepared
for CMIP6 CMIP, , doi:10.22033/ESGF/CMIP6.1569, 2019.
Taylor, K. E., Stouffer, R. J. and Meehl, G. A.: An Overview of CMIP5 and the Experiment Design, Bull. Am. Meteorol. Soc., 93(4), 485–
498, doi:10.1175/BAMS-D-11-00094.1, 2012.
Tegen, I., Neubauer, D., Ferrachat, S., Siegenthaler-Le Drian, C., Bey, I., Schutgens, N., Stier, P., Watson-Parris, D., Stanelle, T., Schmidt, 1180
H., Rast, S., Kokkola, H., Schultz, M., Schroeder, S., Daskalakis, N., Barthel, S., Heinold, B. and Lohmann, U.: The global aerosol–climate
model ECHAM6.3–HAM2.3 – Part 1: Aerosol evaluation, Geosci. Model Dev., 12(4), 1643–1677, doi:10.5194/gmd-12-1643-2019, 2019.
Tilmes, S., Hodzic, A., Emmons, L. K., Mills, M. J., Gettelman, A., Kinnison, D. E., Park, M., Lamarque, J. ‐F., Vitt, F., Shrivastava, M.,
Campuzano Jost, P., Jimenez, J. and Liu, X.: Climate forcing and trends of organic aerosols in the Community Earth System Model
40
(CESM2), J. Adv. Model. Earth Syst., 2019MS001827, doi:10.1029/2019MS001827, 2019. 1185
Tørseth, K., Aas, W., Breivik, K., Fjæraa, a. M., Fiebig, M., Hjellbrekke, a. G., Lund Myhre, C., Solberg, S. and Yttri, K. E.: Introduction
to the European Monitoring and Evaluation Programme (EMEP) and observed atmospheric composition change during 1972–2009, Atmos.
Chem. Phys., 12(12), 5447–5481, doi:10.5194/acp-12-5447-2012, 2012.
Tsigaridis, K., Daskalakis, N., Kanakidou, M., Adams, P. J., Artaxo, P., Bahadur, R., Balkanski, Y., Bauer, S. E., Bellouin, N., Benedetti,
A., Bergman, T., Berntsen, T. K., Beukes, J. P., Bian, H., Carslaw, K. S., Chin, M., Curci, G., Diehl, T., Easter, R. C., Ghan, S. J., Gong, S. 1190
L., Hodzic, A., Hoyle, C. R., Iversen, T., Jathar, S., Jimenez, J. L., Kaiser, J. W., Kirkevåg, A., Koch, D., Kokkola, H., Lee, Y. H., Lin, G.,
Liu, X., Luo, G., Ma, X., Mann, G. W., Mihalopoulos, N., Morcrette, J.-J., Müller, J.-F., Myhre, G., Myriokefalitakis, S., Ng, N. L.,
O’Donnell, D., Penner, J. E., Pozzoli, L., Pringle, K. J., Russell, L. M., Schulz, M., Sciare, J., Seland, Ø., Shindell, D. T., Sillman, S., Skeie,
R. B., Spracklen, D., Stavrakou, T., Steenrod, S. D., Takemura, T., Tiitta, P., Tilmes, S., Tost, H., van Noije, T., van Zyl, P. G., von Salzen,
K., Yu, F., Wang, Z., Zaveri, R. A., Zhang, H., Zhang, K., Zhang, Q. and Zhang, X.: The AeroCom evaluation and intercomparison of 1195
organic aerosol in global models, Atmos. Chem. Phys., 14(19), 10845–10895, doi:10.5194/acp-14-10845-2014, 2014.
Turnock, S. T., Spracklen, D. V., Carslaw, K. S., Mann, G. W., Woodhouse, M. T., Forster, P. M., Haywood, J., Johnson, C. E., Dalvi, M.,
Bellouin, N. and Sanchez-Lorenzo, a.: Modelled and observed changes in aerosols and surface solar radiation over Europe between 1960
and 2009, Atmos. Chem. Phys., 15, 9477–9500, doi:10.5194/acp-15-9477-2015, 2015.
Turnock, S. T., Wild, O., Dentener, F. J., Davila, Y., Emmons, L. K., Flemming, J., Folberth, G. A., Henze, D. K., Jonson, J. E., Keating, T. 1200
J., Kengo, S., Lin, M., Lund, M., Tilmes, S. and O’Connor, F. M.: The impact of future emission policies on tropospheric ozone using a
parameterised approach, Atmos. Chem. Phys., 18(12), 8953–8978, doi:10.5194/acp-18-8953-2018, 2018.
Turnock, S. T., Wild, O., Sellar, A. and O’Connor, F. M.: 300 years of tropospheric ozone changes using CMIP6 scenarios with a
parameterised approach, Atmos. Environ., 213, 686–698, doi:10.1016/J.ATMOSENV.2019.07.001, 2019.
United Nations: Paris Agreement, 2016. 1205
Voldoire, A.: CNRM-CERFACS CNRM-ESM2-1 model output prepared for CMIP6 ScenarioMIP, , doi:10.22033/ESGF/CMIP6.1395,
2019.
van Vuuren, D. P., Kriegler, E., O’Neill, B. C., Ebi, K. L., Riahi, K., Carter, T. R., Edmonds, J., Hallegatte, S., Kram, T., Mathur, R. and
Winkler, H.: A new scenario framework for Climate Change Research: scenario matrix architecture, Clim. Change, 122(3), 373–386,
doi:10.1007/s10584-013-0906-1, 2014. 1210
Weaver, C. P., Liang, X. Z., Zhu, J., Adams, P. J., Amar, P., Avise, J., Caughey, M., Chen, J., Cohen, R. C., Cooter, E., Dawson, J. P.,
Gilliam, R., Gilliland, A., Goldstein, A. H., Grambsch, A., Grano, D., Guenther, A., Gustafson, W. I., Harley, R. A., He, S., Hemming, B.,
Hogrefe, C., Huang, H. C., Hunt, S. W., Jacob, D. J., Kinney, P. L., Kunkel, K., Lamarque, J. F., Lamb, B., Larkin, N. K., Leung, L. R.,
Liao, K. J., Lin, J. T., Lynn, B. H., Manomaiphiboon, K., Mass, C., Mckenzie, D., Mickley, L. J., O’Neill, S. M., Nolte, C., Pandis, S. N.,
Racherla, P. N., Rosenzweig, C., Russell, A. G., Salathé, E., Steiner, A. L., Tagaris, E., Tao, Z., Tonse, S., Wiedinmyer, C., Williams, A., 1215
Winner, D. A., Woo, J. H., Wu, S. and Wuebbles, D. J.: A preliminary synthesis of modeled climate change impacts on U.S. regional ozone
concentrations, Bull. Am. Meteorol. Soc., 90(12), 1843–1863, doi:10.1175/2009BAMS2568.1, 2009.
Westervelt, D. M., Horowitz, L. W., Naik, V., Tai, A. P. K., Fiore, A. M. and Mauzerall, D. L.: Quantifying PM2.5-meteorology sensitivities
in a global climate model, Atmos. Environ., 142, 43–56, doi:10.1016/J.ATMOSENV.2016.07.040, 2016.
Wild, O. and Prather, M. J.: Global tropospheric ozone modeling: Quantifying errors due to grid resolution, J. Geophys. Res. Atmos., 1220
111(11), 1–14, doi:10.1029/2005JD006605, 2006.
Wild, O., Fiore, A. M., Shindell, D. T., Doherty, R. M., Collins, W. J., Dentener, F. J., Schultz, M. G., Gong, S., Mackenzie, I. A., Zeng, G.,
Hess, P., Duncan, B. N., Bergmann, D. J., Szopa, S., Jonson, J. E., Keating, T. J. and Zuber, A.: Modelling future changes in surface ozone:
A parameterized approach, Atmos. Chem. Phys., 12(4), 2037–2054, doi:10.5194/acp-12-2037-2012, 2012.
Wild, O., Voulgarakis, A., O’Connor, F., Lamarque, J. F., Ryan, E. M. and Lee, L.: Global sensitivity analysis of chemistry-climate model 1225
budgets of tropospheric ozone and OH: Exploring model diversity, Atmos. Chem. Phys., 20(7), 4047–4058, doi:10.5194/acp-20-4047-2020,
2020.
de Wit, H. A., Hettelingh, J.-P. and Harmens, H.: Trends in ecosystem and health responses to long-range transported atmospheric pollutants
( ICP Waters Report 125/2015). [online] Available from:
https://www.unece.org/fileadmin/DAM/env/documents/2016/AIR/Publications/Trends_in_ecosystem_and_health_responses_to_long-1230
range_transported_atmospheric_pollutants.pdf, 2015.
Wu, S., Mickley, L. J., Leibensperger, E. M., Jacob, D. J., Rind, D. and Streets, D. G.: Effects of 2000-2050 global change on ozone air
41
quality in the United States, J. Geophys. Res. Atmos., 113(6), doi:10.1029/2007JD008917, 2008.
Wu, T., Lu, Y., Fang, Y., Xin, X., Li, L., Li, W., Jie, W., Zhang, J., Liu, Y., Zhang, L., Zhang, F., Zhang, Y., Wu, F., Li, J., Chu, M., Wang,
Z., Shi, X., Liu, X., Wei, M., Huang, A., Zhang, Y. and Liu, X.: The Beijing Climate Center Climate System Model (BCC-CSM): the main 1235
progress from CMIP5 to CMIP6, Geosci. Model Dev., 12(4), 1573–1600, doi:10.5194/gmd-12-1573-2019, 2019.
Wu, T., Zhang, F., Zhang, J., Jie, W., Zhang, Y., Wu, F., Li, L., Yan, J., Liu, X., Lu, X., Tan, H., Zhang, L., Wang, J. and Hu, A.: Beijing
Climate Center Earth System Model version 1 (BCC-ESM1): Model description and evaluation of aerosol simulations, Geosci. Model Dev.,
13(3), 977–1005, doi:10.5194/gmd-13-977-2020, 2020.
Young, P. J., Archibald, A. T., Bowman, K. W., Lamarque, J.-F., Naik, V., Stevenson, D. S., Tilmes, S., Voulgarakis, A., Wild, O., 1240
Bergmann, D., Cameron-Smith, P., Cionni, I., Collins, W. J., Dalsøren, S. B., Doherty, R. M., Eyring, V., Faluvegi, G., Horowitz, L. W.,
Josse, B., Lee, Y. H., MacKenzie, I. A., Nagashima, T., Plummer, D. A., Righi, M., Rumbold, S. T., Skeie, R. B., Shindell, D. T., Strode, S.
A., Sudo, K., Szopa, S. and Zeng, G.: Pre-industrial to end 21st century projections of tropospheric ozone from the Atmospheric Chemistry
and Climate Model Intercomparison Project (ACCMIP), Atmos. Chem. Phys., 13(4), 2063–2090, doi:10.5194/acp-13-2063-2013, 2013.
Young, P. J., Naik, V., Fiore, A. M., Gaudel, A., Guo, J., Lin, M. Y., Neu, J. L., Parrish, D. D., Rieder, H. E., Schnell, J. L., Tilmes, S., Wild, 1245
O., Zhang, L., Ziemke, J. R., Brandt, J., Delcloo, A., Doherty, R. M., Geels, C., Hegglin, M. I., Hu, L., Im, U., Kumar, R., Luhar, A., Murray,
L., Plummer, D., Rodriguez, J., Saiz-Lopez, A., Schultz, M. G., Woodhouse, M. T. and Zeng, G.: Tropospheric Ozone Assessment Report:
Assessment of global-scale model performance for global and regional ozone distributions, variability, and trends, Elem Sci Anth, 6(1), 10,
doi:10.1525/elementa.265, 2018.
Yukimoto, S., Koshiro, T., Kawai, H., Oshima, N., Yoshida, K., Urakawa, S., Tsujino, H., Deushi, M., Tanaka, T., Hosaka, M., Yoshimura, 1250
H., Shindo, E., Mizuta, R., Ishii, M., Obata, A. and Adachi, Y.: MRI MRI-ESM2.0 model output prepared for CMIP6 AerChemMIP, ,
doi:10.22033/ESGF/CMIP6.633, 2019a.
Yukimoto, S., Koshiro, T., Kawai, H., Oshima, N., Yoshida, K., Urakawa, S., Tsujino, H., Deushi, M., Tanaka, T., Hosaka, M., Yoshimura,
H., Shindo, E., Mizuta, R., Ishii, M., Obata, A. and Adachi, Y.: MRI MRI-ESM2.0 model output prepared for CMIP6 CMIP historical, ,
doi:10.22033/ESGF/CMIP6.6842, 2019b. 1255
Yukimoto, S., Koshiro, T., Kawai, H., Oshima, N., Yoshida, K., Urakawa, S., Tsujino, H., Deushi, M., Tanaka, T., Hosaka, M., Yoshimura,
H., Shindo, E., Mizuta, R., Ishii, M., Obata, A. and Adachi, Y.: MRI MRI-ESM2.0 model output prepared for CMIP6 ScenarioMIP, ,
doi:10.22033/ESGF/CMIP6.638, 2019c.
Yukimoto, S., Kawai, H., Koshiro, T., Oshima, N., Yoshida, K., Urakawa, S., Tsujino, H., Deushi, M., Tanaka, T., Hosaka, M., Yabu, S.,
Yoshimura, H., Shindo, E., Mizuta, R., Obata, A., Adachi, Y. and Ishii, M.: The meteorological research institute Earth system model version 1260
2.0, MRI-ESM2.0: Description and basic evaluation of the physical component, J. Meteorol. Soc. Japan, 97(5), 931–965,
doi:10.2151/jmsj.2019-051, 2019d.
Zhang, J., Wu, T., Shi, X., Zhang, F., Li, J., Chu, M., Liu, Q., Yan, J., Ma, Q. and Wei, M.: BCC BCC-ESM1 model output prepared for
CMIP6 CMIP, , doi:10.22033/ESGF/CMIP6.1734, 2018.
Zhang, J., Wu, T., Shi, X., Zhang, F., Li, J., Chu, M., Liu, Q., Yan, J., Ma, Q. and Wei, M.: BCC BCC-ESM1 model output prepared for 1265
CMIP6 AerChemMIP, , doi:10.22033/ESGF/CMIP6.1733, 2019.