
JigsawMap: Connecting the Past to the Future by Mapping Historical Textual Cadasters
10
JigsawMap: Connecting the Past to the Future by Mapping Historical Textual Cadasters Hyungmin Lee 1 , Sooyun Lee 1 , Namwook Kim 2 , Jinwook Seo 1 1 Department of Computer Science and Engineering Seoul National University 1 Gwanak-ro, Gwanak-gu, Seoul 151-744, Korea {hmlee, hisyun, jseo}@hcil.snu.ac.kr 2 Samsung Techwin Republic of Korea [email protected] ABSTRACT In this paper, we present an interactive visualization tool, JigsawMap, for visualizing and mapping historical textual cadasters. A cadaster is an official register that records land properties (e.g., location, ownership, value and size) for land valuation and taxation. Such mapping of old and new cadasters can help historians understand the social/economic background of changes in land uses or ownership. With JigsawMap, historians can continue mapping older or newer cadasters. In this way, JigsawMap can connect the past land survey results to today and to the future. We conducted usability studies and long term case studies to evaluate JigsawMap, and received positive responses. As well as summarizing the evaluation results, we also present design guidelines for participatory design projects with historians. Author Keywords JigsawMap; interactive visualization; graph layout; case study; cadaster; history ACM Classification Keywords H.5.m [Information interfaces and presentation (e.g., HCI) ]: Miscellaneous General Terms Design, Human Factors INTRODUCTION Historians refer to prior written records to learn about the social and economic aspects of past events. They often have to analyze a large amount of historical data for several years before reaching a sound conclusion. When the sheer volume of such records overwhelms the historians’ analytical capability, only a fraction of the data is reviewed at once or the tasks are distributed among other experts for collaborative analysis. The former approach may be simpler and lead to a more rapid conclusion. However, it is difficult to generalize this conclusion. The latter approach may take a longer time before any meaningful conclusion can be drawn, but it usually generates more generalizable results in the end. The Kyujanggak Institute for Korean Studies (KIKS) preserves many invaluable historical records of pre-modern Korean history in its archives, among which are many pre- modern cadasters (from the 17 th to 19 th century). A cadaster contains information about each land piece surveyed, such as its owners, shape, address, etc. The pre-modern cadasters kept in the KIKS cover most cities and urban areas in the Joseon Dynasty (the most recent and last dynasty in Korean history). Thus, they provide a valuable resource for historical analyses of the temporal and spatial changes of the land’s ownership, development status, and residential areas [9]. However, there are major hurdles in analyzing these pre- modern cadasters. There are no cadastral maps accompanying the textual cadasters, i.e., there are no records of the terrestrial coordinates of each land piece. Instead, only the information on the approximate land survey directions and neighboring land pieces was recorded during the survey. Fortunately, there exist modern cadastral maps to which historians can refer to figure out the geographical locations of the land pieces represented only by texts. To make things worse, the volume of the pre- Permission to make digital or hard copies of all or part of this work for personal or classroom use is granted without fee provided that copies are not made or distributed for profit or commercial advantage and that copies bear this notice and the full citation on the first page. To copy otherwise, or republish, to post on servers or to redistribute to lists, requires prior specific permission and/or a fee. CHI’12, May 5–10, 2012, Austin, Texas, USA. Copyright 2012 ACM 978-1-4503-1015-4/12/05...$10.00. Figure 1. A historian mapping a pre-modern textual cadaster (books on the table) onto a modern cadastral map (map on the table) using sticky notes and highlighters.
Transcript of JigsawMap: Connecting the Past to the Future by Mapping Historical Textual Cadasters
JigsawMap: Connecting the Past to the Future by Mapping Historical Textual Cadasters
Hyungmin Lee1, Sooyun Lee1, Namwook Kim2, Jinwook Seo1 1Department of Computer Science and Engineering
Seoul National University 1 Gwanak-ro, Gwanak-gu, Seoul 151-744, Korea
{hmlee, hisyun, jseo}@hcil.snu.ac.kr
2Samsung Techwin Republic of Korea
ABSTRACT In this paper, we present an interactive visualization tool, JigsawMap, for visualizing and mapping historical textual cadasters. A cadaster is an official register that records land properties (e.g., location, ownership, value and size) for land valuation and taxation. Such mapping of old and new cadasters can help historians understand the social/economic background of changes in land uses or ownership. With JigsawMap, historians can continue mapping older or newer cadasters. In this way, JigsawMap can connect the past land survey results to today and to the future. We conducted usability studies and long term case studies to evaluate JigsawMap, and received positive responses. As well as summarizing the evaluation results, we also present design guidelines for participatory design projects with historians.
Author Keywords JigsawMap; interactive visualization; graph layout; case study; cadaster; history
ACM Classification Keywords H.5.m [Information interfaces and presentation (e.g., HCI) ]: Miscellaneous
General Terms Design, Human Factors
INTRODUCTION Historians refer to prior written records to learn about the social and economic aspects of past events. They often have to analyze a large amount of historical data for several years before reaching a sound conclusion. When the sheer volume of such records overwhelms the historians’ analytical capability, only a fraction of the data is reviewed at once or the tasks are distributed among other experts for collaborative analysis. The former approach may be simpler and lead to a more rapid conclusion. However, it is difficult to generalize this conclusion. The latter approach may take
a longer time before any meaningful conclusion can be drawn, but it usually generates more generalizable results in the end.
The Kyujanggak Institute for Korean Studies (KIKS) preserves many invaluable historical records of pre-modern Korean history in its archives, among which are many pre-modern cadasters (from the 17th to 19th century). A cadaster contains information about each land piece surveyed, such as its owners, shape, address, etc. The pre-modern cadasters kept in the KIKS cover most cities and urban areas in the Joseon Dynasty (the most recent and last dynasty in Korean history). Thus, they provide a valuable resource for historical analyses of the temporal and spatial changes of the land’s ownership, development status, and residential areas [9].
However, there are major hurdles in analyzing these pre-modern cadasters. There are no cadastral maps accompanying the textual cadasters, i.e., there are no records of the terrestrial coordinates of each land piece. Instead, only the information on the approximate land survey directions and neighboring land pieces was recorded during the survey. Fortunately, there exist modern cadastral maps to which historians can refer to figure out the geographical locations of the land pieces represented only by texts. To make things worse, the volume of the pre-
Permission to make digital or hard copies of all or part of this work for personal or classroom use is granted without fee provided that copies are not made or distributed for profit or commercial advantage and that copies bear this notice and the full citation on the first page. To copy otherwise, or republish, to post on servers or to redistribute to lists, requires prior specific permission and/or a fee. CHI’12, May 5–10, 2012, Austin, Texas, USA. Copyright 2012 ACM 978-1-4503-1015-4/12/05...$10.00.
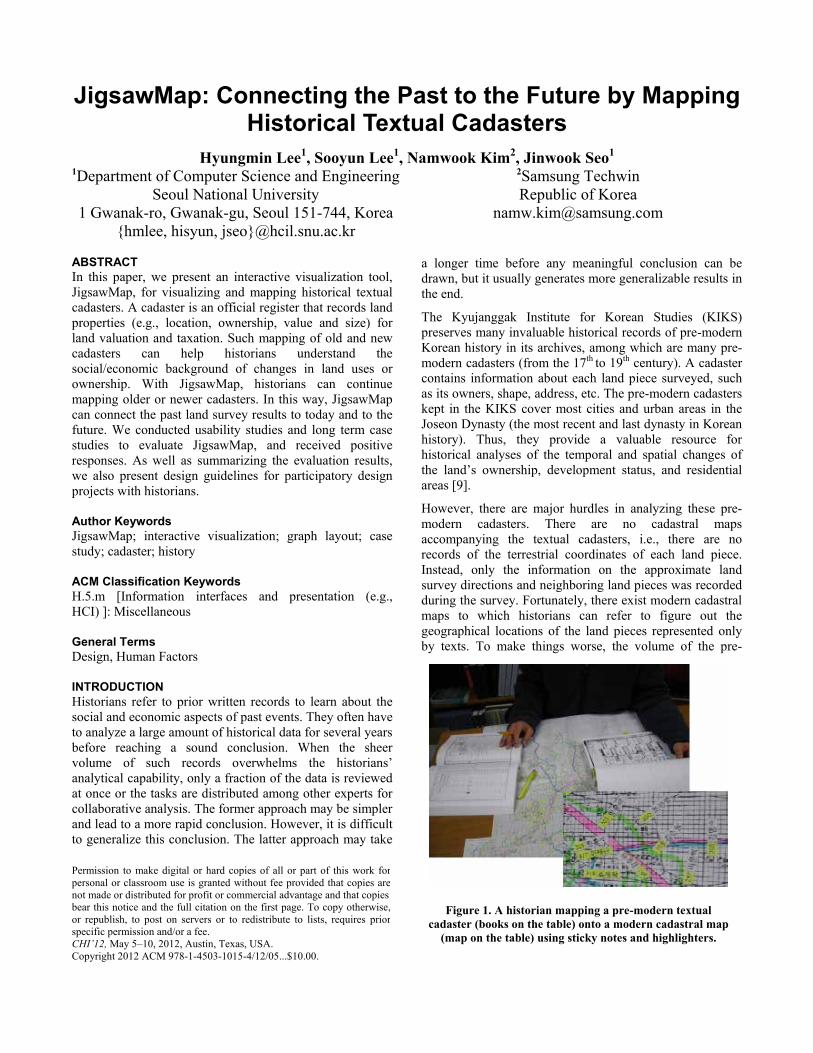
Figure 1. A historian mapping a pre-modern textual cadaster (books on the table) onto a modern cadastral map
(map on the table) using sticky notes and highlighters.

modern cadasters is gargantuan, because it covers the records for most of the Korean peninsula across two centuries.
In the past, historians manually matched the pre-modern cadasters and modern cadastral maps using sticky notes and highlighters (Figure 1). This task was like placing an endless pile of jigsaw pieces on to a map. They chose a small rural village to evaluate the feasibility of an attempt to solve this large jigsaw puzzle [11]. It was labor intensive, time consuming and, thus, not scalable. They estimated that it might take several decades for a historian to manually match all of the pre-modern cadasters in the possession of the KIKS. This matching of cadasters is not only a challenging problem in Korea, but also in other Asian or European countries where historical cadasters exist. At the same time, because of the ambiguity or uncertainty involved in the matching process, designing an interactive visualization tool for this process is also closely related to research on uncertainty visualization.
We teamed up with historians to design and develop an interactive visualization tool called JigsawMap to help them match the pre-modern cadasters with modern cadastral maps. We used a participatory design method where the historians provided constant feedback during the design process. Once the tool was built, we conducted long-term case studies with historians, in which we obtained positive feedback about JigsawMap.
The organization of this paper is as follows. First, we describe the datasets and tasks in detail. Next, we present the design rationale and explain the interface design. We then introduce studies related to our work. A summary of our evaluation is presented in the next section. Finally, we discuss our conclusion and directions for future works.
DATASETS AND TASKS The historians who we worked with have a goal of mapping all pre-modern textual cadasters onto the modern cadastral maps. By connecting the two, they can figure out the actual geospatial layout of the cadasters. If a complete mapping were established for every textual cadaster in the possession of the KIKS, historians would be able to use them for analyzing the temporal and spatial changes in the land ownership, land development status, and residential areas of pre-modern Korea.
In this section, we explain the two datasets and the historians’ task in detail. Then, we introduce the task flow using JigsawMap and explain how the interactive tool helps each step of the historians’ task thoroughly.
Pre-modern Textual Cadasters Until the early 20th century, the Korean government kept the land survey data in a textual document format without using any geographical maps. The survey result was recorded in the simple format depicted in Figure 2. A land surveyor starts from an arbitral land piece in a village. She/he records the size and shape, the fertility rating used for taxation purposes, the four-neighbor (NWSE) information, and the direction in which the surveyor moved from the previous land piece during his/her survey (i.e., survey direction). Then, once the information on a given land piece was collected, she/he moves on to the next land piece. This process is repeated until she/he has the complete records of all land pieces in the village. The surveyor did not record explicit locations in the cadaster. Instead, only the estimated direction of his/her physical movement during the survey was recorded along with the four-neighbor information, resulting in a giant singly-linked list of the land pieces (Figure 3).
Figure 2. Original format of a textual cadaster (right), and a
concept diagram of how the record is visualized (left).
Figure 3. Result of a mapping task (overlapped mode). A node link diagram on a cadastral map is a visual
representation of a textual cadaster. The enlarged region above is a magnified view of some land pieces.
The KIKS preserves about 1300 volumes of textual survey books covering two centuries (from the late 18th to early 20th). They are the only copies left in existence. The Korean government is funding research projects for the purpose of computerizing the textual land survey data to encourage scalable historical research.
Modern Cadastral Maps Modern cadastral maps have the location information and registered owner of each land piece. The cadastral maps used in this project were made in 1914. There is an approximately ten-year gap between the latest pre-modern textual cadasters and these cadastral maps. Historians assumed that there was no significant change during this ten year period, such as the ownership, land configuration, and land type. Thus, they chose to use these maps to connect the land pieces from the pre-modern cadasters.
Paper-based Mapping Process and Obstacles The historians’ mapping task begins by choosing a starting position or a land piece on a map as the first land piece in the textual cadaster. They have to guess the first land piece based only on textual information such as the neighbor information, size of land pieces, terrain description, etc. Then they traverse down the linked-list of land pieces in the textual cadaster to find more mappings to the map. However, after mapping a few more land pieces, they may notice that something is wrong, judging by the owners, land size, etc., in which case they have to try other land pieces as a starting point. This first step largely depends on the historians’ intuition and they have to repeat this process until the mapping result of a starting location makes sense. Therefore, this step may take an arbitrarily long time.
Even after a mapping of the first land piece is successfully found, there are several obstacles throughout the mapping process. First, some actions are difficult to undo, since the task is done manually with sticky notes and highlighters to mark on a physical paper. Second, the mapping between land pieces in a pre-modern cadaster and land pieces in a cadastral map is not always one-to-one. Multiple land pieces in the textual cadaster can be mapped to one land
piece in the cadastral map. Third, for some land pieces, historians cannot find appropriate matching pieces, because of the land pieces being split into smaller pieces or the appearance of new land pieces as a result of cultivation. Fourth, some land pieces may be included in a different town in the modern cadastral map, because of changes in the town boundary. Lastly, the ambiguity of the directional information in the textual cadaster provides another set of major challenges (“north” in the record could actually mean NNE or NNW).
Due to these difficulties, it takes about one to two months for an experienced historian to build a complete mapping of a small rural village. So it may take a few historians decades to finish all of the pre-modern textual cadasters preserved in the Korean history museum.
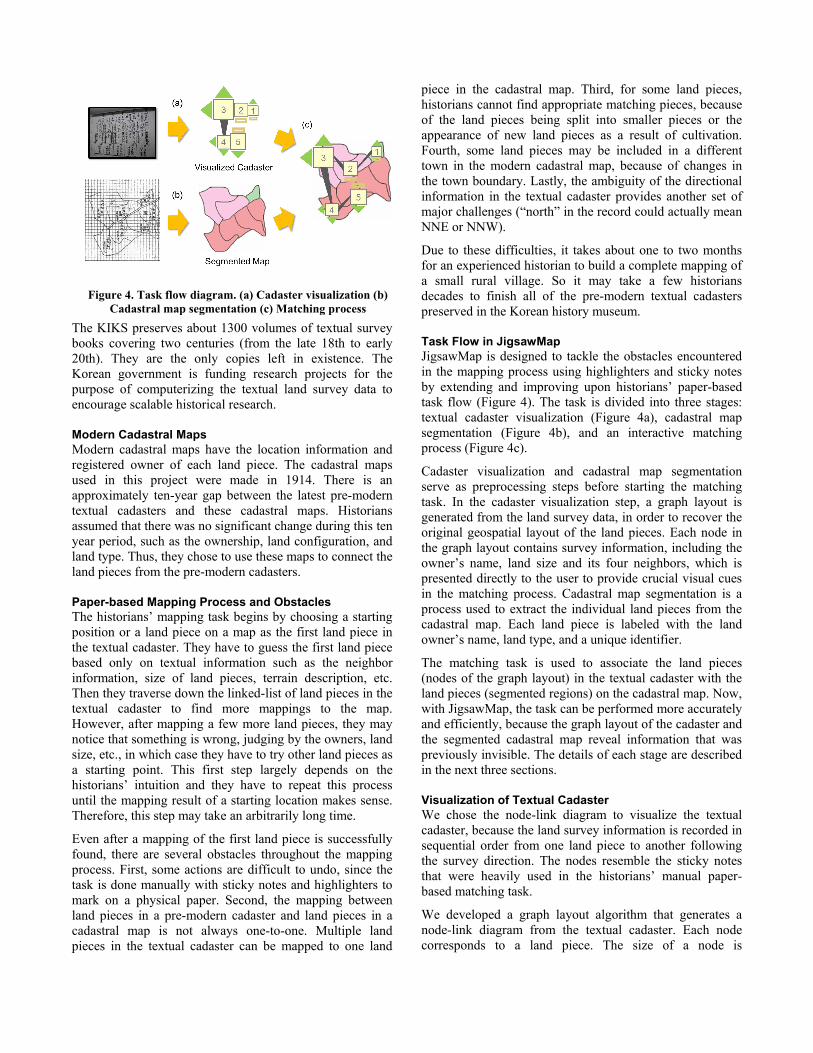
Task Flow in JigsawMap JigsawMap is designed to tackle the obstacles encountered in the mapping process using highlighters and sticky notes by extending and improving upon historians’ paper-based task flow (Figure 4). The task is divided into three stages: textual cadaster visualization (Figure 4a), cadastral map segmentation (Figure 4b), and an interactive matching process (Figure 4c).
Cadaster visualization and cadastral map segmentation serve as preprocessing steps before starting the matching task. In the cadaster visualization step, a graph layout is generated from the land survey data, in order to recover the original geospatial layout of the land pieces. Each node in the graph layout contains survey information, including the owner’s name, land size and its four neighbors, which is presented directly to the user to provide crucial visual cues in the matching process. Cadastral map segmentation is a process used to extract the individual land pieces from the cadastral map. Each land piece is labeled with the land owner’s name, land type, and a unique identifier.
The matching task is used to associate the land pieces (nodes of the graph layout) in the textual cadaster with the land pieces (segmented regions) on the cadastral map. Now, with JigsawMap, the task can be performed more accurately and efficiently, because the graph layout of the cadaster and the segmented cadastral map reveal information that was previously invisible. The details of each stage are described in the next three sections.
Visualization of Textual Cadaster We chose the node-link diagram to visualize the textual cadaster, because the land survey information is recorded in sequential order from one land piece to another following the survey direction. The nodes resemble the sticky notes that were heavily used in the historians’ manual paper-based matching task.
We developed a graph layout algorithm that generates a node-link diagram from the textual cadaster. Each node corresponds to a land piece. The size of a node is
Figure 4. Task flow diagram. (a) Cadaster visualization (b) Cadastral map segmentation (c) Matching process
proportional to the land size of the corresponding land piece. Neighboring nodes on the survey path are connected with directional edges. We used tapered edges which are the most readable visualization according to [6,7].
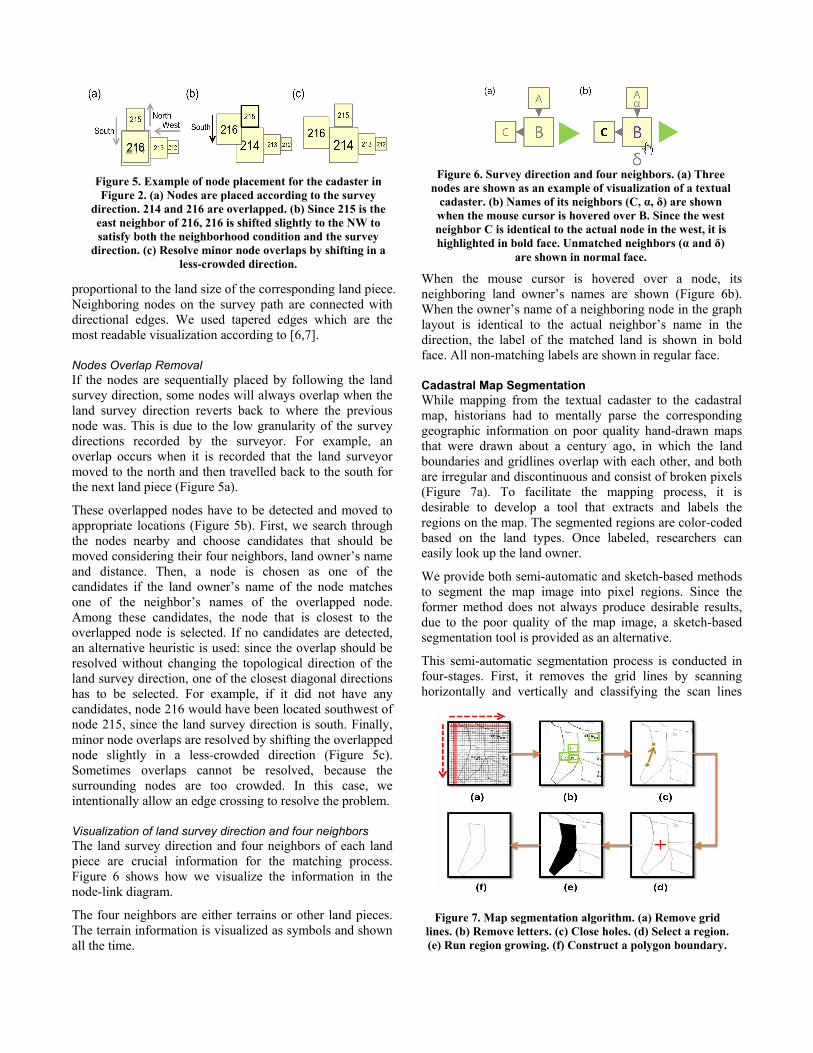
Nodes Overlap Removal If the nodes are sequentially placed by following the land survey direction, some nodes will always overlap when the land survey direction reverts back to where the previous node was. This is due to the low granularity of the survey directions recorded by the surveyor. For example, an overlap occurs when it is recorded that the land surveyor moved to the north and then travelled back to the south for the next land piece (Figure 5a).
These overlapped nodes have to be detected and moved to appropriate locations (Figure 5b). First, we search through the nodes nearby and choose candidates that should be moved considering their four neighbors, land owner’s name and distance. Then, a node is chosen as one of the candidates if the land owner’s name of the node matches one of the neighbor’s names of the overlapped node. Among these candidates, the node that is closest to the overlapped node is selected. If no candidates are detected, an alternative heuristic is used: since the overlap should be resolved without changing the topological direction of the land survey direction, one of the closest diagonal directions has to be selected. For example, if it did not have any candidates, node 216 would have been located southwest of node 215, since the land survey direction is south. Finally, minor node overlaps are resolved by shifting the overlapped node slightly in a less-crowded direction (Figure 5c). Sometimes overlaps cannot be resolved, because the surrounding nodes are too crowded. In this case, we intentionally allow an edge crossing to resolve the problem.
Visualization of land survey direction and four neighbors The land survey direction and four neighbors of each land piece are crucial information for the matching process. Figure 6 shows how we visualize the information in the node-link diagram.
The four neighbors are either terrains or other land pieces. The terrain information is visualized as symbols and shown all the time.
When the mouse cursor is hovered over a node, its neighboring land owner’s names are shown (Figure 6b). When the owner’s name of a neighboring node in the graph layout is identical to the actual neighbor’s name in the direction, the label of the matched land is shown in bold face. All non-matching labels are shown in regular face.
Cadastral Map Segmentation While mapping from the textual cadaster to the cadastral map, historians had to mentally parse the corresponding geographic information on poor quality hand-drawn maps that were drawn about a century ago, in which the land boundaries and gridlines overlap with each other, and both are irregular and discontinuous and consist of broken pixels (Figure 7a). To facilitate the mapping process, it is desirable to develop a tool that extracts and labels the regions on the map. The segmented regions are color-coded based on the land types. Once labeled, researchers can easily look up the land owner.
We provide both semi-automatic and sketch-based methods to segment the map image into pixel regions. Since the former method does not always produce desirable results, due to the poor quality of the map image, a sketch-based segmentation tool is provided as an alternative.
This semi-automatic segmentation process is conducted in four-stages. First, it removes the grid lines by scanning horizontally and vertically and classifying the scan lines
Figure 5. Example of node placement for the cadaster in Figure 2. (a) Nodes are placed according to the survey
direction. 214 and 216 are overlapped. (b) Since 215 is the east neighbor of 216, 216 is shifted slightly to the NW to satisfy both the neighborhood condition and the survey
direction. (c) Resolve minor node overlaps by shifting in a less-crowded direction.
Figure 6. Survey direction and four neighbors. (a) Three
nodes are shown as an example of visualization of a textual cadaster. (b) Names of its neighbors (C, α, δ) are shown when the mouse cursor is hovered over B. Since the west neighbor C is identical to the actual node in the west, it is highlighted in bold face. Unmatched neighbors (α and δ)
are shown in normal face.
Figure 7. Map segmentation algorithm. (a) Remove grid lines. (b) Remove letters. (c) Close holes. (d) Select a region. (e) Run region growing. (f) Construct a polygon boundary.

based on the pixel intensities; if a scan line contains a pixel intensity above a certain threshold, it is considered to be a grid line (Figure 7a). Second, it removes characters by constructing connected components and examining each of them to find resemblance to a character; squareness and the number of branch points are used as character features (Figure 7b). Third, holes are closed by tracing a ray from end point to end point (Figure 7c). In the final stage, the user selects a region to extract (Figure 7d). A region growing method is then applied to construct a pixel region (Figure 7e). In addition, if desirable, a minimum-perimeter polygon algorithm is used to construct a polygon from the pixel region (Figure 7f).
The sketch-based segmentation tool is used when a land piece is not extracted perfectly with the semi-automatic segmentation tool. The user can directly segment the land pieces in the following steps. First, the user sketches a land piece by dragging the mouse pointer along its boundary. Then, a child window is shown and the user needs to input the unique identifier. The child window captures the magnified view of the land piece. This view is helpful for the user to read the unique identifier on the map. After this step, the region segmented by the user is filled with color according to the land type.
Matching Process The user performs the matching task by comparing the node-link diagram with the segmented cadastral map (Figure 8a, b). First, the user selects the best starting point and starts linking land pieces (Figure 8c) and matching nearby land pieces (Figure 8d) until the matching process is no longer able to proceed. The user now has to find another starting point and repeat the above steps. The user may utilize clues such as the four neighbors, terrain, etc., during the process. The detailed user interactions for this process in JigsawMap are explained in a later section.
DESIGN RATIONALE In this section, we explain the rationale behind our design decisions and implementation of JigsawMap with domain experts.
Design based on task observations The historians formulated the task flow as they performed the task. There is a certain goal in every step of the task. We should understand these goals to design an appropriate interface or interaction. We should also find out what makes the task uncomfortable and tedious through observations.
Give the feeling of direct engagement The historians used highlighters and sticky notes to record their matched results on the map. To ease the learning curve of using JigsawMap, we have to support the direct manipulation of the layout through intuitive and familiar interactions with the right affordances. We decided to model the interactions based on the historians’ accustomed actions with highlighters and sticky notes.
Enable search by name The owner names are very important hints for finding the candidate nodes for matching. Especially, at the beginning of the matching process, the historians check the owner names to find out if there are similar names in the cadaster and map. For this reason, the owner names should be searchable to provide clues for the matching process.
Visualize the invisible Making an automatic algorithm that finds perfectly matched results is very difficult, if not impossible. Thus, we visualize the important characteristics of the data which were inconspicuous in the original textual cadasters. With important features embossed in the overview, the user will be able to match places where the features were not visible before.
Control the amount of information to visualize The cadaster contains various information on the land. Visualizing such information helps understand the data, but showing too much information at once could hinder the matching process. In the design process, we had to decide the information necessary for each task. There may be information that is important to historians, but seems irrelevant to non-historians. Thus, we closely collaborated with the historians to decide which information needs to be shown for each task.
JIGSAWMAP INTERFACE DESIGN Our working prototype (Figure 9) is implemented using Microsoft Silverlight 4.0. JigsawMap has two view modes: separate mode and overlapped mode.
In separate mode, the user can compare the cadastral map and the visualized cadaster separately. By comparing these two views side by side, the user can skim and mark the start
(a) (b)
(c) (d)
Figure 8. Matching process. (a) Visualized textual cadaster and (b) Segmented cadaster map. The land pieces in both (a) & (b) are surrounded by mountains. (c) The starting point is
matched. (d) A few more following land pieces are sequentially matched.
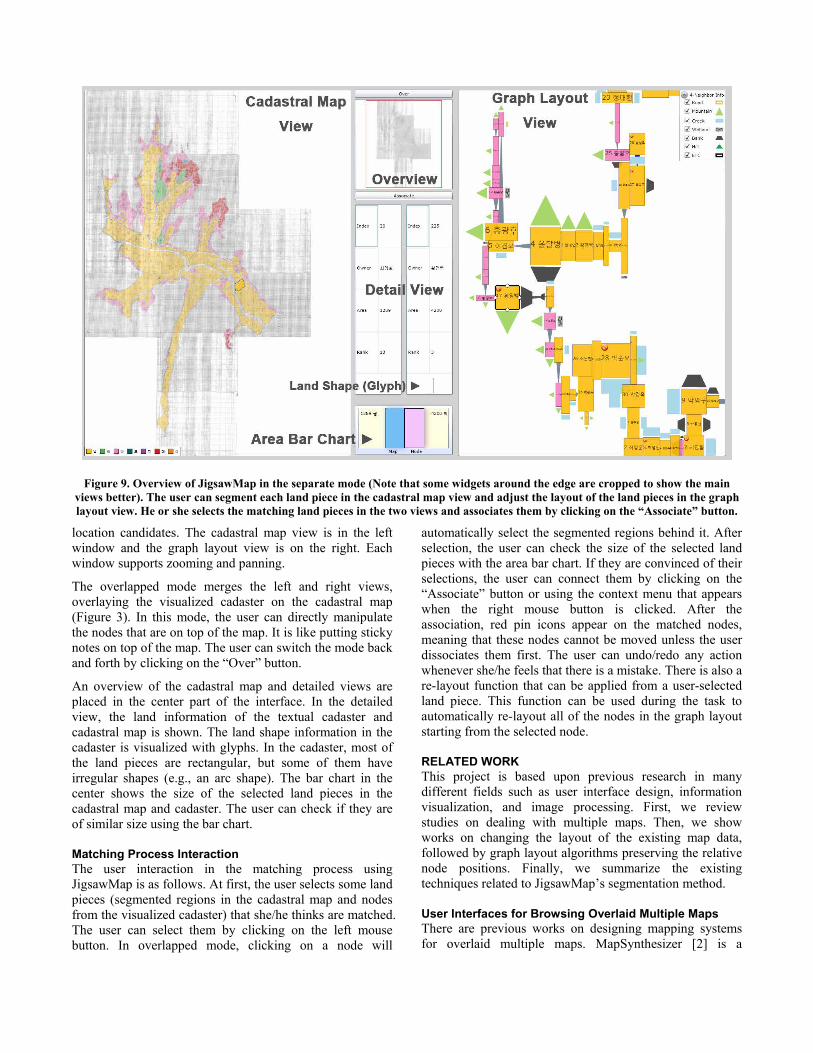
Figure 9. Overview of JigsawMap in the separate mode (Note that some widgets around the edge are cropped to show the main views better). The user can segment each land piece in the cadastral map view and adjust the layout of the land pieces in the graph layout view. He or she selects the matching land pieces in the two views and associates them by clicking on the “Associate” button.
location candidates. The cadastral map view is in the left window and the graph layout view is on the right. Each window supports zooming and panning.
The overlapped mode merges the left and right views, overlaying the visualized cadaster on the cadastral map (Figure 3). In this mode, the user can directly manipulate the nodes that are on top of the map. It is like putting sticky notes on top of the map. The user can switch the mode back and forth by clicking on the “Over” button.
An overview of the cadastral map and detailed views are placed in the center part of the interface. In the detailed view, the land information of the textual cadaster and cadastral map is shown. The land shape information in the cadaster is visualized with glyphs. In the cadaster, most of the land pieces are rectangular, but some of them have irregular shapes (e.g., an arc shape). The bar chart in the center shows the size of the selected land pieces in the cadastral map and cadaster. The user can check if they are of similar size using the bar chart.
Matching Process Interaction The user interaction in the matching process using JigsawMap is as follows. At first, the user selects some land pieces (segmented regions in the cadastral map and nodes from the visualized cadaster) that she/he thinks are matched. The user can select them by clicking on the left mouse button. In overlapped mode, clicking on a node will
automatically select the segmented regions behind it. After selection, the user can check the size of the selected land pieces with the area bar chart. If they are convinced of their selections, the user can connect them by clicking on the “Associate” button or using the context menu that appears when the right mouse button is clicked. After the association, red pin icons appear on the matched nodes, meaning that these nodes cannot be moved unless the user dissociates them first. The user can undo/redo any action whenever she/he feels that there is a mistake. There is also a re-layout function that can be applied from a user-selected land piece. This function can be used during the task to automatically re-layout all of the nodes in the graph layout starting from the selected node.
RELATED WORK This project is based upon previous research in many different fields such as user interface design, information visualization, and image processing. First, we review studies on dealing with multiple maps. Then, we show works on changing the layout of the existing map data, followed by graph layout algorithms preserving the relative node positions. Finally, we summarize the existing techniques related to JigsawMap’s segmentation method.
User Interfaces for Browsing Overlaid Multiple Maps There are previous works on designing mapping systems for overlaid multiple maps. MapSynthesizer [2] is a

prototype map browser based on MapCruncher [3], with which users can search and compare overlaid multiple maps. MapSynthesizer is designed based on expert interviews about how people correlate maps. JigsawMap differs from MapSynthesizer in that it links a textual cadaster to a geographical map. Hypercities [8] is a web-based map browser or an open platform developed for research and education. Hypercities is also used for history research and for many courses in UCLA. Geo-temporal information including historical maps are shared and explored on this platform. MapSynthesizer and Hypercities are similar to our project, since they are also platforms for merging geo-spatial information.
Generating Layout using Geo-spatial Data Morphing a real map into a meaningful spatial layout like a Treemap [15] is one of the important research issues in geo-spatial visualization. HiVE (Hierarchical Visualization Expression) [16] has expressions for describing space-filling rectangular layouts. Among them, there is ‘spatially-ordered’ layout [18] that preserves the relative positions of the geographical elements in a space-filling layout. This layout can produce a Treemap from geographical map data. In JigsawMap, we have to map the spatial layout generated from an ambiguous textual geographical data onto a real map, which is a uniquely challenging task that, to the best of our knowledge, has not been addressed in the past.
Graph Layout Algorithms In JigsawMap, the visualization of the textual cadasters is one of the key components. Since the textual cadasters encode the geographical relationships between the land pieces, it seems natural to visualize them using graph visualization methods. There are extensive works on generating overlap-free graph layouts [1]. Gansner et al. presented a study on graph layout algorithms that reduce the number of edge overlaps while preserving their hierarchy [4]. Our graph layout should preserve both the horizontal and vertical relative positional relationships, since it is composed of geospatial data. There was an attempt made to place nodes in a fixed grid first and then route edges to minimize the edge crossing, bending, length and density [13]. In our visualization, the edges cannot be freely rerouted, because they not only link the nodes sequentially, but also enable the direction information to be visualized. X-Y ordering [10] is a post-processing algorithm that resolves node overlaps while preserving their relative positional relationships. Since we can only partially infer the relative positional relationships among the land pieces from the cadasters, directly applying this algorithm does not guarantee a better layout.
Image Segmentation Wikimapia [17] is a collaborative mapping platform where the user can segment the world map into geographical regions in a wiki fashion. It provides a simple interface with which the user sets the boundary points to define a region.
There are also similar services such as Google Map Maker [5] and OpenStreetMap [12] that collect geospatial information by segmenting the map into geometric primitives; points, lines and polygons. JigsawMap, although targeting a different domain, takes a similar approach by providing a simple sketch-based segmentation and goes one step further to automate the segmentation process.
EVALUATION
Pilot Study We did a pilot study with a Computer Science graduate student who does not have background in this kind of task. This study was done with an early prototype of JigsawMap to find usability problems or errors. We explained about the data and the purpose of our tool and showed a 3-minute demo. We allowed the participant to ask questions about the interactions of JigsawMap and the description of the data during the test.
The test took about 40 minutes. The participant matched about 70 land pieces, which is about 15% of the town. The results of the test were mostly similar to those of the Korea historians.
However, some of the matched results were not identical to those of the historians. This was mainly due to the N:1 matching cases where the participant sometimes matched too many or too few nodes to a land piece of the cadastral map (or vice versa). A meticulous examination of the land area information can resolve this problem. Unfortunately, there was no visualization that allowed differences in the land area data to be shown in the early prototype. Due to this problem, the participant commented that comparing the area information was not very intuitive, due to the irregular shaped land pieces in the cadastral map. Based on this feedback, we included the area bar chart to help the user compare the area data.
Longitudinal Evaluation We conducted long-term case studies following the principles of MILC (Multi-dimensional In-depth Long-term Case Studies) [14], which is a participatory design method, with two historians. We had a meeting with each participant every two weeks for five months. Each meeting took about an hour. We preceded the meeting with the following protocols. First, we got the overall feedback from the historians about their two weeks experience using JigsawMap. Next, we exchanged questions. We mainly asked questions about the historical background of the data to understand the task and data better. The historians usually inquired about the functionality of JigsawMap in detail and the feasibility of their ideas on improving it. Then, we introduced and installed a new version of JigsawMap which was improved based on the feedback from the previous meeting. Finally, we observed the historians using the new version and received their initial feedback on it.

The next two sub-sections describe case studies with the two historians: a graduate student (P1) and undergraduate student (P2) from a Korean history department.
Case 1 This user was a graduate student (P1) who has professional experience in cadaster studies. P1 was used to the manual paper-based matching task. During the evaluation, we asked P1 to use JigsawMap to match land pieces of Gayang-ri, a town surrounded by mountains.
P1 commented that the visualization of the textual cadasters is one of the most satisfactory features compared to the paper-based matching task. The clues mainly used by P1 to find a starting land piece for the matching process were: the terrain in the four neighbors (e.g., Figure 6), the similarity of the land owner names, and the irregular shaped (e.g., arc) land pieces in the cadaster. P1 stated that the area chart was very useful for checking the size of the land pieces.
P1 noted that some of the land information is not necessary in the matching task. According to this statement, information such as the price and fertility were excluded from the tooltip popup. In contrast, the terrain information was considered very useful and important for the matching task. Therefore, we modified the interaction to show the terrain visualization of the four neighbors in a land piece all the time. P1 also mentioned that he wanted to have keyboard shortcuts and that he is familiar with word processors and spreadsheets, so we added keyboard shortcuts based on these programs (e.g., shift/ctrl click, ctrl+c/v).
Case 2 P2 is an undergraduate student in a Korean history department. P2 had no experience in the matching task before and had no background information on the cadaster to be examined. A brief background explanation and tutorial of JigsawMap was given to P2 before the evaluation. P2 worked with Yogok-ri, a town located in the valleys. The feedback from P2 about the strengths of JigsawMap was similar to that of P1.
P2 noted that she used a different approach when she was unable to carry on with the task. At first, she tried to find other candidate locations that could be far away from the current place. However, she often had problems in merging different groups. If dangling nodes remain, it means that there is something wrong and discerning the correct matching will be time consuming. Thus, she decided to follow the survey direction, finding other candidates nearby when she came to a dead-end. P2 said that working this way improved the overall performance. After hearing this anecdote, P1 affirmed that it is a reasonable approach to stay on track in the survey direction.
P2 finished the matching task in about two weeks. The total time was about 20 hours, working for 2~4 hours per day. The working time included a brief seminar on the
background of the cadaster and cadastral map, as well as a tutorial of JigsawMap. Considering this, P2 finished the task in a significantly shortened time compared to that taken by experts to complete the manual paper-based task.
Post Usability Test with a Domain Expert We additionally interviewed and tested our tool with a Korean history graduate student (P3). P3 understood the purpose of our research because he had been working on linking cadaster and cadastral maps manually. The whole process took about 90 minutes. First of all, we interviewed P3 for about 30 minutes about how he had worked manually. We asked P3 how he found starting points, the hints he used to find them, the progress of the research, and difficulties of the task. After the interview, we gave him a 10 minute tutorial with a demo. We asked P3 to use JigsawMap with the town he is working on as a warm-up and received initial feedback about it for 30 minutes. Lastly, P3 tested JigsawMap with a town he was not aware of and this step took about 15 minutes.
In the interview, P3 mentioned that he had been working on a town which is located in a plain with the paper-based method. P3 processed about 70 percent of the town in about 2 months. P3 worked for 2~3 hours on a usual day and 5 hours on weekends. The names of the owners were a very good hint in P3’s case, in that almost 15 percent of his matched results were due to the land owner’s name. Furthermore, their family names were also reliable clues for matching. P3 stated that the natural terrains visualized as the four neighbors of the land pieces were also helpful for finding candidates. For example, a land piece surrounded by a mountain could be easily matched to the map.
DISCUSSION
Summary of Historical Findings Historians have found significant facts by linking cadasters to cadastral maps. Using JigsawMap, they reconfirmed their findings. In addition, they commented that our visualization will be useful for making further discoveries. We introduce some interesting findings made during the evaluation.
Disagreement of land owner names There is only about a ten year gap between the cadastral map and cadasters in our research. For this reason, the historians hypothesized that the land owner names in these two cases would be almost the same or similar. However, when they tried to find matching land pieces by using the owner names, the result was not good. The historians concluded that the representation of the land piece was recorded by the different standards adopted at that time.
Representation of Four Canonical Directions As explained previously, the land survey direction and four neighbors of the Korean pre-modern cadasters were recorded using four canonical directions (NSEW). When fulfilling the task, there were some cases where the

direction information did not make sense compared with the trace of the nearby neighbors. The historians formulated a hypothesis that there may be exceptional cases of direction representation. For example, the direction where the king lived may have been expressed as north. The historians are studying the social aspects of that time to find historical evidences for this hypothesis.
Newly Constructed Roads There are some long, straight roads located in the modern cadastral map. The land pieces divided by these roads share the same land owner name and are usually matched to a single land piece in the textual cadaster. The historians found that these roads were newly constructed in the 20th century.
Hidden Implications of Land Survey Direction There are some survey directions that are unique. For example, the land surveyor walked a long way across a big mountain, rather than finishing recording the land pieces around it first. The historians are researching these survey directions to find hidden patterns and understand any social background behind the unique survey directions.
Further Interdisciplinary Work The visualized cadasters are a rich source of information. Collaboration with researchers in other related fields will be necessary for analyzing the different aspects of them. For example, geologists can use this information to study the irrigation system at that time, because rivers and banks are recorded on the cadasters. Anthropologists may be interested in the record of agricultural land use. Further interdisciplinary work will activate relevant research in various related fields.
Design Guidelines When Working with Historians We worked with the historians for about half a year and learned some rules of thumb that were useful in the design process. We generalize and suggest them as guidelines. We think that these will be useful when collaborating with historians.
Be Aware of Time Scale There are many different kinds of temporal data. Most data used for visualization are evenly-spaced over time and relatively short in length. However, the data used in the history field are mostly irregular in time. The time range can vary by hundreds of years. Therefore, when designing temporal or time-line visualizations for historical studies, these characteristics should be noted.
Be Concerned about Background of the Record During the project, we found that more than one name may represent a single person. At first we thought that the historians made some typographical errors when computerizing the materials. However, it was due to an historical issue. The historians explained that some of the
letters used at that time have more than one pronunciation. In this case, there might be some background knowledge that is trivial for historians, but not for computer scientists. These unknown data properties can cause misconceptions. Thus, it is important to fully understand the background of the data to design a credible tool.
Bridge the experienced and novice users Expertise in the domain can have both positive and negative effects on the task performance with JigsawMap. In our study, the experienced user (P1) was inspired by the feedback from the novice user (P2) who tried to use JigsawMap in a novel way. P1 mentioned that he was so used to working manually with papers and highlighters that he tended to do the task in the same way, even when using our tool. On the other hand, novice users may receive useful tips from experienced users. Thus, if we can bridge them in the design process, we can design a system that can actually improve the performance of both groups.
Field Studies In order to verify the records of historical data, historians may go on field studies. Asking the purpose of the field study and sharing the log of the result can be a valuable process. The collected data can be proactively used in the design process.
Additional Anecdote P2 told us about one episode when she was using the tool. She was doing a part time job in an engineering laboratory. The students in the lab were reluctant to ask about the history books P2 was studying in her free time. They were confused about the Chinese letters in the book P2 was reading. Later on, during the evaluation session with us, P2 installed the tool in her workplace and used it during her break time. When the students saw P2 doing the task with our program, they were very curious about the collaboration work we did. They were impressed about the collaboration between historians and computer scientists. They asked many questions about us and other HCI field studies as well.
Generalizability of Our Approach Mapping historical textual cadasters is not an isolated problem in Korea. Similar problems also exist in other countries such as Japan and China. In China, land information was recorded in a “fish-scale register” in the 17th century, where the land pieces were drawn like fish scales. This system also lacks the exact coordinates, so our approach is also applicable in a similar way. There are some European countries such as Ireland that have historical cadasters to analyze in conjunction with modern cadastral maps.
Mapping historical textual cadasters requires dealing with uncertainty because of the ambiguity involved in the mapping process. JigsawMap helps historians match the historical artifacts by interactively resolving the ambiguity. Since it deals with uncertainty, the interaction design in
JigsawMap is closely related to the visualization of uncertain data or uncertainty visualization. Especially, we think that our approach and design can be generalized to such a research domain as the visualization of geospatial data with uncertainty.
CONCLUSION AND FUTURE WORK We designed a novel interactive visualization tool, JigsawMap, for connecting pre-modern textual cadasters to more recent cadastral maps through close collaboration with historians. Professional historians are currently working on digitalizing textual cadasters in a larger scale, and will be using JigsawMap for mapping them. A visual representation of textual cadasters based on node-link diagram visualization helped the historians to easily identify the land pieces to start the matching process with. Longitudinal case studies and short usability studies were conducted to evaluate JigsawMap. We came up with design guidelines by carefully analyzing the feedback and comments from the participants. These guidelines will be useful when collaboratively designing an interactive tool with historians.
There are several aspects of JigsawMap that could be improved in future works. Our graph layout algorithm does not generate a feasible layout when the town is located in a flatland, where there are few mountains and rivers. While JigsawMap significantly reduces the time required to map a cadaster, it is not scalable enough to deal with all of the villages in a nation over a period of several decades. Crowdsourcing the matching task might be a feasible approach to scale up the process. We will also focus on making the task more playful in the next step of our research. Since our task resembles a puzzle game, we will work on interfaces that will make this task fun and competitive. Finally, we are planning to support the comparison of multiple cadasters. This research will help historians see the temporal and spatial changes at a glance.
ACKNOWLEDGMENTS We wish to thank Prof. Kuen-tae Kim (Department of Korean History, Seoul National University) for his help with the cadasters and cadastral maps. This work was supported by grants from Microsoft Research and the National Research Foundation of Korea (NRF) funded by the Korea government (MEST) (No. 2011-0030813 & 2011-0005526). The ICT at Seoul National University provided the research facilities for this study.
REFERENCES 1. Di Battista, G., Eades, P., Tamassia, R. and Tollis, I G.,
Algorithms for drawing graphs: an annotated bibliography. Computational Geometry: Theory and Applications 1994, 4, 5, (1994), 235-282.
2. Elias, M., Elson, J., Fisher, D. and Howell. J, Do I live in a flood basin?: synthesizing ten thousand maps. In Proc. SIGCHI 2008, ACM (2008), 255-264.
3. Elson, J., Howell, J., and Douceur, J. R., MapCruncher: integrating the world's geographic information. SIGOPS Operating System Review 2007, 41, 2 ACM (2007), 50-59.
4. Gansner, E. R., Koutsofios, E., North, S. C. and Vo, K.-P., A Technique for Drawing Directed Graphs. Trans. on Software Engineering 1993, 19, 3 IEEE (1993), 214-230.
5. Google Map Maker, Sep 2011. http://www.google.com/mapmaker.
6. Holten, D. and van Wijk, J. J., A user study on visualizing directed edges in graphs. In Proc. SIGCHI 2011, ACM (2009), 2299-2308.
7. Holten, D., Isenberg, P., van Wijk, J.J. and Fekete, J., An extended evaluation of the readability of tapered, animated, and textured directed-edge representations in node-link graphs. In Proc. PacificVis 2009, IEEE (2009), 195-202.
8. Hypercities. http://hypercities.com/. 9. Kim, K., The Grasp on the Chinchôn and the
Landholder through the Land Register and the Cadastral Survey, KYUJANGGAK 2010, 37 KIKS (Kyujanggak Institute for Korean Studies), (2010), 1-30.
10. Lyons, K., A., Cluster busting in anchored graph drawing, In Proc. CASCON 1992, 1, (1992), 7-17.
11. Miyajima, H., Comparative analysis of Kwangmu yang’an and Cadastral, Research on the Cadastral Survey in Chosôn dynasty, Minumsa(1997), 199-248.
12. OpenStreetMap, Sep 2011. http://openstreetmap.org. 13. Rohrschneider, M., Heine, C., Reichenbach, A. Kerren,
A. and Scheuermann, G., A Novel Grid-Based Visualization Approach for Metabolic Networks with Advanced Focus&Context View, In Proc. 17th International Symposium on Graph Drawing 2009, Lect. Notes Comp. Sci.. Edited by Emden Gansner DE, Springer (2009), 268-279.
14. Shneiderman, B. and Plaisant, C., Strategies for evaluating information visualization tools: multi-dimensional in-depth long-term case studies. In Proc. AVI BELIV 2006, ACM (2006), 1-7.
15. Shneiderman, B. Tree visualization with tree-maps: 2D space-filling approach. Trans. on Graphics 1992, 11, 1 ACM (1992), 92-99.
16. Slingsby, A., Dykes, J. and Wood, J., Configuring Hierarchical Layouts to Address Research Questions. Trans. on Visualization and Computer Graphics 2009, 15, 6 IEEE (2009), 977-984.
17. Wikimapia, Sep 2011. http://wikimapia.org. 18. Wood, J. and Dykes J., Spatially ordered treemaps.
Trans. on Visualization and Computer Graphics 2008, 14, 6 IEEE (2008), 1348-1355.