
Electron beam gaseous pollutants treatment - OSTI.GOV
65
ISSN 1425-7351 RAPORTY IChTJ. SERIA B nr 1/99 ELECTRON BEAM GASEOUS POLLUTANTS TREATMENT Andrzej G. Chmielewski | «. 5 :;^frv*ft^-;^SSfStl?if:: PL0000393 m'mmfmrn.r-'T ?^.;:C::-,.v INSTYTUT CHEMII ITECHNIKI JADROWEJ INSTITUTE OF NUCLEAR CHEMISTRY AND TECHNOLOGY WARSZAWA 31 - 0
-
Upload
khangminh22 -
Category
Documents
-
view
5 -
download
0
Transcript of Electron beam gaseous pollutants treatment - OSTI.GOV

ISSN 1425-7351
RAPORTY IChTJ. SERIA B nr 1/99
ELECTRON BEAMGASEOUS POLLUTANTS
TREATMENT
Andrzej G. Chmielewski
|«.5:;^frv*ft^-;^SSfStl?if::
PL0000393
m'mmfmrn.r-'T
?^.;:C::-,.v
INSTYTUT CHEMIIITECHNIKI JADROWEJINSTITUTE OF NUCLEARCHEMISTRY AND TECHNOLOGY
WARSZAWA
3 1 - 0

RAPORTY IChTJ. SERIA B nr 1/99
ELECTRON BEAMGASEOUS POLLUTANTS
TREATMENT
Andrzej G. Chmielewski
Warszawa 1999

ADDRESS OF THE EDITORIAL OFFICE
Institute of Nuclear Chemistry and TechnologyDorodna 16, 03-195 Warszawa, POLANDtel: (+4822) 811 06 56; telex: 813027 ichtj pi; fax: (+4822) 81115 32;e-mail: sekdyrn@orange. ichtj. waw. pi
Papers are published in the form as received from the Author
UKD: 621.039.9:628.477IMS: C52.00KEY WORDS: ELECTRON BEAM, FLUE GAS, SULFUR DIOXIDE, NITROGEN
OXIDES, VOLATILE ORGANIC COMPOUNDS, AIR POLLUTIONCONTROL

Electron beam gaseous pollutants treatment
Emission of gaseous pollutants, mostly during combustion of fossile fuels, creates a threat tothe environment.
New, economical technologies are needed for flue gas treatment. A physico-chemical basisof the process using electron beam for the simultaneous removal of nitrogen and sulfur oxidesand volatile organic compounds are presented in this report. Development of the process and itsupscaling has been discussed.
Zastosowanie wiazki elektron6w do usuwaniazanieczyszczen gazowych
Emisja szkodliwych zanieczyszczen gazowych, gtownie w wyniku spalania paliw kopalnych,prowadzi do niebezpiecznego zanieczyszczenia Srodowiska naturalnego.
Poszukiwane s^ nowoczesne, ekonomiczne technologie oczyszczania gaz6w odlotowych.W pracy przedstawiono fizykochemiczne podstawy procesu wykorzystujajcego wiazk?elektronow do jednoczesnego usuwania tlenkow azotu, dwutlenku siarki i lotnychzanieczyszczen organicznych. Om6wiono rozwoj tej technologii oraz zagadnienia zwiazane zzastosowaniem jej w wi?kszej skali.
NEXT PAQiiaft BLANK
E{S) IK I

CONTENTS
1. INTRODUCTION
2. PROCESS THEORY
2.1. ELECTRONS INTERACTION WITH GAS
2.2. RADIOLYSIS OF GASES
2.3. NITROGEN OXIDES REMOVAL PATHWAYS
2.4. SULFUR DIOXIDE REMOVAL PATHWAYS
2.5. NOx AND SO2 REACTIONS WITH AMMONIA
2.6. REACTIONS WITH OTHER NEUTRALIZING REAGENTS
2.7. NjO FORMATION
2.8. VOLATILE ORGANIC COMPOUNDS REDUCTION
2.9. WET AMMONIA DESULFURIZATION PROCESSES
12
121314151718192021
3. LABORATORY AND PILOT INSTALLATIONS
3.1. LABORATORY INSTALLATION AT INCT3.2. PILOT PLANT AT EPS KAWE.CZYN
3.3. PILOT PLANT AT CHUBU EPC
3.4. PREVIOUS PILOT PLANTS
3.5. COMPARISON OF SOLUTIONS APPLIED IN DIFFERENTPILOT PLANTS
3.6. BYPRODUCT APPLICATION
22
2323272830
30
4. INDUSTRIAL PROJECTS
4.1. INDUSTRIAL PROJECT TN CHINA
4.2. INDUSTRIAL PROJECT IN JAPAN
4.3. INDUSTRIAL PRO JECT IN POLAND
31
313232
5. CONCLUSIONS 32
6. REFERENCES 33
FIGURES 38

1. INTRODUCTION
The most important source of air pollution is the combustion of fossil fuels. Among theprocesses in which fuel is used for energy (electricity and heat) production coal burning plays aleading role. Burning fossil fuel is and will be the main source of energy for a long time. In theyear 1995 the power installed based on the coal fired boilers was equal to 870 GW, oil firedboilers 435 GW, while the total world power installed was equal to 2900 GW. According topredictions the total number will increase to 5400 GW by the year 2020, including 1836 GWinstalled in power stations using coal and 648 GW in oil fired power stations [1].
When burning fossil fuels air polluting substances, as particulate, SO2, NOX, volatile organiccompounds (VOC) and other are generated. Exemplary flue gas compositions are presented inTable 1 [2,3,4]. These data give an idea concerning ppssible pollutant concentrations. They vary fromone fuel to another, e.g. for lignite as high SO2 emissions as 5500 ppm are observed. Eventhough the concentration of pollutants is low the global emission is very high for volume offlue gases emitted. In the case of hard coal the volumetric rate of gas flow (per MW of heatcapacity) is in the range 1000-1500 m3/h (gas temperature 393-473 K), lignite - 1550-2200 m3/h(gas temperature 393-473 K). Combustion of one ton of municipal solid waste incinerationcreates 4200 m3 (505 K).
Table 1. Concentrations of pollutants in flue gases from different sources
Pollutants
SO2
scysOxNo2N O 2 / N O K
HClHFCOVOC (mg/m3)particulate(mg/m3)
Carrier gas
N2
CO2O2
H2O
Hard coal Lignite Municipal waste Copper smelter
ppm
350-1700-0.01
200-1600-0.0530-125
5-60300-680
-500-35000
100-2700-0.01
100-500-0.0512-60
0.3-2.6_-
1500-25000
190-290-
50-210_
75011
40-90<20
2000-10000
8.5-10.5%22-580 g/Nm3
1-3_
-
275-1500
vol %
70-8011-154-73-8
60-7811-154-78-24
70-716-127-1410-18
63_
9-1215-17
Worldwide emission of SO2 only from coal fired power stations reaches about 55 millionsmetric tons annualy: 17.5 in the US, 7 in China, 6.6 in CIS, 3.6 in Germany, 1.9 in Poland, 2.2in Bulgaria and 1.3 in Turkey. Emission from domestic and industrial furnaces which use coalas an energy carrier must be added to these numbers. It is necessary to remember that the totalemission is much higher and, for example, in the case of China is equal to 22000 kt/year.

Emission of NOX (recalculated as nitrogen) created by fossil fuel combustion includingengines is equal to 21 million tons (N) annualy [5].
VOC emissions from combustion (not including traffic) reach almost 0.2 million tonsannualy in the US only [6]. The total emission of this pollutant in GB was equal to 1.8 milliontons and 2 million tons in France in 1989 [7].
Air pollution caused by particulate matter and other pollutants not only directly affect theenvironment but by contamination of waters and soil leads to their degradation. Wet and drydeposition of inorganic pollutants leads to acidification of the environment.
These phenomena affect people's health, increase corrosion, destroy cultivated soil andforest. Most of the plants, especially coniferous trees are not resistant to the effect of sulfur andnitrogen oxides. Following longer exposition leaves become yellow and fall down. Wide spreadforest damage has been reported in most Central and Eastern European countries, as well as in thenortheastern USA and Canada. Many cultivated plants are not resistant to these pollutants aswell especially in the early period of vegetation.
The scheme, so called "acid rains" formation, is presented in Fig. 1 [8]. Transportationdistance of the pollutants, before transferred to the acids and deposited, is equal to hundreds orthousands kilometers. In many cases pollutants are deposited over the teritory of another countrywhere emitted. Therefore, this is a global problem and subject of international treaties.
This is the reason why in most countries all over the world emission standards have beenintroduced [9].
The mechanisms of pollutants transformation in atmosphere are described by environmentalchemistry. The processes are rather complicated, some not very well clear so the reactionsscheme differs from source to source. The pathways depends on many conditions (e.g.darkness, sunshine, air humidity or presence of dust or water droplets, presence of otherpollutants). However, because there is a very big similarity between those reactions whichoccurs in atmosphere and in irradiated gas, some of them are discussed below [10,11,12,13].
An important role in process mechanism is played by photochemistry. These reactionsconcern molecules which absorb highly energetic light in the region 300-700 nm. A simplifiedscheme of these reactions is given in Table 2.
Table 2. Photochemical reactions in atmospheric air
A - ^ A'
A' -^ A + hv
A' +M -» A + M
A' -> B + C
A' +B -> C +
so2 - ^ s c v<300 nm
NO2 -!2-> NO + O290-430 nm
O 2 - ! 2 - > O + O '<242 nm
activation
fluorescence
deactivation
dissociation
direct reaction

Table 3. Sulfur dioxide oxidation pathways
Gas phase
Direct
I. 2SO2 + O2 - ^ 2 S O 3
2. chain reaction
so2 - ^ s c v<300 nm
SO2 +SO2 -> SO3 + SO
so2 • + o2 -> so3 + 0SO2 + O -» SO3
O2 + O - • O3
so + o2 -> so3endRadical
SO2 + OH + M -» HOSO2 + M
SO2 + HO2 -> OH + SO2
SO2 + RO2 -> RO + SO3
Liquid phase(droplets, clouds, adsorbed layer)
Pure water
chain reaction
SO2 + H2O -» SO2 H2O
SO2 H2O -> HSCV + H*
HSO3- - ^ HSO3
HSO3 + O2 -> HSO5
HSO5 + HSO3' -> HSO3 + HSO5'
HSOj+HSO3 -» 2HSO4'
HSO3 + HSO3 -> end
Catalyzed (Mn, Fe, Cu)
xSO2 + Mn2+ -> [Mn(SO2)x]2+
HS03" -*-> HSO3
HSOs + HSO3 -> end
Direct photoxidation is insignificant in the case of SO2 conversion in the air. More importantis the oxidation through photochemically formed radicals (see Table 3). The most importantreaction is the one with OH radicals. Hydroxyl radical is produced through different secondaryphotochemical reactions:
H + O 3 -»OH + O2
NO2 + NO + H2O -> 2HNO2
CH3 + O2 -> CH2O + OH
2NO + 2OH
(la)
(lb)
(1c)
an important role in the SO2 oxidation process is played by the HO2 radical as well, which canbe formed in the reactions:
OH + O3 -> O2 + HO2
CH3O + O2 -> CH2O + HO2
(2a)
(2b)

In the liquid phase this radical could be produced, by a Fenton type reaction (metalion/H2O2).
Conversion of SO2 in water droplets, e.g. fog, cloud, rain, snow or adsorbed water layerplays a much more important role than previously described the "dry" reaction. The firstphysical step is the SO2 dissolution in water. The solubility is temperature dependent and atequilibrium depends on SO2 partial pressure.
The oxidation of SO2 in the water solution is accelerated by a catalyst, e.g. magnesium,iron, copper ions which are always present in trace concentration.
Another pollutant, emitted NO, is oxidized and transformed into nitric acid by the wayspresented in Table 4. The first pathway is of small importance and NO in the atmosphere ismainly oxidized by ozone.
The above listed reactions are more complicated when hydrocarbons or different pollutantsare present in the air. Presence of NO* and hydrocarbons enhance oxidation of SO2.
The third problem discussed here, connected with human activities, is the emission ofvolatile organic compounds to the atmosphere. The main sources are: vehicle exhaust,evaporation of petrol vapors, solvent usage, industrial processes, oil refining, land filled wastes,food manufacture, agriculture and fossil fuel combustion. This emission causes: stratosphericozone depletion, ground level photochemical ozone formation, toxic or carcinogenic humanhealth effects, enhancing the global greenhouse effect, accumulation and persistence in theenvironment [7].
Table 4. NO transformation pathways
Oxidation
2NO + O2 -> NO2
NO + O3 -> NO2 + O2
Dissociation
NO2 - !=-• NO + OO + O2 + M -> O3 + MO3 + NO -> NO2 + O
Acid formation
O3 + NO2 -> NO3 + O2
NO3+NO2 -> N2O5
N2OS + H2O -> 2HNO3
Another problem discussed recently, is the combustion of municipal solid waste. Wasteincineration leads to volume and weight reduction, destruction of some components anddetoxification of others, destruction of biodegradable compounds which emit methane to theatmosphere in an uncontrolled manner, energy recovery from organic compounds withadequate calorific value that leads to fossil fuel consumption reduction [4].
The public concern over incineration is connected with the identification of chlorinateddibenzo-p-dioxins and dibenzofurans in incinerator emission. These emissions are observedwhen incomplete combustion may occur when the incinerator is improperly operated, forexample, operation at excessively low temperatures (below 800°C) or overloading of the plant.
10
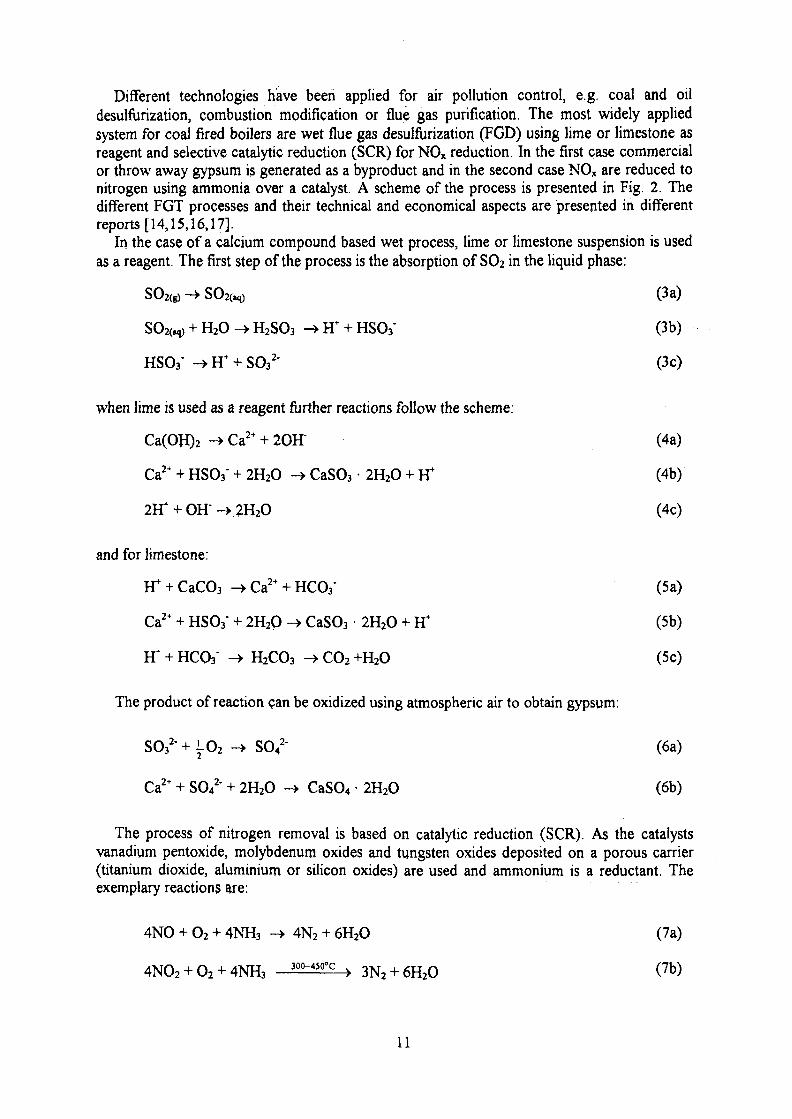
Different technologies have been applied for air pollution control, e.g. coal and oildesulfurization, combustion modification or flue gas purification. The most widely appliedsystem for coal fired boilers are wet flue gas desulfurization (FGD) using lime or limestone asreagent and selective catalytic reduction (SCR) for NOX reduction. In the first case commercialor throw away gypsum is generated as a byproduct and in the second case NOX are reduced tonitrogen using ammonia over a catalyst. A scheme of the process is presented in Fig. 2. Thedifferent FGT processes and their technical and economical aspects are presented in differentreports [14,15,16,17].
In the case of a calcium compound based wet process, lime or limestone suspension is usedas a reagent. The first step of the process is the absorption of SO2 in the liquid phase:
SO2(g) ~> SO**, (3a)
SO2(«p + H2O -> H2SO3 - • H+ + HSCV (3b)
HSCV -> H+ + SOj2' (3c)
when lime is used as a reagent further reactions follow the scheme:
Ca(OH)2 -> Ca2+ + 2OH" (4a)
Ca2+ + HSCV + 2H2O -> CaSO3 • 2H2O + H+ (4b)
2H+ + OH" -> 2H2O (4c)
and for limestone:
tT + CaCOa ->Ca2+ + HCCV (5a)
Ca2+ + HSCV + 2H2O -> CaSO3 • 2H2O + H+ (5b)
H+ + HCCV -> H2CO3 -> CO2 +H2O (5c)
The product of reaction can be oxidized using atmospheric air to obtain gypsum:
SO32" + i-O2 -> SO4
2- (6a)
Ca2+ + SO42' + 2H2O -> CaSO4 • 2H2O (6b)
The process of nitrogen removal is based on catalytic reduction (SCR). As the catalystsvanadium pentoxide, molybdenum oxides and tungsten oxides deposited on a porous carrier(titanium dioxide, aluminium or silicon oxides) are used and ammonium is a reductant. Theexemplary reactions are:
4NO + O2 + 4NH3 -> 4N2 + 6H2O (7a)
4NO2 + O2 + 4NH3 30°-450°c > 3N2 + 6H2O (7b)
11

both processes are rather complicated chemical technologies and different problems occurduring the installation operation (undersierable reactions, scale formation, clogging, etc.)[18,19],
2. PROCESS THEORY
2.1. Electrons interaction with gas
Fast electrons which have a limited penetration range in matter are a good tool forprocessing of gases of low density (three orders of magnitude lower than that of liquids orsolids). During the movement of electrons through a medium which consists mostly of lightnuclei its energy is dissipated mainly through interactions with the orbital electrons. These aremoved from the former positions and ionization or excitation occurs. The average energy of anion pair formation (©) in gasous material lies between 25 and 40 eV. The ionization potentials jof the gases are lower than the ©-values and the rest of energy oo - j must be used forexcitation. For air © is equal to 34 eV, ionization potential j = 15 eV, so © - j = 19 eV. Thedifferences for the air components are not very big, for N2, co = 34.9, 30.8 for O2 and 32.8 forCO2. Since the excitation energies per atom are <5 eV, several excited atoms are formed foreach ion pair. Along the electron track (Fig. 3) exited and ionized molecules are formed andsecondary electrons are liberated. The penetration range of electrons depends on their energyi.e. in air for 1 MeV electrons is equal to 405 cm, for 3 MeV - 1400 cm and for 10 MeV -4200 cm. Specific energy loss is called stopping power s
s = AEic/Ax [J/m]
and is determined by the atomic composition of matter and is a function of the electronvelocity.Specific ionization is defined by
J = dNj/dx [ion pairs/m]
s = ©J [J/m]
where © is the number of ion pairs formed.
The energy which is transferred to unit mass components is called an absorbed dose.Absorbed energy may be represented in eV/g or SI unit Grey [J/g] (1 eV = 1.602 • 10'12 erg;the formerly by used unit for absorbed dose was rad; 1 eV/g = 1.602 • 10'M rad; 1 Gy = 100rad). The number of events or phenomena which have occurred as a result of 100 eV ofenergy absorbed in the matter (produced or reacted atoms and molecules) is represented by G-value. Most of reactions have G-values <10. In the SI system unit of G is mol/J. Theconversion factor between the two units is 1 mol/J = 9.649 • 106 molecules per 100 eV [20].
In the absence of chemical reactions, the ions recombine, exited species return to theirground states, and energy will appear as thermal energy (heat) that will cause the temperatureincrease. This is a very useful dosimetric method often applied in gas treatment researchsystems.
In rare cases, that have small probability because of small nucleus diameter and its stronglocalization (in comparison to delocalized electrons on orbitals), the electron may interact with
12

electromagnetic field of nucleus which is connected with emission of energy quantum(Bremsstrahlung) or elastic collision. The latter, due to the great difference in masses, occurswithout energy exchange and the electron changes only direction. The former depends on theatomic number and can be neglected for very light atoms as in the case of gaseus mixturecomponents. In the case of gasous mixture processing which is performed in an irradiationvessel, some electrons may reach the vessel walls made of metal. This is a source of low energybremsstrahlung emission and equipment has to be shielded.
There is no possibility of photonuclear reactions which may induce radioactivity in materialsfor photons with energies below 10 MeV. Practicaly, in the case of flue gas treatmentaccelerators with electron beam energy less than 1 MeV are applied so these phenomena donot occur. Accelerators with electron energy up to 10 MeV are used commercialy for radiationprocessing, sterilization and food irradiation.
2.2. Radiolysis of gases
Energy of electrons is absorbed by the components of gaseous mixture proportionally totheir mass fraction. In the case of air or flue gases a matrix consists of nitrogen, oxygen, waterand carbon dioxide. In the case of electron beam irradiation only 6% or less of the absorbedenergy is dissipated in vibrational excitation of molecules. Most of it is consumed indissociation and ionization of molecules which is illustrated by data given in Table 5 [21].Dependence of the ways of energy dissipation on electric field (primary electrons energy) in adry air is presented in Fig. 4 [21]. As it can be noticed from the curves for the low electricalfields (e.g. electrical discharge) input energy is consumed predominantly by the vibrationalexcitation of N2. These are important information for selection of economical methods for gasprocessing.
Table 5. Energy dissipation in the plasma produced by electron beam irradiation of dry air (80%N2 + 20% O2)
Process
N2 vibrational
N2(A3SU
+)
N2(B3ng)N2 dissociation
N2 dissociative ionization
N2 molecular ionization
O2 vibrational
O2(a1Ag)
O2 dissociation
O2 dissociative ionization
O2 molecular ionization
Others
Energy dissipation (% of inputpower)
5.3
1.1
1.8
24.0
13.9
28.3
0.6
0.7
8.3
2.9
2.8
10.3
13

The radiolytic yield of primary reactive species is given in the literature [22,23].
100 ev
4,43 N 2 — > 0.29 N2* + 0.885 N(2D) + 0.295 N(2P) + 1.87 N(4S) + 2.27N2
+ +0.69 N+ +2.96 e" (11)100 aV
5.377 O2 ~~~"> 0.077 O2* + 2.25 O('D) + 2.8 O(3P) + + 0.18 O*+ 2.07 O2+
+ 1.23 O+ +3.3 e- (12)
100 aV
7.33 H2O — > 0.51 H2 + 0.46 O(3P) + 4.25 OH + 4.15 H + 1,99 H2O +0.01 H2
+ + 0.57 OH" + 0.67 H+ +0.06 O* + 3.3 e
100 eV ,
7.54 CO2 > 4.72 CO + 5.16 O(3P) + 2.24 CO2 + + 0.51 CO + +0.07C++ 0.21 O+ +3.03 e" (14)
The G-values for the reactions presented in equations (11-14) are 6±2 that corresponds tothe radiolysis of 25+10 ppm of gas molecules per kGy.
Some of the excited molecules react rapidly with the background molecules to produceadditional dissociation. E.g. excited oxygen atoms O(!D) react rapidly with H2O to formadditional OH radicals.Ions react with H2O to decompose it through a charge transfer
N2 + 2H2O -> H3O+ + OH + N2 (15)
electrons react mainly with O2 to produce O2" or its cluster ion
e" + O2 + M - • O2" + M (16)
These ions neutralize to form HO2
+ O2->HO2 + H2O (17)
Therefore, one pair of ions produce one OH and one HO2 radicals.The radicals produced initially through direct and ionic decomposition processes are OH, N,
H2O, O and H.These radicals react with NO and SO2 which are good radical scavengers.
2.3. Nitrogen oxides removal pathways
In the introduction to this chapter different sources of nitrogen oxides emissions weredescribed. The biggest amount of these oxides is emitted by power plants which burn coal. Insuch a case 95% of the oxides is monooxide (NO) and NO2 is the rest. NO is unsoluble, a littlereactive. Therefore in most cases it is necessary to oxidize it to NO2 before removal or reduceto gaseous nitrogen, as in the case of SCR (see equation 7a). In the case of electron beamtreatment the most effective removal pathways are as follows:
+ M-»HNO2 + M (18)
14

N(4S) + NO->N 2 + O (19)
N(4S)+NO2->N2O + O (20)
The other possible reactions are given in Table 6 and discussed by Busi et al. [24],
Table 6, Radiation induced NO transformation pathways
OH + NO + M -> HN02 + M
OH + NO22 -> NO + HO2
HNO2
N(2D) + O2
N(2P) + O2
HO2 + NO -
> NO2 + H2O
» NO + O
NO+ 0
NO2OH
HO2 + NO2 + M -> HO2NO2 + M
O(3P) + NO + M -> NO2 + M
O(3P) + NO2 + M -> NO3 + M
HO2NO2 -> NO2 + HO2
HO2NO2 + O -> NO2 + OH + O2
HO2NO2 + OH -> NO2 + H2O + O2
2.4. Sulfur dioxide removal pathways
SO2 removal is based on two different pathways: thermochemical oxidation and radiationinduced reaction.
SO2 oxidation in the gas phase is possible through direct photooxidation or oxidationthrough photochemically formed components (e.g. radicals) [6]. Even in the absence of light,SO2 in air is oxidized in the presence of several metal oxides (aluminum, calcium, and iron).
However, conversion of SO2 within liquid droplets, dew and on solid particles surfaces is ofspecial significance for oxidation of SO2. This is a heterogenous oxidation. The process isbased on two steps ab(ad) sorption and chemical oxidation.
The solution of SO2 in water depends on the partical pressure and solubility which istemperature dependent:
H2O(liq) -> (SO2 H2O) (21)
Depending on pH value of water, the SO2 hydrate dissociates to hydrogen sulfite (HSO3) inan acidic environment or to sulfite (SO*-) in an alkaline environment whereby protons (H+) arereleased which are then present in water as hydronium ions (H3O+):
SO2 H2O + H2O <-> H3O+ + HSO; (22)
15

in a slightly acidic range
S02 H20 + 2H2O <-> 2H3O+ + SO (23)
in an alkaline range.
For small droplets and pH values below 6 the equilibrium between SO2 in the gaseous phaseand hydrogen sulfite or hydrate in the liquid phase is quickly reached. With decreasing pHvalues it shifts towards the gasous phase. The factor determining the S02 transformation is theoxidation stage and not the SO2 absorption in water [6],
The process of oxidation of SO2 in droplets depends on many different factors and is notfully known. The oxidation of SO2 by O2 can be accelerated in polluted air by catalysts, inparticular by magnese and ferrous ions.
In the case of electron beam treatment the radical reactions lead to SO2 oxidation and theseare listed in Table 7.
Table 7. Main radical reactions concerning SO2 transformation
OH + SO2 + M -> HSO3 + M
OH + HSO3 -> SO3 + H2O
HO2+SO2 -> SO3 + OH
OH + H2O + SO2 -> HSO3 + H2O
HSO3 + O2 -> SO3 + H2O
SO2 + O2 -> SO3
50 2 + OH -> HOSO2
HOSO2 + OH -> H2SO4
50 3 + H2O -> H2SO4
The mechanism of SO2 oxidation is rather simple and can be represented by the followingsequence:
SO2OH HSO3
OH
H2SO4
H2SO4
(24a)
(24b)
The reaction with OH radicals, as it is seen from this reaction, plays the most important rolein SO2 transformation. The rate constant of the first reaction (with OH) depends ontemperature, pressure and water vapor content.
Gas phase oxidation of SO2 is presented in Fig. 5 where experimental data obtained byTokunaga and Suzuki are compared with the model calculations done by Gerasimov et al.[25].
Similar results have been obtained by Nichipor et al. [26] and data for different initialconcentrations are given in Fig. 6.
A remarkable increase in process efficiency is observed in humid air or water droplets. Thedecrease of initial absolute humidity from 7 to 2% causes an increase of oxidation energy from2 to 15 eV/molecule.
16

In the case of water droplets spray present in irradiation region, the observed chain reactionin the liquid phase leads to a significant energy consumption reduction for the SO2 removal in aheterophaseous air stream. First, this is connected with a well-known, from environmentalchemistry, liquid-phase chain mechanism and secondly with a specially proposed ionic chainoxidation mechanism in a cluster. The phenomena were discussed by Baranchicov et al. [27],
2.5. NO, and SO2 reactions with ammonia
Additional reactions should be considered in presence of ammonia. In the case of NO, theradicals reactions are listed in Table 8. Oxidation process leads to the ammonium nitrateformation NO partly is reduced through the reaction with the ground state nitrogen radical (4S)or the NH2 radical to elemental nitrogen and in a smaller portion to dinitrogen monoxide[28,29,30].
Table 8. Radical reactions in presence of ammonia
N(2D)
N('P)
NH 2 H
N H ^
N H ^
NH +
NH +
+ NH3
+ NH3
N0->
N O 2 -
NO->
NO ->
NO2 -
->NH-+
-^NH +
N2 + H
> N2O +
N2H +
NH2
NH2
2O
H2OOH
N2 + OH
>N2O + OH
SO2 is converted to sulfuric acid which reacts with ammonia to form ammonium sulfate.The pathways of NOX and SO2 removal are presented in Fig. 7 [30].
It should be noted that SO2, beside the radical reactions, is removed via a thermochemicalreaction. The mechanism of the second reaction is not fully known and some differences in theresults obtained by different investigators were reported.
According to the observations from the environmental chemistry [31], the presence ofammonia in the air polluted by SO2 does not lead to the formation of particles. But it has beenrealized that air photolytic particles, enriched in SO2, are of larger size when NH3 is added.SO2 dissolved in atmospheric water droplets form H2SOa which is then oxidized by oxygendissolved in droplets to sulfuric acid. The oxidizing action diminishes in proportion toincreasing acidity. The embryos are formed.
NH3 + H2SO4 nH2O --> NH4HSO4 • nH2O
NH3 + NH4HSO4 • nH2O -^ (NH4)2SO4 • nH2O
2SO2 + 2H2O +NH.
(25a)
(25b)
(25c)
17

The products of the first two reactions are saline embryos, a medium resulting in SO2catalytic oxidation. Particle development continues as long as NH3 is fixed and is able toneutralize the acid resulting from catalytic oxidatjon while SO2 is fixed by the particle.
When an electron beam is applied, the oxidation of SO2 is much faster due to the radicalreactions discussed earlier. The formed SO3 condensates in the presence of water vapor even athigh temperatures. The dependence of sulfuric acid dew point on the concentration of SO3 andH2O is presented in Fig. 8. In presence of ammonia the reactions of the type illustrated byequations (25a-c) play a very important role in the overall SO2 removal efficiency.
The reaction of ammonia with SO2 was studied by many researchers in laboratoryexperiments. The role of water vapor was proven [32,33], as it can be noticed from the datapresented in Fig. 9 [33], the reaction practically stops at temperatures below the dew point.The positive role of increasing oxygen and nitrogen oxide concentration on the removalefficiency was observed [34]. However, in these investigations gas mixtures containing pureSO2 were studied and the dew point temperature is characteristic for a given content of watervapor. Quite a different case concerns real flue gases from a power plant where SO3 is alwayspresent.
The dew point temperature is quite high (see Fig. 8), therefore the condensation of sulfuricacid occurs and the heterogeneous/catalytic reactions discussed earlier take place.
Temperature dependence of the thermochemical reaction in the real conditions of coal firedpower plant is presented in Fig. 10 [25]. The reaction is irreversible and has the first orderwith respect to both SO2 and NH3:
d[SO2]/dt = -kt[SO2] [NH3] (26)
The rate-limiting step is the reaction NH3 + SO2 -> NH3 • SO2 having a rate constant kt =7.3 10"16cm3/s at 23°C. Further reactions leading to the condensation and product oxidationoccur rather rapidly. The temperature dependence of the reaction constant could be presentedby the equation [25]:
Kt = 4.55 • 1 (Ty exp (9000/T) (27)
The understanding of the physico-chemical mechanism of the process allows theoptimization of the removal process to achieve the highest SO2 removal efficiency at the lowestpower (beam) consumption.
2.6. Reactions with other neutralizing reagents
Sulfuric and nitric acids formed during flue gase treatment easily react with other thanammonia neutralizing reagents as well. Ca(OH)2, KOH or NaOH can be used. Sulfates andnitrates result as products of these reactions. Tests have been performed with the usage of thesereagents and are discussed later.
2.7. N2O formation
Nitrous oxide (N2O) occurs in the troposphere at the background concentration of about300 ppb and measurement over the past two decades has shown that its concentration is rising ata rate of about 0.2-0.4% per year. The molecules, being chemically stable in the troposphere (thelife time of approximately 150 years) if transported to the stratosphere undergo conversion to
18

x
NO, which subsequently reacts with O3. Hence an increase in N2O emission is followed byfurther O3 depletion in the stratosphere.
Anthropogenic sources, including the denitrification of chemical fertilizers and thecombustion of fossil fuels are estimated to comprise one-third of the total N2O produced.Nitrous oxide is also emitted from different technologies, for example, in the deNOtechnologies. In the deNOx process exploiting NH3 for nitrogen oxide reduction, the secondaryundersired reactions are observed:
(a) For selective catalytic reduction (SCR)
2NH3 + 2O2 -> N2O + 3H2O (28)
(b) For selective noncatalytic reduction (SNCR)
2NH3 + 2O2 -> N2O + 3H2O (29)
(c) For electron beam flue gas treatment (EB process)
O (30a)
NH3 + OH -> NH2 + H2O (3 Ob)
NO2 + NH2 -> N2O + H2O (30c)
In the case of SNCR system (especially urea based systems) the ammonia decompositionreaction results in the emission of N2O, 10-15% of the processed nitrogen oxides. If an SNCRsystem reduces the NOX emission by 50%, the net NOX reduction, considering the N2Oemission, is only 35-40%. The SCR system converts less than 1% of NOX to N2O [35], but thisfigure increases if the activity of the catalyst decreases during the time of the operation. A newproblem arouse when the fluidised bed combustion of coal has been introduced. In this processa much higher concentration of N2O in the flue gases is observed in comparison withconventional combustion process [36], The emission of N2O in the EB process is observed andresults in up to 10% NOX reduction in the case of a single irradiation process. It was one of thetasks in the optimization studies performed at the Kaw^czyn pilot plant. However, aninvestigator has to be very careful in sampling and analyzing of flue gases. A significantamount of artefact N2O may be formed within the sampling container in the simultaneouspresence of NOX, SO2 and moisture. The method of N2O analysis is given in [37].
2.8. Volatile organic compounds reduction
Volatile organic compounds (VOC) are mostly toxic substances affecting human beings orthe environment directly or as an ozone precursor. Ozon is formed as a product of the reactionof VOC with NOX. Reactions leading to ozone formation are given in Table 9. VOC react introposphere with hydroxyl radicals to form organic radicals which, through the reaction withoxygen, form peroxy radicals oxidizing NO. As a result of the photochemically inducedreaction of NO2 with oxygen ozone is formed.
19

Table 9. Ozone formation in troposphere
OHR +RO2
NO;0 +
+ RM
Oz->+ N 0
0 2 ->
->H;
R02
NO
03
0
0:+
+
0
R
Different processes have been introduced for VOC removal from industrial gases.Adsorption, thermal catalytic and non catalytic combustion, biofiltration, etc. Thermalcombustion for low VOC concentrations is not very economical because the whole stream offlue gas has to be heated.
Electron beam application for the VOC destruction has the advantage due to the fact thatthe energy is directed prefentially toward pollutant molecules which act as scavangers offormed radicals. A carrier gas is heated slightly. A fast electron creates up to 3000 secondaryelectrons which slow down very quickly on the neutral species to the energy 0.025 - 1 eV.
Mechanism of energy transfer on the example of chloroorganic compounds destruction isgiven in Table 10 [38].
The oxygen and chlorine radicals produced will react with other VOC molecules. Even theconcentration of halogenated organic compounds is low in comparison with nitrogen oroxygen the attachement of slow electrons to them is much more probable.
Table 10. Mechanism of chloroorganic compounds treatment
e'H
e'H
e'H
e'H
cr
- 0 2 -
-ccu-C2H3
• 0 2 * - > 0 +0"
-» CCU*' CCI3 +
CI3 -> C2H3Cl3*" -
C 2 r lL43 —> L-2XIL.I3 —>
+ M -•• Cl •+ M'
cr-> C2H3CI2 + c r
C2HCI2 + c r
where * indicates an activated, unstable species and M is any species in the reactor
The OH radical plays an important role in the case of hydrocarbon degradation [39].
n - CH3COOC4H9 + OH -> CH3COO + H2O (31)
The reactions of OH radicals with aromatic hydrocarbons occur via the addition of OHradicals to the aromatic ring (at temperature below 320 K). Two possible reaction pathways,namely the hydrogen abstraction and oxygen addition can be considered for reactions of theintermediate radicals with oxygen. The oxygen addition reaction may give a ring cleavage,which leads to the production of various organic compounds through the reactions with NOand/or oxygen. The predominant primary products of the ring opening reactions are simplealdehydes under tropospheric reaction conditions. These opening reactions are of minorimportance compared with aerosol formation. The aerosol formation proceeds via retainmentof the aromatic structure which is favourable from the energetic point of view. Such pathwaysmay be a combination of oxidation and substitution reactions which would lead to thesubstituted xylenes, toluenes and benzenes of low vapor pressure. Parallel to such reactions,
20

coagulation of the molecules may take place to produce polymeric particles. With aliphatichydrocarbons like butylacetate, no comparable reactions are possible, hence aromatichydrocarbons like xylene are much more favourable for aerosol formation upon electron beamtreatment [40].
The electron-generated plasma is used to decompose different chlorinated hydrocarbons.These compounds with more chlorine molecules are more easily decomposed.
The electron-capture cross section is a measure of how readily a molecule captures a slowsecondary electron. Molecules that have electronegative elements such as chlorine or fluorineare more likely to attach to free electrons, and these molecules have higher electron-capturecross sections. Consequently, the rate constans of their dissociation reactions will be higher.
For example CCU, which has four chlorine atoms per one carbon atom, has the highestelectron-capture cross section of any chlorinated molecule. Therefore, its rate constant fordissociative electron attachment is high and, as a result, the molecule will decompose moreeasily in the plasma than a VOC with a similar decomposition mechanism but of lowerelectron-capture cross section.
The energy efficiency for CCU is intensitive to the gas temperature, at least up to 300°C.The mechanism of the process is discussed in [40], The chain reactions may play a role in thedecomposition of VOC (e.g. TCE) as well. Mechanisms of most of the reactions are still notvery clear. In the case of compounds discussed in [40], toluene and freon 113 decompositionof the first compounds, the leaving group is either a hydrogen from the methyl group and inthe second case the leaving group is probably a chlorine atom.
The bond energies of these compounds are listed in the paper published by Vitale et al. [40].Dose dependent destruction of toluene and freon 13 is given in Fig. 11 [40] and energyrequirements for different compounds are given in Fig 12 [40].
2.9. Wet ammonia desulfurization processes
Absorption of SO2in ammonia water is used for flue gas desulfurization as well.The principle reaction is:
NH3 H2O + SO2 -> (NH4)2SO3 + H2O (32)
(NH4)2SO3 + SO2 + H2O -> 2NH4HSO3 (33)
2NH4HSO3 + NH4OH -> (NH4)2SO3 + H2O (34)
The reaction is reversed at temperatures 80-120°C, SO2 can be concentrated and the liquorreturned to recirculation. Eventualy, in a nonregenerative process ammonium sulfite is oxidizedto ammonium sulfate:
2NH4HSO3 + O2 + 2NH4OH -> 2(NH4)2SO4 + 2H2O (35)
The process has been applied for a sintering plant off-gas desulfurization using ammoniumwater from the coke production plant (NKK Keihin works).
For coal fired power plants the process was applied by Walther Co. at HKW - Power Plant(Karlsruhe) [41].
The problems concerning aerosols emission have been solved by Krupp Koppers which operatesa 750000 NmVh installation at Grosskraftwerk, Manheim [42]. General Electric has introduced theprocess in the US [43] SCR process using the same reagent which is used for NOX removal in the
21

Krupp process. Ammonium sulfate is recrystallized from the absorption liquor and is sold as afertilizer. The 30-40% wt ammonium sulfate solution yielded in the scrubbing process can beapplied directly as a liquid nitrogen fertilizer as well [44].
There is a big similarity between this byproduct and that originating from electron beam fluegas treatment. In the second case the byproduct is enriched in ammonium nitrate.
The granular ammonium sulfate cost (FOB price) is 114 USD/ton in the South Easternregion and 146 USD/ton in the Great Lakes region (1994). The export price of standard-gradeammonium sulfate (FOB Gulf Cost) is roughly 52 USD/ton [45].
The heavy metal content measured for ammonium sulfate obtained at the HKW-WestPower Plant desulfurization plant was in ppm [41]:
Cd0.61
Cr5.21
Cu3.27
Hg0.67
Ni3.99
Pb12.5
Zn32.1
much lower than a maximum allowable content:
20 670 670 10 335 670 2000
and much lower than present in the commercially available NPK fertilizer:
4-9 80-110 20 0.5 <40 <100 <210-240
The liquid solution of ammonium sulfate used as fertilizer contains 40% of the salt, giving asulfur concentration of 9.7% and nitrogen concentration of 8.5%. Therefore, ammoniumsulfate can be incorporated into any of the urea and ammonium nitrate fertilizer to give anagronomically desired sulfur/nitrogen ratio [44].
3. LABORATORY AND PILOT INSTALLATIONS
Small laboratory or pilot plants with a gas flow up to 1000 Nm3/h were constructed byEbara-JAERI, Takasaki [46,47], KfK, Karlsruhe [48,49] and TU, Karlsruhe [50,51],
An installation with a gas flow of 400 Nm3/h has been operated in the INCT, Warsaw,Poland [52].
Small laboratory units have been in operation in JAERI, Takasaki [53], IPEN, Brasil [54],INPAS, Shanghai [55] and TU, Helsinki [56]. In all cases, simulated off-gases or gases fromoil or gas fired furnaces were treated.
Larger installations of up to 20000 Nm3/h in capacity were constructed in Japan (Ebara)[57], the USA (Ebara) [58,59] and Germany (Badenwerk) [60,61]. The first pilot was installedto clean flue gases from an iron-ore sintering machine. The others were used for cleaninggases from coal-fired boilers.
A combined technology of the spray drayer-electron beam system, using lime as alkalireagent was investigated in the USA (Cottrel) [62].
Two modern pilot plants based on the multistage gas irradiation principle were constructedin Poland (INCT-EPS Kaw?czyn) [63] and in Japan (Ebara-JAERI-Chubu Electric) [64]. Thefirst pilot plant is still operational [65].
22

3.1. Laboratory installation at INCT
A laboratory unit (Fig. 13) with a gas flow capacity of up to 400 Nm3/h has beenconstructed at the INCT [66], The composition of flue gases from two natural gas fired boilerscan be ajusted by the dosage of different gaseous pollutants (SO2, NOXJ VOC). An irradiator,accelerator ILU-6 is used with an electron beam energy in the range 600-1000 keV. Theinstallation is completed with two independent microwave generators. This allows toinvestigate a combined removal concept based on the simultaneous use of electron beam andstreams of microwave energy to produce free radicals in the reaction vessel [67]. Thesimultaneous use of the electron beam and microwave energy increase the total removalefficiency at the same power consumption [68].
The system has been used for the investigation of SO2 removal from off-gases with highSO2 concentration (up to 15%). This range of SO2 concentration is observed in the case of off-gases emited in the processes applied in the copper industry [69].
Flue gas with high SO2 content can be effectively cleaned by NH3 and electron beamtreatment, even at higher than optimal, temperatures. The efficiency 90-95% of the SO2
removal was obtained in specific conditions (SO2 content 10-15%). The ammoniastoichiometry, humidity and a dose up to 7 kGy have a sharp influence on the SO2 removalefficiency. The product formed in the process is ammonium sulfate. Removal efficiency for oneof the investigated cases is given in Fig. 14 [70].
The other problem investigated was electron beam induced destruction of VOC. A veryresistant to radiation benzene vapor was investigated. The doses were established by using foil(PCV) dosimeters in accordance with the standard procedures. Simulated gases werecomposed of air, 10% water vapor and two initial concentrations of benzene 3.48 lO^g/cm3
and 3.5 \O'5g/cm3, A large number of unidentified organic products obtained by irradiationwas detected by gas chromatography. A Perkin Elmer 8700 gas chromatograph was used forthe determination of radiolysis products. The chromatograph was equipped with a flameionization detector (FID) and a capilar column of 12.5 m length. Temperature of the oven waskept at 110°C (isothermal) and the gas flow was 40 ml He/min. These conditions assured themeasurement of phenol with an accuracy of 3.48 10"I2g/cm3. Phenol constitued the mainproduct of benzene radiolysis. The removal efficiency amounted to ca. 45% for benzene underthe dose 40 kGy (Fig. 15). The relatively low efficiency is caused by exceptionaly highresistivity of benzene to radiation.
The described laboratory installation can be used for the development of new electron beambased processes and for the investigation of optimal physico-chemical parameters.
However, this unit, and other units of this size used in different laboratories all over theworld, cannot be used for process upscaling. Dimensions of laboratory irradiation chambers donot allow to study the effect of electron (with limited range of penetration) interaction withseparate fragments of flue gas streams flowing inside large ducts. Industrial pilot plants (size of20000 Nm3/h and bigger) are necessary to be constructed to investigate these phenomena.
3.2. Pilot plant at EPS Kaweczyn
A pilot plant was constructed at the Electropower Station Kaweczyn [52]. It was installedon a bypass of the main flue gas stream from a boiler WP-120. A scheme of the installation isgiven in Fig. 16. Two accelerators ELV-3a (50 kW, 500-800 keV) were installed in series onthe reaction vessel. For the first time in an industrial pilot installation, a cascade double gasirradiation was applied.
23

Flue gases are cooled down in a spray cooler working in "dry-bottom" conditions and thenirradiated in two steps in the reaction vessel which is a cylinder 7 m long and 1.6 m in diameter(Fig. 17) [71]. The double window system was employed, with the windows made of 50 pirnthick titanium foil. An "air curtain" was used to separate the secondary window from thecorrosive flue gas. A construction of the primary window (accelerator window) which iscooled by an air stream is presented in Fig. 17. Gaseous ammonia is injected by nozzlesupstream of the flue gas irradiation. Aerosols formed in the process (ammonium sulfate andnitrate) are captured in filters: particles size distribution is given in Fig. 18. The particlesformed are small with diameter lower than 1 micron and sticky. Two types of filters wereapplied - a bag filter and a gravel bed filter [72,73]. The bag filter consists of fourcompartments with a total filtration area of 600 m2 (512 bags). An "off line" regenerationmode was used (one compartment in regeneration, three others in operation). The bag filtersystem is equipped with two lines for filtration aid dosage. One of them could be used forprecoating, while the second one allowed the introduction of additional powder during thecontinuous operation. Another system for filter preheating and air conditioning was designedand applied. Filter walls are insulated and bottom heated. Different types of bag fabrics wereinvestigated and cages construction modified to obtain good bag regeneration (cleaning fromthe product). The continuous 30 days test of the installation, equipped with the filter described,has been performed. Very high aerosol removal efficiencies have been achieved (over 99.8%).However, to obtain the stable operation of the filter (constant pressure drop) it is necessary toapply filtration aid (silica, fly ash, dolomite etc.) and to keep a filter temperature in the range70-80°C.
The wet gravel bed filter has been designed together with Forschungszentrum, Karlsruhe wherethis type (dry and wet) of equipment has been developed for the process. In this case thebyproduct (soluble) can be easily separated from fly-ash (unsoluble). The off-line cleaning ofthe gravel from fly ash has been applied in the system. The experiments have proved that thefly ash presence in the flue gas do not affect SO2 and NOX removal efficiency (investigatedrange 100-700 mg of solid particles/Nm3 at the inlet). An additional SO2/NOX removal wasobtained in the wet filter. However, the product in this case is obtained in the form of aqueoussolution (liquid fertilizer or crystallization). The concentration of the nitrogen salts cannot behigher than 40% wt.
The pilot plant is equipped with a modern monitoring and control system [74,75] whosescheme is given in Fig. 19. The manual sample grab methods were used for their verification.
The first experiments were performed with gas humidity of 7-8% vol and its temperature (atthe irradiation vessel inlet) being 70-80°C. The SO2 removal efficiencies, depending on theinlet concentration, were 70-90%, while the NOX removal efficiencies, depending on the dose,process parameters and inlet concentration, were 70-90%.
The fact that the NOX removal efficiency depends mostly on the dose and, on the other handSO2 is mostly removed via a thermal reaction, impose an interesting observation concerningthe ammonia consumption in both reactions. The thermal reaction efficiency for SO2 removaldecreases with temperature. Thus, at higher temperatures more ammonia (at constantstoichiometric ratio) is available for concurrence of NOX reductive processes. However, this isnot the only phenomena which affect the process, that is well illustrated by the furtherdescribed experiment (the influence of ammonia stoichiometry). SO2 is more reactive withammonia, at a given dose, SO2 removal efficiency is strongly dependent on ammoniastoichiometry. There is not a big influence of ammonia stoichiometry (at a given dose) on NOremoval efficiency; this is well ilustrated by the fact that the reaction yields (NO reduction andoxidation path ways) depend mostly on the dose.
The first set of experiments, as has been already mentioned, was performed for low gashumidity and at rather high temperatures. For the second set of experiments the humidification
24

system of the Kaw^czyn pilot plant has been upgraded. The high enthalpy water was used,packing was introduced into the column and water recirculation was applied. The humidity offlue gases can be increased up to 15% vol and the inlet temperature reduced down to 458C. Inthese conditions the SO2 removal efficiency as high as 98% can be achieved (Fig. 20). Due tothe thermal reaction a very low dose is required, to obtain a high removal efficiency (Figs. 21,22). It is important to note that an adequate dose is necessary to obtain the oxidized byproducts(sulfate and nitrate). In the case when a moderate NO* removal efficiency is required, theeconomical competitiveness of the EB process with conventional technologies further increases.
A high removal efficiency was obtained using a bag filter, the other methods of filtration,gravel bed [76] and wet gravel bed filters were investigated. However, all these experimentshave proved that no special methods of filtration should be developed, the most adequate arealready offered by equipment manufactures e.g. dry and wet ESP's.
The most important problem to be solved in process upscaling is the irradiation vesselconstruction. In the Kawe.czyn's pilot plant longitudinal, double irradiation of the flue gaseshas been applied.
Because of the limited electrons penetration the adequate beam energy is required (Fig. 23)[77].
A marker seen on the photographs presented in Fig. 24 has been installed in the horizontalaxis of the irradiation vessel. The glowing ionized gas plum only in the case of electrons energy0.7 MeV covers the whole irradiation vessel intersection. A quantitative penetration of thebeams of 0.6 MeV and 0.8 MeV energy is presented on the drawing presented in this Fig. 22as well. The losses in the beam energy delivered to the gas consist of two components; thestopping power of two titanium foil windows and, the air in the gap between them and theabsorption in the walls of the irradiation chamber. Of course losses connected with gas heatdisspation are not discussed here. For electrons with lower energy the losses of power in thewindows system are higher. On the other hand for higher energy electrons the energy absorbedby the vessel walls (and losses) are higher. Therefore, an optimum energy of electrons for agiven vessel design exists. For an optimum energy the highest NOX removal efficiency can beachieved.
The improvement of removal efficiency due to the limited electron penetration through theflowing gas can be achieved by a multistage irradiation. The gas mixing between irradiationstages is favorable for the process. The further optimization can be achieved by adequate dosedistribution between irradiation stages [78].
The dose dependence of NOX removal for a single irradiation process vessel is given by theequation:
7 N O >= 100[(NOX)O - (NOX),]/(NOX)0 = ki[l - exp(-K2D)] (36)
where:
(NOX)0 - concentration of NOX at the inlet to process vessel,(NOx)i - concentration of NOX after the first stage of irradiation,D - dose absorbed in process vessel.
K2 = k2/(NOX)0 (37)
ki, k2 - constant process parameters
25

For a two-stage exposition we obtain:
a = 100[(NOx)o - (NOX)2]/(NOX)0 = 100- 0.01yeyf (38)
where:
a - NOX removal efficiency,(NOX)2 - concentration of NOX after the second stage of irradiation
Yc = 100-Ki[l - exp(-K2Dx)] (38a)
Yf = 100 -Ki[l - exp(- K2Dy/0.01ye)] (38b)
x - dose delivery ratio at first stage,y - dose delivery ratio at second stage,x + y = 1 for double irradiation
In the case of three-stage irradiation process vessel
a = 100[(NOX)0 - (NOX)3]/(NOX)0 = 100 - 0.0001yby«yd (39a)
where:a - NOX removal efficiency,(NOX)3 - concentration of NOX after the third stage of gas irradiation by an electron beam
Yb = 100 - Ki[l - exp(-K2Dx)] (39b)
Ye = 100 - Ki[l - exp(K2Dy/0.01yb)] (39c)
Yd = 100 -Ki[l - exp(K2Dz/0.0001ybye)] (39d)
x - dose delivery ratio at first stage,y - dose delivery ratio at second stage,z - dose delivery ratio at third stage,x + y + z = 1 for triple irradiation
For uniform dose delivery x = y = z = - .
A comparison of the experimental data for a single-stage and two-stage irradiation indicatesgood agreement. The case of three-stage irradiation concerns only the data theoreticallycalculated since at the pilot plant only the cases of single-stage and two-stage irradiations canbe studied.
A deeper analysis of the multistage process of the flue gases exposition by an electron beamrevealed that in the case of NOX removal a non-uniform power distribution of the acceleratorsat the successive stages will provide further energy savings.
An optimal distribution of the electron energy dose supplied to the gas has been calculatedusing the dependences for NOX removal after its two-stage and three-stage exposition by anelectron beam of a given energy.
26

The Hook-Jeeves procedure has been applied to find a minimum value of the aim functiondefined as:
0 , K,, k2, D) = f\ 100 - a(T, K,, k2, D) | dD(40)
where:
ftT, Ki, k2, D) - the aim function,a ( r , Ki, k2, D) - degree of NOX removal (the model curve),T- vector of the searched parameters,T~ [x»y] - for the two-stage gas exposition,T= [x,y,z] - for the three-stage gas exposition,D - dose (variable parameter),Ki, k2 - constant process parameters,Dg - upper limit of D variation.
From the analysis the following conclusions can be drawn:- for the two-stage gas exposition by an electron beam the optimal ratio of the dose delivery
is: x = 0.56, y = 0.44,
- for the three-stage irradiation: x = 0.394, y = 0.332, z = 0.274.
The experiments have confirmed theoretical computations. However, the energy savings inthe case of non equal stage irradiation are not so significant as in the case of the substitution ofthe single-stage irradiation by the two-stage one.
3.3. Pilot plant at Chubu EPC
A pilot plant was built in the site of Shin-Nagoya Thermal Power Plant of Chubu ElectricPower Company. The test was conducted from November 1992 to December 1993. The mainpurpose of the test was to obtain engineering data for the designing of a full scale plant [79].
A flow chart of the plant is shown in Fig. 25. A pulverized-coal-firing-boiler was exclusivelyoperated to produce gas (12000 Nm3/h) for the test. The burning condition of the boiler wasregulated to get expected NOX concentration. Powdered sulfur was burned with coal to controlthe SO2 concentration in the flue gas. After removing fly ash with a dry electrostaticprecipitator (ESP), the flue gas was cooled down to 1IO°C by a gas-gas heat exchanger(GGH), and cooled again by sprayed water to any temperature between 55 to 110°C in atowering spray cooler (SC). The sprayed water was perfectly evaporated in the cooling tower30 meters high.
The high energy electrons from three electron accelerators were introduced to the flue gasin a process vessel (PV) through two titanium window foils. After the addition of ammonia, theaccelerators were set on line during the first period of the test (one side irradiation), whereasthe following period of the test, the center accelerator was moved to another side of theprocess vessel (both side irradiation) to compare the effect of the uniformity of dosedistribution in the process vessel on NOX and SO2 removal efficiency.
27

The byproduct was collected by the combination of an ESP and bag filters in a baghouse.SO2 removal efficiency showed a strong dependence on temperature which is presented in Fig.26. The dose of 8 kGy was enough to achieve 95% SO2 removal at the 62-64°C outlettemperature. NOX removal was strongly dependent on the initial NOX concentration (Fig. 27)and not very much affected by temperature changes. For 80% removal of NOX, 8 kGy wasenough at the NOX inlet concentration 160-180 ppm, where the dose 10.5 kGy was necesary toachieve the same efficiency at 200-220 ppm.
The aerosol produced was composed of very fine particles with a concentration 3.1-3.3g/Nm3. The ESP demonstrated 99.5% removal efficiency and the outlet paniculateconcentration was 10-22 mg/Nm3, an additional bag filter gave a final aerosol concentration of0.4 mg/Nm3 (total removal efficiency 99.99%).
3.4. Previous pilot plants
The most meaningful for further technology development was PDU (pilot demonstrationunit) constructed by Ebara International Corporation at the Indianapolis Power and LightCompany's EW [80].
The process flow diagram is given in Fig. 28. A sidestream of flue gas from the coal-firedboiler is extracted, analyzed for sulfur dioxide and nitrogen oxides content and fan drafted tothe inlet of the spray cooler. As the gas passes through the cooler, atomized water is sprayedinto gases to reduce its temperature to optimum levels in preparation for irradiation. Speciallydesigned controls enable cooling of the gases down to 16 degrees C above of the water dewpoint without wet bottom operation of the cooler. An upstream ammonia injection port islocated in the flue gas ductwork just prior to the entry of the cooled flue gas into the processbuilding.
In addition to the process vessel, the process building also houses all the electron beamequipment. A cutaway of the building is also shown in Fig. 29. The electron beam system usedin the PDU consists of two 80 kW units operating at 800 kV. Each unit has a dedicated powersupply consisting of an insulating core transformer and DC auxiliary equipment takingconventional 460 volt, three phase power as service power. Each power supply is cable connectedto its electron accelerator/scanner package. This package is mounted integrally on a rolling cartand track system which includes a concrete "plug" door as part of the protection againstgenerated secondary x-rays. This arrangement was adopted to allow maximum serviceability ofthe electron beam while retaining the overall smallest process vessel/e-beam package for anaboveground plant concept. The two guns are horizontally opposed and vertically offset toprovide maximum flue gas energy absorption. Since this absorbed energy is the beam deliveredenergy minus its transmittance and scattering losses, for constant accelerating voltages and fluegas flowrates the dose rate is always proportional to the total beam current. An Ebara designedsecondary window foil system separates the primary window foil in the scanner from thecontact with abrasives and corrosives in the flue gas. The secondary window foil also allowsthe exchange of a failed secondary window foil by remote control with a minimum of off-linetime.
After the inlet ductwork enters the process building vault area, the flue gas flows into theprocess vessel inlet. As a final preparation before entering the irradiation zone, the flue gasmixture is further humidified by the Pre-Reaction Gas Cooling (PRGC) system which againuses atomized water droplets to control the gas temperature rise associated with the exposureto the electron beam as well. Once in the irradiation zone, the humidified gas mixture is subjectto an intense field of energized electrons which collide with the flue gas molecules resulting inmolecular ionization. These ions interact with the flue gas constituents resulting in the creation
28

of free atoms and radical species such as 0 and OH. These are capable of rapid reaction withsulfur dioxide, nitrogen oxides and water in the flue gas to ultimately yield a mixture of finemist and vapor of sulfuric and nitric acids in the process vessel which in turn is neutralizedwhen mixed with the injected ammonia vapor. As the mixture exits the process vessel, it passesthrough the secondary downstream ammonia injection port and enters the retention chamber.At this point the ammonium sulfate and ammonium nitrate-sulfate particles have already startedto form.
Passing through the retention chamber, the ammonia sulfate and ammonium nitrate-sulfatecrystals in the treated flue gas are allowed to agglomerate to the appropriate size required forefficient removal by the baghouse. In the baghouse, this product is separated from the flue gaswith the now clean flue gases reinjected back to the boiler stack through the induced draft fan.The collected product powder is pneumatically transported from the baghouse hoppersthrough the insulated lines for storage in a heated silo for removal off-site.
The main parameters of the flue gas stream treated were:
Flow volume: 6400-8000 m3/h
Temperature: 149-166 °C
Sulfur dioxide concentration: 800-1500 ppmV
Nitrogen oxides concentration: 250-350 ppmV
Test effort has been directed toward studying the many operational variables for the plant todetermine the best way to economically form and collect the fertilizer product. Additionally, itwas desired to determine what was occurring in the various parts of the system, particularly inrespect to the sulfur dioxide removal and ammonia utilization in the process and the ammonialeakage at the outlet of the scrubber [81,82].
The other pilot plant was constructed in Germany at Reinhafen Dampfkraftwerk by BadenwerkAG. Flow of flue gases treated was 5000-20000 Nm3/h in the temperature range 65-100°C,humidity 5-15 vol %.
The concept of the pilot plant is presented in Fig. 30. Both, SO2-rich flue gas anddesulfurized flue gas behind the FGD system were treated. If necessary, the flue gas was cooledand humidified in a spray cooler and then either cooled or heated in a graphite tube heatexchanger to set defined process temperatures. The flue gases conditioned in this way were fedto the reactor through a stabilization train in which NH3 was added. The reactor was equippedwith two electron accelerators located on opposite sides, thus generating a largely uniformradiation field inside the reactor.
The irradiated flue has passed to a baghouse filter. The product was discharged by pulse-jetcleaning of the filter-bags. The purified flue gas then passed to the power plant stack.
The installation was equipped with two electron accelerators (2 x 90 kW) with electronsenergy 300 kV. Because of low voltage of courtain type, a linear cathode accelerator singlewindow (17 micron titanium foil) was applied. It was the main difference between this pilotplant and the other constructed; in all other cases accelerators with electrons energy higherthan 700 keV were applied. In all other solutions, process vessels were furnished with doublewindows systems.
In all the earlier described pilot plants ammonia was used as a reagent for sulfuric and nitricacids neutralization.
However, Research Cotrell proposed adding of electron beam between the spray dryer,using limestone as a reagent, and the fabric filter. A scheme of this pilot plant is presented inFig. 31 [62].
29

3.5. Comparison of solutions applied in different pilot plants
Four industrial pilot plants for flue gases from coal fired boiler have been built all over theworld (Indianapolis, USA; Karlsruhe, Germany; Kawe,czyn, Poland and Nagoya, Japan).
Most of the technological solutions were similar and the main differences concerned theirradiation vessel construction. The process vessel applied in the four earlier mentioned cases ispresented in Fig. 32 [83].
Dose distribution must be considered during the design of the process vessel. Dosedistribution measured at the EPS Kawe.czyn pilot plant is presented in Fig. 33 [83] and thatmeasured at the Nagoya pilot plant - in Fig. 34 [79]. It is worth mentioning that only in thecase of the Polish pilot plant the longitudinal gas irradiation was applied which is favorable foroptimum vessel geometry solution. Dose distribution, presented in Figures, which is nonuniform due to the physical properties of electron radiation, is the reason why the multistagegas irradiation gives a better NOX removal efficiency in comparison to a single step process.Mixing between the stages causes better energy distribution to volumes control of the gasflowing through the vessel [84]. A similar result can be obtained through both sided irradiationwhich was proved in the Nagoya experiment (Fig. 35) [85].
A comparison of the SO2 and NOX removal efficiency obtained at the different pilot plants isgiven in Fig. 36 and Fig. 37.
The tendencies in changes of the curves representing the above functions are similar;differences in the results obtained were connected with different test conditions.
A higher removal efficiency of NOX (at least at higher process temperatures) is observed forhigher SO2 inlet concentrations (at given dose). The phenomenon can be caused by the NO2(oxidized NO) absorption in sulfuric acid mist (formed by SO3 increased concentration).However this phenomenon was not proved in another experiment [86]. It is important tomention that temperature conditions in the second case were quite different from the firstreported case. However, reports from Indianapolis, USA and Badenwerk, Germany pilotplants operation have noticed a similar, as the EPS Kawe,czyn pilot, positive influence of theSO2 inlet increased concentration on the NOX removal efficiency (Fig. 38) [83].
3.6. Byproduct application
An exemplary composition of a byproduct for the coal fired boiler flue gases is given inTable 11. In principle, the byproduct with a small fly ash content (less then 2%) is equivalent toa commercial fertilizer - ammonium sulfate. The granulated form has a better value and can besold for higher price, so dry granulators are proposed for the byproduct final treatment.
Table 11. Byproduct composition (coal fired boilers), wt %
Pilot plant
Kawe,czyn
Badenwerk
Nagoya
Indianapolis
N(total)
19.5-21.6
19.5
N(NH4+)
19.4-20.7
19.4
NH/25.4
N(N03)
0.74-1.9
0.74
NCV5.45
NH4NO3
5
S(total)
25.5
so42-
65.6
(NH4)2SO4
95
S(SO42*)
24.5
30

Another possibility is to use the byproduct as a component of the NPK fertilizer. A testperformed in Poland has proved that a blend obtained with the application of byproduct meetsthe standards established for this kind of fertilizers.
Agriculture tests have been performed with a pure byproduct and a byproduct with differentfly-ash content. Results are very positive. The byproduct was registred as a fertilizer inJapanese Fertilizer Act as well.
The content of heavy metals, e.g. [ppm]:
Pb Cd Cr Hg As<5 0.5-0.6 1-24 0.025-0.05 0.25-0.39
is much lower than the values allowable for commercial fertilizers which are:
As-50ppm, Cd-140ppm, Pb-140ppm, Hg-2 ppm.
Worldwide consumption of ammonium sulfate is estimated to be aproximately 15 milliontons/year; in the US - 2 million tons/year. It is interesting to note that the demand for fertilizerscontaining sulfur will increase in the future.
Researchers believed that S deficiencies could not exist in the industrial countries and, as aresult, few scientists conducted research on the S nutrition of arable crops. Special attentionneeds to be given to Brassica crops (Fig. 39) because of their considerable importance foragriculture in the northern Europe and their high demand for S. The reason for increasing Sdeficiency symptoms in Brassica species is based predominantly on the significant reduction ofatmospheric S deposition to agricultural ecosystems during the last decade.
The reduction of the S supply has also caused increased ecological problems because of thereduction of fertilizer N efficiency in S-deficient crops, resulting in increased leaching of nitrateinto groundwater and probably increased accumulation of surface ozone [86],
4. INDUSTRIAL PROJECTS
Three industrial projects are under development (China, Japan, Poland). The others are planed, forexample in the US [87]. The last project will apply a modem technology based upon the high-powertransformer accelerator (HPTA).
4.1. Industrial project in China
Ebara Corporation, Japan constructed an electron beam desulfurization plant at SeitoElectrical Plant, Sichuan Electric Power Administration [88]. A scheme of the plant is given inFig. 40. The installation treats flue gases from a 100 MW coal (2% S) fired boiler. Flue gasthroughput is 300000 Nm3/h and is treated with a 3.2 kGy dose, assuring the 80% SO2 and10% NOx removal. The inlet concentrations of SO2 are 2000 ppm. Two sets of accelerators,800 keV and 400 mA, are applied. The byproduct fertilizer production rate is approximately2470 kg/h.
31

4.2. Industrial project in Japan
Construction of another plant has started in Nishi-Nagoya Thermal Power Plant whichbelongs to Chubu Electric Power Company, Inc. The installation will treat 620000 Nm3/h fluegases emitted from a 220 MWe boiler [88].
4.3. Industrial project in Poland
The experience gathered during laboratory and pilot plant tests has allowed the preparationof a full scale industrial plant design. The plant will be built in the Electropower StationPomorzany ("Dolna Odra" Group). The flow rate of the gas will be 270000 Nm3/h [89]. Theflue gas purification will treat flue gases from the block which consists of two Benson typeboilers of power 56 MWe each supplying additional steam for heating purposes up to 40 MWeach. The boilers will be reconstructed during the flue gas treatment plant construction, toreach the power 60 MWe and 100 MW* each. Annual operating time is 6500 h/year ofequivalent to full-load operation. A scheme of the industrial electron beam plant is presented inFig. 41. The boilers fire pulverized bituminus coal that has the following characteristics: caloricvalue 22820 kJ/kg, sulfur content 0.72-0.8%, ash content 21.8%, moisture content 7.8%. Theboilers are equipped with modern four zone electrostatic precipitators with a fly-ash removalefficiency of 99.8%. The emission of SO2 and NOX has to meet the Polish standards which willbe 870 g/GJ and 170 g/GJ, respectively. The local ambient air standards must be observed aswell. The guaranteed removal efficiency must be equal to a minimum of 80% for NOX and 70%for SO2. However, the efficiencies possible to obtain are 80 and 95%, respectively. This rangeallows to operate the installation at a quite high (over 100°C) stack temperature.
The flue gas will be humidified up to 10% by volume, in a dry bottom spray cooler. Thenammonia will be injected before two parallel irradiation vessels equipped with two 300 kW,800 kV accelerators installed in the series (Kaw?czyn pilot plant's solution). The longitudinalgas irradiation will be applied. The finally formed aerosol will be collected in a dry ESP with aflat heated bottom furnished in the scraping device. The manufacturers guarantee a highremoval efficiency (particulate at the outlet less than 20 mg/Nm3) and corrosion resistivity ofthe equipment. The product will be granulated.
The ammonia consumption is estimated to be 180-200 kg/h and the byproduct yield ca. 800kg/h. High power accelerators have to be applied in such big systems [90].
Two accelerators 2 x 2 x 300 kW (two HVS plus two heads each) with 800 keV electronsenergy will be applied.
5. CONCLUSIONS
The tests performed on laboratory installations and pilot plants resulted in the preparation ofindustrial plants design. All the technical and economical analyses proved the advantages of thistechnology over the conventional nowadays used technologies.
The designed flue gas treatment plant with the 1.2 MW beam power will be the biggestradiation processing unit all over the world.
32

6. REFERENCES
[1]. Wolk H.R.: Electric power supplies - the next 25 years. 5th World Congress of ChemicalEngineering. San Diego, USA, 15-18 July 1996.
[2]. Michele H.: Purification of flue gases by dry sorbents - possibilities and limits. Intern.Chem. Eng. 27(2), 183-196 (1987).
[3]. Jordan J.R.: The feasibility of wet scrubbing for treating waste-to-energy flue gases.APCA Journal, 37(4), 422-430 (1987).
[4]. Waste incineration and the environment. In: Environmental science and technology. Eds.RE. Hester, R.M. Harrison. The Royal Society of Chemistry, Cambridge 1994.
[5]. Emission standards handbook. IEACR/43. IEA Coal Research, London 1991.[6]. Baumbach G.: Air quality control. Springer Verlag, Berlin 1996.[7]. Volatile organic compounds in the atmosphere. In: Environmental Science and
Technology. Eds. R.E. Hester, R.M. Harrison. The Royal Society of Chemistry,Cambridge 1994.
[8]. Namba H.: Collecting of Ly-products by ESP and bad filter. In: Regional training courseon electron beam technology for purification of flue gases. UNDP/IAEA/RCA. Takasaki,Japan 5-9 February 1996, pp. 17-21.
[9]. Ellison W.: Limiting of SO2 and NOX emissions in worldwide coal - power production.Rad. Phys. Chem., 45, 6, 1003-1011 (1995).
[10]. Krzysztofik B., Krzechowska M., Che.cinski J.: Fundamentals of general andenvironmental chemistry. Warsaw University of Technology, Warsaw 1994, (in Polish).
[11]. Energy and environment. Ed. J. Dunderdale. The Royai Society of Chemistry,Cambridge 1990.
[12]. Advanced radiation chemistry research: current status. IAEA-TECDOC-834.International Atomic Energy Agency, Vienna, October 1995.
[13]. Richard R.J.J.: The feasibility of wet scrubbing for treating waste-to-energy flue gas.APCA Journal, 37, 4, 422-430 (1987).
[14]. Soud H.N., Takeshita M.: FGD Handbook. IEA CR/65. IEA Coal Research, London,January 1994.
[15]. Air pollution control costs for coal - fired power stations. IEA PER/17. IEA CoalResearch, London, January 1995.
[16]. Advanced emission controls for power plants. OECD Documents, Paris 1995.[17]. Air pollution control and design for industry. Ed. P.N. Cheremisinoff. Marcel Dekker
Inc., NY-Basel-Honkong 1993.[18]. Simon O.: Exploitation experiences with conventional flue gas cleaning systems. Radiat.
Phys. Chem., 45, 6, 1057-1062 (1995).[19]. 1955 SO2 control symposium, EPRI, DOE, EPA, Miami, USA, 28-31 March 1995.[20]. Choppin G.R., Liljenzin J.O., Rydberg J.: Radiochemistry and nuclear chemistry.
Butterworth, Oxford 1995.[21]. Penetrante B.M.: Economics of electron beam and electrical discharge processing for
post-combustion NOX control in internal combustion engines. In: 6th SDIO/ONR PulsePower Meeting, Chicago, USA. 9-11 August 1993, pp. 1-8.
[22]. Person J.C., Ham D.O.: Removal of SO2 and NOX from stack gases by electron beamirradiation Radiat. Phys. Chem. 31, 1-3, 1-8 (1988).
33

[23]. Matzing H.: Model studies of flue gas treatment by electron beams. In: Application ofisotopes and radiation in conservation of the environment. IAEA-SM-325/186.International Atomic Energy Agency, Vienna 1995, pp. 115-124.
[24], Busi F. et al.: Radiation induced NOX/SO2 emission control for industrial and powerplants flue gas. Radiat. Phys. Chem., 31,1-3, 101-108 (1988).
[25]. Gerasimov G.Yu. et al.: Simulation of physicochemical processes of oxidation ofnitrogen and sulfur oxides upon electron-beam purification of power plant flue gases.High Energy Chem., 30,1, 29-33 (1996).
[26]. Nichipor H.V., DashoukE.M., Yatsko S.N.: Radiation induced scavenging of NOX, SO2,H2S from exhaust gases. Radiat. Phys. Chem., 45,6, 1067-1070 (1995).
[27]. Baranchicov E.J. et al.: Investigation of SO2 oxidation in humid air stream by highcurrent density pulsed electron beam. Radiat. Phys. Chem., 45, 6, 1063-1066 (1995).
[28]. Namba H. et al.: Experimental evidence of N2 formation from NO in simulated coal-firedflue gas by electron beam irradiation. Chem. Lett., 1465-1468 (1988).
[29]. Namba H. et al.: Material balance of nitrogen and sulfur components in simulated fluegases treated by an electron beam. Appl. Radiat. Isot, A, 41, 6, 569-573 (1990).
[30]. Hashimoto S., Namba H., Tokunaga O.: Factors affecting removal of NOX and SO2. In:Electron beam flue gas treatment - research cooperation among JEARI, IAEA and INCT.JAERI-Research 96-053, JAERI, Takasaki 1996, pp. 7-16.
[31]. Environmental chemistry. Ed. J.O'M. Bockris, Plenum Press, NY-London 1978.[32]. Bai H., Biswas P., Keener T.C.: Particle formation by NH3-SO2 reactions at trace water
conditions. Ind. Eng. Chem., 31, 88-94 (1992).[33]. HirotaK. et al.: Reactions of sulfur dioxide with ammonia. Env. Sci. (Japan), 6, 2, 143-
150(1993).[34], Hirota K., Makela I , Tokunaga O.: Reactions of sulphur dioxide with ammonia:
dependence on oxygen and nitric oxide. Ind. Eng. Chem. Res., 35, 3362-3368 (1996).[35]. Cochran J.R., Harpenau P.A.: Alternative NOX emission reduction system comparison.
In: NOX Reduction Methods Symposium, Warsaw 1995.[36], Takeshita, Sloss L.L., Smith J.M.: N2O emissions from coal use. IEAPER/06. IEA Coal
Research, London 1993.[37]. Licki J., Chmielewski A.G., Radzio B.: Off-line system for measurement of nitrous oxide
concentration in gases leaving irradiation chamber. Radiat. Phys. Chem., 45, 6, 1035(1995).
[38]. Hirota K., Matzing H., Paur H.R.: Removal of gaseous xylene by electron beamirradiation. In: Proceedings of the 6th Japan - China Bilateral Symposium on RadiationChemistry, Tokyo, Japan 1994.
[39]. Hakoda T., Hirota K., Hashimoto Sh.: Decomposition of tetrachloroethylene by ionizingradiation. In: Proceedings of the International Symposium Radiat. Techn. Cons. Env..IAEA-TECDOC-SM-350/4. Vienna 1998.
[40]. Vitale S.A. et al.: Decomposing VOCs with an electron-beam accelerator.CHEMITECH, 4, 58-63 (1996).
[41]. Huvel B.: Installation and operation of flue gas desulfurization and NOX abatement of theheating power plant West (bl kW-West). In: International Comett Course: Pollutantsremoval in power plants, Karlsruhe, Germany, 22-24 June 1992.
[42]. Hilvel B., Rink M.: Kombination einer Ammoniakalischen Nasswasche zurEntschwefelung mit einer SCR-entstickung. Kraftwerk und Umwelt 1995, pp. 53-55.
34

[43]. Ammonia scrubbing: the lowest-cost option for SO2 control. Compliance strategiasreview. Expert opinion suppl. Genera! Electric Environmental Service Inc., 30 January1995, pp. 1-4.
[44]. Fluid fertilizer - science and technology. Ed. D.A. Palgrave. Marcel Dekker Inc., NY-Basel-Hong Kong 1996.
[45]. Brown G.N.: Ammonia scrubbing makes high sulfur fuels economical. In: Procedings ofthe 23rd International Conference on Coal Utilization, Clearwater, USA 1998.
[46]. Machi S. et al.: Radiation treatment of combustion gases. Radiat. Phys. Chem., 9, 1-3,371-388 (1977).
[47]. Kawamura K. et al.: Pilot plant experiment of NOX and SO2 removal from exhaust gasesby electron beam irradiation. Radiat. Phys. Chem., 13, 1-3, 5-12 (1979).
[48]. Jordan S., Paur H.R., Schikarski W.: Rauchgasreinigung durch Elektronenstrahl. Phys.Zeit., 19,8-15(1988).
[49]. Paur H.R., Jordan S.: Aerosol formation in the electron beam dry scrubbing process (ESVerfahren). Radiat. Phys. Chem., 31,1-3, 9-13 (1988).
[50]. Witting S. et al.: Simultane Rauchgasreiningung durch Elektronnenstrahl. Report KfK,PEF 45. KfK, Karlsruhe 1988.
[51]. Willibald V., Platzer K.H., Wittig S.: Flue gas cleaning by the electron beam process (I).Radiat. Phys. Chem., 35, 422-426 (1990).
[52]. Chmielewski A.G., Iller E., Romanowski M.: Pilot plant for electron beam SO2 and NOX
removal. Report INCT-2125/VI. Institute of Nuclear Chemistry and Technology,Warszawa 1991.
[53]. Tokunaga O., Suzuki N.: Radiation chemical reactions on NOX and SO2 removals fromflue gas. Radiat. Phys. Chem., 24, 1, 145-165 (1984).
[54]. Poli D.R.C. et al.: Present state of EB removal of SO2 and NOX from combustion fluegases in Brazil. Radiat. Phys. Chem., 46,4-6, 1133 (1995).
[55]. Li Genii et al.: The experimental facility and results of removal of SO2 and NOX in fluegases by the electron beam process at SINR Academia Sinica. Radiat. Phys. Chem., 40, 4,295 (1992).
[56]. Makela J.M. et al.: Experiments on combustion flue gas cleaning with electron beam. J.Aerosol Sci., 19, 7, 1401-1404 (1988).
[57]. Kawamura K.,. Shui V.H.: A pilot plant experience in electron-beam treatment of iron-ore sintering flue gas and its application to coal boiler flue gas cleanup. Radiat. Phys.Chem., 24, 1, 117-127(1984).
[58]. Frank N.W., Hirano Sh.: The production and utilization of by-product agriculturalfertilizer from flue gases. In: Proceedings on the 4th Symposium on IntegratedEnvironmental Control Systems. EPRI, APCA, ASME, Washington 1988.
[59]. Frank N.W., Kawamura W., Miller G.: Electron beam treatment of stack gases. Radiat.Phys. Chem., 25, 1-3, 35-45 (1985).
[60]. Platzer K.H. et al.: Flue gas cleaning by the electron beam process. Radiat. Phys. Chem.,35,427-431(1990).
[61], Angele H., Gottstein J., Zellner K.: Flue gas cleaning by the electron beam process at theRDK pilot plant. Radiat. Phys. Chem., 35, 19 (1990).
[62]. Helfrich D.J., Feldman P.L.: Flue gas SO2/NOX control by combination of dry scrubberand electron beam. Radiat Phys. Chem., 24,1, 129-143 (1984).
[63]. Chmielewski A.G., Iller E., Zimek Z., Licki J.: Pilot plant for electron beam flue gastreatment. Radiat Phys. Chem., 40,4, 321-325 (1992).
35
[64], Namba H. et al.: The study on electron beam flue gas treatment for coal-fired thermalplant in Japan. Radiat. Phys. Chem., 42, 4-6, 669-672 (1993).
[65]. Chmielewski A.G. et al.: Pilot plant for flue gas treatment - continuous operation test.Radiat. Phys. Chem., 46,4-6, 1067-1070 (1995).
[66]. Chmielewski A.G. et al.: Laboratory and industrial research installations for electronbeam flue gas treatment. In: Application of isotopes and radiation in conservation ofenvironment. IAEA-SM-325/124. International Atomic Energy Agency, Vienna 1992,pp. 8-92.
[67]. Zimek Z. et al.: Flue gas treatment by simultaneous use of electron beam and streams ofmicrowave energy. Rad. Phys. Chem., 46,4-6, 1159-1162 (1995).
[68]. Zimek Z. et al.: US Patent 5,397,444, 1995.[69], Villanueva L., Ahumada L., Licki I : Possible use of electron beam treatment for removal
SO2 in off-gases from copper smelters. In: Clean technology for the mining industry.University of Conception, Concepcion-Chile 1996, pp. 165-174.
[70], Chmielewski A.G. et al.: Electron beam treatment of flue gas with high content of SO2. JAdv. Oxid. Technol., 1, 2, 142-148 (1996).
[71]. Chmielewski A.G. et al.: The double window for electron beam injection into the flue gasprocess vessel. Radiat. Phys. Chem., 45, 6, 1029-1033 (1995).
[72]. Chmielewski A.G., Tyminski, B., Zakrzewska-Trznadel G.: Separation of aerosols fromirradiated flue gas in bag filter. In: Proceedings of International Symposium on Filtrationand Separation of Fine Dust. Wirtschaftskammer Osterreich, Vienna, 1996, pp. 140-150.
[73]. Chmielewski A.G. et al.: Separation of fine aerosols from irradiated flue gas in wetgranular bed filter, ibid, pp. 30-41.
[74]. Licki J. et al.: Monitoring and control systems for an EB flue gas treatment pilot plant -part I. Analytical system and methods. Rad. Phys. Chem., 40,4, 331-340 (1992).
[75]. Szlachciak J. et al.: Monitoring and control systems of an EB flue gas treatment. Part 2.Radiat. Phys. Chem., 40,4, 341-346 (1992).
[76]. Hulewicz Z.Z., Chmielewski A.G.: On dry granular bed filtration of aerosols induced byirradiation. Radiat. Phys. Chem., 45, 6, 1039-1047 (1995).
[77]. Panta P., GKiszewski W., Buika S.: Dosimetry for process vessel for flue gas treatmentpilot plant. Raporty IChTJ. Sena A nr 1/97. Institute of Nuclear Chemistry andTechnology, Warszawa 1991.
[78]. Chmielewski A.G. et al.: Optimization of energy consumption for NOX removal inmultistage gas irradiation process. Radiat. Phys. Chem., 45, 6, 1077-1079 (1995).
[79]. Frank N.W., Maezawa A.: A simultaneous SO2 and NOX removal system for burning allgrades of coal. In: Materials of 20th International Conference on Coal Utilization andFuel Systems. Clearwater, USA 1995.
[80]. Frank N.W. et al.: Ebara electron beam flue gas treatment process. Final Report, DOEAE 22-830 PC 60259. Indianapolis PU, 1988.
[81]. Frank N.W., Hirano Sh.: The electron-beam FGT process. Radiat. Phys. Chem., 33, 1-3,416-421 (1990).
[82]. Frank N.W., Hirano Sh., Kawamura K.: Ebara electron beam process flue gas cleanup:plant test results and future development. Radiat. Phys. Chem., 31, 1-3, 57-82 (1988).
[83]. Chmielewski A.G.: Technological development of EB flue gas treatment based onphysics and chemistry of the process. Radiat. Phys. Chem., 46,4-6, 1057-1062 (1995).
[84]. Chmielewski A.G. et al.: Influence of gas flow patterns on NOX removal efficiency.Radiat. Phys. Chem., 52, 1-6, 339-341 (1998).
36

[85]. Namba H., Tokunaga 0. et al.: Pilot scale test for electron beam purification of flue gasfrom coal-combustion boiler. Radiat. Phys. Chem., 46,4-6, 1103-1106 (1995).
[86]. Schung E., Haneklaus S.: Sulphur deficiency in Brassica Napus. LandbauforschungVolkenrode, Sonderheft 144, 1994.
[87]. Genuario R.D.: Electron scrubbing of flue gases to remove unwanted by-products. In:Plasma science for environment. Eds. W. Manheimer, L.E. Sugiyama, Th.H. Stix. AIPPress, Woodbury 1997.
[88]. Tokunaga O.: A technique for desulfurization and denitration of exhaust gases using anelectron beam. Sei. Techn. in Japan, 16, 64, 47-50 (1998).
[89]. Chmielewski AG. et al.: Industrial demonstration plant for electron beam flue gastreatment. Radiat. Phys. Chem., 46,4-6, 1063-1066 (1995).
[90]. Zimek Z., Chmielewski A.G.: Present tendencies in construction of industrial electronaccelerators applied in radiation processing. Nukleonika, 38, 2, 3-20 (1993).
37

oo
A c i d i I I I
Rain 111/i i i >
Deposition I ' l lI I ( i
i i t Ii i i i
Fig. 1. Scheme of acidic rain formation.

Carbon 87Minerals 6Sulfur 1
Boiler
Coal240 t/h
Furnace ash4t/h
Ammonia0.5 t/h
DENOX ESP
TFlue dust15 t/h
Air2.3 mio. m3/h(dry)
105 m3/h water
9 t/h limestone
CO2
SO2
NCL
FGD
Stack
Gypsum12 t/h
Fig. 2. Scheme of conventional instaUation (FGD + SCR) for flue gas purification.

-2.00e+01--2.5Oe+01
-1.50c+02 -l.OOe+02 -5.00e+01 O.OOe+00 5.00c+01 l.OOc+02 1.50e+02
Fig. 3. Electron tracks in a flue gas treated (Monte Carlo calculations for irradiation chamberat the pilot plant - EPS Kawfczyn).
Note - vessel position is reversed 180° at the figure.
40

we
ro0-
Inpu
tce
nt o
fP
er
50-
40~
30
20~
10
n -
80% N2 +
\
IN vibraD'oniJ
\ .
\ N dissociation
20% O2
. ^
Njlonlwtion
O dissoda&on
O loniiat'oo — -
0 50 100 150 200 250 300E (kV/cm)
Fig. 4. Energy dissipation in a dry air discharge, showing the percent of input powerconsumed in the electron-impact processes leading to vibrational excitation,
dissociation and ionization of N2 and O2.
SO2,ppm
1000-
30 £>,kGy
Fig. 5. Dose dependence of SO2 concentration upon gas-phase oxidation of SO2,as calculated by kinetic scheme (1) and (2)
Experimental points are from reference (Tokunaga and Suzuki, 1984).
41

1000
EQ.a
ion
v^CO
CuucoU
800
600
400
200
0 5 10 15 20 25 30 35 40 45 50
Dose (kGy)Fig. 6. Concentration vs dose curves for SO2 at different initial concentrations of SO2.
NOX removal
HNQ2 oh1. HO2NO2
NO t
SO2 removal
OH
HNO3 --"---> NH4NO3
|NH3
Fig. 7. Simplified pathways of SO2 and NOX eb removal in ammonia presence.
42

or 0.01 0.02 0.03 0.04 0.05 0.06 0.07 0.08 X
150
120
S0-,=
J Ll n „ % mass1 0 UH,0'
Fig. 8. Sulphuric acid dew point in flue gas as a function of SO3 concentration and humidity.
40 50 60 70 80 90 100Reaction Temperature
Fig. 9. Temperature dependence of SO2 reaction with ammonia(simulated gases). Initial concentration with water; 0% (•), 3% (V), 5% (o), 7% (o), 10% (•) ,15% (0), 20% (A). Initial concentrations: SO2 (600 ppm), NH3 (1200 ppm), NO (225 ppm),
O2 (10%) and N2 (balance)
43

0.8-
0.6
0.4
0.2
60 70 80 90 r,°c
Fig. 10. Temperature dependence of thermochemical reaction for real flue gases(coal fired power plant).
102
EQ-CX
§101
10°
D.
J L
0 10 20 30 40 50
Electron beam dose, Mrad
60 70
Fig. 11. Dependence of toluene and freon 13 destruction on dose.
44

10 20
Electron beam dose, Mrad
Fig. 12. Energy required for different organic compounds destruction.
Air
Boiler
Air
Boiler
City gas
[O? [SOz
Electronbeam gun
Retentionchamber
Fig. 13. Laboratory unit for eb gas treatment.
45

100
(XJ90
R
C
H 80
0
V
L
/
/
1 1
• •"'••'I1""
3,0 10,0 13,0
D 0 f C CkByJ
20,0
Fig. 14. SO2 removal efficiency for high concentration case.
100BenzenePhenol
50
benzene
phenol
.1
10 20i_
30 40 Dose(kGy)
Fig. 15. Benzene removal efficiency.
46

., ''FLUE GAS
Fig. 16. Industrial pilot plant for flue - -

-Gas
i — ii i
LJ I 1I I
n SUSI 1I 1
ooI Primary window
Flow of air undersecondary window Secondary window
Fig. 17. Process vessel applied at pilot plant.

TPClT3
100
80
ra 60
V!V}
O
40
20
_
Ift
A%
.
—-
0.1 1 10
median diameter [urn]
-*•- soluble particles - Ir- total
Fig. 18. Aerosol particles size distribution.
100
49

Process Inlet Occasionally Process Outlet
GnbSample
SO,
H2OfmrtiouUK
CEM
—«?""NO/NO,
«2MjO
ftmcuuu
Flow ale
Gnk
K2O
Boiler
ecuH20
MarlO
CnbSaiple
SOj
Acradf
NHj
PutaouUc
Procen Vessel
\ i . i , ..'in, A
CEMS02
HOMO,
CafeSumrJe
SOj
NH,
PmrticubM
CEMSO2
NOiNO,
KH3
PwtiaUau
By*produc(Treatment System
lO.Fon, S t i c k
Fig. 19. Control and monitoring system of the pilot plant.

S02and NOx removal efficiency [*/a]Temp, attcr humldification[oC]
ToUI beam power [kW]
IS
o.o"S.S
B.o
10:12:11
10.37:11
11:02:10
T,:27:O9
11:52:09

to
110
100
HiOz
High humidity. SO2 and NOx removal efficiency.02.21.1995
r Time16:0918:02
. 18:59
Humidity [% (V)]\11.8011.8511.39
J3,00
Fig. 21. Removal efficiencies of SO2 and N0x registered for different beam current (doses).

so2.) *100
90 -
70 .
50.
3 0 .
10 .
1 NOx
• r
•
f
/r /
so2
N O x ^ .
NOx =
U _ _ _J
J . • • • -
280
200
63
.—•
ppnV
ppnV
- 65°C
2 4 6 8 10 12(kGy)
Fig. 22. Dose dependence of SO2 and NOX removal efficiencies.
53

High humidity. SO2 and NO, removal efficiency.04.12.1995
110
3 ^
X O X>0 c ™z « a
It-
3.00
2.50
12kGySOz ZOONO, 130
2.00 d
1.50 '5
1,00
0.50
0.00
O U
f S **y C4 a>
o>CM n y—
o
Time
Fig. 23. Influence of electrons energy on NO* removal efBciency(at pilot plant geometric conditions).

Secondary window
0.8M.V
0.6M«V
0.5
j [mj 0
Fig. 24. Photographs illustrating electrons penetration range (ionization plume).
CoiMfreJBoilar
Coil
S«t(ur
OryESP
w CCK
Stack
Elictron AoeilmtorsUOO-eOOk.V, 45fiAX3)
SpnyCooler
Fig. 25. Flow chart of the pilot plant at Chubu Electric Co., Nagoya.
55

~ 1 0 0 - C p V Outlet Temp-62-64 c|-
Q.WID
9 0 -
\I—a—
—s —
11 V
1
-—'-U -
FlO'ut!crTcmp»6g-72 C[ j
iID
§cr
8
PV Outlet Temp=54-66 CJ" I- ! • - - - i —*-
•SC inlet SO2. «650-950ppmSC Inlet.NOx »150-230ppm
ESP Outlet NHO - 0-30ppro
..! 1.10 11 12
Dose {kGy)
14
9 5 -Oa
n
^ B5-I"UJ 60*
tr7 5 -
7 0 -
Fig. 26. SO2 removal efficiency.
—i—
Bolh Side Irrad.] — j ~
SC Inlet SO2 .650SC Inlet NOx -170
PV Outlet Temp.- 65ESP Outlet NH3 - 0
•950ppm190ppm
-67 C30ppm
4 __f- i.10 1 1
T12
T13 14
Dose (kGy)
Fig. 27. NOX removal efficiency.
56

To existingID. fan
ExistingESP
- - rExisting
mechanicalcollector
ventilation secondaryfan window blower
stack
i--1
rzrft-ixt:Existing,- -I.D. fan i
SO- SO,Storage Vaponizer storage vaDonizer f 4 0 " ^ W a t e rtank . •? vaponizer tank Dumtjspumps
Windowcoolingblowers
Temporary ESP
From existingESP y
By-productstorage tank
By-productblower
Fig. 28. PUot plant at Indianapolis Power and Light Company.

oo
CONCRETE SHIELDING
CTRON
'(ACCELERATOR
CONCRETE
PLUG DOOR r-iii 3̂
':tii PROCESS VESSEL
Fig. 29. Building crossection (accelerators housing).
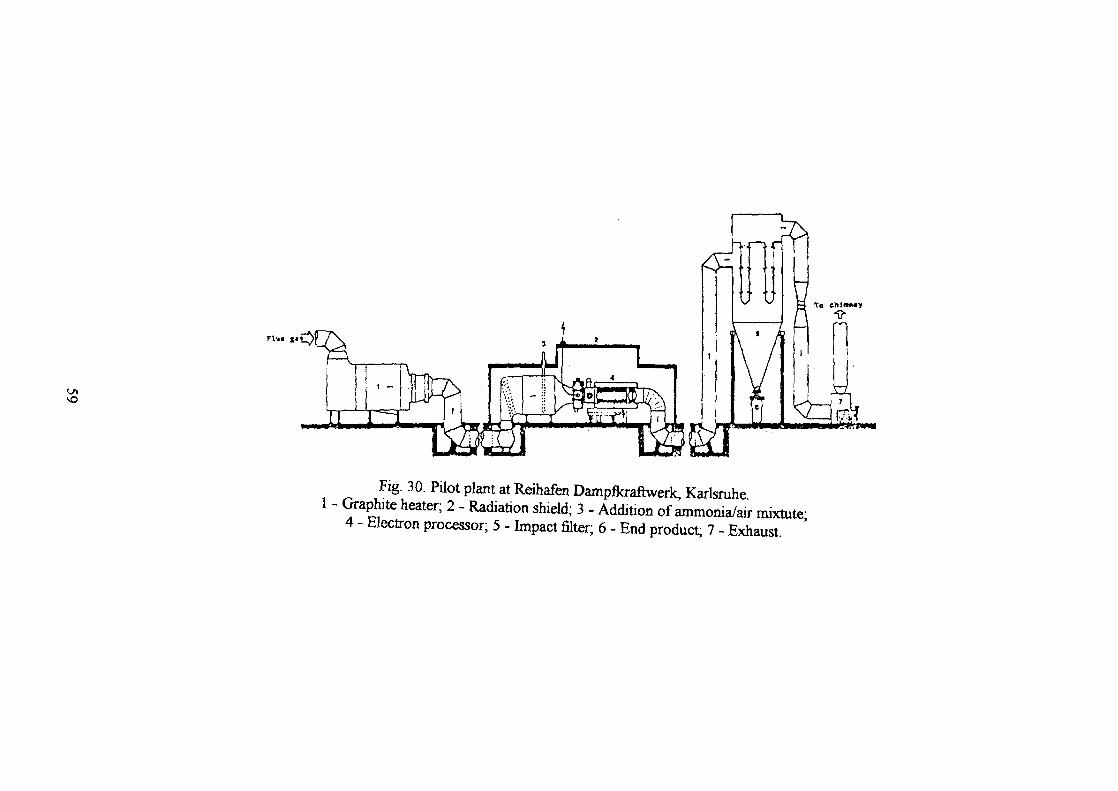
Fig. 30. Pilot plant at Reihafen Dampflcraftwerk, Karlsruhe.1 - Graphite heater; 2 - Radiation shield; 3 - Addition of ammonia/air mixtute;
4 - Electron processor; 5 - Impact filter; 6 - End product; 7 - Exhaust.

o
Fabric fillercompartments
Reagentpreparation
Stack
To solids disposal
Fig. 31. Pilot plant at TVA.

Fig. 32. Process vessel geometry for different pilot plants: a) - Indianapolis, b) - Karlsruhe,c) Kaw?czyn, d) Nagoya.
Fig. 33. Dose distribution in process vessel at the Kawe.czyn pilot plant.
• 2.4m •
Coding gas
2.2m
Accelerator
Fig. 34. Dose distribution in process vessel at the Nagoya pilot plant.
61

10-ai13
"jo
9 5 -
8 5 -
eo-
7 5 -
7 0 -
SC Inlet SO2 -650-950ppmSC Iniel NOx -170-190ppm
PV Ouflel Temp- 65-67 CESP Outlet NH3 - 0-30ppm
I ..( [
0 11
Dose (kGy)
I13
I14
Fig. 35. NOX removal efficiency for both sides gas irradiation.
0 10 15 20 25DOSE [kGy]
Fig. 36. NOX removal efficiency obtained at different pilot plants:1 - Indianapolis, USA (NOX = 270-390 ppm, SO2 = 800-1500 ppm, U = 80-85°C,
RNH3= 0.8-1.17),2 - Badenwerk, Karlsruhe (NOX = 250-450 ppm, desulfurized gas, t = 70°C, RNH3= 0.7-1.5);
3 - Kaweczyn , Poland (NOX = 150 ppm, SO2 = 300 ppm, t= 70°C, RMC= 0.8);4 - Nagoya, Japan (NOX = 200-220 ppm, SO2 = 650-950 ppm, W = 63-72°C).
62

100
10 15 20D0SE[kGy]
Fig. 37. SOX removal efficiency obtained at different pilot plants:1 - Indianapolis, USA (SO2 - 800-1500 ppm, RNTO = 0.84-1.17, t = 74-77°C);
2 - Badenwerk (SO2 - 300 ppm, RNHS = 1, W = 70°C, H2O = 7-12%);3 - Kaweczyn, Poland (SO2 -1000 ppm, RNH3 = 0.75, tm = 70°C, H2O = 5 vol%);
4 - Nagoya, Japan (SO2 ~ 700-850 ppm, outlet temperatures given in figure).
100
1000 1500 2000 2500 3000S0a[ppm]
Fig. 38. Influence of SO2 concentration on NOX removal efficiency:1 - Indianapolis, USA (NOX = 290-410 ppm, RNHS = 0.95-1.3, t = 83-91°C, 18-20 kGy);
3 - KawQezyn, Poland (NOX =135 ppm, RNHS: 0.6-0.75, 11.5 kGy).
63

0)CD
o9
8
2 enC CDCD NO —C "-P° a5 4c
CD
LL
SC^-S emissions in the FRG
. Fertilisers
Atmosphere
Leaf concentrations— I . L _ _ l J- 1 - ^ . J L .
1985JL__
40
30
20
os
ph
er
o
iep
os
ition
(
CD
IT
101980 1985 1990
YearFig. 39. Sulphur deficit in brassica leaves observed in Germany.
64

ON
H2O
NH,
AIR
/FLYASH E.S.P>
SPRAY COOLER
i B/LSTACK
COOLING AIR!EQUIPMENT [
RELEASETO THE AIR
ELECTRON BEANGENERATOR
P COOLING- YATER
I EQUIPMENT
f PROCESS VESSEL
RELEASETO THE AIR
BY-PRODUCT)
Fig. 40. Scheme of the Ebara demonstration plant constructed in Seito Electrical Plant, Sichuan.

ON
' Irradiationvessels
Armenia storageand dosing unit
Fig. 41. Scheme of industrial plant at EPS Pomorzany, Szczecin.

![3} tj- 7] - OSTI.GOV](https://static.fdokumen.com/doc/165x107/631c4c86b8a98572c10cd705/3-tj-7-ostigov.jpg)