'Kind'KA bdclittonetn rBasfiir - OSTI.GOV
108
'Kind' K Abdclittonetn r Basfiir - - B.Sc..(Agile.) Honours (Khartoum) A Thesis Submitted in partial fulfilment of the requirement Tor (lie degree of Master of Science (Agric.) Supervisor: Dr. Abu-Bakr Ali Abu-Goukh MSPARTMICNT OF HOUTICUI/I'UKIi FACULTY OF AGRICULTURE UNIVERSITY OF KHARTOUM MAY, 1999 3 1/28
-
Upload
khangminh22 -
Category
Documents
-
view
1 -
download
0
Transcript of 'Kind'KA bdclittonetn rBasfiir - OSTI.GOV

'Kind' KA bdclittonetn rBasfiir
- - B.Sc..(Agile.) Honours (Khartoum)
A Thesis
Submitted in partial fulfilment of the requirement Tor (lie
degree of Master of Science (Agric.)
Supervisor: Dr. Abu-Bakr Ali Abu-Goukh
MSPARTMICNT OF HOUTICUI/I'UKIi
FACULTY OF AGRICULTURE
UNIVERSITY OF KHARTOUM
MAY, 1999
3 1 / 2 8

Please be aware that all of the Missing Pages in this document wereoriginally blank pages

(In the name of Allah, the Beneficent, the Merciful)
My Lord: "Increase me in 1(iiozi/(ed(je"
(20:114, Ta Ha, Holly Quran)

Acknowledgment
My special praise and unlimited thanks avtto ALLAH; who
supplied helped and gave me health and patience to complete this
study.
I wish to express my deep sense ol' gratitude and sincere thanks
to my supervisor Dr. Abu-Bakr AH Abu-Golikh for his
encouragement, excellent suggestions, continued interest and
guidance during my study.
My greal thanks to Dr. Farouk Hassan El Tahir, Dr. Mustafa
ElbalJa hn~ continuous interest, help and encouragement.
Thanks and also due to the members of Horticulture and
Bioclieuisir_y_De4iartmeut,
I am grateful to my family members for their help and
encoruagemenl.
(ii)

ABSTRACT
Compositional changes in fruit pulp and peel.during ripening of
white - and pink-fleshed guava fruit types were investigated.
Fruit tissue firmness decreased progressively, in a simMar
manner, in both guava types. The white and pink guavas exhibited a
typical climacteric pattern of respiration, with.climacteric peak al 7.6
kilogram-force (kg. f) flesh firmness in both types.
Total soluble solids (TSS) and total sugars increased in pulp and
peel of both guava types with decrease in flesh firmness.. More
increase in total sugars was observed after the climacteric peak.
Reducing sugars and titratable acidity increased up to the climacteric
peak and decreased afterwards. Total protein increased up to the
-fttthripe stage- antHftmr-decreiised. A s c o ^
compounds decreased continuously during ripening of the two types.
The peel showed higher values of ascorbic acid and phenolic
compounds compared to the pulp. The white-fleshed guavas had
higher levels of TSS, total sugars, reducing sugars, titralable acidity
and ascorbic acid content compared to the pink-fleshed fruits.
Changes in the activities of the cell wall degrading enzymes,
pectinesterase (PE), polygalacluronase (PG) and cellulasc were also
studied to find out the reason for tissue softening in g.uava fruit during
handling, transportation and storage.
(ii)

Pectinesterase activity, in both guava types, increased gradually
till the climacteric peak and then decreased. Polygalacturonase and
cellulase activities progressively increased during ripening and high
correlation was observed between the increase in enzyme activity and
the loss in fruit flesh firmness. It was concluded'.that PE, PG and
cellulase enzymes play an important role in controlling tissue
softening mechanism during fruit ripening in guavas.
(iii)

CONTENTS
Page
Abstract - .- ii
Arabic Abstract -. iv
List of Figures ix
Chapter 1 : Introduction I
Chapter 2 : Literature Review - 3
J2..I. Origin, Production and Distribution -• 3
2 .2. Fruit Characteristic 3
2.3. Fruit Ripening and Senescence ----- 4
2 .4. Respiration Rale 5
% .5. Compositional Changes During Fruit Ripening 7
J2.5.1. Total Soluble Solids 7
-.2.5.2. Total and Reducing Sugars 7
2 . 5.3. Acidity and pH 8
2 • 5.4. Amino Acids and Proteins 9
2. «5.5. Phenolic Compounds 10
2. • 5.6. Vitamins and Minerals 11
2 .6. Fruit Softening - 13
£•6.1. Role of Pcctinestcrase 15
£.6.2. Role of Polygalacturonase 16
£ . 6 . 3 . RoleofCellulase 18
(vi)

Page
Chapter 3 : Materials and Methods 20
3.1. Fruit Source and Ripening Procedure 20
3.2. Respiration and Firmness Determination .- 20
3.3. Total Soluble Solids Determination 20
3.4. Compositional Changes 21
3.4.1. Tissue Extraction 21
3.4.2. Titralable Acidity Determination 21
3.4.3. Total Sugars Determination 21
3.4.4. Reducing5Tugars Determination 21
3.4.5. Total proteins Determination - 22
3.4.6. Phenolic Compounds Determination 'l'l
3.4.7. Ascorbic/I cid Determination •-•- 22
3.5. Enzymatic Activity Changes - 22
3.5.1. Enzyme Extraction • 22
3.5.2. Pectineslerase Activity Determination 23
3.5.3. Polygalacturonase Activity Determination 24
3.5.4. Cellulase Activity Determination 24
Chapter 4 : Results 25
.4.1. Fruit Firmness and Respiration Rate. - 25
4.2. Compositional Changes During Ripening in Guava Fruit 25
4.2.1. Total Soluble Solids 25
(vii)

Page
4.2.2. Total Sugars - 26
4.2.3. Reducing Sugars - 26
4.2.4. Titratable Acidity 27
4.2.5. Total Proteins 27
4.2.6. Phenolic Compounds 27
4.2.7. Ascorbic Acid 28
4.3. Enzymatic Activily(^hanges During Ripening of
Guava fruit 28
4.3.1. Pectinesterase * 29
4.3.2. Polygalacluronasc 29
4.3.3. Cellulase -' 29
Chapter 5 : Discussion 43
Conclusion - 55
References 56
Appendixes - - 74
(viii)

List u£ FiguresPage
Figure :
1. Changes of fruit flesh firmness during ripening of while-and
pink-fleshed guava fruits. 31
2. Relationship between CO2 production and fruit flesh firmness
during ripening of white-and pink-fleshed guava fruits 32
3. Changes of total soluble solids (TSS) during ripening of
white-and pink-fleshed guava fruits 33
4. Total sugars changes during ripening of vvhitc-and pink-fleshed
guava fruits. - 34
5. Reducing sugars changes during ripening of white-and
pink-fleshed guava fruits ---• .35
6. Changes in titratablc acidity during ripening of while-and
pink-fleshed guava fruits 36
"?. TaTT0^nnntirhfjfinTn"n"cioTiteTit daring ripening of "white-and
pink-fleshed guava fruits 37 -
8. Changes in phenolic compounds during ripening oi' whilc-and
pink-fleshed guava fruit 38
9. Changes in ascorbic acid content during ripening of white-and
pink-fleshed guava fruits - 39
10. Changes in PE activity d^crign ripening of white-and
pink-fleshed guava fruits 40
11. Changes in PG activity during ripening of white-and
pink-fleshed guava fruits 41
12. Changes in cellulase activity during ripening of'white-and '
pink-fleshed guava fruits 42
(ix)

CHAPTER 1

CHAPTER 1
INTRODUCTION
Guava {psidium guajava L.) is native of tropical countries. It can
grow satisfactory even in adverse environmental conditions.
The fruit has a characteristic odour and is eaten fresh, processed
or cooked (Saiunkhe and Desai, 1984).
Ripe guava fruit is an excellent source of ascorbic acid (vitamin
C) and dietary fiber. It has about five times more vitamin C than
orange (guava, 242 mg. per lOOg. j orange, 50mg. per lOOg.) (Watt
and Merrill, 1975). Guava is also a good source of vitamin A,
phosphorus, calcium and iron as well as tln'amin and niacin (Wilson,
-1-986)—
Guava in Sudan is still a minor fruit crop, but it is commercially'
grown in every region in the Country. Sudan has great potentiality to
produce good Quality guava fruits. It has good marketability in the
middle east and European countries.
The fruit is delicate and many culttvars cannot withstand
long-distance transportation and may reach the market in a mushy,
over-ripe state. It can store for only few days at ambient conditions.
Ripening of the fruit is characterized-by different compositional
changes and by softening of the flesh. Development of proper
handling techniques and control of the ripening proc'ess are of crucial
importance for development of a sound guava industry in the Sudan.

This study was carried out with the following objectives:
1. To provide base-line information regarding the biochemical
nature of ripening and softening mechanisms in the guava fruit, to
assist in development of sound programmes for controlling fruit
ripening and loss of firmness during handling, transportation and
storage of guava fruits.
2 - To study compositional changes in pulp and peel of white -
and pink-fleshed guavas during fruit ripening.
3. To investigate changes in the activity of the cell wall
degrading enzymesjpcclincstcrasc (PE), poiygalacturonasc (PG), and
cellulase during guava fruit ripening.


CHAPTER 2
LITERATURE REVIEW
2..1- Origin, Production and Distribution:
Guava (Psidium guajava L.) is an important cultivated species of
the Myrtle family (Salunk he and Desai, 1984). It is native to the
tropical regions of America. It was spread first into the Philippines
and India, and then quickly extended to most of the tropical and
subtropical regions of the world, _where it has become naturalized
(Yadav, 1998). The crop tolerates a wide range of climates and is
fairly salt and drought resistant. There could be 2 to 3 harvest seasons
in one.year. It has been reported that fivc-ycar-old guava trees can
produce from 130 to 225 kilograms of fruit per tree (28 to 48 tons per
Guava is a minor fruit crop. The major producing countries arc :•
India. (200,000), Mexico (127,000), Egypt (34,000) and Venezuela
(17,000) metric tons (Anon, 1978). ,
In Sudan, guava is a popular fruit crop. It is grown in every slate.
Marketability is limited to local markets due to the delicate nature of
the fruit and poor transportation and storage facilities.
2 »2. Fruit characteristics:
Guava fruit has a rough yellow skin and is round, ovoid, or
pyriform shape. The flesh colour varies from white, deep pink to
salmon red, and the flavour has been described as sweet, mushy, and
highly aromatic. The fruit is eaten fresh, processed or cooked. It is

used for the preparation of juices, jams, jellies, pastes and other
similar products (Salunkhe and Desai, 1984). Guava fruit is very rich
in ascorbic acid (Wilson, 1980). It is a fair source of beta-carotene
(280 IU), calcium (23mg), phosphorous (42mg), riboflavin (0.05'mg),
thiamine (0.05mg) and niacin (1.2mg per lOOg) (Watt and Merrill,
1975). Reportedly, consumption • of'guava fruit reduces serum
cholesterol levels, triglycerides and hypertension, and increases the
level of high density lipoprotein. Both ripe and green fruits, leaves,
roots and bark are used in local medicine for treatment of
gatroenteritis, diarrhea and dysentery (Yadav, 1998).
1*3. Fruit Ripening and Senescence-
Ripening is the sum total of the physio—chemical changes which
makes fruit edible. Ripening is a dramatic event in the life of a fruit. It
transforms a physiological mature but inedible plant organ into a
—vJsuallyjitliacJL^^ the completion
of development of a fruit and the commencement of senescence, and it
is normally an irreversible event. Ripening is the resuU of a complex
of changes, many of them probably occurring independently of one
another. The number, complexity and commercial importance of these
changes make fruit ripening special case of plant organ senescence
(Wills etaL, 1981).
Ripening and senescence processes involve the action of a group
of chemical substances produced by the plant itself- plant hormones.
Chemists have synthesised compounds which function as the natural
plant hormones do, and have achieved some success in controlling the
vital processes of ripening and senescence of fruit. These chemicals
may hasten or delay ripening and senescence (Salunkhe et aL, 1975).

Mature green guavas can be stored at 8 to 10°C and 85 to 95%
relative humidity for 2 to 5 weeks (Panlaslico el aL, 1975).
Ripening of guava was markedly hastened by treatment with
growth regulators such as 2,4 - D and 2, 4, 5 - T. The rate of ripening
was doubled in guava treated with 200 ppm 2, 4, 5 - T (Saha, 1971).
Singh et ah, (1981) found that dipping of guava fruits in calcium nitrate
solution (0.5 to 2.0%) reduced weight loss, respiration rate, disease
occurrence and maintained the edible quality of guavas for more than 6
days compared with 3 days for untreated fruits. Prc-and post-harvest
application of morphactin (a chloroflurenol methyl ester) retained
chlorophyll content, increased soluble solids, and reduced weight loss
with both pre-harvest (2.5 ppm) and post-harvest (2.5 and 5.0 ppm)
application, and extended the shelf life of guava fruits (Goldstein and
Swain, 1963).
Waxing of fruits retarded ripening and senescence of guava
(Bhullar and Farmahan, 1980). The use of potassium permangenate
(KMnO4) or potassium ineta-bi-sulfite in muslin bags (at 10 g/kg fruit)
placed inside the storage polyethylene bags was reported to retard the
rate of guava fruit ripening and extended storage life (Bhullar and
Farmahan, 1980). Guava irradiated at 30 Krad and stored at ambient
temperature exhibited a marked delay in ripening up to 3 to 5 days
(Pablo etal , 1975).
% . 4. Respiration Rate:
Respiration is the process in which complex compounds are
broken down into simple end products, during which exchange of gases
take place. Respiration rate is an excellent indicator of metabolic
activity of the tissue. Thus a useful guide of potential storage life of
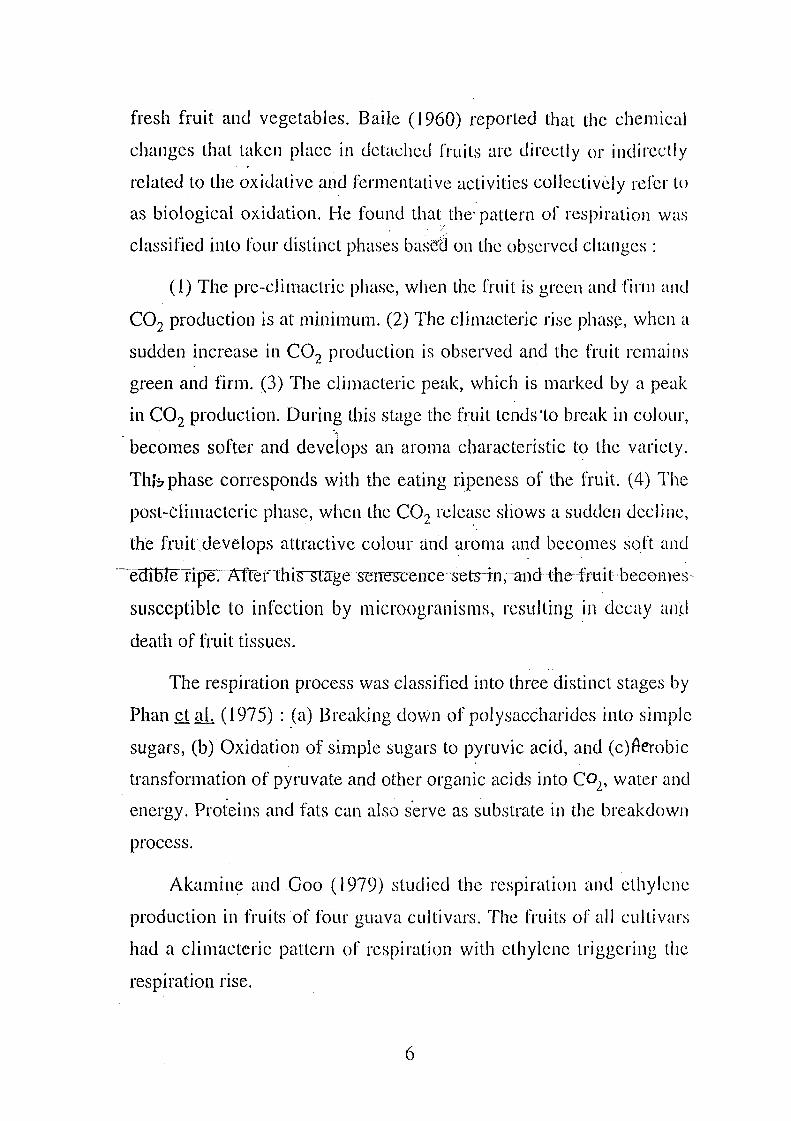
fresh fruit and vegetables. Baile (1960) reported that the chemical
changes that taken place in detached fruits are directly or indirectly
related to the oxidative and fermentative activities collectively refer to
as biological oxidation. He found that the-pattern of respiration was
classified into four distinct phases basetl on the observed changes :
(1) The pre-climactric phase, when the fruit is green and firm and
CO2 production is at minimum. (2) The climacteric rise phase, when a
sudden increase in CO2 production is observed and the fruit remains
green and firm. (3) The climacteric peak, which is marked by a peak
in CO2 production. During this stage the fruit tends'to break in colour,
becomes softer and develops an aroma characteristic to the variety.
Thb phase corresponds with the eating ripeness of the fruit. (4) The
post-Climacteric phase, when the CO2 release shows a sudden decline,
the fruit develops attractive colour and aroma and becomes soft and
"e irJle ripe. Mteintrfs^smge^eiTesceTi-cesets-in, andthe fruit becomes-
susceptible to infection by microogranisms, resulting in decay anil
death of fruit tissues.
The respiration process was classified into three distinct stages by
Phan et al (1975) : (a) Breaking down of polysaccharidcs into simple
sugars, (b) Oxidation of simple sugars to pyruvic acid, and (c)fterobic
transformation of pyruvale and other organic acids into CX>2, water and
energy. Proteins and fats can also serve as substrate in the breakdown
process.
Akamine and Goo (1979) studied the respiration and cthylcne
production in fruits of four guava cultivars. The fruits of all cullivars
had a climacteric pattern of respiration with clhylenc triggering tiie
respiration rise.

5,5. Compositional Changes During Fruit Ripening:
During ripening, a i'nut passes through a scries of overt changes
in colour, texture and flavour, indicating that compositional changes
are taking place. Attain of maximum eating quality of fruit
necessitates the completion of such chemical changes. Unripe fruits
are usually starchy and acidic in taste, hard in texture and sometimes
astringent. After ripening, they become sweet, soft, and highly
flavoured, so greatly acceptable as human food (Maltoo ct al, 1975).
These changes, are described in the text below.
2.5.1. Total Soluble Solids-
Total soluble solids (TSS) were reported to increase during fruit
ripening (Abu-Goukh and Abu-Sana, 1993, Ibrahim eta_L, 1994,
Rodriguez etaL, 1971). The total solids in the fruit were found to
mradn-consl ant dnringJOiiiLripejoLUig.,The,.solubLe_sLolids,__oii.the_other
hand were found to increase at the expense of insoluble solids
(Krishnamurthy etaJL, 1960). Popenoe ct aL (1958) attributed the
increase in TSS during fruit ripening to the hydrolysis.of the starch to
sugars. This was then confirmed by Baile (1960).
Rodriguez et ah, (1971) observed a gradual increase in TSS
during guava.fruit ripening. Similar findings were reported for
bananas (Ibrahim et aL, 1994), mangoes (Abu-Goukh and Abu-Sara,
1993, Minessy ct ah, 1984, Saccd ct ah, 1975b) and dates (Dowson and
Aten, 1962).
.2,5.2. Total and Reducing Sugars:
Climacteric fruit in particular, may show considerable changes in
sugar content during fruit ripening (Hulme, 1971). Starch and.sucrose
7

were found to convert into glucose during fruit ripening (Wills et
aL, 1981). Mowlah and I too (1982) showed that glucose, fructose
and sucrose were the main sugars in white-and pink - fleshed guava
varieties. Chan and Kwok (1975) reported that the total, reducing
and non-reducing sugars were present in guava fruit in amounts of
5.8, 5.5 and 0.3%, respectively, and the gas-chromatographically
determined contents of fructose, glucose and sucrose were 3.4, 2.8
and 0.3%, .respectively.
Total and reducing sugars were found .tc increase during
ripening of guava fruit and then decreased (Subrahmanyam and
Acharya, 1957). The level of fructose increases during ripening and
then decreases in the over-ripe fruits (Le-Riche, 1951). Seshadri
and Vasistha (1964) reported that glucose, arabinose and maltose
increased during guava fruit ripening. Ogata et ah, (1972) found
that unripe pulp and peel of guava fruits contained trace amounts ol
sedoheptulose, which increased to 0.04% in the ripe pulp.
J2-5.3. Acidity and pH:
The non-volatile organic acids arc among the major cellular
constituents undergoing changes during ripening of fruits (Mattoo
etaL, I975). Organic acids play important role in development,
maturity, ripening and post-harvest life of fruits (Agnihotri et ah,
1964). Citric acid is the predominant acid in guava, while malic
acid present in appreciable amounts (Hulme 1970). Other organic
acids reported toc<x<AYw.guava include; tartaric, oxalic, succinic and
ascorbic acids.The reported acidity and pH of guava fjesh range
from 0.33 to 0.99% and 4.7 to 5.4, respectively (Salunkhe and
Desai, 1984).
8

Usually organic acids decline during ripening of fruits as they are
respired or converted to sugars (Wills et ilL 1981). Great variations
were reported in changes in organic acids during ripening of different
types of fruits. Krishnamurthy et aL, (196Q) reported 6-fold decrease
in total acids in "Raspuri" mango. A reduction of 35 - folds was
reported in "Alphonso" mango (Subramanyairret a_L, '1976). Medlicott
and Thompson (1985) found a profound decrease in citric acid and
small reduction in malic acid during ripening of "Kcitt" mango.
Reduction in total acidity was also reported during ripening of pears
and peaches (Vlrich, 1958). Total acidity was shown to increase
during fruit ripening in banana (Ibrahim et al , 1994), and pineapple
(Gortner et ah, 1967). Rodriguez etaL, (1971) observed a decline in
pH values of guava fruit extracts during fruit ripening.
Changes in acidity during fruit ripening were reported to follow
the re s p iratory climacter ic~ur bairanatAimTednEmd "Tmgw a, -19 95 -;•
Desai and Deshpande, 1975; Palmer, 1971) and mango (Abu-Goukh.
and Abu-Sarra, 1993; Krishnamurthy etaL 1971).
51-5.4. Amino Acids and Proteins:
Proteins and free amino acids "are minor constituents of fruits and
have no role in determining eating quality. Changes in amiRO acids
and proteins however, indicate variations in metabolic activity during
the different developmental stages. During the climacteric phase of
many fruits, there is a decrease in free'amino acids which often
reflects an increase in protein synthesis. During senescence, the level
of free amino acids increases reflecting a breakdown of enzymes and
decreased metabolic activity (Wills et ah, 1981).

The observation that the amino acids mcthionine and/or [3-alaninc
may possibly act as the immediate precursors orelhylene in the tissues of
fruits and vegetables (Burg and Clagett, 1967; Liebcrman et al., 1966;
Yang, 1985) signifies the importance ofamino acids metabolism in fruit
ripening.
A small net increase in protien content was observed during
ripening of mango (Mattoo and Modi 1969), pear (Li and 1 lansen, 1964),
avocado and tomato (Spencer, 1965). Quantitative changes insoluble
, proteins during mango ripening have been repeatedly demonstrated (Ghai
and Modi, 1972). Abu-Goukh and Abu-Sarra (1993) reported that the
total protein in pulp and peel of three mango cuitivars increased up to the
full-ripe stage and then decreased at the over-ripe stage. That decline was
explained as breakdown of proteins during senescence, which supported
the view that proteins in ripening fruits are enzymes required for the
ripening process (Frcnkcl ct ah, 1968).
5.5 Phenolic Compounds1:
Phenolic compounds are important factors of fruit quality. The
term "tannins" was reserved for those phenolic compounds of sufficiently
higher molecular weight to form strong complex with protein and other
polymers (Nezain lil-Din et al., 1983). Tannins represent the primary
substrate for browning reaction in fruit tissues (Ilulme, 1971). The
tannins arc also responsible for the astringent taste in unripe fruit which
disappears due to polymerization of tannins during fruit ripening (Al-
Ogaidi and Mutlak, 1986). Tannins have been repeatedly demonstrated lo
play a vital role in plant disease resistance and protect fruits and
vegetables against insect pests (Nezam lil-Din eJ.ajL, 1983) and diseases
(Walker and Stahmann, 1955, Raa, 1968, Mclcan ctaK, 1961)

Abers and Worlstad (1979) suggested that the more reactive
phenols, such as leuco anthocyanins and flavanols, play a major role in
the colour determination of strawberries preserves.
Factors such as size of the fruit, location on the tree and locality
of the tree were reported to influence the fruit phenolic content (Mann
et aJL, 1974). It was reported that phenolic compounds in the peel of
mango were higher than those in the pulp (Abu-Goukh and Abu-Sarra,
1993, Lakshmiriarayana, 1980). Tannins in dates are present just
below the skin (Dowson and Atcn, 1962).
It was reported that phenolic compounds decreased during
ripening of bananas (Ibrahim etal., 1994, Abu-Goukh e taL 1995),
mango (Abu-Goukh and Abu-Sarra, 1993) and dates (Al-Ogaidi and
Mutalk, 1986). Spayal and Morris (1981) reported that phenolic
cjonipounds were present in relatively high quantities m the immature
green fruit as compared to other maturities. Mowlah, and Itoo (1982)
reported that in both types of guavas^white and pink, the total"
polyphenol decreased all along from the immature stage to the to full
ripe stage.
The decreasing • in astringency with guav'a ripening was
associated with the increased polymerization of leucoanthocyanidins
and hydrolysis of the astringent arabinose ester of hexahydrodiphenic
acid (Goldstein and Swain, 1963, Misra and Seshadri 1968)
5,6. Vitamins and Minerals:
Vitamin C (ascorbic acid) is only a minor constituent of fruits
and vegetables, but is of major importance in human nutrition.
Virtually all man's dietary vitamin C (approximately 90 percent) is
obtained from fruits and vegetables. The daily requirement of man

from vitamin C is about 50 milligrams, and many fruits and vegetables
contain this amount of vitamin C in. less than ]()() grams of tissue
(Wills etaL 1981).
Guava fruit is extremely rich in vitamin C. It has about five times*v*
than orange (242 nig per 100 g for guava v$ . 50 mg per 100 g for
orange) (Watt and Merrill, 1975). According to Wilson (1980), the
levels of ascorbic acid in guava are subject to wide variation due to
geographical location, horticultural practices, season and cultivay
Reported values vary from 10 to 1160 mg of ascorbic acid per" 100 gin
fruit (Dedolph, 1966; Wilson, 1980). Variable reports are available
about the amounts of ascorbic acid in white - and pink - fleshed
guavas. El-Fake and Saeed(l975) reported higher values of ascorbic
acid in white - fleshed than pink-fleshed fruit, while other investigators
reported the reverse (Agnihortri et &L 1962; El-Zorkani, 1968).
The peel of guava fruit was reported to contain most of the
ascorbic acid in the fruit (Wilson, 1980). Similar results were repotted
for mangoes (Lakshminarayana etaL, 1970, Siddappa and Bhatia,
1954). The higher values of ascorbic acid in the peel were attributed to
interference of phenolic compounds, with the dye, 2, 6-dichlorophenol
indophenol used in the assay (Lakshminarayana et a_L, 1970). In
contrast, Abu-Goukh and Abu-Sarra (1993) reported lower values for
ascorbic acid in peel compared to the pulp in three mango fruit
cultivars.
The ascorbic acid content in guava fruit reaches a maximum in
the green, fully mature fruit and starts to decline rapidly as the fruit
ripens (Agnihorti etaL, 1962, El-Zorkani, 1968). The decline in
ascorbic acid content during ripening was also reported for. mango
12

fruits (Abu-Goukh and Abu-Sana, 1993, Minessy etaJL, 1984,
Chikkasubbaniia and Hudclar, 1982).
Guava fruits are fair source of provitamin A (P-Carotene) (280
International Units), Calcium (23 ing), phosphorous (42 mg),
riboflavin (0.05 mg), thianiin (0.05 mg) and niacin (1.2 mg per lOOg
fresh weight) (Watt and Merrill, 1975). French and Abbott (1948)
reported that the edible portion of pink-fleshed fruit had carotene
content of 3.1 nig per lOOg, while the white-fleshed fruit contained no
measurable carotene (at 450 nm). These investigators also showed that
about one-half of the colour of the pink-fleshed guavas was due lo
lycopene. Cordoba (1961) found that the thiamin content of
pink-fleshed guava was higher (0.05 ing) than that of the
white-flcshcd fruits (0.03 nig per lOOg).
X' 6. Fruit Softening: ,
Fruit softening is characterized by changes in flesh firmness and
has long been associated with fruit ripening (Dostal, 1970). These
changes in frilit firmness determine shelf-life and quality of the
commodity. Control of fruit texture is a major objective in modern
food technology (Van Buren, 1979).
Fruits undergo progress decline in flesh firmness with fruit
ripening. Abu-Goukh and Abu-Sarra (1993) observed a rapid decrease
in flesh firmness during ripening of three mango cullivars. They found
that more than 80% of firmness decline occurred over two days and
coincided with climacteric peak of respiration. Similar pattern of
change was reported for bananas (Abu-Goukh eiah., 1995), pears
(Luton and Holland, 1986), Apples, peaches, and apricots (Salunkhc
andWu, 1973) and dates (Barrcvellcd, 1993).
13

Histological studies and chemical analysis revealed a
considerable loss of cell wall materials during ripening - associated
fruit softening (Tandon and Kalara, 1984; Hall, 1964; Hultin and
Lcvine, 1965; Nour, 1978). As the Iruit ripens, the contents of
soluble pectins increase while the total pcclic substances decrease.
This trend was found in guava (Luh, 1971), melon (Rosa, 1928),
bananas (Van Loesecke, 1950), citruf (Sinclair and Joliffc, 196!),
strawberry (Neal, 1965) and mango (Tandon and Kalara, 1984).
There are evidences indicating that two processes are at work on
pectic substances during fruit ripening: (1) depolymerization or
shortening of chain length, and (2) de-esterification or removal of
methyl groups from the polymer (Mattoo et aL, 1975). The general*
observation is that softening is accompanied by solublization of
pectin substances involving the sequential action of pectinesterase
(PE) and polygalacturonase (PG) enzymes. This notion was
supported by reports on changes in cell wall pectic materials in
ripening mango (Tandon and Kalara, 1984; Roe and Buremmer,
1981) tomato (Besford and Hobson, 1972; Arad etaL, 1983), pear
(Ahmed and LabavifeU, 1980a), Peach, apple (McCready and Me
Comb, 1954) and strawberry (Kertcsz, 1951).
Very limited degradation of Cellulase was reported to occur
during softening of many fruits, including banana (Barnell, 1943),
peach (Sterling, 1961), pear (Ahmed and Labavitch, 1980a) and
apple (Kertesz el ah, 1959; Knee, 1973), Tahir and Malic (1977)
reported that the Cellulose and hcmicellulQse contents of mango fruit
did not show appreciable changes during ripening, therefore, appear
to have insignificant importance in lextural changes during ripening. ,
However, Ceilulase and hemicelluose were reported to change
14

substantially during softening of dates (Coggins ejLaJL, 1967;
Hasegawa and Smolcnslfy, 1971) and bananas (Barnell, 1943).
Besford and Hobson (1972) observed some degree of softening in
tomato fruit before commencement of the PH and PG action. A
non-enzymatic reaction was suggested to occur in plants which might
be responsible for some of the changes that occur in pectic substances
as well as in other polysaccharides (Kertesz, 1943). A wall-modifying
eiizyme was reported by Karr and Albcrshcim (1969) to be an
important prerequisite for the action of the polysaccharide degrading
enzyme. Mattoo ejtaL, (1975) stated that softening in some fruits
occurs through hydrolysis of starch (as in squash) or fats (as in
avocado).
. 6.1. Role of Pec tines terase:
^
hydrolysis of methyl and other ester groups of the polygalacluronide.
chains of pectin (Lee and MacMillan, 1970; Lineweaver and Janscn,
1951). A direct role of PB in fruit softening has been demonstrated;
Buescher and Tigchelaar (1975) reported that PE activity increased
during ripening of normal tomato fruit, while that of rm fruit (non
ripening mutant) remained constant.•The failure of the nou ripening
tomato mutant (rin) was evaluated in terms of PB activity (Buescher
and Tigchelaar, 1975). PH activity has been reported to increase
during ripening of banana (Ilultin and Levine, 1965; IX\Swardl and
Maxi, 1967), date (Al-Jasim and Al-Delaimy, 1972) and tomato
(Hobson, 1963;'Pelhawala el aL, 1948). Mattoo and Modi (1969)
related the softening of chilling injured mango fruits to the increase
activity of PIS. Barmare and Rouse (1976) suggested that PB activity
15

Could be used to monitor changes in softening time in avocado fruits
during storage. In pears, PE activity was reported to decrease during fruit
maturation (Nagei and Patterson, 1967) and level up during ripening
(Ahmed and Labavitch, 1980b) Abu-Sarra and Abu-Goukh (1992)
reported that, PE activity in "Kitehner" and "Dr. Knight" mango fruits
decreased steadily during ripening at similar rates, whereas that in "Abu
Samaka" fruits it increased up to shortly before the climacteric peak of
respiration, then decreased. Such decrease in PB activity was also found
in ripening mangoes by other workers (Roe and Buremmer, 198!; Tahir
and Mafic, 1977; Van Lelyveld and Smith, 1979). However, Ashrafet aL,
(1981) found inconsistent pattern of change in PI.7, activity of some
Pakislane mango cullivars.
•The—peehV^i-ibstaim^s-xxll^L^ showed
different degrees of esterifiealion. Saeed el aL, (1975a) reported 58,70
and 75% degree of estcrfication for "Alphonso", "Kitchncr" and "Abu-
Samaka" mango cultivars, respectively,. A very high correlation was
observed between the degree of eslrification and fruit firmness (121-
Nabawi et ah, 1970). Alni-Goukh and Abu-Sarra (1993) observed slower
rale of fruit softening in "Abu-Samaka" mangoes in spite of its higher PG
activity coparcd to "Kitchncr" and "Dr. Knight", cullivars. They
suggested a key role for Pit in controlling the rate of fruit softening
during mango fruit ripening.
6.2 Role of Polygiihicfuronnsc:
polygalacluronascs are enzymes responsible for the cleavage
of the a- 1,4 glucosidic bond between adjacent galacturonic acid units
in (he polymeric backbone of iJic pectic substances. There was a clear
evidence that P(i act on I he de-csterificd portion of (he

polygalacluronide chain. It was not clear, but it seemed more, likely,
that both carboxyl groups adjacent to the 1,4 glucosidic bond5ko<\l<lhc
free from linkages in order to be labile to PG enzyme (Benkova and
Markovic, 1976; Line weaver and Jans-en, 1951).
The role of PG in ripqning - associated fruit softening has been
discussed in many reviews (Pilnik and Voragen, 1970; Van Burcn,
1979). PG activity was reported to increase at the onset of ripening in
pears (Ahmed and Labavifch, 1980b)^peaches (Pressey et at., 1971)
and tomatoes (Hobson, 1962). PG activity progressively increased
during mango fruit ripening and a very high correlation was observed
between the increase in PG activity and loss of flesh firmness
(Abu-Sarra and Abu-Goukh, 1992; Roe and Burmmer, 1981).
Tigchelaar and McGlasson (1977) stated that the inhibition of ripening
in rin and nor, singlegene non-ripening mutants of tomato is proposed
"to occur Titn5clty^tTrtJirgtrthe d'1ircts~of thtiTre -geTTes-oir fruit P<x
biosynthesis or activation. Similar observations were reported by,
Buescher and Tigchclaar (1975) and Poovaish and Nukaya (1979).
The physiological disorder "blotchy ripening11 in tomato was also
evaluated in terms of PG activity. The red areas of blotchy fruit
contain less PG than in even red fruits and the activity is even lower in
non-red areas (Hobson, 1964). Ahmed and Labavfo^(1980a) reported
that treatment of cell wall from unripe fruits with highly purified PG,
changed the sugar composition to resemble that of cell wall from ripe
fruits. Pressey ct at., (1971) stated (hat in peaches, fruit firmness began
to decrease before PG was detected, however, the fruit softened
rapidly after the appearance of the. enzyme. Miller (1987) related the
softening of mechanically stressed cucumbers to the increase in PG,
PE and xylanase activities.
17

%.6.3. Role of Cellulase:
Cellulascs are enzymes responsible for the hydrolysis of {3 -1 ,
4-glucosidic bonds of cellulose as well as the P -1, 4 glucanic linkages
of xyloglucan, which is a hemicellulosic polysaccharide prominent in
cell walls of dicotyledonous plants (Keegstra ct at., 1973).
The role of cellulase in fruit softening was not fully understood.
Babbitt et at., (1973) found that tomato fruits treated with gibberellic
acid showed very low PG activity, while cellulase activity increased
steadily. From the loss of firmness in the treated fruits, they suggested
that softening was initiated by the action of cellulolytic enzymes and
that the"pectolytic enzymes were involved in subsequent changes of
texture. Pesis et at., (1978) reported that ccllttlase activity in detached
avocadoes was directly correlated with fruit softening. In contrast,
Hobson (1968), found that cellulase activity was not correlated with
loss of firmness during ripening of tomato. The enzyme activity was
reported to increase during ripening of normal tomato fruit and similar
change was observed in rin and nor non-ripening mutants (Poovaish
and Nukaya, 1979, Buescher and Tigchelaar, 1975). No eellulase
activity was delected in Sapodilla fruit (Selvaraj et at., 1982) and.pears
(Ahmed and Labavi'+di, 1980b). However, during maturation and
ripening the cellulase activity increased markedly in "Deglet Noor"
date fruits (Masegawa and Smolensky, 1971). The amount of fiber
content, which consist of Cellulose, hemicellulose and lignin,
decreased during maturation and ripening of dales (Mustafa et at.,
1986). The cellulose in the ripening dates is converted into glucose
(Barrevclled, 1993). The increase in collulase activity during IVuil
ripening was demonstrated in avocado (Pesis et at., 1978), dates

(Hasegawa and Smolensky , 1971), Strawberry (Maurice and
Palchctt, 1976), and tomato (I Jail, 1964, 1965; Hobson, 1968).
In mangoes, it was reported that cellulase activity steadily
increased with the decrease in.tissue firmness with high correlation
(Abu-Sarra and Abu-Goukh, 1992; Roe andBuremmer, 1981). They
suggested that PG, PE and cellulase are the degrading enzymes
responsible for fruit softening during mango fruit ripening.

CHAPTER 3

CHAPTER 3
Materials and Methods
3.1. Fruit Source and Ripening Procedure:
Mature green fruits of white-and pink-fleshcd guava fruits were
obtained from the University of Khartoum orchard at Shambal (Lai.
15° 40 'N, Long. 32° 22'E). Fruits were selected for uniformity in size,
colour and freedom from blemishes. About 400 fruis, from each guava
fruit type were washed, dried, placed in carton boxes, and stored in the
ripening room at 22 + 1°C and 90-95% RH.
3.2. Respiration and Firmness Determination:
Random samples of sixteen fruits from each type were removed
-daily-forr^spimtioi:^ rate
was determined for each fruit of the sample separately using the total
absorption method of Charlmcrs (1956) (Appendix 1). Hesh firmness
was measured by the Magness and Taylor firmness tester (D. iiallauf
Meg. Co.) equipped with an 8mm diameter plunger tip and expressed
in kilogram - force (kg. I"). Two readings were laken fromopp ff sides
of each fruit after the peel was removed. The fruits were labelled and
stored at - I2"C and later soiled into seven groups (13.4, 1 1.5, 9.5, 7.6,
5.7, 3.8 and 1.9 kg. f.) according lo iheir flesh firmness. Hach group
consisted of 10 fruits.
3.3. Total Soluble Solids Determination:
The frozen fruits of (he different groups were thawed separately
for 90 min. Total soluble solids (TSS) were measured directly from
20

the fruit juice using Kruss hand refractometer (Model HRN-32). Two
leadings of individual fruits of each group were determined by placing
a drop of the fruit juice from opposite sides in the refractometer prism
and the TSS was determined directly as percentage.
3.4. Compositional Changes:
3.4.1. Tissue Extraction:
Thirty grants of pulp or peel from each group were homogenized
in lOOmls. of distilled water for one minute in a Sanyo Solid State
blender (Model SM 228P) and centrifuged at 6,000 rpm for 10 min in
a Gallenkamp portable centrifuge (CP 400). The volume of the
supernatant, which consistutcd (he pulp or peel extracts, were
determined.
3.4.2. Titratablc Acidity:
Titratable acidity in pulp and peel extracts were determined
according to the .method described by Ranganna (1979). Five mis. of
pulp or peel extract were taken. Twenty mis. of distilled water were
added and titrated against 0.IN NaOH using phenophthalcin as
indicator. Tilratablc acidity was expressed as percent cilrie acid.
3.4.3. Total Sugars:
Total sugars were determined in pulp and peel extracts, using the
Anthrone method of Ycnun and Willis (1954) (Appendix 2). Total
sugars were expressed in grams per lOOg fresh weight.
3.4.4. Rcducing$ugars: /
The reducing sugars were determined in pulp and peel extracts
according to the technique described by Nelson (1944) as modified by
21
Somogyi (1952) (Appendix 3). Reducing sugars were expressed in
grams per lOOg fresh weight.
3.4.5. Total Proteins :
The total proteins, in the pulp and peel of guava fruit extracts
were determined by the protein - dye binding procedure described by
Bradford (1976) (Appendix 4). The protein content was expressed in
grams per lOOg fresh weight.
3.4.6. Phenolic Compounds:
The Folin - Ciocalue method of Singleton and Rossi (1965) was
used for determination of the phenolic compounds in the pulp and
peel extracts (Appendix 5). Phenolic compounds were expressed in
grams per lOOg fresh weight.
3A7. Ascorbic Acid:
Ascorbic acid in the pulp and peel of guava fruit extracts was
determined by the 2, 6 - dichlorophenol - indophcnol liiration method
described by Ruck (1963) (Appendix 6). Ascorbic acid content was
expressed in milligramsper lOOg fresh weight.
3.5. Enzymes Extraction and Assays:
3.5.1. Enzyme Extraction:
Enzymes were extracted according lo (he procedure described by
Ahmed and Labavilch (1980b). Guava fruits al designated stages of
firmness were peeled, and 5()g of flesh were homogenized in two
volumes of 100 mM sodium acetate buffer pH 6.0 containing 0.2%
sodium dithionile (Na2 S2 0.,) and .1% poly-vinyl pyrrolidone (IJVI\
MW. 44,000) for one minute using Sanyo Solid State blender. The

homogcnatc was ccnlrifugccl at 10,000 rpm for 20 min. The
supernatant was stored at - 12°C (buffer extract).
The residue was suspended in two volumes of I M sodium
acetate buffer.pH 6.0 containing 6% NaCI. The pH of the suspension
was adjusted to 8.2 with 2N NaOH. The sample was kept overnight at
4 C with continuous stirring and then centrifuged at 10,000 rpm for 20
min. The residue was discarded and the supernatant was filtered twice
using Whatman No. I, 9-cm filler paper. The fillcntfc (salt extract) was
dialyzed against distilled water for 48 hours with four changes. All
operations were carried out in an ice bath. This dialyzed sample
constituted the enzyme extract.
3.5.2. Pcctincstcrnsc Activity Assay:
Peclinesterasc (PE) activity was determined according to the
H:eelinkjire-{-les€ril5ed^y-^^
used was a 1% (w/v) solution of pectin (Citrus; 150 grade; H.P.
Bulmer Ltd., Hereford, England). The pM of the pectin solution was
adjusted to 7.0 with 0.02 N NaOH. The reaction mixture contained
25mls. of the crude enzyme, 5mls. of 0.2M-sodium oxalale and 25mls.
of the substrate. The reaction mixture was incubated al 3()"C and
continuously stirred by bubbling C()2- free air through it. Dining (he
course of the reaction, the pll of the reaction mixture was maintained
at 7.0 with 0.02N NaOH. The amount of 0.02 N NaOH added was
recorded every \5 nun. Enzyme activity was determined in terms of
milliquivalenl of ester hydrolyzed per kilogram of original fruit fresh
weight. The activity was then expressed in units. One unit of PE
activity was defined as one millicquivalenl of ester linkages cleaved
per niin per kg fresh weight.

3.5.3. Polygalacturonasc Activity Assay:
Polygatacturonase (PG) activity was determined by measuring
the reducing groups released from polygalacluronic acid (Orange;
Sigma Chem - Co.)- Reducing groups released were measured
according to the technique described by Nelson (1944) as modified
by Somogyi (1952) (Appendix 3). The reaction mixture containing
0.25 ml of crude enzyme, 0.25 ml of 100 mM sodium acetate buffer
pH 4.5, and 0.5 ml of 0.1% polygalacturonic acjd solution, was
•incubated at 37°C for 30, 60, 90, 120, and 150 min. At the end of
each incubation period the amount of reducing groups released was
determined. A calibration curve was obtained using d-galacturonic
acid (MW 212.2, Sigma Chem. Co.) as a standard. PG activity was
determined as micromoles of galacturonsyle reducing groups
liberated-per minute per kilogram original fruit fresh weight. The
activity was then expressed in units. One unit of PG activity was
defined as one/* mole ol galacturonasyl reducing groups liberated
per min. per kg fresh weight.
' 3.5.4. Cellulase Activity Assay:
Cellulase activity was determined by measuring the reducing
groups released from carboxymcthyj Cellulose. The concentration of
the reducing groups was determined, as in Ihe PG activity assay, with
p-glucose as a standard. The reaction mixture contained 0.25 ml of
crude enzyme, 0.5 ml of 0.1% carboxymethyl cellulase, and 0.25 ml
of 100 mM sodium acetate buffer pII 5.0. Incubation was carried out
at 37°C for 2, 4, 6 and 12 hours. Cellulase activity was determined as
micromoles of glueosyl reducing groups catalyzed per hour per
kilogram fresh weight. The activity was then expressed in units. One
unit of Cellulase activity was defined as one M. mole glucosyl
reducing groups liberated per hour per kg fresh weight.
24

CHAPTER-4

CHAPTER 4
RESULTS
4.1. Fruit Flesh Firmness and Respiration Rate :
Changes in fruit flesh firmness during ripening of white - and
pink - fleshed guava fruits a.t? shown in Fig. 1. Flesh firmness varied
within the individual fruits of the same type and at the same ripening
stage. Therefore, the values for flesh firmness in Fig. 1. were
calculated as means of 10 fruits in each group sample determined in
both sidesof the fruit.
During fruit ripening, the two guava fruit types had shown typical
pattern of changes in flesh firmness. The white - fleshed guava fruit
Jiajd^pix^rej^wejy declined in firmness from 28.2 kg.f. in the firm
mature green stage to 3.1 kg.f. in the soft ripe stage, while the pink
flesh guava decline from 27.5 to 3 kg.f. in the same stages. It look the
fruit 24 days to reach that final ripening stage.
Fig. 2 shows respiration rate of the while - and pink - fleshed
guavas. The respiration curves of the Iwo guava types exhibit a typical
climacteric pattern, wilh climacteric peak al 7.6 kg. f. flesh firmness
for both types. The respiration rate was significantly higher in the pink
- fleshed guava during all stages of ripening. (Appendix 8, (able I).
4.2. Compositional Charges During Fruit Ripening:
4.2.1. Total Soluble Solids:
Changes in total soluble solids (TSS) during guava fruil ripening
are shown .in Fig. 3. In both guava types, TSS increased wilh the
25

decrease in flesh firmness. The white fleshed guava had shown
significantly higher values compared to the pink - fleshed ones.
During fruit ripening, TSS had increased about 1.2 - guava folds in
both types. (Appendix 8, table 2).
4.2.2. Total Sugars:
Fig. 4. Shows changes in total sugars in pulp and peel during
ripening of white - and pink - fleshed guava fruits. Total sugars in the
white guavas were about 3 times higher than that in the pink ones. The
peel in both types contained significantly more total sugar than the
pulp. (Appendix 8, table 3,4, 5, 6).
The total sugars increased in the two guava types with decrease
in flesh firmness. More increase was noticed after fruit firmness of 7.6
kg. f. which coincided with the climacteric peak of respiration (Fig. 2).
Tfre~~pnS^tlTrar^ was-9^2% and
30.4% in the white - and pink - fleshed types compared to
post-climacteric increase of 31.7% and 56.7% in the white and pink
types, respectively. (Fig. 4).
4.2.3. Reducing Sugars:
Fig. 5. Shows the changes in reducing sugars in pulp and peel
during fruit ripening of white and pink guava types. The reducing
sugars in pulp and peel had increased up lo the climacteric peak
(firmness 7.6 kg. f.) in the white-fleshed or shortly before thai
(firmness 9.5 kg. f.) i/i the pink - fleshed guavas and subsequently
decreased. However, the amounts of reducing sugars at the beginning
and end of the ripening period were almost similar. Reducing sugars
in the peel of the while guavas were significantly higher than in the
26

pulp, while in the pink guava type the reducing sugars were higher in the
pulp compared to the peel (fig. 5). (Appendix 8, table 7,8).
4.2.4. Titnihifolc Acidity:
Tilralable acidity was expressed as percent citric acid. Fig. 64}
shows the changes in tilralable acidity in pulp and peel during fruit
ripening of whilc-and pink-ficshed guava fruits. Tilralablc acidity in pulp
and peel of both guava types had increased up to the climacteric peak and
then decreased afterwards. There were a significant differences between
the peel and pulp in white- Meshed guava fruit, but no significant
differences were observed in the pink guava fruits (Appendix 8, table
9,10).
Changes in total protein content in pulp and peel of while and pink guava
fruit types during fruit ripening are shown in Fig. 7. Total protein
increased systematically up to the full-ripe stage (fruit firmness 3.8. kg.f.)
and suddenly decreased. The pink-lleshed guava fruits had significantly
higher total protein content in pulp and peel compared to the white-
ileshed. ones. (Appcndix8, table 11,12), The peel in both guava types had
shown higher values of total protein content compared to the pulp (Fig.7).
4.2.6. Phenolic compounds:
Fig. 8. Shows the changes in phenolic compounds in pulp and peel
of-the two guava fruit types. 'I'he phenolic compounds decreased with
decreased flesh firmness. The decrease in the white guava types was
much drastic than that in the pink type. The decrease in total
phenolic in the white guavas was 7- and 5 folds

in the peel and pulp, respectively, compared to the pink guavas with 3-
- and 4 - folds decrease in peel and pulp (Fig. 8). The white guavas
had significantly higher values of phenolic compounds in pulp and
peel compared to the pink guava type. The peel in both types had
shown higher values of total phenolic* than the pulps. (Appendix 8,
table 13, 14).
4.2.7. Ascorbic Acid:
Fig. 9. Shows the changes in ascorbic acid content in pulp and
peel during fruit ripening of white and pink guava types. Ascorbic
acid decreased steadily during ripening. At the final - ripe stage (flesh
firmness 1.9 kg. f.) the amount of ascorbic acid retained was 86.3% in
the pulp and 85.6% in the peel of the while-fleshed guava fruils,
compared to 76.6% and 78.1% in pulp and peel of the pink - fleshed
guavas, respectively (Fig. 9). The white guava fruils had 19.2%; and
22.3% much more ascorbic acid in pulp and peel/respectively, than
the pink guava type. The peel in both lypcs showed significantly
higher values of ascorbic acid content compared to the pulp.
(Appendix 8, table 15, 16, 17, 18).
4.3. Enzymatic Activity changes During Fruit Ripening :
The activities of cell wall degrading enzymes, pcclinesterase
(PE), polygalacturonasc (PG) and Cellulase were measured in extracts
prepared from pulp of the white - and pink - fleshed guava fruits
during fruit ripening.
Enzyme activities in the buffer extracts were extremely low
compared to the activities in the corresponding salt extracts.
Moreover, the buffer extracts contained lar<;e amounts oi' reducinu
28

sugars which resulted in high back-ground readings in the reducing
group assay. Although that problem can be lessened by dialysis of the
extract, the time required was excessive. Only the data of enzyme
activities measured in the NaCl washes of the cell wall pattets will be
presented hens.
4.3.1. l'cclinelorasc Activity:
Changes in pectinesterase activity during fruit ripening of white
and pink guava types are presented in Fig. 10. The pectinesterase
activity, in both guava fruit types, had increased rapidly during the
onset of ripening and reached the maximum level with the climacteric
peak of respiration (flesh firmness 7.6 kg. f.) and then decreased to a
minimum value. The white guava fruit type had shown significantly
higher HE activity compared to the pink fruit type. (Appendix 8, table
19).
4.3.2. I'olygalacturonase Activity:
Pig. 11. Shows changes in polygalactuionasc activity during
"ripening of white - and pink -fleshed guava fruits. PG activity
progressively increased during fruit ripening in a similar manner, in
both fruit types. High correlation was observed between the increase
in PG activity and loss of flesh firmness. The PG activity had
increased 4.2 - and 3.8 - folds in the white and pink guava types,
respectively.There was a significant difference obscrvecjbelween
the two types. (Appendix 8, table 20).
4.3.3. Cellulasc Activity:
Changes in Cellulase activity during ripening of white and pink
guava fruits are shown in l-'ig. 12. Cellulase activity had progressively
increased during fruit ripening. The correlation was very high between
29

the increase in ccllulasc activity and the decrease in fruit flesh firmness.
The ccllulasc activity had increased 3.5-and 4.8 folds in the white and
pink guavas, respectively (Fig. 12). High significant differences in
ccllulasc activity were observed between the two guava types. (Appendix
8, table 21).

30 n
25-
U)
WWCDcEi lszV)
u.
20
15
U-
0 +1 2 3 4 6 6 7 8 9 10 1112 13 1415 16 17 18 19 20 2122 23 24
Days After Picking
Fig. I : Changes of fruit flesh firmness duringripening oi: white~(-«-) and pink - fleshed
guava al 22"C and 90-95% RI-l.
31

45
40
35
JC•
JC
OOCO
.8"TO
oc
ion
2"a
</>0)
30*
25*
20-
15-
in.
13.3 11.4 9.5 7.6 5.7 3.8
Fruit Flesh Firmness (kg.f)
1.9 0
Fig. 2 : Relationship between CO2 Production andfruit flesh firmness during ripening ofwhite - (-•-) and pink - fleshed (•*-) guavafruits.
32

CO(0
(00)3
15co
3o
14
12
10
8
0
13.3 11.4 9.5 7.6 5.7 3.8
Fruit Flesh Firmness (kg.f)
1.9 0
Fig. 3 : Changes in total souble solids (TSS)during ripening of white -(••-) and pink -fleshed guava fruits.

12
10
fsO)oo
CO
en3e3 4*orco"O
a:2 '
" A - - - A
13.3 11.4 9.5 7.6 5.7 3.8 1.9 0
Fruit Flesh Firmness (kg.f)
Fig. 5 : Reducing sugars changes in pulp (- )ami peel ( ) during ripening of white- (-«-) and pink - fleshed ( •*- ) guavafruils.
35

0.24
0.16
£ 0.08opO
0
: 13.3 11.4 9.5 7.6 5.7 3.8 1.9 0
Fruit Flesh Firmness (kg.f)
Fig. 6 : Changes in titraUible acidity in pulp (—)and peel ( ) during ripening of white( -«- ) and pink - fleshed ( +• ) guavafruits.
36

fJC
wt+Mi
O)oo
s
ote
inT
ota
l Pij
0.48*
0.44*
0.4«
0.36 •
0,32-
0.28*
0.24-
0.2-
0.16 •
0.12-
0.08*
0.04-
0-
m m
13.3 11.4 9.6 7.6 5.7 3.8 1.9 0
Fruit Flesh Firmness (kg.f)
Fig. 7 : Changes in total protein content in pulp( ) and peel ( ) during ripening ofwhite - (-«- ) and pink - fieshcd ( -A.- )uuava fruits.
37

CO
Ooo
3«
C3OQ.
O
oo
"ocro>
JZQ.
0.380.360.340.32
0.3
0.28
0.26
0.24
0.22
0.2
0.18
0.16
0.14
0.12
0.1
0.08
0.06
0.04
0.02
0
2 13.3 11.4 9.5 7.6 5.7 3.8
Fruit Flesh Firmness (kg.f)
1.9 0
Fig. 8 : Changes in phenolic compounds in pulp(—) and peel ( ) during ripening ofwhite - (-*-) and pink - fleshed (•*-) guavafruits.

fres
h.
o>oo
"oCO
'bic
Asc
oi
95*
90'
85 •
80 •
7 5 '
70*
65*
60«
55-
50-
45-
" jfr - - - A
13.3 11.4 • 9.5 7.6 5.7 3.8
Fruit Flesh Firmness (kg.f)
1.9
Fig. 9 : Changes in ascorbic acid content in pulp• (—) and peel ( ) during ripening of
white - (* ) and pink - fleshed (•*•) guavafruits.
39

j
c
73OTOOV)
23
OO
CL
13.3 11.4 9.5 7.6 5.7 3.8
Fruit Flesh Firmness (kg.f)
1.9 0
Fig. l() : Changes in Peetinesterase (PC) activityduring ripening of while - ( ^ ) and pink -Jleshed (-«-) guava fruit.(One unit of PB uctivily will cleave I milliequivalenlof ester linkages per minute).
40

35
30
J9?
25
$en
20a
8=
3- 15
owS 10TOcooJ5 5to
13.3 11.4 9.5 7.6 5.7
Fruit Flesh Firmness (kg.f)
9
3.8 1.9 0
Fig. I I : Changes in PG activity during ripeningof white - ( - • - ) and pink - fleshed (•*• )guava fruits.(One unit of PCI nclivily will l iberate une (.t molegahicluronsyl recluciiui, giou|>s per minute).

32
30
28
.26
£ 24-
I 22x:w on
18
a 16
I 14 •
!* 12
1 10(0 a
"55 6o
13.3. 11.4 9.5 7.6 5.7 3.8
Fruit Flesh Firmness (kg.f)
1.9 0
Fig. 12 : Changes in Ccllulase activity duringripening of white - (-«-) and-pink - fleshed(•*-) guava fruits.(One unit of cellulase activity will liberate one jjmole reducing groups per minute).

CHAPTER 5

CHAPTER 5
DISCUSSION
Guava is a.popular fruit crop in Sudan. It is grown in every slate.
Although Sudan has great potentiality of producing high quality guava
fruits and good potentiality for exporting guavas to other countries, its
marketability is limited to local markets due to the delicate nature of
the fruits, poor handling practices, and inadequate transportation and
storage facilities. In this study, the biochemical and enzymatic
changes that occur during ripening of the white - and pink - fleshed
guava fruits were followed. The aim of the study was to provide a
base-line information regarding the biochemical nut lire of ripening
and softening mechanisms in guava fruits to assist in development of
sound prjo^rairumibiix^ of
firmness during handling, transportation and storage.
Fruit softening is characterized by changes in flesh firmness ami
has long-been associated with fruit ripening (Dostal, 1970). These
changes in fruit firmness determine shelf-life and quality of the
commodity. Control'of the fruit texture is a major objective in modern
food technology (Van Buren, 1979). During fruit ripening, the white -
and pink-fleshed guava fruit types had shown typical pattern of
changes in flesh firmness. l;ruit flesh firmness had progressively
declino/during fruit ripening (l;ig. i). The decline observed was about
8-folds from the hard mature green stage to the final soft ripe stage.
Similar drop in guava fruit firmness was reported in earlier studies
(Rodriguez ct al., 1971). Abu-Goukh and Abu-Sana (1993) observed
a rapid decrease in flesh firmness during ripening of three mango
43
cultivars. They found that more than 80% of the firmness decline hatf
occurred over two days and coincided with the climacteric peak of
respiration. Similar pattern of change'was-reported for bananas
(Abu-Goukh et al., 1995), pears (Luton and Holland, 1986), apples,
peaches and apricots (Salunkhe and Wu, 1973) and dates (Barrcvcllcd,
1993).
Respiration rate of the white - and pink-fleshed guavashad shown
a typical climacteric pattern of respiration, with climacteric peak at 7.6
kg. f flesh firmness for both types (Fig. 2). The...respiration rate was
higher in the' pink-fleshed guava fruits during all stages of ripening.
The climacteric pattern of respiration was also reported earlier by
Akamine and Goo (1979), who observed that clhylene had triggered
the respiratory rise.
changes
in colour, texture and flavour, indicating that compositional changes
are taking place. Attainment of maximum eating quality of a fruit"
necessitates completion of such chemical changes. Unripe fruits, are
usually hard in texture, starchy and acidic in taste and sometimes
astringent. After ripening, they become soft, sweet, non acidic>lost
astringeney and highly flavoured, so greatly acceptable as human
food. These changes are generally coincided wilh I lie peak of
respiration.
Total soluble solids (TSS) and total sugars had increased in ho(h
guava types wilh decrease in flesh firmness, Rodriguez et al. (1971)
observed-gradual increase in TSS and total sugars during guava fruit
ripening. Similar findings were reported for bananas (Ibrahim el al.,
1994), mangoes* (Abu-Goukh and Abu-Sana, 1993; Mincxsy el al.,

1984, Saeed et a]., 1975b) and dates (Dowson and Aten, 1962). Biale
(1960) attributed the increase in TSS and total sugars during ripening
to the hydrolysis of starch to sugars. The peel in both guava types
contained more total sugars than the pulp. This may be due to the less
amounts of moisture content in the peel compared to the pulp, since
sugars were expressed in g per lOOg fresh weight (Fig. 4).
More increase in total sugars in pulp and peel was observed after
fruit firmness of 7.6 kg.f, which coincided with the climacteric peak of
respiration (Fig. 2). This remarkable increase in total sugars observed
after the climacteric peak (Fig. 4) may be attributed to the increase in
activity of enzymes responsible for starch hydrolysis and/or decline in
the rate of sugar breakdown by the respiration process.
Climacteric fruits in particular may show considerable changes in
sugar content during fruit ripcjiingXHiU^£^19JQ^
were round to convert into glucose during fruit ripening (Wills et al.,
1981). The reducing sugars in the pulp and the peel had increased up
to the climacteric peak (firmness 7.6 kg. f) in the white-fleshed or
shortly before that (firmness9.5 kg. f) in the pink-fleshed guavas and
subsequently decreased. Maximum valves reached were 6 and 8
(g/IOOg f.wl) in the pulp and 5 and 10 (g/lOOg. f. wt) in (he peel of the
pink and while guavas, respectively (Fig. 5). Mowlah and lloo (1982)
showed that glucose, fructose and sucrose were the main sugars in (he
white-and pink- fleshed guavas. The level o! fructose sugars increased
during guava fruit ripening and their decreased in the over-ripe fruits
(Le-Riche, 1951). Subrahmanyam and Acharya (1957) also (bund that
reducing sugars increased during guava fruit ripening and then
decreased; Similar results were also reported in mangoesj,where
reducing sugars increased up to the climacteric peak and decreased
45

afterwards (Abu-Coukh and Abu-Sarra, 1993, Subranianyam ct al.,
1976).
The non-volatile organic acids are among the major cellular
constituents undergoing changes during ripening of fruits. Taste in
fruits is a function of sugar-acid blend (Mattoo et al.,' 1975). The
white fruit type had shown higher acidity in the pulp and peel than the
pink fruit type. (Fig. 6). The white-fleshed type had also, the highest
TSS. (Fig. 3); total sugars (Fig. 4) and reducing sugars (Fig. 5-),nuiking
it more tasty and preferred by most consumers compared to the
pink-fleshed fruit typeJltratable acidity in pulp and peel of both guava
types studied increased up to the climacteric peak (firmness 7.6 kg.f)
and then declined afterwards (Fig. 6). Similar results were reported
during ripening of bananas (Ahmed and Tingwa, 1975; Desai and
Deshpande, 1975; Palmer, 1971) and mangoes (Abii-Jao_ukh -and
Abu-Sarnrrl"995rKrishnamurthy ct al., 1971). The pulp in both guava
types showed lower titratable acidity compared to the peel. Similar
findings were reported in mangoes (Abu-Coukh and Abu-Sarra, 1993).
Proteins and free qmino acids arc minor constituents of fruits and
have no role in determining eating quality. Changes in ami no acids and
proteins however, indicate variations in metabolic activity during the
different developmental stages. During the climacteric phase of many
fruits, there is a decrease in free amino acids which ofW\ reflects an
increase in protein synthesis. During senescence, (he level of free
amino acids increases reflecting breakdown of enzymes and decreased
metabolic activity (Wills et al., 1981). The total protein in pulp and
peel of the white and pink guava types increased systematically up to
the full-ripe stage (fruit firmness 3.8 k.g) and suddenly.decreased
(fig.7). Abu-Goukh and Abu-Sana (1993) reported thai
46

total protein in pulp and peel of»Mn<)ocul1:ivars increased up to the
full-ripe stage and then decreased at the over-ripe stage. That decline
was explained as breakdown of proteins during senescence; which
supported the view that proteins in ripening fruits are enzymes
required for the ripening process (Frenkel et al., 1968).
The pink-fleshed guava fruits had higher total protein content in
pulp and peel compared to the white-fleshed ones. The peel in both
guava types, had shown higher values of total protein content
compared to the pulp (Fig. 7). The peel in mangoes was also reported
to have higher protein content than the pulp (Abu-Goukh and
Abu-Sarra, 1993). Although the peel of both guava type studied had
higher protein content, no higher metabolic activity canbe ascribed
for it at this stage, but can be explained for the lower moisture conlcnl
of the peel compared to the pulp, since the piolein content was
Phenolic compounds are important factors of fruit quality.-
Tannins arc high molecular weight phenolic compounds that form
strong complex with proteins and other polymers. The tannins
represent the primary substrate for browning reaction in fruit tissues
(Hulme, 1971). They are also responsible for the astringent taste in
unripe fruits which disappears due to polymerization of tannins during
fruit ripening (Al-Ogaidi and Mullak, 1986). Tannins play a vital role
in plant disease resistance (Kaa, 1968; McLean et al., 1961) and
protect plants against insect pests (Ne/.am FI-I)in et al., 1983).
The phenolic compounds in pulp and peel of while and pink
guava types progressively decreased with decreased fruit flesh
firmness (Fig.8). Molah and lloo (1982) reported that in both while

and pink guavas the total polyphenol decreased all along from the
immature stage to the full-ripe stage. The decrease in phenolic
compounds with fruit ripening was also reported in bananas (Ibrahim
et al., 1994; Abu-Goukh et al., 1995), mangoes (Abu-Goukh and
Abu-Sarra, 1993) and dales (Al-Ogaidi and Mutlak, 1986).
The decrease in phenolic compound in the white guava type was
much drastic than that in the pink type. The decrease in total phenolics
was 7 - and 3 - folds in the pulp of white and pink types (Fig. 8). This
may add for the better taste of the white-fleshed gLiava type compared
to the pink-fleshed type. The decrease in astringency in guava during
ripening was associated with the increased polymerization of
leucoanthocyanidins and hydrolysis of the astringent arabinose ester
of hexahydrodiphenic acid (Goldstein and Swain, 1963; Misra and
Seshadri, 1968). The peel in both types lui 'sIiowiiJiiglici-vaJ-ueK-i-^1-
tettrl^"lTeTiotics"than the pulp. This may have more significance in
plant disease resistance and protection of the fruit against insect pests-.
Ascorbic acid (vitamin C) is only qminor constituent of fruits and
vegetables, butifc&fmajor'importance in human nutrition. Virtually all
man's dietary vitamin C is obtained from fruits and vegetables. The
daily requirement of man from vitamin C is about 50 milligrams and
many fruits contain this amount of vitamin C in less than 100 grams of
tissue (Wills et al., 1981). Guava fruit is extremely rich in vitamin C
(242 mg per lOOg) (Watt and Merrill, 1975).
Ascorbic acid in pulp and peel of white and pink guava (ypes
decreased steadily during fruit ripening. Al the final ripe stage (flesh
firmness 1.9 kg.f) the amount of ascorbic acid retained was 86.3% in
the pulp and 85.6% in the peel of the white-fleshed guava fruits
48

compared to 76.6% and 78.1% of pulp and peel of the pink-fleshed
guavas, respectively (Fig. 9). The ascorbic acid content in guava fruit
reaches a. maximum level in the mature green stage and starts to
decline rapidly as the fruit ripens (Agnihotri et al., 1962; El-Zorkani,
1968). The decline in ascorbic acid content during ripening was also
reported in mango fruits (Abu-Goukh and Abu-Sana, 1993; Mincssy
etal., 1984; Chikkasubbanna and Huddar, 1982).
The white guava fruits had 19.2% and 22.3% much more
ascorbic acid than the pink guavas, in pulp and peel, respectively
(Fig.9). Variable reports are available about the amounts of ascorbic
acid in the white - and the pink - fleshed guavas. El-Fake ct al. (1975)
reported higher values for ascorbic acid in white-fleshed than
pink-fleshed fruits, while other investigators reported the reverse
(Agnihotri et al., 1962; El-Zorkani, 1968).
Th"e~peerUf FotfT types showed much higher values of ascorbic-
acid content compared to the pulp (Fig. 9).The peel of the guava fruit •
was reported to contain most of ascorbic acid in the fruit (Wilson,
1980). Similar result were reported for mangoes (Lakshminarayana et
al., 1970; Siddapa and Bahatia, 1954). The higher values of ascorbic
acid in the peel were attributed to interference of phenolic compounds
with the dye, 2,6-dichlorophenol indophcnol, used in the assay
(Lakshminarayana et al., 1970). In contrast, Abu-Goukh and
Abu-Sarra (1993) reported lower values for ascorbic acid in Ihe peel
compared to the pulp in three mango eultivars.
Fruit softening is characterized by changes in flesh firmness and
has long been associated with fruit ripening. Fruits undergo progress
decline in flesh firmness. This decline was demonstrated in mangoes
(Abu-Goukh and Abu-Sarra, 1993), bananas (Abu-Goukh and et al.,
49

1995) pears (Luton and Holland, 1986), apples, peaches and apricots
(Salunkhe and Wu, 1973) and dates (Barrevclled, 1993). The general
observation is that softening is accompanied by soiublization of pectic
substances : involving the sequential action of pectincstcrase (PE) and
polygalacturonase (PG) enzymes. This notion was supported by
'reports on changes in cell wall pectic material in ripening mango
(Tandon and Kalara, 1984, Roe and Buremmer, 1981), tomato
. (Besford and Hobson, 1972; Arad et al., 1983), pear (Ahmed and
Labavitch, 1980a), peach and apple (McCready and McComb, 1954),
and strawberry (Kertesz, J951).
A direct role of PE in fruit softening has been demonstrated.
Buescher and Tigchelaar (1975) reported that PE activity increased
during ripening of normal tomato fruit, while ihal'of rin fruit (a non
ripening mutant) remained constant. The failure of the uon ripening
loiirato~rrrataiTr("j^)""wTiis"evaliiate"d'~iii"ten'iis of PE activity (Buescher
and Tigchelaar, 1975). Mattoo and Modi (1969) related the softening
of chilling injured mango fruits to the increase activity of PE. Barmorc
and Rouse (1976) suggested that PE activity could be used to monitor
changes in softening time in avocado fruits during CA storage.•
The exlractable PE activity, in the white - and pink - fleshed
guava had increased rapidly during the onset of ripening, reached the
maximum level with the climacteric peak of respiration (flesh firmners
7.6 kg.f.) and then decreased to a minimum value (Fig. 10). Abu-Sana
and Abu-Goukh (1992) reported that PE activity in "Abu-Samaka"
mango increased up to shortly before the climacteric peak of
respiration and then decreased. That finding agrees with previous
reports on mangoes (Van Leiyveld and Smith, 1979; Tahir and Malik,
1977; Roc and Buremincr, 1981). The increase in PE activity during
50

fruit ripening has been reported in bananas (Hultin and Levine, 1965;
De Sward and Maxie, 1967), dates (Al-Jasim and Al-Delaimy, 1972)
and tomatoes (Hobson, 1963; Pctliawala et al., 1948). The
white-fleshed guava fruit had show higher values for PE activity
compared to the pink-fleshed ones. This could be explained for
difference in constituents of the white and pink guava types. White
guava types had shown higher values for TSS (Fig. 3), total sugars
(Fig. 4), reducing sugars (Fig. 5) titralablc acidity (Fig. 8) and most
probable poetic substance compared to the pink guavas.
Polygalacturonas.es (PGs) are enzymes responsible for (he
cleavage of the a -1,4 glucbsidic bond between adjacent galacturonic
acid units in the polymeric backbone of the pectic substances. There
was a clear evidence that PG act on the dc-cslerified portion of the
polygalacturonide chain. It was not clear, but it seems more likely, that
Iree
from linkages in order to be labile to PG enzyme (Benkova and
Markovic, 1-976; Linewcaver and Janscn, 1951).
The role of PG in ripening-associated fruit softening is well
documented (Pilnik and Voragen, 1970; Van Buren, 1979). Tigchelaar
and McGlasson (1977) stated that the inhibition of ripening in rm and
nor, single gene, non-ripening mutants of tomalo is proposed to occur
directly through the effects of these genes on fruit PG biosynthesis or
activation. Similar observations were reported by Bucschcr and
Tigchelaar (1975) and Poovaish and Nukaya (1979). The physiological
disorder "blotchy ripening" in tomalo was also evaluated in terms of
PG activity. The red areas of blotchy fruits contain less PG than in
even red fruits imd the activity is even lower in non-red areas (Hobson,
1964).
51

PG activity progressively increased during fruit ripening in a
similar manner in both guava fruit types. High correlation was
observed between the increase in PG activity and loss of fruit flesh
firmness (Fig. 11). The PG activity had increased 4.2 - and 3.8 - folds
in the white and pink guaya types, respectively. Similar results were
reported for mangoes (Abu-Sarra and Abu-Goukh, 1992; Roe and
Burmmer, 1981), pears (Ahmed and Labavitch, 1980b), peaches
(Pressy et al., 1971), dates (Hasegawa et al., 1969) and tomatoes
(Hobson, 1962).
Pressey et al., (1971) stated that in peaches, fruit firmness began
to decrease before PG was detected, however, the fruit softened
rapidly after the appearance of the enzyme. Miller (1987) related the
softening of mechanically stressed cucumbers to the increase in PG,
PE and xylanase activities. Ahmed and Labavitch ^98()a)repoji.cd_
that treatment of cell wall from unripe fruits with highly purified PG,
changed the sugar composition to resemble that of cell wall from ripe
fruit.
Besford and Hobson (1972) observed some degree of softening in
tomato fruit before commencement of the PK and PG action. A
non-en/.ynialic reaction was suggested to occur in plants which might
be responsible for some of the changes that occur in peclic substances
as well as in oilier polysaccharides (Kcrlesz, 1943). A wall-modifying
enzyme was reported by Karr and Aibersheim (1969) to be an
important prerequisite for the action of the polysaecharide-degrading
enzyme. Matlo et al. (1975) slated that softening in some fruits occurs
through hydrolysis of starch (as in squash) or of fat (as in avocado).

Cellulases are enzymes responsible for the hydrolysis of
(3-1,4-glucosidic bonds of cellulose as well, as (3-1,4-glucanic linkages
of xyloglucan, which is a hcmiccllulosic polysaccharide prominent in
cell wall of dicotyledonuous plants (Keegstra el al., 1973).
The role of celluiase in fruit softening was not fully understood.
Babbit et al., (1973) found that tomato fruits treated with gibberellie
acid showed very low PG activity, while cellulase activity increased
steadily. From the loss in tissue firmness in the treated fruits, they
suggested that softening was initiated by the action of celluloiytie
enzymes and that the pectolytic enzymes were involved in subsequent
changes of texture. Pesis et al., (1978) reported that celluiase activity
in detached avocado fruits was directly correlated with fruit softening.
Celluiase activity increased markedly during maturation and ripening
in "Deglet Noor" date fruits (Hasegawa anc^Smplenste^ 497-1-). The
-aniotmrui'ltbcFcontent, which consist of cellulose, hcniiccllulo.se and
lignin, decreased during maturation and ripening of dates (Mustafa et
al., 1986). The cellulase in the ripening dates was converted into
glucose (Barrevelled, 1993).
In contrast, Hobson (1968), found that cellulase activity was not
correlated with loss of firmness during ripening of tomatoes. The
enzyme activity was reported to-increase .during ripening of normal
tomato fruit and similar change was observed in rj_n and nor
non-ripening mutants (Poovish and Nukayu, 1979; Bucscher and
Tigchelaar, 1975). No cellulase activity was detected in sapodilia fruit
(Selvaraj el al., 1982) and pears (Ahmed and Labavitcli, 1980b). Very
I i in {degradation of cellulose was reported to occur during fruil
softening in bananas (Barhell, 1943), peaches (Sterling, 1961), apples
(Kcrtcsz et al., 1959; Knee, 1973) and pears (Ahmed and Labavitch,
53

1980a). Tahir and Malik (1977) reported that the cellulose and
hcmiccllulose content in mango fruit did not show appreciable
changes during ripening, therefore, appear to have insignificant
importance in textural changes during fruit ripening. However,
cellulose and hemicellulose were reported to change substantially
during fruit softening of bananas (Barncll, 1943) and 'dales (Cogginc
et al., 1967; Hasegawa and Smolensky, 1971).
Cellulase activity had increased progressively during fruit
ripening of white-and pink-fleshed guavas (Fig. 12). The correlation
was very high between the increase in celulase activity and the
decrease in fruit flesh firmness. The cellulase activity had increased
3.5 - and 4.8 - folds in the white and the pink guava types,
respectively. Abu-Sarra and Abu-Goukh (1992) also found that.
cellulase activity steadily increased with the decrease in tissue
It was
suggested that PG and cellulase are the degrading enzymes
responsible for fruit softening during mango fruit ripening. Such
increase in cellulase activity during fruit ripening is well demonstrated
in avocado (Pesis et al., 1978), date (Hasegawa and Smolenskcy,
1971), Strawberry (Maurice and PalehcU, 1976) and tomato (Hall,
1964, 1965;Hobson, 1968).
54
CONCLUSION
Ripening in guava fruit is characterized by and increase in tola
sugars, total soluble solids, total proteins, cellulase and polygalacturonase
activities and decrease in tissue firmness, ascorbic acid and pectinesterase
activity. l'Yuit tissue showed a typical climacteric rise in respiration.
Reducing sugars content followed the respiration pattern and lilratable
acidity decreased only after the climacteric peak.
The two types differ among themselves and between pulp and peel
in quantity of chemical constituents present at particular stage of ripening
and/or the iiuniberof days Taken to reach that stage.
Pcctincstcrase enzyme plays a major role in controlling softening
rate during ripening of white- and pink-fleshed guava fruit by controlling
polygalacluronasc action. Due to the high correlation observed between
the increase in activities of polygalacturonase and cellulase enzymes and
loss of fruit firmness, thatindicatc the 3 enzymes-pectineslerasc (PI2),
polygalacturonase (PG) and ccllulase are the main enzyme responsible
for fruit softening during guava fruit ripening.

References

References
Abu-Goukh, A.A. and Abu-Sarra, A.P. (1993). Compositional
changes during mango fruit ripening. University of Khartoum
" Journal of Agricultural Sciences, 1 (1) 33-51.
Abu-Goukh, A.A., Ibrahim, K.E. and Yusuf, K.S. (1995). A
comparative study of banana fruit quality and acceptability
under different ripening conditions in Sudan. University of
Khartoum Journal of Agricultural Sciences, 3 (2): 32-48.
Abu-Sarra, A.F. and Abu-Goukh, A.A. (1992). Changes in
pcctinesterae, polygatacturonae and cellulac activity during
mango fruit ripening. Journal of Horticultural Science,
561-568.
Agnihoiri, B.N., Kapur, K.L., and Gocl, K.R. (1962). Ascorbic acid
content of fruits during growth and maturity. Sci. Cult,.
28:435.
Ahmed, A.B. and Lahavitch, J.M. (1980a). Cell wall melabolism in
ripening Iruils. I : Cell wall changes in ripening "BarllcU"
pears. Plant Physiologye, 65: 1009-1013.
Ahmed, A. B. and Labavitch, J.M. (1980b). Cell wall melabolism in
ripening fruits. II: Changes in carbohydrate-degrading
enzymes in ripening "Bartlctt" pears. Plant Physiology,
65:1014-1016.
56
Ahmed, O.K. and Tingwa, P.O. (1995). Effect of gibbercllic acid on
several parameters of ripening banana fruits. University of
Khartoum Journal of Agricultural Sciences, .3 (1): 47-59.
Akamine, E. K. and Goo, T. (1979). Respiration and ethylene
production in fruits of species and cultivars of Psidium and
species of Eugenia. Journal of the American Society for
Horticultural Science, 104 (5): 632.
Al-Jasim, H.A. and Al-Delaimy, K.S. (1972). Pectinesterase activity
of some Iraqui dates. Journal of Food Science and
Agriculture, 23:915-972.
Al-Ogaidi, H.K. and Mutlak, H.H. (1986). The phenolic compounds
of four date cultivars during maturing stages. The Date Palm
Journal, 4 (2): 191-196,
Arad, S. M, Didi, S. Mizrahi, X. and Kopelivitch, E. (1983). Pectic
substances: Changes in soft and firm tomato cultivars and in
non-ripening mutant. Journal of Horticultural Science 58,
Ashraf, M, Khan, N. Ahamed, M. and Elahi, M. (1981). Studies on
the pectinesterase activity and some chemical constituents of
some Pakistani mango varieties during storage and ripening.
Journal of Agriculture and Pood Chemistry, 29:526-528.
Babbitt, J.K., Powers, MJ. and Pallerson, MLII (1973). Effect of
growth regulators on celluiase, polygalacluronase, respiration,
colour and texture of ripening lonuito fruit. Journal of the
American Society for Horticultural Science, 98(1): 77-81.
57

Barmore, C.R. and Rouse, A.H. (1976). Pectinesterase activity in
controlled atmosphere stored avocados. Journal of the
American Society for Horticultural Science, 101 (3): 294-296.
Barnell, H.R. (J943). Studies on tropical fruits. Hcmicellulose
metabolism of the banana fruit during storage and ripening.
Annals of Botany, N.S. V1L, 28:298-323.
Barrevelled, W.H. (1993). Date Palm Products. Food and Agriculture
Organization of the United Nations. Agricultural Service.
Bull. No. 101.Rome-pp216.
Benkova, L.R. and Markovic, D. (1976). Pectic enzymes Advances in
Carbohydrate Chemistry and Biochemistry, 33:323-385.
Besford, R.I. and Hpbson, G.H. (1972). Pectic enzymes associated
9iiiil&.J>LJJITJliiiQ-JiuJL_J
11:2201-2205.
Bhullar, J.S. and Farmahan, H.L.(1980). Studies on the ripening and
storage behaviour of "Safeda" guava (psidium guajava L.).
Indian Food Packer, 34 (4): 5.
Biale, J.B. (I960). The post-harvest biochemistry of tropical and
subtropical fruits. Advances in Food Research, 10 : 293-354.
Bradford, MM: (1976). A rapid and sensitive method, for the
quantilation of miemgram quantities of protein utilizing the
principle of protein-dye binding. Analystical Biochemistry,
72:248.254.

Buescher, R.W. and Tigchelaar, E.C. (1975). Pectincsterase,
polygalacturonase, Cx-cellulase activities and softening of the
tin tomato mutants. Hort. Science 10 (6): 624-625.
Burg, S.P. and Clagett, CO. (1967). Conversion of melhionine to
ethylene. in vegetable tissues and fruits. Biochemistry and
Biophysics Research Communication, 27:125.
Chan Jr., and Kwok, S. CM. (1975). Identification and determination
of sugars in some tropical fruit products. Journal of Food
Science, 40(2):419-420.
Charlmers, R.A. 1956. Respiration rate. In : Quantitative Chemical
Analysis. (Charlimcrs, R.A., Ed.) Oliver and Boyd Ltd.,
Edinburgh and London, pp. 101-102.
Chjkkasubbanna, V. and Huddar, A. G. (1982). Ripening of
"Alphonso" mango (Mangifera indica L.) for processing.
Indian Food Packer. 36 (3):38-42.
Coggins Jr. C.W., Lewis, L.N. and Knapp, J.C.F. (1967). Chemical
and histological studies of tough and tender "Deglet Noor"
dates. Physical Chemistry Annual Reports, 44:15-16.
Cordoba, V.J,. A. (1961). Guavas. Agricultural Tropical Bogota,
17:459.
Dedolph, R.R. (1966). Factors influencing ascorbic acid concentration
in guava {Psidium guajava, cv. Beaumont) (Abstr.)
Proceedings 17th International Horticultural Congress.
Maryland.
59

Desai, B.B. and Deshpande, P.B. (1975). Chemical transformation in
three varieties of banana fruits stored at 20 °C. Mysore
Journal Tor Agricultural Science,. 9:634.
De Swardt, G.H. and Maxie, E.C. (1967). Pectin methylesterase in the
• ripening of banana. South Africa Journal for Agricultural
Science, 10:501-506.
Dostal, H.C. (1970). The biochemistry and physiology of ripening.
HortScience, 5(1): 36-37.
Dowson, V.H. and A ten, A. (1962). Dates Handling, Processing and
Packing. FAO plant production and protection Series No. 13.
Food and Agriculture Organization of the United Nations,
Rome, pp 392.
HEJ^akerHakr-^Kl-SaGGdy-ArR^
guavas and their suitability for processing. Sudan JOurnal of
Food'Sciencc and Technology, 7:9-17.
El-Nabawi, S.M.; Wali, Y.A. El-Sahreigi, A.F., Kadir, A.A.,
El-Jwaily, A.A. and Hassan, Y.M. (1970). Peclic substances.
In:Horticultural Crops:.Preparation, Ripening, Storage and
Exportation (pp. 199-207). (in Arabic).
El-Zorkaui, A.S. (1968). A preliminary report on vitamin C, sugar,
pectin and acid contents of guava. Agricultural Research
Review,. 46:107.
French, R.B. and Abboll, O.D. (1948). Levels of carotene and ascorbic-
acid in Florida-grown foods. University of Florida
Agricultural Experiment Station Bulletin, 444.
60

Frenkel, C , Klein, I. and Dilley, DR. (1968). Protein synthesis in
relation to ripening of pome fruits. Plant Ph-ysiology,
43:1146-1153.
Ghai, G. and Modi, V.V. (1972). Some aspects of carbohydrate
metabolism in ripening mangoes. Biochemistry and
Biophysics Research Communication, 41:1088.
Goldstein, J.L. and Swain, T. (1963). Changes in tannins of ripening
fruits. Phytochemistry, 2 : 371.
Gortner, W.A., Dull, G.G. and Krauss, B.H. (1967). Fruit
development, ripening and senescence: a biochemical basis
for horticultural terminology. HortScicnce, 2:141-144.
Hall, C.B. (1964). Ccllulasc, activity in tomato fruits according to
portion and maturity. Botanical Gazette, 125 (3): 156-157.
Hall, C.B. and Mullins. J.T. (1965). Cellulase activity in Sterial
tomato fruit. Nature, 206:638-639.
Hasegawa, S./Macer, V.P., Kaszycki, H.P. and Crawford, J.K. (1969).
Poiygalaettironasc conlcnl of dates and its relation to
maturation and softness. Journal of Food Science,
34:527-529.
Hasegawa, S. and Smolensky, D.C. (1971). Cellulase in dales and its
role in fruit softening. Journal of Food Science, 36:966-967.
Hobson, G.B. (1962). Determination of polygaiacluronase in fruits.
Nature, U.K, 195:805.
61

Hobson, G.E. (1963). Peclineslerase in normal and abnormal tomato
fruit. Biochemistry Journal, 86:358-365.
Hobson, G.E. (1964). Polygalacturonase in normal and abnormal
tomato fruit. Biochemistry Journal, 92:324-332.
Hobson, G.E. (1968). Cellulase activity during the1 maturation of
ripening tomato fruit, .lorunal of Food vScience 33:588-591.
Hulme, A.C (1970). The Biochemistry of Fruits and their products.
Vol. 1. New York, Academic Press. 620 pp.
Hulme, A.C. (1971). The mango. In: The biochemistry of fruits and
their Products, vol. 2: 233-254, (Hulme, A.C.,'Ed.) Academic
press; London and New York.
Hultin., H.O. and Levine, A.S. (1965). Pectin methylesterase in the
ripening banana. Journal of FooTSc7elice730: 9T7-92T
Ibrahim, K.E., Abu-Goukh, A.A. and Yusuf, K.S. (1994). Use of
ethylcne, acetylene and ethrel'on banana fruit ripening.
University of Khartoum. Journal of Agricultural Science 2
(1): 73-92.
Karr, A.L. and Aibershcim, P. (1969). Polysaecharide-dcgrading
enzymes are unable (o attack plant cell walls without prior
action by a "wall-modifying "enzyme". Plant physiology
46:69-80.
Keegstra, K., Talmadge, K.W.; Bauer, W.I), and Albersheim, P.
(1973). The structure oi' plant cell walls. Ill : A model of the
walls of suspension - cultured sycamore cells based on the in-
terconnections of the macromolecular components. Plant
' physiology, 51:188-196.
62
Kertesz, S.L. (1943). A possible nonezymatic mechanism of changes
occuring in the peclic substances and other polysaccharides in
living plants. Plant physiology,s 18:308-309.
Kertesz, Z.L. (1951). "The pectic substances". Interscience Publishers,V1
Inc. New York and London.
Kertesz, Z.L.; Eucan, M and Fox, G. (1959). A study of apple
cellulase. Journal of Food Science. 24:14-19.
Knee, ML (1973). Polysaccharide changes in cell walls of ripening
apples. Phytochem istry, 12:1543-1549.
Krishnamurthy, G.V., Jain, N.L and Bhatia, B.S. (1960). Changes in
the physio-chemical composition of mango during ripening
after picking. Journal of Food Science, 9 (8) : 277-279.
Krislmamurthy, S; Patwardhan, M.W. and Subramnyam, 11. (1971).
Biochemical changes during ripening o\: the mango fruit.
Phytochemistry 10:2577-2581.
Lakshminarayana, S., Subhdra N.V. and Subramanyam, H. (1970).
• Sonic aspects of developmental physiology of mango fruit.
Journal of Horticultural Science, 45(2): 133142.
Lakshminarayana, S. (1980). Mango. In : Tropiel and Subtropical
Fruits. (Nagy, S. and Shaw, P.E., Eds.) AVI Pub I. Co., Inc.
London and New York.
Lee, M. And MacMillan, J.D. (1970). Mode of action of pectic
enzymes. 111. Site of initial action of tomato peclinescrase on
highly esterified pectin. Jourjiai of Biochemistry,
9:1930-1934.
63

Le-Riche, FJ.H. (1951). Chemical changes during the development of
guava varieties, Union South African Department Agriculture
Bulletin, 21.
Libcrman, M., Kunishi, A.T., Mapson, L.W. and Wardalc; D.A.
(1966) Stimulation of ethylene production by methionine in
apple slices. Plant physiology, 41:376.
Li, Pen. H. and Hasen, E. (1964). Effect of modified atmosphere
storage on organic acid and protein metabolism in pears.
\ Proceedings of the American Society for Horticultural
Science, 85:100-1 II.
Lineweaver, H. and Jansen, E.F. (1951). Pectic enzymes. Advances in
Engzymology, 11:267-295,
Luh, B.S. (1971). Tropical fruit beverages, in : Fruit and Vegetable
Juice Processing TechiYology. (Tresslcr. D .K.- and - Joslyn,
M.K., Eds). AVI Publishing Co. Westport, Conn.
Luton, M. T. and Holland, F.A. (1986). The effect of preharvesl
factors on the quality of stored "Conference" pears. Journal of
Horticulturale Science 61(1): 23-32.
Mann, S.S., Singh, R.N. and Pandey, K.M. (1974). Maturity Standards
in "Dashehari" and "Langra" cullivars of mango (Mangij'era
intliccr L.). Haryana Journal for Horticultural Science, 3
Mattoo, A.K. and Modi, V.V. (1969). Biochemical aspects of ripening
and chilling injury in mango fruit. Proceedings of the
Conference on Tropical and Subtropical Fruits. Tropical
Products Institute (London). September 15-19, 11 1-115.
64
Malloo, A.K., Murata, 'I'., hmtastico, VMM., Chaehin, K., Ogata, K.
and Plum, C\T. (11>75>. Chemical changes dming ripening and
senescence. In : Poslharvest Physiology, Handling and
Utilization of Tropical and Subtropical Fruits and Vegetables.
(Panlaslieo, MR. B., I'd.) AVI. Publ. Co., Inc. Connecticut.
Maurice, 1MB. and Palchcll, B. .1. ( 1976). Cell Wall degrading enzyme:*.
and softening of senescent strawberry fruit. Journal of Food
Science, 41:1392-1395. '
McCready, R.M.and McComb, R.R. (1954). Pectic constituents in
ripe and unripe fruits. Journal of Pood Research, 19:530-535.
McLean, J.G., Le Thourneau, K. J., and Guthrie, J.W. (1961). Relation
of potatoes. Phylopmhology, 51:84-89.
Medlicott, A.P. .and Thompson, A.K. (1985). Analysis of sugars and
organic acids in ripcnijig manago fruits (Ma'ni>ifera indica L ,
varicly Keilt) by high performance liquid chroniatography.
Jouranl of Food Science and Agriculture, 36:561-566.
Milller, A.R.; Dalmasso, J.P. and Kretchman, D.W. (1987).
Mechanical stress, storage lime and temperature influence
cell wall degrading enzymes, firmness and ethylene
production by cucumbers. Journal of the American Society
for Horticultural Science, 112 (4):666-671.
Mi.nessy, F.A., Saeed, A.R. and El-Rayah, A. (1984). Respiration and
chemical changes associated with ripening of mango fruits
(Mangifera indica L.) Sudan Agricultural Journal,
10:103-111.
65

Misra, K. and Seshadri, T.R. (1968). Chemical components of the fruit
of Psldiuin guava. Phytochemistry, 7:641.
Mowlah, G. and I too, S. (1982). Guava {Psidium guajava L.). Sugar
component and relation to enzymes at stages of fruit
.development and ripening. Journal of Japanese Society for
Food Science and Technology, 29 (8):472-476.
Mustafa, A.B., David, B.A. and Donald, E.J. (1986). Biochemical
changes during ripening of some Sudanese date varieties.
Journal of Food Science and Agriculture, 37:43-53." • i
Nagel, C.W. and Patterson, M.E. (1967). Pectic enzymes and
development of the pear (Pyrus comrmuiis). Journal of Food
Science, 32:292-297.
Neal, G.E. (1965). Changes^ occuringTin the cell walls of sira~wbeiTies
druing ripening. Journal of Food Science and Agriculture,
16:604.
Nelson, N. J. (1944). A Photometric adaptation of the Somogyi method
for the determination of glucose Journal of Biological
Chemistry, 153:375-380.
Nezam El-Din, A. M. Bukhacv, V. Th., and Ali, L.M. (198-3). Tannin
. content of the main parts of the dale palm. The Dale Palm
Journal, 2 (2): 211-221.
Nour, A.A.M. (1978). The influence of pectic substances on textural
properties of mango fruits. Sudan Journal of Food Science and
- Technology, 10:1-3.
66

Ogata, J.N., Yoshihiko, K., JBevenu, A., and Casarett, L. .1. (1972). The
Ketoheptose content of some tropical fruits. Journal of
Agricultural Food Chemistry, 20:113.
Pablo, I.S., Akamine, E. K., and Chachim, K. (1975). Irradiation. In :
Postharvest Physiology, Handling and Utilization of Tropical
and Subtropical Fuit and Vegetables. (Pantastico, Er. B., Bd.)
AVI Publ. Co. Westport, Conn.
Palmer, J.K. (1978). The banana. In : The Biochemistry of Bruits and
their Products, Vol. 2 : 65-105. (Hulmc, A.C., Bd.) Academic-
Press, London and New York.
Pantastico, Br. B., Chachin, K., Ogata, K. and Plan, C.T. 1975.
Chemical changes during ripening and senescence (chap. 7).
In: Postharvest Physiology, Handing and utilization of
Tropical and Subtropical Fruits and Vegetables. (Pantastico,
Er. B., Ed.). AVI Publ. Co., Inc. Connecticut. 560. P.P.
Pesis, E., Fuchs, Y. and Zauberman, G. (1978). Celiulase activity and
fruit softening in avocado. Plant Physiology, 61 :416-419.
Pethawala, H.R., Savur, G.R. and Sreenivasan, A. (1948).
Characterization of tomato peclinesterase. Arch.
Biochemistry, 17:235-248.
Phan, C.T., Panlastico, BR. B. Ogala, K. and Chachin, K. (1975).
Respiration and respiratory climacteric. In: Postharvcsl
physiology. Handing and Utilization of Tropical and
Subtropical Fruits and Vegetables, pp. 86-102. (Panlastico.
Er. B., Ed.) AVI. Publ. Co. Inc.,. Connecticut.
67

Pilnik, W. and Voragen, A.J.G. (1970). Pectic substances and other
uronides. In : Biochemistry of Fruit and their Products. Vol. I
:53-53. (Hulmc, A.C., Ed.). Academic Press, London and
New York.
Poovaish; B.W. and Nukaya, A. (1979). Polygalacturonase and
cellulase enzymes in the normal "Rutgers" and mutant (rin)
tomato fruits and their relationship to the respiration
climacteric. Plant Physiology, 64:534-537.
Popenoe, J., Halton Jr., T.T. and Harding, P.L. (1958). Determination
of maturity of hard green "Haden" and "Zill" mangoes.
Proceedings of the American Society for Horticultural
Science, 71:326-329.
Pressy, R., Hinton, DM. and Avants, J.K. (1971). Development of
polygalacturonase activity and solubilization of pectin in
peaches during ripening. Journal of Food Science,
36:1070-1073.
Raa, .1. (1968). Natural resistance of apple plants to Venluria inequalis.
Thesis. University of Utrecht.
Ranganna, S. (1979). Titralable acidity. In: Manual of Analysis of
Fruit and Vegetable Products. (Ranganna, S., FAI.). Tata
McGraw Hill Publ. Co. Ltd., New Delhi, pp. 7-8.
Rodriguez, R., Agarwal, P.C. and Salia, N,K. (1971). Biochemical
changes during development of "Safeda" guava fruit. Indian
Food Packer, 25 (I) : 5-20.
68-

Roe, B. and Buremmer, J. H. (1981). Changes in pectic substances and
enzymes during ripening and storage of "Keitt" mango. Journal
of Food Science 45: 186-189.
Rosa, J.T. (1928). Changes in composition during ripening and storage
of melon. Hilgadia, 3:421.
Ruck, J.A. (1963). Ascorbic acid. Publication 1154. Canada Department
of Agriculture.
Saccd, A.R., El-Tiiuiy, A.M. and Khattab, A.M. (1975a). Characterization
of pectic substances in mango marc. Joruanl of Food Science,
40:209-206.
Saeed, A.R., Kharttab, A.M. and El-Tinay, A.H. (1975b). Some physical
and chemical factors influencing quality of mango fruit and
nector 1: Effect of harvest maturity on some physical and
"dTemica1"])fopcTneir"o{ "iiiaTigo"esTSudaTi'l"6unuiT"6r'Fboc.r "Science
and Technology. 7:18-27.
Saha, A.K., (1971). Effect of posthwest treatment with growth regulators
on the ripening and chemical coniosition of guava {P.sidium
guajava'L.) fruits. Indian Journal of Horticulture, 28:11.
Salunkhc, D.K. and Wu, M.T. (1973). Effect of subatmospheric pressure
storage on ripening and associated chemical changes o\' certain
deciduous fruits. Journal of the American Society for
Horticultural Science. 98:113.
Salunkhe, D.K, Do, J.Y., Panlastieo, Er. B. and chachin, K. (1975).
Regulation of ripening and senescence. In : Postharvest
Physiology, Handling and Utilization 'of Tropical and
..Subtropical Fruits and Vegetables. (Pantastico, Er. B., lid.). AVI
Publ. Co. Weslort, Conneclicut 550 pp.
69

Saliiükhc, D.K. and Dcsai, B.B. (1984). Postharvest Biotechnology of
lMiiit. Vol. (II). Boca Ralon, Honda. CRC- Press, inc. 148 pp.
Sclvaraj, Y., Pal, D.K. Subramanyam, M.D. and Lycr, C.P.A. (1982).
Changes in chemical composition of lour cultivais of papaya
(Carica papaya L.) during growth and development Journal
of Horticultural Science, 57 ( I ) : 135-143.
Seshadri, T.R. and Vasistha, K. (1964). Polyphenolic components of
guava fruits, current Science, 33 : 334.
Siddappa, G.S. and Bhatia, B.S. (1954). Tender green mangoes as a
source of vitamin C. Indian Journal for Horticultural Science
11:104.
Sinclair, W.B. and Toliffe, V.M. (1961). Poetic sustances of'Valencia'
organes at different stages of maturity. Journal of Pood
Science, 26:125.
Singh, B.P., Singh, H.K. and Chauhan, K.s. (1981). Effects of
postharvest calcium treatments on the storage life of guavas.
Indian Journal of Agricultural Sciences, 51,44.
Singleton, V.L. and Rossi, Jr., .I.A. (1965). Colorimetry of total
phenolies will) phospliomolyhodic - phospholiiiigeslic acid
reagents. American Journal of linology and Viticulture, 16(3)
: 144-157.
Somogyi, M. (1952). Notes on sugars determination. Journal of
Biological Chemistry, 195: 19-23.

Spayed, S.E. and Morris, J.R. (1981). Physical and chemical
characteristics of puree from once-over harvested strawberry.
American Society for Horticultural Science. 106(1): 105-109
Spencer, M. (1965). Fruit ripening. In : Plant Biochemistry. (Bonner,
.1. and Varner, J.E., Bel.). Academic Press, New York.
Sterling, C. (1961). Physical state of cellulase during peach ripening.
Journal of Food Science, 26:95.
Subrahmanyam, V.V.R. and Acharya, K.T., (1957). Lesser-known
Indian vegetable fat. I. Oleic-rich fats. Journal of Food
Science and Agriculture., 8:657.
vSubramanyam, II., Gouri, S. andKrishnamarlhy, S. (1976). Ripening
behaviour ol" mango fruit graded on specific grasvily basis.
Journal of Food Science and Technology, l3(2):84-86.
Tandon, D.K. and Kalara, S.K. (1984). Pectic changes during the
development of mango cv. "Dashehari". Journal of
Horticultural Science, 59 (2) : 283-286.
Tahir, M.A. ami Malik, A.A. (1977). The activity of pectic enzymes
(pectinesterase, polygalacturonase) in various mango
cis. Pukislan Journal v>i" Scicnlit'ic Research, 29 : 7 1-74.
Tigchelaar, P'.K.C. and McGlasson, W.B. (1977). Tomato ripening
Llnch, R. {19SS). l\)Nlhar\c^ physiology ol' t'ruiis. Annual Reuew o
Plant Physiology, 4 : 385-416.
71

vegetables. Journal of Tcxtural Studies, 10: 1-23.
Van Leyveld, LJ. and Smith, J.H.E. (J979). Physiological factors in
the maturation and ripening of mango fruit (Mangijbra indica
L.) fruit in relation to the jelly-seed physiological disorder.
Journal of Horticultural Science, 54 (4): 283-287.
Van Locseckc, H.W. (1950). Bananas. 2nd. Ed. Intcrscicncc
Publishers, New York, 108 pp.
Wall, B.K. and Merrill, A.L. (1975). Composition of Foods
Agriculture Handbook No. 8, United States Department of
Agriculture. Washington, D.C. 190 pp.
Wills, R. HAL, Lee, T.I I. Graham, D. McGlasson, W.B. and Hall,
E.G. (1981). Postharvest :-An introduction to the physiology
and handling of fruits and vegetables. AVI Publ. Co.
Wcslport, Connecticut.
Wilson, C.W. (1980). Guava. In : Tropical and Subtropical Fruits :
Composition, Properties and Uses. (Nagy, S. and Shaw, P.F.
Eds.) AVI Publishing Co. Wcslport, Connecticut. 279 pp.
Yadave, A.K. (1998). Guava. Commodity Sheets. Agriculture, Home
' r^coiuiniii:;. au l . > -Ilii-jL'?'".' •.*;;/: urn;. O)llii.!|_e. of A uri e u It l ire. Foi l
Valley State Unviersity Georgia. Yung,
Walker, J.C. and Slahmann, M.A. (1955). Chemical nature of disease
resistance in plants. Annual Review of Plant Physiology,
6:351-366.
72

20:41-45.
Yemm, E.W. and Willis, AJ. (1954). The estimation of carbohydrates
in plant extracts by anthrone. Biochemistry Journal,
57:508:13.

Appendix

Appendix 1
Respiration Rate Assay
(Total Absorbilion Method)
Procedure :
1 - Place a known weight ol" fruit or vegetable in a respiration jar
cquiped t with an inlet and outlet.
2 - Pass a constant air flow through :
(a) 40%.NaOH (to absorb atmospheric CO2).
(b) Distilled water to absorb any NaOl I fumes and to humidify
the air.
3 - Pass the humidified, CO2 free, air through the respiration jar.
4 - Trap CO2 of respiration in 50ml of O.lN.NaOJl for a
predetermined period of time.
5 - Titrate 15ml of the NaOH Sol'n. (containing CO2 of respiration)
with O.1N IIC1 using mixed indicator to whitish yellow end
point. •
6 - Add methyl orange indicator and proceed in (itration to pink
colour end point.
Calculations :
The acid used for the second part of the (illation (V2) is equivalent
to half the total carbonate.
74

.-. mey. of carbonalc = 2 V r N- HC i
Equivalent Wt. of carbonate = formula Wt./charge
, = 106/2 = 53
Wt. of Na2CO3 = (meg. of Na2CO3) (Bqui. Wt. of Nu2CO3).
44Wt. of CO2 absorbed (ing) = (Wt. of Na2CO3) (Dil. factor)
Dil. factor = 50315
Wt. of CO2 absorbedRespiration Rate =
(nig CO /K"-hr) S a m P l e W L (K^-) X Ra t ion (hr)

Appendix 2
Total Sugars Assay(Anlhcrone Method)
Preparation ol* Standard Curve :
1 - Dissolve lOOmg glucose in 100ml of sol'n to gel slock (A) of
concentration 1000[ig/ml.
2 - Prepare stock sol'n. (B) by diluting 10ml of slock (A) wifh
40ml distilled water. Concentration of slock (13) will be
200|Ag/ml.
3 - Prepare standard curve concentrations as follows :
0.0ml of stock sol'n + 1.0ml H20 -» O.Ofig sugars (Blank)
25 ).il of slock (13)+ 0.975ml H20 -> 5 » »
50 - - " " + 0.950 " " • -> 10 " "
75 » » " " + 0.925 " " -> 15 »
100 » » » " + 0.950 " " -» 10 » »
25 (.L1 of stock (A) + 0.975 " » -> 25 » "
75 »» » " " + 0.950 " » ->• 50 » "
100 » - " - + 0.900 " " -» 100" "
Autherone Solution : - 2()()ing anlhrone/IOOml cone. HSCh
Procedure :
1 - Place lml of the tested solution in test tube (containing
I ()-l()0|.lg sugars)
2 - Add 2ml of anthrone solulioj).
3 - Mix well on lube mixture and leave lo cool at roomtemperature.
4 - Read O.D. al 62()mu.
76

Appendix 3
Nelson-Somogyi(reducing groups and reducing sugars assay)
Preparation of Standard Curve :
1 - Dissolve lOOmg glucose in 100ml of sol'n to get slock (A) of
concentration 1000f.ig/ml.
2 - Prepare stock sol'n. (B) by diluting 10ml of slock (A) with
40ml distilled water. Concentration of slock (B) will he
200|ig/ml.
3 - Prepare standard curve concentrations as follows :
0.0ml from slock sol'n + 1.0ml U20 —> O.Oug sugars (Blank)
25j.il of slock (B)-i- 0.975m! H20 -> 5 »
50 » " " " + 0.950 " » -> 10 » "
75 " " " " + 0.925 " •• -> 15 » »'
|()() „ „ „ „ .,- 0.900 " » -> 20 " »
25 (11 of slock (A) + 0.975 " »• -> 25 » »
50 " " " " + 0.950 " » ~> 50 " »
100 " » " " -i- 0.900 " " -> 100" -
Reagents :
Solution 1 : Dissolve (I2g KNa-larlral.c -I- 24g anhydrous
Na2CO, + I6g NalICO-, + 144g Na,SO4) in distilled water
and make to final volume of 800.
Solution II : Dissolve (4g CuSO,,.5l 1,0 -I- 36g Na,SO,) in
distilled water and make (o final volume of 200ml.
Nelson reagent :
1 - 25g Ammonium Molyhdale in 450ml water.
2 - Add 21 ml concentrated 11OSO,.
77

3 - Add 3g Na2HASO4.7H2O dissolved in 25ml H2O.
4 - Wrap bottle in foil and let sit for 48 hours before use.
Procedure :
1 - Place one ml of sample in test tube
(containing 10-100 g sugars)
2 - Mix one part of sol's 11 with four parts of sol's 1 and add to
sample tube one ml.
3 - Boil in water bath for 25-30 minutes.
4 - Cool under running lap water and add one ml of Nelson
reagent.
5 - Read O.D. at 520mu.

Appendix 4
Titratable Acidity
Equivalent Weight of Aculs :
Citric
Malic
Tartarie
Acetic
I'roeedure :
64
67
75
60
1 - Take 10ml of tesled sol'n. in a beaker.
2 - Add 20ml distilled water.
3 - Add 3 drops of phenophthalein indicator.
4 - Titrate with 0.1 NaOl I to faint pink colour
(pH =0=8.2)
Calculations1:
%Acid =
(ml of NaOll) (N.NaQll) (dil. factor) (Kqu. Wl. of acid) x 100100 (Wt. of sample g)
dilution factor =
Sample total volumeSample volume used in tilration (10)

Appendix 5
Protein Assay By Dye-Binding
(Bradford, 1976)
Preparation of Standard Curve :
1 - Dissolve lOOmg of protein (Bovine serum albumin) in lOOiul
of sol'n. to get slock (A) of concentration 1000 jig/ml.
2 - Prepare stock solution (13) by diluting 10ml of stock (A) with
40ml distilled water (Cone. 200 |ig/ml).
3 - Prepare standard curve concentrations as follows :
0.0ml from stock sol'n + 0.3ml H20 -> 0.0|.lg protein' (Blank)
25 ji I of slock (B)+ 0.275ml Ii,0 -> 5 » »
50 "
75 "
100 »
25f.il
50 »
Procedure He
" " " +„ „ „ +
„ „ „ +
of slock (A) +
„ -|.
0.250
0.225
0.200
0.975
0.250
it
n
If
t l
H
- * 10
-> 15
- * 20
~> 25
-> 50
1 - Dissolve lOOmg of Coomassie Brilliant Blue dye in 50ml
ethanol (95%).
2 - Add 100ml 85% (W/V) phosphoric acid.
3 - Complete the volume to one liter and filter.
Procedure :
1 - Place 0.3ml of tested sol'n. in test lube.
2 - Add 3nil of protein reagent and shake well.
3 - Read O.D. at 595 imi.

Appendix 6
Total Pheuolics Assay(Folin - Ciocatcu)
Preparation of Standard Curve :
1 - Dissolve lOOmg (annic acid in 100ml of sol'n. to get stock (A)
of concentration 1.000 (.Lg/inl.
2 - Prepare stock sol's (B) by diluting 10ml of stock (A) with
40ml distilled water (Conccenration of stock (B) will be
200 |ig/ml).
3 - Prepare standard curve concentrations as follows :
0.0ml from stock sol'n + 0.3ml 112O -> O.Ojig tannic (Blank)
25 Hi of slock (13)+ 0.275ml H2() -> 5 » »
50 »
75 »
100 »
25j.il
50 "
Procedure :
» » " + 0.250 " »
" » " + 0.225 " "
" " » + 0.200 " »
of stock (A) + 0.275 " »
» " » + 0.250 " »
- > 10
- > 15
-> 2 0
- > 2 5
-> 50
1 - Place 0.3ml of the tested solution in a lest tube
(containing 5-2 g phenolics).
2 - Add 1.5ml of diluted l*olin - Cioealcu reagent (I + 9 distilled
water) and mix well.
3 - Add 1.2ml sodium carbonate solution (7.5g per 100ml of
sol'n.) between 30 seconds and before K minules elapsed.
4 - Place Lest tubes for one hour at 30°C (86T') and for another
hour at O"C (32°l:0. Usually 30 minutes is sufficient.
5 - Read O.D. at 760 mil.

Appendix 7
Ascorbic Acid(Tilration Method)
Preparation :
1 - Take 30 g of fruil tissue and blend with reasonable amount of
0.4% oxalic acid.
2 - Filler by Whatman No. 1 filler paper.
3 - Make up lo 250ml with 0.4% oxalic acid.
4 - Pipette 20ml of fi Iterate into a beaker.
5 - Titrate with dye 2,6-diehlorophenol-indophenol to a faint pink
colour.
Calculations :
Ascorbic acid = liter (ml) x dye strength x 100
(mg/l()0g) factor
Factor = Sample Wl. (30u) x Sample volume I'orT Ural ion (20ml)
Total volume of smaple (250ml)
Reagents :
1 - 0.4% oxalic acid :- 4g oxalic acid/liler of sol'n.
2 - 10% oxalic acid :- 50g oxalic acid/500rnl of sol'n.
3 - Standard ascorbic acid :- 0.05g ascorbic acid/25()ml of 10%
oxalic acid.
4 - Dye sol'n. : 0.2g of 2,6-dichIorphenol-mdoplienol dye per
500ml ofsol'n. and filter.
Determination of dye strength :
Add 5ml of standard ascorbic acid sol'u. lo 5ml of 10% oxalic
acid sol'n. in a beaker and tilralc with the dye sol'n. to faint
pink colour.
Dye strength = —tiler
S2

. Anova Tables lor Statistical Analysis
General Linear Models ProcedureClass Level Information
ClassGroupRep.Color
Levels7
102
Values1 2 3 41 2 3 4Pink White
55
66
77 8 9 10
Number of observations in data set = J40General inear Models Procedure
•pendent Variable : Respiration Rateuree DP Sum of Sqaurcs Mean Square P. Value Pr < I7
odcl 7 9708.494786 1386.927827 66.62 0.0001ror 132 2748.03749 20.818465>rrected Total 139 12456.532214
R-Square C.V. Root MSB RliSRA Mean0.779390 18.95888 4.562726 24.0664286
Table (1)
General Linear Models Procedure
^pendent Variable : TSS
jurcc • DP Sum of Squures Mean Square P. Value- Pr < Fodel 7 1622.592357 231.798908 2.54 0.0174ror 132 12038.951857 91.204181jrrecled Total 139 13661.544214
R-Square C.V. Root MSE ' TSS Mean0.118771 91.33222 9.550088 10/1564286
Table (2)
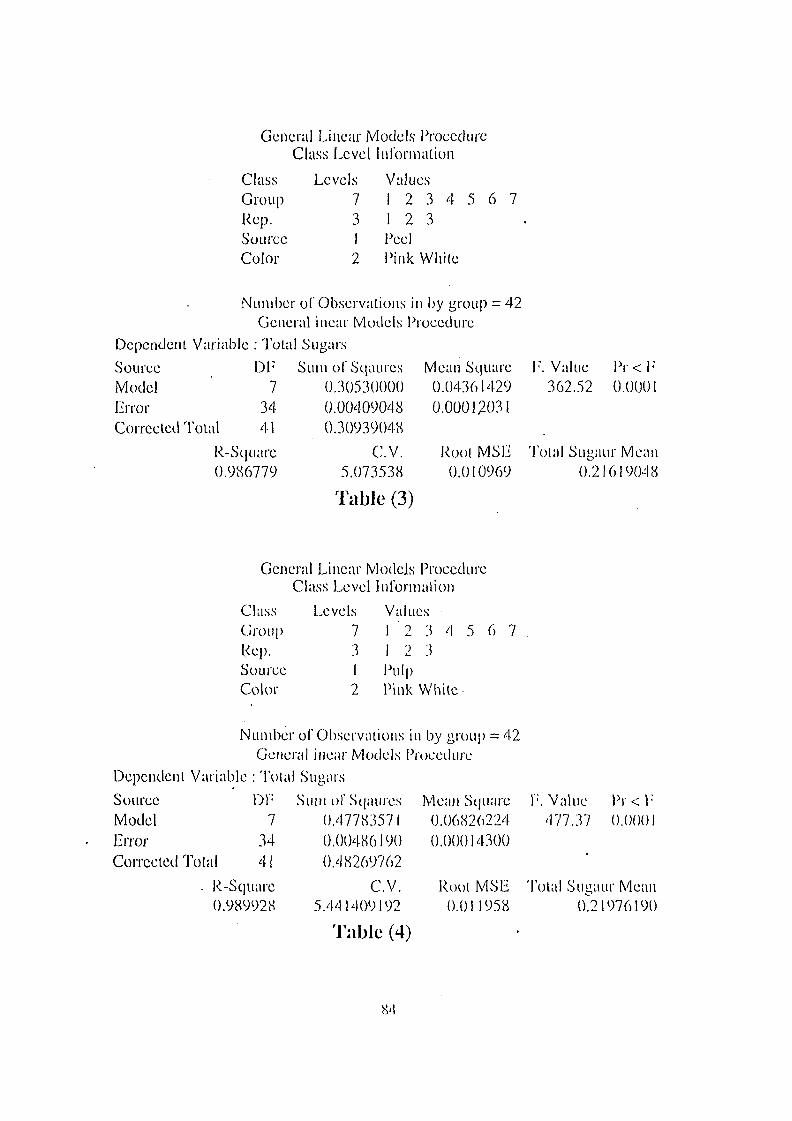
General Linear Models ProcedureClass Level Information
ClassGroupRep.SourceColor
Levels7312
Values1 2 3 4 5 6 71 2 3PeelPink White
Number of Observations in by group = 42
General inear Models Procedure
Dependent Variable : Total Sugars
Source DV Sum of SqauresModel 7Error 34
Corrected Total 41
R-Squarc0.986779
O.3O53OOOO
0.00409048
0.30939048
C.V.5.073538
Table (3)
Mean Square0.043614290.0001^031
Root MSB0.010969
1\ Value P r < F362.52 0.0001
lolal Sugaur Mean0.21619048
General Linear Models ProcedureClass Level Information
ClassGroupRep.SourceColor
Levels7312
Values1 2 3 A1 2 3PulpPink While
5 6 7
Number of Observations in by group = 42General inear Models Procedure
Dependent Variable : Tola! Sugars
Source DV Sum ol'Sqaures0.477835710.004861900.48269762
C.V.5.441409192
Table (4)
Model 7Error 34Corrected Total 41
. R-Squarc0.989928
Mean Square0.068262240.00014300
Root MSB0.0! 1958
Value477.37
P r < l ;
0.0001
Potal Sugaur Mean(U1976190

GroupRep.SourceColor
7321
1 21 2PeelPink
3 4 53
Pulp
6 7
Number of Observations in by group = 42General inear Models Procedure
Dependent Variable : Tola! Sugars
SourceModellirrorCorrected
\W1
34Total 41
R-Squarc0.953366
Sum of Sqaures0.027550000.001347620.02889762
C.V.4,960965
Mean Square0.003935710.00003964
Root MSB0.006296
1\ Value99.30
Total Sug"0.
Pr< 1-0.0001
aur Mean12690476
Table (5)General Linear Models Procedure
Class Level Information
ClassGroupRep.SoureeColor
Levels7321
Values1 2 31 2 3Peel PulpWhite
4 5 6 7
ModelBrrorCorrected' Polal
R-Squ0.918
73441
are1(7
Number of Observations in by group = 42General inear Models Procedure
Dependent Variable : Total Sugars
Source Dl; Sum of Sqaurcs Mean Square I1'. Value Pr<l-"0.06129524 0.00875646 54.46 0.00010.00546667 0.00016078O!O6676I9O
C.V. Root MSB Total Sugaur Mean4.102952 0.012680 0^30904762
Table ((>)General Linear Models Procedure
Dependent Variable : Reducing Suguars
Source 1)1' Sum of Sqauics Mean Square I1'. Value IV<I ;
Model . 7 0.25625000 0.03660714 470.10 0.0001terror 34 0.00264762 0.00007787Corrected Total 41 0.25889762
R-Sqiiare C.V. Root MSB UI-DU Mean0.989773 1.311027 0.008824 0.67309524
Table (7)

General Linear Models ProcedureClass Level Information
ClassGroupRep.SourceColor
Levels7321
Values1 2 31 2 3Peel PulpPink
4 5 6 7
Number of Observations in by group = 42General incar Models Procedure
Dependent Variable : Reducing Sugars
Source DP Sum of Sqaures Mean Square P'. Value Pr<P'Model 7 0.18163333 0.02594762 40.69 0.0001Error ' 34 0.02168095 0.00063768Corrected Total 41 0.20331429
R-Square C.V, Root MSIi RliDU Mean0.893362 5.757837 0.025252 0.43857143
I able (8)
General Linear Models ProcedureClass Level Information
4 5 6 - 7ClassGroupRep.SourceColor
Levels7321
Values1 2 31 2 3Peel PulpWhite.
Number of Observations in by group = 42General incar Models Procedure
Dependent Variable : Tilratable acidily
Source DV Sum of Sqaures Mean Square F. Value Pr < FModel 7 1.60928571 0.22989796 34,13 0.0001L-iTor 34 0.22904762 0.00673669Corrected Total 41 1.83833333
R-Square C.V. Rool MSB TIT Mean0.875405 4.875883 0.082077 1.68333333
Table (9)

General Linear Models ProcedureClass Level Information
ClassGroupRep.SourceColor
Levels7321
Values1 2 3 4 51 2 3Peel PulpPink
6 7
Number of Observations in by group = 42General incar Models Procedure
Dependent Variable : Tkratable acidity
Source DV Sum of Sqaurcs29.14696429
142.64404762171.79101190
C.V.138.6420
Table (10)
Model 7Error 34Corrected Total 41
R-Squarc0.169665
Mean Square4.163852044.19541317
Root MSE2.048271
F. Value Pr < F0.99 0.4533
TIT Meani.47738095
General Linear Models ProcedureClass Level information
ClassGroupRep.SourceColor
Levels73•2
1
Values1 2 3 4 5 6 71 2 3Peel PulpWhile
Number of Observations in by group = 42General incar Models Procedure
Dependent Variable : Protein
SourceModellirrorCorrected
DV1
34Total 41
R-Squarc0.356996
Sum of S qau res0.018152380.032695240.05084762
C.V.6.225732
Mean Square0.002593200.00096162
Root MSI:0.031010
F. Value Pr < F2.70 0.0246
Protein Mean0.49809524
Table (11)
87

General Linear Models ProcedureClass Level Information
ClassGroupRep.SourceColor
Levels7321
Values1 2 3 41 2 3Peel PulpPink
5 6 7
Number of Observations in by group = 42General incar Models Procedure
Dependent Variable : Protein
SourceModelErrorCollected
DV7
34Total 41
R-Square0.664026
Sum ol Sqaures0.009580950.004847620.0(442857
C.V.2.148687
Mean Square0.001368710.00014258
Root MSB0.011941
R Value P r < i ;
9.60 0.0001
Protein Mean0.55571429
Table (12)
General Linear Models ProcedureClass Level Information
ClassGroupRep.SoLUVO
Color
Levels7321
Values1 2 3 4 51 2 3Peel I'ulpWhite
6 7
Number of Observations in by group. = 42General inear Models Procedure
Dependent Variable : Phenolic
Source • Dl; Sinn of Sqaurcs Mean SquareModel 7Error 34Corrected Total ' 41
R-Squarc0.875938
0.420266670.059523810.47979048 .
C.V.35.00672
Table (13)
0.060038 JO0.00175070
Rool MSIi0.041841
Value P r < F34.29 0.0001
Phenolic Mean0.11952381

General Linear Models ProcedureClass Level Information
ClassGroupRep.SourceColor
Levels7321
Values1 21 2Peel 1Pink
3 4 53
\\\p
6 7
Number of Observations in by group = 42General inear Models Procedure
Dependent Variable : Phenolic
Source ' DP Sum of Sqaures Mean SquareModel 7Error 34Corrected Total 41
R-Square0.929217
0.090330950.006880950.0972! 190
C.V.19.21205
Table (14)
0.012904420.00020238
Rool MSL0.014226
Value P r < F63.67 0.0001
Phenolic Mean0.07404762
General Linear Models ProcedureClass Level Information
ClassGroupRep.SourceColor
Levels7321
Values1 2 31 2 3Peel PulpWhite
4 5 6 7
Number of Observations in by group = 42General inear Models Procedure
Dependent Variable : Ascorbic AcidSource DPModel 7Error 34Corrected Total 41
R-Squarc0.903074
Sum of Sqaures6.380000000.684761907.06476190
C.V.
8.120515
Table (15)
Mean Square0.911428570.02014006
Rool MSE0.141916
Value Pr < F45.25 0.0001
ASCO Mean1.74761905
89

General Linear Models ProcedureClass Level Information
ClassGroupRep.SourceColor
Levels7321
Values •1 2 3 41 2 3Peel PulpPink
5 6 7
Number of Observations in by gruup = 42
General inear Models Procedure
Dependent Variable : Ascorbic Acid
Source DF Sum oCSqaurcs Mean SquareModel 7Error 34Corrected Total 41
R-Square0.563777
0.243095240.188095240.43119048
C.V.27.16445
Table (16)
0.034727890.00553221
Rool MSE0.074379
Value P r < l ;
6.28 0.0001
ASCO Mean0.27380952
General Linear Models ProcedureClass Level Information
ClassGroupRep.SourceColor
Levels731
Values1 2 3 4I 2 3PulpPink White
5 6 7
Number of Observations in by group = 42General inear Models Procedure
Dependent Variable : Ascorbic Acid
Source DV Sum ol'Scjaurcs(6.073988100.74202381 .
16.81601190C.V.
16.52376198
Table (17)
ModelErrorCorrected
734
Total 41
R-Squarc0.955874
Mean Square2.296284010.02182423
Rool MSE' 0.147730
Value P J - < J :
105.22 0.0001
ASCO Mean0.89404762
90

General Linear Models ProcedureClass Level Information
ClassGroupRep.SourceColor
Levels7312
Values1 2 31 2 3PeelWhite I
4
'ink
5 6 7
Number of Observations in by group = 42General incar Models Procedure
Dependent Variable : Ascorbic AcidSource DFModel 7Error 34Corrected Total 41
R-Square0.966295
Sum of Sqaures33.96625000
1.1847619035.15101190
C.V.16.55791161
Table (18)
Mean Square4.852321430.03484594
Root MSfi0.186671
Value Pr < F139.25 0.0001
ASCO Mean1.12738095
General Linear Models ProcedureClass Level Information
ClassColorGroupRep.
Levels272
ValuesPink White1 2 3 41 2
5 6 7
Number of Observations in by group = 28Analysis of Variance Procedure
Dependent Variable : Pectincsterasc
Source DF Sum of Sqaures Mean SquareModel • 7Error 34Corrected Total 41
R-Squarc0.893733
0.005142290.000611430.00575371
C.V.19.95052
Table (19)
0.000734610.00003057
Rool MSI7.0.005529
Value24.03
Pr < F0.0001
Pectincsleiase Mean0.02771429

General Linear Models ProcedureClass Level Information
ClassColorGroupRep.
Levels273
ValuesPink. While1 2 3 41 2 3
5 6 7
Number of Observations in by group = 28Analysis of Variance Procedure
Dependent Variable : Polygalacturonasc
Source DF Sum of Sqaures Mean SquareModel 7Error 34Corrected Total 41
K-Sc|imre0.825753
0.235166670.049623810.28479048
C.V.8.608133
Table (20)
0.033595240.00145952
Root MSE0.038204
F. Value23.02
Pr < F0.0001
POLY Mean0.44380952
General Linear Models ProcedureClass Level Information
ClassColorGroupRep.
Levels273
ValuesPink White1 2 3 41.2 3
5 6 7
Number of Observations in by group = 28Analysis of Variance Procedure
Dependent Variable : Ccllulasc
Source Dl ; Sum ol' Sqaures Mean SquareModel 7Error 34Collected Total 41
R-Square0.806387
0.383650000.092114290.47576429
C.V.10.54567
Table (21)
0.054807140.00270924
Root MSE0.052050
Value P r < F20.23 0.0001
Cellulasc Mean0.49357143
92

![3} tj- 7] - OSTI.GOV](https://static.fdokumen.com/doc/165x107/631c4c86b8a98572c10cd705/3-tj-7-ostigov.jpg)