Final Project Report - OSTI.GOV
52
Final report on ‘Quantify and Improve PEM Fuel Cell Durability’ PSO FU 2007-1-7156 Energinet.dk ForskEl FU 2007-1-7156 Final Project Report Project full title: Quantify and Improve PEM Fuel Cell Durability Grant agreement no.: FU 2007-1-7156 Project duration: 1-Mar-2007 to 31-May-2010 Project Coordinator: Laila Grahl-Madsen Beneficiary No. Beneficiary Name Beneficiary short name CVR 1 Coordinator IRD Fuel Cells A/S Kullinggade 31 DK-5700 Svendborg IRD 1468 9605 2 Department of Chemistry DTU 6339 3010 3 Department of Chemical- Bio- and Environmental Technology SDU 2928 3958 Contributors to the Final Report: Laila Grahl-Madsen (IRD), coordinator Madeleine Odgaard (IRD) Rasmus Munksgård Nielsen (IRD) Qingfeng Li (DTU) Jens Oluf Jensen (DTU) Shuang Ma Andersen (SDU) Jozsef Speder (SDU) Eivind Skou (SDU)
-
Upload
khangminh22 -
Category
Documents
-
view
4 -
download
0
Transcript of Final Project Report - OSTI.GOV

Final report on ‘Quantify and Improve PEM Fuel Cell Durability’ PSO FU 2007-1-7156
Energinet.dk
ForskEl FU 2007-1-7156
Final Project Report
Project full title: Quantify and Improve PEM Fuel Cell Durability Grant agreement no.: FU 2007-1-7156 Project duration: 1-Mar-2007 to 31-May-2010 Project Coordinator: Laila Grahl-Madsen
Beneficiary No. Beneficiary Name Beneficiary short name CVR 1 Coordinator
IRD Fuel Cells A/S Kullinggade 31 DK-5700 Svendborg
IRD 1468 9605
2 Department of Chemistry DTU 6339 3010 3 Department of Chemical-
Bio- and Environmental Technology
SDU 2928 3958
Contributors to the Final Report:
Laila Grahl-Madsen (IRD), coordinator Madeleine Odgaard (IRD) Rasmus Munksgård Nielsen (IRD) Qingfeng Li (DTU) Jens Oluf Jensen (DTU) Shuang Ma Andersen (SDU) Jozsef Speder (SDU) Eivind Skou (SDU)

Final report on ‘Quantify and Improve PEM Fuel Cell Durability’ PSO FU 2007-1-7156
2 of 52
SUMMARY AND CONCLUSSION
The durability and performance of fuel cells have a major impact on the most important challenges facing fuel cell commercialization including cost, mass production, system integration, functionality, and reliability. The national target lifetimes are presently >>2,000 hours for PEM FCs. However, the effort has so far been focused on improvement of the initial PEM FC performance and on decreasing the cost, but the durability and lifetime targets have not yet been systematically addressed in Denmark. The aim of the present project is to systematically quantify and improve the durability of the PEM FC including the following three PEM FC variants: LT PEM FC, DMFC, and HT PEM FC. The project was initiated in March-2007 and ended in May-2010. The three (3) active project partners and their responsibilities are listed below:
• IRD Fuel Cells A/S [IRD], responsible for the following: - Project coordination - LT PEM FC single cell, stack test, and post mortem analysis - DMFC FC single cell, stack test, and post mortem analysis - HT PEM FC stack test
• Department of Chemical- Bio- and Environmental Technology [SDU] being main responsible for the following - Ex-situ catalyst test - Ex-situ membrane test - Segmented and un-segmented single cell test, mainly LT PEM
• Department of Chemistry [DTU] being main responsible for the following: - HT PEM FC ex-situ precursor tests, mainly membrane test - HT PEM FC single cell test
Different factors influencing dissolution properties of noble metal catalyst platinum and platinum-ruthenium alloy has been studied. The dissolution was found to increase by increasing the CV cycle upper potential limit, number of potential cycles, solution acidity, oxygen partial pressure, involvement of chloride, and temperature. Ruthenium was found to deteriorate ten (10) times faster than platinum catalyst; and carbon supported catalyst (Pt: 20%, Ru: up to 100%) deteriorate ten (10) times faster than non-supported catalyst (Pt: 2%, Ru: 30%) at the same condition.
Loss of sulphonic acid groups and fluoride from perfluorinated sulfonic acid membrane was confirmed by different techniques, which locally leads to loss of acidity, and consequently enhances dissolution of noble metal catalyst. Degradation of Nafion ionomer in the electrode was enhanced by noble metal catalyst and the thermal decomposition properties has synergetic effect with carbon degradation.
Hydrophobicity of GDL and electrode on GDL were found to degrade e.g. radical attack, oxidation, and physical wear out. The very top micro surface structure turned out to be responsible for wetting property after chemical ageing. Optimal catalyst and ionomer ratio is also reflected in contact angle value, which can be understood in terms of catalyst/carbon – ionomer affinity and layered structure.
A single LT PEM test rig with 15-channels has been constructed at IRD outside the present project, but the test-rig burn-in has been done within the present project. A single cell test station has been established at SDU. The compiled results of the single cell tests during the test-rig burn-in show unrealistic high degradation rates due to uncontrolled electrical noise and flooding due to an ill-optimised flow plate design, which in combination caused cell reversal in up to 5.5% of the test time. The present status of the 15-channel test-rig is that the electrical noise has been eliminated and a new improved graphite flow plate has been designed and experimentally verified. The test rig now allows for true long-term MEA testing as well as accelerated MEA testing e.g. load cycling.

Final report on ‘Quantify and Improve PEM Fuel Cell Durability’ PSO FU 2007-1-7156
3 of 52
A segmented cell with nine (9) segments aimed for LT PEM and DMFC single cell experiments has been developed. The current distribution among individual segments of the single cell can be mapped out, and valuable information on the variation in the MEA load & thereby durability of each individual MEA segment may be gathered. The method developed to manufacture the segmented cells allows the project partners to construct cells in almost any flow field designs.
A 47-cell stack designed for stationary applications like µCHP has been tested for ≈1,700 hours under conditions relevant for hydrogen fuelled dead-end systems. The stack was equipped with reinforced standard IRD MEAs. The average MEA degradation observed is 40 µV/h. This is a factor of four times higher than recorder in open-end systems outside the present project. The reason for the high degradation rate awaits post mortem analysis of the MEAs, but the indication is that a low hydrogen pressure (≈450 mbar applied) facilitates local carbon corrosion and thereby loss of catalyst. The reinforcement of the MEAs showed encouraging durability. The presented stack test has in many ways contributed to a better understanding of the factors influencing the MEA durability in dead-end hydrogen fuelled systems. However, the Danish national road-map target lifetimes for LT PEM stacks are 6,000 hours in year 2009. This lifetime has not been demonstrated in the present stack test under ‘real system conditions’.
Long-term tested and ‘virgin’ LT PEM MEAs have been characterised with respect to SEM, TEM, EDS, and XRD. Both failed and well-functioning MEAs have been characterised. The Post Mortem analysis has shown and quantified degradation mechanisms like catalyst growth and carbon corrosion. Furthermore, the effect of fuel starvation was shown by pronounced Ru-catalyst band within the membrane. The catalyst coarsening observed after ≈4,000 hours of operation correspond to a loss of catalytic active area of 58% for the anode and 69% for the cathode respectively, and the MEA can be expected to perform equivalent to MEAs with less than half the catalyst loating. The catalyst coarsening is mainly due to voltage sweep transients from loaded operation to OCV. Work within the present project has proven that a high potential is not harmful in it-self because the platinum surface is protected by an oxide layer. If, however, the oxide is reduced by potential cycling, platinum ions may be released into the electrolyte, in particular if complexing ions are present.
Prior to this project IRD did not have experience with long-term DMFC testing. The literature on DMFC degradation and Accelerated Stress Test (AST) protocols specific for DMFC is ‘non-existent’ or at least very limited. Conventional unsupported PtRu black electro-catalysts have been used as DMFC anode catalysts widely in research and development because they can be loaded onto MEA at high loading (usually 4~6 mg/cm2) for high power density. However, at such a high loading, the actual catalyst utilization in a MEA is very low. Cost and long term durability are critical for product commercialization. The DMFC MEAs investigated in the present project has been using low loading electrodes (~1-2 mg/cm2) and given IRD a state-of-the-art reference on DMFC durability, although in a limited set of operating conditions. Performance test using two different test protocols have been carried out under conditions initially believed to be slightly more extreme (continuous steady-state operating and load cycling) than the expected operating conditions of a practical system, but close to the conditions applied at system level in real systems with respect to temperature, air and fuel supply. However, these tests using frequent load cycling did not result in accelerated degradation, but turned instead out to be beneficial to the DMFC-lifetime.
DMFC durability tests were carried out on both Nafion and Hydrocarbon membrane based MEAs using different electrode designs. Several single DMFC cells and stacks have been tested up to 3,000 hours. The degradation rates found for both single cells and stacks were in the range between 10-90 µV/hours per cell, depending on the MEA configuration. Certain performance losses incurred by the cell during the steady-state operation were recovered, fully or in part, after the regular OCV hold. Regeneration of the Pt-catalyst particles include electro-reduction of the surface PtO that gradually forms over time, surface electro-oxidation of adsorbed poisons (namely CO formed from methanol crossover), and chemical reduction of PtO and/or PtOH via crossover methanol.

Final report on ‘Quantify and Improve PEM Fuel Cell Durability’ PSO FU 2007-1-7156
4 of 52
The national Danish road map lifetime targets for single DMFC cells are 2,000 hours in year 2009 and 2,500 hours in year 2010. These lifetime targets allow degradation rate of up to ≈22 µV/h and ≈17 µV/h, respectively. The targets are met for at least two DMFC MEA types. The national Danish road map lifetime targets for DMFC stacks are 1,000 hours in year 2009 and 2,000 hours in year 2010. These lifetime targets allow degradation rate of up to ≈45 µV/h in year 2009 and ≈22 µV/h, in year 2010. The target DMFC stack lifetime is met for year 2009, but not yet for year 2010.
Durability is one of the most important issues for PBI based HT PEM FC. Concerning PBI/phosphoric acid membrane based high temperature PEM FC, possible component failure mechanisms include degradation of the polymer, loss of the doping acid, dissolution of noble metal catalysts, corrosion of catalyst support and the triggered catalyst sintering, as well as other construction materials. These mechanisms have been identified and investigated through this project via experimental work in combination with literature studies. During a steady state (continuous) operation of a HT PEM FC with hydrogen and air the lifetime seems very much dependent on temperature, i.e. over 5,000 to 20,000 hours at temperatures around 150-160ºC but a few hundreds to a thousand of hours at 180-200ºC. A performance degradation rate of about 5 µV per hour has been demonstrated. Under operation in a dynamic mode with load or/and thermal cycling, a performance degradation rate of about 300 µV/cycle has been observed. Different mechanisms have been identified that are contributing to the performance degradation. Acid evaporation indicates an acid loss of less than 1 µg m-2 s-1 through the electrode off gases, based on which an acid loss corresponding to a few percents of the total acid content in a fuel cell stack was predicted after 40,000 or five years of operation. Oxidative degradation of the polymer was studied by the Fenton test. An unzip scission mechanism that the radicals attack and oxidize either end of the macromolecular chain has been suggested, emphasizing the importance of the polymer molecular weight. Introduction of heterogroups in the PBI macromolecular chain as well as covalent or ionical cross-linking of the polymer significantly improved the oxidative resistance of the membrane, which can be a compatible to Nafion 117 in term of the Fenton test.
The HT PEM FC results indicate that a degradation rate of ≈5 µV/h for HT PEM FC can be expected under continuous operation with hydrogen and air at 150-160 C, corresponding to a lifetime of 12,000 hours before 10% performance loss. This lifetime is somewhat shorter than aimed at in the national Danish HT PEM Road map (2009: 20,000 h), but it is in this context important to remember the limited knowledge on HT PEM lifetime at the time of the roadmap definition in 2008. Upon thermal or/and load on/off cyclings, which are more relevant to automobile applications, a performance loss of 300 µV per cycle or 40 µV per operating hours has been reported, attributable to more serious acid leaching due to the liquid water formation and the cathodic catalyst activity loss because of exposure to OCV. The accelerated durability test with potential cycling showed significant catalyst degradation, primarily due to the corrosion of carbon supports, which triggers the platinum sintering/agglomeration. Modified catalyst supports in form of graphite or carbon nanotubes improve the catalyst and therefore the PBI cell durability
The present project has contributed with much essential knowledge on lifetime and durability of PEM FC, an important and necessary step towards utilisation of the technology. In particular for the rather new fields of DMFC & HT-PEMFC the knowledge on degradation was indeed limited in the research group. The combined literature and experimental study has changed that completely and members have even been invited to teach HT-PEM degradation at a PhD summer school abroad. The project results has been published in 11 peer reviewed papers and presented at a numerous symposiums and conferences. The PEM lifetime and durability work will be continued by the same consortium in the already on-going PSO-project: PEM durability and Lifetime – Part II (PSO contract 2010-1-10505).
Final report on ‘Quantify and Improve PEM Fuel Cell Durability’ PSO FU 2007-1-7156
5 of 52
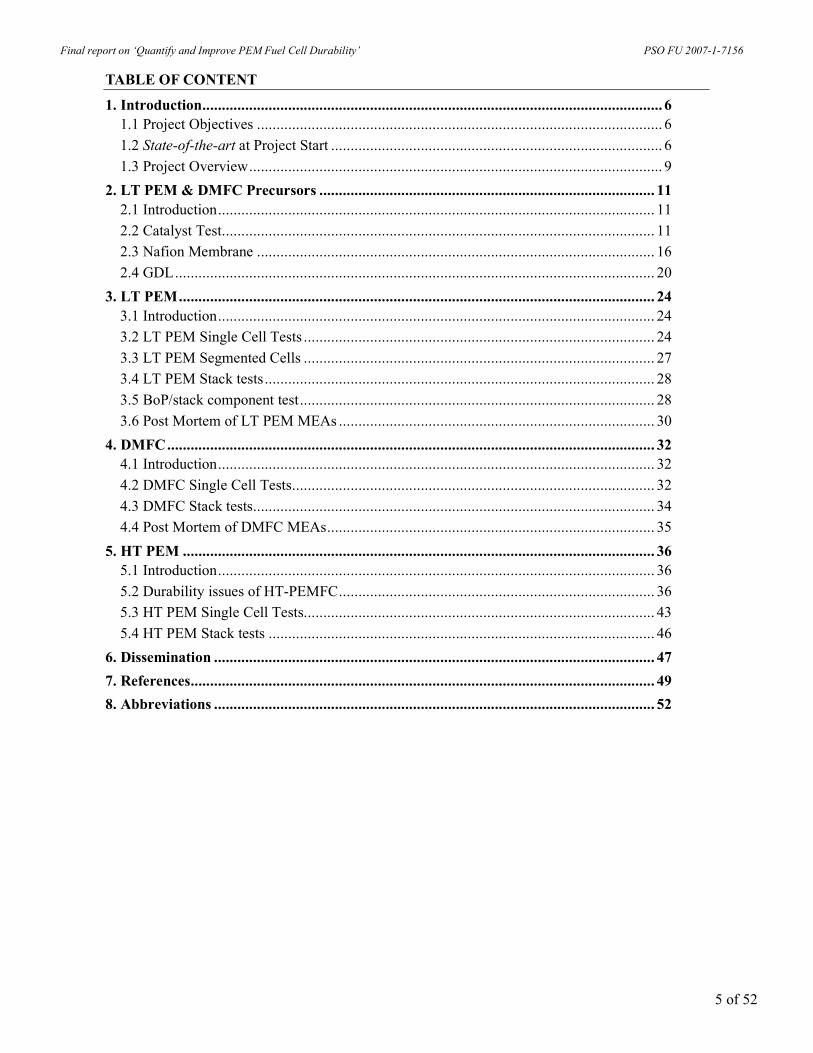
TABLE OF CONTENT
1. Introduction...................................................................................................................... 6 1.1 Project Objectives ........................................................................................................ 6
1.2 State-of-the-art at Project Start ..................................................................................... 6
1.3 Project Overview.......................................................................................................... 9
2. LT PEM & DMFC Precursors ...................................................................................... 11 2.1 Introduction................................................................................................................ 11
2.2 Catalyst Test............................................................................................................... 11
2.3 Nafion Membrane ...................................................................................................... 16
2.4 GDL........................................................................................................................... 20
3. LT PEM.......................................................................................................................... 24 3.1 Introduction................................................................................................................ 24
3.2 LT PEM Single Cell Tests .......................................................................................... 24
3.3 LT PEM Segmented Cells .......................................................................................... 27
3.4 LT PEM Stack tests.................................................................................................... 28
3.5 BoP/stack component test........................................................................................... 28
3.6 Post Mortem of LT PEM MEAs ................................................................................. 30
4. DMFC............................................................................................................................. 32 4.1 Introduction................................................................................................................ 32
4.2 DMFC Single Cell Tests............................................................................................. 32
4.3 DMFC Stack tests....................................................................................................... 34
4.4 Post Mortem of DMFC MEAs.................................................................................... 35
5. HT PEM ......................................................................................................................... 36 5.1 Introduction................................................................................................................ 36
5.2 Durability issues of HT-PEMFC................................................................................. 36
5.3 HT PEM Single Cell Tests.......................................................................................... 43
5.4 HT PEM Stack tests ................................................................................................... 46
6. Dissemination ................................................................................................................. 47
7. References....................................................................................................................... 49
8. Abbreviations ................................................................................................................. 52

Final report on ‘Quantify and Improve PEM Fuel Cell Durability’ PSO FU 2007-1-7156
6 of 52
1. INTRODUCTION
1.1 PROJECT OBJECTIVES
The durability and performance of fuel cells have a major impact on the most important challenges facing fuel cell commercialisation including cost, mass production, system integration, functionality, and reliability. The national target lifetimes are presently >2,000 hours for PEM1 FCs. However, the effort has so far been focused on improvement of the initial PEM FC performance and on decreasing the cost, but the durability and lifetime targets have not yet been systematically addressed in Denmark. The aim of the present project is to systematically quantify and improve the durability of the PEM FC by the following approach:
• Define degradation mechanisms
• Identify and quantify factors that limit PEM FC durability
• Measure property changes in fuel cell components during life testing
• Life testing of materials
• Examine testing conditions
• Develop/apply methods for accelerated and off-line testing
Studies on fuel cell durability are presently being published worldwide. However, most of these studies are based on small single cells, but FC stack systems will have ≈35-250 individual cells, and more systematic data is necessary to predict and improve the durability. The proposed study includes not only lifetime tests of individual materials, but also studies on full size single cells followed by test on full size 1 kW stacks.
1.2 STATE-OF-THE-ART AT PROJECT START
1.2.1 LT PEM FC
The state-of-the-art LT PEM FC degradation has recently been published; a summary is given in Table 1. The reported voltage degradation is well-in line with the measured MEA degradation rate at IRD in the recently terminated PSO project: FU2005-2-6333, 10.6 µV/h cf. Table 1. There is a
100
1,000
10,000
100,000
1 10 100Voltage decay rate µV/h
Lif
eti
me h
ou
rs (
EoL
)
0.4
0.5
0.6
0.7
0.8
BoL Voltage
Total EoL voltage loss: 10%
Fig. 1 Lifetime versus voltage degradation rate (not FC-technology specific).
1 All abbreviations are listed in Section 8 p. 52.

Final report on ‘Quantify and Improve PEM Fuel Cell Durability’
PSO FU 2007-1-7156
7
of 5
2
Tab
le 1
S
elec
ted
LT
PE
M l
ong-
term
tes
t re
sult
s (l
iter
atur
e da
ta a
nd d
ata
from
the
PS
O p
roje
ct F
U20
05-2
-633
3).
Com
pan
y/pr
oduc
t
No. Of cells
MEA area
Test hours
Anode catalyst
Anode catalyst loading
H2 Fuel (λ)
Reformat Fuel (λ)
CO
Air bleed
Humidity
Cathode catalyst loading (Pt/C)
Air as Oxidant (λ)
O2 Oxidant
Humidity
Current density
@ voltage (BoL)
Voltage decay rate
Lifetime @ 10% U-degration
Ref
eren
ce
cm2
mg/
cm2
ppm
%
%
RH
m
g/cm
2
%
RH
A
/cm
2
V
µV
/h
10%
IRD
, Rei
nfor
ced
ME
As
2 15
6 3,
082
PtR
u/C
0.
3
1.2
50
3 10
0 0.
5 2.
7
90
0.28
8 0.
70
No degradation
obs.
PS
O F
U20
05-2
-633
3
Bal
lard
: M
ark
513
2002
PtR
h 4.
0 +
4.
0
+
0.
861
0.78
1.3
60
,000
S
t-P
ierr
e &
Jia
(20
02)
Bal
lard
: M
ark
513
2002
8
11
,000
P
tRh
4.0
+
4.0
+
0.53
8 0.
82
1.4
58
,571
S
t-P
ierr
e &
Jia
(20
02)
Dai
do I
nsti
tute
of
T
echn
olog
y 20
05
2,70
0 P
t/C
0.
5 +
80
0.5
+
80
0.
3 0.
66
2.5
26
,400
Y
u et
al
(200
5)
Osa
ka G
as
36,0
00
PtR
u/C
+
+
100
0.3
2.5
Yam
azak
i et
al
(200
5)
Nuv
era
CG
S
2 50
0 9,
000
PtR
u/C
+
+
0.70
6
11,6
67
Shi
et
al (
2005
)
Gor
e 56
21
26,0
00
PtR
u 0.
45
+
+
100
0.6
+
10
0 0.
8 0.
60
6.4
9,
375
Cle
ghor
n et
al
(200
6)
IRD
, std
. ME
As
16
156
6,08
2 P
tRu/
C
0.3
1.
2 50
3
100
0.5
2.7
90
0.
288
0.68
10.6
6,
450
PS
O F
U20
05-2
-633
3
Gor
e 56
21
18
66
8
+
0.
167
0.76
17
4,45
3 ht
tp:/
/ww
w.s
chat
zlab
.or
g/do
cs/T
dadF
CS
emi
nar2
002.
Bal
lard
: M
ark
513
2000
2,
000
+
+
100
+
0 1.
000
0.43
24
1,79
2 S
t-P
ierr
e et
al
(200
0)
Gor
e 55
10
2,00
0 P
t/C
0.
4 +
100
0.4
+
10
0 0.
2 0.
77
25
3,08
0 F
erre
ira
et a
l (2
005)
Tor
ay/D
aido
Ins
titu
te o
f T
echn
olog
y
+
26
+
26
29
M
iyos
hi e
t al
(20
06)
LA
NL
200
5
3,
400
Pt/
C
0.2
+
25
5 0.
2 +
100
0.55
0.
62
33
1,87
9 W
ood
et a
l (2
005)
Gor
e 55
10
18
66
8
+
36
0 ht
tp:/
/ww
w.s
chat
zlab
.or
g/do
cs/T
dadF
CS
emi
nar2
002.

Final report on ‘Quantify and Improve PEM Fuel Cell Durability’ PSO FU 2007-1-7156
8 of 52
Table 2 Overall degradation of PBI cells under steady state operation with dry hydrogen and air at 150-160ºC.
DTU (2005) >5,000 h @ 150ºC; degradation rate <5 µV/h <2,000 h @ 180-200ºC
BASF-PEMEAS (2006) >20,000 h @ 160ºC; degradation rate 5-6 µV/h
Plug Power (2006) Degradation rate of ca. 12 µV/h at 0.2 A/cm2
Sartorius (2007) 2 kW PBI stack @ 160ºC; degradation rate <10 µV/h
FuMa-Tech (2007) 10,000 h @ 150ºC; degradation rate <5 µV/h
Juelich (2008) >6,000 h @ 160ºC; degradation rate ≈25 µV/h
BASF (2008) >6,000 h @ 160ºC; degradation rate ≈5 µV/h
general worldwide acceptance of defining EoL as the time where the MEA voltage has decreased with 10%. This does not necessarily mean that the MEAs cannot function after 10% voltage degradation, but the definition serves to make a common reference for comparison. Furthermore, 10% voltage degradation might be valid for some applications e.g. CHP where inverters often have a lower voltage input level. Lifetimes above 20,000 hours can only be achieved when the voltage degradation is in the order of 1-2 µV/h for applications where the 10% voltage degradation is valid (Fig. 1), but the acceptable degradation rate can be twice as high in applications where 20% voltage degradation can be accepted.
1.2.2 DMFC
DMFC with power-output in the mW range for battery substitution is in fast development worldwide. However, IRD is one of the few developers of DMFC MEAs, stacks, and modules aimed for power ranges in the kW size. IRD had not prior to the present project done long-term DMFC testing. The literature on DMFC degradation is ‘non-existent’ or at least very limited!
1.2.3 HT PEM
During a steady state (continuous) operation of a fuel cell with hydrogen and air the lifetime seems very much dependent on temperature, i.e. over 5,000 to 20,000 hours at temperatures around 150-160ºC but a few hundreds to a thousand of hours at 180–200ºC. The eventual death of the cell is apparently due to the membrane failure, showing the importance of the polymer stability. A performance degradation rate of about 5 µV/h has been demonstrated by DTU and confirmed by other groups (Table 2).
Final report on ‘Quantify and Improve PEM Fuel Cell Durability’ PSO FU 2007-1-7156
9 of 52
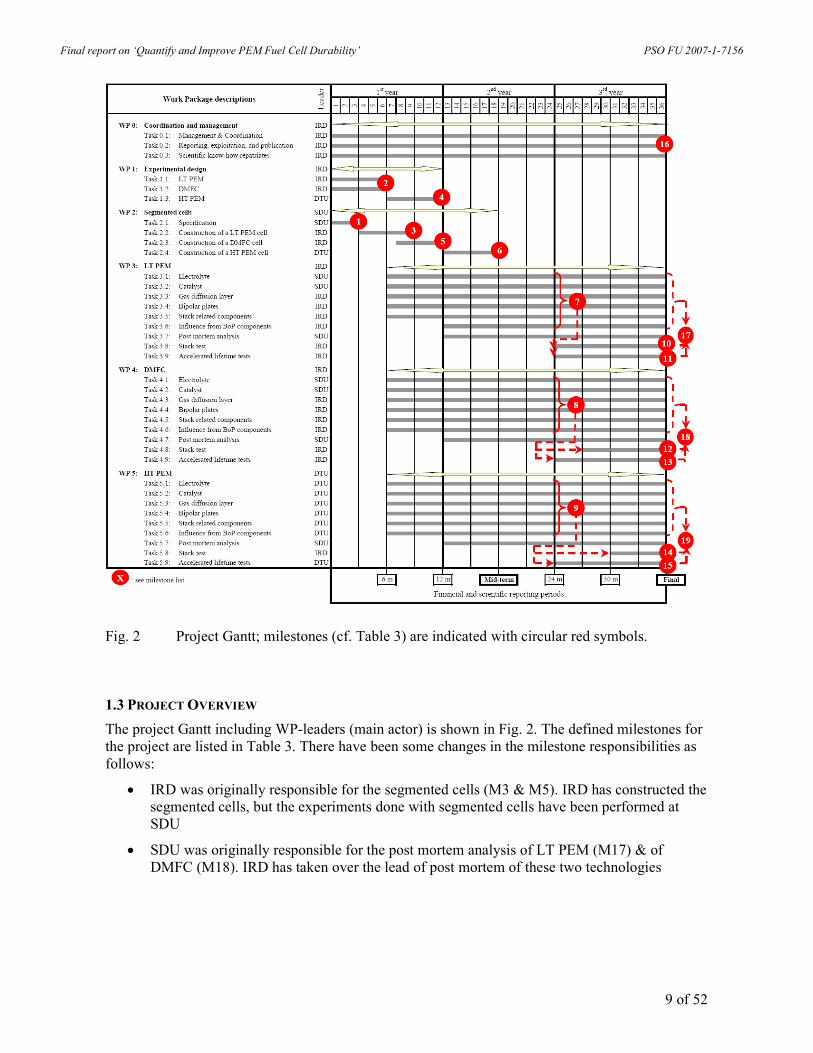
Fig. 2 Project Gantt; milestones (cf. Table 3) are indicated with circular red symbols.
1.3 PROJECT OVERVIEW
The project Gantt including WP-leaders (main actor) is shown in Fig. 2. The defined milestones for the project are listed in Table 3. There have been some changes in the milestone responsibilities as follows:
• IRD was originally responsible for the segmented cells (M3 & M5). IRD has constructed the segmented cells, but the experiments done with segmented cells have been performed at SDU
• SDU was originally responsible for the post mortem analysis of LT PEM (M17) & of DMFC (M18). IRD has taken over the lead of post mortem of these two technologies

Final report on ‘Quantify and Improve PEM Fuel Cell Durability’ PSO FU 2007-1-7156
10 of 52
Table 3 List of Milestones (cf. Fig. 2).
Milestone Description Elaborated
MS1 Report on specification of segmented cells Completed
MS2 Report on specification of LT PEM & DMFC experimental design Completed
MS3 Segmented cell for LT PEM durability test constructed Completed
MS4 Report on specification of HT PEM experimental design Completed
MS5 Segmented cell for DMFC durability test constructed Completed
MS6 Segmented cell for HT PEM durability test constructed Cancelled
MS7 Report on LT PEM single cell durability test Completed
MS8 Report on DMFC single cell durability test Completed
MS9 Report on HT PEM single cell durability test Completed
MS10 Report on 2,000 hours PEM stack test Completed
MS11 Conclusion on accelerated LT PEM test Completed
MS12 Report on 1,000 hours DMFC stack test Completed
MS13 Report on accelerated DMFC test Completed
MS14 Report on >500 hours HT PEM stack test Completed
MS15 Conclusion on accelerated HT PEM test Completed
MS16 Four (4) papers submitted to international journals with peer-review Completed
Cf. section 6
MS17 Conclusion on post-mortem analysis on LT PEM Completed
MS18 Conclusion on post-mortem analysis on DMFC Completed
MS19 Conclusion on post-mortem analysis on HT PEM Cancelled
Final report on ‘Quantify and Improve PEM Fuel Cell Durability’ PSO FU 2007-1-7156
11 of 52
2. LT PEM & DMFC PRECURSORS
2.1 INTRODUCTION
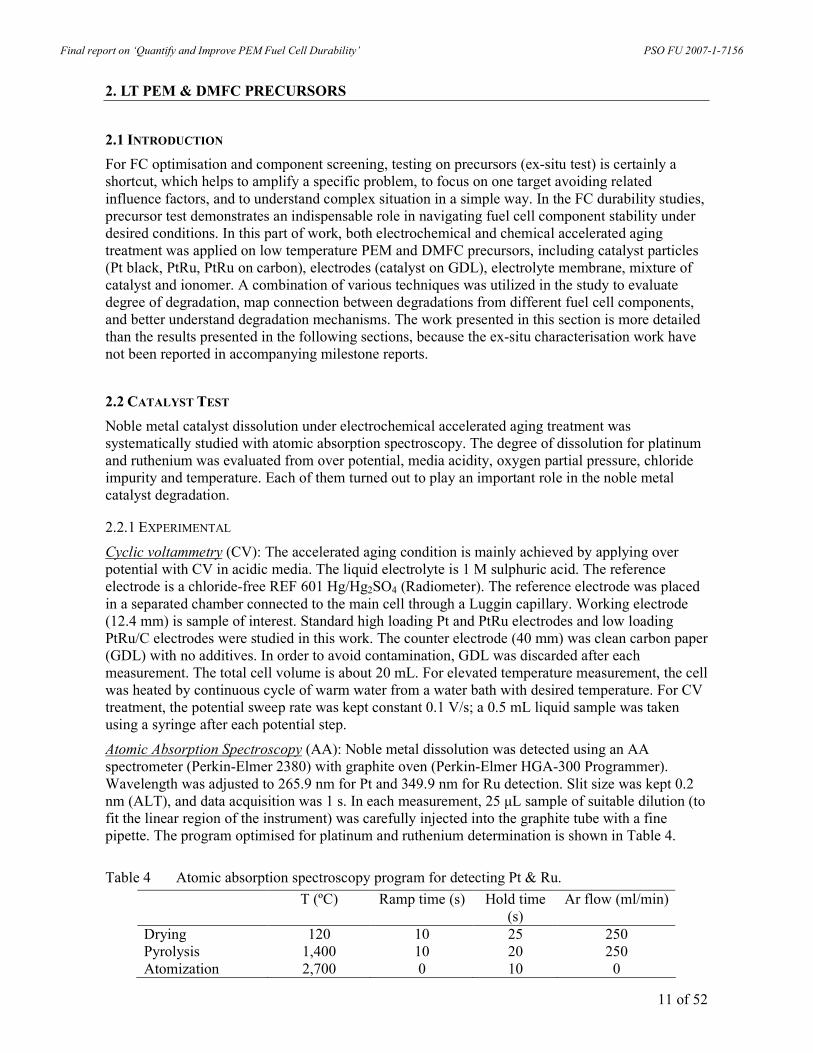
For FC optimisation and component screening, testing on precursors (ex-situ test) is certainly a shortcut, which helps to amplify a specific problem, to focus on one target avoiding related influence factors, and to understand complex situation in a simple way. In the FC durability studies, precursor test demonstrates an indispensable role in navigating fuel cell component stability under desired conditions. In this part of work, both electrochemical and chemical accelerated aging treatment was applied on low temperature PEM and DMFC precursors, including catalyst particles (Pt black, PtRu, PtRu on carbon), electrodes (catalyst on GDL), electrolyte membrane, mixture of catalyst and ionomer. A combination of various techniques was utilized in the study to evaluate degree of degradation, map connection between degradations from different fuel cell components, and better understand degradation mechanisms. The work presented in this section is more detailed than the results presented in the following sections, because the ex-situ characterisation work have not been reported in accompanying milestone reports.
2.2 CATALYST TEST
Noble metal catalyst dissolution under electrochemical accelerated aging treatment was systematically studied with atomic absorption spectroscopy. The degree of dissolution for platinum and ruthenium was evaluated from over potential, media acidity, oxygen partial pressure, chloride impurity and temperature. Each of them turned out to play an important role in the noble metal catalyst degradation.
2.2.1 EXPERIMENTAL
Cyclic voltammetry (CV): The accelerated aging condition is mainly achieved by applying over potential with CV in acidic media. The liquid electrolyte is 1 M sulphuric acid. The reference electrode is a chloride-free REF 601 Hg/Hg2SO4 (Radiometer). The reference electrode was placed in a separated chamber connected to the main cell through a Luggin capillary. Working electrode (12.4 mm) is sample of interest. Standard high loading Pt and PtRu electrodes and low loading PtRu/C electrodes were studied in this work. The counter electrode (40 mm) was clean carbon paper (GDL) with no additives. In order to avoid contamination, GDL was discarded after each measurement. The total cell volume is about 20 mL. For elevated temperature measurement, the cell was heated by continuous cycle of warm water from a water bath with desired temperature. For CV treatment, the potential sweep rate was kept constant 0.1 V/s; a 0.5 mL liquid sample was taken using a syringe after each potential step.
Atomic Absorption Spectroscopy (AA): Noble metal dissolution was detected using an AA spectrometer (Perkin-Elmer 2380) with graphite oven (Perkin-Elmer HGA-300 Programmer). Wavelength was adjusted to 265.9 nm for Pt and 349.9 nm for Ru detection. Slit size was kept 0.2 nm (ALT), and data acquisition was 1 s. In each measurement, 25 µL sample of suitable dilution (to fit the linear region of the instrument) was carefully injected into the graphite tube with a fine pipette. The program optimised for platinum and ruthenium determination is shown in Table 4.
Table 4 Atomic absorption spectroscopy program for detecting Pt & Ru.
T (ºC) Ramp time (s) Hold time (s)
Ar flow (ml/min)
Drying 120 10 25 250 Pyrolysis 1,400 10 20 250 Atomization 2,700 0 10 0

Final report on ‘Quantify and Improve PEM Fuel Cell Durability’ PSO FU 2007-1-7156
12 of 52
-0.5 0.0 0.5 1.0
-0.1
0.0
0.1
REF601, NT-K16H
2SO
4 1 M
Sweep rate: 0.1 V/s
Cu
rren
t /
A
Potential / V v.s. REF 601
Fig. 3 CV treatments on MEA.
Standard solutions are prepared from K2PtCl4 (Chempur GmbH Karlsruhe Pt% 46.78) and RuCl3 * xH2O (Ru% 40.9). Hydrochloric acid was added to prevent precipitation. The quality of the stock solution with a concentration of 10-3 M was frequently examined by UV spectroscopy (between 200 and 700 nm wavelength). It proved to be stable over month.
X-ray Powder Diffraction (XRD): XRD was carried out using a Siemens diffractometer D5000 with incidence wavelength 1.5406 Å (Cu Kα). Catalysts supported by a substrate (GDL) were attached directly on the sample holder with a piece of double-sides carbon tape. All measurements were conducted at ambient temperature and atmosphere. Spectra scan between 10º and 90º, with steps of 0.02º and a counting time of 1s/step. Compound identification was achieved using the PDF database. Peak localization and peak width at half height was determined using OriginTM 6.0 professional.
2.2.2 RESULTS AND DISCUSSION
CV Spectra: Stepwise extension of the upper potential limit in CV treatment was applied on the FC catalysts. Cyclic voltammograms of platinum on carbon type catalyst is shown in Fig. 3. Different from ordinary crystalline platinum voltammograms, in the hydrogen absorption region, no distinct weak/strong hydrogen absorption and desorption peaks were detected (Bewick et al. 1981). This is probably due to the fine size of the platinum nano-particles, which results a broader distribution of crystallites, also the double layer capacity from carbon particles contribution; furthermore, a fine, micro-porous electrode structure contribute to the absorption behaviours of hydrogen to be in a “lower resolution” manner. With extension of the upper potential limit, increasing amount of oxides was detected as expected; however, the reduction peak of the oxide was seen moving to the lower potentials, which indicates a decline of reduction ability, furthermore, a reduced area of the hydrogen absorption / desorption peak reflects loss of platinum electrochemical surface area.
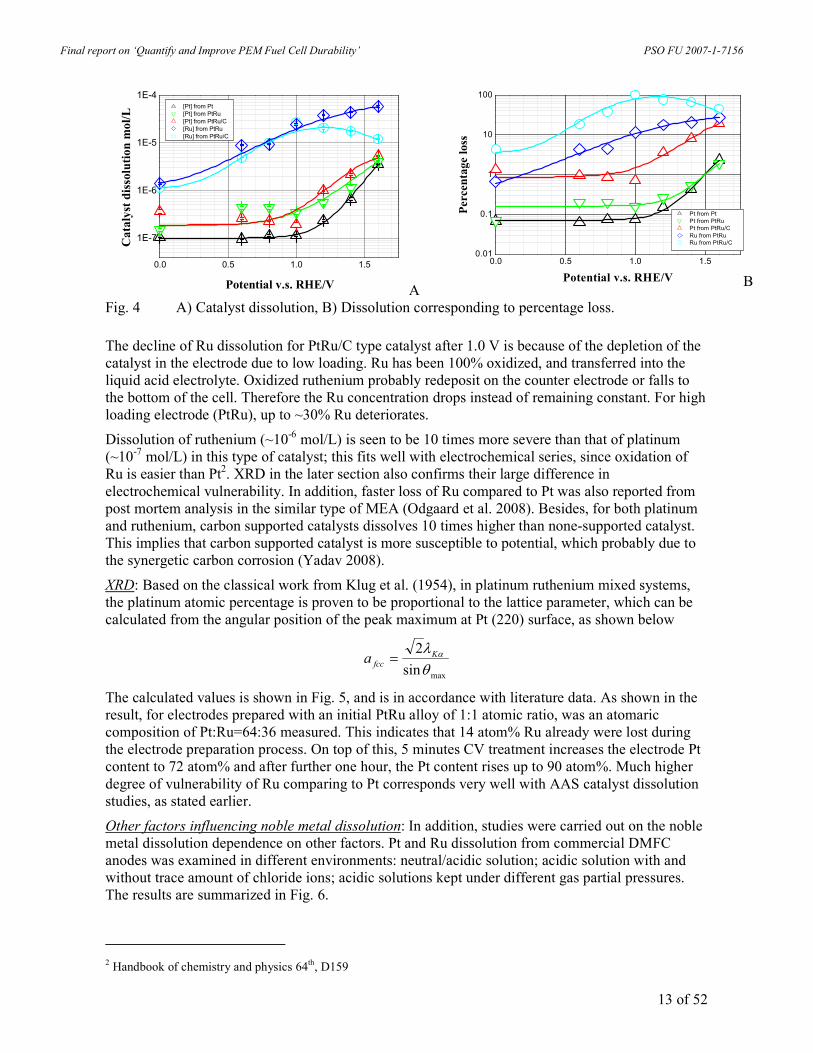
Electrode noble metal catalyst dissolution: Platinum and ruthenium dissolutions in sulphuric acid (1 M) as function of over potential are shown in Fig. 4A. The corresponding values to the percentage loss are presented in Fig. 4B. By comparing the result for platinum in Pt black, PtRu alloy and PtRu supported on C type catalysts, as a general trend, there is a rather stable Pt dissolution in the order of 10-7 mol/L up to 1.0 V v.s. RHE, and an exponential increase of Pt dissolution was observed between 1.0 and 1.6 V v.s. RHE up to 10-6 mol/L. Based on the percentage results, fig.4-B, platinum dissolution was found up to 2% for metallic (Pt black and PtRu) type catalyst and 20% for carbon supported catalyst.
Different from platinum, ruthenium dissolution was found to follow the exponential growth in all potential range (0-1.6 V v.s. RHE). Furthermore, both metallic and carbon supported ruthenium alloy catalyst was found dissolving in the same order of magnitude between 10-6 and 10-5 mol/L.
Final report on ‘Quantify and Improve PEM Fuel Cell Durability’ PSO FU 2007-1-7156
13 of 52
0.0 0.5 1.0 1.5
1E-7
1E-6
1E-5
1E-4
[Pt] from Pt
[Pt] from PtRu
[Pt] from PtRu/C
[Ru] from PtRu
[Ru] from PtRu/C
Potential v.s. RHE/V
Ca
taly
st d
isso
luti
on
mo
l/L
A
0.0 0.5 1.0 1.50.01
0.1
1
10
100
Perc
en
tage l
oss
Potential v.s. RHE/V
Pt from Pt
Pt from PtRu
Pt from PtRu/C
Ru from PtRu
Ru from PtRu/C
B
Fig. 4 A) Catalyst dissolution, B) Dissolution corresponding to percentage loss.
The decline of Ru dissolution for PtRu/C type catalyst after 1.0 V is because of the depletion of the catalyst in the electrode due to low loading. Ru has been 100% oxidized, and transferred into the liquid acid electrolyte. Oxidized ruthenium probably redeposit on the counter electrode or falls to the bottom of the cell. Therefore the Ru concentration drops instead of remaining constant. For high loading electrode (PtRu), up to ~30% Ru deteriorates.
Dissolution of ruthenium (~10-6 mol/L) is seen to be 10 times more severe than that of platinum (~10-7 mol/L) in this type of catalyst; this fits well with electrochemical series, since oxidation of Ru is easier than Pt2. XRD in the later section also confirms their large difference in electrochemical vulnerability. In addition, faster loss of Ru compared to Pt was also reported from post mortem analysis in the similar type of MEA (Odgaard et al. 2008). Besides, for both platinum and ruthenium, carbon supported catalysts dissolves 10 times higher than none-supported catalyst. This implies that carbon supported catalyst is more susceptible to potential, which probably due to the synergetic carbon corrosion (Yadav 2008).
XRD: Based on the classical work from Klug et al. (1954), in platinum ruthenium mixed systems, the platinum atomic percentage is proven to be proportional to the lattice parameter, which can be calculated from the angular position of the peak maximum at Pt (220) surface, as shown below
maxsin
2
θ
λ αKfcca =
The calculated values is shown in Fig. 5, and is in accordance with literature data. As shown in the result, for electrodes prepared with an initial PtRu alloy of 1:1 atomic ratio, was an atomaric composition of Pt:Ru=64:36 measured. This indicates that 14 atom% Ru already were lost during the electrode preparation process. On top of this, 5 minutes CV treatment increases the electrode Pt content to 72 atom% and after further one hour, the Pt content rises up to 90 atom%. Much higher degree of vulnerability of Ru comparing to Pt corresponds very well with AAS catalyst dissolution studies, as stated earlier.
Other factors influencing noble metal dissolution: In addition, studies were carried out on the noble metal dissolution dependence on other factors. Pt and Ru dissolution from commercial DMFC anodes was examined in different environments: neutral/acidic solution; acidic solution with and without trace amount of chloride ions; acidic solutions kept under different gas partial pressures. The results are summarized in Fig. 6.
2 Handbook of chemistry and physics 64th, D159

Final report on ‘Quantify and Improve PEM Fuel Cell Durability’ PSO FU 2007-1-7156
14 of 52
25 50 75 100 125
3.85
3.90
3.95
1 h treatment
Pt atom%
Lat
tice
par
amet
er [
Å]
Original
1 h treatment
5 min.s treatment
Original
Gasteiger et al. (1993) Measured XRD result MEA with Pt/Ru catalyst (1:1) MEA with Pt catalyst
Fig. 5 Ru content determined from lattice parameter. The references are 40, 50 atom% Pt of Pt / Ru alloy and Pt catalyst powder from Johnson Matthey as shown as triangles in the figure.
0 50 100
0.5
1.0
[P
t] /
µm
ol/
L
Hours
Ar / H2O
Ar / H2SO
4
Ar / H2SO
4+10 ppm NaCl
air / H2SO
4
O2 / H
2SO
4
0 50 1000
10
20
Ar / H2O
Ar / H2SO
4
Ar / H2SO
4+10 ppm NaCl
air / H2SO
4
O2 / H
2SO
4
Hours
[Ru
] /
µm
ol/
litr
e
Fig. 6 Other factors influencing noble metal dissolution.
0.6 0.8 1.0 1.2 1.4 1.6
1E-8
1E-7
1E-6
[Pt] mol/L
V v.s. RHE
22Co
53Co
67Co
77Co
Fig. 7 [Pt] as function as potential and T.
As shown in the figures, both Pt and Ru are quite inert in neutral aqueous solution; no Pt or Ru was detected. Nevertheless, both elements were observed in all acidic media. The noble metal concentrations increase during the first three days and slowly reach a constant value. Oxygen partial pressure is also important factor increasing noble metal dissolution. Those results agree fairly well with literature data e.g. Mitsushima et al. (2008). Cl-ions enhance the Pt dissolution due to formation of Pt-Cl complexes as reported by other groups e.g. Yadav et al. (2007), Sugawara et al. (2007) & Matsuoka et al. (2008); however chloride seems to depress ruthenium dissolution.

Final report on ‘Quantify and Improve PEM Fuel Cell Durability’ PSO FU 2007-1-7156
15 of 52
0 20 40 60 80 100 120
0.0
5.0x10⁻⁷
1.0x10⁻⁶
1.5x10⁻⁶
[Pt] mol/L
Number of cycle
Nano-2
K-16
Fig. 8 [Pt] as function of cycles applied
0 25 505x10
-3
1x10⁻²
2x10⁻²
Q/[
Pt]
C [
cm2/m
g]
Ionomer content [wt%]
0.6 V 0.8 V 1.0 V 1.2 V 1.4 V 1.6 V
A
0.5 1.0 1.50.01
0.1
1
10
0% 10% 20% 30% 40% 50%
[Pt]
µm
ol/
litr
e
Potential V v.s. RHEB
Fig. 9 MEAs with different ionomer content A) Active surface area, B) Platinum dissolution.
Besides, dissolution of noble metal catalyst is also very much depending on temperature as shown in the Fig.7. The platinum concentration detected in the 1 M sulphuric acid solution was found to increase with rising temperature. At 77ºC [Pt] is almost 10 times as much as that of room temperature. Therefore, noble metal catalyst dissolution plays an even more important role in durability consideration for fuel cells at optimal working temperature. Last but not least, as shown in Fig. 8, platinum dissolution increases linearly with increase of potential cycle.
Pt dissolution in MEA with different ionomer content: CV and the corresponding Pt dissolution was also specially studied on commercial DMFC cathodes with ionomer content ~0, 10, 20, 30, 40 and 50 wt% in 1 M sulphuric acid solution. The electrochemical active surface area of platinum in the electrodes as function of ionomer content is summarized in Fig. 9A. A maximum is shown at 40%, which indicates optimal ionomer content in the electrode for electrochemical reactions. This is, however, a different value shown in the catalyst as reported in our earlier work (Ma et al. 2009). This is probably due to the fact that catalyst of larger surface area requires a higher amount of ionomer to form an optimised Three-Phase-Boundary (TPB).
Platinum dissolution at each potential step was studied via AAS. The results are shown in Fig 9B. The ionomer content in the electrode showed slight (in general, 20-30% ionomer seems of lower Pt dissolution) but insignificant influence on platinum dissolution. This implies that manipulation of binder (ionomer) content in the membrane electrode assembly; unfortunately, do not significantly improve catalyst electrochemical stability.

Final report on ‘Quantify and Improve PEM Fuel Cell Durability’ PSO FU 2007-1-7156
16 of 52
0 500 1,00080
90
100
∆
w [
wt%
]
Hours
80ºC; H2O
2
3% 6% 10% 20%
A.
0 10 20
500
600
H2O
2 content wt%
[ F
- ]
µm
ol/
litr
e
B.
Fig. 10 A) Nafion weight change in wt% B) fluoride release.
2.3 NAFION MEMBRANE
Most widely applied fuel cell electrolyte – Nafion® was studied with respect to chemical stability under accelerated chemical aging. This protonic conductive polymer is not only of great importance for passing proton from anode to cathode, but also an inevitable part of three-phase zone. Degradation of Nafion membrane, especially releasing of acid groups was examined from different “angles”. Besides, degradation of Nafion ionomer promoted by noble metal catalyst and co-function of carbon corrosion was studied.
2.3.1 EXPERIMENTAL
Membrane degradation by Fenton test: Nafion 117 membranes of ~ 0.2 g were immersed in hydrogen peroxide solutions of 3, 6, 10 and 20wt% with 20 ppm Fe2+. The temperature was maintained at 80ºC (WTB binder). The weight change of the membrane was determined with a digital balance (Mettler AE 260 Delta Range) every 24-72 hours. The membrane surface was quickly wiped with paper tissue every time to eliminate water drops. Fluoride detection was achieved by using an ion selective electrode ISEF25 (Radiometer) in connection with a pH meter (PHM 92, Radiometer). The electrode was calibrated with NaF (Heraeus Gmbh Karlseruhe 99.9%).
Thermogravimetry (TG) and TG – MS: The instrument used was a Setaram TG-DGA 92. Membrane (up to 50 mg) or powder mixture (for Nafion ionomer, carbon and catalyst interaction analysis) was placed into an Al2O3 crucible. The experiment started with 20 min. gas purge, heating rate: 5ºC/min. Gas supply 75% Ar and 25% O2 at one atmosphere. Cleaning and blank were performed before each sample run. For Nafion ionomer, carbon and catalyst interaction analysis, same condition was applied. For TG-MS combination, exhaust gas from membrane thermal decomposition was analysed by mass spectrometry with a gas inlet.
Scanning electron microscopy: Field emission scanning electron microscope (FE-SEM) Carl Zeiss SMT Nano Technology Systems Division was used for element analysis in membrane. Samples of different history were placed next to each other on the same holder during the study. Five (5) points was chosen from each sample and the sulphur content was analysed with EDAS.
Ion selective electrode: Fluoride ion electrode ISEF25 (Radiometer) combining with a pH meter (Radiometer) was used for F- detect in solution. The electrode was pre-calibrated with sodium fluoride within the concentration range 10-1 -10-5 mol/L.
2.3.2 RESULTS AND DISCUSSIONS
Release of acid group: As shown in Fig. 10A, a weight loss of Nafion up to 20% was found. Increasing amount of fluoride ion was detected in the hydrogen peroxide solution after the treatment

Final report on ‘Quantify and Improve PEM Fuel Cell Durability’ PSO FU 2007-1-7156
17 of 52
Fig. 11 . Thermal decomposition of treated membranes.
0 100 200 300 400 500 600
0
1
2
3
4
Nomaliezed signal from MS
Temperature / Co
Virgin memberane
CO2
SO2
Treated membrane
CO2
SO2
Fig. 12 . MS spectrum on TG exhausts gas.
of the membranes over 40 days (Fig. 10B). In addition, thermogravimetry, Fig. 11 indicates that chemically decomposed Nafion membrane shows less content of sulphuric acid groups, which shows typical weight loose between ~ 20 and 420ºC (Qiao et al. 2006). Moreover, in the combination of TG-MS, by taking advantage of the mass spectrometry, it is easy to follow the evolution of individual specific gas species at the same time (which is in contrast to TG recording the total weight loss). In MS spectrum, two major signals were detected during gas evolution from the membrane thermal decomposition in TG. They are 44 and 64, which corresponding to carbon dioxide and sulphur dioxide3, as the oxidation product of carbon and sulphur. As shown in Fig. 12, there is obvious difference in SO2 amount from virgin and treated membrane. For treated membrane sample, the first peak value for mass 64 at around 350oC was very much diminished; besides, second peak value at around 470oC also shows less intensity. This also suggests that lower content of sulphur in the member after chemical treatment. However, signal for 44, treated sample showed slightly higher intensity compared to the original membrane, which might due to the fact that deteriorated polymer is more efficient in converting to carbon dioxide at elevated temperature.
3 Detection of sulfur dioxide is confirmed with the simultaneous detection of its isotope with mass of 48. According to Mass Spectral Data the ratio between 48 and 64 is 493:1,000, which fits also well with the detected value. Atlas of Mass Spectral Data, E. Stenhagen et al. Vol 1 & 2. 1969

Final report on ‘Quantify and Improve PEM Fuel Cell Durability’ PSO FU 2007-1-7156
18 of 52
Fig. 13 . Pinholes on treated membranes
0 100 200 300 400 500 600 700 800
-100
-80
-60
-40
-20
0
20
Weight loss / %
Temp / Co
Vulcan
Nafion
ionomer
Fig. 14 . Thermal properties of Vulcan and Nafion ionomer
An even more direct way to confirm missing of sulfonic acid group in the Nafion membrane is by examining sulphur content with microscopy. The result showed that virgin Nafion has S content of (3.16±1.03) % (normalized to 100% among analysed element (C, O, F, Na, S, K, Ca in the sample), and treated Nafion of (1.86±17) %, which does confirm the loss of sulphonic acid group from the membrane after chemical treatment. In addition, pinholes were observed on the membrane surface under microscopy as shown in Fig. 13.
Comparatively speaking, the higher the hydrogen peroxide concentration, the higher membrane weight loss; correspondingly, more fluoride ion was detected in the hydrogen peroxide solution; furthermore, increasing amount of sulphonic groups were found missing in the treated membrane. All these suggest that degradation of the polyfluorinated sulphonic membrane is very much enhanced by the attacking of radicals from OH·. Released groups including fluoride and sulphonic groups could be one of the important reasons for rising acidity / lower pH value in the electrode. This, in turn, maybe a crucial reason for the dissolution of catalyst which is in close vicinity of the ionomer in the TPB.
Nafion ionomer, carbon and catalyst interaction: Mixing of catalyst powder and Nafion ionomer solution can be found in our earlier work (Ma et al. 2009). After centrifugation, there is a rather clear separation of liquid and precipitation. A fine pipette then carefully removed majority of the liquid; the rest of the liquid was evaporated in an oven at 40ºC for 24 hours. The final product is normally a clump, which is due to the polymer nature of the ionomer. Slight grinding was necessary to return the powder form. About 3-4 mg pre-treated powder was transported into α-Al2O3 crucible for TG analysis.
Final report on ‘Quantify and Improve PEM Fuel Cell Durability’ PSO FU 2007-1-7156
19 of 52
0 100 200 300 400 500 600 700 800
-100
-80
-60
-40
-20
0
Hispec 9100 + Nafion
Hispec 9000 + Nafion
Vulcan+Nafion
Vulcan+Nafion (synthetic)
Weight loss / %
Temp / Co
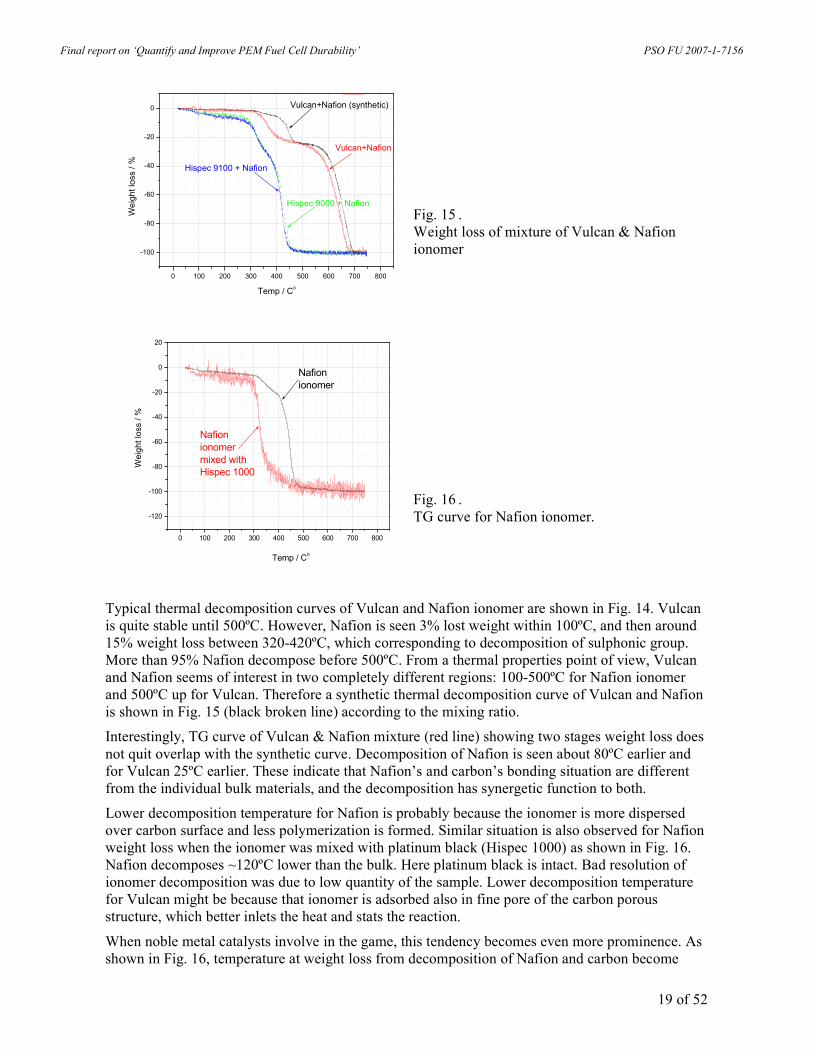
Fig. 15 . Weight loss of mixture of Vulcan & Nafion ionomer
0 100 200 300 400 500 600 700 800
-120
-100
-80
-60
-40
-20
0
20
Nafion
ionomer
mixed with
Hispec 1000
Nafion
ionomer
Weight loss / %
Temp / Co
Fig. 16 . TG curve for Nafion ionomer.
Typical thermal decomposition curves of Vulcan and Nafion ionomer are shown in Fig. 14. Vulcan is quite stable until 500ºC. However, Nafion is seen 3% lost weight within 100ºC, and then around 15% weight loss between 320-420ºC, which corresponding to decomposition of sulphonic group. More than 95% Nafion decompose before 500ºC. From a thermal properties point of view, Vulcan and Nafion seems of interest in two completely different regions: 100-500ºC for Nafion ionomer and 500ºC up for Vulcan. Therefore a synthetic thermal decomposition curve of Vulcan and Nafion is shown in Fig. 15 (black broken line) according to the mixing ratio.
Interestingly, TG curve of Vulcan & Nafion mixture (red line) showing two stages weight loss does not quit overlap with the synthetic curve. Decomposition of Nafion is seen about 80ºC earlier and for Vulcan 25ºC earlier. These indicate that Nafion’s and carbon’s bonding situation are different from the individual bulk materials, and the decomposition has synergetic function to both.
Lower decomposition temperature for Nafion is probably because the ionomer is more dispersed over carbon surface and less polymerization is formed. Similar situation is also observed for Nafion weight loss when the ionomer was mixed with platinum black (Hispec 1000) as shown in Fig. 16. Nafion decomposes ~120ºC lower than the bulk. Here platinum black is intact. Bad resolution of ionomer decomposition was due to low quantity of the sample. Lower decomposition temperature for Vulcan might be because that ionomer is adsorbed also in fine pore of the carbon porous structure, which better inlets the heat and stats the reaction.
When noble metal catalysts involve in the game, this tendency becomes even more prominence. As shown in Fig. 16, temperature at weight loss from decomposition of Nafion and carbon become

Final report on ‘Quantify and Improve PEM Fuel Cell Durability’ PSO FU 2007-1-7156
20 of 52
Fig. 17 . Gallery of contact angle snapshot.
5 10 15 20 25 30
120
125
130
135
140
145
150
155
160 Advancing and reducing
angle was performed at 10o
Contact angle ( o )
20%H2O2, 80
oC,37 days
Advancing
Reducing
Nomal
Original
Advancing
Reducing
Nomal
PTFE content (%)
Fig. 18 . Contact angles for GDLs before and after chemical treatment.
much less separated and both of them move to lower temperature region. For Hispec 9000 (Pt on Vulcan) and 9100, 95% weight (of Nafion & carbon) is seen lost before 450oC.
2.4 GDL
Degradation of a fuel cell can results from different factors; one of the important failure modes is the limitation of mass transport due to water management in the gas channel (Bazylak 2009). Therefore, wetting property of GDL and electrode printed on GDL is a major factor influencing the transport and accumulation of water. In this part, hydrophobicity of the GDL and electrode surface was studied after accelerated aging treatment.
2.4.1 EXPERIMENTAL
Gas diffusion layer (carbon paper), or electrodes were chemically aged by immerging in 20 wt % H2O2 solution and the system is sealed by used autoclave. Samples were heated up to 80oC.Contact angle was taken with an Olympus camera of special lens. Each time, 5 µL distilled water was carefully applied on the surface to be analysed. Then a snapshot was then taken for record. A gallery is shown in Fig. 17.

Final report on ‘Quantify and Improve PEM Fuel Cell Durability’ PSO FU 2007-1-7156
21 of 52
-5 0 5 10 15 20 25 30 35 4080
85
90
95
100 5% PTFE
10% PTFE
20% PTFE
30% PTFE
Change of contact angle / %
Time / day
Fig. 19 . Contact angle change in percentage of GDL under chemical treatment.
5 10 15 20 25 300.000
0.004
0.008
0.012
0.016
86.18%
87.33%85.45%85.43%
Weight / g/cm2
PTFE content %
Weight change
before
after
Fig. 20 . Weight loss change of GDL under chemical treatment.
2.4.2 RESULT AND DISCUSSION
Contact angle for GDL series: Gas diffusion layer (GDL) of different poly tetrafluoro ethylene (PTFE) 5, 10, 20 and 30 wt% was tested for chemical stability. Normal, advancing and reducing (20o tilt) contact angle are shown in Fig. 18. As shown in the picture, in general, advancing angle > normal angle > reducing angle; slight increase was detected with increase of PTFE content in GDL before treatment; After chemical treatment, there is a drop of contact angle in all kinds; a part from 5% PTFE GDL, other types of samples are of more or less same wetting property. Change of normal contact angle in percentage with time is shown in Fig. 19. It is between 22 and 27%.
Corresponding weight change was also measured (Fig. 20). There is a fairly good correlation between PTFE content and sample weight/m2 for both before and after the chemical treatment. There is 13-15% weight loss among the samples. Combine the knowledge of contact angle and weight loss of GDL after chemical treatment, it suggests that top micro-layer surface of GDL is most responsible for wetting properties. PTFE content does give slight difference, however not dominate. When top PTFE layer was chemically oxidized by H2O2 attacking, it depredates and probably is washed off by the solution; then a new PTFE layer was formed, therefore, there is not a very big drop in contact angle and tend to be stabilized (Fig. 19). This might also explain why the wetting properties of GDLs (10, 20 and 30% PTFE) after the treatment are similar (Fig. 18).
Electrodes with different ionomer content: Electrodes of different ionomer content (0, 10, 20, 30, 40, 50 wt %) were also tested for wetting properties (40o tilt) before and after chemical treatment (autoclave, H2O2 20%, 80ºC). The results are shown in Fig. 21.

Final report on ‘Quantify and Improve PEM Fuel Cell Durability’ PSO FU 2007-1-7156
22 of 52
0 10 20 30 40 50
40
60
80
100
120
140
Advancing and reducing
angle was performed at 40o
CV treated
Advancing
Reducing
Nomal
Contact angle ( o )
Ionomer content (%) in the electrode
Original
Advancing
Reducing
Nomal
Fig. 21 . Contact angle for electrodes with different ionomer before and after chemical treatment.
0 10 20 30 40 5050
100
150
200
250
300
350
Area density nomalized with catalyst loading
Ionomer content / %
Fresh sample
After CV treatment
80
85
90
95
100
105
110
115
Final area density relateive to fresh sample / %
Chang in percentage
Fig. 22 . Area density of the electrodes and percentage change.
For fresh sample, a contact angle maximum shows at 30% ionomer content, which indicates an optimised composition among carbon, catalyst and ionomer in the electrode.
As well know (Savadogo 1998 & Mauritz et al. 2004), Nafion polymer consists of hydrophilic sulphonic acid domain and hydrophobic –CF2– backbone. Based on the different affinity region, it is better to understand the behaviour of the contact angle dependence of ionomer content. On the electrodes without ionomer, carbon turned out having good affinity to water, and therefore, it shows low contact angle. With increasing ionomer content, more and more hydrophilic domain of the Nafion ionomer adsorbed on carbon particle surface, at the same time, the hydrophobic chains form new layer around carbons, which results to increasing contact angle. After reaching optimized composition (~30 %), second Nafion layer start to form above first layer, with hydrophobic backbone adsorbing on the first layer and hydrophilic group hanging outside, which leads to decrease contact angle. As tentatively explained above, in the vicinity of first Nafion layer saturation and beginning of the second layer, optimised electrode hydrophobicity is obtained.
After chemical treatment, there is a certain drop on contact angle of all types (reducing, normal and advancing) on all kinds of electrode regardless ionomer content. Most outstandingly, 30% ionomer electrode shows biggest drop (~27%) in normal contact angle, furthermore, normal, reducing and advancing contact angle turn out to be very close values, which also reflects increasing affinity between electrode surface and water (increasing hydrophilicity), and less influence from gravity. A snapshot of the electrode wetting property can be found from the gallery in Fig. 20. Contrast to low ionomer content electrodes, high ionomer loading sample with 40 and 50% Nafion in the electrode, there was rather small change (<10%) in wetting properties after chemical treatment. This might due to higher stability of double layer structure.

Final report on ‘Quantify and Improve PEM Fuel Cell Durability’ PSO FU 2007-1-7156
23 of 52
1 2 3 4 50
20
40
60
80
100
120
140
160
180
CV treat
one hour
80CO H 2
O 2
treat 37 days
80CO H 2
O 2
treat 23 days
80CO H 2
O 2
treat 16 days
Original
5.304.113.273.163.06
65.24
34.6942.3544.58
56.64
132.83139.85141.88142.08
156.79
See unit at legent
Contact angle (O)
Pt (atom. %)
d (nm)
Fig. 23 . Contact angle of electrode of PtRu catalyst after chemical and electrochemical treatment.
Area density normalized with catalyst loading was also studied, and the results are summarized in Fig. 22. Between 5 and 15% area density lost after the treatment. Among those, 30% electrode again, shows biggest change.
Electrode under chemical and electrochemical treatment: Electrode of PtRu catalyst was also tested for wetting properties after chemical and electrochemical treatment. The results are shown in Fig. 23. After 37 days’ chemical treatment, electrode showed up to 10% drop in contact angle, and the degree increase with time. However only after 30 min. electrochemical CV cycling, contact angle was seen decrease of 15%.
Catalyst diameter and platinum content (compare to ruthenium) was also studied via XRD. The experiment details can be found at catalyst part. As shown in the figure, after chemical treatment, catalyst diameter was seen slowly increase. At the end of 37 days, catalyst diameter was found increase 34%. At the same time, platinum content was seen decreasing down to 35%, which means that platinum dissolution/degradation carried out in a faster rate than ruthenium under such chemical aging treatment. This is a clear contrast to the result from electrochemical treatment, where platinum content in the catalyst increase, which indicates that ruthenium, is more venerable under such testing condition.

Final report on ‘Quantify and Improve PEM Fuel Cell Durability’ PSO FU 2007-1-7156
24 of 52
3. LT PEM
3.1 INTRODUCTION
The work performed include single cell LT PEM tests, single cell test in segmented cells, stack test, ex-situ component test, and post mortem analysis of MEAs. Many of the experimental results are presented in detail in separate milestone reports, cf. Table 3. The present section summarised the most important findings.
3.2 LT PEM SINGLE CELL TESTS
3.2.1 LT PEM SINGLE CELL TEST
There are an extremely large range of MEA parameters which may be investigated in order to improve the MEA and the operational parameters. The test matrix that is partly fulfilled is outlined in detail in the MS2 report. A single LT PEM test rig with 15-channels has been constructed at IRD outside the present project, but the test-rig burn-in has been done within the present project. A single cell test station has been established at SDU. The single cell test results from both places are reported below. The compiled results of the single cell tests during the test-rig burn-in are listed in Table 5. In a few cases a bend in the degradation is observed, in these cases the high end-degradation is listed. Several parameters have been investigated, but it is found that a very high degradation is seen for all samples. The high degradation can be related to electrical noise and flooding due to an un-optimised flow plate design. This has caused cell reversal in up to 5.5% of the test time, and can account for the extremely high degradation. Liquid water in the flow channels or other blockages results in starvation conditions. In the case of oxidant starvation, the protons passing through the membrane will combine, in the absence of oxygen, to form hydrogen, and the cell essentially acts as a hydrogen pump. The cathode potential drops due to the lack of oxygen and the presence of hydrogen, and the cell voltage generally drops to very low levels or may even become negative. In
Table 5 Summary of the experimental conditions and the results of the initial static-loaded ‘accelerated’ degradation experiments.
Exp no. TCell
ºC
THumid
ºC
λAir λH2 UBoL
V
I
A/cm2
Test
hours
1 65 65 4 2 0.90 0.00 800 178 506 1,011 1,5172 65 50 4 2 0.95 0.00 800 203 468 936 1,4043 65 65 4 2 0.80 0.05 420 126 635 1,270 1,9054 65 65 4 2 0.75 0.10 274 1,250 60 120 1805 65 50 4 2 0.70 0.20 902 76 921 1,842 2,7636 65 50 4 2 0.64 0.40 730 459 139 279 4187 65 65 4 2 0.64 0.40 175 2,150 30 60 898 70 65 15 2 0.52 0.40 90 1,440 36 72 1089 70 65 5 2 0.58 0.40 90 996 58 116 175
10 65 65 4 2 0.57 0.40 89 5,310 11 21 3211 65 50 5 2 0.58 0.40 105 105 552 1,105 1,65712 60 50 4 2 0.62 0.40 760 168 369 738 1,10713 70 50 4 2 0.41 0.40 142 122 336 672 1,00814 60 50 5 2 0.53 0.40 199 2,280 23 46 7015 65 65 5 2 0.50 0.40 72 1,640 30 61 9116 70 40 4 2 0.49 0.40 642 461 106 213 319
∆∆∆∆U
µV/h
Lifetime
@ 10% ∆∆∆∆U
hours
Lifetime
@ 20% ∆∆∆∆U
hours
Lifetime
@ 30% ∆∆∆∆U
hours

Final report on ‘Quantify and Improve PEM Fuel Cell Durability’ PSO FU 2007-1-7156
25 of 52
Fig. 24 Single cell LT PEM MEA degradation due to cyclic operation. The sample was exposed to 60 full cycles per hour (30 s OCV/30 s @ 0.4 A/cm2). The gas flow is kept constant corresponding to λH2=2 & λO2 in air= 4 at I=0.4 A/cm2. The reactant gases are fully humidified at the cell temperature (65ºC).
the case of fuel starvation, if hydrogen is no longer available to be oxidized, the anode potential will rise to that required to oxidize water, assuming water is available, resulting in the evolution of oxygen and protons at the anode, according to:
[1] H2O → ½ O2 + 2H+ + 2e−
The protons will pass through the membrane and combine with oxygen at the cathode in the normal reduction reaction to produce water (reverse of reaction [1]). The applied electrodes in the IRD LT PEM MEA are based on Pt- (cathode) and Pt/Ru-catalysts (anode) supported on carbon particles. These types of anodes are prone to degradation during fuel starvation due to the oxidation of carbon, which is catalysed by the presence of Pt. This reaction proceeds at an appreciable rate at the electrode potentials required to electrolyse water in the presence of platinum (greater than approximately 1.4 V).
[2] C + 2H2O → CO2 + 4H+ + 4e−
The catalyst support is converted to CO2, and Pt and/or Ru particles may loose the electronic contact to the electrode, resulting in loss of performance. Carbon corrosion due to anode flooding has been verified by cyclic voltametric characterisation.
The present status of the 15-channel test-rig is that the electrical noise has been eliminated and a new improved graphite flow plate has been designed and experimentally verified. An example of a single cell test after these improvements has been implemented is shown in Fig. 24 where a sample has been exposed to more than 10,000 load cycles. The degradation observed in this accelerated ‘catalyst’ test show the fast growth of the catalyst nano-particles due to Oswald ripening during potential sweep (cf MS7 & MS11 report). The catalyst growth is not linear and will decline with time. The cyclic experiment has a high relevance for the lifetime of LT PEM in many applications e.g. CHP’s operated as a VPP (Virtual Power Plant). The observed of 13 µV per cycle allows >5,250 cycles before a 10% voltage decrease is reached, if the degradation is restricted solely to the cyclic operation. These findings are very well in line with the worldwide state-of-the-art on the LT PEM technology4.
The rates of hydrogen and air crossover to opposite sides of the membrane have been proved to increase relatively slowly and to result in only a 1–3% loss in FC efficiency. More severely are the
4 E.g. The IRD Canadian competitor: http://www.ballard.com/files/pdf/Spec_Sheets/FCgen-1030V3_SPC5102414-0D.pdf

Final report on ‘Quantify and Improve PEM Fuel Cell Durability’ PSO FU 2007-1-7156
26 of 52
Fig. 25 Fluoride released from single cell cathode.
Table 6 Corresponding groups and chemical shifts of Nafion (Schlick et al. 1991)
Item A B C D
Formula � � � � � � �� � �
� � � centre 6
� � � sides
� � � � � � �� � � δ / ppm 85.09 122.66 127.18 149.69
chemical reaction on the anode and cathode catalysts that can produce peroxide (HO•) and hydroperoxide (HOO•) radicals, which are responsible for chemical attack on the membrane and catalysts. The generation of these radicals as well as the chemical degradation of the membrane is accelerated when the fuel cell is operated under OCV and low humidity conditions. Several mechanisms have been proposed, with conflicting views on whether the radicals are formed at the anode, at the cathode, or on both sides of the membrane. The presence of foreign cationic ions can significantly decrease cell performance by adsorbing on the membrane or catalysts. Possible sources of multivalent ion contaminants include corrosion of stack components and impurities in the air and/or fuel stream, humidifier reservoirs, etc. Many cations show stronger affinity than H+ with the sulfonic acid group in PFSA membranes. More active sites will be occupied by multivalent ions when the fuel cell is in operation, and, as a consequence, the membrane bulk properties, such as membrane ionic conductivity, water content, and H+ transference numbers, will change proportionally to the cation accumulated. This effect is not normally serious unless the contamination concentration goes beyond 50% of sulfonic acid groups in the membrane. The second possible mode of membrane deterioration due to contaminant ions comes from the altered water flux inside the membrane, and in this case, only 5% contaminant is sufficient. The displacement of H+ with foreign cations also results in attenuated water flux and proton conductivity, and leads to much faster or more extensive membrane dehydration. Contamination by trace metal ions originating from the corrosion of metal bipolar plates or end plates, such as Fe2+ and Cu2+, can strongly accelerate membrane thinning and performance decay of a PEM fuel cell by catalyzing the radicals formation reactions.
Exhaust water from single cell cathode (operate at 0.4 A/cm2) was collected and concentrated at 75ºC. A 20 times concentrated 600 µL sample was examined with 19F-NMR. 1024 scans were applied for the measurement and the data treatment was assisted by MestReNova. Spectra of reference material and sample are show in Fig. 25. Structure of reference Nafion and corresponding

Final report on ‘Quantify and Improve PEM Fuel Cell Durability’ PSO FU 2007-1-7156
27 of 52
A C.
B D.
Fig. 26 Snapshots of segmented single cell.
0 20 40 60 80 100
0.00
0.02
0.04
0.06
0.08
0.10
0.12
Current / A
Time / s
S1 S2
S3 S4
S5 S6
S7 S8
S9
Fig. 27 Current distribution on the segmented cell. Segment numbers are indicated in Fig. 26A.
chemical shift are listed in Table 6. In the exhaust water sample after concentration, a single peak corresponding to centre carbon fluoride backbone was detected.
3.3 LT PEM SEGMENTED CELLS
A segmented cell with nine (9) segments aimed for LT PEM and DMFC single cell experiments has been developed, Fig. 26. The current distribution among individual segments of the single cell was collected during polarization (gradual increase of current draw) measurement, Fig. 27. One set of data was also plotted according to the segments, as shown in Fig. 28. There is an obvious current distribution preference. Each segment demonstrates different ability in conducting electrochemical reaction. Gas inlet shows the highest the current load, which might be due to the high reactant abundance and less influence from mass limitation.

Final report on ‘Quantify and Improve PEM Fuel Cell Durability’ PSO FU 2007-1-7156
28 of 52
01
23
0.04
0.05
0.06
0.07
0.08
0
1
2
6Segmented Cell
98
7
54
3 21
Current distribution / A
Fig. 28
Current distribution among segments.
3.4 LT PEM STACK TESTS
A 47-cell LT PEM stack in the design developed within the recently terminated PSO-project (FU2005-2-6333) was chosen for the long-term test. The stack design allows both pure hydrogen and reformats operation at ambient pressure, and is similar to the stack used in the Danish µCHP demonstration project. It has been chosen to operate the stack with pure hydrogen in the present experiment.
The LT PEM stack was tested for ≈1,700 hours under conditions relevant for hydrogen fuelled dead-end systems (the test is described in more detail within the MS10 report). The stack was equipped with reinforced standard IRD MEAs. The average MEA degradation observed is 40 µV/h. This is a factor of four times higher than recorder in open-end systems outside the present project. The reason for the high degradation rate awaits post mortem analysis of the MEAs, but the indication is that a low hydrogen pressure (≈450 mbar applied) facilitates local carbon corrosion and thereby loss of catalyst. There are several ways to improve the MEA design to minimise this corrosion should the post mortem analysis support the hypothesis of carbon corrosion. The reinforcement of the MEAs showed encouraging durability. The presented stack test has in many ways contributed to a better understanding of the factors influencing the MEA durability in dead-end hydrogen fuelled systems.
3.5 BOP/STACK COMPONENT TEST
The performed ex- and in-situ bipolar plate test includes: a) Element leakages; b) Changes in water management capability; and c) Short stack test with aged bipolar plates.
Ad A. Leachate analyses of compression moulded graphite-composite bipolar plates (BPP) has been carried out in dilute methanol solution (2.0 M and pH=3 adjusted by adding formic acid) at 98ºC for 1,000 h. The weight gain or loss remained below 0.1 wt% for the material. Analysis of the aging solutions revealed leakage of only Ca5 in trace amounts. This is not considered to seriously influence the lifetime of LT PEM nor DMFC.
5 Contaminat level of other elements analysed for are as follows: 1 ppm Na, 0.5 pp S, 6 ppm Cl, 29 ppm Ca, 0.38 ppm B, and 0.06 ppm Li

Final report on ‘Quantify and Improve PEM Fuel Cell Durability’ PSO FU 2007-1-7156
29 of 52
Area not exposed to water during normal
operation
Blank area underneath gasket (anode cooling
side)
Anode diffuser
Cathode diffuser
+ Increasing H2O
exposure/ wear
Cooling Area
Fig. 29 Examples of surface water-wetting on different parts of used graphite-polymer bipolar plate (state-of-the-art bipolar plate at IRD). The plates have been situated in a LT PEM stack that has been tested for ≈4,000 hours.
Fig. 30 TEM cross-section of a MEA that after ≈4,000 test hours were exposed to fuel starvation due to anode flooding with dissolution of Ru as a result (a Ru band is observed within the membrane around mark d-e).
Ad B. A systematic investigation of graphite based bipolar plates aimed for LT PEM & DMFC, as well as the plates aimed for HT PEM has been initiated. The background for this investigation is the observation of increasingly problems with water management in long term tests of LT PEM. These management problems are normally related to loss of hydrophobicity in the electrodes and the GDL, but our experiments has shown that the bipolar plates also losses hydrophobicity (Fig. 29). The hydrophilic development of the BPP surface was proven to be accelerated by methanol and sulfuric acid e.g. from membrane degradation.

Final report on ‘Quantify and Improve PEM Fuel Cell Durability’ PSO FU 2007-1-7156
30 of 52
0.0
2.5
5.0
7.5
10.0
0 1,000 2,000 3,000 4,000 5,000
Test hours
Cata
lyst
cry
stall
ite
size
[n
m]
Cathode Pt-catalyst size (image analysis)Initial cathode Pt-catalyst crystallite size (XRD; supplier)Initial anode Pt/Ru-catalyst crystallite size (XRD; supplier)Anode Pt/Ru-catalyst size (image analysis)
Fig. 31
Catalyst coarsening detected by XRD and/or image analysis of TEM pictures.
0
25
50
75
0.0 2.5 5.0 7.5 10.0 12.5
Cathode catalyst diameter [nm]
Freq
uen
cy [
%]
Fresh cathode catalyst
2,351 h
4,047 h
A.
0
25
50
75
0.0 2.5 5.0 7.5 10.0 12.5
Anode catalyst diameter [nm]
Freq
uen
cy [
%]
Fresh Anode catalyst
2,357 h
4,047 h
B.
Fig. 32 Catalyst particle size distribution measured from image analysis of TEM pictures (A: Cathode catalyst particles & B: Anode catalyst particles).
Ad B. The results the 10-cell stack constructed with fresh LT PEM MEAs and bipolar plates aged for 1,000 hours in sulphuric acid (pH 1) show beginning water management problems at low load (<0.14 A/cm2) due to the changes of the BPPS surface properties.
3.6 POST MORTEM OF LT PEM MEAS
Long-term tested (cf. Table 1) and one ‘virgin’ LT PEM MEAs have been characterised with respect to SEM, TEM, EDS, and XRD. The tested MEAs both represents failed MEAs that during the test developed crossover and well-functioning MEAs. The Post Mortem analysis has lead to the following main conclusions:
• No significant membrane/Nafion thinning has been observed after 4,000 test hours (Fig. 30)
• Catalyst bands, rich in Ru, are observed within the membrane (position d-e in Fig. 30) probably due to fuel starvation as a consequence of water management difficulties
• Significant catalyst particle coursing occurs upon test (Fig. 31)
• Broad (bimodal) catalyst particle size distributions develops with time (Fig. 32)
• Electrode densification occurs with time increasing the water management challenge
These findings are well in-line with literature. The catalyst coarsening observed after ≈4,000 hours of operation correspond to a loss of catalytic active area of 58% for the anode and 69% for the

Final report on ‘Quantify and Improve PEM Fuel Cell Durability’ PSO FU 2007-1-7156
31 of 52
cathode respectively, and the MEA can be expected to perform equivalent to MEAs with less than half the catalyst coating. The catalyst coarsening is mainly due to voltage sweep in transient from loaded operation to OCV condition (cf. section 2 and MS7/MS11 report). Work within the present project has proven that a high potential is not harmful in it-self because the platinum surface is protected by an oxide layer. If, however, the oxide is reduced by potential cycling, platinum ions may be released into the electrolyte, in particular if complexing ions are present.

Final report on ‘Quantify and Improve PEM Fuel Cell Durability’ PSO FU 2007-1-7156
32 of 52
4. DMFC
4.1 INTRODUCTION
The work on the DMFC technology performed within the present project include single cell and stack test, as well as post mortem analysis of DMFC MEAs. Many of the experimental results are presented in separate milestone reports, cf. Table 3. The ex- and in-situ bipolar plate tests discussed in section 3.5 covers both the LT PEM and the DMFC technology, and will not be further discussed in the present section. Below are presented the most important results.
4.2 DMFC SINGLE CELL TESTS
Very limited lifetime test data and no accelerated stress testing protocols specific for DMFC were available at the project start. Two different test protocols carried out under conditions slightly more extreme (continuous steady-state operating and load cycling) than foreseen normal operating conditions were applied in the single DMFC cell-tests (Fig. 33). Data are acquired at constant 200 mA/cm2, load cycles were completed every 50 h’s and every 1 min respectively. They consisted of a 60 s or 15 s hold at OCV and break in air supply (Fig. 33). During the life test in addition to measure the cell voltage, the High Frequency Resistance (HFR) and Open Cell Voltage (OCV) is monitored.
The MEAs under test are based on three different types of electrolyte membrane, i.e. Nafion and two types of Hydro Carbon (HC) membrane (Table 7). The degradation results is summarised in Table 8. As for the Nafion based MEAs, performance losses incurred by the cell during the steady-
Test Protocol 01 Test Protocol 02
• Constant Current Density = 200 mA/cm2 steady-state
• OCV for 60 s every 50 hours
• Cathode Humidifier Temp. = Ambient (set to bypass)
• Cell Temp. = 75°C
• Anode MeOH concentration = 1.0 M
• Anode stoich. = 4.0
• Cathode Stoich. = 3.0
• Monitor cell V as a function of time
• Monitor HFR as a function of time
• Constant Current Density = 200 mA/cm2 steady-state
• OCV for 15 s after every 60 s
• Cathode Humidifier Temp. = Ambient (set to bypass)
• Cell Temp. = 75°C
• Anode MeOH concentration = 0.5 M
• Anode stoich. = 3.0
• Cathode Stoich. = 2.5
• Monitor cell V as a function of time
• Monitor HFR as a function of time
0.00
0.05
0.10
0.15
0.20
0.25
0.30
0 50 100 150 200 250
Time [sec ]
0
0.5
1
1.5
2
2.5
3
Current Density
Air flow
Methanol flow
0.00
0.05
0.10
0.15
0.20
0.25
0 200 400 600 800 1000 1200
Time [Hours]
Current Density [mA/cm2]
Current Density
Intermediant Characterization
Fig. 33 Test protocols (operating conditions) used for the DMFC single-cell test.

Final report on ‘Quantify and Improve PEM Fuel Cell Durability’ PSO FU 2007-1-7156
33 of 52
Table 7 DMFC MEA configurations and test protocol. Design 01 and Design 02 has different GDLs; while design 02 and 03 has equivalent GDLs.
MEA design Test Protocol MEA ID Anode loading
mg PtRu per cm2
Membrane Catode loading
mg Pt per cm2
01 W37A091009C 1.91 Nafion 115CS 1.24
01 W50A092409C 1.91 HC-1 1.24
02 W50A092409F 1.91 HC-1 1.24
02 W05A120209A 1.96 Nafion 115CS 1.26
01 W33A033010B 1.86 HC-1 1.34
02 W33A033010A 1.86 HC-1 1.34
02 W32A033010A 1.86 HC-2 1.34
Design 03 01 W44A120209C 3.69 Nafion 115CS 1.61
Des
ign
01D
esig
n 02
Table 8 Summary of single cell DMFC degradation results.
MEA design Membrane Test Protocol
Test hours
Reversible and irreversible degradation
µV/h
Irreversible degradation
µV/hDesign 01 N115 1 2,115 31.7 7.1Design 02 N115 2 3,334 19.5 20.2Design 03 N115 1 3,275 12.5 9.8Design 01 HC1 1 1,030 36.6 14.3Design 01 HC1 2 1,015 40.8 50.8Design 02 HC1 1 750 32.2 n.a. (positive slope)Design 02 HC1 2 765 54.7 n.a. (positive slope)Design 02 HC2 2 700 0 n.a. (positive slope)
0.000
0.100
0.200
0.300
0.400
0.500
0.600
0.700
0.800
0.900
0.000 0.100 0.200 0.300 0.400 0.500 0.600
Current Density [A/cm2]
Cel
l V
olt
ag
e [
V]
BoL
250
500
750
1000
1250
1500
1750
2000
Fig. 34
An example of a DMFC single cell IV characterisation. The DMFC MEA shown has Design 01, and a Nafion 115CS membrane.
state operation were recovered, fully or in part after OCV hold and break in steady-state-mode for the intermittent test performed every 250 hours. For all three MEA based on MEA Design 2 the slope taken from the recoverable cell voltage part show no decline so far. However, the MEAs test in all cases <1000 hours. The MEA design using the HC2 membrane show no degradation within

Final report on ‘Quantify and Improve PEM Fuel Cell Durability’ PSO FU 2007-1-7156
34 of 52
Fig. 35 An example of a DMFC stack test (right), and the corresponding continuous calculation of decay rate and lifetime to the left.
the first 700 hours of operation. The high frequency resistance is also very stable, no indication of membrane degradation or of interfacial contact between catalyst layer and membrane for the first 1,000 hours of test. During the steady-state life-test, DMFC IV-performance was measured every 250 hours (Fig. 34). The cell degradation rate calculated from the I–V curves as well as from the voltage just after intermittent characterization test is in all cases lower than the overall degradation rate from the durability test and closer to the so called permanent degradation rates (irreversible loss).
No clear difference between cells tested by two outlined test-protocols has been noted. However, the results of the DMFC single cell tests are very encouraging particular the high-loaded Nafion-based MEA with degradation ranges in the same order of magnitude as LT PEM; and the DMFC MEA based on the HC2 membrane that showed no recordable degradation within the 700 test hours. The national Danish road map lifetime targets for single DMFC cells are 2,000 hours in year 2009 and 2,500 hours in year 2010. These lifetime targets allow degradation rate of up to ≈22 µV/h and ≈17 µV/h, respectively (cf. Fig. 1). The targets are met for at least two DMFC MEA types when both the reversible and the irreversible degradation is taken into account.
4.3 DMFC STACK TESTS
Life tests of small stacks are carried out using operating conditions relevant for battery charging applications. The experimental conditions are as follows: Constant Power (BoL: 0.155 A/cm2 @ 0.45 V); Temperature: 70°C; Fuel: 0.5 M CH3OH [λCH3OH = 3.0], and Oxidant: Air [λO2 in air = 2.5]. An example of a DMFC stack test is shown in Fig. 35. Four (4) DMFC stacks equipped with MEAs in ‘Design 02’ (Table 7) have been tested for more than 1,000 hours (up to 3,300 hours). Different bipolar plate materials have been investigated. Cell voltage degradation rate between 47 and 80 µV/h have been recorded (reversible and irreversible degradation). The reversible and the irreversible degradations have not been separated. The individual cells within the stacks show slightly higher degradation rates than observed in the single cell test, this is expected. The national Danish road map lifetime targets for DMFC stacks are 1,000 hours in year 2009 and 2,000 hours in year 2010. These lifetime targets allow degradation rate of up to ≈45 µV/h in year 2009 and ≈22 µV/h inyear 2010 (cf. Fig. 1). The targets are met for year 2009, but not for year 2010. However, the improved MEAs from the single cell test have not been included in the presented stack test within the present project, but will be included in stack test in the phase 2 continuation of the present project. It is therefore believed that further improvements according to the national road maps will be achieved.

Final report on ‘Quantify and Improve PEM Fuel Cell Durability’ PSO FU 2007-1-7156
35 of 52
Fresh sample with Nafion 115CS membrane Sample test for 1,400 h’s (Nafion 115CS membrane)
Fresh sample with HC1 membrane Sample tested for 1,000 hours (HC1 membrane)
Fig. 36 SEM pictures of cross-section of fresh (to the right) and tested DMFC samples (to the left).
4.4 POST MORTEM OF DMFC MEAS
Long-term tested DMFC MEAs form the single-cell testing and stack testing and ‘virgin’ (BoL) MEAs have been characterised with respect to SEM, ICP, EDS, and XRD.
The post mortem analysis proved that the membrane thinning due to operation (up to 1,400 hours) is insignificant (Fig. 36), but electrode densification occurs. The latter is difficult to quantify. Furthermore, the catalyst growth of the Johnsson Matthey catalysts were equivalent to the growth observed for the LT PEM catalysts (cf. Fig. 32), while the Cabot anode catalysts showed insignificant growth over the first 3,000 hours and the Cabot cathode catalyst particles grow equivalent to the Johnsson Matthey cathode catalyst crystallites.

Final report on ‘Quantify and Improve PEM Fuel Cell Durability’ PSO FU 2007-1-7156
36 of 52
5. HT PEM
5.1 INTRODUCTION
The durability of PEM FCs has been recognized as one of the most important issues to be addressed before the commercialization of the PEM FCs (Xie et al. 2005; Yasuda et al. 2006; Knights et al. 2004; Stevens & Dahn 2005 & Taniguchi et al. 2004), with a lifetime of 40,000 hours for stationary uses and 5,000 hours for automobile uses. The most significant challenges reasons for HT-PEMFC based on PBI membranes include loss of the doping acid, oxidative degradation of the polymer, mechanical deterioration of the membrane, corrosion of carbon support and the triggered catalyst sintering, dissolution and precipitation of noble metals, as well as other materials issues such as the gas diffusion layers (GDL), bipolar plates and seals.
Through this project, the DTU group has investigated some of these key issues including polymer and membrane degradation, acid leach-out, carbon support corrosion, catalyst sintering, etc. Single cell tests were conducted under both steady state and dynamic modes of operation. In addition an accelerated durability test with potential cycling was performed with focus of catalyst degradation and carbon support improvement. The knowledge on HT-PEMFC degradation was quite limited in the research group so in parallel to the experimental work an extended literaure study was conducted. This report summarizes the results.
5.2 DURABILITY ISSUES OF HT-PEMFC
5.2.1. POLYMER DEGRADATION
Under fuel cell operation conditions, the degradation of a polymer membrane may occur via different mechanisms. Mechanical stress would cause membrane creep and tearing. Swelling and shrinking under the load cycling when the rate of water formation is varied lead to crack and pinhole formation. Most importantly, thermal and oxidative attack degrades the polymer resulting in increased reactant crossover, decreased open circuit voltage and eventual collapse of the membrane and MEA.
THERMAL DEGRADATION
An early study by Gaudiana & Conley (1969) showed that the weakest part of the PBI in an oxidative atmosphere is the benzenoid rings bearing the nitrogen function and the amine portion of the molecule. The rupture of the bulk polymer backbone happens through the carbon in the imidazole ring linked with the phenylene group towards the amine nitrogen (–NH–).An FTIR study on the thermo-oxidative degradation of PBI in air at 350°C revealed two new adsorption peaks, indicating the stretching vibrations of product or intermediate of the polymer oxidative degradation. It seems that the oxidative attack resulted in the cleavage of imidazole rings and eventually led to the formation of aromatic nitrile groups. Under simulated fuel cell conditions, FBI samples doped with phosphoric acid showed no further weight loss but the desorption of water below 400°C.
OXIDATIVE DEGRADATION
Under fuel cell conditions, oxidative radicals are believed to involve due to the oxygen diffusion through the membrane and incomplete reduction at the fuel cell anode:
O2 (diffusion to anode) + Pt-H (anode) → •OOH
Pt-H + •OOH → H2O2
The peroxide radicals such as HO���� and HO2� attack the hydrogen-containing bonds in polymer membranes, which can be a principal degradation mechanism of membranes (Panchenko et al. 2004
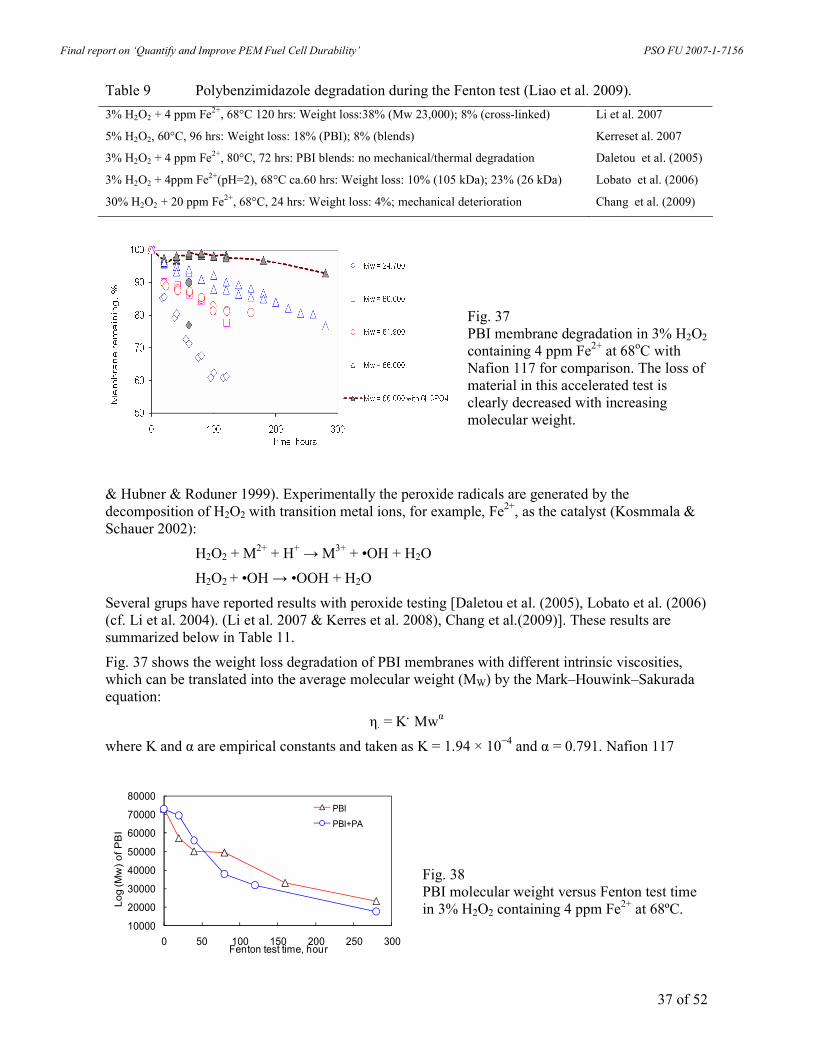
Final report on ‘Quantify and Improve PEM Fuel Cell Durability’ PSO FU 2007-1-7156
37 of 52
Table 9 Polybenzimidazole degradation during the Fenton test (Liao et al. 2009).
3% H2O2 + 4 ppm Fe2+, 68°C 120 hrs: Weight loss:38% (Mw 23,000); 8% (cross-linked) Li et al. 2007
5% H2O2, 60°C, 96 hrs: Weight loss: 18% (PBI); 8% (blends) Kerreset al. 2007
3% H2O2 + 4 ppm Fe2+, 80°C, 72 hrs: PBI blends: no mechanical/thermal degradation Daletou et al. (2005)
3% H2O2 + 4ppm Fe2+(pH=2), 68°C ca.60 hrs: Weight loss: 10% (105 kDa); 23% (26 kDa) Lobato et al. (2006)
30% H2O2 + 20 ppm Fe2+, 68°C, 24 hrs: Weight loss: 4%; mechanical deterioration Chang et al. (2009)
Fig. 37 PBI membrane degradation in 3% H2O2 containing 4 ppm Fe2+ at 68oC with Nafion 117 for comparison. The loss of material in this accelerated test is clearly decreased with increasing molecular weight.
& Hubner & Roduner 1999). Experimentally the peroxide radicals are generated by the decomposition of H2O2 with transition metal ions, for example, Fe2+, as the catalyst (Kosmmala & Schauer 2002):
H2O2 + M2+ + H+ → M3+ + •OH + H2O
H2O2 + •OH → •OOH + H2O
Several grups have reported results with peroxide testing [Daletou et al. (2005), Lobato et al. (2006) (cf. Li et al. 2004). (Li et al. 2007 & Kerres et al. 2008), Chang et al.(2009)]. These results are summarized below in Table 11.
Fig. 37 shows the weight loss degradation of PBI membranes with different intrinsic viscosities, which can be translated into the average molecular weight (MW) by the Mark–Houwink–Sakurada equation:
η. = K. Mwα
where K and α are empirical constants and taken as K = 1.94 × 10⁻⁴ and α = 0.791. Nafion 117
10000
20000
30000
40000
50000
60000
70000
80000
0 50 100 150 200 250 300
Log (Mw) of PBI
Fenton test time, hour
PBI
PBI+PA
Fig. 38 PBI molecular weight versus Fenton test time in 3% H2O2 containing 4 ppm Fe2+ at 68ºC.

Final report on ‘Quantify and Improve PEM Fuel Cell Durability’ PSO FU 2007-1-7156
38 of 52
50
60
70
80
90
100
0 20 40 60 80 100 120 140Time, h
Remaining weight, %
Nafion 117
Linear PBI
Covalently cross-linked PBI
Ionically cross-linked PBI
Fig. 39 Membrane degradation in 3% H2O2 containing 4 ppm Fe2+ at 68°C. Solid lines indicate that the samples remained as a whole membrane, whereas dashed lines indicate that samples were broken into small pieces. Covalently or ionically cross-linked membranes show stabilities comparable to Nafion.
membranes showed about 4% weight loss after 120 hours of the Fenton test, while PBI membranes exhibited a weight loss ranging from 10 to 40% for the polymer molecular weight from 70,000 down to 25,000 g/mol.
A size exclusion chromatographic (SEC) analysis on the PBI membranes before and after the Fenton test showed a shift in the molecular weight distribution (MWD) curves, i.e. the decrease in the polymer molecular weight (Li et al. in prep.). A monomodal molecular weight distribution in the PBI MWD curves suggesting an endpoint scission mechanism of the macromolecular degradation, in good agreement with the weight loss dependence on the polymer molecular weight (up.cit.). There are two types of terminal groups along the macromolecular chains, amine and carbonyl groups. It seems that the carbonyl groups would be oxidized to release CO2, so does the terminal benzyl groups, until the formation of the amine terminal groups and then nitric oxides.
NH
N
N
NH
n
C
OH
O
NH
N
N
NH
n-1
NH
N
N
NH
OH
+ CO2
NH
N
N
NH
n-1
NH
N
OHN
NH
+ 6 CO2
NH
N
N
NH
n-1
NH2
NH2
N
NH
NH
N
N
NH
n-1
NO
NO
N
NH
At the same time the peroxide radicals attack the main chain of the polymer, resulting in formation of C-OH, C-OOH or C=O groups. A model for the chemical oxidation mechanism is in progress
EFFECT OF PHOSPHORIC ACID
Most of the Fenton tests on PBI degradation were made on the pristine polybenzimidazoles with out taking into account of the effect of phosphoric acid, which always is present in the acid doped membranes in fuel cells. It is well known that decomposition of hydrogen peroxide can be depressed, in general, at low temperatures, low pH values and low contaminations. Phosphoric acid is a typically stabilizer to increase the acidity as well as the buffering capacity of the hydrogen

Final report on ‘Quantify and Improve PEM Fuel Cell Durability’ PSO FU 2007-1-7156
39 of 52
peroxide solution. In the presence of heavy metal ions, numerous types of organo phosphoric acids or salts are among the most widely used stabilizers, as described in a large number of patents6.
POLYMER MODIFICATION AND CROSS-LINKING
By synthetically introducing other heteroatoms or heterogroups such as -O-, -SO2-, C(CF3)2- into the macromolecular chain, we found significant improvement in the polymer stability against the oxidative degradation. Further cross-linking of these modified PBI´s with an acidic polymers in form of acid-base blends gives membranes as stable as perfluorinated polymers in the Fenton tests. These new polymer membranes have not been evaluated under fuel cell conditions.
5.2.2. ACID LOSS
Acid loss has been a critical concern for acid doped PBI membranes. This is understandable because the acid is not strongly bonded to the polymer structure like sulfonic acid in e.g. Nafion. There has been, in fact, an argument on if the acid doped PBI membrane is different from the cells using a matrix-plus-electrolyte configuration, e.g. phosphoric acid fuel cells. This is, in fact, a general issue for proton exchange membranes, which usually are soaked in acids before use. A slight amount of chemical degradation of the membrane electrolyte would form water soluble, low molecular weight sulphonic acids. In addition, the membrane is only functional under fully hydration most likely with a local liquid phase around the terminal acid groups. In this context, a solid dry membrane with no unbound free, liquid electrolyte has never existed.
Fig. 40 Boiling point and the vapour composition over the boiling phosphoric acid at different concentrations (Brown & Whitt 1952).
Table 10 Acid loss data from PBI cells by different groups (Jensen et al. 2009).
Direct cast m-PBI membrane, 160oC: Total acid loss: 0.6 µg m-2 s-1
Staudt et al. (2006)
ABPBI, 160ºC, 0.2 Acm-2, 1000 h: Cathodic acid loss: 0.2 µg m-2s-1
Anodic acid loss: initial 0.2 µg m-2s-1, nothing after 600 hours
Wannek et al. (2008)
Direct cast 2OH-PBI: 160ºC, 0.2 Acm-2, 2000 h: Cathodic acid loss: 0.02 µg m-2s-1 Anodic acid loss: 0.004 µg m-2s-1 190ºC, 0.2 Acm-2, 800 h: Cathodic acid loss: 0.22 µg m-2s-1 Anodic acid loss: 0.004 µg m-2s-1
Mader et al. (2008)
6 see N.D.F. Cheshire and G.W.M. Merseyside, USP 5,130,053 (1992)

Final report on ‘Quantify and Improve PEM Fuel Cell Durability’ PSO FU 2007-1-7156
40 of 52
Table 11 The cathodic platinum losses by dissolution in the phosphoric acid both from the PBI membrane and catalyst layer based on the solubility data obtained in concentrated phosphoric acid at different potentials at 176°C.
Cathodic platinum losses
PBI-6PA PBI-15PA
Cathodic potential
(V vs, RHE)
µg/cm² % of 0.5 mg/cm² µg/cm² % of 0.5 mg/cm²
0.8 0.25 0.05 0.61 0.12
0.85 1.16 0.23 2.85 0.57
0.9 9.10 1.82 22.41 4.48
0.95 124.11 24.82 305.60 61.12
In case of acid doped PBI membranes the acid management, fortunately, does not seem necessary. As long as such a fuel cell operates at temperatures above 100ºC when the formation of liquid water is avoided, the major mechanism of the acid loss seems to be via evaporation of the acid. The vapour pressure of phosphoric acid was measured (Brown & Whitt 1952). Acis loss measurements from different groups are listed in Table 10.
Acid loss may occur through different mechanisms such as diffusion, capillary transport, membrane compression, evaporation, and especially, leaching by condensed water during shutdown and cold start. From the possible acid loss mechanisms, Staudt et al. (2006) estimated that, at a rate of 0.6 µg m-2 sec-1 at 160oC, a full size 5 kW stack containing 2,100 g of acid will be sufficient for 40,000 hours of operation.
At this rate it is predicted that a few percents of the total acid content would be lost after 40,000 or five years of operation. Of course the diffusion or capillary transportation of the acid from the membrane to the catalyst layer or gas diffusion layer, without eventual acid loss out of the cell, would also be responsible for a fuel cell performance degradation, which has so far not been investigated in details.
5.2.3. CATALYST DEGRADATION
It is believed that degradation of carbon supported platinum (or platinum alloys) catalysts is the major failure mode for fuel cell as recently reviewed Mathias et al. (2005), Ferreira et al. (2005), Yu et al. (2007) & Antolini et al. (2006). Platinum particle agglomeration triggered by corrosion of the carbon support. Platinum dissolution and redeposition as a nanoscale Ostwald-ripening process. Smaller platinum particles dissolve in the ionomer phase and redeposit on larger platinum particles that are separated by a few nanometers. Coalescence of platinum nanoparticles via nanocrystallite
Fig. 41 Equilibrium concentrations of dissolved platinum in phosphoric acid and perchloric acid as a function of potential.

Final report on ‘Quantify and Improve PEM Fuel Cell Durability’ PSO FU 2007-1-7156
41 of 52
Fig. 42 Corrosion current of Vulcan XC-72 and E350G carbon blacks at different potentials in hot phosphoric acid. [AA] – measurements by this project; [BB] by Landsman DA and Luczak FJ, in Hnadbook of Fuel Cells, Vielstich W et al (eds), vol 4, pp 811-831, John Wiley (2003)
migration on the carbon support. This is a micrometer-scale diffusion process, where dissolved platinum ions diffuse towards anode and are reduced in regions of low potential.
PLATINUM DISSOLUTION AND PRECIPITATION
The Pourbaix diagram for platinum shows that in the region of 1-1.2 V vs RHE and pH 0-2 platinum will corrode (Pourbaix 1974). The fuel cell operation also occurs within this region, therefore, the platinum catalysts used is thermodynamically unstable. An earlier effort was made to determine the platinum dissolution in concentrated phosphoric acid under nitrogen atmosphere in a potential range from 0.8 to 0.95 V versus RHE at temperatures of 176 and 196°C (Bindra et al. 1979). A recent study was conducted in perchloric acid to mimic the acidity of perfluorosulfonic acid membrane electrolyte (Wang et al.), where dramatic increases in the dissolved platinum concentration with potential were also observed, as shown in Fig. 41. Other parameters that increase the platinum solubility include high acidity, oxidative atmosphere and temperature (Mitsushima et al. 2008). By using the solubility data in 96% phosphoric acid at 176°C and the acid content in both the PBI membrane and the catalyst layer, a calculation was made to estimate the platinum loss per unit of the cathode by dissolution, as listed in Table 12. Two types of acid doped PBI membranes were considered with an acid doping level of 6 and 15 mol H3PO4 per repeat unit of the polymer, respectively. At a typical platinum loading of 0.5 mg/cm², the corresponding percentage of the metal loss can be as high as 25 to 61% at the open circuit potential (0.95 V). Under a typical operating cell voltage (<0.8 V), the platinum loss by the acid dissolution is negligible (less than 0.1%).
Honji et al. (1988) measured the dissolution from Pt supported on acetylene black after 100 hours in hot phosphoric acid and showed a rapid increase at potentials higher than about 0.8 V. A direct observation was made by an electron probe microanalysis (Aragane et al. 1988) on changes of Pt distribution in the cross section of PAFC after different operating times at 190°C. At an open circuit potential of ca. 1.0 V, almost all the Pt from the cathode dissolved within 1,500 hours, whereas at 0.7 V little Pt dissolution was observed. This cell voltage is sufficiently cathodic to minimize the Pt dissolution. As the authors appointed out, the cell had an OCV for about 5 min twice a week during operation and these high potential excursions were the cause to the significant Pt dissolution. The conclusions made By Ross (1985) on PAFC might be correct to the PBI cells as well that the rate of Pt loss at potentials of lower than 0.75 V by dissolution and diffusion to the anode was not sufficient to significantly reduce the Pt loading at the cathode, however, at typical OCV (above 0.9 V) the high Pt solubility may result in a 50% Pt loss from the cathode in about 40 hours.
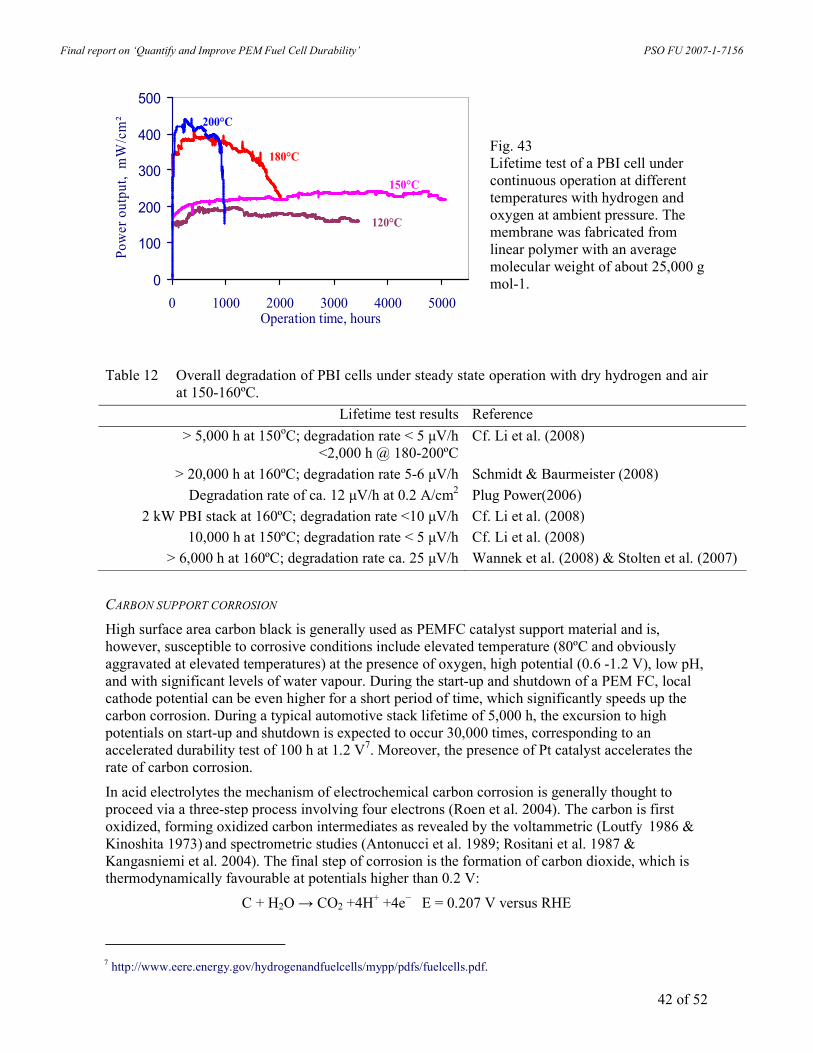
Final report on ‘Quantify and Improve PEM Fuel Cell Durability’ PSO FU 2007-1-7156
42 of 52
0
100
200
300
400
500
0 1000 2000 3000 4000 5000Operation time, hours
Pow
er o
utpu
t, m
W/c
m² 200°C
120°C
150°C
180°C
Fig. 43 Lifetime test of a PBI cell under continuous operation at different temperatures with hydrogen and oxygen at ambient pressure. The membrane was fabricated from linear polymer with an average molecular weight of about 25,000 g mol-1.
Table 12 Overall degradation of PBI cells under steady state operation with dry hydrogen and air at 150-160ºC.
Lifetime test results Reference
> 5,000 h at 150oC; degradation rate < 5 µV/h <2,000 h @ 180-200ºC
Cf. Li et al. (2008)
> 20,000 h at 160ºC; degradation rate 5-6 µV/h Schmidt & Baurmeister (2008)
Degradation rate of ca. 12 µV/h at 0.2 A/cm2 Plug Power(2006)
2 kW PBI stack at 160ºC; degradation rate <10 µV/h Cf. Li et al. (2008)
10,000 h at 150ºC; degradation rate < 5 µV/h Cf. Li et al. (2008)
> 6,000 h at 160ºC; degradation rate ca. 25 µV/h Wannek et al. (2008) & Stolten et al. (2007)
CARBON SUPPORT CORROSION
High surface area carbon black is generally used as PEMFC catalyst support material and is, however, susceptible to corrosive conditions include elevated temperature (80ºC and obviously aggravated at elevated temperatures) at the presence of oxygen, high potential (0.6 -1.2 V), low pH, and with significant levels of water vapour. During the start-up and shutdown of a PEM FC, local cathode potential can be even higher for a short period of time, which significantly speeds up the carbon corrosion. During a typical automotive stack lifetime of 5,000 h, the excursion to high potentials on start-up and shutdown is expected to occur 30,000 times, corresponding to an accelerated durability test of 100 h at 1.2 V7. Moreover, the presence of Pt catalyst accelerates the rate of carbon corrosion.
In acid electrolytes the mechanism of electrochemical carbon corrosion is generally thought to proceed via a three-step process involving four electrons (Roen et al. 2004). The carbon is first oxidized, forming oxidized carbon intermediates as revealed by the voltammetric (Loutfy 1986 & Kinoshita 1973) and spectrometric studies (Antonucci et al. 1989; Rositani et al. 1987 & Kangasniemi et al. 2004). The final step of corrosion is the formation of carbon dioxide, which is thermodynamically favourable at potentials higher than 0.2 V:
C + H2O → CO2 +4H+ +4e− E = 0.207 V versus RHE
7 http://www.eere.energy.gov/hydrogenandfuelcells/mypp/pdfs/fuelcells.pdf.

Final report on ‘Quantify and Improve PEM Fuel Cell Durability’ PSO FU 2007-1-7156
43 of 52
Fig. 44 A daily startup-shutdown cycling test of a PBI cell operating with hydrogen and air at 150°C and ambient pressure. The calendar time was more than 3 years. The membrane was doped with 5.6 mol H3PO4. Catalyst loading for both electrodes was 0.61 mg Pt/cm². The cell was turned on ≈7 hours every working day through the period of time.
Significant work was carried out on carbon corrosion under phosphoric acid fuel cell operating conditions (Kinoshita & Bett 1973) as well as in PEMFC (Mathias et al. 2005).
5.3 HT PEM SINGLE CELL TESTS
5.3.1. STEADY STATE OPERATION
Steady state operation with a constant load continuously at a typical temperature of 150-160°C is a mild mode for PBI cells. First of all, no liquid water formation is involved. This minimizes the risk of the acid washing out, which has been a critical concern for the acid based PBI fuel cells. Another feature of the operation mode is that the cell voltage always remains in the low value range, which minimizes the oxidation of both carbon supports and noble metals and therefore the catalyst degradation.
Fig. 43 shows a set of durability test results previously measured at DTU on PBI cells operating with hydrogen and oxygen under continuous operation at ambient pressure. At temperatures around 150°C a lifetime of 5,000 hours by continuous H2/O2 operation has been achieved at a constant cell voltage of 0.5 V. At temperatures above 180°C, the lifetime is limited, and polymer oxidative degradation is likely the reason of the failure.
The oxidation by air seems much less than by pure oxygen. Using air, BASF-PEMEAS has demonstrated a life time of over 20,000 hours at 160°C (Schmidt & Baurmeister 2008). From the result, a degradation rate of the cell performance is estimated to be about 5-6 µV h-1.
During a steady state (continuous) operation of a fuel cell with hydrogen and air the lifetime seems very much dependent on temperature, i.e. over 5,000 to 20,000 hours at temperatures around 150-160ºC but a few hundreds to a thousand of hours at 180–200ºC. The eventual death of the cell is apparently due to the membrane failure, showing the importance of the polymer stability. A performance degradation rate of about 5 µV per hour has been demonstrated by the DTU group during the previous projects and confirmed by other groups, as listed below.
With acid doped AB-PBI, however, Wannek et al. (2008) reported a high degradation rate of 20-25 µV h-1 under constant load. By collecting the acid from the offgas through a water condenser, they observed a constant acid loss (ca. 0.2 µg m-2 sec-1) at the cathode but only initially an acid loss (also ca. 0.2 µg m-2 sec-1) at the anode (Wannek et al. (2008) & Stolten et la. (2007)). This was confirmed by the nearly constant resistance through the test period of 1,000 hours, indicating that the acid loss does not seem to be the main reason for the performance degradation.
Similar measurements were made by Yu et al. (2008) under steady-state conditions, showing a voltage degradation rate of 4.9-6.3 µV h-1 at 160°C. In the temperature range of 80-160°C the phosphoric acid loss rate was less than 10 ng cm-2 h-1 or 0.03 µg m-2 s-1, corresponding to a total acid of 2.6% after 40,000 hours of steady state operation.

Final report on ‘Quantify and Improve PEM Fuel Cell Durability’ PSO FU 2007-1-7156
44 of 52
Table 13 Dynamic lifetime tests of PBI cells. H2/Air, 150oC, daily 7/17h; 860 cycles, 3.5 years, 25% loss in first 60 cycles, ca. 300 µV/cycle
Li et al. (2008)
H2/Air, 160oC, daily 12/12h, 260 cycles, 6,500 h; 300 µV/cycle or 11 µV/h Schmidt & Baurmeister (2008)
H2/Air, 2 hours at 160oC and 0.6 V and 2 hours at 40oC and 0.6 V, ca. 44 µV/h Li et al. (2008)
OCV 2 min: 20 µV/h; At 0.2 A/cm2: 30 min - 12 µV/h; At 0.6 A/cm2: 30 min - 19 µV/h Staud 2006
DYNAMIC TEST
During dynamic tests with thermal, load and shutdown-startup cycling, the amount and the vapour pressure of the water product varies and formation of liquid water might be involved. In addition, the shutdown-startup or/and temperature cycling cause thermal and mechanical stresses to the membranes and cell components as well as the volume expansion and contractions of the acid in MEAs. Another important mechanism of the cell degradation involved in these dynamic tests is the corrosion of carbon support and sintering of noble metal catalysts (Reiser et al. 2005).
A thermal cycling test on a hydrogen-air cell with a daily shutdown and restart was initiated prior to the project and maintained during the project. During the shut-down period the cell was cooled to room temperature without special care. As shown in Fig. 44, over the first 60 daily cycles, a performance loss rate of 0.7 mWcm-2 per cycle was observed. This performance loss is significant compared with that for the steady state operation. In the following period of test over a period of more than 3 years, up to 850 cycles have been carried out showing a more or less stabilized performance, however, with a sudden death at the end. The sudden death was apparently due to the breakdown of the polymer membrane, as an abnormal increase in the gas permeability occurred. A performance loss rate of 0.07 mWcm-2 per cycle, corresponding approximately to a voltage drop rate of 0.3 mV per cycle or 40 µV per operating hour was observed over the whole test period.
Based on the commercial Celtec-P1000 MEA, Calundann et al. (2006) reported a similar daily startup-shutdown cycling test (12 hours of operation at 160°C followed by 12 hours of shutdown). After a period of 6,500 hours with 260 cycles under mild conditions (160°C and H2), an average voltage drop of 0.3 mV per cycle was observed, corresponding to a performance loss of ca. 11 µV/h (Schmidt & Baurmeister (2008) and & Tang et al. (2006)). With the newly developed Celtec-P2000 MEA, improved cycling performance of 15 µV/h under harsh conditions (180°C & reformat) has been reported.
Based on the advanced PBI MEAs, the Volkswagen group performed a temperature cycle test between 160 and 40°C. The cell operated for 2 hours at 160ºC and 0.6 V and for 2 hours at 40ºC and 0.6 V. These test conditions are critical for acid doped membranes because of the formation of liquid water when operating at 40ºC. With specially designed complex membrane and electrode interfacial structure, a cycling test has been managed for operation of up to 2,500 hours, with a degradation rate of 6% power loss for every 1,000 hours. For comparison purpose, a degradation rate could be estimated to be about 44 µV/h, if assuming the test was performed at a constant current density (830 mAcm-2).
Staudt (2006) reported another load test, by using the so called “filled” PBI membranes, with an off time (open circuit voltage) of 2 min. and an on time at 0.2 A/cm2 of 30 min. and at 0.6 A/cm2 for 30 min. Little performance degradation was observed in the first 600 hours. The performance loss was estimated to be about 20 µV/h at OCV, 12 µV/h at 0.2 A/cm2 and 19 µV/h @ 0.6 A/cm2, respectively, based on which a lifetime of 14,000 hours was projected.
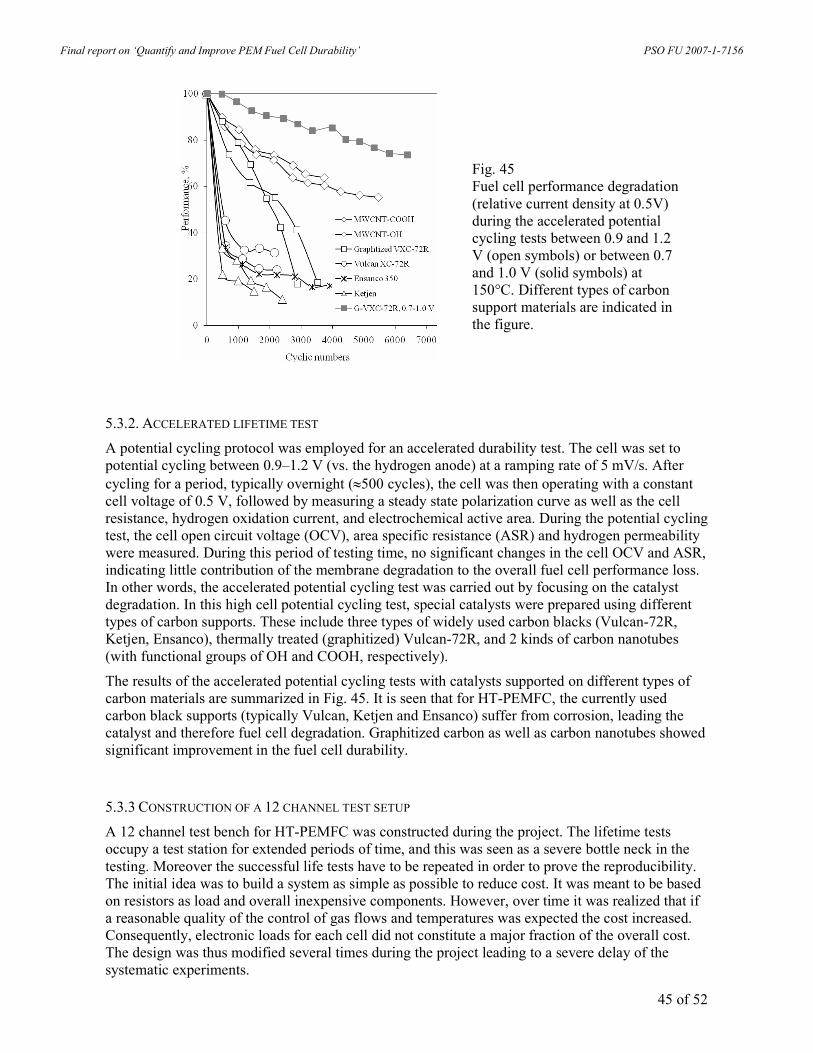
Final report on ‘Quantify and Improve PEM Fuel Cell Durability’ PSO FU 2007-1-7156
45 of 52
Fig. 45 Fuel cell performance degradation (relative current density at 0.5V) during the accelerated potential cycling tests between 0.9 and 1.2 V (open symbols) or between 0.7 and 1.0 V (solid symbols) at 150°C. Different types of carbon support materials are indicated in the figure.
5.3.2. ACCELERATED LIFETIME TEST
A potential cycling protocol was employed for an accelerated durability test. The cell was set to potential cycling between 0.9–1.2 V (vs. the hydrogen anode) at a ramping rate of 5 mV/s. After cycling for a period, typically overnight (≈500 cycles), the cell was then operating with a constant cell voltage of 0.5 V, followed by measuring a steady state polarization curve as well as the cell resistance, hydrogen oxidation current, and electrochemical active area. During the potential cycling test, the cell open circuit voltage (OCV), area specific resistance (ASR) and hydrogen permeability were measured. During this period of testing time, no significant changes in the cell OCV and ASR, indicating little contribution of the membrane degradation to the overall fuel cell performance loss. In other words, the accelerated potential cycling test was carried out by focusing on the catalyst degradation. In this high cell potential cycling test, special catalysts were prepared using different types of carbon supports. These include three types of widely used carbon blacks (Vulcan-72R, Ketjen, Ensanco), thermally treated (graphitized) Vulcan-72R, and 2 kinds of carbon nanotubes (with functional groups of OH and COOH, respectively).
The results of the accelerated potential cycling tests with catalysts supported on different types of carbon materials are summarized in Fig. 45. It is seen that for HT-PEMFC, the currently used carbon black supports (typically Vulcan, Ketjen and Ensanco) suffer from corrosion, leading the catalyst and therefore fuel cell degradation. Graphitized carbon as well as carbon nanotubes showed significant improvement in the fuel cell durability.
5.3.3 CONSTRUCTION OF A 12 CHANNEL TEST SETUP
A 12 channel test bench for HT-PEMFC was constructed during the project. The lifetime tests occupy a test station for extended periods of time, and this was seen as a severe bottle neck in the testing. Moreover the successful life tests have to be repeated in order to prove the reproducibility. The initial idea was to build a system as simple as possible to reduce cost. It was meant to be based on resistors as load and overall inexpensive components. However, over time it was realized that if a reasonable quality of the control of gas flows and temperatures was expected the cost increased. Consequently, electronic loads for each cell did not constitute a major fraction of the overall cost. The design was thus modified several times during the project leading to a severe delay of the systematic experiments.

Final report on ‘Quantify and Improve PEM Fuel Cell Durability’ PSO FU 2007-1-7156
46 of 52
The test bench in it final form has the main characteristics listed here:
• 12 independent channels rates for 10 cm2 single cells
• Individual flow control for hydrogen and air (rotameters).
• Individual temperature control (PID, thermocouples).
• 0-2 V /0-10 A (1A/cm2) active loads (in house built)
• Individual load programming and data aquesition vi PC/LabVIEW
• Constant current or voltage and true open voltage.
• Optional later load cycle and automated polarization curves by programming.
The test bench was built towards the end of the project and the commissioning has started in the succeeding project DuraPEM. The planned test matrix with combinations of varied load and temperature will be reported in DuraPEM based on latest state-of-art cells from the production by Danish Power Systems.
5.4 HT PEM STACK TESTS
The High Temperature PEM stack, built during the PSO FU-2007-1-7328 project on ‘Development of HT-PEMFC components and stack for CHP unit’ has been tested for 500 hours within the present project. The stack was due to time limitations only briefly verified in the above mentioned former project. The 40-cell stack was tested on IRD´s in-house constructed HT PEM FC test stand where it was exposed to 0.2 A/cm2 with pure hydrogen and air for a total added time of 530 hours, fulfilling the 500 hours initial target. The longest uninterrupted test run was 383 hours between.
Both air and liquid cooling methods were tried. Air cooling caused large temperature discrepancies between cells, and a higher degradation rate for the cells exposed to high temperatures (around 200°C against 160°C). The results are divided into three periods where different stack versions were tested as some cells needed to be replaced due to cross-over development. The most relevant degradation rates results are obtained during the test of the third stack version (360 continuous test hours) with liquid cooling. The degradation rate observed for the well conditioned cells in this stack version is in average 34 µV/h ranging from no-degradation up-to 83 µV/h. The stack test is further discussed in the MS14 report. The national Danish road map target for HT PEM stack lifetime is 5,000 hours in year 2009. This target lifetime has not been reached. The lowest degradation rate observed is more than three orders of magnitude too high (cf. Fig. 1).

Final report on ‘Quantify and Improve PEM Fuel Cell Durability’ PSO FU 2007-1-7156
47 of 52
6. DISSEMINATION
The project results have been disseminated in a number of peer-reviewed papers and at several scientific conferences, as listed below.
Publications:
Andersen, SM; Grahl-Madsen, L & Skou, EM (submitted to Solid State Ionics): Studies on PEM Fuel Cell Noble Metal Catalyst Dissolution
Foad Buazar, Karim Almoor, Qingfeng Li, Thomas Steenberg, Jens Oluf Jensen, Chao Pan and Niels J. Bjerrum, Durability of Pt/C Nanocatalyst in High Temperature H3PO4/PBI PEMFC, To be submitted to Journal of Power Sources (2009)
Foad Buazar, Karim Almoor, Qingfeng Li, Thomas Steenberg, Jens Oluf Jensen, Chao Pan and Niels J. Bjerrum, Durability of Pt/C Nanocatalyst in High Temperature H3PO4/PBI PEMFC, To be submitted to Journal of Power Sources (2010)
J. Liao, Q. Li, H.C. Rudbeck, J. O. Jensen, A. Chromik, N. J. Bjerrum, J. Kerres and W. Xing. Oxidative degradation of polybenzimidazole membranes as electrolytes for high temperature proton exchange membrane fuel cells. For submission to Macromolecules 2010
J. O. Jensen, Q. Li, and N. J. Bjerrum. Durability issues and state of the art of high temperature PEMFC, Invited review, to be submitted to Fuel Cells (2010)
J. O. Jensen, Q. Li, and N. J. Bjerrum. Lifetime and degradation of high temperature PEM fuel cells. Invited review, to be submitted to Fuel Cells (September 2009)
L. N. Cleemann, Q. Li, J. O. Jensen, C. Pan, C.D. Liu, S. Dai, and N. J. Bjerrum. Catalyst Degradation in High Temperature Proton Exchange Membrane Fuel Cells Based on Acid Doped Polybenzimidazole Membranes. To be submitted to Journal of Power Sources (2009)
L. N. Cleemann, Q. Li, J. O. Jensen, C. Pan, C.D. Liu, S. Dai, and N. J. Bjerrum. Catalyst Degradation in High Temperature Proton Exchange Membrane Fuel Cells Based on Acid Doped Polybenzimidazole Membranes, to be submitted to Journal of Electrochemical Society (2010)
Li, Q; Jensen, JO; Savinell, RF & Bjerrum, NJ (2009): Acid-doped polybenzimidazole (PBI) membranes for high temperature proton exchange membrane fuel cells. Progress in Polymer Science 34, 5, 449-477 (2009). (This paper is a general review on PBI cells, the durability part can be attributed to the project.)
Li, Q; Rudbeck, HC; Chromik, A; Jensen, JO; Pan, C; Steenberg, T; Calverley, M; Bjerrum, NJ & Kerres, J (2010): Properties, Degradation and High Temperature Fuel Cell Test of Different Types of PBI and PBI Blend Membranes. J.Membrane Sci. 347(1-2)260-270
Odgaard, M; Grahl-Madsen, L; Sieborg, B; Yde-Andersen, S & Lu, J (2008): Durability and performance of LT PEM. Pp.333-337 in Proceedings of the 29th RISØ symposium on Materials Science: ‘Energy Materials – Advances in Characterization, Modelling and Application. NH Andersen, M Eldruo, N Hansen, D Juul Jensen, EM Nielsen, SF Nielsen, BF Sørensen, AS Pedersen, T Vegge & SS West (eds.)
Conference presentations (oral presentations and posters):
Andersen, SM & Skou, EM (2009): Progress on PEM FC noble metal catalyst dissolution. Poster presented at the Solid State Ionic 17, Toronto, Canada, 27. June - 5. July 2009
Andersen, SM & Skou, EM (2009): Studies on PEM Fuel Cell Noble Metal Catalyst Dissolution. Poster presented at the conference: Advances in Polymer Electrolyte Membrane Fuel Cell Systems 2009, Asiloma, USA, 15-18 February 2009

Final report on ‘Quantify and Improve PEM Fuel Cell Durability’ PSO FU 2007-1-7156
48 of 52
Grahl-Madsen, L, Odgaard, M, Sieborg, B & Yde-Andersen (2007): Long-term test of LT PEM FC fuelled with reformat. Poster presented at the ‘EC-JRC/IPHE/IEA International Workshop on Degradation Issues of Fuel Cells’ at Crete, Greece, the 19-21 Sep. 2007. The poster presented results from both the present project and the PSO-project: FU 2005-2-6333
Jensen, JO; Li, Q; Pan, C & Bjerrum, NJ (2009): Degradation of high temperature PEM fuel cells. HyFC Academy School on Fuel Cells and Hydrogen. PEM FC’s: Degradation mechanisms and their mitigation. Vancouver, May 26-29 2009 (Invited presentation)
Jensen, JO; Li, Q; Pan, C & Bjerrum, NJ (2009): High Temperature PEM Fuel Cells. From Membranes to Stacks. HySA Systems Seminar, Cape Town, South Africa, March 31 – 1 April 2009 (Invited talk)
Jensen, JO; Li, Q; Pan, C & Bjerrum, NJ (2009): High temperature PEM fuel cells in Denmark. Part I: Introduction to HT-PEMFC, selected results, Part II: Durability, Electrolysis, activities in Denmark. Seminar at Fuel Cell Research Centre, Korean Institute of Energy Research, KIER, Daejeon, Korea, October 22. 2009 (Invited talk 4 hours)
Jensen, JO; Li, Q; Pan, C & Bjerrum, NJ (2009): High temperature PEM fuel cells in Denmark. Guest talk at Kolon Industries, Suwon, Seoul, Korea, October 23, 2009
Jensen, JO; Li, Q; Pan, C & Bjerrum, NJ (2009): PEM fuel cells at elevated temperature. 3rd Symposium "Hydrogen & Energy" Braunwald, Switzerland, 25. - 30. January 2009. (Invited keynote talk)
Jensen, JO; Li, Q; Pan, C & Bjerrum, NJ (2009): PEM Fuel cells at elevated temperatures, Abstract submitted to International Symposium on Electrochemistry for Energy Conversion and Storage, August 22-25, 2009, the Three Gorges, China
Li, Q; F. Buazar, L. N. Cleemann, Pan, C; Jensen, JO; Steenberg, T; Christensen, E & Bjerrum, NJ (2009) : Durable Catalysts for High Temperature Proton Exchange Membrane Fuel Cells, Abstract submitted to International Symposium on Electrochemistry for Energy Conversion and Storage, August 22-25, 2009, the Three Gorges, China
Li, Q; Jensen, JO & Bjerrum, NJ (2008): High Temperature PEMFC Based on Acid Doped Polybenzimidazole Membranes: Durability Issues and Recent Progress, , Oral presentation at Fuel Cells Durability and Performance, December 11-12, 2008, Las Vegas, NV, USA
Li, Q; Jensen, JO; Pan, C & Bjerrum, NJ (2009): Durability Issues of High Temperature Proton Exchange Membrane Fuel Cells Based on Acid Doped Polybenzimidazole Membranes, oral presentation at the 60th International Electrochemistry Society Conference, August 15-20, 2009, Beijing, China
Ma, S. & Skou, E. (2008): PEM FC Durability Issues. Poster presented at the following two symposiums: - Solid State Protonic Conductor - 14, SSPC-14, Kyoto, Japan, 07-11/09 2008 - Electrochemical Science and Technology, Odense, Denmark, 02-03/10 2008
Odgaard, M (2009): Durability and Performance of the MEAs in the Commercial Fuel Cell Applications. Oral presentation at the 5th Annual Conference in the Knowledge Foundation's on Fuel Cells Durability & Performance. December 8-9, 2009, Alexandria, VA, USA
Odgaard, M; Grahl-Madsen, L; Sieborg, B; Yde-Andersen, S; Lu, J & Thomas, JO (2008): Durability and performance of LT PEM fuel cells. Oral presentation at 29th Risø International Symposium on Materials Science Energy Materials - Advances in Characterization, Modelling and Application, 1-5 September 2008

Final report on ‘Quantify and Improve PEM Fuel Cell Durability’ PSO FU 2007-1-7156
49 of 52
7. REFERENCES
Antolini, E; Salgado, JRC; Gonzalez, ER, J. Power Sources, 160 (2): 957-968 (2006)
Antonucci, PL; Pino, L.; Giordano, N & Pinna, G: Mater. Chem. Phys. 21 (1989) 495–506
Aragane, J., T. Murahashi, et al. (1988). "CHANGE OF PT DISTRIBUTION IN THE ACTIVE COMPONENTS OF PHOSPHORIC-ACID FUEL-CELL." J.Electrochem.Soc. 135(4): 844-850
Bazylak, A (2009); International journal of hydrogen energy, 34 9, 3845-3857
Bewick, A. et al. J. Electroanal. Chem, 119(1) 175-185 (1981)
Bindra, P. Clouser, S. J. Yeager, E. (1979). "PLATINUM DISSOLUTION IN CONCENTRATED PHOSPHORIC-ACID." Journal of the Electrochemical Society 126(9): 1631-1632
Brown , EH & Whitt, CD : Ind. Eng. Chem., 1952, 44, 615-618
Calundann G. et al.: Market Introduction of Reformed Hydrogen Fuel Cells (RHFC) Based on High Temperature Celtec_P1000 MEAs, (Abstract 409), the 2006 Fuel Cell Seminar, November 13-17, 2006, Honolulu, Hawaii
Chang, Z.; Hongting Pu, Decheng Wan, Lu Liu, Junjie Yuan, Zhenglong Yang: Chemical oxidative degradation of Polybenzimidazole in simulated environment of fuel cells. Polymer Degradation and Stability 94 (2009) 1206–1212
Cleghorn, SJC; Mayfield, DK; Moore, DA; Moore, JC; Rusch, G; Sherman, TW ; Sisofo, NT & Beuscher, U (2006): J. Power Sources 158(446)
Daletou, MK; Gourdoupi, N & Kallitsis, JK: Journal of Membrane Science 252 (2005) 115–122
Endoh, E (2005) Fuel Cell Seminar Abstracts, Courtesy Associates, Palm Springs, 2005, pp. 180
Ferreira, PJ; la O’, GJ; Shao-Horn, Y; Morgan, D, Makharia, R; Kocha, S & Gasteiger, HA (2005): J. Electrochem.Soc. 2005, 152, A2256
Ferreira, PJ; la O’, GJ; Shao-Horn, Y; Morgan, D; Makharia, R; Kocha, S & Gasteiger, HA: J. Electrochem. Soc. 152 (11), A2256-A2271 (2005)
Gasteiger, HA et al. (1993); J. Surf. Sci, 293, 67
Gaudiana, RA & Conley, RT: Weak-link versus active carbon degradation routes in the oxidation of aromatic heterocyclic systems, J. Polym. Sci. Part B: Polym. Lett. 7 (1969) 793
Honji, A., T. Mori, et al. (1988). "AGGLOMERATION OF PLATINUM PARTICLES SUPPORTED ON CARBON IN PHOSPHORIC-ACID." Journal of the Electrochemical Society 135(2): 355-359
http://www.schatzlab.org/docs/TdadFCSeminar2002.pdf
Hubner, G & Roduner, E: EPR investigation of HO• radical initiated degradation reactions of sulfonated aromatics as model compounds for fuel cell proton conducting membranes, J. Mater. Chem. 9 (1999) 409–418
Jensen, JO; Li, QH & Bjerrum, NJ: Durability issues and state of the art of high temperature PEMFC based on acid-doped polybenzimidazoles, to be submitted to Fuel Cells (2009)
Kangasniemi, KH; Condit, DA & Jarvi, TD: J. Electrochem. Soc. 151 (4) (2004) E125–E132
Kerres, J; Schönberger, F; Chromik, A; Hein, M; Häring, T; Li, Q; Jensen, JO; Noyé, P & Bjerrum, NJ: Partially fluorinated arylene polyethers and their ternary blends with PBI and H3PO4, Part I. Synthesis and Characterization of Polymers and Binary Blend Membranes, Fuel Cells, 8 (2008), 175-187
Kinoshita, K & Bett, JAS Carbon, 11, 403-411 (1973)
Kinoshita, K & Bett, JAS: Carbon, 11, 237-247 (1973)
Klug P.H. et al. (1954): X-ray Diffraction Procedures for Polycrystalline and Amorphous Materials, Wiley, New York
Knights, SD; Colbow, KM; St-Pierre, J & Wilkinson, DP: J. Power Sources 127 (2004) 127
Kosmala, B & Schauer, J: Ion-exchange membranes prepared by blending sulfonated poly(2,6-dimethyl-1, 4-phenylene oxide) with polybenzimidazole, J. Appl. Polym. Sci. 85 (2002) 1118–27

Final report on ‘Quantify and Improve PEM Fuel Cell Durability’ PSO FU 2007-1-7156
50 of 52
Li, Q; He, R; Berg, RW; Hjuler, HA & Bjerrum, NJ: Water uptake and acid doping of polybenzimidazoles as electrolyte membranes for fuel cells, Solid State Ionics 168 (2004) 177
Li, Q; Jensen, JO & Bjerrum, NJ: High Temperature PEMFC Based on Acid Doped Polybenzimidazole Membranes Durability Issues and Recent Progress, Invited talk at the Fuel Cells Durability and Performance 2008, December 11 – 12, 2008, Las Vegas Hilton, Las Vegas NV, USA. In conference proceedings (Chapter 11)
Li, Q; Pan, C; Jensen, JO; Noy´e, P & Bjerrum, NJ: Cross-linked polybenzimidazole membranes for fuel cells, Chem. Mater. 19 (2007) 350
Li, Q; Rudbeck, HC; Chromik, A; Jensen, JO; Pan, C; Steenberg, T; Calverley, M & Bjerrum, NJ (in prep.): J. Kerres, Properties, Degradation and High Temperature Fuel Cell Test of Different Types of PBI and PBI Blend Membranes, TO BE SUBMITTED TO j. Membr. Sci. (2009)
Liu, D & Case, S (2006): J. Power Sources 162(521)
Lobato, J; Ca˜nizares, P; Rodrigo, MA; Linares, JJ & Manjavacas, G: Synthesis and characterisation of poly[2,2-(m-phenylene)-5,5-bibenzimidazole] as polymer electrolyte membrane for high temperature PEMFCs, J. Membr. Sci. 280 (2006) 351
Loutfy, RO: Carbon, 24 (2), 127-130 (1986)
Ma, S et al. (2009): Appl. Phys. A, 96 (3) 581-589
Mathias, MF; Makharia, R; Gasteiger, HA; Conley, JJ; Fuller, TJ; Gittleman, CJ; Kocha, SS; Miller, DP; Mittelsteadt, CK; Xie, T; Yan, SG & Yu, PT: The Electrochemical Society Interface, 14 (3), 24-35 (2005)
Matsuoka, K et al. (2008), J. Power Sources 179(2) 560-565
Mauritz, K et al. (2004); Chem. Rev. 104, 4535-4585
Mitsushima, S. et al. (2008) ; Electrochim. Acta 54(2) 455-460
Mitsushima, S. Koizumi, Y. Uzuka, S. Ota, K. I. (2008). "Dissolution of platinum in acidic media." Electrochimica Acta 54(2): 455-460
Miyoshi, R; Sakiyama, Y; Miwa, Y; Aoki, Y; Yamamoto, T; Ueno, Y; Masuda, A; Nakagawa, Y; Katagiri, G; Nakayama, H & Hori, M (2006) Fuel Cell Seminar Abstracts, Courtesy Associates, Hawaii
Odgaard, M; Grahl-Madsen, L; Sieborg, B; Yde-Andersen, S; Lu, J & Thomas, JO (2008): Durability and performance of LT PEM fuel cells. Oral presentation at 29th Risø International Symposium on Materials Science Energy Materials - Advances in Characterization, Modelling and Application, 1-5 September 2008
Panchenko, A; Dilger, H; Möller, E; Sixt, T & Roduner, E: In situ EPR investigation of polymer electrolyte membrane degradation in fuel cell applications, J. Power Sources 127 (2004), 325-330
Pourbaix, M: ‘Atlas of Electrochemical Equilibra in Aqueous Solutions’, National Association of Corrosion Engineers, Texas, USA, 1974 Section 13.6, Platinum, J.Van Muylder, N De Zoubov & M. Pourbaix, 378-383
Qiao, JL et al. (2006), J. Electrochem. Soc. 153 (6) A967-A974
Reiser, CA; Bregoli, LJ; Patterson, TW; Yi, JS;. Yang, JD; Perry, ML & Jarvi, TD: Electrochem. Sol. Lett. 8 (2005) A273
Roen, LM; Paik, CH & Jarvi, TD: Electrochem. Solid State Lett. 7 (1) (2004) A19–A22.
Rositani, F; Antonucci, PL; Minutoli, M; Giordano, N & Villari, A: Carbon 25 (1987) 325
Ross P.N., Deactivation and Poisoning of Fuel Cell Catalysts. LBL-19766-Rev. Lawrence Berkeley Laboratory, Berkeley, CA (Sept. 1985)
Savadogo, O (1998); J. New mater. Electrochem. Syst. 1, 47-66
Schlick, S et al. (1991), Macromolecules,24, 3517-3521
Schmidt, TJ & Baurmeister, J: Properties of high-temperature PEFC Celtec_P1000 MEAs in start/stop operation mode. J Power Sources 2008;176:428-434

Final report on ‘Quantify and Improve PEM Fuel Cell Durability’ PSO FU 2007-1-7156
51 of 52
Shi, Y; Horky, A & Polevaya, O (2005): J. Cross, 2005 Fuel CellSeminar Abstracts, Courtesy Associates, Palm Springs
Staudt et al. OE report (2006)
Staudt R. Development of Polybenzimidazole-Based High Temperature Membrane and Electrode Assemblies for Stationary Applications, 2006 Annual Progress Report, http://www.hydrogen.energy.gov/pdfs/progress06/v_b_5_staudt.pdf.
Stevens, DA & Dahn, JR: Carbon 43 (2005) 179
Stolten D, Wannek C, Dohle H, Blum L, Mergel J, Peters R. Strategy, Status and Outlook for HTPEFC Development for APU Application (Abstract 162), Fuel Cell Seminar 2007, Oct.15.19, 2007, San Antonio, TX
St-Pierre, J & Jia, N; (2002): J. New Mater. Electrochem. Syst. 5(263)
St-Pierre, J; Wilkinson, DP; Knights, SD & Bos, M (2000): J. New Mater. Electrochem. Syst. 3(99)
Sugawara, Y et al. (2007), Electrochem. 75(4) 359-365
Tang, H; Qi, Z; Ramani, M & Elter, JF: J. Power Sources 158 (2006) 1306
Taniguchi, A; Akita, T; Yasuda, K & Miyazaki, Y: J. Power Sources 130 (2004) 42
Wahdame, B; Candusso, D; Francois, X; Harel, F; Pera, M-C; Hissel, D & Kaufmann, J-M (2007): Int. J. Hydrogen Energy 32(5493)
Wang, X. P. Kumar, R. Myers, D. J."Effect of voltage on platinum dissolution relevance to polymer electrolyte fuel cells." Electrochemical and Solid State Letters 9(5): A225-A227
Wannek C, Kohnen B, Oetjen HF, Lippert H, Mergel J. Durability of ABPBI-based MEAs for High Temperature PEMFCs at Different Operating Conditions. Fuel Cells 2008 (8)87-95
Wannek et al. Fuel Cells 08 (2008) 87-95
Wood, D; Davey, J; Garzon, F; Atanassov, P & Borup, R (2005): Fuel Cell Seminar Abstracts, Courtesy Associates, Palm Springs
Xie, J; Wood, D; Wayne; D, Zawodzinski, T;Atanassov, P & Borup, R: J. Electrochem. Soc. 152 (2005) A104
Yadav, AP (2008), Proton Exchange membrane Fuel Cells 8, PTS 1 & 2 Book Series: ECS Transactions Vol. 16(2) 2093-2099
Yadav, AP et al. (2007); Electrochim. Acta 52(26) 7444-7452 (2007)
Yamazaki, O; Oomori, Y; Shintaku, H & Tabata, T (2005): Fuel Cell Seminar Abstracts, Courtesy Associates, Palm Springs
Yasuda K, Taniguchi A, Akita T, Ioroi T, Siroma Z. Phys. Chem. Chem. Phys. 2006; 8: 746-752
Yoshioka, S; Yoshimura, A; Fukumoto, H; Hiroi, O & Yoshiyasu, H (2005) J. Power Sources 144(146)
Yu S, Xiao L, Benicewicz BC. Durability studies of PBI-based high temperature PEM FCs. Fuel Cells 2008 (8)156-174
Yu XW and Ye SY, J. Power Sources 172, 145–154, (2007)
Yu, J; Matsuura, T; Yoshikawa, Y; Islam, N & Hori, M (2005): Electrochem. Solid-State Lett. 8(A156)
Yu, XW; Ye, SY, J Power Sources, 172 (1): 133-144 (2007)

Final report on ‘Quantify and Improve PEM Fuel Cell Durability’ PSO FU 2007-1-7156
52 of 52
8. ABBREVIATIONS
AA Atomic Absorption Spectroscopy AB Air Bleed BoL Beginning-of-Life BoP Balance-of-Plant BPP Bipolar Plate CCB Catalyst Coated Backing CCM Catalyst-Coated Membrane CHP Combined Heat and Power CV Cyclic Voltammetry DOE USA Department of Energy EoL End-of-Life FC Fuel Cell GDL Gas Diffusion Layer HT High Temperature LT Low Temperature MS MileStone e.g. MS1 meaning milestone no.1 MEA Membrane Electrode Assemblies MS Mass Spectroscopy NG Natural Gas OCV Open Cell Voltage PEM Proton Exchangeable Membrane PBI PolyBenzImidazoles PTFE Polytetrafluoroethylene (Teflon) SEM Scanning Electron Microscope SoA State-of-the-Art TPB Three-Phase-Boundary TEM Transmission Electron Microscope TG ThermoGravimetry UPS Uninterrupted Power Supply VPP Virtual Power Plant WP Work Package XRD X-Ray Diffraction