MASTER - OSTI.GOV
44
- / ,-jC;A,~gJ~ Qy/t.-?o;3 -- /y * T PUBLICATIONS OF THE WATER AND ENVIRONMENT RESEARCH INSTITUTE 19 Liisa Lepisto Phytoplankton succession from 1968 to 1990 in the subarctic Lokka reservoir Yhteenveto: Kasviplanktonin kehitys vuosina 1968-1990 subarktisessa Lokan tekoaltaassa MASTER NATIONAL BOARD OF WATERS AND THE ENVIRONMENT, FINLAND Helsinki 1995
-
Upload
khangminh22 -
Category
Documents
-
view
3 -
download
0
Transcript of MASTER - OSTI.GOV
-/ , - j C ; A , ~ g J ~ Qy/ t . -?o;3 - - / y * T PUBLICATIONS OF THE WATER AND ENVIRONMENT RESEARCH INSTITUTE
19
Liisa Lepisto
Phytoplankton succession from 1968 to 1990 in the subarctic Lokka reservoir
Yhteenveto: Kasviplanktonin kehitys vuosina 1968-1990 subarktisessa Lokan tekoaltaassa
MASTER
NATIONAL BOARD OF WATERS AND THE ENVIRONMENT, FINLAND Helsinki 1995
The series PUBLICATIONS OF THE WATER AND ENVIRONMENT RESEARCH INSTITUTE contains scientific papers from the research field of the Water and Environment Research Institute, National Board of Waters and the Environ- ment, Finland. The series is a sequel to the publications "Communications of the Hydrological Off ice", "Soi I and Hydro tec h n ical I nvest i g at io n s" and "Pub I i- cations of the Water Research Institute". Inquiries should be addressed to the National Board of Waters and the Envi-
FIN-00251 Helsinki, Finland). This publication is available from Painatuskeskus Oy, P.O. Box 516, FIN-00101 Helsinki, Finland. Telex 123458 vapk sf.
I.
f ronment, P.O. Box 250, FIN-00101 Helsinki, Finland. (New adress since 1.3. 1995: Finnish Environment Agency, PO. Box 140,
. I
DISCLAIMER
Portions of this document may be illegible in electronic image products. Images are produced from the best available original document.
PUBLICATIONS OF THE WATER AND ENVIRONMENT RESEARCH INSTITUTE
19
Liisa Lepisto
Phytoplankton succession from 1968 to 1990 in the subarctic Lokka reservoir
Yhteenveto: Kasviplanktonin kehitys vuosina 1968-1990 subarktisessa Lokan tekoaltaassa
NATIONAL BOARD OF WATERS AND THE ENVIRONMENT, FINLAND Helsinki 1995
The author is responsible for the contents of the publication. It may not be referred to as the official view or policy of the National Board of Waters and the Environment.
ISBN 952-11-0003-6 ISSN 0783-9472
Lahden Kirjapaino ja Sanomalehti Oy "LahtiPrint" - Lahti 1995
! r '
1
3
Contents
1 Introduction
2 The study area
3 Material and methods
4 Results 4.1 Water quality 4.2 4.2.1 The early stage: 1968-1971 4.2.2 The erosion stage: 1977-1990 4.3
Phytoplankton succession: biomass and species composition
Phytoplankton succession in three different summers
5 Discussion 5.1 Water quality 5.2 Phytoplankton 5.2.1 5.2.2 5.3 The Lokka reservoir today
Algal response to environmental changes Long term and seasonal succession
6 Conclusions
Acknowledgements
Yhteenveto
References
Appendices
6
6
8
10 10 16 19 22 27
29 29 30 30 31 33
33
34
34
35
38
5
PHYTOPLANKTON SUCCESSION FROM 1968 TO 1990 IN THE SUBARCTIC LO= RESERVOIR
Liisa Lepisto
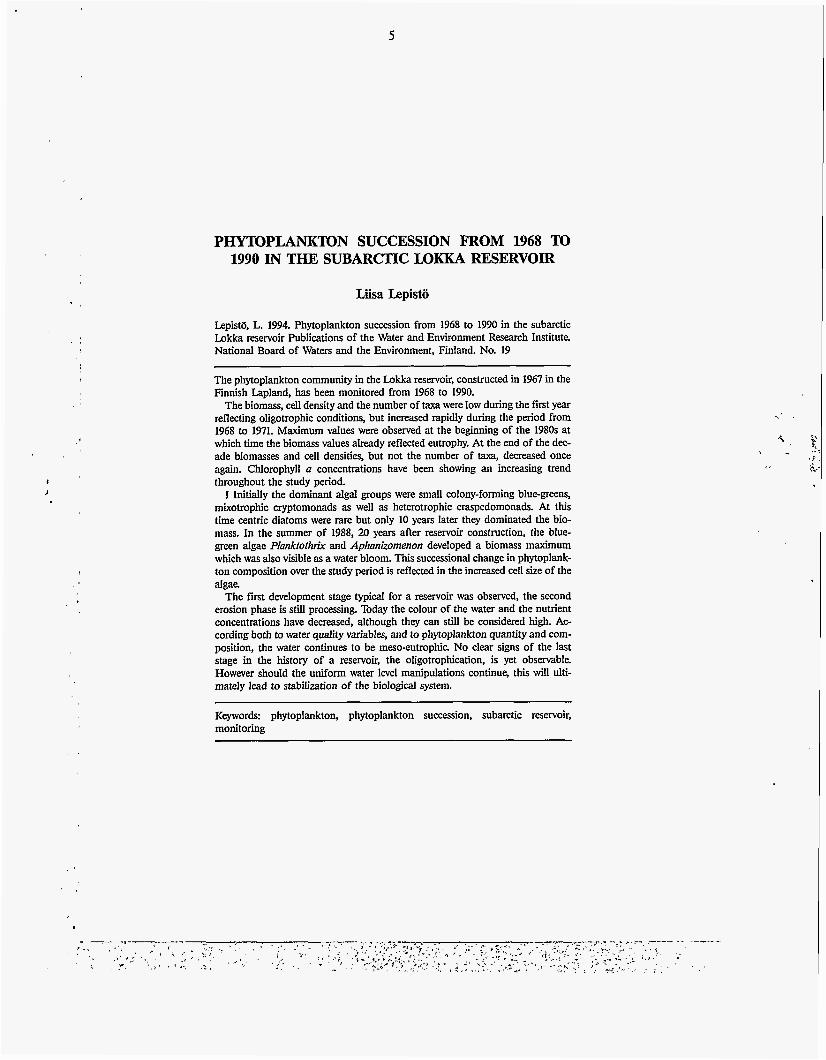
Lepist6, L. 1994. Phytoplankton succession from 1968 to 1990 in the subarctic Lokka reservoir Publications of the Water and Environment Research Institute National Board of Waters and the Environment, Finland. No. 19
The phytoplankton community in the Lokka reservoir, constructed in 1967 in the Finnish Lapland, has been monitored from 1968 to 1990.
The biomass, cell density and the number of taxa were low during the fmt year reflecting oligotrophic conditions, but increased rapidly during the period from 1968 to 1971. Maximum values were observed at the beginning of the 1980s at which time the biomass values already reflected eutrophy. At the end of the dec- ade biomasses and cell densities, but not the number of taxa, decreased once again. Chlorophyll a concentrations have been showing an increasing trend throughout the study period.
I Initially the dominant algal groups were small colony-forming blue-greens, mixotrophic cryptomonads as well as heterotrophic craspedomonads. At this time centric diatoms were rare but only 10 years later they dominated the bio- mass. In the summer of 1988, 20 years after reservoir construction, the blue- green algae Planktothrix and Aphanizomenon developed a biomass maximum which was also visible as a water bloom. This successional change in phytoplank- ton composition over the study period is reflected in the increased cell size of the algae.
The first development stage typical for a reservoir was observed, the second erosion phase is still processing. Today the colour of the water and the nutrient concentrations have decreased, although they can st i l l be considered high. Ac- cording both to water quality variables, and to phytoplankton quantity and com- position, the water continues to be mesoeutrophic No clear signs of the last stage in the history of a reservoir, the oligotrophication, is yet observable However should the uniform water level manipulations continue, this will ulti- mately lead to stabilization of the biological system.
~
Keywords: phytoplankton, phytoplankton succession, subarctic reservoir, monitoring
.
6
1 INTRODUCTION
Man-made lakes can be considered systems inter- mediate between rivers and lakes. They are much younger than lakes and their ageing process very much depends upon watershed inputs ('Iiundisi 1993). As in lakes, the water quality of man-made lakes is primarily based on the soil types within their catchment area. Immediately after dam- ming, nutrients are supplied by decomposition processes with material in the inundated land area functioning as substrate This may cause high nutrient levels and dark water colour, especially in areas with large peatlands (Vogt 1978, Kinnunen 1982). The often strong water level variations dis- turb the macrophyte covered shoreline resulting in erosion, an effect also brought about by ice ero- sion during winter. Consequently, phytoplankton, not having to compete with macrophytes, are of great importance as primary producers in these ecosystems (Gamier 1992).
The biological systems in artificial lakes have been found to be constantly changing. These changes can be classified in successive stages, yet with a tendency towards oligotrophication (Garni- er 1992). According to Vogt (1978) the primary production of phytoplankton is at its highest dur- ing the early phase at which time an artificial lake can be characterized as potentially eutrophic With time the biota in the water as well as the nutrient status changes (Kinnunen 1985, Krzyza- nek et al. 1986, Trifonova 1989, Gamier 1992). During a period of 28 years Krzyzanek et al. (1986) described five different stages in the estab- lishment of biota in a Polish reservoir. The changes during the first months were rapidly suc- ceeded by a brief oligotrophica-tion period. The following five years were characterized by a lack of chemical or biological stability and by large numbers of algae After another oligotrophication period of ten years, with the ensuing formation of stable communities, the trophic status of the reservoir increased once again. This was exempli- fied by the intense development of animals and plants, especially phytoplankton with resultant blooms of Microcystk (Krzyzanek et al. 1986).
According to Vogt (1978), the intensive early phase, lasting approximately five years, gives way to an erosion phase, when there is still plenty of organic matter available but which is more resis- tant to decomposition. In addition, during the erosion phase, primary production decreases and
stable communities develop (Krzyzanek et al. 1986). This stage continues for as long as there is a constant supply of organic matter from either the reservoir shores or from the peat bottom. In Finland this stage continues for tens, perhaps even for hundreds of years (Vogt 1978).
Environmental conditions femain balanced in the reservoir if there are no dramatic changes in water level fluctuations (Kinnunen 1985). When reservoirs reach some stage of stabilization their community composition and water quality cor- responds to the characteristics of lakes whose water level has been regulated for a long period of time (Vogt 1978).
In Finland there are 32 reservoirs whose size ex- ceed 1 km2. It may seem strange that a country so rich in lakes needs to construct reservoirs, however, these man-made lakes are situated in lake-poor areas along the western coast of Fin- land and in the inland north, where natural lake coverage is only three percent of the land area (Vogt 1978). Most man-made lakes in Finland are built by damming a river in the upper regions of its watercourse, areas which are rich in marshy soils. These reservoirs are primarily constructed for hydroelectric power generation, as in the case of the Lokka reservoir (Kinnunen 1982), but also to prevent floods (Vogt 1978).
The aim of this study was to investigate the de- velopment of phytoplankton composition, abun- dance and biomass in the Lokka reservoir during a period of 23 years. Special emphasis was placed on the long-term succession as well as on the seasonal succession of the communities. This was done by following the development of the riverine planktonic algae, observed in the earlier stages, into the typical lake planktonic algae of the later stages. Algal succession two years after damming and ca. twenty years after damming is discussed. The physico-chemical properties of reservoir water such as colour, pH, alkalinity, conductivity, oxygen, silica, phosphorus, nitrogen and iron were investigated as background data. Chlorophyll a concentrations are compared with the biomass values.
2 THE STUDY AREA
The Lokka reservoir is situated in the Finnish Lapland (Fig. 1). It is the biggest man-made lake area-wise in western Europe (Vogt 1978). Its dam- ming was initiated in July 1967 after a clearance
, ' .,. "
r ,
* -
F
$.*' .
7
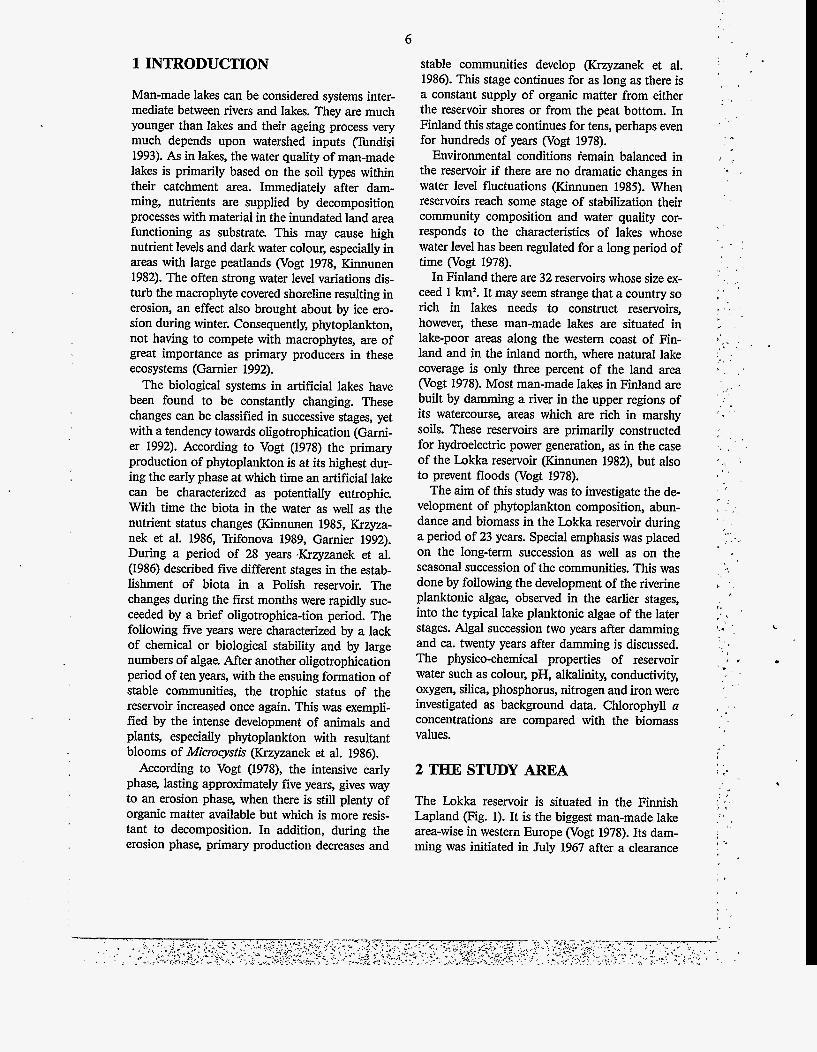
Fig. 1. The Lokka reservoir. Submerged rivers (- - - -) and sampling sites L1 and L3.
of only minor areas from trees and bushes. The vironment 1987). The reservoir is filled during au- area covered by water in the reservoir consisted of tumn as well as by floods during spring and lies 80 070 marsh grounds, the rest were fields and at minimum holding in winter due to water level meadows. The Posoaapa swamp (Fig. l), one of regulation (Kinnunen 1982). The retention time is the most magnificent swamps in Europe with an thus relatively short. Water level manipulation area of more than 100 km2, was subsequently does not necessarily mean only allowing the level drowned. Several rivers eg. the Luiro river and to fluctuate between its established maximum and Lake Sompioj&vi, with an area of 9 kmZj were minimum levels, but very much depends on the re- submerged pig. 1). Drifting floats of peat formed quirements for hydroelectric power. The estab- dense mats in the summers of 1970 and 1971 lished maximum and minimum water levels are (Nenonen and Nenonen 1972). Ice and waves con- 245 m and 240 m above sea level. The resulting tributed to the dispersal of the peatfloats, but in reservoir areas and volumes are given below sheltered areas they remained intact for consider- (Nenonen and Nenonen 1972): able periods of time @uuhij&vi et al. 1976). Maxmum area 417 km'
The flat bottomed Lokka reservoir is subarctic Minimum area 216 km' (Ahti et al. 1964) and part of the Kemijoki yater- Volume at the highest water level 2 063 - IO6 m3 course. Morphological details are given below Volume at the lowest water level 500- 106 m3 (Nenonen and Nenonen 1972): In 1968 the water level was raised to 242 metres Catchment area above sea level. Withdrawal of water started in Midmum depth 12 m 1971-1972 and was continued throughout the Mean depth winter by keeping the water running through a
Due to its northern location the reservoir has a dam to the river Luiro. Since 1981 the water was thick ice cover from the end of October to the end running through a channel to another reservoir, of May (National Board of Waters and the En- Porttipahta, built in the vicinity of the Lokka
2 380 km2
4.3 m
8 246 1
m l aJ d
1 1 1 1 1 1 1 I I
1968 69 70 I1 72 13 I4 I 5 16 I1 I8 19 80 81 02 03 8 4 85 06 81 88 89 90 Year
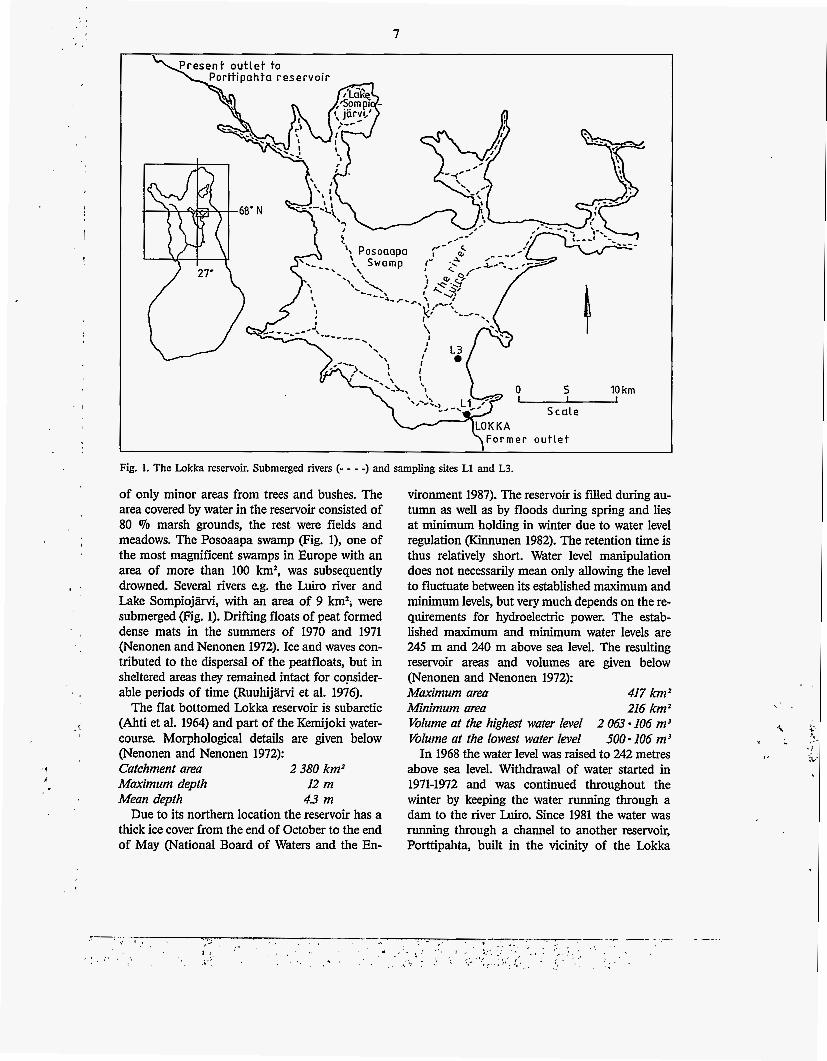
Fig. 2. Regulation of the water level in the Lokka reservoir in 1968 to 1990.
reservoir (Fig. 1). In 1977 the water level was dra- matically lowered, almost to its established mini- mum level and remained at low level until spring 1981 (Fig. 2). During that period the minimum water volume of the reservoir fluctuated between 572 and 946 million m3.
Since 1981 the minimum water level has been above 242 metres and thus the minimum water volume has exceeded 1100 million m3. At present, the water level fluctuation normally varies within three metres (Fig. 2). The minimum and maxi- mum water levels from the hydrological data bank of the National Board of Waters (NBW) - since 1986 the National Board of Waters and the En- vironment (NBWE) - are given in Appendix 1. The corresponding water volumes and areas are also shown.
3 MATERIAL AND METHODS
In the autumn of 1965 some water quality data was collected from the river Luiro before the reser- voir was constructed (Oy Vesitekniikka Ab 1967). After filling, it was unclear whether the water authorities or the users of the reservoir were responsible for its monitoring (Kinnunen 1985). Consequently the data concerning water quality, phytoplankton and zooplankton is temporally and spatially scattered (Lepisto and Kerminen 1970, Heinonen and Airaksinen 1974, Sundback 1976, Arvola 1980, LRpisto et al. 1981, Jones and Ilmavirta 1983 and Pur0 1989).
The water quality data for sampling site L1 is taken from the water quality data bank of the
NBWE. The sampling site, with a total depth of 12 metres, is close to the dam itself (Fig. 1). Ac- cording to Kinnunen (1985), water quality data at this site is representative for the main part of the reservoir. Samples from the surface to a depth of two metres were chosen to represent the water quality in water layers from which phytoplankton samples were taken. Only silica results were from a depth of five metres. The samples were analysed according to the standard methods of the labora- tories of the NBW (National Board of Waters 1981, 1984).
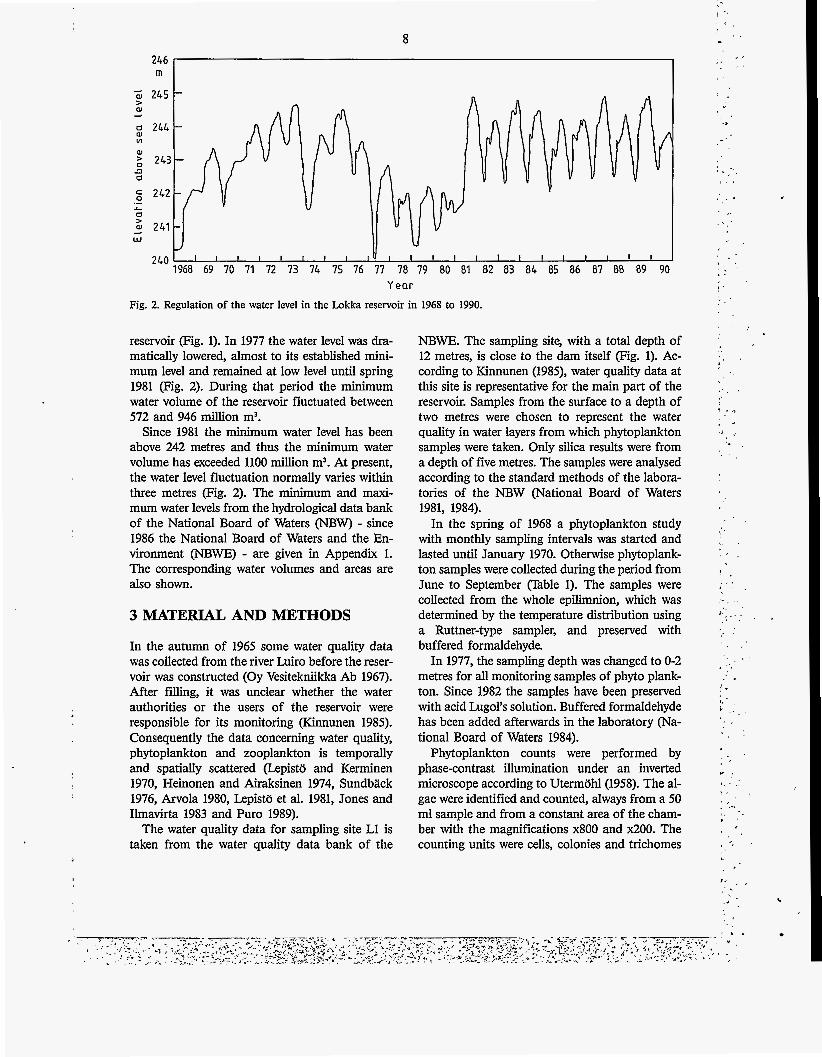
In the spring of 1968 a phytoplankton study with monthly sampling intervals was started and lasted until January 1970. Otherwise phytoplank- ton samples were collected during the period from June to September (Table 1). The samples were collected from the whole epilimnion, which was determined by the temperature distribution using a Ruttner-type sampler, and preserved with buffered formaldehyde
In 1977, the sampling depth was changed to 0-2 metres for all monitoring samples of phyto plank- ton. Since 1982 the samples have been preserved with acid Lugol's solution. Buffered formaldehyde has been added afterwards in the laboratory (Na- tional Board of Waters 1984).
Phytoplankton counts were performed by phase-contrast illumination under an inverted microscope according to Utermohl(l958). The al- gae were identified and counted, always from a 50 ml sample and from a constant area of the cham- ber with the magnifications x800 and x200. The counting units were cells, colonies and trichomes
1 . * . - ! '
. . .
' I
C
.
9
Table 1. Phytoplankton sampling dates in the Lokka reservoir in 1968-1990. * = one sample.
Month I
Year . 'I
I1 111 Iv V VI VI1 VI11 Ix X XI XI1
.
1968 1969 * 1970 * 1971 1972 1973 1974 1975 1976 1977 1978 1979 1980 1981 1982 1983 1984 1985 1986 1987 1988 1989 1990
* * * *
*
* *
*
** * *
* *
* *
* *
*
* *
* * *
* t
*
*
*
* ** *
* * * * *
*** **** ***** *
** *
* *
*
* * *
with a length of 100 pm. The identification of Au- Iacoseira species was confirmed by making diatom slides.
Cell counts were converted to volumes using the database of the NBWE with cell volumes of phytoplankton. The biomasses are given as fresh weight (mg 1' fw). Results have been added to the biological data bank of the NBWE.
In the summer of 1988, phytoplankton was sampled monthly or even weekly, as pad of a zooplankton study by Pur0 (1989), from sampling site L3 which is found in the same main basin as sampling site L1 (Fig. 1). There were no darked differences in water quality between these two points according to the results of Pur0 (1989). In the present study the total number of samplb was 62, 49 of them representing the growth period from June to September (Table 1).
In the phytoplankton investigation the period of observations was divided into two parts. The
period 1968-1971 was used to represent the early stage in the development of the reservoir. The period 1977-1990 was used to represent the erosion stage of the reservoir as defined by Vogt (1978) and Krzyzanek et al. (1986). The data from these periods were treated separately so as to identify the long term successional trend. Also the differ- ent months were treated separately to identify the different periods of growing season from June to September.
Those species which comprised more than 10 Vo of either total number or total biomass were regarded as abundant. The small species, although numerous, do not generally dominate the biomass. Thus in this paper the abundance of different taxa is also treated on the basis of their cell density. Those species which occurred almost every year, or periodically during several years are also considered, The share of small (nanoplank- ton), flagellated and heterotrophic species of the
10
total cell number and total biomass is also treated. Determining of heterotrophic species is based on literature
In order to classify the species into different in- dicator groups the indices of Jiirnefelt (1952, 1956) and Jhe fe l t et al. (1963) and Heinonen (1980) were applied to the material.
Systematics used in this work is based on the classification of Christensen (1980). In general the literature used for identification is the same as that presented in Tikkanen (1986) and Tikkanen and WillCn (1992). The list of species with author name is given in Appendix 2.
4 RESULTS 4.1 Water quality The annual average values of physico-chemical water quality variables from three periods, name- ly: 1968-1971, 1972-1981 and 1982-1990 (?able 2) were used together with phytoplankton results. The first period represents the early stage of the reservoir before regulation was initiated, the se- cond the erosion stage when water level fluctua- tions were large, including the period of strong regulation in 1977-1981, and the third represents the period with a more uniform regulation.
When water level regulation started it caused a massive transport of organic matter into the reser- voir. This increased load of organic compounds
into the recently filled reservoir was reflected by changes - which were reversed once water quality improved - in water colour, oxygen and nutrient concentrations as well as by changes in other water quality variables.
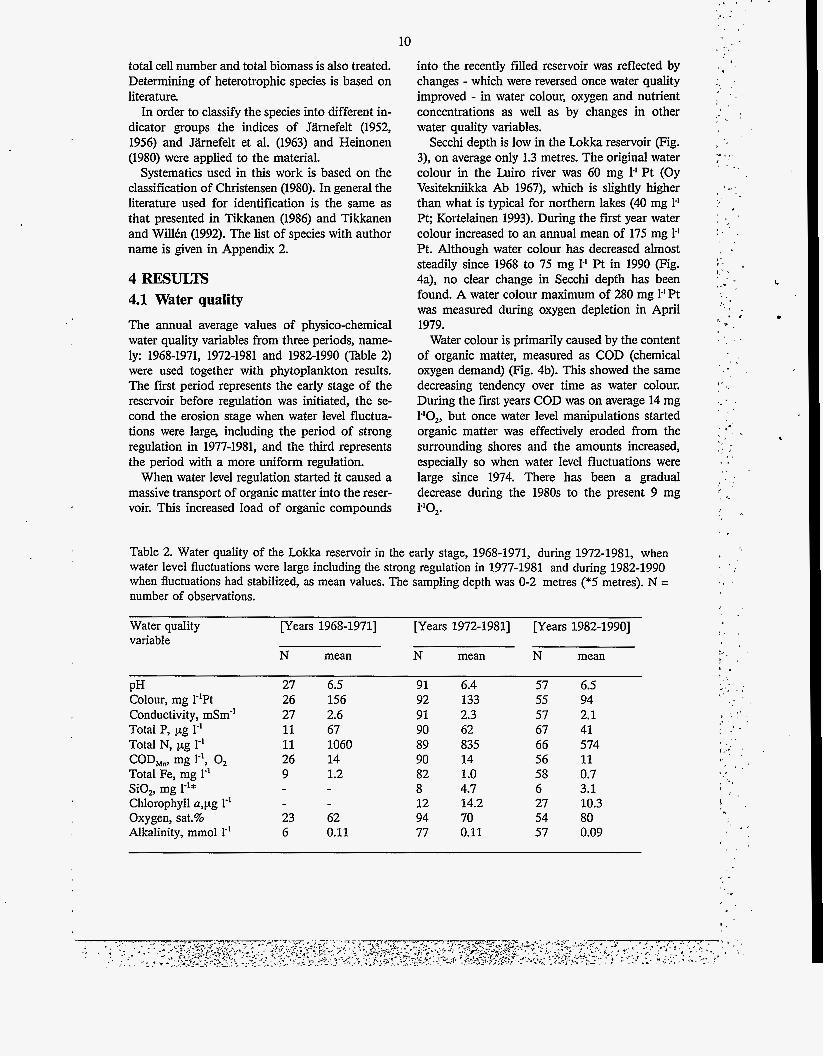
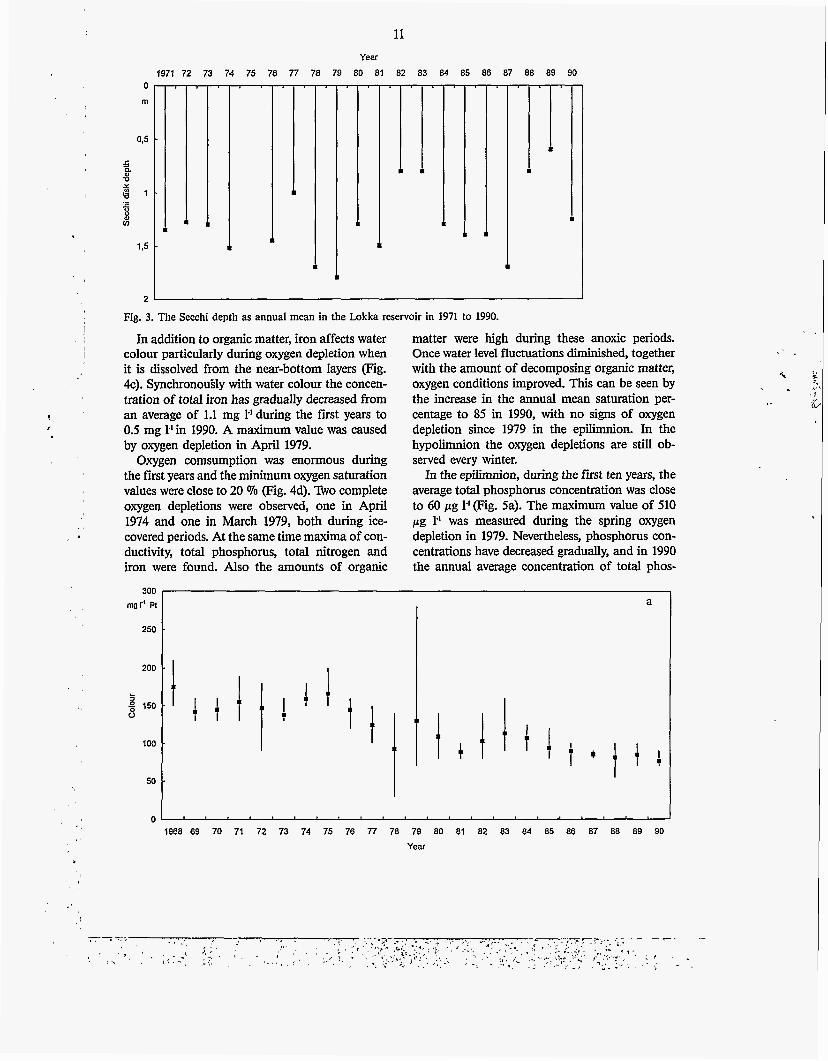
Secchi depth is low in the Lokka reservoir (Fig. 3), on average only 1.3 metres. The original water colour in the Luiro river was 60 mg 1.' Pt (Oy Vesitekniikka Ab 1967), which is slightly higher than what is typical for northern lakes (40 mg I' Pt; Kortelainen 1993). During the first year water colour increased to an annual mean of 175 mg 1' Pt. Although water colour has decreased almost steadily since 1968 to 75 mg 1-' Pt in 1990 (Fig. 4a), no clear change in Secchi depth has been found. A water colour maximum of 280 mg 1"Pt was measured during oxygen depletion in April 1979.
Water colour is primarily caused by the content of organic matter, measured as COD (chemical oxygen demand) Fig. 4b). This showed the same decreasing tendency over time as water colour. During the fiist years COD was on average 14 mg PO2, but once water level manipulations started organic matter was effectively eroded from the surrounding shores and the amounts increased, especially so when water level fluctuations were large since 1974. There has been a gradual decrease during the 1980s to the present 9 mg PO2.
Table 2. Water quality of the h k k a reservoir in the early stage, 1968-1971, during 1972-1981, when water level fluctuations were large including the strong regulation in 1977-1981 and during 1982-1990 when fluctuations had stabilized, as mean values. The sampling depth was 0-2 metres (*5 metres). N = number of observations.
Water quality Bears 1968-19711 [Years 1972-19811 Bears 1982-19901 variable
N mean N mean N mean
PH Colour, mg l-Pt Conductivity, mSm" Total P, pg l-' Total N, pg 1-' COD,,, mg l-I, 0, Total Fe, mg I-' SiO,, mg I-'* Chlorophyll u,pg 1" Oxygen, sat.% Alkalinity, mmol r'
27 26 27 11 11 26 9
23 6
6.5 156 2.6 67 1060 14 1.2
62 0.11
91 92 91 90 89 90 82 8 12 94 77
6.4 133 2.3 62 835 14 1 .o 4.7 14.2 70 0.11
- 57 55 57 67 66 56 58 6 27 54 57
6.5 94 2.1 41 574 11 0.7 3.1 10.3 80 0.09
1 . I (
' ,
. . " ,
. .
. . ' I
' . . I ' .
11
.
0
m
Fig. 3. The Secchi depth as annual mean in the Lokka reservoir in 1971 to 1990.
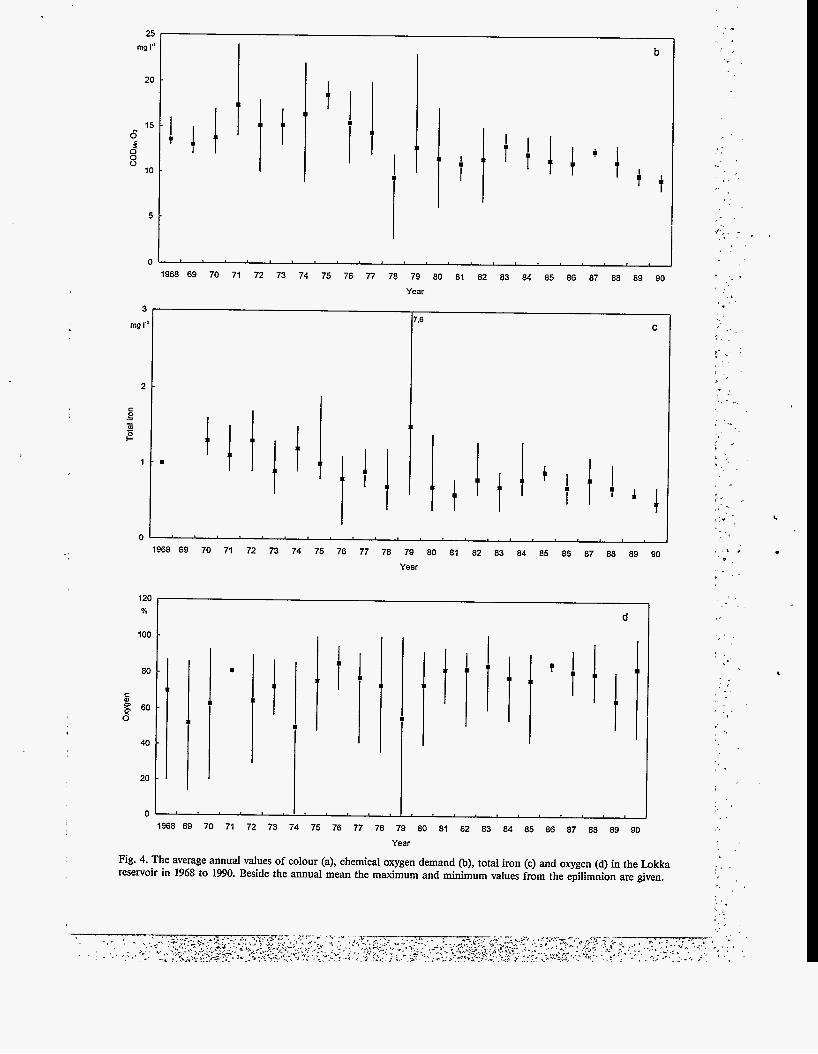
In addition to organic matter, iron affects water colour particularly during oxygen depletion when it is dissolved from the near-bottom layers (Fig. 4c). Synchronou'sly with water colour the concen- tration of total iron has gradually decreased from an average of 1.1 mg 1.' during the first years to 0.5 mg 1-I in 1990. A maximum value was caused by oxygen depletion in April 1979.
Oxygen comsumption was enormous during the first years and the minimum oxygen saturation values were close to 20 07'0 (Fig. 4d). %o complete oxygen depletions were observed, one in April 1974 and one in March 1979, both during ice- covered periods. At the same time maxima of con- ductivity, total phosphorus, total nitrogen and iron were found. Also the amounts of organic
matter were high during these anoxic periods. Once water level fluctuations diminished, together with the amount of decomposing organic matter, oxygen conditions improved. This can be seen by the increase in the annual mean saturation per- centage to 85 in 1990, with no signs of oxygen depletion since 1979 in the epilimnion. In the hypolimnion the oxygen depletions are still ob- served every winter.
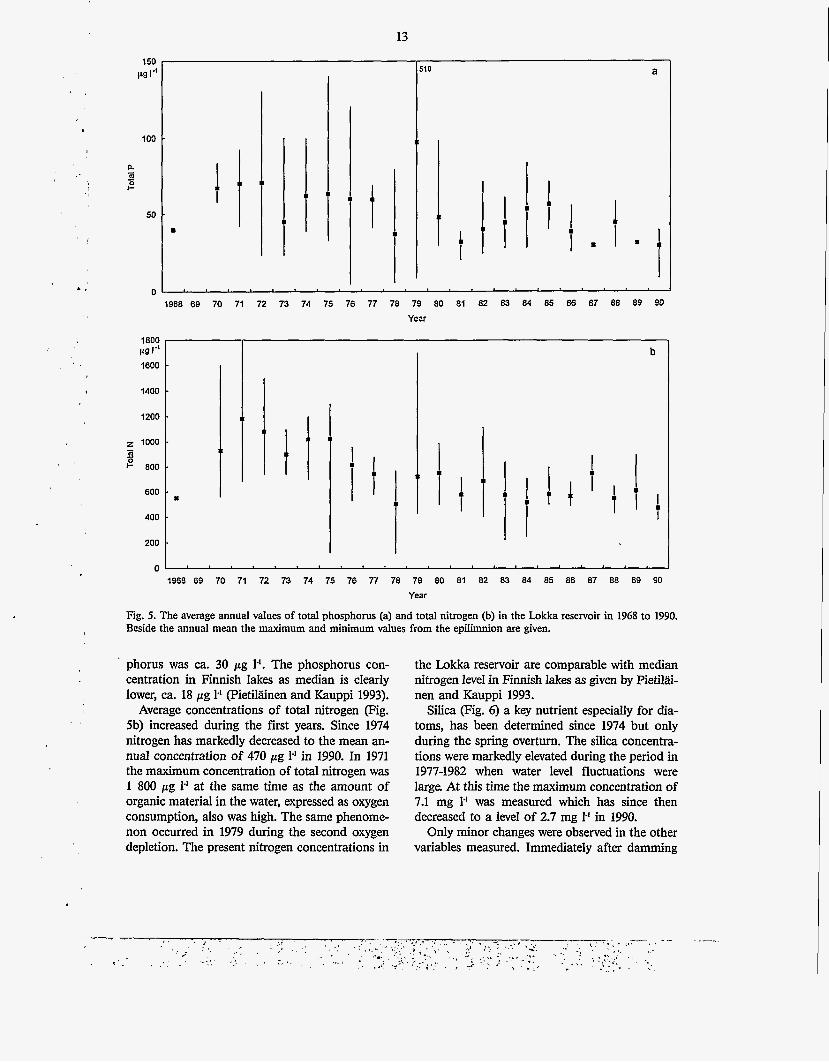
In the epilimnion, during the first ten years, the average total phosphorus concentration was close to 60 ,ug 1-1 (Fig. Sa). The maximum value of 510 pg 1-1 was measured during the spring oxygen depletion in 1979. Nevertheless, phosphorus con- centrations have decreased gradually, and in 1990 the annual average concentration of total phos-
300 a
1 mg r1 PI
250
200
100
50
c
II
I I
8
I
21 mg r
20
15 e 0' 8
10
5
0
b
t
.' , ,
1968 69 70 71 72 73 74 75 76 77 78 79 80 81 82 83 84 85 86 87 88 89 90
Year
6 C
- , I - , ,,
i * I ,
c
1968 69 70 71 72 73 74 75 76 77 78 79 80 81 82 83 84 85 86 87 88 89 90
Year
. 120 %
100
I
, .
' S
80 ' I
I .
1 %
, , 2.
40
20
I , , , , , I , , , I 1968 69 70 71 72 73 74 75 76 77 78 79 80 81 82 83 84 85 86 87 88 89 90
Year
Fig. 4. The average annual values of colour (a), chemical oxygen demand @), total iron (c) and oxygen (d) in the Lokka reservoir in 1968 to 1990. Beside the annual mean the maximum and minimum values from the epilimnion are given.
13
510
I '
I
t
150 Irg 1.l
100
50
0
1800
1800
1400
1200
z 1000
pg 1''
- L
800
600
400
200
0
I
I
a
m
b
Fig. 5. The average annual values of total phosphorus (a) and total nitrogen (b) in the Lokka reservoir in 1968 to 1990. Beside the annual mean the maximum and minimum values from the epilimnion are given.
phorus was ca. 30 pg 1'. The phosphorus con- centration in Finnish lakes as median is clearly lower, ca. 18 pg 1' (Pietilgnen and Kauppi 1993).
Average concentrations of total nitrogen (Fig. 5b) increased during the first years. Since 1974 nitrogen has markedly decreased to the mean an- nual concentration of 470 pg 1' in 1990. In 1971 the maximum concentration of total nitrogen was 1 800 pg 1' at the same time as the amount of organic material in the water, expressed as oxygen consumption, also was high. The same phenome- non occurred in 1979 during the second oxygen depletion. The present nitrogen concentrations in
the Lokka reservoir are comparable with median nitrogen level in Finnish lakes as given by Pietiliii- nen and Kauppi 1993.
SiIica pig. 6) a key nutrient especially for dia- toms, has been determined since 1974 but only during the spring overturn. The silica concentra- tions were markedly elevated during the period in 1977-1982 when water level fluctuations were large At this time the maximum concentration of 7.1 mg 1' was measured which has since then decreased to a level of 2.7 mg I-' in 1990.
Only minor changes were observed in the other variables measured. Immediately after damming
14
8 rng I-'
7 - rn 6 -
5 -
$4-¤ (0
3 -
2 -
rn m
m rn
1 -
0 I I I 1 I I I I I I I 1 I I I I
78 80 82 84 86 88 90 1974 76 Year
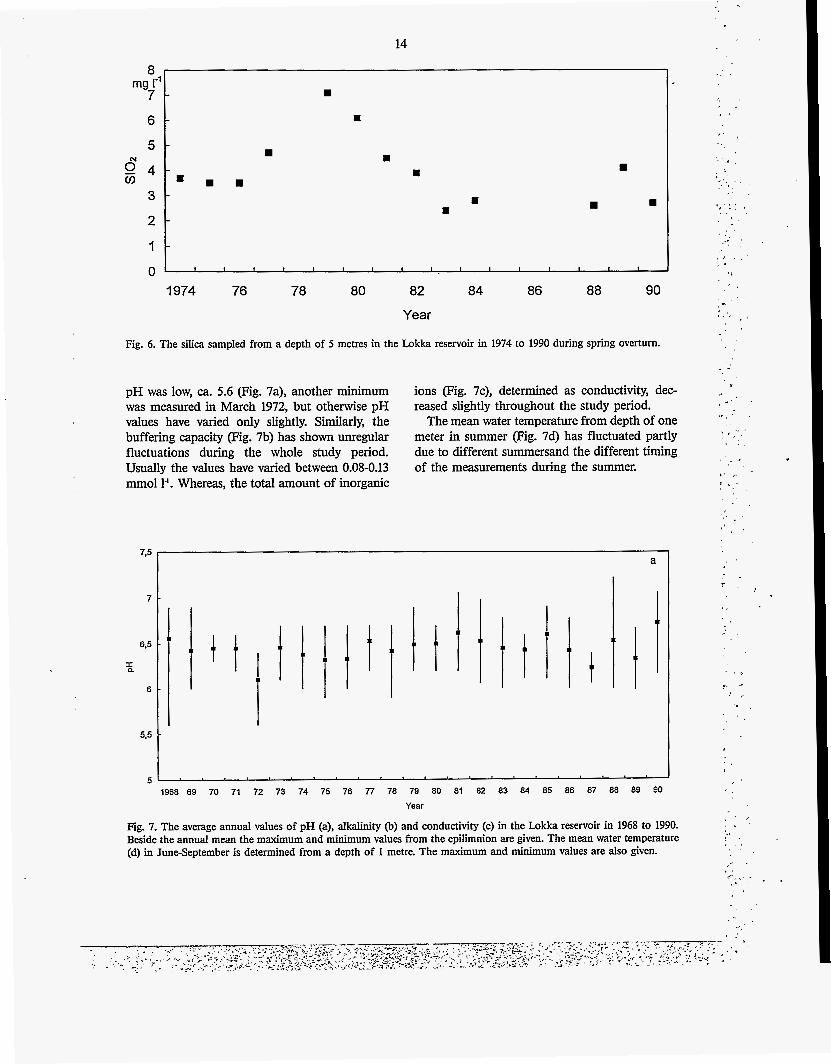
Fig. 6. The silica sampled from a depth of 5 metres in the Lokka reservoir in 1974 to 1990 during spring overturn.
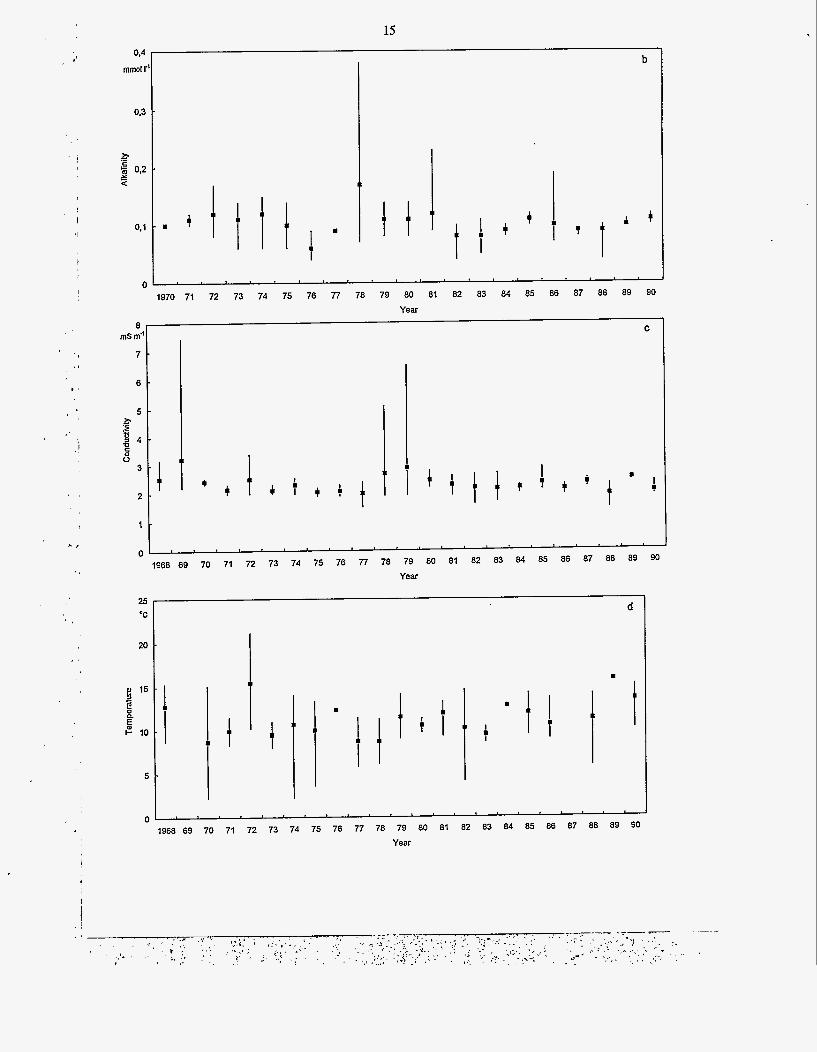
pH was low, a. 5.6 (Fig. 7a), another minimum was measured in March 1972, but otherwise pH values have varied only slightly. Similarly, the buffering capacity (Fig. 7b) has shown unregular fluctuations during the whole study period. Usually the values have varied between 0.08-0.13 mmol 1.'. Whereas, the total amount of inorganic
ions (Fig. 7c), determined as conductivity, dec- reased slightly throughout the study period.
The mean water temperature from depth of one meter in summer (Fig. 7d) has fluctuated partly due to different summersand the different timing of the measurements during the summer.
73
7 - I
I t 5'5 t
1968 E9 70 71 72 73 74 75 78 77 78 79 80 81 E2 83 84 85 86 87 08 E9 90 Year
Fig. 7. The average annual values of pH (a), alkalinity (b) and conductivity (c) in the Lokka reservoir in 1968 to 1990. Beside the annual mean the maximum and minimum values from the epilimnion are given. The mean water temperature (d) in June-September is determined from a depth of 1 metre. The maximum and minimum values are also given.
15 0,4
mmol I.
0.3
0 .- : 0,2 X a
0
8 ms m"
7
6
5 0 '3 .- .u 9 4
8 3
2
1
0
b
I
1970 7 Year
C
1968 69 70 71 72 73 74 75 76 ?? 78 79 80 61 02 83 04 85 86 87 88 89 90
25
'C
20
p! 15
2 F 10
a
E
Year
d
1968 69 70 71 72 73 74 75 76 77 78 79 80 81 82 83 84 85 86 87 88 89 90 Year
4.2 Phytoplankton succession: biomass and species composition
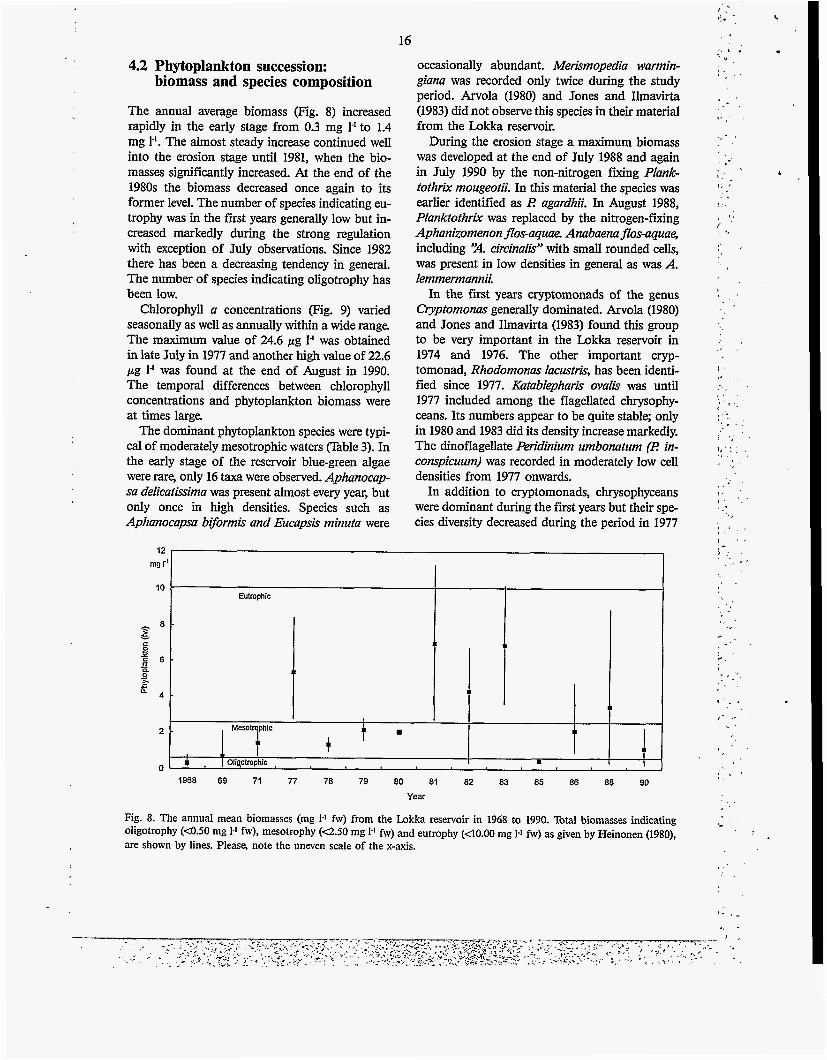
The annual average biomass (Fig. 8) increased rapidly in the early stage from 0.3 mg 1' to 1.4 mg 1'. The almost steady increase continued well into the erosion stage until 1981, when the bio- masses significantly increased. At the end of the 1980s the biomass decreased once again to its former level. The number of species indicating eu- trophy was in the fnst years generally low but in- creased markedly during the strong regulation with exception of July observations. Since 1982 there has been a decreasing tendency in general. The number of species indicating oligotrophy has been low.
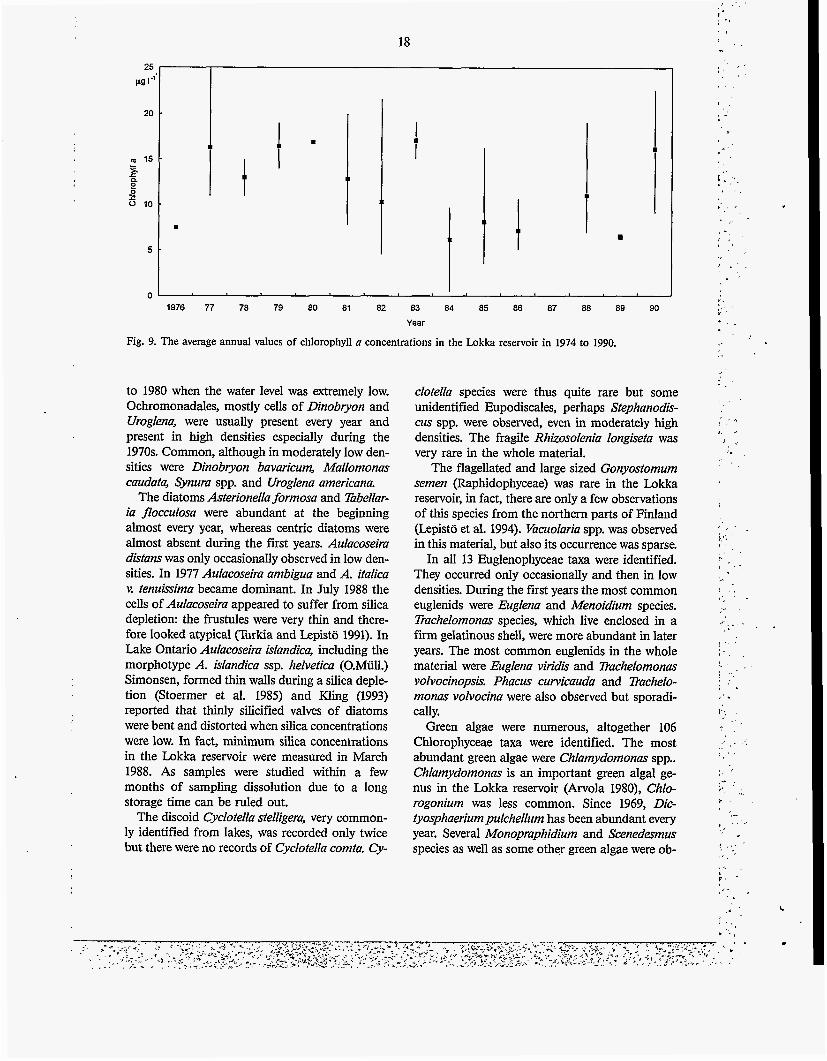
Chlorophyll a concentrations (Fig. 9) varied seasonally as well as annually within a wide range The maximum value of 24.6 pg I' was obtained in late July in 1977 and another high value of 22.6 pg 1.' was found at the end of August in 1990. The temporal differences between chlorophyll concentrations and phytoplankton biomass were at times large
The dominant phytoplankton species were typi- cal of moderately mesotrophic waters D b l e 3). In the early stage of the reservoir blue-green algae were rare, only 16 taxa were observed. Aphanocap- sa delicatissma was present almost every year, but only once in high densities. Species such as Aphanocapsa bifomk and Eucapsk minuta were
16
occasionally abundant. Merismopedia warmin- giana was recorded only twice during the study period. Arvola (1980) and Jones and Ilmavirta (1983) did not observe this species in their material from the Lokka reservoir.
During the erosion stage a maximum biomass was developed at the end of July 1988 and again in July 1990 by the non-nitrogen fixing Plank- tothrix mougeotii. In this material the species was earlier identified as R agardhii. In August 1988, Planktothrix was replaced by the nitrogen-fixing Aphanizomenon jlos-aquae. Anabaena jlos-aquae, including '2. circinalk" with small rounded cells, was present in low densities in general as was A. lemrnermannii.
In the first years cryptomonads of the genus Cryptomonas generally dominated. Arvola (1980) and Jones and Ilmavirta (1983) found this group to be very important in the Lokka reservoir in 1974 and 1976. The other important cryp- tomonad, Rhodomonas lamtris, has been identi- fied since 1977. Katablepharis ovalk was until 1977 included among the flagellated chrysophy- ceans. Its numbers appear to be quite stable; only in 1980 and 1983 did its density increase markedly. The dinoflagellate Peridinium umbonatum (R in- conspicuum) was recorded in moderately low cell densities from 1977 onwards.
In addition to cryptomonads, chrysophyceans were dominant during the first years but their spe- cies diversity decreased during the period in 1977
12 mg r1
10 . Eulmphic
8 - 2
I 0 II 3 E 6 - - Q
Q I
r 4 - a I 1
I
I
Meso! phic I , I + 2 - t I1
OlQotmphic O L '
m I
1968 69 71 77 78 79 80 81 82 83 85 86 88 90
Year
Fig. 8. The annual mean biomasses (mg I-' fw) from the Lokka reservoir in 1968 to 1990. Total biomasses indicating oligotrophy (4.50 mg 1.' fw), mesotrophy (Q.50 mg 1.' fw) and eutrophy (40.00 mg 1.1 fw) as given by Heinonen (1980), are shown by lines. Please, note the uneven scale of the x-axis.
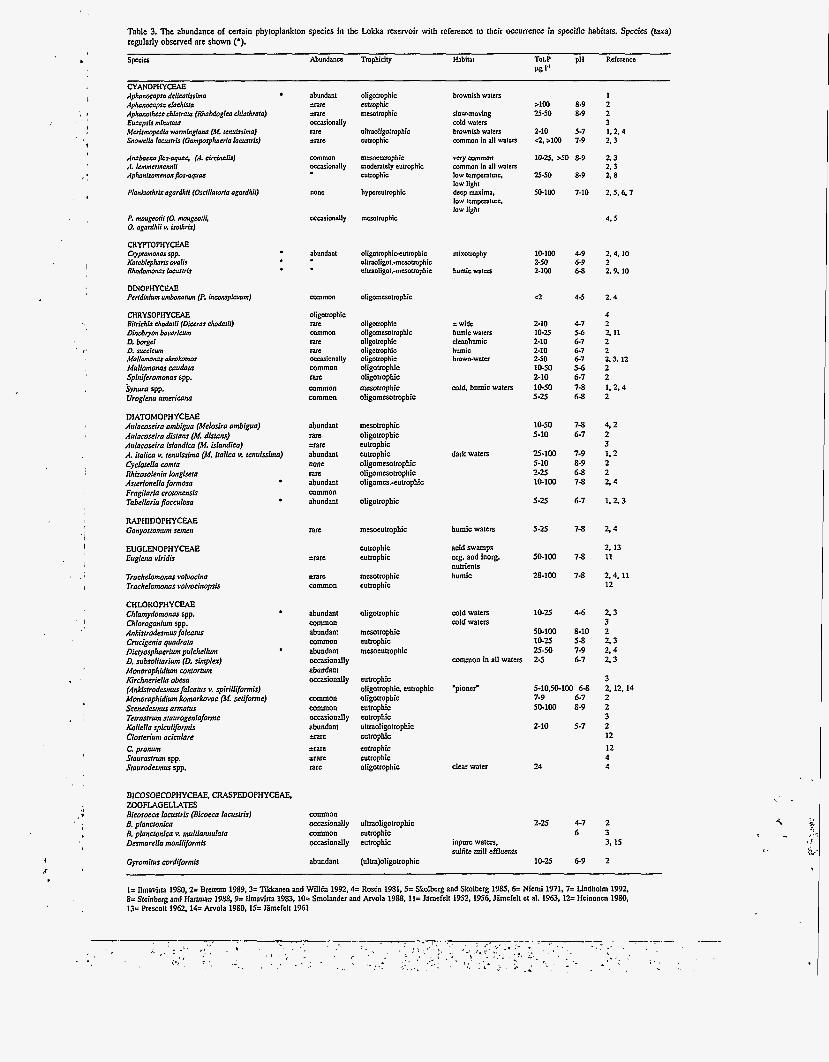
Table 3. The abundance of certain phyloplankton species in the Lokka reservoir with reference to their Occurrence in specific habitats. Species (taxa) regularly observed are shown p). S p ' C S Abundana Tmphicity Habitat T0t.P pH Rcfercncc
Pg I.'
CYrnOPHYCEAE Aphamapsa delicarirrima abundant oligotrophic brownish waters 1 Aphanocapsa eladirra :rare eutrophic >lo0 8-9 2 AphaMrhecc chbrrala (f?habdogka ch/afhrafa) *rare mesotrophic slow-moving 25-50 a-9 2 Eucapsir mitturara occasionally cold waters 3 Merismopedin wanninglann (M. renuirsim) me ulfrdoligolrophic brownish wafers 2-10 5-7 1.2.4 Snowclin facwrris (Gompqhacrfa Iamris) %rare eutrophic common in all waters 4, >lo0 7-9 2.3
Anabornapor-aquae, (A. circinalir) A. IcmmermMii Aphaniwmmonj7os-aquae
Pla&orhru agardhii (Oscillarorin agnrdhii)
P. mougeorii (0. mougeorii, 0. aprdhii v. irorhrir)
CRYFTOPHYCEAE
Karablrpharis avaiir Rhodamonas facvrrrtr
DINOPHYCEAE Peddhium U&MIWI (P. incoiupicuum)
CHRYSOPHYCEAE Bitrichla chodarii (Diems chodorii) Dinabryon bovnrfcwn D. borgcl D. ~ e d c u m M a l l a ~ r ~ o * o m o s Mnllomonas caudarn Spinferomonas spp. iynura spp. Uroglenn omericana
DIATOMOPHYCEAE Aulncoseira ambigun (Melatira nmbigua) Aulacoseirn disfans (M. d u m ) Aulncoseiro islnndicn (M. islandica) A. iralica v. renuissimn (M. iralicn v. renuissirnu) CyclorelrO comfa Rhizosolenin longisera Asrerianelln formosa Fragilarln croronensis Tabellaria pocculosa
RAPHIDOPHYCEAE Gonyosromwn semen
EUGLENOPHYCEAE Eugfenn viridu
C~plOmOMS Spp.
mmmon mew~ulmphic occasionally moderately eutrophic
eutrophic
none hypcrculrophic
occasionally mesotrophic
very wmmon 10-25. S O 8-9 2.3 2.3 common in all waters
low tempcralurc. 2540 8-9 Z 8 low light dccp maxima, 50-1M) 7-10 2.5. 6.7 low lempcraturc. low light
4.5
abundant
wmmon
oligotrophic rare common ran mC occasionally common
mmmon common
rare
abundant m e f I X C abundant nunc rare abundant common abundant
I X C
*rare
:rare common
abundanl common abundant common abundant occasionally abundant occasionally
mmmon common occasionally abundant + I X C
trare -re rare
oligotrophicsutrophic ultraoligol.-mesotmphic ultraoligol.-mcsolrophic
mixotmphy
hvmicwatcrs
10-1M) 2-50 2-1w
Q
2-10 10-25 2-10 2-10 2-50 10-50 2-10 10-50 5-25
10-50 5-10
25-100 5-10 2-25 10-100
5-25
5-25
50-100
28-100
10-25
50-100 10-2.5 25-50 2-5
4-9 6.9 6 8
4-5
4-7 5-6 6-7 6-1 6.7 5-5 6-7 7-8 6-8
7-8 6-7
7-9 8-9 6-8 7-8
6-7
7-8
7-8
7-8
44
8-10 5-8 7-9 6-7
14.10 2 2.9. 10
2.4
4 2 2.11 2 2 2.3. 12 2 2 1.2.4 2
4.2 2 3 1.2 2 2 2.4
1.2.3
2.4
2, 13 11
2.4. 11 12
2.3 3 2 2.3 2.4 2.3
3 2.1214 2 2 3 2 12 12 4 4
oligomesotrophic
oligotrophic oligomesotmphic oligotmphic oligotrophic oligotrophic oligotrophic oligotrophic mesotrophic oligomesotrophic
wide humic waters dcarhumic humic b m - w a t e r
mld. humic waters
mesotrophic oligotrophic eutrophic eutrophic oligomeso~mphic oligomesotrophic oligomcs.-cutrophic
dark waters
oligotrophic
mesoeutrophic
eutrophic eutrophic
mesotrophic eutrophic
humic waters
acid swamps org. and inorg. nutrients humic
' I 1
Trachelomonns volvocina Troche[omanns volvocinopsis
CH LO R 0 P HY CEAE Chlamydomonas spp. Chloroganiwn spp. Ankistrodesmus falcaw Cruclgenia quadrnfa Dicfyosphaeriwn pulchellwn D. subsoliloriwn (0. simplex) Monornphidiwn conlarm Kirchneriel!n obesn (Anhifrodamus fnlcnw v. spirillifarmisJ Monoraphidiwn bmarkovae (M. seriforme) Scencdesmus a m w Tefrasrrwn stnurogeninforme Itoliella spiculiformis Closterium ociculare C pronwn Sraurnsfrum spp. Srnurodesmus spp.
oligotrophic
mesotrophic eutrophic mesoeutrophic
mld waters m l d waters
mmmon in all waters
'pioncr' eutrophic oligotrophic, eutrophic oligotrophic eutrophic eutrophic ultraoligotrophic eutrophic cutmphic eutrophic oligotrophic
5-10.50-100 6-8 7-9 6-7 50-100 8-9
2-10 5-7
clcar water 24
BICOSOECOPHYCEAE, CRASPEDOPHYCEAE, ZOOFIAGELLATES Bicosoeca lacusrris (Bicoeca lncusrrir) mmmon
8. plnncronicn v. mulriannulara mmmon cutropbic 6 3 6. plancronica occasionally ultraoligotrophic 4-7 2
Desmnrella monilifarmis occasionally eutrophic inpurc waters, 3, 15 sulfite mill effluents
Gyromilus cordiformis abundant (ultra)oligotrophic 10-25 6-9 2
2-25
I= Ilmavirta 1980.2= Brcttum 1989,3= Ttkkanen and Willtn 1992,4= Rosin 1981.5;. Skolberg and Skolbcrg 1985.6= Nicmi 1971.7= Lindholm 1992. 8= Steinberg and Hanman 1988,9= llmavirta 1983,10= Smolander and b o l a 1988.11= Jlmefelt 1952.1956, JSmcfclt et al. 1963.12= Hcinoncn 1980. 13= Prescot~ 1962. 14= Arvola 1980.15= JSmefelt 1961
18
I
1
1976 77 78 79 80 a i a2 03 a4 a5 a6 a7 aa a9 90 Year
Fig. 9. The average annual values of chlorophyll a concentrations in the Lokka reservoir in 1974 to 1990.
to 1980 when the water level was extremely low. Ochromonadales, mostly cells of Dinobryon and Uroglena, were usually present every year and present in high densities especially during the 1970s. Common, although in moderately low den- sities were Dinobryon bavaricum, Mallomonas caudata, Synura spp. and Uroglena americana.
The diatoms Asterionella formosa and Tabellar- ia flocculosa were abundant at the beginning almost every year, whereas centric diatoms were almost absent during the first years. Aulacoseira distans was only occasionally observed in low den- sities. In 1977 Aulacoseira ambigua and A. italica v. tenuissima became dominant. In July 1988 the cells of Aulacoseira appeared to suffer from silica depletion: the frustules were very thin and there- fore looked atypical (Turkia and Lepisto 1991). In Lake Ontario Aulacoseira islandica, including the morphotype A. klandica ssp. helvetica (0.MUll.) Simonsen, formed thin walls during a silica deple- tion (Stoermer et al. 1985) and Kling (1993) reported that thinly silicified valves of diatoms were bent and distorted when silica concentrations were low. In fact, minimum silica concentrations in the h k k a reservoir were measured in March 1988. As samples were studied within a few months of sampling dissolution due to a long storage time can be ruled out.
The discoid Cyclotella stelligera, very common- ly identified from lakes, was recorded only twice but there were no records of Cyclotella comta. Cy-
clotella species were thus quite rare but some unidentified Eupodiscales, perhaps Stephanodis- cus spp. were observed, even in moderately high densities. The fragile Rhizosolenia longiseta was very rare in the whole material.
The flagellated and large sized Gonyostomum semen (Raphidophyceae) was rare in the h k k a reservoir, in fact, there are only a few observations of this species from the northern parts of Finland (Lepisto et al. 1994). Vamolaria spp. was observed in this material, but also its occurrence was sparse.
In all 13 Euglenophyceae taxa were identified. They occurred only occasionally and then in low densities. During the first years the most common euglenids were Euglena and Menoidium species. Trachelornonas species, which live enclosed in a firm gelatinous shell, were more abundant in later years. The most common euglenids in the whole material were Euglena viridis and Trachelomonas volvocinopsk. P h a m curvicauda and Trachelo- monas volvocina were also observed but sporadi- cally.
Green algae were numerous, altogether 106 Chlorophyceae taxa were identified. The most abundant green algae were Chlamydomonas spp.. Chlamydomonas is an important green algal ge- nus in the Jhkka reservoir (Arvola 1980), Chlo- rogonium was less common. Since 1969, Dic- tyosphaerium pulchellum has been abundant every year. Several Monopraphidium and Scenedesmus species as well as some other green algae were ob-
.
served, especially during the strong regulation in 1977-1981 in moderately high cell densities (Ap- pendix 2). Monoraphidium contortum (Ankist rodesmus falcatus v. spirilliformis), a very impor- tant species in the Lokka reservoir, according to Arvola (1980) and Jones and Ilmavirta (1983), was recorded for the first time in August 1971, and in very high densities. Another peak occurrence was in June and July 1977. Since 1982 its cell density decreased clearly and after 1988 there are no records of the species. At this time the water level fluctuations diminished markedly.
Before 1980 Koliella spiculiformis was identi- fied as Ankistrodesmus falcatus. The morpholo- gy of these two species differ only slightly: Koliella has the typical transverse cell division of Ulotrichales. The possibility of erroneous iden- tification was pointed out by Tikkanen and WillCn (1992) among others. However, their ecol- ogy differs clearly (Table 3) . Occasionally K. spiculiformis was present in high cell densities. In all Ulotrichales, generally filamentous species, increased clearly during the 1980s.
Desmids such as Closterium aciculare and C. pronum were present in 1977 in high densities. This may have been partly caused by flushing from the littoral zone when the water level fluctu- ated strongly. Several species of Cosmarium, Staurastrum and Staurodesmus were observed occasionally in low cell numbers in 1988 and 1990.
During the first years colourless Bicosoeca Iacustris and B. planctonica were abundant. Bac- terial amounts must have been enormous during the first years because of the decomposing mat- ter. Colourless craspedomonads were particular- ly abundant in the early years, Desmarella moniliformis developed rather high cell densities. The zooflagellate Gyromitus cordiformis was present every year, generally in July-August with only a few exceptions.
4.2.1 The early stage: 1968-1971
In the early stage, the highest number of taxa found in June was 24 including three eutrophy indicating species (Table 4). Average biomass was 0.87 mg 1-1 (s=l.l and n=3). During the first years chrysophyceans, like Syncrypta spp. and cryptomonads were alternatively dominant (Ta- ble 5). These flagellated algae were generally small (Table 6). In 1971 the blue-green alga Eu-
19
capsis minuta and the flagellated green alga Chlamydomonas spp. were prevalent causing a higher biomass (Fig. 10). Only Aphanocapsa delicatissima, Desmarella moniliformis and unidentified Bacillariales were recorded in all three years. No Eupodiscales (centric diatoms) were observed.
The species composition in July varied be- tween the years 1968 and 1969 (Fig. ll) and the biomasses were low, 0.18 mg 1-I and 0.11 mg 1' respectively (Table 4). The number of taxa was low, including, at the most, only four eutrophy indicators. Flagellated, generally small (Table 6) chrysophyceans and also cryptomonads were dominant. Monoraphidium komarkovae and Tabel laria flocculosa were observed in both years (Table 7). Euglenid Menoidium spp. occurred in higher density in 1969.
In August the species composition also varied between the years 1968, 1969 and 1971 although the cell density was generally higher than in July. The mean biomass was 1.11 mg 1' (s=O.9, n=3) (Fig. 12). A maximum of 34 taxa was identified with no more than three eutrophy indicators (Ta- ble 4). Cryptomonas spp. were dominant with high cell numbers in all three years. In 1971 green algae almost dominated the biomass. Green alga Monoraphidium contortum accounted for 61 Yo of the total cell density, although the biomass re- mained low because of their small size (Table 8). Also flagellated species were important (Table 6).
In September 1965 before the damming of the
mass in the river Luiro was 0.03 mg 1-I and the number of species was high, altogether 55. The cell density was low, with unidentified Bacillari- ales as the dominant species. Eupodiscales were rare. A total of 12 eutrophy indicators were recorded and the number of oligotrophy indica tors was three (Oy Vesitekniikka Ab 1967).
In September 1968-1971 the mean biomass in the reservoir was 0.54 mg 1-1 (s=0.7, n=3). The number of taxa was at its highest 44, altogether with six eutrophy-indicating species (Table 4). Aphanocapsa delicatissima, Cryptomonas spp. and Mallomonas akrokomos were observed in all samples. More than one half of the biomass and cell density was due to Asterionella formosa in 1971 (Fig. 13, Table 9), when Monoraphidium contortum accounted for 15 Yo of the total cell density. Flagellated small species were still im- portant (Table 6).
\ . river Luiro was initiated the phytoplankton bio-
% . % -
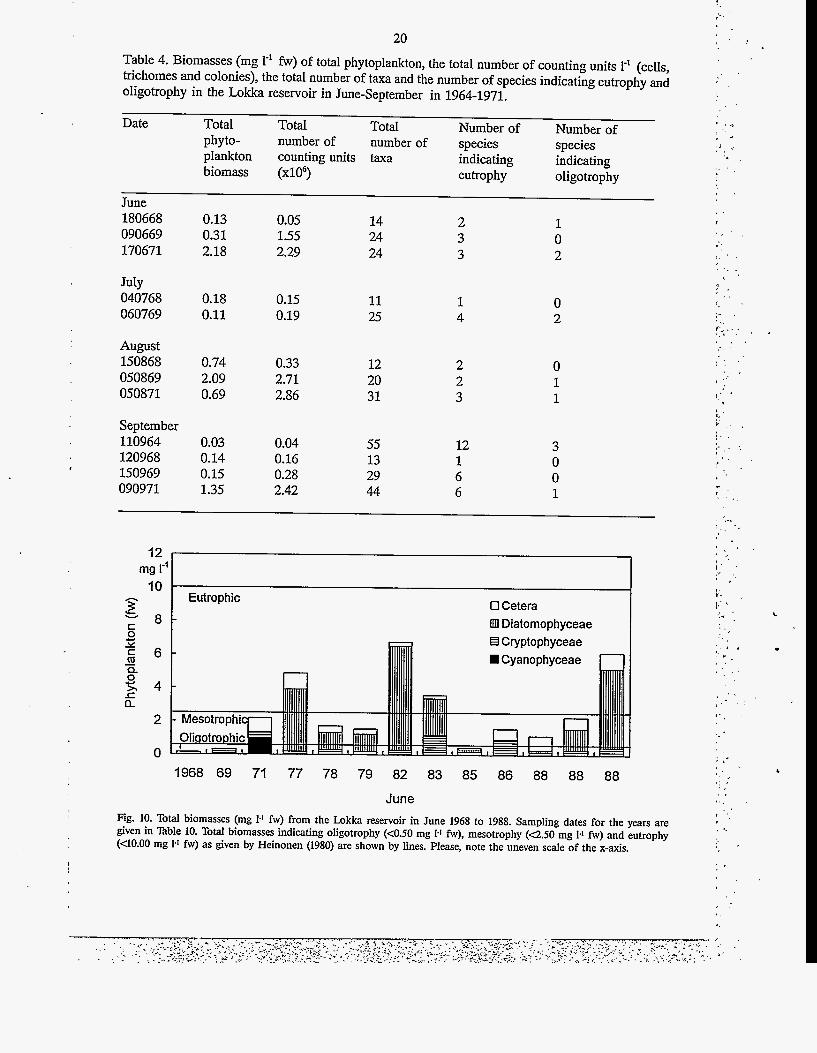
20 Table 4. Biomasses (mg I-' fw) of total phytoplankton, the total number of counting units I-* (cells, trichomes and colonies), the total number of taxa and the number of species indicating eutrophy and oligotrophy in the Lokka reservoir in June-September in 1964-1971.
Date Total Total Total Number of Number of phyto- number of number of species species plankton counting units taxa indicating indicating biomass (x106) eutrophy oligotrophy
June 180668 090669 170671
July 040768 060769
August 150868 050869 050871
September 110964 120968 150969 090971
0.13 0.31 2.18
0.18 0.11
0.74 2.09 0.69
0.03 0.14 0.15 1.35
0.05 1.55 2.29
0.15 0.19
0.33 2.71 2.86
0.04 0.16 0.28 2.42
14 24 24
11 25
12 20 31
55 13 29 44
2 3 3
1 4
2 2 3
12 1 6 6
1 0 2
0 2
0 1 1
3 0 0 1
12 rng I-' 10
8 UU Diatornophyceae v f c 0 z €I Cryptophyceae - (II = 6 Cyanophyceae
5 4 a
2
0
P 0
c
1968 69 71 77 78 79 82 83 85 86 88 88 88
June Fig. 10. Total biomasses (mg 1-1 fw) from the h k k a reservoir in June 1968 to 1988. Sampling dates for the years are given in Table 10. Total biomasses indicating oligotrophy (c0.50 mg 1-1 fw), mesotrophy (4 .50 mg 1-1 fw) and eutrophy (UO.00 mg 1-1 fw) as given by Heinonen (1980) are shown by lines. Please, note the uneven scale of the x-axis.
21
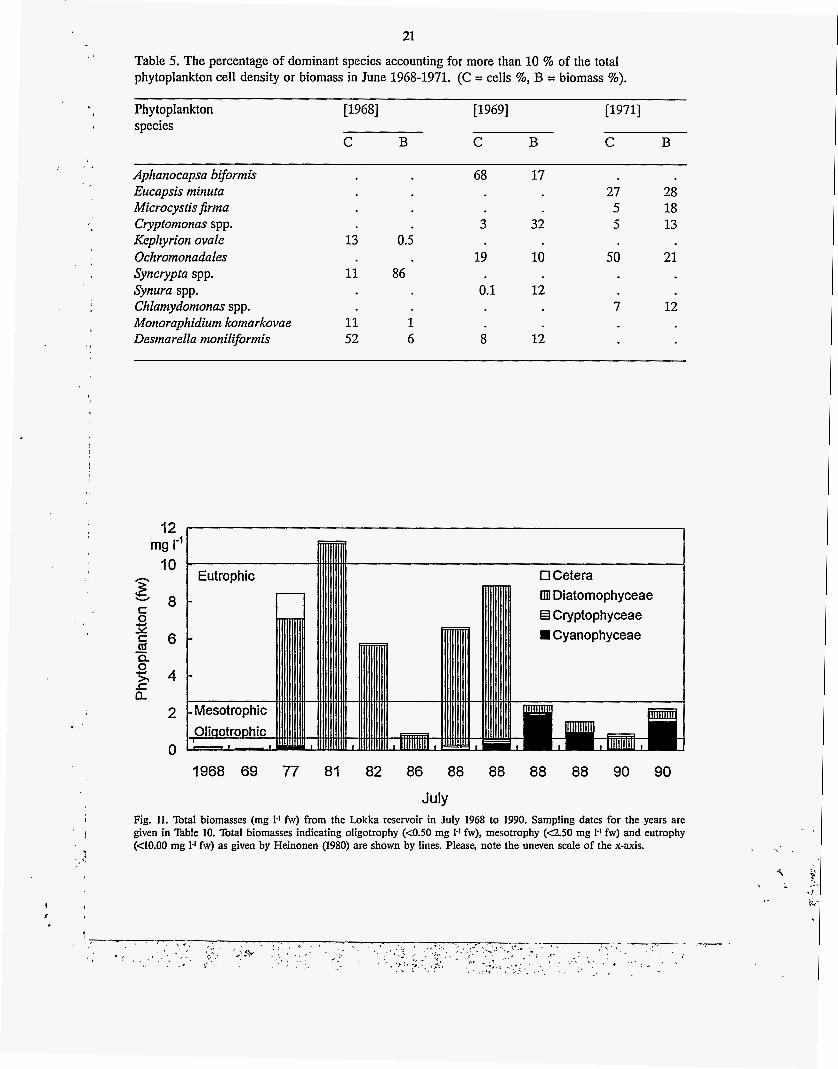
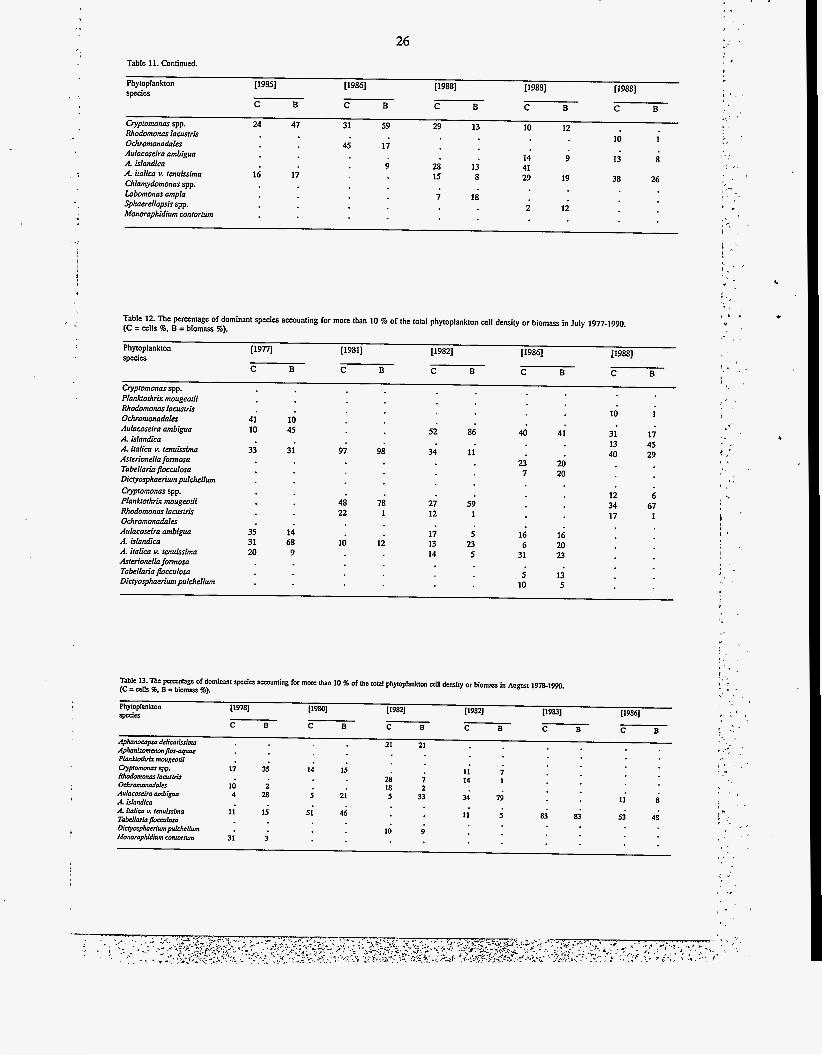
Table 5. The percentage of dominant species accounting for more than 10 % of the total phytoplankton cell density or biomass in June 1968-1971. (C = cells %, B = biomass %).
f
Phytoplankton [1968] [1969] [1971]
species B C B C B C
68 17 Aphanocapsa biformis 28 Eucapsis minuta
5 18 Microcystis firma 13 Cryptomonas spp. Kephyrion ovale 13 0.5 Ochromonadales Syncrypta spp. 11 86 Synura spp. 12 Chlamydomonas spp. Monoraphidium komarkovae Desmarella moniliformis
27
3 32 5
19 10 50 21
0.1 12 7
11 1 52 6 8 12
t
12 I
mg I-’ 10
8
6
4
2
n
0 Cetera IIU Diatomophyceae f3 Cryptophyceae H Cyanophyceae
- J -
1968 69 77 81 82 86 88 88 88 88 90 90
July Fig. 11. Total biomasses (mg 1.1 fw) from the Lokka reservoir in July 1968 to 1990. Sampling dates for the years are given in Table 10. Total biomasses indicating oligotrophy (<OS0 mg 1.’ fw), mesotrophy (4.50 mg 1-1 fw) and eutrophy (<10.00 mg 1-1 fw) as given by Heinonen (1980) are shown by lines. Please, note the uneven scale of the x-axis.
4.2.2 The erosion stage: 1977-1990
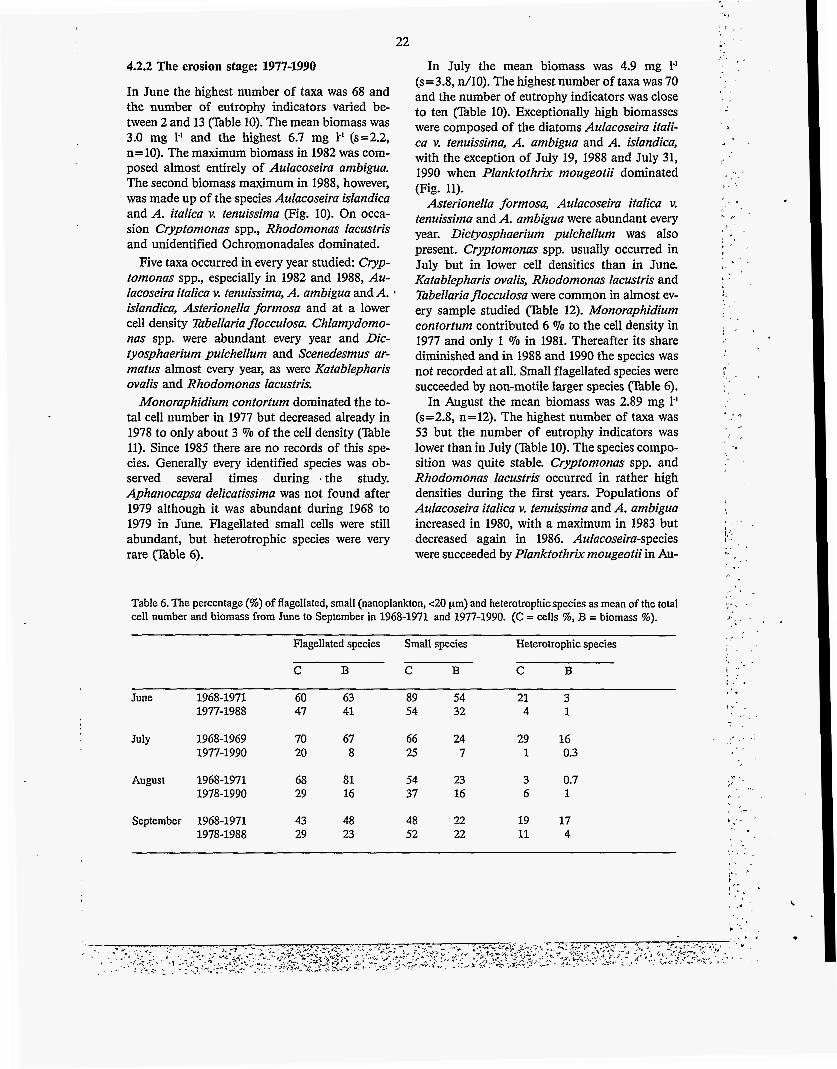
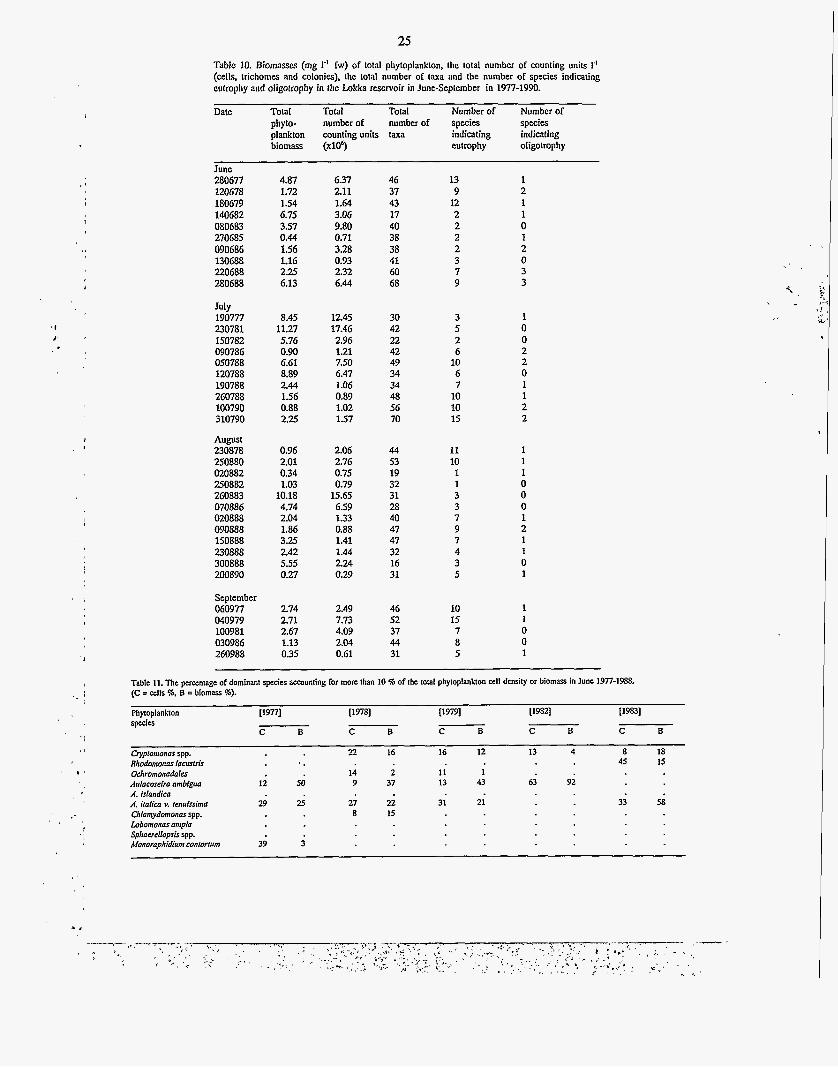
In June the highest number of taxa was 68 and the number of eutrophy indicators varied be- tween 2 and 13 (Table 10). The mean biomass was 3.0 mg I-' and the highest 6.7 mg 1-' (s=2.2, n=10). The maximum biomass in 1982 was com- posed almost entirely of Aulacoseira ambigua. The second biomass maximum in 1988, however, was made up of the species Aulacoseira islandica and A. italica v. tenuissima (Fig. 10). On occa- sion Cryptomonas spp., Rhodomonas lacustris and unidentified Ochromonadales dominated.
Five taxa occurred in every year studied Cryp- tomonas spp., especially in 1982 and 1988, Au- lacoseira italica v. tenuissima, A. ambigua and A. ' islandica, Asterionella formosa and at a lower cell density Tabellaria flocculosa. Chlamydomo- nas spp. were abundant every year and Dic- tyosphaerium pulchellum and Scenedesmus ar- matus almost every year, as were Katablepharis ovalis and Rhodomonas lacustris.
Monoraphidium contortum dominated the to- tal cell number in 1977 but decreased already in 1978 to only about 3 070 of the cell density (Table 11). Since 1985 there are no records of this spe- cies. Generally every identified species was ob- served several times during . the study. Aphanocapsa delicatissima was not found after 1979 although it was abundant during 1968 to 1979 in June. Flagellated small cells were still abundant, but heterotrophic species were very rare (Table 6).
22
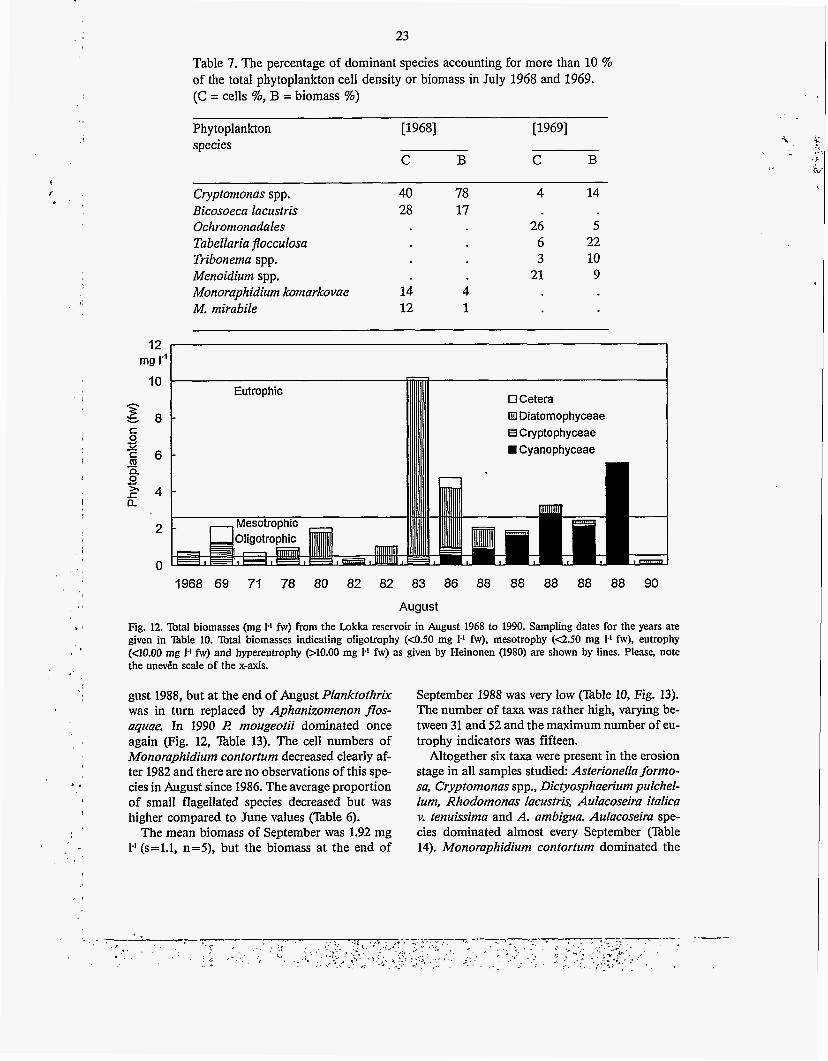
In July the mean biomass was 4.9 mg 1-I
(s=3.8, n/10). The highest number of taxa was 70 and the number of eutrophy indicators was close to ten (Table IO). Exceptionally high biomasses were composed of the diatoms Aulacoseira itali- ca v. tenuissima, A. ambigua and A. islandica, with the exception of July 19, 1988 and July 31, 1990 when Planktothrix mougeotii dominated (Fig. 11).
Asterionella formosa, Aulacoseira italica v. tenuissima and A. ambigua were abundant every year. Dictyosphaerium pulchellum was also present. Cryptomonas spp. usually occurred in July but in lower cell densities than in June. Katablepharis ovalis, Rhodomonas lacustris and Tabellariaflocculosa were common in almost ev- ery sample studied (Table 12). Monoraphidium contortum contributed 6 070 to the cell density in 1977 and only 1 070 in 1981. Thereafter its share diminished and in 1988 and 1990 the species was not recorded at all. Small flagellated species were succeeded by non-motile larger species (Table 6).
In August the mean biomass was 2.89 mg 1' (s=2.8, n=12). The highest number of taxa was 53 but the number of eutrophy indicators was lower than in July (Table IO). The species compo- sition was quite stable. Cryptomonas spp. and Rhodomonas lacustris occurred in rather high densities during the first years. Populations of Aulacoseira italica v. tenuissima and A. ambigua increased in 1980, with a maximum in 1983 but decreased again in 1986. Aulacoseira-species were succeeded by Planktothrix mougeotii in Au-
Table 6. The percentage (%) o f flagellated, small (nanoplankton, c20 pm) and heterotrophicspecies as mean of the total cell number and biomass from June to September in 1968-1971 and 1977-1990. (C = cells %, B = biomass %).
Flagellated species Small species Heterotrophic species
C B C B C B
1968-1971 60 63 89 54 21 3 1977-1988 47 41 54 32 4 1
June
July 1968-1969 70 67 66 24 29 16 1977-1990 20 8 25 7 1 0.3
August 1968-1971 68 81 54 23 3 0.7 1978-1990 29 16 37 16 6 1
September 1968-1971 43 48 48 22 19 17 1978-1988 29 23 52 22 11 4
c
23
Table 7. The percentage of dominant species accounting for more than 10 % of the total phytoplankton cell density or biomass in July 1968 and 1969. (C = cells %, B = biomass %)
i F .
* .
,
Phytoplankton species
[1968] [1969]
C B C B
Cryptomonas spp. 40 Bicosoeca Iacustris 28 Ochromonadales Tabellaria fiocculosa Tribonema spp. Menoidium spp. Monoraphidium komarkovae 14 M. mirabile 12
78 17
4 1
4 14
26 5 6 22 3 10
21 9
12 mg P
10
E 8 c 13 Cryptophyceae 3 Y Cyanophyceae c 6 m Q 0 - 5 4 a
2
0 1968 69 71 78 80 82 82 83 86 88 88 88 88 88 90
August Fig. 12. Total biomasses (mg 1.1 fw) from the Lokka reservoir in August 1968 to 1990. Sampling dates for the years are given in Table 10. Total biomasses indicating oligotrophy (~0.50 mg 1.' fw), mesotrophy (Q.50 mg I-' fw), eutrophy (C10.00 rng 1.1 fw) and hypereutrophy (AO.00 mg 1.' fw) as given by Heinonen (1980) are shown by lines. Please, note the unev6n scale of the x-axis.
gust 1988, but at the end of August Planktothrix was in turn replaced by Aphanizomenon flos- aquae. In 1990 I? mougeotii dominated once again (Fig. 12, Table 13). The cell numbers of Monoraphidium contortum decreased clearly af- ter 1982 and there are no observations of this spe- cies in August since 1986. The average proportion of small flagellated species decreased but was higher compared to June values (Table 6).
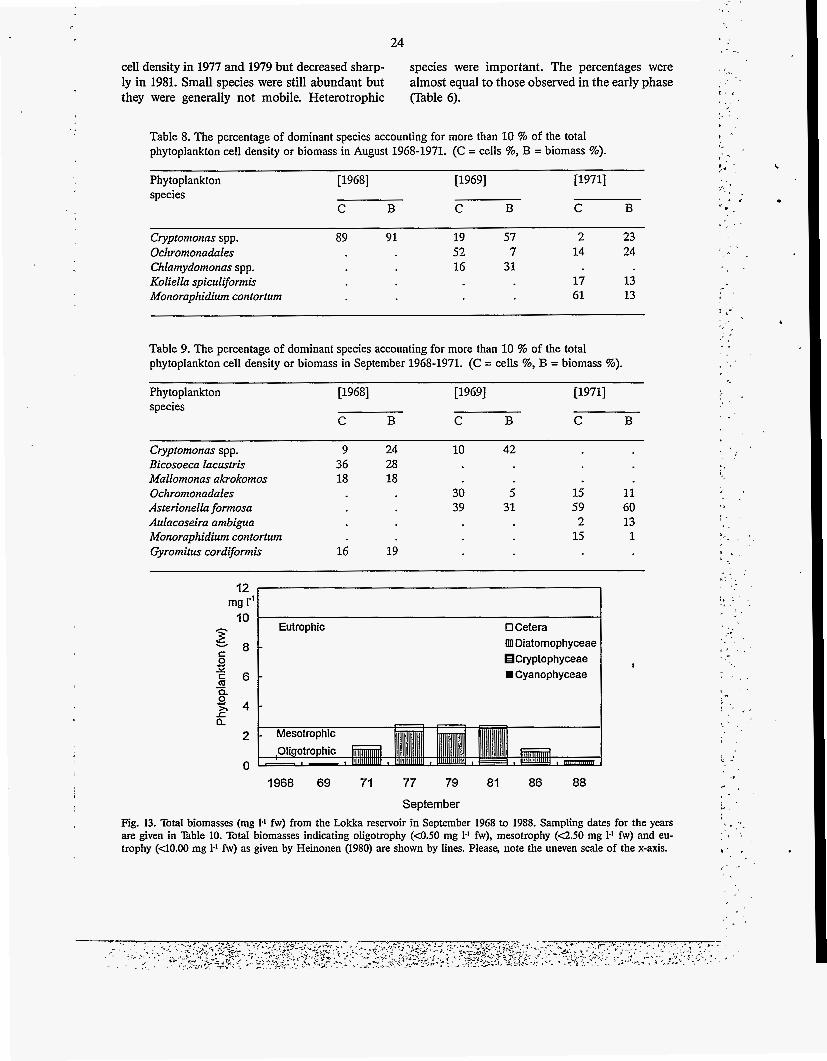
The mean biomass of September was 1.92 mg 1' (s=l.l, n=5), but the biomass at the end of
September 1988 was very low (Table 10, Fig. 13). The number of taxa was rather high, varying be- tween 31 and 52 and the maximum number of eu- trophy indicators was fifteen.
Altogether six taxa were present in the erosion stage in all samples studied Asterionella formo- sa, Cryptomonas spp., Dictyosphaerium pulchel- lum, Rhodomonas lacustris, Aulacoseira italica v. tenuissima and A. ambigua. Aulacoseira spe- cies dominated almost every September (Table 14). Monoraphidium contortum dominated the
24
cell density in 1977 and 1979 but decreased sharp- ly in 1981. Small species were still abundan t but they were generally not mobile. Heterotrophic
species were important. The percentages were a lmost equal to those observed in the early phase ("hble 6).
Table 8. The percentage of dominant species accounting for more than 10 % of the total phytoplankton cell density or biomass in August 1968-1971. (C = cells %, B = biomass %).
Phytoplankton [1968] [1969] [1971] species
C B C B C B
Cryptomonas spp. 89 91 19 57 2 23 52 7 14 24 Ochromonadales
Chlamydomonas spp. 16 31 Koliella spiculiformis 17 13 Monoraphidium contortum 61 13
Table 9. The percentage of dominant species accounting for more than 10 % of the total phytoplankton cell density or biomass in September 1968-1971. (C = cells %, B = biomass %).
Phytoplankton [1968] [1969] species
C B C B C B
Cryptomonas spp. 9 24 10 42 Bicosoeca lacustris 36 28 Mallomonas akrokomos 18 18
Asterionella formosa 39 31 59 60 Aulacoseira ambigua 2 13
Ochromonadales 30 i 15 11
Monoraphidium contortum 15 1 Gyromitus cordiformis 16 19
12 mg I-' 10
E c 8
P c 6
k 4
2
0
0
m Q 0
c Q
-
0 Cetera lIll Diatomophyceae
Cryptophyceae W Cyanophyceae
Eutrophic
1968 69 71 77 79 81 86 88
September Fig. 13. Total biomasses (mg 1-1 fw) from the Lokka reservoir in September 1968 to 1988. Sampling dates for the years are given in Table 10. Total biomasses indicating oligotrophy (<OS0 mg 1-1 fw), mesotrophy (~2.50 mg 1-1 fw) and eu- trophy (<10.00 mg 1-I fw) as given by Heinonen (1980) are shown by lines. Please, note the uneven scale of the x-axis.
25 Table 10. Biomasses (mg 1" fw) of total phytoplankton, the total number of counting units I' (cells, trichomes and colonies), the total number of taxa and the number of species indicating eufrophy and oligotrophy in the Lokka reservoir in June-September in 1977-1990.
Date TotaI Total Total Number of Number of phyto- number of number of species species plankton counting units taxa indicating indicating biomass (~10~) eutrophy oligotrophy
June 280677 120678 180679 140682 080683 270685 090686 130688 220688 280688
July 190777 230781 150782 090786 050788 120788 190788 260788 100790 310790
August 230878 250880 020882 250882 260883 070886 020888 090888 150888 230888 300888 200890
September 060977 040979 100981 030986 260988
4.87 1.72 154 6.75 3.57 0.44 1.56 1.16 2.25 6.13
8.45 11.27 5.76 0.90 6.61 8.89 2.44 1.56 0.88 2.25
0.96 2.01 0.34 1.03 10.18 4.74 2.04 1.86 3.25 2.42 5.55 0.27
2.74 2.71 2.67 1.13 0.35
6.37 2.11 1.64 3.06 9.80 0.71 3.28 0.93 2.32 6.44
12.45 17.46 2.96 1.21 7.50 6.47 1.06 0.89 1.02 1.57
2.06 2.76 0.75 0.79 15.65 6.59 1.33 0.88 1.41 1.44 2.24 0.29
2.49 7.73 4.09 2.04 0.61
46 37 43 17 40 38 38 41 60 68
30 42 22 42 49 34 34 48 56 70
44 53 19 32 31 28 40 47 47 32 16 31
46 52 37 44 31
L '
1
13 9 12 2 2 2 2 3 7 9
3 5 2 6 10 6 7 10 10 15
11 10 1 1 3 3 7 9 7 4 3 5
1 2 1 1 0 1 2 0 3 3
1 0 0 2 2 0 1 1 2 2
1 1 1 0 0 0 1 2 1 1 0 1
10 1 15 1 7 0 8 0 5 1
Table 11. The percentage of dominant spen'es aecounling for more than IO %of the rota1 phytoplankton cell density or biomass in June 3977-3988. (C = cells %, B =biomass %).
Phyloplanklon [I9771 [I9781 [1979] ~9821 ~9831 Species
C B C B C B C B C B
Cvplomonas spp. 22 16 16 12 13 4 8 18 Rhodomonas lacusrris 45 15
Aulacoseira ambigua 12 50 9 37 13 43 63 92
Chlamydomonas spp. 8 15
Ochromonadales 14 i 11 1
A. islandica A. italiccr v. cenuissima 29 25 27 22 31 21 33 58
Lobomonas ampla Sphaerellopsis spp. Uonoraphidium contortum 39 i
26 1 , . ' * . , Table 11. Continued.
Phytoplankton 119851 [I9861 [I9881 [1988] [ 19881 Species
Cryptomonas spp. 24 47 Rhodomonas lacustris Ochromonodoles Aulacosciro ambiguo A. islandica A. italic0 v. tenukima Chlamydomonas spp. Lobomonas ampla Sphaerellopsis spp. Monoraphidium WnlOrNm
C B C B B C B C B C
31 59 29 13 10 12 10 1
45 17
14 9 13 s
z 12
9 28 13 41 8 29 19 38 26 16 17 15
; 18
b - ' . ,
!
! .
a ',
?
Table 12. The percentage of dominant species accounting for more than 10 % of the total phytoplankton cell density or biomass in July 1977-1990. (C = cells %, B =biomass %).
~9821 [I9861 [I9881 Phytoplankton r19nl [I9811 specis
C B C B B C B C B C
Gvptomonas spp. PIonkorhrir mougeotii Rhodcmanas 1acustri.s Ochromonadales Aulacoseira ambiguo A. islandica A. italica v. renuissima Asterionella formoso Tabellario flocculosa Dic~osphaerim pulchellum Cryptomonas spp. PIankrorhrix maugeotii Rhodcmonas lacustris Ochromonadales Aulacoseira ambigua A. islandico A. italica v. renuissima Asterionella formosa Tobellario flocculosa Dicyosphaerium pulchellum
41 10
33
35 31 20
10 45
31
14 68 9
10 1
41 31 17 13 45 40 29
20 20
12 6 34 67 17 1
16 20 23
40 52 86
34 11 97 98 t : , I 23
7
27 59 12 1
48 22
78 1
16 6
17 5 13 23 14 5
I '
10 12 , ', 31
i 10
13 5
Table 13. The pcmnlagc of domina1 spca'cr acmunting for more than 10 % of Ihc total phytoplankton a l l density or biomass in Augvrt 1978-1990. (C = alh %. B = biomass %).
. - I )
, -z
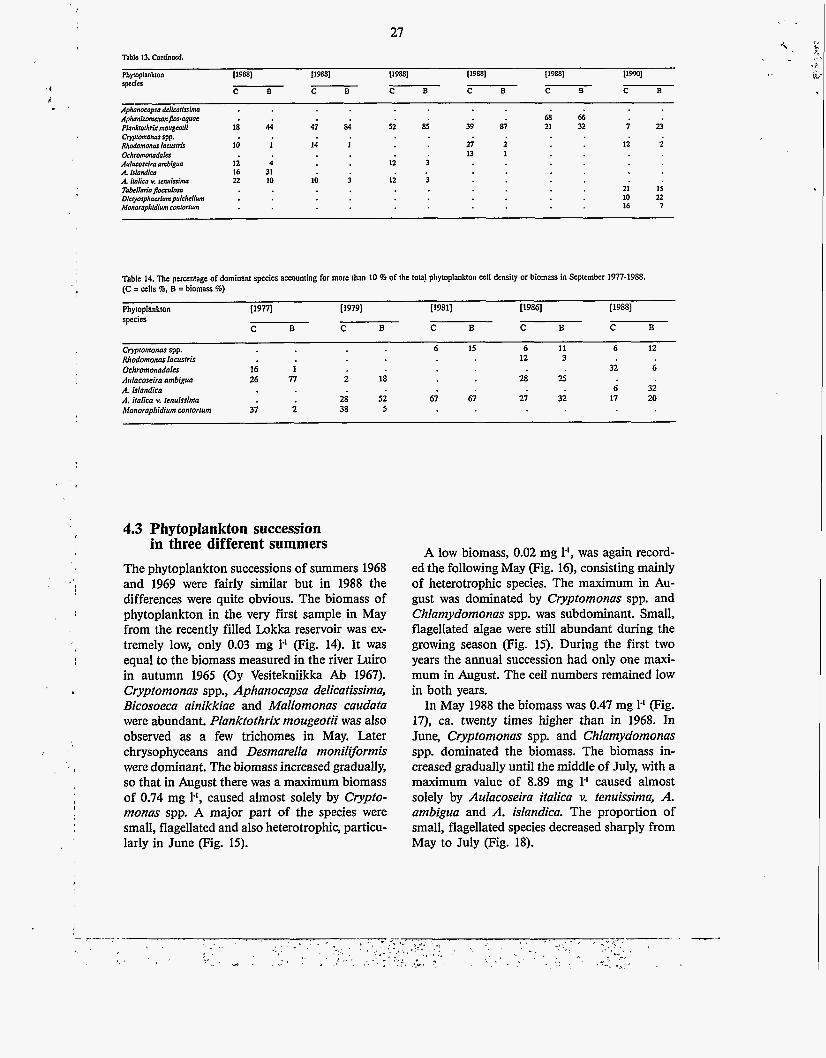
27 Table 13. Continued.
Phytoplankton 119881 119w 119w 119w 119881 IlWl S p c c b C B C B
Plankrorhrix mougmlii 18 44 41 84 52 85 39 87 21 32 i u Rlum!amonm laarsnir 10 1 14 I 2 ; ; ii i Aubcoscira amblgvn 1; 4 i i i A. iroiicn v. renulsima 22 10 1; i 12 3 Tokl lor io~ulosa 21 15 Dicfyosphaerium puichc~ium 10 22
C B C B C B C B
Aphanocopsa deiicnlhim Aphanirommnpm.oqe 6 8 6 6
Crypromonas spp.
Ochromonadaler 13 1
A. islandica I6 31
Momrophidium conrorrum 16 7
Table 14. The pcranrage of dominant specics amunting for more than 10 % of the tola! phytoplankton cell density or biomass in September 1977-1988. (C = cells %, B =biomass %)
Phytoplankton t19n1 ~ 7 9 1 I19811 [1986] (19881 . . species
C B C B C B C B C B
Crypromonas spp. 6 I5 6 11 6 12 Rhodomonas lamrris 12 3 Ochromonadales 16 1 32 6 Aulacoseira ambigua 26 n i 18 2 8 2 5
Manaraphidium cnnlorrum 37 i 38 5
A. islandica 6 32 A. iralica v. renuissirno 28 52 67 67 21 32 17 20
4.3 Phytoplankton succession in three different summers
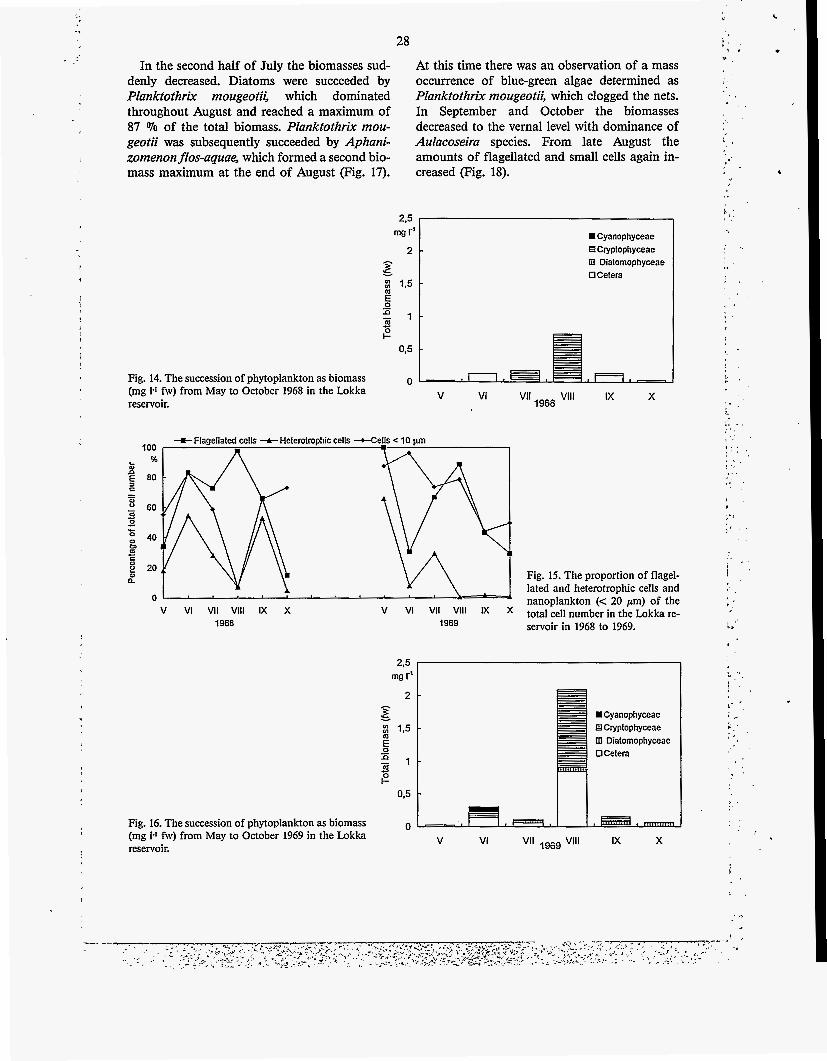
The phytoplankton successions of summers 1968 and 1969 were fairly similar but in 1988 the differences were quite obvious. The biomass of phytoplankton in the very first sample in May from the recently filled Lokka reservoir was ex- tremely low, only 0.03 mg 1' (Fig. 14). It was equal to the biomass measured in the river Luiro in autumn 1965 (Oy Vesitekniikka Ab 1967). Cryptomonas spp., Aphanocapsa delicatissima, Bicosoeca ainikkiae and Mallomonas caudata were abundant. Planktothrix rnougeotii was also observed as a few trichomes in May. Later chrysophyceans and Desmarella moniliformis were dominant. The biomass increased gradually, so that in August there was a maximum biomass of 0.74 mg l - I , caused almost solely by Crypto- monas spp. A major part of the species were small, flagellated and also heterotrophic, particu- larly in June (Fig. 15).
A low biomass, 0.02 mg tl, was again record- ed the following May (Fig. 16), consisting mainly of heterotrophic species. The maximum in Au- gust was dominated by Cryptomonas spp. and Chlamydomonas spp. was subdominant. Small, flagellated algae were still abundant during the growing season (Fig. 15). During the first two years the annual succession had only one maxi- mum in August. The cell numbers remained low in both years.
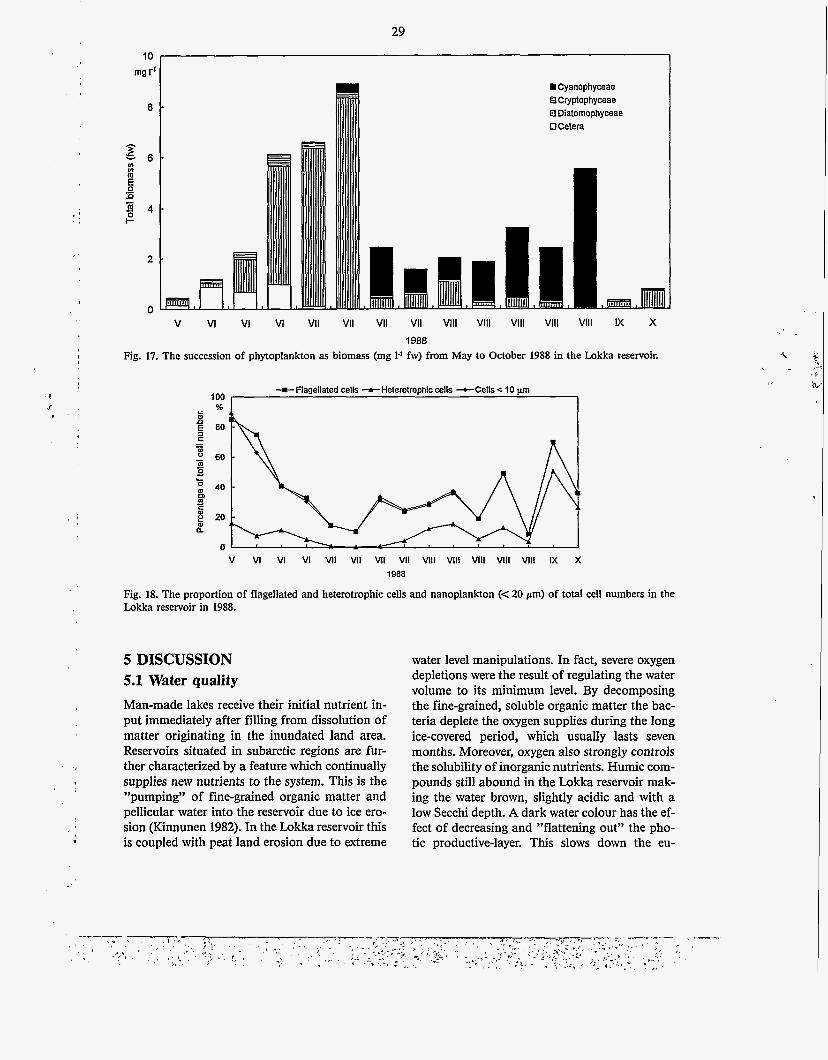
In May 1988 the biomass was 0.47 mg 1-I (Fig. 17), ca. twenty times higher than in 1968. In June, Cryptomonas spp. and Chlamydomonas spp. dominated the biomass. The biomass in- creased gradually until the middle of July, with a maximum value of 8.89 mg 1-I caused almost solely by Aulacoseira italica v. tenuissima, A. ambigua and A. islandica. The proportion of small, flagellated species decreased sharply from May to July (Fig. 18).
28
In the second half of July the biomasses sud- At this time there was an observation of a mass denly decreased. Diatoms were succeeded by occurrence of blue-green algae determined as Planktothrix mougeotii, which dominated Planktothrix rnougeotii, which clogged the nets. throughout August and reached a maximum of In September and October the biomasses 87 '70 of the total biomass. Planktothrix mou- decreased to the vernal level with dominance of geotii was subsequently succeeded by Aphani- Aulacoseira species. From late August the zomenonflos-aquae, which formed a second bio- amounts of flagellated and small cells again in- - mass maximum at the end of August (Fig. 17). creased (Fig. 18).
2.5 - mg I" 2
E s D 1.5
6 - 1
m
-4
0.5
H Cyanophyceae 13 Cryptophyceae ll Diatornophyceae OCetera
0 Fig. 14. The succession of phytoplankton as biomass (mg I-' fw) from May to October 1968 in the Lokka reservoir. V VI VI1 196* Vlll IX X
+Flagellated cells -A- Heterotrophic cells --cCells < 10 pm 100 I
v VI VI1 VI11 IX x 1968
v VI VI1 Vlll IX x 1969
0 Fig. 16. The succession of phytoplankton as biomass (mg I-' fw) from May to October 1969 in the Lokka reservoir.
1
Fig. 15. The proportion of flagel- lated and heterotrophic cells and nanoplankton (< 20 pm) of the total cell number in the Lokka re- servoir in 1968 to 1969.
=Cyanophyceae €I Cryptophyceae G I Diatornophyceae OCetera
V VI VI1 ,969 Vlll IX X
29
I
! 8 , . .
-,
10 mQ I"
Cyanophyceae B Cryplophyceae 0 Diatornophyceae OCelera
8
E 6
.- E a a m
n 3 4 B
2
0 v VI VI VI VI1 VI1 VI1 VI1 Vlll Vlll Vlll Vlll Vlll IX x
1988 Fig. 17. The succession of phytoplankton as biomass (mg 1-' fw) from May to October 1988 in the Lokka reservoir.
-m- Flagellated cells -A- Heterotrophic cells +Cells 10 pn 100 1
. %
80
.! 60
0 n
c - - - 0 u- : 40 e4 L
f 20 Q
0 v VI VI VI VI1 VI1 VI1 VI1 Vlll Vlll VI11 VI11 Vlll IX x
1988
Fig. 18. The proportion of flagellated and heterotrophic cells and nanoplankton (< 20 pm) of total cell numbers in the Lokka reservoir in 1988.
5 DISCUSSION 5.1 Water quality Man-made lakes receive their initial nutrient in- put immediately after filling from dissolution of matter originating in the inundated land area. Reservoirs situated in subarctic regions are fur- ther characterized by a feature which continually supplies new nutrients to the system. This is the "pumping" of fine-grained organic matter and pellicular water into the reservoir due to ice ero- sion (Kinnunen 1982). In the Lokka reservoir this is coupled with peat land erosion due to extreme
water level manipulations. In fact, severe oxygen depletions were the result of regulating the water volume to its minimum level. By decomposing the fine-grained, soluble organic matter the bac- teria deplete the oxygen supplies during the long ice-covered period, which usually lasts seven months. Moreover, oxygen also strongly controls the solubility of inorganic nutrients. Humic com- pounds still abound in the Lokka reservoir mak- ing the water brown, slightly acidic and with a low Secchi depth. A dark water colour has the ef- fect of decreasing and "flattening out', the pho- tic productive-layer. This slows down the eu-
30
. !
i
trophication process and Ilmavirta (1983) has found evidence of naturally dark lakes also often being oligotrophic.
The water quality of the reservoir has im- proved during the past 23 years, which is indicat- ed by the decrease in values of some important water quality variables. Water colour has decreased by more than a half to the present an- nual mean of 75 mg t' Pt. The amount of par- ticulate organic matter has also decreased as well as the amount of iron.
Within a period of only two decades the con- centrations of total phosphorus have decreased by ca. 70 070 and total nitrogen by 40 070. On the basis of the present annual average phosphorus concentration, 30 pg l l , the Lokka reservoir is still eutrophic (Wetzel 1983, Brettum 1989, WillCn 1992) whereas the nitrogen concentration of 470 pg t' reflects a meso-eutrophic status (Wetzel 1983). These nutrient concentrations reflect a rather eutrophic water environment in Lapland as noted earlier by Kinnunen (1985).
Because of the acidic nature of the Finnish bedrock and soil the alkalinity of lakes and reser- voirs is rather low and the waters have a low pH. The Lokka reservoir is no exception to this rule. Only minor changes - decreases - were observed in these variables. The water is still poor in elec- trolytes and has a low pH, confirming the obser- vations of Heinonen and Airaksinen (1974).
The increase in the oxygen saturation level reflects the improved oxygen condition in the reservoir.
5.2 Phytoplankton 5.2.1 Algal response to environmental changes Light In the Lokka reservoir it is the autotrophic phytoplankton that are the responsible primary producers due to the lack of higher littoral plants. Phytoplankton communities are known to react rapidly to changes in the environment (Willen 1987, Gamier 1992, Jacobsen and Simonsen 1993). In Finnish lakes, whether man- made or natural, environmental conditions change rapidly because of the short growing sea- son. These changes are quickly responded to by phytoplankton emerging as either morphological or physiological adaptations, or both. Changes in pigment concentrations of individual algae is a good example (Ilmavirta 1982). Total
phytoplankton biomass in the Lokka reservoir, determined as chlorophyll, reflected eutrophy us- ing the limits set by e.g. Trifonova (1989), but there was no clear correlation between chlo- rophyll and biomass. The high chlorophyll con- tent could be partly explained by light limitation, which would lead to increased cellular chlo- rophyll levels (e.g. Ahlgren 1970, Voros and Padi- s ik 1991). In brown-water lakes the colour of the water and the depth of the trophogenic layer are more important factors than nutrient concentra- tions in determining the composition of phytoplankton as noted by Ilmavirta (1980).
Diatoms are favoured by low light, low temper- ature and a moderately nutrient-rich environ- ment during turbulence or the onset of stratifica- tion (Lund 1971, WillCn 1991). A reservoir thus offers an excellent environment for diatoms be- cause of the water level manipulations which cause both turbulence and recirculation of nutrients, especially of silica. For instance Au- lacoseira italica v. tenuissima which is charac- teristic of extremely dark waters due to its low light demands (Talling 1957) is very abundant in the Lokka reservoir. On the other hand blue- green alga Planktothrix forms deep biomass maxima because of its low light requirements (e.g. Lindholm 1992), which will be missed if only samples from the upper water layer are used (Harris 1986). Also Aphanizomenon is typical of waters with low temperatures and low light levels (Steinberg and Hartmann 1988).
Life forms Algal response to environmental change is often reflected by changes in life forms. For instance the presence of flagella have been found impor- tant for the survival of phytoplankton during long winters (Rott 1988). In lakes flagellated spe- cies compose more than 50 070 of the biomass when the water colour is more than 50 mg 1' Pt (Ilmavirta 1983). In the early stage of the Lokka reservoir flagellated species contributed, on aver- age, more than 60 '70 to the total cell density and to the biomass. The proportion of flagellated species decreased below 50 070 in the subsequent erosion stage. For the flagellated cells, such as Cryptomonas spp., Uroglena spp. and Chlamy- domonas spp. which are very common in the Lokka reservoir, mobility is of great advantage and can be considered an adaptation to the am- bient humic waters (Ilmavirta 1983, Salonen et
31
al. 1984, Eloranta 1988, Smolander and Arvola 1988, Arvola et al. 1990). With their flagella eg. cryptomonads are able to migrate through the thermocline to take up additional nutrients from the hypolimnion (Salonen et al. 1984, Arvola.et al. 1990).
Cell size In the early stage, in the chemically and biologi- cally unstable environment, the majority of the species were small, which is also typical for oligo- trophic waters (Pavoni 1963, ref. Harris 1986, Harris 1994), despite the high nutrient concentra- tions at that time. Algae with a small cell size are very efficient users of nutrients and are capable of rapid growth in unstable environments and may outcompete larger algae, e.g. blue-green al- gae (Reynolds and Walsby 1975, Harris 1984, Padislk et al. 1988, Steinberg and Hartmann 1988). In the Lokka reservoir the stabilization of the environment through decreased regulation, decreased colour and decreased, but still- available nutrients may explain the increase of the larger species like blue-greens towards the end of the study period.
In this material the small sized species Monoraphidium contortum was observed as ear- ly as in 1971 and for the last time in 1986. It was also very abundant in the material of Arvola (1980) and Jones and Ilmavirta (1983). According to Arvola (1980) this species is probably a pi- oneer species, able to survive in a new labile ecosystem. Monoraphidium contortum seems to have a wide ecological habitat encompassing both oligotrophic and polyeutrophic conditions (Komlrkovl-Legnerovl 1969, Brettum 1989). Brettum assumes that the oligotrophy indicating species M. irregulare is often included in M. con- tortum, which indicates eutrophy. The correct identification is therefore very important. Rey- nolds (1988) has classified M. contortum as a true river phyto plankton, which tolerates high- frequency hydraulic disturbances. I found M. contortum to be almost the only species present in the strongly regulated River Nurmonjoki with turbid water. No strong correlation between either the cell density or the biomass of Monoraphidium with the studied variables was found. Water colour and organic matter content gave weak positive correlations whereas with conductivity a negative correlation was found. 11- mavirta (1982) observed that in humic waters
correlations are never strong not even between bi- omass and chlorophyll.
Nutrional requirements Though phytoplankton in general are auto- trophs, there are species which depend on organ- ic substrates and are subsequently heterotrophic. The craspedomonad Desmarella moniliformis for instance, prefers waters in which organic compounds are present in moderately high con- cent rations and where bacteria are abundant. According to Tikkanen and WillCn (1992), Des- marella occurs in eutrophic and impure waters. Jarnefelt (1961) has concluded that the species in- dicates the presence of effluents from sulfite mills. There are also algae suspected of mixo- trophy like Cryptomonas (Haffner et al. 1980) which is an indicator of waters rich in nutrients and organic material (RosCn 1981) and Rhodo- monas (Haffner et al. 1980) which tolerates waters with mud and clay particles (Brettum 1989) as well as Dinobryon bavaricum (StrasIrabovB and gmek 1993). Euglenids are also typical of waters with organic nutrients (Prescott 1962). The abundancy of colourless species was high during the first spring and au- tumn in 1968 and still so during the spring of 1969 when decomposition was efficient. Obligate autotrophy is difficult to demonstrate.
5.2.2 Long term and seasonal successions The development of phytoplankton communities can be investigated as an indicator of the produc- tivity of the lakes by measuring the total biomass (Heinonen 1980, Trifonova 1986). Year-to-year variations in the quantitative values are possible, even when the biomasses are studied monthly. The different abundances of the various algal species, especially colony forming species, cause this variation as noted among others by Trifono- va (1986) and Eloranta (1988). Also several eco- logical factors eg. grazing pressure of zooplank- ton as well as weather conditions affect phytoplankton (Porter 1973, Brettum 1989, Jacobsen and Simonsen 1993, Reynolds et al. 1993). In the Lokka reservoir the year to year var- iations were large though the results were treated as annual means or separatelly in different months. This may be explained partly by differ- ent water regulation practice in the different years.
32 Long term succession The long term succession of phytoplankton com- munities during the ageing process of lakes from oligotrophy to eutrophy is associated with the evolution of the lakes and with the availability of nutrients, generally phosphorus (eg. RosCn 1981, Trifonova 1988, 1989). The biomass of the river Luiro before it was submerged was comparable with the reservoir biomass values of the early stage, which were relatively low. The measured seasonal averages indicated oligotrophy and oligo-mesotrophy, according to Heinonen (1980), Brettum (1989) and Trifonova (1989). Biomass in- creased rapidly during the first years. Partly, this may be caused by different sampling depths in the beginning of the monitoring programme. Di- atoms caused maximum biomasses at the begin- ning of strong regulation and again when the regulation decreased. Depending on whose clas- sification system one uses the biomass either reflected mesotrophy, meso-eutrophy or eu- trophy (Heinonen 1980, Brettum 1989, Trifonova 1989) during the different years of the erosion stage. Although the biomass has decreased toward the 199Os, there is still no indication of oligotrophy.
When plankton development progresses from oligotrophic plankton via mesotrophic to eu- trophic plankton the species composition changes reflecting the trophic status of a water body (eg. Trifonova 1986, 1989, WillCn 1987, Brettum 1989, Tikkanen and WillCn 1992). Look- ing at the development in the Lokka reservoir over a longer time perspective significant changes in the plankton community can be observed. During the first years the dominant groups of phytoplankton were typical for oligotrophic con- ditions, including eg. small colony forming blue- green algae, chrysophyceans (partly mixotroph- ic), craspedophyceans, small green algae and pennate diatoms. The species composition was more or less similar to the species composition of the river Luiro. On the other hand abundant cryptomonads reflected the influence of a dark water colour (Ilmavirta 1983, Eloranta 1988, Smolander and Arvola 1988). Cold water dinophyceans were rare, although they are typical in oligotrophic waters (WillCn 1987, Trifonova 1988, Tikkanen and WillCn 1992). Centric dia- toms, mainly Aulacoseira species, dominated during the erosiod stage, for all in the period just after the strong regulation. These diatoms are
typical of more eutrophic waters. At the end of the 1980s large blue-green algae increased, with mass occurrences as noted before. Large desmids, typical in different water bodies in Lapland (Jar- nefelt 1962), were also observed more often. The increase of filamentous Ulotrichales may be ex- plained by the creation of new niches for these periphytic species once water level fluctuations had stabilized. Nevertheless, there are always "background" species, as noted by Padisik (1992), that remain in the system irrespective of the environmental changes. In the Lokka reser- voir eight such "background" taxa were observed throughout the studied years.
Different trophic status may be determined by counting indicator species. The value of in- dividual species as indicators of trophic state must be evaluated with some caution (Jarnefelt 1952, 1956, Jarnefelt et al. 1963, Heinonen 1980, RosCn 1981, Brettum 1989). Planktothrix agard- hii for instance, is not included as an indicator of eutrophy by either Jarnefelt (1952, 1956), Jar- nefelt et al. (1963) or Heinonen (1980). On the other hand Niemi (1971) found it to be a good in- dicator of eutrophication in brackish waters. Ac- cording to Skolberg and Skolberg (1985) and Brettum (1989), €? agardhii indicates very eu- trophic conditions whereas E! mougeotii prefers mesotrophy. Consequently the correct species identification is of great importance. In this material the proportion of species indicating eu- trophy was generally low, but during the strong regulation the number of eutrophy indicating species increased. In July the tendency was oppo- site, anyhow. The number of oligotrophy indicat- ing species was always very low.
Seasonal succession The seasonal succession is caused by periodic dominance of successive algal populations in the annual cycle (Trifonova 1986). According to Heinonen (1982), whose observations of annual variations in phytoplankton are based on the results only from southern and central Finland, a biomass maximum occurs in oligotrophic and mesotrophic lakes in June. After a decrease of bi- omass in July a weaker second maximum ap- pears in August. In oligo-mesotrophic lakes of the Carelian isthmus studied by Trifonova (1986, 1989) the spring maxima rapidly decreased in June. In July a slight increase was observed which perhaps could be considered the weaker
, ..
'I . I ' .,
u. - . , I .
. . , .' ,
, ,
33
second maximum. In mesotrophic lakes three been caused by the efficient recycling of silica maxima were observed; one in May, one in July- and other nutrients due to the large water level August and one in September. The same fluctuations. The mixing of the water column in phenomenon is illustrated by cell density values mid summer may cause blooms of Melosira (Au- from Lake Erie in 1927, when the lake was still lacoseira) as noted by Lund (1971). mesotrophic (Davis 1964). In the 30 year old Rybinsk reservoir the dia-
In the Lokka reservoir in 1968 and 1969 the toms Aulacoseira italica and Asterionella formo- phytoplankton successions had features both of sa were dominant in spring, whereas later in sum- oligotrophic and mesotrophic lakes; the June mer blue-green algae such as Aphanizomenon maximum was weak with oligotrophy indicating 80s- aquae and Microcystis aeruginosa dominat- biomass, but the maximum in August in both ed (Sorokin 1972). In the Lokka reservoir blue- years (Figs. 14, 16) was clear and more meso- green algae have increased in addition to dia- trophic according to biomass values. Approxi- toms. However, only one record of Microcystis mately twenty years later in June-July 1988 a aeruginosa colonies has been made. This was in long-lasting maximum was produced by diatoms. 1986. According to Sorokin (1972) and Porter There was even a slight depression of biomass at (1973) the filtering zooplankton are not able to the end of July. The second maximum in August use the larger blue-green algae, dinoflagellates or was caused by blue-greens (Fig. 17). This mass desmids directly, only via a bacterial link. Thus occurrence was persistent for a long time and can the primary food chain is lengthened, with seri- be considered as evidence for eutrophication ous losses as a consequence. The proportion of (WillCn 1987). nanoplankton has decreased during the history
of the Lokka reservoir. The small fast-growing pioneer species are replaced by larger colonies or
5.3 The Lokka reservoir today trichom-forming species in July and August. At The biotic development in reservoirs occur via this time the productivity of filtering zooplank- several different stages (Vogt 1978, Kinnunen ton is high. If zooplankton are not able to utilize
changes are very rapid lasting only a few months. fluence on the nutrient chain culminating in fish As sampling in the Lokka reservoir was not start-
period of rapid change has not been monitored. The low biomass of the first years illustrated the
to have reduced the development of phytoplankton, although the nutrient concentra-
1982, Krzyzanek et al. 1986). After damming the phytoplankton directly, this may have an in-
1989)* ed until ten months after damming, this initial During the last ten years water level fluctua-
tions in the Lokka reservoir have been stabilized pig. 2). The colour values have decreased and
reservoir with whitefish since the 1970s (Salonen and Mutenia 1992) may have caused an im-
first oligotrophic phase. The dark water colour the water quality has improved- Stocking of the
tion was very high, Besides this, the species corn- position observed reflected the availability of or-
balance in the phytoplankton community. The erosion Phase still continues, Primarily due to the
ganic nutrients favouring m~otrophic cryp- tomonads, chrysophyceans and euglenids and heterotrophic craspedophyceans like Desmarella. with eutrophic features such as Of
The erosion stage may last tens or even hundreds of years and ends in a stage (Vogt 1978). The erosion stage began in the mid-1970s. At this time, water level fluctuations, due to manipulation, were large and the water volume at its minimum. Moreover, the number of taxa was high as were the biomasses and cell densities, indicating eutrophy until1 the mid- 1980s. This period w p a time of change when the oligotrophic (mixotrophic) chrysophycean-group decreased and was replaced by large, more eu- trophic, centric diatoms. Partly, this may have
high nutrient concentrations, consequently, the reservoir can still be considered meso-eutrophic
greens. As yet there are no signs of the assumed oligotrophication which is the last phase in the generalized reservoir
6 CONCLUSIONS
1. The normal development of reservoirs with an unstable oligotrophic period after damming was observed. The biomasses and the number of spe- cies were low and like the species composition, in accordance with the samples taken prior to fill- ing.
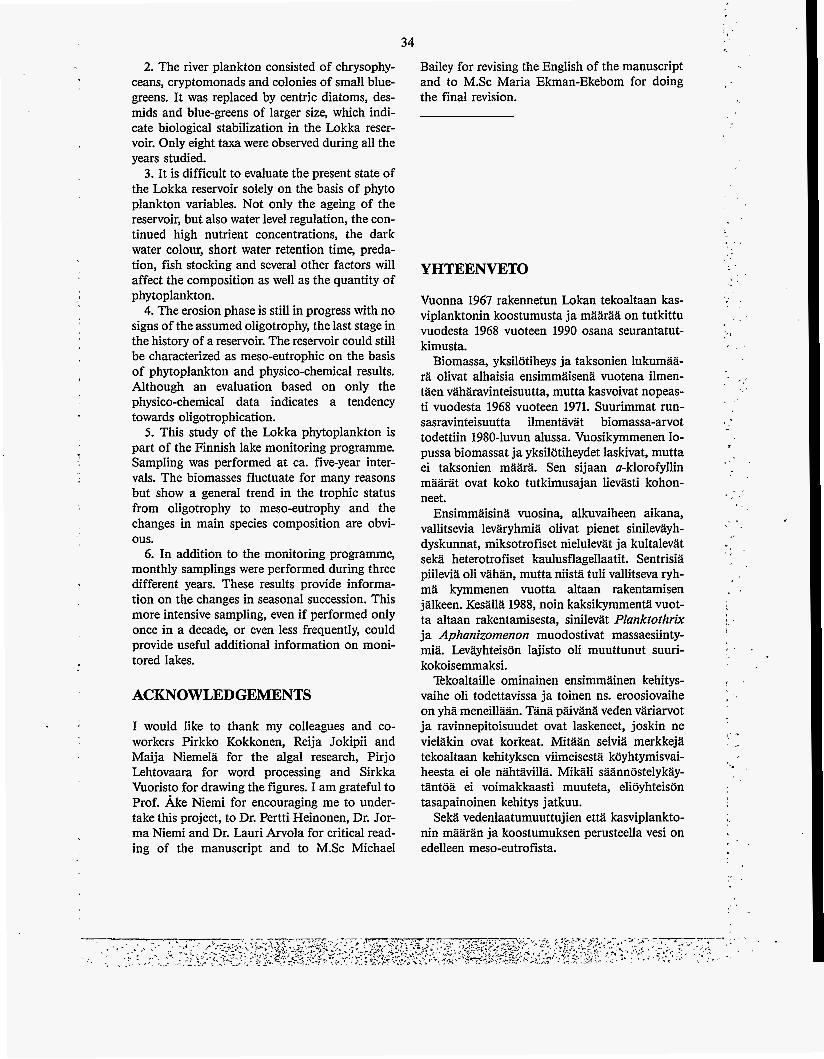
34
2. The river plankton consisted of chrysophy- ceans, cryptomonads and colonies of small blue- greens. It was replaced by centric diatoms, des- mids and blue-greens of larger size, which indi- cate biological stabilization in the Lokka reser- voir. Only eight taxa were observed during all the years studied.
3. It is difficult to evaluate the present state of the Lokka reservoir solely on the basis of phyto plankton variables. Not only the ageing of the reservoir, but also water level regulation, the con- tinued high nutrient concentrations, the dark water colour, short water retention time, preda- tion, fish stocking and several other factors will affect the composition as well as the quantity of phytoplankton.
4. The erosion phase is still in progress with no signs of the assumed oligotrophy, the last stage in the history of a reservoir. The reservoir could still be characterized as meso-eutrophic on the basis of phytoplankton and physico-chemical results. Although an evaluation based on only the physico-chemical data indicates a tendency towards oligotrophication.
5. This study of the Lokka phytoplankton is part of the Finnish lake monitoring programme. Sampling was performed at ca. five-year inter- vals. The biomasses fluctuate for many reasons but show a general trend in the trophic status from oligotrophy to meso-eutrophy and the changes in main species composition are obvi-
6. In addition to the monitoring programme, monthly samplings were performed during three different years. These results provide informa- tion on the changes in seasonal succession. This more intensive sampling, even if performed only once in a decade, or even less frequently, could provide useful additional information on moni- tored lakes.
ous.
ACKNOWLEDGEMENTS
I would like to thank my colleagues and co- workers Pirkko Kokkonen, Reija Jokipii and Maija Niemela for the algal research, Pirjo Lehtovaara for word processing and Sirkka Vuoristo for drawing the figures. I am grateful to Prof. Ake Niemi for encouraging me to under- take this project, to Dr. Pertti Heinonen, Dr. Jor- ma Niemi and Dr. Lauri Arvola for critical read- ing of the manuscript and to M.Sc Michael
Bailey for revising the English of the manuscript and to M.Sc Maria Ekman-Ekebom for doing the final revision.
YHTEENVETO
Vuonna 1967 rakennetun Lokan tekoaltaan kas- viplanktonin koostumusta ja maaraa on tutkittu vuodesta 1968 vuoteen 1990 osana seurantatut- kimusta.
Biomassa, yksilotiheys ja taksonien lukumaa- ra olivat alhaisia ensimmaisena vuotena ilmen- taen vaharavinteisuutta, mutta kasvoivat nopeas- ti vuodesta 1968 vuoteen 1971. Suurimmat run- sasravinteisuutta ilmentavat biomassa-arvot todettiin 1980-luvun alussa. Vuosikymmenen lo- pussa biomassat ja yksilotiheydet laskivat, mutta ei taksonien maara. Sen sijaan a-klorofyllin maarat ovat koko tutkimusajan lievasti kohon- neet.
Ensimmitisina vuosina, alkuvaiheen aikana, vallitsevia levaryhmia olivat pienet sinilevayh- dyskunnat, miksotrofiset nielulevat ja kultalevat seka heterotrofiset kaulusflagellaatit. Sentrisia piilevia oli vahan, mutta niista tuli vallitseva ryh- ma kymmenen vuotta altaan rakentamisen jalkeen. Kesalla 1988, noin kaksikymmenta vuot- ta altaan rakentamisesta, sinilevat Planktothrix ja Aphanizomenon muodostivat massaesiinty- mia. Levayhteison lajisto oli muuttunut suuri- kokoisemmaksi.
Tekoaltaille ominainen ensimmainen kehitys- vaihe oli todettavissa ja toinen ns. eroosiovaihe on yha meneillaan. Tana pitivana veden variarvot ja ravinnepitoisuudet ovat laskeneet, joskin ne vielakin ovat korkeat. Mitaan selvia merkkeja tekoaltaan kehityksen viimeisesta koyhtymisvai- heesta ei ole nahtavilla. Mikali saanniistelykay- tantoa ei voimakkaasti muuteta, elioyhteison tasapainoinen kehitys jatkuu.
Seka vedenlaatumuuttujien etta kasviplankto- nin maaan ja koostumuksen perusteella vesi on edelleen meso-eutrofista.
, ','
r
r .
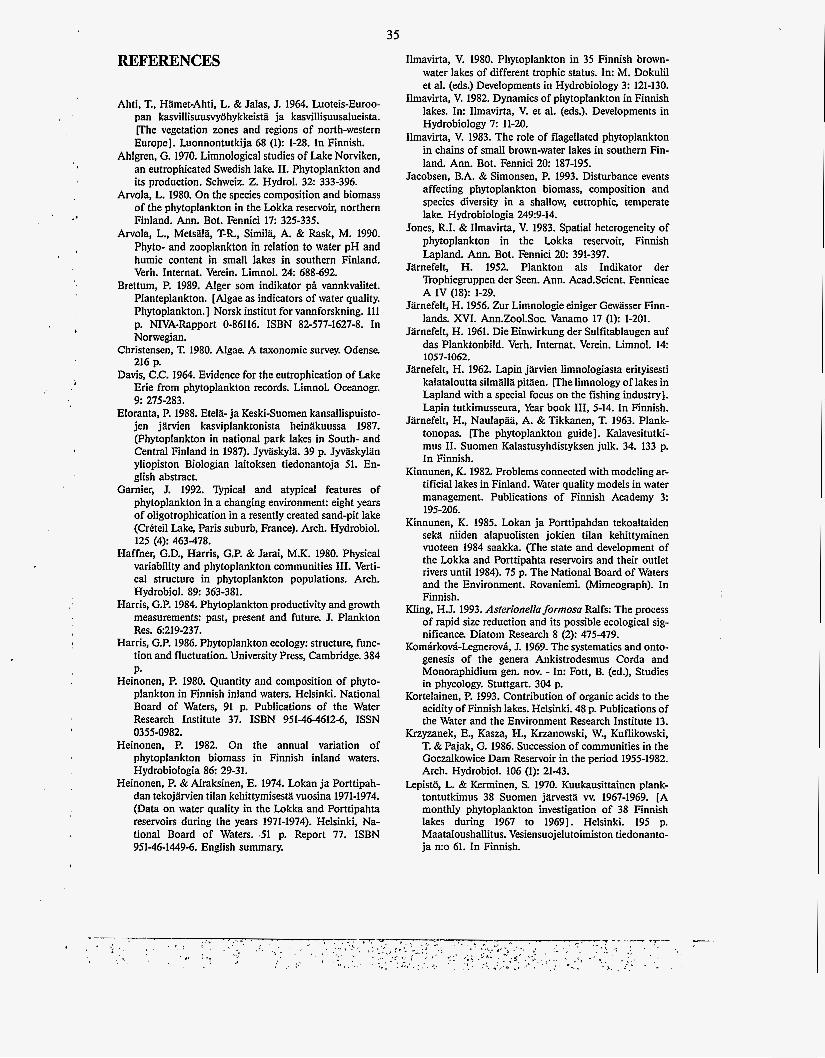
35
REFERENCES
Ahti, T., Hlmet-Ahti, L. & Jalas, J. 1964. Luoteis-Euroo- pan kasvillisuusvy6hykkeism ja kasvillisuusalueista. p h e vegetation zones and regions of north-western Europe]. Luonnontutkija 68 (1): 1-28. In Finnish.
Ahlgren, G. 1970. Limnological studies of Lake Norviken, an eutrophicated Swedish lake. 11. Phytoplankton and its production. Schweiz. Z. Hydrol. 32: 333-396.
Arvola, L. 1980. On the species composition and biomass of the phytoplankton in the Lokka reservoir, northern Finland. Ann. Bot. Fennici 17: 325-335.
Arvola, L., Metsitla, T-R., Simila, A. & Rask, M. 1990. Phyto- and zooplankton in relation to water pH and humic content in small lakes in southern Finland. Verh. Internat. Verein. Limnol. 24: 688-692.
Brettum, P. 1989. Alger som indikator p& vannkvalitet. Planteplankton. [Algae as indicators of water quality. Phytoplankton.] Norsk institut for vannforskning. 111 p. NIVA-Rapport 0-86116. ISBN 82-577-1627-8. In Norwegian.
Christensen, T. 1980. Algae. A taxonomic survey. Odense. 216 p.
Davis, C.C. 1964. Evidence for the eutrophication of Lake Erie from phytoplankton records. Limnol. Oceanogr.
Eloranta, P. 1988. EtelH- ja Keski-Suomen kansallispuisto- jen jlrvien kasviplanktonista heinakuussa 1987. (Phytoplankton in national park lakes in South- and Central Finland in 1987). Jyvakyla. 39 p. Jyvakylan yliopiston Biologian laitoksen tiedonantoja 51. En- glish abstract.
Gamier, J. 1992. 'Qpical and atypical features of phytoplankton in a changing environment: eight years of oligotrophication in a resently created sand-pit lake (Crkteil Lake, Paris suburb, France). Arch. Hydrobiol. 125 (4): 463-478.
Haffner, G.D., Harris, G.P. & Jarai, M.K. 1980. Physical variability and phytoplankton communities 111. Verti- cal structure in phytoplankton populations. Arch. Hydrobiol. 89: 363-381.
Harris, G.P. 1984. Phytoplankton productivity and growth measurements: past, present and future. J. Plankton Res. 6:219-237.
Harris, G.P. 1986. Phytoplankton ecology: structure, func- tion and fluctuation. University Press, Cambridge. 384 P.
Heinonen, P. 1980. Quantity and composition of phyto- plankton in Finnish inland waters. Helsinki. National Board of Waters, 91 p. Publications of the Water Research Institute 37. ISBN 951-46-4612-6, ISSN
Heinonen, P. 1982. On the annual variation of phytoplankton biomass in Finnish inland waters. Hydrobiologia 8 6 29-31.
Heinonen, P. & Airaksinen, E. 1974. Lokan ja Porttipah- dan tekojgrvien tilan kehittymisesm vuosina 1971-1974. (Data on water quality in the Lokka and Porttipahta reservoirs during the years 1971-1974). Helsinki, Na- tional Board of Waters. 5 1 p. Report 77. ISBN 951-46-1449-6. English summary.
9: 275-283.
0355-0982.
Ilmavirta, V. 1980. Phytoplankton in 35 Finnish brown- water lakes of different trophic status. In: M. Dokulil et al. (eds.) Developments in Hydrobiology 3: 121-130.
Ilmavirta, V. 1982. Dynamics of phytoplankton in Finnish lakes. In: Ilmavirta, V. et al. (eds.). Developments in Hydrobiology 7: 11-20.
Ilmavirta, V. 1983. The role of flagellated phytoplankton in chains of small brown-water lakes in southern Fin- land. Ann. Bot. Fennici 20: 187-195.
Jacobsen, B.A. & Simonsen, P. 1993. Disturbance events affecting phytoplankton biomass, composition and species diversity in a shallow, eutrophic, temperate lake. Hydrobiologia 2499-14.
Jones, R.I. & Ilmavirta, V. 1983. Spatial heterogeneity of phytoplankton in the Lokka reservoir, Finnish Lapland. Ann. Bot. Fennici 20: 391-397.
Jarnefelt, H. 1952. Plankton als Indikator der Trophiegruppen der Seen. Ann. AcadScient. Fennicae
Jarnefelt, H. 1956. Zur Limnologie einiger Gewasser Finn- lands. XVI. Ann.Zool.Soc Vanamo 17 (1): 1-201.
Jgrnefelt, H. 1961. Die Einwirkung der Sulfitablaugen auf das Planktonbild. Verh. Internat. Verein. Limnol. 14:
Jarnefelt, H. 1962. Lapin jWien limnologiasta erityisesti kalataloutta silmidla pimen. r h e limnology of lakes in Lapland with a special focus on the fishing industry]. Lapin tutkimusseura, Year book 111, 5-14. In Finnish.
Jarnefelt, H., Naulapaa, A. & Tikkanen, T. 1963. Plank- tonopas. r h e phytoplankton guide]. Kalavesitutki- mus 11. Suomen Kalastusyhdistyksen julk. 34. 133 p. In Finnish.
Kinnunen, K. 1982. Problems connected with modeling ar- tificial lakes in Finland. Water quality models in water management. Publications of Finnish Academy 3:
Kinnunen, K. 1985. Lokan ja Porttipahdan tekoaltaiden seka niiden alapuolisten jokien tilan kehittyminen vuoteen 1984 saakka. (The state and development of the Lokka and Porttipahta reservoirs and their outlet rivers until 1984). 75 p. The National Board of Waters and the Environment. Rovaniemi. (Mimeograph). In Finnish.
Kling, H.J. 1993. Asterionella formosa Ralfs: The process of rapid size reduction and its possible ecological sig- nificance. Diatom Research 8 (2): 475-479.
Komirkovi-Legnerovi, J. 1969. The systematics and onto- genesis of the genera Ankistrodesmus Corda and Monoraphidium gen. nov. - In: Fott, B. (ed.), Studies in phycology. Stuttgart. 304 p.
Kortelainen, P. 1993. Contribution of organic acids to the acidity of Finnish lakes. Helsinki. 48 p. Publications of the Water and the Environment Research Institute 13.
Krzyzanek, E., Kasza, H., Krzanowski, W., Kuflikowski, T. & Pajak, G. 1986. Succession of communities in the Goczalkowice Dam Reservoir in the period 1955-1982. Arch. Hydrobiol. 106 (1): 21-43.
Lepist6, L. & Kerminen, S. 1970. Kuukausittainen plank- tontutkimus 38 Suomen jWesta w. 1967-1969. [A monthly phytoplankton investigation of 38 Finnish lakes during 1967 to 19691. Helsinki. 195 p. Maataloushallitus. Vesiensuojelutoimiston tiedonanto- ja n:o 61. In Finnish.
A IV (18): 1-29.
1057-1062.
195-206.
36 Lepistii, L., Kokkonen, P. & Puumala, R. 1981. Kasvi-
planktonin maaristi4 ja koostumuksesta Suomen vesistoissa kesalla 1971. (Quantity and composition of phytoplankton in Finnish watercourses in the summer of 1971). Helsinki, National Board of Waters. 146 p. Report 207. ISBN 951-46-5189-8, ISSN 0355-0745. In Finnish.
Lepisto, L., Antikainen, S. & Kivinen, J. 1994. The occur- rence of Gonyostomum semen (Ehr.) Diesing in Fin- nish lakes. Hydrobiologia 273: 1-8.
Lindholm, T. 1992. Ecological role of depth maxima of phytoplankton. Arch. HydrobioLBeih. Ergebn. Lim- nol. 35: 33-45.
Lund, J.W.G. 1971. An artificial alteration of the seasonal cycle of the plankton diatom Melosira italica subs. subarctica in an English lake J. Ecol. 5 9 521-533.
National Board of Waters 1981. Vesihallinnon analyy- simenetelmat. (Methods of water analysis employed by the Water Administration). Helsinki. 136 p. Report 213. ISBN 951-46-6001-3, ISSN 0355-4745. In Finnish.
National Board of Waters 1984. Vesiviranomaisten kayt- ti4mat vesitutkimusten naytteenottomenetelmat. (The sampling methods of water investigations used by water authorities). 2. rev. ed. Helsinki. 56 p. Publica- tions of the National Board of Waters 40. ISBN 951-46- 8367-6, ISSN 0355-9297. In Finnish.
National Board of Waters and the Environment 1987. Hydrological Yearbook 1981-1983. As reference period 1961-1980. Leppajarvi, R. (ed.). Helsinki. 238 p. Publi- cations of the Water Research Institute 66. ISBN
Nenonen, 0. & Nenonen, M. 1972. Havaintoja Lokan ja Porttipahdan tekoaltaista. (Observations on the artifi- cial lakes of Lokka and Porttipahta). Helsinki, Nation- al Board of Waters. 16 p. Report 21. In Finnish.
Niemi, A. 1971. Iti4meren planktonista. [Baltic Sea plank- ton]. Luonnon tutkija 75: 92-105. In Finnish.
Pavoni, M. 1963. Die Bedeutung des Nanoplanktons im Vergleich zum Netzplankton. Schweitz. Z. Hydro]. 25:
Padisik, J. 1992. Seasonal succession of phytoplankton in a large shallow lake (Balaton, Hungary) - a dynamic approach to ecological memory, its possible role and mechanisms. J. Ecol. 8 0 217-230.
Padisik, J., Toth, L.G. & Rajczy, M. 1988. The role of storms in the summer succession of the phytoplankton community in a shallow lake (Lake Balaton, Hun- gary). J. Plankton Res. 10 (2): 249-265.
Pietilainen, 0.-P. & Kauppi, L. 1993. Suomen sisavesisto- jen typpi/fosforisuhteista - kayttokelpoista tietoa ve- siensuojelun kannalta? [The relation of nitrogen/ phosphorus - content in Finnish inland waters - usefull knowledge for waterprotection?] Vesitalous 6: 1-7, in Finnish.
Porter, K.G. 1973. Selective grazing and differential diges- tion of algae by zooplankton. Nature 244: 179-180.
Prescott, G.W. 1962. Algae of the Western Great Lakes Area. Revised edition. W.M.C.Brown company pub- lishers. Dubuque, Iowa. 977 p.
Puro, A. 1989. Ayriaisplanktonin koostumuksesta ja tuotannosta Lokan tekojarvessa vuonna 1988. r h e composition and productivity of zooplankton in the
951-47-1557-8, ISSN 0356-4053.
219-341.
Lokka reservoir in 19881. 58 p. University of Jyvasky- la. (Mimeograph). In Finnish.
Reynolds, C.S. 1988. Potamoplankton: Paradigms, Paradoxes and Prognoses. In: Algae and the Aquatic Environment (ed. F.E.Round), Biopress Ltd., Bristol.
Reynolds, C.S. & Walsby, A.E. 1975. Water blooms. Biol. Rev. 50: 437-481.
Reynolds, C.S., Padisik, J. & Sommer, U. 1993. Intermedi- ate disturbance in the ecology of phytoplankton and the maintenance of species diversity: a synthesis. Hydrobiologia 249 183-188.
RosCn, G. 1981. Phytoplankton indicators and their rela- tions to certain chemical and physical factors. Lim- nologica (Berlin) 13 (2): 263-290.
Rott, E. 1988. Some aspects of the seasonal distribution of flagellates in mountain lakes. Hydrobiologia 161:
Ruuhijarvi, R., Alapassi, M. & Heikkinen, P. 1976. Lokan altaan turvelauttatutkimus. [Research on peat floats in the Lokka reservoir]. 49 p. Department of Botany. University of Helsinki. (Mimeograph). In Finnish.
Salonen, K., Jones, R.1 & Arvola, L. 1984. Hypolimnetic phosphorus retrieval by diel vertical migrations of phytoplankton. Freshw. Biol. 14: 431-438.
Salonen, E. & Mutenia, A. 1992. Stockings and changes in peled (Coregonus peled (Gmelin)) stocks and fishery management in the Lokka and Porttipahta reservoirs, northern Finland. Pol. Arch. Hydrobiol. 39 (3-4):
Skolberg, O.M. & Skolberg, R. 1985. Planktic species of Oscillatoria (Cyanophyceae) from Norway, characteri- zation and classification. Arch. HydrobiolSuppl. 71 112 (Algological Studies 38/39): 157-174.
Smolander, U. & Arvola, L. 1988. Seasonal variation in the diel vertical distribution of the migratory alga Cvpto- monas marssonii (Cryptophyceae) in a small, highly humic lake. Hydrobiologia 161: 89-98.
Sorokin, Y.I. 1972. Biological productivity of the Rybinsk reservoir. In: Proceedings of the IBP-UNESCO Sym- posium on Productivity Problems of Freshwaters. Kazimier Dolny, Poland, May 6-12.1970 (eds. Z.Kajak, A.Hillbricht-Ilkowska), 493-503.
Steinberg, C.E.W. & Hartmann, H.M. 1988. Planktonic bloom-forming Cyanobacteria and the eutrophication of lakes and rivers. Freshwater Biology 2 0 279-287.
Stoermer, E.F, Wolin, J.A., Shelske, C.L & Conley, D.J. 1985. Variations in Melosira islandica valve morpholo- gy in Lake Ontario sediments related to eutrophication and silica depletion. Limnol. Oceanogr. 30 (2): 414-418.
Straslrabovi, V. & amek, K. 1993. Microbial loop in lakes and reservoirs related to trophy and metazooplankton development. Verh. Internat. Verein. Limnol. 25: 1183-1186.
Sundback, K. 1976. Kalaston ja kalastuksen kehitys Lokan tekojarvessa. p h e development of fishstock and fish- ing in the Lokka Reservoir]. 84 p. University of Hel- sinki. (A manuscript). In Finnish.
Talling, J. 1957. Photosynthetic characteristics of some freshwater plankton diatoms in relation to underwater radiation. New Phytol. 56 29-50.
285-311.
159-170.
837-846.
I .
, 0
37 Tikkanen, T. 1986. Planktonopas. [Phytoplankton
guide]. Suomen honnonsuojelun tuki Oy. Forssa. 278 p. In Finnish.
Tikkanen, T. & Willtn, T. 1992. Viixtplanktonflora. [Phytoplankton guide]. NaturvArdsverket. Eskilstuna. 280 p. In Swedish.
Trifonova, I. 1986. Seasonal and main succession of lake phytoplankton. Hydrobiological Journal. 22 (3):
Tkifonova, I. 1988. Oligotrophic-eutrophic succession of lake phytoplankton. In: Algae and the Aquatic En- vironment, (F.E.Round ed.), Biopress Ltd., Bristol.
Trifonova, IS. 1989. Changes in community structure and productivity of phytoplankton as indicators of lake and reservoir eutrophication. Arch. Hydrobiol. Beih. Ergebn. Limnol. 33: 363- 371.
lbndisi, J.G. 1993. Theoretical basis for reservoir manage- ment. Verh. Internat. Verein. Limnol. 25: 1153-1156.
lbrkia, J. & Lepist6, L. 1991. ' b o centric diatoms from Finland: Freshwater species of Melosiru or Aulucoseiru and Skeletonemu. 8th Workshop of the International Association of Phytoplankton Taxonomy and Ecology. 5-15 July 1991, Baja, Hungary. (Mimeograph) 1 p.
19-25.
108-123.
Utermohl, H. 1958. Zur Verfollkommnung der quan- titativen Phytoplankton-Methodik. Mitt. Int. Verein. Limnol. 9: 1-38.
Oy Vesitekniikka Ab, 1967. Kemijoen yleistutkimus vv. 1964-1966. [A compherensive survey of the river Kemijoki in 196449661. Rauma. 411 p. In Finnish.
Vogt, H. 1978. An ecological and environmental survey of the humic man-made lakes in Finland. Aqua Fennica, 12-24.
Voros, L. & PadisBk, J. 1991. Phytoplankton biomass and chlorophyll-u in some shallow lakes in central Europe. Hydrobiologia 215: 111-119.
Wetzel, R. G. 1983. Limnology, 2nd edition. Saunders Col- lege publishing (ed.), New York, 767 p.
Willtn, E. 1987. Phytoplankton and reversed eutrophica- tion in Lake Mdaren, Central Sweden, 1965-1983. Br.
Willin, E. 1991. Planktonic diatoms -an ecological review. Algological Studies 6 2 69-106.
Willtn, E. 1992. Long-term changes in the phytoplankton of large lakes in response to changes in nutrient load- ing. Nord. J. Bot. 1 2 575-587.
Phytol. J. 2 2 193-208.
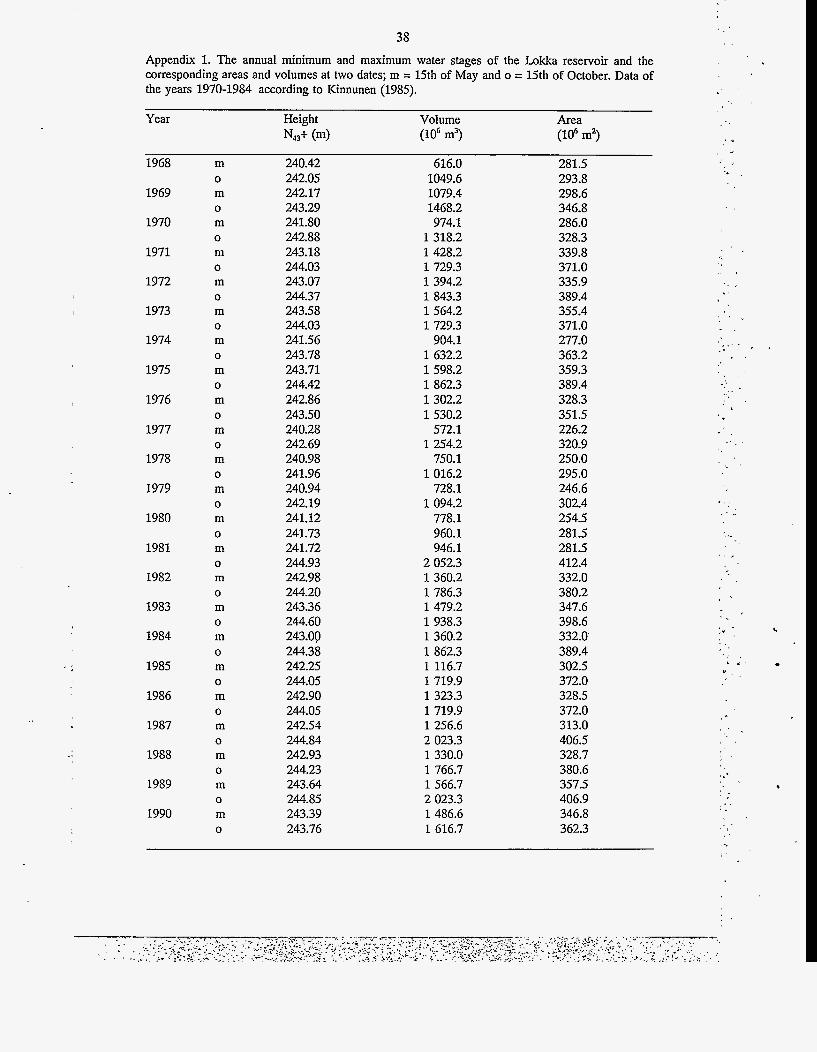
38 Appendix 1. The annual minimum and maximum water stages of the Lokka reservoir and the corresponding areas and volumes at two dates; m = 15th of May and o = 15th of October. Data of the years 1970-1984 according to Kinnunen (1985).
Year Height Volume Area N43+ (4 (lo6 m3) (10' m2)
1968
1969
1970
1971
1972
1973
1974
1975
1976
1977
1978
1979
1980
1981
1982
1983
1984
1985
1986
1987
1988
1989
1990
m
m
m
m
m
m
m
m
m
m
m
m
m
m
m
m
m
m
m
m
m
m
m
0
0
0
0
0
0
0
0
0
0
0
0
0
0
0
0
0
0
0
0
0
0
0
240.42 616.0 281.5 242.05 242.17 243.29 241.80 242.88 243.18 244.03 243.07 244.37 243.58 244.03 241.56 243.78 243.71 244.42 242.86 243.50 240.28 242.69 240.98 241.96 240.94 242.19 241.12 241.73 241.72 244.93 242.98 244.20 243.36 244.60 243.00 244.38 242.25 244.05 242.90 244.05 242.54 244.84 242.93 244.23 243.64 244.85 243.39 243.76
1049.6 1079.4 1468.2 974.1
1318.2 1428.2 1 729.3 1 394.2 1 843.3 1564.2 1 729.3
904.1 1 632.2 1598.2 1 862.3 1302.2 1530.2
572.1 1 254.2
750.1 1016.2
728.1 1 094.2
778.1 960.1 946.1
2 052.3 1360.2 1 786.3 1 479.2 1 938.3 1360.2 1 862.3 1 116.7 1719.9 1323.3 1719.9 1 256.6 2 023.3 1 330.0 1 766.7 1 566.7 2 023.3 1486.6 1 616.7
293.8 298.6 346.8 286.0 328.3 339.8 371.0 335.9 389.4 355.4 371.0 277.0 363.2 359.3 389.4 328.3 351.5 226.2 320.9 250.0 295.0 246.6 302.4 254.5 281.5 281.5 412.4 332.0 380.2 347.6 398.6 332.0 389.4 302.5 372.0 328.5 372.0 313.0 406.5 328.7 380.6 357.5 406.9 346.8 362.3
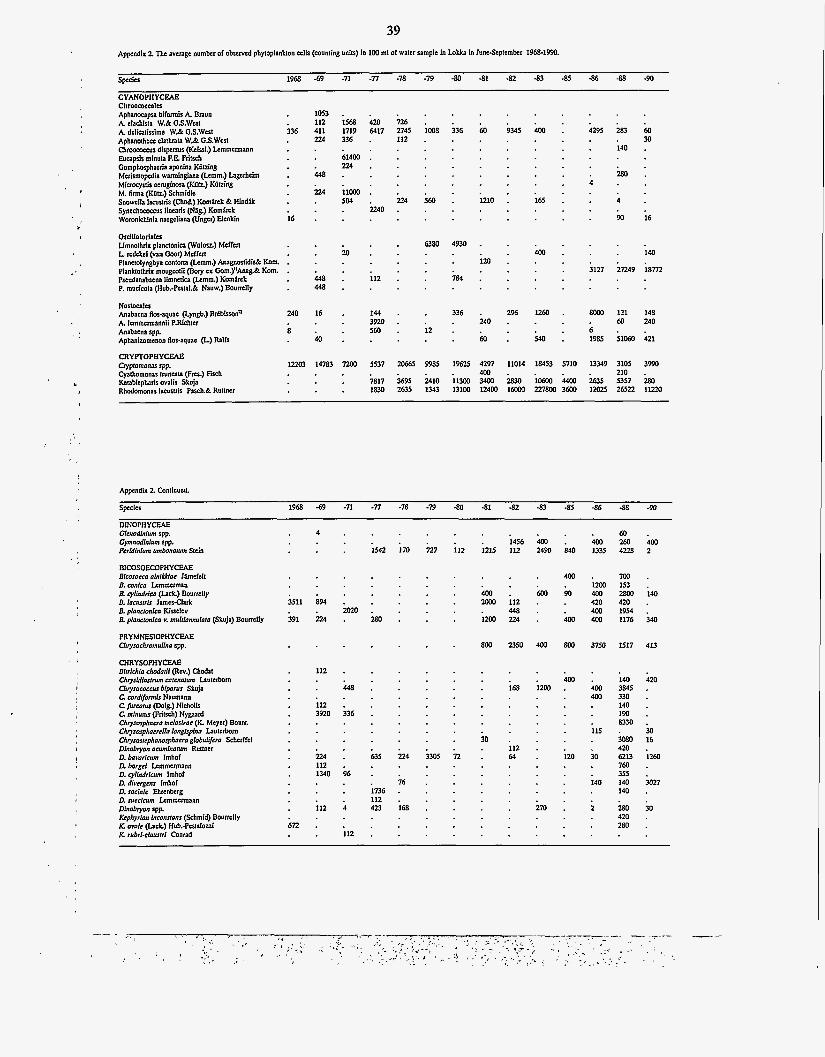
39 Appendix Z ll8c avenge numkr of obscrvcd phytoplanklon a l l r (counting unils) in 100 ml of watcr sample in Lakka in IuncSeplcmkr 19fS-1990.
Chmococcaln Aphanocapsa biformir A Bnun A clachirla W.& GS.Wn1 A dclialissima W.& 0.S.Wal Aphanalhca clathnla W.& GS.WKI chmoeocatr dirpersur (KCLI.) Lcmmcrmann Euwpris minula F.E Friuch Gomphosphaeria aponina KGaing Mcrirmopcdia warmingiana (rcmm.) hgcrhcim Miaucystis acrupinm (KGb) KGlzhg M. firma (KO=) Schmidlc Snowclla lacurlrir (Chad.) Komdxk & Hindik Syncchomaur liicarir (?fl&) Komtrck Womnichinia nacgeliana (Ungcr) Ucnkin
1053 . 112 1568 420 726 411 1719 6417 2745 224 336 . 112
. 61400 . .
. 2 2 4 . . 448 . . . 224 11ooo . . . 5 0 4 . 224 . 2240 .
. .
336 . .
1008 336 60 9345 400 . . . . . . . . . . . . ~ . 560 . 1210 . 16.5 . . .
4295 yJ3 60 . 3 0 . 140 . 2 8 0 . h . 4 .
90 16 I
16
Orclllalorialn Umnolhrix planaonica (Wnlorr) Meffcn L rcdckcl (van Goof) Mcffcn Planaolyngbya conlorn (Lcmm.) Anagnoslidii Kom. Planklolhdx mougmlii (Bory ex Gom.)"Ana&& Kom. Preudanabacna limnclica (Lcmm.) Komdxk P. mucimla (Hub.-Palal.& Nauw.) Baumlly
. . 6380 4930 . . . . .
. 120 . . . . . . 2 0 . . . . . . 448 . 112 . 448 .
4 0 0 . 140
3127 27249 18772 7 8 4 .
Nostocala Anabaena Ros.aquae (Lyngb.) Brtbissong A lcmmcrmannii P.Richtcr Anabacna spp. AphanLomcMn Aos.aquas &) Ralfs
240
8 . 336 . 296 1260 . 12 . . . . € 0 . 5 4 0 .
. 240 . gM0 121 148 . 60 240 6 . 1985 51060 421
16 . 144 . 3920 . 560 . . . 40 .
CRYFTOPHYCEXE Cryptomonas spp. 12203 14783 72W 5537 2 W 5985 19625 4297 11014 18453 5710 13349 3105 3990
Karablcpharir ovalir Skuja . . : 7817 3695 2410 11300 3400 2gu) ~o600 h400 2635 5357 280 Rhadomonar Iacurlrir Parch.& Rutlncr . . . 1830 2635 1343 13100 12400 16OW 227BM) 3KW 12025 26522 11220
Cyathomonas INnaIa (Frcr.) Flrch . . . . . . 4 0 0 . . 210 .
Appendix 2 Continued.
Spccicr 1968 -69 -71 -n -78 -79 -80 -81 -SZ -83 -85 6 - 8 ~ -90
DINOPHYCEAE Cle~dinlvm spp. . 4 . . . .
1542 170 727 112
. .
. .
3305 72
. 1456 400 . 1215 112 2490 840
. a . 400 260 400 1.335 4228 2
Gymnodinlwn rpp. Pcddinlum wnbunarum Slcin
DICOSOECOPHYCEAE Blmrocco oinWoe Ihcfclr B. conlco Lcmmcrman E. cylindrlcr, (La&.) Dourrclly 8. lacwrrls lamcs.Clark 8. ploncronlco Kizvlev B. plancronlco v. mulr&nnukm (Skuja) Bounclly
. 4 0 0
4 0 0 . 6 0 0 9 0 uxx) 112 . . 4 4 8 . 1200 224 . 400
. 700 . 1200 153 . 400 2800 140 420 420 . 400 19% . 400 1176 340
. . . . . . . . 3511 894 . . mo . 391 224 . 280 .
PRYMNESIOPHYCEAE Qtysochromulinu rpp. rn 2350 400 rn 3750 1517 413
CHRYSOPHYCEAE B l l d ~ h c h ~ r l l (Rsv.) Chodrt Chty~ldiorlm WlCMNm b U l C h r l l Q~rocaccus blporus Skuja C mrdiformls Naumann C firwrus (Dol&) Nichollr C minuw (Friwh) Nygaard Chtyro~phacro mclorlroe (K. Mcycr) Bourr. ~rysosphacrclla longispinu Lurehorn Qtyrorrepho~~phacrog&bulifcro Schcrffcl Dinobryon acuminurum Ruuncr D. bovarlcwn lmhaf D. borgcl Lemmcrmann D. cyl lnddm Imhof D. dlvergcns lmhof D. socinlc Ehrcnbcrg D. suecicum Lcmmcrmann Dinobryon spp. Kephyrlon inmnsrans (Schmid) Bourally K ovok (Lack.) Hub..Pcstalozzi K rubrl.c&usrri Conrad
. 112 .
. . 4 4 8 . .
. . . . . . 4 0 0 . 168 1200 .
. . . 140 420 400 3845 . 400 330 . . 140 . . 190 . . 8330 . 115 . 30 . 3080 16 . 420 . 30 6213 1260 . 760 . . 355 . 140 140 3027 . 140 .
. . . . . 112 . . . . 3920 336 . . . . . . . . . . . . . . . . 224 . 635 224 . 112 . . . . 1340 96 . . . . . . 76 . . . 1736 . . . 112 . . 112 h 423 168 . . 6 n . . . 112 .
30 . . 112 . . 64 . 120 . .
. 270 .
. . 2 2 8 0 3 0 . 420 . . 2 8 0 ,
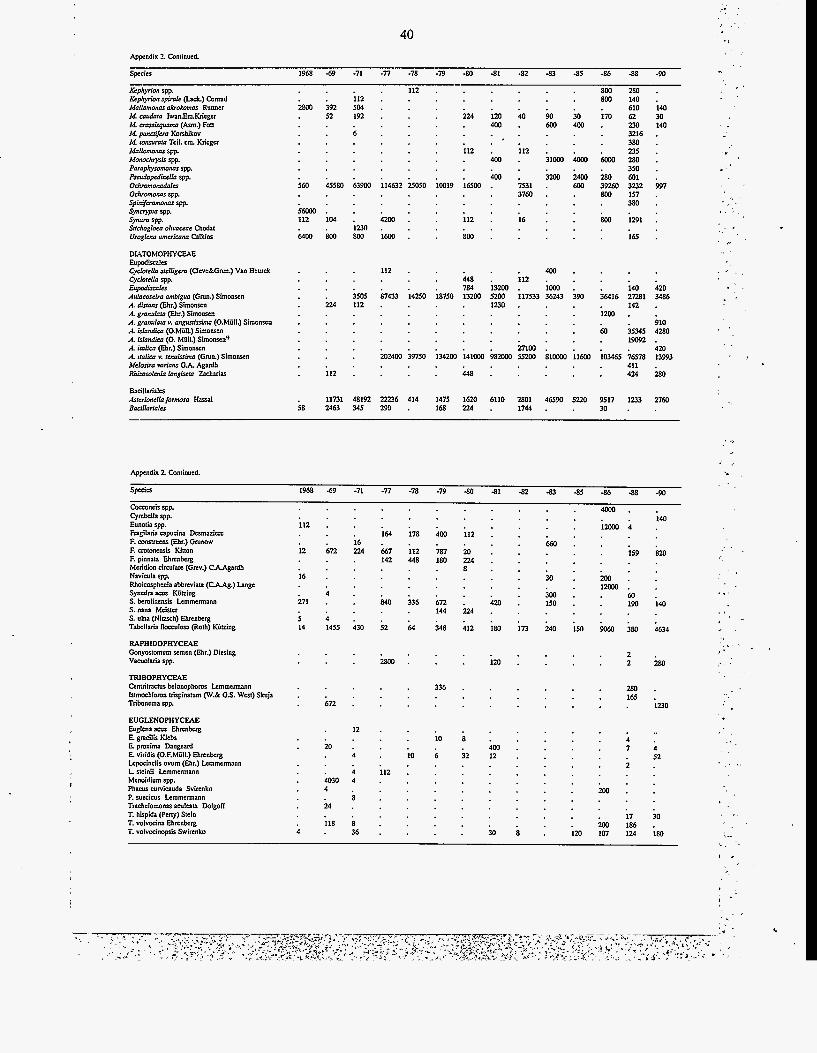
40 Appendix Z Continucd.
SpcdCS 1968 -69 -71 -77 -78 -79 -80 -81 -82 -83 -85 -86 -88 -90
KePhyrio" rpp. Kephyrion spirnle pck.) Conrad Mallomonat &obnuu Ruttnu M. caudnrn 1wanh.Kricgcr df. anuirgvMur (Aun.) Fott M. pwraifem Korshikov M. r o m n r n Tcil. em. Kricgu dfallomonnr spp. MoMdvysir spp. Pamphysomonat spp. PsordopcdincUn spp. OChmnWMdEler OChmmMS spp. S p i n i f w m m spp.
- W r o spp. Syncrypra spp.
Sfirhogloea olivaccae o l d a t U r o g h umcric- Calkins
DMTOMOPHYCEAE Eupodiilcr Cylorcllo srelligua (CIcvcdcGmn.) Van Hcurck
Eup4scnler Auhcoscirn ambigun (Gmn.) Simonwn A. dinnns (Ehr.) Simonscn A. gramlorn (Ehr.) Simonwn A. granulorn v. nngvnirrimo (0.MBII.) Simonwn A. irlandica (OMBIL) Simonwn A. isfnndicn (0. MBII.) Sionwn" A. hlica (Ehr.) Simonwn A. ualicn Y. ruuissimn (Grun.) Simonwn Melnsira wlinnr G A Agardh Rhwsolurin longism Zacharias
BacilMala Arrcrionellnfomsu H w l BaciUnridrr
cyclovun spp.
. 112 . . 8 0 0 2 8 0 . . 112 . . 800 140 .
2800 392 5w . . 610 140 . 52 192 . . 224 I20 40 90 30 170 62 30 . 4 0 0 . 6 0 0 4 0 0 . 2 3 0 1 4 0 . 3216 .
. . 3 8 0 . . 112 . 112 . . . 235 . . 4 0 0 . 3 1 0 0 0 4 w o 6 0 0 0 2 8 0 .
: i :
. . 350 . . 4 0 0 . 3 m 2 4 w 2 8 0 6 0 1 . SM) 45580 63900 114632 25050 10019 16500 . 7531 . 600 39260 3232 997 . . . 3760 . . 800 I57 . . . . 380 . 5 m . . . . 112 104 . 4 m . . 112 . 16 . . 800 1291 . 6400 800 800 1600 . . 800 . . I65 . . m n .
. 112 . . 4 0 0 . . . . . 448 . 112 . . . . . . 784 13200 . 1wO . . 140 420 . 3505 87433 14250 18750 13200 5200 117533 36243 390 36416 2RBl 3486 . 224 112 . . . 1230 . . . 142 .
. 1200 . .
. 60 35345 4280 . . . 910
. *
. . 1 9 0 9 2 . . 27100 . . . . 420 . 2U2400 39750 134200 141wO 98uxx) 55ux) 81oMM 11600 103465 76578 13593 ' . . . . 411 . . 112 . . 448 . . . 424 280
. 11731 48192 22236 414 1475 I620 6110 2801 46590 5220 9517 1233 2760 58 2463 345 290 . 168 224 . 1744 . . 3 0 . .
Coccancis rpp. Cymbclla spp. Eunotia spp. Fngilaria capudna Dcrmaricrc E mnrmcns (Ehr.) Gmnaw F. cmloncnris Kitton F. pinnata Ehrcnkrg Meridian circulars (Gmr.) CAAgardh Navicula spp. Rhoimrphenia abbmriata (CAAg.) Langc Syncdn a m KGQing S. bcmlincnsis Lcmmcrmann S. nana Mcistcr S. ulna (Nimch) Ehrcnbcrg Tabellaria R a a r l o s (Roth) KBQing
. . . . 140 . . . . . 1 m 4 . 112 . . . . . . 164 178 400 112 . . . 16 . . . . m . . .
. E . . . . . . 16 . . . 3 0 . 2 0 0 .
12 672 224 667 112 787 20 . . . . 159 820 . . . . . 142 448 180 224 .
. . . 1m. . : i : . 3 0 0 . . 6 0 .
i h : . . . . 271 . . 840 336 672 . 420 . 150 . . 190 140
. . . . . 144 224 . 14 1455 430 52 64 348 412 180 173 240 150 9060 380 4634
RAPHIDOPHYCEXE Cmnystomum semen (Ehr.) Diaing Vacuolaria spp.
TRlBOPHYCE4E Ccntritnaus bclonophoms Lcmmcrmann ls:mochlomn trispinatum (W.& GS. Wcst) Skuja Tnincma spp.
EUGLENOPHYCEXE Euglena am Ehrcnkrg E gracilis Klcbs E. proxima Dangcard E. viridir (0.F.MBII.) Ehrcnbug Lcpainclis ovum (€hi.) Lcmrncrmann L steinii Lcmmcrmann Mcnoidium rpp. Phacus curvisuda Svircnko P. ruccicus Lcmmcrmann Tnchclomonas aculcata Dolgoff T. hirpidi @my) Stein T. wlvocina Ehrcnbcrg T. volvodnopsis Swircnko
2 8 0 0 . . . I20 . . . 2
. . 2 280
1230
h 52
30
180
. 336 . . . m . . 165 . . . . 672 . . . . 12
. 2 0 . h : b
. s ;Is s
. 4030 4
. 4
. 24 .
h . 36
: ;a s : io b ;2
112 .
. .
400 . 12 .
. . .
. . 4
. . 7 . . . i . . . . .
. m . . . . . .
. . 17
. ZW 186 120 107 124 ;o 8 :
I . C
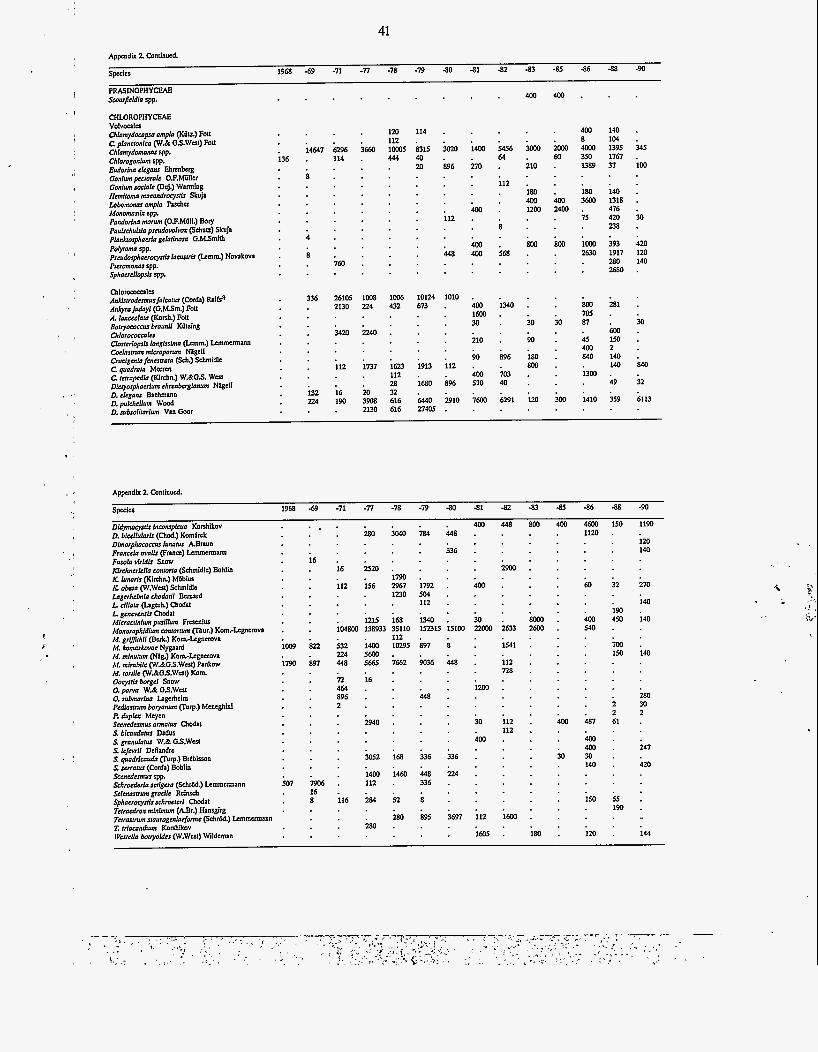
41 Appendix 2. Continued.
S d C S 1968 -69 -71 -n -78 -19 -80 -81 -82 -83 -85 -86 -88 -90
PRASINOPHYCEAE 400 400 Scourficldfo rpp.
CHLOROPHYCEAE Volvoalcs Chlomydowpa omplo (Koa) Fott C pfonflonfm (W& GS.WCSI) FoU Chlomydomow spp. Chforogonfum rpp. Eudorina ckgans Ehrcnberg Gonfum pccromfc 0.FMGller G o n h soclofc @uj.) Wming Hmiromo mocandrocysris Shja Lobomow amplo P d e r MOMIMS~& spp. Pandorlno m o m (0.F.MOII.) BOW ~~~ischukhps&fwx (Schuu) Shja PloNtroJphacrb gclorhsa G.MSmith Polyromn rpp. pscudasphncrocysr& locusfrfs (Lmm) Novakova Prcromow spp. Sphocrc/lops& spp.
Chlorocomlcs An&rrodumwfo/wrus (Cob) Wfs" A&ra judnyl (G.MSm.) Fott A. Ionuoforo (Korrh.) Fou Borryacaccus brounif KOlring ChlOmXacWlrr Cfosrerlopsis fongfsfmo (Lam.) hmermann CoelmlNwn micropom Nigeli crucfgcnlo fwrrroro (Sch.) Schmidle Cquadrorn MOM C rctropcdh (Klrchn.) W.&GS. Wcsl Dfciyosphocrium chrcnbcrglonum N W D. cfcgons Bachmann D. pdclreflum Wood D. subsofirorfum Van Gwr
120 112 1m
114
8315 40 2Il
400 8 4wo 350 U89
140 104 1395 1767 37
136 3660 3020
896
1400 5456 64
112
345 14647 6296 114 444
no 210 100 s 400 24M)
180 400 12CQ
800
180 36w
75
loo0 2630
140 1318 476 420 238
400 30 112
8
568
4 800 393
1917 280 2630
420 120 I40
400 4M) 448 8
7M)
10% 224
IWK 432
10124 673
IOIO 336 26105 2130 800
705 87
281
600 150 2 140 140
400 I 6 w 30
210
1340
M 30 30 2240
1737
3420 90
180 800
45 4M) 840
1300
90
400 570
896
703 40
1623 112 28 32 616 616
1913
1680
6440 27405
112 840
32
6113
112
896
2910
49
359 120 132 224
16 190
20 3908 2130
Mo 1410 6291
Appendix 2. Continued.
SpCciS 1968 49 -71 -n -78 -19 -80 -81 -82 -83 .as -86 -88 -90
Dfdwsf?J InmWJh Korrhikov . . 400 448 800 400 4600 uo 1190 . . . . m
I6 2520
112 156
3040184 4 4 8 .
. 336 . . .
. 2m 1790 . 2967 I792 . 400 . 1230 504 . . . 112 . 168 1340 . 30 . 35110 152315 15100 ZZOOO 2633
400
30
1120
60
400 540
481
400 400 30 140
uo
120
D. ifccf&lor& (Chob.) Kombek ~ f m o r p h o u ~ ~ how ABnun Froncclo awlis (France) Lcmmcrmann Fusolo vfrfdis Snow Mrchncrkflo mnrom (Sdunidlc) Bohlin K /mor& (Klrchn.) Mobius K o k n (W.Wcst) Sdunidle logerhcfmlo chodarli Bcmrrd L cffloro (ldgerh.) Chcdil L gcnrvmnsis Chodal Micraflinfum pusfllum Fraenius Monornphldivm mnrorrum (mur.) Kom.-LcgnCmVa M. grifjirhfi perk.) Kom.-Lcgnerova M. b m o r h e Nygaard M. minurum vag.) Kom.-Lcgnmva M. mimbife (W.&GS.WCSI) Pankow M. rorrik (W&GS.Wcst) Kom. Oocysris burgel Snow 0. porn W& GS.Wsrt 0 . d m o r i M Lagerhch p c d h r m boryonum (Furp.) Meneghini P. dupk Meyen Scencdumw armow Chodal S blwudnw Ddus S. grnnubw W.& GS.Wcst S. f e f d i DeRandre S quodriwudn ( T u p ) Brtbi in S scrrow (Coda) Bohlin Sccncdumus spp. Schrocdcrb sntgcro (Schrad.) h m c r m a n n Scfemwrum grodfc R e i d sphoemcynLschmrcri Chodit Terraedron mlnfmwn (A.Br.1 b g i r g Tcrrosrrwn srawogcnloeforme (Sdu6d.) Lcmmermann L rrbwndwn Konhikov W'csrefh borryolder (W.Wcs1) Wildeman
32
190 450
7M) 150
; 2 61
55 190
120 140
16
270
140
140 . 1215 104800 138933
532 1400 224 56w 448 5665
. . . . 1009 622
112 . 10295 897 s : . . 7652 9036 448 . . . . . . . . lux) . 448 .
. . M
1541
112 728
112 112
I 6 w
140 1790 897
. .
. . . .
?Z 16 464 . 896 . 2 .
. 2940
. 3052
. 1400 . 112
116 284
. m
280 30 2
. m . . I68 336 336 .
247
420 . . . 1 4 . 5 0 4 4 8 2 2 4 . . 336 . . 507 7906 . 16
. a . .
. . . . 280 895 3697 112
. 1605 180 144
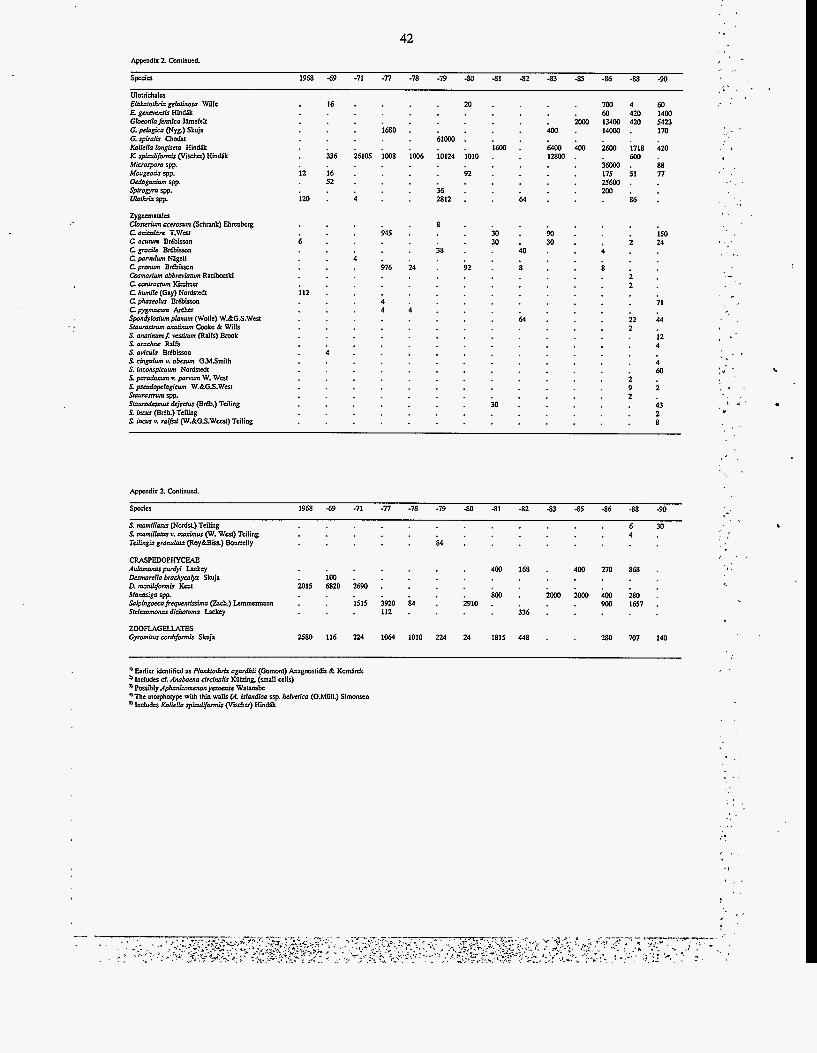
. 16 .
. 1680
. 336 26105 100s
12 16 . . 52 . ; 2 0 : h :
f 2 0 .
. 61OOO . . 10% 10124 1010 .
. a .
. 1600 .
. 36 . . 2812 . . 6 4
. 7 0 0 4 60 . 60 420 1400 . zoo0 13400 420 5423 400 . 14ooo . 170 . . 6400 400 2600 1718 420 1m. . 6 0 0 .
. 3 m . 88
. 25600 . . 200 .
. 175 51 n
. 86 . Zygnunaula Closfcrim accrosum (Schnnk) Ehrcnbug . 8 . . . C aciadmc T.West . 945 . . 3 3 . 9 0 . 150 Caauwn Brtbiin 6 . . 30 . 30 . 24 Cgradlr Brtbiin . 38 . . 40 . . i . C punvlum Nigcli : h : Cpronwr Brtbiin . 9 7 6 i 4 : 5 2 : i ; : s cnsmarim abbminrum Raciirrki . . . i :
Cphprmlrr Brtbiin : h ' . . . . 71 Cpypnun Archer . 4 i : Spondylosium pla.ym (Wolc) W.&GS.Wst . a . . 22 44
Savi& Brcbisson : h : . . . : h
S p s d o p c l o p h n W.&GS.Wcw . . 9 i
C mrncrum Kirchnu . . 2 . C hwnile (Gay) Nordsrsdt 112 . . .
Suwnrmun (uy1~uyn Cookc & Wills S umfinwnf. ustirum (Ralfs) Bmok . 12 S nmduu Ralfs . . . 4
S cingulum v. o h G.MSmith S inconspic- Nordstedt 60 S paradaaun v. pmwl w. west
srawnrmun spp. . . 2 . Srovodcanvr &jcuus (Brcb.) Teiling . 3 0 . . . . . 43 S inm (Bdb.) Teiling . 2 S inarr v. ralfni (w.&GS.Wcat) Tciling . 8
. 2 .
: : i
Appendix Z Continued.
Spcdu 1968 -69 -71 -77 -78 -79 -80 -81 -82 -83 -85 -86 -88 -90
S d l o r u r (Nodst.) Teiling . 6 30 S mndw v. tmximus (W. West) Tciling . . . 4 . Tcifingia granulotn (Roy&Bii) Boumlly . 8 4 . . . Auhwnaspw@ Lackey . . . 400 168 . 400 210 868 . Demuuelb bmchycnryI Shja . 100 . . . . . D. monilfam*r Kent 2015 6820 2690 . . . . M o m i n spp. . . . m . z o o 0 ~ 4 0 0 2 8 0 . S a f p i n g m c a f i q u c ~ (Zach.) Lsmmermann . . 1515 3920 84 . 2910 . . 900 167 . Svlaomonnr di&romn Lackey . 112 . . 336 . . . . .
cRAsPED0PHYcEAE
2580 116 224 1064 1010 224 24 1815 448 .
. . . . I ,.
.... , .
* _
. "
8 . .*
'I Earlicr i3cnIificd as Pfmtk~olhrL agardhii (Gomont) Anagnmlids & Komdrck lnduda d.hbom circinulir KWng, (small ells) e m a i y Aphonizomcnonyclwrre Watanabc The morphorypc with thin walls @ Ubndicn s p . hckriua (0.MidI.) Simonwn Includes Kolicflo spicufifommk (Viiu) Hind&
. ..
C