
Scientific Report 2000 - OSTI.GOV
161
PAULSCHERRERINSTITUT ISSN 1423-7342 March 2001 Scientific Report 2000 Volume V General Energy ed. by: Christina Daum and Jakob Leuenberger CH-5232 Villigen PSI Switzerland Phone: 056/310 21 11 Telefax: 056/310 21 99 http://www1.psi.ch/www_f5_hn/f5_home.html
-
Upload
khangminh22 -
Category
Documents
-
view
1 -
download
0
Transcript of Scientific Report 2000 - OSTI.GOV

PAULSCHERRERINSTITUT ISSN 1423-7342
March 2001
Scientific Report 2000
Volume V
General Energy
ed. by: Christina Daum and Jakob Leuenberger
CH-5232 Villigen PSISwitzerland
Phone: 056/310 21 11Telefax: 056/310 21 99
http://www1.psi.ch/www_f5_hn/f5_home.html

TABLE OF CONTENTS
INTRODUCTION 1A. Wokaun
ENERGY AND MATERIALS CYCLES 5
IMPROVEMENT OF THE HEAT TRANSFER IN CATALYTIC FIXED BED REACTORS BY 6MEANS OF STRUCTURED PACKINGST. Schildhauer, E. Newson, P. Binkert, F. v. Roth, P. Hottinger, T.B. Truong
KINETICS AND SYSTEMS ANALYSIS FOR PRODUCING HYDROGEN FROM METHANOL 8AND HYDROCARBONSK. Geissler, E. Newson, F. Vogel, T.B. Truong, P. Hottinger
INVESTIGATING THE EVAPORATION OF HEAVY METALS FROM FLY ASH BY THERMO- 10DESORPTION SPECTROMETRYH. Lutz, Ch. Ludwig, R. Struis, S. Stucki
OPTIMISATION OF THE BATTERY PYROLYSIS IN A THERMAL BATTERY RECYCLING 12PROCESSJ. Wochele, Ch. Ludwig, A.J. Schuler, A. Krebs (BATREC AG)
PECKTECH: BETTER QUALITY OF MSW INCINERATOR RESIDUES AT LOWER COST 14S. Biollaz, S. Stucki, R. Bunge (Eberhard Recycling AG), M. Schaub (CT Umwelttechnik AG),H. Kunstler (Kupat AG)
THE INFLUENCE OF PLASTIC MATERIALS ON THE FORMATION OF TARS IN THE 16GASIFICATION OF URBAN WASTE WOODL.C. de Sousa, T. Marti, S. Stucki
THE REDOX PROCESS FOR PRODUCING HYDROGEN FROM WOODY BIOMASS, 18PRELIMINARY MODELLING RESULTSR. Sime, S. Biollaz, M. Sturzenegger, S. Stucki
STUDYING THE REDOX PROCESS BY COMBINED TG-FTIR-GC EXPERIMENTS 20R.P.W.J. Struis, A. Frei, L D'Souza, J. Kuehni, Ch. Ludwig, M. Sturzenegger
SOLAR TECHNOLOGY 23
DETERMINATION OF THE RESIDENCE TIME DISTRIBUTION FOR A SOLAR REACTOR 24AND ITS USE FOR DERIVING REACTION KINETICSTh. Frey, Ch. Guesdon, M. Sturzenegger
DEVELOPMENT OF A REFLECTOMETER FOR THE DETERMINATION OF THE 26SPECTRAL EMITTANCE IN THE VISIBLE AT HIGH TEMPERATURESS. Eckhoff, I. Alxneit, M. Musella, H.-R. Tschudi
SOLAR RECYCLING OF HAZARDOUS SOLID WASTE MATERIALS 29B. Schaffner, W. Hoffelner (RWH Consult GmbH), A. Steinfeld (ETHZ and PSI)
STOICHIOMETRIC OPERATION OF THE SYNMET REACTOR 31S. Kraupl, A. Steinfeld (ETHZ and PSI)
DEVELOPMENT OF A SOLAR CHEMICAL REACTOR FOR THE DIRECT THERMAL 33DISSOCIATION OF ZINC OXIDES. Moller (DLR, Stuttgart, Germany), R. Palumbo
COMBUSTION RESEARCH 35
PRELIMINARY INVESTIGATION OF STABILITY AND STRUCTURE OF TURBULENT 36PREMIXED FLAMES AT ATMOSPHERIC PRESSUREP. Griebel, K. Herrmann (ETH Zurich), R. Scharen, M. Witt

CATALYTIC COMBUSTION OF HYDROGEN-AIR MIXTURES OVER PLATINUM: 38VALIDATION OF HETERO/HOMOGENEOUS CHEMICAL REACTION SCHEMESC. Appel, I. Mantzaras, R. Schaeren, R. Bombach, A. Inauen
LASER INDUCED FLUORESCENCE OF HOT OXYGEN IN PARTIALLY PREMIXED 40METHANE FLAMESR. Bombach, A. Inauen
INVESTIGATION OF THERMOACOUSTIC PHENOMENA IN A GAS TURBINE BURNER 42BY LASER-INDUCED FLUORESCENCEA. Inauen, R. Bombach, W. Hubschmid, A. Stampanoni-Panariello
DETERMINATION OF THE HYPERFINE STRUCTURE SPLITTING OF NO A2Z+ (v"=0) 44BY DOUBLE RESONANCE POLARIZATION SPECTROSCOPYB. Hemmerling, A. Stampanoni, E.F. McCormack (ETH Zurich)
SIMULTANEOUS MEASUREMENTS OF TEMPERATURE AND FLOW VELOCITY 46USING LASER-INDUCED ELECTROSTRICTIVE GRATINGSD.N. Kozlov, B. Hemmerling, A. Stampanoni-Panariello
TEMPORAL EVOLUTION OF THERMAL LASER-INDUCED GRATINGS 48W. Hubschmid
THE SOOT REDUCTION POTENTIAL OF OXYGENATED FUELS 50S. Kunte, T. Gerber, P. Beaud , P. Radi, G. Knopp
HIGH RESOLUTION SPECTROSCOPY BY fs-CARS 52P. Beaud, T. Lang (MPQ, Garching), H.-M. Frey, T. Gerber, M. Motzkus (MPQ, Garching)
OBSERVATION OF STATE-TO-STATE ROTATIONAL ENERGY TRANSFER IN 54EQUILIBRIUM MEDIAP.P. Radi, A.P. Kouzov (St.-Petersburg State University, Russia),P. Beaud, T. Gerber
SELECTIVE CATALYTIC REDUCTION OF NO AND NO2 AT LOW TEMPERATURES 56M. Koebel, G. Madia, M. Elsener
THERMOPHOTOVOLTAIC DEMONSTRATION SYSTEMS 58J.C. Mayor, W. Durisch, F. von Roth, B. Bitnar
ELECTROCHEMISTRY 59
AC IMPEDANCE ANALYSIS OF BIFUNCTIONAL AIR ELECTRODES 60S. Miiller, F. Holzer, H. Arai (on leave from NTT Laboratories, Japan), O. Haas
IN-SITU SYNCHROTRON XAS AND XRD INVESTIGATION ON BIFUNCTIONAL 62OXYGEN-ELECTRODE CATALYSTSO. Haas, S. Muller, F. Holzer, X.Q. Yang (BNL), X. Sun (BNL),M. Balasubramanian (BNL), J.M. McBreen (BNL, USA)
PULSED LASER DEPOSITION OF ELECTROCHEMICALLY ACTIVE PEROVSKITE FILMS 64M.J.Montenegro, T. Lippert, S. Muller, A. Wokaun, P. Willmott (University of Zurich)
STABILITY OF BIFUNCTIONAL AIR ELECTRODES DEPENDING ON THE CO2 65CONTENT IN THE AIR AND STUDY OF DIFFERENT CO2 FILTER MATERIALSF. Holzer, J.-F. Drillet (Fachhochschule Mannheim), T. Kallis (DaimlerChrysler AG), S. Muller
SUPERCAPACITORS BASED ON GLASSY CARBON AND SULFURIC ACID - 67MECHANISMS OF SELF-DISCHARGEM. Hahn, M. Bartsch, B. Schnyder, R. Kotz, O. Haas, M. Carlen (ABB), D. Evard (Leclanche S.A.)
THE CORRELATION OF THE IRREVERSIBLE CHARGE LOSS OF GRAPHITE 69ELECTRODES WITH THEIR DOUBLE-LAYER CAPACITANCEF. Joho, M.E. Spahr (TIMCAL SA), H. Wilhelm (TIMCAL SA), P.Novak
IN-SITU NEUTRON RADIOGRAPHY OF LITHIUM-ION BATTERIES DURING 71CHARGE/DISCHARGE CYCLINGM. Lanz, E. Lehmann, W. Scheifele, R. Imhof (Renata AG), I. Exnar (Renata AG), P.Novak

ELECTROCHEMICAL QUARTZ CRYSTAL MICROBALANCE INVESTIGATION OF LITHIUM 73INTERCALATION INTO GRAPHITE ELECTRODES FOR LITHIUM-ION BATTERIESM. Lanz, P. Novak
DEVELOPMENT OF A 10 KW SUPERCAPACITOR MODULE FOR FUEL CELL CAR 74APPLICATIONM. Bartschi, S. Mtiller, B. Schnyder, R. Kbtz, V. Hermann (montena components s.a.),A. Schneuwly (montena components s.a.), R. Gallay (montena components s.a.)
GRAFTED, CROSS-LINKED CARBON BLACK AS A DOUBLE-LAYER CAPACITOR 76ELECTRODE MATERIALR. Richner, S. Muller, A. Wokaun
TESTING OF SUPERCAPACITORS AT PSI 78M. Bartsch, J.-C. Sauter, R. Kbtz
XPS AND LFM INVESTIGATION OF ANION INTERCALATION INTO HOPG 80B. Schnyder, D. Alliata, R. Kbtz
MODELLING STUDIES OF THE CO POISONING IN POLYMER 82ELECTROLYTE FUEL CELLS (PEFC)B. Andreaus (EPFL/PSI), L Danon (Imperial College, London, UK), L. Gubler, G.G. Scherer
DEVELOPMENT OF A BIPOLAR ELEMENT FOR PE-FUEL CELLS DEMONSTRATION 84IN A 6 kW STACKF.N. Buchi, M. Ruge (ETH Zurich)
DIRECT METHANOL FUEL CELL - IN SITU INVESTIGATION OF CARBON DIOXIDE 86PATTERNS IN ANODE FLOW FIELDS BY NEUTRON RADIOGRAPHYA. Geiger, E. Lehmann, P. Vontobel, G.G. Scherer
INVESTIGATION OF CATALYST UTILIZATION AT THE ELECTRODE - SOLID 88POLYMER ELECTROLYTE INTERFACE USING MODEL ELECTRODESU.A. Paulus, Z. Veziridis (Volkswagen AG, Germany), E. Deiss, C. Marmy, G.G. Scherer
FUEL CELLS WITH FLEXIBLE GRAPHITE BIPOLAR PLATES 90T. Pylkkanen, G.G. Scherer
EFFECTS OF TEMPORARY POTENTIAL INVERSION ON POLYMER ELECTROLYTE 92FUEL CELL (PEFC) PERFORMANCESA. Tsukada, O. Haas, J. Huslage
DRY AND WET CORROSION OF STAINLESS STEEL SAMPLES: AN XPS INVESTIGATION 93J. Wambach, A. Wokaun, A. Hiltpold
LASER INDUCED DECOMPOSITION OF KAPTON® STUDIED BY INFRARED SPETROSCOPY 94E. Ortelli, F. Geiger, T. Lippert, A. Wokaun
POLYIMIDE CARBONISATION AFTER LASER ABLATION 95F. Raimondi, S. Abolhassani, R. Brutsch, F. Geiger, T. Lippert, J. Wambach, J. Wei, A. Wokaun
INFLUENCE OF PHOTOCHEMICAL PROPERTIES ON THE ABLATION OF NOVEL ABLATION 96RESISTST. Lippert, J. Wei, A. Wokaun, N. Hoogen (TU Munich, Germany), O. Nuyken (TU Munich, Germany)
TOF-MS ANALYSIS OF POLYMERS DESIGNED FOR LASER ABLATION 97M. Hauer, T. Dickinson (Washington State University), S. Langford (Washington State University),T. Lippert, A. Wokaun
DEMONSTRATION OF A WORKING POSITIVE-NEGATIVE LASER RESIST SYSTEM 98J. Wei, T. Lippert, A. Wokaun, N. Hoogen (TU Munich, Germany), O. Nuyken (TU Munich, Germany)
CONVECTION-INDUCED ABSORPTION OSCILLATIONS IN A CUVETTE AFTER 99IRRADIATION WITH UV-LASER PULSESF. Gassmann, T. Lippert, J. Wei, A. Wokaun
ATMOSPHERIC CHEMISTRY 101
OZONE AROUND MILANO, ITALY 102A.S.H. Prevbt, J. Dommen

COMPARISON OF MODEL RESULTS (UAM-V) WITH MEASURED DATA DURING LOOP 103N. Ritter, M. Tinguely, S. Andreani-Aksoyoglu, J. Dommen, J. Keller, A. Prevot
CLEANSING OF THE PO BASIN AIR BY NORTH FOEHN 104R. Weber, A.S.H. Prevot
VERTICAL WIND MEASUREMENTS DURING THE 1999 MAP-FORM FIELD CAMPAIGN 105M. Furger, CH. Haberli (MeteoSchweiz), B. Neininger (MetAir AG)
REAL TIME RISK ASSESSMENT FOR ATMOSPHERIC DISPERSION OF ACCIDENTALLY 106RELEASED AIR POLLUTANTS FROM NUCLEAR POWER PLANTSW.K. Graber, M. Tinguely
UNEXPECTED VERTICAL PROFILES OBTAINED BY THE UAM-V AIR QUALITY MODEL 108OVER COMPLEX TERRAINJ. Keller, S. Andreani-Aksoyoglu, N. Ritter, M. Tinguely, A.S.H. Prevot
EVALUATION OF DIURNAL HYPERSPECTRAL BIDERECTIONAL REFLECTANCE FACTOR 109DATA ACQUIRED WITH THE RSL FIELD GONIOMETER DURING THE DAISEX'99 CAMPAIGNG. Strub, J.Keller, M. Schaepman (University of Zurich)
THE PSI ATMOSPHERIC POLLUTANT LABORATORY: SOPHISTICATED CHASING OF 110GASES AND AEROSOLSI. Polo, N. Bukowiecki, J. Dommen, A.S.H. Prevot, R. Richter, E. Weingartner, U. Baltensperger
ULTRAFINE PARTICLES FROM DIESEL ENGINES 111N. Bukowiecki, U. Baltensperger, W. Watts (University of Minnesota, Minneapolis),D.B. Kittelson (University of Minnesota, Minneapolis)
CHARACTERIZATION OF 20 nm- AEROSOL PARTICLES DURING AN URBAN RUSH HOUR 112N. Streit, E. Weingartner, S. Nyeki, U. Baltensperger, R. Van Dingenen (JRC, Ispra),H.W. Gaggeler (PSI, Uni Bern)
CLOUD AND AEROSOL CHARACTERIZATION EXPERIMENT (CLACE) AT THE 113JUNGFRAUJOCH - AN OVERVIEWE. Weingartner, S. Henning, N. Bukowiecki, M. Gysel, S. Nyeki, U. Baltensperger,P. Quaglia (EPFL), G. Larcheveque (EPFL), B. Calpini (EPFL), E. Karg (GSF),B. Busch (Uni Mainz), K. Kandler (Uni Mainz), L. Schutz (Uni Mainz), A. Hoffer (Uni Veszprem),Z. Krivacsy (Uni Veszprem), K.-P. Hinz (Uni Wurzburg), A. Trimborn (Uni Wurzburg),B. Spengler (Uni Wurzburg), M. Ebert (TU Darmstadt), S. Weinbruch (TU Darmstadt),S. Schmidt (IFT, Leibzig), M. Wendisch (IFT, Leibzig)
HYGROSCOPIC PROPERTIES OF LABORATORY GENERATED AND AMBIENT AEROSOL 114PARTICLES AT T < 0 °CM. Gysel, E. Weingartner; U. Baltensperger
SIZE DEPENDENT AEROSOL ACTIVATION AT THE HIGH-ALPINE SITE JUNGFRAUJOCH 115(3580 m ASL)S. Henning, E. Weingartner, U. Baltensperger, S. Schmidt (IFT Leipzig), H.W. Gaggeler(PSI, Uni Bern)
AIRBORNE LIDAR AND AEROSOL STUDIES OVER THE ADRIATIC SEA DURING STAAARTE II 116S. Nyeki, K. Eleftheriadis (NCSR), U. Baltensperger, I. Colbeck (Essex Uni.), M. Fiebig (DLR),C. Kiemle (DLR), A. Petzold (DLR), M. Lazaridis (NILU)
DISTINCTION BETWEEN BIOCHEMICAL AND WATER LIMITATION OF PHOTOSYNTHESIS 117USING STABLE ISOTOPESM. Saurer, Y. Scheidegger, R. Siegwolf13C / 18O ISOTOPE CORRELATION REVEALS OPPOSITE EFFECTS OF NO2 ON THE PLANT 118CARBON / WATER BALANCE COMPARED TO SOIL NITROGENR. Siegwolf, M. Saurer, R. Matyssek (University of Munich, Germany), J. Bucher (WSL Birmensdorf)
SEASONAL 518O VARIATIONS IN NEEDLES OF PICEA ABIES AS A FUNCTION OF 119ENVIRONMENTAL CONDITIONSM. Jaggi, M. Saurer, R. Siegwolf

ENERGY SYSTEMS ANALYSIS 121
THE REGIONALIZED CHINA ELECTRICITY TRADE MODEL: FIRST RESULTS AND POLICY 122RECOMMENDATIONSS. Kypreos, R. Krakowski
GEM-E3 SWITZERLAND: DATABASES UPDATE AND FURTHER INSIGHTS 124O. Bahn
THE POTENTIAL ROLE OF ENERGY CONSERVATION AND NEW RENEWABLES 126ECOLOGICAL AND ECONOMIC IMPLICATIONS FOR SWITZERLANDM. Jakob, U. Gantner, S. Hirschberg
APPENDIX 128

PLEASE BE AWARE THATALL OF THE MISSING PAGES IN THIS DOCUMENT
WERE ORIGINALLY BLANK

INTRODUCTION
A. Wokaun
The General Energy Research Department at PSIaims at advancing technologies for the sustainableprovision of energy services, hence contributing to-wards the development of a sustainable energy sys-tem as the long-term goal.
Problems associated with the use of energy have be-come a subject of severe public concern; examplesinclude the depletion of non-renewable energy re-sources and raw materials, the production of waste,emissions of air pollutants and the release of green-house gases that give rise to global warming. Reflec-tion on the mentioned classes of impacts shows that,in most cases, it is not the energy use by itself but theassociated material flows that give rise to the problem,causing the present energy system to be non-sustainable.
Avenues towards sustainability must thus aim at re-ducing the materials flows associated with humanenergy use. Acknowledging the social demand foruseful energy services, a first prerequisite is an in-crease in the efficiency of the processes by whichthese energy services are provided. When, in addition,efficient energy storage options are available, the pri-mary energy required for satisfying the demand can bedecreased. The use of renewable energies can reducethe flows of non-renewable energy carriers into thesystem. Development of clean technologies decreasesthe production of airborne pollutants and solid waste;advanced recovery schemes help to retrieve com-modities and minimize the amount of inert materials tobe deposited into the environment. Importantly, theseecological goals should be achieved in economicways, such that the social dimension - satisfying thenecessary demand for service - can be met.
The research program of the General Energy Depart-ment has been shaped by these considerations. At thebeginning of the year 2000, our activities have beengrouped accordingly into five laboratories, i.e.
• Energy and Material Cycles,
• Solar Technology,
• Combustion Research,
• Electrochemistry, and
• Atmospheric Chemistry.
In the following paragraphs, we shall briefly describethe mission of each laboratory within the frameworkoutlined above, and exemplify it by hints to some spe-cific highlights of the year 2000, to be described inmore detail below in this volume. We shall concludeby mentioning the work of the Energy Systems Analy-sis group, which aims at assessing the impacts oftechnological developments for the sustainability goal,keeping in mind the ecological, economic and social
dimensions of sustainability, on a global and on a re-gional / national scale.
Energy and Material Cycles
The reduction of material flows is at the center of thislaboratory's projects. The mentioned goal is ad-dressed by recovering both the energetic content andvaluable materials from waste streams, i.e. dry bio-mass waste on the one hand and municipal solidwaste on the other hand.
Focusing on available biomass resources such asforestry residues, scrap and waste wood, the gasifica-tion process yielding synthesis gas is a key step forenergetic use. In the reporting period, particular atten-tion has been paid to the generation of tars upon gasi-fication. Aged wood was found to produce significantlyless tars than fresh wood; this finding is favorable forthe energetic use of waste wood, e.g. from the demoli-tion of buildings. In contrast, tar production is in-creased if plastic residues are added to the biomassfeed.
For the use of the synthesis gas thus produced, sev-eral avenues are pursued depending on the size of theinstallation. Of particular interest to us is the REDOXprocess described below for the direct production ofclean hydrogen, which might serve as a transportationfuel to be used, e.g., in fuel cell cars.
The second focal area is the recovery of heavy metalsfrom the bottom ash and filter ash produced in munici-pal waste incinerators. Evaporation of the metals be-low the melting point of the solid appears to be a par-ticularly attractive option. A novel Condensation Inter-face has been developed which will be crucial for thein situ monitoring of these processes. With a view toimplementation, a process integrating the heavy metalrecovery within a waste incineration plant has beenpatented, together with partners, in 2000.
High Temperature Solar Chemistry
The concept of solar chemistry aims at addressing thefact that solar energy reaches the earth dilute,intermittently, and with large differences in spatialdistribution around the global. As a consequence, thepossibility to store solar energy is a key issue. Second,in view of the large share of liquid and gaseous fuelsin the energy system, the production of transportablechemical energy carriers from renewables is a highlevel goal. In solar chemistry processes, the incidentsolar energy is concentrated to drive endothermicchemical processes, with chemical fuels obtained asproducts.
In this framework, significant progress has beenachieved in 2000 within the SYNMET project. In thisprocess, zinc oxide is decomposed by concentrated

solar energy, and energy is stored in the form of me-tallic zinc. In a solar/fossil hybrid scheme, methane isadded in order to lower the required process tempera-tures. We have succeeded for the first time to operatethe process in a solar reactor using stoichiometricflows of the methane auxiliary gas, which is importantfor achieving a high solar share in the energy contentof the product.
The rational design of high temperature solar chemicalprocesses is supported by results of the physical sci-ences group. A Flash Assisted Multiwavelength Py-rometer developed at PSI is used for real timemonitoring of the temperature of the hot target(typically at 2000 K) that is irradiated by concentratedsunlight. Studies on the solar decomposition of mixedmetal oxides have been carried out at the solarfurnace using a quenching device named TREMPER.
An important milestone was reached in another, moreshort term oriented project in collaboration with indus-trial partners, in which solar energy is used to removeheavy metals from industrial wastes, such as electricarc furnace dust. Processing the material within PSI'ssolar furnace we have succeeded in reducing the zinccontent of the waste material to 2 %. An alloy of zincand lead is obtained for use as a secondary raw mate-rial, whereas the heavy metal content of the residue islow enough such that deposition in special repositoriesis no longer required.
Combustion Research
The projects of the Laboratory are embedded in acommon joint program in combustion research of PSIand ETH Zurich. Our activities contribute to the devel-opment of clean and efficient converters for fossil fu-els, with a focus on gas turbine combustion on the onehand and internal combustion engines on the otherhand.
Catalytic combustion has recently attracted increasedinterest as an option for further reducing the gas tur-bine NOX emissions. In the year 2000 we have signifi-cantly advanced our understanding of the process inwhich part of the fuel is combusted catalytically in ametal coated converter. The interaction between gasphase and heterogeneous chemical processes in thepresence of turbulent flow has been studied by nu-merical modeling. Laser spectroscopic techniqueswere used extensively to record the spatial profiles oftemperature, reactants, products and radical interme-diates, thereby validating and improving the simula-tions.
For internal combustion, Diesel engines are known toachieve considerably better efficiencies and hencelower CO2 emissions, as compared to gasoline en-gines. In addition to nitrogen oxides, paniculate emis-sions and the associated health effects are the majorfactor impeding widespread implementation of theDiesel technology in passenger vehicles. The genera-tion of soot is studied in our high-temperature highpressure combustion cell by laser spectroscopic tech-niques. We have found that oxygenated additives,such as dimethoxymethane, are capable of signifi-
cantly reducing primary particle formation. Fundamen-tal studies of the associated molecular reactions arecarried out to understand the mechanism of this de-sired effect. The capabilities within the department forstudying combustion generated soot range from mo-lecular beams through burner and spray test rigs tothe real engine exhaust.
A likely path of Diesel engine development will aim atincreasing the completeness of combustion includingthe carbon particles, with the simultaneous benefit ofhigh efficiency. This implies high combustion tempera-tures and, consequently, the necessity to reduce NOX
emissions by exhaust gas aftertreatment. In our de-velopment of lean DeNOx catalysts, we are imple-menting the novel concept of "fast selective catalyticreduction". In this report we show that the rate of NOX
removal is considerably faster if the molar ratio of NOand NO2 is adjusted to unity in an oxidation pre-catalyst. This system holds the potential of effectiveremoval of NOX from lean exhaust gases, even at thelow temperatures prevailing in passenger car exhaustgases under part load. This type of reaction proves inaddition to be relevant for soot oxidation on specificallydesigned catalytic surfaces. In this sense we are work-ing towards the realisation of the "New Zero EmissionTruck Engine" vision.
Electrochemistry
In view of the sustainability goal outlined at the onsetof this introduction, the program of the electrochemis-try laboratory deals with the aspects of energy storageon various time scales, and with fuel cells as highlyefficient, zero emission converters.
Numerous devices in everyday use, notably mobilephones and laptops, are in need of rechargeable elec-tric supplies featuring a high energy density. Lithiumion batteries represent the most frequently used solu-tion. In this highly competitive market segment, wehave recently succeeded in implementing the resultsof our research: PSI has contributed to the transfer ofa superior carbon material for the negative electrodeof the lithium ion battery to production by a Swisscompany. Advanced characterization methods avail-able at PSI, such as neutron radiography, have beenkey for this success.
Another important technology transfer was success-fully started in 2000 in the zinc/air rechargeable batteryproject. Due to improvements in the design of thereversible oxygen electrode, more than 300 charge/discharge cycles have been demonstrated. The tech-nology will now be developed into a commercial prod-uct by an industrial partner in collaboration with PSI.
The pace of fuel cell development for stationary, mo-bile, and portable applications has accelerated world-wide in 2000, with all major car manufacturers pursu-ing programs for the demonstration of fuel cell vehi-cles. The unresolved issue is the large cost decreaserequired before fuel cells will become competitive withinternal combustion engines. Increase in power den-sity, less use of expensive materials, and advances in

manufacturing technology are required. Contributingtowards these goals, we have demonstrated a 6.5 kWfuel cell stack using graphite bipolar plates, with speci-fications described in this report.
Analysis shows that fuel consumption of passengervehicles can be reduced by up to 40 % in city driving ifbraking energy can be recovered. The electric propul-sion used in fuel cell vehicles is predestined for theimplementation of regenerative braking. Due to thehigh specific power, supercapacitors are excellentlysuited to accommodate the entire kinetic energy of avehicle at the power level characteristic of a breakingevent, and to provide equivalent power during accel-erating, thereby supplementing the power from thefuel cell. The realization of a 2.5 V/800 F superca-pacitor based on electrodes developed at PSI is de-scribed.
Properties of surfaces and interfaces are crucial in allelectrochemical applications, as well as in energy re-lated catalysis. The spectroscopic characterization ofcatalysts and electrodes under working conditionsrepresents therefore a major analytical competence.Laser techniques are used not only for probing butalso for the modification of surfaces, as illustrated inthis report by the high resolution structuring of posi-tive/negative photoresists.
ATMOSPHERIC CHEMISTRY
The Laboratory of Atmospheric Chemistry was consti-tuted at the beginning of 2000, bringing together PSIcompetence in the characterization of gaseous andparticulate emissions and their transformations in theatmosphere. The aim of the laboratory is a compre-hensive, experiment and model based assessment ofenergy related pollutant emissions. This includes me-teorological transport processes and photochemicaltransformations (e.g. secondary aerosol formation andozone production) in the atmosphere and their impacton humans, climate, ecosystems, and material struc-tures.
A measuring van was equipped with a comprehensiveset of instruments for on-line recording of concentra-tions of gaseous pollutants and paniculate matter, andhas become operational in November 2000. This toolwill be used in future field and automobile chasingcampaigns, based on the experience of earlier meas-urements in the Po valley as well as in the Milan andMinneapolis metropolitan areas, which are presentedin this report.
In addition to the mentioned campaigns, the aerosolgroup records long-term changes of a variety of aero-
sol parameters at the high alpine research station onthe Jungfraujoch. These activities are embedded inthe Global Atmospheric Watch program of the WorldMeteorological Organization. An intensive measure-ment campaign was carried out in March 2000.Among the numerous findings, we mention the meas-urement of interstitial aerosols (i.e. particles not form-ing cloud droplets within a cloud), the fraction of whichchanges significantly during atmospheric transportover long distances, as a consequence of surfaceoxidation and other aging processes.
Isotope ratio mass spectrometry has been establishedas a powerful tool for assessing the impact of atmos-pheric pollutants on ecosystems. The acquisition of another mass spectrometer, designed for analyzing theisotopic ratio in very low trace gas concentrations,allows the tracking of air pollutants from their sourcesto the sinks (plants). We are reporting a study on theeffects of NO2 exposure on trees, where nitrogendioxide taken up through the leaves tends to increasethe water use efficiency of plant photosynthesis,whereas the opposite trend is observed when inor-ganic nitrogen fertilizers are delivered through the soil.
Energy Systems Analysis
The Energy Modeling group assesses the role of inno-vative technologies within the global energy system,focussing also on the economic frame and therebyproviding guidelines and boundary conditions for theresearch strategy of the department. Some represen-tative results from the China Energy Technology Pro-gram are reported below.
Global climate change is a topic of highest concern inthis context. Scenarios for the development of green-house gas emissions are analyzed, and the pathwaysand economic impacts of achieving the internationalKyoto targets as well as the binding Swiss CO2 reduc-tion goals are assessed.
The results clearly show the importance of interna-tional collaborations for achieving the emission targetsin the most cost effective way. In other studies, theimportance of technological learning has been ana-lyzed, with the result that renewable energies wouldattain significant market shares most rapidly if devel-opment efforts were shared among all nations con-cerned. Closing the circle to the sustainability targetmentioned at the beginning, the mission of the Gen-eral Energy research department may be seen as acontribution towards this global learning process of amore sustainable energy provision.

Energy and Materials Cycles

IMPROVEMENT OF THE HEAT TRANSFER IN CATALYTIC FIXED BED REACTORSBY MEANS OF STRUCTURED PACKINGS
T. Schildhauer, E. Newson, P. Binkert, F. v. Roth, P. Hottinger, T.B. Truong
A novel type of structured catalyst supports for heterogeneous catalysis in industrial tube-bundle reactorshas been developed. It shows a low pressure drop and an increased heat transfer through the reactor wall.This improves the performance of reactors used for strongly endo- or exothermic reactions by decreasingthe development of cold or hot spots and lowering the risk of thermal run-aways in the latter case. Theseimprovements have been shown in heat transfer experiments and validated in experiments under dehy-drogenation reaction condition combined with a reactor simulation.
1 INTRODUCTION
The typical reactor for heterogeneous catalysis in thechemical industry is still the fixed bed reactor, which isfilled with an irregular packing of catalyst in form ofspheres, rings or extrudates. Fixed bed reactors arecharacterized by relatively high pressure drops andcomplex material and heat transport processes be-tween the fluid stream, catalyst grain surfaces and thegrain pore structure. With strongly endo- or exother-mic reactions, heat transport through the reactor wallbecomes more important depending on both axial andradial heat transfer. Catalyst utilization can be ad-versely affected if "hot spots" (axial temperaturegreater than reactor wall temperature) or "cold spots"are formed.
From investigations to improve the heat transfer intube/shell heat exchangers [1], it is well-known thatstatic mixers can remarkably improve the radial heattransport in comparison to empty tubes. This led to thedevelopment of static mixers coated with catalyst,which improve the radial transport processes in thetube and intensify the heat and material transfer be-tween the fluid stream and the catalyst surface by theproduction of turbulence [2,3]. In comparison to con-ventional irregular packings, flatter radial concentra-tion and temperature profiles are achieved combinedwith a clearly smaller pressure drop. The commercialcatalyst supports of this type developed at presenthowever do not show a significantly increased heattransfer between the fluid stream and the reactor wall[3]. Therefore structured packings were developed inthis work, which show an improved heat transfer be-havior and enable a significant process intensification.
2 EXPERIMENTAL
Different types of catalyst supports (alumina spheres,diameter 1.5-2 mm, commercial structured packings,improved packings) were fitted into an electricallyheated reactor tube (inner diameter 19 mm, length500 mm) with a sand packing at the in- and outlet ofthe reactor. At a wall temperature of 120°C air flows of5- 100NI/min were fed representing mass flows inindustrial scales (Particle Reynolds Numbers 10 - 50).The stationary axial temperature profiles of the fixedbed were measured with a movable thermocouple.The pressure drop was measured.
Based on the axial temperature profiles, the globalheat transfer coefficients could be calculated. This
allowed derivation of the heat transfer coefficient atthe inner wall of the reactor tube which is responsiblefor the main differences in the heat transfer behaviourof the diverse catalyst supports.
3 RESULTS
As seen in Figure 1, the commercial packing shows aslightly better heat transfer behavior than the aluminaspheres. The heat transfer coefficient of the optimizedpacking exceeds, depending on the mass flow, that ofthe spheres by 30 - 50% and that of the commercialpacking by 25 - 30% .
1000
Oimproved packing
commercial packing
alumina spheres
10specific mass flow G [kg/m s]
Fig. 1: Heat transfer coefficients of catalyst supportsat the inner side of the reactor wall depending on themass flow.
Taking into account the known fluid properties (Prandtlnumber Pr) and the proportionality between a and theNusselt number (Nu), as between the specific massflow G and the Reynolds number (Re), it is possible toestablish the following analogies which permit to cal-culate the heat transfer coefficients a for the differentcatalyst supports over a wide mass-flow/temperature/fluid-properties range:
Nu = 0.223 Repa 6 1 0 9Pra 3 3 3
Nu = 0.339- Repa5523- Pr0333
Nu = 0.480 Repa 5 3 3 4Pra 3 3 3
In Figure 2 the specific pressure drops are shownwhich are similar for both types of packings but re-markably lower than that of the alumina spheres.
alumina spheres:commercial packing:improved packing:

E 200Q.
2
£ 1003COCOCD
oCDQ_CO
« alumina spheres
Hcommercial packing
O improved packing
1 3 5 7specific mass flow [kg/m2s]
Fig. 2: Specific pressure drops of catalyst supportsdepending on the mass flow.
4 VALIDATION UNDER CHEMICAL REACTION
To validate the heat transfer correlations shown inFigure 1 under reaction conditions, the improvedstructured packings and the commercial packingswere tested coated with a dehydrogenation catalystusual in the industry (Pt/AI2O3, thickness approx.100 (im). The strongly endothermic, equilibrium limiteddehydrogenation of methylcyclohexane (MCH) to tolu-ene (C7H14 <=> C7H8 + 3 H2; AHR
298K = 205 kJ/mol) wasused as the test reaction.
For these experiments the above mentioned reactortube was used. At different temperatures (400°C,425°C, 450°C), but constant pressure (7.1 barabs.) andMCH-feed of about 2 l/h, conversions of 15% -29% forthe commercial packing and 20% - 32% for the opti-mized packing were measureded. The "cold-spot"temperatures were shifting over time due to catalystdeactivation, but they were always similar for bothpackings.
The results of these experiments were compared withappropriate results for conventional fixed beds(Pt/AI2O3-spheres, d = 1.5 - 2 mm) and used in a re-actor simulation. The kinetics of the different catalyti-cally coated structures were determined independentlyin microreactors. Due to a lack of fit appearing in theevaluation of the isothermal kinetic measurements, itbecame necessary to determine the equilibrium con-stant (Keq) for the MCH to toluene reaction in an auxil-iary experimental program. The value found thereby[4] is Keq] 650K = 3.60 • 109 kPa3 compared to the lit-erature value [5] of Keq,65oK= 4.61 • 109 kPa3.
Comm. Packing
Improved packing
Pt/AI2C>3-spheres
Preexp. Factork3oo°c [mol/s g
kPa]
0.914- 106
1.37- 106
3.10- 107
Activation energyEA [kJ/mol]
149.3
149.3
215.1
Table 1: Kinetic parameters for both catalyticallycoated packings and commercial catalyst (Pt/Al2O3).
With this new Keq, the kinetics of both the catalyticallycoated packings and the commercial catalyst
(Pt/AI2O3-spheres, d = 1.5-2 mm) were determined(Table 1), using a first-order model. These kineticsand the heat transfer correlations shown in Figure 1were introduced into a pseudohomogeneous first or-der model, which included limitations by film diffusion.As an example of a comparison between experimentand simulation (Figure 3), the axial temperature profilein an improved packing is shown for a wall tempera-ture of 400°C. The simulated temperature profile iscomparable to the measured profile, if the simulatedconversion is the same as in the experiment (26%).
O 420£- 400§ 380« 360g. 340E 320~ 300
A.+ experiment
simulation
11 111 11 |-|J I l-m=H I'M
0 0.05 0.1 0.15 0.2 0.25 0.3 0.35length of reactor [m]
Fig. 3: Measured and simulated axial temperatureprofile (improved packing, wall temperature 400°C,conversion 26%).
5 CONCLUSION
A novel type of structured catalyst support was devel-oped showing increased heat transfer (30 - 50%) anddecreased pressure drop (V5) compared to conven-tional alumina spherical supports. Under reaction con-ditions for dehydrogenation, simulation of temperatureand concentration profiles was in good agreement withmeasurements.
6 ACKNOWLEDGEMENTS
Financial support by the Swiss Federal Office for En-ergy (BfE) is gratefully acknowledged. UOP Ltd. (UK)supplied commercial catalysts under a confidentialityagreement.
7 REFERENCES
[1] H. Kalbitz, Wirkung statischer Mischer auf dieStromung, den Warmed bergang und den Druck-verlust in Rohrbundelwarmeaustauschern, Dis-sertation TU Braunschweig (1990).
[2] A. Cybulski, J. A. Moulijn (Hrsg.): StructuredCatalysts and Reactors ,New York (1998).
[3] G. Eigenberger, V. Kottke, T. Daszkowski, G.Gaiser, H. Kern: RegeimaBige Katalysatorform-trager fur technische Synthesen, Fortschrittsbe-richt des VDI, Reihe 15, Nr. 112, Dusseldorf(1993).
[4] T. Schildhauer, E. Newson, St. Muller, acceptedfor publication, J. Catal.
[5] Akyurtlu, J., Stewart, W., J. Catal. 51,101 (1978).

8
KINETICS AND SYSTEMS ANALYSIS FOR PRODUCING HYDROGEN FROMMETHANOL AND HYDROCARBONS
K. Geissler, E. Newson, F. Vogel, T.B. Truong, P. Hottinger
Fuel cell powered electric cars using on-board methanol or hydrocarbon reforming to produce a hydrogen-rich gas represent a low-emissions alternative to gasoline internal combustion engines (ICE) with well-to-wheel efficiencies of 17%. For the overall methanol process, a simplified model of the reaction networkconsisting of the total oxidation of methanol, the reverse water-gas shift reaction, and the steam-reformingof methanol is proposed. Individual kinetic measurements for the latter two reactions on a commercialCuO/ZnO/AI2O3 catalyst are presented. Partial oxidation (POX) of hydrocarbons (isooctane) has shown thatnoble metal catalysts can provide power densities of 33 kWth per litre reactor at 475 °C compared to54 kWth per litre reactor with methanol at 250 °C.
1 INTRODUCTION
Hydrogen produced from renewable sources is aclean and carbon-free energy vector which can beconverted to electrical energy either by conventionalcombustion engines or by fuel cells, the latter not be-ing limited in theoretical efficiency by the maximumCarnot efficiency. However, up to now, none of thephysical or chemical storage options being consideredas technically feasible, has turned out to be themethod of choice [1]. Among the liquid carriers underdiscussion, methanol offers a high energy density, thepossibility of using a petrol-like infrastructure for dis-tribution and, unlike hydrocarbons, can be producedfrom renewable sources.
Autothermal reforming of methanol (1) or iso-ocatane(2) has a net reaction enthalpy change of zero.
Methanol LHV
4 CH3OH + 3 H2O + 1/2 O 2 -> 4 CO2 H2 (1)
(2)
A reactor for this process does not require externalheating once having reached reaction temperature. Tofacilitate reactor design it is highly desirable to developa complete kinetic model for the process.
2 SYSTEM ANALYSIS
Current gasoline internal combustion engine (ICE)technology reaches a full fuel cycle ("well-to-wheel")efficiency of about 17-18% [2]. This figure can bedecomposed into an overall vehicle ("tank-to-wheel")efficiency of 19-20% and a fuel efficiency ("well-to-tank") of 90 %. Fuel efficiencies for methanol produc-tion from natural gas are in the range of 67-71 %. Theoverall vehicle efficiency for a methanol powered carmust therefore reach at least 25-27 % in order toequal the efficiency of the full gasoline ICE cycle.Steady-state system analyses including an autother-mal methanol reformer linked to a PEM fuel cellyielded overall vehicle efficiencies of 27-30 % (Fig-ure 1). Hohlein [2] investigated other options for on-board methanol reforming and obtained overall vehicleefficiencies in the range of 25-34 %.
100%
ATR Reformer 97%
97%I CO cleanup | 99%
96% I| Anode | 83%
80%
Fuel Cell 5 1 %
41%
Parasitic Power 8 1 %
33%El. Motor
30% ^
90%
Wheels
Fig.1: Calculated steady-state "tank-to-wheel" effi-ciency for autothermal re-forming of methanol andsubsequent gas cleanup bypreferential oxidation of CO,followed by a PEM-fuel cell(assuming 83 % hydrogenutilisation at the anode and51 % electrochemical effi-ciency) and electric motor.The values on the left repre-sent the cumulative effi-ciency while the ones on theright represent the efficien-cies of the individual sub-processes.
3 EXPERIMENTAL PART
Microreactor experiments were carried out using anelectrically heated tubular reactor (silica coatedstainless steel, inside diameter 4 mm), equipped withan inner tube (diameter 1.5 mm) containing a move-able thermocouple. A commercial CuO/ZnO/AI2O3
catalyst with particle diameter of 250...500 micronswas placed in the 65 mm isothermal zone. All gasflows were controlled by electronic mass-flow control-lers, liquids were dosed by a pump. Product gasanalysis was carried out using a gas chromatographequipped with both, a thermal conductivity detectorconnected to a two-column switching system (HP PlotQ and HP Plot 5 A), and a flame ionisation detectorconnected to an Alltech AT 5 column.
4 RESULTS
From the species present in either the feed or theproduct gas, a strongly crosslinked system of at least7 components and 8 reactions can be formulated(Figure 2). To simplify the reaction network, the com-bination of total oxidation and steam-reforming (SR) isan appropriate model for the autothermal reforming of

methanol. Adding the reverse water-gas shift (RWGS)reaction allows the carbon monoxide formation to bemodelled.
C02 + 2H20 -
C02 + 2H2 "
H2+V2(
CH3OH
0.5 O>(7)
CO + 2H2
(10)CO2 + H2<^ CO + H2O
Oz^HzO CO+V2C
CO2 + 3H2
DME+H2O
h^CO2
Fig. 2: Reaction network of methanol autothermalreforming on copper-containing catalysts.
Kinetic measurements of methanol steam reformingand the reverse water-gas shift reaction have beenperformed separately in the microreactor system. Forevaluation of the data obtained for both reactions, thesoftware package SIMUSOLV, assuming a one-dimensional, isothermal, plug-flow model was used.Possible equilibrium limitation was included by intro-ducing temperature-dependent equilibrium terms, e.g.
(3)CO2 P H 2
where K is the equilibrium constant of the reaction.Methanol-steam reforming was found to be 0.4th orderin methanol (4), the reverse water-gas shift was as-sumed to be first order in CO2 as described in [3]. Dueto the low pressure the number of free sites was con-sidered to be a constant (5).
r S B =1 .52 -10 - 5 e f l m o l U ™ f'eg
mol
rRWGS = 4 . 3 8 - 1 0 "513K, f
HCO2 'eq
' s g kPa04
mol
s g kPa
(4)
(5)
The kinetics of the total oxidation of methanol in thepresence of water is more difficult to evaluate due tonon-isothermality at elevated temperatures.
In contrast to methanol reforming catalysts based oncopper, hydrocarbon reforming requires noble metalcatalysts for typical operating temperatures between400-550 °C. The noble metal catalysts proved lesssusceptible to deactivation in 200-300 hour tests. Us-ing isooctane as the hydrocarbon feed for autothermalreforming as in equation (2), results for commercialand proprietary catalysts are shown in Table 1. Thehydrogen production rate or STY with the proprietarycatalyst is 10730 litres per hour and litre reactor
volume compared to 6720 for a less selective com-mercial noble metal catalyst. Thermal power densitiesare 33 kW per litre reactor volume for the PSI catalystcompared to 45 kW per litre for the methanol feed.Catalyst screening is continuing with hydrocarbonsincluding refinery streams.
Com. Cat. PSI-Cat. Com. Cat.(HC)1 (HC)2 (MeOH)3
Conversion (%)
H2-yield (%)
Selectivity (%)
STY (I H2/h/lrv)
LHV efficiency (%)
hot-spot (K)
88
34
39
6720
18.8
81
82
53
64
10730
30
77
85
85
100
14660
69.6
15
Table 1: Results of hydrocarbon (HC) and methanol(MeOH) catalyst testing, catalyst mass 0.1 g, dilutioncatalyst/quartz sand=1/50, p=5 bar, 1T=450 °C, 2T=475 °C, 3T = 250°C, WHSV = 8h"1; STY: Space-Time-Yield (litre hydrogen / hour / litre reactor volume);LHV efficiency = LHV (H2 out) / LHV (fuel in).
5 CONCLUSION AND FUTURE WORK
It has been shown that the autothermal reformingprocess of methanol and hydrocarbons is a promisingoption for hydrogen production. If used for non-sta-tionary PEM fuel cell-based propulsion, the methanolsystem can at least compete with the 17% full fuelcycle efficiency of current state-of-the-art internalcombustion engines. Modelling of the reactor systemfor temperature and concentration profiles under non-isothermal conditions is continuing in future work.
6 ACKNOWLEDGEMENTS
The authors thank Johnson-Matthey pic. (UK) andSiidchemie AG (D) for the supply of catalyst samplesunder non-analysis agreements.
7 REFERENCES
[1] G. Berry, S. Aceves, Onboard storage alterna-tives for hydrogen vehicles, Energy and Fuels 12,49-55(1998).
[2] B. Hohlein, Minutes of the 2nd IEA Advanced FuelCell Workshop on "Fuel Processing for Modular(< 100 kW) Fuel Cell Power Packages", Septem-ber 29 - October 1 ,Wislikofen,Switzerland (1997).
[3] K. Vanden Bussche, G. Froment, A Steady-StateKinetic Model for Methanol Synthesis and theWater Gas Shift Reaction on a CommercialCu/ZnO/AI2O3 Catalyst, Journal of Catalysis 161,1-10(1996).

10
INVESTIGATING THE EVAPORATION OF HEAVY METALS FROM FLY ASH BYTHERMO-DESORPTION SPECTROMETRY
H. Lutz, Ch. Ludwig, R. Struis, S. Stucki
Our research is devoted to better understanding the evaporation process of the heavy metals cadmium,copper, lead, and zinc from toxic filter ash of municipal solid waste incinerators. This knowledge is used foroptimising the heavy metal removal from the ash by a thermal process - the final goal being the detoxifica-tion of the ash. The evaporation rates obtained from the thermo-desorption spectra (TDS) gave valuableinsight into the chemical reaction mechanisms. Especially interesting from a point of view of heavy metalremoval by evaporation is the role of chlorides like sodium chloride (NaCI). They reacted with non-volatileheavy metal species (like oxides) to form volatile heavy metal chlorides.
1 INTRODUCTION
We observe the evaporation of metals from filter ashon-line. Our goal is to understand the chemical proc-esses during the treatment of the ash and to improvethe heavy metal removal efficiency. In order to monitorthe heavy metals evaporating due to our thermaltreatment process of the ash, we have to employ aspecific tool for heating the ash and analysing theevaporating heavy metals. This tool consists of threeparts: A quartz tube heated by a furnace, a detector(an Inductively Coupled Plasma Spectrometer) andour connecting condensation interface. The interfaceis the crucial part for transferring the metals. Ludwigpublished earlier a detailed description [1, 2].
2 EXPERIMENTAL
Experiments were carried out with the standard ashBCR176, which had been certified by the CommunityBureau of Reference of the European Community.The ash was used as received (particle 0 <40 (im).
The thermo-desorption spectra (TDS) are generatedby heating the filter ash in a tubular furnace from 450to 950 °C at a constant heating rate of 3.3 °C/min. Theamount of evaporating metals is detected in 2-minuteintervals for every element by an Inductively CoupledPlasma (ICP) Spectrometer. Plotting the every metal'smeasured relative evaporation rate against tempera-ture results in the TDS graphs shown in both versionsof Figure 1.
3 THERMO DESORPTION SPECTRA (TDS)
The peak pattern of a TDS can be rather complex. Ingeneral, every peak represents one kind of speciesthat might have left the ash directly (e.g. Zn°T, ZnCI2T)or stem from a reaction, which transforms a non-volatile precursor into a volatile species (e.g. ZnOSO|id +2 HCI <=> ZnCI2t + H2O).
TDS can provide information about the amounts ofevery metal vaporizing, the reaction kinetics, the typeof chemical species, and about chemical reactions inthe sample. Here we focus on the latter two, speciesand possible chemical reactions.
1.5 -
1.2 -
0.9 -
0.6 -
— ^ N a
—•—Pb
2co2 0.3 -oQ.(0& °-° —
400
4fM-600 800 1000
1 0 -r
0.1 -
S.0.01CD
UJ
0.001 -
0.0001400 600 800
Temperature [°C]
1000
Fig. 1: Thermo-desorption spectra for filter ashBCR176; the same experiment is shown with a lineary-axis above and a logarithmic y-axis below (umol =(imol).
4 RESULTS AND DISCUSSION
Figure 1 shows an identical TDS of BCR176 for Na,Zn, Pb, and Cu - on a linear and a logarithmic scale,respectively.

11
In Figure 1, top, the Na-peak is by far the most domi-nant. Only about a tenth of the evaporation rate of Nais reached by Zn, but in three peaks at 650 °C, 800 °C(like Na) and beyond 900 °C. In comparison, theevaporation rate of Pb and Cu is negligible on thatgraph.
Figure 1, bottom, uses a logarithmic scale for a betterpeak comparison, since the evaporation rates are sovastly different. Here the following observations can bemade:The evaporation of Na shows a peak, which coincidesnicely with peaks of Zn and Cu and exceeds them byabout 1 and 2 orders of magnitude, respectively. Namost presumably evaporates as sodium chloride,NaCI, which is originally present in filter ash (Pluss[3]). Cl evaporates in exactly the same temperaturerange as Na. (Data for Cl not shown here.)The first peak of Zn almost parallels the one of Cu, thesecond those of Na and Cu. The incline to the thirdZn-peak (second half not visible) parallels the last Pb-peak.Neither of the other two Pb-peaks precisely follows theothers.Cu reveals an almost perfect match with Na and Zn.
In the following we propose a chemical hypothesis toexplain the parallelism of some of the peaks:We know that chlorine species play a major role in theevaporation mechanisms (Jakob [4], Wochele [5]).The reason is that metal chlorides tend to have lowerboiling points than the respective pure metals or metaloxides (e.g. ZnCI2 732 °C, Zn° 907 °C, ZnO>1500 °C). So, transforming a pure metal or metaloxide into its chloride induces the evaporation of themetal at a lower temperature. This has the advantagesof minimizing corrosion of materials in industrial plantsand helps to prevent sticking of the ashes, which re-strains the metal removal efficiency.Chlorides present in the ash promote heavy metalevaporation. Upon evaporation, major chloride species(see the upper curves; especially Na, but also Zn)transfer their Cl to oxidic minority species (see thelower curves, Zn and Cu, maybe Pb). This is illustratedby the following equation and Figure 2:
Me(1)-Chloride + Me(2)-0xide
Me(1)-0xide + Me(2)-Chloride
Newly formed oxides (like Na2O) may bind to the ma-trix, thus facilitating the above reaction to the right.
Above hypothesis does not satisfactorily explain thePb-behavior. Here, further studies need to be done.
For Zn and Cu, simplified species calculations basedon pure substances in a thermodynamic model sub-stantiate the above hypothesis.
5 CONCLUSION
Our work enables us to determine why chlorine is soimportant in aiding the heavy metal evaporation fromfilter ash.
Fig. 2: Hypotheses on the chlorine and oxygen trans-fer between the species evaporating according to Fig-ure 1.
6 ACKNOWLEDGEMENT
We express our thanks to A. Schuler for experimentalassistance, and to A. Wokaun and J. Wochele, as wellas A. Jakob and R. Moergeli (both CT Environment,Switzerland) for fruitful discussions. This work is sup-ported by the Swiss National Science Foundationgrant number 5001-058295.
[1]
REFERENCES
Chr. Ludwig, A.J. Schuler, J. Wochele, S. Stucki,Measuring the evaporation kinetics of heavy met-als: a new method, Recovery, Recycling, Re-integration, 4land (1999).
world congress, Geneva, Switzer-
[2] Chr. Ludwig, A.J. Schuler, J. Wochele, S. Stucki,Measuring heavy metals by quantitative thermalvaporisation, J. Water Sci. Technol., 42,7-8, 209-216(2000).
[3] A. Pluss, Charakterisierung von Rauchgasreini-gungsruckstanden aus Mullverbrennungsanlagenund deren Immobilisierung mit Tonmineralen,Veroffentlichungen des Institutes fur Geotechnikder ETH Zurich, Band 205, vdf Verlag, Zurich,Switzerland (1993).
[4] A. Jakob, S. Stucki, R.P.W.J. Struis, Completeheavy metal removal from fly ash by heat treat-ment: Influence of chlorides on evaporation rates,Environ. Sci. Technol, 30, 3275-3283 (1996).
[5] J. Wochele, Chr. Ludwig, S. Stucki, P. Auer, A.J.Schuler, Abfall- und Ruckstandsbehandlung:Grundlagen zur thermischen Schwermetall-separation, from Forschung fur eine nachhaltigeAbfallwirtschaft, Schwerpunktprogramm Umwelt,Paul Scherrer Institut (1999).

12
OPTIMISATION OF THE BATTERY PYROLYSIS IN A THERMAL BATTERYRECYCLING PROCESS
J. Wochele, Ch. Ludwig, A.J. Schuler, A. Krebs (BATREC AG)
Scrap batteries consist of about 60% of metals. Some of them are valuable raw materials (Fe, Mn, Cu, Zn,Ni) and, moreover, they can be very toxic (Hg). Therefore, BATREC AG in Wimmis (CH) recycle thesematerials from spent batteries in a thermal process. Alkali salts originating from the electrolytes of the bat-teries represent a stress on the facilities and can influence the quality of the recycled goods. In this col-laboration with BATREC AG the goal is to improve the separation of the alkali salts in the pyroiysis proc-ess. We investigate the process by means of thermodynamic calculations and laboratory experiments,using our on-line measuring instrument for studying the simultaneous evaporation of various elements.
1 INTRODUCTION
BATREC AG in Wimmis (Switzerland) recycles fromeach ton of scrap batteries (coal-zinc- and alkaline-Mn-batteries) about 590 kg metals. Contaminants,such as organics, salts, and oxides, can substantiallyinfluence the quality of produced secondary raw mate-rials. The efficiency of the process and the quality ofthe products could be improved, if the salts from theelectrolyte of the batteries could be eliminated. Salts infurnaces shorten the lifetime of the fire-resistant bricklining and form depositions on walls and tubes.
We use thermodynamic calculations and evaporationexperiments with single batteries to investigate theprocess and to look for means to evaporate and re-move selectively potassium alkali chlorides during thepyroiysis.
2 THE BATREC PROCESSSince 1992 BATREC has used a three step processfor thermally recovering the metals from scrap batter-ies (Figure 1). In stage 1 the batteries are pyrolysed at350-750°C. Water and mercury is volatilised togetherwith organic substances originating from paper, card-board and plastics. These gases are transported tothe wet-chemical gas cleaning system (stage 3).
raw gas c l e a n 8 a ^
batteries w
p ypro
tpyrolyses
1
olysis 1 A C Qduct f | *
ludg
e
»as
melting furnace
2
metals w
Igas and watercleaning system
3
_lclean
' merci
w
water
try
Fig. 1: Thermal treatment of spent primary batteries.
In stage 2 the metallic compounds are reduced in ainduction furnace at 1500°C. The metals obtainedfrom the process can be recycled by the steel andmetallurgical industry.
Mercury is condensed and treated together with thesludge - containing up to 40% mercury - from the gascleaning system. The mercury is cleaned by distillationof the separated solid phase. The distillation residuesgo back to the pyroiysis furnace. The separated wateris purified from heavy metals, cyanides and fluoridesand discharged to the public sewage treatment plant.
Our interest focuses on the pyroiysis stage. The taskof this stage is to convert the carbon to volatile organicmatter, to separate the volatile substances (carbon,water, salts, mercury) from non-volatile (metals, ash)in order to concentrate and diminish the mass sent tothe high temperature melting furnace for the reductionof the metals in stage 2.
3 THERMODYNAMIC CONSIDERATIONS
Thermodynamic equilibrium calculations (TEC) mini-mising the Gibb's free energy allow to predict the sta-ble species of a system at given conditions (tempera-ture, pressure, concentrations). Such calculations do,by definition, not take kinetic effects into account.Nevertheless, sometimes a reasonable match withexperiments can be found even in a such complexand heterogeneous multi-component system as bat-tery pyroiysis. Our "black box" model considers thepyroiysis process (stage 1) as a one zone well mixedreactor.
In Figure 2 the result of such a calculation is shown forpotassium (K) considering a typical (standard) batterypyroiysis process. In the temperature range between350-750 °C applied in the battery pyroiysis process,volatile K compounds do not appear (are not stable).Sensitivity analyses by varying the input data clearlyshowed that the system is very robust to input varia-tions in a wide range. Even if we assume all the plas-tics (cover, box) in the batteries as PE (polyethylen) oras PVC (polyvinylchloride) or if we investigate only

13
300mol250
200
150
100
50
^ K C ,
y ~"
0 200
TEC, lambda = 0.8
400
KY
— - ^
fir)0 8(
\
\
)0
1
f1yA
<CI(g)
1000 1200 1400
Temperature
c
Fig. 2: Stable potassium species in battery pyroiysis(k = 0.8). (g) = gaseous species.
charcoal-zinc- or only alkaline-Mn-batteries, the ther-modynamic picture remains the same.
4 EVAPORATION EXPERIMENTS
Our thermo-analysis system with on-line measurementcapabilities (CI-ICP Spectrometer, Condensation In-teterface Inductively Coupled Plasma) [1] is an ana-lytical tool that was developed for investigating theevaporation of metals in heterogeneous, complexmulti-component systems [2] like e.g. filter ash or pri-mary batteries.
Mignon type alkaline batteries were cut open for thepyroiysis in a tube furnace which was connected to theCI-ICP equipment for the on-line monitoring of theevaporating elements (Figure 3).
Fig. 3: Alkaline battery before the thermo-analysisand the remaining ash after the pyroiysis.
In the thermogram (Figure 4) the applied temperatureand the measured evaporation of K and C are drawnas a function of time. The volatilisation rates of carbon(C) were much higher than those of K.
temperature " " 9 0 0
800
1000
100 200time [min]
300 400
Fig. 4: Thermogram obtained by CI-ICP Spectro-metry during battery pyroiysis from 100°C to 950°C.
Gasification (C-line) starts at about 250°C with a firstpeak at 400 °C. K evaporates only at 740°C, which isin good agreement with the thermodynamic calcula-tions.
5 CONCLUSION
The information from the laboratory experiment andthe thermodynamic calculations are in good agree-ment. Both, model and experiment, show no relevantvolatilisation for K below 700 °C, the pyroiysis tem-perature. This is also observed in the real process.From the calculation we conclude that in the experi-ment K is volatilized as KCI.
Further investigations considering modified pyroiysisconditions to selectively evaporate potassium andtherefore the salts, are in progress.
6 ACKNOWLEDGEMENT
The financial support by the Commission of Technol-ogy and Innovation (Project 4805.2 KTS) is gratefullyacknowledged.
7 REFERENCES
[1] Chr. Ludwig, A.J. Schuler, J. Wochele, S. Stucki,Measuring the Evaporation Kinetics of HeavyMetals: A New Method, Recovery, Recycling, Re-integration, R'99 4th World Congress, February 2-5, A. Barrage, X. Edelmann (eds.), II, (1999).
[2] Chr. Ludwig, A.J. Schuler, J. Wochele, S. Stucki,Measuring Heavy Metals by Quantitative ThermalVaporisation, Journal of Water Science andTechnology 42: 209-216 (2000).

PECKTECH.
14
BETTER QUALITY OF MSW INCINERATOR RESIDUES AT LOWERCOST
S. Biollaz, S. Stucki, R. Bunge (Eberhard Recycling AG), M. Schaub (CT Umwelttechnik AG),H. Kunstler (Kupat AG)
A new technology concept for the incineration of municipal solid waste (MSW) has been developed withina joint venture of PS I with three companies active in the field of waste treatment (Eberhard Recycling AG,CT Umwelttechnik AG, Kupat AG). The resulting PECHfech MSW incineration technology consists of a skil-ful combination of thermal and mechanical separation techniques. Lower operation cost for the wastetreatment are reached as the costs for the deposition of residues are significantly reduced while the in-vestment and operating costs are comparable to conventional MSW incinerators.
1 INTRODUCTION
For the incineration of municipal solid wastes (MSW),grate systems have been the technical standard formany decades. In order to minimise their environ-mental impact, considerable effort has been dedicatedto the purification of the flue gases and the post-treatment of the residues. Today, grate incineratorswith state-of-the-art pollution control equipment com-ply with the emission limits for air and water.
The goal of waste management in Switzerland is toproduce either disposable residues or reusable prod-ucts. With state-of-the-art MSW incineration technol-ogy the heavy metal concentrations in residues areabove the regulated threshold values for landfill ofinert material, or for use as secondary materials incements.
Numerous efforts have been dedicated towards thedevelopment of alternative incineration technologiesfor MSW, mostly with the objective of producing betterresidues for further utilisation. These efforts have at-tempted to improve the residue quality by pure py-rometallurgical technologies. Despite substantial in-vestment into such innovative technologies, so farnone of these processes has been proven successfulin the market. They are either technically or economi-cally non-viable.
Given the sources, speciations and physico-chemicalproperties of the heavy metals, a skilful combination ofthermal and mechanical separation techniques is nec-essary to achieve the required high degrees of separa-tion. Metallic materials are preferably separated me-chanically, heavy metal compounds by a thermalprocess.
2 THE PECK TECHNOLOGY
In contrast to the "big-leap" approaches mentionedabove we have developed the PECKtech process whichemploys a combination of various industrially provensub-processes (see Figure 1 and 2). While thePECKech process basically utilises standard incinera-tion hardware, the innovation lies in a clever mode ofoperation, thereby minimising the risk of hardwarerelated problems. The products from the PECKtech
process conform to highest standards while the tech-nology is simple and robust.
Sewage Sludge
MSW
Fig. 1: Block diagram: PECKtech process.
• Thermal treatment
The PECKtech process is based on a modified grateincinerator which is combined with a rotary kiln. Withinthe grate furnace, MSW is gasified and volatile heavymetals (Zn, Pb, Cd) are evaporated to a high degree.In the rotary kiln the combustible gas and the remain-ing char are burned. By adjusting the excess air in thekiln the gas temperatures up to 1400°C can bereached. With this heat the minerals are melted or atleast sintered and copper is smouldering without form-ing alloys with iron. Leaving the kiln, the bottom ash isquenched in water to yield an amorphous material.
• Fly ash treatmentThe fly ash, rich in heavy metals, is chemically treatedto extract the volatile heavy metals (Zn, Pb, Cd). Theremaining hydroxide sludge has comparable zinc andlead concentration as EAF dust (electric arc furnace)and is therefore accepted from the metal refining in-dustry. On the other hand the depleted fly ash is recy-cled to the incineration process, i.e. rotary kiln.
• Bottom ash treatmentThe bottom ash is a glassy product with puzzolanicproperties. This product is crushed and the non-volatile metals such as copper and iron are separatedby well established mechanical processes. Dependenton the intended separation efficiency the mechanicalseparation can be a dry or a wet process.

15
Fig. 2: Thermo-mechanical treatment of MSW with three key sub processes which are different form conventionalMSW incinerator: thermal treatment, fly ash and bottom ash treatment.
As a result of these separation operations, the mineralresidue from the PECKtech process can be used as abuilding material and the metal concentrates can berecycled to the metal refining industry.
3 COST ESTIMATION
A comparative case study for an incinerator plant witha capacity of 225'000 t/a was carried out. The as-sumptions are: MSW with a lower heating value of 12MJ/kg is processed observing existing flue gas emis-sion standards (i.e. NOX levels below 80 mg/m3
n) Theconventional incinerator system consists of 2 lines witha capacity of 16 t/h each. The PECKtech incineratorsystem consists of 4 lines with 8 t/h each. For the con-ventional MSW incinerator the bottom ash and fly ashproduced is landfilled. For the PECKtech MSW incinera-tor no fly ash is produced and therefore has not to belandfilled. The glassy bottom ash is used as zero costmaterial and only transportation cost are taken intoaccount.
In Figure 3 treatment cost are shown for a conven-tional MSW incinerator and compared with the cost forthe PECKtech incinerator. The costs are split into capi-tal costs, operating costs, costs for staff, maintnance/Insurance, and disposal. In both cases the capitalcosts make half of the treatment costs. Except for thesaved costs for disposal, all cost for the PECKtech
process are comparable to conventional technologydue to the basic similarities (flue gas treatment, steamturbine, size of the building, etc.). Overall, by using the
PECK7%.
100
•tech technology the total costs can be reduced by
• Cost for Staff
n Maintenance/Ins, etc.
^ D isposal C ost
• Operating Cost
m Capital Cost
Fig. 3: Comparison of normalised costs per ton ofMSW processed, for PECKtech process and standardgrate incinerator technology.
This cost reduction immediately leads to reduced gatefees for the MSW, as the energy recuperation in thePECKtech process is comparable to an advanced grateincinerator system, i.e. revenues from energy sales(electricity and heat) are the same. In the case studycalculation presented here the disposal fee can bereduced by 8%.
4 CONCLUSION
The advantages of PECKtechare:
No hazardous residues to be landfilled (closedmaterial cycles)Industrially proven hardware and sub systemsLower treatment and disposal costs than with con-ventional MSW incinerators.

16
THE INFLUENCE OF PLASTIC MATERIALS ON THE FORMATION OF TARS IN THEGASIFICATION OF URBAN WASTE WOOD
L.C. de Sousa, T. Marti, S. Stucki
Gasification experiments were performed using urban waste wood (Altholz) with additions of polymerstypical for separately collected waste plastics. The resulting tar product distributions are discussed in thispaper. The amount of tars is shown to be a function of operation parameters of the gasifier as well as thefuel. Plastics admixture yields higher concentrations of aromatic tar compounds in the gases, even if theplastic used is not aromatic in its structure. Such mixtures can be gasified for the production of synthesisgas, but clearly a larger effort will be required in cleaning the gases.
1 INTRODUCTION
In the economics of biomass transformation proc-esses the cost of the feedstocks is generally a limitingfactor. Waste derived fuels are an attractive optionbecause of their low or even negative cost. Wasteplastics from well defined sources are an economicallyinteresting feedstock to be co-processed with biomassfor the production of synthesis gas in a fluidized-bedgasification plant [1]. The effects of plastics additionsto wood on the overall gasification process is yetpoorly understood. The present study investigates theinfluence of Polyethylene (PE) and Polystyrene (PS)additions of up to 20% by weight on the product spec-trum of urban waste wood gasification in the PSI fluid-ized bed gasifier.
2 EXPERIMENTAL
The experiments were carried out in PSI's bubblingfluidised bed gasifier operated with a mixture of steamand oxygen as gasification agent [2], [3]. The gasifierwas operated with a fuel throughput of 9 to 23 kg/h,which is equivalent to a thermal load of 50 to 145 kW.
The main parameters varied in this investigation werethe plastics content and the gasification stoichiometriy,i.e. the oxidant/fuel equivalence ratio (ER). Variation ofthe ER was achieved by adjusting the fuel feed rate toa constant flow of the gasification agents.
The basis of the fuels used for the present study wasurban waste wood ("Altholz"), a mixture of wastewoods of different provenience provided by Holder-bank Cement und Beton. After removing coarse met-als and stones the fuel was milled and dried to beused in a pulverised fuel burner of a cement kiln. PEand PS were chosen as model polymers because theyare the main compounds expected in packagingwastes [4] and they are typical representatives ofpolymers with aliphatic (PE) or aromatic (PS) buildingblocks. Mixtures of 10% and 20% of the plastics (rawgranules) were mixed with Altholz.
The gas composition (N2, CO2, CO, CH4, H2, Ar, andO2) was monitored on-line by a process mass spec-trometer. Tars were sampled from the raw gas using acondensation/absorption sampling train using water,CH2CI2, and methanol/acetone as solvents.
The samples collected were analysed for their contentin 41 characteristic tar compounds using a GC/MSD
[2]. For simplicity, the tar compounds have beengrouped into 9 representative classes of compounds,see Table 1.
Tar classBenzene1 ring
Naphthalene2-ring
3-ring
4-&5-ring
PhenolCresolsO-Heteroaromatics
Compounds in classBenzeneToluene; Ethylbenzene; Xylenes;Styrene; isomers of Ethyltoluene andMethylstyreneNaphthaleneIndene; Methylnaphthalenes; Biphe-nylAcenaphthylene; Acenaphthene;Fluorene; Phenanthrene; AnthraceneFluoranthene; Pyrene; Benz[a]an-thracene; Chrysene; Benz[e]ace-phenanthrylene; Benzo[k]fluoran-thene; Benzo[a]pyrene; Perylene;Dibenzo[ah]anthracene; Inde-no[1,2,3-cd]pyrene; Benzo[ghi]pe-rylenePhenolo-, m- & p- Cresol2,3-Benzofuran; Dibenzofuran
Table 1 : Tar compounds analysed and tar class defi-nitions.
3 RESULTS
The gasification experiments carried out with both PEand PS as additives did not give significant differenceswith respect to gas composition for CO and CO2. Sur-prisingly, however, the hydrogen yields in the experi-ments with 20% plastics tended to drop below thereference values with Altholz.
As expected, the levels of 1-ringed aromatics in thegas rise dramatically with the addition of PS (see Ta-ble II). Styrene and toluene are found in much higherconcentrations at low ER's. The increase is much lessdramatic at high ER. At low ER, up to 40% of the poly-styrene fed to the reactor is directly transformed intothe monomer, styrene. At ER above 0.3 this fraction isless than 1%.
The concentrations of polycyclic aromatic compoundsare also higher when PS is added. On the other hand,phenolic compounds seem to be converted inside thereactor in this case, as the observed concentrationsare lower.

17
FuelER[-]T Bed [2C]Benzene1 ringNaphthalene2 ring3 ring4+5 ringPhenolCresolsO-hereoar.Total
Altholz+10%0.2080247.463.011.610.79.72.55.21.41.1152.7
0.2893068.05.113.64.411.25.60.00.00.4
108.3
PS0.42102433.50.45.20.73.83.20.00.00.0
46.9
Altholz+20%0.1669945.3198.913.014.710.62.25.94.80.8296.3
0.24841109.926.220.511.220.27.00.20.00.6195.9
PS0.3497049.88.26.71.35.74.20.00.00.176.0
Table 2: Tar classes concentration in [g/m N,dry] forsteam/oxygen gasification of Altholz/PS mixtures.
Data for PE/Altholz mixtures is given in Table 3. Sur-prisingly, the admixture of PE yields a significantlyhigher concentration of tars. 10% PE in the fuel in-creases the total tars by a factor of ca 1.5 in the lowerER range studied, but essentially the same tar isfound when a high ER is used.
FuelER[-]T Bed [2C]Benzene1 ringNaphthalene2 ring3 ring4+5 ringPhenolCresolsO-hereoar.Total
Altholz0.2173210.110.92.13.51.80.76.14.50.740.4
0.3083014.55.15.02.93.71.50.50.00.633.7
Altholz+20%0.3892020.10.75.80.73.62.30.00.00.233.4
0.1567020.019.32.23.91.60.64.95.30.558.3
0.2478840.213.78.75.55.72.31.70.20.778.8
PE0.3490137.92.610.31.97.25.10.00.00.265.1
Table 3: Tar classes concentration in [g/m3N,dry] for
steam/oxygen gasification of Altholz and Altholz/PEmixtures.
The concentrations of two major tar compounds areshown in Figures 1 and 2, respectively. Benzene con-centrations are higher with both, PE and PS additionsto the fuel. This holds especially for ER around 0.3. Athigh ER, the influence of the plastics is less ex-pressed. Relatively more benzene is formed as theamount of polymers in the fuel increases. Phenol con-centrations decrease strongly with increasing ER, forboth Altholz and mixtures with polymers. ER stronglycorrelates with the operating temperature of the gasi-fier (see Table 2 and 3).
4 CONCLUSION
The results of the gasification experiments of Altholzmixed with plastics show that this fuel will produce gaswith substantially higher tar contents than Altholzalone unless the process is run at very high ER ortemperatures. The increased tar contents may lead tomodifications in the gas treatment section of a Bio-mass-to-methanol plant. The nature of the plasticsplays an important role in the composition and amountof tars in the gas. While high loads of aromatics are
expected with PS, the levels found with PE are un-expectedly high. Along with the chemically similarpolypropylene, PE is the major polymer in the wastefractions considered for use as fuel.
I Phenol Concentrations~ 6000 j
O 2000
oO 1000
0.15 0.20 0,25
Equivalence Ratio
Fig. 1: Concentrations of phenol as a function ofER in dry gas, for different fuels.
-•-Altholz
— 10%PE
— 20% PE
-o-10% PS
-^20% PS
0,00 0,05 0.10 0,15 0.20 0,25 0,30 0.35 0,40
Equivalent Ratio
Fig. 2: Concentrations of benzene as a function ofER in dry gas, for different fuels.
5 ACKNOWLEDGEMENT
The work presented in this paper was funded by theSwiss federal office for energy BFE.
6 REFERENCES
[1] Biometh, Methanolproduktion aus Biomasse-Abfallen in der Schweiz, Schlussbericht BFE(1996).
[2] L.C. de Sousa, Gasification of Wood, UrbanWaste Wood (Altholz) and Other Wastes in aFluidised Bed Reactor, ETH PhD Thesis, inpreparation.
[3] L.C. de Sousa, S. Stucki, Gasification of UrbanWaste Wood in a fluidised bed Reactor, in Pro-ceedings of the 3rd biomass conference of theAmericas, Montreal, Quebec, Canada, p. 447-452, (1997).
[4] K. Stumpf, Kunstoffrecycling in der Schweiz: einenaturwissenschafliche, technische und okonomi-sche Betrachtung, PhD Thesis, University of Zu-rich, (1994).

18
THE REDOX PROCESS FOR PRODUCING HYDROGEN FROM WOODY BIOMASS,PRELIMINARY MODELLING RESULTS
R. Sime, S. Biollaz, M. Sturzenegger, S. Stucki
The production of hydrogen using REDOX technology has been modelled. These studies have shown that the hy-drogen production efficiency depends significantly on the gasifier fuel gas composition and the thermochemicalproperties of the REDOX material.
1 INTRODUCTION
REDOX technology was initially developed during thelate 19th and early 20th century for the production ofhydrogen and nitrogen from fossil fuels. The technol-ogy was based on cyclic reduction and oxidation ofiron oxides. In the first stage the metal oxide materialwas reduced using fuel gas (Figure 1). The materialwas then re-oxidized in a second stage by eithersteam (for hydrogen production) or air (for nitrogenproduction).
The REDOX technology development was eventuallyabandoned as other technologies such as PressureSwing Absorption (PSA) and cryogenic separationbegan to dominate. In recent years there has been arenewed interest in developing the REDOX technol-ogy.
In this work biomass is used as a hydrocarbonsource to supply the fuel gas. The REDOX modellingstudies are used to provide basic information on thebehaviour of REDOX process. This information wouldbe used to determine the best strategy for the tech-nology development.
Fuel gas HydrogenSteam-hydrogen
Condenser
WaterGasifier
T TAir Wood
Fig. 1: Basic REDOX process diagram.
The overall project is being targeted toward a com-mercial biomass to hydrogen systems in the powerrange 100 kWth to 1 MWth. Validation of the marketpotential for these systems is a strategic objective,but is not the focus of this paper.
A key requirement for commercial success is efficienthydrogen production. Preferably the efficiency wouldbe greater or equal to the efficiency obtained fromstandard hydrogen technologies such as PSA. Other
modelling studies [1] have shown that PSA technologiesin combination with advanced gasifier technologies mayobtain 50-60% hydrogen production efficiency with in-stallations up to 2000 MWth.
2 MODELLING
The REDOX process was modelled using an Excelspreadsheet. In this process dry biomass is fed into agasifier where it is converted to a combustible fuel gas.On exiting the gasifier the fuel gas temperature wasassumed to be 900 °C. The fuel gas then passesthrough a cyclone to remove entrained char and ash.
When the fuel gas is passed through the bed, it is oxi-dised by the metal oxide material to form depleted fuelgas. The depleted fuel gas is then fully combusted withthe addition of air. The heat generated is used to pro-duce steam for the second stage.
In stage 2, steam is used to re-oxidize the metal oxidematerial. A gas stream containing a mixture of hydro-gen and steam is produced. After condensing thesteam, pure hydrogen remains. The heat generated bycooling the steam-hydrogen gas stream may be usedfor fuel drying and district heating. Examples of therelevant chemical equilibriums are:
Fe3Q4+CQ+H2< stage1 )FeO+CQ+H2O 1
FeCX H2O< Sfag6g >FeA + H2 2
For this preliminary work the model assumed the follow-ing:
• Sufficient metal oxide material is present to enablethe redox reactions to proceed to equilibrium.
• The temperature of the fuel gas, REDOX bed andsteam are maintained at 900°C. Endothermic re-forming reactions are compensated for by the addi-tion of air into the REDOX bed.
• The pressure is approximately atmospheric.
• Energy losses from the gasifier and the REDOXbed are minimal (=5%).
• The boiler efficiencies are less than 80%.
• The metal oxide material is stable for a large num-ber of cycles.
• Process electricity consumption has not beenevaluated, but is considered to be low.

19
3 RESULTS AND DISCUSSION
The gasifier fuel gas quality is an important issue forthe REDOX technology development. The effect ofthe fuel gas composition has been modelled. Themodelling showed that the potential hydrogen produc-tion efficiency is strongly dependent on combustion-products/fuel ratio ((CO2+H2O)/(CO+H2) = C/F) of thefuel gas.
A core aspect of the model is the determination of thechemical conversion of gasifier fuel gas to hydrogenby the REDOX process. The effect of the fuel gasC/F ratio on the chemical conversion is shown inFigure 2. For the purpose of clarity the fuel gasesused in this example were assumed to be hydrocar-bon free (i.e. no methane).
>, 50 4o.2 40 -uI304Co« 204
C 10oo
0
Standard gasificationof dry biomass
0 0.5 1 1.5 2 2.5
Fuel-gas C/F ratio (CO2+H2O)/(H2+CO)
Fig. 2: The effect of the fuel gas C/F ratio on thechemical conversion efficiency for magnetite-wuestite.
For conditions where steam availability is not limiting,the chemical conversion relates to the differencebetween the initial and final combustion/fuel ratio ofthe fuel gas. The initial C/F ratio is determined by thegasifier and the biomass feedstock. The final C/Fratio is determined by the thermochemical propertiesof the metal oxide material. The REDOX reactionsare reversible. Therefore when the fuel gas passesthrough the bed, fuel gas oxidation proceeds to anequilibrium composition (i.e. not all of the fuel gas isoxidized).
Ideally the difference between the initial and final C/Fratios should be as large as possible. In reality theavailability of steam for the re-oxidation of the metaloxide is limiting for conditions where the difference inthe C/F ratios are large.
One way to increase the difference between the initialand final C/F ratios, is to increase the final C/F ratioby modifying the metal oxide material. This may beachieved by using mixed metal oxides. A high
metal oxide C/F ratio would allow strong depletion ofthe gasifier gas by changing the final ratio of gases(equation 1). However, for the reverse reaction (equa-tion 2) this means that only a small fraction of the steamwill be converted to hydrogen. A goal therefore must beto find the optimum C/F ratio.
The optimum metal oxide C/F ratio depends on thegasifier fuel gas composition. The best efficiencies areobtained with fuel gases from indirect gasification tech-nologies (Figure 3). Indirect gasifiers use a separatecombustor to provide heat for the endothermic gasifica-tion reactions.
50.0 T
magnetite-wuestite
- • - Indirect gasification I
^Standard gasification[
I
0 1 2 3 4 5
Metal oxide equilibrium CO2/CO ratio
Fig. 3: The effect of the metal oxide C/F ratio on thehydrogen production efficiency. The mole fraction com-position of the fuel gases used in Figure 3 are as fol-lows:
• Indirect- H2 0.32, H2O 0.17, CO 0.29, CO2 0.13 andCH40.09.
• Standard- N2 0.571, H2 0.059, H2O 0.107, CO 0.111,CO2 0.136 and CH4 0.0154.
4 CONCLUSION
High efficiency will be achieved by using good qualityfuel gas (Low C/F ratio) and by optimising the proper-ties of the metal oxide material.
5 ACKNOWLEDGEMENT
Financial support by the Swiss Office of Energy isgratefully acknowledged.
6 REFERENCE
[1] A. Faaij, C. Hamelinck, E. Larson, T. Kreutz. Pro-duction of methanol and hydrogen from biomassvia advanced conversion concepts- Preliminary re-sults. Biomass for Energy and Industry, 1 st WorldConference and Technology Exhibition, June(2000).

20
STUDYING THE REDOX PROCESS BY COMBINED TG-FTIR-GC EXPERIMENTS
R.P.W.J. Struis, A. Frei, L D'Souza, J. Kuehni, Ch. Ludwig, M. Sturzenegger
We present experimental means and preliminary results for studying the redox reactions (Fe3O4^FeO) and thereforming of CH4 by steam, starting from Fe3O4 at 900 °C by combined (TG-FTIR-GC) techniques.
1 INTRODUCTION
The thermochemical conversion of biomass [1] is apotential route for a decentralized sustainable hydro-gen (H2) production. Conversion of the producer gasinto clean H2 is crucial for advancing this technology.We recently proposed a closed loop process for gasclean-up [2], which essentially utilizes the redox chem-istry of iron oxides reactions: Fe3O4^FeO [3]. In thefirst step shown in equation (1), the producer gaspartly reduces magnetite (Fe3O4) to wustite, for sim-plicity described here as FeO. Re-oxidation of FeOwith steam yields clean H2 and the parent Fe3O4
(equation 2).
Fe3O4 + CO / H2 -> 3 FeO + CO2 / H2O (1)
3 FeO + H2O -> Fe3O4 + H2 (2)The chemical equilibrium for the two reactions stronglydepends on the gas composition as is shown in Figure1. Gases with a CO2/CO ratio smaller than 18, butlarger than 0.09, will reduce Fe3O4 to FeO, whileCO2/CO ratios below 0.09 would yield metallic iron(Fe). From Figure 1 it can also be appreciated thatsteam/H2 mixtures react with FeO only until the ratio ofH2O/H2 reached a value of 19.
p(H2O)
P(H2)
100 •;
10-;
1.0-.
0.10-j
0.01 1
Fe3O4 + H 2
3 FeO + H 2O
FeO + H 2
Fe + H2O y y
PI
yS 8
3 Fe
O
OO
i f
Temperature: 823 °C
0 0.01 0.1 1.0 10 100P(CO2)
p(CO)
Fig. 1: Existence of pure and mixed iron oxides as afunction of the partial pressure ratios H2O/H2 andCO2/CO, respectively. The equilibrium composition ofthe producer gas after conversion is indicated with P1.
Besides the reducing agents CO and H2 the producergas often contains methane (CH4). Its utilization in thereduction process is highly desirable. However, it re-quires catalytic reforming of CH4, e.g., with steam attemperatures above 500 °C, yielding [4]:
CH4 + H2O -> CO + 3 H2 (3)However, coke formation inhibits the catalyst effi-ciency for steam methane reforming with time. Lit-erature reports that this phenomenon may be reducedconsiderably when depositing metal catalysts, such as
Pt, Ni, Rh, or Pd, on metal oxide supports, such asAI2O3, SiO2, or TiO2 [4]. In this context, we study thepotential of magnetite and wustite for steam reformingof CH4. This work presents experimental means toobtain kinetic information on reaction (1) and on theCH4 steam reforming potential of magnetite at 900°C.
2 EXPERIMENTAL
The reactions were studied with a Thermo-GravimetricAnalyser (TG) coupled with gas phase Fourier Trans-form Infra-Red spectrometer (FTIR) (from BomemInc., Canada), and a Gas Chromatograph (GC). Ca.25 mg of magnetite (particle size distribution between0.1-10 (im, with average around 1 \im) was placed in aplatinum sample holder within the TG furnace andheated to the desired temperature. The micro-balancesystem of the TG traced the sample mass with time,while FTIR determined the gas (CH4, CO, CO2) andwater vapour flow quantitatively every 0.1 min. On-lineanalysis of the gas leaving the TG-FTIR unit with theMicro Gas Chromatograph (from Hewlett Packard)provided the H2 concentration (as well as those of CO,CO2, and CH4) every 2 min. X-ray powder diffractionanalysis (with X'Pert from Philips) was used for speci-ation of the iron oxides studied.
To investigate reaction (1), we used a (bottled) gasmixture of known composition (H2/CO/CO2/N2=15/19/12/54 vol.-% from Sauerstoffwerk Lenzburg corre-sponding to the output of a typical air-blown woodgasifyer. Prior to use, the gas was saturated with wa-ter vapour by passing it through a water bottle placedin a thermostat bath at 60 °C. To minimise water con-densation in the down-line tubing and in the TG-FTIRunit, the water-saturated gas was mixed with the TGcarrier gas at the nearest possible distance to the TGfurnace. Moreover, the connecting tube was heatedexternally by flowing thermostat water and was iso-lated with aluminium foil. Under the given experimen-tal conditions, the effective water vapour content in thegas mixture amounted to 9 vol.-%. Reaction (3) in thepresence of magnetite was studied with a CH^Ar gasmixture (5/95 v/v), respectively, with pure CH4, bothsaturated with water vapour as outlined earlier.
3 RESULTS & DISCUSSION
In a typical TG-FTIR-GC run, the first 20 min are usedfor heating the TG oven to 900 °C and for stabilisingthe end temperature under an inert Ar atmosphere.Figure 2 shows the mass loss due to the reduction ofmagnetite at 900 °C after introduction of the (H2/CO/CO2/N2) gas mixture (40 ml/min) to the TG carrier gas.The results in Figure 2 illustrate that the reduction ofFe3O4 to FeO or Fe depends on the amount of watervapour present in the gas mixture, in line with thermo-

21
dynamic predictions (see Figure 1). The mass lossesagree well with the predicted ones, as the reduction ofFe3O4 to FeO should result in 6.9, and that of Fe3O4 toFe in 27.7% weight decrease.
105-
100
E 9 5 -
9 0 -
r 85-8 0 -
70-
Inert Igas
Introduction of(CO/CO2/H2/N2
gas mixture.
30
Time(min)
40
Fig. 2: Mass loss associated with the reduction ofmagnetite under reducing conditions at 900 °C.
Figure 3 demonstrates the steam reforming potentialof magnetite at 900 °C upon introduction of the watersaturated CH4/Ar gas mixture (5/95 v/v) to the TGcarrier gas after 20 min. Between 20 and 90 min., wefirst passed 20 ml/min of the CH4/Ar gas mixturethrough the water bottle for saturation, leading to aneffective [CH4]/[H2O] volume ratio of 0.5, which wasthen mixed with the TG carrier gas. From Figure 3, itcan be seen that the sample mass dropped within 10min by ca. 2 wt.-%, and that the sample mass re-mained constant thereafter, unless, after 90 min, weincreased the [CH4]/[H2O] volume ratio to 10 (as dis-cussed further down in the text). Between 20 and 90min, GC and FTIR analysis reveals the formation of H2
and carbon oxides, which we attribute to the steamreforming reaction of methane. After 90 min, we re-placed the CH4/Ar (5/95 v/v) gas mixture with pureCH4 (20 ml/min), hereby rising the [CH4]/[H2O] volumeratio to 10. Also under the new conditions, H2 andcarbon oxides are being formed as a result of themethane steam reforming reaction. As can be seenfrom Figure 3, the mass loss of Fe3O4 to FeO pro-ceeds in two stages as a result of the differentCH4/H2O ratios used. X-ray powder diffraction analy-ses with thermally quenched samples (under inertatmosphere), revealed that in region (I), the magnetitesample also contained some hematite (Fe2O3), whichreduced completely to Fe3O4, which is the thermody-namically favoured species under the reducing condi-tions prevailing in region (II). The stability of the latterspecies is also supported by the experimentally de-termined partial pressure ratio of [H2O]/[H2]=45+5 (seeFigure 1). However, in region (III) we have more H2
and less H2O, leading to a [H2O]/[H2] ratio around 8.4,and under these stronger reducing conditions,
Fe3O4 is no longer thermodynamically stable and re-duces to the favoured FeO, albeit not completely, asthe observed net 4.8% weight loss in region (III), sug-gests that the sample contains ca. 70% FeFe3+
and 30%
••= 1 o o -
D. 95 -
(I)I 1Inertgas
[CHJ/[H2O]= 0.5
(III)
[CHJ/[H2O]= 10
20 40I I \
60 80
Time (min)
100 120 140
Fig. 3: Mass loss in magnetite during steam reform-ing of methane at 900°C (as discussed in the text).
4 CONCLUSION
Combined TG, FTIR and GC techniques allowed us toinvestigate the reduction of Fe3O4 and the CH4/H2Oreforming reaction with Fe3O4 at 900 °C very satisfac-torily. Preliminary results support thermodynamic ex-pectations with respect to the favoured iron oxide spe-cies under the prevailing reducing gas atmosphere.They further suggest that magnetite supports steamreforming of methane, which is encouraging in view ofthe desired conversion efficiency of the biomass pro-ducer gas, including that of hydrocarbon containingconstituents, such as methane and volatile tars. Theseresults enable the envisaged kinetic study on the influ-ence of Ni compounds on the steam reformation ofmethane when combined with iron oxides.
5 ACKNOWLEDGEMENT
The financial support of the Swiss Federal Office forEnergy Research (BFE) is gratefully acknowledged.
6 REFERENCES
[1] Cl. von Scala, Ph. D. Thesis, ETH-Ztirich, Nr.12665(1998).
[2] M. Biollaz, M. Sturzenegger, S. Stucki, Redoxprocess for the production of clean H2 from bio-mass, Conference poster to Process in Thermo-chemical Biomass Conversion, Tyrol, Austria, 17-22 September 2000.
[3] A. Steinfeld, A. Frei, P. Kuhn, Metallurgical andMaterials Transactions B, 26B, 509-515 (1995).
[4] R. P. W. J. Struis, TM-50-00-06, PSI (2000).

23
Solar Technology

24
DETERMINATION OF THE RESIDENCE TIME DISTRIBUTION FOR A SOLAR RE-ACTOR AND ITS USE FOR DERIVING REACTION KINETICS
Th. Frey, Ch. Guesdon, M. Sturzenegger
The residence time distribution of a solar reactor was experimentally determined by measuring the re-sponse function at the reactor outlet after applying a step input of a tracer. The results have shown that thereactor behaves like an ideal stirred tank with a mean residence time of 90±2 s and they were used toderive reaction kinetics from high temperature experiments in the solar furnace.
1 INTRODUCTION
TREMPER is an experimental reactor for high tem-perature reactivity studies under concentrated solarradiation and it was employed to evaluate metal ox-ides for the production of solar fuels [1]. Previous ex-periments yielded valuable information about equilib-rium compositions. However, quantitative reactionkinetics could not be derived from post mortem sam-ple analysis because temporal resolution was insuffi-cient in particular for the early stage of the experiment.Thus, the objective of this work was to determine theresidence time distribution and to employ this quantityfor calculating the rate of oxygen release of the sam-ple from on-line gas phase analysis.
2 EXPERIMENTAL
The experimental solar reactor, TREMPER, is sche-matically represented in Figure 1. A detailed descrip-tion is given elsewhere [1].
The residence time distribution was determined asfollows: A step input of oxygen as tracer was appliedand the oxygen concentration at the reactor outlet wasmeasured by means of a mass spectrometer.
The nitrogen flow at the inert gas inlet (4) was10.0 lNmin-1, the tracer flow (at position 5) was set to20mlmiir1. The system was purged until the back-ground signal for oxygen at the reactor outlet (9) be-came steady. After stabilization the three-way valve (6)was switched from position A to position B therebyfeeding oxygen into the reactor exactly at the positionof the sample (2). At the same time a trigger signalwas transmitted to the data acquisition to tag the be-ginning of the experiment. The measurement wasstopped when the signal for oxygen became constant.
From the measured concentrations the cumulativedistribution function F(t) was calculated by
F(t) = - 0)
1 45° Mirror2 Sample position3 Hammer4 Inert gas inlet5 Tracer inlet6 Three-way/
two-position valve7 Quartz tube8 Capillary to MS9 Outlet
O
©
where cjt) is the tracer concentration at the reactoroutlet, cjt=°o) is the finally reached outlet concentra-tion, which results from the two inlet flows, and c0 isthe background signal for oxygen in nitrogen.
The relation between the F curve for an ideal stirredtank and the mean residence time x is described by
(2)
(3)
The mean residence time x is defined by
T--V,.
where Vr is the reactor volume and v is the volumetricflow rate.
The mass balance for a component / in an ideal stirredtank without any chemical reaction is
V !—i-=v(c- - c ) (4)
where cia is the concentration of component / in thefeed and c, that in the outlet and in the tank, respec-tively. Thus, a time dependent concentration of com-ponent / in the feed can be expressed as
Fig. 1: Side View of TREMPER. (5)

25
For chemical experiments with TREMPER the sourcefor the gaseous component i is not the feed but thesample releasing / in the course of the reaction. Be-cause the gas evolution is much smaller than the inertgas flow, it can be neglected, and the gas evolutionrate «. can be calculated from the volume concentra-tion Xi measured at the outlet according to
RT(6)
where p is the atmospheric pressure, R the universalgas constant and nhe gas temperature at the outlet.
3 RESULTS AND DISCUSSION
Figure 2 shows the F curve calculated from the meas-ured concentrations and the one for an ideal stirredtank with a mean residence time of 93.6 s. The latterfigure results from the net reactor volume of 15.6 IN,as it was determined with CAD software, and an inertgas flow of 10lNmin1 (see Equation 3). The goodagreement between the two curves suggests thatTREMPER behaves like an ideal stirred tank.
0.8 -
0.6
0.4
0.2 •]
0
Experimental
Ideal stirred tank
100 200 300 400 500
Time [s]
Fig. 2: Experimental F curve compared with theF curve for an ideal stirred tank with a calculatedmean residence time x of 93.6 s.
y = 0.0113x-0.0909
R2 = 0.9973
Exp. #1
Exp. #2
Linear Fit (Exp. #1)
Linear Fit (Exp. #2)
400
Fig. 3: Logarithmic plot of the results from two ex-periments. Linear fits confirm the consistence with themodel of an ideal stirred tank.
Figure 3 shows the results of two experiments in alogarithmic plot. Data for t>400 s are omitted becauseof amplification of noise for F(t) values near to unity.For an ideal stirred tank one expects a straight linewith a slope that equals the reciprocal value of themean residence time. In fact, the results are well rep-resented by a linear fit and confirm the assumedmodel. The mean residence times derived from theslopes are 88.5 s and 90.9 s. The somewhat smallervalue than the calculated one (see Equation 3) is ex-plained by the fact that determination of the net reactorvolume by CAD neglected smaller components, e.g.cooling water tubes.
The results described above were applied to calculatethe rate of oxygen release for the reduction of Mn3O4
to MnO at temperatures around 2200 K. Figure 4displays the rate of oxygen release as it was calcu-lated from the gas phase analysis according to Equa-tion 6. The gray line represents the integrated amountof oxygen. It is used to calculate the composition ofthe melt and it indicates that the reaction reacheschemical equilibrium towards the end of the experi-ment.
oE
a>(A
0.08
0.06 -
S 0.04a>
CCca>
2XO
0.02 -
0.8
- 0.6o
c
0.4 |T3a>
- 0.2
o
0 20 40 60 80 100 120 140 160 180
Time [s]
Fig. 4: Rate of oxygen release and integrated amountof oxygen during reduction of Mn3O4 in the solar fur-nace.
4 ACKNOWLEDGEMENT
Continuous financial support from the Swiss FederalOffice of Energy is gratefully acknowledged.
5 REFERENCES
[1] Th. Frey, E. Steiner, D. Wuillemin, M. Sturzeneg-ger, Investigations on the Solar Thermal Reduc-tion of Manganese Oxide, Proc. 10th SolarPACESInt. Symp. on Solar Therm. Cone. Technologies,Sidney/Australia, 309-314 (2000).

26
DEVELOPMENT OF A REFLECTOMETER FOR THE DETERMINATION OF THESPECTRAL EMITTANCE IN THE VISIBLE AT HIGH TEMPERATURES
S. Eckhoff, I. Alxneit, M. Musella, H.-R. Tschudi
The design of a high temperature reflectometer is presented. The instrument allows measuring thedirectional-hemispherical spectral reflectance in the visible at temperatures up to 3000 K. For opaquesamples the spectral emittance follows from the spectral reflectance. Limited by the current detectionequipment the spectral reflectance between 510 nm and 860 nm can be measured simultaneously. Anelectrical resistance heater is used to reach temperatures up to 1200 K, for higher temperatures thesamples are heated by a flash-lamp pumped dye laser. First measurements on stabilized ZrO2 and Mn2O3
are presented.
1 INTRODUCTION
The solar technology research at the Paul ScherrerInstitute is focused on the transformation and storageof solar energy. To provide chemical energy carriers,so called solar fuels, thermochemical reductions ofvarious metal oxides (e.g. manganese- or zinc oxide)at very high temperatures (T>1500K) areinvestigated [1]. In this context, the spectral emittanceof hot surfaces is an important parameter necessaryfor the calculation of the radiant heat transfer and forprecise pyrometric temperature measurements. Inaddition, the knowledge of the emittance of thematerials used in the system, either as reactants ofthe solar chemical reactions or as constructionmaterials of the reactor itself, plays a decisive role inthe choice of the reactor design, its modeling and inthe final performance of the entire process. In spite oftheir importance, optical properties of the metal oxidesused in the thermochemical cycles mentioned aboveas well as many of the materials currently used in hightemperature applications (e.g. alumina and zirconia)are known only at moderate temperatures or, at hightemperatures, for some discrete wavelengths [2].Since important data are missing in the literature, anew method to determine the spectral emittance ofcondensed samples at temperatures up to 3000 K inthe visible and near infrared range has beendeveloped in our laboratory.
2 METHOD
In the newly developed method the emittance e isdetermined indirectly by measuring the directionalhemispherical reflectance p using an integratingsphere. Provided that the sample is opaque, thedirectional hemispherical emittance is related to thereflectance by Kirchhoff's law [3] and can be simplycalculated from the equation
e{X,T) = \ -/?(!, T)
Our technique is based on the comparison method,thus the reflectivity is obtained by comparing theresponse of the sample with the response of a whitereference
where 0spl is the light reflected from the sample, @hot
is the thermally emitted radiation from its hot surface,0ref is the white light reflected from the reference and0bg is the background signal.
Since the whole apparatus is calibrated to an absolutescale, the temperature of the sample and the size ofthe hot spot is obtained by fitting the thermal emissionof the hot sample surface with Planck's formula (seeFigure 4).
3 EXPERIMENTAL SETUP
In the reflectometer (see Figure 1), the sample (S)0 = 8 mm and the reference (R) are placed in thecentre of an integrating sphere (I) on opposite sides ofa rotatable manipulator (M). White light (W) is focusedonto the sample surface monitored by a black/white-camera (C). The light reflected by the sample iscollected by an optical fibre (F), analysed in aspectrograph, and detected by an intensified CCD-camera.
Fiber (F)
Water Cooling
Fig. 1: Cross-section of the experimental chamber(see text for details).

27
Probing the spectral reflectance with a white lightsource allows the simultaneous acquisition of data inthe wavelength range 510-860 nm. For measuring thelight reflected from the reference, the water cooledmanipulator (M) is turned by 180°.
The sample is heated up to about 1200 K by anelectrical resistance heater. Higher temperatures arereached by heating the sample with a flash lamppumped, pulsed dye-laser operating at 596 nm whichis focused on the sample surface on a spotoverlapping the spot of the white light. To suppressplasma generation the integrating sphere is placed in avacuum chamber (V) which also allows formeasurements under controlled atmospheres. Due tothe short laser pulse (200-400 (is) exposure times ofthe order of 10-100 (is are used for the acquisitiontimes of the CCD-camera. A notch-filter is placed atthe entrance of the spectrograph in order to suppressthe direct laser light. This causes an artifact in allspectra around 600 nm. A detailed analysis of thephoton statistics in the light path allows to calculateindividual standard deviations for every single datapoint of the spectrum (see Figures 4-6).
4 MEASUREMENTS
Test measurements on two different materials(stabilized ZrO2, high reflectivity, chemically inert;Mn2O3, low reflectivity, prone to reduction) have beenperformed to assess the performance of thereflectometer.
The reflectance of stabilized zirconia (ZrO2) does notchange much for temperatures up to about 1200 Kwhen heated by the electrical heater. In the range of512-860 nm, the reflectance is almost constant atabout 0.8 (see Figure 3, curve a) However, itdecreases reversibly to about 0.5 for temperaturesnear 2000 K (not shown).
Laser heating of stabilized ZrO2 with an energy densityof 19 Jem"2 results in melting of the surface (Tm ~2823 K). The observed change in the surfacestructure is reported in Figure 2.
Fig. 2: SEM-images of the ZrO2-surface before (a)and after (b) laser heating with 19 J cm"2.
The reflectance decreases to 0.2 (see Figure 3, curvee) when the surface melts. XPS-measurementscarried out after the measurements show that themolten area is chemically reduced. Thus, thedecrease in the reflectance value at this very hightemperature is attributed to both, the change ofsample microstructure and its varied chemicalcomposition.
If the molten surface is then laser heated again thereflectance increases with temperature from 0.2 atabout 1600 K to 0.4 at more than 2000 K (see fig. 3,curves d-b). Despite the notch filter, a disturbing signalfrom the laser is still superimposed on the spectra.Therefore, proper spectra can be obtained only afterthe laser pulse, i.e. from about 0.6 ms after the triggersignal onwards, while the sample is cooling down.
1.0
0.9
0.8
0.7
" 0.6CO
o 0.5
~O 0.4
0.3
0.2
0.1
0.0
a): 298 K (before melting the surface)
- * b ) : 2 3 * 3 +/-15 K (AtTril>lr = 1 ms)
c): 1699 +/- 5 K ( A t ^ ^ = 10 ms)
d):1610+;-9K(AtTr i> l. r = 20ms)
_., ' " " "
/•-\A / ' w
e): 298 K (after melting the surface)
-
-"- b
y™ C
e
-
500 600 700 800
Wavelength / nm
900
Fig. 3: Spectal reflectance of stabilized ZrO2 before(a) and after (b-e) melting the surface.
For data acquired well after the laser pulse reliabletemperature values can be obtained from the thermalemission of the samples. This is exemplified inFigure 4 for spectrum c of Figure 3.
0.4
£ 0.3
a 0.2
0.0
Tm =1699+/-5K
Am = 28.8+/-1.1 mm2
600 700 800
Wavelength / nm
Fig. 4: Temperature fit of a ZrO2 sample 10 ms afterthe end of 10Jem"2 heating pulse of the dye-laser.Data correspond to spectrum c of Figure 3.
The influence of chemical reactions is demonstratedby measurements carried out on manganese oxides.The differently valent manganese oxides Mn2O3,Mn3O4 and MnO can be distinguished at roomtemperature by their spectral reflectances (seeFigure 5).

28
500 600 700
Wavelength / nm
800 900
Fig. 5: Spectral reflectance of different manganeseoxides at room temperature.
A sample of Mn2O3 was studied in the temperaturerange 300-2000 K. When heated in vacuum (0.2 Pa),the sample is expected to be chemically reduced insuccessive steps. Mn2O3 is reduced to Mn3O4 at about700 K and finally to MnO at about 1300 K [4]. Thesechemical transformations should become evident inthe change of the reflectance according to Figure 5. InFigure 6, we report the temperature dependentreflectance of Mn2O3. It increases with temperature,less at short wavelengths and more in the nearinfrared (see Figure 6).
600 700
Wavelength / nm
800 900
Fig. 6: Temperature dependence of the spectralreflectance of Mn2O3. In the hatched area the spectraare disturbed by the direct laser light.
Although the absolute values do not coincide with theones in Figure 5, it is evident that reduced manganese
oxides have been formed. According to the reductiontemperatures of Mn2O3 and Mn3O4 one mightconclude that even MnO should have been formed. InFigure 5 it is shown that Mn3O4 and MnO can only bedistinguished by the slight kink in the reflectancespectrum of MnO at 680 nm which is absent in thecase of Mn3O4. The quality of the data in Figure 6does not allow for such a detailed interpretation.Moreover, only a small layer of the sample surface isheated up to the temperature calculated by the fit.Therefore the measured reflectance is an average ofthe value of the very hot surface and of layers layingunderneath with lower temperatures. In all figures themeasured reflectances are attributed to the highesttemperature of the small surface layer but it actuallyrepresents an average of the hot surface and the lesshot bulk of the sample.
5 DISCUSSION
With the newly developed reflectometer, the spectralreflectance between 510 nm and 860 nm can bemeasured from room temperature to temperatures upto 3000 K. Chemical reactions can also be monitoredwith the same experimental set-up. In the presentstate of the apparatus, the pyrometric determination ofthe surface temperature is often disturbed by thesuperimposed broadband emission of the laser itself.The temperature inside the sample has to be modeledin future in order to associate the measuredreflectivities with their proper temperature.
6 ACKNOWLEDGEMENT
The cooperation with the group of Prof. Oelhafen atthe University of Basel is gratefully acknowledged.This work has been supported by the Swiss FederalOffice of Energy (BFE).
7 REFERENCES
[1] A. Steinfeld, R. Palumbo, Fuels from Sunlight andWater, Sun at Work in Europe, 12 (1999).
[2] Y.S. Touloukian, D.P. DeWitt, Thermo-physicalProperties of Matter, 7 (1970).
[3] G. Korttim, Reflexionsspektroskopie (1969).
[4] G. Tromel et al., Das Zustandsdiagramm desSystems Mangan-Sauerstoff, Erzmetall, 29(1976).

29
SOLAR RECYCLING OF HAZARDOUS SOLID WASTE MATERIALS
B. Schaffner, W. Hoffelner (RWH Consult GmbH), A. Steinfeld (ETHZ and PSI)
The thermochemical conversion and recycling of hazardous solid waste materials is investigated usinghigh-temperature solar process heat. Electric arc furnace dust (EAFD), an important source of waste con-taminated with heavy metals, is being considered. The chemical equilibrium composition and the energyrequired to process it, using carbon as reducing agent, is computed for temperatures in the range 300-2000 K. Zinc, lead and iron can be extracted from their oxides in reducing atmospheres at above 1300 K.The thermal energy requirement for converting EAFD at 1500 K is 3000 kJ/kg, and the solar exergy con-version efficiency can be as high as 67%. Major sources of irreversibilities are those associated with there-radiation losses of the solar reactor and the heat rejected during the quenching. The use of concen-trated solar energy as the source of process heat avoids emissions of greenhouse gases and other pollut-ants derived from the combustion of fossil fuels, and further offers the possibility of converting waste mate-rials into valuable commodities for processes in closed and sustainable materials cycles.
1 INTRODUCTION
Solid waste materials such as by-products from themetallurgical industry contain hazardous compoundsthat cannot be discharged to the environment. Theyare usually disposed of in hazardous waste storageand landfill sites, where they need to be continuouslymonitored [1]. The chemical transformation of thesematerials into elemental components offers the possi-bility of converting waste materials into valuable feed-stock for processes in closed materials cycles [2]. Thecurrent commercial thermal recycling techniques aremajor consumers of electricity and high-temperatureprocess heat and, consequently, major contributors ofgreenhouse gas emissions and other pollutants [3].Concentrated solar radiation can supply clean thermalenergy at temperatures exceeding 1500 K for drivingthese endothermic processes. Greenhouse gases andother pollutants derived from the combustion of fossilfuels are avoided, and the chemical products can beused as fuels with a solar-upgraded energetic value.
We present a thermodynamic study of the recyclingprocess of EAFD, to assist the solar reactor engineer-ing design [4]. Chemical equilibrium compositions arecomputed over a wide range of temperatures for thecarbothermal reduction process. A 2nd law analysis isconducted to determine the maximum solar exergyconversion efficiency and to identify sources of irre-versibility. This information determines the constrainsto be imposed on the design and operation of the solarchemical reactor.
2 CHEMICAL THERMODYNAMICS
The carbothermal reduction of metal oxides (usingC(gr) as reducing agent), is a complex process but theoverall reactions can be represented by:
MxOy + y C(gr) = xM + yCO (1)
where M denotes the metal and MxOy the correspond-ing metal oxide. The chemical equilibrium compositionfor representative species compositions of EAFD wascomputed over the temperature range 300-2000 Kusing the code HSC Outokumpu [4]. Results are givenin Figure 1. Species with less than 10~5 moles havebeen omitted from the graph.
Reactants: 3.46 mol ZnO, 0.91 mol ZnFe2O4, 0.12 mol Pb3O4, 7.56mol C (reducing agent), 5.45 mol SiO2 (main vitrification agent).
in
Q.CO
7
6 -
5 -
4 -
3 ZnF
0
e2O4 F e 3°4
1
.... C
ZnO
= f -
CO(g)
~\ F e
V y
SiO2
Zn(g)
Pb Fe ,O3 , FeCO3,
'S i , PbO• 1
300 700 19001100 1500Temperature [K]
Fig. 1: Chemical equilibrium composition for the car-bothermal reduction of EAFD.
3 2NU LAW ANALYSIS: SOLAR EXERGY CON-VERSION EFFICIENCY
Solar chemical reactors for highly concentrated solarsystems usually feature the use of a cavity-receivertype configuration. For a perfectly insulated blackbodycavity-receiver (no convection or conduction heatlosses), the solar energy absorption efficiency of asolar reactor, r]absorp\\on is given by [5, 6]:
iubsoiirption = 1-IC (2)
where / is normal beam insolation, C is the flux con-centration ratio of the solar concentrating system, T isthe nominal cavity-receiver temperature, and o is theStefan-Boltzmann constant. Since the net energy ab-sorbed should match the enthalpy change of the reac-tion, the total solar energy required is
O -*£ solar 'absorption (3)
The measure of how well the solar energy can beconverted into chemical energy for the process is the

30
solar exergy efficiency, T]exergy, defined as
-AG,Iexergy
'fuel cell
xireactants x^solar(4)
where Qreactants is the heating value of the reactants,Qsoiar is the total solar energy input given by Eq. (3),and AGfuel.cen is the maximum possible amount of workthat may be extracted from the products at ambienttemperature. An ideal cyclic process (Figure 2) uses asolar reactor (assumed to be a perfect blackbody cav-ity-receiver), a quenching device, and a fuel cell.
ConcentratedSolar Radiation
C = 2000
1absorptiori= ° - 8 6
1 kg EAFD + C + SiO2
>. L^Solar Reactor @ ISOOK
() ~ 3008 kjQsola,= 3509 k j
Reactants Products@298K @1500K
Recycling
Consumption
Ideal Fuel Cell@298K
, Electricity Oxygen
Fig. 2: Schematic of an ideal cyclic process for thesolar carbothermal reduction of EAFD. Concentratedsolar energy (solar flux concentration ratio = 2000) isthe source of high-temperature process heat.
Table 1 is a numerical description of the componentsshown in Figure 2 for the solar flux concentration ra-tios 2000 and 5000.
Qreactants (heating value of reactants)
Fuels in products
AGfue/ceii (exergy of products)
AHrxn
'/absorption
Qsoiar
Vexergy
C = 2000
C = 5000
C = 2000
C = 5000
C = 2000
C = 5000
2975 kJ
C, CO, Zn, Fe, Pb
-4107 kJ
3008 kJ
0.857
0.943
3509 kJ
3189 kJ
0.63
0.67
Table 1 : Exergy efficiency for the solar carbothermalrecycling of EAFD using the chemical compositions ofFigure 1. The parameter is the solar flux concentrationratio, assumed to be 2000 and 5000. All values arenormalized for 1 kg reactants.
The complete process is carried out at constant pres-sure. The reactants enter the solar reactor at 298 Kand are heated to the reactor temperature at 1500 K.The products exit the reactor having the chemicalequilibrium composition at 1500 K given in Figure 1.After quenching to 298 K, the fuels contained in theproducts are sent to an ideal fuel cell for calculatingthe exergy of the products, AGfuel.cell. Oxidized solidfuels and waste materials from consumer goods arerecycled to the solar reactor. The energy demand forthe transformation is 3008 kJ/kg, if the reactants arefed at 298 K and the products are obtained at 1500 Kwith the equilibrium composition of Figure 1.
For a solar concentration varying in the range 2000 to5000, maximum exergy efficiencies vary between 63and 67%. Major sources of irreversibilities are thoseassociated with the re-radiation losses of the solarreactor and the heat rejected during the quenching.High efficiencies directly translate to lower solar collec-tion area and associated costs of the heliostat field,which amount to 40-50% of the capital cost for thesolar recycling plant. In general, it can be stated thatthe solar thermal technology for the recycling of highlycontaminated waste materials is a favorable mediumto long term prospect provided the cost of energy willaccount for the environmental externalities from fossilfuel burning such as the costs for CO2 mitigation andother pollution abatement measures.
4 ACKNOWLEDGEMENT
Financial support by the BFE-Swiss Federal Office ofEnergy is gratefully acknowledged.
5 REFERENCES
[1] Schweizerischer Bundesrat, Technische Verord-nung uber Abfalle vom 10. Dezember 1990, Bun-deskanzlei, Bern, Switzerland (1991).
[2] D.K Xia, C.K. Pickles, Waste Processing andRecycling in Mineral and Metallurgical Industries3,221-245(1998).
[3] F. Habashi, Principles of Extractive Metallurgy 3,Gordon and Breach Science Publishers S. A.,New York (1986).
[4] B. Schaffner, W. Hoffelner, A. Steinfeld, Recy-cling of Hazardous Solid Waste Materials UsingHigh-Temperature Solar Process Heat. 1. Ther-modynamic Analysis Environ. Sci. Technol. 34,4177-4184(2000).
[5] A. Roine, Outokumpu HSC Chemistry for Win-dows, Outokumpu Research Oy, Pori, Finland(1997).
[6] E.A. Fletcher, R.L. Moen, Science 197, 1050-1056(1977).
[7] A. Steinfeld, C. Larson, R. Palumbo, M. Foley,Energy 2\, 205-222 (1996).

31
STOICHIOMETRIC OPERATION OF THE SYNMET REACTOR
S. Kraupl, A. Steinfeld (ETHZ and PSI)
The thermodynamic implications of conducting the solar combined ZnO-reduction and CH4-reforming un-der stoichiometric and non-stoichiometric conditions are examined. For a solar flux concentration ratio of5000 and for a solar cavity-receiver operating at 1300 K, the solar thermal conversion efficiency is 55 % fora stoichiometric molar ratio of ZnO and CH4, and decreases by 50 % when using excess methane by afactor 10 over the stoichiometric molar amount. A technical solution for operating a gas-solid vortex-flowsolar reactor under stoichiometric conditions was established by using a pulsed-feed of methane to carryout the particles of ZnO. Using this technique, nearly stoichiometric operation was demonstrated with aprototype reactor in a high-flux solar furnace, thereby opening up a means for efficient conversion ofsunlight into chemical fuels.
1 INTRODUCTION
Zinc and synthesis gas (syngas), besides being impor-tant material commodities, are attractive as energycarriers. Zinc finds applications in Zn/air fuel cells andbatteries, and it can also be reacted with water to formhydrogen. Syngas is the building block of a wide vari-ety of synthetic liquid fuels, including methanol - apromising substitute of gasoline for fuelling cars. How-ever, the current industrial production techniques ofboth zinc and syngas carry severe environmental con-sequences, especially CO2 emissions. These emis-sions can be reduced substantially, by combining boththe production of Zn and syngas and by replacingfossil fuels with concentrated solar energy as thesource of high-temperature process heat. The pro-posed solar combined process, called "SynMet", canbe represented by the overall reaction:
ZnO + CH4 -» Zn + 2H2 + CO (1)The use of solar energy for supplying the enthalpy ofthe reaction upgrades the calorific value of the initialreactants by 39%. Thus, using the SynMet process,solar energy is converted into storable and transport-able chemical fuels.
In recent articles [1-3] we described the process andthe engineering design and testing of a solar chemicalreactor for performing the SynMet process. The solarreactor concept features a gas-particle vortex flowconfined to a windowed cavity-receiver that is exposedto concentrated solar irradiation. A continuous primaryflow of methane was used to carry the particles ofZnO. A secondary flow of methane was also used asan aerodynamic curtain to protect the quartz windowfrom deposition of particles and/or condensablegases. Because of the fluid mechanic characteristicsof this kind of gas-solid vortex reactor, excess meth-ane was used over the stoichiometric ratio [as givenby Eq. (1)]. However, excess methane, or the use ofany other carrier gas that is not participating in thereaction, results in a significant reduction of the energyconversion efficiency. Attempts to reduce the primarycarrying flow to the stoichiometric amount resulted inplugging and sedimentation inside the cavity, whilereducing the secondary protecting flow resulted in Zncondensation on the window.
In the present paper we examine the thermodynamicimplications of non-stoichiometry on the solar energyconversion efficiency. We further describe an original
and simple engineering solution to this problem andpresent experimental results that allowed nearlystoichiometric operation of the SynMet process.
2 THERMODYNAMIC IMPLICATIONS
The capability of a solar cavity-receiver to absorb theincoming solar power is expressed in terms of its ab-sorption efficiency r]absorption, defined as the net energyabsorbed Qnet,absorPtion divided by the solar energy com-ing from the concentrator Qsoiar- For a perfectly insu-lated blackbody cavity-receiver (no convection or con-duction heat losses), it is given by [3,4]
*~-net,absorption -. Ol
I absorption s-~ j-~,(2)
where T is the nominal reactor temperature, / is thenormal beam insolation, C is the mean solar flux con-centration ratio over the cavity's aperture (typically500-10000 for large-scale solar concentrating facili-ties), and 7] is the Stefan-Boltzmann constant.Qnet.absorption is used to heat the reactants ZnO and CH4
to the reactor temperature and for supplying the heatof the reaction.
The solar energy stored at 298 K, TJH298K, is314.9 kJ/mol. Thus, assuming no heat recovery, theoverall solar thermal energy conversion efficiency
i is given by [5]
[ ] (3)
where cp is the specific heat, rjHrxn is the enthalpychange of the reaction at T, and f is the stoichiometricfactor defined as the molar ratio of CH4 to ZnO in thereactants. In Eq. (3) it is assumed that reactants arefed at 298 K and that fe1. Figure 1 shows the variationof r/thermai as a function of f, for various temperatures inthe range 1300 - 1900 K, and for various solar fluxconcentration ratios in the range 3500-10000. As ex-pected, the thermal efficiency is maximum for thestoichiometric molar ratio (/=1), and decreases mono-tonically with increasing stoichiometric factors be-cause a larger portion of the solar energy input is lostin heating excess methane. For example, for a fluxconcentration of 5000 and a reactor temperature of1300 K, rjthermal reaches about 55% when /equals unitybut decreases to about 27.5% for />10, and below10% for />50.

32
Fig. 1: Variation of the solar thermal conversion effi-ciency as a function of the stoichiometric factor forvarious temperatures and solar flux concentrationratios [5].
3 EXPERIMENTALThe continuous injection of CH4 in the primary vortexflow that carries the ZnO particles was substituted by adiscontinuous pulsed feeding of CH4 and an inde-pendent continuous feeding of ZnO. The secondaryflow that protects the window remained unchanged(continuous flow). Figure 2 shows the experimentalset-up. The ZnO powder is continuously fed by a spi-ral-type feeder located at the rear end of the reactorcavity. Short pulses of CH4 are simultaneously injectedthrough a tangential inlet nozzle at the site where theZnO particles fall. The pulse duration and the timeinterval between consecutive pulses are controlled bya programmable logic module.
Fig. 2: Schematic of the reactor set-up. Legend: (1)spiral-type feeder; (2) reactor cavity; (3) primary CH4
inlet; (4) quartz window; (5) secondary CH4 flow forwindow protection.
The new system was first cold-tested. Qualitative flowpattern visualisation revealed the creation of a stableswirling particle cloud that would absorb the incominghigh-flux solar irradiation efficiently and would furthershield and protect the reactor walls. When comparedto earlier experiments under similar conditions butusing a continuous primary gas feeding, the particlecloud obtained for the pulsed gas feeding was muchmore dense and uniformly distributed over the cavityspace. Experiments were also conducted at tempera-tures up to 1400 K with concentrated solar radiation at
the PSI solar furnace. Results are shown in Figure 3for a set of representative experiments that lastedbetween 10 and 20 minutes. In each of these solarruns, a stable operation of the vortex flow wasachieved while keeping the window clean from parti-cles or condensable gases by means of the auxiliaryflow.
The diagonal solid line indicates stoichiometric feedingof CH4 and ZnO at the primary flow, i.e. fprimary=^ • Be-low this line, CH4 is deficient, i.e. fp,imary<\. All datapoints lay in the region fPrimary<\. Thus, a satisfactoryoperation was obtained without the need of workingwith excess methane at the primary flow. Operationunder exact stoichiometric conditions will require anadjustment of the secondary continuous flow that isused for window protection. Experiments aimed atdetermining the fraction of ZnO reduced for variousvalues of f are scheduled for the next measurementcampaign.
IO
£
0 5 10 15mass flow rate of ZnO / g/min
Fig. 3: Measured CH4 mass flow rate as a function ofthe ZnO mass flow rate [5].
4 ACKNOWLEDGEMENT
Financial support by the BFE-Swiss Federal Office ofEnergy and The Baugarten Foundation is gratefullyacknowledged.
5 REFERENCES[1] A. Steinfeld, M. Brack, A. Meier, A. Weidenkaff,
D. Wuillemin, A Solar Chemical Reactor for theCo-Production of Zinc and Synthesis Gas, Energy- The International Journal 23, 803-814 (1998).
[2] A. Steinfeld, A. Frei, P. Kuhn, D. Wuillemin, So-larthermal Production of Zinc and Syngas ViaCombined ZnO-Reduction and CH4-ReformingProcesses, Int. J. of Hydrogen Energy 20 793-804(1995).
[3] A. Steinfeld, C. Larson, R. Palumbo, M. Foley,Thermodynamic Analysis of the Co-Production ofZinc and Synthesis Gas Using Solar ProcessHeat, Energy - The International Journal 21, 205-222(1996).
[4] E. A. Fletcher, R. L. Moen, Hydrogen and Oxygenfrom Water, Science 197, 1050-1056 (1977).
[5] S. Kraupl, A. Steinfeld, Pulsed gas feeding forstoichiometric operation of a gas-solid VortexFlow Solar Chemical Reactor, J. of Solar EnergyEngineering, submitted (2000).

33
DEVELOPMENT OF A SOLAR CHEMICAL REACTOR FOR THE DIRECT THERMALDISSOCIATION OF ZINC OXIDE
S. Moller (DLR, Stuttgart, Germany), R. Palumbo
A solar chemical reactor was designed, constructed and tested for the direct thermal decomposition of zincoxide at temperatures as high as 2250 K using concentrated sunlight which enters through a window. Toavoid the deposition of Zn or ZnO on the window, a curtain of inert gas was realised. Along with the reac-tor, a model was developed to predict the reactor's thermal performance under various solar flux levels.
1 INTRODUCTION
The direct solar thermal decomposition of ZnO to itselements is an attractive process for the storage ofsolar energy [1,2].
At temperatures near 2000 K, the endothermic reac-tion proceeds. Solar radiation is thereby directly con-verted into the chemical energy of Zn and O2. Thesolar energy stored in the condensed Zn phase can beused to split water in an exothermic reaction. Theproducts are hydrogen and ZnO that is recycled to thesolar furnace.
2 THE SOLAR REACTOR
We report on a solar thermal chemical reactor thateffects the dissociation of ZnO with direct solar radia-tion. The reactor concept evolved from several bound-ary conditions that we suggest are essential featuresof an industrial scale reactor with a high exergy effi-ciency [1]. We define this efficiency as
T| = -"ZnO
•100%4 solar
where AG°rxn is the standard Gibbs function for form-ing ZnO(s) at room temperature from its stable ele-ments, fnZn0 is the mass flux of dissociated ZnO,and <jsoiar is the concentrated solar flux.
A schematic of the reactor that meets these conditionsis shown in Figure 1. The reactor chamber (1) is partlyfilled with pressed ZnO powder forming a slope (2)with an inclination of approximately 45 degrees. Thesurface of the slope is directly irradiated by concen-trated solar radiation entering through a quartz window(3). The uppermost ZnO layers are dissociated,whereas the non-reacted ZnO bed serves as insula-tion to protect the reactor walls directly in line with theconcentrated sunlight. At the lower end of the slope(4), the non-reacted ZnO overflow is collected andrecycled. The reactor can be operated both in batchand continuous modes with respect to the ZnO. In thelatter case, solid zinc oxide particles are continuouslyfed into the reactor (5) and ripple down the slope, thusavoiding the need for a carrier gas. The transparentwindow is kept clean by several inert gas streams (6),which prevent zinc vapour from condensing on thequartz window. The gaseous reaction products andthe inert gas flow continuously through the reactor to a
chimney (7) and out to the quench unit.
The experiments were carried out in the solar furnaceat PSI [3].
7 5 _
Fig. 1: Schematic of SLOPE: a solar chemical reactorfor the solar thermal decomposition of ZnO.
3 COMPARISON OF MODEL WITH PRELIMI-NARY EXPERIMENTS
We compared the results of the product gas mass fluxvs. average solar flux from theory and experiments. A1300 K pre-sintered ZnO block was used as the sam-ple. This block was used rather than ZnO powder be-cause the block has a well-defined ZnO surface andmass.
A sensitivity analysis of a theoretical model was done[4]. Figure 2 shows the comparison between experi-mental and calculated mass flux for solar flux density.The experimentally determined mass fluxes are 3 to 6

34
times lower than the calculated numbers dependingon the thermal conductivity.
0,16-
0,14-
0,12-
0,10-
0,08-
0,06-
0,04-
0,02-
0,00-
• Experimental dataModel with k = 0.2 W m1 K'Model with k = 2.0 W m"1 K"'
! I :-Tf
^^^ ' T
\ 1 i Ii i
1,0x10° 1,2x10e 1,4x10e 1,6x10° 1,8x10e 2,0x10e 2,2x10° 2,4x10°
Solar flux density in W m 2
Fig. 2: Comparison between experimental and calcu-lated decomposition mass fluxes depending on solarflux density.
Differences of the magnitude shown in the figure can-not be explained from the sensitivity analysis. Of allthe parameters varied, the one most sensitive to themass flux was the solar flux density. The results sug-gest that one would need an error of 3000 to 4000suns. An error of this magnitude is well beyond theuncertainty in the measured solar flux density.
The model itself or the rate equation are thus the mostlikely sources for differences between calculated andexperimentally determined values of the reaction ve-locity. Several differences exist between the modeland reality.
We suspect that the rate equation describing the de-composition process could be in error. But becausethe ZnO is essentially vaporising, the stated activationenergy is quite reasonable [1]. However, it is not un-common to expect large scatter in reported pre-exponential factors. The scatter could account for thedifferences between the experiments and those givenby the model. Specifically, one must experimentally re-evaluate the magnitude of the pre-exponential factor.
4 THE REACTOR WINDOW
Keeping the window clean is a challenging designaspect for all closed direct heating solar chemicalreactors. In the case of the ZnO decomposition proc-ess, the product gases can flow or diffuse toward thewindow where Zn and/or ZnO may condense or de-posit. The problem may be addressed by developing aprotective curtain of inert gas on the window.
We focused our effort on avoiding pressure sinks andturbulence within the reactor chamber. These con-cepts were followed in our latest design shown in Fig-ure 1. Through a duct with a rectangular cross sectionflows a laminar flow. The principal function of this flowwas to carry the products out of the reactor withoutcreating turbulence. It also served as protection for thewindow. A flow through two nozzles located near thetop portion of the window was to add further protectionat the top half of the window from products. The win-dow stayed mostly clean.
5 CONCLUSION
We are developing a solar chemical reactor that pos-sessed many features of a conceivable industrial scalereactor while at the same time preserving flexibility inthe concept that enables us to experimentally explorea variety of design features.
Our work to keep the window clean was as much artas science. Finally, we clearly define the need to im-prove our understanding of the ZnO decompositionprocess. Our numerical and experimental study pointsto two critical areas for further research: expanding thenumerical model to include mass transfer resistanceto the description of the decomposition process andevaluating the pre-exponential term given in the pub-lished ZnO decomposition rate equation.
6 ACKNOWLEDGEMENT
We gratefully acknowledge the financial support of theSwiss Federal Office of Energy for supporting thiswork at the Paul Scherrer Institute (PSI).
7 REFERENCES
[1] R. Palumbo, J. Lede, O. Boutin, E. Elorza Ricart,A. Steinfeld, S. Moller, A. Weidenkaff, E.A.Fletcher, J. Bielicki, The production of Zn fromZnO in a high-temperature solar decompositionquench process—/ The scientific framework forthe process, Chemical Engineering Science 53,2503-2517(1998).
[2] A. Steinfeld, P. Kuhn, A. Reller, R. Palumbo, J.Murray, Y. Tamaura, Solar-Processed Metals asClean Energy Carriers and Water-Splitters, Int. J.Hydrogen Energy 23, 767-774 (1998).
[3] P. Haueter, T. Seitz, A. Steinfeld, A new high-fluxsolar furnace for high temperature thermo-chemical research, J. Solar Energy Engineering121,77-80(1999).
[4] S. Moller, R. Palumbo, The Development of aSolar Chemical Reactor for the Direct ThermalDissociation of Zinc Oxide, in press.

35
Combustion Research

36
PRELIMINARY INVESTIGATION OF STABILITY AND STRUCTURE OF TURBULENTPREMIXED FLAMES AT ATMOSPHERIC PRESSURE
P. Griebel, K. Herrmann (ETH Zurich), R. Scharen, M. Witt
Experiments in a tubular combustor have been performed to study the stability and structure of leanpremixed natural gas/air flames at atmospheric pressure. Qualitative planar laser induced fluorescence(LIF) of the OH radical was used to detect the flame structure. In this preliminary study the inlettemperature, equivalence ratio, and the velocity of the fuel/air mixture was varied.
1 INTRODUCTION
Lean premixed combustion of gaseous fuels (naturalgas, methane) is a well established technology instationary gas turbines for achieving low NOX
emissions. Although this technique is being used sinceseveral decades the knowledge of the influences ofturbulence on flame structure and NOx-formation isstill unsatisfying. Especially there is a deficiency ofexperimental data at gas turbine relevant conditions(lean mixtures, high temperatures, and highpressures). A lot of studies were performed either atatmospheric pressure or higher pressures, but withnear stoichiometric mixtures [1,2]. Currently, there isno study with the combination of the two. Therefore,the present project was started to study the influenceof turbulence on flame structure and NOX formationunder gas turbine relevant conditions. As a first step,preliminary investigations of the lean blow out limit andthe flame structure have been performed atatmospheric pressure. High pressure experiments willfollow later on with the new combustor test rig. Theinitial tests were performed in a tubular combustor atdifferent inlet temperatures (350, 450, 550 °C), equi-valence ratios (0.4 - 0.6), and velocities (10-45 m/s).
2 EXPERIMENTAL SET-UP
The atmospheric test rig shown in Figure 1 consist ofa water-cooled quadratic casing and a tubularcombustor, which had exactly the same design as theplanned high pressure combustor. To establish astable flame over a wide range of lean equivalenceratios and velocities a backward facing step designwas chosen. The outlet diameter of the uncooledstainless steel combustor head was 25 mm. A quartzglass liner with the inner diameter of 75 mm was usedto achieve an good optical access. About onediameter upstream of the burner outlet, a turbulencegrid was mounted. The combustion air could bepreheated up to 550 °C in an electrical heater. Thefuel, natural gas with the methane content of about 98% per volume, and air stream were measured andcontrolled and afterwards mixed in a static mixerlocated upstream of the combustor head.
In the LIF measurements a laser light sheet wasintroduced through a window and the OH-LIF signalwas detected with an ICCD camera, 90 ° orientated tothe light sheet. The details of the LIF set-up are givenin [3].
T3_CDOooB"to
l
CDo
_Q
EB
CO
fuel/air (premixed)
Fig. 1: Experimental set-up.
3 RESULTS
The flame stability and the lean blow out limits werestudied observing the self luminescence of the flameand the combustion noise. Lean blow out wasachieved by lowering the fuel flow rate at a constantair flow rate (velocity) and inlet temperature. Thecriteria for lean blow out was the extinction of theflame within 1 minute after changing the fuel flow rate.Figure 2 shows the lean blow out and the stabilitylimits at three different inlet temperatures. Themaximum velocity of the premixed fuel/air mixture inthe burner outlet that could be reached withoutextinction of the flame is named critical velocity.
In the region on the right hand side of the stability limitcurves a quiet stable flame does exist. Between thestability and the blow out limit the flame becomesunstable as the equivalence ratio is decreased.

37
Pulsations and local extinction occur and the positionand shape of the time averaged flame front are nolonger constant. These combustion modes are oftenbeing accompanied with enhanced combustion noise.In the region on the left side of the blow out limitextinction of the flame occurs.
area, and therefore an increase of flame areacorresponds to a lower turbulent flame speed. Thisascent of flame area with decreasing equivalence ratiocan be seen in the left column of Figure 3. The singleshot images in the right column show that the flamefront is wrinkled more and more because of thisincrease of flame area.
averaged (2x256 shots) single shot
ID
.QC
60
50
40
0 = 30
| ° 201 101 o
0.35
stability limits
350 f^
lean blow out limits
0.4 0.45 0.5
equivalence ratio
0.55
Fig. 2: Lean blow out and stability limits at threedifferent inlet temperatures.
Up to a certain amount increasing the air flow rate(velocity) at a constant inlet temperature results inbroadening the stability range. Both, the stability andlean blow out, limits are shifted to lower equivalenceratios because the turbulence level is higher at highervelocities, which enhances the heat transfer from therecirculation zone to the flame root. If the velocity isincreased even further the flame would extinguish athigher equivalence ratios because the flame stretcheffect dominates the enhanced heat transfer. Thisbehaviour could not be studied in this experimentsbecause the maximum air flow rate was limited.
If, for a constant velocity, the inlet temperature isincreased, the stability and blow out limits are shiftedto lower equivalence ratios because of the highercombustion temperature.
The results of the OH-LIF measurements are shown inFigure 3. The images show the fluorescence intensitywhich is representative for the relative OH radicalconcentration. The black colour corresponds to a OHconcentration of zero (unburned mixture), the whitecolour with a high OH concentration (reaction zone).The images are not corrected for absorption and for abetter contrast each series is scaled independently.The width of the images correspond to the linerdiameter (75 mm), the length was 80 mm. The loweredge corresponds to xo=64 mm (see also Figure 1).
Decreasing the equivalence ratio by lowering the fuelflow rate at a constant inlet temperature and velocityresults in lower combustion temperatures and for aconstant turbulence intensity therefore in lowerturbulent flame speeds. If the reactant flow rate (airflow rate is constant, fuel flow rate is not constant butmuch smaller than the air flow rate) and the unburnedgas density is constant, the turbulent flame speed isinversely proportional to the time-smoothed flame
a)O =0.45
b)O =0.50
C)O =0.56
d)O =0.63
L A i
Fig. 3: OH-LIF measurements at an inlet temperatureof 450 °C, velocity of 40 m/s and four differentequivalence ratios. Left column shows the averaged,right column the single shot images.
4 ACKNOWLEDGEMENT
The authors would like to thank the Swiss FederalOffice of Energy (BFE) for the financial support.
5 REFERENCES
[1] T. Plessing et al., Ein neuartiger Niedrigdrall-brenner zur Untersuchung turbulenter Vormisch-flammen, VDI Berichte Nr. 1492, 457-462 (1999).
[2] H. Kobayashi et al., Turbulence Measurementsand Observations of Turbulent Premixed Flamesat Elevated Pressures up to 3 MPa, Combustionand Flame 108, 104-117(1997).
[3] K. Herrmann, K. Boulouchos, Visualization of OH-and NO-Distribution in Turbulent PremixedFlames using Laser Induced Fluorescence, 2nd
Meeting of the Combustion Institute (GreekSection), Nov. 26-27(1999).

38
CATALYTIC COMBUSTION OF HYDROGEN-AIR MIXTURES OVER PLATINUM:VALIDATION OF HETERO/HOMOGENEOUS CHEMICAL REACTION SCHEMES
C. Appel, I. Mantzaras, R. Schaeren, R. Bombach, A. Inauen
The applicability of various hetero/homogeneous chemical reaction schemes in channel-flow catalyticcombustion of H2/air mixtures over platinum is investigated numerically and experimentally. Four homoge-neous and three heterogeneous chemical reaction schemes are tested in the numerical model againstmeasured homogeneous ignition characteristics. The difference between predicted and measured homo-geneous ignition distances can be substantial (from 6% to 250%) depending on the particular scheme un-der investigation and this is attributed primarily to the homogeneous reaction pathway. Sensitivity analysisindicates that the origin of the differences among the various schemes is the presence of water in the near-wall region which affects the radical pool buildup during the preignition period.
1 INTRODUCTION
In previous studies [1,2] we investigated experimen-tally and numerically the catalytically stabilized com-bustion (CST) of simple fuels (H2 and CH4) on sup-ported platinum in channel-flow configurations relevantto power generation applications. Of particular interestin the aforementioned studies was the het-ero/homogeneous coupling leading to the onset ofhomogeneous ignition.
In the present work, recently acquired measurementsof H2/air CST are compared against detailed numeri-cal predictions using different hetero/homogeneousreaction schemes. Four well-known homogeneous(gas-phase) and three heterogeneous (catalytic)chemical reaction schemes are investigated with mainobjective to validate their applicability in CST. A par-ticular objective is to identify -via sensitivity analysesand reaction path analyses- the origin of the differ-ences among the various reaction schemes. It isshown that even for a simple fuel such as H2, thereexist substantial differences in the predicted homoge-neous ignition characteristics and that these differ-ences are ascribed primarily to the homogeneousreaction pathway.
2 EXPERIMENTAL
Our rectangular, channel-flow combustor consists oftwo Pt-coated horizontal ceramic plates 300mm long,104mm wide, placed at a distance of 7mm apart (seeRef. 2). Optical accessibility is provided by two quartzwindows positioned at the 300mm x 7mm sides of thecombustor. The incoming H2/air flow is laminar withfuel-to-air equivalence ratios ranging from 0.28 to0.32. The following experiments are performed: PlanarLaser Induced Fluorescence (PLIF) of the OH radicalalong the streamwise plane of symmetry, line (acrossthe 7 mm channel gap) Raman of the major species(H2, O2, N2, H2O) and thermocouple measurements ofthe catalyst surface temperature. The Raman meas-urements yield, in addition to species concentrations,the gas-phase temperature. Typical OH PLIF andline-Raman species concentrations are illustrated inFigure 1 along with the corresponding numerical pre-dictions (to be discussed next).
Experiment (OH-PLIF)
FlowSimulation
50
Trsnsvoisc piofilos x=25mmMole Fractions [-]
— o.o 0.1 0.2E 7.0
100 150 • inun)
0 0 0 500 1000Temperature [K1
Transverse piohlcs. x=105mmrratlioris [-]
0.0 0.1 0.2 —7.0 E
0 600 1200L
Temperature |K]
Fig. 1: Comparison between measurements andpredictions in H2/air channel CST. Inlet velocity1.6m/s, equivalence ratio 0.28. Top: OH distribution.Bottom: transverse Raman data (squares: H2, circles:H2O, triangles: temperature) and predictions (lines).
3 NUMERICAL
Numerical predictions are performed with our 2-Delliptic CFD code, capable of treating elementary het-erogeneous and homogeneous chemical reactionschemes [1,2]. Four homogeneous mechanisms(Warnatz [3 ] , GRI-3.0 [4 ] , Yetter [5] and Miller[6]) and three heterogeneous ones (Warnatz [7 ] ,Schmidt [8] and Kasemo [9]) were investigated.Comparisons between experiments and predictionsusing the Warnatz/Warnatz hetero/homogeneousscheme are illustrated in Figure 1. The OH PLIF datadetermine the homogeneous ignition location and theRaman-measured transverse profiles provide a roughestimate (due to near-wall experimental limitations) ofthe catalytic reaction strength, e.g. mass-transport-limited vs. kinetically controlled reactions. Figure 1indicates a good agreement (within 6%) between pre-dicted and measured homogeneous ignition distanceswith the Warnatz/Warnatz schemes. In Figure 2 pre-dicted gaseous fuel conversions are given for all fourhomogeneous mechanisms and the heterogeneousmechanism of Warnatz. There is substantial differ-

39
ence between predicted and measured ignition dis-tances depending on the particular homogeneousscheme (up to 250% underprediction for the Millerscheme).
H + O2 + M -» HO2 + M (1)
0.00 0.05
Streamwise distance [m]0.10
Fig. 2: Predicted gas-phase H2 conversions for thefour homogeneous reaction mechanisms. The arrowsindicate the onset of homogeneous ignition. Experi-mental conditions as in Figure 1.
To understand the origin of the above differences,sensitivity analysis (SA) was performed for all gasphase mechanisms. Figure 3 presents the five mostimportant reactions in the SA of Warnatz's gas-phasescheme (with Warnatz's heterogeneous scheme).
5 •
6 4 •
o(0
& 2]
' 1.2 ^ ^ H
1 HO2+OH->H2O+O2
^^^^^m H2+OH -> H2O+H
^ ^ ^ ^ ^ HO2+H -> 2OH
O2+H->OH+O
IH+O2+M -> HO2+M
-20 -10 0 10 20 30 40 50% decrease in ignition distance
Fig. 3: Five most sensitive reactions in Warnatz'sgaseous mechanism: bars indicate the percentagechange in homogeneous ignition distance for an in-crease (black) or decrease (gray) of the reaction ratesby a factor of -unless otherwise indicated- two.
These reactions are also the most sensitive ones inthe SA of the other gaseous schemes. The ignitiondifferences of Figure 2 are attributed largely to thepresence of water in the near-wall region (up to 22%per volume in the pre-ignition zone, see Figure 1),produced via the catalytic pathway: the third body effi-ciency of water varies from 6.5 in Warnatz's to 18.6 inMiller's scheme. The two reactions with the greatestsensitivity are the chain terminating and chain branch-ing steps:
O2 + H -> OH + O (2)respectively. The rates of Reaction (1) in the pres-ence of 22% vol. H2O vapor at 1000 K (a temperaturerepresentative of the near-wall gas, see Figure 1) arefor the Yetter and Miller schemes as much as 25%lower than Warnatz's rate. This leads to a faster H-radical buildup in the former two schemes and henceto an earlier ignition.
Different heterogeneous mechanisms were also inves-tigated along with the homogeneous scheme of War-natz. Homogenous ignition is achieved ca. 10% earlierwith Schmidt's and ca. 15% earlier with Kasemo'sscheme (not shown here). Thus, the particular hetero-geneous scheme is not crucial for the determination ofhomogeneous ignition characteristics. Sensitivityanalysis and reaction path analysis were performed toelucidate the key surface reactions affecting homoge-neous ignition. The SA analysis indicates that the H2
adsorption is the most important surface reaction (as itdetermines the near-wall boundary layer profile of H2)followed by the radical (OH, H, and O) adsorption-desorption reactions. All heterogeneous schemesreproduce the H2 boundary layer profile since theirnon-activated hydrogen adsorption rate is -althoughdifferent- faster than the mass transport rate and theradical adsorption/desorption rates are about thesame.
4 REFERENCES
[1] J. Mantzaras, C. Appel, P. Benz and U. Dogwiler,Catalysis Today 59:3-17 (2000).
[2] U. Dogwiler, J. Mantzaras, P. Benz, B. Kaeppeli,R. Bombach and A. Arnold, Proc. Combustion In-stitute, Pittsburgh, 2275-2282 (1998).
[3] J. Warnatz, Technische Verbrennung, Springer-Verlag, 102(1993).
[4] Gas Research Institute (GRI), http://www.me.berkeley.edu/ gri_mech .
[5] M.A. Mueller, T.J. Kim, R.A. Yetter and F.L.Dryer, Int. Journal Chem. Kinetics 31:113-125(1999).
[6] J.A. Miller and C.T. Bowman, Prog. Energy Com-bust. Sc/. 15:287-338 (1989).
[7] O. Deutschmann, R. Schmidt, F. Behrendt and J.Warnatz, Proc. Combustion Institute, Pittsburgh,1747-1754(1996).
[8] D.A. Hickman and L.D. Schmidt, AlChE 39, 7:1164-1177(1993).
[9] E. Fridell, A. Rosen and B. Kasemo, Langmuir10:699-708(1994).

40
LASER INDUCED FLUORESCENCE OF HOT OXYGEN IN PARTIALLY PREMIXEDMETHANE FLAMES
R. Bombach, A. Inauen
Planar laser induced fluorescence (PLIF) has been applied to fuel rich and fuel lean methane/air flame todetect zones of hot oxygen. Experiments show that in the case of fuel rich flames, hot oxygen PLIF revealsstructures not observable by other single-species LIF methods.
1 INTRODUCTION
In general, to localise flame zones, and therewithflame structure, some transient species is looked at.Examples are the CH, the CHO, or the OH radical,among others. This makes perfect sense becausethese species are part of the chemical reaction pathsin flame chemistry. In this work we want to show thatimaging of stable species is not only possible withstandard laser induced fluorescence (LIF) methodsbut that it reveals structures not observable by minorityspecies LIF, too.
This work addresses imaging of oxygen molecules inflames. The 0-0 band of the oxygen Schumann-Rungebands is not accessible with standard dye laser sys-tems. As atmospheric oxygen would absorb this radia-tion it would be of no practical value in flame researchanyway. However, several hot bands of the transitioncan be excited near 226 nm, namely the 0-3, the 4-5,and the 2-4 bands. (The bands are labelled v'-v" bytheir vibrational quantum number in the excited state,v', and in the ground state, v", respectively). Thismakes possible to observe hot oxygen by planar laserinduced fluorescence.
2 EXPERIMENTAL
The experimental set-up has been described in detailelsewhere [1]. In short, a Nd:YAG pumped dye laserequipped with frequency mixing-after-doubling facili-ties provides the UV excitation beam. By tuning thedye laser around 580 nm, and mixing the frequencydoubled dye laser beam with the YAG fundamental of1064 nm, wavelengths around 226 nm are createdwhich are used to selectively excite one, or more, ofvarious species, i.e. NO, O2, CO, and O atoms [2].Note that O atoms and the CO molecule can be ex-cited only by a two photon process. This renders thesespecies less suited for quantitative experiments, espe-cially at high pressures.
The fluorescence signal is detected after appropriatefiltering with an intensified camera. The NO PLIF dataare not shown here because they do not exhibit anyunexpected results. The detection system has not tobe altered for NO observation because the fluores-cence occurs in the same wavelength range.
3 RESULTS
Figure 1 shows the distribution of hot oxygen in a par-tially premixed flame. The two separate parts of theflame are clearly discernible. The inner feature corre-sponds to a zone just before the flame.
Fig. 1: PLIF signal of hot oxygen in a fuel rich(A,=0.64) methane/air flame at 2 bar.
There the oxygen gets hot and can be detected.Shortly afterwards it will be used up completely by thefuel rich flame. The second outer feature correspon-dents to oxygen approaching the diffusion flame. Notethat an OH PLIF image of this flame would only revealfeatures outside a X<1 region [1]. Within fuel rich re-gions OH is consumed by the reactants, therefore theinner feature of Figure 1 would remain invisible in OHPLIF. The asymmetric shape of the fluorescence im-age is explained elsewhere [3].
At elevated pressures turbulence sets in. In this re-gime single shot capability is mandatory.
Fig. 2: PLIF signal of hot oxygen in a fuel rich(A,=0.68) methane/air flame at 15 bar. The figure to theleft shows a single shot image, the figure to the rightshows an average of 200 laser shots.

41
Figure 2 shows an image of the hot oxygen moleculesat 15 bar. At even higher pressures the effect getsmore pronounced as can be seen in Figure 3:
Fig. 3: PLIF signal of hot oxygen in a fuel rich(?i=0.73) methane/air flame at 25 bar. The left figure isa single shot image, the right figure is an average of200 images.
Fig. 4: Hot oxygen averaged PLIF images in stoi-chiometric (left figure) and fuel lean (right figure,1=1.10) methane air flames.
Note the abrupt change of the picture when going tofuel lean conditions (A>1, see Figure 4). Now excessoxygen exists throughout and after the flame.
4 SUMMARY
Molecular oxygen hot band PLIF has been success-fully applied to a high pressure methane air flame. ThePLIF images reveal flame structure features not ob-servable with other single species PLIF techniques.The signal strength was large enough to record singleshot images with very good signal-to-noise ratio, amandatory prerequisite to study turbulence in flames.
When going from fuel rich to fuel lean flames a sud-den change in PLIF image appearance occurs atX=1.0. Oxygen LIF is therefore an interesting addi-tional method especially when studying the structureof turbulent lean low NOX flames.
5 ACKNOWLEDGEMENT
We would like to thank the Swiss Federal Office ofEnergy (BFE) for financial support of this work.
6 REFERENCES
[1] R. Bombach, B. Kappeli, Simultaneous visualisa-tion of transient species in flames by planar-laser-induced fluorescence using a single laser system,Appl. Phys. B 68, 251-255 (1999).
[2] U, Westblom, M. Alden, Simultaneous multiplespecies detection in a flame using laser-inducedfluorescence, Appl. Opt. 29, 4844-4851 (1990).
[3] A. Arnold, R. Bombach, B. Kappeli, A. Schlegel,Quantitative Measurements of OH ConcentrationFields by Two-dimensional Laser-induced Fluo-rescence, Appl. Phys. B 64, 579-583 (1997).

42
INVESTIGATION OF THERMOACOUSTIC PHENOMENA IN A GAS TURBINEBURNER BY LASER-INDUCED FLUORESCENCE
A. Inauen, R. Bombach, W. Hubschmid, A. Stampanoni-Panariello
Laser-induced fluorescence of the hydroxyl radical (OH) was used to visualise the turbulent flame fronts inthe second combustion chamber of a full-scale gas turbine burner operated at atmospheric pressure. Ace-tone was evaluated as a tracer for the determination of the fuel/air mixing quality at the exit of the mixingtube.
1 INTRODUCTION
Thermoacoustic phenomena are a major concern ofgas turbine manufacturers. The pressure fluctuationsinvolved lead to increased pollutant (i.e. NOx) forma-tion due to inhomogeneous temperature distributions.Furthermore, they can cause severe mechanicalstress decreasing the lifetime of the combustors con-siderably. Therefore, several techniques were devel-oped for active control of these combustion instabili-ties. [1-3] Most of them base on acoustic excitationinside the combustion chamber or on fast actuatorsregulating either the main fuel injection or a pulsedinjection of additional secondary fuel. Both methodsare rather expensive as well as prone to break down.
On the other hand, passive methods, e.g. adaption ofthe burner geometry, require better understanding ofthe influence of combustion instabilities on the fuel/airmixing [4] and, hence, on the flame shape. In thisproject we tackle the thermoacoustic phenomena us-ing laser-induced fluorescence (LIF) of the hydroxylradical (OH) for the determination of the turbulentflame shapes, and tracer LIF for monitoring the fuel/airmixing quality. There is a large number of publications[e.g. 5-10, to mention just a few] reporting the suitabil-ity of acetone as a tracer molecule in combustion envi-ronments. Excitation wavelengths varied between248 nm and 355 nm.
2 EXPERIMENTAL
Figure 1 depicts the set-up of the experiments. Thefrequency-doubled output of a Nd:YAG/dye laser sys-tem (Quantel YG781C-20/TDL50) served as an excita-tion source for both OH and tracer LIF. The laserwavelength was tuned to the P2(7) line of the OH radi-cal near 285 nm. Typical pulse energies were around2 mJ. A combination of spherical and cylindricallenses was used to form a slightly divergent laser lightsheet approximately 7 cm wide and 500 (im thick.Using an intensified CCD camera the induced fluores-cence was detected through a band-pass filter at310 + 10nm. Due to the limited optical access thedetection occured at arbitrary angles.
In a first measuring campaign we evaluated the us-ability of acetone as a tracer molecule for monitoringthe fuel/air mixing quality. Acetone is a broad-bandabsorber, allowing the use of the same wavelengthregion as for the OH LIF. Acetone fluorescence caneasily be distinguished from the OH signal by tuningthe dye laser off the narrow-band OH line.
Quartz . .windows LJ
l\Mirror '
ICCD camera
2nd stage::vi
mixing chamber
Test rig
, hot air' flow
Laser system
Fig. 1 : Schematic set-up (top view) of the OH andtracer LIF experiments.
3 RESULTS
Passive chemiluminescence images as well as LIFimages summed over a number of laser shots bothshow a typical V-shaped flame form. This picturechanges when applying single-shot 2-D LIF (cf. Fig-ure 2). The images exhibit a strongly turbulent flameshape. Islands are formed where combustion takesplace, separated by non-reacting zones. This results innon-contiguous flame fronts, giving rise to inhomoge-neous heat release and, thus, to thermoacoustic phe-nomena.
Fig. 2: Single-shot LIF imaging of the hydroxyl radi-cal. The straight lines depict the position and size ofthe laser light sheet, the dotted lines depict the tempo-rally averaged form and position of the flame front.The fuel/air flow is from right to left.

43
The hot air enters the second combustion chamber attemperatures of 1100 K or above. At these tempera-tures the auto-ignition delay of acetone is rather low,leading to considerable degradation of the tracermolecules before they enter the combustion zone. Theresulting decrease of the fluorescence signal proves tobe a major problem for single-shot imaging using ace-tone at this high temperatures. Therefore, other tracersubstances will be tested which exhibit longer auto-ignition delays.
4 ACKNOWLEDGEMENT
We gratefully acknowledge financial support of theSwiss Federal Office of Energy (BFE). For the con-struction and operation of the gas turbine combustorwe thank the team of Dr. CO. Paschereit at theAlstom Research Centre in Baden-Dattwil.
5 REFERENCES
[1] O. Delabroy, F. Lacas, T. Poinsot, S. Candel,T. Hoffmann, J. Hermann, S. Gleis, D. Vortmeyer,A study of NOx reduction by acoustic excitation ina liquid fuelled burner, Combust. Sci. Technol.119,397-408(1996).
[2] CO. Paschereit, W. Polifke, Investigation of thethermoacoustic characteristics of a lean premixedgas turbine burner, ASME Turbo Expo '98,Stockholm, Sweden, June 2-5 1998, ASME Pa-per 98-GT582.
[3] CO. Paschereit, E. Gutmark, W. Weisenstein,Structure and control of thermoacoustic insta-bilities in a gas-turbine combustor, Combust. Sci.Technol. 138, 213-232(1998).
[4] CO. Paschereit, E. Gutmark, W. Weisenstein,Coherent structures in swirling flows and theirrole in acoustic combustion control, Physics ofFluids 11, 2667-2678 (1999).
[5] F. Ossler, M. Alden, Measurements of pico-second laser induced fluorescence from gasphase 3-pentanone and acetone: Implications tocombustion diagnostics, Appl. Phys. B 64, 493-502(1997).
[6] H. Tamura, T. Sakurai, H. Tai, Simultaneouslaser-induced fluorescence imaging of unburntand reacting areas in combustion fields using aKrFexcimer laser, Opt. Rev. 5, 119-123 (1998).
[7] H. Neij, A. Saitzkoff, R. Reinmann, A. Franke,M. Alden, Application of two-dimensional laser-induced fuel tracer fluorescence for ion currentevaluation, Combust. Sci. Technol. 140, 295-314(1998).
[8] T. Fujikawa, Y. Hattori, M. Koike, K. Akihama,T. Kobayashi, S. Matsushita, Quantitative 2-D fueldistribution measurements in a direct-injectiongasoline engine using laser-induced fluorescencetechnique, JSME Int. J.-Series B-FluidsTherm. Eng. 42, 760-767 (1999).
[9] M.C Thurber, R.K. Hanson, Pressure and com-position dependences of acetone laser-inducedfluorescence with excitation at 248, 266, and308 nm, Appl. Phys. B 69, 229-240 (1999).
[10] M. Tamura, T. Sakurai, H. Tai, Visualization ofcrevice flow in an engine using laser-inducedfluorescence, Opt. Rev. 7, 170-176 (2000).

44
DETERMINATION OF THE HYPERFINE STRUCTURE SPLITTING OF NO A2S+ (v'=0)BY DOUBLE RESONANCE POLARIZATION SPECTROSCOPY
B. Hemmerling, A. Stampanoni, E.F. McCormack (Bryn Mawr College, USA)
We employed time-resolved double resonance polarization spectroscopy to monitor the temporal evolutionof a coherent superposition of molecular hyperfine states created by a short laser pulse. The observedquantum beats are sensitive to the polarization of pump and probe beam.
1 INTRODUCTION
A sufficiently short laser pulse can create in an atomor a molecule a non-stationary state that may be de-scribed as a coherent superposition of stationary ei-genstates. Investigated by a time-resolved spectro-scopic technique this superposition of states results inintensity modulations of the signal at frequencies cor-responding to the energy spacing between thesestates, generating so-called quantum beats. Whilethere are highly sophisticated laser systems and tech-niques needed to obtain good spectral resolution inthe frequency domain, quantum-beat spectroscopyallows for Doppler-free high-resolution spectroscopicinvestigations employing relatively simple, pulsed lasersources. For more than thirty years quantum-beatspectroscopy has provided a wealth of information on,for example, fine and hyperfine splitting of atomic andmolecular states.
We report to our knowledge for the first time on theuse of temporally resolved double resonance polariza-tion spectroscopy to investigate hyperfine structurequantum beats. Compared to conventionally usedlaser-induced fluorescence this technique is back-ground-free and no requirement to fluoresce isneeded. Furthermore, two resonances offer a higherstate selectivity, and the coherent nature of themethod is responsible for the higher contrast of theobserved quantum beats.
2 EXPERIMENTAL METHOD
Demtroder [1], for example, gives a detailed descrip-tion of double resonance polarization spectroscopyand so only a brief summary will be given here. Theoutput of a Nd:YAG-pumped dye laser is frequencydoubled and sum-frequency mixed with residualNd:YAG fundamental to obtain light at about 226 nmused to pump individual rotational states of the A2Z+,v'=0 <— X2n1/2, v"=0 band in NO. An Ar+-laser pumpedcw dye laser, operating near 600 nm with a bandwidthof about 0.27 cm1 , was employed to probe E2I+, v*=0<— A2I+, v'=0 transitions. The linearly polarized probebeam traverses opposite to the propagation directionof the pump beam through a parallel oriented polar-izer, a gas cell, typically filled with 104 bar of NO, andis blocked by a second polarizer that is crossed withrespect to the first one. The pump beam is either line-arly polarized at an angle of 45 ° with respect to thepolarization of the probe beam or circularly polarizedand crosses the probe beam at a small angle withinthe cell. Tuned to an atomic or a molecular transition,the pump beam creates a non-uniform population ofthe magnetic sublevels in ground and excited states,
respectively. If the transition induced by the probebeam shares a common level with the pump beamthis laser-induced anisotropy is experienced by theprobe beam as dichroism and birefringence and in-creases the transmission of the probe beam throughthe crossed polarizer. Pump and probe lasers areoperated with Rhodamine 6G. Under operating condi-tions the pulses produced by the pump laser are 8 nslong, having 1 mJ energy and about 0.1 cnrr1 band-width. Thereby the transitions of the A2I+, v'=0 <—X2ni /2, v"=0 band are strongly saturated. Laser-induced fluorescence is detected additionally to en-sure that the pump laser is properly tuned to a transi-tion. The power of the probe laser is about 10 mW. ABurleigh wave meter is used to measure its wave-length. The signal is detected by a photomultiplier andacquired by a digital oscilloscope with a full bandwidthof 500 MHz and a 2 GHz sampling rate.
3 RESULTS AND DISCUSSION
The A2Z+, v'=0 <— X2n1/2 ,v"=0 band of NO comprisestwelve rotational branches. We obtained temporallyresolved double resonance polarization spectra for allof them. The spectroscopic notation of the rotationaltransitions is given by AN AJy , where AN and AJ de-note the change of the angular momentum of nuclearrotation and the total angular momentum (N+S), re-spectively. Depending on the orientation of the totalelectron spin, S=1/2, there are two fine components(F1 with J=N+1/2, and F2 with J=N-1/2). They areindicated by the two indices i,j. Fine splitting of rota-tional levels increases linearly with N'. Rotational tran-sitions with N'<10 that differ only by the fine splitting ofthe A-state are excited simultaneously by the pumplaser and are excluded from the analysis.
The nuclear spin of 14N (1=1) causes the hyperfinestructure of NO. In the double resonance scheme,employed in this work, three molecular states are cou-pled with each other. The related quantum beats,however, are state selective in that the characteristicfrequencies are determined by the hyperfine structureof only the common state. Therefore, the stepwiseexcitation scheme exclusively produces quantumbeats corresponding to the energy separations be-tween hyperfine levels in the intermediate state.
Figure 1 shows, averaged over 100 single shots, thetemporal behaviour of the double resonance polariza-tion signal observed after pumping the RR22(7) line ofthe A 2 I + , v'=0 <- X2n1/2, v"=0 band and probing theR(8) line of the E2I+, v*=0 <- A 2 I + , v'=0 band. Solelyfitting the exponential decay of the signal one obtains

45
the time constant x=110 ns. Due to the coherent na-ture of the signal its decay time is half as long as theradiative lifetime of the A2I+, v'=0 state (-217 ns). Thedashed line in Figure 1 depicts the residual of meas-ured signal and exponential fit and reveals clearly themodulation by hyperfine structure quantum beats.Displayed in the inset is the second derivative of thepower spectrum of the residual of measurement andexponential fit. The decay time of the signal sets alower limit to the line width of the peak in the powerspectrum and therefore to the accuracy of the fre-quency determination. However, by fitting the peakone can determine the oscillation frequency with accu-racy better than 1 MHz.
1.0 •
0.8 •
0.6 •
0.4 •
0.2 •
A 1.0 •\ Cfi
\ § 0.5\ S
\ «\ » o.o •
\ 3
\ I'0-5\ 3
\ (
V
\
11/20 40 60 81
frequency / MHz
^
0.0 0.1 0.2 0.3
time / jis
0.4 0.5
Fig. 1: Temporal evolution of the double resonancepolarization signal obtained after pumping the RR22(7)and probing the R(8) transitions of NO. The insetshows the second derivative of the power spectrum ofthe difference between measurement and fit displayedby the dashed line.
The modulation depth of the double resonance polari-zation signal due to hyperfine structure quantum beatsdecreases with increasing rotational quantum numberand is larger for linearly polarized light than for circu-larly polarized pump light. Compiled in Figure 2 are thequantum beat frequencies of low-lying rotational states(N'<9) of the two fine components of the A 2 I + , v'=0state. Two distinct frequencies (F1=J+1 <- F2=J,F2=J <- F3=J-1), shown by squares and triangles, areobserved for the F1 fine component (see Figure 2a).The open and filled symbols indicate measurementswith linearly and circularly polarized pump beam, re-spectively. In the F2 fine component (see Figure 2b)the two frequencies become indistinguishable for rota-tional states N'>3. Comparing the results of p P i r andsR21-branch with those obtained for °P12- and RR22-branch, respectively, we estimate an error of 0.25 MHzfor the measured quantum beat frequencies.
There is no obvious reason for the discrepancy be-tween the measurements carried out with linearly andcircularly polarized pump beam. However, due to theunpaired electron spin NO is very susceptible to mag-netic fields. Therefore, small residual fields like forexample the earth's magnetic field might be able tocause such a difference in the measured separation ofthe energy states. Before we can fit the observedquantum beat frequencies to the Hamiltonian to obtainthe hyperfine constants of the A2I+, v'=0 state furtherexperiments have to be performed to investigate theinfluence of the Zeeman effect on the hyperfine struc-ture of NO.
N'
Fig. 2: Summary of the measured quantum beat fre-quencies (squares and triangles) of (a) the F1 finecomponent and (b) the F2 fine component. Filledsymbols - linear, open symbols - circular polarizationof the pump beam.
4 ACKNOWLEDGEMENT
We gratefully acknowledged financial support by theSwiss Federal Office of Energy (BFE).
5 REFERENCES
[1] W. Demtroder, Laser Spectroscopy, SpringerVerlag, Berlin (1996).

46
SIMULTANEOUS MEASUREMENTS OF TEMPERATURE AND FLOW VELOCITY US-ING LASER-INDUCED ELECTROSTRICTIVE GRATINGS
D.N. Kozlov, B. Hemmerling, A. Stampanoni-Panariello
Light scattering from laser-induced electrostrictive gratings has been used for simultaneous, instantane-ous, non-intrusive, and remote measurements of temperature and velocity in a submerged air jet. We ac-complished phase sensitive detection of the scattered light by superimposing two signal beams whosefrequencies are Doppler shifted by the movement of the grating. Temperatures in the range 295-600 K andflow velocities in the range 10-100 m/s were measured.
1 INTRODUCTION
Temperature and velocity are key parameters to char-acterize reacting gas flows. While there is a wide vari-ety of techniques available to determine any of thesevalues, there are relatively few attempts of simultane-ous measurements. Recently, laser-induced grat-ings (LIGs) - the regular spatial modulations of therefractive index of the medium - have been proposedin a few groups for measurements of either tempera-tures or flow velocities [1-7]. The present work wasaimed to study the possibilities to apply the techniqueof electrostrictive LIGs for simultaneous non-intrusiveand remote measurements of temperature and veloci-ties in gas flows.
Electrostrictive LIGs are created by the acousticwaves, non-resonantly generated in the region of inter-ference of two excitation laser beams (with wave-length XE and wave vectors kE1 and kE2) that intersecteach other in a medium at an angle 9. The acousticwavelength is defined by the fringe spacing of theinterference pattern: A = ^E/2sin((9/2) = 2^/|q|, withq = kE1 — kE2, the acoustic frequency depends on Aand the adiabatic sound velocity vs: Q = 2T IV S /A ,
while the damping time constant is determined bydynamic viscosity and heat conduction and scales asA2 [8]. The acoustic waves propagate in opposite di-rections, q and -q, normal to the planes of the fringes.In a standard LIG detection technique a read-out laserbeam (wavelength XR) is coherently scattered by thegrating to a signal beam at the Bragg angle to thefringe plane, radiation of a cw laser being used to fol-low the temporal evolution of the scattered light power.In the present approach, after passing through theprobe volume the read-out beam is retro-reflectedthus forming the second read-out beam. As a result,there appear two signal beams leaving the interactionvolume in opposite directions, and one beam is thenreflected back, to make it co-propagating with theother one. Both signal beams are coherent to eachother, have comparable amplitudes, are spatially over-lapped, and therefore fulfill the requirements for het-erodyne detection. Caused by movement of the grat-ing with the flow, they are frequency shifted due to theDoppler effect, the shift having the opposite sign forthe two beams. The detector signal can be expressedas Ps(t)°c[i + m-cos(Qmt + \|/)]sin2Qt-exp(-2t/Ta),where Qm =2|qv| = 2(v/vS0)b0 is the modulation fre-quency of the signal determined by the velocity of theflow v, m is the modulation coefficient, and \\i accountsfor the phase shift experienced by the two signal
beams, subscript 0 refering to the reference condition(room temperature To = 295 K). At the same time, asthe signal oscillation frequency Q is defined at theknown fringe spacing, the sound velocity in the me-dium can be deduced, that is directly related to gastemperature T at the given gas composition [3].
2 EXPERIMENTAL
The fundamental output of a pulsed Nd:YAG laser(?iE = 1064 nm, energy ~ 150 mJ, pulse length 8 ns,spectral bandwidth 1 cm"1) has been used in a stan-dard experimental arrangement [7] to create electro-strictive LIGs. The pump beams were focused with alens (f = 1000 mm) to a spot with the diameter2w0 ~ 300 (im, resulting in an effective grating thick-ness of about 10 mm. The grating was read out by twocounter-propagating beams furnished by a cw Ar+-laser (kR = 514.5 nm, 200 mW), that were focused intothe probe volume (f = 1000 mm). The overlappedsignal beams were spatially filtered and detected usinga photomultiplier. The time-resolved acquisition of thesignal was performed by a digitizer (500 MHz band-width, 2 GHz sampling rate).
3 RESULTS
All measurements were performed in submergedheated air jets at atmospheric pressure in the exitplane of a slot nozzle with an overall length of 20 mm
time |xs
Fig. 1: Temporal evolution of the LIG signal atTth = 380 K and a flow rate of 80 l/min.
and an opening 1.5 mm high and 22 mm wide. Walland gas temperatures were measured by thermocou-

47
pies. Measurements have been carried out for gastemperature range 295 K-600 K and various flow ratesQ = 20-200 l/min. The average flow velocity at the exitof the nozzle was related to the flow rate via the equa-tion of continuity.
0.10-
0.08-
0.06-
0.04-
0.02-
0.00-
A/ \
• / \ T°/ \ Tmean
/ \ a
/ \
a
= 295K
= 296.7 K
= 1.8K
temperature / K
0.14-
0.12 •
0.10 •
0.08 •
0.06 •
0.04-
0.02-
/ \/ \
/ \ vmean = 59.0 ms"1
\ o =2.5 ms"1
\
\
vflow velocity / ms
Fig. 2: Normalized histogram of 300 simultaneoussingle-shot measurements of temperature (a) and flowvelocity (b) in a submerged air jet.
From the temporal evolution of the signal acquired inair without flow at room temperature the angular fre-quency Qo = 93.3+0.3 MHz of the acoustic wave isdeduced, corresponding to a fringe spacingA = 23.19±0.07 |im. The upper trace in Figure 1shows the temporal evolution of the signal recorded ina heated air flow at the nozzle exit and averaged over30 laser shots. The low-frequency modulation, result-ing from the Doppler shift of the frequencies of the twosignal beams, is clearly observed. The lower tracedepicts the difference between the measured signaland the best fit. The flow temperature in the probevolume, Tth = 380 K, was measured by a thermocou-ple, and the averaged flow velocity vQ = 52.8 m/s wasderived from the measured flow rate Q = 80 l/min andTth. The best fit gives Q = 107.3+0.3 MHz and thebeating frequency Qm = 49.0+0.3 MHz. Assuming thatair composition and specific heat ratio are unchanged,the temperature T = 389.6±3 K can be deduced from
Q. The flow velocity v = 89.8+0.6 m/s is determined bythe beating frequency Qm Systematic measurementsfor various air flow rates Q = 20-200 l/min at T = 295 Kshow a linear relationship between the flow velocity, v,and the averaged flow velocity, vQ: v = 1.5 • vQ, Tem-perature measurements in the range 300-600 K usinga thermocouple and the LIG method agree within theestimated errors. Simultaneous single-shot measure-ments of flow velocity and temperature have beenperformed in an air flow at T = 295 K andvQ = 41.0 m/s (Q = 80 l/min). In Figure 2 about 300temperatures and flow velocities are compiled in nor-malized histograms with bin widths of 0.5 K and 1 m/s,respectively. A correlation coefficient > 0.94 indicatesthat a normalized Gaussian (the solid line) well de-scribes the measured distributions. The mean valuesof 59.0+2.5 m/s and 296.7+1.8 K result from themeasurements.
The spatial resolution of the LIG technique along theprobe volume is estimated to be about 10 mm, thatresults in a spatial averaging of measured values. Forhigher spatial resolution and higher sensitivity of thevelocity measurement the angle between the read-outbeam and the velocity vector should be as small aspossible that results in a smaller acoustic wavelength,A, and hence in a strong reduction of the decay timeof the grating (~ A2). High temperature and turbulenceshorten the lifetime of the grating as well. The signallifetime, however, sets a lower limit to flow velocity andtemperature that can be measured accurately. Thus,the proposed method is of the most value for flows ofrelatively low temperature, low degree of turbulenceand high speed.
4 ACKNOWLEDGEMENT
Financial support of the BFE is gratefully acknowl-edged.
5 REFERENCES
[1] S. Williams, LA. Rahn, P.H. Paul, J.W. Forsman,R.N. Zare, Opt. Lett. 19, 1681-1683 (1994).
[2] D.J.W. Walker, R.B. Williams, P. Ewart, Opt. Lett.23, 1316-1318(1998).
[3] A. Stampanoni-Panariello, B. Hemmerling, W.Hubschmid, Appl. Phys. B67, 125-130 (1998).
[4] R.C. Hart, R.J. Balla, G.C. Herring, Appl. Opt. 38,577-584(1999).
[5] S. Schlamp, E.B. Cummings, H. G. Hornung,Appl. Opt. 38, 5724-5738 (1999).
[6] S. Schlamp, E.B. Cummings, Th. H. Sobota, Opt.Lett. 25, 224-226 (2000).
[7] D.N. Kozlov, B. Hemmerling, A. Stampanoni-Panariello, Appl. Phys. B71, 585-591 (2000).
[8] W. Hubschmid, B. Hemmerling, A. Stampanoni-Panariello, J. Opt. Soc. Am. B12, 1850-1854(1995).

48
TEMPORAL EVOLUTION OF THERMAL LASER-INDUCED GRATINGS
W. Hubschmid
The thermal evolution of thermal laser-induced gratings is calculated for the case of three subsequent relaxationprocesses, where the first process is considered to be instantaneous. The application of the analysis to thermalgratings in mixtures of oxygen with other gases is discussed.
1 INTRODUCTION
The technique of laser-induced grating spectroscopy(LIGS) uses crossed beams of a pulsed laser, whichgenerate a spatially periodic and transient electro-magnetic field in their overlap volume. A populationgrating is generated by tuning the laser frequency toan absorption line of the medium in the beam overlapvolume. By radiationless collision-induced moleculartransitions, heat is released and also a thermal densitygrating (or short: thermal grating) is generated. Inaddition to the thermal and population grating, spa-tially periodic field intensity generates also an electro-strictive grating [1] in nonabsorptive as well as absorp-tive media. It arises from the density change in themedium caused by the electrostatic force of a spatiallyinhomogeneous electric field. In the case of a mediumtransparent at the laser frequency, a pure electrostric-tive grating is generated.
The time-resolved grating diffraction efficiency ismeasured by diffracting a beam of a cw-laser at thelaser-induced grating and measuring the power of thediffracted laser light. Time-resolved LIGS is appropri-ate to study heat releases on time scales up to micro-seconds. The upper limit of a few microseconds isdetermined by the rate of the molecular diffusion bywhich the population grating decays.
In this article, we review general properties of thetemporal evolution of thermal gratings. We considerthe case that the relaxation in the medium, after beingexcited by the laser beams, passes through threesubsequent steps. It is shown how the various relaxa-tion steps can partially be discriminated by the analy-sis of the temporal evolution of the grating reflectivity.As an example, we discuss the grating formation inmixtures of oxygen with other gases [2].
2 THERMAL GRATINGS FOR A CHAIN OF RE-LAXATION PROCESSES
In the model under consideration, the first relaxationstep is assumed to be instantaneous, whereas the twosubsequent steps are slow. The heat release of thefirst slow relaxation ("mother" process) is assumed tohave the form
Q1exf = 2£
(1)The heat release of the "daughter" slow relaxationprocess has the form
(2)
The decay of the population grating by mass diffusionis taken into account by an exponential function withdecay constant tf. The quantities Q are ratios of theenergies released in the relaxation step consideredand the total absorbed radiation energy. Further quan-tities in Eqs. (1,2) are: The grating vector q, the refrac-tive index n, the optical absorption coefficient a, theamplitude A of the electric field of the laser providingthe grating generation beams, and the Heaviside stepfunction 0. For simplicity, the duration of the laserpulse is considered being infinitely short (at the timet=t0) and the overlap volume of the beams beinginfinite in space.
The heat releases from the instantaneous and the twoslow relaxation processes are inserted as sourceterms in the linearized fluid dynamics equations [3]that govern the temporal development of density andtemperature. For the variation p' = p-p0 of the den-sity from the equilibrium value one finds in lowest or-der of the dissipation constants the solution
q_
Here the quantities B\ were introduced:
e0 := £0A£0yacos{qx)Q(t-t0)
(3)
(4)
cos(qx)Q{t-t0)
The instantaneous relaxation process gives rise to thecosine term in (3). The subsequent slow relaxationproceses contribute only in higher order of the dissipa-tion constants to oscillatory terms.
We recall here that we assumed that the laser-induced grating is infinitely extended. In a spatially

49
finite grating, the sound waves forming the thermaland the electrostrictive grating propagate out of theirsuperposition region. This causes a decay of the oscil-latory part of the grating diffraction efficiency, whichadds to the decay from dissipation. For focussed laserbeams, this effect may be large and should be takeninto account in the data analysis.
We consider now the p' -amplitude for a small value oft-t0. Neglecting the oscillation terms, we obtain fromEq. (3) up to linear order in t-t0 the following expressionfor ff:
(5)
The diffraction efficiency of the grating is, up to thecontribution from the population grating, proportionalto p'2. From (5) we get the time dependence of p'2 tothe same order:
(6)
Equation (6) states that the decay of the grating fromfast heat release (with decay constant 2/?2) is cor-rected for small t — t0 by a term proportional to theparameter A.& of the mother slow relaxation process.
The daughter slow relaxation process appears in low-est order of f - fo with a quadratic term (in [2] there is asign error):
(7)
The expansion in the time t-t0, Eqs. (5-7) above,gives a general insight in the effect of the slow heatreleases, which a direct machine analysis does notprovide.
3 THERMAL GRATINGS IN OXYGEN GAS MIX-TURES
The relations given above are used for the data analy-sis of experiments in gas mixtures containing O2 [2].By light of an optical parametric oscillator (at a wave-length of about 760 nm), the O2 molecules were ex-cited via transitions of the branches RR, RQ (i.e.AK = +1), PP, and PQ (i.e. AK = -1) to the metastable&'S^(v' = 0) state. In the notation AKAJ, K representsthe rotational angular momentum and J the total angu-lar momentum quantum number.
The fastest heat release within a few ns originatesfrom the thermalization of the O2 molecules in theupper and lower state with respect to the rotationallevels. The relative strength of the electrostrictive grat-ing and the thermal grating from this relaxation deter-
mines the oscillation phase of the grating diffractionefficiency, see Eq. (3). We found a good agreementbetween measured and calculated oscillation phasesfor mixtures of O2 with CO2, using the energy levels ofthe O2 rotational states and data of the O2 light absorp-tion. This represents therefore a technique to deter-mine the O2 concentration. The period of the gratingoscillation on the other hand is related to the soundvelocity and therefore to the gas temperature.
The slow relaxation steps in O2-CO2 mixtures are theelectronic and the subsequent vibrational relaxation ofthe O2 and the CO2 molecules. Experiments withchanging pressures of the components show that thequantity 2 ,^ in the Eq. (6) is proportional to the CO2
concentration. Therefore, in this specific case the con-centration of the species CO2 can also be (approxi-mately) determined simultaneously. Pictures of resultsof these experiments can be found in [2].
Because of the high energy release from the elec-tronic relaxation induced by collisions with moleculesof H2O or H2, the linear dependence in time of thegrating reflectivity (Eq. (6)) is seen there very clearly.As an example, Figure 1 shows the temporal evolutionof the grating diffraction efficiency in a mixture of10.9 mbar H2O and 0.504 bar O2.
« o.o0.4 0.6
time / us0.8 1.0
Fig. 1: Temporal evolution of the LIG signal intensityin a mixture of O2 and CO2.
4 ACKNOWLEDGEMENT
Financial support by the Swiss Federal Office of En-ergy (BFE) is gratefully acknowledged.
5 REFERENCES
[1] A. Stampanoni-Panariello, B. Hemmerling, W.Hubschmid, Phys. Rev. A 51, 655 (1995).
[2] W. Hubschmid, B. Hemmerling, Chem. Phys. 259,109(2000).
[3] R.W. Boyd, Nonlinear Optics, Academic Press,San Diego, 353 (1992).

50
THE SOOT REDUCTION POTENTIAL OF OXYGENATED FUELS
S. Kunte, T. Gerber, P. Beaud, P. Radi, G. Knopp
The influence of oxygen containing fuels on the soot forming tendency within a laminar diffusion flame hasbeen investigated. The promising results show a strong decrease in soot content at higher admixtureswhereas the at small quantities the soot production rises slightly under highly diluted conditions.
1 INTRODUCTION
The addition of oxygenated compounds to Diesel fuelcan result in a sizable decrease of paniculate matter inthe exhaust gases. Of special interest are acetals asan admixture agent because they are compatible withthe technical restraints of commonly used engines.
Our investigations have been carried out on a Wolf-hard-Parker burner. DME, methylal (dimethoxy-methane (DMM)), and butylal (dibutoxy-methane)were admixed to a basic fuel and burnt in anoverventilated diffusion flame. Laser InducedIncandescence (Lll) was used to measure sootvolume fractions within the flame.
To separate as much as possible the effects due tothe specific reaction kinetics of the added compoundfrom those due to a change in temperature, ethylene,well matching the adiabatic flame temperatures of theinvestigated additives, was used as a base fuel. An-other comparison is possible with an addition of CH4
instead of oxygenates. CH4, having a soot reducingeffect due to its very low sooting propensity, does notchange the combustion chemistry by the introductionof oxygen in the fuel stream.
2 EXPERIMENTS
The flames are realised on a Wolfhard-Parker burner.The fuel exits a 7.4 mm wide rectangular slit which issandwiched between two other 16 mm wide slits de-livering the combustion air. The length of all slitsmeasures 42 mm. (Within the ducts the gas flow isstraightened with a honeycomb structure made ofceramics.). In order to prevent condensation of fuelsbefore entering the burner all tubes as well as theburner itself were heated to a temperature up to200°C. The gas flows of air, fuel and nitrogen (dilutant)are controlled by flow meters with an accuracy of 1%.
The liquid fuels (methylal and butylal) had to be evapo-rated and appropriately mixed in the gas supply. Me-thylal has a high enough vapour pressure at ambienttemperature that allows the use of a bubbler in whichthe vapour is stripped by a nitrogen flow. To maintaina constant N2 fraction in the fuel stream, a bypass wasused to compensate for the varying bubbler flow (seeFigure 1).
Butylal has a boiling point of 180°C, i.e. the vapourpressure at ambient temperatures is not sufficient forour experiment. Butylal was therefore mixed with ni-trogen in a temperature controlled evaporator heatedup to 200°C. Dosimetry was accomplished with a peri-staltic precision pump. (The evaporator is filled withmetal balls acting as static mixer). To avoid condensa-
tion of butylal on the way to the burner all connectingtubes were heated to 200°C.
Parke*burner
Fig. 1: Bubbler-type set-up to evaporate DMM.
The soot volume fraction fv is measured with laserinduced incandescence (Lll). With the output of a fre-quency doubled Nd:YAG-laser formed into a 500umwide and 40mm long light sheet soot particles in theflame are heated up to 3095K, well above flame tem-peratures. The power flux is set to 12 MW/cm2, whichwas found to be a good compromise between heatingbig particles to high enough temperatures to generatea signal and loss of small particulates due to evapora-tion. The incandescence of soot is observed perpen-dicular to the sheet through a filter (700nm,FWHM=30nm) with a camera using a shutter time of40ns. Single shot signals from every position in theflame can be captured on one frame. To evaluate thetotal amount of soot the Lll-signal was integrated overthe full flame. To improve signal-to-noise ratio, severalpictures were acquired and averaged.
3 RESULTS
Figure 2 shows the soot content in the whole flamedepending on different replacements of base fuel bythe additives. Methane as a substitute behaves asexpected, i.e. a linear reduction of soot was observed.In contrast to expectations, soot mass fraction slightlyincreases with an admixture of up to 20% DME andDMM before it falls more than proportional for higherpercentages. DMM, most likely due to its higher O/Cratio, has a more pronounced effect.
A similar behaviour is found for butylal. The experi-ment is, however, not directly comparable to the othercurves. Measurements with the same mole flux had tobe rejected, because the flame became to high andunstable. The butylal experiments were therefore per-formed with mixtures maintaining the oxygen con-sumption constant. Moreover, due to the high boiling

51
point the fuel mixture had to be heated up to 200°Cresulting in a higher adiabatic flame temperature byabout 80K. The measurements show a sizeable in-crease of soot (up to 35% at 40% admixture) withbutylal as fuel component. At higher butylal ratios adecrease of soot is observed. But even at 100% buty-lal, soot is only reduced by a factor of two compared tothe pure ethylene flame. Thus butylal by itself is not a"nonsooting" fuel what could be explained by its smallO/C ratio.
30 -
28-!
2 6 -
•g- 24-
ro 22-
flam
e[
c 16-
vith
a> 12 •
| 10-
§ 8-3 6-8 4-
2 -
0 -
o n o' g 6 ° • o
a / A on °- ' • ^ \ •
T soot
A—*—CH 4
• - - • - -DME _
o --.- DMM-
butylaL
\ A
7"fc=50°C x v ^ A
' ,~ * '~^>>^_^
1 I ' 1
2300
2280
2260
2240
2220
2200
2180
2160
2140
2120
2100
2080
2060
2040
2020
20000 10 20 30 40 50 60 70 80 90 100
percentage of addition [%]
Fig. 2: Soot content of the flames (symbols on lines)and temperatures (symbols) versus fuel mixture; basicfuel ethylene 0.158 lN/min diluted by 0.6lN/min N2.
In all experiments described, the flame temperatureprincipally changes for different fuel mixtures.Comparing the pure ethylene flame at 50°C and200°C (see points for 0% addition on the differentcurves) the soot amount doubles when temperature isincreased by 150K. Therefore, the increased sootcontent with the flames run with admixture of DME,DMM and butylal might simply reflect a higher flametemperature with mixed fuels. The maximumtemperature in each flame was measured with acoated thermocouple. Within the assumption that thismeasurement is characteristic for the temperaturethroughout the flame one finds that the admixtures ofoxygenates generally lowers the flame temperature.According to the above hypothesis soot content shouldbe lower. From the opposite experimental findings forthe lower oxygenate admixtures, we may concludethat the increased soot mass fraction found in some ofthe mixtures is due to a different combustionchemistry rather than a temperature effect.
These results are in contrast to the observations madewith engines where for all admixtures of oxygenates toDiesel, also for small ones, a decrease of soot wasfound in the exhaust. Actually, an increased soot pro-duction upon addition of oxygenates depends verysensitively on flame conditions, as stoichiometry, tem-perature and dilution. Indeed, additional measure-ments with diluted flames, -excess nitrogen wasadded-, showed that an increase of soot productionnever occurs. For highly diluted flames small addi-
tions of DME result in an immediate decrease of soot,whereas the less diluted flames show a threshold be-haviour.
At present the data sets are not yet complete enoughto draw final conclusions or to provide a comprehen-sive set of input data to a model applicable in enginecombustion. However intuitively it seems that theoxygenates used in our experiment play a double role:on one hand the pyrolytically formed fragments ema-nating from the oxygenates increase the pool of sootprecursors, e.g. by an increased H-abstraction rate; onthe other hand, they open a more direct route to theformation of products like e.g. H2CO, HCO and COwhich no longer take play in the soot formation proc-ess. At higher concentrations all tested oxygenatesquite efficiently reduce soot. The effect of the specifi-cation of the oxygen bearing molecule is compara-tively small in our experiment and changes seem to beadequately described by the O/C ratio. Therefore, upto now, no obvious explanation can be derived whichfragments emanating from an oxygenate compoundcould be responsible for the observed flame behav-iour.
Apart from chemical effects, i.e. a change of reactionroutes, the results may still be explained by "macro-scopic" parameters like mixture fraction and localtemperature which just have an influence on individualreaction speeds. Kent et al. [1] have shown, that thenet soot formation rate is a function of mixture fractionand temperature with a maximum for T-1600K and<t>~1.5 in the case of an ethylene flame. The presenceof additional oxygen introduced by oxygenated com-pounds on the fuel side of the diffusion flame corre-sponds to a change of mixture fraction. Moreover,from experiments with Diesel engines run with oxygencontaining fuels Bertola et al. [2] observe an increasedheat release during the ignition phase, indicating alocally higher temperature that is not reflected by themaximum flame temperature. As shown by Kenfthesechanges may have opposite influences on soot pro-duction depending on the situation referenced upon.
4 ACKNOWLEDGEMENTS
This work was supported by the Swiss Federal Officeof Energy (BFE).
The acetals used in our studies were provided byLambiotte & Cie, Belgium.
5 REFERENCES
[1] J.H. Kent, D.R. Honnery, A soot formation ratemap for a laminar ethylene diffusion flame, Com-bust. Flame 91, 287-298 (1990).
[2] A. Bertola, K. Boulouchos, Oxygenated Fuels forParticulate Emissions Reduction in Heavy-DutyDl-Diesel Engines with Common-Rail Fuel Injec-tion, SAE-paper 2000-01-2885.

52
HIGH RESOLUTION SPECTROSCOPY BY fs-CARS
P. Beaud, T. Lang (MPQ, Garching), H.-M. Frey, T. Gerber, M. Motzkus (MPQ, Garching)
Femtosecond coherent anti-Stokes Raman scattering (fs-CARS) is demonstrated to deliver the contribu-tion of the molecular anharmonicity to the optical constants with high accuracy. In addition we show, thatfs-CARS is also applicable for thermometry and investigation of the collisional-rotational relaxation matrix.
1 INTRODUCTION
Recently we have demonstrated rotational coherencespectroscopy on molecules of low symmetry using de-generate femtosecond four wave mixing (fs-FWM) in amolecular beam [1] and fs-CARS on H2 in a cell [2]. Inthis work the fs-CARS technique is applied to mole-cules in the molecular beam and for thermometry in aflame on N2. The evolution of the CARS signal withtime is a direct manifestation of the anharmonicity ofmolecular rotation and sensitive to the rotational popu-lation distribution, e.g. the temperature.
2 THEORY
In a nonresonant fs-CARS experiment two of the threeincident pulses are temporally overlapped and preparea macroscopic coherent excitation in the ground state.The coherent excitation is then probed by a third de-layed pulse which creates a signal pulse at the anti-Stokes frequency under the condition that the requiredphase-matching is fulfilled.
The signal intensity resulting from a femtosecondFWM experiment can be evaluated with the equation:
2
(1)-S(T)= J dtEp(t) jdt'E1(t'-x)E2(t'-x)%(3)(tI)
E, and E2 are the two pump fields, Ep is the probepulse, x the time delay of the probe to the pump pulsesand 3c<3>(t) the third order susceptibility. In an off-resonant time-domain pump-probe experiment thenonlinear susceptibility is related to the time correla-tion function of the molecular polarizability [3]:
,(3) ,"^- (2)
The polarizability tensor a can be expanded with re-spect to the normal coordinates of vibration as
Each term can be separated into isotropic and aniso-tropic contributions.
Aj=±2Av=O
Aj=OAv=+1
4 5 IT
V.j-^V.j't
v^v+1-i (4)
where a,y and a',/ are the mean and anisotropy in-variants of a and a\ respectively, fvj the population ofstate (v,j) at f<0 and b$ are the Placzek-Teller coeffi-cients.
Setting the probe pulse polarization to the magic angleof 54° with respect to that of the pump pulses [3] theanisotropic contributions vanish and the CARS signalcan be expressed as
X(3)W = Efv j(2j + l)(v + l)sin(co'(t))e-t2/TD2-rt (5)
where the sum runs over all Raman active transitionsco'=ctVj >ctv+1 j . T D =c/co'V2m/kT is the inverse Dop-pler FWHM and V the collisional decay rate. For linearmolecules the rovibrational levels can be expressed bythe phenomenological constants Be, ae, |3e, ... and %,cObXe, cofeye . . . . The coherent superposition of all transi-tions will lead to interferences with beat frequencies atmultiples of 2cobxe and oce.
3 EXPERIMENTAL
The laser source is an ultrashort Ti:S laser systemmaking use of the chirped pulse amplification tech-nique yielding 110 fs laser pulses of 500 |uJ energy.Half of the laser output is used to pump an opticalparametric amplifier (OPA). The OPA pulse (duration:130 fs, energy: -10 (iJ, X: 550 - 720 nm) is evenly splitto create the pump and the probe pulse. The Stokespulse is produced using 10 - 100 (iJ of the output ofthe Ti:S laser at 785 nm. The frequency of the OPA istuned, so that its difference to that of the Stokes pulsecorresponds to the frequency of the normal modeunder investigation. % probe
Pump
Stokes
JAj=0±2Av=±l
signal
Fig. 1: Experimental setup.
As shown in Figure 1 the three beams are focused ina forward BOXCAR configuration by a 500 mm lensinto the molecular beam or alternatively into the flameor cell. The probe pulse is delayed with a computercontrolled translation stage. The resulting signal beamis recollimated, filtered in a monochromator and de-tected with a photomultiplier tube.

53
4 RESULTS AND DISCUSSION
Fs-CARS transients are recorded for N2 (v=2330cnr1)and the two Raman-active normal modes of theground state of acetylene (v1=3372cnr1, v2=1973cm1)in the expansion zone of a pulsed molecular beam. Inthe molecular beam, collisional dephasing is negligibleand the coherently excited sample survives up to longdelays, which improves the accuracy of the determina-tion of the molecular constants. An example is shownin Figure 2 and the results in Table 1 are in agreementpublished data.
fit: ae= 0.006824 cm"1
T=125K
100 200 300 400
Probe pulse delay [ps]500
Fig. 2: Fs CARS transient for the v2 vibration of theacetylene ground state measured in a pulsed molecu-lar beam.
mode h-BoIcnr1]this work literature
C2H2
C2H2
N2
v1=3373 cm"1
v2=1974cnv1
v=2330 cm"1
.006824 (7)
.006176(4)
.017341 (6)
.0068 a
.0061 a
.017370 (1)b
Table 1 : Comparison of the measured values of ae toliterature data. Note that at this level of the expansion
With increasing temperature and in presence of colli-sions the temporal structure of the transients becomesmore complex since higher rotational and vibrationalstates are populated. The signal amplitude decreasesrapidly in time due to collision-induced dephasing.However, the molecular coherence can still be fol-lowed thanks to the high S/N ratio offered by theFWM-technique.
ca
.1[/]
inPi<U
-
-
-
-
Mi*
residuals
xio :
^ - experiment ;
0 400 500100 200 300Probe pulse delay [ps]
Fig. 3: Measured and fitted fs-CARS transient on N2
in a partially premixed methane air diffusion flame.
Figure 3 shows the CARS-response of N2 measuredin the time domain in an atmospheric pressure meth-ane/air diffusion flame. We simultaneously fit 8 pa-rameters: the gas temperature, the higher order spec-troscopic constants ae, ya, p\ co xe, and three parame-ters required to correctly describe the coherence de-cay due to rotational energy transfer. This model isbased on the energy corrected sudden approximation(ECS) theory in conjunction with a power gap law(ECS-P). It comprises a temperature dependent crosssection A(T), the length scale of the collisional processXc, and ythe coefficient of the power gap law [6].
cell flame literature
TBi-B(
Ye
Pcoexe
A(T)
Xc
Y
[K],[10-2cm-1]
[10"5cm-1]
[10"8cm-1]
[cm"1]
[10"3cm-1]
[A]
296.3 (9)
1.7391 (6)
n.a.
1.40 (25)
n.a.-
7.47 (22)-
0.74(14)
1.08(10)
1316(23)
1.7395 (5)
-2.3 (2)
0.6 (3)
14.351 (4)-
8.76 (26)
0.59 (39)
0.96 (25)
--1.7370 (1)a
-2.85 (2)a
1.02 (3)a
14.3304 (3)a
7.71 (31 )b
9.82 (32)b
0.748 (47)b
1.245 (66)b
Table 2: see text. a: Ref. [5],b: Ref. [6].
The results of the fit are summarized in Table 2 includ-ing the result obtained in a cell filled with N2 at 200 mband RT. The fitted temperatures agree well with that inour laboratory of 22-23 eC, respectively with 1350 ± 50K measured in the flame using a thermocouple device.The fitted spectroscopic parameters and those de-scribing the collisions compare well with publisheddata. The main spectroscopic constants ae and Gy<e,however, show a significant systematic deviation in theorder of 0.15 % which might be due to calibration errorof the translation stage.
5 ACKNOWLEDGEMENT
Financial support by the Swiss Federal Energy Office(BEW) is gratefully acknowledged.
6 REFERENCES
[1] H.-M. Frey, P. Beaud, T. Gerber, B. Mischler, P.Radi, A.P. Tzannis, Appl. Phys. B 68, 735 (1999),ibid, J. Raman Spectrosc, 31, 71 (2000).
[2] T. Lang, K.-L. Kompa, M. Motzkus, Chem. Phys.Lett. 310, 64(1999).
[3] M. Morgen, W. Price, P. Ludowise, Y. Chen, J.Chem. Phys. 102, 8780 (1995).
[4] M.I. El Idrissi, J. Lievin, A. Capargue, M. Herman,J. Chem. Phys. 110, 2074 (1999).
[5] M. L. Orlov, J.F. Ogilvie, J.W. Nibbler, J. Molec.Spectrosc. 185, 128(1997).
[6] L. Bonamy, J. Bonamy, D. Robert, B. Lavorel, R.Saint-Loup, R. Chaux, J. Santos, H. Berger, J.Chem. Phys. 89, 5568(1988).

54
OBSERVATION OF STATE-TO-STATE ROTATIONAL ENERGY TRANSFER INEQUILIBRIUM MEDIA
P.P. Radi, A.P. Kouzov (St.-Petersburg State University, Russia), P. Beaud, T. Gerber
Two-color resonant four-wave mixing (TCRFWM) is applied to the investigation of rotational energy trans-fer (RET). We show that the technique has the potential to yield information on state-to-state collisionalenergy transfer of transient molecules in both, their ground and excited electronic state. Furthermore, sincethe method can be applied to high density and high temperature environments, it yields RET rates in situand provides data to validate theoretical models.
1 INTRODUCTION
Inelastic collisional energy transfer controls the inter-nal energy of molecules and determines ultimately theresult of reactive encounters between molecules.Thus, the detailed dynamics of molecular collisionsdetermine the rate of a chemical process and are,therefore, of fundamental interest. From a spectro-scopic point of view, collisional effects have to betaken into account for determining molecular lineshapes and saturation behavior. In particular, accurateknowledge on RET is essential for quantitative appli-cations of diagnostic methods such as absorptionspectroscopy and laser-induced fluorescence (LIF) incombustion processes. In general, all state-to-statecollision rates at the flame conditions have to beknown. It is important to notice, that for such environ-ments there is always more than one collider speciespresent and many rotational levels are populated.Also, the RET cross sections are strongly dependenton collisional frequency and kinetic energy.
As a consequence, a large number of experimentaland theoretical studies on state-to-state RET havebeen performed using stable molecules and radicals.Most investigations have been accomplished for theelectronically excited state. Fewer measurements ofRET for ground state molecules have been reported.These experiments involve the preparation of a vibra-tionally and/or rotationally excited state on the groundpotential energy surface. Excitation can take placeeither by chemical activation or by photolysis of a suit-able precursor. Alternatively, infrared (IR) excitationmethods are applied. However, IR selection rules aresomewhat restrictive, and until recently, there havebeen few intense monochromatic, readily tunable IRlight sources. To the best of our knowledge no state-to-state RET rates on the ground state potential sur-face have been measured in high density and hightemperature environments. In fact, to validate theoreti-cal models, such state-to-state RET rates obtained inan equilibrium media, such as a flame, are much de-sirable.
2 EXPERIMENTAL
The arrangement of the optical system for TCRFWMhas been described in detail [1] and is briefly outlinedin the following. Two separate Q-switched Nd:YAGlaser pumped dye laser systems are frequency-doubled using KDP crystals to generate the PUMPand PROBE beams to establish a forward box TC-RFWM configuration. DCM, Sulforhodamin or Pyri-
din 1 dyes are used to cover the (0-0) and (1-0) vibra-tional bands of the A 3 n - X 3E" electronic transition ofNH. The same spectral regions access the (0-1) and(0-0) vibrational bands of the A 2Z+ - X 2 n system ofOH. The forward box TC-RFWM configuration de-scribed in [1] has been modified by introducing polari-zation rotators in the beam path of the PROBE andone of the PUMP beams. In this way, arbitrary polari-zation geometries of the electric fields are readily real-ized. We utilize the standard nomenclature of [2] todistinguish possible configurations of the linear polari-zations e4eie3e2 viz., YYYY, YXYX, etc. The sub-scripts 1 and 2 refer to the two pump fields, whereas 3and 4 label the probe and signal fields, respectively.The large dynamic range for the signal intensity that isrequired for this experiment is obtained by introducingthe appropriate neutral density filters in front of thephototube. All measurements of OH and NH are per-formed in a H2/O2/N2 and H2/NH3/O2/N2 flame stabi-lized on a welding torch, respectively.
3 THEORY
RET couples nearby rovibronic states and inducestransitions in the TCRFWM spectra (provided it is fastcompared to the time duration of the laser pulse).These resonances originate from neighboring rota-tional substates sharing no common level with thepumped states. The standard theory developed so far([2] and references therein) exploits three-levelschemes, for which both transitions share a commonlevel either in the ground (UP) or excited electronicstate (SEP). As a consequence of the implementeddiagonal relaxation matrices, the theory yields linebroadening only and fails to explain the collision-induced resonances. Recently, we have extended theexisting theory to a general, four-level theory using theFano-Mori and line-space techniques [3, 4]. The ap-proach shows how rotationally inelastic collisions per-turb the ground/upper electronic state gratings andtrigger new transitions in equilibrium gases. Further-more, the technique is able to yield in situ state-to-state collisional rates for transient molecules. Suchdata are required to increase the understanding ofcollisional dynamics.
4 RESULTS AND DISCUSSION
A detailed description of the analysis of recent ex-perimental results on OH and NH and the evaluationof the state-to-state RET rates is beyond the scope ofthis report and can be found elsewhere [3, 4]. Here,

55
we illustrate the power of the method by consideringthe fine-structure labels of radicals. In fact, molecularradicals, which have open-shell electron configura-tions, exhibit generally a coupling of the nuclear rota-tional angular momentum with the non-zero electronspin and/or orbital angular momentum leading to thepresence of several fine-structure levels for eachvalue of the nuclear rotational angular momentum.Rotationally inelastic collisions can change the nuclearrotational momentum and/or the fine-structure labelsof the molecular free radical. Knowledge on theseenergy transfer rates are important for laser diagnos-tics of free radicals in combustion environments, mod-eling of interstellar masers, etc.
10 9
, v
•§
1 — u — • • •M 10 9
Rel
ativ
e
8
9
6 5 4
r-n ,
8 7 6
8 7 6 5
, JU.LL.L.
Fixed ProbeTransition0-0 Band
n (A\
5 1 3 ,
iI 3
VJ}\ 0,(4)2
I Q"32720 32740 32760 32780 32800
Pump Laser Frequency (cm1) 1 -0 Band
Fig. 1: Propensity for the conservation of the finestructure label in the 3£- ground electronic state of NH.See text for details.
Figure 1 depicts RET lines of the A 3 n - X 3E~ band ofNH recorded by applying the YXXY configuration. Theprobe laser is fixed at the rovibronic transitions 0^(4),Q3(4) and Q2(4) in the 0-0 vibrational band for theupper, middle and bottom trace, respectively. Thus,different fine-structure levels F-,, F2 and F3 of N=4 inthe ground state are addressed [5]. By scanning thepump laser in the 1-0 vibronic band, intense UP transi-tions for Qj(4), i=1,2 and 3, are observed. The rota-tional quantum number N is shown on the comb forassignment of the different fine-structure levels. Inaddition to the UP transitions, a number of peaks areobserved that are due to collisional energy transfer inthe ground electronic state. Some interesting resultsare readily perceived. The decrease of the state-to-state cross sections with increasing AN is clearly ob-servable for 0^(4) and Q3(4), as expected from the
large energy spacing of this hydride. The same trendis discernible for Q2(4). Note, however, that the lattertransition overlaps with neighboring resonances in the(0-0) band (Q3(10) and Q3(9)) and gives rise to addi-tional peaks in the spectrum. Furthermore, Figure 1shows that there is a clear propensity for the conser-vation of the fine-structure label. In fact, for a moleculein a 3E state, which follows closely Hund's case (b)coupling like NH, there should be a conservation ofthe fine-structure levels in collisions. This is a conse-quence of the fact that the electron spin is only looselycoupled to the molecular axis and remains a spectatorduring the collision. Its direction is not changed asthere is generally no magnetic torque exerted in mo-lecular collisions.
In summary, we have developed experimentally andtheoretically a novel sensitive technique for the inves-tigation of collisionally induced energy transfer proc-esses in equilibrium media. The method has beenapplied to OH and NH in a flame. For the first time,polarization-dependent state-to-state RET rates of theground state have been observed experimentally in ahigh density and high temperature environment. Fur-thermore, we have shown that TCFWM is applicablefor detailed studies of propensity rules for the changein the fine-structure label.
5 ACKNOWLEDGEMENT
The financial support of the Swiss Federal EnergyOffice (BFE) is gratefully acknowledged.
6 REFERENCES
[1] P.P. Radi, H.-M. Frey, B. Mischler, A.P. Tzannis,P. Beaud, T. Gerber, Chem. Phys. Lett. 265, 271(1997).
[2] S. Williams, E.A. Rohlfing, LA. Rahn, R.N. Zare,J. Chem. Phys. 106, 3090 (1997).
[3] A.P. Kouzov, P.P. Radi, PSI - Scientific Report V,50(1999).
[4] A.P. Kouzov, P.P. Radi, Phys. Rev. Lett., ac-cepted for publication.
[5] NH exhibits an electronic spin of 1 which pro-duces triplets that are characterized by subscripts1, 2 and 3 such that: F^ J=N+1, F2: J=N and F3:J=N-1. J is the total angular momentum quantumnumber and N denotes the angular momentumexclusive the electron spin.

56
SELECTIVE CATALYTIC REDUCTION OF NO AND NO2 AT LOW TEMPERATURES
M. Koebel, G. Madia, M. Elsener
A feed gas containing both NO and NO2 can react with NH3 according to two different reaction pathways atlow temperatures: The fast SCR reaction has a positive and the ammonium nitrate reaction has a negativetemperature coefficient. The deposition of ammonium nitrate in the pores of the catalyst may lead to itstemporary deactivation.
1 INTRODUCTION
Forthcoming European legislation pertaining to heavyduty diesel engines calls for the simultaneous reduc-tion of both particles and NOX emissions. It is nowgenerally assumed, that the EURO 4 emission stan-dards proposed for the year 2005 will be no longerfeasible by primary measures alone but will requireadditional aftertreatment techniques.
A possible technique to reduce NOX in lean exhaust isSCR (selective catalytic reduction). Due to toxicologi-cal and safety considerations urea is preferred overammonia as a selective reducing agent. Urea may beregarded as a solid storage compound for ammonia,which is the active agent in both cases. Urea SCR hasbeen investigated by us and others in the last years asthe most promising technique to reduce NOX in theexhaust of mobile diesel engines [1, 2]. The main ef-fort is directed to heavy duty engines used in trucks,but attempts are also made to develop a suitabletechnique for diesel passenger cars.
The main reaction of SCR with ammonia is:
2 NH3 + 2 NO2 —> NH4NO3+ N2 + H2O (4)
4 NH3 + 4 NO + O2 4 N2 + 6 H2O (1)
On the typical SCR catalysts based on TiO2-WO3-V2O5 the "standard SCR" reaction has a useful rate inthe temperature range 250-450°C. However, at lowertemperatures, the kinetics of this reaction are too slowfor the practical application in a mobile SCR system.In a mobile system, only limited catalyst volumes areacceptable and this calls for a higher rate of the reac-tion.
In order to increase the rate of NOX conversion it hasbeen proposed to utilise the fact that the reaction rateof an equimolar mixture of NO and NO2 is muchhigher [1] ("fast SCR"):
4 NH3 + 2 NO + 2 NO2 4 N2 + 6 H2O (2)
In a practical system the additional NO2 is produced byan oxidation precatalyst (Pt-based) upstream of theSCR catalyst. NO2 fractions above 50 % of total NOX
should be avoided because excess NO2 can only reactin a third slower reaction:
4 NH3 + 3 NO2 3.5 N2 + 6 H2O (3)
It is also well known from the manufacturing processof nitric acid that NO2 and NH3 may form solid ammo-nium nitrate at low temperatures [3,4]. The reactionmechanism involves the dimerization of NO2 and theoverall equation is:
In the following we report some basic experiments ofthis highly interesting chemistry. The practical issue ofthese experiments is to find the lowest possible tem-perature limit of the fast SCR reaction for the practicalapplication of the process.
2 EXPERIMENTAL
The experiments were performed in a flow-troughreactor (gas flow ~ 300 lN/h). The base feed gas usedwas adapted to a typical diesel exhaust gas, contain-ing 10 % O2 and 5 % H2O with balance N2. NO andNO2 were added at various proportions to composeNOX and NH3 was used as reducing agent. The gasesat the reactor outlet were analysed by means of anFTIR spectrometer.
A ternary catalyst composed of TiO2, V2O5, WO3 wasused as a powder and as a monolithic sample. Furtherdetails have been given in [5].
3 RESULTS
3.1 Standard and fast SCR at T>200°C
Fig. 1 shows typical results for a monolithic sampleobtained at 200°C by varying the ratio of NO2/NOX.The performance plot is obtained by varying the addi-tion of NH3 for the fixed concentration of 1000 ppmNOX and measuring the resulting slip (efflux) of NH3 atthe reactor outlet.
100
90
80
70
60
50
40
30
20
10
0
- - O - - 0 0
—•—1C
- - 4 - - 2 C
—*—3C
- - 0 - - 4 C
0I n ^ 1
'o
°/c
%
°/c
%
NO2
NO2
NO2 1NO2
NO2
6
I
A/
J ,t
10 20 30 40 50 60
DeNOx [%]
70 80 90 100
Fig. 1: Performance of monolithic catalyst sample atT = 200°C for various ratios of NO2/NOX at GHSV =52000 h"1. Base feed + 1000 ppm NOX.

57
In the practical application only values of DeNOx atlow NH3-slip are of interest. It can be seen that theDeNOx for an NH3 slip of 10 ppm increases from -20% for pure NO to =95 % with a 1:1 mixture NO + NO2.Expressed in terms of a first order rate law this corre-sponds to an increase by a factor of =13. The benefi-cial effect of NO2 may also be observed at highertemperatures, although in a less sensational mannerdue to the increasing rate of the standard SCR reac-tion. On the other hand, NO2 fractions above 50 %lead to a decrease of the catalyst performance.
3.2 Experiment at T=150°C
Below about 200°C the formation of ammonium nitrate(solid or liquid) according to reaction (4) must be con-sidered. On a powder sample at 150°C this is practi-cally the exclusive reaction. Fig. 2 shows the result ofa typical experiment with a monolithic sample which isfirst subjected 30 minutes to a base feed with 1000ppm each of NO2 and NH3. It may be seen that duringthis time a considerable drop of the NH3 concentrationoccurs over the catalyst, the drop of NO2 being practi-cally equal (not shown). Ammonia and NO2 are con-sumed according to the ammonium nitrate reaction(4).
NH3 consumed in the reaction = 0.002925 molNH3 desorbed = 0.001636 molHNO3 desorbed = 0.00109 molblank NH3 = 0.00031 mol
40 60 80
time [min]
Fig. 2: Efflux of NH3 and HNO3 behind monolithiccatalyst sample. For details see text.
An important issue is the decomposition productsresulting from a subsequent heat-up of the ammoniumnitrate formed. The subsequent thermal decomposi-tion experiment shows that the decomposition yieldsonly ammonia and nitric acid. Within the experimentalerror and considering the blank adsorption of NH3, halfthe amount of each NH3 and NO2 adsorbed are re-leased in the thermal decomposition experiment ac-cording to:
NH4NO3 —> NH3 + HNO3 (5)
It is well known from the literature [6] that pure ammo-nium nitrate can also decompose into N2O and wateraccording to:
NH4NO3 N2O + 2 H2O (6)
In the above experiment no N2O could be detected.Only if the experiment is performed without water inthe feed, some N2O (~ 10 %) is formed in the subse-quent thermal decompostion experiment.
3.3 Behaviour between 150 and 200°C
Figure 3 shows the behaviour of both powder andmonolithic catalyst samples with a 1:1 NO-NO2 mix-ture in the base feed gas in the temperature range150-200°C. Due to the fact that the fast SCR reaction(2) consumes equimolar amounts of NO and NO2, butthe ammonium nitrate reaction NO2 only, the contribu-tions of both reactions may be calculated. It can beseen that the ammonium nitrate reaction contributesincreasingly with decreasing temperature to the totalDeNOx. The fast SCR reaction follows an oppositetrend.
100
90 - -
8 0 • ] —
70
60
50
40
30
20
10
0140
•—Monolith, totali Monolith, fast SCRi Monolith, NH4NO3•— Powder, total. Powder, fast SCR. - Powder, NH4NO3
150 160 170T[°C]
180 190 200
Fig. 3: NO2 converted due to the fast SCR reaction(2) and ammonium nitrate reaction (4) and resultingtotal DeNOx
4 REFERENCES
[1] E. Jacob et al., NOx-Verminderung fur Nutz-fahrzeugmotoren mit Harnstoff-SCR-Kompakt-systemen (GD-KAT), 19. Intern. Wiener Moto-rensymposium. 07.-08.05.1998, Fortschritt-Berichte VDI, Reihe 12, Nr. 348, Bd. 1, 366-86.
[2] M. Koebel, M. Elsener, M. Kleemann, Urea-SCR: A promising technique to reduce NOxemissions from automotive diesel engines,Catal. Today 2031, 1-11 (2000).
[3] A. Mearns, K. Ofosu-Asiedu, Ammonium nitrateformation at low concentration mixtures of ox-ides of nitrogen, ammonia and water vapour, J.Chem. Biotechnol. 34A, 350, (1984).
[4] A. Mearns, K. Ofosu-Asiedu, Kinetics of reac-tion of low concentration mixtures of oxides ofNitrogen and ammonia J. Chem. Biotechnol.34A, 341.(1984).
[5] M. Koebel, M. Elsener, G. Madia, ReactionPathways in the SCR Process with NO and NO2
at Low Temperatures, Ind. Eng. Chem. Res., inprint.
[6] Gmelin, Handbuch der anorganischen Chemie,Ammonium, 8. Ed., Lieferung 1, 109 (1936).

58
THERMOPHOTOVOLTAIC DEMONSTRATION SYSTEMS
J.C. Mayor, W. Durisch, F. von Roth, B. Bitnar
A 20 kWth thermophotovoltaic (TPV) generator with a selective ytterbium oxid emitter and silicon photocellshas been realised. The theoretical prediction of the existence of an optimum emitter temperature at whichthe electrical efficiency reaches its maximum has been experimentally confirmed. A comparison of differentphotocells under TPV irradiation conditions shows the importance of cell selection for specific TPV applica-tions. In a small demonstration system of 1.35 kWth an electrical efficiency of 2.1 % has been reached.Possibilities for a further improvement of the electrical efficiency are presented.
1 INTRODUCTION
The principle of thermophotovoltaic (TPV) is the con-version of thermal radiation emitted by a hot radiatorinto electricity using suitable photocells. The TPV gen-erator developed at PSI was already described in anearlier Annual Report, [1]. This article describes theprogress achieved during the year 2000. The mostimportant action was the realisation of a TPV demon-stration generator working with a 20 kW methaneburner, a selective ytterbium oxid emitter (Yb2O3) andcommercially available silicon solar cells. This systemgenerates an electrical output power of 164 W. Theradiation power at the emitter surface is 1.8 W/cm2 inthe wavelength range X e [0.6 - 1.3 |im] at a tempera-ture of 1736 K.
2 20 kW DEMONSTRATION SYSTEM
Figure 1 shows a view of the 20 kW TPV demonstra-tion system. Clearly visible are the central methaneburner surrounded by the selective Yb2O3 emitter (A =500 cm2) and the water cooled photocell modules (A =2030 cm2) in the peripheral zone. The vertical photo-cell arrangement consists of three rings of cells placedon top of each other and coupled in parallel. In orderto protect the photocells against the hot exhaustgases, a cylindrical quartz tube is situated between theemitter and the photocells. The specific electric powerof the central ring of photocells reachs 103 mW/cm2
which roughly corresponds to 6.5 times the value ob-tained by normal solar irradiation.
The maximum electrical power of 164 W is reached ata burner power of 20 kW whereas the max. electricalefficiency of 1 % occurs at a burner power of roughly12 kW. These measurements fully confirm the theo-retical expectations. Furthermore these results showthat the specific flame power on the emitter should bereduced from 46 W/cm2 to 28 W/cm2 in order to shiftthe max. efficiency to the nominal burner power of 20kW. This can be achieved through an increase of itsradiative surface. This purely geometrical adjustmentwould allow to reach an electric power output ofroughly 200 W. Using TPV tailored photocells up to300 W are to be expected.
Fig. 1: View of the 20 kW TPV demonstration sys-tem.
3 CONCLUSION AND OUTLOOK
A TPV demonstration system working with a 20 kWmethane burner which actually produces 164 W elec-trical power is presented. The electrical efficiency ofthe system is sufficient to realise a residential gasheating system running indepently of any externalelectricity supply. Possibilities to further increase theelectrical efficiency of the system have been clearlyidentified and should be implemented in a future de-velopment phase. These are: reducing the specificpower of the emitter, avoiding radiation losses in axialdirections by using reflectors and using better photo-cells or even low bandgap photocells with an Er2O3
selective emitter.
4 ACKNOWLEGMENT
Support by the Research Foundation of the Swiss GasIndustry (FOGA) is gratefully acknowledged.
5 REFERENCES
[1] J.-Ch. Panitz, J.-C. Mayor, A. Brunner, W.Durisch, M. Schubnell, Development of Thermo-photovoltaic Energy Converters, PSI Annual Re-port, Annex V, 33 (1997).

59
Electrochemistry

60
AC IMPEDANCE ANALYSIS OF BIFUNCTIONAL AIR ELECTRODES
S. Muller, F. Holzer, H. Aral (on leave from NTT Laboratories, Japan), O. Haas
The electrochemical properties of bifunctional air electrodes for electrically rechargeable metal/air batterieswere investigated using ac impedance spectroscopy. The PTFE-bonded electrodes contained aperovskite-type catalyst (La06Ca04CoO3), which was dispersed on high-surface-area carbon or on graphit-ised carbon. In addition the stability of the electrodes was investigated using continuous cycling tests.
1 INTRODUCTION
Due to their high specific energy and their inexpensiveand environmentally benign materials, electrically re-chargeable metal/air batteries are promising powersources. The cycle life and power drain capabilitymainly depend on the activity and stability of the bi-functional air electrode. Air electrodes typically containa catalyst dispersed on a carbon substrate. This mix-ture is PTFE-bonded and forms the active part of theporous gas-diffusion electrode [1].
In this report we analyse the overpotential contribu-tions made by the different processes in the air elec-trode using electrochemical impedance spectroscopy(EIS) [1]. We also evaluate carbon materials of poten-tial utility as catalyst substrates in these electrodes.
2 EXPERIMENTAL
The different carbon and graphite substrates used inthe electrodes are listed in Table 1. Part of the carbonblack (CB) was graphitized at 2700°C in order to im-prove its corrosion resistance. The active layer of theair electrodes was prepared using a mixture of cata-lyst, carbon substrate, and PTFE binder. The ratios ofthese compounds are listed in Table 1. In contrast tothe stable corrosion-resistant, low-surface-area (<100m2/g) graphitised carbon black (GCB), the carbonCB1-3 had a specific B.E.T. surface area of 1500m2/g.
The test cell was equipped with an air electrode(0.5 cm2), a spirally wound platinum wire as the coun-terelectrode, and a Hg/HgO reference electrode. Im-pedance spectra were measured potentiostaticallyover a frequency range typically from 10 kHz to10 mHz. The impedance spectra were analysed usingan equivalent circuit (Figure 1) containing the electro-lyte resistance (Rei), the charge-transfer resistance(Ret), the double-layer capacitance (Cd), and two finitediffusion terms shown to be associated with oxygendissolved in the electrolyte solution and with the perox-ide ions generated at the electrode by the electro-chemical reaction [1].
Cycle life tests of bifunctional oxygen electrodes werecarried out with 25-cm2 electrodes. One full cycle in-cluded 3 h of cathodic and 3 h of anodic operation.The current density was +/- 6 mA.cnrT2. After eachhalf-cycle a break of 12 minutes occurred.
Nemstian Nernstiandiffusion 1 diffusion 2
Fig. 1: Equivalent circuit for the air electrode contain-ing the electrolyte resistance (Rei), the charge-transferresistance (Rct), and two Nernstian diffusion terms inparallel with the double-layer capacitance (Cd).
Carbon Material
CB1CB2CB3GCB
Catalyst(wt %)4025040
Carbon(wt %)40558040
PTFE(wt %)20202020
Table 1 : Carbon Black (CB) and graphitised(GCB) materials tested. Carbon treatment: CBreceived), GCB (graphitised 1 h @ 2700 °C, He).
3 RESULTS AND DISCUSSION
800 , , , ,—, , , ,
CB(as
Oxygen evolution
oOJO
X
600
400
200
—. 0
-200
-40010 30 100
Current density / mA i300
Fig. 2: Current-potential curves of electrodes CB1(filled circles), CB2 (filled squares), CB3 (filled trian-gles), and GCB (empty circles).
Among the carbon-black electrodes 1-3, theperovskite-activated electrodes exhibited a better per-formance in oxygen reduction than CB3 which con-tained no catalyst (Figure 2). The catalysed electrode

61
with graphitised carbon black as a substrate (GCB)exhibited poorer performance (higher polarisation)than the high-surface-area electrode CB3 withoutcatalyst. This result suggests that the right selection ofthe carbon substrate is important for the polarisationbehaviour of the electrodes.
100-2
20 40 60 80Current density / mA cm'
Fig. 3: Derivatives (5E/5i) of current-potential curvesof electrode CB1 measured in oxygen and air flow(solid lines). The values of total impedance obtainedfrom (Rmax-Rmin) at 10, 20, 50 and 100 mAcnr2 areshown as circles (filled: oxygen gas flow, empty: airflow).
u
a« 0.0
I-0.5 -
-1.0
29Hz)
-•-era1.5 Hz,
(b)B
/
(c)
0.0 0.5 1.0 1.5 2.0
Real part / fi cm22.5 3.0
Fig. 4 Nyquist plots for electrode CB1 at cathodiccurrent densities (a) 100, (b) 20, and (c) 10 mAcnr2.
Figure 3 shows the derivatives (8E/8i) of current-potential curves recorded at electrode CB1 and, aspoints, the values of Rmax-Rmin obtained from Figure 4,where Rmin and Rmax are the real parts of resistance inthe Nyquist plot at the high and low frequency limit,respectively. The points obtained from the impedanceplots nicely coincide with the curves obtained from thecurrent-potential curves. This result demonstrates thatthe two measurements contain the same information.
The two semicircles shown in Figure 4 characterisethe two Nernstian diffusion processes included in theelectrochemical reaction, namely the diffusion of feedgas and the diffusion of HO2" and OH". In additionalexperiments we found that the contribution of feed-gasdiffusion is responsible for the semicircle at lower fre-quencies while ionic diffusion is responsible for thehigh-frequency semicircle.
The impedance spectra obtained with electrodes CB1,CB2, CB3 and GCB were analysed using the equiva-lent circuit depicted in Figure 1. From the charge-
transfer resistance (Rct) one can calculate the ex-change current density i0 = RT/zFRct. A value of 0.4-1imA/cm2 was obtained using the real surface area,which is about 1000 times the geometrical surfacearea. This result is in agreement with i0 data obtainedfrom pure carbon electrodes. Electrode GCB had lar-ger Rtot and smaller Cd values, suggesting that itselectrochemically active surface area is smaller thanthat of electrodes CB1-3. At low current densities (10mAcnr2) the contribution of ionic diffusion to the totalresistance (Rtot) was found to be predominant (70-80 %) for all electrodes.
The limiting factor for the cycle life of bifunctional airelectrodes is carbon stability at oxygen generationpotentials. It can be seen from Figure 5 that the stabil-ity of the graphitised carbon-black electrode (GCB) incontinuous oxygen reduction and generation cycles ismuch higher than that of the high-surface-area CBelectrode.
1000
Time t (h)
2000 3000 4000 5000
GCB: 40% Cat.
100 200 300Cycle Number
400
Fig. 5: Cycle life of the GCB and CB electrode at +/-6mAcnrr2.
4 CONCLUSION
Ac impedance spectroscopy is a useful tool for thecharacterisation of gas-diffusion electrodes. Using aplausible equivalent circuit, one can evaluate the diffu-sion and charge-transfer resistance of the electro-chemical process at the electrode, and useful direc-tions for electrode improvement can be deduced. Theresults of the present investigation indicate that theactivity of the gas-diffusion electrode can be improvedby using high-surface-area carbon in the active layerof the electrode. However, the cycling stability is low-ered when using such a catalyst substrate.
5 ACKNOWLEDGMENTS
We thank the Swiss Federal Office for Education andScience for partial financing of the project. The techni-cal support provided by Mrs. G. Masanz (electrodepreparation) is gratefully acknowledged.
6 REFERENCES
[1] H. Arai, S. Muller, O. Haas, J. Electrochem. Soc.147(10), 3584-3591 (2000).

62
IN-SITU SYNCHROTRON XAS AND XRD INVESTIGATION ON BIFUNCTIONALOXYGEN-ELECTRODE CATALYSTS
O. Haas, S. Muller, F. Holzer, X.Q. Yang (BNL), X. Sun (BNL), M. Balasubramanian (BNL),J.M. McBreen (BNL, USA)
Crystalline perovskite powders of different compositions were examined by XANES, EXAFS, and X-raydiffraction. The influence of perovskite stoichiometry on the cobalt K-edge energy was investigated, andCo-nearest-neighbor distances in Lao.6CaOACo03 samples were evaluated from EXAFS measurementsi
1 INTRODUCTION
In our laboratories, La0.6Cao.4Co03 perovskite is usedas an electrocatalyst in bifunctional oxygen-diffusionelectrodes of Zn/air batteries. Last year we reportedsome in-situ XANES results obtained during chargeand discharge of such a Zn/air battery. These resultsrevealed that the valence state of cobalt changeswhile the potential is scanned from the potential ofoxygen reduction to that of oxygen evolution. We havenow prepared perovskites differing in their stoichiome-try (namely Lao.4Cao.6Co03, Lao.5Cao.5Co03,La0.6Cao.4Co03 and LaCo03), and measured the near-edge region (XANES) of the Co K-edge as well as theEXAFS spectra of these compounds (after obtainingconfirmation by XRD measurements that these sam-ples had the expected perovskite structure).
2 EXPERIMENTAL
X-ray absorption was measured on beam line X-11Aof the National Synchrotron Light Source (NSLS) atBrookhaven National Laboratory (BNL) with the stor-age ring operating at 2.52 GeV beam energy and withbeam currents between 340 mA and 140 mA. ASi(111) double-crystal monochromator was used forenergy selection. The intensities of the incident andtransmitted X-rays were monitored by nitrogen-filledionization chambers.
X-ray diffraction data were collected in the trans-mission mode on beam line X-18A of the NSLS atBrookhaven at an energy of 10,375 eV (X =1.195 A).
The perovskite catalyst was prepared by calcination ofcitric La, Ca, and Co precursor salts at 700 °C, as pre-viously described [1].
Samples for the x-ray absorption measurements(XANES and EXAFS) were prepared by mixing thepure perovskite powder with BN (1 : 5) and pressingthese diluted samples to pills. These samples weremounted on an adequate sample holder and broughtinto the X-ray beam. The arrangement of the in-situmeasurements can be seen in last year's annual re-port.
3 RESULTS AND DISCUSSION
XANES investigation. The edge in the XANES spec-trum is expected to shift when the valence state ofcobalt is altered. In the higher valence state, electrons
are more strongly bound to the Co nucleus, hence theabsorption edge - where the X-rays start to knock outelectrons - will be shifted to a higher energy.
7680 7700 7720 7740 7760 7780 7800 7820eV
Fig. 1: XANES spectra of La0.6Ca0.4CoO3,La0.5Ca0.4CoO3, La0.4Ca0.6CoO3, and LaCoO3 powdersdiluted with BN (1 :5). (xmu is the normalized x-rayabsorbance)
Figure 1 shows that there is almost no shift in the Coedge when the La/Ca ratio in the perovskite ischanged from 0.4/0.6 to 1.0/0. This must be due to thefact that these samples have all been prepared at thesame temperature (700°C) in air, and thus at the sameoxygen partial pressure. The Co edge is shifted tolower energies when La0.6Ca0.4CoO3 subsequently isincorporated into a porous gas-diffusion electrode,which occurs by sintering of the electrode at 330 °C(curve ELaO6 in Figure 2). We may suppose that thisis due the fact that cobalt is slightly reduced by thecarbon substrate during the sintering process, eventhough the perovskite structure remains essentiallyunchanged, according to X-ray diffraction. It is mostprobably the oxygen partial pressure which determinesthe final oxidation state of cobalt. With cobalt havingthe same valence state at different La/Ca ratios (whichin fact were confirmed by atomic absorption analyses),the samples should have corresponding oxygen defi-ciencies compensating for the loss of positive ioniccharge which occurs when La is replaced by Ca inthe perovskite. We will set up some experiments withwhich we hope to see whether this oxygen deficiencycan be confirmed by XPS measurements.
At different potentials, in an electrochemical cell thevalence state of cobalt in the cobalt compound con-tained in the electrodes should change when the

63
Co37Co4+ redox potential is in the potential range ex-amined. Unfortunately, this redox process is very slow,and in the cyclic voltammograms of theLa0.6Cao.4Co03-catalysed electrodes, very sluggishcurrent waves are seen which in fact could also bedue to the carbon used as a substrate of the catalyst.From these cyclic voltammograms one only mayguess that there is some redox activity of Co within thepotential range examined (0.9 - 2 V vs. Zn). The factthat the edge is shifted by about 2 eV can be taken asan indication that the redox potential is near to, butprobably not between these two potential limits. (Notethat the edge shifts by about 15 eV for the full changein valence state from Co0 to Co3+. This was confirmedexperimentally by simultaneously measuring Co metalfoil and a sample of LaCo03 where cobalt is known tobe present as Co(lll).
7670 7690 7710 7730 7750 7770 7790 7810eV
Fig. 2: XANES spectra of a sample of La0.6Cao.4Co03
incorporated into an electrode (ELaO6), of a sample ofLa0.6Cao.4Co03 powder diluted with BN (1 : 5) (PLA06),and XANES spectra recorded in situ in an electro-chemical cell at La0.6Cao.4Co03-catalyzed electrodesat 0.9 V and 2.0 V vs. Zn, respectively.
Figure 2 shows the near-edge X-ray absorption spec-tra of an electrode measured in situ at 0.9 and 2.0 Vvs Zn, together with the XANES spectra recorded atsamples of Lao.6Ca0.4Co03 incorporated into an elec-trode (ELaO6) or as powder diluted with BN (1 : 5)(PLaO6).
The EXAFS spectrum of the La0.6Cao.4Co03 powderdiluted with BN (1 :5) has also been measured andthen analyzed using the multiple-shell data analysisprogram XDAP [2]. The Fourier transforms (Figure 3)show peaks at 1.57 and 3.25 A. The peak at 1.57 Acan safely be assigned to the oxygen shell, and consti-tutes an indication for the distance between Co andoxygen in this compound. Corrections for phase shiftsleads to a Co-0 distance of 1.9 A. The second peakmost probably is due to the X-ray scattering propertiesof Lanthanum. Work in preparation should showwhether there is any change in the nearest-neighbordistances when the electrode is used in the battery atdifferent potentials, or when the La/Ca ratio changes.
4 CONCLUSION
The results of in-situ and ex-situ X-ray absorption ex-periments on La04Ca0.6CoO3, La05Ca0.5CoO3,La0.6Cao.4Co03 and LaCoO3 powder samples reveal
10.0r(A)
Fig. 3: Fourier transform function of the EXAFS sig-nal obtained from the Lao.6Ca0.4Co03 powder sample.This representation shows distinct peaks at nearestneighbor distances.
that there is almost no shift at all in the Co K-edgewhen the La/Ca ratio is changed from 0.4/0.6 to 1/0,whereas a remarkable shift of the Co K-edge is ob-served when the perovskite is incorporated in the po-rous carbon electrode and the electrode is used in anelectrochemical cell at different potentials. The resultsobtained from the powder samples may be explainedin terms of an increase in oxygen deficiency whichoccurs with decreasing La/Ca ratio.
The shift of the Co-edge towards lower energies ob-served during preparation of the perovskite-catalyzedelectrodes indicates that a certain reduction of thecatalyst by the supporting carbon occurs at the prepa-ration temperature.
The shift of the Co-edge towards higher energies thatis observed while recording cyclic voltammograms atLa0.6Cao.4Co03-catalyzed electrodes indicates that theCo(lll)/Co(IV) redox potential must be close to theupper limit of the potential range (0.9 to 2.0 V vs. Zn)examined.
X-ray diffraction data have shown that the perovskitestructure on the whole is preserved in all samplestested in this work.
5 REFERENCES
[1] S. Muller, K.A. Striebel, O. Haas, Electrochim.Acta39, 1661 (1994).
[2] M. Vaarkamp, I. Dring, R.J. Stern, Koningsber-ger, D.C. Phys. Rev. B 50, 7872 (1994).

64
PULSED LASER DEPOSITION OF ELECTROCHEMICALLYACTIVE PEROVSKITE FILMS
M.J.Montenegro, T. Lippert, S. Muller, A. Wokaun, P. Willmott (University of Zurich)
Bifunctional catalysts play an important role in the realization of powerful electrically rechargeable metal-airbatteries. Perovskites such as La0.6Ca0ACoO3 are promising candidates for catalysing oxygen reductionand oxygen generation in bifunctional air electrodes. It has been shown that PLD is an attractive method toprepare thin, dense and crystalline films of perovskites on selected substrates.
1 INTRODUCTION
Oxygen reduction and evolution are important proc-esses in various electrochemical devices such as fuelcells or metal-air batteries. For electrically rechargeablemetal-air systems, there is a great challenge in develop-ing a catalyst active both for oxygen reduction and foroxygen evolution. Some materials such as perovskites,spinels and pyrochlores appear promising as bifunc-tional catalysts. In previous studies, good bifunctionalelectroactivity for oxygen reduction/evolution was dem-onstrated for La0.6Cao.4Co03 (LCCO) [1]. Carbon-supported metal oxides in porous gas-diffusion elec-trodes are usually prepared for activity investigations.Carbon is an inexpensive and highly conductive supportmaterial, but it acts also as an oxygen reduction catalystin alkaline medium and tends to be unstable under oxy-gen evolution conditions. These carbon properties giverise to difficulties in mechanistic studies and in theevaluation of catalyst performance. A different prepara-tion method must be used for preparing crystalline thinfilms of the catalyst well adhering to a stable, inactivesubstrate. Pulsed laser deposition (PLD) has beenshown to be a superior technique for the production ofcrystalline thin films of multicomponent oxides having awell-defined stoichiometry [2]. On a lattice matchedsubstrate, even single crystalline thin films can begrown.
2 EXPERIMENTAL
LCCO targets were prepared by pressing metal-oxidepowders synthesized by spray pyrolysis. The PLD ex-periments were carried out with a special PLD system atthe University of Zurich, [3]. The films were depositedon MgO substrates (10 x 10 x 0.5 mm) at 550 and650°C. The films were characterized by RutherfordBackscattering (RBS) and X-ray Diffraction (XRD)analysis.
The electrochemical activity of the LCCO film for oxygenevolution was measured with a three-electrode ar-rangement with the LCCO as working electrode, a Pt-wire as counterelectrode, and a Hg/HgO as referenceelectrode.
3 RESULTS AND DISCUSSION
The f i lm sto ich iometry (Lao.64±o.o4Cao.35±o.o2Coo.95±o.o503±o.2i)
was calculated from RBS spectra, confirming that thePLD technique is appropriate for the preparation of filmshaving the same stoichiometry as the target. A film
thickness of 470+20 nm and a surface roughness of12+2 nm were measured with a Dektak Profilometer.
(024)
(024)
(012)(208)
10 20 30 40 50 60 70 80 10 20 30 40 50 60 702O (degrees) 28 (degrees)
0.6
2,UJ 0.1
0 20 40 60
I (,uA cm 2)
Fig. 1: XRD spectra of the LCCO films and E vs Icurve.
The XRD spectra (Figure 1) reveal that the crystallinityof the oxide phase depends on the substrate tempera-ture. The first electrochemical measurements per-formed with LCCO on MgO (Figure 1, bottom) con-firmed the electrochemical activity of the films for theoxygen evolution reaction.
4 CONCLUSION
By adjusting the PLD conditions the crystallinity of thefilms can be controlled. This is an important parameterfor studying the catalytic activity of differently orientedcrystallite sites. Preliminary investigations revealed acatalytic activity for oxygen evolution on PLD films ofLCCO on MgO.
5 REFERENCES
[1] S. Muller, F. Holzer, O. Haas, J. Appl. Electrochem.28,895(1998).
[2] K. A. Striebel, C.Z. Deng, E. J. Cairns, Proc. of theElectrochem. Soc, 95-26, 112-120 (1995)
[3] P.R. Willmott, J.R. Huber, Rev. Mod. Phys., 72,No. 1 (2000).

65
STABILITY OF BIFUNCTIONAL AIR ELECTRODES DEPENDING ON THE CO2
CONTENT IN THE AIR AND STUDY OF DIFFERENT CO2 FILTER MATERIALS
F. Holzer, J.-F. Drillet (Fachhochschule Mannheim), T. Kallis (DaimlerChrysler AG), S. Muller
The stability of bifunctional oxygen electrodes used in electrically rechargeable zinc/air batteries was inves-tigated in air/air cells as a function of CO2 concentration in the feed gas supplied to the oxygen reducingelectrode. With pure oxygen as the feed gas, a limiting lifetime of about 2500 h was first attained at theoxygen evolving electrode. However, when CO2 concentrations of 400 to 10'OOOppm were present in thefeed gas, the lifetime of the oxygen reducing electrode was drastically shortened due to electrode degrada-tion by carbonate precipitation inside the pores of its gasdiffusion layer.Several alkaline CO2-adsorbing materials were tested for their filtering efficiency. It was found that the filtercapacity strongly depends on the relative humidity of the feed gas.
1 INTRODUCTION
Electrically rechargeable zinc/air batteries have veryattractive properties for many applications such asportable electric devices or electric vehicles. Majoradvantages are their high practical specific energy(approx. 100 Wh/kg), the low cost of zinc as the anodematerial, their reversibility in aqueous alkaline electro-lytes, and the low toxicity of the materials used in thisbattery system [1].
However, the cycle life of state-of-the-art zinc/air cellsis strongly influenced by carbonate deposits forming inthe porous gasdiffusion electrode due to the adsorp-tion of CO2 from the ambient air. Therefore, such analkaline battery requires a CO2 filter in order toachieve adequate cycle life performance of the bifunc-tional air electrode [1,2].
The CO2 filtering can be accomplished by hydroxidecompounds or amines, which have already been usedin some space applications and in alkaline fuel cellsoperated with ambient air [3]. Soda lime, NaOH, LiOH,Ca(OH)2 and mixtures of these compounds are cheapCO2 filter materials exhibiting low toxicity. Their actionis based on physical adsorption and chemisorptionprocesses [4].
The present work aimed at investigating the influenceof the CO2 concentration in air on the lifetime perform-ance of bifunctional oxygen electrodes, and the influ-ence of parameters such as filter material mass, airflow and air humidity on the CO2 filter efficiency.
2 EXPERIMENTAL
Bifunctional oxygen electrode
A driven air/air cell was used in the lifetime measure-ments of the bifunctional oxygen electrodes. In thiscell configuration, O2-reduction at the cathode and O2-evolution at the anode can be studied in parallel; theseprocesses correspond to the oxygen electrode reac-tions occurring during discharge and charging in anelectrically rechargeable zinc/air battery. The air/aircell was assembled from two identical 50 cm2 gasdif-fusion electrodes with La0.6Cao.4Co03 perovskite cata-lyst on a graphitised carbon substrate. The preparationof the bifunctional O2-electrodes has been describedelsewhere [2]. The electrolyte used was a 15% KOHsolution saturated with ZnO and containing 1.5 M KF.This electrolyte is normally used in electrically re-chargeable zinc/air batteries [2]. A constant current
density of 6 mA/cm was applied to the air/air cells intests run continuously without changing a cell's polar-ity.
CO2 filter
A commercially available plastic tube was used as thefilter body. The filter materials tested were: Soda lime,LiOH, and a mixture of LiOH and Ca(OH)2. The rela-tive humidity (RH) of the air feed was adjusted to 35 or90 % RH before the air entered the filter. The CO2
concentration in the air having passed the filter wasdetected with Nondispersive Infrared Spectroscopy(NDIR). The test equipment is detected in Figure 1.
rGas flowregulator
Humidifi
TestGas
Gas-outlet
Humidifier-Sensor |5ata Box"[J
Fig. 1: CO2 filter test equipment with gas flow regula-tor, humidifier, CO2 filter and data box for humidifierand CO2 sensor.
The end of filter life was defined as the time when theCO2 concentration in air past the filter, reached avalue of 100 ppm. The corresponding air volume inlitres is reported as the V100 value. The total amount ofCO2 taken up at that point (in mg adsorbed CO2 per gof adsorbent) is reported as the K1Oo value.
3 RESULTS AND DISCUSSION
Bifunctional oxygen electrode
Figure 2 shows the lifetimes of bifunctional O2-electrodes determined at a current density of6 mA/cm2 in pure oxygen and in air containing differ-ent amounts of CO2 (409, 1000 or 10'000 ppm). In theair/air cells, the 02-evolving electrode (anode) was thelife limiting electrode with a lifetime of approx. 2500 hwhen the O2-reducing electrode (cathode) was sup-

66
plied with pure 02. The life limiting electrode was thecathode when the experiment was performed withCO2-containing air. The lifetime of the bifunctional 02-electrodes was about 270 h when the air contained409 to 1000ppm of CO2, and about 60 h when theCO2 content of the air was 10'OOO ppm.
3
2.5
2
cN
S 1.5w
1
0.5
: D
Anode
B,C
B,C Cathode
500 1000 1500Time /h
2000 2500 3000
Fig. 2: Lifetime tests of bifunctional 02-electrodes.Cell potentials measured in pure O2 (A) and in air con-taining 409 ppm (B), 1000 ppm (C), or "lO'OOO ppm (D)of CO2.
The cells were disassembled after the experiments,and the electrodes were visually inspected. Qualitativeanalyses revealed that most carbonate particles werelocated in the pores of the cathode. This indicates thatirreversible carbonate precipitation takes place in thehydrophilic layer of the gasdiffusion electrode.
COz-filter
Figure 3 shows the CO2 filter capacities of soda lime,LiOH and a LiOH/Ca(OH)2 mixture (always with 9.2 gmaterial in test tube) according to tests with ambientair containing 409 ppm CO2, an air flow of 20 l/h, anda relative humidity of the air of 35 or 90 %.
1000 2000 3000
Total air volume /I
4000 5000
Fig. 3: CO2 filter capacities of 9.2 g filter materials inambient air (409 ppm of CO2) with a flow rate of 20 l/h:(A) 35 % RH, LiOH/Ca(OH)2, (B) 90 % RH, soda lime,(C) 90 % RH, LiOH/Ca(OH)2, and (D) 90 % RH, LiOH.
The filtering capacities are poor for dry air (35 % RH),however, a marked improvement is noticed when theair is humidified to 90 % RH. All adsorbents testedwere able to reduce the residual CO2 concentration toa level of 10 ppm. However, the experiment with LiOHhad to be stopped after 2100 I because of water ac-cumulation in the filter device. LiOH/Ca(OH)2 and sodalime exhibited similar filtering behaviours up to a re-sidual CO2 concentration of 20 ppm and a total airvolume of 2500 I. Beyond this point the CO2 concen-tration measured at the outlet of the soda lime filterincreased less steeply than that at the LiOH/Ca(OH)2
filter.
4 CONCLUSION
The lifetimes of bifunctional 02-electrodes in alkalineelectrolyte were studied as functions of the CO2 con-centration in the air feed. Since each electrode wasoperated either as an oxygen reducing or an oxygenevolving electrode, it was possible to distinguish dif-ferent aspects of the CO2 effects in the air electrodesand their propagation in the cell. The anode was thelife limiting electrode (2500 h) when pure oxygen wasthe feed gas at the cathode. With air containing 409 to1000 ppm of CO2, the cathodes failed after about270 h. Carbonate precipitation was responsible for thedrop in cathode potential.
For a longer lifetime of oxygen diffusion electrodes,CO2 must be removed from the air feed. CO2 adsorb-ents such as soda lime, LiOH and a LiOH/Ca(OH)2
mixture which are cheap and little toxic have beeninvestigated.
It was found that air humidity is an important factor forfiltering efficiency. Thus, with air having 90 % RH and409 ppm of CO2, all CO2 adsorbents studied were ableto filter at least 228 lair/g yielding a residual CO2 con-centration smaller than 20 ppm. The highest filter ca-pacities were obtained in some additional measure-ments with the LiOH/Ca(OH)2 mixture using 90 % RHambient air (367 mgcce/g)- It should be mentioned thatpure LiOH was unsuitable as a filter material, becauseit formed lumps at high air humidity.
5 ACKNOWLEDGMENTS
The authors thank Mrs. G. Masanz for preparing theoxygen electrodes. The financial support provided bythe Karl-Volker-Stiftung (Mannheim) is gratefully ac-knowledged by J.-F. Drillet and T. Kallis.
6 REFERENCES
[1] O. Haas, K. Wiesener, S. Mtiller, Chem. Ing.Techn. 68, 524-542(1996).
[2] S. Muller, F. Holzer, H. Arai, O. Haas, J. NewMater. Electrochem. Systems 2, 227-232 (1999).
[3] K. Kordesch, G. Simader, Fuel Cells and theirApplications, VCH Weinheim (1996).
[4] J.-F. Drillet, F. Holzer, T. Kallis, S. Muller, V.M.Schmidt, PCCP, in press (2001).

67
SUPERCAPACITORS BASED ON GLASSY CARBON AND SULFURIC ACID -MECHANISMS OF SELF-DISCHARGE
M. Hahn, M. Bartsch, B. Schnyder, R. Kotz, O. Haas, M. Carlen (ABB), D. Evard (Leclanche S.A.)
The self-discharge of a single cell double-layer capacitor (DLC) based on glassy carbon and sulfuric acidwas investigated. After an appropriate preoxidation treatment the discharge rate at a cell voltage of 1.0 Visfound to be below 1 mV/h and thus is as low as that of common organic electrolyte based double-layercapacitors at their rated cell voltage of 2.3 V. It is shown that the main part of the observed leakage currentis caused by irreversible decomposition of water and carbon, thereby determining the capacitors life time.The discharge rate is found to be independent on whether transport of solution species between the elec-trodes is being allowed or not. This indicates that no shuttle mechanism contributes significantly to theoverall self-discharge. Oxygen from ambient air is irreversibly consumed at the negative electrode.
1 INTRODUCTION
Self-discharge does not only affect the energy effi-ciency of the DLC by loss of charge, but may alsoaffect the life time by consumption of matter. Whetherthere is an influence on life time crucially depends onthe mechanisms of self-discharge [1]. We have toconsider at least two possible pathways:
(i) Reaction-rate controlled leakage by irreversibledecomposition of electrode material or electrolytesolution.
(ii) Diffusion-limited leakage by a redox couple, givingrise to a shuttle transport between the two electrodes.This redox species may be an impurity (e.g. Fe3+/Fe2+)or an intrinsic redox couple, being produced by re-versible conversion of electrode material or electrolytesolution (e.g. H+/H2). The corresponding dischargerate must drop to zero when any transport betweenthe half-cells is prevented.
Only if self-discharge is due to an irreversible elec-trode reaction (route i), then the electrode materialand/or the electrolyte solution are consumed and reac-tion products are accumulated inside the cell accord-ing to Faradays law. Clearly, this kind of process willaffect the capacitors life time. On the other hand, ifself-discharge proceeds via a shuttle mechanism(route ii), there is no net consumption of matter andconsequently no ageing.
2 POSSIBLE ELECTRODE REACTIONS
The thermodynamically possible reactions for the sys-tem carbon / sulfuric acid and their equilibrium poten-tials are the following [2]:
£° = 0.00 V
£° = 0.21 V
£° = 0.52 V
2 H -
C02
CO 4
O2 +
v2e
+ 4H+
-2H+
4H%
<=>
+ 4e"
+ 2e"
-4e~
H2
•^
<=>
C +
C +
2H2O
2H2O
H2O
£°= 1.23 V
(1)
(2)
(3)
(4)
As a fifth reaction the formation of a wide variety of notwell defined surface oxides has to be added. At least apart of these oxides contributes to reversible chargestorage. For glassy carbon up to some 10 % of thedifferential capacitance may be attributed to thispseudo-capacitance [3].
Finally iron, being an ubiquitous impurity in organicmaterials, could act as a shuttle depolarizer accordingto
Fe3 Fe2 £° = 0.77 V (5)
Equations (1) and (2) determine the narrow potentialwindow of 0.21 V, where the system is expected to bethermodynamically stable under standard conditions.Actually, due to the high overvoltages of most of thereactions above, a much wider 'kinetic' potential win-dow of about 1 V is accessible without too much de-composition.
It is well known that the oxidation of carbon by evolu-tion of gaseous COX, equation (2) and (3), is totallyirreversible under the present conditions [2]. The situa-tion is less clear for the possible oxidation of H2 (equa-tion (1)) at the positive electrode, which could give riseto a shuttle process, and also for the possible reduc-tion of O2 at the negative electrode [2]. The latter reac-tion involves at least the intermediate production ofperoxide, H2O2, via
£° = 0.67 VO2 + 2H+ + 2e~ H2O2 W 2 (6)
which may either be further reduced to water accord-ing to
H2O2 + 2H+ + 2e" <=> 2H2O £° = 1.77 V (7)
or, alternatively, diffuse back to the positive electrode,thereby providing a shuttle according to equation (6).Recently this redox couple was suggested to causethe self-discharge of double-layer capacitors based onactivated carbon and aqueous electrolytes [1]. It isworth to note that oxygen is not only a possible reac-tion product (equation 4), but is always expected toremain absorbed to some extend in the porous elec-trodes even if these are vacuum degassed at elevatedtemperature prior to use.
3 RESULTS
Figure 1 shows a typical measurement of current ver-sus time at a constant voltage of 1.0 V. Upon floodingthe chamber with argon, the current significantly de-creased within a few hours. This effect must be attrib-uted to the elimination of oxygen from ambient air,which had diffused through the sealing and reactedinside the cell. However, even in argon atmosphere

68
the current remains at a non-zero level after 70 hoursand still tends to decrease slightly.
20 40 60 80
Time [hours]
Fig. 1: Residue Current at V= 1.0 V.
Much lower discharge rates (less than 1 uA at 1.0 V)were attained after holding the capacitor first 72 hoursat 1.4 V and then 48 hours at the respective voltage.
300
o
-300 O-0.25 0.00 0.25 0.50 0.75 1.00 1.25
E vs. SHE [V]
Fig. 2: //E-characteristic of the capacitor. The insetdepicts the cell equivalent circuit.
Figure 2 shows the 'steady state' //E-characteristicdetermined by the latter procedure. Probably a signifi-cant part of the slowly decreasing current during thefirst days results from the formation of surface oxidesinside the porous layer of the positive electrode.
Hydrogen and carbon dioxide are the only gaseousproducts that could be identified by electrochemicalmass spectroscopy. Even for a cell voltage of 1.4 Vthe potential of the positive electrode is below theNernstian potential for oxygen-evolution, 1.23 V vs.SHE. Thus, oxygen is not being produced by decom-position of water, as sometimes assumed.
Instead of measuring the residue current at constantvoltage the discharge rate can also be determined bymonitoring the cell voltage, V, and the electrode poten-tials, E+ and E, at open circuit. The residue currentand the voltage (potential) change at open circuit arerelated by
~dt~ +~dtdE_dt
(8)
where C, C+, and C are the capacitances of the celland the single electrodes, respectively (c. the equiva-lent circuit in Figure 2).
50 100 150
Time [hours]200 250
Fig. 3: Potential decay with shutter continuouslyopened (solid line) and shutter closed after 70 hours(dotted line).
Figure 3 depicts the potential decay of the half-cellsdetermined by this procedure (solid line). Prior toopening the circuit the cell was kept 5 days at a con-stant voltage of 1.4 V. For a cell voltage of 1.0 V thecell discharge rate is significantly below 1 mV/h.
The experiment was repeated, but now the half-cellswere separated after 70 hours by closing an electro-lyte-tight shutter (Figure 3, dotted line). The slopeAEJAt is almost identical before and after the shutterhas been closed. The sharp drop at the negative elec-trode is caused by oxygen that is inevitably introducedwhen moving the shutter. These results prove thatthere is no significant contribution of any shuttle proc-ess to the overall self-discharge.
4 ACKNOWLEDGEMENT
Financial support by CTI (project no. 4096.1) is grate-fully acknowledged.
5 REFERENCES
[1] B. E. Conway, Electrochemical Supercapacitors:Scientific Fundamentals and Technological Appli-cations, Kluwer, New York (1999).
[2] K. Kinoshita, Carbon: Electrochemical and Phys-icochemical Properties, Wiley, New York (1988).
[3] M. Hahn, M. Bartsch, B. Schnyder, R. Kotz, O.Haas, C. Ohler, M. W. Carlen, 10th Seminar onDouble Layer Capacitors and Similar EnergyStorage Devices, Deerfield Beach, FL, 2000.

69
THE CORRELATION OF THE IRREVERSIBLE CHARGE LOSS OF GRAPHITEELECTRODES WITH THEIR DOUBLE-LAYER CAPACITANCE
F. Joho, M.E. Spahr (TIMCAL SA), H. Wilhelm (TIMCAL SA), P. Novak
Cycling of graphite in lithium-ion batteries is reversible except for the first cycle where some charge is "lost"due to irreversible side reactions. The irreversible charge loss of different TIMRE)f graphites was found tobe a linear function, both of their specific BET surface areas and of the double-layer capacitance of elec-trodes manufactured from these graphites.
1 INTRODUCTIONDuring recent years extensive work has been carriedout toward increasing the energy density of lithium-ionbatteries. Progress has mainly been made by improv-ing the carbonaceous material of the negative elec-trode [1] and especially by replacing amorphous cokematerials by more highly crystalline graphitic materials.A major problem of the carbonaceous materials istheir "charge loss" during the first cycle, which con-sumes lithium that must be brought into the cell in theform of a relatively heavy lithium metal oxide such asLiCoO2. It is generally accepted that this irreversiblecharge loss or irreversible capacity seen during thefirst Li+ insertion into graphite electrodes is caused bythe formation of a solid electrolyte interphase (SEI) onthe graphite particles that prevents further electrolytedecomposition at the negative electrode [1,2].
2 RESULTS AND DISCUSSION
The irreversible capacity seen during the first reduc-tion cycle affects the available capacity of a lithium-ioncell [1]. On the other hand, an ideal solid electrolyteinterphase (SEI) that is formed as a surface film isessential for the functioning of the graphite negativeelectrode. This means that SEI film must be as thin aspossible so as to keep the charge losses as small aspossible. It is almost universally accepted in the litera-ture [1,2] that the irreversible charge loss occurringduring the first reduction cycle depends on the elec-trode surface area and on the specific BET surfacearea of the graphite material used in the negative elec-trode, because the SEI covers all the surface areaexposed to the electrolyte solution. In order to find anyother influence on the irreversible charge loss, weinvestigated different types of graphite.Figure 1 shows the irreversible capacities of the firstcharge/discharge cycle plotted as a function of theBET surface areas determined for synthetic TIMREX®graphites of the KS, SFG, T, E-SLX and SLM type aswell as for the natural graphite TIMREX® E-NP 15. Itcan be seen that this function is linear. A linear re-gression fit of the experimental data resulted in a cor-relation factor R2 of 95 %. It must be pointed out, how-ever, that the experimental conditions are very impor-tant for consistent and reproducible results. We chosea small specific current (about C/36) and room tem-perature for galvanostatic charging of the cell in thefirst cycle in order to complete formation of the SEIlayer and maximise the irreversible capacity in the firstcycle of the electrode.
o
3CDCD
hat
o_o>
sib
ever
ju -
25
20
15
10 -
R
AO
0V•0
rj
KS typeSFG typeTtypeSLM 44E-SLX typeE-NP 15Linear Regression
I I I
y^
> A
f(x)=2.55+1.18xR2=0.95
!
8 10 12 14 16 18 20 22
BET surface area / m2g"1
Fig. 1: Irreversible charge loss of the first electro-chemical Li+ intercalation into different synthetic andnatural TIMREX® graphites as a function of the spe-cific BET surface areas.
The first cycle of an electrode containing TIMREX® E-SLX 50 as the active material is presented as an ex-ample in Figure 2. It shows a galvanostaticcharge/discharge curve typical for highly crystallinegraphite electrode materials, with reversible Li+
intercalation/deintercalation occurring at potentialsbelow 0.2 V vs. Li/Li"1". The SEI formation takes placeat potentials between 0.8 V and 0.2 V vs. Li/Li+ in theLi+ insertion (charging) half cycle. The specific BETsurface area of this sample was 3.9 m2/g. The firstcharging of the electrode consumed 385 Ah/kg, whilethe reversible capacity was 360 Ah/kg. The chargeloss or irreversible capacity (Cirrev.) of this sample ascalculated by the formula
Cin' int .
was 6.5 %, Cint. is the specific charge recorded in thefirst Li+ intercalation, and Crev is the reversible specificcharge recorded in the corresponding Li+ deintecala-tion.
Electrodes containing the different TIMREX® graphitesall exhibited reversible capacities of ca. 360 Ah/kg at aspecific current of 10 mA/g (both figures being re-ferred to the mass of graphite in the negative elec-trode). The data obtained for the irreversible capacityin the galvanostatic charge/discharge experiments aswell as for the double-layer capacitance obtained fromimpedance measurements are summarised in table 1.

70
0.4 0.6
x in Li C.
0.8 1.0 1.2
Fig. 2: First galvanostatic charge/discharge cycle of aTIMREX® E-SLX50 negative electrode at 10mA/ggraphite in a 1 M LiPF6, EC:DMC (1:1) electrolyte.
A linear function is also obtained when the chargelosses or irreversible capacities of graphite electrodescontaining the same TIMREX® graphites are plottedagainst their double-layer capacitance as determinedby impedance spectroscopy (Figure 3). Here the cor-relation factor was 96 %. For a reliability test of ourresults, the double-layer capacitance found in all 38measurements were divided by the correspondingspecific BET surface areas. From this calculation weobtained an average double-layer capacitance of ca.4 ( iFcm2 .
Product
KS6KS10KS15KS25KS44SFG6SFG10SFG15SFG44T15T44SLM44E-SLX 20E-SLX 30E-SLX 50E-NP15
specific BETsurface area
mV19.413.812.312.08.315.210.08.54.311.28.14.57.74.83.98.4
chargeloss
%24.820.018.014.612.521.016.014.09.615.210.78.010.77.56.511.8
specific doublelayer capacitance
Fg"1
0.769
0.587
0.3150.688
0.3370.1860.3970.273
0.3310.1570.1380.347
Table 1 : Properties of investigated graphites.
There are some differences between the two plots:irreversible charge loss vs. specific BET surface areas(Figure 1) and irreversible charge loss vs. double-layercapacitance (Figure 3), but the linear regression fit isequivalent. The instances of departure of the datafrom the straight-line fit might be attributed to a mate-rial parameter other than the BET surface areas.However, it is not certain whether these deviations aresignificant. Minor differences in electrode manufactur-ing and in the experimental set-up may be responsiblefor these differences.
In this context, it is remarkable that TIMREX graph-ites of the SFG type have relatively high irreversiblecapacities, while graphites of the E-SLX type haverelatively low irreversible capacities.
io
rge
<$o0)
JD
0)
1
25 -
20 -
15 -
10 -
5 -
AO
o0n
pi
KS typeSFG typeTtypeE-NP15E-SLX typeLinear Regression
111 U
i ! ^ ' A
!^fi ! ! ! !f(x)=3.51R2=0.96
A
+26.4X
0.1 0.2 0.3 0.4 0.5 0.6
spec. Cdl / Fg"1
0.7 0.8 0.9
Fig. 3: Irreversible charge loss of the first electro-chemical reduction of different synthetic and naturalTIMREX® graphite electrodes as a function of theirdouble-layer capacitance calculated from impedancespectroscopic measurements at 2.5 V vs. Li/Li"1".
3 CONCLUSIONThe irreversible capacities of the first Li+ intercalationin graphite negative electrodes linearly depend on boththe specific BET surface areas of the graphite materi-als and the double-layer capacitance of the corre-sponding graphite electrodes. Since the specific BETsurface areas and double-layer capacitance also ex-hibit a linear relationship, we conclude that the surfacearea of the graphite mesopores contributes to theelectroactive surface, i.e. almost all graphite pores arewetted by the liquid electrolyte solution used in lithium-ion batteries. Finally, there are some other influenceson the irreversible charge loss, but their nature andmechanism are not clear yet.
4 ACKNOWLEDGEMENT
The technical assistance of A. Blome and B. Rykart isgratefully acknowledged.
5 REFERENCES
[1] A. Yoshino, Abstract ISIC 10, 31A5, Okazaki,Japan (1999).
[2] E. Peled, in: J.-P. Gabano (Ed.), Lithium Batter-ies, Academic Press, London, 43 (1983).
[3] J.R. Dahn, A.K. Sleigh, H. Shi, B.M. Way, W.J.Weydanz, J.N. Reimers, Q. Zhong, U. vonSacken, in: G. Pistoia (Ed.), Lithium Batteries,New Materials, Developments, and Perspectives,Elsevier, Amsterdam, 1 (1994).
[4] see e.g., M. Broussely, P. Biensan, B. Simon,Electrochim. Acta 45, 3 (1999).
[5] R. Fong, U. von Sacken, J.R. Dahn, J. Electro-chem. Soc. 137, 2009(1990).
[6] B. Simon, S. Flandrois, A. Fevrier-Bouvier, P.Biensan, Mol. Cryst. Liq. Cryst. 310, 333 (1998).

71
IN-SITU NEUTRON RADIOGRAPHY OF LITHIUM-ION BATTERIES DURINGCHARGE/DISCHARGE CYCLING
M. Lanz, E. Lehmann, W. Scheifele, R. Imhof (Renata AG), I. Exnar (Renata AG), P. Novak
Commercial, prismatic lithium-ion cells (Renata AG, Switzerland), were investigated using neutron radiog-raphy. The measurements revealed that an excess of electrolyte initially present in the cells was con-sumed after first cell charging and solid electrolyte interphase formation. In-situ neutron radiography of thelithium-ion cells during the first electrochemical charge/discharge cycles showed a displacement of suchexcess electrolyte owing to volume changes of the electrode assembly as well as to an evolution of gasesin the first charging cycle.
1 INTRODUCTION
In-situ techniques are useful tools for investigating theprocesses occurring in lithium-ion cells during electro-chemical cycling [1]. Applying in-situ measurementsdirectly to commercial lithium-ion batteries would beadvantageous for a correct identification of certainprocesses taking place therein. Neutron radiography(NR) appears as a useful, non-destructive inspectionmethod for the study of lithium-ion cells. The neutronsare strongly attenuated both by Li and by the H atomsof the organic electrolyte used in lithium-ion cells (at-tenuation of a neutron beam is caused by scatteringand/or absorption of neutrons), whereas the metallicparts of the lithium-ion cell are rather transparent toneutrons [2]. We therefore applied NR to the in-situstudy of a commercial, rechargeable lithium-ion bat-tery [3].
2 EXPERIMENTAL
Lithium-ion cells and electrochemical cycling: Pris-matic lithium-ion cells, type ICP-340848 from RenataAG, Switzerland, having a nominal capacity of 950mAh and an aluminium casing, were investigated. Thecells examined here did not undergo the factory-typecell formation step of commercially available cells. Inthe electrochemical cycling experiments, the cellswere charged up to a cell voltage of 4.1 V at a currentrate of 1 C (950 mA), then the voltage was maintainedat 4.1 V for 2.4 h. Discharge was performed at a cur-rent rate of 1 C, down to a cell voltage of 3.0 V.
Neutron radiography: NR images were taken at theNEUTRA facility [4] of the spallation neutron sourceSINQ at the PSI. The lithium-ion cells were fixed be-tween two aluminium plates (thickness 3 mm) set-upin the neutron beamline. NR images were taken every10 to 20 minutes during electrochemical cycling. Theexposure time per image was about 30 seconds. Theneutrons passing through the samples were absorbedon a neutron-sensitive scintillation screen, and thescintillation light was detected by a nitrogen-cooledCCD camera. Alternatively, a Gd-doped imaging plate(resolution 50 (im) was used for high-resolution NRimages.
3 RESULTS AND DISCUSSION
Measurements before/after electrochemical cycling:Figure 1 shows NR images of a fresh lithium-ion cell(left) and of a lithium-ion cell after 70 electrochemicalcharge/discharge cycles (right). The electrode assem-
bly comprising the anode, the cathode and the separa-tor sheets, is soaked with an organic electrolyte con-taining a lithium salt, and appears dark in the NR im-age due to the strong neutron beam attenuation of theH and the Li atoms. The aluminium casing is hardlyvisible because of its weak neutron beam attenuation[2]. In the fresh lithium-ion cell (left), a small excess ofliquid electrolyte is seen at the lower left and rightedges of the casing, which was not taken up by theelectrode assembly. In the lithium-ion cell with 70 elec-trochemical charge/discharge cycles (right), no excesselectrolyte is left, showing that it was irreversibly con-sumed during cycling. This observation can be ac-counted for by the formation of a protecting solid elec-trolyte interphase (SEI) on the electrode surfaces,which may be accompanied by gas evolution [5,6].The SEI layer is built up mainly in the first chargingcycle (formation cycle), but part of this process canextend beyond the first charging [7].
Fig. 1: Left: NR image of a fresh lithium-ion cell (ICP-340848 from Renata AG). The arrows point to theelectrolyte level. Right: A lithium-ion cell after 70 fullcharge/discharge cycles.
In-situ measurements: The macroscopic changesoccurring in lithium-ion cells during electrochemicalcycling can best be visualized by creating a "refer-enced image", i.e. by constructing an intensity ratioimage from two NR images taken at different chargingstages. Figure 2 shows an example. To constructFigure 2, an NR image of two cells (A and B), placedside by side in the neutron beamline and electro-chemically charged simultaneously, was taken duringthe first charging cycle after a 1.8 h charging time, andthen graphically divided by an NR image of the samecells taken before charging, at t = 0, and the resultingimage was subsequently normalized to obtain an ap-propriate grey-scale image. The cell (A) on the left-

72
hand side of Figure 2 had been charged to 380 mAh(at a C/3 current rate) before sealing of the cell in anargon-filled dry-box one day before the NR experi-ment, whereas the cell (B) on the right was fresh (un-charged) at the beginning of the experiment. Darkareas in the referenced image indicate a strongerneutron beam attenuation of the NR image taken at t =1.8 h, while bright areas indicate a weaker attenuation.
The referenced image in Figure 2 shows that the ex-cess electrolyte filling level had increased in both cells,due to the following reasons: (i) During the charging ofthe lithium-ion cells, the thickness of the electrodesincreased to some extent because of an expansion ofthe lattice constants of the electrode materials duringlithium insertion or extraction, respectively [8]. There-fore, part of the electrolyte was displaced and in-creased the filling level of the cells, (ii) In the cell (B)on the right of Figure 2, the bright area indicates that adisplacement of electrolyte had taken place at thebottom of the cell, which was presumably due to gasevolution under initial charging of the cell. The gaswas held back by the electrode assembly, and there-fore it could not immediately rise to the top of the bat-tery casing. This effect further increased the electro-lyte filling level, and therefore, the filling level changewas more pronounced in the cell (B) of Figure 2. Thecell (A) did not show this displacement related to gasformation, because most of the gas evolution hadalready taken place when the cell had been charged to380 mAh before the beginning of the experiment.
probably indicates a consumption of electrolyte due toSEI formation.
A \
I
Fig. 2: Referenced image (see text) of two lithium-ioncells placed in the neutron beamline. The referencedimage was constructed from NR images taken after a1.8 h charging time and at t = 0. The cell (A) had beencharged to 380 mAh before the experiment, whereasthe cell (B) was uncharged at the beginning.
Figure 3 displays how the electrolyte filling level of thecell (A) shown in Figure 2 varied during the first threeelectrochemical half-cycles. The level increased at thebeginning of a charging cycle, and it decreased duringdischarge. This observation correlates well with thecorresponding expansion/contraction processes of theelectrodes. A similar behaviour was found for cell (B)of Figure 2, but the initial increase at the beginning ofthe first charging cycle (during the first ten minutes)was even more pronounced in this case, the reasonbeing gas evolution as described above. After the firsthour of charging, the electrolyte filling level decreasedslowly during further charging, see Figure 3, which
0 1 2 3 4 5 6
Time [h]
Fig. 3: Charge and electrolyte filling level of a lithium-ion cell [cell (A) of Figure 2] as functions of time duringinitial cycling. Square symbols with error bars indicateaverage values of two successive NR images in eachcase.
4 CONCLUSION
Neutron radiography is a useful tool for the non-destructive investigation of lithium-ion batteries. It canbe used to optimize the electrolyte soaking and theformation process in the industrial development oflithium-ion batteries.
5 ACKNOWLEDGEMENTS
We thank Dr. F. Joho and Dr. O. Haas for helpful dis-cussions. The financial contribution of the Commissionfor Technology and Innovation (KTI), Bern, is gratefullyacknowledged.
6 REFERENCES
[1] P. Novak, J.-C. Panitz, F. Joho, M. Lanz, R. Im-hof, M. Coluccia, J. Power Sources 90, 52-58(2000).
[2] M. Kamata, T. Esaka, S. Fujine, K. Yoneda, K.Kanda, J. Power Sources 68, 459-462 (1997).
[3] M. Lanz, E. Lehmann, R. Imhof, I. Exnar, P.Novak, submitted for publication.
[4] E. Lehmann, P. Vontobel, PSI Scientific Report1998, VI, 61-65(1999).
[5] R. Imhof, P. Novak, J. Electrochem. Soc. 145,1081-1087(1998).
[6] R. Imhof, P. Novak, J. Electrochem. Soc. 146,1702-1706(1999).
[7] P. Novak, F. Joho, M. Lanz, B. Rykart, J.-C.Panitz, D. Alliata, R. Kotz, O. Haas, J. PowerSources, submitted.
[8] M. Winter, J.O. Besenhard, M.E. Spahr, P.Novak, Adv. Mater. 10, 725-763 (1998).

73
ELECTROCHEMICAL QUARTZ CRYSTAL MICROBALANCE INVESTIGATION OFLITHIUM INTERCALATION INTO GRAPHITE ELECTRODES FOR
LITHIUM-ION BATTERIES
M. Lanz, P. Novak
The electrochemical intercalation of lithium into graphite electrodes and the formation of a solid electrolyteinterphase on these electrodes were investigated with an electrochemical quartz crystal microbalance.
1 INTRODUCTION
Graphites are often used as intercalation materials forthe negative electrode of today's commercial lithium-ion batteries. Here, we investigate how the electro-chemical quartz crystal microbalance (EQCM) can beapplied as an in-situ method to study the processesoccurring during the first charging of graphite elec-trodes [1,2].
2 EXPERIMENTAL
5 MHz, AT-cut quartz crystals (Vectron International),with 0.3 cm2 active area of titanium sputter-depositedin a keyhole shape, were coated with graphite TIM-REX SFG 6 (TIMCAL Group) by an air-brush coatingtechnique [3]. The loading of the electrode was lessthan one monolayer of graphite particles, with an av-erage particle size of ca. 3 |im. The electrochemicalcell is shown in Figure 1. The quartz crystal was fixedat the bottom of the polypropylene cell body with sili-cone adhesive. The cell was dried at 80°C and filledunder argon with the electrolyte, 1 M LiPF6 in 1:1 eth-ylene carbonate/dimethyl carbonate (Merck LP30).Metallic lithium was used as the counter and referenceelectrode. The quartz crystal was connected to aresonator [4], which was used in combination with afrequency counter and a potentiostat.
Cell body
Resonator
Metallic lithiumcounter/referenceelectrode
Graphiteworkingelectrode
5 MHz Quartz crystal
Fig. 1: EQCM cell for lithium intercalation studies ongraphite electrodes.
3 RESULTS AND DISCUSSION
Figure 2 shows a cyclic voltammogram (first cycle) at1 mV/s and the corresponding EQCM frequency re-sponse of a graphite SFG 6 electrode. The mass ofthe graphite electrode increased (frequency decreaseof the quartz crystal) during lithium intercalation intothe graphene layers, and it decreased (frequency in-crease) during the reverse process. The reductivesweep showed a distinct frequency decrease peakaround 0.7 V, which is related to the formation of a
solid electrolyte interphase. Some other features in thereductive sweep are not yet well understood. The sus-tained frequency decrease between ca. 1.8 V and 0.7V is possibly due to an electrochemical double-layercharging of the electrode surface, a viscoelastic cou-pling of the quartz crystal coverage to the electrolyte,as well as a viscosity change of the electrolyte solutionclose to the electrode. In the oxidative sweep, theanodic peak (lithium extraction from the graphite) inthe cyclic voltammogram correlates well with a fre-quency increase of the quartz crystal. However, thefrequency change does not obey the mass-frequencycorrelation predicted by the Sauerbrey equation [1],probably because of the relatively large size of thegraphite particles and the non-uniform electrode cov-erage.
0.0 1.0 2.0Potential / V vs. Li/Li+
Fig. 2: Cyclic voltammogram (first cycle) and EQCMresponse of a graphite TIMREX SFG 6 electrode.
4 ACKNOWLEDGEMENTS
We thank Dr. R. Kotz, Dr. O. Haas and Dr. F. Joho forhelpful discussions, and R. Schraner (UniversitatBern) and R. Hugi for technical aid. M. Horisberger isacknowledged for sputtering the quartz crystals.
5 REFERENCES
[1] D.A. Buttry, in: A.J. Bard (Ed.), Electroanal.Chem. 17, Marcel Dekker, New York, 1-85(1991).
[2] M. Morita, T. Ichimura, M. Ishikawa, Y. Matsuda,J. Power Sources 68, 253-257 (1997).
[3] R. Imhof, P. Novak, J. Electrochem. Soc. 145,1081-1087(1998).
[4] M.C. Miras, A. Jaggi, R. Kotz, PSI - TechnischeMitteilung TM-51-91-14 (1991).

74
DEVELOPMENT OF A 10 KW SUPERCAPACITOR MODULE FOR FUEL CELL CARAPPLICATION
M. Bartschi, S. MO Her, B. Schnyder, R. Kotz, V. Hermann (montena components s.a.),A. Schneuwly (montena components s.a.), R. Gallay (montena components s.a.)
Electric double layer capacitor electrodes based on high-surface area carbonaceous material and an Al-foilcurrent collector were fabricated on a semi-industrial coating machine. From these electrodes 2.5 V/800 Fsupercapacitors were industrially manufactured. 50 supercapacitors of this type were connected pair wisein a 25 series to obtain a module with 60 F and 60 V. The electrical series resistance of the module wasmeasured to be 0.02 Q. The maximum specific power and energy measured for the 800 F supercapacitorwas 5 kW/kg and 2.5 Wh/kg, respectively.
1 INTRODUCTION
During the last few years extensive research and de-velopment has been done in the field of double-layercapacitors so called supercapacitors. Supercapacitorsoperate at high power (above the power supplied byconventional batteries) and deliver a considerablequantity of energy (above the energy supplied by con-ventional capacitors) [1]. Combined with a fuel cell, thesupercapacitor can be used in automotive applicationsto supply the extra power needed for acceleration, andto store energy during breaking, which can be reusedin the next acceleration process [2]. This paper de-scribes research and development steps towards thedemonstration of a 10 kW supercapacitor module.
2 EXPERIMENTAL
2.1 Electrodes
Suspended activated carbon in an appropriate sol-vent/binder mixture has been coated on two sides of athin aluminium-foil. The coating process was per-formed on a semi-industrial coating machine using aslit-coating process. The slit of the coating head wasadjusted to a size leading to a final thickness of the drycarbon coating of approximately 150 |jm on each side.
2.2 Supercapacitor single cell
The electrodes were industrially wound, dried, impreg-nated with an organic electrolyte (1 M tetraethylam-moniumtetrafluoroborate in acetonitril) and finallymounted into a cylindrical housing. Information aboutthe internal series resistance, the time constant, thecapacity, the specific energy and power of the super-capacitors was obtained by impedance spectroscopy[3].
2.3 Supercapacitor module
50 supercapacitor units were connected pair wise to a25 series. A low internal resistance of the single cellsas well as a low resistance along the current path in
the module is a prerequisite to meet the high powerdemand of the fuel cell powered car. Due to its su-preme electrical conductivity, oxygen free high con-ductivity (OFHC) copper was chosen as connectingmaterial although the heavy specific weight. The cur-rent transmitting joints were eroded to its specific formfrom a 3 mm thick plate and after polishing (to removethe insulating copper oxide layer) mounted accordingto Figure 1.
Fig. 1: Assembly of the supercapacitor module.
2.3.1 Voltage balancing
Due to the slightly different capacities of the singlecells, charging and recharging of the module wouldlead to different voltages of the single cells, whichcould result in the early damage of a single cell, toolong exposed to a voltage above 2.5 V. Therefore anelectronic device, which protects the single cells formovercharge (compare Figure 4) was developed at theSwiss Federal Institute of Technology (EPFL) andconnected to our supercapacitor module [4].
3 RESULTS
3.1 Supercapacitor single cell
The single cells delivered a capacity of 800 F (calcu-lated from impedance spectroscopy at a frequency of10 mHz) at 2.5 V. The electrical series resistance(ESR) was 1.2 mQ, which leads to a time constant x of0.96 s. The maximum specific power was 5 kW/kgand the maximum specific energy was 2.5 Wh/kg, asshown in the Ragone Plot of Figure 2.

75
specific power / (W/kg)
0.001
0.01 -
o
oCDQ .
100 1000 10000
Fig. 4: Detailed view of the voltage balancing elec-tronic and the copper connections between singlecells.
Fig. 2: Ragone Plot of an 800 F single cell.
3.2 Supercapacitor module
The complete 10 kW module connected to the voltagebalancing electronic is shown in Figure 3 and 4. Themodule delivered a capacity of 60 F at a voltage of60 V. The ESR was 0.02 Q and the time constant xwas 1.4 s.
Si *t #t ft ** 11 Ik•'!'• it I t -Hi '•% U
<*
JkJ.
Fig. 3: Supercapacitor module including the voltagebalancing electronic.
4 CONCLUSION
Thin layer carbonaceous electrodes were successfullyfabricated on a semi-industrial coating machine. Su-percapacitors consisting of these electrodes and anorganic electrolyte exhibited maximum specific energyand power of 2.5 Wh/kg and 5 kW/kg, respectively.Finally 50 supercapacitors were connected to a60 V / 60 F module displaying a low ESR of 0.02 Q.
5 ACKNOWLEDGMENTS
We thank Prof. Rufer and Dr. Barrade from the SwissFederal Institute of Technology, Lausanne for provid-ing the electronic voltage balancing device.
6 REFERENCES
[1] R. Kotz, M. Carlen, Principles and applications ofelectrochemical capacitors, Electrochimica Acta45, 2483-2498 (2000).
[2] W.G. Pell, B.E. Conway, W.A. Adams, J. de Oliv-iero, Electrochemical efficiency in multiple dis-charge/recharge cycling of supercapacitors in hy-brid EV applications, J. of Power Sources 80,134-141 (1999).
[3] T. Christen, M. W. Carlen, Theory of Ragoneplots, J. of Power Sources 91, 210-216 (2000).
[4] A. Schneuwly, R. Gallay, Properties and applica-tions of supercapacitors from the state-of-the-artto future trends, PCIM 2000, June 00, Nurnberg.

76
GRAFTED, CROSS-LINKED CARBON BLACK AS A DOUBLE-LAYER CAPACITORELECTRODE MATERIAL
R. Richner, S. Muller, A. Wokaun
Isocyanate prepolymers readily react with oxidic functional groups on carbon black. On carbon blackgrafted with diisocyanates, reactive isocyanate groups are available for cross-linking to a polyurethanesystem. This cross-linked carbon black was considered as a new active material for electrochemical elec-trodes. Active material for electric double-layer capacitor electrodes was produced which had values ofspecific capacitance of up to 200 F/g. Cross-linking efficiencies of up to 58 % of the polymers utilised wereachieved.
1 INTRODUCTION
During recent years, carbon black has received in-creasing attention for applications in battery and fuelcell electrodes. It is also used in electric double-layercapacitors (EDLC) [1]. Commercial EDLCs depend onthe high surface area available in carbon electrodesand on the resulting double-layer capacitance of suchelectrodes in electrolyte solution. Apart from their highsurface area, carbon blacks possess chemical surfacegroups. Their nature and number depend on the pro-duction process and on pretreatment. Carbon-oxygencompounds are the most important surface groupsinfluencing the physicochemical properties of carbonblacks [2]. These surface groups can be utilised forthe grafting of polymeric precursors or prepolymers.Conventional active materials for carbon-based ca-pacitors are prepared from a suspension of carbona-ceous materials in a binder solution or with suspendedbinder applied to a current collector by a coating tech-nique to form electrodes [1,3]. An adhesive binder willalways tend to block large part of the carbon's highsurface area, thus the performance of the electrodewill strongly decrease owing to occlusion of the finepores providing the major contribution to a high dou-ble-layer capacitance [4].
In this paper we describe a new concept according towhich prepolymers are grafted onto carbon black.These prepolymers are then cross-linked to form anactive material. From the grafted diisocyanate pre-polymers and polydiols, a polyurethane network canbe built up which incorporates the carbon black viachemical bonds. By selecting prepolymers of an ap-propriate size one can circumvent the problem that animportant fraction of the pores becomes occluded inthe process. Cross-linked active material is expectedto have some major advantages over the conventionalactive material.
We examined the reactions of appropriate prepoly-mers with carbon black powder with a view to achiev-ing enhanced adhesion of the binder and forming elec-trode materials retaining the unique surface area andporosity of the constituent carbons, which is a prereq-uisite for their application in EDLCs.
2 EXPERIMENTAL
Black Pearls 2000 carbon black was stirred into a so-lution of diisocyanate-terminated polyether prepoly-
mers in tetrahydrofuran (THF). After 1 h of reactionthe grafting was complete. For further cross-linking ofthe grafted carbon black a mixture of diols and triolswas added. The reaction slurry of cross-linked carbonblack obtained after this reaction was cast into metalfoam (serving as the current collector) or extruded (inwhich case the extruded filaments were attached witha graphite binder to a titanium foil serving as the cur-rent collector). Electrochemical impedance spectrome-try (EIS) was used to study the electrochemical prop-erties of these electrodes.
The degree of grafting was determined by thermogra-vimetric analysis (TGA). The dried active material wasextracted with tetrahydrofuran (THF) in a Soxhlet ap-paratus and then analysed by TGA.
3 RESULTS
3.1 Grafted carbon black
Isocyanate-terminated polyethers were reacted withcarbon black (CB). The reaction sites are oxidic sur-face functions such as phenol or carboxylic acidgroups, as indicated in the reaction scheme below.
CBCOOH
OH + 2O~C~N R-N-C-0
—NHCB R-N-C-0
0 R N~C~O: NH
+ CO2
For reasonable grafting efficiencies, the carbon blackshould contain a sufficient number of these groups.Grafted carbon black containing 10wt.% of graftedprepolymer was achieved.
3.2 Cross-linked carbon black
The prepolymer molecules used for grafting areknown to undergo cross-linking with diols and triols.Therefore, attempts were made to cross-link corre-spondingly grafted carbonaceous materials. A diol/triolmixture was added to the slurry of grafted carbon pre-pared as above. The remaining isocyanate reactionsites were then expected to react with the OH groupsas shown in the scheme below.
9 R N C O

77
The slurry obtained after reaction was cast, and afterextraction with THF, the TGA analysis was performed.The weight gain measured with TGA showed that upto 58% of the binder utilised was integrated into theBlack Pearls 2000 structure. An active material con-taining 16 wt.% of immobilised polymer was produced.
In the next step, electrodes were produced from thisactive material, and their electrochemical propertieswere measured by electrochemical impedance spec-troscopy (EIS). The double-layer capacitance wascalculated from the EIS spectra. A plot of calculatedspecific capacitance versus frequency is shown inFigure 1. Electrodes with the cross-linked carbonblack incorporated into metal foam as the current col-lector exhibited the highest specific capacitances, withvalues of up to 200 F/g at 0.01 Hz. This high specificcapacitance demonstrates the potential of the cross-linked active material for supercapacitor applications.
For a practical realisation, the mechanical stability andelectrical conductivity of this cast electrode materialmust yet be improved. One step towards this targetwas realised by preparing extruded filaments exhibit-ing higher mechanical stability. The physical structureof the different kinds of electrode prepared can beseen from the scanning electron microscopy (SEM)images of Figure 2. The extruded sample of the cross-linked carbon is more homogeneous than the castelectrode: no grain structure is visible. The shearingforces arising during extrusion are responsible for thismore compact structure. In first electrochemical meas-urements, this material had a lower grain-to-grain re-sistance than cast electrode samples. The specificcapacitance is also lower. This can be explained bythe longer pathway of the ionic current in the filament,which has a thickness of 0.5 mm. The individual con-tacted grains cast into the Ni foam have diameters ofonly few tenths of a millimeter.
4 CONCLUSION
The cross-linked active material described has someadvantages over the conventional materials. Thesemust now be realised in EDLC electrodes. The pro-duction of crosslinked carbon foils by extrusion is inpreparation.
5 ACKNOWLEDGEMENTS
Financial support by the Board of the Swiss FederalInstitute of Technology is gratefully acknowledged.The authors thank Mr. D. Kunz for excellent technicalsupport.
200
180
0.01 0.10 1.00Frequency / Hz
10.00 100.00
Fig. 1: Plot of specific capacitance vs. frequency foran electrode of cross-linked carbon in Ni foam.
Fig. 2: SEM micrographs of cross-linked active mate-rial extruded as filament (left) and cast (right).
6 REFERENCES
[1] Y. Kibi, T. Saito, M. Kurata, J. Tabuchi, A. Ochi,Journal of Power Sources 60, 219-224 (1996).
[2] K. Kinoshita, Carbon, Electrochemical and Phys-icochemical Properties (1988).
[3] L. Bonnefoi, P. Simon, J.F. Fauvarque, C. Sar-razin, J.F. Sarrau, A. Dugast, Journal Of PowerSources 80, 149-155(1999).
[4] R. Richner, S. Muller, R. Kotz, A. Wokaun, PSIScientific Report 1998, V, 47 (1999).

78
TESTING OF SUPERCAPACITORS AT PSI
M. Bartsch, J.-C. Sauter, R. Kotz
Development of electrochemical double-layer capacitors - so called supercapacitors - has been pursuedfor several years at the PSI in the Electrochemistry Laboratory. Besides material development and charac-terization of capacitor components, the characterization of the whole device is of significant importance.The presently available test facilities at PSI and test setups being currently developed are described.
1 INTRODUCTION
Since 1995 research and development of electro-chemical double-layer capacitors has been pursued atPSI within the scope of projects funded by BSIT(Board of Swiss Institutes of Technology) and CTI.Research at PSI aims at high energy as well as at highpower capacitors. The respective applications areswitchgear and hybrid electric vehicles [1].
Main concern in both projects is the development ofan appropriately tailored electrode. For the high powercapacitor we use an activated glassy carbon electrodein a bipolar arrangement, whereas for the high-energycapacitor a pasted carbon powder electrode is used ina monopolar cell.
2 TEST PROCEDURES
2.1 Cyclic Voltammetry
Cyclic voltammetry (CV) - one of the classical analyti-cal techniques in electrochemistry - can also be usedto characterize electrochemical double layer capaci-tors. With a constant voltage scan rate dU/dt an idealcapacitor should give a constant current in the CVaccording to C = I / (dU/dt), where C is the nominalcapacitance of the device. In Figure 1 the CV of a 24V bipolar EDLC [2] is shown, which is more or lessrectangular. The CV shows that the capacitance ofthis capacitor is higher in the discharged state (0 V)than fully charged (24 V).
1000
500
-1000
-1500
I—
i
• •
16 18 20 22
Cell Voltage (V)
Fig. 1: CV of a 24 V bipolar EDLC based on activatedglassy carbon. Scan rate 2.2 V/s.
Advantages of CV are simplicity and availability inalmost any electrochemistry lab.
2.2 Electrochemical Impedance Spectrometry
The current response to a periodic voltage perturba-tion is defined as
Z(co) = z' + iz" = Uo/ I0((o) • exp(- i cp)
where Z is the complex impedance, Uo the amplitudeof the voltage disturbance, and co its frequency. I0(co)and cp are amplitude and phase, respectively, of theinduced current. In an experiment the current re-sponse of the capacitor to a periodic voltage signal ismeasured in terms of current amplitude and phase. Inthe complex impedance plane an ideal capacitor isdescribed by a vertical line shifted with respect to thevertical axis by the equivalent series resistance (ESR)of the capacitor.
Measuring impedance of high capacitance low resis-tance devices such as EDLCs is not trivial. Specialequipment for electrochemical impedance analysis isneeded, which is a disadvantage of this method.
Figure 2 shows the result of an impedance measure-ment of a bipolar EDLC based on glassy carbon elec-trodes with 24 F and an ESR of 25 mfi. In the imped-ance plane the data approach a vertical line very well,however if one zooms into the region at higher fre-quencies clear deviations from the vertical line behav-ior are detected, which are attributed to the behavior ofthe porous electrode.
Fig. 2: Complex impedance plot of the same capaci-tor as in Figure 1 between 0.1 Hz and 1000 Hz.
Capacitance and internal resistance data extractedfrom impedance measurements are a function of thefrequency. On the other hand in order to provide realresistance and capacitance data independent of fre-quency the impedance data may be fitted by complex

79
circuit models. Using a linear approximation it is alsopossible to calculate Ragone plots (specific power vs.specific energy for a constant power charge/ dis-charge) from such impedance data.
2.3 Constant Load Discharge
While impedance measurements provide data in thefrequency domain constant load discharge measure-ments provide data in the time domain. The advantageof such measurements is the rather simple instrumen-tation compared to the impedance technique.
After charging of the capacitor with a simple powersource the capacitor is discharged over a known resis-tor and the evolution of the current and voltage ismonitored. A typical example is shown in Figure 3 fora capacitor with 800 F and 1.1 mQ equivalent seriesresistance.
Voltage-
CuL
Time (s)
Fig. 3: Current and voltage decay of an 800 F EDLCover a load of 3.75 mQ. Note the peak current of 350Ampere. The insert shows the potential step at thebeginning of discharge (ca. 0.4 V @ 350 Amp).
From the measurement the ESR and the capacitanceC can be determined according to
C(t) = -t / R / ln[U(t)/Uo]
Where R is the total resistance in the circuit and Uo isthe starting voltage.
For capacitors with rather low ESR one has to makesure that small voltage drops of connectors andswitches are taken into account.
2.4 Cycle Tests
One of the main advantages of EDLCs compared tobatteries is the excellent cycle stability. Using com-puter controlled 4-quadrant power supplies (KEPCO)this parameter is investigated by periodical chargingand discharging of the capacitor at e.g. constant cur-rents between defined limiting voltages. In the chargedor discharged state the capacitor may be held at con-stant voltage or zero current. A typicalcharge/discharge cycle is shown in Figure 4 for a ca-pacitor with a capacitance of 800 F. The charge/dis-
charge current is 10 A. In this mode we were able todemonstrate 10O'OOO charge/discharge cycles of a 5 Vglassy carbon based bipolar capacitor with only minorchanges in capacitance and ESR [3].
The set-up also allows to define a series of differentcurrents and to perform a series of differentcharge/discharge cycles, which allows calculating thepower energy relation (Ragone plot). The maximumpower available is 1.2 kW, i.e. 60 Amp. max current @20 V or 8 Amp. @ 150 V max. voltage.
A unique feature of this setup is the time resolution of1 ms, which allows the determination of the ESR atequivalent 1 kHz from the voltage drop during currentswitching.
tial (
V)
Pot
en
0.5
0
y \F
iBP—
Time (s)
Fig. 4: Current and voltage during constant current(10 A) charge/discharge cycles. The voltage limitswere set to 1.25 and 2.5 V. Between charge and dis-charge a hold period of 30 s at constant potential wasapplied.
Testing EDLCs with constant power charge and dis-charge is especially important for vehicle applications,where driving cycles are defined in terms of powerconsumed during acceleration and recuperated duringbraking. In order to test the capacitor units developedat PSI for the fuel cell car project [4] we are currentlybuilding a 10 kW test setup utilizing an electronic pro-grammable load in combination with a current source.
3 REFERENCES
[1] R. Kotz, M. Carlen, Electrochimica Acta 45, 2483-2498 (2000).
[2] M. Hahn, M. Bartsch, B. Schnyder, R. Kotz, M.Carlen, Ch. Ohler, E. Krause, PSI Scientific Re-port 1999 / Volume 5, 79 (1999).
[3] M. Bartsch, A. Braun, B. Schnyder, R. Kotz, O.Haas, Journal of New Materials for Electrochemi-cal Systems 2, 273 (1999).
[4] P. Dietrich, A.Amstutz, R. Schelbert, O. Garcia, F.Buchi, R. Kotz, G.G. Scherer, PSI Scientific Re-port 1999 / Volume 5, 94 (1999).

80
XPS AND LFM INVESTIGATION OF ANION INTERCALATION INTO HOPG
B. Schnyder, D. Alliata, R. Kotz
The effects of the intercalation process of perchlorate ions were studied in terms of the changes in surfacefriction and on the electronic structure of the HOPG. Lateral force microscopy (LFM) combined with cyclicvoltammetry (CV) and x-ray photoelectron spectroscopy (XPS) indicated that the specific adsorption ofperchlorate ions is responsible for changes in friction occurring in proximity of the steps on the HOPG sur-face. The friction changes reversibly within a narrow potential window preceding intercalation. After anintercalation and deintercalation cycle the change of the friction at a step is irreversible. No change in thefriction coefficient could be observed on the basal plane. The binding energies in the C 1s, O 1s and Cl 2pXPS spectra of the intercalated compound are shifted relative to those of the non-intercalated host andadsorbed perchlorate ions, which is attributed to a shifted Fermi level.
1 INTRODUCTION
In the context of battery application the knowledge oftopographical (dimension) and chemical changes isfundamental for the understanding of the electro-chemical intercalation mechanism [1].In the present communication we investigate highlyoriented pyrolytic graphite (HOPG) in perchloric acidas a model system in order to elucidate the mecha-nism of electrochemical anion intercalation in graphite.
2 EXPERIMENTAL
Electrochemical experiments were typically carried outin aqueous 2 M HCIO4 in a 3-electrode cell withcounter and reference electrodes (SME or Pt).Scanning force microscopy (SFM) and lateral forcemicroscopy (LFM) investigations were performed witha Park Scientific Instruments Model AP-100 Auto-probe CP scanning probe microscope equipped with ahome made electrochemical cell and and EG&G Ver-sastat 270 potentiostat/galvanostat.High resolution X-ray Photoelectron Spectroscopy(XPS) measurements were performed using a AlKoc X-ray source (1486.6 eV) with monochromator on a VGphotoelectron spectrometer (ESCALAB 220i XL).
3 RESULTS
Over a potential range of 200 mV four different stagesof anion intercalation in HOPG [2] can easily be distin-guished in cyclic voltammograms (see Figure 1). Theintercalation reaction is nearly reversible for concen-trations higher than 2 molar.
Potential vs. SME [V]
Fig. 1: Cyclic voltammogram of HOPG in 2 M HCIO4.
In Figure 2 the friction of a step with 4 graphene layersmeasured in-situ by LFM is plotted for two potentials.At 0.9 V vs. SME no intercalation occurs (see Figure1). This is confirmed by the topography images, whereno change in the step height could be observed be-tween the images taken at 0.0 V and 0.9 V. However achange of friction can be observed, comparing theforward and the backward scan for the two potentials.No changes are visible for the basal planes.
="l tir i 'JI'A .l-J -III. i L41J*
. *^^ 0.0 V (SME)
0.9 V(SME)
Fig. 2: Topography and friction images (forward andbackward scans) of HOPG at a step of 4 graphenelayers in 2 M HCIO4 by SFM/LFM.
Figure 3 shows the friction variation as a function ofthe potential. A reversible friction change is only pos-sible for potential smaller 1.1 V vs. SME. At more posi-tive potentials, where intercalation occurs, the frictionchange is irreversible.
|o
80
60
40
20
0
-20
40
vz.o -q
Double-layer region region
0.00 0.25 0.50 0.75 1.00 1.25
Potential vs. SME [V]
1.50
Fig. 3: Friction changes at a step on HOPG as func-tion of potential.

81
XPS measurements show an increase of the perchlo-rate content with potential in agreement with the in-creased amount of anions in the double layer. At po-tential higher than 1.0 V (intercalation region) the in-crease of the perchlorate species is even more pro-nounced (see Figure 4).
co
0.030
0.020
0.010
0.0000.2 0.4 0.6 0.8 1.0 1.2
Potential vs. SME |VJ
1.4 1.6
Fig. 4: Atomic concentraction ratios Cl/C onHOPG surface vs. the electrochemical potential.
the
In Figure 5 the atomic concentation ratio Cl/O shows adramatic change at about 0.8 V vs. SME, similar to thefriction change plotted in Figure 3. The Cl/O ratio fallsfrom about eight to five. This can be interpretated as aloss of water in the solvation shell of perchlorate fromfour water molecules to one.
10.0
8.0
6.0
4.0
2.0
0.0
co
o Oo 2o £I
• -• • •
Double-layerregion
\ • .• . • •
IIIICTC.II.IIIOII
IWIIttll
Spocilicad^oipiion
0.0 0.2 0.4 0.6 0.8 1.0 1.2 1.4 1.6
Potential vs. SME [V]
Fig. 5: Atomic concentraction ratio O/CI onHOPG surface vs. the electrochemical potential.
the
In the Cl 2p spectra the adsorbed perchlorate ions canwell be distinguished from the intercalated one. The Cl2p level of the intercalated species is shifted with re-spect to the adsorbed perchlorate ions by ~ 1.7 eV.
In order to disdinguish the two peaks present in the C1s spectra more accurately, the maximum entropymethod [3] was applied. With the help of this methodethe resolution of the spectra could be enhanced by afactor of two. A smaller binding energy shift of about0.7 - 0.9 eV depending of the electrode potential couldthen be observed in the C 1s spectrum for the interca-lated graphene layers (see Figure 6).
For the intercalated species all corresponding peaks(Cl 2p, O 1s, C 1s) are shifted to smaller binding en-ergies.
5000
- 4000
3000
2000
1000
Non-Intercalatedc^aphene layers"
0.5 V (SME)
11 V (SME)
290 288 286 284 282 280
Binding Energy IeV]
Fig. 6: Maximum entropy deconvolution of the C 1sspectra of HOPG samples emersed at different poten-tials.
Assuming no change of the valence state of the per-chlorate ions during the intercalation process, the ob-served shifts can be explained by a shift of the Fermiedge [4] for the intercalated layers.
4 CONCLUSION
Adsorption and intercalation of perchlorate ions cau-ses:- Friction change at a step of HOPG due tospecific adsorption of CIO4".
- Irreversible friction change after intercalation.- No change of the friction on the basal plane.- Chemical shifts in the C 1s and Cl 2p XPS spectra of
the intercalated species and the intercalated gra-phene layers.
- Shift of the Fermi edge explains this result.
5 ACKNOWLEDGEMENT
Financial support by the Swiss National ScienceFoundation, Grant No. 4036-044040 is gratefully ac-knowledged. Special thanks are due to S.J. Splinterand N.S. Mclntyre for making available to us the Mat-lab program for the maximum entropy deconvolution.
6 REFERENCES
[1] L B. Ebert, Ann. Rev. Mat. Sci. 6, 181 (1976).
[2] D. Alliata, P. Haring, O. Haas, R. Kotz, H. Siegen-thaler, Electrochem. Comm. 1, 5 (1999).
[3] S.J. Splinter, N.S. Mclntyre, Surf. Interface Anal.26, 195(1998).
[4] G.K. Wertheim, P.M.Th.M. Van Attekum, S. Ba-su, Solid State Commun. 33, 1127 (1980).

82
MODELLING STUDIES OF THE CO POISONING INPOLYMER ELECTROLYTE FUEL CELLS (PEFC)
B. Andreaus (EPFUPSI), L. Danon (Imperial College, London, UK), L. Gubler, G.G. Scherer
A simple kinetic model for the time dependence of the CO-poisoning of the fuel cell anode has been estab-lished. Despite the strong assumptions, the calculated cell potential evolution is qualitatively in goodagreement with the experimental behavior. In a second stage, the model parameters were fitted to an ex-perimental curve. This allowed for extraction of quantitative information for the 'effective' reaction rate con-stants of CO-adsorption, CO-desorption and the apparent CO-exchange current density.
1 MOTIVATION
The fuel question is a key issue for a successfulcommercialization of fuel cells and is subject of inten-sive debate. Hydrocarbons as fuels offer the advan-tage of availability, ease of handling, and, in the caseof methanol, of being liquid at room temperature andtherefore having a high volumetric energy density. Anenergy efficient and fuel flexible method is to use afuel processor, a 'reformer', to convert the hydrocar-bon fuel into a H2-rich reformate. A funda-mental ob-stacle in using such a fuel for low tempe-rature fuelcells (< 100 °C) is the existence of carbon monoxide inthe reformate [1]. At fast and consider-able loadchanges, complete CO removal from the reformate isvery difficult to achieve. Even small amounts of CO inthe order of 100 ppm in the fuel lead to a significantimpairment of the hydrogen oxidation reaction by CO-poisoning of the electro-catalyst, resulting in a highanode overpotential.
To understand this process and to improve cell per-formance, it is important to assess the CO modifiedreaction parameters as kinetic reaction rates and ex-change current densities.
2 THE EFFECT OF CO
At temperatures around 60 - 80 °C where the polymerelectrolyte membrane exhibits long term stability, theCO will adsorb (1) and then strongly adhere to theplatinum catalyst. This leads to a high anode over-potential, as only a small fraction of the Pt sites is leftfree for the H2 electrooxidation. In this case the H2
adsorption reaction (2) will be rate determiningwhereas with pure H2, the charge transfer reaction (3)is the slowest.
Co + Pt <k(ad)'co
K(des),CO- CO)
H2+Pt<. kiad)'H )2(Pt-H)
H
k(des),H
k(ox),Hads
(1)
(2)
(3)
At very high anode overpotentials rjanode > 500 mV vsNHE, the onset potential for CO electrooxidation isreached.
OHads + COads k("xXC0 > CO2 + H+ + e~ (4)
In reaction (4), the COads is oxidized to CO2 by meansof water activation by the catalyst, where oxygenatedspecies OHads are formed from water present in thereaction zone, originating from the polymer electrolytemembrane or from H2 humidification. Thereby, moreCO free catalyst sites are again available for H2 oxi-dation. The performance may be enhanced by using aPt-Ru alloy catalyst, where the activation of watertakes place at lower potentials, or by providing theoxygen directly with the reformate fuel by adding asmall percentage of O2 or air.
3 THE MODEL
We use a simple kinetic model for the fuel cell anodeto investigate time dependence of the CO-poisoning ina complete fuel cell. Losses due to mass transporteffects are ignored. We assume the interfacial kineticsare determined by the four processes (1) - (4) with the'effective' reaction rate constants as parameters.
The assumption that the fuel cell operates at a con-stant current fixes the overall rate of charge trans-ferreactions. For comparison with experimental data, wecan separate the CO-induced anodic overpotential bysubstracting data from a measurement with pure H2
as fuel, as all other potential losses (e.g. cathodeover-potential) remain constant. Further, we assume aLangmuir-type adsorption allowing us to calculate thechange in surface coverage 8a; a e [H,CO] for bothspecies, depending on the cell current and the gasconcentrations Ca(t):
P% = kC(1" 0 ~ O )' - W * * " (5)
Ja = 2Ja,0ea s i n h T (6)
For CO, the exponent x has a value of 1, whereas,assuming Tafel behavior for the hydrogen adsorption,x is equal to 2. p represents the molar area density ofcatalyst sites. As the H2 oxidation current is largecompared to the CO oxidation current j c o , we canidentify it with the fixed cell current.
In this simple model, the same overpotential is as-sumed for both Hads and COads (6), although the COelectrooxidation is a complex process requiring oxy-genated species from activation of water. For thiscombined process, we can define an apparent ex-change current density j0!co-

83
4 MODELLING RESULTS AND FITTING
The type of fuel cell 'reactor' defines the boundaryconditions for the differential equation system, the gasconcentrations Ca(t). We assumed a constantly stirredtank reactor (CSTR), corresponding to a fuel cell withhomogeneous gas distribution, available at PSI. Forthis reactor, Cco(t) is expressed in differential form as
^o-Cco{t))-v-ecoadldes{t) (7)
where x and v are known constants. CH(t) = CH m.
2The current density was held at 500 mA/cm . In thisregime, we can observe CO electrooxidation. Theoutput is given in form of an anode overpotential dueto CO-poisoning, r|co, which is also experimentallymeasurable.Figure 1 shows the time evolution of the CO poisoningboth for an experiment and the fitted model behavior.CO is added to the fuel at a 100 ppm level (Cco
m) att = 0, and we can observe a steep increase of theanode overpotential due to the catalyst site blocking byCO. At high overpotentials, we observe the onset ofCO-electrooxidation and the stabilization of the over-potential. At time 4140 s, the COm feed is stopped andthe potential relaxes. At sufficiently long times, thepure H2 feed potential will be attained when all COads
is removed from the catalyst.
I IT I I I IT I I I I
2000 4000 6000time [s]
8000
Fig. 1: CO induced anode overpotential. The ex-perimental curve was recorded using a cell with 28.3cm active area. Tcen = 60 °C, Nafion 115, pa = 1 atm,stoichiometric gas feed of XH2 = ^02 = 1 -5.
From the fit, we obtain the following values for thefitting parameters:
k(ad),H k(des),H k(acl),CO k(des),CO JO.CO
3.26e-3[cm/s]
3.55e-7[mol/cm/s]
3.81 e-4[cm/s]
2.74e-13[mol/cm/s]
1.04e-72
[mA/cm ]
We observe that the model mimics the experimentalbehavior qualitatively well, but shows a sharp transi-tion at the onset of CO electrooxidation, presumablydue to the strong assumption of equal overpotential ofthe CO and H electrooxidation.
The fitting values of the parameters depend stronglyon starting values of the reaction rate constants k(ad) H,k(ad),co a nd k(des) co, indicating the existence of severallocal least square (% ) minima for the physical mean-ingful range of the starting values. For the fit in Figure1, we used starting values proposed in [2].
Whilst predictions for the mentioned rate constantrequire alternative investigation methods, the CO ex-change current density remained constrained to anarrow interval (± 30 %) around the indicated value forall minima found.
Figure 2 points out that even minor quantities of COwill block most of the catalytic sites, but also brings tomind how little catalyst is needed for the H2 oxidationto take place at reasonable speed.
2000 4000 6000 8000
time [S]
Fig. 2: Calculated coverages 9H and 8C0 at operatingconditions described in Figure 1.
It is illuminating to compare the values of the ex-change current densities JO,H, jo.co for H and CO, whichdetermine the effectiveness of a catalyst for a certainreaction and therefore its overpotential for a chosenreaction rate (current). For the hydrogen oxidationreaction in a fuel cell, j o , H = 2 mA/cm was measuredby AC impedance spectroscopy of a sym-metric H2/H2 cell. This value is 7 orders of magnitude higherthan the value of j0,co- The important insight is thateven such a negligible CO oxidation current has asignificant effect on the magnitude of the hydrogenelectrooxidation, as even a small fraction of thethereby CO freed surface is sufficient for a reasonablehydrogen oxidation rate.
5 CONCLUSION
The time evolution of CO-poisoning of the PEFC an-ode can be described qualitatively by a simple kineticmodel. Fitting of the model parameters to experimen-tal data allowed to quantify the value of the apparentCO exchange current density.
6 REFERENCES
[1] L. Gubler, ETH Dissertation 13954, Zurich, inpress.
[2] T. Springer, T. Zawodzinski, S. Gottesfeld, Mod-eling of Polymer Electrolyte Fuel Cell Perform-ance with Reformate Feed Streams, Electro-chem. Soc. Proc. 97-13, 15 (1997).

84
DEVELOPMENT OF A BIPOLAR ELEMENT FOR PE-FUEL CELLSDEMONSTRATION IN A 6 kW STACK
F.N. Buchi, M. Ruge (ETH Zurich)
The bipolar plate is the main construction element of a fuel cell stack. It needs to be optimized with respectto material and design. A bipolar element for a 200 cm2 active area fuel cell stack has been designed andmanufactured. The versatility of the element has been demonstrated by the construction of a 100 cellstack. The stack exhibits a specific power of 330 W/kg at the nominal power of 6.4 kW.
1 INTRODUCTION
The low single cell voltage of hydrogen/air fuel cells oftypically 0.6 to 1.0 V (depending on the load) requiresa series connection of many cells (10 to several 100)for obtaining voltages of practical interest. In cell de-signs optimized for high specific power, the seriesconnection should exert a minimal electric resistanceto minimize losses. Generally in these cases a bipolartype series connection is chosen, which interconnectsindividual cells over the entire active area and leads tofilter-press type cell arrangements called stacks. Thebipolar element or bipolar plate (because of its flatform, BIP) then becomes the main construction ele-ment of the fuel cell stack. Besides the performance ofthe electrochemical components, the characteristics ofthe bipolar plate determine the performance of thestack with respect to specific power and power den-sity.
2 BIP REQUIREMENTS
An optimized BIP has to fulfill a series of require-ments.
(i) Material requirements:
• Electric conductivity > 10 S/cm
• Heat conductivity > 20 W/m K• Gas tightness: permeation < 10~7 mbar l/s cm2
• Corrosion resistance in contact with an acidic
Top view Cross section
II II H
0
0 Water
Hydrogen Air
Fig. 1: Concept for internally liquid cooled bipolarplate, composed from two half plates.
electrolyte, oxygen, heat, and humidity.
The specified values for electric and heat conductivi-ties are required to keep the voltage loss in the BIPbelow 3% at full load and ensure low temperaturegradients, respectively. Gas tightness is required toprevent dangerous leaks to the exterior as well ascross leaks between the fluids in the stack.
(ii) Construction/manufacturing requirements
• Slim, for minimal volume
• Light, for minimal weight
• Cheap material and short production cycle, forminimal cost
(iii) Design features
• Distribution of gases on and removal of productwater from active area
• Heat removal
• Inclusion of manifolds for fluids
3 BIP MATERIAL AND DESIGN
Fulfilment of the material requirements is easiest witha graphite based material, because carbon exhibits agood corrosion resistance. Graphite also has a lowspecific weight («2g/cm3). However pure graphite isnot easily shaped, i.e. for shaping graphite needs to
M| ' **
Fig. 2: Bipolar plate with an active area of 200 cm2
and internal water cooling, as shown schematically inFigure 1.

85
Vol
tage
[V
]
100 j
95 ,
90 -
85
80
75 -
70 -
65 -
60
55 <
C
, . .. .
V
20
•.••• r A i ^
Q
- 8
- 7
- 6
- 5
- 4
- 3
- 2
- 1n
40 60 80 100 120 140
Current [A]
Pow
er [
kW]
Fig. 3: 100 cell, water cooled, 200 cm2 active areaPEFC stack. Gross dry weight 19.5 kg, volume 14 I.
be milled which is time consuming and therefore ex-pensive. As in the earlier development for an air-cooled bipolar plate [1] a graphite-polymer compoundwhich can be shaped by pressure moulding was cho-sen as construction material. With a thermoplasticpolymer compound the pressure moulding processneeds high temperatures (« 200 °C) and requires arelatively long product cycle due to the necessity tocool the mould before releasing the part from the form.But even with these boundary conditions, moulding isa big advantage as compared to the milling process,i.e. it allows the production of plates with a thicknessof less than 1.6 mm, which is difficult to achieve withthe milling process. A critical issue with the mouldingprocess is the variation of the plate thickness. Varia-tions of less than 0.1 mm have to be achieved toguarantee the plate's functionality with respect to seal-ing and gas distribution properties.
Internal plate cooling is an elegant way for liquid cool-ing. If all plates are cooled internally then the heatvariation in the stack can be easily controlled. To pro-vide a void for the cooling fluid in the middle of thebipolar plate, the plate has to be composed from twohalf-plates. These half-plates are united by a glueingprocess in order to make the complete plate tight forthe fluids with respect to leaks to the exterior and be-tween the different fluids. Because gas tightness iscrucial for the application, the parameters in the glue-ing process have to be carefully controlled.
4 RESULTS
Half-plates were produced by SGL Technik (D) andprocessed into complete bipolar plates at ETH andPSI. A complete bipolar plate is shown in Figure 2. Ithas a thickness of 3.1 mm and a weight of approxi-mately 130 g.
Fig. 4: Current/voltage and current/power charac-teristics of the 100 cell stack operated with pure H2
and air. Stack temperature 70 °C, air stoichiometry2.0; gas pressures 2.0 bar abs. Dew point of gases:• 65 °C, o 50 °C.
As electrochemical components, Nafion® membranesfrom DuPont (USA) and electrodes from E-Tek (USA)were employed.
A 100 cell stack was completed for testing (see Figure3). The pitch of a repetitive unit is 3.25 mm. Includingoptimized endplates, current collectors, tie-rods andgas connectors the dry weight of the stack is 19.5 kg.The performance of this 100-cell stack characterizedby its current/voltage and current/power curves isshown in Figure 4. At a stack temperature of 70 °C,with gas pressures of 2 bar and well humidified condi-tions (dew point of the gases 65 °C) the nominalpower of 6.4 kW is obtained at an average cell voltageof 626 mV and a current of 102 A. Under comparablymore dry conditions (dew point of the gases 50 °C) thenominal power is reached at 106 A and an averagecell voltage of 603 mV.
The specific power and power density of the stack atnominal (not maximum) power are 330 W/kg and450 W/l, respectively.
5 ACKNOWLEDGMENTS
Technical support from R. Panozzo, P. Hottinger, C.Marmy (PSI), the PSI workshop and H. Nef (ETH) aswell as discussions with T. Pylkkaenen and G.G.Scherer on plate design, are gratefully acknowledged.
6 REFERENCES
[1] F.N. Buchi, C.A. Marmy, R. Panozzo, G.G.Scherer, O. Haas, Development of a 1.6 kW PEFuel Cell System, PSI Scientific Report 1999, V,92-93 (2000).

86
DIRECT METHANOL FUEL CELL - IN SITU INVESTIGATION OF CARBON DIOXIDEPATTERNS IN ANODE FLOW FIELDS BY NEUTRON RADIOGRAPHY
A. Geiger, E. Lehmann, P. Vontobel, G.G. Scherer
First attempts have been made to develop a method for an in situ investigation of the gas evolution pat-terns in anode flow fields of direct methanol fuel cells (DMFC). An operating DMFC was placed in the neu-tron beam at the neutron radiography station NEUTRA and images of the anode flow field were capturedby either one of two neutron detection systems: Imaging plates provide a high spatial resolution and agood dynamic range, with the penalty of a discontinous process acquiring the images. On the other hand,the CCD-camera offers very short acquisition times per image. The experiments at NEUTRA have shownencouraging results and promising use of the neutron radiography for the investigation of two-phase flow inDMFCs.
1 MOTIVATION
Over the past years, a rapidly increasing interest infuel cell technology by public and science could benoted worldwide. To overcome the difficulties causedby the on-board storage of hydrogen, a great deal ofresearch has focused on the direct methanol fuel celllately. As shown in Figure 1, the DMFC consists of aproton conducting membrane onto either side of whichporous electrocatalytic electrodes are attached, eachconsisting of a porous backing and an active layer.This membrane electrode assembly is then sand-wiched between graphite blocks that enable electricalconnection to the cell and have flow fields machinedinto the surface for the supply of the reactants to theelectrocatalytic active layer and the removal of theproducts.
The reaction that takes place at the anode of the
CO,
anodecurrentcollector
/ .. • yi
cathodecurrent
\ collector
"porous a c t i v e S " a c t i v e porous \backing l av e r / laVer backing
membrane(electrolyte)
As shown in Reaction 1, carbon dioxide is a product ofthe oxidation of methanol at the anode, which haslimited solubility in the aqueous methanol solution andthus, is evolved as a gas in the cell. However, largeamounts of carbon dioxide can block the microporesof the diffusion layer as well as accumulate in the flowchannels. Therefore, carbon dioxide has to be re-moved from the electrode structure and from the cellas efficiently as possible to enable access of the reac-tants to the catalytic layer and to maintain effectivereaction conditions [1, 2]. However, the carbon dioxidemanagement depends on the interaction of severalparameters, e.g., material properties, cell and elec-trode design, and operating conditions - a rather com-plex system. Therefore, an experimental method wassought that enables "real-time" visualization of the gasevolution process occuring at the anode of a DMFC.
2 EXPERIMENTAL
The neutron radiography facility NEUTRA offers thepossibility to look in situ at the gas evolution occuringat the anode in operating DMFCs. Figure 2 shows asimplified diagram of this experimental method.
Similar to x-rays, neutrons penetrate a sample andproject an image on a detector screen. However, neu-trons are very sensitive to light elements (e.g. hydro-gen) in contrast to x-rays and can detect even thinlayers of these elements. Therefore, this method isvery suitable for visualizing the carbon dioxide distribu-tion in the aqueous methanol solution on the anode ofa DMFC. As shown in Figure 2, an operating DMFCwas placed vertically into the neutron beam and im-ages were captured either by imaging plates or by aCCD-camera system.
Fig. 1: Schematic diagram of the direct methanolfuel cell.
DMFC (oxidation) is
CH3OH + H2O -> CO2 + 6 H+ + 6 e-, (1)
and the reaction at the cathode (reduction) is
3/2 O2 + 6 e- + 6 H+ -> 3 H2O. (2)
XD-camera
fuel cellneutron scintillator
neutron source
Fig. 2: Experimental setup at NEUTRA.

87
Fig. 3: Neutron radiography of the anode flow field ofa DMFC at low current.
In the past this method had also been applied to de-termine the water distribution on the cathode side flowfield of a H2/air fuel cell [3].
3 FUEL CELL
The fuel cell used has an active area of 100 cm2 withcurrent collectors made of graphite plates, comprisinga serpentine gas channel flow field for the distributionof the reactants. The polymer electrolyte membraneused was Nafion® 117, electrodes were from E-TEKwith a Pt-Ru loading of 0.6 mg/cm2 on the anode anda pure Pt loading of 2 mg/cm2 on the cathode side.
4 RESULTS
To evaluate the applicability of neutron radiography forvisualizing the CO2 patterns in a DMFC, first pictureswere taken by the imaging plate technique. Becauseof its higher spatial resolution (max. spatial resolution:50 (im), imaging plates allow to work out the exposuretime and spatial resolution necessary to get suitableimages. Unfortunately, they prevent us from observinginstationary processes as the flow of the gas domainsin the flow channels of a DMFC because of the breaksnecessary to change the plates. Therefore, this tech-nique can only show snapshots of the process.
Nevertheless, interesting images of the anodic flowfield of an operating DMFC could already be derivedwith this detector system as shown in Figures 3 and 4.The spatial resolution of these images is 100 urn andthe exposure time was in the order of 25 s. The inlet ofthe aqueous methanol solution is at the upper lefthorizontal distribution channel and the outlet is on thediagonally opposite side. Dark areas of the flow fieldindicate regions that are filled with liquid; light areas ofthe flow field show gas-filled channels. Both picturesare taken at the same operating conditions except that
mFig. 4: Neutron radiography of the anode flow field ofa DMFC at higher current density as in Figure 3.
in Figure 4 a higher current density was drawn andcorresponding to Reaction 1 a larger amount of car-bon dioxide is produced. As can be seen easily, athigher current density {Figure 4), gas accumulates toa large extent at the inner section of the flow field andblocks a considerable part of the active area. Becausein all of the pictures taken, the carbon dioxide pro-duced concentrates in the center of the flow field, aquasi-stationary flow scheme seems to be estab-lished. Therefore, this type of flow field is not appropri-ate as anodic flow field in a DMFC.
Furthermore, our studies could show that the CCD-camera is also useful for investigating the CO2 man-agement in DMFCs. With this detector system ahigher temporal resolution is achieved and the gasevolution process can be observed more precisely.
5 ACKNOWLEDGEMENT
Financial support of the Swiss Federal Office of En-ergy is gratefully acknowledged.
6 REFERENCES
[1] P. Argyropoulos, K. Scott, W.M. Taama, Gasevolution and power performance in directmethanol fuel cells, J. appl. Electrochem. 29,661-669(1999).
[2] P. Argyropoulos, K. Scott, W.M. Taama, Carbondioxide evolution patterns in direct methanol fuelcells, Electrochim. Acta 44, 3575-3584 (1999).
[3] A. Tsukada, E. Lehmann, P. Vontobel, G.G.Scherer, In Situ Observation of Water Condensa-tion in an Operating Polymer Electrolyte Fuel Cellby means of Neutron Imaging at the SpallationNeutron Source (SINQ), PSI Scientific Report1999, V, 84-85(1999).

88
INVESTIGATION OF CATALYST UTILIZATION AT THEELECTRODE - SOLID POLYMER ELECTROLYTE INTERFACE
USING MODEL ELECTRODES
U.A. Paulus, Z. Veziridis (Volkswagen AG, Germany), E. Deiss, C. Marmy, G.G. Scherer
Structured glassy carbon electrodes serve as a model support for catalyst systems. The well-known ge-ometry of the substrate allows a precise determination of the surface area. Variations of the platinumdeposition result in the creation of different but well defined catalyst distribution patterns. Differences in thecatalyst utilization can then be quantitatively determined by cyclic voltammetry and related to the differentcatalyst distribution patterns.
1 INTRODUCTION
Low temperature polymer electrolyte fuel cells(PEFCs) require precious metals, mainly platinum, aselectrocatalysts. As platinum is an essential cost factorthe lowest possible platinum loading is desired. How-ever high Pt loading guarantees high current densitiesand therefore high power generation per geometricalunit area. This contradiction must be solved by a mostefficient utilization of the catalyst.
A first systematic study of the catalyst utilization at theinterface Pt-electrode/membrane was carried out byMcBreen using cyclic voltammetry [1]. He observedthat under certain conditions H-adsorption could bedetected also at that part of the total platinum surface,which was not in direct contact to the solid electrolytemembrane. No detailed explanation was given.
2 EXPERIMENTAL
To study the catalyst utilization we used model elec-trodes prepared from microstructured glassy carbonplates, which were covered with platinum in variousways (for details see ref. [2,4]).
TypI TypH
Pt-BlackPt on Carbon
Polymerelectrolyte
Platinumla
Glassy Carbon
Fig. 1: The two model electrodes and the corre-sponding "real catalyst layers" at the elec-trode/electrolyte interface.
The electrode with a continuous platinum layer(Type I, Figure 1) resembles an active layer of Pt-
black particles. The Pt distribution of the Type II elec-trode resembles an active layer of platinum supportedon carbon (Figure 1) The interface between suchmodel electrodes and a water-swollen proton conduct-ing membrane was probed by cyclic voltammetry in atest cell purged either with humidified Argon or filledwith liquid electrolyte.
3 RESULTS AND DISCUSSION
When purging the cell with argon we observed full Ptutilization for the H-adsorption on Type I electrodes. Incontrast investigating a Type II electrode only the Ptcontacting the solid electrolyte is detected (ref. [2]).These results reflect utilization data obtained on Pt-black electrodes (about 50% utilization) in contrast toelectrodes with Pt supported on Vulcan XC72 graphite(about 20 % utilization).
Further we studied the base voltammogram applyingvarious voltage sweep rates. On Type I electrodes avariation of the sweep rate (25 to 800 mV/s) intro-duces a shift to the lower potential desorption peak byup to 50 mV (Figure 2, above). Whereas using Type IIelectrodes no peak shift can be observed (Figure 2,below).
These findings also resemble data recently obtainedwith microelectrodes using Pt-black and Pt/Vulcancatalysts [3].
An explanation of the observed peak shift could beeither a slow kinetic hydrogen desorption process oran ohmic drop within the electrode channels. In thelatter case we assume either a thin electrolyte film oreven channels filled with electrolyte, both formed dur-ing the purging with humidified argon and accompa-nied by leaching out of membrane fragments.
We developed a model for the H-adsorption-desorption process at the electrode/electrolyte inter-face, which includes the possibility of either diffusion ofHad along the channel walls or transport of H+-ions inan electrolyte layer within the ,,pores,, of the micro-structure (for details see ref. [4,5]).

89
1
0.0 0.2 0.4 0.6 0.8 1.0 1.2
U[V]
0.0 0.2 0.4 0.6 0.8 1.0 1.2
1
-125 mV/s (mA x 10)
\l 800 mV/s
Fig. 2: Variation of the sweep rate on the two differentmodel electrodes.
Due to these model calculations we could explain theobserved peak shift by assuming an ohmic electrolyteresistance within the electrode channels of about1.4*105 Q. Assuming fully electrolyte filled channelsthis results in a specific resistance of 200 to 300 Qcm(channel width between 30 and 50 (im), which corre-sponds for example to the specific resistance of 0.005to 0.01 M H2SO4 at 25°C. As thinner electrolyte filmswould implicate higher acid concentration thereforefully electrolyte filled channels seem to be the mostprobable explanation.
A[mV]
a
45
b
40
c
28
d
14
e
5
f
0
g
0
Table 1 : Peak potential shift on a Type I electrode for(a) humidified Argon, (b-g) 0.001, 0.005, 0.01, 0.1, 0.5,1.0 M H2SO4.
To verify the assumption of fully electrolyte filled chan-nels we deliberately added sulfuric acid of varyingconcentrations to the channels of both types of elec-trodes. Using Type I electrodes the peak shift de-creases for H2SO4 concentrations up to 0.01 M anddisappears at higher concentrations in agreement withthe predicted resistance values (compare data in Ta-ble 1).
In contrast using Type II electrodes we cannot find apeak shift in any case. A different observation is madeon Type II electrodes: Catalyst utilization increaseswith increasing H2SO4 concentration in the channelsand only for concentrations higher than 0.01 M weobserve now a nearly complete Pt utilization (data inTable 2).
% Utilization
a
43
b
51
c
51
d
55
e
81
f
97
g
100
Table 2: Catalyst utilization on a Type II electrode at100 mV/s for (a) humidified Argon, (b-g) 0.001, 0.005,0.01, 0.1, 0.5, 1.0MH2SO4 (100%: Pt on web andbottom).
The results obtained on Type I electrodes and also onType II electrodes with high electrolyte concentrationsin the channels indicate that electrolyte in the channelsplays an important role to explain our observations.However, the fact that with Type II electrodes thecomplete platinum area cannot be detected for con-centrations below 0.01 M (and therefore no peak shiftcan be observed) requires to take into account addi-tional parameters, which still have to be identified.
4 CONCLUSION
The two outlined similarities to both gas diffusion elec-trodes and microelectrodes concerning catalyst utiliza-tion and the observed peak shift clearly underline thesuitability of the chosen model for fundamental inves-tigation purposes. Further investigations applying e.g.impedance spectroscopy are expected to give addi-tional insight into the catalyst utilization mechanism.
5 REFERENCES
[1] J. McBreen, J. Electrochem. Soc. 132, 1112-1116(1985).
[2] G.G. Scherer, Z. Veziridis, M. Staub, H. Freimuth,PSI Scientific Report 1996, V, 55-56 (1997).
[3] W.Y. Tu, C.S. Cha, B.L. Wu, Electrochim. Acta,43,3731-3739(1998).
[4] Z. Veziridis, G.G. Scherer, E. Deiss, H. Freimuth,GDCH-Monographie 14, 544-551 (1999).
[5] Z. Veziridis, L. Gubler, E. Deiss, A. Wokaun, G.G.Scherer, Book of Extended Abstracts, 3rd Interna-tional Symposium on Electrocatalysis, Advances& Industrial Applications, Sept. 11-15 1999 Por-toroz, Slovenia, Ed. Hocevar, S., Gaberscek, M.,Pintar, A., 240-242(1999).

90
FUEL CELLS WITH FLEXIBLE GRAPHITE BIPOLAR PLATES
T. Pylkkanen, G.G. Scherer
From an economic and technical point of view flexible graphite is found to be one of the best candidates forthe use as bipolar plate material for polymer electrolyte fuel cells. The material properties have beenevaluated, bipolar plates have been manufactured by embossing, and cost estimates have been made forthis process. A fuel cell stack, with two cells of 193 cm2 active area each, has been designed, built andtested while taking into consideration the attractive properties of flexible graphite.
1 INTRODUCTION
The bipolar plate cost is a considerable part of thecost of a polymer electrolyte fuel cell stack. Especiallyfor automobile applications, it is necessary to stronglyreduce this cost. At the same time, the specific powerof a fuel cell stack has to be high in order to avoidexcess weight. In the stack the bipolar plate has fol-lowing functions:
1) To separate the individual fuel cells from eachother, 2) to electrically connect them in series, 3) todistribute the process gases (hydrogen and oxygen) tothe negative and positive electrode, respectively, 4) toallow the cooling of the cells.
The bipolar plate is essentially a plate with channelsfor the gas flows on each side (flow fields), see Figure1. In the center plane of the plate, there exist channelsfor a cooling medium, for example, water.
Up to now our bipolar plate standard design includedtwo parts bonded together. The water cooling chan-nels are placed between these parts. The plates havebeen made by hot pressing a mixture of graphite andplastic binder and simultaneously forming the channelstructures. Further, it has been necessary to drill holesinto the bipolar plates for the gas and water distribu-tion through the stack. This whole manufacturingprocess is rather expensive for fuel cell stacks inautomobile applications.
2 THE NOVEL PLATE MATERIAL
Flexible graphite raw plates are made from puregraphite. Sheets and foils with a thickness between0.2 mm and 2 mm are commercially available for useas highly corrosion and temperature resistant sealingmaterial. Its main properties are listed in Table 1.
The plates can be cut and embossed cost effectivelyto the desired forms at room temperature. The lowdensity of the material enables to make lightweightfuel cell stacks. Besides many advantages, there aresome disadvantages in the use of this material [1]. It ismechanically not as strong as the standard materials,and it is slightly permeable to gases. With careful han-dling and intelligent bipolar plate and system design,these disadvantages can be circumvented withoutaffecting the performance of the fuel cell.
Density (g/cm3)
Contact resistance
Gas permeability (cm2/s)
Purity available (%)
Electrical resistivity perpendicularto plane (| Qm)
Cost (large quantities) ($/kg)
Compressibility (%)
1
negligible
<210"5
98 - 99.85
700(typical)
9
50
Table 1 : Properties of flexible graphite.
3 DESIGN
A new fuel cell stack design especially adapted to thenew bipolar plate material was made in order to opti-mize cost, performance and sealing against hydrogenleaks. The flow field for the gases is shown in Figure1. The depths of the flow field channels are 0.65 and0.4 mm for air and hydrogen, respectively. The widthsof the channels were 0.8 mm.
The gas flow fields were designed such that a pres-sure loss of 2000 Pa is caused along the channellength at Vi of the maximum current in order to ensurethat the liquid product water is driven away from thechannels even at part load of the fuel cell.
Since flexible graphite is a good sealing material, thebipolar plate in connection with polypropylene gasketsis used to seal the flow field against gas leaks. Insteadof bonding the two halves of the bipolar plates to-gether, suitable sealing surfaces are embossed andintegrated in the bipolar plates in order to avoid leaksfrom the cooling water cycle.
A typical previous standard design of a fuel cell stackincluded end plates of aluminium, which hold the stacktogether. The end plates are connected with metal tierods around the fuel cell stack.
In the present design, however, the tie rods connect-ing the end plates are placed within the active area,which has four holes for the rods. The gas flow fieldsare sealed against gas leaks through these holes.
The forces of the tie rods press on disc springs(4 pieces on each end plate). This design makes itpossible to manufacture considerably thinner andlighter end plates than with the standard design be-cause the forces are distributed more uniformly acrossthe area of the end plates.

91
4 RESULTS AND DISCUSSION
A fuel cell with Nafion 115 as the membrane and E-Tek electrodes (active area 193 cm2) with 0.6 and 2mg/cm2 Platinum loading on the anode and cathode,respectively, was built and tested. At cell voltagesaround 0.6 V, higher current densities than with othercells utilizing the same membrane and electrodes andat the same operation conditions were achieved.
As a next step, a fuel cell stack with two cells (Nafion112, E-Tek electrodes (active area 193 cm2) with 0.6and 0.6 mg/cm2 Platinum loading on the anode andcathode, respectively, was designed and built in orderto proof the performance of a fuel cell stack with flexi-ble graphite bipolar plates. Operation with different airflow rates reveals that the stack performance is stablealso at low air flow rates, see Figure 2.
A power density of 420 mW/cm2 at an average voltageof the two cells of 0.525 V and a pressure of 2 bar withhydrogen/air was achieved. This results in a specificpower of 700 W/kg and power density of 730 W/L.Extrapolating these values for a 10 kW stack withoptimized end plates, it corresponds to 630 W/kg and700 W/L. By reducing the pitch per cell from the cur-rent 3.9 mm to lower values, these performance val-ues can further be improved while still using the samemembranes and electrodes at the same operatingconditions.
Under certain conditions in mobile applications it canbe more economic to use pure oxygen instead of airfor the fuel cell operation [2]. Therefore, the powerdelivery with oxygen was tested. A specific power ofmore than 1000 W/kg and 1100 W/L per cell was cal-culated based on the experimental results under hy-drogen/oxygen operation.
From preliminary thickness measurements and fromthe flexible graphite compression data, it can be ex-pected that the fuel cell operation and thermal cyclingbetween room temperature and an operation tempera-ture of 70 or 80 °C will not reduce significantly thechannel depths of the flow fields. The bipolar platesare expected to last as long as the fuel cells.
Leak proof tests with hydrogen at these operationtemperatures and pressures were performed too. Theleak rates of hydrogen through the bipolar plate to theoxygen side correspond less than 0.1 % loss of thecurrent.
Cost calculations show that there is a potential of pro-ducing this bipolar plate at a unit cost of 3 USD in-stead of the current standard cost of more than 60USD.
As a summary, these results demonstrate the potentialof flexible graphite bipolar plates as an economicalalternative to be used in high performance fuel cellstack applications.
Cooling water outlet manifold (hole) Channels of gas flow field
Air inlet manifold (hole)
H2 outlet manifold (hole)
Fig. 1: Bipolar plate gas flow field.
21.81.6
'• 1 . 4
i 1 . 2
1
0.8
0.6
0.4
0.2
0
•••••Airstoich. 1.5—•—Air stoich. 2.0- * - Airstoich. 2.5
20 40 60 80 100
Fuel Cell Stack Current (A)
120
Fig. 2: Dependence of the stack performance on theair flow rate, described as the stoichiometric factor, theratio between the actual air flow to the theoreticalminimum needed.
5 ACKNOWLEDGEMENT
Financial Support from the Swiss Federal Institute ofTechnology in Zurich is gratefully acknowledged.
6 REFERENCES
[1] P.L. Hendall et al., New Materials for PolymerElectrolyte Membrane Fuel Cell Current Collec-tors, J. Power Sources 80, 235-241 (1999).
[2] T. Pylkkanen et al., Comparison of H2/air andH2/O2 Mobile PE Fuel Cell Systems, Proceedingsof 3rd International Fuel Cell Conference, Nagoya,Japan (1999).

92
EFFECTS OF TEMPORARY POTENTIAL INVERSION ON POLYMER ELECTROLYTEFUEL CELL (PEFC) PERFORMANCES
A. Tsukada, O. Haas, J. Huslage
Potential inversion of one or more cells in a PEFC stack could drastically reduce its performances, or, inthe worst case, seriously damage the entire stack owing to thermal deterioration and perforation of themembrane electrode assembly (MEA). The causes of potential inversion are numerous, including inhomo-geneous gas distribution, drying of membranes and flooding of electrodes, etc. However, the symptomsare always the same: the polarisation curve of such a malfunctioning cell is very steep and rapidly reachesthe short-circuit voltage before the other cells of the stack.
1 INTRODUCTION
Homogenous gas supply in a fuel cell stack is veryimportant in keeping the voltage of all cells at a similarvalue, particularly when the stack is operating at highcurrent. Water condensation in the flow field, whichcan increase the input/output pressure difference, canprevent homogeneous H2 distribution in one or morecells. These cells can reach negative voltage, longbefore other correctly supplied cells. Depending on theduration and degree of negative voltage, the fuel cellscan recover or be rendered completely ineffective.
2 EXPERIMENTAL
Electrochemical impedance spectroscopy (EIS) hasbeen chosen to avoid the cell deterioration during themeasurement. This method was used after each cellpotential inversion, while superposing an AC compo-nent to the cell potential varying between 10 kHz and 1Hz, with an amplitude of ± 5 mV. Potential inversiontests were performed while keeping the stoichiometricvalue of hydrogen XH2 at 0.5, until the cell voltagereaches a desired negative value.
Voltage / CurrentSupply (PSI)
TestFC:N112,30 cm2, 70 °C
I =15 AU= 0.585 V +/- 5 mV
Zahnder / Thales EL300Impedance Apparatus
Fig. 1: Experimental Set-up.
The 30 cm2 cell is composed of a Nafion® N112membrane (Dupont, USA) and E-Tek electrodes with0.6 mg Pt/cm2 loading, and its stationary operatingconditions before and after potential inversion are0.585V / 15A. at 70°C /1.05 barabs. Humidified H2 anddry O2 are supplied with X at 1.5 for both gases. Theexperimental set-up is depicted in Figure 1. The volt-age/current supply (PSI) stands for the correctly func-
tioning cells in a stack, and the test fuel cell is thepotential inverting one.
3 RESULTS AND DISCUSSION
Figure 2 shows the EIS measurements of the test cellafter the cell potential inversions, from Plot A to Plot H,measured chronologically. Plot A is the measurementof the non-inverted cell.
0.005 0.01 0.015 0.02 0.025 O.I )3 0.035
Re(Z) / mfi
Fig. 2: Nyquist plots of a PEFC after temporary po-tential inversions (Plots A to H). Plot A: new cell; plotB: -1.2 V; plot C: -1.5 V; plot D: after 9.5 hour recov-ery; plot E: -0.6 V: plot F: -1.4 V; plot G: -2.0 V; plot H:-2.7 V.
During potential inversion, some of the water in themembrane is electrolysed into H2 and O2. This elec-trolysis dries the membrane and increases its internalresistance (Plots B & C). After hours (9.5 h) of station-ary operating conditions, the cell regains again humid-ity and its membrane conductivity becomes higher, butdoes not reach its initial impedance value (Plot D). Itwas noticed that potential inversion up to -0.5 to -0.6 Vrecovers cell performances somehow (Plot E), per-haps due to reactivation of the catalyst or to contactimprovement between the membrane and the elec-trodes (internal hot press effect). The cell can be con-sidered to be destroyed when its potential drops below-1.5 V; at such values the membrane is not only driedout by electrolysis, but it is believed that the triplephase boundary can be seriously damaged owing tothe high local temperature due to the thermal reactionbetween H2 and O2.

93
DRY AND WET CORROSION OF STAINLESS STEEL SAMPLES:AN XPS INVESTIGATION
J. Wambach, A. Wokaun, A. Hiltpold
The formation of oxide films on Type 316Ti (DIN 1.4517) austenitic stainless steel by oxidation at 573 K indry air at normal gas pressure and in high purity water (0.05 mS/cm) at 90 bar during different oxidationtimes from 0.5 h up to 120 days was investigated by means of XPS depth profiling. It is demonstrated thatduring oxidation in dry air a two layered oxide film is formed and each layer follows a linear growth law.The outer oxide layer consists nearly exclusively of Fe-oxides. Cr, Ni and Mo was found only in the inneroxide layer and in the metallic bulk. In the presence of water an enhanced oxide layer formation is ob-served (ca. factor 5 for dry steam, > factor 10 for wet steam and pure water). Furthermore, Cr and Ni arepresent at the sample surface as oxides. The layer development is more complex and reflects possibly aquadratic growth law with breakaway oxidation" for thicker oxide layers.
1 INTRODUCTION
Knowledge about the formation of oxide layers onstainless steel and of their composition under differentconditions is important because it is one of the mostused construction materials. On 316L type austeniticstainless steel the oxide film composition dependsstrongly on the reaction temperature, exposure timeand reaction media. High temperatures result in a Crand Mn rich oxide. After oxidation at room and inter-mediate temperatures, Fe is found mainly in the oxidetop layer [1]. Oxidation in water at room temperatureforms a two layered passive film: outermost hydrox-ides and underneath Fe-Cr oxides [2, 3].The aim of our investigation was to compare the oxi-dation behaviour of 316Ti steel under different condi-tions at intermediate temperatures, as applied e.g. incatalytic reactors or under hot water conditions in nu-clear reactor systems.
Slabs 20x10x2 mm in size of type 316Ti (DIN 1.4517;Fe 65 - Cr 17 - Ni 12 - Mo 2.1) stainless steel wasused. The samples were oxidised at 573 K between0.5 h and 120 days either under atmospheric con-ditions, or in high purity H2O at 90 bar, or under dry,respectively wet steam conditions.
The XPS spectra (apparatus: VG ESCALAB 220i XL,monochromatised Al Ka X-ray source, operated with200 W and 1 mm spot size) were obtained in normalemission mode. The analyser was set to EPass = 20eV. For depth profiling, an Argon ion beam with 3 keVand 1.2 mA (7.5 x 10¹² Ar+/sec) was rastered over anarea of 3x4 mm2 under an angle of 45°.
2 RESULTS AND DISCUSSION
After oxidation in dry air the composition profilesshowed that the sample surface consisted mainly ofiron oxides and carbonates, and that the near surfaceoxide layers are depleted from Cr, Ni and Mo. Ni andMo are detected first near the oxide/bulk interface.Oxides formed under aqueous conditions contain Niand Cr oxides and hydroxide species at the surfaceand near surface oxide layers. Again, Mo appears firstnear the oxide/bulk interface.
Figure 1 shows the development of the oxide growthversus time for the different conditions studied. In thepresence of water the oxide formation is strongly en-hanced. Different growth modes are observed. In thecase of oxidation in water, the 120-days result givesindications of a "breakaway oxidation".
3 SUMMARY
In the presence of water the oxidation rate is stronglyenhanced. A phenomenologically quadratic growth lawcompared to a 2-step linear growth mode is observed.Water influences the oxide composition and their ap-pearance in the oxide layer.
800-
600-
400-
200-
n-
316 Ti SteelOxidation at
Natural Oxide / RT
/ Dry Air •t •' • f - 4
—•—
573 K
Wet Steam
— *
O1s l\
H2O / \
s l" ^ ^ Dry Steam
0.1 1 10
Oxidation Time [days]
316 Ti SteelOxidation in dry air
Oxidation Time [days] Oxidation Time [days]
Fig.1: Development of the oxide layer thickness fordifferent treatments versus oxidation time.
4 REFERENCES
[1] I. Olefjord, Corros. Sci. 15, 687 (1975).
[2] I. Olefjord and H. Fischmeister, Corros. Sci. 15,697(1975).
[3] J.E. Castle and C.R. Clayton, Corros. Sci. 17, 7(1997)

94
LASER INDUCED DECOMPOSITION OF KAPTON®STUDIED BY INFRARED SPETROSCOPY
E. Ortelli, F. Geiger, T. Lippert, A. Wokaun
The UV-laser (308 nm) induced decomposition and ablation of Kapton was studied using Diffuse Reflec-tance Infrared Fourier Transform (DRIFT) Spectroscopy. The first step of photolysis is the simultaneousdecomposition of the imide ring and of the diary! ether group. In the next step the aromatic system decom-poses and isocyanates, aliphatic hydrocarbons, nitrites and alkynes are formed.
1 INTRODUCTION
During the past three decades, since the commerciali-zation of Kapton® polyimide, an impressive variety ofpolyimides with various properties have been synthe-sized. Approximately 15 years ago, the direct structur-ing or laser ablation of polyimides by excimer laserswas described first [1]. These studies showed clearlythat ablation caused clean etching of the material withmicron size precision. Because of the importance ofpolyimides in numerous applications and the difficultyin etching these polymers by other means, such find-ings prompted intensive further research. At the pre-sent time, laser ablation of polyimide is a routine partin microelectronic packaging and the fabrication ofnozzles for ink jet printer heads. The difficulty in etch-ing these polymers by other means started intensivefurther research.
The ablation products have been studied by a varietyof techniques, and the principal gaseous products, theablated area, and the redeposite soot have been ana-lyzed. Other surface species, intermediates and prod-ucts in the polymer film, which could be indicative of amechanistic scheme, are not reported to our knowl-edge.
2 EXPERIMENTAL
Kapton HN ® foils were abraded using a SiC disk. Thedisk with the Kapton scrapes is irradiated with anXeCI-excimer laser (308 nm) using defined energiesand pulse numbers. The disk is then placed in theDRIFT cell and analyzed.
3 RESULTS AND DISCUSSION
The change in the peak areas of several selectedbands is used to elucidate the laser induced decom-position pathway. In Figure 1 the proposed reactionpathway is shown. The imide system breaks betweenthe imide N and carbonyl carbon with a simultaneousdecomposition of the diaryl ether group, either in thesame repetition unit or at some other place along thepolymer chain. Upon further laser irradiation a con-stant concentration of these species is maintained,suggesting that creation and decomposition of thesegroups reach a quasi steady state. This first step isprobably photon-induced, but we cannot rule out atemperature increase. In the next steps, which couldalso be thermally induced, the aromatic systems de-compose, while acetylenes are formed. At the same
time isocyanate species are detected, which decom-pose upon further irradiation, or by reaction with otherspecies. This decomposition is at least partially ther-mal. In the following steps nitrile and aliphatic hydro-carbons (CH) are formed [2].
Y_/~X^~W
TO*
CH
indi-Fig. 1: Suggested decomposition scheme. Tcates a broken bond.
4 CONCLUSION
Silicon Carbide (SiC) is a suitable substrate for studiesof laser induced processes in polymers. The surfacesensitive DRIFT technique allows a detection of reac-tion intermediates and products of the laser treatedsolid polymer. The laser induced decomposition pat-way is identified.
5 REFERENCES
[1] R. Srinivasan, B. Braren, J. Polym. Sci. 22, 2601(1984).
[2] E.E. Ortelli, F. Geiger, T. Lippert, A. Wokaun,Macromolecules 33, 5090 (2000).

95
POLYIMIDE CARBONISATION AFTER LASER ABLATION
F. Raimondi, S. Abolhassani, R. Brutsch, F. Geiger, T. Lippert, J. Wambach, J. Wei, A. Wokaun
Kapton® polyimide was irradiated with a XeCI excimer laser (308 nm) and the ablated area and itssurrounding were studied using confocal Raman microscopy, scanning electron microscopy, transmissionelectron microscopy and energy dispersive X-ray analysis. Carbon was detected in a ring-like areasurrounding the ablation crater (low crystallinity) and on the top of the conical structures formed within theirradiated area at fluences between 40 and 250 mJ/cm2 (high crystallinity). It was demonstrated that Ca-containing impurities are responsible for the formation of the conical structures.
1 INTRODUCTION
Kapton® polymide is an important material in themicroelectronic industry, where it is used as dielectricin the production of multichip modules (MCM) [1].Chemical and morphological modifications upon laserirradiation are of high interest, since laser ablation isroutinely used in important manufacturing steps (e.g.production of via holes in MCMs).
In the present study Kapton™ films were ablated usinga XeCI excimer laser (X = 308 nm) with fluencesbetween 40 and 320 mJ/cm2, and with various pulsenumbers. The ablation craters and their surroundingwere studied by confocal Raman microscopy,scanning electron microscopy (SEM), transmissionelectron microscopy (TEM) and energy dispersive X-ray analysis (EDX).
2 RESULTS AND DISCUSSION
Figure 1 (top) shows the optical microscope image ofan ablation crater obtained with 200 pulses at 250mJ/cm2. Raman microscopy indicates that the darkring-like structure surrounding the crater consists ofpolycrystalline carbon with a relatively high bond-angledisorder. From the relative intensity of the carbon andpolymer Raman bands it can be demonstrated that thethickness of the carbon overlayer, deposited duringablation, decreases radially moving away from thecrater. TEM shows a thickness of 1.6 |jm at the crateredge [2].
The dark spots inside the ablated area are cone-likestructures, which are found only after ablation atfluences between 40 and 250 mJ/cm2. Their numberincreases with decreasing fluence, as indicated bycomparison of the two images in Figure 1. EDXanalysis revealed that the conical structures areassociated with the presence of Ca-containing speciesthat are not detected anywhere else. Carbon isdetected on top of the cone-like structures by Ramanmicroscopy. This carbon is more crystalline and showsless bond-angle disorder compared to the materialfound in the surrounding of the ablation craters. This isprobably due to a tempering-like process caused bythe prolonged exposure of these carbon particles tothe laser radiation. The average amount of carbon ontop of the conical structures increases with increasingpulse numbers. Moreover, no carbon is detected after200 pulses at fluences lower than 160 mJ/cm2,
Fig. 1:- top: Optical micrograph of an ablation crater
obtained with 200 pulses at 250 mJ/cm2.- bottom: SEM image of a crater ablated with
800 pulses at 160 mJ/cm2.
although cone structures are already fully developed.This excludes the hypothesis that carbon particlesdeposited on the irradiated area during the ablationprocess might cause the formation of the conicalstructures. Instead it is more likely that the Ca-containing impurities detected by EDX cause theformation of the cones by shading the underlyingpolymer from the laser radiation.
3 REFERENCES
[1 ] W. Kern, Semicond. Int. 8:7, 228 (1985).
[2] F. Raimondi, S. Abolhassani, R. Brutsch, F.Geiger, T. Lippert, J. Wambach, J. Wei, A.Wokaun, J. Appl. Phys. 88, 3659 (2000).
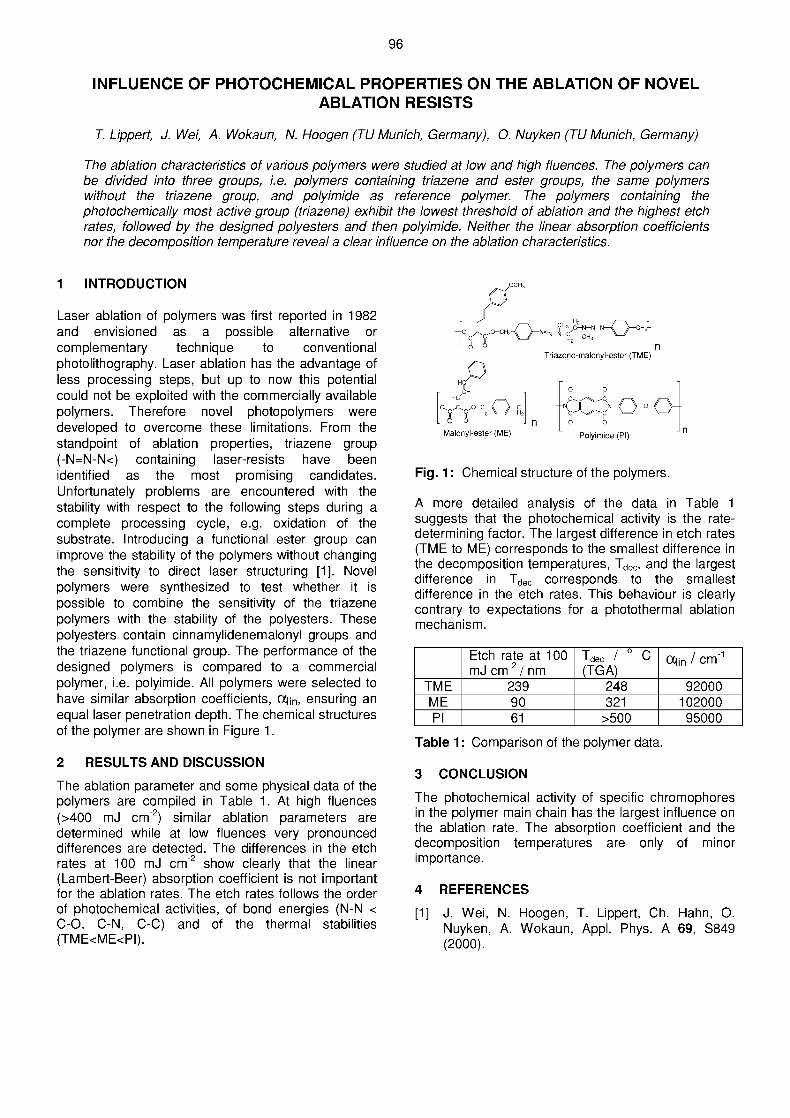
96
INFLUENCE OF PHOTOCHEMICAL PROPERTIES ON THE ABLATION OF NOVELABLATION RESISTS
T. Lippert, J. Wei, A. Wokaun, N. Hoogen (TU Munich, Germany), O. Nuyken (Til Munich, Germany)
The ablation characteristics of various polymers were studied at low and high fluences. The polymers canbe divided into three groups, i.e. polymers containing triazene and ester groups, the same polymerswithout the triazene group, and polyimide as reference polymer. The polymers containing thephotochemically most active group (triazene) exhibit the lowest threshold of ablation and the highest etchrates, followed by the designed polyesters and then polyimide. Neither the linear absorption coefficientsnor the decomposition temperature reveal a clear influence on the ablation characteristics.
1 INTRODUCTION
Laser ablation of polymers was first reported in 1982and envisioned as a possible alternative orcomplementary technique to conventionalphotolithography. Laser ablation has the advantage ofless processing steps, but up to now this potentialcould not be exploited with the commercially availablepolymers. Therefore novel photopolymers weredeveloped to overcome these limitations. From thestandpoint of ablation properties, triazene group(-N=N-N<) containing laser-resists have beenidentified as the most promising candidates.Unfortunately problems are encountered with thestability with respect to the following steps during acomplete processing cycle, e.g. oxidation of thesubstrate. Introducing a functional ester group canimprove the stability of the polymers without changingthe sensitivity to direct laser structuring [1]. Novelpolymers were synthesized to test whether it ispossible to combine the sensitivity of the triazenepolymers with the stability of the polyesters. Thesepolyesters contain cinnamylidenemalonyl groups andthe triazene functional group. The performance of thedesigned polymers is compared to a commercialpolymer, i.e. polyimide. All polymers were selected tohave similar absorption coefficients, ociin, ensuring anequal laser penetration depth. The chemical structuresof the polymer are shown in Figure 1.
2 RESULTS AND DISCUSSION
The ablation parameter and some physical data of thepolymers are compiled in Table 1. At high fluences(>400 mJ cm'2) similar ablation parameters aredetermined while at low fluences very pronounceddifferences are detected. The differences in the etchrates at 100 mJ cm"2 show clearly that the linear(Lambert-Beer) absorption coefficient is not importantfor the ablation rates. The etch rates follows the orderof photochemical activities, of bond energies (N-N <C-O, C-N, C-C) and of the thermal stabilities(TME<ME<PI).
Malonyl-ester (ME) Polyimide (PI)
Fig. 1: Chemical structure of the polymers.
A more detailed analysis of the data in Table 1suggests that the photochemical activity is the rate-determining factor. The largest difference in etch rates(TME to ME) corresponds to the smallest difference inthe decomposition temperatures, Tdec, and the largestdifference in Tdec corresponds to the smallestdifference in the etch rates. This behaviour is clearlycontrary to expectations for a photothermal ablationmechanism.
TMEMEPI
Etch rate at 100mJ cm"2/ nm
2399061
Tdec / C(TGA)
248321
>500
OCiin / cm"1
9200010200095000
Table 1: Comparison of the polymer data.
3 CONCLUSION
The photochemical activity of specific chromophoresin the polymer main chain has the largest influence onthe ablation rate. The absorption coefficient and thedecomposition temperatures are only of minorimportance.
4 REFERENCES
[1] J. Wei, N. Hoogen, T. Lippert, Ch. Hahn, O.Nuyken, A. Wokaun, Appl. Phys. A 69, S849(2000).

97
TOF-MS ANALYSIS OF POLYMERS DESIGNED FOR LASER ABLATION
M. Hauer, T. Dickinson (Washington State University), S. Langford (Washington State University),T. Lippert, A. Wokaun
A photolabile triazene polymer was irradiated with excimer lasers emitting at 308 nm and 248 nm. Theablation fragments where analysed by a time-of-flight mass spectrometer. The signal intensities of thefragments suggest that different mechanisms are active at the two irradiation wavelengths.
1 INTRODUCTION
Laser ablation of polymers has been studiedextensively over the last two decades with variousanalytical techniques. The ablation mechanisms, i.e.thermal, photothermal or photochemical, are still oftencontroversial. It has been repeatedly emphasised [1]that it is important to analyse the product distribution inorder to establish and/or test ablation mechanisms.Time-of-flight (TOF) distributions of neutral fragmentshave been analysed to determine the energydistribution of the fragments. In general, most TOF-mass spectrometer (MS) studies have given strongindications for photothermal ablation mechanisms. Totest, whether a photochemical ablation mechanismcan be identified with TOF-MS a triazene-polymer waschosen, which has given strong indications for aphotochemical ablation mechanism [2].
2 EXPERIMENTAL
The triazene-polymer was cast from two differentsolvents, (i.e. tetrahydrofuran (THF) and chlorbenzene(CB)) onto a quartz substrate. The TOF-distributionswere then analysed at 248 nm (THF, CB) and at 308nm (CB).
3 RESULTS AND DISCUSSION
The UV-Vis absorption spectrum of the triazene-polymer (the chemical structure is shown as insert inFigure 1) is shown in Figure 1. The absorptionmaximum at 330 nm is due to the photolabile triazenegroup (-N=N-N<) and the absorption at 248 nm is dueto the aromatic-ring-system. The main ablationproducts, i.e. nitrogen and phenyl fragments withmasses of 76/77 amu, were analysed in detail.
/=\ ? H 3 ? H s
—\ f~ N=N-N—(CH2)6-N-N=N- -
0.0-I
The TOF curves of the films, cast from THF, could befitted with an Arrhenius type model, suggesting aphotothermal ablation mechanism [3]. The data for themass 28 (i.e. nitrogen) after an irradiation at 308 nmand 248 nm are shown in Figure 2.The data taken after an irradiation at 308 nm exhibit alinear increase of the signal intensity at low fluences(< 40 mJ/cm2). With higher fluences the signal raises
1.0x10~6 -
0.8-
•) 0.6-CD
I 0.4 H
0.2-|
0.0
—)-• 28 AMU 308 nm•&• 28 AMU 248 nm
2 0 0 5 0 0300 400Wavelenght / nm
Fig. 1: UV-Vis spectrum of the triazene-polymer.
100 200 300 2 400Fluence /mJ*cm
Fig. 2: Signal intensity vs. fluence.much faster. This is an indication, that at fluencesabove aprox. 40 mJ/cm2 the process changes from alinear photochemical reaction to an ablation process.(30 mJ/cm2 where found with other techniques)At 248 nm the signal intensity increases much faster,and no linear increase could be observed. At highfluences the signal intensity reaches a maximum. Thisis probably due to absorption of the incoming photonsby aromatic fragments (e.g. radicals), which areproduced during the ablation process.
4 CONCLUSION
Theses measurements suggest that the ablationprocess is influenced by the irradiation wavelengthand various processes are active.
5 REFERENCES
[1 ] R. Srinivasan, J. Appl. Phys. A 56, 417 (1993).
[2] T. Lippert, J. Stebani, J. Ihlemann, O. Nyken,A. Wokaun, J. Phys, Chem. 97, 12296 (1993).
[3] T. Lippert, S.C. Langford, A. Wokaun, S.Georgiou, J.T. Dickinson, J.Appl. Phys. 86, 7116(1999).

98
DEMONSTRATION OF A WORKING POSITIVE-NEGATIVE LASER RESIST SYSTEM
J. Wei, T. Lippert, A. Wokaun, N. Hoogen (TU Munich, Germany), O. Nuyken (TU Munich, Germany)
Polyesters containing cinnamylidenemalonyl groups (CM-Polymers) which undergo photocrosslinking uponirradiation atX> 395 nm and laser direct structuring at 1= 308 nm have been developed for applications ascombined positive-negative resists.
1 INTRODUCTION
Ultrasensitive, photolabile polymers [1] have beendeveloped for laser ablation at specific irradiationwavelengths, i.e. 308 nm. The polymers exhibit veryhigh sensitivity to the laser irradiation wavelength anddecompose into gaseous species. However, theirradiation area is limited by the laser beam size. A'pure' laser process would be slow and tedious for thecreation of arrays of structures, e.g. micro-lens arrays,on a large substrate. To overcome this limitation,novel photopolymers have been developed which canbe used as classical negative (crosslinking) resists,but still exhibit very high sensitivity towards laser directstructuring. These polymers are based on polyesterscontaining cinnamylidenemalonyl groups (CM-Polymers) which undergo photocrosslinking uponirradiation at X > 395 nm and laser direct structuring atX = 308 nm. The structure and crosslinked structure ofthe CM-polymers are shown in Figure 1. In Volume Vof the PSI Scientific Report 1999, we reported theablation behaviour of these resists [2]. In this work, wedemonstrate the principle of the positive-negativeresists.
JnFig. 1: Structure of the cinnamylidenemalonyl esterpolymer (CM) before and after crosslinking.
2 EXPERIMENTAL AND RESULTS
A brass mask (100 mm thick) with a rectangularpattern was placed on a thin (3 to 5 |jm) polymer film,casted from CHCI3 solution on a quartz wafer. Thenthe film was irradiated through the mask pattern with aXe-lamp, equipped with a filter (Xirr > 395 nm) for 20min at a power of 100 mW cm"2. The irradiated filmwas developed by immersing CMcr for 10 sec intochloroform, which is a good solvent for CM. Ascanning electron microscope (SEM) picture of thedeveloped, negatively structured film is shown inFigure 2 (top). The crosslinked polymer squares weresubsequently irradiated with a XeCI excimer laser(Lambda Physik Compex 205), through a coppermask with a varying slit pattern, which wasdemagnified with a reflective objective (Ealing 15x).The SEM picture in Figure 2 (middle) shows the micro-structure obtained with a single pulse at 7.9 J cm"2.
The microstructure is well resolved and shows aresolution close to the limits of our setup (~ 1 |im). Totest, whether there is a preferential order ofprocessing steps, i.e. first negative development andthen positive laser structuring or vice versa, a polymerfilm was first structured with the laser, thencrosslinked and developed in CHCI3. Themicrostructure (Figure 2, bottom) reveals the samequality as the structures obtained for the experimentswith the opposite sequence.
Fig. 2: SEMpictures of thepolymer aftercrosslinking.Top: after wetdevelopment inCHCI3;Middle: structuringof the crosslinkedand wet developedpolymer (from topSEM) (1 pulse with7.9 J cm"2 at 308nm);Bottom: inverseprocessing, i.e.first laserstructuring, thencrosslinking andwet development.
3 CONCLUSION
In this work we have demonstrated that CM polymerscan be used as combined positive-negative resists.The order of processing, i.e. first negative thenpositive structuring or vice versa is not affecting thequality of the structures on a micrometer scale.
4 REFERENCES
[1] T. Lippert, J. Stebani, J. Ihlemann, O. Nuyken, A.Wokaun, J. Phys. Chem. 97, 12296-12301(1993).
[2] J. Wei, N. Hoogen, T. Lippert, Ch. Hahn, O.Nuyken, A. Wokaun, PSI Scientific Report 1999,V, 18-19(2000).

99
CONVECTION-INDUCED ABSORPTION OSCILLATIONS IN A CUVETTE AFTERIRRADIATION WITH UV-LASER PULSES
F. Gassmann, T. Lippert, J. Wei, A. Wokaun
Investigations of the origin of slow absorption oscillations after UV-laser irradiation of pentazadiene (PZ)solutions indicated that they are not of chemical origin but rather produced by pure physical convectivetransport. To test this hypothesis, convective transport combined with diffusion of PZ in tetrahydrofuran(THF) was simulated and the results compared with observations. Simplified analytical formulas to esti-mate convective activity in a cuvette are given. They are intended to prevent misinterpretations of experi-ments due to convection phenomena normally thought to be negligible in small cuvettes.
1 INTRODUCTION
Pentazadienes (PZ) are photosensitive compoundsshowing an absorption maximum around 380 nm.Decomposition of the N5 system (-N=N-N-N=N-) byUV-laser irradiation leads to a pronounced reductionof the absorption. Previous investigations of thisphotolysis revealed an oscillating behavior of themeasured absorption during the dark period followingthe irradiation [1]. To clarify the mechanism underlyingthese damped oscillations with periods of 10 to 100 s,additional measurements were performed. Theyshowed convincingly that the oscillations do not havetheir origin in chemical instabilities (our first hypothe-sis), but are produced by convection. Small horizontaltemperature differences due to the temperature stabi-lization system create a stationary convection cell.Absorption inhomogeneities produced by the laserirradiation combined with convective transport anddiffusion of PZ in tetrahydrofuran (THF) results in theobserved damped absorption oscillations. To provethis hypothesis, the respective physical processeshave been simulated.
2 THE SIMULATION METHOD
To simulate fluid convection, the following basic equa-tions have to be solved simultaneously:
• equation of motion (Navier-Stokes equation)
• continuity equation
• equation of state for THF (i.e. density variation ofTHF with temperature)
• transport equation for heat
• transport equation for PZ (PZ concentration isproportional to absorption).
Due to symmetries of the experimental setup, thecalculation of fluid convection in our temperature stabi-lized quartz cuvette can be restricted to the two mostimportant dimensions, namely the vertical (z) and thehorizontal (x, parallel to the laser beam). A tempera-ture gradient in the x-direction is driving a convectioncell. The physical origin of this temperature gradient isthe temperature stabilization system consisting of aseparate stabilization chamber at the back of the cu-
vette, through which water from a thermostat ispumped. It keeps the back wall of the experimentalchamber at a constant prescribed temperature. Itsfront wall however, where the laser beam enters, isinfluenced by the room temperature.
The method to solve the above described system ofpartial differential equations is widely used in meteor-ology and is described (for three dimensions) e.g. in[2]. By introducing a stream function *F and a vorticityfunction i;, pressure and the continuity equation canbe eliminated so that the main problem is reduced tosolving the Poisson equation ^ = A ^ (A is theLaplace operator). This is done for a rectangular do-main with quadratic grid cells using the IMSL-routineFPS2H. For 17x67 grid points and 20'000 time steps(a 0.006-0.03 s), a simulation needs roughly a minuteCPU-time on an Alpha 4100 computer.
3 EXAMPLES OF RESULTS
Simulations of the THF flow field with physical pa-rameters according to Table 1 resulted in a stationaryconvection cell shown in Figure 1.
J3yjmbol_
r|=pv
V
Y
PK
cH
D
gLH
Value
0.46 cP
5.06-10"3cm2s"1
128-10"5K"1
0.89 g cm"3
0.6Wm"1K"1
1720 J kg"1 K"1
15-10"5cm2s"1
9.81 m s"2
6.8 mm28 mm
Definition
dynamical viscosity of THF
kinematical viscosity ofTHF
expansion coefficient THF
density of THF
thermal conductivity of THFheat capacity of THF
effective diffusion coeff.normal acceleration
width of fluid (x-direction)
height of fluid (z-direction)
Table 1 : Physical parameters for 25°C.
Investigations of the Rayleigh-Benard convection (e.g.convection between two horizontal and parallel platesheated from below) show that the dimensionlessRayleigh number

100
Ra =gySTH3
VKwhere K =
K
PCH(1)
is the governing control parameter (definition of sym-bols cf. Table 1, 8T is the temperature differencebetween back- and front wall of the experimentalchamber) for buoyancy-induced transport in a viscousfluid. Dimensional analysis of the heat transport equa-tion gives for the ratio of convective to molecular heattransport the Peclet number P = V H / K . In this rela-tion, v is a typical velocity (e.g. the average or themaximum velocity). A numerical sensitivity analysisshows that
P « Ra for Ra small, P °c Ra for Ra large (2)
Solving the relations (2) for v and comparison withsimulations yields
;5.3-10-3.ax^p f o r R a < 1 5 0 .'000
forRa>350'000(3)
Fig. 1: x-z cross sectionof simulated stationaryvelocity field. Tempera-ture of the stabilizationchamber (right) is 30°C,room temperature is22°C. Coordinates aregiven as grid points 0-16and 0-66 with a grid con-stant of 0.425 mm. Theeffect of boundary cohe-sion at the left, bottomand right walls results inzero velocities. Max.velocities of 1.9 mm/sare found around z = 33,x = 3 and 13. The spec-trometer-beam is at co-ordinates x = 12, z = 17and is perpendicular tothe shown cross section.The laser beam is paral-lel to x and enters fromthe left with almost ho-mogeneous energy dis-tribution between z = 0and z = 37.
The transition range between small and large Rayleighnumbers is roughly 150'000-350'000. The flow fielddisplayed in Figure 1 has been calculated for Ra «3-106, e.g. the relation for large Ra applies where Kand cH are important parameters, but not p. Simula-
tions with Ra < 150'000 show negligible effects of Kand cH on v and linear relationships between v and p,7 , 5T and L2. The two coefficients in (3) have beencalibrated with different simulations and hold for v asthe maximum velocity. Relation (3) is useful to esti-mate convection velocities in small cuvettes inducedby horizontal temperature differences.
The experimental setup allows only the irradiation ofthe lower half of the solution. The distribution of theabsorption is therefore inhomogeneous within the fluidafter the single 20 ns laser pulse. The convection celltransports and mixes the two parts of the solutionresulting in damped absorption oscillations at thespectrometer location. The resulting oscillation periodsare directly coupled with the turnaround time of theconvection cell. Figure 2 shows measured and simu-lated damped oscillations with a period of 37 s.
0.65.0 100 i4o 2A0 250 300 350
time (s)
Fig. 2: Measured (thicker line) and simulated dampedoscillation of the absorption after application of a laserpulse at second 38 to a PZ solution in THF stabilizedto 30°C. The simulated laser energy was adjusted toreproduce the absorption drop following the laserpulse. The higher observed stabilization level is sup-posed to result from trans-cis isomerization followedby a slow thermal relaxation.
4 CONCLUSION
Normally neglected horizontal temperature differencescan lead to convection cells even in small 2 ml cu-vettes resulting in misinterpretations of experimentalresults. Our analytical relations are useful to estimateperiods of oscillations due to convective transport anddiffusion of concentration inhomogeneities.
5 REFERENCES
[1] T. Kunz, Ch. Hahn, Th. Lippert, F. Gassmann,Damped oscillations in UV-vis spectra of penta-zadiene monomers and polymers after laserphotolysis, J. Phys. Chem. A 103, 4855-4860(1999).
[2] W.K. Graber, W. Portmann, Modeling wind fieldsover complex terrain by superposition of scale-related processes and its application to the Alpineair mass exchange, Meteorol. Zeitschr., N.F. 2,153-166(1993).

101
Atmospheric Chemistry

102
OZONE AROUND MILANO, ITALY
A.S.H. Prevot, J. Dommen
During the the European LOOP project (Limitation of Oxidant Production) measurements of trace gasesand aerosols were performed in the Milan area. Up to 200 ppb of ozone were measured downwind of Mi-lano close to the Alpine foothills. The ozone production during one afternoon is often higher than 50 ppb,up to 100 ppb. The Milano region is one of the major air pollution regions around the whole Alps.
1 INTRODUCTION
The highest concentrations of ozone in Switzerlandare found in the Sotto-Ceneri of the Ticino, the south-ern tip of Switzerland. The maximum concentrations insummer are often twice as high in Ticino compared tostations north of the Alps. Several field campaignshave been conducted since 1991 to understand theozone production processes and to investigate possi-ble ozone reduction strategies. It was shown that veryhigh ozone concentrations (160-200 ppb) occur nearthe Alpine foothills if the location is down-wind of theMilano city plume [1]. Here, we will summarize howmuch ozone is produced during one day in the Milanoplume and in the Lombardy region in general.
2 DATA
During the LOOP (Limitation of Oxidant Production)campaign in May and June 1998, two rural and repre-sentative air quality stations Verzago and Landrianowere added to the Lombardy air quality network (Fig-ure 1). During summer days, winds develop from thePo Basin into the Alps. Landriano thus represents thepollution levels up-wind of Milano. Verzago is down-wind of the industrialized region around Milano and isin case of winds coming exactly from the south down-wind of the Milano city center. Additional aircraftmeasurements were performed to deduce the spatialconcentration differences in detail.
3 RESULTS
In the following, we will compare the typical ozoneconcentration ranges found around Milano. The lateafternoon concentration ranges are summarized inFigure 1. South of Milano, the ozone concentrationsare similar to the region of Zurich. Also the concentra-tion increase of about 0-25 ppb from noon (usually 60ppb) to the late afternoon is similar to the concentra-tion increase found in the area of Zurich [2]. North ofMilano, the concentration increases are dramatic.Starting with around 60-80 ppb south of Milano, 120 to180 ppb are reached down-wind of Milano. Even out-side the Milano plume, 90-150 ppb are reached. Thisyields a gradient of around 30-70 ppb ozone from thesouthern to the northern part of the Po Basin. On topof that, the Milano city plume itself adds another 20-40ppb ozone, yielding up to 100 ppb of ozone produc-tion. In comparison, 120 |j.g/m3 (around 60 ppb) ofozone should not be exceeded by more than one hourper year in Switzerland.
120-
80
£0)Eo
40
• Verzago
120-180 90-150 ppbppb
Milano
60-85 ppb • Landriano
o660 700
kilometer740 780
Fig. 1: Location of the air quality stations Verzagoand Landriano. The concentration ranges refer to typi-cal concentrations ranges of the late afternoon ozoneconcentration at different locations around Milano insummer.
4 FURTHER WORK
Within the LOOP project, models and measurementsof a large number of different trace gases and aero-sols will be used to elucidate the limiting factors(emissions, meteorology) of the ozone production. Amodel output of the ozone distribution can be found inthis issue [3].
5 ACKNOWLEDGEMENTS
We like to thank all the providers of data within theLOOP project and the BUWAL for the funding of theaircraft measurements.
6 REFERENCES
[1] A.S.H. Prevot et al., The Milan photooxidantplume, J. Geophys. Res. 102, 23375-23388(1997).
[2] J. Dommen et al., Photochemical production andaging of an urban air mass, J. Geophys. Res.104, D5, 5493-5506(1999).
[3] N. Ritter et al., Comparison of model results(UAM-V) with measured data during LOOP, thisissue.

103
COMPARISON OF MODEL RESULTS (UAM-V) WITH MEASURED DATA DURINGLOOP
N. Ritter, M. Tinguely, S. Andreani-Aksoyoglu, J. Dommen, J. Keller, A. Prevot
The three-dimensional photochemical Urban Airshed Model with variable grid (UAM-V) is used to investi-gate the temporal and spatial behavior of the photooxidant production in the highly polluted Milan area(Italy) in spring 1998. A dense network of continuously working ground based monitoring stations in theItalian provinces and in the Canton Ticino measured numerous chemical species as well as different mete-orological parameters in the whole region. Additional information in the upper boundary layer is availablefrom chemical measurements in an airplane and meteorological data from soundings and a wind profiler.The dataset offers a unique opportunity to validate model results.
1 INTRODUCTION
The Milan metropolitan region is the most industrial-ized and populated area in Northern Italy and is regu-larly affected by high ozone concentrations duringstagnant weather conditions (low wind speed) andhigh solar radiation. In such a case, the breeze direc-tion during the day is south to north, and during thenight and in the early morning hours from north tosouth. Ozone is formed through various chemical re-actions between NO* (NO+NO2), volatile organic com-pounds (VOC) and solar radiation and shows no line-arity between these parameters.
A measuring campaign within the LOOP project (Limi-tation of Oxidant Production), a subproject of EURO-TRAC-2, was carried out in this area in the earlysummer 1998. The aim of the LOOP project is to im-prove the understanding of the temporal evolution andthe spatial extent of different photooxidant productionregimes in the planetary boundary layer of the Milanarea in order to assess the effectiveness of reductionstrategies of the ground level ozone.
2 MODEL SIMULATIONS
The UAM-V is used to simulate the air quality in theLOOP-domain (141 km x 162 km). The simulationsare performed with a spatial resolution of 3 km x 3 kmand 8 vertical terrain following layers. The model usesthe Carbon Bond Mechanism (CBM-IV) and requiresan hourly and day-specific database for input prepara-tion. The simulation period is 12.-13.5.1998, with oneadditional start-up day to limit the influence of the ini-tial concentrations.
3 RESULTS
The weather conditions with low wind speeds, hightemperature and clear sky were favourable for highphotooxidant production. Ozone concentrations atground level of more than 190 pbb were measureddownwind of Milan city close to the Alpine foothills(Figure 1). A highly polluted plume of 50 km widthcould be observed by airplane measurements of en-hanced ozone. Such an ozone plume is also producedby the model (Figure 2), however, it appears northwestof Milan. Adjustments of the meteorology will beneeded for further data intercomparisons.
.aa.
200
150
100
50
n
-
I Verzago
-
X x x
a
-
Milan = :a D
12
time
18 24
Fig. 1: Measured ozone concentration at the urbanMilan station and the rural site of Verzago, -27 kmnorth of Milan, May 13, 1998. The rural station showsa significantly higher O3 concentration. The time in thefigure is given in CET (Central European Time).
5 I 40 / j
5120
5100
— 5080
5060
5040
5020
5000
u
180
160
140
120
100.o
x (km)
Fig. 2: Modelled ozone distribution in the LOOPdomain at 15h CET, May 13, 1998. A highly pollutedplume moves slowly from south to north. Thecoordinates are given in UTM (Universal TransverseMercator Projection).

104
CLEANSING OF THE PO BASIN AIR BY NORTH FOEHN
R. Weber, A.S.H. Prevot
The Po Basin is a region where very high ozone concentrations are found in summer. We found that northfoehn situations with advection of air from the Alpine crest lead to significant reduction of ozone concentra-tions in summer. The cleansing is evident in a large region starting at the southern Alpine foothills, reach-ing areas close to Milano.
1 INTRODUCTION
In the strongly industrialized region around Milano inthe Po Basin, one usually finds high concentrations ofboth primary pollutants (nitrogen oxides, volatile or-ganic compounds and aerosols) and secondary pol-lutants such as ozone. During stagnant fair weatherconditions, very high levels of ozone can be built upand accumulated within the basin [1,2]. So far, it hasnot been systematically investigated which processesterminate the accumulation periods. Usually, the pollu-tion levels drop when cloudy and rainy conditions re-place the good weather. We suppose that in regionsnear larger mountain ranges, air masses from the freetroposphere might be transported down to low alti-tudes. Such processes could lead to advection of airwith low primary pollutant concentrations replacing thepolluted boundary layer air. The low primary pollutantcontent in the free tropospheric air masses will alsolead to a substantial reduction in the production ofozone.
2 DATA AND RESULTS
The effect of Foehn on the ozone levels was studiedby using data of the last ten years at the station Men-drisio, located in the Alpine foothills on the northernedge of the Po Basin (see Figure 2). Meteorologicaldata from Stabio, 4 km southwest of Mendrisio, wastaken for the determination of the prevailing weatherconditions. In Figure 1, the daily ozone maximum con-centration is plotted against the afternoon mean tem-perature. Generally, ozone concentrations increasewith temperature, reflecting higher ozone concentra-tions in summer than in winter. In order to select dayswith possible advection of free tropospheric air, wedefine north foehn days by requiring that the meanafternoon wind direction at Stabio lies between 0 and36°. The ozone temperature relationship on thesenorth foehn days is given by the grey dots and theinset in Figure 1. The ozone concentration range ismuch smaller (40-60 ppb), yielding high concentra-tions in winter and low concentrations in summercompared to the data of all days. The observed con-centrations on the north foehn days match the yearlycycle of ozone at Jungfraujoch.
The data at Mendrisio have shown that the concentra-tions of ozone are substantially reduced by north foehnin summer. This leads to the question how far south-ward this cleansing mechanism is effective. We useddata from 20 stations in the Regione Lombardia toanswer this question. We tested whether the ozoneconcentrations were significantly lower on days withnorth foehn for temperatures in the range of 20-30
degree C. This was found to be true for most stationsnorth of Milano (black circles in Figure 2).
150150-
-10 0 10 20 30Afternoon temperature (deg C)
Fig. 1: Afternoon ozone maximum concentration atMendrisio versus afternoon mean temperature atStabio. The gray dots and the inset show data of northfoehn days.
inMSL
10630 680 730 780
Swiss coordinates east (km)
Fig. 2: Locations of air quality stations used in thisstudy. The filled symbols refer to stations where northfoehn reduces ozone in summer. White triangle: Jung-fraujoch, black triangle Mendrisio.
3 ACKNOWLEDGEMENTS
We thank the providers of the station data, Ufficiodella protezione dell'aria in Bellinzona, the Swiss Me-teorological Institute, and the Regione Lombardia.
4 REFERENCES
[1] A.S.H. Prevot et al., The Milan PhotooxidantPlume, J. Geophys. Res. 102, 23375-23388(1997).
[2] A.S.H. Prevot and J. Dommen, Ozone aroundMilano, Italy, this issue.

105
VERTICAL WIND MEASUREMENTS DURING THE 1999 MAP-FORM FIELDCAMPAIGN
M. Furger, Ch. Haberli (MeteoSchweiz), B. Neininger (MetAir AG)
PSI deployed two crosswind scintillometers as a contribution to the MAP-FORM campaign to measurewind at 500 m above ground in the area of Sevelen, a few kilometers north of Sargans. The scintillometersare unique with their capability to measure the vertical wind component. During strong foehn sustainedterrain-induced downward motion of up to 8 m/s has been observed. The measurements were comparedto radiosonde and aircraft measurements.
1 INTRODUCTION
The Mesoscale Alpine Programme (MAP) is an inter-national meteorological research programme with thegoal of improving the understanding of orographicallyinfluenced wet and dry atmospheric processes. Theresults should ultimately lead to refined weather fore-casts in the Alps, especially for extreme events likeflash floods (e.g. Gondo, Switzerland, 14 Oct 2000)and severe storms. A campaign overview is given in[1]. Part of this program was FORM, the Foehn-in-the-Rhine-Valley-during-MAP campaign, which took placein the Rhine Valley between Chur and the Lake ofConstance from 7 Sep to 15 Nov 1999.
2 EXPERIMENT SETUP AND GOALS
PSI deployed two scintillometers [2] to measure thepath-averaged horizontal and vertical crosswind atabout 500 m above ground [3]. Our scintillometersmeasure horizontal and vertical wind componentssimultaneously. We wanted to test the instrumentsduring long-term monitoring and validate the calibra-tion in strong wind conditions.
3 RESULTS
The scintillometers provided more than 1700 h (10weeks) of continuous measurements. Maintenanceintervals could be increased to several weeks withoutdata loss or beam alignment problems.
Verifying the calibration of the scintillometers in highwind conditions was more difficult because of the ef-fects of orography and flow dynamics. The occurrenceof gravity waves in the valley during foehn was ex-pected, but the waves made an inter-comparison withrawinsonde data arbitrary. This was less so for aircraftmeasurements. An example of crosswind measure-ments is shown in Figure 1. Values range up to 40 ms"1 for horizontal wind, and -11 m s"1 (i.e. downward)for the vertical component. Such large values sus-tained over several hours were astonishing, and averification with independent measurements was re-quired. The intercomparisons with aircraft datashowed that the scintillometers measure crosswindspeeds of up to 40 m s"1 reliably, and that the remain-ing discrepancies have to be attributed to the complexstructure of foehn flow in that particular area. Verticalvelocity measurements could not be directly verified
due to the local separation of the different platforms,but aircraft and rawinsonde data exhibited the samerange of vertical velocity variance as the scintillome-ters. We conclude that the scintillometers are capableof measuring both the horizontal and vertical windcomponents reliably even under strong wind condi-tions. The complete scintillometer measurementshave been included in the MAP database at the MAPData Center in Zurich (www.map.ethz.ch) and areavailable for further study.
12
1212 18
TimeCET(h)
Fig. 1: Horizontal and vertical crosswind componentsmeasured with a scintillometer at Ergellen (a farmnear Sevelen, Switzerland), 24 Oct 1999. Negativevalues indicate downward motion.
4 REFERENCES
[1] P. Bougeault, P. Binder, A. Buzzi, R. Dirks, R.Houze, J. Kuettner, R.B. Smith, R. Steinacker, H.Volkert, all MAP Scientists, The MAP Special Ob-serving Period, Bull. Amer. Meteor. Soc, ac-cepted, (2001).
[2] L. Poggio, M. Furger, A.S.H. Prevot, W.K.Graber, E.L Andreas, Scintillometer wind meas-urements over complex terrain, J. Atmos. Oce-anic Technol., 17, 17-26 (2000).
[3] M. Furger, Crosswind measurements with scintil-lometers at 500 m above valley floor duringfoehn, 9th Intl. Conf. Mountain Meteor., Aspen,Colorado, 75-78 (2000).

106
REAL TIME RISK ASSESSMENT FOR ATMOSPHERIC DISPERSION OF ACCIDEN-TALLY RELEASED AIR POLLUTANTS FROM NUCLEAR POWER PLANTS
W.K. Graber, M. Tinguely
An emergency decision support system for accidental releases of radioactivity into the atmosphere is pre-sented. This system is based on intensive field campaigns in the regions around the Swiss nuclear powerplants. The field data from temporary and permanent stations are analysed to evaluate the typical windfield patterns of the regions. A cluster analysis for this data-set lead to 12 different wind field classes with ahigh separation quality. It is demonstrated that an on-line acquisition of meteorological data from perma-nent stations can be used to diagnose the recent wind field class with a probability of 96 % to hit the cor-rect class. Furthermore, a method is outlined to use a weather prediction model to forecast the future windfield classes. An average probability of 79 % to hit the correct class for a forecast time of 24 hours isevaluated.
1 INTRODUCTION
Since 1995 the project "Windbank" has been runningto evaluate the regional wind field patterns aroundnuclear power plants in Switzerland. The aim of theproject is an on-line diagnosis and prognosis of thewind field with high spatial resolution. This approachmeets the requirement of decision makers in cases ofaccidential releases for precise knowledge and predic-tion of a dispersion in the vicinity ot the release point.
Especially, knowledge of the wind field in complexterrain is essential for developing a clear picture ofthe atmospheric dispersion after an accidential re-lease. To make an emergency decision support sys-tem operative, the fact is used that wind fields in aregion with complex orography can be attributed to asmall number of wind field classes which can be de-fined by a few permanent stations.
For emergency applications, the functional reliability ofa decision support system as well as the simplicity ofits use and the clarity and accuracy of immediate re-sults are of prevalent importance. The following ap-proach is based on a classification of the regional windfields. Wind field classes based on extensive meas-urements are considered to be much more convincingthan complicated and lasting calculations with amesoscale model. For our meteorological problem,the only information to decide which wind field class isactive in a given moment comes from routine mete-orological measurements via an on-line connection.
2 EXPERIMENTS AND CLASSIFICATION
Three intensive field campaigns were carried out inthe years 1995, 1997 and 1999, each lasting 4months. The temporary measurements covered anarea of about 30 by 30 km around the nuclear powerplants at Beznau, Miihleberg and Gosgen. The meas-urements of 20 permanent and 22 temporary stationswere used. Additionally, two SODAR (sound detectionand ranging) instruments were operated to get infor-mation ot the vertical wind distribution.
To bridge the gap from the regional meteorologicalsituation to the continental scale, the output of a highresolution numerical weather prediction model wasincluded in the data-set. The model used is a non-
hydrostatic mesoscale model routinely operated by theSwiss Meteorological Institute (MeteoSchweiz) asdescribed in [1]. A set of 25 data-points from this nu-merical weather prediction model is extracted forevery hour during the intensive field campaigns.
These data are combined with the measured data andcollected in a data-set based on hourly wind averages.The classification of the wind fields is based on thecluster analysis described in [2]. It is shown that 12different classes represent the wind field patterns forall three areas with good separation quality.
For the calculation of wind fields for each class, themean winds of all data points are interpolated to aregular grid. The horizontal resolution is 500 m andthe grid consists of 100 by 100 points, covering anarea of 50 by 50 km around each of the three nuclearpower plant sites. The interpolated wind fields areevaluated for divergence and corrections are intro-duced to eliminate divergence. The corrections aremade by slight adaptations of the horizontal wind fieldon every layer and by introducing vertical windspeeds.
The wind fields for 12 classes and 3 different siteswere calculated and can be taken from the corre-sponding file in case of an on-line diagnosis of thewind situation. Since model runs are computer timeconsuming, this is a substantial improvement withrespect to the acquisition speed in the framework of adecision support system. Based on the wind fieldmodeling described above, a dispersion can be calcu-lated afterwards for visualizing the flow pattern of ahypothetical release at a given emission source. Moredetails are given in [3].
3 DIAGNOSIS OF WIND FIELD CLASSES
About twenty of the data points used in the classifica-tion are provided by routine stations. These data arecontinuously available on-line and are updated every10 min. The data from the weather prediction modelare also available permanently in intervals of 1 hourand with a 42 hours forecast period. 22 data pointsand profile data from the two SODARs came fromtemporary stations and are no routine data, they wereavailable only during the four months of the intensivefield campaigns.

107
For an accurate diagnosis of the recent wind fieldclass, wind data of the temporary stations are recon-structed with multivariate regression. For each windcomponent u and v of the temporary stations, the rou-tine and SM data during the field campaign are usedas independent variables.
In the next step, the recent wind field class is evalu-ated by comparing the on-line data and the recon-structed wind data for the temporary data points withall 12 average wind values of the 12 classes. For thiscomparison the distances between the recent winddata and these averages are used. The recent windfield class is given by that class which has the smallestdistance to the recent hourly data. The mean probabil-ity for diagnosing the "real" hourly wind field over all 12classes is 96 %. This percentage reflects the highquality of the reconstruction procedure and the reli-ability of the classification scheme.
4 PROGNOSIS AND DISPERSION MODEL
The numerical weather prediction model runs routinelyevery day and is successfully used to reconstruct thewind parameters at the temporary station points.Therefore, the prognostic capability of the model canbe used in the framework of the on-line wind fieldclass determination.
In this paragraph the expected probability of hitting thecorrect wind field class over a forecast time of 24hours is evaluated. In analogy to the multivariate re-gression for the temporary station data shown in theprevious chapter, a forecasted wind field class can befound by reconstructing all data points from the nu-merical weather prediction model.
As in case of the diagnosis, the forecasted wind fieldclass is derived from the reconstructed wind values byevaluating the minimal distances to all 12 classes.The overall average probability of hitting the correctwind field class as tested with the data from the fieldcampaign over the 24 hours is 79 %. The result scat-ters between 68 and 86 %, but shows no significantdependence on the forecast time.
In a last step, the windfields of the 24 hours from themost recent measurements and the 24 hours from thenumerical prediction model are combined and disper-sions are calculated from a hypothetical release at allthree nuclear power plant sites. This dispersion iscontinuously available in form of a graphic presenta-tion.
5 CONCLUSION
The classification scheme with real time evaluationand prediction of wind fields based on on-line data-
acquisition described above combines the very highspatial resolution of a temporary field campaign with anetwork of permanent wind stations and with the con-tinental wide information from weather stations inte-grated in a numerical weather prediction model. In anon-line test set-up for the three nuclear power plantsites in Switzerland, this procedure has proven to bepractical and reliable for use in emergency decisionsupport systems. The principle approach is visualisedin Figure 1.
field campaigns 1 July-31 October 1995, 1997, 1999
high resolution winddata (hourly basis)
Clusteranalysis
12 wind classes with 3-D wind fields foreach nuclear power plant site
online diagnosis basedon routine stations
online prognosis based onweather prediction model
windfield calculation and dispersion
scenario with a hypothetical emission source
Fig. 1: Overall scheme of wind field analysis, diagno-sis and prognosis.
6 REFERENCES
[1] F. Schubiger, G. De Morsier, Erstellung von An-fangs- und Randfeldern fur das hochauflosendeRegionalmodell (HRM) und zugehorige Experi-mente. Bericht Schweiz, Meteorol. Anstalt Nr.169, Zurich 1-30(1992).
[2] P. Kaufmann, R.O. Weber, Classification ofmesoscale wind fields in the MISTRAL field ex-periment, J. Appl. Meteorol., 35, 1963-1979(1996).
[3] W.K. Graber, F. Gassmann, Real time modellingas an emergency decision support system for ac-cidental release of air pollutants, Mathematicsand Computers in Simulation 52, 413-426 (2000).

108
UNEXPECTED VERTICAL PROFILES OBTAINED BYTHE UAM-V AIR QUALITY MODEL OVER COMPLEX TERRAIN
J. Keller, S. Andreani-Aksoyoglu, N. Ritter, M. Tinguely, A.S.H. Prevot
The air quality model UAM-V was tested using the complex topography of Switzerland. When the originalmodel was applied to a mountainous terrain, the mixing ratio of the pollutants showed unreasonable verti-cal profiles. Using CO as a tracer, we found that the model has several shortcomings regarding the trans-port of trace gases. After various modifications of the transport mechanism, the unexpected shapes of thevertical profiles disappeared.
1 INTRODUCTION
After having used the LJfban Airshed Model (UAM) forair quality modelling at PSI for the last few years, weprocured the updated version UAM-V with variablegrid capability [1]. The meteorological data required byUAM-V are prepared by the pre-processor SAIMM(Systems Applications International MesoscaleModel). The model package is widely used in the U.S.in the frame of air quality programs. The model do-main, however, was usually applied to flat domains(see e.g. [2]). UAM-V creates two output data sets foreach pollutant: the mixing ratio [ppb] in the lowestlayer averaged over 1 hour, and the instantaneousconcentration [umol/m3] in all layers at the end ofeach hour. We tested the SAIMM / UAM-V packagefor the complex Swiss topography. The size of themodel domain was 470 km x 385 km with 5 km gridcell size and 8 atmospheric layers up to 3000 m a.g.l.
2 UNEXPECTED VERTICAL CO PROFILES
Using the long-lived CO as a tracer, we found that theinstantaneous mixing ratio increased inexplicably withheight. For instance, a test run was initialised at noonwith 160 ppb CO in the layers 1 and 2 and 140 ppb inthe layers 3 to 8. After 2 hours of simulation the mixingratio increased up to 200 ppb in the upper layers. Inaddition, the Swiss topography was mirrored in thehorizontal CO distribution (Figure 1). The concentra-tion field (in (imol / m3), however, did not show thiseffect. After numerous calculations it became evidentthat UAM-V does not take into account expansion andcompression of trace gases when they are transportedfrom one pressure level to another. In applicationslinked with air quality regulations it is usually sufficientto consider the lowest layer only. On the one hand themixing ratios in this layer are strongly influenced by theemissions. On the other, most model domains investi-gated so far do not exhibit large altitude variations.Under these conditions the shortcomings mentionedabove are invisible.
We converted the trace gas concentrations of eachgrid cell to a common pressure and temperature be-fore the mixing processes due to vertical and horizon-tal turbulent exchange, advection and entrainmentoccur. After these modifications the pressure andtemperature dependence of the mixing ratios com-pletely disappeared.
. - - y'
E 200
150.• - J
..Iff
500 600[km"
700 300
Fig. 1: CO mixing ratio [ppb] of layer 7 (2000 to 2500m a.g.l.) on July 28, 1993, 14:00 CET. The simulationstarted 12:00 with a constant mixing ratio of 140 ppb.
3 CONCLUSION
For the first time the original version of UAM-V wasapplied to the complex Swiss topography. The mixingratio of CO increased with height above ground andthe topography was mirrored in the pattern of the up-per layers. We detected that the model neglects pres-sure and temperature changes when the trace gasesare transported between different altitudes. Theseshortcomings disappear if expansions or contractionsof the air are taken into account. Such features haveprobably not been observed so far because the do-mains of earlier investigations were usually flat.
4 ACKNOWLEDGEMENT
This work has been supported by the Kommission furTechnologie und Innovation (KTI).
5 REFERENCES
[1 ] User's Guide to the Variable-grid Urban AirshedModel (UAM-V), SYSAPP-99-95/27r2, SystemsApplication International (1999).
[2] W. Jiang, M. Hedley, D.L. Singleton, Compari-son of the MC2/CALGRID and SAIMM/UAM-VPhotochemical Modelling Systems in the LowerFraser Valley, British Columbia, AtmosphericEnvironmment, 32, 2969-2980 (1998).

109
EVALUATION OF DIURNAL HYPERSPECTRAL BIDERECTIONALREFLECTANCE FACTOR DATA ACQUIRED WITH THE RSL FIELD
GONIOMETER DURING THE DAISEX'99 CAMPAIGN
G. Strub, J. Keller, M. Schaepman (University of Zurich)
Satellite- and airborne imaging sensors acquire images under various view and sun angles. Due to theanisotropic behaviour of most ground surfaces, different illumination and viewing angles reduce the inter-comparability of images or portions of a single image. The acquisition and analysis of ground based multi-directional data help to quantify and correct angular effects in remote sensing data.
1 INTRODUCTION
The comparison of multiangular data sets with fieldgoniometer measurements is a method to validatebidirectional effects in data acquired by air- andspaceborne sensors. For this reason, goniometermeasurements were performed during the airborneimaging spectrometer campaign DAISEX'99 (DigitalAirborne Imaging Spectrometer Experiment) in theframework of ESA's Earth Observation PreparatoryProgramme [1].
The objective of the campaign was to demonstrate theretrieval of geobiophysical parameters from imagingspectrometer data for an agricultural test site in Spain.Intensive ground truth measurements were carried outfor the proper characterisation of vegetation, soil andatmospheric conditions. Spectral reflectance signa-tures under 66 different view angles were measuredusing the RSL field goniometer system (see Figure 1).For the study of the effect of varying sun angles, bidi-rectional reflectance factor (BRF) data were acquiredover the day.
Fig. 1: Spectro-directional measurements withFIGOS on an alfalfa field.
2 ANALYSIS
The data of the plant alfalfa (Medicago sativa L.)measured under nine different sun zenith angles arevisualized and statistically analysed (see Figure 2).
The weighted difference vegetation index (WDVI) [2],a secondary variable for the determination of leaf areaindex (LAI) is computed using nadir reflectancesmeasured under different sun angles with the followingequation:
WDVI=Reflectance(0.78um)-1.5Reflectance(0.67um).
iffP "*•
Fig. 2: Measured BRF of alfalfa (sun zenith = 55°).
3 RESULTS
The derived WDVI is strongly influenced by the reflec-tance variation at 0.78 urn, whereas at 0.67 urn onlyminor differences over the day are observed. Direc-tional effects are strongly represented in WDVI dataand have to be considered for reflectance meas-urements performed at different sun angles. Specialattention has to be paid to errors introduced by direc-tional effects if further parameters are derived fromWDVI. Due to an exponential correlation of the WDVIand the LAI [2], the variation of the LAI is larger thandeviations of original reflectance data.
4 CONCLUSION
The quality of vegetation parameters derived fromreflectance measurements may be strongly influencedby viewing and illumination angles. Directional effectsin remotely sensed reflectance data cannot be ne-glected in the process of deriving quantitative informa-tion about vegetation.
5 ACKNOWLEDGEMENT
This work has been supported by the Remote SensingLaboratories, University of Zurich.
6 REFERENCES
[1] M. Berger et al., The Digital Imaging Spectro-meter Experiment DAISEX'99, Proc. IGARSS,Hawaii, 3039-3041 (2000).
[2] J.CIevers, The application of a weighted infraredvegetation index for estimating leaf area index bycorrecting for soil moisture, RSE 29, 25-37(1989).

110
THE PSI ATMOSPHERIC POLLUTANT LABORATORY: SOPHISTICATED CHASINGOF GASES AND AEROSOLS
/. Polo, N. Bukowiecki, J. Dommen, A.S.H. Prevot, R. Richter, E. Weingartner, U. Baltensperger
The Laboratory of Atmospheric Chemistry at the Paul Scherrer Institute has developed an atmosphericpollutant mobile laboratory, including a large set of atmospheric gas phase and aerosol instrumentsplaced in a van. This laboratory has been implemented to measure in motion while driving the van, yield-ing pollutant concentration distributions at ground level. The project named YOGAM (Year Of Gas andAerosol Measurements) is the first one involving the mobile lab. In this project we investigate the currentaerosol particle and gaseous pollutant distributions in the Zurich region and surroundings during thecourse of a whole year. The project is partially funded by the Kanton Zurich and BUWAL.
It has been demonstrated in the last decades thatboth aerosol particles and high concentrations ofground-level ozone have adverse health effects.Common human activities, as traffic and industry, arenot only responsible of the major part of anthropo-genic aerosol sources, but also determine the ozoneproduction channel in urban sites.
The periodical monitoring of both paniculate andozone matter within urban and rural areas, in combi-nation with the measurement of meteorological pa-rameters, gives a better understanding of distribution,transport and aging processes of airborne pollutants.In this context, this atmospheric pollutant mobile labo-ratory has been developed. It is a commercial van(IVECO) in which some modifications have been in-troduced, in order to provide the required functionality.The most important modification is the installation of asecond generator to provide sufficient electric poweraccording to the instruments power demand.
Fig. 1: Scheme of the van and instruments set up.
The measuring devices are distributed in the van asshown in Figure 1. The instruments included in eachrack are listed in Table 1 and 2.
The van is also equipped with a GPS (Global Position-ing System), a wind speed- and direction-measuringdevice, a computer for the data acquisition and apower supply system. This power supply system in-cludes two 12-volt batteries working in parallel.
Instrument Parameter
DMA+ CPC(TSI 3010)
CPC (TSI 3022)
Eberline FH 62 I-R
OPC (Grimm 1.108)
Aethalometer MageeAE:9
Diffusion Charger, DC
Size distribution 7-330 nm
Number concentration N(d > 7 nm)
Mass concentration
Size distribution 0.3-20 (im
Black carbon
Total active area SA
Table 1 : Instruments for aerosol particle character-rization and their corresponding parameters.
Instrument
Developed by PSI/IFU
AEROLASER AL2002
PSI/Julich/ MetAir)
Developed at PSI
LI-COR (LI-6262)
AEROLASER AL5001
Species
Formaldehyde
Peroxide (H2O2, total)
NO, NO2, NOy, PAN, HNO3
Ozone
Carbon dioxide
Carbon monoxide
Table 2: Instruments for gas phase chemistry studyand measurable species.
The atmospheric pollutant mobile laboratory will firstbe used for the YOGAM project. This is a project thatdeals with the measurement of aerosol particles andgas phase chemistry periodically, once a week, duringthe course of a year and within the Zurich region. Themain aim of this project is to study air mass agingprocesses under different meteorological conditions,locations, and seasonal variation of these processesalong the year. So far, the Zurich plume has mostlybeen studied during episodes [1]. This project consti-tutes an innovative approach, involving both tracegases and aerosols.
REFERENCES
[1] J. Dommen et al., J. Geophys. Res. 104, 5493-5506(1999).

111
ULTRAFINE PARTICLES FROM DIESEL ENGINES
N. Bukowiecki, U. Baltensperger, W. Watts (University of Minnesota, Minneapolis),D.B. Kittelson (University of Minnesota, Minneapolis)
During a field campaign in Minnesota and Indiana (USA) led by the University of Minnesota, the use of alarge variety of aerosol instruments allowed detailed investigations on the formation and characteristics ofultrafine diesel exhaust particles (10-50 nm), which were consistently observed both during roadwaymeasurements and chassis dynamometer experiments. Since the exact composition and possible healtheffects of these particles are still subject to current investigations, a highly time-resolved monitoring isimportant to provide a complete understanding of the formation, dynamics and impact of the ultrafine par-ticles.
1 INTRODUCTION
In the last years, a new focus has been put on theinvestigation of ultrafine particles (10-50 nm), whichappear in diesel exhaust under conditions which havebeen shown to strongly depend on the dilution proc-ess of the raw exhaust [1]. The motivation for this fieldof research is based on the results of several healthstudies on ultrafine particles and on the attempt to setnew standards for emission regulation and ambientconcentration levels. Though the composition of theultrafine particles is not fully characterized yet, it isknown that they do not consist of soot, but rather con-tain semivolatile hydrocarbons, a small amount ofboth sulphuric acid and water, and other organic com-pounds [1].
A widely used instrument for measuring nanoparticlesize distributions is the SMPS (Scanning Mobility Par-ticle Sizer), which provides highly size-resolved sizedistributions, but shows a time resolution significantlyhigher than 1 minute. As an alternative, the use of aDiffusion Charger (DC), a Photoelectric Aerosol Sen-sor (PAS) and a Condensation Particle Counter (CPC)delivers relevant key parameters of diesel exhaustsize distributions with high time resolution (< 10 sec-onds) [2]. These key parameters are valuable informa-tion with respect to the presence and the amount ofultrafine particles.
2 EXPERIMENTAL
Data was collected with the Mobile Emission Labora-tory (MEL) described in [1]. The MEL allowed on-roadexhaust plume investigations by following heavy-dutydiesel trucks and other vehicles and was also used forgeneral monitoring of on-highway particle concentra-tions. The same instrumentation was also used forchassis dynamometer testing of diesel engines.
3 RESULTS
Figure 1 shows the PAS response against the DCsignal for a 4-hour freeway ride in the Minneapolis cityregion. Two distinct branches are seen, which wasalso the case for PAS/DC plots resulting from chassisdynamometer testing. A flat slope clearly could beassigned to situations where a highly concentrateddiesel ultrafine mode was present in the sampled
aerosol, whereas the absence of this mode was indi-cated by a highly positive slope. This information,together with the total aerosol number concentration,makes the PAS, DC and CPC a suitable instrumentcombination for monitoring the presence of ultrafinediesel particles with a high time resolution [3].
DC Surface Area (^m /cm )Fig. 1: PAS/DC plot for a 4-hour freeway ride.
4 ACKNOWLEDGEMENTS
Funding support for the mentioned project is spon-sored by the following U.S. institutions: CoordinatingResearch Council (CRC), Department of En-ergy/National Renewable Energy Laboratory (DOE/NREL). Co-Sponsors are the Engine ManufacturersAssociation, Southcoast Air Quality Management Dis-trict, California Air Resources Board, Cummins Inc.,Caterpillar Inc. and Volvo Inc.
5 REFERENCES
[1] D.B. Kittelson et al., Diesel Aerosol Sampling inthe Atmosphere, SAE Technical Paper Series2000-01-2212(2000).
[2] U. Matter et al., Environ. Sci. Technol. 33, 1946-1952(1999).
[3] N. Bukowiecki et al., Comparing SMPS Size Dis-tributions with DC, PAS and CPC Data, Proc. ofthe 4th ETH Conference on Nanoparticle Meas-urement, Zurich, August 7-9, (2000).

112
CHARACTERIZATION OF 20 nm- AEROSOL PARTICLES DURINGAN URBAN RUSH HOUR
N. Streit, E. Weingartner, S. Nyeki, U. Baltensperger,R. Van Dingenen (JRC, Ispra), H. W. Gaggeler (PSI, Uni Bern)
Urban morning rush hours lead to a marked increase in ultrafine aerosol particle concentration. Both thevolatility and the hygroscopicity of these aerosol particles were investigated in Milan during the PIPAPOfield campaign.
1 INTRODUCTION
Aerosol measurements were performed in Milan, Italy,during the PIPAPO field campaign [1]. The aerosol asit occurs during the morning rush hour is discussed,with a focus on ultrafine particles. Below, its hygro-scopicity and volatility at a temperature of 110 and280°C, as measured with a thermodesorber/ SMPSsystem [2], are presented. The hygroscopic growth ofparticles with a dry diameter Do = 20 nm was deter-mined by a hygroscopicity tandem differential mobilityanalyzer (HTDMA, [3]).
2 RESULTS
First, the aerosol volatility as a function of size is dis-cussed (Figure 1). It shows the average fraction ofaerosol non-volatile at 110°C and 280°C at 0800CEST for all days and the average aerosol numbersize distribution at 0800 CEST as additional informa-tion. The maximum of the number size distribution liesat D = 26 nm. The fraction of aerosol particles non-volatile at 110°C goes through a 0.2 minimum at D =30 nm, steadily increasing to 0.9 at D = 150 nm. Thefact that as much as 80% are volatilized at 110°Cpoints to a chemical composition of the ultrafine parti-cles of either sulfuric acid or volatile organic material.While pure sulfuric acid particles with Do = 20 nmhave a growth factor of about 1.8 [4], particles consist-ing of oxidation products of typical ambient organicsubstances have a growth factor of below 1.1 [5].
o
frac
titil
e
_sOA
-l
o
1.0-
0.8 -
0.6 -
0.4 -
0.2 -
o . o -
x^*X x
x X x
X
10
Non- volatile at 110 °C
• • • " . * " • . *
x " * • "x • "
* i
A 1
x x x
1 1 1 1 1 ' '
100
D [nm]
* Non-volatile at
•
*
A
i 1 i> i i i
- 40000
- 30000
- 20000
- 10000
1000
280 °C x dN/dloi
a01)o
ZT3
Fig. 1: The average fraction of aerosol non-volatile at110°C and 280°C at 0800 CEST for all days and theaverage aerosol number size distribution.
As Do = 20 nm rush hour particles do not grow signifi-cantly when exposed to RH = 90% (Figure 2), theycannot consist of sulfuric acid and are thought to con-
sist mainly of hydrophobic organic material. They arequite likely to contain sulfur, though, as sulfuric acidmay play an important role in the formation of particlesthrough homogeneous nucleation.
\ ^ 6 0 "
22 20-
73 0-
10 20
D [nm]
30 40
Fig. 2: The mean number size distribution of Do =20 nm particles (dry diameter) after exposure to RH =30% or 90% and respective log-normal fits (line).
For particles with D < 70 nm, there is no significantdecrease in the non-volatile fraction when moving tohigher temperatures (280°C). At D > 100 nm, the vola-tility of the particles increases at higher temperaturesand the non-volatile fraction decreases to approxi-mately 0.4. This additional evaporation at higher tem-peratures can be attributed to secondary aerosol par-ticles such as ammonium sulfate.
3 ACKNOWLEDGEMENT
This work was supported by the Swiss Commissionfor Technology and Innovation (KTI).
4 REFERENCES
[1] N. Streit et al., PSI Scientific Report, I, 143(1998).
[2] H. Burtscher, et al., J. Aerosol Sci. in press(2001).
[3] E. Weingartner, S. Nyeki, S. Henning,U. Baltensperger, J. Aerosol Sci. 30, S17 (1999).
[4] J. Q. Xiong, M. Zhong, C. Fang, L. C. Chen, M.Lippmann, Environ. Sci. Technol. 32, 3536(1998).
[5] Virkkula, A., R. van Dingenen, F. Raes, J. Hjorth,J. Geophys. Res. 104, 3569 (1999).

113
CLOUD AND AEROSOL CHARACTERIZATION EXPERIMENT (CLACE) AT THEJUNGFRAUJOCH - AN OVERVIEW
E. Weingartner, S. Henning, N. Bukowiecki, M. Gysel, S. Nyeki, U. Baltensperger, P. Quaglia (EPFL),G. Larchevêque (EPFL), B. Calpini (EPFL), E. Karg (GSF), B. Busch (Uni Mainz), K. Kandier (Uni
Mainz), L. Schütz (Uni Mainz), A. Hoffer (Uni Veszprem), Z. Krivacsy (Uni Veszprem), K.-P. Hinz (UniWürzburg), A. Trimborn (Uni Würzburg), B. Spengler (Uni Würzburg), M. Eben (TU Darmstadt),
S. Weinbruch (TU Darmstadt), S. Schmidt (IFT, Leibzig), M. Wendisch (IFT, Leibzig)
With the participation of eight German, Hungarian, and Swiss institutes the intensive field campaignCLACE took place during February/March 2000 at the high alpine research station Jungfraujoch (JFJ,3580 m asi, Switzerland). The main goals of CLACE were to examine cloud formation processes underdifferent meteorological conditions, to characterize organic aerosol compounds, to compare particle sizedistributions measured under different conditions and to determine hygroscopic properties of aerosols.
1 INTRODUCTION
The observation of cloud and aerosol has been con-ducted at the JFJ since 1988 and has established thesite to be suitable for the long-term monitoring of theaerosol of the lower free troposphere, which is per-formed within the Global Atmosphere Watch (GAW)programme.
During CLACE, with the instrumentation and expertiseof the contributing scientists, the following aerosolparameters were measured simultaneously: numberand surface area concentrations, aerosol and clouddroplet number size distributions, aerosol volatility,chemical composition (major ions and organic com-pounds), particle morphology (SEM, TEM), singleparticle composition (TOF-MS), spectrally resolvedlight scattering and absorption, water soluble fractionas well as hygroscopic growth (HTDMA). Here, we willgive an example of particle number concentrationmeasured with different methods and under differentconditions.
2 EXPERIMENTAL
Ambient aerosol was sampled by different inlet sys-tems: A heated inlet, as described in Weingartner etal. (1999) [1], was used to measure the total aerosol.In addition, the interstitial aerosol was sampled by acascade impactor, which was designed to removecloud droplets.
Total and interstitial particle size distributions weremeasured with three different Scanning Mobility Parti-cle Sizers (SMPS, D = 0.02 to 0.8 (im). One SMPSwas operated in the laboratory at approx. 25 °C andsampled the aerosol alternately from both inlets. An-other SMPS system measured the interstitial aerosol,which passed through a thermodesorber system [2]. Athird SMPS system was located outdoor and meas-ured the size distribution at ambient relative humidityand temperature conditions.
3 RESULTS
Figure 1 shows the 24-h variation of the particle num-ber concentrations for the different systems. On theseparticular days the station was in clouds until approx.
5:00 of Feb. 21. The ambient temperature rangedbetween -16 and -20 °C. The number concentrationof the interstitial aerosol measured indoors tracks wellwith the total aerosol measured by the same systemas well as with the total particle number concentrationmeasured by a Condensation Particle Counter (CPC).In contrast, the variation of the interstitial aerosolmeasured outdoors shows two additional peaks thatare significantly higher than the level of the interstitialaerosol measured indoors. These two phenomenarange over 3-4 hours before the particle concentrationdrops back to the level of the other signals. Duringthese periods the outdoor SMPS recorded particlenumber size distributions with nearly identical modes,but with a particle concentration higher by a factor 3 inthe range 20-100 nm and by a factor 2 in the range100 - 400 nm, respectively. Obviously a significantfraction of the particles is composed of material with ahigh volatility.
Further evaluation of the data with incorporation of thechemical analysis will show to what extent organiccompounds are responsible for these phenomena.
- • -N total (SMPS, 25 °C)
— N total (CNC,25°Q
-o- N interstitial (SMPS, -18 "C )
-x- N interstitial (SMPS, 25 °C)
¿ N total (TTiermodesorber, 60 °C)
14:00 17:00 20:00 23:00 2:00
Time, February 20-21 2000
Fig. 1: 24-h variation of the particle number concen-tration measured by different instruments and inletsystems.
4 REFERENCES
[1] Weingartner, E., S. Nyeki and U. Baltensperger.J. Geophys. Res. 104, 26809-26820 (1999).
[2] H. Burtscher, et al. J. Aerosol Sei., in press(2001).

114
HYGROSCOPIC PROPERTIES OF LABORATORY GENERATED AND AMBIENTAEROSOL PARTICLES AT T < 0 °C
M. Gysel, E. Weingartner; U. Baltensperger
A new Hygroscopicity Tandem Differential Mobility Analyser (H-TDMA) was built for the first time workingat temperatures below 0 °C. The H-TDMA was tested by measuring hygroscopic growth factors of labora-tory generated salt particles. During CLACE (Cloud and Aerosol Characterization Experiment), a fieldcampaign at the high alpine research station Jungfraujoch (3580 m asl), hygroscopic growth factors of freetropospheric aerosol particles were measured at ambient conditions (-10 °C). The internally mixed parti-cles remain in the liquid phase under atmospheric conditions.
1 INTRODUCTION
The influence of atmospheric aerosol particles on airquality, visibility degradation, heterogeneous chemis-try, radiation forcing and climate change dependsstrongly on their hygroscopic properties.
A new hygroscopicity tandem differential mobilityanalyser (H-TDMA) allows for the first time to meas-ure growth factors of aerosol particles as a function ofrelative humidity (RH) at temperatures below 0 °C.
After testing the H-TDMA with different laboratorygenerated salt particles, the H-TDMA was used in thefield campaign CLACE (Cloud and Aerosol Charac-terization Experiment). At the high alpine researchstation Jungfraujoch (3580 m asl) growth factors offree tropospheric aerosol particles were measured atambient conditions (-10 °C).
2 EXPERIMENTAL
One particle size class of the dried polydisperse aero-sol is selected with the first DMA of the H-TDMA. Themonomodal aerosol is then humidified. The resultingwet particle size distribution is measured with the sec-ond DMA and a condensation particle counter operat-ing as a scanning mobility particle sizer (SMPS). Adetailed description of the measurement principle isgiven in Weingartner et al. [1].
3 RESULTS
Figure 1 shows the growth factors of 100-nm(NH4)2SO4 particles as a function of RH at -10°C. The(NH4)2SO4 particles show a hysteresis effect. A solidparticle exposed to increasing RH does not change itssize until the deliquescence relative humidity (DRH) isreached, and a saturated droplet is formed. A particlein the liquid phase can exist below the DRH as a me-tastable supersaturated droplet. The experimentalresults agree very well with the liquid phase Kohlertheory (solid line). The behaviour of the salt particlesat -10°C is similar to the behaviour at temperaturesabove 0°C because the freezing point depressioncaused by the dissolved ions prevents a freezing ofthe particles.
Figure 2 shows the growth factors of free tropospheric100-nm aerosol particles at the high alpine researchstation Jungfraujoch (3575 m asl) measured at ambi-
ent conditions (-10°C). Ambient aerosol particles insource regions typically consist of a more and a lesshygroscopic mode. The growth factors of the ambientparticles at the Jungfraujoch are very homogeneous,because the aerosol is internally mixed. The growthfactors at the Jungfraujoch (Figure 2) are smaller thanthe growth factors of pure (NH4)2SO4 particles (Figure1) because the ambient particles are a mixture of sev-eral salts, soot and organic material. Therefore theparticles in the free troposphere remain in the liquidphase down to 10% RH (Figure 2).
1.71.61.51.41.31.21.1
10.9
decreasing RHincreasing RHTheory
20 30 40 50 60 70
Relative Humidity RH [%]
Fig. 1: Growth factor of laboratory generated 100 nm(NH4)2SO4 particles as a function of relative humidityat-10°C.
11CO
I
1.71.61.51.41.31.21.11.00.9
I '
1 ' 1 '
1 ' I
' I
do= 100 nmempirical fit
^^"•^*; " \ -_
10 20 30 40 50 60 70 80 90
Relative Humidity RH[%]
Fig. 2: Growth factor of ambient aerosol particles atthe high-alpine station Jungfraujoch (3580 m asl) as afunction of relative humidity measured at ambientconditions (-10°C).
4 REFERENCES
[1] E. Weingartner et al., Hygroscopic properties ofcarbon and diesel soot particles, Atmos. Environ.31,2311-2327(1997).

115
SIZE DEPENDENT AEROSOL ACTIVATION AT THE HIGH-ALPINE SITEJUNGFRAUJOCH (3580 m ASL)
S. Henning, E. Weingartner, U. Baltensperger, S. Schmidt (IFT Leipzig),H. W. Gaggeler (PSI, Uni Bern)
Measurements of the interstitial and total aerosol were conducted at the high-alpine research station Jung-fraujoch during a summer campaign in August 2000. Additionally, cloud droplet size distributions wererecorded. Activation diameters of the aerosol were calculated and correlations with meteorological condi-tions were investigated.
Clouds have an effect on the earth's energy budget byreflecting the solar radiation back to space. This prop-erty is known as the indirect effect of the atmosphericaerosol and has rarely been quantified yet [1]. It istherefore of special interest which particles becomeactivated under which conditions. With the increase ofthe aerosol concentration caused by human activity,more particles are possible available for activation.Under the assumption that the amount of water va-pour stays constant, more and smaller water dropletsare formed than without anthropogenic influence. Thiswill cause an increase of the cloud albedo and thusthe backscattering of solar radiation [2].
The high-alpine station Jungfraujoch (3580 m asl) isan ideal site to study such processes, since it is withinclouds about 40 % of the time [3]. Aerosol numbersize distributions of the total and the interstitial aerosolwere measured with a Scanning Mobility Particle Sizer(SMPS, D = 0.01 to 0.8 urn). A Forward ScatteringSpectrometer Probe (FSSP-100) was operated todetect the cloud droplet size distribution. In addition,measurements of the chemical aerosol compositionwere performed in two size ranges (total aerosol,PM1). Moreover, data from instruments continuouslyoperated in the framework of the GAW Program wereavailable (liquid water content (LWC), temperatureand dew point). The data were obtained during a fieldcampaign lasting from July to August 2000.
Typical examples for a cloud event and a cloudlessperiod are shown in Figure 1, where the 1-hour aver-ages of the total and interstitial aerosol size distribu-tions are plotted. In Figure 1 (a) the cloud droplet sizedistribution is also given.
The Aitken (20 nm < Dp < 100 nm) and accumulationmode (100 nm < Dp < 800 nm) were observed in bothcases, with mean diameters for the cloud event of65 nm and 150 nm, respectively, and 90 nm and200 nm, respectively for the cloudless period. Duringthe cloud, the complete accumulation mode aerosolwas scavenged, while almost the whole Aitken moderemained. This can also be seen in the number con-centrations, with 500 cm"3 for the total and 238 cm"3
for the interstitial aerosol. The total droplet concentra-tion of 384 cm"3 calculated from the FSSP data showsa reasonable agreement with the one calculated fromthe difference of the particle concentrations betweentotal and interstitial aerosol (-260 cm"3).
1000
800-
£. 600-Q
I5 400-•o
200-
800-
£ 6 0 0 -Q
oP 400-
200-
0
SMPS, tot (Ntot=500 cm3)
SMPS, int (NM=238 cm"3)
FSSP(Ntot=384cm3)
(a) 06.08.00 12:00 LST
LWC=0.43gm3
SMPS, tot (1^=317 0 1 0
SMPS, int ( ^ = 2 9 4 cm1)
(b) 07.08.00 11:00 LST
LWC=0gm3
102 104
Diameter [nm]105
Fig. 1: Averaged size distribution of the total (up tri-angles) and interstitial (circles) aerosol during a cloudevent, including the cloud droplet size distribution (a)and without cloud (b).
ACKNOWLEDGEMENTS
We thank the International Foundation Jungfraujochand Gornergrat and the staff of the high-alpine re-search station Jungfraujoch for their support. Thiswork was founded by MeteoSchweiz under the aus-pices of the Global Atmosphere Watch (GAW) Pro-gramme of the World Meteorological Organization.
REFERENCES
[1] J.T. Houghton et al., Climate Change 1994, IPCCCambridge University (1995).
[2] S. Twomey, Atmos. Environ. 8, 1251 (1974).
[3] U. Baltensperger, M. Schwikowski, D.T. Jost, S.Nyeki, H.W. Gaggeler, O. Poulida, Atmos. Envi-ron. 32, 3975 (1998).

116
AIRBORNE LIDAR AND AEROSOL STUDIES OVER THEADRIATIC SEA DURING STAAARTE II
S. Nyeki, K. Eleftheriadis (NCSR), U. Baltensperger, I. Colbeck (Essex Uni.),M. Fiebig (DLR), C. Kiemle (DLR), A. Petzold (DLR), M. Lazaridis (NILU)
The effect of mountainous regions on planetary boundary layer (PBL) structure and the exchange of PBLairmasses with the free troposphere are still largely uncharacterized aspects of atmospheric research. Inorder to further investigate these processes, an airborne campaign was conducted over the EuropeanAlps and northern Adriatic Sea in Autumn 1999 during the Mesoscale Alpine Programme (MAP) fieldcampaign.
Clear sky conditions occurred on 24 September whena small anticyclone was situated over northern Italy.Instrumentation aboard the DLR Falcon research air-craft included a downward-looking aerosol lidar (X =354, 532 and 1064 nm) and two condensation nucleus(CN) counters (TSI 3760A; cut-offs at d = 14 nm) [1].The CN concentration of atmospheric aerosols was alsomeasured using volatility tubes, operating at T = 25°C,120°C and 250°C. In this manner, the qualitative aerosolcomposition of the following species was measured inreal time, respectively: H2SO4 droplets, NH4HSO4/(NH4)2SO4 and refractory aerosol (sea-salt, black car-bon, and mineral dust) [2].
CN volatility results for a composite of all vertical pro-files up to 9500 m altitude are shown in Figure 1.Measurements in the PBL (i.e. below 2100 m asl) areclearly indicated by higher concentrations in allcurves, where the refractory aerosol is the main con-stituent. The state of aerosol acidity/neutralisation isprobably represented well by curves in the upper FT,however, this may not be the case for the PBL, due tothe confounding effects of atmospheric aerosol or-ganic components. The vertical extent of the PBL isconfirmed in Figure 2, which illustrates a lidar transectacross the Austrian Alps, Po basin and northern Adri-atic sea. The main features of interest are the inho-mogeneous airmasses in mountain valleys and thefairly uniform PBL top over the Alps as a whole. Aninteresting feature is the PBL structure over the Adri-atic (~ 2000 m asl), which overlies a thin marineboundary layer (250 - 300 m asl). This results from theadvection of PBL airmasses from over the Appenni-nes and the Po Basin in the synoptic westerly winds.
CN Concentration (scnf )
Fig. 1: CN concentration of aerosol species on 24September 1999 over the Po basin and Adriatic sea.
ACKNOWLEDGEMENT
Funding from NERC and the EU STAAARTE pro-gramme are kindly acknowledged.
REFERENCES
[1] S. Nyeki et al., Geophys. Res. Lett. 26, 2195-2198(1999).
[2] A.D. Clarke, J. Geophys. Res. 98, 20633-20647(1993).
!
uT3 '•a
0
)km 100 200
s
300 400 500
T : 47ttr. Innsbruck
46 45nr. Venice/Coastline Northern Adriatic Sea
Fig. 2: Aerosol lidar transect on 24 September 1999 at X = 1024 nm.
44

117
DISTINCTION BETWEEN BIOCHEMICAL AND WATER LIMITATION OFPHOTOSYNTHESIS USING STABLE ISOTOPES
M. Saurer, Y. Scheidegger, R. Siegwolf
Based on S18O and S13C data in organic matter of plants, we have developed a conceptual model whichgives insight into the relationship between stomatal conductance (gi) and photosynthetic capacity (Amax),resulting from differing environmental constraints and plant-internal factors. This is a semi-quantitativeapproach for describing the long-term effects of environmental factors on CO2 and H2O gas exchange.
1 INTRODUCTION
Plants are exposed to a great variety of environmentalconstraints. In order to survive they must respond tothese factors with appropriate adaptation mecha-nisms. Water, the essential substrate for life, is often alimiting factor and its loss must therefore be kept to aminimum. Stomatal movement is an efficient means ofadjusting to changes in plant water demand (Figure1). A fine-tuned mechanism allows a rapid reaction toaltered water supply or ambient humidity, while at-tempting to ensure the maximisation of carbon acqui-sition, thus optimising the relationship between waterloss and carbon acquisition. Besides stomatal conduc-tance (gi), photosynthesis is determined by biochemi-cal factors (amount and activity of the enzymeRubisco) which are driven by irradiance and modu-lated by temperature and nutrient availability. Undernatural conditions the photosynthetic capacity (Amax) isdefined as the average maximal net photosynthesis atambient CO2 concentration and under optimal envi-ronmental conditions. The interaction between gi andAmax is of great ecological interest [1].
biochemicalisotopefractionation
photosynthesisA_
diffusive isotopefractionation
Fig. 1: CO2 and H2O-exchange of leaves with corre-sponding isotope fractionations.
2 ISOTOPE MODEL
Isotope fractionation steps take place during the up-take of carbon and during the loss of water. While theoxygen isotope enrichment of leaf water is determinedby physical processes (phase transition, diffusion), thecarbon isotope ratio is determined by physical (diffu-
sion) and biochemical processes as well (Amax). Dueto these differences in fractionation, the combinedanalysis of carbon and oxygen isotopes gives insightinto the regulation of photosynthesis, namely the rela-tive limitation of photosynthesis by diffusive and bio-chemical processes. This is achieved by a conceptualmodel which translates a given change in the isotoperatios into a corresponding physiological response(Figure 2, [2]). The model is semi-quantitative in as faras it is based on mechanistic isotope fractionationmodels, but also incorporates experimental plant-climate relationships.
518OFig. 2: An isotope response (left) is translated into aphysiological response (right) by the model. The ar-rows indicate two examples of an environmental im-pact reflected in an isotope shift of the plant.
The proposed conceptual model is easily applicable inthe field by analysing the isotopic composition ofplants grown in contrasting environments, but it mayalso be used for controlled experiments, e.g. for plantsexposed to air pollutants or increased levels of CO2.
3 ACKNOWLEDGEMENT
This work was supported by the EC-project ECO-MONT, Swiss Federal Office for Education and Sci-ence under Contract 95.0386-2.
4 REFERENCES
[1] W. Larcher, Physiological plant ecology: eco-physiology and stress physiology of functionalgroups, Springer, Berlin (1995).
[2] Y. Scheidegger, M. Saurer, M. Bahn, R. Siegwolf,Linking stable oxygen and carbon isotopes withstomatal conductance and photosynthetic capac-ity: A conceptual model, Oecologia, in press.

118
13, 18/C / 1SO ISOTOPE CORRELATION REVEALS OPPOSITE EFFECTS OF NO2 ONTHE PLANT CARBON / WATER BALANCE COMPARED TO SOIL NITROGEN
R. Siegwolf, M. Saurer, R. Matyssek (University of Munich, Germany), J. Bucher (WSL Birmensdorf)
Nitrogen emissions like NO2, NO and NH3 have increased, along with growing industry and agriculturalactivities. Besides impairment of the air quality, the gaseous species have direct impact on plant metabo-lism. With the stable carbon and oxygen isotopes it could be shown that airborne NO2 absorbed by theleaves via stomata (pores) improves the plant carbon uptake / water loss ratio, opposite to soil nitrogen.
1 INTRODUCTION
Plant demand of nitrogen is met by the uptake of NH4+and NO3" from the pedosphere via roots. However,atmospheric NO2 represents another considerablesource of nitrogen, contributing significantly to thenitrogen budget. Besides the phytotoxicity of high NO2
concentrations, several studies report a fertilizingeffect on plants. Since an increasing soil nitrogensupply stimulates CO2 assimilation, while water loss isincreased too, the same response was expected forplants exposed to NO2. To find out whether this re-sponse to NO2 was maintained during a whole plantlife span the analysis of stable carbon and oxygenisotopes was employed.
During photosynthesis, plant organic material is de-pleted in 13C. However, when photosynthesis in-creases or stomatal conductance decreases this de-pletion is reduced [1]. Under a rather constant airhumidity, an increasing transpiration results in a de-crease of the 18O/16O isotope ratio. Thus, the impactof soil nitrogen, and NO2 on the long-term response ofplant CO2 and H2O gas exchange was studied.
2 EXPERIMENTAL SET-UP
Cloned hybrid poplar cuttings {Populus x eurameri-cana) were potted in 10 L containers and grown in twoidentical walk-in climate-controlled phytotrons (BBC-York, Germany). Two different soil nitrogen regimeswere applied. In one of the chambers, NO2was addedto the filtered air. A mean diurnal course for NO2 inrural air, air temperature (TAir), relative humidity (RH),and CO2 concentration was followed. Five-week-oldleaves were analyzed for their isotopic carbon andoxygen composition with a continuous flow massspectrometer (Delta S, Finnigan, Germany).
3 RESULTS AND DISCUSSION
The 813C plotted against 818O-values of leaf organicmatter (Figure 1) is the result of a life time integrationof plant responses to different nitrogen regimes. Thedirections of the arrows symbolize the shifts of theisotope values, caused by the nitrogen treatments.Irrespective of the soil nitrogen supply (high or low),NO2 exposure raised the 513C values ('b' and 'B', Fig-ure 1), indicating an increased CO2 assimilation. Inboth cases the 518O was simultaneously lowered ('d'and 'D', Figure 1), suggesting an increase in water
loss. An increase in soil-N supply, however, reduces813C (sections 'a' and 'A'; downward pointing arrows)while lowering 818O even more (sections 'c' and 'C'),regardless whether the plants were NO2 exposed ornot.
-29.0
Er -29.5
CD
-30.0
® -30.5
I -31.0o
O -31.5
-32.0
A Low-N^ NO2-Low-NO High-N£ NO2-High-N
21.0 22.0 23.0 24.0 25.0 26.0
518O of organic leaf material [%»]
513C / 5 1 8
27.0
Fig. 1: The 8 C / 8 0 plot results from different ni-trogen regimes. Solid arrows indicate the shift in 513Cand 518O caused by N02 exposure, and the dashedlines the changes of increased soil nitrogen.
The data show that N02 increases C02 assimilation,while keeping the water loss low, opposite to in-creased soil N-supply, which increases both, C02
assimilation and water loss. This is consistent with abiomass increase for both treatments (soil-N supplyand N02 exposure) whereas the water loss for thesoil-N supplied plants is much higher. A detailed de-scription of this study is given in [2].
4 ACKNOWLEDGEMENT
The growth chamber study was carried out at theFederal Institute for Forest Research (WSL Birmens-dorf).
5 REFERENCES
[1] Y. Scheidegger, M. Saurer, M. Bahn, R. Sieg-wolf, Linking stable oxygen and carbon isotopeswith stomatal conductance and photosyntheticcapacity: A conceptual model, Oecologia, inpress (2001).
[2] R. Siegwolf, R. Matyssek, M. Saurer, S. Maurer,M.S. Gunthardt-Goerg, P. Schmutz, J.B. Bucher,Stable isotope analysis reveals differential effectsof soil nitrogen and nitrogen dioxide on the wateruse efficiency in hybrid poplar leaves, New Phy-tologist in press, February (2001).

119
SEASONAL 518O VARIATIONS IN NEEDLES OF PICEA ABIES AS A FUNCTION OFENVIRONMENTAL CONDITIONS
M. Jaggi, M. Saurer, R. Siegwolf
818Ooi in leaf organic matter of current-year spruce needles in 69-year-old trees showed distinct short-termvariations during the growing season which could be related mainly to variations in S18O of water in the topsoil layer. The difference in S18Ooi between the years could be explained by differences in air humidity. Thecorrelation between measured and modelled data could be improved by introducing a factor to account forphenological changes in the biochemical fractionation.
1 INTRODUCTION
The stable oxygen isotope ratio of leaf water is knownto be a short term integrator of microclimatic parame-ters, whereas the 518O of cellulose serves as a long-term integrator, especially reflecting local mean an-nual temperature.
The extent of enrichment in the oxygen isotope ratioof leaf water is influenced by relative humidity, tem-perature, the stable oxygen isotope ratio of sourcewater and by the characteristics of the evaporatingsurface. This was considered in the model developedby Dongmann [1]. This model was further adapted forwood cellulose by introducing a biochemical fractiona-tion factor (ec) and a dampening factor (/) that summa-rises the effect of leaf water inhomogeneity and theexchange of oxygen atoms of sucrose with stem water[cf. 2].
In our experiment we wanted to test to what extent the818O values of whole needle organic matter reflectseasonal fluctuations in microclimatic conditions.
2 EXPERIMENTAL SET-UP
We sampled current year needles of 16 maturespruce trees (Picea abies) in a field experiment duringtwo consecutive years (1998 and 1999). The twoyears differed in precipitation amount and in relativehumidity, but not in temperature, whereby 1998 wasthe dry year and 1999 was the wet year. Sampleswere taken three times in 1998 (May, August andOctober) and four times in 1999 (May, June, July andOctober). We sampled throughout both years soilwater (10-25 cm depth). The oxygen isotopiccomposition of the whole leaf organic matter and ofthe soil water was determined with a continuous flowmass spectrometer (Delta -S Finnigan).
3 RESULTS AND DISCUSSION
Eventhough we found a coherence of stable oxygenisotope ratios of soil water and needle organic mate-rial within each year (Figure 1), a difference betweenthe years remained to be explained. Therefore wecalibrated the factors ec and / of the adapted Dong-mann model [2] for whole needle organic matter with adata set obtained in a controlled experiment withspruce saplings. These two calibrated factors allowed
us to model the 518Oo! of 69-year-old spruce treeswhere 63% of the variation in 518Oo! measured couldthus be explained. We found that the between-yeardifference is due to the difference in relative humidity,an important parameter in the Dongmann model.
oO00To
- 1 2 - 1 1 - 1 0 - 9518O
- 7
Fig. 2: Correlation between the 818O of soil water inthe top soil layer (10-25 cm below ground) and the518O of whole leaf organic matter for a dry (1998) anda wet (1999) year.
We introduced a biochemical fractionation factor thataccounts for phenological changes of the developingneedles and thus allowed us to explain 70% of thevariation in the measured 518Oo! values.
These results may help to more reliably resolve sea-sonal climate signals from high-resolution studies oftree rings.
4 ACKNOWLEDGEMENT
This experiment was part of the COST E6 andHARVE (BUWAL) project.
5 REFERENCES
[1] G. Dongmann, H.W. Nurnberg, H. Forstel, K.Wagener, On the enrichment of H2
18O in theleaves of transpiring plants, Radiat. Environ. Bio-phys. 11,41-52(1974).
[2] M. Saurer, K. Aellen, R. Siegwolf, CorrelatingS13C and 818O in cellulose of trees, Plant Cell En-viron. 20, 1543-1550(1997).

121
Energy Systems Analysis

122
THE REGIONALIZED CHINA ELECTRICITY TRADE MODEL:FIRST RESULTS AND POLICY RECOMMENDATIONS
S. Kypreos, R. Krakowski
The China Energy Technology Program (CETP) is focusing on the specification of options to generateelectricity in China and their cost that take into account local, regional and global externalities. The role thatadvanced technology could play in China is analysed under different policy assumptions and internationalco-operation strategies for the improvement of local and regional environments in combination with themitigation of global warming. The primary objectives of the Energy-Economics Modelling (EEM) team areto share experience with other model developers in the CETP environment together with the Chinese re-searchers, to expand the modelling capabilities, to contribute to quantitative analyses of the problem and togain insights on the potential developments in China. The paper describes assumptions and the main find-ings of scenarios that mitigate SO2 and CO2 emissions from electricity generation in China based on theChina Regional Electricity Trade Model (CRETM), developed in our group during CETP; first policy rec-ommendations are given.
1 INTRODUCTION
China is expected to generate 1,300 TWeh of electric-ity in the year 2000 with an installed capacity of 315GW, more than 50% of the US installed capacity. Thiscorresponds to a 45% increase in capacity and a 30%increase in production since 1995, [1]. China's GDProse by an annual average of 9.8%/a during the lastdecade. Even with any eventual tapering of thesepresently high GDP growth rates to growth rates of 4-5%/a, the demand for electric power is expected tomore than triple to about 4,500 TWeh/yr by the year2030. Significant degradation of already seriously de-teriorated environmental (air and water) quality is ex-pected if this growing demand for electrical energy isprovided by coal at the present -75% use rate. In ex-amining options to such a future based on conven-tional use of coal, the CETP is using both optimizingand simulation energy-economic-environmental mod-els to assess tradeoffs in the electricity-generationsector for a range of fuel, transport, generation, anddistribution options. The CETP is composed of arange of technical tasks, including Energy EconomicsModeling (EEM) represented by our group. Althoughthe scope of CETP is limited to one province (Shan-dong), the EEM study applies a countrywide analysisof power generation, including trade of fuels and elec-tricity.
The CRETM model describes 17 electricity-generationtechnologies utilizing 14 fuel forms (type, composition,source) in a 7-region transportation model of China's(electricity) demand and supply system over the period2000-2030; Shandong is one of those seven regions.The CRETM is a state-of-the-art optimisation modelfor electricity expansion that includes partial equilib-rium between energy demand and supply, endoge-nous learning leading to increasing economic returnsto scale, and a multi-regional trade of energy fuels andelectricity. Therefore, a variety of policy questionsrelated with the improvement of energy efficiency, thelocal and regional environments and the mitigationoptions of global warming can be examined.
2 MAIN RESULTS
The development of electricity demands responds toexogenous assumptions on income (GDP) and en-dogenous electricity prices through respective time-dependent elasticities. Exogenous fuel prices andconstraints are applied to transportation limits, re-source availability, rates of introduction (penetration)of specific technology, and (where applicable) to local,regional, and countrywide emission rates of CO2, SO2and NOX. Results from CRETM are expressed interms of scenario-base "visions of the future". Thescenarios considered are reference to a baseline thatdoes not include environmental policy constraints(Figurei) and divides according to whether the drivingattributes derive from economic policy {e.g., demand
4000
3500
3000
2500
2000
1500
1000
500
<DCHIzHIC5
BHC SCENARIO HYDRO ^ ^M
NUCL -. ^ ^ ^ ^
DOMESTIC COAL
1995 2000 2005 2010 2015 2020 2025 2030
TIME
Fig. 1: The electricity generation mix for the BusinessAs Usual (BAU) case with 10%/a discount rate).
growth, discount rate), environmental policy (e.g.,emission taxes versus emission caps) or technologicalpolicy (e.g., pricing and learning rates that may favorspecific technologies like Clean Coal Technologiesversus nuclear energy, versus renewable energy).Scenario-based sample results are presented, withdetailed description of the CRETM and the supportingdata is given in Reference [2].

123
1 Nuclear
• Wind
H Solar PV
— • Hydro
• Gas
OOil
D Advanced Coal
1 Coal scrubbers
• Domestic Coal
BaU Sulfur Carbon S&CControl Control Control
Fig. 2: Electricity generation mix in China by techno-logy and scenario in the year 2030.
Advanced technology is introduced when policies fa-vour regional and global environments, as shown inFigure 2. Demand is adjusted to higher productioncosts (market liberalisation based on marginal costpricing gradually introduced, discount rate now 5%/a).Table 1 describes the techno-economic characteristicsof China generation systems used. Capital costs areassumed 25%-30% less than in the industrialisedcountries, but operate at 2-3% lower efficiency.
Generation Technology
Domestic small coal plant
Domestic 100-200 MW coal plant
Domestic 300 MW coal plant, ESP
Dom. 300 MW coal, ESP & scrubbers
Supercritical coal, ESP & scrubbers
Foreign AFBC coal plant
Foreign IGCC coal plant
Foreign PEBC coal plant
Traditional oil-fired plant
Combined-cycle oil-fired plant
Combined-cycle gas-fired plant
Advanced gas-turbine CC plant
Nuclear plant
Hydroelectric plant
Wind plant
Solar photovoltaic plant
Capital
Cost, CC
$/kW
676
650
650
750
1100
950
1200
1100
530
500
530
500
1500
1200
1200
7000
Variable
cost
M$/TWh
5
4
3.5
4.5
4.5
8.5
4.5
4
2.8
2.8
8
8
5
1
Z
0.07
Fixed
O&M
%CC/a
3
3
3
3
3
3
3
3
3
3
3
3
1.6
1.5
1.5
1.5
Eff.
%
27
29
36
35
42
38
43
45
35
42
45
55
33
33
33
33
Table 1 : Techno-economic characteristics; IGCC,Supercritical Coal, Nuclear, Wind and Solar-PV as-sume "learning-by-doing" economic scaling.
3 CONCLUSION
Results from studies using CRETM are based on afirst, evolving set of techno-economic data (Table 1),
price assumptions, fossil fuels resource availabilityand imports, as well as projections of the technicalpotential for renewable energy use. Based on thesefirst results the following interim conclusions can beformulated.
China will rely on coal for power production, independ-ent of environmental policies.
Chinese R&D on advanced technology and foreigninvestments can improve energy efficiency and,through reduced emissions, the environment.
SO2 pollution can be reduced at moderate invest-ments by introducing scrubbers and/or advanced coaltechnology.
Carbon emission reduction needs significant invest-ments, but this policy improves local environments(secondary benefits).
The cumulative discounted power-production cost fora more sustainable path for China increases by 2-4 %over the 2000-2030 time frame investigated.
Transmitting electricity between regions could be aneconomic option in general terms but also for reducinglocal pollution, and this finding results from the re-gional attribute of CRETM.
Based on these interim findings, it is concluded that acombination of national R&D policies to improve sup-ply-side conversion efficiencies and to enforce sulfuremission control of coal power will lead to importantlong-term benefits to a growing China. These im-provements together with the selection of promisingCDM projects for advanced-technology systems, to bepartially financed by the international community, couldrepresent a "win-win" strategy for China and the indus-trialized world.
In fulfilling these goals, this study projects an optimis-tic view towards nuclear energy for scenarios basedon low (but achievable) capital costs and low discountrates, given the attainment of necessary levels of pub-lic acceptance. Similar conclusions derive for hydroe-lectric power, albeit resource constraints are moresevere in this case. Finally, the use of renewable en-ergy sources other than wind and hydropower systemsneed a more detailed examination of the local condi-tions before making any commitments to invest in newinstallations.
4 ACKNOWLEDGEMENT
Financial support by the Alliance for Global Sustain-ability and by ABB Corporation is gratefully acknowl-edged.
5 REFERENCES
[1] China Daily, Power towards the future, October23, (2000).
[2] S. Kypreos, R. Krakowski, Full-cost-pricing elec-trical-generation scenarios in China using a multi-regional linear-programming model, PSI report (inpreparation), November (2000).

124
GEM-E3 SWITZERLAND: DATABASES UPDATE AND FURTHER INSIGHTS
O. Bahn
The economic and environmental databases of GEM-E3 Switzerland have been updated. The new modelhas then been used to assess policy options for reducing the Swiss carbon emissions. The procedure toconstruct the new databases as well as results of the simulations are reported here.
1 INTRODUCTION
GEM-E3 is an applied general equilibrium model thatanalyses the macro-economy and its interaction withthe energy system and the environment. It has beendeveloped under the auspices of the European Com-mission (DGXII) by Capros et al. [2]. Within the EUResearch Project 'GEM-E3-ELITE', GEM-E3 has beenimplemented for Switzerland by Bahn and Frei [1].Within the new EU Research Project TCH-GEM-E3',the economic and environmental databases of GEM-E3 Switzerland have been updated from a 90 to a 95base year. The purpose of this update is to enable thelinking of GEM-E3 Switzerland with the European ver-sion of GEM-E3 whose databases shall use also 95 asa base year.
2 DATABASES UPDATE
This section describes briefly the data sources and theprocedure used to update the databases.
2.1 Economic database
The economic database consists mainly of a SocialAccounting Matrix (SAM). Due to time and data avail-ability restrictions, a 95 Swiss SAM, compatible withthe GEM-E3 format, has been constructed using:
i) Structures from the 90 GEM-E3 Swiss SAM; andii) 95 data from the Swiss National Accounts (Swiss
Federal Statistical Office—SFSO [8]), various 95economic statistics compiled by SFSO [7], and 95external trade data from the Swiss Customs [5].
The 95 Consumption Matrix is obtained by applyingthe structure of the 90 GEM-E3 Consumption Matrix tothe 95 consumption totals by categories. Governmentas well as households' consumption are given bySFSO [7]. The latter is beforehand disaggregated intothe 13 GEM-E3 consumption categories using an ap-propriate key.
The 95 Investment Matrix is constructed by applyingthe structure of the 90 GEM-E3 Investment Matrix tothe 95 investment by branches. The latter is obtainedby disaggregating the 95 investment of six institutionalsectors given by SFSO [8] into the 18 GEM-E3branches following the structure of the 90 investment'sdisaggregation.
The Swiss Customs [5] provides imports and exportsfor 19 branches producing goods. Disaggregationsand aggregations are performed to obtained im-ports/exports for the corresponding 13 GEM-E3branches. The total import and export of services are
obtained from subtracting the total import/export ofgoods from the total import/export given by SFSO [7].Disaggregation by branches is done following the 90structure of the imports/exports. Total expendituresabroad and tourists expenditures are given by SFSO[8]. They are disaggregated into the 18 GEM-E3branches using their 90 structure.
Let A denotes the matrix of input-output coefficients ofintermediate demand; Id the identity matrix; 10 theInput-Output Matrix; X the vector of total domesticoutputs; and Vthe vector of net final demand. Follow-ing a so-called Leontief analysis, supposing in particu-lar that there is no technical change between 90 and95, one can approximate the 95 A matrix by its 90value. The 95 X vector is computed as follows:
X95 = [ld-A90]\ Y95
The 95 Input-Output Matrix is then given by:
/O95 = ^90 • -X95
The 95 labour and capital incomes, indirect taxes,subsidies, VAT and duties are given by SFSO [8].Disaggregation by branches is done using in particulartheir 90 structure and such that revenues andexpenditures of each branch are balanced.
The distribution of capital and labour incomes to theeconomic agents, the savings of each agent, and thetransfers of households and government to the otheragents are given by SFSO [8]. The transfers of theforeign sector are approximated from their 90 valuesand the 95 exports, and are such that revenues andexpenditures of the foreign sector are balanced. Thetransfers of firms are finally deduced from the hy-pothesis that the 95 SAM is in equilibrium.
2.2 Environmental database
The environmental database consists mainly of anEnergy Balance Table and of an Emission CoefficientsTable. The first has been designed following SFOE[6]. The disaggregation of solid and liquid fuels, as wellas of the final consumption, has been done applying tothe SFOE statistics structures from the InternationalEnergy Agency [3, 4]. The second table has not beenupdated since it uses already 95 values; see [1].
3 POLICY SIMULATIONS
The purpose of these simulations is to evaluate twostrategies Switzerland could follow to curb its CO2
emissions: the imposition of a domestic carbon tax,and the combining of such a tax with the buying ofCO2 permits on an international market.

125
3.1 Scenarios
Two scenarios are considered for CO2 emissions: i)baseline, where emissions are not limited; and ii) 10%reduction, from the 90 level, to be reached by 2010. A5% reduction is also imposed by 2005.
The framework of the baseline scenario, between2000 and 2010, is as follows. Population grows by2.8%, fossil fuels prices by 1% a year cumulatively.The model is then calibrated such that real GDP in-creases by 2% a year. The resulting CO2 emissionsgrow from 44.2 million tons (Mt) in 95 to 45 in 2010.Compared to the findings of the model using a 90database, emissions in 2010 are found to be lower (45instead of 46 Mt), since the model does now take intoaccount the observed emission reduction in 95.
To reduce emissions, two options are considered. In'tax only', the reduction is achieved through a domes-tic carbon tax. In permits & tax', it is achieved througha (lower) tax together with the buying of permits on aninternational market. Furthermore, two cases are con-sidered: when the buying of permits cannot exceed50% of the reduction ('ceiling), and when no such limitis imposed ('no-ceiling).
3.2 CO2 emissions, permits and tax
In tax only, the model ensures that the CO2 reductiontargets are fulfilled: 42.8 Mt in 2005 and 40.5 in 2010.This is done through a tax of 29 CHF95 per ton (/1)CO2 in 2005 and 85 in 2010. Compared to the findingsusing a 90 database, the tax is lower in accordancewith the smaller reduction effort from the baseline.
In permits & tax, one supposes following Weyant [9]that international prices for CO2 permits are 50 USD90/ tC in 2010 (19 CHF95 / tCO2), and half that price in2005 (9.5 CHF95 / tCO2). In the ceiling case, 50% ofthe reduction is done domestically. The levels to bereached are: 43.7 Mt in 2005 and 42.8 in 2010. This isdone through a tax of 14 CHF95 / tCO2 in 2005 and 36in 2010. To fulfil its reduction target, Switzerland buysalso permits for a total of 3.2 Mt. In the no-ceilingcase, 70% of the reduction is done through buying ofpermits for a total of 4.4 Mt. Domestic reduction (at43.9 Mt in 2005 and 43.7 in 2010) is achieved througha tax whose levels correspond to the permit prices.
3.3 Employment and Gross Domestic Product
In tax only, Switzerland uses the tax revenue to re-duce social security charges. In permits & tax, it usespart of the tax revenue to acquire permits, and only theremaining to reduce social security charges. Whendoing so, employment increases: 7.6 thousand moreemployees in 2010 in the first strategy, 3.3 in the sec-ond with ceiling and 1.7 without. There is thus a 'dou-ble dividend': an environmental benefit (fewer emis-sions) and a societal one (more employment). Thisresults from an increase in energy prices (due to thecarbon tax) coupled with a decrease in labour costs(due to the tax revenue recycling). These changestrigger substitutions in the production structures awayfrom energy (hence fewer emissions) and in favour oflabour. These changes are smaller in permits & tax
(especially in the no-ceiling case) and so is the in-crease in employment.
Both strategies yield negligible GDP losses: 150.5million CHF95 (a reduction of 0.03%) in 2010 for taxonly, 70.1 (0.02%) for permits & tax with ceiling and47.4 (0.01%) without. GDP is driven downward by adecrease in investments and in exports. Indeed, therelative price of labour decreases also compared tocapital, and a fraction of capital is substituted by la-bour in the production structures. The lower capitaldemand implies then a decrease in investments. Con-cerning exports, the energy costs increase has astronger impact on the Swiss competitiveness than thelabour costs decrease. There are thus competitive-ness losses that lead to a reduction of exports. Noticethat the total abatement cost (reduction of emissionsand buying of permits) is lower in permits & tax (espe-cially in the no-ceiling case) and so are GDP losses.
4 CONCLUSION
Both reduction strategies yield a double dividend.However, permits & tax, especially for no-ceiling, ap-pears a better strategy since it requires a lower do-mestic carbon tax and yields lower GDP losses. Butfor choosing between these policies, one should alsoconsider 'secondary benefits' of reducing emissions inSwitzerland instead of buying permits abroad.
5 ACKNOWLEDGMENT
This research has been funded by BBW (Contract N.99.0186) as part of the EU Research Project ENG2-CT-1999-00002 TCH-GEM-E3'.
6 REFERENCES
[1] O. Bahn, C. Frei, GEM-E3 Switzerland: A Com-putable General Equilibrium Model Applied forSwitzerland, PSI Report 00-01 (2000).
[2] P. Capros, et ai, European Union: the GEM-E3general equilibrium model, Economic & FinancialModelling 4, 51-160(1997).
[3] IE A, Energy Statistics of OECD Countries 1995-1996, IEA Statistics, Paris (1998).
[4] IE A, Energy Balances of OECD Countries 1994-1995, IEA Statistics, Paris (1997).
[5] Swiss Customs, Commerce Exterieur de laSuisse 1988/97, Bern (1998).
[6] SFOE, Statistique Globale Suisse de I'Energie1995, Bern (1996).
[7] SFSO, Annuaire Statistique de la Suisse, Neu-chatel (2000).
[8] SFSO, Le systeme de Comptabilite Nationale:Resultats 1992-1997, Neuchatel (1999).
[9] J.P. Weyant, The Costs of the Kyoto Protocol: AMulti-Model Evaluation, a Special Issue of theEnergy Journal (1999).

126
THE POTENTIAL ROLE OF ENERGY CONSERVATION AND NEW RENEWABLESECOLOGICAL AND ECONOMIC IMPLICATIONS FOR SWITZERLAND
M. Jakob, U. Gantner, S. Hirschberg
After the recent rejection of the energy initiatives by the people, Switzerland still has a firm commitment toreduce its CO2 emissions and consequently to limit the use of fossil energy. Decisions will have to bemade on the future electricity configuration. Would one abstain from the nuclear energy without extensivecompensatory measures the CO2 emission would rise dramatically which would be contrary to the climatecommitment. To prevent this Switzerland would have to improve its energy efficiency and to expand theuse of new renewables both in the heat and in the electricity sector. In this paper four main future Swissenergy supply and demand options are presented regarding their ecological and economic performances.
1 INTRODUCTION
The Greenhouse Gas (GHG) emissions should bereduced, the costs should be low, the use of renew-able energies should be expanded, the air should becleaner, risks should be minimised etc. These aresome of the requirements that the future electricity andheat system should fulfil according to the variousstakeholders of the Swiss society. Also Swiss lawsand international agreements have to be respected.This applies in particular to the Greenhouse Gasemissions, which have to be reduced in the future.Simultaneously the role of nuclear energy is debated.
Identification of feasible options and their merits aswell as drawbacks serves as an input to the politicaldiscussion and is a prerequisite for designing suitablepolicy instruments that are efficient and effective.
2 METHODOLOGY AND ASSESSED OPTIONS
When considering the future development of the elec-tricity and heating system of a country it is important toassess the technical and economic limitations, butalso the potential techno-economical progress. Fur-thermore the dynamics of the structural change has tobe taken into account. In the heating sector this in-cludes the refurbishment cycles of the buildings, thereplacement rates of the heating systems and theacceptance of new technologies.
Implementing these methodological requirements fourmain options were designed to account for the poten-tial developments for the next 30 years (Fig. 1). Cen-tralised vs decentralised or nuclear vs fossil powergeneration, conventional vs new technologies, moder-ate vs extensive expansion of new renewables andenergy efficiency technologies and measures, theseare the key elements of the assessed options.
12 13 14 15 16Yearly Costs, in Billion CHF
1 Fossil: 46 % of the electricity and most of the heat isfossil, resulting in highest GHG loads and lowest costs.Differences between the options: D/H have an increasedshare of cogeneration, H/F an increase in heat pumps,which lead to lower GHG emissions but higher costs inboth cases.
2 Nuclear: 41 % of the electricity is produced by nuclear.GHG emissions are clearly lower than in group "Fossil",but the costs are slightly higher. Differences within thegroup: B uses mainly conventional boilers, E/G haveincreased shares of cogeneration, and G additional heatpumps. C/l assume that nuclear power remains at today'slevel and is supplemented by CC. I contains as much heatpumps as G, which explains reduction in GHG emissionsand increase in costs comparing with C.
3 Fossil + increased Savings & Renewables: Similar to"Fossil", but with increased share of new renewables andpromotion of energy conservation and energy efficiency.This leads to lower emissions but to higher costs.
4 Nuclear + increased Savings & Renewables: Similarto "Nuclear", but with increased share of new renewablesand promotion of energy conservation and energyefficiency (same amount as in 3). This group has thelowest greenhouse gas emissions and the highest costs.
Fig. 1: Total Greenhouse Gas emissions and yearly costs of electricity and heat supply options for Switzerland forthe year 2030.

127
The options reflect the potential situation of 2030 andtechnologies are compared on that level to include thetechno-economical development. The emissions arebased on the method of life cycle assessment (LCA)and the yearly cost include annualised investments,operation and maintenance and the expenditures forenergy carriers.
3 RESULTS AND WHAT IS BEHIND THEM
The analysis of the future Swiss heat and electricitysupply and demand is based on many parameters anddevelopments that have to be taken into account andassessed in a consistent way. These considerationsare documented mainly in [1,2,3]. Hereafter the mostimportant background information that leads to the setof analysed options and explains the results, is given.
The increased emissions of main group 1 compared togroup 2 are due to fossil plants which substitute fornuclear plants. The higher emissions are reduced inthe group 3 and 4 by a strong expansion of new re-newable energies and efficiency measures in bothheating and electricity sectors. This leads to higherannualised costs even under consideration of the un-used potential of the no-regret measures. The highercosts are due to higher investments in efficiencymeasures and renewable energies that cannot fully becompensated by saved expenditures for energy carri-ers. Most of the new renewable energies and part ofthe efficiency measures will face higher yearly coststhan fossil technologies if prices for fossil fuels remaincomparatively low. The cost difference for efficiencymeasures such as efficient appliances, solar or insula-tion measures in buildings is however smaller andsome of them are even economic under the today'sprice relations. Regarding the potential which might berealised in the timeframe of the next 20 or 30 yearsthe one associated with efficiency measures is esti-mated to be higher and mostly more cost effectivethan that of new renewables.
Parallel to the decrease of the emissions there is an-other positive effect of such investments: The specificcosts of the renewable technologies and of the effi-ciency measures would decrease, bringing themcloser to market competitiveness [4].
4 CONCLUSION AND RECOMMENDATIONS
Given the Swiss commitments on the national andinternational level to reduce greenhouse gas emis-sions, the use of fossil fuels should be reduced. Keep-ing the current hydro- and nuclear-based configurationof electricity supply, or replacing the nuclear powerplants with fossil ones and simultaneously stronglypromoting efficiency measures, heat pumps and newrenewable systems, would allow stabilisation of thegreenhouse gas emissions from electricity and heatingsectors at the 1990 level. The latter mentioned
alternative is, however, more expensive by about 15%.On the other hand significant emission reductionsmuch below the Kyoto level, would be feasible bycombining nuclear electricity with strong promotion ofefficiency measures, heat pumps and new renew-ables. The associated yearly costs would in this casebe higher than today; this applies also to the corre-sponding fossil-based option. However the reductionof the uses of fossil fuels would be also favourable inview of the direct and indirect health and environ-mental impacts of such pollutants as NOx, SOx, CO,NMVOC and paniculate matter. Some of these im-pacts that occur under specific conditions are alreadyconsiderable.
Taking into account the currently expected technologi-cal advancements some recommendations can bemade based on the findings: (i) no-regret measuressuch as no or low cost efficiency improvements shouldbe promoted; (ii) enhanced use of new renewablesources - significant contributions can be achieved onthe heating side; (iii) increased use should be madeof heat pumps for the generation of space heatinggiven favourable conditions (low costs of small units,availability of low temperature heating system, and/oravailability of heat source that can be easily tapped);(iv) use of cogeneration plants in large buildings andfor the production of process heat is recommended ifpart of the electricity produced is used in heat pumpsto compensate increased air pollution emissions of thecogeneration plants.
Some of the options need well-designed policy instru-ments such as information programs and initiatives forexample in schools, companies and for the generalpublic [5], improvement of the professional educationor start-up financial support.
5 REFERENCES
[1] U. Gantner, S. Hirschberg, Entwicklung der Nut-zung regenerativer Energiequellen in derSchweiz, contribution to CH 50 % - Eine Schweizmit halbiertem Verbrauch an fossilen Energien,Swiss Academy of Technology and Science, Zu-rich (1999).
[2] M. Jakob, U. Gantner, S. Hirschberg, Perspekti-ven der zukunftigen Energieversorgung in derSchweiz unter Berucksichtigung von nachfrage-orientierten Massnahmen PSI-Report, Villigen, tobe published (2001).
[3] Prognos AG, Energieperspektiven der SzenarienI bis IV 1990 bis 2030, Swiss Federal Office ofEnergy, Bern (1996).
[4] L. Barreto, S. Kypreos, Technological Learning inEnergy Models: Experience and Scenario Analy-sis with MARKAL and the ERIS Model Prototype,PSI Report 99-08, Villigen (1999).
[5] S. Hirschberg (Ed.), Energie-Spiegel Nr. 1 undNr. 2, PSI, Villigen (2000).

128
APPENDIX
PROJECT COLLABORATIONS WITH EXTERNALPARTNERS
ALLIANCE FOR GLOBAL SUSTAINABILITY
Projekleiter: S. KypreosEnergy Modelling, The China CETP Programme
Projektleiter: A. WokaunSustainable Mobility:The Future of Mobility: New Technologies and PoliciesShaping Transportation Supply and Demand
ASTRA/BUWAL
Projektleiter: R. Gehrig*, U. BaltenspergerVerfikation von PM10-Emissionsfaktoren desStrassenverkehrs* EMPA Diibendorf
BAUGARTEN FOUNDATION
Projektleiter: A. SteinfeldSYNMET
BBW
Projekleiter: O. BahnTCH-GEM-E3: The Role of Innovation and PolicyDesign in Energy and Environment for a SustainableGrowth in EuropeEU-Projekt
Projektleiter: U. BaltenspergerDIFUSO (Diesel Fuel and Soot-Fuel Formulation andits Atmospheric Implications)EU-Projekt
Projektleiter: U. BaltenspergerSING ADS (Synthesis of Intergrated Global AerosolData Sets)EU-Projekt
Projektleiter: U. Baltensperger, E. WeingartnerPARTEMIS (Measurement and Prediction ofEmissions of Aerosols and Gaseous Precursors fromGas Turbine Engines)EU-Projekt
Projektleiter: W. GraberVOTALPII (Vertical Ozone Transports in the Alps)EU Projekt
Projekleiter: S. KypreosSAPIENT: Energy Systems Analysis for Progress andInnovation in Energy TechnologiesEU-Projekt
Projektleiter: S. MtillerELZA: Development of Electrically Rechargeable Zinc-Air Batteries
Projektleiter: P. NovakSolvent-free Lithium Polymer Starter Battery5th EU Programm
Projektleiter: A.S.H. Prevot, U. BaltenspergerARTEMIS (Assessment and Reliability of TransportEmission Models and Inventory Systems)EU-Projekt
Projektleiter: R.T.W. Siegwolf, J. Fuhrer*Eurosilva - HARVA (Optimale Ernahrung undHolzasche - Recycling im Wald)EU-Projekt
* IUL Birmensdorf
BFE
Projektleiter: S. Biollaz, S. StuckiRedox Filter. Decentralised Production of PureHydrogen from WoodProjektleiter: T. GerberThermochemische Charakterisierung undspektroskopischer Nachweis von Sauerstoff-verbindungen
Projektleiter: T. GerberInvestigation of Soot and NO Production in SprayCombustion of Acetal/Diesel Mixtures.
Projektleiter: T. GerberDarstellung und Spektroskopie von ZnO bzw. ZnxOyin der Gasphase
Projektleiter: P. GriebelStruktur turbulenter Vormischflammen unter Hoch-druck
Projektleiter: W. HubschmidLaserspektroskopische Methoden zur Analyse vonFlammen und Brennstoff-Sprays
Projektleiter: E. Jochem*Teilprojektleiter: M. JakobGrenzkosten bei forcierten Energie-Sparmassnahmenin WohngebaudenGemeinsames Projekt PSI-CEPE-ETHZ* CEPE-ETHZ
Projektleiter: M. KoebelNOX- Verminderung bei mobilen Dieselmotoren mittelsHarnstoff-SCR

129
Projektleiter: J. MantzarasTurbulent Catalytic Combustion
Projektleiter: R. Palumbo, A. SteinfeldSolar Thermal Production of Zinc
Projektleiter: G.G. SchererPolymerelektrolyt Brennstoffzellen mit H2 oderMethanol als Brennstoff
Projektleiter: A. SteinfeldSolarPACES: Solar Power and Chemical EnergySystems
Projektleiter: M. SturzeneggerAuf dem Weg zu solaren Brennstoffen - Physikalisch-chemische Beiträge zur Entwicklung von Solarreak-toren
BUWAL, Cantons of Grisons and Ticinio
Projektleiter: A.S.H. PrévôtTOSS (Trends of Ozone in Southern Switzerland)
COORDINATION RESEARCH COUNCIL, USA
Projektleiter: D.B. Kittelson*, U. BaltenspergerDiesel Aerosol Sampling MethodologyDepartment of Energy* University of Minnesota, Minneapolis, Minnesota,
USA
EPFL
Projektleiter: U. Baltensperger, E. WeingartnerSynthesis of Lidar, Optical Depth, and in Situ AerosolData at the Jungfraujoch
Projektleiter: S. BiollazFeasibility Study on Methanation of Biomass for SNGProduction
ETH-Rat
Projektleiter: U. Baltensperger, H. Burtscher*Entwicklung eines Wolkenkondensationszählers* FH Aargau
Projektleiter: J. KellerRetrieval of Tropospheric Aerosol Properties fromSpace (Contribution to the EUROTRAC-2 SubprojectTRO POSAT)
Projektleiter: A. Wokaun, S. LieninInnovationen im Individualverkehr(Pilotprojekt im Rahmen der Strategie Nachhaltigkeit)
ETHZ
Projektleiter: A. Wokaun, M. Meier*Brennstoffzellen-Antrieb* ETH Zürich
EU
Projektleiter: U. BaltenspergerNICE (The Nitrogen Cycle and Effects on theOxidation of Atmospheric Trace Species at HighLatitudes)(via NCSR Demokritos GR)
Projektleiter: A.S.H. Prévôt, S. NyekiCHAPOP (Characterisation of High Alpine PollutionPlumes)Projekt CAATER
HSK
Projektleiter: W. GraberWINDBANK III
IEA
Projekleiter: S. KypreosActivities Implemented Jointly to Curb CO2 EmissionsIEA-ETSAP/Annex VI
INDUSTRY
Projektleiter: S. BiollazCommercialisation of Integrated Waste Incinerationand Ash Treatment TechnologyConsortium PECK (PSI, Eberhard Recycling AG,CT Umwelt AG, Küpat AG)
Projektleiter: S. BiollazFeasibility Experiments on the Direct Electrification ofa Synthetic Low BTU Gas in a High Temperature FuelCell Test Stack (SOFC)Sulzer Hexis AG, Winterthur
Projektleiter: W. DurischThermophotovoltaische Erzeugung von Strom in mitErdgas betriebenen, wärmegeführten Kleinblockheiz-kraftwerkenForschungs-, Entwicklungs- und Förderungsfonds derschweizerischen Gasindustrie (FOGA)
Projektleiter: W. DurischElectrical Characterisation of Photovoltaic LaminatesAtlantis Solar Systeme, Härkingen
Projektleiter: W. HubschmidTeilprojektleiter PSI: A. InauenMischung und Verdampfung von Brennstoffsprays inGasturbinen- VormischbrennernAistom Power Technology, Dättwil und BFE

130
Projektleiter: M. KoebelEntwicklung eines mobilen SCR-Systems fürDieselmotorenLiebherr Machines Bulle SA undOberland Mangold, Garmisch-Partenkirchen (D)
Projektleiter: J. MantzarasCatalytic Combustion for Power GenerationAistom Power Technology, Dättwil
Projektleiter: A. MeierSolar Production of LimeQualiCal, Italy
Projektleiter: S. MüllerTechnologie- Transfer-Projekt "ElektrischWiederaufladbare Zink-Luft Batterie"- ChemTEK GmbH, Oberderdingen, Germany- Zoxy Energy Systems AG, Halsbrücke, Germany
Projektleiter: E. NewsonPartial Oxidation of Hydrocarbons/MethanolJohnson Matthey, UK, Haldor Topsoe A/S, DK, UOPLtd., UK., Süd Chemie AG, Germany
Projektleiter: P. NovákBehandlung der Graphite für die negative Elektrodeder Lithium-IonentransferbatterieTimcal AG, Sins/Bodio
Projektleiter: P. NovákElektrochemische Charakterisierung von Oxiden fürLithium-Ionen-BatterienDegussa Metals Catalysts Cerdee AG, Frankfurt,Germany
Projektleiter: G.G. SchererMembranen für die Direkt Methanol BrennstoffzelleAutomobilindustrie
Projektleiter: A. Steinfeld, W. HoffeinerSolar Thermal Processes for Closed Materials CyclesRWH Consult GmbH, Oberrohrdorf AG
KANTON Zürich/AWEL, BUWAL
Projektleiter: A.S.H. PrévôtYOG AM (Year of Gasphase and AerosolMeasurements)
KTI
Projektleiter: U. BaltenspergerThe Life Cycle of the Tropospheric Aerosol
Projektleiter: U. Baltensperger, H. Burtscher*Entwicklung der Steuerelektronik und Selbstdiagnosefür das Epiphaniometer* FH Aargau
Projektleiter: J. KellerInfluence of the Transboundary Pollution on the AirQuality in Switzerland (Contribution to theEUROTRAC-2 Subproject GLOREAM)
Projektleiter: R. KötzHigh Power, High Voltage SupercapacitorsABB, Dättwil, Leclanché SA, Yverdon
Projektleiter: P. NovákWiederaufladbare Hochleistungs-Lithium-Ionen-BatterienRenata AG, Hingen
Projektleiter: J. Wochele, Ch. LudwigPyroBatBATREC AG, Wimmis
METEO SCHWEIZ
Projektleiter: U. BaltenspergerGlobal Atmosphere Watch Programme: AerosolResearch at the Jungfraujoch
NATO
Projektleiter: S. Georgiou*, J.T. Dickinson**, T. LippertPhotochemical Active Materials for Laser AblationNATO Grant No; CRG 973063* Institute of Electronic Structure and Laser,
Foundation for Research and Technology-Hellas,Heraklion, Crete, Greece
** Washington State University, Pullman, USA
NATIONALFONDS
Projektleiter: U. BaltenspergerSources, Formation and Composition of PaniculateOrganic Carbon in the Lower Troposphere
Projektleiter: P. Blaser*, R.T.W. SiegwolfSoils, a Sink for Atmospheric CO2? Stabilisation and
13CÖ2Bioavailability of Soil-Incorporated Atmospheric* WSL Birmensdorf
Projektleiter: R. Kötz, H. Siegenthaler*Nanoscale Intercalation into Graphite and MetalOxides* University of Bern
Projektleiter: U. Krähenbühl*, R.T.W. SiegwolfReconstruction of Anthropogenic Pollution by S- andN-Bearing Compounds: Isotopic Signatures Since theTurn of the Century Through Study of EnvironmentalArchives* University of Bern

131
Projektleiter: Ch. Ludwig, S. Hellweg*, S. StuckiWaste BookPartners from Industry, Consulting Firms, andUniversities* ETH Zurich
Projektleiter: Ch. LudwigCT-PilotCT Environment AG
Projektleiter: A.F. Neftel*, A.S.H. PrevotCOCA (Characterization of Organic Compounds in theAtmosphere)* IUL Liebefeld, Bern
Projektleiter: P. NovakSynthesis and Characterization of AdvancedElectroactive Materials for Electrodes of RechargeableLithium-Ion-Batteries
Projektleiter: P. Schleppi*, R.T.W. SiegwolfIRISALP; Isotope S15N and Research on Impacts ofNitrogen Deposition in Subalpine Ecosystems* WSL Birmensdorf
Projektleiter: A. Wokaun, T. LippertLaser Ablation as a Tool for Trace Analysis and HighResolution Material Transfer
UNIVERSITIES
Projektleiter: H. Armbruster, S. StuckiOn-Board Production of EthersCombustion Engine Research Center, ChalmersUniversity, Goetheborg, Sweden
Projektleiter: J. KellerRetrieval of Biogeophysical and BiogeochemicalParameters Using Hyperspectral Remote SensingDataUniversity of Zurich
Projektleiter: M. KoebelMessgerat fur gasformiges Ammoniak undIsocyansaureUniversity of Kaiserslautern, Germany
Projektleiter: E. NewsonHydrogen for Gasoline Engines
J. Czerwinski, FH Biel, K. Boulouchos, ETH Zurich
TEACHING ACTIVITIES
University Level TeachingPD Dr. U. Baltensperger, with othersAnalytische Chemie VETH Zurich, WS 2000/2001.
PD Dr. U. Baltensperger, Prof. Dr. H. Burtscher,Prof. Dr. T. PeterAerosole IETH Zurich, WS 2000/2001.
PD Dr. U. Baltensperger, Prof. Dr. H. Burtscher,Prof. Dr. T. PeterAerosole IIETH Zurich, SS 2000.
Prof. Dr. R. PalumboApplied ThermodynamicsMechanical Engineering DepartmentValparaiso UniversityValparaiso IN 46383 USA.
Prof. Dr. R. PalumboMechanical MeasurementsMechanical Engineering DepartmentValparaiso UniversityValparaiso IN 46383 USA
Prof. Dr. A. Steinfeld, Dr. J. GassTechnik erneuerbarer Energien - Tell 1ETH Zurich, SS 2000.
Prof. Dr. A. SteinfeldSolar Thermal Concentrating TechnologiesWeizmann Institute of Sciences, Israel, SS 2000.
Prof. Dr. A. SteinfeldWarmeubertragung durch StrahlungETH Zurich, WS 2000/2001.
Prof. Dr. A. Steinfeld, Prof. Dr. A. Wokaun,Prof. Dr. G. Yadigaroglu, Prof. Dr. W. Kroeger,Prof. Dr. E. Jochem, Prof. Dr. M. FilippiniVertiefungseinfuhrung in Energietechnik:Nachhaltige EnergienutzungETH Zurich, WS 2000/2001.
Prof. Dr. P. TalknerStochastische Mechanik irreversibler ProzesseUniversitat Basel, WS 1999/2000.
Prof. Dr. P. TalknerStochastische Prozesse in der PhysikUniversitat Basel, WS 2000/2001.
Prof. Dr. A. WokaunErneuerbare EnergienETH Zurich, SS 2000.
Prof. Dr. A. Wokaun, Dr. J. GassTechnik erneuerbarer Energien, Tell 2ETH Zurich, WS 2000/2001.

132
Lecture Courses at Other Schools
Dr. F. GassmannUmweltethikFH Aargau, Brugg-WindischInterdisziplinärer Wahlfachkurs, WS 1999/2000.
Dr. Ch. LudwigBlockkurse: Speziierung in Nährlösungen (ZurLöslichkeit von Festphasen und Adsorption vonSchwermetallen)Beitrag zur Vorlesung "Bodenkunde 3", HochschuleWädenswil, December 22, 1999 - January 21, 2000.
Contributions to Courses at Universities, FHL andOther Institutes
Dr. O. BahnEvaluation d'une Réforme Fiscale Ecologique enSuisse à l'Aide d'un Modèle d'Equilibre GénéralCours de Gestion des Ressources Naturelles,Université de Neuchâtel, SS 2000.
Dr. R. BombachIntroduction to Numerical and Experimental Methodsin Combustion ResearchERCOFTAC Summer School ETH Zürich, September4-9, 2000.
Dr. F. BüchiBrennstoffzellenBeitrag zur Vorlesung "Technik erneuerbarerEnergien", Prof. A. Wokaun, ETH Zürich, WS 2000.
Dr. W. DurischPhotovoltaik-Praktikum für StudentenHochschule für Technik + Architektur, HTA Luzern,July 18, 2000.
Dr. F. GassmannTreibhauseffektSchweiz. Drogistenschule, Neuenburg, May 11, 2000.
Dr. F. GassmannDie wichtigsten Erkenntnisse zum Treibhaus-ProblemETHZ, Beitrag zur Vorlesung "Ökologische Aspekteder individuellen Mobilität", Zürich, May 12, 2000.
Dr. F. GassmannCO2-Emissionen und KlimaproblematikETHZ, Beitrag zur Vorlesung "Erneuerbare Energien",Prof. Dr. A. Wokaun, ETH Zürich, June 27, 2000.
Dr. F. GassmannUmweltethik in den Unterricht einbauen: Vom linearenzum zirkulären Denken, KomplexitätDidaktischer Weiterbildungszyklus 2000 der FHFreiburg (CH)Windisch, November 10, 2000.
Dr. W. K. GraberVerwendung von Flugzeug-, Satelliten- undnumerischen Wetterprognosedaten zur Modellierungdes grossräumigen Austausches von Oekosystemenmit der AtmosphäreBeitrag zur Vorlesung "Oekologische Modelle, GISund Fernerkundung", Lehrstuhl für Pflanzenökologie,University of Bayreuth, Germany, February 8, 2000.
Dr. O. HaasElektrochemische EnergiespeicherungDoppelschichtkondensatorenBeitrag zur Vorlesung "Technik erneuerbarerEnergien", Prof. A. Wokaun, ETH Zürich, WS 2000.
Dr. W. HubschmidIntroduction to Numerical and Experimental Methodsin Combustion ResearchERCOFTAC Summer School ETH Zürich, September4-9, 2000.
Dr. T. LippertPhotochemistryBeitrag zur Vorlesung "Erneuerbare Energien",Prof. A. Wokaun, ETH Zürich, SS 2000.
Dr. J. MantzarasIntroduction to Numerical and Experimental Methodsin Combustion ResearchERCOFTAC Summer School ETH Zürich, September4-9, 2000.
PD Dr. P. NovakElektrochemische Energiespeicherung1. Grundlagen2. BatterienBeitrag zur Vorlesung "Technik erneuerbarerEnergien", Prof. A. Wokaun, ETH Zürich, WS 2000.
Dr. G.G. SchererBrennstoffzellenBeitrag zur Vorlesung "Technik erneuerbarerEnergien"Prof. A. Wokaun, ETH Zürich, Wintersemester 2000.
Dr. R.T.W. Siegwolf, Dr. M. SaurerPraktikum zu "Stabile Isotope in der Ökologie undPflanzenphysiologie "University of Basel, May 18-19, 2000 and May 25-26,2000.
Dr. R.T.W. Siegwolf, Dr. M. SaurerStabile Isotope in der Oekologie und Pflanzen-physiologieUniversity of Basel, April 27-28, 2000.
Dr. R.T.W. SiegwolfProseminar zu Themen in der Stressphysiologie:Isotopenanalytik, ein wichtiges diagnostischesInstrument in der Ökologischen Kausalanalytik,Pflanzenphysiologisches Institut der University ofBern, April 25, 2000.

THIS PAGE IS MISSINGIN THE
ORIGINAL DOCUMENT

134
<. Robert**rimercial Photovoltaiclimatic Conditions), World Conference and3)-imy Idstein, Germanyle Lubeck, Germany
Wbrz*, W. Plapp**ovoltaic Generators284 (2000).le Ulm, Germanyle Aalen, Germany
<. Robert**lotovoltaic Modules underonsy Congress VI, WREC 2000,000. Renewable Energy, First79-788 (2000).dstein, Germanybeck, Germany
Itaic Electricity Supply Systeme in Southern Jordany Congress VI, WREC 2000,000. Renewable Energy, First95-800 (2000).
ski, H. W. Gaggeler, V. Furrer,Saurer, M. Funk**fan Ice Core from the Uppera.s.l.)5, (2000).
'. Gerber, B. Mischler,
nal Constants in a Moleculelave Mixing, 71-76 (2000).Chemistry and Biochemistry,
innAtmosphere- Vegetation
asing Radiative Forcing, 337-349 (2000).s Ltd., Zurich
N. K. Graber, L. Poggio,Grell*, T. Trickl*,iger***, G. Wotawa****Valley Campaign 1996 -
id Some Highlightsit 34, 1395-1412(2000).ur Atmospharische Umwelt-h-Partenkirchen, Germanyjna, Jugoslavia
eteorologie und Geodynamik,
U. Gantner, M. Jakob, S. HirschbergPerspektiven der zukunftigen Strom- und Warmever-sorgung fur die SchweizVSE-Bulletin 12, 11-20 (2000).
F. Gassmann, F. Klotzli*, G.-R. Walther*Simulation of Observed Types of Dynamics of Plantsand Plant CommunitiesJ. Veg. Sci. 11,397-408(2000).* ETH Zurich
P. Geissbuhler, R.T.W. Siegwolf, W. Eugster*Eddy Covariance Measurements on MountaneousSlopes: The Advantage of Surface-Normal SensorOrientation Over a Vertical SlopeBoundary Layer Meteorology 96, 371-392 (2000).* University of Bern
W.K. Graber, F. GassmannReal Time Modelling as an Emergency DecisionSupport System for Accidental Release of AirPollutantsMathematics and Computers in Simulation 52, 413-426 (2000).
B. Hemmerling, D.N. Kozlov, A. StampanoniTemperature and Flow-Velocity Measurements by Useof Laser-Induced Electrostrictive GratingsOpt. Lett. 25, 1340-1342 (2000).
V. Hermann, D. Dutriat*, S. Muller, Ch. Comninellis*Mechanistic Studies of Oxygen Reduction atLa06Ca0ACoO3-Activated Carbon Electrodes in aChannel Flow CellElectrochim. Acta 46 (2-3), 365-372 (2000).* EPF Lausanne
W. Hubschmid, B. HemmerlingRelaxation Processes in Singlet O2 Analyzed byLaser-Induced GratingsChem. Phys 259, 109-120 (2000).
F. Joho, P. NovakSNIFTIRS Investigation of the OxidativeDecomposition of Organic-Carbonate-BasedElectrolytes for Lithium-Ion CellsElectrochim. Acta 45, 3589-3599 (2000).
P. Jordan*, P. TalknerA Seasonal Markov Chain Model for the Weather inthe Central AlpsTellus 52A, 455-469 (2000).* Universitatsrechenzentrum, Universitat Basel
P.P. Kastendeuch*, P. Lacarrere**, G. Najjar*,J. Noilhan**, F. Gassmann, P. Paul*Mesoscale Simulations of Thermodynamic FluxesOver Complex TerrainInt. J. Climat., 20, 1249-1264 (2000).* Universite Louis Pasteur, CEREG, Strasbourg,
France** Centre National de Recherches Meteorologiques
(CNRM), Meteo-France, Toulouse, France

135
D.B. Kittelson*, J.Johnson*, W.F. Watts*, Q. Wei*,M. Drayton*, D. Paulsen*, N. BukowieckiDiesel Aerosol Sampling in the AtmosphereSAE Technical Paper Series 2000-01-2212 (2000).* University of Minnesota, Minneapolis, Minnesota,
USA
M. Kleemann, M. Elsener, M. Koebel, A. WokaunInvestigation of the Ammonia Adsorption on MonolithicSCR Catalysts by Transient Response AnalysisAppl. Catal. B: Environmental 27, 231-242 (2000).
M. Kleemann, M. Elsener, M. Koebel, A. WokaunHydrolysis of Isocyanic Acid on SCR CatalystsInt. Eng. Chem. Res. 39, 4120-4126 (2000).
M. Koebel, M. Elsener, M. KleemannUrea-SCR: A Promising Technique to Reduce NOX
Emissions from Automotive Diesel EnginesCatal. Today 59, 335-345 (2000).
R. Kbtz, M. Carlen*Principles and Applications of ElectrochemicalCapacitorsElectrochim. Acta 45, 2483-2498 (2000).* ABB Corporate Research, 5405 Baden-Dattwil
D.N. Kozlov, B. Hemmerling, A. StampanoniMeasurement of Jet Flow Velocities Using Laser-Induced Electrostrictive GratingsAppl. Phys. B71, 585-591 (2000).
R. Kuhn*, W. Durisch, A. Boueke*, P. Fath*,E. Bucher*Characterization of Mono- and Bifacially ActiveSemitransparent Crystalline Silicon Solar Cells underOut-door Operating ConditionsWorld Renewable Energy Congress VI, WREC 2000,Brighton, UK, July 1-7, 2000. Renewable Energy, FirstEdition 2000, Elsevier, 809-812 (2000).* University of Konstanz, Germany
S. Kypreos, L. Barreto, P. Capros*, S. Messner**ERIS: A Model Prototype with EndogenousTechnological ChangeInt. J. of Global Energy Issues 14, 374-397 (2000).* National Technical University of Athens, Greece** NASA, Austria
T. Kram*, A.J. Seebregts*, G.J: Schaeffer*, L. Barreto,S. Kypreos, S. Messner**, L. Schrattenholzer**Technology Dynamics in Energy Systems ModelsWith Perfect ForesightInt. J. of Global Energy Issues 14, 48-64 (2000).* ECN, Petten, The Netherlands** NASA, Austria
M. Lanz, C. Kormann*, H. Steininger*, G. Heil*,O. Haas, P. NovakLarge-Agglomerate-Size Lithium Manganese OxideSpinel with High Rate Capability for Lithium-IonBatteriesJ. Electrochem. Soc. 147, 3997-4000 (2000).* BASF AG, Ludwigshafen, Germany
E. Limpert*, P. Bartos*, W.K. Graber, K. Muller*,J.G. Fuchs*Increase of Virulence Complexity of Nomadic AirbornePathogens from West to East Across EuropeActa Phytopathologica et Entomologica 35, 261-272(2000).* ETH, Zurich
T. Lippert, J. Wei, A. Wokaun, N. Hoogen*,O. Nuyken*Polymers Designed for Laser MicrostructuringAppl. Surface Science 168, 270-272 (2000).* University of Munich, Garching, Germany
T. Lippert, J. Wei, A. Wokaun, N. Hoogen*,O. Nuyken*Development and Structuring of Combined Positive-Negative / Negative-Positive Resists Using LaserAblation as Positive Dry Etching TechniqueMacromol Mater. Eng. 283, 140-143 (2000).* University of Munich, Garching, Germany
J. Luczka*, P. Talkner, P. Hanggi**Diffusion of Brownian particles governed by fluctuatingfrictionPhysicaA278, 18-31 (2000).* University of Silesia, Katowice, Poland** University of Augsburg,Germany
Ch. Ludwig, A.J. Schuler, J. Wochele, S. StuckiMeasuring Heavy Metals by Quantitative ThermalVaporisationJ. Water Sci. and Technol. 42, 209-216 (2000).
Ch. Ludwig, C.A. Johnson*, M. Kappeli*, A. Ulrich*,S. Riediker*Hydrological and Geochemical Factors Controlling theLeaching Process in Cemented Air Pollution ControlResidues: A Lysimeter Field StudyJ. Contaminant Hydrology 42, 253-272 (2000).* EAWAG, Diibendorf
M. Lugauer, U. Baltensperger, M. Furger,H.W. Gaggeler, D.T. Jost, S. Nyeki, M. SchwikowskiInfluences of Vertical Transport and Scavenging onAerosol Particle Surface Area and Radon DecayProduct Concentrations at the Jungfraujoch (3454 masl)J. Geophys. Res. 105, 19869-19879 (2000).
J. Mantzaras, C. Appel, P. Benz, U. DogwilerNumerical Modelling of Turbulent CatalyticallyStabilized Channel Flow CombustionCatalysis Today 59, 3-17 (2000).
J.-C. Mayor, W. DurischApplication of a Generalized Model for the ElectricalCharacterisation of a Commercial Solar CellWorld Renewable Energy Congress VI, WREC 2000,Brighton, UK, July 1-7, 2000. Renewable Energy, FirstEdition 2000, Elsevier, 2081-2084 (2000).

136
D.S. Moore*, K.T. Gahagan*, T. Lippert, D. J. Funk*,S. J. Buelow, R.L. Rabie*Ultrafast Non-Linear Optical Method for Generation ofFlat-Top ShocksSPIE Proc. 4065, 490-494 (2000).* Los Alamos National Laboratory, Los Alamos,
NM, USA
D.S Moore*, K.T. Gahagan*, S.J. Bulow*, R. L. Rabie*,D.J. Funk*, S.A. Sheffield*, L. L. Davis*, T. Lippert, H.Brand*, J.W. Nicholson*Time- and Space-Resolved Optocal Probing of theShock Rise Time in Thin Aluminium FilmsShock Compression in Condensed Matter 1999, Eds.M.D. Furnish, L.C. Chhabildas, R.S. Hixson, 1003-1006(2000).* Los Alamos National Laboratory, Los Alamos, NM
USA
J. Nerlov* S. Sckerl*, J. Wambach, I. Chorkendorff*Methanol Syntesis from CO2, CO and H2 over Cu(100)Modified by Ni and CoAppl. Catal. A: General 191, 97-109 (2000).* Haldor Topsoe Research Laboratories, DK-2800
Lyngby, Denmark
P. Novak, J.-C. Panitz, F. Joho, M. Lanz, R. Imhof,M. ColucciaAdvanced In Situ Methods for the Characterization ofPractical Electrodes in Lithium-Ion BatteriesJ. Power Sources 90, 52-58 (2000).
S. Nussbaum*, M. Geissmann*, M. Saurer,R.T.W. Siegwolf, J. Fuhrer*Ozone and Low Concentrations of Nitric Oxide HaveSimilar Effects on Isotope Discrimination and GasExchange in Leaves of Wheat (Triticum aestivum L.)J. Plant Physiol. 156, 741-745 (2000).* IUL, Liebefeld-Bern
S. Nyeki, I. Colbeck*The Influence of Morphological Restructuring ofCarbonaceous Aerosols on MicrophysicalAtmospheric ProcessesK. Spurny (Ed.), Aerosol chemical processes in theenvironment Lewis Publ. 505-523 (2000).* University of Essex, Colchester, Essex, UK
S. Nyeki, M. Kalberer, I. Colbeck*, S. de Wekker**,M. Furger, H. W. Gaggeler, M. Kossmann***,M. Lugauer, D. Steyn, E. Weingartner, M. Wirth,U. BaltenspergerConvective Boundary Layer Evolution to 4 km AslOver High-Alpine Terrain: Airborne Lidar Observationin the AlpsGeophysical Research Letters 27, 689-692 (2000).* University of Essex, Colchester, Essex, UK** University of British Columbia, Vancouver, Canada*** University of Canterbury, Christchurch, New
Zealand
E.E. Ortelli, J. Wambach, A. WokaunUse of Periodic Variations of Reactant Concentrationsin Time Resolved DRIFT Studies of HeterogeneouslyCatalysed ReactionsAppl. Catal. A: General 192, 137-152 (2000).
E.E. Ortelli, F. Geiger, T. Lippert, J. Wei, A. WokaunUV-Laser-lnduced Decomposition of Kapton Studiedby Infrared SpectroscopyMacromolecules 33, 5090-5097 (2000).
R. Palumbo, S. Moller, A. SteinfeldSolar Thermochemical Processing: Challenges andChangesHigh Temperature Material Processes 4, 417-430(2000).
L. Poggio, M. Furger, A.S. H. Prevot, W.K. Graber,E.L. Andreas*Scintillometer Wind Measurements Over ComplexTerrainJ. Atmos. Oceanic Technol. 17, 17-26 (2000).* U.S. Army Cold Regions Research and
Engineering Laboratory, Hanover, NewHampshire, USA
A.S.H. Prevot, J. Dommen, M. Baumle*Influence of Road Traffic on Volatile OganicCompound Concentrations in and Above a DeepAlpine ValleyAtmospheric Environment 34, 4719-4726 (2000).* MetAir AG, Illnau
A.S.H. Prevot, J. Dommen, M. Baumle*, M. FurgerDiurnal Variations of Volatile Organic Compounds andLocal Circulation Systems in an Alpine ValleyAtmospheric Environment 34, 1413-1423 (2000).* MetAir AG, Illnau
F. Raimondi, S. Abolhassani, R. Briitsch, F. Geiger,T. Lippert, J. Wambach, J. Wei, A. WokaunQuantification of Polyimide Carbonization after LaserAblationJ. Appl. Phys. 88, 3659-3666 (2000).
M.A. Reiche*, T. Burgi*, A. Baiker*, A. Scholz,B. Schnyder, A. WokaunVanadia and Tungsta Grafted on TiO2: Influence of theGrafting Sequence on Structural and ChemicalPropertiesAppl. Catal. A: General 198, 155-169 (2000).* ETH-Zurich
M. Saurer, P. Cherubini*, R.T.W. SiegwolfOxygen Isotopes in Tree Rings of Abies Alba: TheClimatic Significance of Interdecadal VariationsJ. Geophys. Res. 105, 12461-12470 (2000).* WSL, Birmensdorf

137
B. Schaffner, W. Hoffelner*, H. Sun*, A. SteinfeldRecycling of Hazardous Solid Waste Material UsingHigh-Temperature Solar Process Heat -1.Thermodynamic AnalysisEnviron. Sci. Technol. 34, 4177-4184 (2000).* MGC-Plasma AG, Muttenz
Y. Scheidegger, M. Saurer, M. Bahn*, R.T.W. SiegwolfLinking Stable Oxygen and Carbon Isotopes withStomatal Conductance and Photosynthetic Capacity:A Conceptual ModelOecologia 125, 350-357 (2000).* Institute of Botany, Innsbruck, Austria
W. Schmid*, H. Schiesser*, M. Furger, M. Jenni**The Origin of Severe Winds in a Tornadic Bow-EchoStorm Over Northern SwitzerlandMonthly Weather Review 128, 192-207 (2000).* ETH, Zurich** University of Bern
G. Skillas*, Z. Qian, U. Baltensperger, U. Matter,H. BurtscherThe Influence of Additives on the Size Distribution andComposition of Particles Produced by Diesel EnginesCombustion Sci. Technol. 154, 259-273 (2000).* ETH Zurich
J. Staehelin*, A.S.H. Prevot, J. Barnes**Gasphasenchemie und PhotooxidantienUmweltveranderungen und Oekotoxikologie, SpringerVerlag, Band 1 A Atmosphare, 207-341 (2000).* ETH Zurich** University of Wuppertal, Germany
A. Steinfeld, A. Weidenkaff*, M. Brack, S. Moller,R. PalumboSolar Thermal Production of Zinc: Program Strategyand Status of ResearchHigh Temperature Material Processes 4, 405-416(2000).* now University of Augsburg, Germany
A. SteinfeldRecent Research Developments in SolarThermochemical ProcessingRecent Research Developments in ChemicalEngineering 4, 95-101, in: Transworld ResearchNetwork ISBN: 81-86846-63-8 (2000).
N. Streit, E. Weingartner, C. Zellweger,M. Schwikowski, H. W. Gaggeler, U. BaltenspergerCharacterization of Size Fractionated Aerosol Fromthe Jungfraujoch (3580 m asl) Using Total ReflectionX-Ray Fluorescence (TXRF)Int. J. of Environmental Analytical Chemistry 76, 1-16(2000).
R.P.W.J. Struis, M. Quintilii, S. StuckiFeasibility of Li-Nafion Hollow Fiber Membranes inMethanol Synthesis: Mechanical and Thermal Stabilityat Elevated Temperature and PressureJ. Membr. Sci. 177, 215-223 (2000).
M.G. Sullivan*, R. Kotz, O. HaasThick Active Layers of Electrochemically ModifiedGlassy Carbon. Electrochemical Impedance StudiesJ. of the Electrochem. Soc. 147, 308-317 (2000).* now Roche Diagnostics Corporation, Roche
Patient Care, Indianapolis, Indiana, USA
M.G. Sullivan*, B. Schnyder, M. Bartsch, D. Alliata**,C. Barbero***, R. Imhof****, R. KotzElectrochemically Modified Glassy Carbon forCapacitor Electrodes. Characterization of Thick AnodicLayers by Cyclic Voltammetry, DifferentialElectrochemical Mass Spectrometry, SpectroscopicEllipsometry, X-Ray Photoelectron Spectroscopy,FTIR, andAFMJ. Electrochem. Soc. 147, 2636-2643 (2000).* now Roche Diagnostics Corporation, Roche
Patient Care, Indianapolis, Indiana, USA** now I.N.F.M. Dipartimento di Scienze Ambientali,
Universita della Tuscia, Viterbo, Italy*** Departamento di Quimica y Fisica, Universidad
National de Rio Cuarto, 5800 Rio Cuarto,Argentina
****now Renata AG, Itingen
P. Talkner, R. WeberPower Spectrum and Detrended Fluctuation Analysis:Application to Daily TemperaturesPhys. Rev. E 62, 150-160 (2000).
P. TalknerMarkov Processes Driven by Quasi-PeriodicDeterministic ForcesAnn. Phys. (Leipzig) 9, 741-754 (2000).
A. Weidenkaff*, A. Reller*, A. Wokaun, A. SteinfeldThermogravimetric Analysis of the ZnO/Zn WaterSplitting CycleThermochimica Acta 359, 69-75 (2000).* University of Augsburg, Germany
A. Weidenkaff*, A. Reller*, F. Sibieude**, A. Wokaun,A. SteinfeldExperimental Investigations on the Crystallization ofZinc by Direct Irradiation of Zinc Oxide in a SolarFurnaceChem. Mater. 12, 2175-2181 (2000).* University of Augsburg, Germany** CNRS Odeillo, France
M. Werder*, A. SteinfeldLife Cycle Assessment of the Conventional andSolarthermal Production of Zinc and Synthesis GasEnergy - The International Journal 25, 395-409 (2000).* ETH Zurich

138
M. Winter*, G.H. Wrodnigg*, J.O. Besenhard*,W. Biberacher**, P. NovákDilatometric Investigations of Graphite Electrodes inNonaqueous Lithium Battery ElectrolytesJ. Electrochem. Soc. 147, 2427-2431 (2000).* Institute for Chemical Technology of Inorganic
Materials, Graz University of Technology, Graz,Austria
** Walther Meissner Institute, Bavarian Academy ofSciences, Garching, Germany
C. Zellweger, M. Ammann, B. Buchmann*, P. Hofer*,M. Lugauer, R. Rüttimann*, N. Streit, E. Weingartner,U. BaltenspergerSummertime NOy Speciation at the Jungfraujoch,3580 m Above Sea Level, SwitzerlandJ. Geophysical Research Atmospheres 105, 6655-6667 (2000).* EMPA Dübendorf
Other Papers
S. Andreani-Aksoyoglu, J. KellerComparison of Model Results for Winter and SummerAir Quality in SwitzerlandGLOREAM'99 Workshop, Ischia, ItalyGlobal and Regional Atmospheric Modelling, 191-200(2000).
S. Andreani-Aksoyoglu, J. KellerModelling of Air Quality During a Short Winter Periodin Switzerland and Comparison with Summer ResultsJ.W.S. Longhurst, C.A. Brebbia and H. Power (eds.),Air Pollution VIII WIT Press, 3-12 (2000).
F. Arens, M. Ammann, L. Gutzwiller, U. Baltensperger,H.W. Gäggeler*Formation of HONO from the Reaction of NO2 withDiesel SootEuropean Aerosol Conference, Dublin, Ireland,J. Aerosol Sei. 31, S1035-S1035 (2000).* University of Bern
H. Armbruster, J. van Gunsteren, S. Stucki,E. Olsson*, S. Gjirja*On-Board Conversion of Alcohols to Ethers forFumigation in Diesel EnginesISAF XIII, International Symposium On Alcohol Fuels,Stockholm, Sweden, Proc. Vol II, July 3-7 (2000).* University of Goetheborg, Sweden
O. Bahn, C. FreiGEM-E3 Switzerland: A Computable GeneralEquilibrium Model Applied for SwitzerlandPSI Bericht 00-01.
U. BaltenspergerAerosol Measurements Within the WMO GlobalAtmosphere Watch Programme: Providing DataRelated to Climate Forcing and Air QualityProc. EMEP-WMO Workshop on Fine Particles -Emissions, Modelling and Measurements, Interlaken,EMEP/CCC-Report 9/2000, 67-69 (2000).
U. Baltensperger, E. Weingartner, S. Henning,S. NyekiAerosol Measurements: Providing the Data for theQuantification of Aerosol Impact on ClimateProc. EMEP-WMO Workshop on Fine Particles -Emissions, Modelling and Measurements, Interlaken,EMEP/CCC-Report 9/2000, 95-99 (2000).
K. Baumann*, H. Maurer*, G. Rau*, M. Piringer*,U. Pechinger*, M. Furger, A. Prévôt, B. Neininger**ROM Project - Air Mass Analysis Based on PBLSoundings and Trajectories26th International Conference on Alpine Meteorology,Innsbruck, Austria (2000).* Central Institute for Meteorology and
Geodynamics, Vienna, Austria** MetAirAG, Illnau
S. Biollaz, M. Beckmann*, M. Davidovic*,Th. Jentsch**Improvement of Municipal Solid Waste Bottom AshQuality by Process Integrated Measures at GrateSystemsReis A., [et al.] ed. by INFUB, 5th EuropeanConference on Industrial Furnaces and Boilers, II,Rio Tinto, Portugal, April 11-14 (2000).* Clausthaler Umwelttechnik-Institut GmbH
(CUTEC), Germany** Fraunhofer Institut für zerstörungsfreie
Prüfverfahren (IzfP), Germany
S. Biollaz, Ch. Ludwig, M. Beckmann*, M. Davidovic*,Th. Jentsch**Volatility of Zn and Cu in Waste Incineration: Radio-Tracer Experiments on a Pilot Incinerator19th International Conference on Incineration andThermal Treatment Technologies - IT3 Conference,Portland, OR, May 8-12 (2000).* Clausthaler Umwelttechnik-Institut GmbH
(CUTEC), Germany** Fraunhofer Institut für zerstörungsfreie
Prüfverfahren (IzfP), Germany
B. Bitnar, D. Heger, J. A. Selvan, D. Grützmacher,J. Gobrecht, W. Durisch, F. von RothPhotovoltaic Cells for a Thermophotovoltaic Systemwith a Selective EmitterProc. of the 16th European Photovoltaic Solar EnergyConference and Exhibition, May 1-5, 2000, Glasgow,UK, 191-194(2000).
F.N. BüchiElektroboot mit BrennstoffzellenantriebsGWA (Gas, Wasser, Abwasser), Organ desSchweizerischen Vereins des Gas und Wasserfaches,4.292-295(2000).
F.N. Büchi, M. Wüst*Development of Small Fuel Cell Powered BoatsProc. Fuel Cell 2000, Proc., Ed. L. Blomen, Luzern,315-323, July (2000).* MW Line SA

139
N. Bukowiecki, S. Henning, A. Hoffer*,E. Weingartner, U. BaltenspergerCloud and Aerosol Characterization Experiment in theFree Troposphere (CLACE) - a Field Experiment atthe Jungfraujoch (3580 m asi)European Aerosol Conference, Dublin, Ireland,J. Aerosol Sei. 31, S11-S12 (2000).* University of Veszprem, Veszprem, Hungary
P. Dietrich, G. G. SchererDie Alternative Brennstoffzelle - wie real ist sie?Neue Zürcher Zeitung 52, B 11, March 2 (2000).
W. Durisch, J.-C. Mayor, J.-C. Panitz, F. von RothCoproduction de Chaleur et D'électricité Par VoieThermophotovoltaique- GAZ D'AUJOURD'HUI N° 2, 21-24 (2000)- Bulletin ASE/AES, 1/00, 12-14 (2000).
W. DurischPhotovoltaik heute und morgenSchweizerischer Elektrotechnischer Verein, ReiheSEV: Band 18d, 17-51 (2000).
W. Durisch, M. Leutwyler*Leistungsfähigkeit und spektrale Empfindlichkeit vonCu(ln, Ga)Se2-SolarmodulenBulletin SEV/VSE 10, 27-29 (2000).* ETH, Zürich
O. Epelly, J. Gondzio*, J.-P. Vial**An Interior Point Solver for Smooth ConvexOptimisation with an Application to Environmental-Energy-Economic ModelsLogilab Report 2000.08, HEC-Geneva, 1-27 (2000).* University of Edinburgh, UK** HEC-Geneva, University of Geneva
G. Erdmann*, M. Grahl*, A. Rôder,Fuel Chain Efficiencies,Schriften des Forschungszentrums Jülich, ReiheEnergietechnik/ Energy Technology, Volume 13: FuelCell Systems for Transportation, Ed. B. Hoehlein,Jülich, 2000* Technical University Berlin
C. Frei, E, Jochem*Ökosteuer als Investition in die Zukunft - Die doppelteDividende ist eine Frage der ZeitperspektiveNeue Zürcher Zeitung Nr. 206, September 5, 25(2000).* CEPE, ETH Zürich
T. Frey, E. Steiner, D. Wuillemin, M. SturzeneggerInvestigations on the Solar Thermal Reduction ofManganese OxideProc. 10th SolarPACES Int. Symp. on Solar ThermalCone. Technologies: Solar Thermal 2000, Sidney,Australia, 309-314(2000).
D.J. Funk*, T. Lippert, H. Brand*Synthesis of N4: Physical ApproachesLA-UR-00-0705, 1-11 (2000).* Los Alamos National Laboratory, Los Alamos, NM,
USA
M. FurgerCrosswind Measurements with Scintillometers at500 m Above Valley Floor During FoehnProc. 9th Conference on Mountain Meteorology,Aspen, Colorado, USA, 75-78 (2000).
M. FurgerScintillometric Wind Measurements in the Rhine ValleyDuring MAP-FORMMAP Meeting 2000, Bohinjska Bistrica, Slovenia, 44-45 (2000).
F. GassmannDynamique du Climat Global - Le Message de lacomplexitéB. Lâchai, F. Romerio (éd.) L'expertise scientifique,l'énergie et le climat: Pourquoi tant de controverses?Université de Genève, 33-40 (2000).
F. GassmannPotential of Forests to Control Regional and GlobalClimate by EvaporationProc. Forum Forests and Atmosphere - Water - Soil,Soltau (D), July 2-5 1999,Alfred Toepfer Akademie für Naturschutz, Reports 12,124-129(1999).
W.K. Graber, F. GassmannReal Time Risk Assessment for AtmosphericDispersion of Accidentally Released Air Pollutantsfrom Nuclear Power PlantsC.A. Brebbia, Risk Analysis II, 523-530 (2000).
S. Henning, E. Weingartner, U. Baltensperger,H.W. Gäggeler*Investigation of the Interaction Between Aerosol andClouds at the Jungfraujoch (3580 m asi)European Aerosol Conference, Dublin, Ireland,J. Aerosol Sei. 31, S13-S14 (2000).* University of Bern
S. Hirschberg, M. Jakob, U. GantnerFacts pour la politique énergétique de demainME - le Monteur Electricien 7, 35-37 (2000).
C. Hueglin*, W. Devos*, R. Gehrig*, P. Hofer*,J. Kobler*, W.A. Stahel**, M. Wolbers**,U. Baltensperger, C. Monn***Source Apportionment of PM10 in Switzerland byApplication of a Multivariate Receptor ModelEuropean Aerosol Conference, Dublin, Ireland,J. Aerosol Sei. 31, S891-S892 (2000).* EMPA, Dübendorf** ETH Zurich*** ETH Zurich
A. Inauen, R. Bombach, W. Hubschmid, B. KäppeliSimultaneous Raman and LI F Measurements in aCatalytic BurnerProc. 22nd IEA Task Leaders Meeting 2000 on EnergyConservation and Emissions Reduction inCombustion, Stockholm, Sweden, August 2000.

140
M. Jakob, P. DietrichSecondary Benefits von Treibhausgasemissionen furForschung und Technologie - SyntheseSekundarnutzen (Secondary Benefits) vonTreibhausgas-Reduktionen, Synthesen derArbeitsgruppen des Workshops im GDI, Riischlikon,November 22-23, 39-52, OcCC, Bern (2000).
H. Kiess*, W. DurischOptimization, Construction and Performance of aRoof-Top On-Grid Photovoltaic System in the SwissMidlandsProc. of the 16th European Photovoltaic Solar EnergyConference and Exhibition, Glasgow, UK, May 1-5,2000, 1855-1857(2000).* Consultant, Steinmaur
Z. Krivacsy*, A. Hoffer*, A. Molnar*, Z. Sarvari*,D. Temesi*, U. Baltensperger, S. Nyeki,E. Weingartner, S. Kleefeld**, S. G. Jennings**,K. Eleftheriadis***, I. Colbeck****Organic and Black Carbon in BackgroundAtmospheric AerosolsEuropean Aerosol Conference, Dublin, Ireland,J. Aerosol Sci. 31, S178-S179 (2000).* University of Veszprem, Hungary** National University of Ireland, Galway, Ireland*** NCSR Demokritos, Athens, Greece**** University of Essex, Colchester/Essex, England
T. Lippert, J. Wei, A. Wokaun, N. Hoogen*,O. Nuyken*Ultrasensitive Polymers for Laser Ablation3rd Inter. Symposium on Photorection Control andPhotofunctional Materials, Ext. Abstracts, 170-171,Tsukuba, March (2000).* Technische Universitat Munchen, Garching,
Germany
Ch. Ludwig, J. Wochele, S. StuckiRecycling Zinc from Muncipal Soild WasteProc. Recovery, Recycling, Re-integration, R'2000,June 5-9, Toronto, Canada, 1088-1093 (2000).
E. Newson, P. Mizsey, T. Truong, P. HottingerThe Autothermal Partial Oxidation Kinetics ofMethanol to Produce HydrogenStudies in Surface Science and Catalysis 130, A.Corma, F.V. Melo, S. Mendioroz, J.L.G. Fierro,(Editors), Elsevier, 695-700, 2000.
E. Newson, P. Mizsey, T. Truong, P. Hottinger,F. von Roth, Th.H. Schucan, K. Geissler,T. SchildhauerHydrogen from Liquid Energy Carriers: The CatalyticReforming of Methanol and HydrocarbonsHYFORUM 2000, Proc. Vol II, Forum furZukunftsenergien (Ed), 351-358 (2000).
S. Nyeki, U. Baltensperger, I. Colbeck*,K. Eleftheriadis**, Z. Krivacsy***, E. WeingartnerAerosol Volatility Measurements at the GAW StationsJungfraujoch and Ny AlesundEuropean Aerosol Conference, Dublin, Ireland,J. Aerosol Sci. 31, S366-S367 (2000).* University of Essex, Colchester, Essex, England** NCSR, Demokritos, Attiki, Athens, Greece*** University of Veszprem, Veszprem, Hungary
S. Nyeki, K. Eleftheriadis**, U. Baltensperger,I. Colbeck*, M. Fiebig***, C. Kiemle***,M. Lazaridis****, A. Betzold***Airborne Lidar and Aerosol Studies Over the AdriaticSea: II. Aerosol Volatility StudiesEuropean Aerosol Conference, Dublin, Ireland,J. Aerosol Sci. 31, S586-S587 (2000).* University of Essex, Colchester, Essex, England** NCSR "Demokritos", Attiki, Athens, Greece*** DLR, Oberpfaffenhofen, Germany**** NILU, Kjeller, Norway
J.-C. Panitz, J.-C. Mayor, B. Grob, W. DurischA Raman Spectroscopic Study of Rare-Earth MixedOxidesJ. Alloys and Compounds 303-304, 340-344 (2000).
A.S.H. Prevot, M. Furger, J. Dommen, B. Neininger*Vertical Pollutant Transport Over Alpine FoothillsProc. 14th Symposium on Boundary Layer andTurbulence, Aspen, Colorado, USA, 406-407 (2000).* MetAir AG, Illnau
N. Ritter, S. Andreani-Aksoyoglu, J. Keller,J. Dommen, A.S.H. PrevotTransboundary Air Pollution and its Influence on theAir Quality in SwitzerlandProc. GLOREAM'99 Workshop, Ischia, Italy, Globaland Regional Atmospheric Modelling, 281-286 (2000).
A. Rbder,Fuel Cell Cars and Platinum-Group Metals - Influenceon the Life Cycle Balance,Schriften des Forschungszentrums Julich, ReiheEnergietechnik/ Energy Technology, Volume 13: FuelCell Systems for Transportation, Ed. B. Hoehlein,Julich, 2000
J.A. Selvan, D. Griitzmacher, B. Bitnar, W. Durisch,Th. Neiger, J.GobrechtTunable Plasma Filters for TPV Systems UsingTransparent Conducting Oxides of Tin Doped IndiumOxideProc. 16th European Photovoltaic Solar EnergyConference and Exhibition, Glasgow, UK, May 1-5,2000, 187-190(2000).
F. Stahli*, F. GassmannGedanken aus der Sicht der Umweltethik\n:Wasserschloss, ISBN 3-85648-090-0, Merker imEffingerhof, Baden (CH), 14-16 (2000).* Fachhochschule Aargau, Brugg-Windisch

141
A. SteinfeldInternational Energy Agency -SolarPACESAnnual Report 1999, W. Grasse ed., Chapter 4(2000).
N. Streit, E. Weingartner, S. Nyeki, U. Baltensperger,R. Van Dingenen*, H.W. Gaggeler**Primary Aerosol Characterization During UrbanMorning Rush HoursEuropean Aerosol Conference, Dublin, IrelandJ. Aerosol Sci. 31, S311-S312 (2000).* Joint Research Centre, Ispra, Italy** University of Bern
S. Stucki, S. Biollaz, Ch. Ludwig, J. WocheleThermal Treatment of MSW - Can we Afford Recyclingat the End of the Pipe?Recovery, Recycling, Re-integration, R'2000, June 5-9, Toronto, Canada, 1237-1242 (2000).
S. Stucki, Ch. LudwigPhysikalisch-chemische Grundlagen des Schwer-metallverhaltens bei der thermischen Abfall- undRuckstandsbehandlungKurzfassungen SPP Umwelt, IP Abfall,Schweizerischer Nationalfonds, 160-161 (2000).
S. Stucki, S. BiollazWasserstofferzeugung aus EnergieholzLuftreinhaltung, Haus-Systeme und Stromerzeugung:Tagungsband zum 6. Holzenergie-Symposium, Th.Nussbaumer (Hrsg.); Bundesamt fur Energie, October20, ETH Zurich, 197-210 (2000).
P. Talkner, J. Luczka*Brownian motion in a d-dimensional space withfluctuating frictionStochastic Processes in Physics, Chemistry, andBiology, Edts.: J.A. Freund, T. Poschel, LNP 557,Springer Verlag, Berlin, Germany, 85-96 (2000).* University of Silesia, Katowice, Poland
H.R. Tschudi, Ch. MullerPyrometric Temperature Measurements in the SolarFurnaceProc. 10th SolarPACES Int. Symp. on Solar ThermalCone. Technologies: Solar Thermal 2000, March 8-10,2000, Sidney, Australia, 269-273 (2000).
E. Weingartner, S. Henning, S. Nyeki,U. BaltenspergerSeasonal and Diurnal Variation of Aerosol SizeDistributions (10 < D < 750 nm) at a High-Alpine Site(Jungfraujoch 3580 m asl)Proc. EMEP-WMO Workshop on Fine Particles -Emissions, Modelling and Measurements, Interlaken,Switzerland, EMEP/CCC-Report 9/2000, 195-200(2000).
E. Weingartner, H. Saathoff**, N. Streit, V. Lavanchy*,M. Schnaiter**, U. Matter***, U. BaltenspergerHygroscopic Behavior of Soot Particles Coated withOxidation Products of a-PineneEuropean Aerosol Conference, Dublin, Ireland,J. Aerosol Sci. 31, S987-S988 (2000).* University of Bern** Karlsruhe Research Center, Karlsruhe, Germany*** ETH Honggerberg, Zurich
CD. Whiteman*, R. Mayr**, M. Furger, E. Dreiseitl**Changes in the Alpine Boundary Layer During theSolar Eclipse of 11 August 1999Proc. 9th Conference on Mountain Meteorology,Snowmass, Colorado, 140-144 (2000).* Pacific Northwest National Laboratory, Richland,
Washington, USA** Institute for Meteorology and Geodynamics,
University of Innsbruck, Austria
J. Wochele, S. Stucki, Ch. LudwigThermal Treatment: Potential for Solving the HeavyMetal Problem of Municipal Solid Waste in aSustainable WayWorld Congress of the International Solid WasteAssociation (ISWA), July 3-6, Paris, France, CD,D-4173(2000).
A. WokaunSpectrosopic Probes of Surfactant Systems andBiopolymersMacromolecular Systems: Microscopic Interactionsand Macroscopic Properties, VCH, Weinheim,Germany, 401-424(2000).
DISSERTATIONS
Dario AlliataInvestigation of Nanoscale Intercalation Into Graphiteand Carbon Materials by in situ Scanning ProbeMicroscopyPh.D. Thesis, University of Bern, June 28, 2000.
A. CadenaModels to Assess the Implications of the KyotoProtocol on the Economy and Energy System ofColombiaPh.D. Thesis, SES Faculty, Nr. 506, University ofGeneva, 2000.
M. ColucciaSynthesis, Optimisation and Characterisation ofLayered Electroactive Materials for Lithium-IonBatteriesPh.D. Thesis, Nr. 13751, ETH Zurich, 2000.
M. CorbozEfficiencies in Heterogeneous Photocatalysis-OnaSubtle Interplay Between Physical and ChemicalPropertiesPh.D. Thesis, University of Bern, 2000.

142
S. EckhoffEntwicklung eines Reflektometers zur Bestimmung derspektralen Emissivitat im Sichtbaren bei hohenTemperaturenPh.D. Thesis, University of Basel, 2000.
L. GublerOperating Polymer Electrolyte Fuel Cells withReformed FuelPh.D. Thesis, No. 13954, ETH Zurich, November 29,2000.
V. HermannPreparation et Caracterisation D'electrodes a Base deLa0.6Cao.4Co03: Application a la Reduction D'oxygeneen Milieu AlcalinThese ETHL, No. 2181, 2000.
E.E. OrtelliModulation Techniques for the Application ofFTIR/DRIFT Spectroscopy in HeterogeneousCatalysisPh.D. Thesis, No. 13694, ETH Zurich, May 19, 2000.
N. StreitChemical and Physical Characterization of AmbientAerosols in Source and Sink RegionsPh.D. Thesis, University of Bern, 2000.
J.WeiPart A: Influence of Minerals on the ChemicalDecomposition of Carbamate PesticidesPart B: UV Laser Induced Microstructuring of NovelPolymersPh.D. Thesis, No. 13856, ETH Zurich, September 20,2000.
DIPLOMA THESES
C. FreiModelling Employment Effects in the Context ofEnergy Policy AssessmentEconometrics, University of Geneva, May 2000.
M. GyselDas Feuchtigkeitsverhalten von Aerosolpartikeln beitiefen TemperaturenETH Zurich, 2000.
M. HadornSynthese des Katalysators Laa6 Ca0A CaO3 mittels"Micro-Emulsions-Technik"Diplomarbeit, FH fur Technik und Architektur,Burgdorf.
T. KallisAufbau und Inbetriebnahme eines Messstandes zurCharakterisierung von CO2-Filter fur alkalische Zink-Luft BatterienDiplomarbeit, FH Mannheim, Germany
J. KtihniFiltre redox - Influence du Debit d'un Melange Gazeuxde CO, CO2, H2 et H2O sur la Vitesse de Reduction dela Magnetite en Wustite et Observations des Effets duNickel sur la Reaction de Reforming du Methane avecde L'eauEcole d'ingenieurs et d'architectes de Fribourg,Chemie, 2000.
R. NesslerCn
2 Messung mit einem ScintillationsanemometerETH Zurich, 2000.
D. NotterKatalytischer Reinigungsschritt von Reformat fur dieWasserstoffanwendung in BrennstoffzellenETH Zurich, April - August 2000.
J. van GunsterenKatalysatoren fur die Dehydratisierung von Methanolzu DimethyletherETH Zurich, October 1999 - January 2000.
S. WernerAuslegung einer Pilotanlage fur die Herstellung vonionen leitenden MembranenZiircher Hochschule Winterthur
M. WohlfenderAuf der Suche nach der fehlenden Kohlenstoffsenkeim CO2-Anreicherungsexperiment
University of Basel, 2000.
TALKS
Invited Talks
S. Andreani-AksoyogluModelling of Air Quality During a Short Winter Periodin Switzerland and Comparison with Summer ResultsAir Pollution VIII, Cambridge, Great Britain, July 24-26,2000.B. AndreausCelle a Combustibili per Applicazioni MobiliPommerigio informativo sul VEL 2, ExpoVEL,Mendrisio, October 6, 2000.
U. BaltenspergerFeinstaube zwischen Emission und ImmissionZAP-lnformationstag Feinstaub, EMPA, DubendorfNovember 17, 2000.
U. BaltenspergerThe Impact of Transportation Sources on AmbientAerosol CharacteristicsEnergy Technologies for a Sustainable Future, ENESymposium, PSI Villigen, Switzerland, November 23-24, 2000.

143
U. BaltenspergerThe Art of Aerosol Measurement and Modeling withinAEROSOLEUROTRAC-2 Symposium 2000, Garmisch-Partenkirchen, March 27-31, 2000.
U. BaltenspergerDas Aerosolprogramm auf dem Jungfraujoch: Datenzur Quantifizierung des Aerosol-Effekts auf das Klima1. Forschungskolloquium 2000 der MeteoSchweiz,Zurich, May 17, 2000.
U. BaltenspergerModification of Aerosol Particle Characteristics Due toAging Processes in the Atmosphere25th EGS General Assembly, Nice, France, April 29,2000.
U. BaltenspergerVeranderung der Partikel in der AtmosphareHaus der Technik, Partikelemissionen undPartikelfiltertechnik, MCinchen, Germany, May 20-31,2000.
L BarretoMulti-Regional Technological Learning: SomeExperiences with the MARKAL ModelWorkshop on Economic Modelling of EnvironmentalPolicy and Endogenous Technological Change,Amsterdam, The Netherlands, November 16-17, 2000.
F.N. BiichiGrundlagen und Konstruktion eines Brennstoffzellen-stapelsETH Zurich, Seminar der Professur fur Leistungs-elektronik und Messtechnik, January 19, 2000.
F.N. BuchiPEM-Brennstoffzellen: Forschung und Entwicklung amPaul Scherrer InstitutSeminar Festkorperphysik, University of Fribourg, May8, 2000.
F.N. BuchiDevelopment of Small Fuel Cell Powered BoatsFuel Cell 2000 Conference, Luzern, July 10-14, 2000.
F.N. BuchiLa pile a combustibles, la propulsion de I'avenirpour/'automobileTechniciens Peugeot Suisse SA, Avenches,December 1, 2000.
J. DommenVOC- versus NOx-limitierte OzonbildungZAP-Tag 2000: Fluchtige organische Verbindungen(VOC), EMPA Dubendorf, May 25, 2000.
W. DurischPhotovoltaik heute und morgenSEV-lnformationstagung fur Betriebselektriker,Zurich, March 7 and 23, 2000.
W. DurischEfficiency of Selected Photovoltaic Modules UnderVarying Climatic ConditionsWorld Renewable Energy Congress VI, WREC 2000,Brighton, UK, July 1-7, 2000.
M. FurgerHin-und-Her oder Auf-und-Ab: Windmessungen in denAlpen mit SzintillometernSeminarreihe Atmospharenwissenschaften, ETHZurich, December 11, 2000.
M. FurgerScintillometer crosswind measurements in the AlpsSeminar at the Environmental Technology Laboratory,National Oceanic and Atmospheric Administration,Boulder, Colorado, USA, July 31, 2000.
F. GassmannDynamique du Climat Global - Le Message de laComplexity- Journee du CUEPE 2000, Universite de Geneve
Geneva, May 4, 2000- Storia dei mutamenti climatici: le ricerche sulle
cause, Seminario WWF Svizzera, Lugano, May 27,2000.
F. GassmannThe Novel Science of Complex Systems - GoingBeyond ReductionismSwiss Chapter of Sigma Xi, Bern, June 24, 2000.
F. GassmannIntroduction Into the New Science of ComplexSystemsIGEI-Summerschool: Beyond Kyoto - AchievingSustainable Development, Hamburg, Germany, July24-28, 2000.
F. GassmannKlimaproblem - Was weiss man, wo ist man nochunsicher?Solaar: Solarwarme AG, Windisch, November 7,2000.
F. GassmannComplex Systems Dynamics Demonstrated with aWaterwheel-SimulationPhysics on Stage:- Jahrestagung SANW, Winterthur, October 13, 2000- Int. Conf. at CERN, Geneva, November 8-9, 2000.
T. GerberScope of Investigations on Acetals at PSIUniversity of Nijmegen, The Netherlands, November7, 2000.
W.K. GraberProjekt Windbank, ein Instrument zurNotfallschutzplanung bei Storfalien von KernanlagenTagung der Kommission zur Ueberwachung derRadioaktivitat, PSI Villigen/Wurenlingen, Switzerland,March 14,2000.

144
W.K. Graber, R.T.W. SiegwolfLarge-Scale Effects of Alpine Land Use Changes onthe Atmospheric Water Cycle and the Signature ofLand Use Changes in Stable Isotope RatiosPress conference on the EU-Project ECOMONT,Centro di Ecologia Alpina, Trento, Italy, March 24,2000.
O. HaasDynamics of Ion-Transport and Electron-TransferProcesses in Inorganic and Organic ElectroactiveFilmsNATO Advanced Research Workshop onElectrochem. of Electroactive Polymer Films WEEPF2000 Poraj, Poland September 9-14, 2000.
O. HaasMaterials for Electrochemical Energy Conversion andStorageHerbstseminar des SFB Elektroaktive Stoffe,Technische Universitat Graz, November 23-25, 2000.
O. HaasDynamics of Porous Composite Electrodes - anEngineering Aspect for Lithium-Ion BatteriesKeynote Lecture 51st ISE Meeting, Warschaw, Poland,September 3-8, 2000.
M. HahnDouble-Layer Capacitors Based on Glassy Carbonand Sulfuric Acid - Mechanisms of Self Discharge10th Int. Seminar on Double Layer Capacitors,Deerfield Beach, FL, December 4-6, 2000.
S. Hirschberg, U. Gantner, M. JakobTowards More Sustainable Energy Supply SystemsEnergy Technologies for a Sustainable Future, PSI,November 23-24 (2000).
R. KotzSupercap Energiespeicher fur mobile Anwendungen -Technologie und AnwendungenETHZ, Seminar der Professur fur Leistungselektronikund Messtechnik, January 26, 2000.
R. KotzSuperkapazitaten, revolutionare Komponenten furzukunftige Energiespeicher Anwendungen. Aufbau derElemente und Stand der GrundlagenforschungHochschule Technik + Architektur Luzern, AbteilungElektrotechnik, February 24, 2000.
R. KotzBipolarer elektrochemischer Doppelschichtkonden-sator mil hoher LeistungsdichteGesellschaft Deutscher Chemiker, Jahrestagung 2000der Fachgruppe Angewandte Elektrochemie,Elektrochemische Verfahren fur neue Technologien,Ulm, September 27-29, 2000.
S. KypreosThe MERGE Model with Endogenous TechnologicalChangeWorkshop on Economic Modelling of EnvironmentalPolicy and Endogenous Technological Change,Amsterdam, The Netherlands, November 16-17, 2000.
M. LanzIn-Situ DEMS Study of the Electrochemical Reductionof an Industrial Carbonate Electrolyte at ThickGraphite Electrodes for Lithium-Ion Batteries51st ISE Meeting, Warschaw, Poland, September 3-8,2000.
T. LippertPolymers Designed for Laser Microstructuring8th JST Int. Symposium on Molecular Processes inSmall Time and Space Domains, Nara, Japan, March3, 2000.
T. LippertLaser- and FTIR-SpectroscopyResearch Laboratory of Resources Utilization, TokyoInstitute of Technology, Japan, March 13, 2000.
T. LippertUltrasensitive Polymers for Laser Ablation- COE-Project, National Institute of Materials and
Chemical Research, Tsukuba, Japan, March 9,2000,
- Department of Chemistry, Tohoku University,Japan, March 12, 2000.
T. LippertLaser Ablation Applied for Direct Structuring, Thin FilmDeposition and Emission Spectroscopy- Los Alamos National Laboratory, USA, June 19,
2000,- Institute of Energy Technology, ETH-Zurich,
June 28, 2000,- Institute of Applied Optics, EPF Lausanne, July 4,
2000,- Festkbrperchemie, University of Augsburg,
Germany, July 6, 2000.
T. LippertLasers and PolymersPolymer Symposium, Thurnau, Germany, October2000.
P. NovakThe Complex Electrochemistry of Graphite Electrodesin Lithium-Ion Batteries10th Int. Meeting on Lithium Batteries, Como, Italy,May 28-June 2, 2000.Keynote Lecture
Ch. LudwigBeispiele zur Speziierungsrechnung und ihreBedeutung fur die PraxisUniversity of Applied Sciences Wadenswil, January21,2000.

145
E.NewsonThe Partial Oxidation of Methanol and HydrocarbonsInstitute of Catalysis and Petrochemistry, CSIC,Madrid, Spain, July 19, 2000.
R. PalumboSolar Thermal Chemical Processing Research: A Pathtoward Sustainable Energy TechnologyEnergy Technologies for a Sustainable Future, VilligenPSI, November 23-24, 2000.
A.S.H. PrevotEU Projects VOTALP and VOTALPII (Vertical OzoneTransports in the ALPs)Seminar at the Environmental Technology Laboratory,National Oceanic and Atmospheric Administration,Boulder, Colorado, USA, July 31, 2000.
A.S.H. PrevotSubproject LOOP: Limitation of Ozone Production onLocal and Regional ScaleEUROTRAC-Symposium 2000, Garmisch-Parten-kirchen, Germany, March 27-31, 2000.
A.S.H. PrevotUmweltrelevanz von fluchtigen organischen Kohlen-stoffverbindungenHochschule Wadenswil HSW, Fachhochschule ZurichFHZ, Umweltbiotechnologie, March 24, 2000.
P.P. RadiCollision-Induced Resonances in Two-ColorFour-Wave MixingUniversity of St. Petersburg, Russia, April 12,2000.
T. RagerMembranelektrolyte fur elektrochemische ZellenGDCh-Fachgruppe Angew. Elektrochemie,Jahrestagung 2000, Ulm, Germany, September 27-29,2000.
G.G. SchererMembran-Brennstoffzellen - Eine Herausforderungauch fur die Makromolekulare ChemieLehrstuhl fur Makromolekulare Stoffe,Techn. University of Munich, January 27, 2000.
G.G. SchererDer Elektrolyt in der Membran BrennstoffzelleBunsentagung 2000, Wurzburg, Germany, June 1-3,2000.
G.G. SchererProton Conducting Membranes - Development Trendsin Solid Polymer Electrolyte Applications10th Int. Conf. Solid State Protonic Conductors,Montpellier, France, September 24-28, 2000.Plenary lecture
G.G. SchererBrennstoffzellen in der Schweiz - Chancen undRisikenForum Energie Zurich, 2000/2001, Zurich, October 3,2000.
G.G. SchererResearch & Development in the Area of PolymerElectrolyte Fuel Cell Membranes at Paul ScherrerInstitutLawrence Berkeley Laboratory, Material ScienceDivision, Advanced Spectroscopy Department,Berkeley, CA, USA, November 3, 2000.
G.G. SchererDie Polymermembran als Schlusselkomponente derNiedertemperatur BrennstoffzelleETH Zurich, Institut fur Polymere, November 9, 2000.
G.G. SchererMoglichkeiten und Grenzen der BrennstoffzelleM.U.T. Fachkongress; Messe Basel, November 14,2000.
G.G. SchererBrennstoffzellen - Eine ObersichtGesellschaft Deutscher Chemiker, Ortsverband Harz,Techn. University of Clausthal-Zelierfeld, November17,2000.
R.T.W. SiegwolfThe Combined Use of Stable Carbon and OxygenIsotopes Reveal Differential Effects of Soil Nitrogenand Nitrogen Dioxide on the Water Use Efficiency ofHybrid PoplarMax Planck-lnstitut fur Biogeochemie, Jena, Germany,November 28, 2000.
R.T.W. SiegwolfEinsatz stabiler Isotope in der DendrochronologieDendrochronologisches Kolloquium, Eidg. Institut furWald, Schnee und Landschaft (WSL), Birmensdorf,January 28, 2000.
R.T.W. SiegwolfQuantitative Partitioning of the Soil Respiration UsingStable Isotope Analysis of the Carbon and OxygenIsotope RatioFACE-Workshop, Eschikon, February 10-12, 2000.
R.T.W. SiegwolfThe Use of Stable Isotopes as a Diagnostic Tool inCarbon Water Relations of PlantsSFB-Workshop, Buchendominierte Laubwalder unterdem Einfluss von Klima und Bewirtschaftung, AlbertLudwigs Universitat, Freiburg i.B., Germany, June 21,2000.
R.T.W. SiegwolfThe Use of Stable Isotopes in the Study of Soil -Vegetation Interaction59th annual meeting of the Swiss Society forMicrobiology, University of Zurich, March 23-24, 2000.

146
A. StampanoniLaser-Induced Gratings and Two-Color Four-WaveMixing: Application for DiagnosticsOnera, Paris, France, Journee Scientifique,November 20, 2000.
R.P.W.J. StruisGasification Reactivity of Charcoal with CO2
Thermochemical Biomass Conversion Congress,Tyrol, Austria, September 17-22, 2000.
S. StuckiNachhaltige Nutzung von BiomasseUniversity of Basel, April 2000.
S. StuckiWasserstofferzeugung aus EnergieholzHolzenergiesymposium ETH Zurich, October 20,2000.
S. StuckiThermal Treatment of MSW - Can we AffordRecycling at the End of the Pipe?Organization of the Workshop at the R'2000Conference, June 5-9, Toronto, Canada, 2000.
Ch. WieckertSolares Zink - Zukunftskonzept zur Zinkherstellungmit drastisch reduzierten C02-Emissionen und zurSpeicherung von SonnenenergieTagung des Fachausschusses Zink der GDMB(Gesellschaft fur Bergbau, Metallurgie, Rohstoff- undUmwelttechnik), Datteln, September 28-29, 2000.
P. TalknerMarkov Processes Driven by Quasi-Periodic ForcesCECAM Meeting: Computational Issues in StochasticProcesses, Lyon, France, May 25-27, 2000.
P. TalknerPeriodically and Quasi-Periodically Driven MarkovProcesses in the Adiabatic and the SemiadiabaticLimitYear 2000 Marian Smoluchowski Symposium onStatistical Physics, Zakopane, Poland, September 10-17,2000.
P. TalknerClosing AddressXXIV International School of Theoretical Physics:Transport Phenomena from Quantum to ClassicalRegimes, Ustron, Poland, September 25 - October 1,2000.
A. WokaunMobilitatsmodelle fur die ZukunftPodiumsveranstaltung Novatlantis, ETH Zurich,February 2, 2000.
A. WokaunTechnology Sharing: A Case Study of the ChinaEnergy Technology Programme. Energy/EconomyModelling and Life Cycle AnalysisInternational Transdisciplinary ConferenceABB Baden-Dattwil, February 27 - March 1, 2000.
A. WokaunRessourcenverbrauch und Umweltbelastungen beiEnergiebereitstellungForum Vera, 4. Weiterbildungskurs fur Lehrerlnnen,Bbttstein, September 8, 2000.
A. WokaunKonkrete Problemlosungsvorschlage am Beispiel derProvinz Shandong (China)Proclim, Parlamentarische Gruppe "Klimaanderung",Bern, October 3, 2000.
A. WokaunStrukturanderungen in der Energiewirtschaft alsHerausforderung fur die ForschungSAEE-Jahrestagung, Bern, October 20, 2000.
Other Talks
D. AlliataElectrochemical/lnterfacial Studies of Carbon Films inNon-aqueous Electrolytes10th Int. Meeting on Lithium Batteries, Como, Italy,May 28-June 2, 2000.
C. AppelNumerical Investigtion of a Turbulent CatalyticallyStabilized CombustionERCOFTAC Annual Meeting, PSI, May 22, 2000.
H. ArmbrusterOn-Board Conversion of Alcohols to Ethers forFumigation in Diesel EnginesISAF XIII, International Symposium On Alcohol Fuels,Stockholm, Sweden, July 3-7, 2000.
O. BahnAssessing a Swiss Ecological Tax Reform with GEM-E3 SwitzerlandInternational Workshop on Decision & Control inManagement Sciences in honour of Professor AlainHaurie, Montreal, Canada, October 19-20, 2000.
U. BaltenspergerAenderung von Russpartikel-Eigenschaften durchAlterung"Jungfrau-Tagung": Partikel-Lungen-lnteraktion,University of Bern, February 29, 2000.
U. BaltenspergerAerosol Measurements Within the WMO GlobalAtmosphere Watch Program and Their Potential forGround Truthing of Satellite DataNARSTO Symposium 2000, Queretaro, Mexico,October 23-26, 2000.

147
U. BaltenspergerResearch Activities and Recent Developments inAnalytical Chemistry at the Paul Scherrer InstitutSeminar of the Centre of Excellence in AnalyticalChemistry (CEAC), Muri, September 21 -22, 2000.
U. Baltensperger, E. WeingartnerCLACE Cloud and Aerosol CharacterizationExperiment in the Free TroposphereAstronomic commission HFSJG, Observatoire deGeneve, April 14, 2000.
P. Beaud, H.-M. Frey*, T. Lang**, M. Motzkus**Direct Observation of the Anharmonicity of MolecularRotation by Femtosecond CARSXIX European CARS Workshop, Moscow, Russia,March 20-23, 2000.* now Departement of Chemistry and Biochemistry,
University of Berne** Max Planck Institut fur Quantenoptik, Garching,
Germany.
P. Beaud, H.-M. Frey*, T. Lang**, M. Motzkus**Femtosecond CARSERCOFTAC, Annual Meeting, PSI Villigen, May 22,2000.* now Departement of Chemistry and Biochemistry,
University of Berne** Max Planck Institut fur Quantenoptik, Garching,
Germany.
S. BiollazPECK - Ein integriertes Verfahren fur die Behandlungvon Siedlungsabfall zur Schwermetallabtrennung undWertstoffruckgewinnungAbschlusstagung IP Abfall, PSI Villigen, January 26,2000.
S. BiollazVolatility of Zn and Cu in Waste Incineration: Radio-Tracer Experiments on a Pilot Incinerator19th International Conference on Incineration andThermal Treatment Technologies - IT3 Conference,Portland, OR, USA, May 11, 2000.
B. Bitnar, W. Durisch, D. Griitzmacher, J.-C. Mayor,Ch. Miiller, F. von Roth, J.A. Anna Selvan, H. Sigg,H.R. Tschudi, J. GobrechtA TPV System with Silicon Photocells and a SelectiveEmitter28th. IEEE Photovoltaic Specialists Conference,Anchorage, 17-22 September (2000).
R. BombachCatalytically Stabilized Hydrogen CombustorCharacterized by Simultaneous Raman and OHFluorescence MeasurementERCOFTAC Annual Meeting, PSI, May 22, 2000.
N. BukowieckiIn-Situ On-Highway Particle Measurements onMinnesota Highways with Help of a Mobile EmissionLaboratory"Jungfrau-Tagung": Partikel-Lungen Interaktion,University of Bern, February 29, 2000.
N. Bukowiecki, D.B. Kittelson*, W.F. Watts*,U. Baltensperger, E. WeingartnerComparing SMPS Size Distributions with DC, PAS andCPC Data4th ETH Conference on Nanoparticle Measurement,Zurich, Switzerland,* University of Minnesota, Minneapolis, USA
C. Condevaux-Lanloy*, O. Epelly, E. Fragniere**Dynamic Handling of Non-linear Problem StructuresAPMOD2000 meeting, Brunei University, England,April 17-19,2000.* HEC-Geneva, University of Geneva** HEC-Lausanne, University of Lausanne
M. Corboz, I. Alxneit, H.R. TschudiEffet de la Diffusion Moleculaire sur la Determinationde lEfficacite Quantique d'une PhotocatalyseHeterogene1eres Journees Chimie Soleil Energie etEnvironnement, St-Avold, France, 3 et 4 fevrier 2000.
L.C. de SousaFluidized Bed Gasification of Wood, Urban WasteWood and Wood/Plastic MixturesInternational Conference Biomass for Energy andIndustry, Sevilla, Spain, June 5-9, 2000.
W. DurischPhotovoltaik-Strom aus SonnenlichtEnergietechnische Ausbildung fur nichttechnischeFiihrungskrafte, ABB Technikerschule, Baden, May31,2000.
O. EpellyComputational Experience with an Interior-PointAlgorithm for Handling and Solving Large-ScaleMacroeconomic Growth ModelsIOR Seminar, Zurich, January, 2000.
O. EpellyResolution par une Methode de Points Interieurs d'unProgramme non Lineaire Convexe dont le Modele estEclate en Blocs Exprimes dans des Langages deModelisation DifferentsROADEFF'2000, Nantes, France, January, 2000.
O. EpellyA New Solver for Markal-Macro ModelsIEA-ETSAP Seminar, Paris, May 15-19, 2000.

148
O. EpellyDevelopment of an Interior Point Algorithm for Large-Scale Smooth Convex Programs with an Application toE3 Models: Markal-Macro and MergeIEA-ETSAP Seminar, ABB Dattwil, October 17-18,2000.
O. Epelly, J. Gondzio*, J.-P. Vial"Effects of Dynamic Scaling on the Efficiency ofInterior-Point Solver for Convex ProgrammingAPMOD2000 meeting, Brunei University, England,April 17-19,2000.* University of Edinburgh, UK** HEC-Geneva, University of Geneva
O. Epelly, J. Gondzio*, J.-P. Vial**Computational Experience with Solving Large-ScaleEconomic Problems by an Interior Point MethodISMP2000 meeting, Atlanta, USA, August 7-11, 2000.* University of Edinburgh, UK** HEC-Geneva, University of Geneva
T. GerberInvestigations on the soot reduction potential ofacetals in diffusion flamesIEA, XXII Task Leader Meeting, Stockholm, Sweden,August 7, 2000.
W.K. Graber, F. GassmannReal Time Risk Assessment for AtmosphericDispersion of Accidentially Released Air Pollutantsfrom Nuclear Power PlantsRisk Analysis 2000, Bologna, Italy, October 11-13,2000.
W.K. Graber, P. Schuhmacher*, M. FurgerAn Atmospheric Water Vapor Cycle Model forEvaluating Large-Scale Effects of Alpine Land UseChange on the Atmospheric Water CycleEnviroSoft 2000, Bilbao, Spain, June 27-29, 2000.* Geo-Partner AG, Zurich
L. GublerElektroden-Design fur CO-tolerante PolymerelektrolytBrennstoffzellenBunsentagung 2000, Wurzburg, Germany, June 1-3,2000.
L. GublerOperation of Polymer Electrolyte Fuel Cells withReformed Fuels6th AGS Day of Switzerland, ETH Zurich, June 30,2000.
L. GublerPolymer Electrolyte Fuel Cell Activities at the PaulScherrer InstitutEnvironment Office, Imperial College, London,October 17, 2000.
M. HahnDoppelschichtkondensatoren - Wege derSelbstentladungBunsentagung 2000, Wurzburg, Germany, June 1-3,2000.
S. HenningWolken am Jungfraujoch: welche Partikel werden zuWolkentropfen aktiviert?University of Bern, December 8, 2000.
F. Holzer, S. MullerElectrically Rechargeable Zn/O2-Batteries Tested atDriving Cycle Conditions198th ECS Meeting, Phoenix, USA, October 22-27,2000.
F. HolzerElectrically Rechargeable Zinc/Air Batteries (ELZA)Midterm Assessment Meeting, EU Project, Brussels,Belgium, April 6, 2000.
J. Huslage, T. Rager, J. Kiefer, L. Steuernagel,G.G. SchererDevelopment of Improved Membrane ElectrodeAssemblies based on the Radiation-Grafted PSI-Membrane197th Electrochemical Society Meeting, Toronto,Canada, June 2000.
W. HubschmidRelaxation Processes in Singlet O2 Analyzed byLaser-Induced GratingsInternational Quantum Electronic Conference 2000,Nice, France, September, 10-15.
A. InauenLiquid-Fuel/Air Premixing in Gas-Turbine Combustors:Experiment and Numerical SimulationERCOFTAC Annual Meeting, PSI Villigen, May 22,2000.
A. InauenHomogene GasverbrennungSVV-Jahrestagung, ETH Zurich, October 13, 2000.
M. Jaggi, R.T.W. SiegwolfS13C and 818O Ratios in Needles of Norway Spruce(Picea abies) as Affected by Environmental Conditionsin a Dry (1998) and a Wet (1999) Year2nd International conference on Applications of StableIsotope Techniques to Ecological Studies,Braunschweig, Germany, May 7-11, 2000.
J. Keller, S. Andreani-AksoyogluSensitivity of the Peak Ozone Mixing Ratio to Changesin NOx and VOC Emissions for Two MeteorologicalConditions in SwitzerlandAnnual Meeting of Competence Centers onAtmospheric Boundary Layer Turbulence andDiffusion, Lausanne, December 7, 2000.

149
J. Keller, S. Andreani-Aksoyoglu, N. Ritter,A.S.H. PrevotMeteorological Surface and Sounding Data: How doTheir Spatial Resolutions Alter the Modelled withSAIMM/UAM-V?4th GLOREAM Workshop, Cottbus, Germany,September 20-22, 2000.
J. Keller, S. Andreani-Aksoyoglu, N. Ritter,A.S.H. PrevotUnexpected Vertical Profiles Obtained by theSAIMM/UAM-V Air Quality Model Over ComplexTerrain4th GLOREAM Workshop, Cottbus, Germany,September 20-22, 2000.
M. KoebelNOx-Verminderung bei mobilen Dieselmotoren mittelsHarnstoff-SCRSVV-Jahrestagung, ETH Zurich, October 13, 2000.
M. KrausPromotion of Catalytic Processes by the Combinationof Heterogeneous Catalysts with a Dielectric-BarrierDischargeJahrestagung Schweiz. Phys. Gesellschaft, Montreux,March 16-17,2000.
R. KbtzA 24 V Bipolar Electrochemical Double-LayerCapacitor Based on Activated Glassy Carbon198th ECS Meeting, Phoenix, AR, October 22-27,2000.
S. KypreosEndogenous Technology Learning in Energy Models3rd Joint IEA-ETSAP/OECD Meeting, Paris, France,May 17-19, 2000.
S. KypreosSome Insights from the CHINA Regional Energy TradeModel, CRETMJoint CETP/IEA-ETSAP Seminar, ABB Dattwil,October 16, 2000.
T. Lang**, H.-M. Frey*, P. Beaud, M. Motzkus**High Resolution Specroscopy by fs-CARS in aMolecular Beam: Vibrational Anharmonicity, RotationalConstants and Isotope Shifts in Polyatomic MoleculesThe XVIIth International Conference on RamanSpectroscopy (ICORS 2000), Peking University,Beijing, China, August 20-25, 2000.* now Departement of Chemistry and
Biochemistry, University of Berne** Max Planck Institut fur Quantenoptik, Garching,
Germany
T. LippertPolymers Designed for Laser MicrostructuringE-MRS Meeting, Strasbourg, France, June 2000.
Ch. LudwigRecycling Zinc from Muncipal Soild WasteRecovery, Recycling, Re-integration, R'2000, June 5-9, Toronto, Canada, 1088-1093 (2000).
H. LutzOn-line Monitoring of Heavy Metal Evaporation UsingICP-OES22. Spektrometertagung, June 4-8, Interlaken, 2000.
J. MantzarasCatalytic Combustion of Methanol Air Mixtures overPlatinum: Homogeneous Ignition Distances in ChannelFlow Configurations28th International Symposium on Combustion,Edinburgh, UK, July 30 - August 4, 2000.
J. MantzarasHomogeneous Ignition in Channel Flow CatalyticCombustionERCOFTAC Annual Meeting, PSI Villigen, May 22,2000.
J. MantzarasCatalytically Stabilized Combustion of Methane-AirMixturesColloquium Thermo-Fluidynamics, ETH Zurich, June7, 2000.
J. Mantzaras, T. Griffin*Catalytic Combustion for Power GenerationSVV-Jahrestagung, ETH Zurich, October 13, 2000.* Alstom Power, Baden
A. Meier, P. Haueter, S. Kraupl, S. Moeller,R. Palumbo, A. SteinfeldSolar Thermal and Carbothermal Production of ZincRenewable Energy for the New Millenium, Sydney,Australia, March 8-10, 2000.
S. MullerInvestigation of the Kinetics and the Transport-phenomena at Perovskite-Activated Bifunctional AirElectrodes for Zinc-Air Batteries51st ISE Meeting Warschaw, Poland, September 3-8,2000.
S. MullerZinc-Air Technology: Combination of Mechanical andElectrical RechargeBunsentagung 2000, Wurzburg, Germany, June 1-3,2000.
E. NewsonThe Autothermal Partial Oxidation Kinetics ofMethanol to Produce HydrogenStudies in Surface Science and Catalysis 130, A.Corma, F.V. Melo, S. Mendioroz, J.L.G. Fierro,(Editors), Elsevier, 695-700, 2000.

150
E. NewsonHydrogen from Liquid Energy Carriers: The CatalyticReforming of Methanol and HydrocarbonsHYFORUM 2000, Proc. Vol II, Forum furZukunftsenergien (Ed), 351-358 (2000).
A.S.H. PrevotDiesel Aerosol Sampling in the AtmosphereWorkshop on Traffic Emissions, Roadway & TunnelStudies, Vienna, Austria, October 1-3, 2000.
A.S.H. PrevotNew Aspects of Vertical Exchange Between BoundaryLayer and Free TroposphereEUROTRAC-Symposium 2000, Garmisch-Parten-kirchen, Germany, March 27-31, 2000.
A.S.H. PrevotVOTALPII and CHAPOPTOR-2 EUROTRAC Workshop, Dubrovnik, Croatia,September 23-26, 2000.
R. RichnerComparison of Specific Power and Energy forDifferently Bond Carbonaceous Materials inSupercapacitors- 51 ISE Meeting, Warschaw, Poland, September
3-8, 2000,- Third International Conf. On Carbon Black,
Mulhouse, France, October 25-26, 2000.
H. Saathoff*, E. Weingartner, U. Kirchner**,O. Mohler*, K.-H. Naumann*The AID A Soot Aerosol Campaign in October 1999:Dynamics and Optical Properties of Pure and MixedAerosols (Solicited Paper)25th EGS General Assembly, Nice, France, April 25-29, 2000.* Forschungszentrum, Karlsruhe, Germany** FORD, Aachen, Germany
M. SaurerCanopy Gradients in 518O of Water Vapour, LeafWater and Organic Matter as Ecophysiological Tool2nd International Conference on Applications of StableIsotope Techniques to Ecological Studies,Braunschweig, Germany, May 7-11, 2000.
M. SaurerOxygen Isotopes as Climatic IndicatorsLTER Kolloquium, WSL Birmensdorf, July 7, 2000.
M. SaurerTemporal and Spatial Oxygen Isotope Variations inTree RingsMax-Planck-lnstitut fur Biogeochemie, Jena,Germany, November 29, 2000.
B. SchaffnerSolid Waste Treatment and Material Recycling in aHigh-Temperature Solar Reactor5th World Congress R'2000, Toronto, Canada, June 5-9, 2000.
T. Schildhauer, E. Newson, P. Mizsey, A. WokaunVerbesserung des Warmeubergangs in katalytischenFestbettreaktoren mittels strukturierter PackungenVortrag bei der Jahrestagung der GesellschaftVerfahrenstechnik und Chemieingenieurwesen (GVC)im Verein deutscher Ingenieure (VDI), Karlsruhe,Germany, September 20-22, 2000.Abstract: Chemie Ingenieur Technik 72, 9, 992, 2000.
B. SchnyderPerchlorate Ion Intercalation Process in HOPGInvestigated by SFM/LFM and XPSECOSS-19: European Conference on SurfaceScience Madrid, Spain, September 5-8, 2000.
R.T.W. SiegwolfS18O in Tree Rings of Abies Alba: The ClimaticSignificance of Inderdecal VariationsInternat. Conference on Dendrochronology for thethird Millenium, Mendoza, Argentina, April 2-7, 2000.
R.T.W. Siegwolf, M. SaurerJahrringe, Isotope und KlimaHerbstschule, PSI Villigen/Wurenlingen, Oktober 9-13,2000 and Oktober 16-20, 2000.
G. StrubEvaluation of Diurnal Hyperspectral BRF DataAcquired with the RSL Field Goniometer During theDAISEX'99 Campaign2nd EARSeL Workshop on Imaging Spectroscopy,Enschede, The Netherlands, July 11-13, 2000.
S. StuckiThermal Treatment of MSW - Can we Afford Recyclingat the End of the Pipe?Recovery, Recycling, Re-integration, R'2000, June 5-9, Toronto, Canada, 1237-1242 (2000).
M. SturzeneggerHigh-Temperature Chemical Reactivity Studies UnderConcentrated Solar Radiation10th ILJPAC Conference on High TemperatureMaterials Chemistry, Julich, Germany, April 10-14,2000.
M. SturzeneggerA Study of the Reactivity of Manganese Oxides withAlkali Hydroxide14th International Symposium on the Reactivity ofSolids, Budapest, Hungary, August 27-31, 2000.
M. SturzeneggerKinetic Investigations on the Reduction of ManganeseOxide and Iron Oxide at Temperatures Above 1850 K14th International Symposium on the Reactivity ofSolids, Budapest, Hungary, August 27-31, 2000.
M. SturzeneggerSustainable Production of Hydrogen WithConcentrated Sunlight - An Up-DateHyforum 2000, Munich, Germany, September 11-15,2000.

151
A.-P. Tzannis, S. Kunte*First Insights into Diesel Spray and CombustionProcesses in the High Temperature and HighPressure Cell at PSIERCOFTAC Annual Meeting, PSI, May 22, 2000.* ETH Zurich
E. Weingartner, V. Lavanchy*, H. Saathoff**,U. Schurath**, M. Schnaiter**, N. Streit,U. BaltenspergerHygroscopic Behavior of Soot Particles Coated withOxidation Products of Alpha-Pinene7th International Conference on CarbonaceousParticles in the Atmosphere, San Juan, Puerto Rico,November 26-29, 2000.* Universitat Bern** Forschungszentrum Karlsruhe, Germany
E. Weingartner, H. Saathoff*, M. Schnaiter*,V. Lavanchy**, N. Streit, U. BaltenspergerHygroscopic Properties of Fresh and Aged SootParticles25th EGS General Assembly, Nice, France, April 25-29, 2000.* Forschungszentrum Karlsruhe, Germany** Universitat Bern
M. Winter*, P. NovakSolvated and Unsolvated Lithium Intercalation intoGraphites1. ABBA Brno, Tschechien, August 28 - Sept.1, 2000.* Technical University of Graz, Austria
J. WocheleThermal Treatment: Potential for Solving the HeavyMetal Problem of Municipal Solid Waste in aSustainable WayWorld Congress of the International Solid WasteAssociation (ISWA), July 3-6, Paris, France (2000).
POSTERS
D. Alliata, R. Kostecki*, X. Song*, K. Kinoshita*,R. KotzElectrochemical/lnterfacial Studies of Carbon Films inNon-aqueous Electrolytes10th Int. Meeting on Lithium Batteries, Como, Italy,May 28-June 2, 2000.* Lawrence Berkeley Nat. Lab., Berkeley, CA, USA
D. Alliata, R. Kostecki*, X. Song*, K. Kinoshita*,R. KotzResistance Behavior of Carbon Films as AnodeMaterial for MicrobatteriesI.N.F. Meeting 2000, Genova, Italy, June 12-16, 2000.* Lawrence Berkeley Nat. Lab., Berkeley, CA, USA
I. AlxneitDissociative Adsorption of H2O2 at TiO2 Crystallites -An EHMO Study13th International Conference on PhotochemicalConversion and Storage of Solar Energy (IPS),Snowmass, CO, USA, July 30 - August 4, 2000.
S. Andreani-Aksoyoglu, J. KellerComparison of Model Results for Winter and SummerAir QualityGarmisch-Partenkirchen, EUROTRAC-2 Symposium2000, March 27-31, 2000.
S. Andreani-Aksoyoglu, J. KellerScenario Calculations for the Effects of a FutureEnergy System on the Air Quality in SwitzerlandPSI Villigen/Wurenlingen, Switzerland, EnergyTechnologies for a Sustainable Future, November 23-24, 2000.P. Beaud, T- Lang**, H.-M. Frey*, M. Motzkus**High Resoution Spectroscopy by fs-CARSFirst General Meeting of the ULTRA Programme,European Science Foundation, Coimbra, Portugal,October 22-24, 2000.* now Departement of Chemistry and Biochemistry,
University of Berne** Max Planck Institut fur Quantenoptik, Garching,
Germany
S. Biollaz, Ch. Onder*, Th. Nussbaumer*Measuring and Modelling the Gas Residence TimeDistribution in Biomass FurnacesProgress in Thermochemical Biomass Conversion(PITBC), Tyrol, Austria, September 17-22, 2000.* ETH Zurich
S. Biollaz, S. Stucki, M. SturzeneggerRedox Process for the Production of Clean Hydrogenfrom BiomassProgress in Thermochemical Biomass Conversion(PITBC), Tyrol, Austria, September 17-22, 2000.
S. Biollaz, R. Bunge*, M. Schaub**, H. Kunstler***PECK Technology: Better Quality of MSW IncineratorResidues at Lower CostEnergy Technologies for a Sustainable Future, PSI,November 23-24, 2000.* Eberhard Recycling AG, Kloten** CT Umwelttechnik AG, Winterthur*** Ktipat AG, Uitikon
B. Bitnar, D. Heger, J. A. Selvan, D. Griitzmacher,J. Gobrecht, W. Durisch, F. von RothSolar Cells for a TPV-System with a Selective Emitter16th European Photovoltaic Solar Energy Conferenceand Exhibition, Glasgow, UK, May 1-5, 2000.
B. Bitnar, W. Durisch, D. Griitzmacher, J.-C. Mayor,C. Miiller, F. von Roth, J.A. Selvan, H. Sigg,H.R. Tschudi, J. GobrechtA TPV System with Silicon Photocells and a SelectiveEmitter28th IEEE PV Specialists Conference, Anchorage,Alaska, USA, September 17-22, 2000.
B. Bitnar, G. Palfinger, W. Durisch, F. von Roth,J.-C. Mayor, D. Grutzmacher, H. Sigg, J. GobrechtA 160 W Electrical Power TPV GeneratorNationale Photovoltaiktagung, Universitat Neuenburg,November 7-8, 2000.

152
R. Bombach, W. Hubschmid, A. Inauen, I. Mantzaras,R. ScharenCatalytically Stabilized Hydrogen CombustorCharacterized by Simultaneous Raman and OHFluorescence Measurement28th International Symposium on Combustion,Edinburgh, July 30 - August 4, 2000.
HP. Brack*, J. Huslage, F.N. Buchi, G.G. SchererInvestigations of Long-term Performance andDegradation in Fuel Cell Tests of Perfluorinated Nafionand Radiation-Grafted MembranesILJPAC Symposium "Macromolecular Chemistry",Warsawa, Poland, July 2000.* now General Electric Plastics bv, Bergen op Zoom,
The Netherlands
F.N. Buchi, G.G. SchererMeasuring the Water Profile across a PEM Fuel CellMembraneBunsentagung, Wtirzburg, Germany, June1-3, 2000.
F.N. Buchi, J.F. Affolter*Project 2nd Generation Fuel Cell Boat: HYDROXY2000Fuel Cell 2000, Conference, Luzern, July 10-14, 2000.* Fachhochschule Yverdon
M. Coluccia, P. Novak, R. Nesper*Stable Mixed Metal Oxides for the High-Energy-Density Li-Ion-Battery2nd Int. Conference on Inorganic Materials, SantaBarbara, USA, P 21, 2000.* ETH Zurich
J. Dommen, A.S.H. Prevot, B. Neininger*, M. Baumle*Aircraft Measurements of the Urban Plume of MilanGarmisch-Partenkirchen, EUROTRAC-2 Symposium2000, March 27-31, 2000.* MetAir AG, Illnau
J. Dommen, A. S. H. Prevot, B. Neininger*,M. Baumle*Sensitivity of Ozone and Peroxide Formation in theLombardy Region, ItalySan Francisco, USA, American Geophysical UnionFall Meeting, December 15-19, 2000.* MetAir AG, Illnau
W. Durisch, B. Bitnar, J.-C. Mayor, J.-C. Panitz,F. von RothThermophotovoltaic Power Generation for ResidentialHeating Applications- Internationale Fachmesse fur Haustechnik, HILSA
2000, Zurich, April 11-14,2000- Gas, the Energy for the 21s t Century. International
Gas Union, Nice, France, June 6-9, 2000.
W. Durisch, P. Aebli*Economics of a Photovoltaic Electricity Supply Systemin a Small Remote Village in Southern JordanThe World Renewable Energy Congress-VI, Brighton,UK, July 1-7, 2000.* ETH, Zurich
W. Durisch, K. Robert*, J. Meier**Effect of Climatic Parameters on the Performance ofSilicon Thin Film Multi Junction Solar CellsGlobeEx 2000, Conference and Tradeshow, LasVegas, Nevada, USA, July 23-28, 2000.* Technical University of Lubeck, Germany** University of Neuenburg
W. Durisch, A. Gray*Application of the Generalised Model for Solar CellsUsing Real Condition MeasurementsGlobeEx 2000, Conference and Tradeshow, LasVegas, Nevada, USA, July 23-28, 2000.* University of Bristol, UK
W. Durisch, M. Leutwyler*Leistungsfahigkeit und spektrale Empfindlichkeit vonCu(ln, Ga)Se2-SolarmodulenNationale Photovoltaiktagung, Universitat Neuenburg,November 7-8, 2000.* ETH, Zurich
S. Eckhoff, I. Alxneit, M. Musella, H.R. TschudiDetermination of the Spectral Emittance in the VisibleSpectral Range at High Temperatures Supported byLaser Heating10th IUPAC Conference on High TemperatureMaterials Chemistry, Julich, Germany, April, 10-14,2000.
T. Frey, E. Steiner, D. Wuillemin, M. SturzeneggerInvestigations on the Solar Thermal Reduction ofManganese Oxide10th SolarPACES Int. Symp. on Solar Thermal Cone.Technologies: Solar Thermal 2000, Sidney, Australia,March 8-10, 2000.
K. Geissler, E. Newson, F. Vogel, T. Truong,P. Hottinger, A. WokaunAutothermal Methanol Reforming for HydrogenProduction in Fuel Cell ApplicationsBunsentagung, Wtirzburg, Germany, June 1-3. 2000.
W.K. Graber, E. Limpert*Life is Log-Normal, Evidence in Atmospheric ScienceETH Zurich, Int. Transdisciplinary Conference,February 27 - March 1, 2000.* ETH Zurich
T. Gradinger, A. Inauen, R. Bombach, B. Kappeli,W. Hubschmid, K. BoulouchosLiquid-Fuel/Air Premixing in Gas-Turbine Combustors:Experiment and Numerical Simulation28th International Symposium on Combustion,Edinburgh, July 30 - August 4, 2000.
O. Haas, F. Holzer, J. McBreen*, X. Sun*, X .Q. YangEXAFS Investigation of La0.6Ca0.4CoO3 PerovskiteCatalyst in Bifunctional Oxygen Electrodes220th Nat. ACS Meeting, Abstracts, Washington DC,USA, August 20-24, 2000.
153
B. Hemmerling, A. Stampanoni, E.F. McCormackObservation of Hyperfine-Structure Quantum Beats inDouble-Resonance Polarisation Spectroscopy ofNOA2?v'=0ECW International Conference on Nonlinear LightScattering Spectroscopy, Moscow, 2000.
F. Joho, B. Rykart, A. Blome, P. Novak, M.E. Spahr*Relation Between Surface Properties and First-CycleIrreversible Charge Loss of Graphite Electrodes forLithium-Ion Batteries10th Int. Meeting on Lithium Batteries, Como, Italy,May 28 - June 2, 2000.* TIMCAL Group, Bodio
T. Kallis*, J.-F. Drillet*, S. Muller, V. M. Schmidt*Einfluss von CO2 auf das Langzeitverhalten derSauerstoffelektrode in einer wiederaufladbarenZink/Luft-BatterieBunsentagung, Wtirzburg, Germany, Juni 1-3 2000.* Institut fur Umwelttechnik, Fachhochschule Mann-
heim, Germany
J. Keller, S. Andreani-Aksoyoglu, N. Ritter,A.S.H. Prevot, J. DommenWind and Vertical Turbulent Exchange OverSwitzerland and Their Influence on Short-Term AirQuality. Simulations with SAIMM and UAM-VGarmisch-Partenkirchen, EUROTRAC-2 Symposium2000, March 27-31, 2000.
M. Koebel, M. Elsener, G. Madia, J. DespresExhaust Gas Aftertreatment for Future Diesel EnginesEnergy Technologies for a Sustainable Future. PSI,November 23-24, 2000.
A.P. Kouzov*, P.P. RadiCollision-Induced Resonances in Two-Color Four-Wave MixingXIX European CARS Workshop, Moscow, Russia,March 20-23, 2000.* Saint Petersburg University, Russia
D.N. Kozlov, B. Hemmerling, A. StampanoniFlow Velocity and Temperature Measurements UsingLaser-Induced Electrostrictive GratingsECW International Conference on Nonlinear LightScattering Spectroscopy, Moscow, 2000.
S. Kraupl, M. Brack, P. Haberling, M. Keunecke,A. Meier, R. Palumbo, C. Wieckert, D. Wuillemin,A. SteinfeldSolar Thermal and Carbothermal Production of Zinc -Solar Furnace ExperimentationEnergy Technologies for a Sustainable Future, PSI,November 23-24, 2000.
S. Kunte*, A.-P. Tzannis, T. Gerber, K. BoulouchosVisualization of Diesel Spray and Combustion Processin the High Temperature, High Pressure Cell at PSI3rd Symposium Towards Clean Diesel Engines, Rueil-Malmaison/Paris, June 15-16, 2000.* ETH Zurich
M. Lanz, F. Joho, M. Coluccia, J.-C. Panitz, D. Alliata,P. NovakDevelopment of Advanced Lithium-Ion BatteriesEnergy Technologies for a Sustainable Future, PSI,November 23-24, 2000.
T. Lippert, J. Wei, A. Wokaun, N. Hoogen*,O. Nuyken*Ultrasensitive Polymers for Laser AblationPCPM 2000, 3rd Int. Symp. on Photoreaction Control,Tsukuba, Japan, March 2000.* Techn. University of Munich, Garching, Germany
T. Lippert, J. Wei, A. Wokaun, N. Hoogen*,O. Nuyken*Polymers Designed for Laser MicrostructuringGordon Conference, Andover, NH, USA, June 2000.* Tech. University of Munich, Garching, Germany
H. Lutz, J. Wochele, Ch. Ludwig, A.J. Schuler,S. StuckiChlorine - A Key-Player in Hazardous WasteTreatment - Now Monitored On-lineEnergy Technologies for a Sustainable Future, PSI,Villigen, November 23-24, 2000.
J.-C. Mayor, W. DurischApplication of a Generalized Model for the ElectricalCharacterisation of a Commercial Solar CellWorld Renewable Energy Congress VI, WREC 2000,Brighton, UK, July 1-7, 2000.
B. Neininger*, M. Lehning**, M. Baumle*, W. Fuchs*,A. Volz-Thomas***, H. W. Patz***, S. Konrad***,J. Dommen, A.S.H. PrevotAirborne Measurements and Mass Budgets of TraceGases During the Berlioz CampaignBonn, Germany, TFS-Abschlussseminar, June 28,2000.* MetAir AG, Illnau** Swiss Federal Institut for Snow and Avalanche
Research, Davos, Switzerland*** Institut fur Chemie und Dynamik der Geosphare,
Forschungszentrum Julich, Germany
E. Newson, F. Vogel, T.B. Truong, K. Geissler,T. SchildhauerCatalysis, Reaction Engineering and SystemsAnalysis to Produce Hydrogen from Liquid EnergyCarriers by Partial OxidationEnergy Technologies for a Sustainable Future, PSI,Villigen, November 23-24, 2000.
P. Novak, J.-C. PanitzRaman Microscopy as a Quality Control Tool forElectrodes of Lithium-Ion Batteries10th Int. Meeting on Lithium Batteries, Como, Italy,May 28-Juni 2, 2000.
J.-C. Panitz, P. Novak, O. HaasVibrational Spectroscopy as a Characterization Toolfor Materials Used in Lithium BatteriesBunsentagung 2000, Wurzburg, Germany, Juni 1-3,2000.

154
U.A. Paulus, Z. Veziridis*, E. Deiss, O. Haas,A. Wokaun, G.G. SchererInvestigation of Catalyst Utilization at the ElectrodeSolid Polymer Electrolyte Interface using ModelElectrodesECS Fall Meeting, Phoenix, AR, October 22-27, 2000.* Volkswagen AG, Wolfsburg, Germany
The PSI Fuel Cell GroupPolymer Electrolyte Fuel Cells at the Paul ScherrerInstitutEnergy Technologies for a Sustainable Future, PSI,November 23-24, 2000.
N. Ritter, S. Andreani-Aksoyoglu, J. Keller,A.S.H. Prevot, J. DommenModelling with UAM-V: Influence of Different BoundaryConcentrations on the Ozone Formation inSwitzerlandGarmisch-Partenkirchen, Germany, EUROTRAC-2Symposium 2000, March 27-31, 2000.
M. Saurer, P. Cherubini*, R.T.W. SiegwolfOxygen Isotopes in Tree Rings of Abies Alba at aSwiss LTER Site: The Climatic Significance ofInterdecadal VariationsSnowbird, Utah, USA, All Scientists MeetingInternational Long Term Ecological Research (LTER),August 2-5, 2000.* WSL Birmensdorf
B. Schaffner, W. Hoffelner*, H. Sun*, A. SteinfeldSolar Thermal Processing of Hazardous WasteMaterialsRenewable Energy for the New Millenium, Sydney,March 8-10, 2000.* MGC-Plasma AG, Muttenz
B. Schaffner, A. Meier, D. Wuillemin, W. Hoffelner*,A. SteinfeldSolar Thermal Recycling of Solid Waste MaterialsEnergy Technologies for a Sustainable Future, PSI,November 23-24, 2000.* RWH Consult GmbH, Oberrohrdorf AG
B. Schnyder, D. Alliata, R. Kbtz, H. Siegenthaler*Perchlorate Ion Intercalation Process in HOPGInvestigated by SPM/LFM and XPSECOSS-19: European Conference on SurfaceScience, Madrid, Spain, September 5-8, 2000.* University of Bern
B. Schnyder, D. Alliata, R. Kbtz, H. Siegenthaler*Intercalation Process of Perchlorate Ions in HOPG: ASPM and XPS Study18th General Conference of the Condensed MatterDivision of the European Physical Society (CDM-18)Montreux, March 13-17, 2000.* Univesity of Bern
L. Sesana*, M. Milesi*, S. Begnini*, U. Facchini*,J. Dommen, A. S. H. Prevot, B. Alicke**, J. Quaglia***,J. Balin***, G. Lanzani****, C. Bosio*****Radon and Pollutants in the Milan Area, May and June1998, the Pipapo CampaignGarmisch-Partenkirchen, Germany, EUROTRAC-Symposium 2000, March 27-31, 2000.* University of Milan, Italy
University of Heidelberg, Germany*** EPFL, Lausanne**** Assessorato Ambiente Como, Italy***** Presidio Multizonale Igiene e Prevenzione, Pavia,
Italy
A. Stampanoni, B. Hemmerling, C. Appel,J. MantzarasCARS Temperature Measurements in CatalyticallyStabilized Channel-Flow combustionECW International Conference on Nonlinear LightScattering Spectroscopy, Moscow, Russia, 2000.
N. Streit, E. Weingartner, U. Baltensperger,H.W. GaggelerPhysical Parameters for Chemical Characterization:Linking Hygroscopicity and VolatilityGarmisch-Partenkirchen, Germany, EUROTRAC-2Symposium 2000, March 27-31, 2000.
S. Stucki, S. Biollaz, M. SturzeneggerRedox Process for the Production of Clean Hydrogenfrom BiomassEnergy Technologies for a Sustainable Future, PSI,November 23-24, 2000.
H.R. Tschudi, Ch. MullerPyrometric Temperature Measurements in the SolarFurnace10th SolarPACES Int. Symp. on Solar Thermal Cone.Technologies: Solar Thermal 2000, Sidney.Australia,March 8-10, 2000.
H.R. Tschudi, Ch. MullerPyrometric Temperature Measurements in thePresence of External Radiation10th IUPAC Conference on High TemperatureMaterials Chemistry, Julich, Germany, April 10-14,2000.
G.H. Wrodnigg*, P. Novak, J.O. Besenhard*,M. Winter*Investigation of Solvated and Unsolvated LithiumIntercalation Processes Into Graphitic Carbons byElectrochemical Dilatometry10th Int. Meeting on Lithium Batteries, Como, Italy,May 28-June 2, 2000.* Institute for Chemical Technology of Inorganic
Materials, Graz University of Technology, Graz,Austria

155
PATENT APPLICATIONS
S. Biollaz, R. Bunge*, M. Schaut»**, H. Künstler***Verfahren zur Aufbereitung von schwermetallhaltigenSekundärrohstoffen in brennbarem VerbundSchweizerische Patentanmeldung Nr. 00 140/00,January 25, 2000.* Eberhard Recycling AG, Kloten** CT Umwelttechnik AG, Winterthur*** Küpat AG, Uitikon
CONFERENCES, WORKSHOPS & EXHIBITIONS
B. Andreaus, A.B. Geiger, L. GublerNachhaltige Energie und BrennstoffzellenPSI-Herbstschule, Villigen, October 11-18, 2000.
W. Durisch, J.-C. Mayor, F. von RothThermophotovoltaik-DemonstrationInternationale Fachmesse für Haustechnik, HILSA2000, Zürich, April 11-14,2000.
W. Durisch, J.-C. Mayor, F. von RothThermophotovoltaik-DemonstrationWeltgaskonferenz, Nizza, France, June 6-9, 2000.
W. Hubschmid„Measuring Techniques" and „Combustion andPollutant Formation"Ercoftac Joint Annual Meeting of the Leonhard EulerCompetence Centres, PSI Villigen, May 22, 2000.
Ch. Ludwig, S. Stucki, M. Wimmer*Directing Material Fluxes - Research Challenges forIntegrated Resources ManagementOrganization of the Workshop at the R'2000Conference, June 9, Toronto, Canada, 2000.* BayFORREST, Bavaria, Germany
H. LutzPh.D. Student Congress, ZOeK, ETH Zürich,November 15, 2000Member of the Organization Commitee
S. Stucki2nd Sino-Swiss Workshop on Solid WasteManagement and TechnologyETH Zürich, PSI Villigen, June 19-23 2000
S. StuckiAbschlusstagung IP AbfallPSI Villigen, January 26, 2000.
Ch. WieckertSolar ZincTabletop Exhibit at Lead-Zinc 2000 Symposium and4th Int. Symp. On Recycling of Metals and EngineeredMaterials, Pittsburgh, USA, October 22-25, 2000.
A. Wokaun, U. Baltensperger, K. Boulouchos,O. Haas, R. Palumbo, G.G. Scherer, R. Siegwolf,S. StuckiEnergy Technologies for a Sustainable FuturePSI, November 23-24, 2000.
MEMBERSHIPS IN EXTERNAL COMMITTEES
S. Andreani-AksoyogluAir Pollution 2000Member, International Scientific Advisory Committee
S. Andreani-AksoyogluAir Quality Management SymposiumMember, Scientific Advisory Committee
U. BaltenspergerBMBF Förderschwerpunkt Aerosolforschung,GermanyExpert
U. BaltenspergerCenter of Excellence in Analytical Chemistry, ETHZürichBoard of Directors
U. BaltenspergerGesellschaft für AerosolforschungSecretary General
U. BaltenspergerJournal of Aerosol ScienceEditorial Board
U. BaltenspergerScientific Advisory Group for Aerosol Within GlobalAtmosphere WatchChairman
U. BaltenspergerSwiss committee of Global Atmosphere WatchMember
W. DurischPrüfungskommission für die Lehrlinge desLaborantenberufes des Kantons ZürichFachexperte
W. DurischInternational Energy Foundation, IEFAdvisory Committee Member and Under SecretaryScience and Technology
W. DurischSwiss Society of Engineers and Architects (SIA)Fachgruppe für Verfahren- und Chemieingenieur-Technik (FVC)Delegate

156
W. DurischUNESCO, World Renewable Energy CongressSteering Committee Member
M. FurgerMeteorologische ZeitschriftEditorial Board
F. GassmannInstitute for Global Environmental Issues (IGEI),Wellfleet (MA), USABoard of Directors
F. GassmannInternational Lenkungsausschuss des trinationalenProjektes REKLIP, D-F-CHMember
F. GassmannMaturakommission fur die Kantonsschulen Baden undWohlenExperte fur Mathematik und Physik
F. GassmannNaturforschende Gesellschaft in ZurichPresident of editing committee of Vierteljahrsschrift,Neujahrsblatt and treasurer
F. GassmannNaturama, AarauMember of Verwaltungsrat
T. GerberTowards Clean Diesel EnginesSteering Committee
T. GerberIEA Implementing Agreement on Energy Conservationand Emissions Reduction in CombustionTask Leader
T. GerberERCOFTACScientific Committee
W.K. GraberKommission fur Klima und Atmospharenforschung(CCA) der Schweizerischen Akademie derWissenschaften (SANW)Vice president
O. HaasComite dEvaluation de I'lnstitut de Topologie et deDynamique des Systemes (ITODYS)Member
O. HaasJournal of New Materials for Electrochemical SystemsAdvisory Board
R. KotzInternational Society of Electrochemistry ISEDivision Officer Electrochemical Energy Technology
T. LippertNanophotonics for the 21si Century1s t Students Inter. Symposium on AdvancedEngineering, Osaka, Japan, December 7-10, 2000.Member of Organizing Committee
Ch. Ludwig, S. StuckiR'2002 (Recovery, Recycling, Re-integration)CongressMember of the Scientific Panel
G.G. SchererNeuartige Schichtstrukturen fur BrennstoffzellenDeutsche Forschungsgemeinschaft, Mitglied derPriifungsgruppe fur das Schwerpunktprogramm
G.G. SchererEuropean Fuel Cell ForumInternational Board of Advisors
G.G. SchererHandbook of Fuel Cell TechnologyEds. H. Gasteiger, A. Lamm, W. Vielstich, J. Wiley &Sons Ltd., Int. Advisory Board
A. SteinfeldEnergy—The International JournalAssociate Editor
A. SteinfeldASME - Journal of Solar Energy EngineeringAssociate Editor
A. SteinfeldInternational Energy Agency Solar PACESOperating Agent
A. SteinfeldThe Michael Visiting Professorship at the Departmentof Environmental Sciences and Energy Research ofthe Weizmann Institute of Sciences, Israel (2000).
S. StuckiPriority Programme Environment, SNFCoordinator of Integrated Project Waste
S. StuckiTVA-Revision im Bereich derVerbrennungsruckstandeMitglied der Expertengruppe des BUWAL
P.TalknerInternational Scientific Committee of the XXIVInternational School of Theoretical Physics, Ustron,Poland

157
A. WokaunDeutsche Bunsen-Gesellschaft für PhysikalischeChemieMitglied des Ständigen Ausschusses
A. WokaunStrategie Nachhaltigkeit des ETH-RatesMitglied des Leitungsausschusses
A. WokaunForum für Wissenschaft und Energie (FWE)Vorstandsmitglied
AWARD
F. Holzer, S. Müller, HJ.Pauling*Venture 2000, Companies for TomorrowAuszeichnung der Geschäftsidee chemTEK, GmbH,Germany
P. TalknerTitularprofessor für Theoretische Physik an derPhilosophisch-Naturwissenschaftlichen Fakultät derUniversität Basel