- x No. 24 - OSTI.GOV
155
NIRS-M-117 ISSN 1343-0769 NIRS-M--117 JP9809030 -x No. 24 x U
-
Upload
khangminh22 -
Category
Documents
-
view
1 -
download
0
Transcript of - x No. 24 - OSTI.GOV

NIRS-M-117ISSN 1343-0769
NIRS-M--117
JP9809030
- x No. 24
x U

No. 24
:<u
rtlK I E *!1§7C ,"S>^

Evaluation of Effects from Radiation Exposureon the Society
— Lessons from the Chernobyl Accident —
Proceedings ofThe Twenty-fourth National Institute of
Radiological SciencesSeminar on Environmental Research
Chiba, December 5 - 6 , 1996
Edited byM. Uchiyama
&K. Fujimoto
March 1997
National Institute of Radiological SciencesChiba, Japan

U
<<oft£mmm_i -0 , 6
i»«< I, U ^VU&O2B

U
u26
35
I*I m IE st.ft—n
1 - 1 $S£H F*3 111 IE ^
2 - 2 * - 5 y F S ® # A i 3 - KSlOflRffi it S £ H
3. 3~y.)VJ ~7 4 U V&^i t > ^ ^ — j \ - \ S: B3 ?n * 70
4 , Jz%fi$k(D#:£tf}¥^ Pi ± IE # 108
42

2. tt£-bW£#)tiAfrb ^ Jll % =$• 121
H ffl M. 128
t& H M ^ 132
140
143
144

Contents
Editorial Note
List of Chairpersons
List of Contributors
SESSION I International Conference One decade after Chernobyl: Summing up the consequences
of the Accident
1. General and thyroid diseases
1 - 1 Outline of the IAEA International Conference titled ONE DECADE
AFTER CHERNOBYL M. Uchiyama
1 — 2 Health Consequences of the Chernobyl Accident: Thyroid Diseases S. Nagataki
2 . Social impact of the Chernobyl accident
2 — 1 Radioactivity Monitoring and Import Regulation of the Contaminated Foodstuffs
in Japan following the Chernobyl Nuclear Power Plant Accident Y. Izumo
2 — 2 Administration of Stable Iodine to the Japanese in Poland at the time of
Czernobyl Accident Y. Tateno
2 — 3 International cooperation Mass screening M. Hoshi
SPECIAL LECTURE I
The Mental Health State of Atomic Bomb Survivors Y. Nakane
SESSION H Lessons learned from the Chernobyl accident
1 . Current features on risk perception and risk communication of radiation T. Kusama
2 . The Initial Medical Activities at the Accident A. Akanuma
3 . Learned from Chernobyl Accident - Intervention H. Yasuda

SESSION III Social consequences by differences in risk perceptions
1 . Influence of Radiation Exposure on Our Society and Epidemiological Study
Y. Yoshimoto
2. Some points of issue on risk assessment for radiation protection H. Yonehara
3 . Social Effects of the Tokyo Photochemical Smog and Occupational
Lead Poisoning S. Araki
4 . Social Impact by Air Pollution M. Murakami
SESSION F Risk Communication
1 . The Influence of Knowledge on Risk Perception R. Kanda
2 . Risk Communication — A Social Psychological Perspective T. Kikkawa
SPECIAL LECTURE El
Social Impact of Accidents I. Kuroda
SPECIAL LECTURE F
Estimation of Health Risks and About What we should Discuss Now
J. Matsubara
GENERAL DISCUSSION

List of Chairpersons
2 . i f
3 . n m -
4 .
5.
6. , 2 € A
7. 3 , 4
8.
9. mtmrnrn # si s
io.
11. 04 IE

List of Contributors
uU IE ife
tti
•*•
m
IE m m
^ n W-
/It
± IE
JII
15

7V U
1 .
rt UJ IE
Outline of the IAEA International Conference titled ONE DECADE AFTER
CHERNOBYL : Summing up the Consequences of the Accident
Masafumi Uchiyama
Division of Human Radiation Environment,
National Institute of Radiological Sciences
4 - 9 - 1 Anagawa, Inage-ku, Chiba-shi 263, Japan
ABSTRACT-In April 1996 in Vienna, Austria an international conference organized by the
European Commission, the International Atomic Energy and the World Health Organization
was held to sum up the consequences of the Chernobyl accident. The following is a overview.
1. There are three significantly important groups to be studied. The first is the 200,000 or so
emergency and recovery workers that worked there from 1986 to 1987. The second is the
115,000 evacuees moved from April 27 to the middle of August 1986. The third is 150,000
individuals with thyroid doses confirmed by direct external measurements. Medical follow up
studies are necessary to continue monitoring the heavily affected population.
2 . 137 emergency workers were diagnosed with acute radiation sickness. There were 28
victims in the first three months. Over 800 children were confirmed to have thyroid cancers.
There were 3 victims. No significant increase was observed in the number of cancers
including leukemia. Non-specific health effects increased among the recovery workers.
3 . In general the implemented countermeasures were effective for mitigating internal dose
but less effective for the external dose.
4 . The change in demographic composition and the implementation of food controls
resulted in serious social effects to the heavily aaffected areas. The accident had negative
effects on social activities through malignant social, economic and political changes.
Incomolete and distorted information on the consequences of accident and the mitigation
measures made situation more complicated.
5 . Psychological effects appeared in the public and caused serious health disorders. Many
factors continue to have significant health effects.
- 1 -

6 . Negative psychological and economic impact may exceed the net benefit if further
countermeasures are taken in many of the affected areas. All political implications should be
considered when deciding future countermeasures. The mitigation of psychological impacts
must be also studied.
7 . Symptoms of anxiety and related mental stress appear to be among the most notable
legacies of the accident. 20 May 1996.
1996 ^ 4 ^ jC IAEA, WHO, ECCfcS £ U * & 10
8 ffi«
I H
1 .
mmt t - a i m i # 2 x ioi8Bq -c- 50 ~ 60 %,134Cs # 0.6 x 10¹⁸BqN
137Cs # 0.09 x 10¹⁸Bq
20 ~ 30 %\z.
2 .
4,600km2, 16,500km2, 8,100km2
4,300km2 f C ^ o f V ^
i37cs
11 75 6 1986 27
3 .
tmwnmt
- 2 -

1986 ~ 1987 zm 20
l i ^ f e 60 ^ e> 80
(2) 1 9 8 6 ^ 4 J3 27 B £ ^
lOOmSv fcLkKlfttf < L/c
(3)
s, 1986
^ 20 ~
2056 ^*"C 70 ^
, 185 ~ 555kBq/m2
i 555 ~ 1480kBq/m2
5 ~ 20mSv
4 .
(2)
1995 0 ~ 15
400
800
(3)
(4) L/co
5 .
Codex Alimen-
tarius levels
<
1990 1995
3 -

6.
j iU±o^"-C^&l
1995 billion dollars
H I Privarte subsidary , -HB * ' small holdings
•
fSiHB , , Basic production andgHHim ' working funds
y ' '-. -•: S . . •T *
' fc 1 , '
Bi|ffil|WffHHBBBBBHHHHBHBH
*i ' * • i *
'f '.''.*; ;"'."':,vV;
' . ' " * ; . ; ; ' • ' ' » V f *
H B gross outputBSproductton
• •
.-' •-. • ' '. ' :' •« ' , . • • ,
' I f v . * «' ' "' ''••"'^ - ' • • ' - , - , '
:%•: •'""•,•",>•.-. iv' •
f r o m . <,.'>'% \ --, ,,',
i, W . . . *- • • -, - „
10 124 6 8
Billion dollars
Fig. 1 Effects on agricultural production (Belarus, 1995)
14 16
c t
7. *
- 4 -
90
80
70
60
50
40
30
20
10
0
m•Hn81IIIILflL
eada
ch
X
pres
sio
• n
1
-e t
hroa
oCO
,'
t J' .
-•"m i
-lair
los
1ILJI
rhoe
a o
Dia
r
LJ
stip
atio
con
-
• nm-M 1c
ight
gai
o
, , . , . , ,
• Contaminated• Control• All
LJLl
ight
los
enst
rua
egul
arit
rr•jj
sebl
eed
oZ
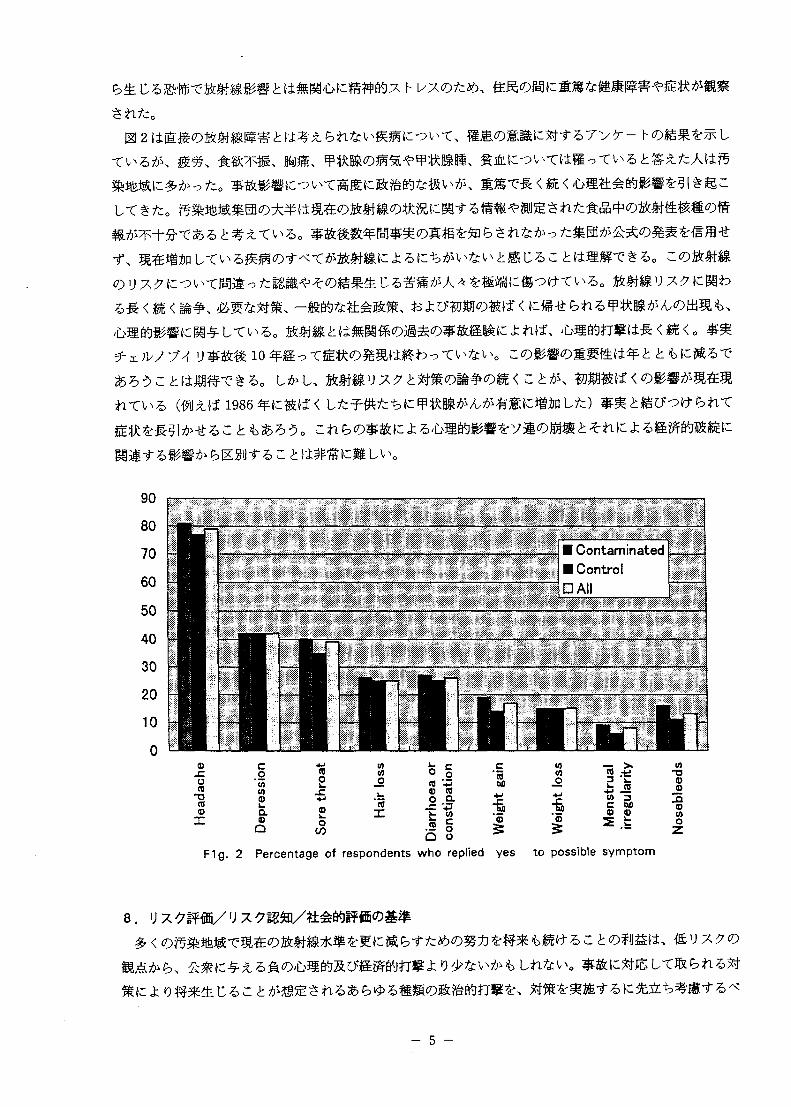
Fig. 2 Percentage of respondents who replied yes to possible symptom
8.
- 5 -

10.
11.
1991 ic IAEA
12. m
- 6 -

RBMK
W^,m <• C <
13.
700 x 1015Bq
14.
Zfr dn d t
1986
- 7 -

^ 39(8), 81-290(1996).
2) ftfflfcifc: B * H ^ ^ ^ ^ E 3 8 594-596 (1996)
3) rtUUIE^ : K # t ^ ^ ^ 39(8)358-359(1996)
4) Conference Proceedings 'One Decade After Cheraobyl: Summing Up the Consequences' Vienna, 8-12
April 1996 IAEA, Vieena.

Health Consequences of the Chernobyl Accident: Thyroid Diseases
Shigenobu Nagataki, Kiyoto Ashizawa
The First Department of Internal Medicine,
Nagasaki University School of Medicine
1-7-1 Skakamoto, Nagasaki, 852 Japan
ABSTRACT-An International Conference entitled "One decade after Chernobyl: Summing
up the consequences of the accident" was held at the Vienna from 8 to 12 April 1996.
The aim of conference was to seek a common and conclusive understanding of the nature and
magnitude of the consequences of the Chernobyl accident. It was concluded that a highly sig-
nificant increase in the incidence of thyroid cancer among those persons in the affected areas
who were children in 1986 is the only clear evidence to date of a public health impact of radi-
ation exposure as a result of the Chernobyl accident and both temporal and geographical dis-
tributions clearly indicate a relationship of the increase in incidence to radiation exposure due
to the Chernobyl accident.
To clarify the relationship between thyroid cancer and radioactive fallout more clearly, a
long term prospective study (case - control/cohort) should be conducted in the highly risk
groups and the analysis of accurate estimation of exposure dose to external and/or internal
radiation is needed.
- x. )\sJ74 U l J ^ ^ m i ^ & ^ f b 10 4£g ^ 1 9 9 6 ^ 4 nVL\t, U t l i ^ f tKH (WHO), 3 - D ,
& (EC), mm&J-Mm (IAEA)
- 9 -

I .
1.
, -a If 400 A U ± #
bo 1995 4%-t.X-K 15
{±, 1991^ 5 Jlfrib,
u - -It,
%X\ # C n
-X-tfo 20,000
e * (^r^ 100 ^ A t - 0.2 - 5 A )
ft 100 fgw
2.
0 ~ 3:
7 V U
IBVat 3 l t 800
10
i \ i i i i i i86 87 88 89 90 91 92 93 94 95
(GomelifeE)
^ 15 75
1 2 3 4 5 6 7 8 9 &)
- 1 0 -

(4.5%)
I) J ^
TV^S12)O C
Stage
, 1995^tT'Cd^T*i±, 3 AftfPttBi&XVyZt: Ltzfollow up X' 26 A4"fc>-f*» 1 «A^5Et L
papillary carcinoma (&Slffi) T * * 0 , T4bN1M0%
Slfi < , 8 l r t C l f f f i # ^ ^ t T V ^ c o ^^ttfic-g-ff- 21Gy
&i> Adjuvant therapy
^f5^: 132
65
I
case-control study
Te-132
95 %
(1-131)
1-132
v h D-;1/<T) ,h
15)16)
-137
\ o 4 <
- 11

U 7.
1. j^HoiA :«S
3 - F -131,3 - F -B :
3 - F -131,
d : jfiLjfc,D :
Cohort, Case-control studies,
C : Ej3:tflgffij
a :
b :
2 .
3.
, 3 - F - i z i-T4. Vit D, Ca
A : 3-K
' U - —
1) K. Ashizawa, S. Yamashita, and S. Nagataki: Ada Medica Nagasakiensia, 41 (1-2), 1-7 (1996).
2) V. S. Kazakov, E. P. Demidchik, L. N. Astakhova: Afe/wre, 359, 21 (1992).
3 ) E. P. Demidchik, I. M. Dorbyshevskaya, E. D. Cherstvoy et al.: In: Karaoglou A, Desmet G, Kelly
GN and Menzel HG eds The radiological consequences of the Chernobyl accident, Luxembourg, 677 - 682
(1996).
4) N. Tronko, T. Bogdanova, I. Komissarenko et al.: In: Karaoglou A, Desmet G, Kelly GN and Menzel
HG eds The radiological consequences of the Chernobyl accident, Luxembourg, 683-690 (1996).
5) L A . Likhtarev, N. D. Tronko, V. B. Beral et al. Nature, 375, 365 (1995).
6) A. F. Tsyb, E. M. Parshkov, V. V. Shakhtarin et al.: In: Karaoglou A, Desmet G, Kelly GN and
Menzel HG eds The radiological consequences of the Chernobyl accident, Luxembourg, 691-697 (1996).
7) S. Yamashita, H. Namba, M. Ito, et al.: In: Nagasaki symposium on Chernobyl update and future.
Amsterdam, 63-72 (1994).
8) S. Nagataki, K. Ashizawa: In: Karaoglou A, Desmet G, Kelly GN and Menzel HG eds The radiological
consequences of the Chernobyl accident, Luxembourg, 749 - 754 (1995).
9 ) S. Yamashita, M. Ito, H. Namba et al.: In: Nagataki S, Yamashita S eds Nagasaki symposium
- 12

Radiation and human health: Proposal from Nagasaki, Tokyo, 103-116 (1996).
10) M. Ito, S. Yamashita, K. Ashizawa et al.: Thyroid, 5(5), 365-368 (1995).
11) G. N. Souchkevitch, A. F. Tsyb eds Health consequences of the Chernobyl accident, Geneva, 294 (1996)
12) nm'MA • &MJEW- • fi^^ffi : ft0tE^£$tfL 71, 234-236 (1996)
13) L. V. Middlesworth: In: J. Robbins eds Treatment of thyroid cancer in childhood, DOE/EH-406, 103-
108 (1993).
14) M. Ito, S. Yamashita, K. Ashizawa et al.: Int. J. Cancer, 65, 29-33 (1996).
15) B. Dorothy: The Lancet, 347, 1176 (1996).
16) L. Fugazzola, S. Pilotti, A. Pinchera et al.: Cancer Res., 55, 5617-5620 (1995).
17) D. Williams: Nature, 371, 556 (1994).
18) J. Nauman, J. Wolff: The American Journal of Medicine, 94, 524-532 (1993).
- 1 3

'+»•+•++••+••+ «•*«
2.2 -1 Appfl)M$J
t-U
Radioactivity Monitoring and Import Regulation of the Contaminated Foodstuffs
in Japan following the Chernobly Nuclear Power Plant Accident
Yoshiro IZUMO
Depertment of Radiological Health, National Institute of Public Health,
6 - 1 , Shirokanedai 4 chome, Minato-ku, Tokyo, 108 Japan.
ABSTRACT-Radioactivity monitoring and import regulation of the contaminated foodstuffs
executed by Minstry of Health and Welfare following the Chernobyl nuclear plant accident
were reviewed as follows; © . background of socio-psychological effects and environmental
radioactivity leading to the regulation (to may 3, 1986); (2). intial intervention for imported
foodstuffs in Japan (may 8, '86), and ® . in european countries (to may 31, '86), immediately
after the Accident, respectively; © . determination of the interim drived intervention level for
radionuclides in imported foodstuffs ([134Cs+ 137Cs]: 370Bq/Kg) and activation of the
monitoring, (5) • outline of the monitoring with elapsed time, number of foodstuffs monitored,
number of foodstuffs exceeded radioactivity of the intervention level and re-exported; (6).
guideline in international trade of radioactive contaminated foodstuffs adopted by CODEX
Alimentarius Commission (FAO/WHO) and the intervention level recommended by ICRP
following the Accident;©, discussion for problems and scopes in future based on the results
of monitoring.
As the results, a number of imported foodstuffs (about 75,000 samples at present) has been
monitored, 55 samples exceeding the interim intervention level were re-exported to each
export's country, and socio-psychological douts for radioactive contamination of imported
foodstuffs have been dispersed. In addition, problems for several factors based on calculation
of the interim intervention level, radioactivity level of foodstuffs exceeding about 50 Bq/Kg as
radiocesiums and necessity of monitoring for the other radionuclides in foods except
radiocesiums were also discussed.
- 14 -

^:< H C ,
/ c ^ 2
, 3 4.
5. . 6.
, 7
1.
(1)
t(2)
(3)
29
(i) *£*#>& ?J * i
- 1 5 -

2.
(2) f 15
Og-100%)
3. ( 5 / 3 ) IZ
Table 1 . Derived intervention level for radioactivityconcentration of 131I in foodstuffs in internationaltrade recommended by Commission of EuropeanCommunity (CEO following the Chernobylnuclear power plant accident131.
(Bq/Kg, L)
1 3 4 c s + i 3 7cS]
7t13> (Table
2)
Date
(1986)
May 6
16
26
Milk, Dairy
products
500
250125
Vegetables
350175
90
Other
foodstuffs
350
17590
Fresh fruits
Table 2 . Drived intervention level for radioactivity concentration of [ 134Cs + 137Cs](Bq/Kg,l) infoodstuffs adopted in mainly european countries on may, 1986 following the Chernobylnuclear power plant accident131.
Date
May 2
15
22
31
May
May
Country
Sweden
//
Finland
Recommendation
by CEC"
Australia
Canada
Milk, Dairyproducts
1000
*
300
1000
370
100
50,100 (processed)
Vegetables
600
100
300
Meats
100
X300
1000
(Beef, Pork)
600
100
300
Other foodstuffs
1000
(Cereals)
370
(Infant foods)100
300 (Fruits)
l) Countries adopted (except infant foods) : Ireland, Great Britain, Italy, Netherlands, Greece, Spain, Swiss,
Denmark, Portugal, Luxembourg, Turkey and Norway(from June 20).
4.
a) a.
- 1 6 -

, [134Cs+ (Table
Table 3. Factors based on calculation and re-assessment of interim derived intervention level (IIL) forradioactivity of import foodstuffs in japan following the Chernobyl nuclear power plantaccident1"71.
Factors
1 . Portion of radiation dose by in-take of radioactive contamina-tion foodstuffs
2 . Composition of radionuclides infoodstuffs
3 . Contribution rate of dose by in-take of radionuclides
4 . Dose per unit by intake of[ 134Cs + 137Cs]
5 . Intake of total diet in weight(Kg/day/adult)
6 . Consumption rate of importedfoodstuffs in weight
7 . Ratio of foods imported in japanfrom EC countries to total inweight
8 . Days a year
At the time (Nov. 1, '86)
of the level determination
1/3 of dose limit for public(0.5 rem/year).
137Cs: 134Cs: ^Sr= 100: 50: 2.2 (determined for theradioactive fallout samples)
® [ 134Cs + 137Cs] : 66%© ^Sr : 33%(D Other radionuclides: 1%
(Committed dose equivalent)5.4 x 10"5 mrem/pCi
( = 1.46 x 10"5 mSv/Bq)
1.4
0.35
—
365
At the time (Oct. '87)of the level re-assessment
Considerat ion of effective doseequivalent limit for public(lmSv/year)
I37Cs: 134Cs: 90Sr: 106Ru= 100: 50: 2: 15 (determined for the
actually imported foodstuffs)
® [ 134Cs + 137Cs] : 90%
(Committed effective doseequivalent)
1.33 x 10"5mSv/Bq
1.4
0.35
0.039
365
Calculation process of the drived IIL for radioactivity of [ 134Cs + 137Cs] in foodstuffs on nov. 1, '86 was as
follow : 1.4 x 0.35 x IIL x 5.4 x 10"5 x 365 S 0.5 x 1/3 x 0.66, IIL S 11.389 (pCi/Kg)( i 421.4 Bq/Kg)
••370 Bq/Kg.
(2) -
$(•±10%
- a-FJCK -VA, V-?I/-F,
5.
1 )
- 1 7 -

'87 %- 11 ft : 20
t$# ioo(Fig. l ) o
'88 # # 5 ft : ±|S 5 ^ ^
U -
© '90 *£ 1 J! :
100 10 % ^ ,
xport country
Foodstuffs
Nuts
Processed nuts
Spice
Processed wild gras:
Beef
Cow's internal orgai
Reindeer's meat
Ireland, Albania. Italy. Greece, Sweden. Spain.
Ancient USSR (west region of the Urals) ,
Turkey, France. Ancient Yugoslavia .Rumania
Meats
Processed meats
Natural cheese
Skim milk
Germ wheat
Starch
Vegetables
Processed vegetable
Hop
Jam
Mama 1ade
Wine
Honey
Cavier
Beans
Fresh water product
Others
n —' JT n-__
HP oil Igl m grai—Hr ?181 Jp aa-l n ™ a HI »«
U B B r"
100 % inspection inspection
Fig. 1 Radioactivity monitoring for foodstuffs imported fromnovember 1, 198771.
b . 10
2)
'86 ft fc
© '86
y , 520Bq/Kg, 980Bq/Kg, I t 30
15,049 49 (Table4)o
Table 4 . Result of radioactivity monitoring for foodstuffs imported in japan from novemder '86 to aporil '89.7
Meats (poultry,beasts), dairy products
Marine products, their processed
Cereals, beans, their processedVegetables, fruits, their processed
Sugared, tea, spice
Drinks
Fats, saltedOthers
Total
(rate, % )
Totalnumber
3,665
1,154376
3,864
1,724
1,031
166
3,079
15,049(100%)
Detection number
~50
3,558
1,144374
3,769
1,534
1,021
164
2,883
14,257(94.7%)
-150
67
101
152
102
7
2
226
567(3.8%)
at each radioactivity
-250
19
01
34
39
9
0
25
127
(0.8%)
~370
7
00
12
21
0
0
9
49
(0.3%)
(Bq/Kg)
>370
4
00
13
28
0
0
4
49
(0.3%)
paritially modified.
- 18 -

Table 5. Result of radioactivity monitoring for foodstuffs imported in japan from may '89 to april '917) .
Foodstuffs
Nuts, their processed
Spice
Wild grass, their processed
(contained instant tea)
Condensed • processed fruits
Beef (contained internal organs)
Reindeer's meat
Beef extract, seasoning materials
Meats (except beef, pork, reindeer)
Processed meats (except beef)
Skim milk contained its process
Pasta
Processed fruits (except condense)
Honey
Beans
Cavier
Marine products
Pork
Natural cheese
Cereals (except pasta)
Vegetables, their processed
Shirop, sugared fruits
Others
Total
(rate, % )
Totalnumber
666
1,502
2,859
3,858
851
5
366
6,370
1,769
238
3,117
871
224
54
189
1,198
1,116
285
466
2,946
1,249
10,673
41,572
(100%)
Detection number
- 5 0
660
1,441
2,692
3,851
848
2
347
6,366
1,769
238
3,116
871
218
54
186
1,892
1,116
285
466
2,942
1,249
10,648
41,249
(99.2%)
-150
6
55
122
7
2
19
3
1
5
3
5
4
1
25
258
(0.6%)
at each radioactivity (Bq/Kg)
-250
4
27
1
1
1
1
1
7
43
(0.1%)
—370
1
14
2
17(0.04%)
>370
1
4
5(0.01%)
paritially modified.
621 m x\ mf 54 ft)
^ 4 ; §4 t ?© 2
(Table 5 ) o
41,572 5 6 >
15,544 # (Hf+ 72,165
ft). &K\±0ft (Hf+54
ft) X'%>Z>O
* £^<O'93 ~'94
2,565 ft (HI+74,
730 ft). S S l f t (Hit
55 #) (Table 6)U)X'%>
Table 6. Result of radioactivity monitoring for foodstuffs importedin japan from '93 to '94141.
Foodstuffs
Herb
Mushroom
Reindeer's meat
Spice
Beef extract
Total(rate, % )
Totalnumber
2,565
2,565
(100%)
Detection number at each radioactivity (Bq/Kg)
- 5 0
2,539
2,539
(99.0%)
-150
10
5
0
3
2
20
(0.8%)
-250
1
2
0
0
0
3
(0.1%)
—350
0
1
1
0
0
2
(0.08%)
—400
0
0
1O371)
0
0
1
(0.04%)
- 1 9 -

Table 7. Number of foodstuffs exceeded radioactivity of the intervention level and re-exported injapan7'141.
Foodstuffs
Hasel nutsCow's stomach
Reindeer's meat
Thyme
Heath's flower
Black currant's puree
Almond
Ice-cream's pasteHasel-nut's pasteBeef extract
Laurel tree's leaf
Sage
Herb
Fern
Herb tea
Mushroom
Mixed spices
Total
Number of foodstuffs exceeded the in-tervention level and re-exported
1987
2
11
11
1
11
31
5
7
2
3
30
1988
1
1
2
4
2
16
1989
2
2
4
1990
2
2
1991
11
2
~1994
1I
1
Export's country*
Tur, ItaFin
Swe
Fra
Fra
Fra
Ita
ItaIta, TurBra, Ire, Fra
Tur, Spa
Tur, Gre, Yug, Alb, Fra
Fra, Yug
USSRSpa, Yug, Swi, Rum, Alb
Fra, Yug
Fra
Re-export's
quantityin weight
HOKg, 30t
1.26t0.2t4.02Kg
8.5Kg
1.5t37.5Kg
576Kg
5Kg-4t216Kg, 2.6t
10Kg-28t
4Kg-14.5t4-98Kg
158Kg, 180Kg
2Kg-2.52t
3-34Kg
8Kg
*Tur : Turkey, Fin : Finland, Swe : Sweden, Fra : France, Ita : Italy, Bra : Bragil, Ire : Ireland, Spa : Spain,Gre : Greece, Yug : ancient Yugoslavia, Alb : Albania, USSR : ancient USSR, Rum : Rumania.
V (Table 7)
1 ) FAO/WHO (Codex Alimentarius Commission)
6 ~ 22Bq/Kg t
(CEC)1 3 U 5 ) ' 1 6 >
FAO/WHO,
X\t. m (Table 8) # " t -
a
ttz,
Table 8 . Guideline Levels for radionuclides in food followingaccidental nuclear contamination for use ininternational trade151.
Foods
Foods destined
for general
consumption
Milk and
infant Foods
Representative
radionuclides
a i A m , 239Pu90Sr
131I, 134Cs, 137Cs
241Am, 239PuI 3 I I , M Sr
134Cs, 137Cs
Level
(Bq/kg)
10
100
1000
1
100
1000
Dose per unit of
intake factor
(Sv/Bq)
10"6
io-7
10"s
10"5
io-7
10"8
- 2 0 -
\ SUglfclte lmSv t
2) ICRP 63 m.& (1992^)
lOmSv
& (^frop, rmikmmm •• io3
: 10 ~ 102Bq/Kg) ^
3) I B V 3 © -
(1991
. ^¥L : 185 ~ 370Bq/l, ^ ^ : 600 ~ 740Bq/Kg) (±x ± E ICRP63
7.
1 )
(370Bq/Kg) t * o T , CO «t
5mSvgS (tztzL,
c. i •9
0.1
- 2 1 -

ii9
2) 4*
a.
(1985^) tC
# 60
( i x i o - 3 ) t
±1 3 7Cs
(Fig.
(Table 6) X'ii,
S3& t
LX <b,
lfi FAOAVHO
U 50Bq/Kg^^x^.
(Fig. 3) ^ J t ^
^ , 60
(4 x 10"3)
(lmSv/
. IB V
- ^ . 9 0Sr: 137Cs
c 0
8I
0.0
lotal dietO Uilled RiceO M i ] k• Green tea(dried)
'83 85 86 67 88 89 91 •94 (Year)
Fig. 2 Radioactive concentration ra-tio (average) of 90Sr: 137Csin Japanese foodstuffs meas-ured from 1983 to 1994211.
- 22

JhlB© tis 0, - a
0, m&K t
100
t <
(90Srfc<tOtl37Cs) (Table 9 )
CD
ion
c<uocoo
o
10,000 ~ 20,000Bq/Kg 137Cs
0.0
® Total diet ;O Milled Rice -O N i l k '
• Green tea (dried)
(„: 166)
1 1 1 1 1 1 1 1 1
p.n,
137cs
%83 85 86 B7 88 89 91 '94 Wear)
Fig. 3 Radioactive concentration(average) of 137Cs inJapanese foodstuffs meas-ured from 1983 to 1994211.Estimation of 137Cs con-centration in total diet isbased on its radioactivity(Bq)/dietary intaked .4kg)/man/day.
Table 9 . Radioactivity of 90Sr and 137Cs-in total diet samples*11
collected in regions of the Ancient USSR221.
&< (> 28.8
, 240Pu,
Regions
Russia (Novozybkov)Stari BoboviciNovozybkovStari VyskovSv' atsk
Belorussia (Bragin)GdenMalozinMikuliciBragin
Ukraine (Ovruc)DaletaRakitnoeKorchevka
Radioactivity (Bq/Kg dry mass*2')
90Sr
5.6 (1)2.3-5.2 (6)
--
0.95- 4.9 (3)1.1 - 3.8 (3)1.8 -12.5 (3)
-
3.8 (1)4.1 (1)
4 .8 , 10.8 (2)
137Cs
14,1160 (2)27- 285 (7)57,3930 (2)36, 101 (2)
4-421 (4)17- 63 (3)35-182 (3)
14 (1)
1350-6370 (3)101-3600 (3)60-1010 (3)
( ) : No. of samples. ^ : partially modified.*1): Their collection data is no clear, but probably in 1991 in
consideration of the reference.
- 2 3 -

28-33)
-5
itt
2) *Xft&-£ft if:175 (1988).
3)
4)
(1989).
5) Sfe if:
^ ^ ^ 7 , 35(7), 369-373 (1989).
6) g g ; if : VMlA^fiu
(1992).
7)
8) l£
9)
ID ft
12)
13)
14)
, 265-439 (1986).
37(7), 7-21 (1987).
, 37(3-4), 169-
,23, 63-67 (1988).
, 39(10), 15-25
- , B***f-feV?-!£#, No.20, 25-30
News, No.467, 26-33 (1993).
, 154(2), 97-101 (1990).
&, m28
, 43(1), 33-41 (1994).
(1990).
£ () (1993).
15) FAOAVHO : Food Standards Program, Codex Alimentarius, General Requirements, Second edition,
183-188 (1991).
16) ICRP : Publication 63, fa^Wkik^^teft%<k^<DViWDiz<DmWM, 23-25, B*T^f V \--7W,£, %
m, 'MB. (1994).
17) ^fflUS* : FAOAVHO ^:it I5nil*&$il££? 18 ®m£Km LT, 4 S i 4 I ^ , 39(10), 7-13 (1989).
18) IAEA : Reducing caesium contamination of food products in the Chernobyl area, IAEA Bull., 18-23
(1993).
19) ff£*«tA£,8,E:aA®»£S : A^pap 1993, (&) B * t p D n i 4 f i ^ , * B # 2 H ^ f « , I I (1995).
20) ICRP : Publication 60, Hgg&#filRf^A;ic<0 1990 ^ t S £ , B * 7 ^ V b - ^ B ^ . A # , I M (1991).
- 2 4 -

21) B###?*! V ? - : PfcTtel, S * . £ * , ±m'R.lf&&.-kE>&ft<DtiltoW.tR&. W, 26 IU~ 37
D§SW2E«*!n£:#it* (f+^g«f/f), (1983 S ~ 1994 ! t )
22) E. L. Cooper, E. Zeiller, A. Ghods-Esphahani, M. Makarewicz, R. Schelenz, 0. Frindiki, M. Heileist
and W. Kalus: Radioactivity in total diet samples collected in selected settlements in the USSR, Environ.
Radioactivity, 17, 147-157 (1992).
23) K. Muck, S. Streits, F. Steger, K. Mayr and V. Karg : Estimate of the dose due to 90Sr to the
Austrian population after the Chernobyl Accident, Health Phys., 58(1), 47-58 (1990).
24) f ^ s a i f j r : H35 mmmnMmm^m%m^m±i'pmm, 1-20 a.993).
25) i£uj££ • FEB « • mmm® • &mm$: • mzi^m • -gm§,u • mmm=- •• ^ ^ s ^ m c ^ A ^ o
mftimm^ m37m^&&imm&wft&mBfici$>&&* ^a*ff, 95-96(1995).
26) H. Sugiyama & K. Iwashima: 239'240Pu concentration in contaminated european foods imported to
japan following the Chernobyl Accident, Radioisotopes, 40(9), 361-364 (1991).
27) (Bt)fCT2mm6ffi- tV?- : ^B D BOl iS iqKCj ;S&#t f tg« (D^*^ ^ - f e V ? - , I I (1994).
28) \ammm-mm m-. * > * ^ ^ i c t < o z - t n t c I 0 6 R U o ^ ^ ^ c f e f t s a M i , » 2 4
HlfeX&S*, ^^S^lf f> 141-142(1982).
29) mmmm • &m m = ^ ^ - ^ x t i - o ^ i c t D c 4 t i / c i 0 6 R u c D v ^ 7 . i c f e t t ^ j i s i
%#-&, 31(2), 100-110 (1982).
30) Y. Izumo et A.Takase: Etats biochimiques du 106Ru accumule dans le miscle et le foie de la crevette,
Penaeus, japonicus, La Mer, 21(4), 191-197 (1983).
31)Y. Izumo et H. Ogata:Etude comparative de l'accumulation et de l'elimination du cesium-134 chez des
souris nourriees par des aliments prealablement contamines, et chez des souris nourriees par un melange
inorganique du cesium-134, Rev. Int. Oceanogr. Med., 9 3 - 9 4 , 77-90 (1989).
32)Y. Izumo et H. Ogata: Etats biochimiques du cesium-134 accumule dans le muscle et le foie de la crevette,
Penaeus japonicus, Rev. Int. Oceanogr. Med., 9 3 - 9 4 , 91-102 (1989).
33) 3 E * * # ? - • =%mm • ±K ft • *mmw • mmm® •• 5 ^ mmm) ^
^8?SS5, p850 (1996).
- 25 -

U
2 - 2 # -
Administration of Stable Iodine to the Japanese in Poland
at the time of Czernobyl Accident
Tateno Yukio
National Institute of Radiological Scienses
4 - 9 - 1 Anagawa, Inage-ku, Chiba 263, Japan
n
, a-
1986/4/26
^-77 , 4/28
4/29
16
4/30
4/30 (7k)
- 2 6 -

(3ml)
5 / 1
(Kaliumu Jodatum) & 1 B
5 / 2
3I (Solutio Jodi)
(18ml)
5 / 2 -7y Kt
3 -
L
5/3 (±)
COB ^ ^(23
28 H
25m rem0
0.1 - 200Bq/m3,
2 - 10Bq/m3
1000Bq/£
0-600Bq/fl
- 27

5 /4 (B)
COB
m
/c0 ^ 9
l
2 i i j
3
4
io, $.
lOrem y
2 .
- 2 8 -

1 .
3 ^ H l - «t
2)
50rem
2 .
t
!gg^-fS 1-131 ¥ ^
, 50rem KKZKte 33 fjCu 5rem l±33}i Ci
3 .
4J! 28 Bfrb5H 1 S^li^^-C27 x 10"7 ~ 54 x
54 x 10-6~27 x 10"5//Ci / m 3 / c , tz t ^Oa ~
H 10m3{iT'*5o fcd^, ?^^ft^:O54 x 10-4/iCi/m3 O ^ ^ ^ 5
i u -y ^;l/^^/c: 313S<mm^l,720Bq - 0.04//Ci
(5rem U
6.
- 2 9 -

ka, vol, 42(2),
Xlt Endokrynologia Pols-
1 . / K - =
(By Krajewski,
ment model fl
1986/4/28, U%
1986/4/29, 40%
1986/4/30, 26%
1 9 8 6 / 5 / 1 , 12%
committed dose , 5 compart-(by Johnson)
2 . (By Nauman et
-. 77-y
>. 1974 1 9 8 5 ^ 12
1973 ^ 12
JtTSH, T4,
3.
dine)
(By Kinalska et al.
committed dose #
1983 ~ 1985 ^ ^ # 6,921
, 90
(4.4%
5 7 HX—
1986 ~ 1988 4,010
74%, 5 ~ 5 S # 23.0 ~ 43.4 \
/-: (better tolerated than other kinds f io-
(143),
29 A (12%)
- 3 0 -

AWc0 o *> 177 Aft, 1A
.i>*ti, 1983 ~ 1985 32 A %X1b~> tz35.9 %, 1986 ~ 1988
, FNodular goitre before the catastrophe was noted in 8.1% persons
with goitre, after 1986 the percentage for the general population was significantly enhanced
(16.1%) j tm^-x&Zo
., Graves disease,
THS
(ATMA t ATG)
VII
PKU
Htc TSH-spot levels
25 %\z
(By Lenartowska, et a l ,3: IU)
u -~
12,000 ®
^ 14,000
2.
1989 ~ 1990 ^ C 1912 A ^ i 1 ^ (^938, * 974) #
, f f ^ ^ X ^ U - - V ^ " TSH-spot test
3ffi| (1.7%),
1897 ^ ^ I E S O 15 MX IQ
(toral T4 serum level, total T3 serum level, TSH serum level) £ L/c 1904
(0.8%) t¥t tE@: 1912
© ^ - ^
(By Nauman,
voivodships
- 31 -

TSH <D- (Wolff - Chailcoff
©X\ 50mSv
© v>-v - T i i , 95 %f i l±#H^f t* U Sr-IUIRffi L/c (^ 10,000,000 A )
^*U*lgfflL/c (m 7,000,000 A)
11 <O voivodoships T'ii, ^ f t O ^ 75 %\t 24 B^^UP^t 3 ^ittl U ^
An 30 B^&tCEfrSS»#tijrCkft;fc%«t!ti, 30 BtClRffl UfcOf±*9 25
48-72hrs Kim Ltzo
fee i:
K (By Nauman,
Lfci^t, ^ <
t
© #
- 3 2 -

©
X #-=?> K<D H
(in far field (O
- 7 V Ftr(± 1996^-3,^7^^ fa new project on the same issue, for the long-term effectsj
XI
©
, 1987. 5. 5,
Endokrynologia Polska, vol. 42(2), 1991 iC%
1) Pawel Krajewski
Commited dose to the thyroid of polish population after the Chernobyl accident. Effect of administering
stable iodine.
2) Janusz Nauman, Hanna Roszkowska
Epidemiological foundation of population studies of MZ-XV E programme.
3) Ida Kinalska, Wieslaw Zarzycki, Anna Zonenberg, Mikolaj Rybaczuk, Piotr Zimnicki, Henryk Holowac-
zyk, Anna Gosiewska, Marek Kulikowski, Eugeniusz Dzierzanowski, Aleksander Modzelewski, Teresa
Modzelewska, Irina Krawczuk, Maria Gorska, Beata Telejko
- 3 3 -

The results of study of influence of radiological contamination and iodine prophylaxis after Czernobyl
accident on the thyroid morphology and function of the inhabitants of north-east region of Poland.
4) Irena Lenartowska, M. Oltarzewski, Iwona Lisewska, Barbara Staroszyczy
The lack of negative outcome of Chernobyl accident in infants born between 26 april and 5 may 1986 in
central Poland.
5) Janusz Nauman
Results of studies performed within MZ-XVH programme; most important observations and conclusions
of country-wide studies
- 3 4 -

•fe v i/ 3 v I ^ x ;i// yV u
2 - 3 WiWy &$ftg;© cs-137
IE
International cooperation Mass screening
— Whole body cesium-137 measurements for the residents in Chernobyl area —
Masaharu Hoshi
International Radiation Information Center, Research Institute for Radiation Biology and
Medicine, Hiroshima University
1 - 2 - 3 Kasumi, Minami-ku, Hiroshima, 734 Japan
ABSTRACT-The level of radiation exposure in children in the former Soviet Union area
caused by the Chernobyl accident was investigated on the basis of whole body 137Cs count.
The subjects were totally 87,430 (42,114 boys and 45,316 girls) in Mogilev and Gomel Bela-
rus, Bryansk Russian Federation and Kiev and Zhitomir Ukraine. They received Chernobyl
Sasakawa Health and Medical Cooperation Project health examinationsfor May 1991 to De-
cembef 1994 and were 5-16 y old at the time of examination. The median whole body137Cs count per body weight varied from 20 to 50 Bq kg"1 except several cases in Gomel and
Bryansk oblast. (The "obtest" is the largest administrative district constituting the country.)
Corresponding annual effective dose equivalents were all less than the public dose limit of 1
mSv y"1.
1 . [
1986 *£ 4 R 26 B f i J l / / ^ U E ^ *|g«BlfO*Sfc#|g^Lfco ^O^Sfet±i$tl/c&#ttgt± 3.6EBq
(lOOMCi) f i - f r f t -CVSo C O f i ^ ^ VK3-ti%WM®&1&.kr) 53^£€>1991^<fc 0 5 #
Gomel Specialized Medical Dispensary, Mogilev Regional Medical Diagnostic Center,
City Children's Hospital, ^ ^
- 3 5 -

RussianFederation
V
N
o Zhitomir
EDEDm
——
3 7 -
185-
Above
185 GBQ
555 GBq
555 GBq
km
km
km
30km zone aroundnuclearRiver
Nations
plant
border
" (1 - 5 Ci k m " )
" ( 5 - 1 5 Ci k m " )
" (above 15 Ci k m " )
the Chernobyl
Dnieper100km
I
miCZOi&i&ti&WZfRTo
Regional Hospital No.2, Kofosten Inter-Area Medical Diagnostic Center ~Q'£>Z>o
i , (2)
(3)
Hoshi c/ a/. (1994a) Id
L?to
5o<7)-ty?-li4tl±^7JV-^37 U 7 *
(1)
(2)
(3) - 137
- 3 6 -

t
t LX,
#*>o tz0
Wo T .
tz
L L«?> < "f £ < Mts i 9 C
Y U--
Sasakawa Memorial Health Foundation (1994, 1995) K3
2 .
Aloka WBC101 X
[£i 7.6cm, ^ $Sliding
7.6cm ONal(Tl) i/y^U-i/ 3 Vft chair
30c
NaKTI)detector
EH2
- 3 7 -

?.
270Bq(la)
V 9 -
3.000
2.000
1,000
V 20 40
Phantom weight (kg)
60
r «fc 9 IC
=1 v t: a - ^ -
61994^12 J| 31 H
•fe v ? -
Hoshi ^ al. (1994b) CJ^Lfc
1991 5 15 H #> b 1994 ^ 12 H 31 B
^ l O ^ C f t 9 ^ f t 87,430 Ai^o -CV^^
8,778
6,927
8,753
8,965
8,691
9,149
7,469
8,714
9,883
10,101
17,927
14,396
17,467
18,848
18,792
), (b) CJi—^ It 42,114 45,316 87,430
(a)
137 ©±*J§* (Ci/km2
, 50%, 75% ©>^KJKD1IS (Ci/km2) T'*
1994
- 3 8 -

3 .
(a) 'J-fcv?-
(a),
oR
100
so
50Bq/kgJUTtf*(b)
5K (a), (b) ^ U -fe V ? -
a.
too
SO
i/cOO 3
>> lOOBq/kg £ f '
/Co c
50Bq/kg
• ? ,
Bq/kg
• . t? " ;• j? ;i: ^ U ?• u ; u
CD Boy.• I Girls
7 8 S 10 11 12 13 14 15 16 Age
% ^ ^ ^» , ^ ^ ^ ^ ^ r/* Examinees
i! }! !: i . i i .. t ;
I I Boy«
• B Girls
10 11 12 13 14 15 16 17 AgeO. r.
'», • ' / , • ' • , •'«<, ••», " * • '«, • ' • . E«amin.. i'% '% ' \ '% '% '% '% '' (B»y».O.rl
Examina«sIS)
1kg 137Csfi (Bq/kg)
+ lCl* 50%
2Bq/kg J
1OOOBq/kg i ^ 0.97mSv5OBq/kg
^t l l f IS*
LXlt
- 3 9 -

lOOOBq/kg <O 137Cs
x ;uy 7V U 3
100
( ± 3 -
(a)
^ 1000 -
* 500 -aa
CJ
•a
5
100 -
50 •
(b)
_ 1000
i 500
100
50
I t
PUct of residence
1OOBq/kg
4 .
m
- 4 0 -

X-te
Gomel Specialized Medical Dispensary
V. B. Masyakin, W. A. Kalimullin, V. E. Derzhitsky
Mogilev Regional Medical Diagnostic Center
V. F. Sharifov, I. I. Veselkina, I. V. Pilenko, S. V. Kovaleva, N. K. Dolbeshkin, S. A. Danilchik,
T. A. Krupnik Klincy City Children's Hospital A. 1. Kovalev, A. A. Averichev
Kiev Regional Hospital No.2
P. M. Shmygun, V. V. Elagin
Korosten Inter-Area Medical Diagnostic Center
I. N. Sokolovskiy, V. V. Danilyuk
3t m1) M. Hoshi, M.Yamamoto, H. Kawamura, K. Shinohara et al. Fallout radioactivity in soil and food
samples in the Ukraine: Measurements of iodine, plutonium, cesium, and strontium isotopes. Health Phys.
67:187-191; 1994a.
2) M. Hoshi, Y. Shibata, S. Okajima, T. Takatsuji, et al. 137Cs concentration among children in areas
contaminated with radioactive fallout from the Chernobyl accident: Mogilev and Gomel oblast, Belarus.
Health Phys. 67:272-275; 1994b.
3) Sasakawa Memorial Health Foundation. A report on the 1994 Chernobyl Sasakawa Project Workshop.
May 16-17, 1994 Moscow.
4) Sasakawa Memorial Health Foundation. A report on the 1994 Chernobyl Sasakawa Project Workshop.
July 7-8, 1995 St .Petersburg.
- 4 1 -

t <
The Mental Health State of Atomic Bomb Survivors
Yoshibumi Nakane1', Yoshihiro Imamura1', Kazuyasu Yoshitake11,
Sumihisa Honda21, Mariko Mine2', Keiko Hatada1',
Masao Tomonaga3' and Masuko Tagawa4':> Department of Neuropsychiatry, Nagasaki University School of Medicine2) Science Data Center for the Atomic Bomb Disaster, Nagasaki University School
of Medicine3) Department of Hematology, Atomic Disease Institute, Nagasaki University School
of Medicine4) Nagasaki Atomic Bomb Casualty Council
1 - 7 - 1 Sakamoto, Nagasaki, 852 Japan
ABSTRACT-Our department of Neuropsychiatry has clarified the clinical features of several
mental disorders and surveyed the causes of those disorders from the psychosocial aspect
using the methodology of epidemiological psychiatric approach. Using this previous research
experience, we began a long-planned study to examine the mental health state of atomic
bomb survivors. Fifty-one years have passed since the atomic bombing, and the survivors
must have suffered various psychosocial stresses, other than any direct effect on the central
nervous system from exposure to radiation, and it is assumed that victims' mental state has
been affected in various ways as a result.
The subjects of the survey were 7,670 people who had regular health examinations for
atomic bomb survivors during the study period of three years and who consented to partici-
pate in the study. Of the total, 226 subjects were selected for a second phase according to the
results of the General Health Questionnaire 12-item Version which was used in the first
phase of the survey.
- 4 2

The results were as follows: 1. The distance from the hypocenter was related to the degree
of ill health, and the percentage of people with a high score was greater among those exposed
to the atomic bomb in proximity to the hypocenter. 2 . 14.6% of the subjects were diagnosed as
having some kind of mental disorders according to clinical interviews by trained psychiatrists.
These results had not expected prior to the study. On the bases of the study, we will try to
establish a mental health support system for atomic bomb survivors.
I .
2) 3)
4)
2) m
(DMMi KkZ frnk Subject Variance
Occasion Variance
Criterion Variance
Information Variance
KZ:Z> 5-fk Observation Variance
Reliability ;
Validity ;
^m (B%:&. Sensitivity) (Specificity) ;
3)
t
- 4 3 -

\ tztz.ii,
WHO
tz1>K 1995 1 1 B frhli ICD-1O A*
fC | | | g$n i t % ^(OWRmBffimm (Diagnostic Criter-
ia for Research, ICD - 10DCR)14) #
(Structured Self-report Form) t±,
< WB.-tZ> i>O t IX, ^m<D Goldberg ff^% Ltd
(General HealthQuestionnaire.GHQ) J02> j js*5o ^ t l t i ^ ^ J E T ' * * t 60 JgB
i 3 0 ^ g ) S (GHQ-30)
(Structured or Semi - structured Interview) fi%
, m(Composite International Diagnosticlnterview, CIDI)15)
n. %1. ^
(PTSD)
- 4 4 -

, 1995
PTSD
2 .
2)
3)
4)
5)
6)
7)
!- LUtcK LX
m.
- 4 5 -

tz tz t ^ 9
c 192
O Z. 113: < , ^ 1 O i 9 iC * <
C A
«t. 2 C ^
LX f fcft« < 7,297
B IE
mm •
is tt
it '&
mm• •& J^S
m ft
B Hi^ Jiig et
*)»!
10
35
7
4
5
14
15
9
5
51
2
4
13
9
4
4
1
T SOP ffi
<k # jt it1 1 $ ^- ".ft
& *IB £m £ & T
1
71
6
21
3
* $
7
4
314
52
7
1
2
(Iff) i:.o/c^ (Iff)
C 1953^
0 1.5 ~ 2.0km O
AC
c n
T £ # e €
Y. X r U -
Sf#Ii
!S ft J « ttfe )S tT.^ IEft M 4 L© 51
£ ^ o
a1 * I- & !&
I?¥(N=4,269)
415 (9.7%)
98.0%3.9
1.2
1.0
0.50.5
65.5%55.952.036.934.933.226.520.513.012.8
Ef¥(N = 3,028)
118 (3.9%)
93.2%0.80.8
0.8
0.83.4
60.2%48.350.031.424.626.316.916.1
5.1
7.6
-g-fKN =7,297)
533 (7.3%)
93.1%3.2
1.1
0.9
0.6
1.1
64.4%53.751.635.632.631.724.419.511.311.6
- 4 6 -

m M §i ft is-1 ft » ft SfIB R §f ft Iff
Jfti f 51W) ft It?ft at ft is$: it ft IS& & ft iff
± % ft s^ ,t isat « * «
x.X.
X.
X-X.
X.
X.
*%
ft
n0
n5
61
411
27
17
19
5
21
011
0
3
2030
27
28
5
32
5171
7
3157
44
47
%
3.8
24.03.8
12.90.8
5.323.543.533.535.9
¥ Sf
ffl JfiL ft i li ff * • •*
ft>p[ gj . jp
i i Iit m m» tt fF g 1ffi tt ~> g -v 7
IS]
tl
^*&ftfi
i
7
17
1011
1
1619
2
15
5
13
2628
284
23
26
821
620
43
38
39
53947
10
36
%
4.6
15.332.829.029.83.8
29.835.97.8
27.5
2. BRAIN DAMAGE IN UTEROJ t^M
WHO ^fr rWHO Project on Brain Damage in Uteroj 01) tM LXft-o X
(NASHIM)
ICD-10ICD
F70F80F82
F93F94F95F98
(N=154) (N = 90)
40.9 21.1
3?
9.979 0.0016
2.018.812.38.4
20.1
4.56.5
20.1
1.17.8
4.42.26.7
03.3
10.0
0.2475.518
4.145
3.8088.003
4.212
1.125
4.253
0.52920.0188
0.0310
0.04100.0082
0.03790.2260
0.0392
- 4 7 -

Igumnov03) <O =f -
L.
fc 274
* 5 yf»i|J!«sit
7<H0O*KS*fc«ft
51-755(fCB*fcJgSF
26-50% dfg&fc^iff
1-25XCB**:** ^Sl^., i i f f i i , 5f;$c^^ ^ 'SO^^;. ^ L*.O^^:> SfSi&^^Sn, &5:tt<0)$$LI SL 'ijft, iSffi, ^ # , ffi^
N. (1993^-)
, 2) . 3) , 4)
, 5)
1) m2)
3)4)
5)
KIT,
(GHQ-12)
^ (GHQ - 30)
- 4 8 -

CIDI
I C D - 10 K
1993
1994 LT, 1996 ii?T U ^ ^ ~
7,670 A (IS;3,216 A>
454 A)
17, ^rtt 64.09 ± 8.52,
z ft
105 £ ,
: 63.35
62.34 ± 8.
8.41
62.11 ± 8.21, 64.32 ± 8.49,
63.28 ± 8.42
GHQ - 12
12 g
^ ) [±11.3%
m 1 O i 9 C
GHQ12If.
1.2 r
1 -
0.8 -
0.6 -
0.4 -
0.2 -
0"-
2km
CIDI (c
50
60
70
mi- 4 9
- 5 9
- 6 9
- 7 9
It
% 14
121( 3.8)1,045(32.5)1,568(48.8)
482(15.0)
3,216
* 14106
( 2.4)1,272(28.6)1,900(42.7)1,176(26.4)
4,454
It227
( 3.0)2,317(30.2)3,468(45.2)1,658(21.6)
7,670
2.0km 2.1~3.0km 3.1~km
p<0.01 (%: p=0.15, * : p<0.05)
9.3
, 3.1km
(37.1%), 44 ig (36.4%)
(36.7%) -r-
1412
10
8
6
4
2
iS
m
83
- 4 9 -

G H Q - 1 2 ^ C<fc3=2
GHQ-12 {#,&£• :fr
4> % A mm & & m
tt
76 (33.6%) 5
33 (14.6%) 12
117 (51.8%) 66
226 (100.0%) 83
6.6%
35.4%
56.4%
36.7%
14.6%le
mz GHQ-GHQ-12ft,£
m ® &
ft
12$
M &
6
7
# ^ »
,091
867
712
,670
'ft' ?R
6.
35.
56.
6%4%4%
402.0
315.6
401.6
1,119.2 (14
! « »
.6%)
i.
# S ECA W5£ (1988)•%i-y, Edmonton (1988)- a - ^ - 5 V K ( 1 9 8 9 )F^ y , Munich (1992)
© H , Seoul (1990)
Uffi (1990)•&?f, 'J^rfJ (1989)
tSIS (1992)
SB'DBB (1993)
32.2
33.836.632.1
39.841.134.9
30.4
21.7
Lfctt
22.1 *--
-
31.833.028.0
21.5
16.3
gci£ (Diagnostic Interview
Schedule, DIS) Srfljffi L / c p g P ^ 1 3 > t:*?>c
: ^ 9 0 7 )
<it
16.3 ~ 33.0 %C
14.6%
- 5 0 -

FF
F
F
£10 ±%3L[Zfeltsm
I C D jj 7- -d ij -
3 &# (jfiift) B»
5 4aW^SB.O-*##KSH
^>. =+n p i
12
18
6
45
45
Sr ( ICD-
(2)
(6)
(2)
(1)(1)
(6)
mIX
21
18
4
02
45
10)
m
a)
a)
Bf
HI
33
36
10
47
90
It
(2)
(7)
(2)
(1)(1)
(7)
v.
1960
7s YV
ICD
X \t PTSD # -
(F4)
Ltz
t
Ztlbfr\ W4
, 50
1) Division of Mental Health, World Health Organization WHO Project on Brain Damage in Utero.
WHO, Geneva, 1991.
2) Goldberg, D. G. The Detection of Psychiatric Illness by Quetionnaire. Maudsley Monographs vol 21,
Oxford Univ. Press, 1975. WH 3?MR*iI HraffiifeCiSfilff -^gS-EttOfflgOglfe t E£i£O^
H:ffififfflffi£W3^ ^fit. 1981)
3) Igumnov, S. Psychological development of children exposed to radiation in prenatal period as a result
- 5 1

of Chernobyl disaster. Acta Medica Nagasakiensia 41: 20-25, 1996.
4) ' h S - H f i i WM&&:&&<D?$M&&.:g%f&lcm®i<DmMfcg£X ft($E^^$llfe 36: 706-716, 1961.
5) Kryzhanovskaya, L. & Nakane, Y. Mental health of liquidators of the Chernobyl disaster. Acta
Medica Nagasakiensia 41: 15-19, 1996,
6) ^u±x mnmmcioit^m^ zLmnm^** • TOJE WA mnm^mm • mnm-m • mmm •%m, jKeasi? • smm • ±mi^m • M^BL • um^xm, ^IMWJS, UJK, pp3i-57,1987.
7) <£«:fc£ ICD-10 t DSM- yCfc«-5*#^a t tW«t ' l j *S<D«l± <[>#&¥ 37:21-27,1997.
8) Nakane, Y. & Michitsuji, S. Results from the Nagasaki centre. In: Mental Illness in General Health
Care. Ustiin, T. B. & Sartorius, N. eds., John Wiley & Sons, Chichester, ppl93-209, 1995.
9) Nakane, Y., Honda, S., Mine, M., Tomonaga, M. & Tagawa, M. & Imamura, Y. The mental health
of atomic bomb survivors. In: Nagasaki Symposium Radiation and Human Health. Nagataki, S. &
Yamashita, S. eds., Elsevier, Tokyo, pp239-249, 1996.
io) cMmmm • §g«±J!P m^-mwwji^c-o^xcomn^^mms. ^m^^^mit 36:717-722, i96i.ID *ffl^±• 3E*ji-• mi-?-* • &mm® • *®.it± nm^vvT.t'bo'rr. E*^atiiig«^#a,
JJU5U 1996.
12) mtf-ii • TEffl Hgp w^m&m$i%<omnnm.m¥Mm&j&m Amnmmn&^ 1:50-52,1949.13) Regier, D. J., Boyd, J. H., Burke, Jr. J. D., et al. One-month prevalence of mental disorders in the
United States. Arch Gen Psychiatry 45: 977-986, 1988.
14) World Health Organization The ICD-10 Chapter V, Diagnostic Criteria for Research. WHO, Geneva,
1993. ( $g;fc£• mm&±• mw^TU ICD-IOmn^ku^m^nmDCRm%m&m&m, m.^mu,ifUJU 1993)
15) World Health Organization Composite International Diagnostic Interview (CIDI) (core version 1.1),
Washington, DC, American Psychiatric Press, 1993.
- 5 2 -

Current features on risk perception and risk communication of radiation
Tomoko Kusama
Department of Radiological Health
Faculty of Medicine
The University of Tokyo
7 - 3 - 1 , Hongo, Bunkyo-ku, Tokyo 113 Japan
ABSTRACT-Health effects and risks of radiation and radionuclides are being misunderstood
by many members of general public. Many peoples have fear and anxieties for radiation. So
far, the health effects from radiation at low dose and low dose rate have not been cleared on
biological aspects. Then, we have quantitatively estimated health risks of low-dose radiation
on the basis of linear dose response relationship without threshold from the viewpoints of
radiation protection by using both epidemiological data, such as atomic bomb survivors, and
some models and assumptions. It is important for researchers and relevant persons in
radiation protection to understand the process of risk estimation of radiation and to
communicate an exact knowledge of radiation risks ot the public members.
1 .
4
ifc
- 5 3 -

2 .
© m
©
ft
Sttttftt^JS.^ (-f =£ 'J x)
KiSSCTtJS^ ( 7 ^ ' J * ) *:f'£[*JlSHiJS.S ( T / U *)&&&>% (X^Sffi) (T^ I) *)&&!&•% (Xi^Sffi) (*-^^)W*-®. (T/ U *) *131I?&«a* ( ^ ^ x - x V ) *
/\V7 *• - h'ff*^
^ i? *y 2* •? *{ ~T )V^4 ^y~7 ~~
21853351278950
1837496862109888138784
220777109910331206773400
21691139018
(3797/25185)(1506/14130)
121800015710149232613042882721
167790908983
422000
Sidffi. Mil's: if ISaa^ 1
¥ttis. An? 1ABI 1epttiS. 11, i
¥LH 1an 1?L» 1i , BK. Si' 1
I111I8
B 1
1 t # xi: V 9
(UNSCEAR 1994.
'r - % n v h n -
- 5 4 -

& *& sm -*: m. PRK 'J- W S * B
* * * * * * *
>fvK
ttJt, * ^ » , 9EM i:ftJtttit
US'15410/55870476248322/7976
31150/4106611364/12297
12918/593813720
15000/30000
7768
1908
(UNSCEAR 1994. £ i> t (c
3. -
LX
3 }c
L «b,
t i <!:
V
200mGy Ti±iKitltt&1f;£Ali£te!g#> f , n t ^ 4 ^
A<D^#^ft*fH|cest^^^tLTfi'J^ffiO*T-^5
How did you get information on radiations and / or radioactivity?
t ^
4 .
• f t- 4.
\ # <
- 55 -

•Z%kM<0±%:
(D(D©
f Uffl.t
5.
10 20 30 40 50 60 70 fcO 90 100
- 5 6 -
9 7, \
i d i-M ic^t LX
4 K u
fr TMI
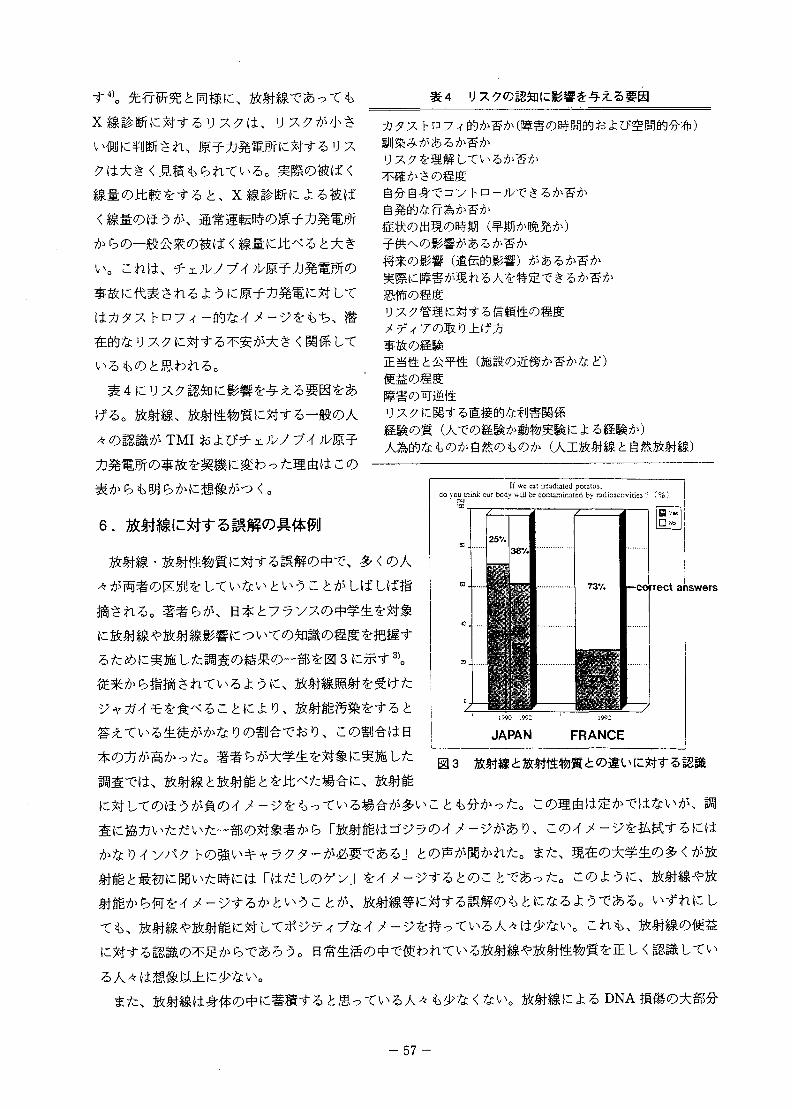
If we eat irradiated potatos,do you think our body will be contaminated by radioactivities ? {%)
73V.
i*\.\f
—cofrect answers
D »
1990 1992 199:
JAPAN FRANCE
- 5 7 -

6.
50
- 58 -

7.
L/ci9K
2)
3)
(1996)
(1997)
(1993)
> 20, 267-273(1985)
- 5 9 -

U
2 .
The Initial Medical Activities at the Accident
Atsuo Akanuma
Division of Radiation Health, National Institute of Radiological Sciences
9-1 Anagawa 4-chome, Inage-ku, Chiba-shi 263 JAPAN
ABSTRACT-Medical activities at the initial phase after the accident and following medical
cares for the acutely exposed radition unjury patients are reviewed. The medical dispatch
team of the central soviet government responded promptly enough to arrive at the accident
site in 12 hours. The medical dispatch members were skillful enough to perform the
severity diagnosis of acutely exposed radiation injury patients judging from subjective
symptoms, which was essential in the initial medical activities. It was feasible to judge the
severity of acute radiation syndrome from the minimum lymphocyte count during the first five
days. Patients exposed with one Gray or more were treated in hospital and were closely
followed. The most important medical procedure was to prevent infections. In this kind of the
nuclear disaster acutely exposed patients have both radiation burns and acute radiation
syndrome, therefore, when the immune tolerance is strongly decreased in about three weeks
after exposures skin burns which are usually beta-burns break up and the skin allows
internal infections, which can often develop into bacterial sepsis. Bone marrow
transplantation, which have been often discussed for severely exposed patients was not
feasible. The most important treatment is the anti - infection treatment.
- 6 0 -

LT, ^f^
1 9 8 6 ^ 4 ^ 25 0 5" x ;W 7V ^ K
1982
. g£(C 50 160
, -rx
26
20 ^ kW fC-tU^^rlslSi-^ < IJ
iC^|L/co 30 * U
23
U± C
2)
3)
4)
5)
6)
- 61 -

Table- 1 Chernobyl Nuclear Accident-Time table of emergencyMedical Activity - Nuclear Accident at 1:23 am, April26, 1986
t <
fcrt: t?
26
io
30 29
3 0 * ik
n
Jte
n
t2AA132AAK
t t
I
10
' ,12 I:£•*% Z
.E 10"
132I 5
4
3
89 ©
O 0
oo o 3 O
t
OO
2 4 6Dose. Gy
10 12 14
24
36
Fig. 1 Exposure dose and initial symptoms. The higher thedose, the sooner the sympotms appear.
&72B#P(iJ$T?fc:200 1 Kt.
- 62 -
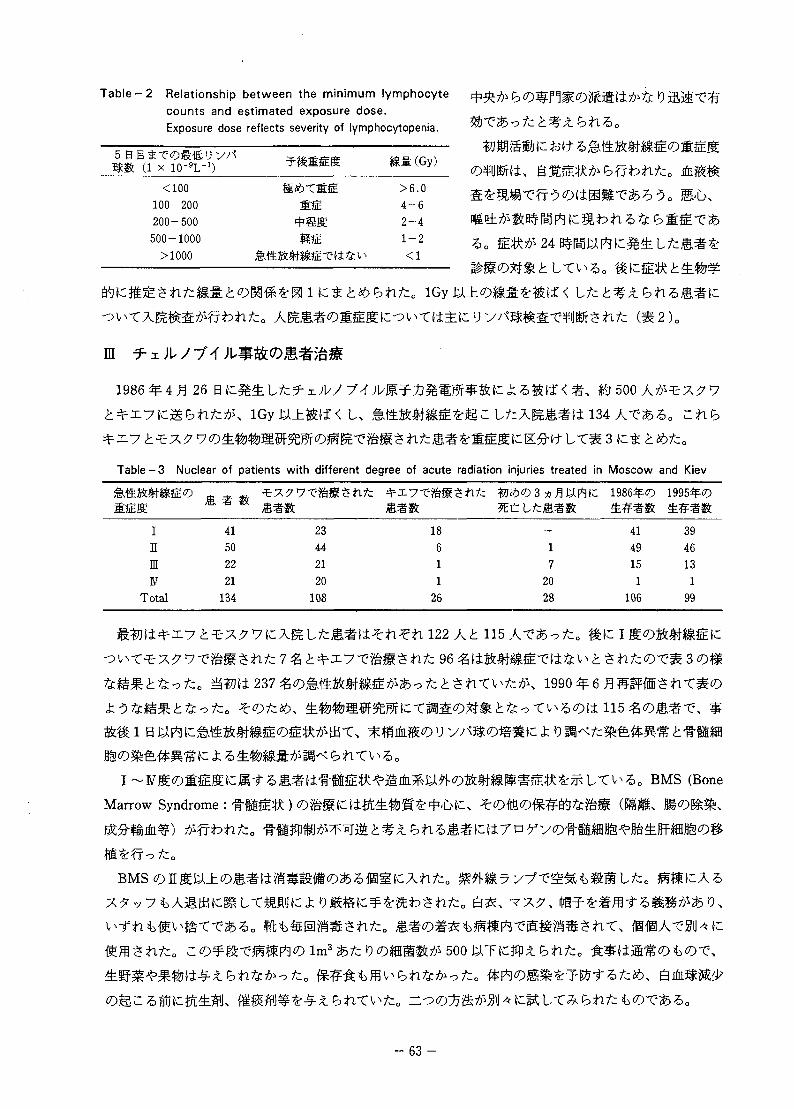
T a b l e - 2 Relationship between the minimum lymphocytecounts and estimated exposure dose.Exposure dose reflects severity of lymphocytopenia.
(Gy)
$bX'%>-o7C
mi(1 x
<100100-200200-500500-1000
>1000
>6.04-62-41-2 24
lGy
26 500
Table-3 Nuclear of patients with different degree of acute radiation injuries treated in Moscow and Kiev
InmV
Total
41502221134
23442120108
1861126
—172028
4149151
106
394613199
XU Ltc&.%lt%ti%ti 122 A t 115 At?*o fc. &C I
237 ««7)^fe&|*«|^#*o/c£$avCl^7&'\ 1990 6
0
BMS (Bone
Marrow Syndrome
500
6 3 -

>—o ( ^
—->y v 24 ~ 48
y ) 6 g £ 12
K lmg/Kg #L:£L/co
200-250ml ^jflL?gT-300 x
: 300
/c i: fc^ y 7 i ± ¥ ^ i: LT 600 ~ 650
B 0.2~0.8 U»y h;l/T*«9, 1 W$K 3 - 5
200 ~ 250 17
y y ^
L/c
/c0
63
& 14-18 BC
8 - lOGy « K < L/c# 30 H i f f t /c o W£<0 H 17 H g
< & 34 ~ 91 0
4.5Gy
27 - 79 0 I (C)
t 8
m 2 - 19 0
L/c
2)
3)
4)
5)
- 6 4 -

D
Lit
Table-4 Patients died from acute radiation syndrome.Estimated bone marrow dose, survival days and causedeath of 26 deceased cases from radiation.The abbreviations stand for following.ARS-acute radiation syndrome / Inf —infection /HRF-heparo- renal failure / post tr sy —post traumaticsyndrome / Th b-thermal burns / SI-skin injury /LI lung injury / I I - intest inal injury / Rl-renalinsufficiency / GVHD- graft versus host disease
56
/C 27 m* 19 mcmfo 0 > >p-& < t % 13
60
it—
115 A+ 80
(OPS I ~ I S ) ti 8~ 9
20 ~ 25 0 a
m <• f
ARSJffiK
nm
mm.3357242528303412346891012141516172023262731
# » » * (Gy)
4.14.44.73.75.76.45.55.86.69.212.011.87.58.39.711.19.310.910.510.110.012.413.712.58.36.7
£#Bifc
9634182316482148251517188630231424181491181715202432
it m
Inf + HRF + SIInf + post tr sySI + post tr syTh b + SITh b + SIInf + GVHDbleedingRI + SIToxicity, RISI = LISI+ 11SI+ 11Inf + GVHDToxicity = RISI = LISI = 11LI + SISI+ 11SI+ 11Inf + GVHDSI+ 11SI+ 11SI + IISI+ 11LIRI + cerbredema
io a afiC 18 20 0
Table-5 Exposure dose and herpes simplex, incidenceA correlation between exposure dose incidence rateof herpes simplex was observed.
(Gy)
01143
66.677.7
100
0-4.04.5-5.05.0-6.06.0-8.08.0-9.0
>9.0
3 - 4 0
0
- 6 5 -

X kfe
0.
£:
3) 17
FU y
4) t
14-30
0 Itl C
c tub 7
mm & 2-35)
13
T a b l e - 6 Eye c o m l i c a t i o n s f r o m r a d i a t i o nexposure.Distinct eye changes due to exposureare described in frequency (%)
Vn m
(1-3B1)
(10—15B a )
(15-170 @)
(35-55 H 1 )
(100)
6.1 39.5 100 100
20.9 80.9 100*
18.6 100 100*
16.3 66.7 100*
4.6 52.4 100*
48.8 95.2 100*
32.6 74.4 100*
4.6 - 100
13.9 25.1 100
4.6 23.5 100
>K 1 . 2 - 1.5 40
t
tzo
- 6 6 -

Table-7 Grouping of the beta-burm patients.According to the condition of exposure the beta-burn patientsare classed into four groups.(Adopted from: A. Barabanova andD. Osanov, 1990)
(Gy) (Gy)
I :
I :
W :
(mvs±N :
2.0-5.8 8.0-10.0
60.0-90.0 25-28
4.0-12.7 100.0 10-12
250.0 35
9.0-14.0 200.0 5-10
2.0-11.5 150.0- 25-30 I-300.0
ft, 10
1'7V, 35
', 20
, 20-30
fc, 12-15
60%b. s . -
, 25-30
Table-8 Severity correlation of bone marrow syndrome and beta-burn.A correlation was observed between severity of skin burn andthat of bone marrow syndrome.
N
mii
Total
c*
20214331
115
50-100%
9310
10-50%
101591
56
1-10%
1322
Table-9 Cyclic development of skin burns.According to the severity repeated erythemas were observed.
mmmm
1-2B
5-8018-210
35-4O3i(±49-6O0
40
2 ~ 3 HIS
, ±81.
\ZM 9 ^ " t ^ \ i
3 - 4 HS(±
a# , %> < 8 ~ 21 a
(IS), KM. *
. 2 ~ 3
- 6 7 -

2 .
3 .
•77 * u -
4 .
5.
. UT
• rGVHD (Graft Versus Host Disease:)
< fc,
2.
- 6 8 -

1) A. V. Barabanova and D. P. Asanov: Int. J. Radial Bio!., 57, 775-782 (1990).
2) A. K. Guskova et al: UNSCEAR 1988 Report to the General Assembly, with annexes " Sources, Effects
and Risks of Ionizing Radiation ", UN, 613-631 (1988).
3) A. K. Guskova and A. E. Baranov: Berzelius Symposium XV, 157-165 (1988).
4) G. D. Seldovkin and A. E. Baranov: Actual Problems of Transfusiology, 94-99 (1990).
- 6 9 -

3 . f- x ;l// 7V U *&^ b^S - ft A
Learned from Chernobyl Accident - Intervention
Hiroshi Yasuda
The 3rd Research Group, National Institute of Radiological Sciences
4 - 9 - 1 Anagawa, Inage-ku, Chiba 263, Japan
ABSTRACT-It is considered that health and social damage as seen in the Chernobyl
accident could be avoided by establishing a clear framework for intervention against
contamination. The framework must be easy to understand to be accepted by all the people
concerned. This study presented a process of decision-making on countermeasures against a
regional-scale soil contamination. This process put an emphasis on 1) Clarification of
responsibility and intervention principles, 2) Application of probabilistic techniques into
individual dose estimation, 3) Reduction of social burden. Examples of decision-making were
also presented for a simulated ground surface contamination.
(summing up)
(liquidator) #ffl^O$f±*< £gW\ 28 Aft&&&gX'Wt:LfcZ t
- 7 0 -
1 .
, rfr&j t
ICRP Publ.
?£ [>AJ t/c> IAEA(BSS)te,
tz
^ (authorized practice)
(1)
(2)
(3)
O 3
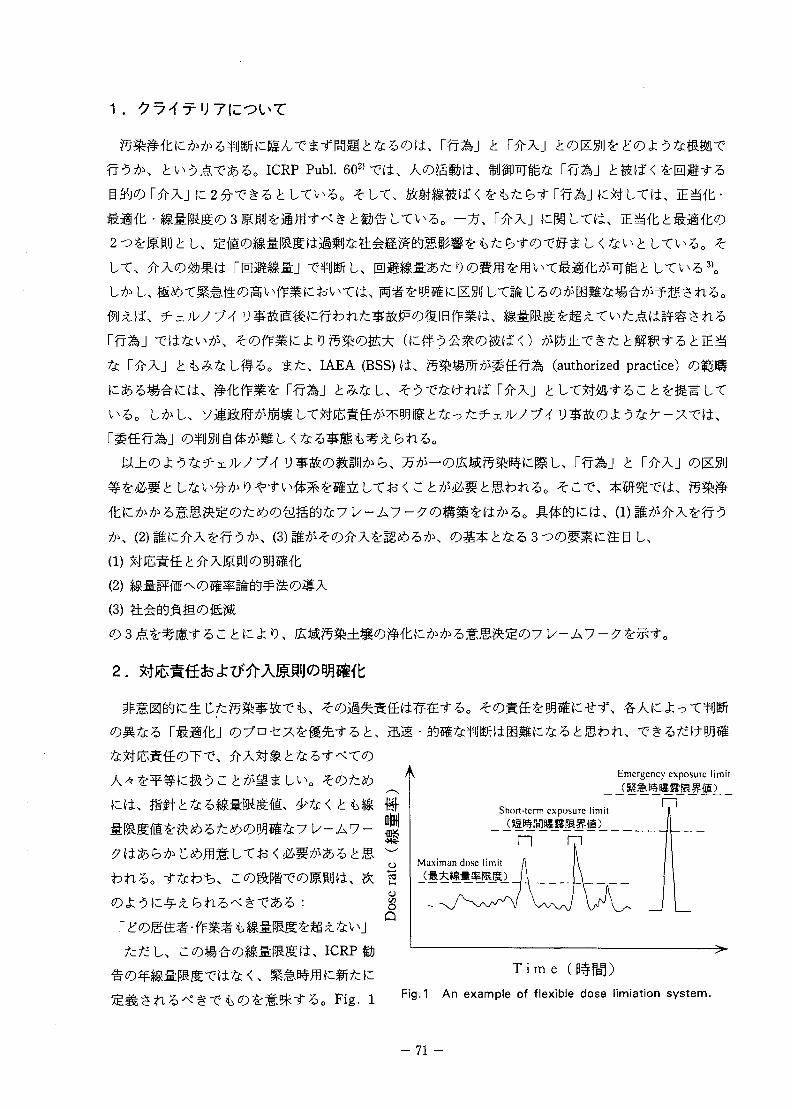
2.
Emergency exposure limit
Short-term exposure limit
n nMaximan dose limit
#
e4J1/3O
Q
T i m e ($%
Fie 1 FiQ-1 A n example of flexible dose limiation system.
- 7 1
to [Sv] ii,
DA
workerx F'conv
x Csoilworker
C ZX\A \±J Cm 2 ] ; aclean
(l)
[m2 man"1 hr"
• ^ worker [man]; F'c
CSV yr"1 per Bq kg"1] X
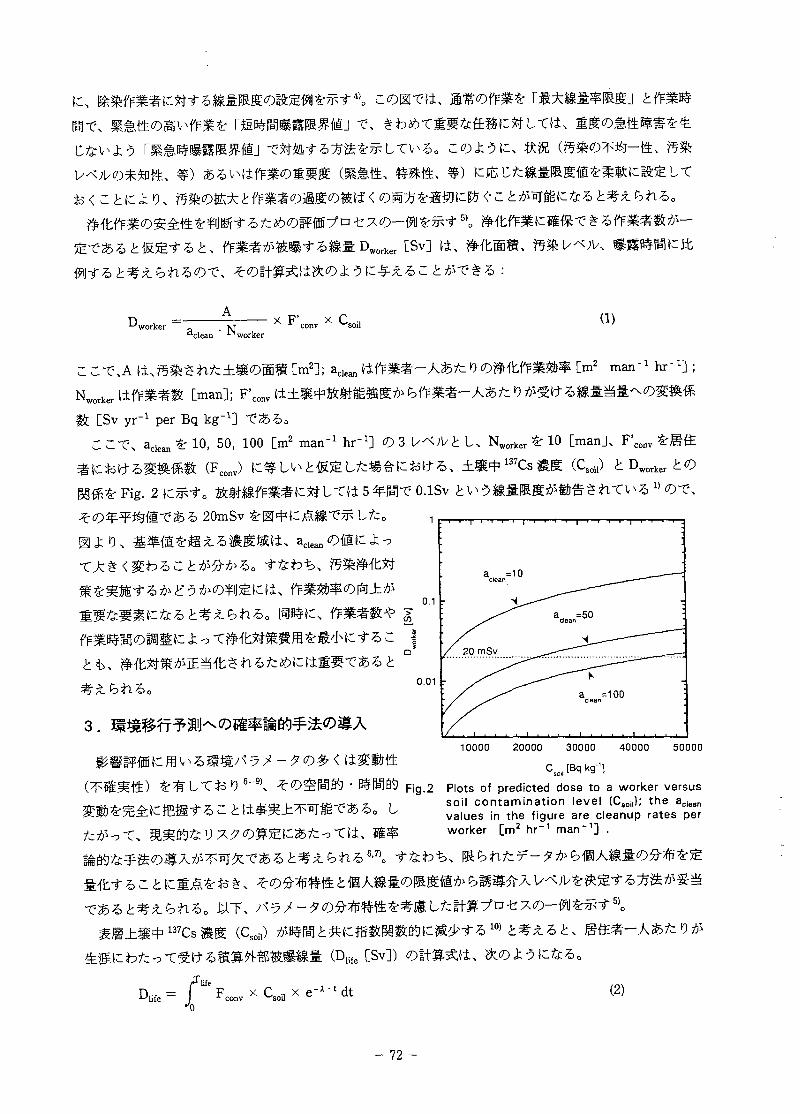
CZX\ aclean 4- 10, 50, 100 [m2 man"1 hr"1] U Nworker % 10 [man j , F'conv ^r137Cs J | l £ (Csoil) i: Dworker
^ Fig. 2 fc
20mSv SrH
3.
1
0.1
0.01
. I I • 1 • . 1 . . I
a =10clean
/ 20 mSv _- - -
/ . ,
_ _ _ —
j4___—•—
aciMn=100
•
-
t f L T f c 0 6"9)x
10000 20000 30000 40000 50000
C50ll [Bq kg"1]
Fig.2 Plots of predicted dose to a worker versussoil contamination level (Csoi|); the ade8nvalues in the figure are cleanup rates perworker [m2 hr"1 man"1] .
137Csftg (Csoil) ^
(Dae CSv])
= I x n * x e~ (2)
- 7 2 -

99.99
99.9
99
9590
8070
50
302010
5
1
.1
.01
. 137Cs
Normal: p=0.002Log-normal: p=0.907
i , , i
[y];
1 ] ; csoiltit = o (m
kg-1]; x i±mm±m137Cs fr
i37cs
[Sv yr-1 per Bq
±m* 137csais[y-1] -c-
hi ~~In2
Wsoil xsoil
Kd)(3)
;£ [L m-2 y" 1 ] ;
[kg m - 2 ] ; 0 [L kg"1]; Kd (±±l
kg" 1 ]
10 = 103 10'
K, [L kg ']
Fig. 3
137Cs
Fig. 3 Probability distribution of cesium (Cs-Kd)Kds obtained for 36 agricultural ± S h a j j ^ , . W f l k
soils collected in Japan; *0,
p value in the graph means the
Shapiro-WilkVest"as t^elch 5 . Cdistribution type.
O> Cs-Kd
f? 5 d t ft
< ,
1.0
0.8
0.6
0.4
0.2
95% (K=8.74x10-
50% (K =1.85x10'd
5%\K =3.91 x 10²)d
(DU { e)
(Csoil)
K d t t , Fig. 3
, 5, 50, 95
0,
2000 4000 6000 8000 10000
C^Pqkfl-1]
Fig. 4 Predicted life-dose for a resident as a function ofCsoii; the resident is assumed to be exposed for30 years without shielding.
s 0 . IK® •
- 7 3 -

* ex ' ^ r e s iex ' ^residents
[man] tr
i C 350mSv16)
, *&4.1 x io3Bq
LX ft F , ^
4. a
. m£
1 0 0 0
10.0 -
(Nex [man])
(4)
(5)
ig.5 |C
r
'• 1
S -
; Safety level (C safe)
1.0U-
0.14080 4090 4100 4110 4120 4130 4140 4150
Fig. 5 Predicted number of residents who will getmore then 350 mSv in their lives as a functionof C1O|,
(Csoil) #
- 7 4 -

(Ycomp [y]) \±,
Y = _ -— 1-1 comp A J
(6)
, tiJflJ-C-3Jffl L fc . [Bq kg"1] £§l(Mcomp[$])
Mcomp — mcomp X *comp X ^resident
fl i:
t U Kd
6 (C^-fo !I
5. 50. 95 —
C$ man"1 y"1]
Mcomp
(7)
de %• 4 .1 x 103 Bq k g " 1
\ C^, <r>m$L t LTFig .
Fig.7 K
5 .
5 108
4 108
„ 3 10E
10e
L 0
50% (K =1.85x10³:
95% (Kd=8.74x10³;
m =50,000 [$ man'1 yr'1]
4000010000 20000 30000
Csoi|tBqkg-1]
Fig. 6 Estimated total compensation cost as a functionof Csoil.
T30}
OCo
205
^3
—mtLx, <o
? Access-proh ibitedg| (Relocation) |
Compensation(Evacuation)
Contamination level
Fig .7 Schematic diagram of countermeasures related tosoil contamination level and number of residents.
- 7 5 -

Table-1 Parameter values used in the decision-making process.
Parameter definition value*
Th half-life by radioactive decay
downward water velocity
areal surface soil density
soil water content by weight
individual life expectancy
couversion coeff. from radionuclide cone, in
surface soil to dose equivalent per resident
number of residents
annual compensation cost per resident
residential area
number of workers involved in cleanup
3.96 x 10~6
30 [y]
740 [L n r V 1 ]
240 [kg m-2]
0.14 [L kg'1]
30 [y]
[Sv yr"1 per
Bq kg-1]
100 [man]
50,000 [$ man"1 y"1]
106 [m2]
10 [man]
*The values of the vw and the 6, are taken from Hoffman and Baes10);the wsoil USNRC13'; and the Fconv, USDOE14).
u, 38,594-596,1996.
2) ICRP: ICRP Publ. 60 (1991).
3) ICRP: ICRP Publ. 63 (1991).
4) Yasuda, H.: A decision making for radiological protection in a semi-natural radiation environment,
Proc, International Symposium on Radiation Safety, pp. 43-50, 1996, 9., Moscow.
5) Yasuda, H.: A decision-making process for surface soil cleanup: Determination of derived intervention
levels, Jpn. J. Risk Anal, 7, 74-80, 1995.
6) Yasuda, H., Uchida, S.: Apparent non-linear relationship of radionuclide concentration in between
crop and soil, IAEA-SM-339, 259-267, 1995.
7) Yasuda, H., Uchida, S.: Statistical analyses of soil to plant transfer factors: Strontium and cesium. /.
Nucl. Sci. Techno!., 31, 1308-1313, 1994.
8) Yasuda, H., Uchida, S.: Statistical approach for the estimation of strontium distribution coefficient.
Environ. Sci. Technol., 27, 2462-2465, 1993.
9) Yasuda, H.: Effectiveness of Electric Conductivity for Estimating Distribution Coefficients of Strontium
- 7 6 -

and Cesium, /. Nucl. Set. TechnoL, 33, 166-170, 1996.
10) Hoffman, F. 0.: Baes, C. F. NUREG/CR -1004, ORNL, Oak Ridge (1979)
11) Yasuda, H., Uchida, S., Muramatsu, Y., Yoshida, S.: Sorption of manganese, cobalt, zinc, strontium,
and cesium onto agricultural soils: Statistical analysis on effects of soil properties, Water Air Soil Pollut.,
83, 85-96, (1995).
12) Shapiro, S. S. and Wilk, M. B.: An analysis of variance test for normality, Biometrica 52, 591-611,
1965.
13) U. S. Department of Energy (USDOE). External dose-rate conversion factors for calculation of dose
to the public, USDOE, Wachington, D. C. (1988). p. 152.
14) U. S. Nuclear Regulatory Commission (USNRC). Regulatory Guide 1. 109, USNRC (1977).
15) IAEA: Safety Series 81, IAEA (1986).
16) International Advisory Committee: The International Chernobyl Project; An overview, IAEA (1991).
17) Yasuda, H.: A consideration on internal dose evaluation and intervention based on a surface
contamination concept, IAEA-CN-63/9, 1996.
18) Yasuda, H.: Transfer models in a soil-plant system used for environmental impact assessments, / .
Nucl. Sci. TechnoL, 32, 1272-1283, 1995.
- 7 7 -

Influence of Radiation Exposure on Our Society and Epidemiological Study
Yasuhiko Yoshimoto
Division of Human Radiation Environment, National Institute of Radiological Sciences
4 - 9 - 1 , Anagawa, Inage-ku, Chiba 263, Japan
ABSTRACT-A brief epidemiological review of risk assessment of radiation was discussed
with respect to two periods; before and after the establishment of the United Nations Scien-
tific Committee on the Effects of Atomic Radiation. Selected topics were the studies of atom-
ic bomb survivors and people living in the contaminated areas due to Chernobyl nuclear pow-
er plant accident. An ethical view to ensure that potential social benefits of epidemiology are
maximized was emphasized as well as a scientific view. On the other hand it should be recog-
nized that there are the limitations of epidemiological studies on the basis of the observations
on man in which the animal - experimental setting generally cannot be controlled over. Inform-
ing people about the professional confidence and caution of radiation exposure is needed to
resolve social concern associated with low dose, low dose rate of radiation. Also there are
guidelines for the investigation of clusters of adverse health events. In the future an appropri-
ate strategy for decontamination might be expected to unusual radiation exposure as a conse-
quence of a nuclear power plant accident. Justification for the implementations can be deter-
mined only through the assessment of the effects both on the environment and health of hu-
mans after the accident.
- 7 8 -

1. " i &
Farr1893 mzmm u v ^ v F • o X
&LX^Z> t'&frtiZo M*tft<D John Snow fi, 1849(Lambeth ft ,h Southwark & Vauxhall ft) #
—tt (Lambeth
tt) ^ 1854M> M*ig^P>tt*&:6rS^t-CV^y!:3%«^Cov^T^l/7<7)5Et:$;S:Jt^S!L^:o Robert Koch #
tuiuimtti,
m 1 UNSCEAR
1556
1883
1895
1896
1898
1915
1920
1921
1922
1925
1928 ICRP
fijfcj?!
1938
1945
1954
1955 UNSEAR Jg.iL
[B#]
1956
1958 UNSEAR ffi.-
Note: UNSCEAR
ICRU
ICRP
2 .
a.
b .
- 7 9 -

ZM Bradford Hill (OW^YK 1fc%WM&ftA,<0 *.*> K
3.
(UNSCEAR)
m^ (ICRP)
1 . UNSCEAR IftjSliUgtr81
&*fixfr
(ICRU)
1 9 2 8 - 1950
(mi)
2 . UNSCEAR
UNSCEAR
UNSCEAR (1958-1994^) - ^ M f i . IS
r 1990 ^ fFSc L/c0
UNSCEAR o^iz:^^^ 30 ^&K 1986
- 8 0 -

-? i)
UNSCEAR 1993/1994 5'6)
3 . Bl
1938
LX 1945
K. «fcTNT ^ j f t 2Okt tc
LT
1945 1947
1975
u
t
t LX 1958 c*tJ 2 A C 2
1945 1950 1955 1960 1965 1970 1975 1980 1985 1990 1995
T57D T65D DS86
(F.)
(1957^, (1981^) (1994^)
Note: T57D. T65D, DS86 =
- 8 1 -

2)
U II
, 1951
tK 1950 ~ 1957
ments at Nevada. BREN)
H.H.Rossi
BREN
T57D, T65D, RV DS86
Harry S Truman
(Bare Reactor Experi-
TlchibanJ
3) Ji
1967
2)
4 )
&mO Pierce DA P, U) \m
86,572 A (249AtifilflL^ 7,578
Sv
^lj, 4,565
» t t 50,113tzo Z<D\H, W
1950 ~ 1990 ^
0.005
, 176
- 8 2 -

% (376A)
DS86
RBE
1,100
2km
8
Otake M, Schull WJ <7)^^«12) T i± 17 fl
( t f t t tS t ) © t20S^ f> Pierce DA et al., Radiation Rwsearch 146: 1-27, 1996,
30
0- 9%10-19^20-29;?30-39:?40-49:?
£;50;?
(1950)
17,82417,55710,88212,27013,48914,550
86,572
m
(1991)
94%
86%77%
51%
16%
1%
56%
J9T V\ va ?K
ffikAs(D^&i&. 3i ^£ -31 @ §? ifSJ IM "t "7 S. C/ }^ /£ fl
SjfllS ? E t ^ X c,s,a,y+EAR (d,e,s,t)
S ^ H H U 7* 9 X c,s,a,ytk%M8M&V 77 EAR (d,e,s,t) = [d + 6 d2]f (e,s,t)S 0.005 Sv S9Et^ij 176 #|JtSsSSIJEt:^ *tl 78 ^|| = 176 x 44 %
@^**^ ? E t ^ X c,s,a,y [ 1 + ERR (d,e,s,t) ]§ $&M^. 'J 7 9 X c,s,a,yJfel+^IM^U 7N^ X c,s,a,y ERR(d,e,s,t) = X c,s,a,y ^(s)d g(e)£ 0.005 Sv Sf 9E t ^ 4,565JiS3if!l5Et:$ m 376 09 = 4,565 x 8 %
Note : SI^JeS- t 'T lUQai^ c = city, s = sex, a = age at risk, y = year, d = dose, e = age at exposure,t = time since exposure, EAR = excess absolute risk, ERR = excess relative risk. ^ fc s P (s), f (e,s,t),g (e)
S1631
JBK Otake M, Schull WJ., Int J Radiat Biol 63: 255-70, 1993.
(Gy)
<0.01
SO.01993418
69
101
248
(
(
(
(
(
6)
5)
0)
2)
3)
1745
12
26
7
( 2)
(13)
( 0)
(12)
( 1)
13
0
3
0
(1)(3)
(0)(3)
(0)
1011
466
81
130
255
( 9)(21)
( 0 )
(17)( 4 )
tf- 1,411 (11) 62 (15) 4 (4) 1477 (30)
Note: ( )
- 8 3 -

1,500
14)
4.
1988^oUNSCEAR
/•7V
0.8
0.7 r
0.6
0.5
at
ean 0.3
0.2
0.1
o.o
-? U
: 2.4mSv J;
^J 70mSv
£ o 1989f
h 30km lUjtt5137Cs
(IAEA)
U H30
9 t
z\C 30km
- -7°
Illllll-UNSCEAR
- 8 4 -

<o853 A , (ICi/km2 fcTF 6 803 1,656
15)
(1994^
- vt?
17)
(IPHECA)J
14 y a>p> 10 4 f :
1994 - e ^ 7 L/co 1996^
j t i u EC/IAEAAVHO £^BE5£$#
(1995 tt&xm800
m
ft* .fc •>> LT, < O l H j - i:fiti t ^
•77,94
X<7 (RR, relative risk)Maclure M. Am J Epidemiol 121:343-350, 1985.
T) Science
1987 ~ 1995
RRRRRRRR
= OO
= 100= 10= 1
90 <RR<1109 < RR < 110.5<RR< 2 .0
RR MOO
RR> 10RR> 1
SB
RRRRRRRR
Et t*
< oc
*100* 10* 1
U
- 8 5 -

Non-Hodgkin >J
(± 1957
v ymmK1990
(BNFL)
1993
1989 h 7v?<D ftfc d t v
t % Z
i%
- 8 6 -

CDC. MMWR, 39:23-1990.
« T
UNSCEAR 0.2Sv
, ICRP1990
A)
ICRP1990 [ tTW tbft/c C i: (C t LT7 =7
- 8 7 -

^, 1990
&K 20
20
1995 ^ C BALB/cJ
fc 26)
i^^-se/^
—ot 27)
- ^ u
V
1) MacMahon B, Pugh TF. Epidemiology; Principles and Methods. Little, Brown & Co., 1970.

2) Rothman KJ. Modern Epidemiology. Little, Brown & Co., 1986.
3) Wakeford R, Tawn EJ. Childhood leukemia and Sellafield: the legal cases. J. Radiol.Prot. 14: 293-316,1994.
4) Edited by Coughlin SS, Beauchamp TL. Ethics and Epidemiology. Oxford University Press, 1996.
5) United Nations. Sources and effects of ionizing radiation. UNSCEAR 1993 Reports, United Nations,
New York, 1993.
6 ) United Nations. Sources and effects of ionizing radiation. UNSCEAR 1994 Reports, United Nations,
New York, 1994.
7 ) International Commission on Radiological Protection. 1990 recommendations of the ICRP. ICRP
publication 60., Pergamon Pres, Oxford, 1990.
8) mm±%w.Mo s * ftjwupm, 1896-1944^fm^e>o m a ^ u a r a ^ 1988.
9) mM%k&m%&mmmw,tsmmw,m£mo wMm^moA^mw i992o * # S L 1992.
10) AUM^Jo jmm-tOffffHffio ftte&S 22:467-486, 1987.
11) Pierce DA, Shimizu Y, Preston DL, Vaeth M, Mabuchi K. Studies of the mortality of atomic bomb
survivors. Report 12, part I. Cancer: 1950-1990. Radiation Research 146: 1-27, 1996.
12) Otake M, Schull WJ. Radiation-related small head sizes among prenatally exposed atomic bomb
survivors. Int J Radiat Biol 63: 255-70, 1993.
13) Yoshimoto Y, Delongchamp RR, Mabuchi K. In-utero exposed atomic bomb survivors: cancer risk
update. Lancet 344: 345-346, 1994.
o mmmmmo^m^^f^^timt^^mm^ 1946-1990 o Mmm.
299-304, 1996.
15) Rep. Int. Advisory Committee. The International Chernobyl Project, an Overview, Assessment of
Radiological Consequences and Evaluation of Projective Measures, IAEA, 1992.
16) pmmxb. f-xjwjjvm&frbiosz. mmmmmm^mt>^B^ommm^mt!0 m-3 Erase,B ^ K ^ ^ f f c 38: 184-204, 1996.
17) ikttm.%-ww,£o m^£m, ^-xivj-74 v&h IO*P : m&<Dmw<Dm%o &%mw 39:281-290,1996.
18) Maclure M. Popperian refutation in epidemiology. Am J Epidemiol 121: 343-350, 1985.
19) RTaubes G. Epidemiology faces its limits. Science 269: 164-166, 1995.
20) Roger Bernier. Epidemiology Monitor 17(6): 1-14, 1996.
21) Graham T. The Brown and Williamson documents: the companys response. JAMA 274: 254-255, 1995.
22) Wakeford R, Tawn EJ. Childhood leukemia and Sellafield: the legal cases. J Radiol Prot 14: 293-316,
1994.
23) CDC. Guidelines for investing clusters of health events. Morbidity and Mortality Weekly Report, 39:
1-23, 1990.
24) Cardis E et al. Effects of low doses and low dose rates of external ionizing radiation: cancer mortality
among nuclear industry workers in three countries. Radiation Research 142: 117-132, 1995.
25) Rob Edwards. 'Hot' report leaves France out on a limb. New Scientist. 147(1993), P. 9., 1995.
26) Cattanach BM et al. Investigation of lung tumour induction in BALB/cJ mice following paternal X -
irradiation. Int. J. Radiat. Biol. 67: 607-615, 1995.

27) Shigematu I. Epidemiology in Japan and future problems. J Epidemiol 6: S3-S7, 1996.
28) Perera FP. Molecular epidemiology: insights into cancer susceptibility, risk assessment, and prevention.
JNCI 88: 496-509, 1996.
29) Smigel K. Beta carotene fails to prevent cancer in two major studies; CARET Intervention stopped.
JNCI 88: 145, 1996.
- 9 0 -

•fe v is 3 VIE
Some points of issue on risk assessment for radiation protection
Hidenori Yonehara
Division of Human Radiadon Environment, National Institute of Radiological Sciences
9-1, Anagawa-4-chome, Inage-ku, Chiba 263 Japan
ABSTRACT-It has been reported that not only health effects directly induced by radiation
exposure but political, economic and social effects were caused in various ways by the Cher-
nobyl accident. Taking account of significance of these indirect effects of events with
radiadon exposure, risk assessment for radiation protection should be performed on the basis
of more comprehensive index of detriments. Relative magnitude of miseries which people per-
ceive could be useful for an unified index of harm. Because magnitude of miseries due to
different harmful events depends on personal sense of values and perception, it is necessary to
use average value of the magnitude which are examined with investigation by questionnaires.
There is a large uncertainty in estimating risks from exposure to low level radiation. If a risk
from some radiation exposure is possibly over estimated in order to take safety side for radi-
ation protection, a risk from other serious risk sources could be misesteemed. Therefore
these uncertainties should be considered appropriately in comparing risk for decision making.
For example, effect of indoor radon was estimated to be more serious than other natural radi-
ation sources in spite of large uncertainties in estimating risk. From such points of view, the
problems in a risk assessment for radiation protection were discussed.
- 91 -

Ku
H
1.
(somatic effect)
(hereditary effect) <D&X'&Za LfrL, Ztl<b<D&W#&.CfctiibK^
mh& dCRP) }±, 1977^t&^1)^C^V^T
(detriment) O H i ^ i A L , a^fifec: "9 i:
L•CV^§O ZHDWMK&^X,
1977
L<
U ^
F • ( / / / ) • ( 2 - k )
, F :
k :
- 9 2 -

tilt, IXT<D i o K^ffcJEtfMCo^-tifcJE^&S C5
5|$ (P) CSo^Tl^o
P =
= F + k • (1 - k ) • (F / k)
= F • ( 2 - k )
IAEA O ^ ^ V U - X 3 ) T*fi, f£S
(multiattribute utility analysis) 4rJi$|L"CV^S*^
2 .
L,
- 9 3 -

Lie
3.
v 19
t
J C> 9
J; 5 K: R O T O 2:
0,
SM t
9 £ri>& 0
- 9 4 -

10
1
0.001
10 '
1 0 '
60
o A aD »o oX IS -f
s ,
Q ^
B S f
oo
1000
10
1
to\ 0.1
e&0.001
10"" r
10''
r j .) !r i ma sjr j ,• iD i r & *: ; i : m °
\ \ : • ' .
r | j i Ii i i : i
• • i i '•• !
ID; I !
i i i : ]
O A DD »O OX B -f+ B .A • x
" ° 1
• m
B C D E F G H I J B C D E F G H I
(ROffift) 113
i 1
i i
- 1 H
: }---«
3
1
-BSD-«f—
; i °
B
•b
•f...-.
oi
|-
<b
- B S -
+T
-a
—
-1
!!
i
' j|in
•oil
I
i
•?-•i -
|1
a
1
1
•mp-
•KD
^ -
-f-
_
-f-
—•— j _ _
I D
i
1 :
-
•
4 -m? :
o
D
o
X
••
A a
T
0
B-f
o H
50 - r
40 - T 1
30 - - *
2 0 - ; - • - - '
10 -
IP
1000
10
0.1
0.001
10'5
10'7
10"S
• 4. ' i ; • ' i
.S?_..... : » . .
..A.....
o A Da »o o
r
D A
• 81
A B C D E F G H I JA B C D E F G H I J
05
10 ' - \
8000 f
6000 -
4000 -
2000 -
i. ,
I
- • • (3— <>--
i I
-Jfft;-- • ! • - -• :
—#ffl &i
o; i—a—io-
!
"""1':
:
; • • •
I
..„..;...
Ol
—if)
j|
1i•
i
i
• • ? • • -;;
i__1
j
.„.!
•i
i
i
i
. . - . ;
„.*>*—
•:
j...••
i
\'•
1
1
i
ii
!
•
:
^
i
i
;1
—i. . . .
•!••••
Ii
.....„„*...
j
-• :•••
T •J j
4_
•
|
- '••
i
•
_ _ ^
. . 1
• - • - ( - -
•
4i
*1
«33-
1 i '
;
•
|
I
j
- A C T V - —
• i
-•4^0 -
o A a
• »O O
X B -f
X Q ^
B O
D ^
• Bf
~ 10 =
EC
{5 1000
§ 10
0.1
0.001
""-I ""T ' 1 •1 ""\ '"•"I *T ""T ' ""1 '""1
t { "
- f i•4—:• • • • ! • • • • - • •—!•
! • - * .
T rr»r !••
•i -r r
i i x ..i |. i j
. . . J . . . - J I . . . J , . . . j , . . . j I . . . J , . . . J , . , . J . . . . J I I 1 . 4 I l . l . i M . . J . - — i ...
A B C D E F G H I J
- 9 5 -

L^U
i
>sf u
2 .
- 9 6 -
(PC: Proba-
bility of causation)
3 . -7 .
, EPA
L#>U
Hv/WLM)
| g ^ $ / G y ) *%:
, ICRPPublication65
< c^
Lfc5 F
(RBE)
- 97 -

0.68
>, 2
RBE
(RBE)
ft m
F 7 V X 7 * - ^ --> 3 v ^ S
yJN)K (micronuclei)
DNA ^ f i ^ ^ S i f
Po-210
JPJta&£Pu-238Pu-238Pu-238Pu-238
Pu-238Am-241Pu-238
RadonRadonPu-238
ffl IS * 3fc
humanChinese hamsterChinese hamsterChinese hamsterChinese hamsterChinese hamstermousemousemouseratSyrian hamsterrat
ratChinese hamster
in
ininin
in
in
in
inin
inin
inin
in
vitrovitrovitrovitrovitrovitrovitrovitrovitrovitrovitrovitro
vitrovitro
237
3
7
3
7
22
3
.5
.5
.4
.3
.6
RBE
- 6.0- 5- 10- 5- 10- 5.82
- 10.32
- 3- 92.4
n
10.9
W K %
Baredsen et al.6)
Baredsen et al.6)
Bamhart and Cox71
Thacker et al.8>
Barnhart and Cox71
Thacker et al.8)
Lloyd et al.9>
Robertson et al.10)
Hall and Heiu>
Thomassen121
Martin et al.13»
Brooks et al.14)
Brooks et al.14)
Jenner et al.15)
V
\ u
^ n
- 9 8 -

v i1) ICRP, Recommendations of the ICRP, ICRP Publ. 26, 1977
2) ICRP, Recommendations of the ICRP, ICRP Publ. 60, 1991
3) IAEA, Intervention Criteria in a Nuclear or Radiation Emergency IAEA Safety Series No.109, 1994
4) #{!§;, ftltfKKl.fcfc-jft&fcKlSN-* r^OJI^J tcHi-*#£, <KM*^±^Ktf±§#£> 1988
5) Pierce, D. A. et al., Studies of the Mortality of Atomic Bomb Survivors, Report 12, Part I . Cancer:
1950-1990, Radiat. Res. 146, 1-27, 1996
6) Barendsen, G. W. et al., Effects of different ionizing radiations on human cells in tissue culture. IE.
Experiments with cyclotron-accelerated alpha - particles and deuterons. Radiat. Res. 18: 841-849, 1960
7) Barnhart, B. J. and S. H. Cox. Mutagenicity and cytotoxicity of 4.4 - MeV a-particles emitted by pluto-
nium-238. Radiat. Res. 80; 542-548, 1979
8) Thacker J., Stretch, A., and Goodhead D. T., The mutagenicity of a perticles from plutonium-238.
Radiat. Res. 92: 343-352, 1982
9) Lioyd, E. L., Gemmell, M. A., Henning, C. B., Gemmell, D. S., and Zabransky, B. J., Transformation
of mammalian cells by alpha particles. Int. J. Radiat. Biol. 36: 467-478, 1979.
10) Robertson et al. Oncogenic transformation of mouse BALB/3T3 cells by pultonium-238 alpha
particles. Radiat. Res. 96: 261-274, 1983
11) Hall, E. J. and T. K. Hei, Oncogenic transformation in vitro by radiations varing LET. Radiat. Prot.
Dosimetry 13: 149-151, 1985
12) Thomassen, D. G., Seiler, F. A., Shyr, L.-J., and Griffith, W. C, Alpfa - particles induce preneoplastic
transformation of rat tracheal epitheal cells in culture, Int. J. Radiat. Biol., 57(2), 395-405, 1990
13) Martin S. G., Miller R. C, Geard C. R., and Hall E. J., The biological effectiveness of radon-progeny
alpha particles. V . Morphological transformation of Syrian hamster embryo cells at low doses. Radiat. Res.,
142: 70-77, 1995
14) Brooks, A. L., Khan, M. A., Duncan, A., Buschbom, R. L., Jostes, R. F., and Cross, F. T.,
Effectiveness of radon relative to acute 60Co r - rays for induction of micronuclei in vitro amd in vivo, Int.
J. Radiat. Biol., 66: 801-808, 1994
15) Jenner, T. J., deLara, C. M., O ' Neill, P. and Stevens, D. L., Induction and rejoining of DNA
double - strand breaks in V79-4 mammalian cells following gammer-and alpha - irradiation. Int. J.
Radiat. Biol., 44: 265-273, 1993
- 9 9 -

•fc v -y a vn i M*<o u
:LX-
Social Effects of the Tokyo Photochemical Smog and Occupational Lead Poisoning
Shunichi Araki and Mutsuhiro Nakao
Department of Public Health, School of Medicine, University of Tokyo
Hongo, Bunkyo-ku, Tokyo 113, Japan
ABSTRACT-Social effects of the Tokyo photochemical smog and occupational lead poisoning
were discussed based on our past studies. A total of 16 junior high school students of the s o -
called "Photochemical air pollution in Tokyo" were admitted to a hospital on June 1, 1972,
because of carpopedal spasm, tingling paresthesias, dyspnea, ocular irritation and anxiety
state. Physical and laboratory examinations disclosed tetany and unconsciousness induced by
respiratory alkalosis. Otherwise, low-grade fever, mild leucocytosis and transient proteinuria
were noted. The atmospheric concentrations of nitric oxide (NO) and nitrous dioxide (NO2),
examined four months later, were extremely high at the school and its environs. Later study
also disclosed dysfunction of alveolar-arterial gas exchange in those children. It was concluded
that anxiety reaction, precipitated by the physical effects of photochemical oxidants and
athletic performance, possibly led to many outbreaks of mass psychogenic systemic illness
(hyperventilation syndrome) among school children.
Medical consultation rates were compared berween 346 male lead workers and two groups
of non-lead workers (317 and 327 males) in a newspaper company where a serious industrial
dispute took place over health effects of lead. Maximal blood lead concentrations (PbBs)
ranged from 0.1/imol/kg to 3.6/imol/kg (74/ig/100g) with an average of 1.3^mol/kg in the
past three years. The consultation rate of lead workers was significantly higher than that of
both the non-lead workers, when the number of workers who consulted physicians or
dentists once or more for a year per 100 workers (general consultation rate) was compared.
Disease-specific consultation rates were also higher in lead workers for seven categories of
diseases and injuries such as hypertensive disease and peptic ulcers. When lead workers
were divided into three groups by PbB or erythrocytes delta - aminolevulinic acid dehydratase
(ALAD) levels, however, no significantly high rate was found in the higher PbB groups nor
- 100 -

lower ALAD groups in terms of general and disease - specific consultation rates. It was concluded
that the industrial dispute might have been a major cause of the high consultation rate of lead
workers.
It was emphasized that evaluation of environmental and psychosocial factors and of the
physical, mental and behavioral effects of those factors together with an epidemiological
study are essential for a control of social effects of environmental pollution.
1. itttblz
!Sfc (Recognition),
t &WWM (Evaluation), (Control) <D 3
(1967^) <om
2 . (Mass Psychogenic Systemic Illness)1"3'
18
Tokyo lay
Tokyo Intern«tLontIAirport
7\
, 2)
i; o KWfo* titzo
Junior Itlgh School •
O
Healch Center
Ketropol1 tanHljhu.y
1972
122
(Figurel)31 fe®36 A
Fig. 1 The location of a junior high school and theTokyo International Airport (Haneda), 197231
- 101 -

Table- 1 Atomospheric concentrations of nitric acid and nitrous dioxide for a week (1972)4'
-——^^atmospheric concentrations (ppm/day)
locations ~~ — ___^
Junior high school
Air port, adjacent
Kohjia health center, 1.4km apart
Control district (Setagaya)
Control district (Johto)
Nitric
mean
0.091
0.121
0.048
0.044
0.054
oxide (NO)
range
0.041-0.160
0.037-0.188
0.025-0.088
0.017-0.068
0.039-0.085
Nitrous
mean
0.090
0.076
0.028
0.032
0.043
dioxide (NO2)
range
0.061-0.134
0.037-0.112
0.025-0.031
0.025-0.043
0.033-0.064
(Tokyo Metropolitan Research Institute for Environmental Protection, 1973)
c&tt i6 A en 4 A, -k 12 A>9 Akm
1.4km
23.9 t:. U&3
12 m- is vtz0 29
0.07ppm
T a b l e _ 2
16 Table 22)Frequency of Symptoms Noted inSixteen School Children21
37.0
carpopedal spasm
li6lfe# 13 i&
k* Table 33) |C^-to fulfil pH
(PAO2)
CO2) <h^m^BE (PaO2)
- l iMJfl l^^^BE^II (AaDO2)
tl7Co
(Pa
, *5 J:
t 10
Symptoms
Chest discomfortHeadacheTachypneaExcited conditionParesthesiaXerostomiaChillOcular irritationLacrimationDizzinessStaggering gaitNauseaParalysis of limbs and trunkConsciousness disturbancePain in the extremitiesAbdominal discomfortCoolness in the extremitiesMuscular rigidityBlurred visionThroat sorenessNasal irritation
Number
13
1312
1211
119
7777
7666665
5
2
2
- 102 -
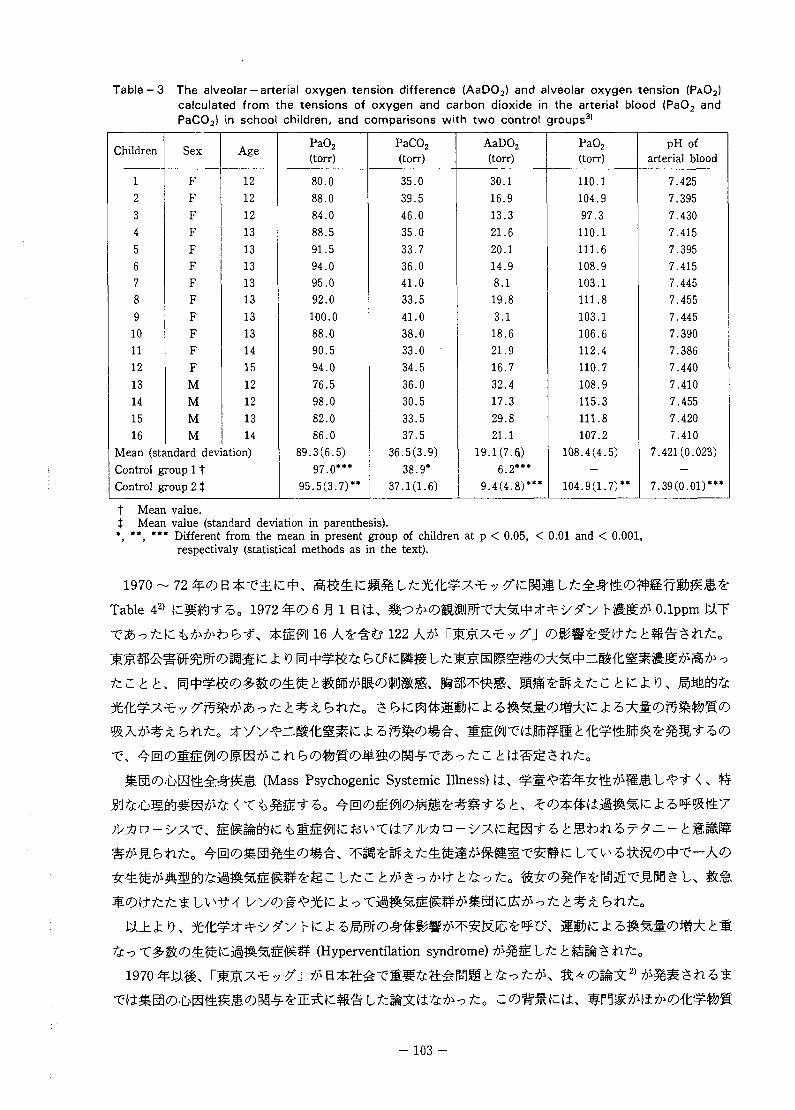
Table-3 The alveolar —arterial oxygen tension difference (AaDO2) and alveolar oxygen tension (PAO2)calculated from the tensions of oxygen and carbon dioxide in the arterial blood (PaO2 andPaCO2) in school children, and comparisons with two control groups31
Children
1
2
34
5
678
9
1011
12
1314
15
16
Sex
FFFFFFFFFFFFMMMM
Age
12
12
12
13
13
131313
13
1314
15
12
12
1314
Mean (standard deviation)Control group 11Control group 2 t
PaO2
(torr)
80.088.084.088.591.594.095.092.0100.088.090.594.076.598.082.086.0
89.3(6.5)97.0***
95.5(3.7)**
PaCO2
(torr)
35.039.546.035.033.736.041.033.541.038.033.034.536.030.533.537.5
36.5(3.9)38.9*
37.1(1.6)
AaDO2
(torr)
30.116.913.321.620.114.98.1
19.83.1
18.621.916.732.417.329.821.1
19.1(7.6)6.2***
9.4(4.8)***
PaO2
(torr)
110.1104.997.3110.1111.6108.9103.1111.8103.1106.6112.4110.7108.9115.3111.8107.2
108.4(4.5)-
104.9(1.7)**
pH ofarterial blood
7.4257.3957.4307.4157.3957.4157.4457.4557.4457.3907.3867.4407.4107.4557.4207.410
7.421(0.023)-
7.39(0.01)***
t Mean value.t Mean value (standard deviation in parenthesis).*, **, *** Different from the mean in present group of children at p < 0.05, < 0.01 and < 0.001,
respectivaly (statistical methods as in the text).
1970 ~ 72
Table 42) £ 3 1972 O.lppm
16 122
, m*&&<D&WL<D£fiz£&&ft Z tKk 0.
X\
(Mass Psychogenic Systemic Illness)
u
(Hyperventilation syndrome)
- 103
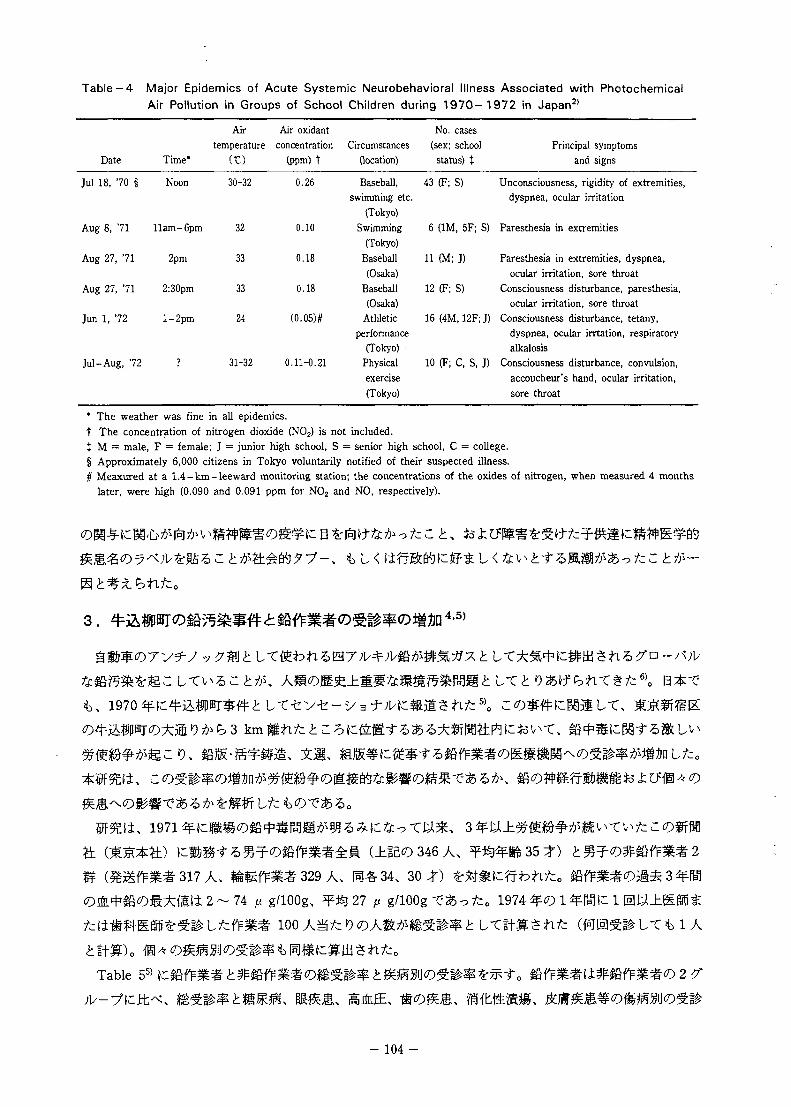
Table-4 Major Epidemics of Acute Systemic Neurobehavioral Illness Associated with PhotochemicalAir Pollution in Groups of School Children during 1970-1972 in Japan21
Date Time*
Air
temperature
(TC)
Air oxidant
concentration
(ppm) t
Circumstances
(location)
No. cases
(sex; school
status) X
Principal symptomsand signs
Jul 18, 70 §
Aug 8, 71
Aug 27, 71
Aug 27, 71
Jun 1, 72
Jul-Aug, 72
Noon
11am-6pm
2pm
2:30pm
l-2pm
30-3
32
33
33
24
31-:
0.26
0.10
0.18
0.18
(0.05)/f
0.11-0.21
Baseball,
swimming etc.
(Tokyo)
Swimming
(Tokyo)
Baseball
(Osaka)
Baseball
(Osaka)
Athletic
performance
(Tokyo)
Physical
exercise
(Tokyo)
43 (F; S) Unconsciousness, rigidity of extremities,dyspnea, ocular irritation
6 (1M, 5F; S) Paresthesia in extremities
11 (M; J) Paresthesia in extremities, dyspnea,
ocular irritation, sore throat
12 (F; S) Consciousness disturbance, paresthesia,
ocular irritation, sore throat
16 (4M, 12F; J) Consciousness disturbance, tetany,
dyspnea, ocular irrtation, respiratory
alkalosis
10 (F; C, S, J) Consciousness disturbance, convulsion,
accoucheur's hand, ocular irritation,
sore throat
* The weather was fine in all epidemics.
t The concentration of nitrogen dioxide (NO2) is not included.J M = male, F = female; J = junior high school, S = senior high school, C = college.
§ Approximately 6,000 citizens in Tokyo voluntarily notified of their suspected illness.# Meaxured at a 1.4-km-leeward monitoring station; the concentrations of the oxides of nitrogen, when measured 4 months
later, were high (0.090 and 0.091 ppm for NO2 and NO, respectively).
L
3 .
LXt
h 3
317 A, %$
2 ~ 74329 A , m^s^ 30
27 ? g/ioog 1974
Table
^ m^mmtmmm,
- 104 -

Table-5 General and disease-specific consultation rates per 100 workers for a year5'
General and disease - specif ic consultations Leadworkers
Non-lead workers
Forwarding Printing -workers machine
workers
General consultation
Disease - specific consultaationa
I . Infective and parasitic diseases (001-039)
I . Tubeaculosis (010-018)2 . Tinea pedis and other dermatophytosis (110)
3 . Others
E. Neoplasms (140-239)
4. Malignant neoplasms (140-208,0230-234)5 . Benign neoplasms and othersHI. Endocrine.nutritional, metabolic and immunological diseases
(240-279)6 . Diabetes mellitus (250)
7. Others
F . Diseases of blood and bolld-forming organs (280-289)
8. Anemias (280-285)
9. Others
V. Mental disorders (290-319)
10. Mental Disorders (290-319)
\I . Diseases of nervous system and sense organs (320-389)II. Diseases of central nervous system except spinal cord
(320-334, 337-349)12. Diseases of spinal cord and peripheral nerves
(335, 336, 350-359)13. Diseases of eye (360-379)14. Diseases of ear and mastoid process (380-389)MI. Diseases of circulatory system (390-459)
15. Hypertensive disease (401-405)16. Isghemic heart disease (410-414)17. Cerebrovascular disease (430-438)18. Hemorrhoids (455)19. Others
W. Diseases of respiratory system (460-519)
20. Acute respiratory infections (460-466)21. Pneumonia, bronchitis, emphysema and asthma (480-496)22. Others
K. Diseases of digestive system (520-579)
23. Diseases of teeth and supporting strucres (520-525)24. Peptic ulcer (531-534)25. Other gastroduodenal diseases (535-537)26. Appendictis (540-543)27. Diseases of liver, gall bladder and pancreas (570-577)28. Others
X. Diseases of genito - urinary system (580-629)
29. Nephritis and nephrosis (580-589)30. Others
87.0
1.5
72.6*
1.0
76.9*
0.915.6
1.7
0.00.0
2.2***11.0
1.0
0.00.0
2.7**17.0
2.4
0.00.9
5.80.6
0.30.3
2.81.3
1.00.3
2.4*2.4
0.00.3
2.7
0.0
5.2
24.38.7
9.81.20.03.23.5
55.51.56.9
37.05.8
12.40.05.2
13.3
0.64.1
0.0
5.4
15.1***4.7
4.7*0.00.37.9*2.2
49.85.16.6
24.9**4.4
12.30.03.26.3**
0.66.0
0.0
4.0
22.210.3
6.11.20.62.42.4
62.06.7**6.7
31.31.2**
14.91.8»4.6
14.0
0.32.1
- 105

Table-5 (continued)
General and disease - specif ic consultations Leadworkers
Non-lead workers
For wording Printing-workers machine
workers
XII. Diseases of skin and subcutaneous tissue (680-709)
31. Diseases of skin and subcutaneous tissue (680-709)
Xm. Diseases of musculoskeletal system anf connective tissue(710-739)
32. Diseases of musculoskeletal system anf connective tissue(710-739)
XIV. Congenital anomalies (740-759)
33. Congenital anomalies (740-759)
XVI. Symptoms and ill-defined conditions (780-799)
34. Abdominal pain (789.0)
35. Others
XI. Injuries and poisonings (809-999)
36. Injuries and poisonings (809-999)
21.7
11.6
0.0
0.316.2
24.3
13.3*
12.0
0.3
0.39.5*
29.3
16.4
13.9
0.0
0.312.2
23.7
a XI. Complications of pregnancy, childbirth puerperium (630-676) and XV. Certain causes of perinatal morbidityand mortality (760-779) are excluded
( ) Disease number in International Classification of Diseases (WHO)*, ** and*** The difference from lead workers is significant (P < 0.05, 0.01 and 0.001, respectively, in chi-square
test with Yates' correction)
Table —6 Lead workers by three levels of blood lead (PbB) or delta — aminolevulinic acid dehydrataseactivity in erythrocytes (ALAD)51
PbB groups
PbB (1)PbB (2)PbB (3)
ALAD groups
ALAD (1)ALAD (2)ALAD (3)
PbB(^mol/1
0.1-0.91.0-1.31.4-3.6
ALAD
40.0-75.930.0-39.98.3-29.9
kg)a
[0.7][1.2][1-9]
(u.)b
[49.7][35.1][22.9]
No. ofworkers
11314991
No. ofworkers
14310994
Age
19-5520-5421-54
Age
19-5319-5422-55
(yr)
[34][36][36]
(yr)
[34][36][38]
Years employed
1-42 [16]2-39 [17]3-38 [17]
Years employed
1-36 [15]1-39 [17]1-42 [19]
Smoking(cigarette/day)
0-40 [16]0-55 [16]0-50 [19]
Smoking(cigarette/day)
0-55 [13]0-50 [18]0-45 [19]
Alcohol(100% I/week)
0-1.00 [0.15]0-1.00 [0.20]0-0.81 [0.19]
Alcohol(100% Vweek)
0-1.00 [0.15]0-1.00 [0.22]0-0.80 [0.18]
a Maximal value in the past three years (1/jmol/kg = 21^ig/100g)b The value in the year of this study[ ] Average value
fc, Table 65) K
(ALAD)
J 1/7 y v
JfiL+IB U"*;l/*5Z.U ALAD
(Table7)5)o
- 106 -

Table-7 Standardised consultation ratiosa for general and seven disease —specific consultations in leadworkers by blood lead (PbB) and erythrocyte delta-aminolevulinic acid dehydratase activity(ALAD) levels51
General and disease-specific consultations
General consultationDisease - specific consultation:6. Diabates mellitus
13. Diseases of eye15. Hypertensive disease23. Diseases of teeth and supporting structures24. Peptic ulcer31. Diseases of skin and subcutaneous tissue35. Other symptoms and ill-defined conditions
a Standardised consultation ratio = (observed number of consultation/expected number of consultation) x 100b See Table-1 for groups of PbB (1), PbB (2), PbB (3), ALAD (1), ALAD (2) and ALAD (3)• P < 0. 05
Ratio ofagainst
PbB (3)/PbB (1)
103
88628287868335*
higher PbB grouplower PbB
PbB (3)/PbB (2)
104
17567
11310020010630*
groupb
PbB (2)1PbB (1)
100
459880835080
115
Ratio of lower ALAD groupagainst higher ALAD groupb
ALAD (3)/ALAD (1)
98
100647786867993
ALAD (3)/ALAD (2)
106
7575
1001503008678
ALAD (2)/ALAD(l)
94
133877961*2989
124
-tz
L tz tzo
4.
(Psychosocial factor)
, 21,75-80 (1974).
2) Araki, S. and Honma, T.: Arch Environ Health, 41, 159-162 (1986).
3) Araki, S., Aono, H., and Ushio, K.: H * U i « E ^ ^ S , 34, 446-451 (1986).
4) Mm$t-:mmm^ ^ t a v x t , m^ (i98i).5) Araki, S., Murata, K., Yanagihara, S., and Ushio K : Int Arch Occup Environ Health, 49, 241-250 (1982).
6) WHO Task Group: Inorganic Lead (Environmental Health Criteria Series 165), WHO, Geneva (1995).
107 -

4. . .. „
n ± iE
Social Impact by Air Pollution
-Risk Assessment for Human Effects due to Air Pollutants
Masataka Murakami
Department of Environmental Health
Institute of Community Medicine
University of Tsukuba
Tsukuba, Ibaraki, 305 Japan
ABSTRACT-When The Central Advisary Council revised The Compensation Law in 1986, it
recommended that the surveillance system is necessary in order to monitor the relationships
between the health status of residents and the air pollution in the residential area for a long
time, and to prevent in the future, the city people from air pollution-related diseases. If such
a surveillance system is established, policy makers will be able to decide the necessity to set
up the further intensive epidemiological studies and the action programme for
environmental improvement. Since then, many researchers and officials have made efforts to
establish the system.
U. K. established the Environmental Health Surveillance system since 1990. This system
has been conducted as the system called by Small Area Health Statistics Unit which is an
independent national facility that uses routine sources of data to investigate health effects
near industrial sources of environmental pollution.
- 108 -

2.
N02
3. *s>
S0 2 ) N02 )
SPM
4 .
bit,
0.8%)
, 1994 ^ (C t t 9910
, *<£>& N02 K o
S02i±lL<i£<>5:o/c^\ SPM t
<h SPM (^O 1 / 3 l± DEP : ^--tf
passive sampler t J ; 5 9 0 ^ DEP
, DEP C ( 3 . 0 -
<0 <b D E P
50 %fr tzo
, Anffigf^IU, 2.43PPb
- 1 0 9 -

7.84/zg/m3
0.7 ~ 1.6
5.
6.
^Hldfel^-C SAHSU (Small area health statistics unit) kLancet (339:845,1992) CD y K y ^ ^ « 4 • ^ B ^ g R Elliott if ± C i 5
Z t \Z.%-o tzo
- ^ C « f c
district, ward, ED (enumeration district) ^ L T p o s t code (PC) ">%><
CIO PC
ED (i 10 ^
(Carstairs' index145 ;
- 110

10km
* 0.5km
, 3km J
0.5, 1, 2, 3, 4.9, 6.3, 7.4, 8.3, 9.2km <0M'bn5rJSt 10 fr
, o |?fi 0.5 ~ lkm ^ g O K-^ -y t tO i f e^ 1 ~ 2km, 2 ~ 3km i:
3 ~ 4.9km Ujti i / iV^cV^MS^^ L < & 3 i d & F - ^ y ^ O & E i
(Carstairs'
index14')
ED (
(O)
:, H 1
2
10 0g
3km
500m
(3 ~ 10km)
(9.2 ~ 10km)
0/E
0/E
Richard
d ^ SAHSU
LX. 1974
- ill -

„ Carstairs' index131
t
SAHSU IC
8.
1) M. Murakami et al: Physical and Chemical Environment, in R. Detels et al. Eds: Oxford Text book of
Public Health. Oxford University Press. (1996)
2) axit^gm:±%m&-mm<omm ( ^^mmr jo 109-132.(1979)3) mmff-.mm&m
- 1 1 2 -

4) M. Ono et al: Environmental Sciences. 4(1): 13-23. (1996)
5) K. Makino: Environmental Sciences. 4(1): 25-35. (1996)
6) S#fn$ftiJ: ±%W%k¥ikm 27(6): 289-303. (1992)
7) Hffi^ffi: B#'J*7Wft^££4l3&F$fc!6^ifcfc£:l-5. (1991)
8) fiiumm-- B#y*?wft^£S&9[iwsfc5^£ifcfcii3i9g 6i-66. (1996)
9) P. Elliott et al.: Lancet. 339: 854-858. (1992)
11) Small Area Health Statistics Unit, London School of Hygiene and Tropical Mediche: An analysis of
the incidence of cancer of the larynx and lung near incinerator of waste solvents and oils in Great Britain
(final report) (1992)
12) P. Elliott et al.: J. Epidemiol. Community Health. 46: 345-349. (1992)
13) Y. I. Kleinschmidt: Proc. Geographical Methods in Small Area Health Studies on 22nd June (1990) at
London Univ., 15-34.
14) V. Carstairs: Health Bull. 48(4): 162-175. (1990)
15) R. A. Stone: Stat. Med. 7: 649-660. (1988)
16) P. Elliott et al.: Brit. J. Cancer 73: 702-710. (1996)
17) M. Murakami: Environmental Sciences. 4(1): 1-12. (1996)
- 113 -

•fc v V H V F
The Influence of Knowledge on Risk Perception
Reiko Kanda, Kenzo Fujimoto and Sadayoshi Kobayashi
Division of Human Radiation Environment, National Institute of Radiological Sciences
4 - 9 - 1 , Anagawa, Inage-ku, Chiba 263, Japan
ABSTRACT-Many researches on risk perception have often been concerned with reaction of
the public to modern technology. A major concern is the public fear of such new technology
as nuclear power and genetic engineering. When the perceived risk was examined using a risk
ranking technique, Japanese school teachers, university students and also NIRS staffs
(female clerical staffs and researchers) viewed nuclear power to be much riskier than the
objective estimation. Many technical experts have believed that this great fear results from an
overestimation of risk by the public due to lack of scientific knowledge. So far, several
studies reported the results to examine the correlation of the perception of some risk sources
with knowledge about them, although their conclusions are inconsistent. When the perceived
risk by trainees on a radiation protection course in NIRS was examined, nuclear power was
rated as the second and 14th among 30 risk items by those who majored in life sciences in
college and by those in physics, chemistry or technology, respectively. The perceived risk of
nuclear power did not change among trainees by training offered fundamental knowledge
about radiation during the course. On the other hand, the orders of smoking and alcoholic
beverages rose considerably. Our results are consistent with the previous reports, i.e., what
people learn initially about risk source has more imporant role in risk perception than what
they learn later, and the increase of perceived risk is more easier than its decrease.
Knowledge is now recognized as one of the factors which influence on risk perception.
However, a special emphasis is now placed on risk communication in order to make
partnership between communicators and receivers in the risk management.
- 114 -

-fc A t
1970
CS <
H
1 . U
, u
x\
Table 1 Ordering of
Risk items
Handguns
Motor vehicles
Motorcycles
Nuclear power
Private aviation
Food preservatives
Police work
Smoking
Food coloring
Fire fighting
Surgery
Antibiotics
Commercial aviation
Hunting
Pesticides
Large construction
Alcoholic beverages
X-rays
Contraceptives
Bicycles
Mountain climbing
Vaccinations
Spray cans
Electric power
Railroads
Swimming
Skiing
Power mowers
Football
Home appliances
Perceived Risk for 30 Activities and Technologies
Female clerical staffs in NIRS
1983
1
2
3
4
5
6
7
8
9
10
11
12
13
14
15
16
17
18
19
20
21
22
23
24
25
26
27
2829
30
1992-1993
2
7
10
1
11
3
12
8
617
14
4
15
18
9
13
21
5
1924
23
16
20
25
22
30
29
26
28
27
Researchers in NIRS
1983
4
1
2
28
9
19
11
5
17
10
620
15
14
12
3
13
22
23
7
8
21
24
26
18
16
25
2729
30
1992-1993
1
10
2
5
3
17
4
12
18
8
6
23
15
11
14
7
22
13
21
25
9
24
29
28
27
26
19
20
16
30
The ordering is based on the geometric mean risk ratings within eachgroup.
- 1 1 5 -

2.
1983 ^(ff 1992-1993
rxnj
3.
Tx^jU
ICRP
(1992-1993^)
f i
(Table 2),
Jc 0.75
Table 2 Spearman's Coefficient of Rank Correlation between Perceived Risk and Technical Estimate Risk
Subject
Japanese female secretaries in NIRS (1992-1993)Japanese researchers in NIRS (1992-1993)Japanese university students (male)
Japanese university students (female)
Japanese school teachersJapanese experts in risk assessment
American college students
American members of the League of Women VotersAmerican business and professional club membersAmerican experts of risk assessment
Correlation coefficient0.120.32*
0.38'
0.33*0.14
0.41 *
0.30
0.53*0.64-0.75'
ReferenceThe present studyThe present study
The present studyThe present study
The present study
The present study
Slovic et al.3), Upton4)
Slovic et al.3), Upton4)Slovic et al.3), Upton4)Slovic et al.3), Upton4)
'Significantly (p < 0.05) correlated with the order of technical estimate risk.
4.
Table 38)
t U
- 116 -

Slovic (1987)2)te, |
(Unknown risk).
18 R g
(Dread risk)
(Number of people involved)
Slovic
Slovic
9.10,11)
9ms
CHLt, 1992-93
Z<D2
n
Table 3 Factors involved inpublic risk perceptionAdapted from Covelloet al.81
Catastrophic potentialFamiliarityUnderstandingUncertaintyControllabilityVoluntariness of exposureEffects on childrenEffects on future generationsVictim identityDreadMedia attentionAccident historyEquityBenefitsReversibilityPersonal stakeScientific evidenceOrigin
m
2 .
- 117 -

Jenkings-Smith and Bassett (1994)18)J±,
a) -(2) Jft
(3) m
3.
ISIJenkins-Smith and Bassett (1994)18)
(Table 4)
4 a
^ rxnj
30 m 1
Table 4 Ordering of Perceived Risk for 30 Activities andTechnologies among Trainees before receiving trainingon Radiation Protection Course
x\ Mkz.m&ft
Risk
1
2
345
678
9
10
11
12
13
14
15
16
17
18
19
20
21
22
23
24
25
26
27
28
29
30
Majors in life sciences
Handguns
Nuclear power
Private aviation
Motorcycles
Motor vehicles
Fire fighting
Large construction
Hunting
Police work
Surgery
Smoking
Commercial aviation
Pesticides
X-rays
Mountain climbing
Antibiotics
Food preservatives
Contraceptives
Food coloring
Vaccinations
Power mowers
Alcoholic beverages
Skiing
Railroads
Electric power
Football
Bicycles
Spray cans
Swimming
Home appliances
Majors in physics, chemistry or Technology
Handguns
Private aviation
Hunting
Motor vehicles
Motorcycles
Police work
Surgery
Antibiotics
Large construction
Commercial aviation
Pesticides
Contraceptives
Smoking
Nuclear power
Food coloring
Fire finghting
Food preservatives
Mountain climbing
Bicycles
X-rays
Power mowers
Alcoholic beverages
Spray cans
Railroads
Electric power
Vaccinations
Skiing
Swimming
Football
Home appliances
- 118 -

rx$u
^c^%lii<#t:*5 5 19)0
1)
2) Slovic, P. (1987): Perception of risk. Science 236, 280-285.
3) Slovic, P., Fischhoff, B. and Lichtenstein, S. (1981): Perceived risk: Psychological factors and social
implications. Proc. R. Soc. Lond. A 376, 17-34.
4)
5)
6) ICRP (1991): Recommendations of the International Commission on Radiological Protection, Adopted
by the Commission on November 1990
7) Upton, A.C. (1982): The biological effects of low-level ionizing radiation. Scientific American 246,
29-37
8) Covello, V., McCallum, D., Pavlova, M., Eds. (1989): Effective Risk Communication: The Role and
Responsibility of Government and Nongovernment Organizations, pp 3-16. New York
9) Englander, T., Farago, K., Slovic, P. and Fischhoff, B. (1986): A comparative analysis of risk
perception in Hungary and the United States. Social Behavior 1, 55-66.
10) Teigen, K.H., Bran, W. and Slovic, P. (1988): Societal risk as seen by a Norwegian public. Journal of
Behavioral Decision Making 1, 111-130.
11) Goszcynska, M., Tyszka, T. and Slovic, P. (1991): Risk perception in Poland. Journal of Behavioral
Decision Making 4, 179-193.
12) Kuklinski, J., Metlay, D. and Kay, W. (1982): Citizen knowledge and choices in the complex issue of
nuclear energy. American Journal of Political Science 26, 615-642.
13) Hensler, D.R. and Hensler, C.P. (1979): Evaluating nuclear power: Voter choice on the California
- 119 -

nuclear energy initiative (Rand, Santa Monica, California)
14) * T I S , ^J l lHi 1 (1989)
^ S l l , 42-46.
15) TfcTSJt (1996) :Wm.m
* , 46-47.
16) Maharik, M., and Fischhoff, B. (1993): Risk knowledge and risk attitudes regarding nuclear energy
sources in space. Risk Analysis 13, 345-353.
17) # * n B ^ ^ J I I # - (1995) : IK^&fceSsN-SJiKafci » E W R # f c 5 ?—>"J - X No.22 127-147.
18) Jenkins-Smith, H. and Bassett Jr., G. W. (1994): Perceived risk and uncertainty of nuclear waste:
Differences among science, business, and environmental group members. Risk Analysis 14, 851-856.
19) *TM3£ (1993) : U 7,9 • 3 5 n - ^ - ^ a V. B * U X ^ g r ^ ^ ^ l f e 5 (1), 82-86.
120 -

—Y - i/ H V
2 .
Risk Communication - A Social Psychological Perspective
Toshiko Kikkawa
Institute of Policy and Planning Sciences
University of Tsukuba
1 - 1 - 1 Tenno-dai, Tsukuba, Ibaraki 305, Japan
In this article, the author tried to examine some problems of risk communication from a
social psychological perspective. Firstly, four imperatives of risk communication were
discussed. Secondly, cognitive limitations of people when dealing with risk information were
examined. Thirdly, the reliability of information sources was discussed. Lastly, the author
argued successful risk communication.
ir-v-
, Stallen & Coppock(1987) # ,
(imperative)J #
(1) S
(2) Ji
(3) >i
(4) fi
V hD-;b
it, (effective) (efficient)
~ 121 -

4~2<r>&8i*%:t:LXli±Ct!>XftZ>'<% V
.-'r- =s3
> U
i: (awareness of risk) -frW^X-%% t V ^
, Stallen & Coppock (1987) <D^
2 .
DSlovic(1986) ( i .
TU5 (1992)11,
Epstein & Roupenian (1970) v^ a >y 27 * 5
, 50 i/a
95
- 1 2 2 -

«fc
McNeU et al.(1982)
, 32
2) tt
100
10
, 1994)
- 123 -

(1075AM)
Ui Uf%
z t #
E3 PD-d
C , V
426617
45709
28
55
229
65
170
41
100.3
6769
257174
0.212589
798
X 55
, 10 174
•c .
so -c
> 1988)O
3) -Ifl«|3 S a : ^ - > g >ifoffifta S 1=^--> g >
- 1 2 4 -

-=-^r- i/ a V i: 1^9 <E>[± J g ^ L i 9
- i;
vxm
4) HlfRjSO^
5 C t it, m- ^ - i / a i; i: tC , "b 9 1
t V -5 d t X"tbZ>0 '&*<D U
(scientific literacy) C i:T\ U
L^U
(Shamos, 1991)O
S T . 3§ (Expertise)
-^LT, % 9 1 (Trustworthiness)
(Jungermann et al., 1996)O [3€)9^> Honesty
- 125 -

8I
2
1
0
• 1
GOVERNMENT SCIENTISTS
CHEMICAL PLANT TUV EXPERTS
SENATE
POLICE
DISTRICT OFFICE «
ENVIRONMENTALISTS
CRITICAL GROUPS
. DISASTER CONTROL
UNIVERSITY SCIENTISTS
FREDEPT.
DEPT.FAMLY DOCTOR
• JOURNALISTS *
-3 -2 1-1 0
Honesty
1 Location of information sources in the two-factor space of trustworthiness. Jungermann et al. (1996)
Principal Axis 2 (253%)AccountableSelf-ProtectionVested Interest
Food Industry •
A Government Ministry
Government Minister . Government Scientist.Supermaiicet Information Leaflet*
Member of Parliament •
DistortedProven Wrong in the PastBiased
Tabloid Newspaper*
Consumer Organisation
An Environmental Pressure Group
Television Documentary •Television News Broadcast •
I *Quality Newspaper
Friends •
University Scientist^ Medical Doctor
* * Principal Axis 1 (643%)TruthfulGood Track RecordTrustworthyFavourAccurateFactualPublic WelfareResponsibleKnowledgable
Sensationalisation
12 Results from the survey study (study 3). Location of differentinformation sources within the two-component space.
c s Competence
- 1 2 6 -

(Frewer et al., 1996,
A,
3.
j Z ^ - v ' a V (Successful risk communication) # £ 9 V 9 k O ^ t V
(National Research Council, 1989)O fSJ«t 0 fc £-f, UT.^ • n 5 o.r.-Jr--> a
1) Epstein, S. & Roupenian, A. (1970) Heart rate and skin conductance during experimentally induced
anxiety: The effect of uncertainty about receiving a noxious stimulus. Journal of Personality and Social
Psychology, 16, 20-28.
2) Fewer, L. J., Howard, C, Hedderley, D., & Shepherd, R. (1996) What determines trust in information
about food-related risks? Underlying psychological constructs. Risk Analysis, 16, 473-486.
3) Jungermann, H., Pfister, H. R.,& Fischer K. (1996) Credibility, information preferences, and
information. Risk Analysis, 16, 251-261.
4) ^)\\m^ • «f)5$- • P*IE-J!P (1994) BflUB^ffitf'J^&fclCiRff-r^ff 0*U^^W^f i^^^7
mm^^m^m-xm, 92-95.5) McNeil, B. J., Pauker, S. G., Sox, H. C, Jr. & Tversky, A. (1982) On the elicitation of preferences
for alternative therapies. New England Journal of Medicine, 306, 1259-1262.
6) Mumpower, J. L. (1988) Lottery games and risky technologies: Communications about low-probability/
high-consequence events. Risk Analysis, 8, 231-235.
7 ) National Research Council (1989) Improving risk communication. Washington, D. C: National
Academy Press.
8) Shamos, M. H. (1991) Scientific literacy: Can it decrease public anxiety about science and technology?
In D. J. Roy, B. E. Wynne, & R. W. Old (Eds.), Bioscience <=> Society. Wiley & Sons.
9) Slovic, P. (1986) Informing and educating the public about risk. Risk Analysis, 6, 403-415,
10) Stallen, P. J. & Coppock, R. (1987) About risk communication and risky communication. Risk
Analysis, 7, 413-414.
11) t ^ # ^ (1992) | a ^ ^ * f t € ) S . ^ ^ i M « J I J 7 > 7 C S : « - r » S B*>WI^£|l56[I]*:£3gSlll:£*, 538.
12) Tversky, A. & Kahneman, D. (1981) The framing of decisions and the psychology of choice. Science,
211, 453-458.
- 1 2 7 -

/Mr. • I [ 5jfe -/tr? TTT J.,.^ • * - _ • • • ^ - »
Social Impact of Accidents
Isao Kuroda
School of Human Sciences, Waseda University
2-579-15 Mikashima, Tokorozawa, Saitama 359, Japan
ABSTRACT-There is the quite big difference between technological risk and social risk
feeling. Various biases of social and sensational factors on accidents must be considered to
recognize this difference.
"How safe is safe enough" is the perpetual thema concerning with not only technology but
also sociology.
The safety goal in aircraft design and how making effort to improve the present safety
status in civil jet aircrafts is discussed as an example of social risk allowance.
INSAG under IAEA started to discuss the safety culture after Chernobyl nuclear power
plant accident on 1986. Safety culture and risk communication are the most importannt proce-
dures to rlieve the social impact for accidents.
j , \~rn
mm, mm,
. 10,679 «•?& o, 1996 6 n 15 B \z-\tmk<o$m£M^wttzw 502,520
1 2 8 -

= 2 f i C i n
V ± "How safe is safe enough" i l " -
n
, 1960
(JUK±<7)ftiJ*5. ^ t
. rpj^ttj, ri^a (A
t LX<0 Safety Goal «ri*
U V :
10"7WT
io -3 y
200
10-6 x\
- 129 -

M(D%} 60 %\t,
fc 50
8S (B - 747)
(DC-10)
, 1988 (B - 737)
1986 ;l/y Z>LXi> U^)V 7 C
. 1986 ^fe LT1 9 9 5 ^ 12
, 73
BIU
t-c,
IAEA(ow (INSAO
z>o5)
- 130 -

1) fcM&fc : Security, 63, 52-55 (1991)
2) E. Lloyd and W. Tye: Systematic Safety, Civil Aviation Authority, London (1982)
3 ) | J M •• INSS JOURNAL, 1, 227-236 (1994)
4) JJSBffPjfl : 1996. 2. 25
5) IAEA: Safety Series, 75-INSAG-4, 1991
- 131 -

Estimation of Health Risks and About What we should Discuss Now
Junko Matsubara
Yokohama City University College of Nursing
3-9 Fukuura, Kanazawaku, Yokohama 236 Japan
ABSTRACT - Reviewing various trials to estimate risks from environmental factors to human
quantitatively, the author summarizes several check points which should be clarified and
should be discussed now. Mathematical definitions of hazard and risk are proposed. Since we
already have enough evidences about hostdefense in organisms agent against harmful, we
should reconsider the linear dose response hypothesis and consider the contribution of life
style which effects signifcantly the potential of the defense power of an individual.
1 .
0157
- 1 3 2 -

2 .
(2) mz&K£<o
X(t) —rate of IntakeV
I . T i ouuy ur^-"-v ! ,|Q. (t> j ' ; Amount* \ i—T— I quantit
Body or Organof the
quantity existingi in the compartment
-EC*)
i ii l
Rate of Excreation
Q(t)=\ X(f)r(t-f)dfr(t);retention function
D(t);dose
U, F
rem
t K * (m)- (e)
Qi H Ci
mm)
(Sv)Tti,
H = i ^ / o T f 2 - q o ' R ( t ) e " l t d t
tztzLFX
ftme
U;KBq)18))
5 A , g)
= EE-F-Q-nE :F :Q :
C&ft)
i/ S Qo
i/ 0
to H9 *
198911)
- 1 3 3 -

2 .
2
3
2 A) (HI2B)
'ft (0 3)
—*-—*-
317(0.07)
73(0.05)
248(0.081
ffi £65(0.025)
* %80(0.004)
a. %76(0.045)
i
1.000(0.002)
30(0.07)
* ?L74(0.003)
.ft 15)7(0.05) — 38(0.05) -
£
Tfa
(0.01) 1
•« *(0.0001)
J
*1 a a ;
•*-|><?f'J7
s x6(0.12)
12A
v 1973«ty
02 B
1. Hepatitis A
2.
gram & I O.lgramUCL (i 50 %T'
3 .
4 .
; l )2)
(4 j§fgf£g^SE) ; U X 7 = O.5x •Hi lC '^^T- O.lgram X'C, 0.3mg/liter
[1966-1967^, * S ^ # I H M ; 22-29 A/100,000 A, ^ # § ^ A t l 50-200 A /100,000 A t1§M"£?L2>O l l ^ ^ 5 - 2 0 % t * 3 i - & { 5 , itftJfi* 1,400-4000 A/100,000 A,1000 A /100,000 A (-1 % ), ^ ^ * * 100 A /100,000 A (-0.1 % ) t&t£iro
100-200gram (wet) / B / 4501iter i g f f l * / B 0.3gram / liter,, 0.3mg/ liter 4.iSffl7K~"F7K3tt K i^-5>D A^JSI^ft. i § t e « ; 95 %, irtj:t>*3 0.05 ^ i
; 1/10, -f&iyh 0.1 S@lOml / A * B
; -0.3mg/lit x 0.05 x 0.1 x 10ml/ B1.5xlO"8g/ 0
- 0.5x(1.5xl0-8/0.1)-7.5xl0-8/ 0
CkZ>WM ; 1.61iter/AB; 99.99 %^rgjb, 0.0001 S@ t&2>- 0.3mg / lit x 0.05 x 0.1 x 0.0001 xl.61it/ B
-2.4xl0-1 0g/ B- 0.5x2.4xl0- I 0 /0.1-1.2xl0-9 / B -4.4xlO"7 A / ^
\ 3 x lO" 5
2 )
70
[213(N. J.Hutzler and W. C. Boyle, ASCE, EE5, Oct., 1980)
- 1 3 4 -

4
5
2 . 2
2
3
(311 A) (ilB)
threshold • ? * o ,
£: (linear)
DNA
A) (SI4B)
(M&h) L t V * , , linear <h(± no-
u
( t B. N. Ames et al. Science 236, 271, 1987)
HERP* ( t n Bfefcy)70kg TD50 (mg/kg)
7 - / vox
0.001
0.004
0.008
0.6
0.004
2.1
0.0002
0.0003
0.0004
0.0030.0060.0030.03
0.03
0.060.10.008
2 .8*4 .7*6.2
1.3
0.0002
0.06*
[0.3]
[5.6]
16*
5.8
140
, 1/
1 B
1 B
PCBs : £ $ J 4 > , 1 B
DDE/DDT : •%%)$>, 1 BEDB : ftfiodp, 1 B
^ - n v , (lOOg)
m, (250m/)3 - V 7 ' J - I , lcup
! , (54g)», (15g)%-M (354m/)
K-JV (354m/)7 4 V, (250m/)
AF-2, B mum)•', (354m/)
FDB ;
Chloroform, 83/jg
Trichloroetylene, 2,800/ig
Chloroform, 250^g
Formaldehyde, 598^g
Benzene, 155/ig
Formaldehyde, 2.2mg
PCBs, 0.2^g (US average)
DDE, 2.2/jg (US average)
Ethylene dibromide, 0.42/ig
(,-k &)Dimethylnitrosamine, 0.3/igDimethylnitrosamine, O.lfig
Urethane, 43//gSymphytbe, 38/ig
(750^g of pyrrolizidine alkaloids)Aflatoxin, 64ng
(US average, 2ppb)Dimethylnitrosamine, 7.9^gMixture of hydrazine ^Dimethylnitrosamine, 1/igEthylalcohol, 18mlEthylalcohol, 30mlComfrey root, 2.700mgSymphytine, 1.8mg
A F - 2 (furylfuramide), 4.8^gSaccharin, 95mg
(E M)Phenaccetin, 300mgMetronidazole, 2,000mgPhenobarbital, 60mg
1 B Formaldehyde, 6.1mg
Ethylene dibromide, 150mg
(119)(-)(119)1.5(157)1.51.7
(-)1.5
(0.2)0.02(41)1.9
9094190(44)53(44)(9.6)13
(5.1)
0.2
(+)22
(?)
0.003
(0.2)(?)(0.2)9,1109,1106261.9
292,1431,246
(542)
( + )
1.5
1.5
0.220,3000.2
(?)(? )(?)(?)
(131)
(-)
(2,137)5065.5
(44)
(5.1)
HERP; Human Equivalent Rodent Potency of carcinogenicity
- 135 -

. 1 0 . )
1 Bffl
kq/d/A fJ -&
1.4 x 0.35 x
S>^ T 370
Bq/kg
f!l -o Bq/kg d/y (input) Bq/mSv86
mSv/y (input)
1 A 1
106Ru5.24.3
2217x 370 x 365 x / ( 0.075 x 10* x 0.9 ) = 0.038
370Bq/kg, A )
1987.10
lmSv/y (input)= 0.04
370Bq/kgmSv/y (input)
=0.98, = 1lOBq/kg J
( 1 )
( 2 )
( 3 )
•• A
, 61, 408, 1991)
B mmnmrn^. c
USA =i*?
p?!St<DB
U S A ^m<r.
B G «>#<<£ J5
— "7B G ifeigJ^ER
SSfeffl ££*&}£ fc
C
Barcinski C?
Walter h
Kochupillai b
Jacobson P> '
75
86
76
76
89
*t ft <t 75 ^C 640mR/y ifeS(-EEfi;202;S i.St^%SE147iSC> U
A ^ H ^ ^ or L S 1 6 9 * f e * E * t ) 3 1 0 : ^ A ' : : ' : * ; " / *
C1500-3000 mfem/y CiS*«ttR12718A t Stfi DtlOOmrem/y tr>Sfetf(&^5938ACot^"CiSr^(!: ^*? V ^ O
CrSjBGJfeJS (*<J 5.5mSv/y) ffigg tP^JsffiaJtk
Sftfe^"? breaks £DS
SE BG JfeatT-»:fe<
*
*«»<DJ«Jp
UK, t -Xh5 U7«S
Caldwell P>
Darby £
Preston ib
' 83
' 88
' 87 A«. |> 10km U r t £ O t e * * 9
Bo
326AIC-^<^T SMR SMR T-l/cAK RI
A • Sv 3
lOmSv "X; Sifil^^EtrO
Stffl*>*B>cl,T^7to
5 7t 0 <D®*I9Etr(DI+»:
USA / \ y 7 *Mancuso h ' 71Hutchinson h ' 79 (fig
,, )
Beral h ' 85 i6K;<, SMRtrit)
SMR
SMR AU20UJi(L!i»L p
Gardner h ' 90Mckinney h ' 91
u V ^
R Rc i lOOmSv
t , RR >6)
U S A Wing & ' 91 A '
SMR
SMR IllOOJU
lOmSvlOmSv
- 136 -

SOD
t ? S > E . C. A
7 iv 9 f- x y
SffJ
7 5 * K > «J
* X T - Y
us
HttKS? • 7 'J-?y*;H
T
JUSRftS
<M£lil*«
*tf)
( R » g S
if)
0-f ^7.
S» • Sff
1Img^afeRal [KS
hw-tnmm MWB?a5i^
i /
•SSfiH!
\ /
ftffl Sffi itSSR
\^ \/
lfciRa(t £<t s-aswl
DNAffl®
£££ 5 mm
/
S GKHE1992) I 4 B 1992)
< Oxidative Stimuli)
Radiation protection
I Radiation
Cylokines induction
<Or.OH-.HA, NO> WU PADRT
Toxic subst.
Microbes
Act.Act. Monocytes inflamatory
response
< Endogeneous Antioxidanls >< Exogenerus Antioxidants >
Fig. Releases of cytokines induced by oxidative stressers including radiation and coordinated radioprotectivereactions, (cf. Weich sel baum et al. 1993, Balawin 1996, Matsubara 199551)
4
5
6 t 7
attributable risk < t£
- 1 3 7 -

V
1 . /N-tf- F hazard
3 .
m 5) (iR),=
8 y 7,7 OJt5? risk estimation
t^) 7,7 i ' 7 ^ - 1 ^ y l 1 risk 2 . U 77 risk
management ii^ljt12(5 %0 i£/cy (CI)t =
3 . Ua.b .
potentialt $ instantaneous incidence rate; IR
{T-1}
cumulative incidence CI
1 I R td t>
expected riskER =ij 7 . ^ 5 1 ^ x l S S- loss of life expectancy
LLE = E - E'
4 .
a .
b . X odds it
{T}
attributable risk{rate difference}
{rate ratio}
lJ 7^9 OX f
k\z.
- 138-

0157
u
2)
3)
4)
5)
0 f 1989
> 44 ^4-f-413-418 1996
1996
5 ' J - 1992
3 -?• 309-315 (1995)
- 1 3 9 -

&
, a -
3 - ftfe
lot, Bl-i
X,
- 1 4 0 -

t
U
V\
"C % P> O
priority , —$£€> priority
u 7,9<o
priority
fc public
1± public panel with technical assistance
^ f i S I ^ L T i <S«IL
<0 J f T
afeo fc0 ^ 9 V ^ C i;
1. Psycho-somatic ^
2. &£&£r#J^3 ALARA, Cost-benefit
3.
4.
- 141 -

, Public Relations
v
- 142 -

fli:: H
5 : 6 0
•fc v a V Y )V ffi ft«1 BB
9:45-10:00
10:00-10:3010:30-11:00
11:00-11:3011:30-12:0012:00-12:3012:30-13:45
13:45-14:45
14:45-15:1515:15-15:4515:45-16:1516:15-16:30
16:30-17:3017:30-19:00
-12^5 8 (*) -
•fer>aVl f-x;lV7VU1. IAE
1 - 11 - 2
2 - 12 - 22 - 3
IS^(Btftiftl^I)
±)
*)
if)
*&)
£2B1
9:30-10:0010:00-10:30
10:30-11:00
11:00-11:30
11:30-12:0012:00-13:1512:30-13:45
13:45-14:45
14:45-15:4515:45-16:00
16:00-16:3016:30-16:35
-123 6 B•tvi/a VI
2 .
3 .
4 .
1 .2 .
IX)
E if)I (ft E if)
ft ±)
E if)
+ if)
E if)
E if)
E if)
mm
ik.mm.mmw
- 143 -

rt LU IE 5t
% 7C % =
± i ^ IE
K x; 5f -
5 II f A
±
- 1 4 4 -

- V U - X No.24
m %'J-JII ?f-/.MI±
=F263
043-251-1111