AECL EACL - OSTI.GOV
189
AECL EACL AECLCANDU EACLCANDU The Formation and Characteristics of Hydride Blisters in c.w. Zircaloy-2 Pressure Tubes AECL-11106 A-NFC-94-144-P CA9600166- CA9600177 7IJ215 1994 September Septembre 1994
-
Upload
khangminh22 -
Category
Documents
-
view
3 -
download
0
Transcript of AECL EACL - OSTI.GOV

AECL EACLAECLCANDU EACLCANDU
The Formation andCharacteristics ofHydride Blisters inc.w. Zircaloy-2Pressure Tubes
AECL-11106A-NFC-94-144-P
CA9600166-
CA9600177
7IJ215 1994 September Septembre 1994

AECL EACLAECLCANDU EACLCANDU
The Formation andCharacteristics ofHydride Blisters inc.w. Zircaloy-2Pressure Tubes
AECL-11106A-NFC-94-144-P
Editor: E.G. Price
Contributions by: M. Puis, M. Léger,T.P. Byrne, G.D. Moan, A. Causey,R.J. Klassen, M.P. Dolbey, E.V. Murphy,V. Urbanic, H. Wong, E.G. Price, N. Azer,and D.K. Rodgers
Papers Presented at IAEA Consultants'Meeting, Vienna, Austria1994 July 25-29
1994 September Septembre 1994
AECL CANDU EACL CANDU2251 Speakman Drive 2251, rue SpeakmanMississauga, Ontario Mississauga (Ontario)Canada L5K1B2 Canada L5K 1B2
AECL EACLAECLCANDU EACLCANDU
Les caractéristiques etla formation dessoufflures d'hydruredans les tubes de forceen Zircaloy-2 écroui àfroid
AECL-11106A-NFC-94-144-P
Rédacteur : E.G. Price
Avec la collaboration de : M. Puis,M. Léger, T.P. Byrne, G.D. Moan,A. Causey, R.J. Klassen, M.P. Dolbey,E.V. Murphy, V. Urbanic, H. Wong,E.G. Price, N. Azer, and D.K. Rodgers
Communications présentées lors de laréunion des spécialistes de I'AIEA, àVienne, en Autriche,du 25 au 29 juillet 1994
1994 September Septembre 1994
AECL CANDU EACL CANDU2251 Speakman Drive 2251, rue SpeakmanMississauga, Ontario Mississauga (Ontario)Canada L5K 1B2 Canada L5K 1B2

PREFACE
The PHWR's in India closely follow the Douglas Point design and use cw. Zircaloy-2pressure tubes for the first seven reactors. The spacers used in the early RAPS reactorswere of Zr-2.5Nb-0.5Cu alloy to a design which in Pickering reactors was found to besusceptible to movement away from their design locations under conditions of largeamplitude vibration produced during assembly and commissioning.
In 1994 February the IAEA held a meeting in Bombay on Operating Experience in HeavyWater Reactors. At this meeting, Canadian participants were made aware of inspectiondata developed by India DAE from RAPS-2 reactor, which showed that spacer displacementhad occurred; that a number of channels were in contact; and that relatively highequivalent hydrogen concentrations were present in the tubes. These are the conditions thatled to a pressure tube failure in Pickering Unit 2 in 1983.
Under the auspices of thfi IAEA, a consultants' meeting was arranged in Vienna, 1994 July25-29, at which a Canadian delegation, consisting of AECL and Ontario Hydro Technologiespersonnel, presented information on our knowledge of the behaviour of hydride blisters inZircaloy-2 pressure tubes.
The Indian delegation in turn provided information on their understanding of thephenomena from investigative and surveillance work. A full report of the materialpresented by both delegations and the joint summary will be published by the IAEA.
This document contains the 10 papers presented by the Canadian delegation to the meeting.It is believed that they represent a good reference document on hydride blister phenomena.
RECORD: (B:\WPDATA\PiaCE}VCHB-ZK2J793-0909

Préface
Les RELP de l'Inde suivent assez fidèlement le modèle de Douglas Point et utilisent des tubesde force en Zircaloy-2 écroui à froid dans le cas des sept premiers réacteurs. Les baguesd'espacement utilisées dans les premiers réacteurs RAPS étaient fabriquées d'un alliage deZr-Nb2,5%-CuO,5% suivant un modèle qui, dans les réacteurs de Pickering, a posé des problèmesquant au maintien de sa position de calcul dans des conditions de vibrations de grande amplitudecomme celles produites au cours du montage et de la mise en service.
En février 1994, l'AIEA a tenu une réunion à Bombay portant sur l'expérience d'exploitation desréacteurs à eau lourde. Lors de cette réunion, les participants canadiens ont été mis au fait desdonnées d'inspection recueillies par le DAE indien (ministère de l'Énergie atomique) à partir duréacteur RAPS-2, données qui montraient que les bagues d'espacement s'étaient déplacées, qu'uncertain nombre de canaux étaient en contact avec d'autres et que des concentrations équivalentesd'hydrogène relativement élevées étaient présentes dans les tubes. Ce sont ces mêmes conditionsqui ont été à l'origine de l'accident de rupture de tube de force survenu à la tranche 2 dePickering, en 1983.
Sous les auspices de l'AIEA, une réunion de spécialistes a été organisée à Vienne, du 25 au29 juillet 1994, au cours de laquelle une délégation canadienne constituée de membres dupersonnel d'EACL et d'Ontario Hydro Technologies ont présenté l'état de nos connaissances surl'évolution des soufflures d'hydrure dans les tubes de force en Zircaloy-2.
La délégation indienne a par ailleurs fourni des informations sur sa compréhension du phénomènerésultant d'activités de surveillance et d'analyse. L'AIEA publiera un rapport complet desinformations présentées par les deux délégations ainsi que le résumé conjoint.
Le présent document renferme les dix communications présentées par la délégation canadiennelors de cette réunion. On estime qu'elles constituent un bon document de référence sur lephénomène des soufflures d'hydrure.

CONTENTS
Canadian papers presented at the IAEA Consultants' Meeting on Pressure Tube Integrity,1994 July.
1. "Overview of Blister Phenomena in Relation to Pressure Tube Integrity", by E.G. Price(AECL-CANDU).
2. "Corrosion and Hydriding of Zircaloy-2 Pressure Tubes", by E.V. Murphy (AECL-CANDU) and V. Urbanic (AECL-RC-CRL).
3. "Creep Sag of Zircaloy-2 Pressure Tubes in CANDU-PHW Reactors", by A. Causey(AECL-RC-CRL) and R.J. Klassen (AECL-RC-CRL).
4. "Conditions in the Pressure Tube and the Calandria Tube after Contact", by M. Léger(OH Technologies) and T.P. Byrne (OH Technologies).
5. "Delayed Hydride Cracking in Zirconium Alloys", by M. Puis (AECL-RC-WL).
6. "Blister Growth in Zircaloy-2 Pressure Tubes", by T.P. Byrne (OH Technologies),M. Léger (OH Technologies) and G.D. Moan (AECL-CANDU).
7. "Hydride Blister Features in Zircaloy-2 Pressure Tubes Removed from Pickering Units 1and 2: A Selection of Photomicrographs", by G.D. Moan (AECL-CANDU) andD.K. Rodgers (AECL-RC-CRL).
8. "The Mechanism and Criterion for Failure by Hydride Blister Initiated Cracking", byM. Léger (OH Technologies).
9. "Inspection Procedures for Assessment of Blister Formation/Cracking", by M.P. Dolbey(OH Technologies).
10. "Restricting the Operating Envelope to Minimize Failure Probability", by N. Azer (AECL-CANDU) and H. Wong (AECL-CANDU).
11. "Worked Examples and Discussion", by T.P. Byrne (OH Technologies) and H. Wong(AECL-CANDU).
RECORD: CB:\WPDATA\PIUCE}FCHB-ZR2JT93-O9-O9

1. OVERVIEW OF BLISTER PHENOMENA INRELATION TO PRESSURE TUBE INTEGRITY
by
E.G. Price (AECL-CANDU)

OVERVIEW OF BLISTER PHENOMENAIN RELATION TO PRESSURE TUBE INTEGRITY
E.G. Price
1.0 INTRODUCTION
Unstable pressure tube rupture is an event in a pressure tube type PHWR that has potentiallyserious economic and safety consequences, and reactor operation under conditions which entailthe risk of such failure should be avoided. Mostly, failure mechanisms in zirconium alloypressure tubes involve hydrogen either in the initiation process or the propagation process. Theslow propagation of such cracks by delayed hydride cracking (dhc) are well characterizedexperimentally and by post service observation allowing a reasonable prediction of the time fora crack to grow to an unstable length after leaking. Action can then be taken to shutdown thereactor before the crack grows to an unstable length. If there is evidence that the above sequencecan be met, the design is commonly described as meeting a leak-before-break criterion.
For one mode of failure, i.e. a crack originating from a hydride blister (Figure 1) on the Outsideof the pressure tube, leak-before-break cannot be relied upon because the conditions in thepressure tube that led to the formation of the hydride blister, inhibit crack growth through thewall, and crack growth in the axial direction to a partial thickness unstable length is possible.This situation occurred in Pickering unit 2 in August 1983 when a pressure tube in channel G16ruptured with the reactor at power from exactly that cause. (Figure 2).
Fortunately the consequences of that rupture were limited by the availability of make-up heavywater and an orderly shutdown of the reactor was possible without invoking emergency systems.(Figure 3) The subsequent review of the state of the Zircaloy-2 pressure tubes led to a decisionto retube both Pickering 1 and 2 units.
The root cause of the G16 failure was the significantly displaced outlet end spacer in that channelexacerbated by the high rate of hydriding of the Zircaloy-2 pressure tube. Many other channelsin Pickering units 1 and 2, also has spacers out of position. Subsequent examinations showedthat a number of other reactors had channels in a similar out-of-design condition with spacersdisplaced from their intended locations. Since not all these reactors could be retubed, andbecause a change in pressure tube alloy to Zr 2.5% Nb, had been made in reactors tubedsubsequent to Pickering 2, it was imperative that the conditions which can cause blister inducedfailure be adequately quantified so that operation could continue with no sensible risk of rupture,until the intended design conditions could be restored by a spacer location and relocationoperation.
The Canadian nuclear industry has thus made a large investment in R&D related to hydrogen inpressure tubes to determine the criterion for initiation, growth and crack propagation fromblisters, so as to ensure satisfactory and safe performance of the reactors.
1

It is the purpose of these presentations and discussions to describe the essential features ofblister behaviour as researchers and analysts in Canada understand them, and how thephenomenon impacts on pressure tube integrity. We believe that the conditions that led to thePickering G16 rupture are present in the RAPs reactors, and that the information presented willallow the operators of the RAPs plants to make a valid assessment of the risk of pressure tuberupture in those reactors.
2.0 CHANGES IN PRESSURE TUBE CONDITION OCCURRING DURING SERVICE
Zirconium alloy pressure tubes in CANDU type PHWR reactors are exposed to aqueousconditions embracing high temperature, fast neutron flux and high pressure. Under thisenvironment there will be a change in the margins between ample resistance to the operatingconditions at the start of service (effectively to leak-before-break) to progressively tighter marginsas the tubes age. Two properties, dimensions, and hydrogen concentration represent the mainproperties where changes are important to the life of a pressure tube. But in the case of achannel with out-of-position spacers, the changes in these properties can reduce severely theoperating life of the pressure tubes.
The dimensional changes in pressure tubes have to date been at a constant rate and thuspredictable. The hydrogen pick up by corrosion of Zircaloy-2 in Pickering units 1 and 2however, was not at the predicted rate and an acceleration that occurred beyond 6 effective fullpower years of operation in a Pickering unit, contributed significantly to the cause of the G16rupture
3.0 SPACER DISPLACEMENT
The evidence from laboratory experiments and post irradiation examinations (PIE) of pressuretubes, indicates spacers were moved out of position during the installation and commissioningof the channels in early reactors. No evidence has been observed from PIE of pressure tubes ofspacer movement in service. With displaced spacers, large spans of pressure tube exist betweensupporting spacers. This increases the local rate of sag of the pressure tube, and contact of thepressure tube with the calandria tube can occur in an operating time, which is well short of thedesign life. In the extreme, with spacers all in the end bells of the calandria tube, contact willoccur almost immediately. This contact could occur over most of the length, although physicallyit is not possible for the pressure tube to contact the pressure tube for a short distance from eachend of the pressure tube.
4.0 PRESSURE TUBE TO CALANDRIA TUBE CONTACT
The contact produces in the pressure tube a localized cooling and in the calandria tube a localhot spot. The consequence of local heating of the calandria tube is some localized precipitationfrom moderator solution, of metallic compounds whose solubility decreases with temperature.On the pressure tube, the cooling produces a thermal gradient through the wall of the tube.Under certain conditions, hydrogen will migrate down the temperature gradient and accumulate

in the coldest region. The condition for precipitated hydride is that the local hydrogenconcentration of the tube must exceed the TSS for the temperature of the cold spot. Typically,the temperature of the contact zone of the pressure tube will increase as the temperature increasesfrom inlet to outlet.
If the temperature of the cold spot can be estimated accurately, then the hydrogen concentrationfor hydride precipitation can be determined. Such precipitation, when it occurs under operatingconditions, is considered to be the start of blister formation.
5.0 GROWTH OF A BLISTER
Once initiated, a blister can then grow at a rate determined by the rate at which hydrogen diffusestowards the cold spot. This rate will be influenced mostly by the ingress rate of deuterium tothe pressure tube. As described in the following papers, a number of other factors will affectgrowth. Also it was observed from the examination of the G16 pressure tube that a row ofblisters is formed, likely as a result of surface waviness on the pressure tube, but also frompossible maldistribution of contact pressure.
6.0 THRESHOLDS IN BLISTER BEHAVIOUR
In describing blister behaviour in pressure tubes, we see that there are two major thresholds thatcan be reached if contact conditions are not altered.
(a) A threshold at which the hydrogen concentration of the pressure tube reaches a valuewhere hydride can precipitate at the contact region. This is typically described as theblister formation threshold (BFT).
(b) The growth of a blister to a threshold size where cracks can grow from the blisters intothe parent metal. The growth of the blister to this size depends on the influence ofvarious parameters.
The threshold for hydride initiation can be predicted reasonably well from simulation experimentsand modelling. These models have been used to predict blister formation in pressure tubes ofknown hydrogen concentration and known to be in contact with their calandria tubes, and themodels have been found to be in good agreement with observations on such tubes after removal.For Zircaloy-2 tubes, the blister formation threshold concentration is between 20 and 30 ppmdepending on the location of the channel in the reactor and the location along the tube.
The second threshold, i.e. blister cracking threshold, is reached when a blister has grown to aparticular size such that the blister can initiate a crack on the tube body. Cracks can thenpropagate by DHC. The onset of this threshold cannot be defined with comparable accuracy tothe BFT, due to variation in hydrogen ingress rates, contact conditions with growth, and thefactors influencing fracture. From the variables involved, there is expected to be a widedistribution of times to dhc initiation for a population of pressure tubes in the same condition.The risk of pressure tube rupture increases the longer the time the tube operates beyond BFT.

7.0 SERVICEABILITY
In establishing the serviceability of a pressure tube it is necessary to know the rate of hydrogenbuild up in a tube and whether the tube is in contact Inspection for the existence of blistersrequires intrusive inspection of each channel. Monitoring for hydrogen ingress requires eitherthe removal and destructive sampling of the tubes or scrape sampling. A significant effect offlux on hydrogen pick-up exists in Zircaloy-2, thus requiring a detailed analysis of channels whenpredicting hydrogen levels. It should be pointed out that considerable analytical effort has hadto be expended to ensure the required accuracy of the deuterium and hydrogen analyses wereachieved to establish rates in Zr-2.5% Nb.
8.0 OPERATING PRACTICE
It is the practice in Canada and CANDU 6 units operating outside Canada, to only operatepressure tubes in contact with a hydrogen concentration below the blister formation level.Although growth characterization and fracture criterion have been developed for blisters, it is feltthat the comprehensive validation of the inputs and the modelling must be completed to allowa sensible engineering margin between safe operation and failure to be defined. In addition, thespacer relocation equipment developed in Canada, which is being employed to restore thechannels to their design condition, would, on removing tubes from contact with a blister present,allow the blisters to dissolve. However, if a large cracked blister existed, the cracks remain andan uncertain stress state could exist.
These operational requirements are based on the behaviour of Zr-2.5% Nb. For Zircaloy-2pressure tubes where the hydriding rate can be much higher, the risk in operating after BFT ishigher.
9.0 ZIRCALOY-2 CHARACTERISTICS OF CONCERN
Not only will the rapid hydriding characteristics of Zircaloy-2 increase the rate of growth ofcontact blisters, but the increased hydrogen concentration will lower the fracture toughness of thetube.
10.0 LIFE OF ZIRCALOY-2 PRESSURE TUBES
In the absence of pressure tube to calandria tube contact, a Zircaloy-2 pressure tube, with anassumed hydriding rate about halfway between that of Pickering and NPD, could have a lifebetween 12 and 15 EFPY. At that stage the toughness of the alloy would likely not be adequateto meet leak-before-break requirements.
With contact occurring, the tubes would appear to be at high risk after about 8 EFPY's ofoperation when the hydriding rate will enter an acceleration phase.
2. CORROSION AND HYDRIDING OFZIRCALOY-2 PRESSURE TUBES
E.V. Murphy (AECL-CANDU)and V.F. Urbanic (AECL-RC-CRL)

CORROSION AND HYDRIDING OF ZIRCALOY-2* PRESSURE TUBES
E.V. Murphy and V.F. Urbanic
1.0 INTRODUCTION
Zircaloy-2 has seen extensive use as pressure tube material in pressure tube type reactors. It wasthe material of choice for the early CANDU demonstration reactor, NPD at Rolphton, Ontario,for the prototype CANDU reactor at Douglas Point, Ontario and for the first two of thecommercial CANDU reactors at Pickering, Ontario, ie Pickering Units 1, 2. It was also thepressure tube material of choice for the Hanford N reactor in Washington state, USA and forthe British Steam Generating Heavy Water Reactor (SGHWR) at Winfrith, UK. And finally, itis the material that has been used in the commercial reactors in the Indian nuclear powerprogram. Therefore, there is a considerable operating history for Zircaloy-2 in pressure tube typereactors.
The most relevant information available on the in-reactor corrosion and hydriding performanceof Zircaloy-2 pressure tubes comes from pressure tubes removed from the NPD reactor, thePickering Units 1,2 reactors and the Hanford N reactor. The above reactors have either had theirZircaloy-2 pressure tubes replaced with Z- 2.5Nb pressure tubes as for the Pickering Units 1, 2reactors, or have been shut down. There is no available information on the corrosion andhydriding of the Zircaloy-2 pressure tubes in the Douglas Point and SGHWR reactors, both ofwhich have now been shut down, or from the Indian power reactors.
The replacement of the Zircaloy-2 pressure tubes in Pickering Units 1, 2 was preceded by thefailure of a pressure tube in the G16 fuel channel of Pickering Unit 2 (called P2G16) in August,1983. The metallurgical investigation of this tube and of several other pressure tubes removedfrom the Pickering Units 1,2 reactors indicated the corrosion and hydriding rates of the Zircaloy-2 tubes were unexpectedly and unacceptably high and they were replaced as indicated above.The information generated in the investigations of Zircaloy-2 pressure tubes following the P2G16failure is used extensively in this paper.
2.0 DESIGN
For the purposes of this paper, the design of the fuel channel of most of these reactors can beconsidered as similar. Essentially, the design is as in Figure 1. The ends of the pressure tubesare rolled into steel end fittings ( type 403 stainless steel in CANDU reactors), and which, inturn, are connected via the feeder couplings to the feeders of the heat transport system (HTS).The pressure tubes are surrounded by the calandria tubes and kept from contact with them by
The term hydriding is used throughout and is intended to cover any uptake of eitherhydrogen or deuterium by the pressure tubes.
1

annular spacers. The HTS coolant flows through the pressure tubes while the annular spacebetween the pressure tubes and the calandria tubes is filled with the annulus gas. With theexception of SGHWR, the fuel channels of all the above reactors are horizontal.
With the exceptions of the Hanford N reactor and the SGHWR reactor, the HTS coolant in theabove reactors is heavy water. The chemistries of the coolants and of the gas annuli in thosereactors for which information on corrosion and hydriding behaviour is available, along withseveral other characteristics of these reactors, are as shown in Table 1.
The annulus gas systems in the several reactors serve several purposes. Initially, the annulussystem was designed to insulate the moderator from the HTS, such as in the open annuli of theNPD and Douglas Point reactors. In the more recent reactors such as the Pickering reactors, theannulus gas system is a closed, recirculating system and is designed to be slightly oxidizing sothat it will preserve the integrity of the oxide on the out side of the pressure tubes. This protectsthe pressure tubes from deuterium pickup due to any buiJd up of gaseous deuterium in theannulus system as a result of deuterium diffusion through the steel end fittings. And finally itis now used as a means of detecting possible leaks from the fuel channels by continuousmonitoring of the dew points in the annulus systems.
3.0 OPERATING PERFORMANCE
Figure 2 shows the relative corrosion behaviour of removed Zircaloy-2 pressure tubes from thosereactors for which such information is available. The data is given in terms of the maximumuniform oxide thickness seen on these tubes as a function of the effective full power operationof these reactors. All the data lie on the same curve up to an oxide thickness of approximately15um after which there is different but accelerating kinetics up to the limit of the available datafor the pressure tubes from Pickering Units 1 ,2 reactors and the Hanford N reactor on the onehand and for NPD on the other. Figure 3 shows the hydriding of the pressure tubes of Figure2, ie it shows the hydriding at the locations of the maximum uniform oxide thickness along thepressure tubes. The hydriding is expressed in units of mg/dm2 to account for the difference inwall thickness between the tubes from the different reactors.
While Figures 2 and 3 show the extremes of the corrosion and hydriding of the pressure tubesin the several reactors, Figures 4 and 5 show the corrosion and hydriding behaviour found alongseveral pressure tubes removed from the Pickering Units 1, 2 reactors. The variation of theseparameters along the channels is quite marked, but the sharp peaks toward the outlet ends maskthe increased hydrogen pickup at rolled joints relative to pickup in the body of the tubes. Forexample, Figure 6 shows the hydrogen content at the inlet rolled joint of a Zircaloy-2 pressuretube removed from Pickering Unit 2. This figure shows there is considerable pickup of hydrogenat the rolled joint region of the pressure tube relative to pickup inboard of the rolled joint.Because AECL now uses pressure tubes of Z-2.5Nb, there is little further research on thehydriding of Zircaloy-2 pressure tubes. However, it has been shown both from laboratorytesting and from the examination of Z-2.5Nb pressure tubes removed from reactors, that thisincreased hydriding of pressure tubes at rolled joint locations is now a well establishedphenomenon for zirconium alloy pressure tubes.

4.0 DISCUSSION
Most of the available evidence indicated that the corrosion kinetics of Zircaloy type alloys inhigh temperature water consisted of three distinct phases. First there was the formation of a thinfilm following cubic growth characteristics to a thickness of about 2.0um. Next, the corrosionrate increased with time in a transition period. And finally, there was the post transition periodwhen a constant linear corrosion rate was established. This model was based on laboratory andreactor testing that was relatively short compared with a pressure tube design life. The behaviouris shown schematically in Figure 7
The results presented in Figure 2 for the in-reactor corrosion of Zircaloy-2 pressure tubes didnot conform to this model as the corrosion rate for some of the pressure tubes showed acontinuously accelerating rate after reaching an oxide thickness in the 15-20um range. Theseresults prompted a critical reappraisal of the corrosion mechanism, and in particular, as it appliedto in-reactor behaviour.
The corrosion behaviour of Zircaloy-2 in high temperature water depends on the temperature, theoxygen content of the water and on irradiation flux. As indicated in Table 1, the temperaturechange along a fuel channel in one of the Pickering reactors is about 50°C. This temperaturechange could account for a of 2-3 fold increase in corrosion rate along a fuel channel but aloneit can not account for the peaking in corrosion rate observed at about the 5.0m location in thechannels as indicated in Figure 4. Similarly, oxide thickness peaks were also observed in theHanford N reactor pressure tubes, and while there is a significant temperature increase along thefuel channels, the oxide peaks occurred close to the centre of the fuel channels, again suggestingthat parameters other than temperature play a significant role in the occurrence of these peaks.
In the absence of irradiation, the oxygen concentration does not affect the corrosion behaviourof Zircaloy-2 in high temperature water. However in the presence of irradiation, there is asynergistic effect between irradiation and oxygen content with corrosion rate increasing withincreasing oxygen content. As a result, hydrogen is added to the HTS of CANDU pressurisedheavy water reactors (PHWRs) to control the oxygen content and in this way it was expected tominimise and control the corrosion of zirconium alloys. Obviously, this was not the experiencewith the long term exposure of the Zircaloy-2 pressure tubes in Pickering Units 1, 2.
Figure 4 indicates that the G20 low flux channel of Pickering Unit 1 had the smallest peak incorrosion rate of the removed pressure tubes, implying that the flux played a critical role in thelong term in-reactor corrosion behaviour of the Pickering Units 1, 2 Zircaloy-2 pressure tubes.Also it was noted in comparing the curves in Figure 4 with the information available from theexamination of pressure tubes previously removed from the Hanford N reactor that the peaks inoxide thickness occurred at high flux locations in both reactors (1). This was in spite of the factthat the high flux location in the Hanford N reactor occurs in the centre of the channels, whiledue to the relatively flat flux profile in the Pickering reactors, the flux is still high at thecorrosion peak location towards the outlet of the fuel channels. Similarly, Figure 2 shows thatthe data for pressure tubes from the NPD reactor are displaced to longer exposures for equivalentoxide thicknesses, and this is believed to be more a consequence of the relatively lower flux in

the NPD reactor rather than the lower fuel channel temperature. However, the deviation inbehaviour is not apparent until after reaching an oxide thickness of approximately 15um.
Evidence already available corroborated the fact that there could be a transition in the in-reactorcorrosion behaviour of Zircaloy-2 once the oxide thickness was in the 15-20um range. Someearly tests in the Engineering Test Reactor (ETR) at Idaho Falls showed that Zircaloy-2specimens with oxide thicknesses > 20um continued to oxidize at the same high corrosion ratewhen the water chemistry was changed from oxidizing to reducing conditions (2).| In a secondseries of tests in the Advanced Test Reactor (ATR), Zircaloy-2 specimens with oxide thicknesses<15um were exposed first to oxidizing conditions and then to reducing conditions.. In these teststhe corrosion kinetics reverted from the kinetics typical of oxidizing conditions to those typicalof reducing conditions when the specimens were transferred from the oxidizing to the reducingconditions (3). These tests confirmed there was a change in the corrosion behaviour of Zircaloy-2 as the oxide increased in thickness from 15-20um. This change was also accompanied by achange in the hydrogen pickup rate of the Zircaloy-2 material.
The basic chemical reaction of any zirconium based alloy with high temperature water is
Z + 2H,0 — ZrO2 +2H2
Some of the hydrogen produced is released to the HTS, but a fraction is picked up by thezirconium alloy. The fraction picked up by a pressure tube material is important because of itseffect on delayed hydrogen cracking (DHC) considerations (4,5,6,7) and on the fracture toughnessof the pressure tubes (8)
In out-reactor tests and under low oxygen conditions in-reactor, Zircaloy-2 is acknowledged topick up approximately 50% of the corrosion product hydrogen. Conversely, under high oxygenconditions in-reactor (and hence where there would be an acceleration in corrosion rate), therewould be a significantly lower uptake of the corrosion product hydrogen. The corrosion andhydriding behaviour is summarized by the solid lines in the schematic of Figure 8, and wherethe H:O ratio is used to express the oxidizing power of the coolant.
However, the ETR and ATR tests indicated that there could be a change in the hydrogen pickupbehaviour of Zircaloy2 when oxide thicknesses exceeded 20um. For example, when theenvironment was changed from oxidizing to reducing conditions for material with oxidethicknesses < 15um, both the corrosion and hydrogen pickup remained consistent with the modelof Figure 8. However, this was not found to be the case for material with >20|im oxide thicknessin the ETR tests. Here it was found that when the environment was changed from reducing tooxidizing conditions, the corrosion rate reverted to the high rate typical of oxidizing conditions,but in addition, the hydrogen pickup rate continued at the high pickup rate characteristic ofreducing conditions, and not at the low hydrogen pickup rate characteristic of oxidizingconditions. This behaviour is reflected in the dotted lines included in Figure 8. This modifiedmodel of the in-reactor corrosion and hydriding behaviour of Zircaloy-2 can be used to explainthe observed corrosion and hydriding behaviour of the Zircaloy-2 reactor pressure tubes.

The data of Figure 2 indicate that the corrosion kinetics were essentially constant up to oxidethicknesses of about 15um, after which there was a continuous increase in the corrosion rate. Toexplain this situation it was proposed that there was a significant change in the corrosion kineticsonce this value of 15um was exceeded. Essentially, it is surmised, that once this thickness isexceeded, that there is local radiolysis within the oxide, ie that the hydrogen added to the coolantcan not control the oxygen production, so that the pressure tube surface is exposed to anoxidizing environment and hence there is an increase in the corrosion rate.
As a corollary to this mechanism, the situation would deteriorate with increasing oxide thicknessas seen in Figure 2, where for the high flux tubes, there is increasing kinetics up to the limit ofthe existing data. In addition, when the hydrogen pickup of the Pickering Units 1, 2 pressuretubes of Figure 3 is expressed as a percentage of the corrosion product hydrogen, the percentagepickup is in the 50% range. This indicates that the decreased hydrogen pickup that is associatedwith an oxidizing environment does not occur with thick oxides, and thus confirms the modifiedmodel of Figure 8, ie that with thick oxides under reducing conditions, both the corrosion andthe hydrogen pickup rates are high.
The amount of hydrogen that was picked up by most of the pressure tubes removed from thePickering Units 1, 2 reactors could be explained by assuming that approximately 50% of thecorrosion product hydrogen was picked up. However, there were a number of locations alongsome pressure tubes where the measured hydrogen content exceeded 100% of the corrosionproduct hydrogen and that therefore could not be explained by the above mechanism. Since therewas no evidence of oxide spalling at these locations, the presence of a thicker oxide could notbe used to account for hydrogen pickup exceeding 100%. It was subsequently found that theselocations were usually at the cooler inlet ends of the pressure tubes and were always associatedwith very thin outside surface oxides, some of which were less than l.Oum thick. Since thepressure tubes were autoclaved in 400° C steam to give oxide thicknesses in the l|im rangebefore insertion in the reactor, it was obvious that there had not been any substantial oxidegrowth on the outside surfaces of some of the pressure tubes even after approximately 4000EFPD of operation. This indicates that the very dry nitrogen annulus gas atmosphere of dewpoint < -18°C that prevailed in the units before replacement of the Zircaloy-2 pressure tubes wasprobably reducing much of the time, allowing the outside surface oxide to deteriorate. Thedeterioration of the oxide permitted hydrogen pickup directly into the pressure tube from thehydrogen present in the annulus gas. This mechanism had previously been demonstrated forzirconium alloys where in the absence of sufficient oxidizing species to maintain a normaloxidation rate, hydrogen was absorbed directly from the gas phase (9). One consequence of theseobservations was a recommendation to maintain an oxidizing annulus gas atmosphere, and thisrecommendation has been implemented in most of the CANDU plants by adding oxygen in therange 0.5- 5.0 vol % to the carbon dioxide that is used as the annulus gas in these systems.
It is apparent from Figure 6 that there is also additional pickup of hydrogen associated with therolled joints of CANDU reactors over and above the pickup in the body of the tube. This pickupis now believed to be due to galvanic effects associated with the crevice between the pressuretube and the type 403 stainless steel end fitting, The hydrogen generated in the corrosion

reaction is cathodically discharged on the end fitting and some of it diffuses into the pressuretube through the points of intimate contact between the pressure tube and the end fitting. Thistopic is discussed at length in reference 10.
Since all the AECL designed domestic and export CANDU reactors are now tubed with Z-2.5Nbpressure tubes, a brief comparison of the in-reactor performance of both pressure tube materialsis in order. The reactors with the most severe exposure, ie combining length of exposure andtime integrated flux, for Z-2.5Nb pressure tubes are the Bruce Units 1-4 reactors of OntarioHydro. These reactors have accumulated exposures of approximately 4600 EFPD and so farthere has not been an apparent acceleration in corrosion rate such as shown by Zircaloy-2 inFigure 2. Also, the pressure tubes continue to demonstrate one of the more significantadvantages of Z-2.5Nb in that the pickup rate of the corrosion product hydrogen is significantlylower for Z-2.5Nb than for Zircaloy, ie approximately 5% for Z-2.5Nb compared to about 50%for Zircaloy-2 . The combination of superior in-reactor corrosion behaviour and much lowerhydrogen pickup rate confirm the advantage of Z-2.5 Nb as pressure tube material for CANDUPHW reactors
5. CONCLUSIONS
(1) The corrosion and hydriding of Zircaloy-2 pressure tube material under CANDU PHWRconditions accelerates once the oxide thickness reaches the 15-20um range.
(2) The mechanism is ascribed to radiolysis within these "thick" oxides leading to kineticscharacteristic of oxidizing conditions. However, under these local oxidizing conditions,the pressure tubes continue to pick up hydrogen at a rate that is characteristic of reducingconditions rather than oxidizing conditions.
(3) The examination of the pressure tubes removed from Pickering Units 1, 2 indicated thatthe annulus gas was not always sufficiently oxidizing to maintain a protective oxide onthe outside surface of the pressure tubes. As a result, there was hydrogen pick updirectly from the annulus system from hydrogen accumulation in the annulus system asa result of hydrogen diffusion through the end fittings. Subsequently, it wasrecommended that oxygen in the 0.5-5.0 vol% range should be added to the carbondioxide annulus gas.
(4) The unexpectedly high corrosion and hydriding of the Zircaloy-2 pressure tubes inPickering Units 1, 2 contributed to their replacement with pressure tubes of Z-2.5Nb.
(5) The performance of Z-2.5 Nb pressure tubes after approximately 4600 EFPD in the BruceUnits 1-4 reactors of Ontario Hydro confirms the superior in-reactor corrosion andhydriding behaviour of Z- 2.5Nb relative to Zircaloy-2.

REFERENCES
1. K.V. Scott, "N Reactor Pressure Tube 2566 Post Irradiation Examination", U.S. ReportUNI-1204, December 1978.
2. A.B. Johnson Jr. and J.E. Irvin, "Radiation Enhanced Oxidation of Zircaloy-2 in pH 10.5LiOH and pH 10 NH4OH ", US Report BNWL-463, 1967.
3. A.B. Johnson Jr., J.E. Lesurf and R.A. Proebstle, "Study of Zirconium Alloy CorrosionParameters in the Advanced Test Reactor", ASTM STP-551, p495, 1974
4. CE. Coleman, B.A. Cheadle, J.F. Ambler, P.C. Lichtenberger and R.L. Eadie,"Minimizing Hydride Cracking in Zirconium Alloys", Canadian Metallurgical Quarterly,Volume 24, No. 3, p245, 1985.
5. R. Dutton, M.P. Puis and L.A. Simpson, Metallurgical transactions A, Volume 8A,pl553, 1977.
6. J.F. Ambler, "Effects of Direction of Approach to Temperature on Delayed HydrideCracking Behaviour of Cold Worked Zirconium", Zirconium in the Nuclear Industry,ASTM STP 824, p653, 1984 .
7. CE. Coleman and J.F. Ambler, "Susceptibility of Zirconium Alloys to Delayed HydrogenCracking", Zirconium in the Nuclear Industry, ASTM STP 633, p 589, 1977.
8. CE. Coleman, B.A. Cheadle, A.R. Causey, P.C. Chow, P.H. Davies, M.D. McManus,D.K. Rodgers, S.Sagat and G. van Drunen, "Evaluation of Zircaloy-2 Pressure Tubes fromNPD", Zirconium in the Nuclear Industry, ASTM STP 1023, p35, 1988.
9. D.W. Shannon , "Role of the Oxidation Rate on the Hydriding of Zirconium Alloys inGas Atmospheres Containing Hydrogen", Corrosion, Volume 19, p414, 1963.
10. V.F. Urbanic, G.M. McDougall, A.J. White and A.A. Bahurmuz, "Deuterium Ingressat Rolled Joints In CANDU Reactors", Proceedings of International Conference onExpanded Rolled Joint Technology, (Canadian Nuclear Society), Toronto, Ontario, 1993.
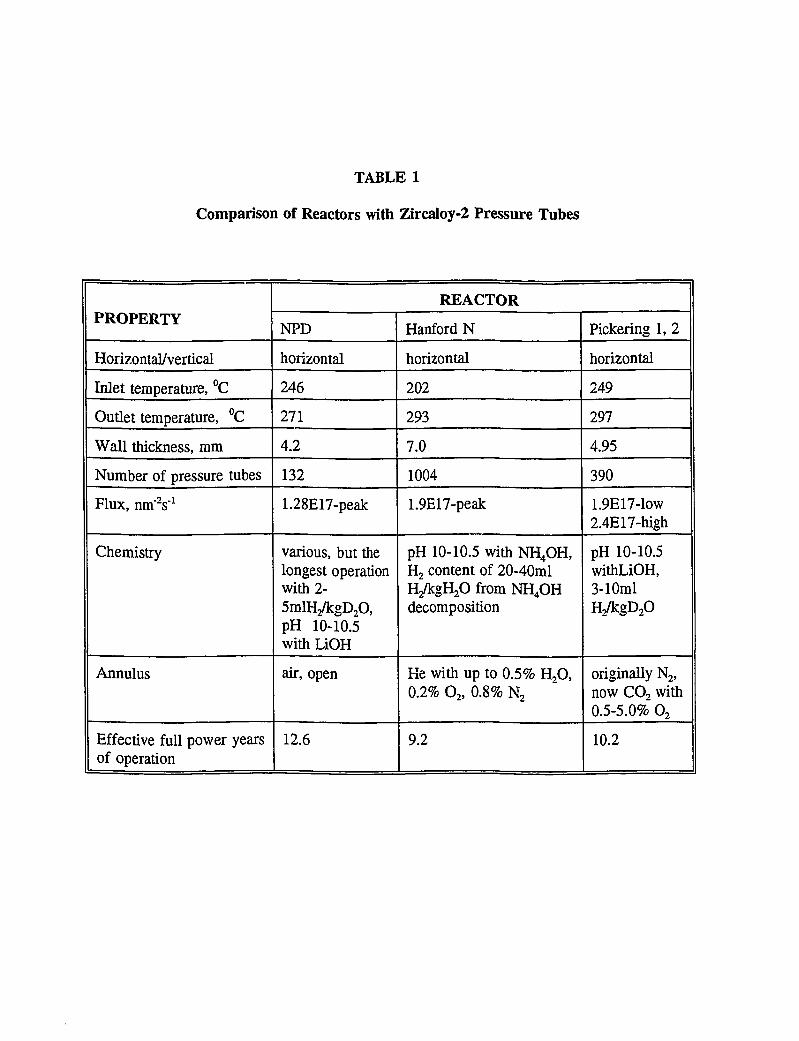
TABLE 1
Comparison of Reactors with Zircaloy-2 Pressure Tubes
PROPERTY
Horizontal/vertical
Inlet temperature, °C
Outlet temperature, °C
Wall thickness, mm
Number of pressure tubes
Flux, nin'V1
Chemistry
Annulus
Effective full power yearsof operation
REACTOR
NPD
horizontal
246
271
4.2
132
1.28E17-peak
various, but thelongest operationwith 2-SmlR/kgDApH 10-10.5with LiOH
air, open
12.6
Hanford N
horizontal
202
293
7.0
1004
1.9E17-peak
pH 10-10.5 with NH4OH,H2 content of 20-40mlH^gHjO from NH4OHdecomposition
He with up to 0.5% H2O,0.2% O2, 0.8% N2
9.2
Pickering 1, 2
horizontal
249
297
4.95
390
1.9E17-low2.4E17-high
pH 10-10.5withLiOH,3-10mll y k g D ^
originally N2,now CO2 with0.5-5.0% O2
10.2

FEEDERS CALANDRIATUBE
FEEDERS
ENDFITTING FUEL
BUNDLESPRESSURE
TUBE
END SHIELD
Fig. 1: Simplified version of a fuel channel. Each fuel channel consists of a zirconiumalloy pressure tube, sealed at each end with steel end fittings that have side portconnections to the heat transport system. The gap, or annulus, between thepressure tube and the surrounding Zircaloy-2 calandria tube is filled with aninsulating gas and contains coiled helical spring spacers that provide physicalseparation between the two tubes.

IIIIIIIIIII,
70
60
SO
bJ2
gxoXz:X
30
20
PICKERING-1 ANO -2
O HANF0R0 N-REACTOR
O HPO
1000 2000 3000
TIME (EFPO1
4000 S000
Fig. 2: Corrosion Of Zircaloy-2 pressure tubes in-reactor
so
CL
IIIIII
enax
2Ç
PICKERING-1 ANO - 2
O HANFORD N-REACTOR
O NPO
30
20 l -
X 10 _
1000 2000 3000
TIME «FFPD1
4000 SOO0
Fig. 3: Hydriding of Zircaloy-2 pressure tubes in-reactor

60
COLU
tuQ
Xo
Fig. 4:
4SI
^ 30 L
P2G16P2J15P1K05P1G16
— 1 P1K18
P1G20
HIGH FLUX
LOW FLUX
JL JL ±100 200 300 A00 . 500
DISTANCE FROM INLET ENO (cm)600
Maximum uniform oxide thickness along 6 of the Zircaloy-2 pressure tubesremoved from Pickering Units 1, 2.

en_*:\enE
a:t—zUJ
Z
o
U J
UJQ
300
200
100
P2G16P2J15P1K05P1G16
-A P1K18
P1G20
HIGH FLUX
LOW FLUX
1 1. 1
Fig. 5:
0 1 2 3 4 S 6
DISTANCE FROM INLET END (ml
Average deuterium content along 6 of the Zircaloy-2 pressure tubes removed fromPickering Units 1, 2.

200 r
0 1
G
O
LUCJ
o(J
-25LlJ
UJ
150
100
0
Û 0
O
o
ROLLED JOINT AREA
0
O
O
o
10 20 30
DISTANCE FROM TUBE END (cm)
O
50
Fig. 6: Average deuterium concentrations through Pickering Unit 2 G16 inlet rolled joint.

001
u
ta
o
PRE TRANSITION
TIME
Fig. 7: Schematic of corrosion kinetics of Zircaloy-2 in high temperature water.

HYDROGEN UPTAKE
X NEW SPECSWATER CHEMISTRY CHANGED
• -+O\ AT > 20
X
10 ce / k g UO ce /kg
10' 10'
H'O RATIO
10'
Fig. 8: Effect of water chemistry on corrosion and hydriding of Zircaloy-2 in-reactor.

3. CREEP SAG OF ZIRCALOY-2 PRESSURE TUBESIN CANDU-PHW REACTORS
A.R. Causey and R.J. Klassen (AECL-RC-CRL)
RECORD: (H:\WPDATA\FRICEIKCHB-ZR2.PT93-0909

CREEP SAG OF ZIRCALOY-2 PRESSURE TUBESIN CANDU-PHW REACTORS
A.R. Causey and RJ. Klassen
ABSTRACT
In CANDU-Pressurized Heavy Water reactors, the horizontal fuel channels sag as a result ofcreep caused by the distributed load of the fuel and coolant, elevated operating temperature,and fast neutron flux. Creep sag has been monitored in Zircaloy-2 pressure tubes installed inthe NPD, Pickering Units 1 and 2, and Douglas Point reactors using direct measurement ofpressure tube curvature. Using the sag measurements and additional length and diameterchange data, a computational creep analysis was set up to predict the fuel channel sag in aDouglas Point type reactor. The model predicts the time and length of pressure tube/calandriatube contact as a function of annular spacer location. The effect of removing the fuel aftercontact has occurred was assessed and shown to result in breaking of the contact only if thefuel is removed very shortly after contact first occurs.
1.0 INTRODUCTION
Horizontal pressure tubes in CANDU reactors operate under hoop stresses from 95 to 125MPa at temperatures from 520 to 580 K and in fast neutron fluxes up to 3.5 x 10¹⁷ n.nïls"1
(E > 1 MeV). In addition to these stresses, the tubes are subject to bending stresses inducedby the weight of the fuel, the coolant and the tube. Creep deflection of the pressure tubedepends on the structural behaviour of the fuel channel, which consists of a pressure tubesupported by a concentric calandria tube through annular spacers and by end-fittings. It alsodepends on the irradiation-enhanced creep behaviour of the zirconium alloys from which thepressure tube and calandria tube are fabricated. With time, the faster creeping pressure tubecould eventually contact the calandria tube. Creep deflection of both tubes could also resultin contact of calandria tubes with reactor control mechanisms which are located horizontallybetween the fuel channels. By understanding the effects of irradiation-induced creep thedesigner and operator can make the necessary allowances to achieve the optimal reactorlifetime for the fuel channels.
Direct measurements of pressure tube sag have been carried out in many CANDU reactorsincluding the initial prototypes NPD and Douglas Point and the first two reactors (Units 1 and2) from the Pickering Nuclear Generating Station (Table 1). The pressure tubes in thesereactors were cold-worked Zircaloy-2. This report presents the sag measurements ofcold-worked Zircaloy-2 pressure tubes and applies a computational creep analysis to predictthe sag and subsequent time to pressure tube / calandria tube contact as a function of annularspacer location.

2.0 DEFLECTION MEASUREMENTS
Deflection measurements were made during reactor shutdown periods by inserting ameasuring device (Figure 1) into the pressure tube which had been emptied of fuel anddrained of coolant. The device measured the radius of curvature, R(x), at equally spacedintervals along the tube. The measurements were made with a displacement probe mounted atthe centre of a reference beam. Two tips attached to the ends of the beam establish areference line from which displacement, 5, was measured, such that R(x) = 8Ô7L2, where L isthe length of the beam. The deflection, Y, at distance x from the end of the tube wascomputed by double integration of R(x) with respect to x. The accuracy of the deflectionmeasurement was better than the greater value of either + 1% or + 0.1 mm.
The sag deflections were measured in two pressure tubes in the NPD reactor, four tubes in theDouglas Point reactor, and four tubes each in the Pickering Units 1 and 2 reactors. Figure 2shows the curvature and deflection profiles measured from the Zircaloy-2 pressure tube inchannel F-07 of NPD after 5.4, 10.5 and 12.6 years of reactor operation1. Although after thefirst measurement the curvature is uneven, primarily because of the initial shape of the tube,the uniformly distributed load from the fuel and coolant results in a uniform downward sag.The annular spacer impedes this sag. With time, curvature decreases at the spacer andincreases between the spacer and end-fittings. The location of the minimum in the curvatureprofile indicates the approximate location of the annular spacer. The larger measureddeflections at the outlet end of the pressure tube reflect the higher operating temperature inthat region of the tube.
Maximum pressure tube deflections for the measured channels from the NPD, Douglas Pointand Pickering reactors are given in Tables 2 to 4. The maximum pressure tube deflectionsare plotted as a function of reactor time in Figure 3. The data from the Pickering fuelchannels indicate that the variability in deflection at a given time is about + 20%. Thepressure tube deflection rates were 0.1 mm/Year, 1.9 mm/Year, and 1.7 mm/Year for theNPD, Douglas Point, and Pickering reactors respectively. The deflection rate is a function ofthe fuel channel geometry and materials and, therefore, is different for the three reactors (seeSection 3).
Removal of several pressure tubes in Pickering Unit 2 made it possible to measure thedeflections of four calandria tubes. Maximum deflections after 12.4 year of reactor operationfor four Pickering Unit 2 calandria tubes are given in Table 4. The lower maximumdeflection in channel V-09 is attributed to the fast neutron flux in this channel being about70% that in the other channels. For the other channels, which experienced similar fastneutron flux, the maximum calandria tube deflections vary by less than + 7%.
One year corresponds to 7000 equivalent full power hours, assuming an 80% capacityfactor.

3.0 ANALYSIS
3.1 Model of Creep Sag in Zircaloy-2 Pressure Tubes
The following factors affect the sag deflection of a fuel channel [3]:
the dimensions of the pressure tube, calandria tube and the spacer-supports,the bending creep rates of the pressure tube and calandria tube,the number and location of the spacer-supports,axial loads from interactions with the end-shields and feeder pipes,as-installed straightness of the tubes, andslopes of the tubes at the rolled joints where the pressure tubes are attached to theend-fittings and calandria tubes to the end shields.
In this report only the effects of the first three parameters will be investigated for Zircaloy-2pressure tubes.
A creep deflection analysis has been applied to account for the behaviour of the pressure tubeand calandria tube deflections. The analysis calculates the contribution of thermal creep,irradiation creep, and irradiation growth to the deformation of the pressure tube and thecalandria tube via the following creep rate equations
^creep ~ e thermal + e-irradiation +^growth
where
and
In these equations a is the equivalent stress, T is the temperature, and <j) is the fast neutronflux. The parameters m, n^ .Q^, and A,.5 are material constants which are determined fromdirect measurement of the elongation and diametral changes of Zircaloy-2 pressure tubes inCANDU reactors [1-3]. The dimensional changes are strongly dependent on thecrystallographic texture of the zirconium alloy [4]. Analysis of the axial and diametral strain

rates derived from the measurements together with creep and growth anisotropy factorsderived from texture measurements gives the pressure tube material constants in Eqs. (1-4).The elongation rates of the pressure tubes in Pickering Units 1 and 2 varied from tube-to-tubeby about + 15%, hence the tube-to-tube variations in the creep rate constant derived from thelength and diametral measurements (which exhibit tube-to-tube variations of + 20%), are atleast + 25%.
A computer code was used to apply these creep equations to calculate the curvature anddeflection profiles as a function of time for a fuel channel in a Douglas Point type reactor. Inthe analysis the distributed pressure tube and calandria tube loads, temperatures, and fastneutron flux profile for fuel channel K-09 were used. Figure 4 shows the measured and thecalculated pressure tube deflection profiles after 3.4 years (23700 h) of reactor operation. Inthis figure the predicted maximum pressure tube deflection is about 1.5mm less than themeasured maximum deflection. This may be a result of measuring the tube with themoderator still in the calandria vessel. The bouyancy forces forces excerted on the calandriatube when it is surrounded by the moderator during gauging were not included in thecalculated pressure tube deflection. Despite this, a close correspondence between thepredicted and the measured deflection profiles is shown in Figure 4. The computationalcreep analysis was also applied to predict the rate of sag deflection of Zircaloy-2 pressuretubes in the Pickering Units 1 and 2 reactors. The calculated deflection rate was1.39 mm/year. This is in reasonable agreement with the rates derived from the measurementsof 1.7 mm/year for Zircaloy-2 pressure tubes.
3.2 Effect of Spacer Location and Fuel Removal on Contact
The span between the spacer supports (and between the supports and the end-fittings) controlsthe clearance between the pressure tube and the calandria tube and, hence, the time to contact.A series of computational analyses were performed to determine the effect of spacer locationon the time to pressure tube / calandria tube contact in a fuel channel from a Douglas Pointtype reactor. This type of fuel channel has two "loose fitting" annular garter spring spacers.The design location for the inlet spacer is 2.03 m from the inlet end of the pressure tubewhile the design location for the outlet spacer is 3.25 m from the inlet end. In the analysis,one spacer was maintained at the design location and the time to contact was calculated as afunction of location of the other spacer. Figure 5 shows the predicted contact time as afunction of spacer location for movements of either the inlet side or the outlet side spacer.The calculations indicate that with the spacers in the design locations the time to contact isabout 21 years (149,000 effective full power hours). The higher temperature, andsubsequently higher creep rates, at the outlet end of the pressure tube result in the time tocontact being sensitive to small changes in position of the outlet spacer.
Computational analyses were also performed to determine the effect of fuel removal on theextent of pressure tube / calandria tube contact. Parameters used in the calculation for theuniformly distributed forces on the pressure tube and calandria tube before and after removingthe fuel are given in Table 5. The operating conditions in the defuelled channel were

simulated by reducing the neutron fluxes to about 5%, equivalent to the contribution fromneighbouring channels, and maintaining the temperature along the length of the pressure tubeat the inlet coolant temperature. The results of the calculations are given in Table 6 for fourcases; I) both spacers at the design postions, II) both spacers in the inlet end of the channel,III) both spacers in the outlet end of the channel, and IV) both spacers outboard of the designpositions. In Case I contact between the pressure tube and calandria tube did not occurbefore at least 140,000 h. Spacer positions for Cases II and El were chosen to give contact atabout 35,000 h. For each case analyses were performed for fuel removal at 40,000, 50,000and 60,000 h. Both Cases II and III show that if the fuel is removed soon after the firstcontact the spring back of the pressure tube is greater than the elastic unloading of thecalandria tube and contact is broken. If contact occurs for several thousand hours thenremoving the fuel does not break the contact. The contact force remains constant at a lowervalue after removal of the fuel. In Cases II, III and IV the length of the contact is reducedafter fuel removal.
4.0 SUMMARY
The measurements and analysis of fuel channel deflections described here support thefollowing observations:
Analysis of channel deflections arising from interactions between fuel channelcomponents resulting from irradiation creep of the pressure and calandria tubes givesgood agreement with measurements.
Time to pressure tube / calandria tube contact is controlled by pressure tube creep rateand the positions of the spacer-supports.
Removal of the fuel after contact between the pressure tube and calandria tube iseffective in restoring an annular gap between the pressure tube and the calandria tubeonly if carried out soon after the initial contact is made.
ACKNOWLEDGEMENTS
We gratefully acknowledge CD. Nelson, RJ. Kinsella and K. Rogers of Ontario Hydro forthe deflection measurements at Pickering NGS A, and M.D. McManus and S.A. Donohue forthe deflection measurements at NPD and Douglas Point NGS.

REFERENCES
1. A.R. Causey and R.A. Holt, Trans. Am. Nucl. Soc. 44, 235-236 (1983).
2. A.R. Causey, S.R. MacEwen, H.C. Jamieson and A.B. Mitchell, Res. Mechanica 2,211-226 (1981).
3. A.R. Causey, A.G. Norsworthy, and C.W. Schulte, Can. Metall. Quarterly 24, 207-214(1985).
4. R.A. Holt and E.F. Ibrahim, Acta Metall. 27, 1319-1328 (1979).

TABLE 1 Summary of fuel channel designs for CANDU reactors which contained cold-workedZircaloy-2 pressure tubes.
Model
Power
Core Length
Pressure Tube
Inner Diameter
Wall Thickness
Calandria Tube
Material
Inner Diameter
Wall Thickness
Garter SpringMaterial
Type
Number perChannel
Coil diameter
NPD
25 MW
4 m
82.6 mm
4.20 mm
Aluminum
101.9 mm
1.27 mm
Inconel X-750
Tight
1
4.75 mm
Douglas Point
218 MW
5 m
82.6 mm
3.94 mm
Zr-2
107.7 mm
1.24 mm
H.T. Zr-Nb-Cu
Loose
2
7.52 mm
RAPP-1,2
220 MW
5 m
82.6 mm
3.94 mm
Zr-2
107.7 mm
1.24 mm
H.T. Zr-Nb-Cu
Loose
2
7.52 mm
Pickering-1,2
542 MW
6 m
103.4
4.95 mm
Zr-2
130.8 mm
1.55 mm
H.T. Zr-Nb-Cu
Loose
2
6.81 mm

TABLE 2 Maximum sag of pressure tubes from Fuel Channels H-07 and F-07 of the NPDNuclear Reactor.
ChannelNo.
H-07
F-07
Time(year)
7.0
10.6
14.3
20.0
5.4
10.5
12.6
MaximumPressure Tube
Sag(mm)
2.60
3.00
4.14
4.51
3.10
3.51
4.29
TABLE 3 Maximum sag and diameter of pressure tubes from the Douglas Point NuclearGenerating Station.
ChannelNo.
L l l
N15
K l l
K09
Time(year)
7.9
7.9
7.9
3.4
7.9
Maximum Sag(mm)
14.2
14.4
13.5
4.8
11.8
MaximumDiameter
(mm)
83.34
83.23
83.30
83.24
83.01
Elongation(mm)
19
14
13
not avail.
15

TABLE 4 Maximum pressure tube amd calandria tube deflections in selected channels in thePickering Units 1 and 2 reactors.
Un i t l
Unit 2
ChannelNo.
K05
K18
M i l
Q12
J15
G16
K13
V09
Time(year)
5.4
9.5
5.4
9.5
5.4
9.5
5.4
9.5
12.4
12.4
12.4
12.4
PressureTube
Deflection(mm)
14.8
21.3
18.6
23.3
18.7
31.2
22.1
26.3
30.0
n/a
31.0
n/a
CalandriaTube
Deflectiom(mm)
not avail.
not avail.
not avail.
not avail.
not avail.
not avail.
not avail.
not avail.
23.5
23.0
21.0
11.0
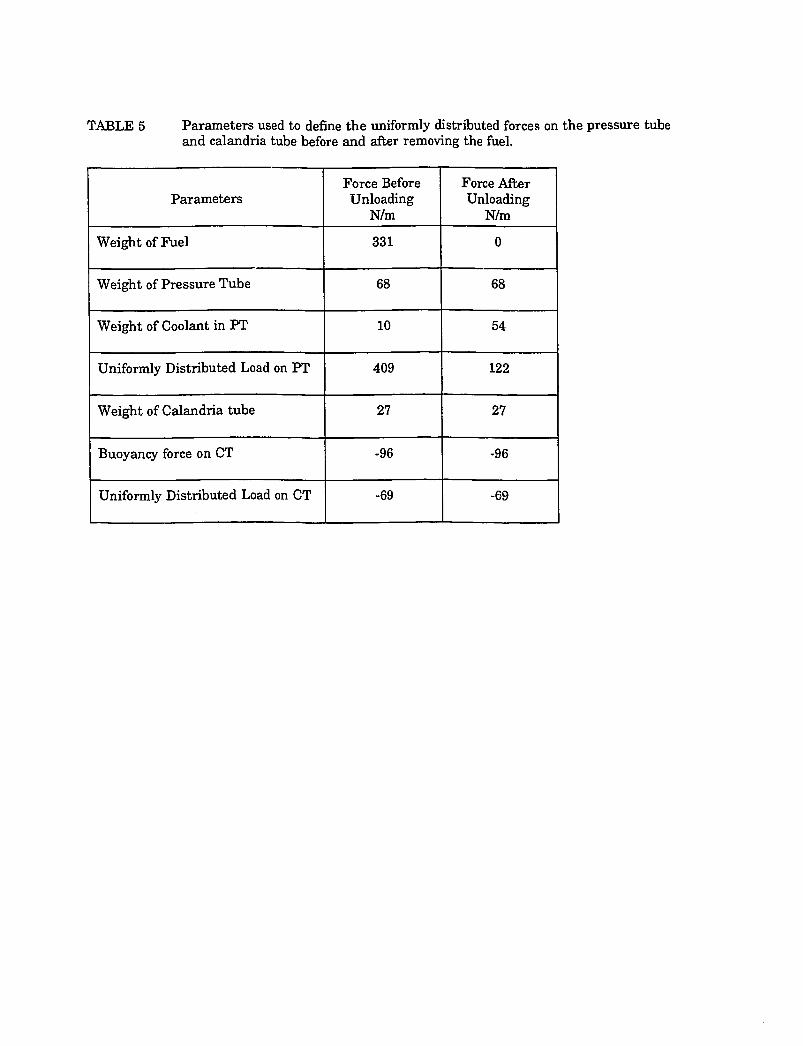
TABLE 5 Parameters used to define the uniformly distributed forces on the pressure tubeand calandria tube before and after removing the fuel.
Parameters
Weight of Fuel
Weight of Pressure Tube
Weight of Coolant in PT
Uniformly Distributed Load on PT
Weight of Calandria tube
Buoyancy force on CT
Uniformly Distributed Load on CT
Force BeforeUnloading
N/m
331
68
10
409
27
-96
-69
Force AfterUnloading
N/m
0
68
54
122
27
-96
-69

TABLE 6 Calculation of the effect of removing fuel from the channel after contact hasoccurred on length of contact and contact force in Douglas Point reactor.
CASE
I
II
III
IV
SpacerLocationsfrom Inlet
m
Design2.03/3.25
Inlet End2.03/2.40
OutletEnd3.25/3.38
BothOutboard0.65/4.52
Time ToFirst
Contactkh
140.0
34.6
35.3
2.7
UnloadingTime
kh
not avail.
40.050.060.0
40.050.060.0
40.0
Contact ConditionsBefore Unloading
Length ofContact m
not avail.
0.260.260.26
0.130.390.39
1.03
ContactForce N
not avail.
103198215
138172197
119
Contact ConditionsAfter Unloading
Length ofContact m
not avail.
00.130.26
00.130.13
0.78
ContactForce N
not avail.
060127
040113
94

Figure 1: Fuel channel curvature measuring device.

4.OS-»
9.SI-&
2.01-0
1.01-0
-1.01-0
—>
"" if41
• fv rV
lp«MZ Loamtlan \ }
-o.a
-0.4
-o.c
-o.»
-l.a
-1.4
0 10 30 30 40 SO SO 70 00 90 100 liO UO 130 140 180 ICO 170 MO
Loaatlon TXOM tncmx* Tab» Xnlab Kad (Tnnh»)
3lB-(t P-T5 " " kgc-TT JBB-S»
Figure 2: Measured pressure tube curvature and deflection versus position along the pressure tube offuel channelF-07 of the NPD reactor.

Pickering 1 & 2
? t .
0 20000 40000 CO000 80000 100000 120000 140000 160000
t Fnll F o n t Hour»
Figure 3: Maximum pressure tube deflection versus operating time for tubes from the NPD, DouglasPoint, and Pickering Units 1 and 2 reactors.
Difttanm Vzom Vrmtturm «Pub»
Figure 4: Measured and calculated pressure tube deflection versus axial position for fuel channel K-09of the Douglas Point reactor.

400
350
O«U*t «itou. M a l «*Monaco a d tb» HI**
1 2 3 4 5
Spacer Location nom inlet Knd of Pzessuze Tube (•)
Figure 5: Effect of support spacer position on time-to-contact for a two spacer Douglas Point type fuelchannel.

4. CONDITIONS IN THE PRESSURE TUBE ANDTHE CALANDRIA TUBE AFTER CONTACT
T.P. Byrne and M. Léger (OH Technologies)
RECORD: (B:\WPDATA\PRiaiJFCSB-ZR2.PT93-0949
CONDITIONS IN THE PRESSURE TUBEAND THE CALANDRIA TUBE AFTER CONTACT
T.P. Byrne and M. Léger
1.0 OBJECTIVE
The objective of this document is to provide a clear understanding of the expected conditions ina pressure tube following pressure tube-to-calandria tube contact. The conditions include both thethermal conditions and the range of effects that these thermal conditions have on hydrogendissolved in the zirconium alloy. The methods used to make an assessment of these conditionsare presented with reference to information in available publications.
2.0 INTRODUCTION
In order to be able to understand the consequences of pressure tube-to-calandria tube contact, theeffects of the contact on the temperature distribution in the pressure tube need to be clearlyunderstood. The whole phenomenon of hydrogen migration which results in the formation ofhydride blisters is driven primarily by the temperature field. Determining the steady statetemperature field for a given set of thermal boundary conditions and thermo-physical propertiesof the materials involved is simply the result of the solution of the heat equation with suitableboundary conditions. For the geometry of the pressure tube-to-calandria tube contact, numericalmethods can be used to establish the solutions. Determining the temperature of the pressure tubeat the contact location is required in order to establish the minimum hydrogen concentration inthe tube at which the phenomenon of blister growth begins.
3.0 FUNDAMENTAL EQUATIONS
The fundamental equation which must be solved in order to determine the temperature field isthe following:
pCpdT/dt = - V(kVT)+y
in which T is the temperaturet is timek is the thermal conductivityCp is the specific heat at constant pressure
and y is the rate of heat input into the material per unit volume from gammaheating.
In order to solve this equation, thermal boundary conditions and material properties are required.Simple solutions can be obtained for the steady state if heat flow in a single dimension isassumed. The gamma heating must also be known: a value of about 1 W/g is typical per unitmass for high power operations.

4.0 THERMAL BOUNDARY CONDITIONS
The thermal boundary conditions that must be established include:
1. The temperature of the heat transport coolant and the heat transfer coefficientbetween the coolant and the pressure tube.
2. The heat transfer coefficient of the contact between the pressure tube and thecalandria tube.
3. Moderator temperature and saturation temperature and the boiling heat transfercorrelation between the calandria tube and the moderator.
In addition decisions with respect to the heat transfer on the outer surface of the pressure tubeaway from the contact location need to be taken.
Each of these will be dealt with in turn.
4.1 Heat Transfer from the PHT to the Pressure Tube
The condition of heat transfer at the inside of the pressure tube is one of forced convection.Correlations for such heat transfer are available in the literature. The correlation that is used forblister assessments for CANDU reactors is that of Dittus-Boelter/1./. This correlation is asfollows:
h = 0.023 k/De(GDe/[i)°-8(|iCp/k)a4
in which:h is the heat transfer coefficientk is the thermal conductivity of the fluidDe is the equivalent hydraulic diameter = 4A/P with A the flow area and P the total
perimeterG is the mass flux|i is the viscosity, andCp is the specific heat of the fluid.
The values in parentheses are dimensionless numbers.
In CANDU channels, this correlation results in the calculated values of heat transfer coefficientbeing high. This result is, of course, an average value of the heat transfer coefficient and noattempt is taken to determine the precise distribution of the heat transfer due to the fuel bundleorientation and position relative to the location of the contact between the pressure tube and thecalandria tube. Typical values of the heat transfer coefficient are in a range from 40,000 to60,000 W/m2/°C with the precise value being determined by the mass flux of coolant in thechannel and the geometry of the fuel bundle.

The high values of the heat transfer coefficient mean that, in the case of a pressure tubecontacting the calandria tube, the effects of the contact on the temperature distribution within thepressure tube remain somewhat localized. Even the temperature of the inside surface of thepressure tube directly opposite the contact does not deviate from the primary heat transporttemperature by more than a few degrees.
However, because of the sensitivity of the correlation to both the hydraulic diameter and to themass flux, for a situation in which the fuel bundles are removed and the flow restricted (such asRAPP quarantining of fuel channels) there will be an effect on this heat transfer coefficient andthe expected temperature field in the tube will be significantly affected. In general, thetemperatures at the contact will be lower in such a case because the inside surface temperatureopposite the contact will also be lower. The zone over which the temperature is reduced will alsobe larger. This will likely result in a larger zone of low fracture toughness material if deuteriumlevels are high.
4.2 The Contact Thermal Boundary Condition
Determination of a good representation of the contact itself is considerably more difficult and isone of the main uncertainties associated with heat transfer predictions. In general, heat transfercoefficients between rough, conforming surfaces depend upon interfacial pressure, surfaceroughness characteristics of both contacting surfaces, mechanical and thermophysicalcharacteristics of the materials involved, the presence of surface films or debris and the gaspresent. Some of these factors are now examined.
In a real pressure tube-calandria tube contact situation, the distribution of load over the contactzone is time dependent following initial contact because the contact is spreading due to creep.Specific loads ( i.e. loads per unit length) in the contact area tend to increase towards the endsof the contact as the contact area lengthens. Specific loads can be significantly higher thanwould be calculated simply on the basis of elastic responses. A range of specific loads ispossible. Because of creep, removing fuel from the channel is not, in general, sufficient toeliminate contact except for contacts that occurred shortly before the time of fuel removal.
The observations of tubes removed from reactors show that, in most cases, the contact zone ismade up of a number of discrete contact areas aligned along the bottom of the pressure tube 111.In some cases, more than one axial line of spots has been apparent. It is believed that the surfacewaviness of the pressure tube, a result of the manufacturing process, is primarily responsible forthe discrete nature of these spots. The load in the contact zone must be distributed among thesediscrete spots and this produces further uncertainty in the contact pressure at these spots becauseboth the spacing of the spots and the contact areas of the spots are distributed quantities.
Once the contact pressure is established, the effective heat transfer coefficient in the contact canbe determined if the details of the materials and surface characteristics are known. This isanother significant area of uncertainty. In the initial phase of the contact, the contacting surfaceshave essentially the same surface roughness characteristics as as-manufactured tubes. Thus the

characteristics of the surfaces in initial contact can be determined on the basis of surfaceparameter measurements from actual pressure tubes and calandria tubes because operation isjudged to have a minor effect on the surface roughness parameters although the surface hardnesswill increase due to irradiation. Contact conductance correlations applicable to these early contactsituations have been reviewed /3/. The best correlation was judged to be that of Yovanovich andHegazy IAl. This correlation for as-received properties is shown in Figure 1. It is based upona model of a contact that shows a mechanical contact between surfaces being made up of largenumbers of contacting asperities caused by surface roughness together with gas-filled interstices.The correlation assumes that the total heat transfer coefficient can be represented as the sum ofa contribution from the gas in the interstices of the microcontacts and a contribution from themicrocontacts themselves. At low contact pressures, the contribution of the gas is dominant,whereas at high pressures the microcontact contribution is the major component. For contactpressures calculated for the fuel channel situation, the gas contribution is a large fraction of thetotal. Surface roughness plays a significant role here: increasing surface roughness can result inlarge decreases in the heat transfer coefficient. Experiments conducted using as-received pressuretube and calandria tube surfaces confirmed the validity of the correlation 131.
The major uncertainty in the heat transfer coefficient at the contact zone for a particular contactpressure is due to the time dependent development of the surface geometry and the presence ofoxide films and debris in the contact. The development of these films and debris is likely aresult of fretting corrosion between the pressure tube and the calandria tube due to small relativemovements brought about by vibration. In general, increases in surface roughness are observedand in some cases oxide films up to 40 microns thick have been noted. However, since thecalculated reduction in heat transfer associated with increased surface roughness is primarily dueto the reduction of the gas contribution to the heat transfer, this reduction may not occur to thesame extent if the interstices between the microcontacts are filled with oxide debris.
It is apparent from the information presented above, that a judgement of the contact thermalboundary condition must be made. First of all, a judgement of the appropriate size of contact ismade. The blister growth model shows that blisters tend to grow following the shape of theisotherms. Since, for contact situations there is a large change in the heat transfer coefficient atthe edge of the contact, the isotherms tend to bunch up at the edge of the contact. Consequently,the blister diameter is a good indication of the size of the contact area. Observations of blistersin Pickering 1 and 2 pressure tubes showed a distribution of diameters with a mean of between4 and 5 mm. The RAPS pressure tubes are smaller in diameter than Pickering pressure tubes butthis difference is thought unlikely to produce a significantly different contact size. For theevaluation of blister development in other CANDU pressure tubes, a diameter of the contact of5 mm has been chosen as a nominal case. For the heat transfer coefficient over this area, a valueof 10,000 W/m2 C was chosen. This is about half the heat transfer coefficient which would becalculated on the basis of as-received surface characteristics for a high contact load situation withthe distances between contact centres being 25 mm. It is less than twice the very low contactpressure case with just the gas contribution for as-received surfaces. Use of this nominal valuehas not resulted in any obvious discrepancies in comparisons with observations/5/.

In order to complete the details of the heat transfer in the contact region, a description of the gascontribution adjacent to the actual contact is necessary. Some relatively simple assumptions havebeen applied here. Pressure tube surface waviness profiles ( waviness is a measure of the verylong wavelength undulations in the surface profile) have been made and show that waviness ofthe order of 20 microns is common. In order to model the beginning of blister growth, an axi-symmetric model has been used in which the axis of rotation is through the wall of the pressuretube. This results in growth of blisters with cross sections which are circular on planesperpendicular to the radial direction of the tube. The actual contact area is assumed to besurrounded by a gas gap of fixed thickness of 20 microns. The radius of this zone is taken to be13 mm. As the blister grows, changes to the gap thickness are taken into account by adding theexpected profile height of the blister to the initial gap. Thermal fields are thus recalculatedperiodically during blister growth.
4.3 The Calandria Tube to Moderator Heat Transfer
Finally, the heat transfer on the moderator side of the calandria tube must also be input to thecalculation of the temperature field. The heat transfer characteristics here are more difficult tomodel accurately and there is no clear choice for the correlation to be used when there is thelikelihood of boiling in the moderator on the outside of the calandria tube. Following theselection of an appropriate boiling heat transfer relation, the numerical modelling must be doneusing an iterative procedure to ensure that the local heat transfer coefficients are consistent withthe calandria tube outside wall temperatures obtained in the analysis. The boiling heat transfercoefficient can be based on the correlation suggested by Rohsenow for flat plates/6/. Thiscorrelation leads to the following form:
q = A (Twall-Tsat)n
in which: q is the heat fluxA is a factor that is slightly dependent upon the saturation
temperature of the moderator and includes the surface interactioneffects( a value of about 0.08 is appropriate when q is in kW/m2).
Twall and Tsat are the wall temperature and the saturation temperaturerespectively in °C
andn is a constant (about 3).
It is apparent that with this correlation, the heat transfer is independent of the moderatortemperature in the boiling regime and is only dependent on the moderator saturation temperatureand the calandria tube surface temperature.
As a first approximation for a one-dimensional analysis, moderator boiling can be assumed tooccur at the calandria tube surface. The rapid increase in the boiling heat transfer coefficientwith wall temperature tends to result in a local calandria tube surface temperature that is

relatively insensitive to the heat flux and can be taken to be fixed at about 15°C above thesaturation temperature. This approximation is quite crude and would only apply if the contactareas were assumed to be quite large.
5.0 THERMOPHYSICAL PROPERTIES
In order to calculate the steady state temperature fields, the thermal conductivities of thezirconium alloy materials involved must be known. In general these are temperature-dependentand this dependence can be incorporated into the analysis. Alternatively, a single value can beused as a good approximation if it is representive of the temperature range exhibited in theanalysis.
For Zircaloy-2 material, the thermal conductivity has been measured/7/ and is reproduced inFigure 2. Variations in composition and microstructure will produce slight variations in thethermal conductivity. Irradiation should tend to reduce the conductivity a little but these effectsare likely to be small compared with the effects due to compositional variation.
The thermal conductivity of hydride material is also required in order to correctly recalculate thetemperature field following blister growth. Measurements of hydride thermal conductivitiesindicate that they are in the same range as thermal conductivities of the base material. This is notsurprising since both metal and hydride are metallic conductors and the electrical conductivitiesare also very close. No large error occurs in using the Zircaloy-2 thermal conductivity for thehydride.
6.0 EFFECTS OF THE TEMPERATURE DISTRIBUTION ON THE PRESSURE TUBE
The presence of a large temperature gradient has some significant impacts on the pressure tube.It affects the distribution of hydrogen in solution, the distribution of hydrides following reactorcooling cycles, the characteristics of crack growth by the delayed hydride cracking mechanism,the local fracture characteristics, and the stress state.
First and foremost, the temperature distribution provides a driving force for hydrogen migrationbecause of the positive heat of transport for hydrogen isotopes in zirconium ,Q\ which resultsin migration of hydrogen atoms in solution down the temperature gradient. Hydrogen isotopesin solution in a temperature gradient will equilibrate according to the following:
Cs = A exp(QTRT)
in which Cs is the concentration is solution and A is a constant determined by mass balance.
Secondly, it results in the solubility for hydrogen being dependent on location through thetemperature dependence of the terminal solid solubility (TSS). Reduced solubility at the locationto which hydrogen is driven by the temperature gradient leads to hydride blister formation whenthe solubility at the cold spot is exceeded at operating conditions. The appropriate solubility that

is associated with hydride precipitation, is designated TSSP and corresponds to the solubilityobtained through cooling measurements (as contrasted with the terminal solid solubility associatedwith dissolution (TSSD) which results from heating measurements). The values of these TSS'sfor Zircaloy have been measured by Slattery/8/ among others/9/.
A consequence of the temperature distribution and the hysteresis in the solubility is that eachcooling cycle experienced by the reactor results in a ratchetting of hydrogen into a zone aroundthe cold spot in the pressure tube. The extent of this zone is roughly defined by the isotherm, atoperating conditions, corresponding to the minimum temperature at which the hydrides presentcan completely dissolve. As the concentration in the tube increases with time, the size of thiszone also increases.
The crack growth process by DHC is controlled by the concentration of hydrogen available insolution and the TSSP at the crack tip. The temperature distribution due to contact is likely tomake cracks, initiated at the outside surface (as at a blister), tend to grow axially rather thanradially. This can result in critical cracks that are not through-wall( as in Pickering Unit 2 G16pressure tube failure). In other words, in the case of blister initiated cracks, leak-before-breakcannot be assured.
Fracture toughness characteristics of Zircaloy are sensitive to the concentration of radiallyoriented hydride and the temperature/10,11/. The temperature field and the ratchetting effectsmentioned above, will tend to produce zones of hydride around the cold spots which exhibitsignificantly reduced fracture toughness characteristics.
The stress state of the tube is also modified by the temperature distribution and a tensile thermalstress results at the pressure tube contact location.
7.0 THE CALANDRIA TUBE
The calandria tube also has a significant temperature gradient through the wall but because thetemperatures are much lower and there are no localized cold spots, the hydrogen migration whichmust occur likely has no effect on the integrity of the calandria tube. However, the local ultimatestrength of the tube would be slightly reduced due to the higher temperatures associated with theheat flux through it.
•*©*
8.0 SUMMARY
The thermal conditions in the fuel channel following pressure tube to calandria tube contact havebeen described. The methods and the data which can be used to calculate the expectedtemperature distributions were presented. Effects of these temperatures on the behaviour ofhydrogen which affects pressure tube integrity have been included and will be elaborated in otherdocumentation.

REFERENCES:
1. W.H. Rohsenow and J.P. Hartnett, Handbook of Heat Transfer. New York .McGraw-Hill, 1973:7-32
2. G.J. FieldJ.T. Dunn and B.A. Cheadle, Can. Met. Quart., 24,p.l81, 1985
3. M. Shoukri and A.M.C. Chan, Nuclear Engineering and Design 104,(1987), 197-206.
4. M.M. Yovanovich and A.A. Hegazy, Paper No.83-1434, AIAA 18th ThermophysicsConference, June 1983, Montreal Canada.
5. T.P. Byrne, D.R. Metzger and M. Léger, Proc. B13/1, SMiRT Conf., Tokyo, Japan, 1991
6. W.M. Rohsenow, ASME Trans. 74, 969, 1952
7. D.B. Scott, Report WCAP 3269-41, Westinghouse Electric Company,1965
8. G.F. Slattery, J. Inst Met., 95, p43, 1967
9. J J . Kearns, J. Nucl. Mat. 22, 292, 1967
10. P.H. Davies and C.P. Stearns, Fracture Mechanics: Seventeenth Volume, ASTM STP 905,ASTM, Philadelphia 1986, p379
11. C.K. Chow and L.A. Simpson, Symposium on Case Histories Involving Fatigue andFracture Mechanics, Charleston, South Carolina, 1985,

CONTACT CONDUCTANCE
Figure 1:Conta c theattransfer correlation from Reference 3
TOTAL
CONTACT
GAS
DATA
LOG P
LUII-
18
17
16
15
14
13
12
11
10I
5QI
150I
100 150 200
TEMPERATURE CÇ)
I250 300
Figure 2: Thermal Conductivity of Zircaloy Tube Material (Ref.7)

5. DELAYED HYDRIDE CRACKINGIN ZIRCONIUM ALLOYS
M.P. Puis (AECL-RC-WL)
RECORD: (H:\WRDATA\RRICE9FCBB-ZRZ^PT93-09-09

DELAYED HYDRIDE CRACKING IN ZIRCONIUM ALLOYS
M.P. Puis
1.0 INTRODUCTION
In hydride-forming metals, the presence of hydrides may lead to a process of slow crackpropagation called delayed hydride cracking (DHC) [1-3]. In this process, hydrogen or deuteriumatoms diffuse to a region of high tensile stress (e.g., at a notch or crack tip) and form hydrides.The hydride formed at the crack tip may fracture under suitable conditions. Once the hydridehas fractured, the main crack advances and the cycle repeats at the extended crack tip. Thisintermittent process of crack growth has been confirmed most directly by observations under atransmission electron microscope (TEM) for niobium [4], titanium [5], vanadium [6] andzirconium [7], although there are also numerous indirect observations confirming this.
The development of delayed hydride cracks is shown schematically in Figure 1 where crackvelocity, V, is a function of stress intensity factor, Kr The DHC region is characterized by athreshold value Km, below which cracks do not grow, and a stable crack velocity regime wherecrack velocity is almost independent of Kj until close to KIC (instability).
In this paper we review the phenomena of DHC in zirconium alloys and describe the importantparameters for cracking. Emphasis will be placed on the two alloys used in pressure tubes, cold-worked Zr-2.5 wt%Nb (hereinafter referred to as Zr-2.5Nb) and Zircaloy-2. This latter alloy isno longer in use for pressure tubes in Canadian designed CANDU reactors, except in RAPS 1and RAPS 2. The phenomenon of DHC is illustrated by several occurrences in components ofnuclear reactors.
2.0 EXAMPLES OF DELAYED HYDRIDE CRACKING
The first components to fail by DHC were experimental fuel elements made from Zr-2.5Nb [8].The welds between the end caps and the sheathing failed during storage at room temperature.Hydride platelets were seen at the sharp notch at the junction of the weld upset and the sheath.DHC was attributed to the combination of residual stresses from welding and the sharp notch atthe weld upset producing the required stress gradient.
Many of the examples of DHC in the nuclear industry have occurred in pressure tubes ofCANDU-PHW reactors. However, the Russians have also had a number of DHC failures in thepressure tubes of their RBMK reactors [9]. The pressure tubes in Units 3 and 4 of the PickeringNuclear Generating Station (NGS) were made from Zr-2.5Nb and three of them cracked andleaked in 1974 and 1975 [10-12]. All the cracks initiated at the inside surface of the pressuretubes where the tubes were attached to the ends of the reactor by rolled joints. At this positionthere were high residual tensile hoop stresses which resulted from an incorrect procedure formaking the rolled joint. The crack surfaces were characterized by coloured, concentric bands,

centred about the crack origin, corresponding to portions of the fracture surfaces covered withdifferent thicknesses of oxide. Cracking only occurred when the pressure tubes were coolingdown and the temperature decreased below about 140°C [13].
When the cause of the cracking in the Pickering NGS Units 3 and 4 was diagnosed, the rolledjoints of Unit 2 at the Bruce NGS had already been made using the same incorrect procedure.To reduce these stresses in the pressure tubes, which were also fabricated from Zr-2.5Nb, therolled joint regions were stress relieved. However, during the two years between rolling-in andstress relieving, cracks initiated at the inside surfaces of some of the tubes. The tubes picked updeuterium during service so that cracking occurred during some periods of reactor operation andthree pressure tubes leaked in 1982 [14]. The crack surfaces were somewhat different to thoseof the Pickering cracks. During the time between initial leakage and detection of the leak,pressurized water flashed to steam within the cracks and produced thermal gradients at the cracktips. This in turn caused the crack to grow at different rates along the crack front and the crackwas much longer at the outside surface than the inside.
The most serious pressure tube failure, occurred in Unit 2 of the Pickering NGS in 1983 August.The pressure tubes in this reactor were fabricated from cold-worked Zircaloy-2. Failure was inthe form of an approximately 2 m long axial crack extending to the endfitting of one pressuretube. Because of the design of the CANDU-PHW reactors, quick operator response, theavailability of makeup water from the other units of the four unit station and the fact that thecalandria tube remained intact, even the massive leakage of reactor coolant did not require theactivation of the safety systems [15]. The primary cause of failure was the incorrect position ofone of the spacers which separate the calandria tube from the pressure tube. The hot pressuretube sagged by creep into contact with the cold calandria tube. The resultant severe thermalgradient through the wall of the pressure tube, concentrated the hydrogen at the cool zones andhydride blisters were formed. Zirconium hydride is about 17% less dense than zirconium andthe tensile stresses in the blisters at their surface, combined with the inherent brittleness of thehydride, resulted in cracking of the blisters. Some of the cracks in adjacent blisters then grewby DHC and joined to form a critical length, partial thickness (non-leaking, but nearly through-wall) crack that extended rapidly axially. This type of failure, therefore, did not providesufficient warning to the reactor operators of the presence of a growing crack, since the modeof fracture was such that the leak-before-break condition was not satisfied.
3.0 THE MECHANISM OF DELAYED HYDRIDE CRACKING
3.1 Important Parameters
Several parameters are important in DHC; stress, flaws, time, thermal cycles, direction ofapproach to temperature, hydrogen concentration, microstructure, and temperature must all beconsidered when evaluating a component for its probability of failing by DHC.

3.1.1 Stress and flaws
Tensile stress is required to fracture hydrides. In the absence of flaws, the most important effectof tensile stress is to precipitate hydrides with their plate normal parallel with the stress. Thesehydrides are often called 'reoriented' hydrides or, if the component is an internally pressurizedtube, 'radial' hydrides. Such hydrides are then prime candidates for crack initiation [16,17]. Theusual requirement for producing these damaging hydrides is that the component is cooled understress [18], the volume fraction of reoriented hydrides being proportional to the amount ofhydrogen that was in solution at the highest temperature. Once the hydrogen concentration hasexceeded the solvus for hydride precipitation (or terminal solid solubility for precipitation, TSSP),radial hydrides could potentially also form during hydrogen ingress, at operating temperature, intothe pressurized tubes. However, this is unlikely under normal circumstances, except at coldspots, because of the large hysteresis between TSSD (the terminal solid solubility for hydridedissolution) and TSSP.
When a flaw is present, hydrides collect at the tip of the flaw and are often oriented because ofthe high stress. When a threshold stress or stress intensity factor is exceeded, the accumulatedhydrides crack. Depending on the size of local tensile stresses, effective flaws can range fromsmall surface perturbations if the stress is high, to large defects from welds or manufacturingflaws. During operation, flaws may be introduced from the interaction with fuel bundles byfretting wear or from fretting due to debris in the pressurized hot transport (PHT) system beingtrapped at fuel bundle bearing pads or endplates. A flaw could also be produced at local coldspots where the temperature gradient has resulted in hydrogen accumulation, producing hydrideblisters, which could fracture under the applied stresses, if these are sufficiently large [19].
3.1.2 Time
DHC is a time dependent process, but the time to initiate the first crack is often quite variable.This variability is not well understood. Time is required for the hydrogen to diffuse up the stressgradient at the stress concentration and for hydrides to nucleate and grow. The time for crackingto start depends on the accumulation rate of hydrogen and this depends on the diffusivity andsolubility of hydrogen. Consequently, cracking velocity has the approximate temperaturedependence of the product of the diffusion coefficient and the solubility limit [20].
3.1.3 Thermal cycles and direction of approach to temperature
Thermal cycles shorten the time to crack initiation and, under certain circumstances, increase theamount of crack propagation which would have occurred over the same time period if thematerial had not been thermally-cycled. The thermal cycling rate influences the magnitude ofthese effects. The direction of approach to temperature determines, as explained in the following,the amount of hydrogen in solution in the bulk of the material. This matrix hydrogenconcentration has an important effect on DHC initiation and propagation.

3.1.4 Hydrogen concentration
Hydride formation at the crack tip must be possible to provide the brittle phase for crackextension. Hydride formation is only possible when the hydrogen concentration at the flaw tipcan build up to TSSP. The hydrogen concentration in solution in the bulk of the matrix must besufficiently high for this to happen. The presence of hydrides in the bulk does not necessarilyensure that this is the case and, hence, the bulk hydrides do not always provide the source ofhydrogen which can diffuse to the flaw tip. The amount of hydrogen in solution depends on thetotal hydrogen content in the specimen and its immediate thermal history. The reason for theeffect of the immediate thermal history is because there is a strong hysteresis in the TSS inzirconium alloys. As a result, only below a certain temperature [21], do hydrides in thezirconium alloy matrix also provide the source of hydrogen for the crack tip hydride. Close toor somewhat above the terminal solid solubility temperature for hydride dissolution, TTSSD, DHCis not possible because hydrides cannot form, even at a stress concentrator - regardless of thedirection of approach to temperature [22].
The hysteresis in the TSS is similar for Zr-2.5Nb and Zircaloy-2. TSSP is sensitive toparameters such as the maximum temperature to which the specimen had been taken prior tocool-down, the hold-time at that temperature, and the cooling rate. Only Zr-2.5Nb has beenstudied in detail to assess the effects of these variables on TSSP. On the other hand, the solvusfor hydride dissolution, TSSD, is not sensitive to the foregoing parameters, nor to the alloystructure within a range from unalloyed zirconium, to the Zircaloys and Zr-2.5Nb.
3.1.5 Microstructure
Crystallographic texture, phase distribution and grain size and shape affect cracking. A commonhabit plane for hydride precipitates is close to the basal plane [23] and thus cracking planes tendto be parallel to the basal plane.
Extruded and cold-worked materials tend to have a strong crystallographic texture. In tubes,when the basal plane normals are concentrated in the circumferential (tangential) direction, cracksare formed on planes normal to this direction. Cracking on the plane normal to the longitudinal(or axial) direction is difficult when no basal plane normals lie in this direction [24]. Zr-2.5Nbpressure tubes have a stronger textural anisotropy than Zircaloy-2 pressure tubes. The majorityof the Zr-2.5Nb tubes have resolved basal pole normal fractions of ~ %, Vz, 0 in the tangential,radial and axial directions of the tube, respectively, compared to the Zircaloy-2 tubes previouslyused in Canadian reactors, which had basal pole normal fractions of ~ Vi, Vz, 0 in these directions.
Alloying has several effects. The yield stress may be increased and thus higher stresses can besupported at a crack tip. Although a-alloys crack by DHC, the presence of the (3-phase tendsto increase crack velocity, probably through enhanced diffusion [25, 26]. In extruded and cold-worked Zr-2.5Nb, the P-phase is almost continuous, while after stress relieving at 400°C it isbroken up into discrete grain boundary particles. Consequently, cracking is faster in the cold-worked compared to the stress relieved material. Irradiation causes changes in the microstructure,

which increase the yield stress of the material and decrease the hydrogen diffusion coefficientby altering the alloy composition, volume fraction and structure of the P-phase. The net effect,nevertheless, is an increase in the DHC velocity.
The usual benefit of a small grain size in reducing cracking is obtained [16], although the effectsneed clarification. Cracking tends to be isotropic when the grains are equiaxed. If the grains areelongated, cracks tend to be longer in the direction of the greatest dimension of the grains. Thisobservation results partially from a grain size effect and, in oc/p alloys, partially from thedistribution of the P-phase in the grain boundaries.
3.1.6 Temperature
Above a certain temperature, which differs with the alloy, DHC initiation and propagation is notpossible, even if all the other conditions are met. In unirradiated Zr-2.5Nb this limit is slightlyabove 300°C [27]. In Zircaloy-2, the limit is likely somewhat below 300°C, since there havebeen no demonstrated cases of DHC in, for instance, irradiated and unirradiated fuel claddingwelds. The likely reason for the high temperature cut-off to DHC initiation is reductions in thevalues of the yield stresses of hydride and zirconium matrix with temperature below a criticallevel, making it possible for hydrides to flow with the matrix rather than to fracture. Atsufficiently low temperature, although DHC initiation is possible, the propagation rate becomesnegligibly slow. Thus DHC propagation in Zircaloy-2 at room temperature, being approximatelyan order of magnitude lower than in Zr-2.5Nb, has dropped to negligible rates. This is not thecase for Zr-2.5Nb, as witness the initial problem of room temperature DHC initiation andpropagation in the overextended rolled joints of the Pickering 3 and 4 NGS, as well as DHCcracks formed at stamped numbers and letters in pressure tubes desginated for the DarlingtonNGS which were left unautoclaved (and, therefore, not stress relieved) for periods of many yearsafter manufacture.
3.2 Stages of DHC
The mechanism of DHC can be divided into crack initiation and propagation. Our presentunderstanding of these two stages is summarized below. Such information can be helpful infinding ways to prevent initiation and to minimize propagation.
3.2.1 Crack initiation
Up until recently, crack initiation was the least understood aspect of DHC. With respect tostudies on Zr-2.5Nb, significant progress has recently been made, both experimentally andtheoretically. Initiation of DHC is controlled by two main processes: the formation and growthof a hydride and the imposition of a sufficiently high tensile stress on the hydride to fracture it[2]. Deformation studies on smooth and notched zirconium alloy specimens containing a uniformdistribution of hydrides have shown that crack initiation at hydrides depends on variables suchas yield stress of the material, microstructure, hydride size and shape, applied stress and stressstate, amount of imposed plastic deformation of the matrix and temperature [28-30]. A hydride

platelet fracture strength ranging from 575 to 520 MPa between ambient and 100°C, respectively,was estimated for hydride platelets in Zr-2.5Nb from the most recent of these studies [30].
Theoretical models for crack initiation have been developed [31-35]. The models deriverelationships between the locally applied normal stress acting on the hydride and the criticalhydride length (or aspect ratio) for crack initiation. The platelet normal stress inside a hydrideplatelet precipitated in a zirconium matrix is compressive because of the misfit strain betweenhydride and matrix. As the hydride at the flaw tip lengthens (at approximately constantthickness), its internal compressive stress decreases. Fracture of the hydride occurs when the sumof the local applied tensile stress and the hydride's compressive stress equals or exceeds thefracture stress of the hydride. An essential input parameter is the fracture strength of the hydrideplatelet
The potential for crack initiation at a flaw is expressed in terms of a threshold, or criticalparameter which characterizes the stress needed to fracture hydrides at the flaw tip. Thisparameter is different for cracks or sharp notches, blunt notches and nominally smooth surfacesand has led to a different analytical treatment of the experimental crack initiation data, dependingon the initiating site."o
For deep and sharp notches, and for cracks under a sufficiently high applied tensile stress, thestress state at the flaw tip can be characterized by the elastic stress intensity factor, Kz (eventhough, as is generally the case, there is a small region of plastic deformation at the flaw tip).For initiation, Kj must exceed a threshold value, Kffl.
For blunt notches, an estimate of the notch tip stresses based on Kl5 as if the notch were sharp,would overestimate the stresses there and would lead to an overly low value for Km. Thecurrently accepted approach is to use, instead, the maximum normal notch-tip stress, o yX [34,35]. Crack initiation will occur when this stress exceeds a threshold value, tf?".
Given a suitable description of the stress state at the flaw, an estimate of whether the notch issusceptible to crack initiation also requires the solution of a diffusion equation to determinewhether hydride can form at the flaw and whether it can grow to a sufficient length (aspect ratio)to crack under the stresses prevailing there [36]. Generally at blunt notches, a cluster of hydridesis observed to grow from the notch. The theoretical treatment makes allowances for this byproviding a criterion for estimating the maximum hydride thickness at the notch (the combinedthickness of the cluster) [34, 35].
For cracks, the solution to the diffusion equation predicts the concentration limit as a functionof temperature at which DHC starts [22]. Experimentally and theoretically, this concentrationlimit for DHC initiation at sharp cracks is found to be close to TSSD. The closeness of this limitto TSSD is somewhat of a coincidence, since DHC initiation is actually controlled by whetherthe hydrogen concentration at the flaw can exceed TSSP over a sufficiently long length at theflaw tip. However, for sharp flaws (cracks), the increase in hydrogen concentration which ispossible at the flaw tip due to the elevated hydrostatic tensile stress, corresponds closely to the

difference in solubility between TSSP and TSSD [22], thus making it appear that the hydrogenconcentration limit for DHC is the same as TSSD. A further experimental and theoretical findingis that Km depends on the hydrogen concentration in solution (which, in turn, depends on thedirection of approach to temperature of the material) [37]. It is found that K^ increases as thehydrogen concentration in solution decreases.
A similar analysis at blunt notches, based on the solution to the diffusion equation to determinethe maximum possible hydride length, shows that crack initiation is not only determined by o ^ \but also by the stress gradient, since a sharper stress gradient may make it impossible for hydrideto grow to its critical size [34, 35].
Extensive experimental studies have been carried out to determine both Kffl and c ^ \ Theseresults are summarized in the following.
It is expected that Kra depends on such variables as temperature, fast neutron fluence, hydrogenconcentration, material, microstructure and testing method, but only limited work has been doneso far (such as the effect of hydrogen concentration in solution [37]) to systematically establishthe separate effects of these variables. For Zr-2.5Nb, an analysis of the entire data base yieldsa mean K™ value of 8.2±3.9 (2s) MPaVm. The irradiated material has a Km value of 7.0±2.1(2s) MPa-vm and the unirradiated material a value of 8.7±4.0 (2s) MPaVm [38]. A statistical testshows that the difference in Km between the unirradiated and irradiated material is significant.Therefore, it can be concluded that the irradiated material has a marginally lower Kffl value.However, this result should be treated with caution because of the larger scatter in the data forthe unirradiated material, which includes some of the earliest results on Kffl involving less wellcontrolled experimental conditions. An analysis of a subset of data obtained on material fromtwo sets of irradiated tubes and their unirradiated offcuts shows that the irradiated material hasa Kffl of 6.15 MPa^m compared to 7.5 MPaVm for the unirradiated material. This shows thatthere is still a decrease in Km, but the difference is smaller. In c.w. Zircaloy-2 material takenfrom tubes having a texture similar to Zr-2.5Nb (such as Harvey tubes [39]), the Km values arevery similar to Zr-2.5Nb [39], ranging from 5.2 to 8.4 MPaVm. It was noted that Km increasedby 20% with a temperature increase from 204 to 260°C. Ziroaloy-2 tube material having atexture with a lower fraction of hydride habit planes on the crack plane gives higher Kffl values.There is a two-fold increase in Km between the Harvey tube material and the plate material [39,40] correlating with a corresponding decrease in the fraction of hydride habit planes on the crackplane. Irradiation to 7.7 x 1025 n/m2, decreases Kffl in the Harvey tubes by about 1 or 2 MPaVm,which is a comparable decrease to that observed in Zr-2.5Nb.
The theoretical model of the lower-bound value for Kffl predicts a small increase in Km withincreasing temperature and a smaller decrease than is experimentally observed, in Kffl withincrease in yield stress [33]. The theory also incorporates the effect of texture on Kffl with goodsuccess.

-max°th
Long-term tests on unirradiated Zr-2.5Nb specimens were carried out to determine the probabilityof DHC initiation from blunt notches [35]. The results of these tests were analyzed in terms ofthe calculated maximum (or peak) notch-tip stress. The experiments consisted of subjectingcantilever beam specimens, notched on the inside surface and held under dead-weight loading,to specific outerfibre stresses for periods of as long as 48 months, or until a sufficient numberof the specimens in a set of ten with nominally identical o^* had fractured. Comparison of testresults for specimens subjected to different thermal cycles having different cooling rates, differentmaximum temperatures and hold times at test temperature show that all of these variables havean effect on the failure rate of a given notch. The reason is that these variables influence the rateat, and the maximum length to which, the notch-tip hydride can grow. A recent theoretical study[41] shows how, as a result of the hysteresis in the TSS, suitably selected thermal cycles cancause a "ratcheting" of the hydride collected at the notch tip leading to accelerated hydridegrowth compared to testing under isothermal conditions. An analysis of the test results, basedon approximate calculations of the maximum notch-tip normal stress, show that the thresholdstress for crack initiation is between 675 and 750 MPa [35]. Only a limited number of tests havebeen carried out on c.w. Zircaloy-2 pressure tube material and these were done prior to the recentadvances in understanding of crack initiation at notches. They were, therefore, not analysed interms of the maximum notch-tip normal stress and it is not obvious from the data if there are anydifferences in crack initiation susceptibilities between the two materials.
3.2.2 Crack propagation
The rate at which a crack propagates depends primarily upon whether it was heated or cooledto the hold temperature [3,42]. The relationship between temperature and crack growth rate,vDHC, is shown schematically in Figure 2. T1 is the temperature to which the component is cooledbefore heating and T4 the temperature to which it is heated before cooling.
With reference to Figure 2 and Table l(a), on heating from Tp the crack velocity increases untilthe temperature reaches T, above which it decreases. Above T3 the crack velocity is negligible.On cooling from T4 there is no crack growth until the temperature reaches T5 below which itincreases. Below T6 crack velocity decreases with decrease in temperature.
As can be seen there is considerable hysteresis between heating and cooling. T2 increases withincrease in Tj and the difference between T2 and Tx decreases, as does the difference betweenT3 and T2. Also, T5 and T6 both decrease with decrease in T4. Thus, the degree of hysteresisdepends upon T, and upon T4. Typical values of the temperatures are given in Table l(a).
Stress intensity factor, KIt has no significant effect on these parameters. However, between T2
and T3 and between T5 and T6, the crack velocity increases with increase in Kv the effect beingmost pronounced just below T3 and T6.

The effect of direction of approach to temperature can be used at temperatures above T2 tomitigate initiation or to arrest propagation by approaching the operating temperature from belowwith negligible overshoot (DHC avoidance manoeuvre). However, for a leaking crack,experiments show that T3 is significantly increased because the temperature at the crack tip isreduced by the escaping water flashing to steam and the manoeuvre would not work to arrest theleaking crack [43]. This result is in agreement with theoretical predictions [44].
In the {^-independent regime, the effect of irradiation on DHC velocity in Zr-2.5Nb and Zircaloy-2 depends on the fluence, the irradiation temperature and the direction of crack growth for axial-radial cracks; that is, whether crack growth is in the tube axial or radial (through-wall) direction.All results described in the following are with the test temperature approached from above tomaximize the crack velocity. The range of parameters obtained for Zr-2.5Nb is summarized inTable l(b).
The DHC velocity has been determined in irradiated Zr-2.5Nb material taken from tubes removed fromreactor [45] and from small specimens irradiated in a high flux reactor. Irradiation temperatures rangedfrom 250 to 290°C, corresponding to the inlet and outlet sections of the pressure tube, respectively. Theincrease in velocity with fast neutron fiuence saturates at 1 x 10" n/m2, which is slightly higher than thefluence of 0.3 x 1025 n/m2 at which the increase in yield stress saturates. At saturation, the velocityincrease is 3 to 5 times the value for unirradiated material. The highest increase is at the lower irradiationtemperature. Earlier work [46] had shown that when irradiation damage is removed by annealing, thevelocity decreases.
Comparison with theory shows that in Zr-2.5Nb the increase in velocity can be explained in terms of theincrease in the yield strength of the material [45], There is also an effect of irradiation temperature onDHC velocity, which is thought to be connected with its effect on the break-up of the P-phase of thematerial. This causes the increase in the DHC velocity with irradiation to be less with increase inirradiation temperature. In Zircaloy-2, irradiation is expected to produce a greater increase in DHCvelocity, since the increase in velocity due to the yield stress increase is not offset by a decrease in thehydrogen diffusion coefficient. Studies [39] on Zircaloy-2 tubing material show that this is, indeed, thecase. Irradiation to a fluence of 7.7 x 10î5 n/m2 causes an approximately 40-fold increase in the velocitycompared to similar unirradiated Zircaloy-2 material. This significant increase in velocity in Zircaloy-2cannot be explained on the basis of the current DHC theory [36,45]. As a result of the large increase invelocity with irradiation, at 204°C the DHC velocity in irradiated Zircaloy-2 tube material taken from theHarvey tubes [39], which have similar texture to the Zr-2.5Nb tubes, is only a factor of two smaller thanthe velocity in irradiated Zr-2.5Nb. On the other hand, for the respective unirradiated materials, thevelocity in the Harvey, Zircaloy-2 tubes is a factor of 10 slower than in Zr-2.5Nb.
There is also a difference in DHC velocity in the axial and radial crack growth directions. In Zr-2.5Nb,the temperature dependencies of the two velocities differ, with the result that at temperatures approachingambient, the radial velocity is a factor of two slower than the axial velocity, but at reactor operatingtemperatures the two velocities are almost equal. Similar data for Zircaloy-2 is not available.

4.0 SUMMARY
The key variables of delayed hydride cracking are: stress and flaw geometry, time, thermal cycles anddirection of approach to temperature, hydrogen concentration, microstructure, and temperature. Criteriahave been developed to assess the potential for DHC initiation at cracks and blunt flaws. Experimentalresults for the two stages of DHC - crack initiation and propagation - for the two pressure tube materialscurrently used in CANDU and Pressurized Heavy Water reactors, cold-worked Zr-2.5Nb and Zircaloy-2,respectively, show that, after irradiation, both have similar Km and velocity values, provided the tubematerial has a similar texture. In the absence of flaws, DHC iniation in unirradiated Zircaloy-2 is unlikely,because sufficiently high stresses to fracture hydrides cannot be generated. There is insufficient data todetermine whether this is also true in irradiated Zircaloy-2 material.
10

REFERENCES
1. D.N. Williams, J. Inst. Metals, vol. 91, 1962, pp. 147-152.
2. R. Dutton, K. Nuttall, M.P. Puis and L.A. Simpson, Metall. Trans. A, vol. A8,1977, pp. 1553-1562.
3. L.A. Simpson and M.P. Puis, Metallurgical Transactions A, vol. 10A, 1979, pp. 1093-1105.
4. H. Matsui, N. Yoshikawa and M. Koiwa, Acta Metallurgies vol. 35, 1987, pp. 413-426.
5. H.Z. Xiao, S.J. Gao and X.J. Wan, Scripta Metallurgies vol. 21, 1987, pp. 265-268.
6. S. Takano and T. Suzuki, Acta Metallurgies vol. 22, 1974, pp. 265-274.
7. CD. Cann and E.E. Sexton, Acta Metallurgies vol. 28, 1980, pp. 1215-1221.
8. C.J. Simpson and CE. Elis, Journal of Nuclear Materials, vol. 52,1974, pp. 289-295.
9. P.A. Platonov, A.V. Ryasantseva and I.A. Frolov (Russian National Research Center "KurchatovInstitute), B.C. Rodchenkov and L.P. Sinelnikov (Research and Design Institute of PowerEngineering, NIKJET), and A.P. Eperin (Leningrad NPP), abstract submitted to ASTM 10thInternational Symposium on Zirconium in the Nuclear Industry, Baltimore, MD, U.S.A., 1993.
10. P.A. Ross-Ross, E.J. Adams, D.F. Dixon and R. Metcalfe in Proceeding, European NuclearConference, Paris, 1975, Pergamon Press, Oxford, 1976, pp. 85-109.
11. P.A. Ross-Ross, J.T. Dunn, A.B. Mitchell, G.R. Towgood and R.A. Hunter, AECL-5261, 1975.
12. A.H. Jackman and J.T. Dunn, AECL Research Report, AECL-5691, 1976.
13. A.R. Causey, V.F. Urbanic and CE. Coleman, Journal of Nuclear Materials, vol. 71,1977, pp. 25-35.
14. J.T. Dunn and A.H. Jackman, AECL Research Report, AECL-7537, 1982.
15. G.J. Field, J.T. Dunn and B.A. Cheadle, AECL Research Report, AECL-8355, 1984.
16. CE. Coleman and J.F.R. Ambler, in Zirconium in the Nuclear Industry, ASTM STP-633, AmericanSociety for Testing and Materials, 1977, pp. 589-607.
17. B.A. Cheadle and CE. Elis, in Proceedings, Second International Congress on Hydrogen in Metals,Paris, 1977, Paper 3C8.
18. M.R. Louthan and R.P. Marshall, Journal of Nuclear Materials, vol. 2, 1967, pp. 661-681.
19. M.P. Puis, Metallurgical Transactions A, vol. 19A, 1988, pp. 2247-2257.
11

20. R. Dutton and M.P. Puis, International Conference on the Effects of Hydrogen on Behavior ofMaterials, The Metallurgical Society of AIME, 1976, pp. 516-525.
21. M.P. Puis, Journal of Nuclear Materials, vol. 165, 1989, pp. 128-141.
22. S. -Q. Shi, G.K. Shek and M.P. Puis, "Hydrogen Concentration Limit and Critical Temperatures forDelayed Hydride Cracking in Zirconium Alloys", submitted to Journal of Nuclear Materials, 1994.
23. D.G. Westlake, Journal of Nuclear Materials, vol. 26, 1968, pp. 208-216.
24. CE. Coleman, in Zirconium in the Nuclear Industry, ASTM STP-754, American Society for Testingand Materials, 1982, pp. 393-411.
25. M.P. Puis, L.A. Simpson and R. Dutton, Fracture Problems and Solutions in the Energy Industry,Pergamon Press Oxford and New York, 1982, pp. 13-25.
26. B.C. Skinner and R. Dutton, Hydrogen Effects on Material Behavior, The Mineral, Metals &Materials Society, 1990, pp. 73-83.
27. R.R. Smith and R.L. Eadie, Scripta Metallurgica, vol. 22, pp. 833-836.
28. M.P. Puis, Metallurgical Transactions A, vol. 19A, 1988, pp. 1507-1522.
29. M.P. Puis, Metallurgical Transactions A, vol. 22A, 1991, pp. 2327-2337.
30. R. Choubey and M.P. Puis, Metallurgical Transactions A, vol. 25A, 1994, pp. 993-1004.
31. E. Smith, "The Initiation of Delayed Hydride Cracking at a Nominally Smooth Surface", to bepublished in Journal of Nuclear Materials, 1994.
32. E. Smith, "The Initiation of Delayed Hydride Cracking at a Blunt Flaw", to be published inInternational Journal of Pressure Vessels & Piping, 1994.
33. S. -Q. Shi and M.P. Puis, Journal of Nuclear Materials, vol. 208, 1994, pp. 232-242.
34. S. -Q. Shi, M.P. Puis and S. Sagat, Journal of Nuclear Materials, vol. 208, 1994, pp. 243-250.
35. S. Sagat, S.-Q. Shi and M.P. Puis, Materials Science and Engineering, vol. A176. 1994, pp. 237-247.
36. S.-Q. Shi, M. Liao and M.P. Puis, "Modelling of Time Dependent Hydride Growth at Crack Tipsin ZirconiumAlloys", to be published in Modelling & Simulation in Materials Science &Engineering, 1994.
37. S.-Q. Shi and M.P. Puis, "Dependence of the Threshold Stress Intensity Factor on HydrogenConcentration during Delayed Hydride Cracking in Zirconium Alloys", submitted to Journal ofNuclear Materials, 1994.
12
38. M.P. Puis, S. Sagat, D.K. Rodgers, D.A. Scarth and W.K. Lee, unpublished research, 1991, AECLResearch: Chalk River Laboratories (Chalk River, Ontario) and Whiteshell Laboratories (Pinawa,Manitoba) and Ontario Hydro Technologies (Toronto, Ontario).
39. F.H. Huang and W.J. Mills, Metallurgical Transactions A, vol. 22A, 1991, pp. 2049-2060.
40. J.W. Mills and F.H. Huang, Engineering Fracture Mechanics, vol. 39, 1991, pp. 241-257.
41. R.L. Eadie, D.R. Metzger and M. Léger, Scripta Metallurgica et Materialia, vol. 29, 1993,pp. 335-340.
42. J.F.R. Ambler, Zirconium in the Nuclear Industry. Sixth International Symposium, ASTM STP 824,American Society for Testing and Materials, 1984, pp. 653-674.
43. CE. Coleman, S. Sagat, G.K. Shek, D.B. Graham and M.A. Durand, Int. J. Près. Ves. & Piping,vol. 43, 1990, pp. 187-204.
44. S. Sagat, J.F.R. Ambler and CE. Coleman, unpublished research, Chalk River Laboratories, ChalkRiver, Ontario, Canada, 1988.
45. S. Sagat, CE. Coleman, M. Griffiths and B.J.S. Wilkins, AECL Research Report, RC-1141, COG-93-377, 199; presented at Tenth International Symposium on Zirconium in the Nuclear Industry,Baltimore, MD, June, 1993.
46. CE. Coleman, C.K. Chow, CE. Ells, M. Griffiths, E.F. Ibrahim and S. Sagat, Effects of Radiationon Materials: 15th International Symposium, ASTM STP 1125, 1992, pp. 318-336.
13
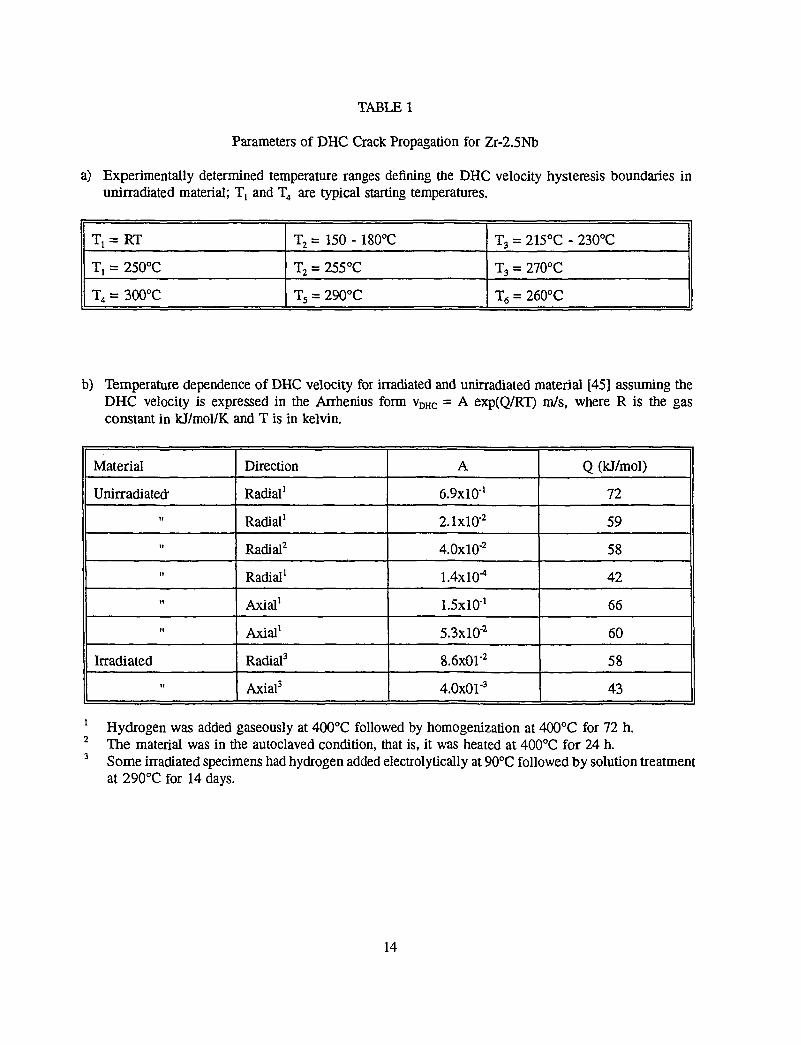
TABLE 1
Parameters of DHC Crack Propagation for Zr-2.5Nb
a) Experimentally determined temperature ranges defining the DHC velocity hysteresis boundaries inunirradiated material; T, and T4 are typical starting temperatures.
T1 = RT
T, = 250°C
T4 = 300°C
T2 = 150 - 180°C
T2 = 255°C
T5 = 290°C
T3 = 215°C - 230°C
T3 = 270°C
T6 = 260°C
b) Temperature dependence of DHC velocity for irradiated and unirradiated material [45] assuming theDHC velocity is expressed in the Arrhenius form vDHC = A exp(Q/RT) m/s, where R is the gasconstant in kJ/mol/K and T is in kelvin.
Material
Unirradiated'
tt
n
n
M
II
Irradiated
Direction
Radial1
Radial1
Radial2
Radial1
Axial1
Axial1
Radial3
Axial3
A
6.9X10⁻¹
2.1xlO-2
4.0xl0"2
1.4X10⁻⁴
1.5X10'1
5.3xlO"2
8.6x0r2
4.0x0r3
Q (kJ/mol)
72
59
58
42
66
60
58
43
1 Hydrogen was added gaseously at 400°C followed by homogenization at 400°C for 72 h.2 The material was in the autoclaved condition, that is, it was heated at 400°C for 24 h.3 Some irradiated specimens had hydrogen added electrolytically at 90°C followed by solution treatment
at 290°C for 14 days.
14

Stable crackGrowth
Unstable crackGrowth
Crack initiation
K IH
Crack driving force (K|)
Figure 1 Schematic diagram of the dependence of crack velocity on stress intensity factor.
15

oa
O_O
oCDO
VDHC = Aexp(-Q/RT)
VDHc = 0
1/T
Figure 2 DHC crack velocity - temperature relationships showing the hysteresis between heating andcooling cycles.
16

6. BLISTER GROWTH IN ZIRCALOY-2PRESSURE TUBES
T.P. Byrne and M. Léger (OH Technologies)G.D. Moan (AECL-CANDU)
RECORD: (H:\WFDATA\FRICEIFCHB-ZR2JT93-09-09

BLISTER GROWTH IN ZIRCALOY-2 PRESSURE TUBES
T.P. Byrne, M. Léger and G.D. Moan
1.0 OBJECTIVE
The objective of this document is to provide a brief review of the experimental and theoreticalbasis for calculations of hydride blister growth in pressure tubes in contact with calandria tubesin reactor. Such calculations, together with a criterion for blister fracture based on size providethe basis for a method to critically assess the integrity of pressure tubes subject to contact withcalandria tubes.
2.0 INTRODUCTION
Since the pressure tube rupture in Pickering Unit 2, a large research program has provided arelatively detailed understanding of the phenomenon of blister growth in pressure tubes due tocontact with calandria tubes. The program included the development of an excellent modellingcapability based upon numerical methods that have been described in detail in severalpublications /1-3/. The modelling efforts were supported by a significant experimental program,the major results of which have also been published /4,5/. The purpose of this document issimply to review some of these results in order to establish key features of the blister growthphenomenon which are likely to have an impact on integrity evaluation for pressure tubes incontact.
From an historical perspective, the key feature of all this effort, which was not recognized at theoutset, was probably the necessity to include details of the hysteresis of the solubility of hydrogenin zirconium alloys in the modelling. This was realized when some of the initial blister growthexperiments produced results which were qualitatively different from the results of a model basedupon a single-valued solubility-temperature curve. Without the inclusion of the hysteresis,calculated blister formation thresholds were much reduced and the large two-phase (hydride-alphazirconium) zones in thermally cycled specimens could not be modelled. Although the modellingof the hysteresis is probably greatly simplified compared to the reality of hydrogen solubility, thismodel of two TSS relations, depending upon dissolution and precipitaion of hydride, is veryeffective in explaining what can be observed experimentally.
Included in this document are some representative results of blister growth calculations for aZircaloy-2 pressure tube such as a Douglas Point or RAPS tube. Detailed predictions of blistergrowth would have to take account of reactor history and deuterium ingress in a morecomprehensive manner.

3.0 BLISTER GROWTH OVERVIEW
When pressure tube/calandria tube contact occurs, the terminal solid solubility (TSS) decreasesat the cold spot and a thermal driving force is developed which tends to diffuse hydrogenisotopes to the contact location. This, in itself, is not enough to form a blister because ashydrogen in solution accumulates at the cold spot, a counterbalancing driving force develops dueto the gradient of hydrogen in solution. When the local bulk concentration is lower than theBlister Formation Threshold (BFT), an equilibrium distribution is very quickly established andno further diffusion occurs. Blisters cannot form under these conditions. Precipitation mayoccur, however, due to changes in temperature and residual precipitate may result from thermalcycles due to the hysteresis in the TSS. This precipitation generally develops over a volume andis not formed due to hydrogen diffusion to the cold spot Hydride precipitates may have a radial-axial orientation (especially in Zircaloy) in which the formation of radial hydrides has beenobserved at stress levels of between 75 and 90 MPa 161. A sufficient density of such precipitatescreates a zone of low fracture toughness even up to operating temperatures.
When the bulk concentration is above BFT (or if the BFT drops below the bulk concentrationdue to reduction in operating temperatures) this equilibrium condition cannot be established anddiffusion begins as local precipitation occurs, resulting in hydride accumulation at the cold spot.This is the start of a process to form a blister. The rate at which the resulting blister growsdepends on many parameters including bulk concentration, ingress rate, local temperature andtemperature distribution, the proportion of hydrogen to deuterium as well as the direction takento arrive at the thermal condition under consideration (ie- heating vs cooling) as well as the timeof contact (ie- early or late contact).
Blisters become a structural integrity concern when a crack develops from the blister through tothe parent material creating an initiation site for DHC. This happens when the blister reaches acritical size 141. Since the blister size is measured in terms of equivalent blister depth, the rateof blister growth is defined in terms of rate of increase of equivalent blister depth 111.
4.0 MODELLING OF BLISTER INITIATION AND GROWTH
The technical details and the mathematical background for the blister modelling are givenelsewhere /1-3/. Basically, blisters initiate when the local temperature is cold enough (normallybecause of pressure tube/calandria tube contact) and the bulk PT equivalent hydrogenconcentration is high enough (blister formation threshold) so that hydride precipitation occurs.The blister formation threshold (BFT) depends on the temperature distribution and the materialproperties governing hydrogen solubility (and heat of transport) through the equation;
BFT = CT expRT
cexp
BULK
(1)

where BFT is the hydrogen isotope concentration at a point near contact but far enough awayso that the temperature is TBULK. The other parameters are;
CT = constant defining the terminal solid solubility
(pre-exponential in the Arhenius expression)
H = heat of mixing
Q* = heat of transport
R = gas constant
Tc = local temperature (deg K) at the cold spot
This equation can also be used to calculate the limiting blister size, which depends only on thetemperature distribution and the local bulk concentration.Since BFT depends on the local temperature distribution, it varies with axial position along thepressure tube and increases towards the outlet end due the higher PHT temperatures. It alsoincreases from the top of the calandria to the bottom as a result of the increase in moderatorsaturation temperature. As well, the local bulk concentration increases in time (from the initialhydrogen concentration) with the ingress of deuterium, with the greatest increase occurring nearthe outlet where the temperatures are highest. The BFT also varies with time due to changes inlocal temperature as a result of changes in operating conditions. As the local PHT temperatureis reduced due to a reduction in power level, for example, the BFT is reduced. However, at verylow temperatures (eg- cold shutdowns), although BFT is exceeded, the rate of diffusion isnegligible due to the reduced temperature gradients and the extremely low diffusion coefficientat these temperatures.
When the bulk concentration is above BFT, hydrogen migrates down the temperature gradientresulting in precipitation and blister growth at the local cold spot. The governing equation forthe diffusion of hydrogen in solid solution is;
v • vsz> • he, + S ^ v r l + q = 4r &1 \ RT2 I dt
where; C = total hydrogen isotope concentration
Cs = concentration in solid solution
T = temperature (deg K)
t = time
vs = volume fraction of isotope in solid solution
D = diffusion coefficient
q = hydrogen ingress from operating environment

Since the governing equation depends on temperature, the problem is one of coupled thermal andhydrogen diffusion, and the concentration in solution is determined from the total concentrationat each time step through logic that describes the local TSS (terminal solid solubility). Thepartitioning of the total concentration between the amount in solution and the amount ofprecipitate at each spatial location (at each instant of time) is not trivial and is currently an activearea of research. Details of the TSS logic are given elsewhere /8/, and will not be given herein the interest of brevity. However, as shown in Figure 1, the hysteresis in TSS is modelled byhaving a different TSS for precipitation than for dissolution. Therefore, the prediction of blistergrowth rates is much more difficult than the prediction of blister initiation. The growth ratesdepend on the rates of diffusion (of both hydrogen and deuterium) as well as the thermal andingress histories.
The analysis is further complicated by the fact that the temperature field changes as the blistergrows. This, combined with the uncertainties in the nonlinear thermal boundary conditions,makes the modelling extremely difficult. As well, since this is a time dependent phenomenon,the full thermal history of the fuel channel must be considered when making a blister assessment.Therefore station records, combined with the changing thermal boundary conditions, due to blisterbulging, fretting, oxidation and moderator boiling, etc., must be taken into account.
Surface hydrogen equivalent flux, due to the ingress of deuterium, must be specified on thepressure tube outer and inner surfaces. Unfortunately, the bulk concentration is generally onlyknown at the- beginning and the end of the pressure tube life, and the ingress rate history mustbe estimated.
Existing hydride accumulations and/or blisters can be dissolved, although the hysteresis in TSSleads to some difficulties. For pressure tubes that remain in contact, the contact temperaturewould have to be raised approximately 50 degrees C higher than the contact temperature at whichthe blisters initiated, before the blisters will begin to dissolve. On the other hand, in the case oftubes that are removed from contact, blisters will dissolve if the bulk concentration is less thanTSSD.
4.1 Modelling Parameters
Blister growth rates vary over a wide range and depend on many parameters. A single blister ismodelled in order to eliminate the competition with neighbouring blisters for hydrogen. Thetemperature field is updated as the boundary conditions change due to blister growth. Mesh sizes,at the surface in the contact region, must be chosen to ensure accuracy for the thermal and thehydrogen diffusion analyses. The material properties, thermal boundary conditions and othermodelling assumptions used for the analyses are defined in reference /1-3,9/. "Best values" ratherthan "conservative values" are used, so as to most accurately predict blister initiation and growth(both for comparisons with reactor data and for applications during reactor assessments).Conservatism is ensured during the application of the model, for reactor assessments, through thechoice of the values for the governing parameters and operating conditions.

4.1.1 Pressure Tube Temperatures
Details of the pressure tube temperature calculations, that are required for both the TSS logic andthe solution of equation (2), are described in another associated paper in this meeting 191. Thetemperature distributions change both spatially and with time due to changing of both operatingconditions and boundary conditions. In addition to the current temperature distribution, thethermal history must be considered when carrying out a blister growth analysis.
4.1.2 Initial Hydrogen Concentration
Both hydrogen and deuterium are present in the pressure tubes and since the diffusion coefficientfor hydrogen is higher than that for deuterium, the amount of initial hydrogen affects the rate ofblister growth. The blister growth model considers both species simultaneously and the initialhydrogen concentration must be specified unless a conservative value is used in the analysis.
4.1.3 Bulk Concentration and Ingress Rate
If the bulk concentration is lower than the BFT, an equilibrium distribution of concentration insolution will be quickly set up and there will not be any blister growth. On the other hand whenBFT is exceeded, the rate of growth of blisters will depend on both the amount that the bulkconcentration exceeds BFT and the ingress rate. If the BFT is only marginally exceeded, thegrowth rate is slower and the limiting blister size is small.
4.1.4 Blister Diameter
Reference 191 describes the technical basis for the choice of a "contact size" of 5 mm and acontact conductance of 10,000 Wlm2C. These are based on observations of blisters in Pickering1 and 2 and the contact conductance correlation of Yovanovich and Hegazy /10/ combined withan estimate of the contact load. For a given contact load, the change in pressure, as a result ofa variation in contact area, affects the contact conductance so that the local surface temperatureis not very sensitive to the contact area and therefore BFT is not sensitive to the size of hardcontact. However, the rate of blister growth does depend on the contact geometry, and thecapability to accurately predict BFT does not ensure the accurate prediction of blister growth rate.Blisters with a smaller diameter (assuming the same contact temperature) grow faster because ofthe geometry (less hydride required for the same depth) and also because of the higher localtemperature gradients. The use of a 5 mm diameter is consistent with reactor evidence. Anotherinteresting observation is that the limiting blister size is smaller for blisters with smallerdiameters. Therefore, although they grow faster, they do not grow as deep.

4.2 Verification and Validation of the Model
Evidence that the model adequately simulates the physics of the phenomena and that there isadequate accuracy in the prediction of the various phenomena has been shown on the basis ofvarious documents /1-3/ and the comparison of model predictions with controlled laboratoryresults /4,5/. It has been shown that the model predicts the initiation and growth of blisters underconditions where the temperature field is controlled. As well, the various phenomena associatedwith the hysteresis in the terminal solid solubility (TSS) are adequately simulated.
Comparisons have also been made between the results predicted by both the finite difference andthe finite element method. The excellent comparison confirms that the controlling differentialequations and the TSS logic are being correctly modelled.
Pressure tube temperatures and blister growth cannot currently be monitored in reactor. Therefore,comparisons of model predictions with reactor blister data from removed tubes have been carriedout for the purpose of validating the model. Recent comparisons (eg- 111) have resulted inincreased confidence in the modelling. However, due to the fact that only the very early stageof blister growth (ie- hydride accumulation) has been observed in the Zr-2.5% Nb pressure tubesremoved from reactor and because of the uncertainty of the blister initiation and growth time,there is insufficient reactor data to validate the blister growth rates. The best validation that canbe done at this time is a combination of comparison of growth rates under controlledtemperatures in the laboratory and a verification of the reactor temperature predictions withcurrent reactor data on early blister growth.
4.3 Blister Growth Predictions
Figures 2 and 3 show sample blister growth predictions for the inlet and outlet locationsrespectively of a Zr-2 pressure tube with nitrogen as the annulus gas. The thermal conductivity/ l l / , diffusion coefficients /12/ and TSS values /13/ for Zr-2 are used along with the pressuretube and calandria tube geometry of the RAPS fuel channels. All other assumptions are the sameas those that are used for analyses of Zr-2.5% Nb tubes. Comparison of these examples showthat;
- BFT is lower at the inlet than the outlet.- Blister growth rate is lower at the inlet than the outlet.- Expected blister depths, for a particular bulk concentration,
are higher for lower ingress rates.These sample cases assume that the pressure tube has been in contact with the calandria tubesince early in the life of the fuel channel. As well, the ingress rates are assumed constant withtime. These blister depths and growth rates should be used only for the purpose of qualitativeanalyses, since actual reactor conditions are changing with time and the expected blisters, inreactor, will depend on the full history of the thermal conditions and the pressure tube ingressrates. The various phenomena, along with worked examples, will be covered in more detail laterin this meeting /8/.

5.0 EXPERIMENTAL BLISTER GROWTH
A good description of the blister growth experiments is provided in reference IAl. This referenceincludes results both from experiments designed to test the blister growth model and fromexperiments on a set of pressure tube-calandria tube contacts.
The experiments designed to test the blister growth model (discussed in Section 3) wereaccelerated relative to the expected pressure tube cases by having tubes hydrided in some casesto 100 ppm and by carrying out the tests with a bulk tube temperature of 350 °C. This wasachieved through the use of a circulating metal bath as the heat transfer medium on the innersurface of a short length of pressure tube. Confined air jets were used to produce the cold spotson the outer surface. The increased temperature (relative to reactor) increases both the amountof hydrogen in solution available for transport and the hydrogen diffusion coefficient. Blisterswith profile heights of 60-80 Jim were regularly grown in about a month. The goodreproducibility of the thermal boundary condition in the air-jets allowed similar blisters to begrown. By starting blister growth at different times, the end of the test resulted in having blisterswhich could show the whole sequence of the process. Blisters were found to grow initially as anaccumulation of hydride plates adjacent to the surface. As more hydrogen was driven to the coldspot, the density of hydrides increased and the hydrided zone expanded. With time the part ofthe blister adjacent to the surface became almost solid hydride although electron metallography,neutron diffraction and nuclear reaction analysis suggested that some alpha phase zirconiumremained. Only blisters grown to very large profile heights (greater than about 120 \im) by thismethod were cracked during growth.
Some tests were carried out on tube sections which had been deuterided. This allowed subsequentdetailed analysis of the distribution of deuterium through the depth of the blister using nuclearreaction analysis techniques using the D(3He,p)a reaction /14/. Some results of the comparisonof the modelled deuterium distributions with the observations 151 are reproduced in Figures 4 and5. The most striking feature of these comparisons was that excellent agreement was achieved bysimply using the TSS data available in the literature /13/, the diffusion coefficients establishedthrough other experiments 1151 and a mean value of reported heats of transport 116,111 (20,900J/mole K). There were no adjustable parameters in the model once the temperature distributionin the pressure tube under the air jets were established.
Sensitivity studies were carried out using the model. The agreement between the model and theobservations was found to be most sensitive to the deuterium diffusion coefficient. Variations inthe heat of transport had little effect, nor did variations of the TSSP except in conditions in whichthe BFT was only slightly exceeded.

Comparisons were also made with the distributions of hydride within blisters grown underconditions in which the bath temperature was thermally cycled from 350°C to 100°C severalhundred times. In this case the comparison was less good. This cycling produced a very largetwo-phase zone beneath the blister due to the hysteresis in the solubility mentioned above. Themultiple thermal cycles result in a ratchetting of the hydrogen into the two phase zone but theexact distribution is very sensitive to small errors in the estimates of the solubility limits.
The other major growth experiments were designed to reproduce reactor conditions and are alsodescribed in reference IAI. Pre-bent sections of hydrided pressure tubes were loaded into contactwith calandria tubes surrounded by cold (65°C) water in a simulated calandria vesvl with nine-channels. High pressure, high temperature (295°C) water was pumped through the tubes whichwere internally baffled to increase heat transfer from the water to the pressure tube. Themaximum growth period was 250 days.
Blisters were observed to grow over the contact area as an array of several tens of blisters, withsome distributed randomly and others distributed in different linear arrays. The largest blistershad profile heights of about 50 urn. This distribution of blisters over the contact area was quitedifferent from those observed in the tubes removed from Pickering Units 1 and 2 following thepressure tube rupture. In those tubes, blisters were seen to be more or less in a linear array. Inthe experiments, it was felt that because the contact had not "developed" in the same way (i.e.through creep and fretting of intimate contact points) there may have been different preferredsites for the start of blister growth when the tubes were brought into contact initially and afterhaving been removed and replaced after visual examinations at different times.
Blisters were seen to grow on tubes with concentrations as low as 13 ppm. This was subsequentlyexplained when the heat transfer from the water to the pressure tube was reviewed and found tobe significantly less than anticipated. This resulted in pressure tube temperatures at the contactthat were estimated to be 20°C less than would be the case in a fuelled, central core channel inreactor. The resulting BFTs were estimated to be about 10 ppm rather than the expected 26 ppm.
Many of the blisters grown on these tubes were cracked, although blisters with metallographicdepths less than 0.3 mm were generally not cracked. Profile heights for these blisters indicatedthat they had higher densities of hydride, through the depth of the blister, than did blisters grownby the air-jet method.
6.0 SUMMARY
Blister growth experiments and modelling have been reviewed. The model has been shown tobe verified through comparison with experimentally-grown blisters and appears to predict reactorsituations (including P2-G16) very well. The temperature distributions and temperature historyhave been shown to be important in being able to model growth well. Proper application of thismodel to reactors requires good estimates of the deuterium ingress rate.

REFERENCES
1. Byrne, T.P., Gadala, M.S., and Léger, M., "Hydrogen Redistribution Due to TemperatureGradients in Zirconium Alloys-A Finite Element Approach", B3/5, SMiRT Conference,Brussels, Belgium, 1985.
2. Byrne, T.P., Metzger, D.R. and Léger, M., "Zirconium Hydride Blister Modelling and theApplication to the P2-G16 Failure", B13/1, SMIRT 11 Conference, Tokyo, Japan, August1991.
3. Metzger, D.R., Badie, N., Byrne, T.P. and Sauve, R.G., "An Overview of CANDU FuelChannel Modelling", Ontario Hydro Research Review, Number 8, August, 1993.
4. Léger, M., Moan, G.D., Wallace, A.C. and Watson N.J., "Growth, Fracture andNondestructive Evaluation of Hydride Blisters in Zr-2.5 Nb Pressure Tubes", Zirconiumin the Nuclear Industry: Eighth International Symposium, ASTM STP 1023, L.F.P. VanSwam and CM. Euken, Eds., American Society for Testing and Materials, Philadelphia,1989, pp. 50-65.
5. Léger, M., Byrne, T.P., Wallace, A.C., Leemans, D.V., "Understanding Hydride Blistersin Pressure Tubes", Ontario Hydro Research Review, Number 8, August 1993.
6. Léger, M., and Donner, A., Can. Met. Quart. 24, p235, 1985.
7. Léger, M., "The Mechanism and Criterion for Failure by Hydride Blister-InitiatedCracking", Consultants' Meeting on "PHWR Pressure Tube Integrity", IAEAHeadquarters, Vienna, July, 1994.
8. Byrne.T.P. and Wong, H., "Worked Examples of Hydride Blister Growth", Consultants'Meeting on "PHWR Pressure Tube Integrity", IAEA Headquarters, Vienna, July, 1994.
9. Byrne, T.P. and Léger, M., "Conditions in the Pressure Tube and the Calandria TubeAfter Contact", Consultants' Meeting on "PHWR Pressure Tube Integrity", IAEAHeadquarters, Vienna, July, 1994.
10. Yovanovich, M.M. and Hegazy, A.A., Paper No. 83-1434, AIAA 18th ThermophysicsConference, June 1983, Montreal, Canada.
11. Scott, D.B., Report WCAP 3269-41, Westinghouse Electric Company, 1965.
12. Kearns, J.J., "Diffusion Coefficient of Hydrogen in Alpha Zirconium, Zircaloy-2 andZircaloy-4", J. Nuc. Mat., 43, p330-338, 1971.

13. Slattery, G.F., "The Terminal Solubility of Hydrogen in Zirconium Alloys Between 30and 400 C", J. List Met, 1967.
14. Laursen, T., Léger, M., Xin-Pei MA, MacArthur, J.D., Palmer, G.R. and Whitton, J.L.,"The Measurement of the Deuterium Concentration Distributions in Deuteride Blisters onZirconium-Alloy Pressure Tube Material", J. Nuc. Mat, V165, pl56-163, 1989.
15. Results of Léger reported in - Sawatzky A., Ledoux G.A., Tough R.L. and Cann CD.,AECL-7265, 1981.
16. Sawatzky, A., J. Nucl. Mat 2, p321, 1960.
17. Jovanovic, M., Stern, A., Kneis, H., Weatherly CC. and Léger M., Can. Met Quart.,27(4), p323, 1988.
10

200
150
13
."5
c
's
100
50
0
1 ' ' ' J I
. •— TSSP = 30900 exp[-25150/(RT)]TSSD = 59300 exp[-31880/(RT)]
c—
i—i—
i—i—
|—i—
i—i—
i—|—
i—i—
i—i
/ • • /
,._ i
i • •
i
• i
i i—
1—
i—i—
i—i—
100 300200
Temperature (deg C)
Figure 1: Terminal Solid Solubility for Zircaloy-2
400
11

1000 1500 2000
Time (days)
2500 3000
PUR = lppm/hot yearPUR = 3ppm/hotyearPUR = 6ppm/hotyearPUR=10ppm/hotyearPUR = 20ppm/hotyearPUR = 40ppm/hotyear
10 20 30 40 50 60 70 80 90 100 110 120
Bulk Concentration (ppm)
Figure 2: Blister Growth at Fuel Channel Inlet (PHT = 250 C)
12

£S
•SCU<uÛ
0.5
0.4
0.3
£ 0.25
0.1
0
500 1000 1500 2000
Time (days)
2500 3000
v 1
PUR = 1 ppm/hot yearPUR = 3 ppm/hot yearPUR = 6 ppm/hot yearPUR = 10 ppm/hot yearPUR = 20 ppm/hot yearPUR = 40 ppm/hot year
0 10 20 30 40 50 60 70 80 90 100 110 120
Bulk Concentration (ppm)
Figure 3: Blister Growth at Fuel Channel Outlet (PHT = 290 C)
13

35
0 100 200 300 400 500 600 700 800 900 1000 1100Depth (micron)
Figure 4 Comparison of measured (A) and predicted (E) deuterium distributions throughthe depth of a blister grown with the air-jet technique.
-2 - 1 0 1Distance (mm)
Figure 5 Comparison of measured (A) and predicted (D) deuterium distributions in ablister along the circumferential direction of the tube.
14

7. HYDRIDE BLISTER FEATURES INZIRCALOY-2 PRESSURE TUBESREMOVED FROM PICKERING UNITS 1&2
G.D. Moan (AECL-CANDU) andD.K. Rodgers (AECL-RC-CRL)
RECORD: CH:\WFDATA\PMŒ3FCHB-ZR2JT93-09O9

HYDRIDE BLISTER FEATURES INZIRCALOY-2 PRESSURE TUBES
REMOVED FROM PICKERING UNITS 1 & 2
A SELECTION OF MICROGRAPHS
G.D. Moan and D.K. Rodgers
1.0 INTRODUCTION
Following the failure of the pressure tubes in channel G16 in Pickering Unit 2 (P2G16) sectionsof it and other pressure tubes removed from Pickering Units 1 and 2 were examined to study theblisters that led to the failure. Several tubes were removed for examination before the decisionwas made to replace all of the Zircaloy-2 tubes with Zr-2.5Nb tubes. Additional work on theZircaloy-2 tubes was stopped at that time.
The examination carried out on the tubes at AECL CRL included a visual inspection of theoutside surface looking for blisters, followed by optical metallography of the transverse and axialsections that contained the blisters.
The micrographs in the following pages are the results of many hours of metallography carriedout on the blisters found in the pressure tubes found in the pressure tubes removed fromPickering Units 1 and 2. It can be seen that most of the micrographs are made up from severalindividual micrographs that were mounted together and later re-photographed and printed.
All of the blisters in this report were grown in the Zircaloy-2 pressure tubes during their servicein Pickering. None of the blisters included here were grown in the laboratory and none of themicrographs show Zr-2.5Nb.
In addition to the microstructures, some of the photographs show the outside surface of thepressure tubes and illustrate the surface features commonly found associated with blisters.
The photographs are arranged in different sections in this report according to the features ofinterest.
2.0 SURFACE FEATURES
The surfaces of the pressure tube and calandria tube removed from P2G16 were examined andthe features found are shown in Figure 2.1. The outside surface of the pressure tube (PT) isshown in the top section, the inside surface of the calandria tube (CT) in the second section andthe outside surface of the CT in the third section.

Of special interest in the top section are:
1. The axial crack in the pressure tube can be seen; it ends in a fish tail at 429 cmfrom the inlet, and extending to the outlet rolled joint
2. The locations of the blisters in a linear array on the tube surface can be seen, withsome of them inboard of the fish tail end of the crack.
3. The crack did not go through the centres of the blisters but was slightly to oneside of their centres.
4. The crack initiation is considered to have occurred at the blisters marked with "x";it then travelled in the inboard and outboard directions before stopping at therolled joint and in the fish tail (after some transverse propagation).
The middle section shows the marks on the inside surface of the CT (the regular transverse spiralmarks caused by the inspection tooling can be ignored). The black marks are not hydrides, butare scuff marks introduced into the CT surface by the contact with the PT. No hydrides wereseen in the calandria tube beyond those normally expected. No hydrogen seems to have beentransferred from the PT, but if any were transferred, the temperature gradient would havedispersed it and no blister would be expected in the CT. The locations of the marks on the insidesurface match the blister locations on the PT, when allowance is made for axial motion of thePT.
The bottom section shows the marks of the outside of the CT at the contact location. The CTwas hot in this area and copper compounds (leached from the steam generator piping) dissolvedin the moderator were decomposed by the higher temperatures. The black marks in thephotograph are regions where a Cu rich deposit was formed.
Figure 2.2 shows the blister locations on the outside of the PT in channels P1K05 and P1K18.The wavy axial pattern on the tube surfaces are the witness marks left by the Zr-2.5Nb-0.5Cuspacers when the PT was dragged over them during tube removal.
Figure 2.3 shows the blister locations and a white oxide deposit on the outside of the PT inP1G14. The white deposit is a Zr compound that forms when there is vibration induced wearon the PT surface.
3.0 FEATURES IN BLISTER MICROGRAPHS
Several features common to blisters are shown in Figure 3.1, a composite micrograph of atransverse section through a blister that had been polished and etched. The frequently used etchwas (45% nitric acid, 45% glycerol, 2 to 10% hydrofluoric acid). At the edge of the photograph,remote from the blister, regular matrix hydrides can be seen, with their concentration slightlyincreased by the diffusion down the temperature gradient. The individual hydrides are visible,

and their concentration is seen to increase towards the region that has etched almost uniformlyblack. In later micrographs it is shown that this black region is made up from closely spacedhydrides with alpha Zr separating them, so that after etching the local surface is not smooth andreflective.
The large white region at the centre of the blister is a region that is made up mostly of zirconiumhydride containing little alpha Zr, and is often called "solid hydride". The concentration ofhydrogen increases up to about 16,000 ppm in this white region. The volume expansion (about17%) associated with the transformation from alpha Zr to ZrHj 6 has caused the material to beproud on the tube surface, with a change in curvature that starts on the outside surface at theareas that etched black.
The features in the surface are small cracks. Their size in this micrograph is small, whencompared with later micrographs. A possible driving force for the formation of the cracks couldbe the volume expansion that is occurring at increasing depths below the surface.
The micrographs in Figures 3.2 to 3.10 all show features found in small blisters, or at the edgeof larger blisters. The increase in hydride concentration remote from the blister can be seen, withthe concentration increasing towards the contact region. The orientation of many of the hydridesis mostly radial, even though the hydrides elsewhere in the tube are circumferential. Thepresence of radial hydrides close to blisters is commonly observed in blistered Zircaloy-2 PTmaterial.
The blistered region in many of the blisters in Figures 3.2 to 3.10 have etched mostly black,indicating that they are not quite solid hydride and that their H concentrations are less than16,000 ppm.
At some of the blisters there is a region close to the black etched area that has predominantlyradial hydrides and a hint of hydride depleted zones between them (see Figures 3.4 to 3.9). Thissuggests that the radial hydrides were present immediately before the unit was shut down (or thatthey formed very soon after the start of the cooldown) and that they absorbed the adjacenthydrogen atoms during the cooldown to create the apparent depleted zones.
In some cases (as in Figures 3.5 to 3.9) it is clear that two or more blisters were growingadjacent to each other and the implication is that one would eventually absorb the other.
The micrographs in Figure 3.11 show the hydride concentrations near the blisters, their radialorientation, and the two phase region closer to the blister centres. Note that the radial hydridesclose to the blister appear to be in streams, with the suggestion of hydride depleted zonesbetween them, as mentioned above. These again suggest that there were radial hydrides in thematerial when the unit was operating (or very soon after the start of the cooldown).

4.0 CRACKS IN BLISTERS
The blisters shown in Figures 4.1 to 4.9 all contain cracks that are confined within the blisters,ie., none of the cracks have extended into the region outside the blisters. In some cases the sameblister with cracks was examined after polishing to different amounts and etching.
The shape of the blister in Figure 4.1 suggests that there were two or more different blistersinitiated and that one of them seems to have become dominant It has two radial cracks closeto the edge of the white region. There are also many hydrides with a predominantly radialorientation all along the blister boundary.
The micrograph in Figure 4.2 is from the same blister as that in Figure 4.1, but at a differentlocation. The blister depth and the crack depths are greater; the radial hydrides and the smallerblister at one side are still present, but the smaller blister on the left side has effectivelydisappeared.
The micrograph in Figure 4.3 is an axial section through a blister. The hydrides outside theblister are not as well defined and appear more smeared, so that it is difficult to point to any thatare radially oriented. The black region marks the edge of the blister, as also indicated by thestart of the proud region on the tube surface. The cracks are more extensive in this blister andhave opened up, especially close to the tube surface. Their depths are all less than the depth ofthe white etched region. The crack shapes are mostly radial, but there are sections that haveorientations different from radial.
The blister in Figure 4.4 has grown from two blisters, each of which has its own cracks that haveextended down through the white etched area to the black etched region. There is a large regionof radial hydrides adjacent to the blister.
The crack in the blister in Figure 4.5 is located close to the centre of the blister, and extendsalmost to the black region. The blister is surrounded by radial hydrides but they are morecircumferential at greater distances.
Figure 4.6 shows a blister that contains an extensive array of cracks, and is unusual in that someof them have a large component that is not radial. There are two sets of cracks, small ones andlarge ones. The small ones are generally shallow, and extend a short distance into the blister.The large cracks are much deeper and in some cases extend down to the black etched regionwhere they undergo an orientation change from radial to circumferential. The other large cracksare also unusual in that they show some bifurcation. The radial hydride region is larger thanusual at this blister.
The blister in Figure 4.7 shows the more usual crack features in that the crack depths are about50% of the blister depth. The cracks have opened up more than can be accounted for by etchingeffects. The radial hydride region outside the blister is also extensive.

The cracks in Figure 4.8 are again more usual in that their depths are about 50% of the blisterdepth. They do, however, show more bifurcation than is usual. The radial hydrides outside theblister can also be seen, but it is also clear that at the interface between the blister and the tubesurface the hydrides are transverse.
Figure 4.9 shows an extensive crack array in a blister. Again the cracks are about 50% of theblister depth, but they have opened up in such a way as to suggest that the outer surface of theblister in the crack region could be almost porous.
5.0 DETAILS AT HIGH MAGNIFICATION
The micrographs in this section were collected together to show important details in theblis' îrsand in the cracks found in them.
Figure 5.1 contains a micrograph at high mangification that shows the details of a blister. Theblister has been formed by the accumulation of individual hydrides in the cooled region. Withincreased migration of hydrogen atoms down the temperature gradient, the individual hydrideshave grown larger and thicker, and the space between them (alpha Zr) has decreased. Eventuallythe space betwen the hydrides decreases to zero as the local H concentration increases towards16,000 ppm.
This blister also shows that the hydrides outside the blister are mostly radial in their orientation.Closer to the tube surface their orientation changes from radial to transverse. The orientationchange on crossing the blister matrix interface suggests that the stress state is different inside andoutside the blister. Calculations and modelling have indicated that the blister induced stressesarising from the volume expansion outside are tensile outside the blister, whilst inside the blisterthay are compressive.
The fraction of alpha Zr also decreases closer to the tube surface. At about half blister depththere is a clear indication that some of the hydrides are losing their individuality and have smallareas that are almost flat after being polished and etched. These small flat areas are reflective(and appear white) in the micrograph. No cracks were found in this section of the blister.
Figures 5.2 to 5.11 consist of pairs of micrographs that show the same cracks in unetched blistersand after etching. The micrographs indicate that, in many of the blisters, the white centre of theblister is not completely uniform, but contains hints of individual hydride platelets and remnantsof alpha. In most cases the crack has not extended beyond the white region.
Figures 5.6 and 5.7 compare the same crack in a blister before and after etching. The crackwanders from its initial radial direction as its depth increases, and shows extensive growth in thetransverse direction at different depths. It has bifurcated in several places and later hasrecombined to leave islands of hydride. This crack has propagated beyond the white region ofthe blister and has arrested just outside the black etched region where the hydrides are generalyradial. Some of the details close to the crack tip suggest that, locally, the plane of the crack haschanged from the radial-axial plane to the radial transverse-plane.

Figures 5.8 and 5.9 show another crack that has bifurcated extensively, has lost some smallsections (perhaps when the crack plane changed from radial-transverse to radial-axial). The crackdepth is very much less than the blister depth, and is about 50% of the blister depth. The whitehydride appears uniform to a depth just greater than the crack depth, and at greater depths theblister microstructure is clearly non uniform. At the bottom of the micrograph there areindividual hydrides (predominantly radial) and between them and the crack tip the microstructure,showing the gradual changes indicated in several other micrographs, has an increasing numberof larger and thicker hydrides until it appears uniform.
The two micrographs in Figure 5.10 are of interest because they show a wide crack close to thetube surface but at greater depths the crack width is very narrow. The crack in this blister hasmanaged to extend beyond the black etched region of the blister. At the bottom of themicrograph the crack appears to have jumped from one individual radial hydride to another.These jumps suggest that the crack growth beyond the blister is occurring mainly by the fractureof the radial hydrides. Crack growth between the radial hydrides could occur later by DHC, oras a result of the increase in the length of the radial hydrides. Again the hydrides just outsidethe blister are radial, whilst inside the blister they are mostly transverse.
Figure 5.11 is a composite micrograph that contains many of the features listed in the otherFigures. The crack is wide open at the tube surface and it has extended to a depth well beyondthe blister depth. Outside the blister it has jumped from large radial hydride to large radialhydride and has left short ligaments between them. In the blister the individual hydrides appearto be mostly transverse, and outside they are mostly radial. The change in the uniformity of themicrostructure can also be seen from the tube surface to the crack tip.
The micrograph in Figure 5.12 shows one of the blisters in the pressure tube in P2G16. Itcontains several details of interest including:
(a) The blister contained several cracks, one of which propagated completely throughthe wall of the tube by following the large radial hydrides (and by DHC) overmost of the distance outside the blister and by overload to give the 45° shear planeat the inside surface.
(b) The second large radial crack that has extended almost 90% through the wall ofthe tube appears to have followed the radial hydrides for part of its growth. Atthe crack tip the hydride reorientation, close to and adjacent to the tip, suggeststhat crack growth at that depth was occurring by DHC.
(c) The cracks at the left edge of the blister appear to have turned to follow the blistershape, rather than remaining radial.
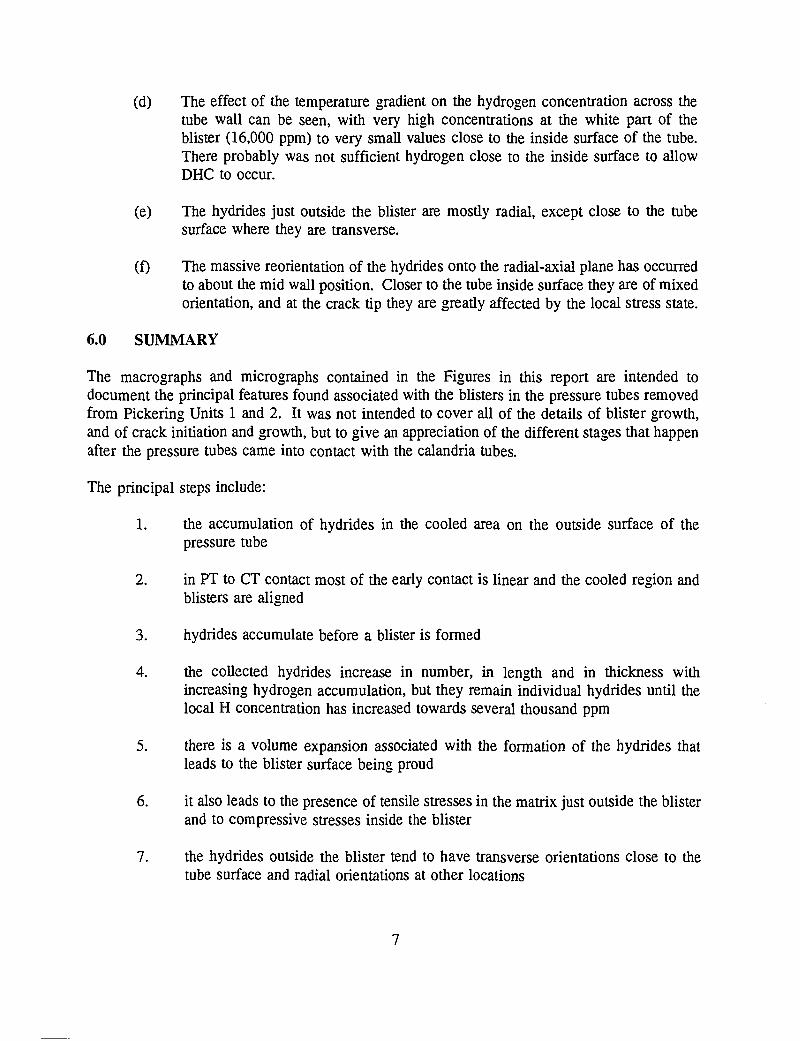
(d) The effect of the temperature gradient on the hydrogen concentration across thetube wall can be seen, with very high concentrations at the white part of theblister (16,000 ppm) to very small values close to the inside surface of the tube.There probably was not sufficient hydrogen close to the inside surface to allowDHC to occur.
(e) The hydrides just outside the blister are mostly radial, except close to the tubesurface where they are transverse.
(f) The massive reorientation of the hydrides onto the radial-axial plane has occurredto about the mid wall position. Closer to the tube inside surface they are of mixedorientation, and at the crack tip they are greatly affected by the local stress state.
6.0 SUMMARY
The macrographs and micrographs contained in the Figures in this report are intended todocument the principal features found associated with the blisters in the pressure tubes removedfrom Pickering Units 1 and 2. It was not intended to cover all of the details of blister growth,and of crack initiation and growth, but to give an appreciation of the different stages that happenafter the pressure tubes came into contact with the calandria tubes.
The principal steps include:
1. the accumulation of hydrides in the cooled area on the outside surface of thepressure tube
2. in PT to CT contact most of the early contact is linear and the cooled region andblisters are aligned
3. hydrides accumulate before a blister is formed
4. the collected hydrides increase in number, in length and in thickness withincreasing hydrogen accumulation, but they remain individual hydrides until thelocal H concentration has increased towards several thousand ppm
5. there is a volume expansion associated with the formation of the hydrides thatleads to the blister surface being proud
6. it also leads to the presence of tensile stresses in the matrix just outside the blisterand to compressive stresses inside the blister
7. the hydrides outside the blister tend to have transverse orientations close to thetube surface and radial orientations at other locations

8. cracks develop in the solid hydride part of the blister
9. in some cases the cracks have penetrated beyond the blister and are associatedwith the long radial hydrides.

1 \ l
Figure 3.1Composite micrograph showing a transverse section through one of the blisters on the pressuretube removed from P1P14. Reduced from original micrographs taken at 100X magnification.

V , ' V = T ' . ' i - J - . - • • v - : , 1 • : • • • • • . - ' " / •
Figure 3.2 . . .,Composite micrograph showing the transverse section through the edge of a blister in thepressure tube removed from P1K05. Reduced from original micrographs taken at 100Xmagnigication.

' • : i \ • ' . • ' • ' • • • '
Figure 3.3Same blister as shown in Figure 3.2, but showing a transverse section closer to the centre of theblister. Reduced from original micrographs taken at 100X magnification.

^^^M» V . i . .•'':•:••:•.K'
> • • : • " • :• i • 7 '•
< • ? • • • « • " " » x
\ Vi-
• ' - I
2 5 0 urn
Figure 3.4Composite micrograph showing a transverse section through the edge of the 10th blister from theeast end on the outside surface of the pressure tube removed from P1P14. Reduced from originalmicrographs taken at 100X magnification.

250)iin
Figure 3.5Same blister as in Figure 3.4, but showing a section slightly closer to its centre. Reduced fromoriginal micrographs taken at 100X magnification.

«aSsSSëïSS VSf&M 1 ^ 1SSSSSSSS*
iÉÉI ^^^^^^^feiËil
M»..oKfr.'i</lM
%
Figure 3.6Same blister as in Figure 3.5, slightly closer to the centre. Reduced from original micrographstaken at 100X magnification.

Figure 3.7Composite micrograph showing a transverse section through two small blisters in the pressuretube removed from P1K05. Reduced from original micrographs taken at 100X magnification.
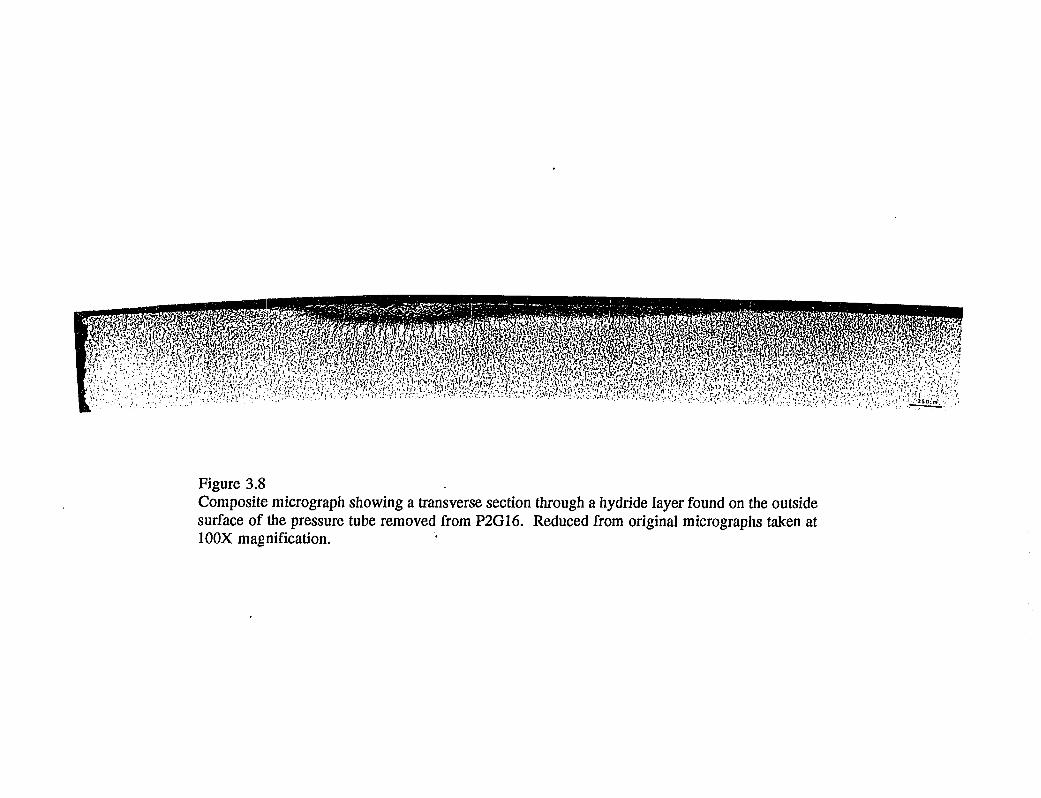
Figure 3.8Composite micrograph showing a transverse section through a hydride layer found on the outsidesurface of the pressure tube removed from P2G16. Reduced from original micrographs taken at100X magnification.

- ^Vji . i i
Figure 3.9Composite micrograph showing a transverse section through the edge of blister 6 on the pressuretube removed from P1G14. Reduced from original micrographs taken at 100X magnification.

mm
^
s ' y 250
Figure 3.10Composite micrograph showing a transverse section through the edge of one of the blisters onthe pressure tube removed from P1P14. Reduced from original micrographs taken at 100Xmagnification.
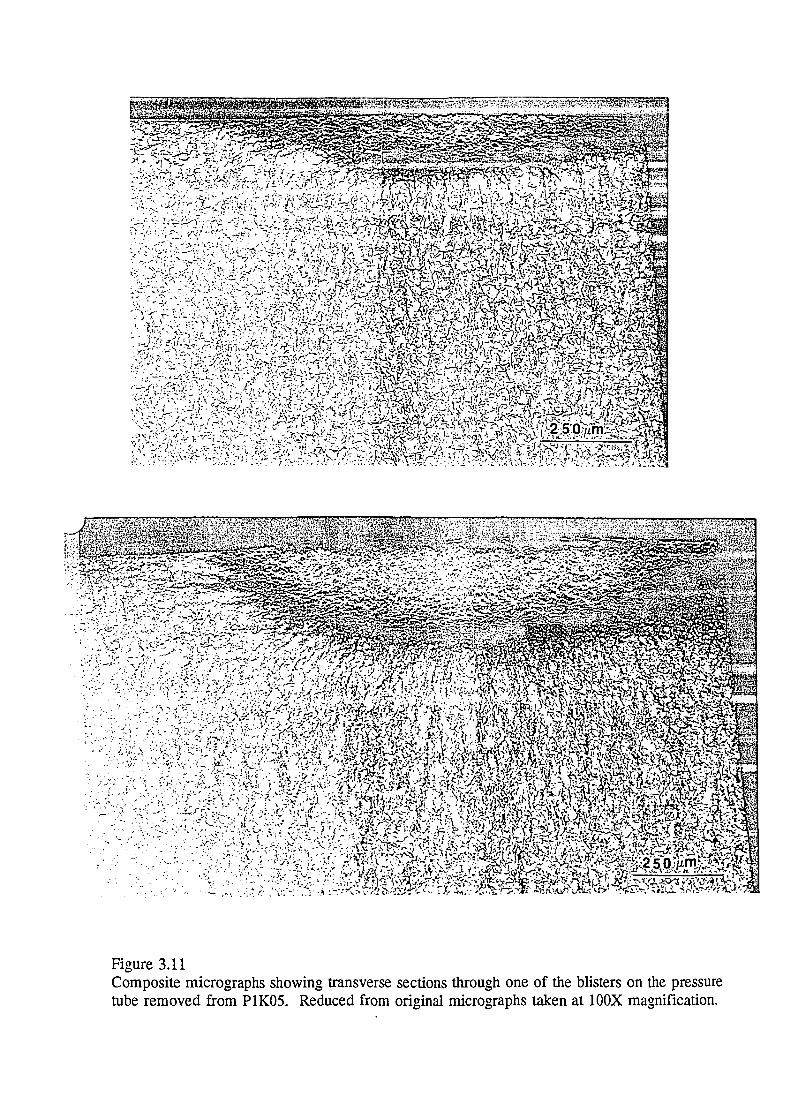
Figure 3.11Composite micrographs showing transverse sections through one of the blisters on the pressuretube removed from P1K05. Reduced from original micrographs taken at 100X magnification.

mm
Figure 4.1Composite micrograph showing a transverse section tlirough the cracks in blister 6 found on theoutside surface of the pressure tube removed from P1G14. The section was close to the edge ofthe blister. Reduced from original micrographs taken at 100X magnification.

Figure 4.2Composite micrograph showing a transverse section through the cracks in blister 6 found on theoutside surface of the pressure tube removed from P1G14. The section was close to the centreof the blister. Reduced from original micrographs taken at 100X magnification.

mm?m*®<
2 0
Figure 4.3Composite micrograph showing an axial section through the cracks in one of the blisters foundon the outside surface of the pressure tube removed from P1K05. The section was close to thecentre of the blister. Reduced from original micrographs taken at 100X magnification.

V '"•',; ••:/ . • • " / • , • : ' ' ; • • * • • • • ' ; . -. • • V - l ' r v ' \ ' '• . W . i ' : "-' -•• , W i il?' r^t-i: • V , ; •-' ' ,;(• •'. l h % \-\S '•%:,/.-.
ill©
H
Figure 4.4Composite micrograph showing a transverse section through the cracks in blister M found on theoutside surface of the pressure tube removed from P2G16. The section was close to the centreof the blister. Reduced from original micrographs taken at 100X magnification.

Figure 4.5Composite micrograph showing a transverse section through the cracks in one of the blistersfound on the outside surface of the pressure tube removed from P1K05. The section was closeto the centre of the blister. Reduced from original micrographs taken at 100X magnification.

nmw^^::'':^250 ,
Figure 4.6Composite micrograph showing a transverse section through the cracks in blister N found on theoutside surface of the pressure tube removed from P2G16. The section was close to the centreof the blister. Reduced from original micrographs taken at 100X magnification.

Figure 4.7Composite micrograph showing a transverse section through the cracks in one of the blistersfound on the outside surface of the pressure tube removed from P1P14. The section was closeto the centre of the blister. Reduced from original micrographs taken at 100X magnification.
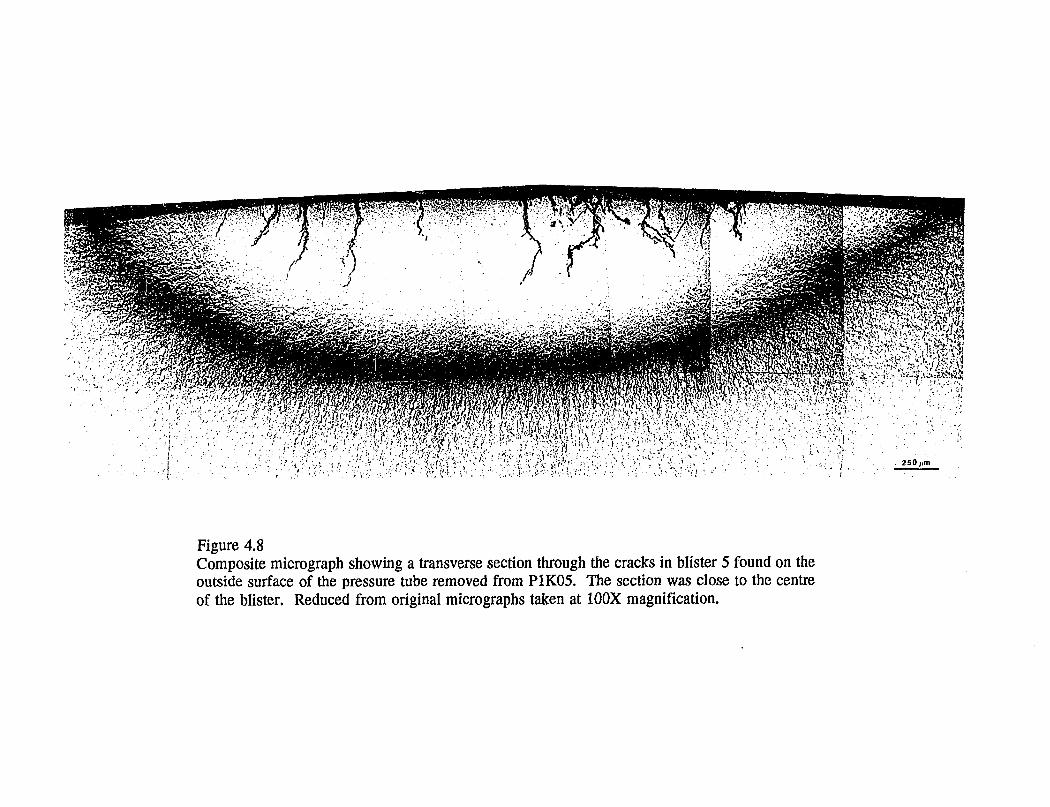
250)il)l
Figure 4.8Composite micrograph showing a transverse section through the cracks in blister 5 found on theoutside surface of the pressure tube removed from P1K05. The section was close to the centreof the blister. Reduced from original micrographs taken at 100X magnification.

1 '
Figure 4.9Composite micrograph showing a transverse section through the cracks in one of the blistersfound on the outside surface of the pressure tube removed from P1P14. The section was closeto the centre of the blister, displaced slightly from that in Figure 4.7. Reduced from originalmicrographs taken at 100X magnification.

' " " - N
Figure 5.1Micrograph showing a detail in the transverse section through one of the blisters in the pressuretube removed from P1K05. Enlarged from the original micrograph taken at 500X magnification.

Figure 5.2Composite micrographs showing a transverse section through the tip of crack 1 in blister E inthe pressure tube removed from P2G16, as-polished and after etching. Based on originalmicrographs taken at 500X magnification.

ii&^?;,--&?^>'«'-&-2z'- ,•":•"£
J-50 j
Figure 5.3Composite micrographs showing a transverse section through crack 3 in blister M in the pressuretube removed from P2G16, as-polished and after etching. Based on original micrographs takenat 500X magnification.

50
Figure 5.4Composite micrographs showing a transverse section through crack 1 in blister M in the pressuretube removed from P2G16, as-polished and after etching. Based on original micrographs takenat 500X magnification.
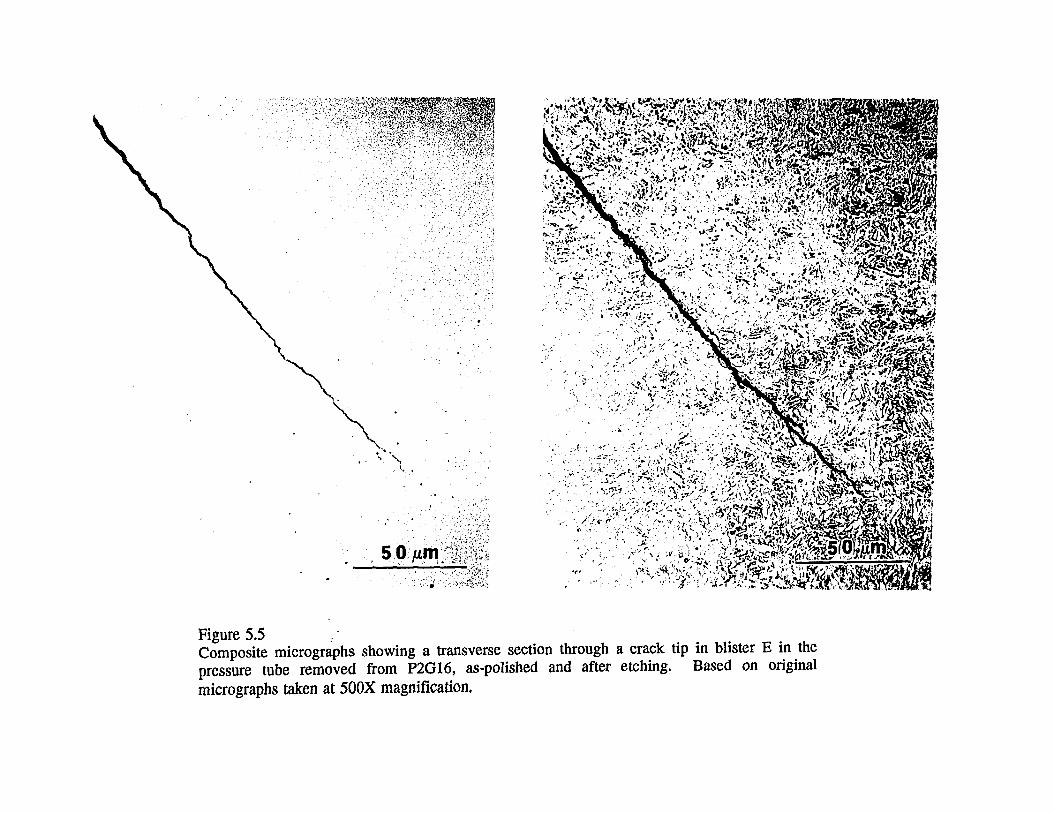
5 0/im
Figure 5.5Composite micrographs showing a transverse section through a crack tip in blister E in thepressure tube removed from P2G16, as-polished and after etching. Based on originalmicrographs taken at 500X magnification.

Figure 5.6Composite micrograph showing atransverse section through acrack in blister M in thepressure tube removed fromP2G16, in the as-polishedcondition. Based on originalmicrographs taken at 500Xmagnification.
AV
•i - A /

V •' • AT*
Figure 5.7Composite micrograph showing atransverse section through acrack in blister M in thepressure tube removed from P2G16,in the as-etched condition. Thesection is the same as that inFigure 5.6. Based on originalmicrographs taken at 500Xmagnification.

0/im
Figure 5.8Composite micrograph showing atransverse section through thedeepest crack in blister 5 inthe pressure tube removed fromP1K05, in the as-polishedcondition. Based on originalmicrographs taken at 500Xmagnification.

Figure 5.9Composite micrograph showing atransverse section through thedeepest crack in blister 5 inthe pressure tube removed fromP1K05, in the as-etched condition.The section is the same as thatin Figure 5.8, but shows more ofthe blister. Based on originalmicrographs taken at 500Xmagnification.

50
Figure 5.10Composite micrographs showing a transverse section through a crack in blister M in the pressuretube removed from P2G16, as-polished and after etching. Based on original micrographs takenat 500X magnification.

Figure 5.11Composite micrograph showing atransverse section through crack2 in blister M in the pressure tuberemoved from P2G16. Based onoriginal micrographs taken at 500Xmagnification.

Figure 5.12Composite micrograph showing a transverse section through cracks in blister E in the pressuretube removed from P2G16. The predominantly planar fracture face can be seen together withthe shear at the inside surface. Based on original micrographs taken at 500X magnification.

8. THE MECHANISM AND CRITERION FORFAILURE BY HYDRIDE BLISTER-INITIATED
CRACKING
M. Léger (OH Technologies)
RECORD: (H:\WPnATA\FRICEIVGBR-ZB2JPT93-09-09

THE MECHANISM AND CRITERION FOR FAILUREBY HYDRIDE BLISTER-INITIATED CRACKING
M. Léger
1.0 OBJECTIVE
The objective of this document is to provide a brief summary of hydride blister fracturecharacteristics by reference to both reactor experience and fracture testing of experimentally-produced blisters. The use of this information in making an integrity assessment of a reactorwhich has pressure tubes in contact with calandria tubes is described.
2.0 INTRODUCTION
Hydride blisters in pressure tubes created as a result of contact between the pressure tube and thesurrounding calandria tube can initiate cracking that leads to pressure tube rupture at operatingconditions. This was the experience in the Pickering Unit 2 reactor in 1983/1/. Failure analysisof the G-16 pressure tube, together with examinations of many other tubes and a largeexperimental program have led to the development of criteria for the evaluation of the reactorscontaining pressure tubes in contact with calandria tubes. In this document, the key results of thiswork are reviewed for application to pressure tube integrity assessments.
3.0 EVIDENCE FROM THE PICKERING G-16 EXPERIENCE
3.1 The Event and Recovery
The Zircaloy-2 pressure tube of channel G-16 of Pickering Unit 2 ruptured without warning inAugust of 1983 while the reactor was at full power. The calandria tube remained intact and oneannulus bellows (Pickering has a closed gas annulus system) ruptured. The initial leak rate wasestimated to be about 16 kg/sec i.e. 1 Mg per minute. ( Subsequent analysis indicated asignificant choking effect on the flow due to the geometry of the bearings). The quick action ofthe operators and the availability of heavy water supply from the other units at the four-unitstation enabled the reactor to be shut down safely without the operation of safety systems. Theleakage continued at a high rate following the shutdown and supply of heavy water to the reactorwas maintained by pumping water out of the sump drains below the reactor into the PHT systemuntil the channel could be isolated and defuelled. Inspection of the channel with TV equipmentrevealed a fracture approximately 2 m long extending from the outlet rolled joint. Replacementof the channel was complicated by the presence of two fuel pencils trapped in the crack. Thesewere removed using a specially developed tool.
When the failure analysis indicated that there could be a generic problem, a large inspectioncampaign was carried out and a number of channels were removed for examination. Manychannels were judged to be in a state approaching that of the failed channel and a decision wastaken by Ontario Hydro to replace the pressure tubes in both Pickering Unit 2 and Unit 1.
1

3.2 Failure Analysis
The removed pressure tube from channel G-16 was examined at Chalk River and the initiationsites for the rupture were quickly identified. Visual examination of the outside surface of thepressure tube revealed a linear array of small, elliptical, whitish markings ("blisters") at thefracture which was close to the bottom of the pressure tube. Examination of the fracture surfaceestablished that the origin of the fracture (determined by distinct "chevron" markings pointingtowards this area from the other zones of the fracture) was in an area containing four closely-spaced spots. It was also apparent that the metal immediately under these spots had fractured ina very brittle manner. The entire fracture surface appeared to be a uniform gold colour exceptfor a very small blue region adjacent to one of the spots near the fracture origin.
Metallographic sections through the fracture origin were examined and revealed that the spotsseen on the fracture surface were associated with massive hydride accumulations in the metal.On an axial-normal section, these blisters appeared to be roughly semi-elliptical in cross-section.Adjacent to the outer surface, the hydride etched white, indicating that these parts of the blisterswere almost pure hydride. A black-etching band (the result of the joint presence of a highdensity of hydrides in alpha zirconium) created the blister boundaries beyond which there werelarge quantities of hydride in the form of distinguishable hydride plates, some of them in a radialorientation (Figure 1 shows similar blisters from another tube). At the inside surface of the tubeadjacent to the blister there was considerably less hydride. The massive hydriding of the blisterresulted in a protrusion of the surface of the tube due to the large transformation strain associatedwith hydride formation (about 17%).
A significant range of blister depths ( as measured to the deepest part of the black etching band)was observed in the G-16 tube with one of the deepest blisters at 1.1 mm being one of the fourassociated with the initiation site. Blisters in many other removed tubes were also examined andno deeper blisters were found.
Another feature of many of the blisters revealed by the metallography was the presence of manysmall cracks within the massive hydride itself. The orientations of these fractures appeared to bequite random and few were perfectly axial-radial (Figure 2.). Only in the G-16 tube did thesecracks extend beyond the blister boundary. Some smaller blisters did not have any observablecracks.
Fractography of the zone surrounding the four blisters at the origin of the failure suggested thatthe crack which was initiated at the blisters grew by DHC to a part through-wall flaw with alength of about 110 mm. Progression of the crack through the wall to the inner surface by DHCwas not possible because of the absence of sufficient hydrogen near the inner surface. This flawwas a critical size for the tube and the fast fracture proceeded from it. The uniformity of theoxidation on the fracture surface indicated that the total process from crack initiation to failurewas quite short and there was no leakage prior to the rupture.

4.0 BLISTER FRACTURE TESTING
In order to develop an understanding of the processes which led to the pressure tube rupture andto assess the consequences of pressure tube to calandria tube contact for fuel channels with Zr2.5wt%Nb pressure tubes, a large, coordinated research program was undertaken. Fracture testingformed a major component of the overall program. However, only a small portion of the workwas concerned with testing of blisters on Zircaloy tubes. Most of the results have been reportedin two publications /2,3/.
Several different types of fracture test were involved. These included: 1). Four-point bend testsof curved pressure tube sections containing laboratory-grown blisters made under a.number ofdifferent conditions (These were the only tests for Zircaloy blisters); 2). Tensile tests oflaboratory-grown blisters (including blisters grown on irradiated material); 3). Delayed hydridecracking tests of laboratory-grown blisters. 4). Cantilever-beam tests of blisters grown under load.
The four point bend tests were designed to measure the blister fracture stress for crack-freeblisters. These blisters were grown using an air-jet technique. Tests and results are described in111. A major result of this work was that the fracture stress was found to correlate with themeasured profile height of the blister (i.e. the amount by which the surface of the blisterprotruded beyond the nominal tube surface) with larger blisters exhibiting lower fracture stresses.The results are shown in Figure 3 ( These are slightly different than those in Reference 111because some errors in profile height measurement were corrected.) The upper and lower boundlines were determined on the basis of the OHT tests only. The results for Zr-2 blisters areincluded on this plot and are statistically indistinguisable from the Zr 2.5wt%Nb results. Thecorrelation exhibited by Figure 3 has been used to develop criteria for blister fracture.
The tensile fracture tests were carried out on blisters grown using a cold-contact method/3/. Manyof these blisters contained small cracks in the as-grown state. The results are designated WRL-Tens. in Figure3 and include the tests of irradiated material. The correlation of fracture stresswith size (characterized by profile height) was not as apparent as in the four-point bend tests butresults generally lie within the scatter band.
Delayed hydride cracking tests were also carried out in order to determine the parameters whichinfluenced the initiation of DHC from a blister into the pressure tube. The results for the DHCtests are also included in Figure 3. The correlation with blister size is less evident if only theDHC results are used.
Another way of analysing the blister DHC initiation is to calculate the apparent stress intensityfactor required to initiate cracking by assuming that the initiation is from a semi-elliptical crackwith a depth determined by the metallographic extent of the blister in the crack plane._The valueof this factor, termed K1B, was found to be in a range from about 10.7 to 15.4 MPaV m 131. Thisis towards the upper end of the range of Km for DHC cracking in Zr2.5wt%Nb. There isconsiderable uncertainty in the significance of this result because the size of the crack at the pointof initiation of DHC is unknown. If the same calculation is made for the largest blister observed
at the initiation site of the crack in G16, the resulting K1B is at the lower end of the range of K1H
for Zircaloy pressure tube material. It may well be that the lower limit of the calculated K1B'sis determined primarily by the stresses required to generate a crack from which DHC can initiatenear the blister boundary.
Blisters were grown under bending load on unirradiated Zr 2.5wt%Nb using a cold contacttechnique. Only specimens under high bending stresses of 500 MPa initiated DHC during blistergrowth.
5.0 BLISTER STRESS FIELDS
Several attempts have been made to calculate the stress fields around blisters /4,5/. A problemwith these analyses has been the inability to accurately represent blister growth in a way whichreflects laboratory observation and understanding of the growth process. However, the resultsshow the extent of the tensile stress field in the matrix just outside the blister boundary whichbalances the compressive stress within the blister. ( The existence of this tensile stress is apparentin blister examination since blisters grown under small applied stresses exhibit hydrides at theblister boundary that tend to extend radially from the blister). A second key observation, resultingfrom modelling which attempted to include blister growth through incremental increases in thefraction of hydride within the blister, was the apparent increase in tensile stress at the surface ofthe blister as the blister grew (Figure 4). This result tended to support the idea that blister sizecould be a determining factor in the fracture.
6.0 FRACTURE CRITERIA
6.1 Characterizing Blister Size
In general, there can be large gradients in the hydrogen concentration within the blister. Theblack etching region that defines the blister boundary corresponds to a hydrogen concentrationof up to a few thousand ppm Heq1. In some blisters, the highest hydrogen concentration regions( at the tube surface) approach 16,000 ppm which corresponds to Zr H1.5 (delta phase hydride).The distribution of hydride within the blister depends upon the thermal boundary conditions andtheir time dependencies as well as the hydrogen content in the tube and the hydrogen pickuprate/6/. It should be clear that there can be no single characteristic blister.
In order to characterize blisters, a method consistent with the blister growth modelling has beenadopted. The problem of describing the blister size, when there is a variability in the hydrogenconcentration within the blister, disappears with the choice of "equivalent depth" as a key blistercharacteristic. The "equivalent depth" of a blister is the depth of a blister of pure delta phasehydride which has the same average weight fraction of hydrogen through the tube wall as theactual blister at the deepest point. This concept is illustrated schematically in Figure 5.
1 Heq stands for "hydrogen equivalent" and is the weight fraction of hydrogen isotopes that would be obtainedif the total atomic fraction of hydrogen isotopes were converted to protium.
There is a close correlation between the profile height and the blister equivalent depth. This wasdemonstrated for a series of blisters which were grown using the air-jet technique on a tubewhich had been previously deuterided. The profiles of the blisters were measured and thedeuterium distributions through the wall of the tube were independently measured onmetallographically prepared cross-sections. The technique used for the deuterium measurementshas been described in detail elsewhere 111. Equivalent depths were determined from the measureddeuterium concentrations. The correlation between the profile height and the blister equivalentdepth for these blisters is shown in Figure 6.
6.2 Blister Critical Size
The gradual nature of the development of a blister in a pressure tube, from a small hydrideaccumulation through to a solid hydride core surrounded by a heavy two-phase hydrided regionimplies that there is a change in the possibility of crack initiation accompanying the development.Although the understanding of the initiation of cracks from blisters is not yet fully developed,the evidence, both from Pickering 1 and 2 and from the blister fracture experimental program,suggests that small blisters exhibit low probabilities of initiating DHC cracks at operatingstresses.
The blister fracture results suggest that there may be a critical size blister that would crack underoperating stress. The largest blister at the initiation site of the failure of G-16 (Blister "E" ) wasa size consistent with the blister fracture results as is shown in Figure 3. The equivalent depthfor Blister "E" was determined using the same deuterium measurement technique used onlaboratory grown blisters /6/.
DHC initiation from blisters has proven to be quite difficult in laboratory testing although mostof the initiation results also lie within the scatter of the rising load tests. The test conditions forinitiation by DHC have not adequately reproduced the reactor conditions, particularly in termsof the temperature distribution and imposed stress state. The calculation of the K1B for blister"E" of G-16 is near the lower bound of the range of K1H for Zircaloy although the K1B'scalculated for Zr2.5wt%Nb tests seem to be well above the K1H lower bound. This tends tosupport the idea that in-reactor, conditions for DHC initiation are more severe than have beenreproduced in testing. For this reason, the rising load tests are used to determine the lower boundcritical size for reactor evaluation.
There is a good basis, from the above evidence, for the concept of a critical size required forcrack initiation. The lower bound line in Figure 3, showing the blister fracture test results , hasbeen chosen to represent the critical blister size as a function of applied stress. It can be redrawnin terms of equivalent depth based on Figure 6 and this is shown in Figure 7. This lower boundline was determined on the assumption that the relationship between equivalent depth and stressto fracture is linear. When this linear assumption is made, there is bias in the fit: at low stressesthe linear assumption underpredicts the observations of equivalent depth. It is important torealize that the metallographic depth is usually considerably bigger than the equivalent depth dueto the fact that the actual blister is not solid hydride.

6.3 Crack Growth to Rupture
When a DHC crack is initiated at a blister, it can then grow through the tube wall. The hydrogendistribution due to the cold contact will influence the way in which the crack grows. The insidesurface of the tube can have a hydrogen concentration in solution that is too low to result inpropagation through the wall of the tube by DHC. In this situation, the crack can continue togrow axially and result in a non-penetrated critical crack i.e. there will not be leak before break.In general, this situation is quite likely to be the case for blistered tubes because the hydrogenlevels in the tube at the time when critical blister sizes are achieved are likely to be less thanTSSD at operating temperatures unless the contact and blister growth occurs when the hydrogencontent has already exceeded TSSD. The evidence from the G-16 failure tends to confirm thisthinking/8/. Therefore, no credit should be taken for the possibility of leak detection prior torupture and initiation is basically rupture because the time to achieve a critical sized crack isextremely small compared to any reasonable inspection interval.
7.0 REACTOR APPLICATION
In order to apply the concept of a critical size to the integrity evaluation of a reactor in whichthere are pressure tubes in contact with calandria tubes, blister equivalent depths must becalculated. Blister growth calculations are described in an accompanying document. These depthsare then compared to the lower bound critical depth for level A and B loading conditions andwhen the critical depth is exceeded, rupture is assumed to occur. In order to be confident that therisk of pressure tube rupture is low, an adequate account must be taken of the uncertaintiesassociated with the calculations i.e. there must be adequate margins of safety.
The Canadian regulators (AECB and MCCR) have taken a position with respect to operation ofreactors containing tubes known to be in contact that such reactors should not knowingly beoperated with blisters growing actively at power. This is a much more stringent constraint thanthat which would be derived simply by applying the concept of a critcal size based upon a lowerbound of the fracture results.
The uncertainties that must be addressed in making an assessment fall into several groups. Firstof all, the variability in all the physical parameters used to calculate blister growth rates must beconsidered. These parameters include thermal conductivity of the materials, diffusion coefficients,heat of transport for hydrogen and terminal solid solubilities. Then, there is the variability withinthe contact itself - a range of surface conditions and contact pressures are possible. Finally, andprobably most significantly, there can be a large uncertainty with respect to the deuterium pickup rate in the tube.
An adequate safety margin should include a margin on operating time because of the uncertaintyin blister growth rate. If the state of the tube at a particular time can be well defined, the timeto develop a blister that could rupture under the highest conceivable deuterium pickup rate shouldform a limit to the operating time for that tube before reinspection. The inability to adequately,individually characterize the hundreds of tubes in a CANDU means that for a whole reactor the

margins in time before re-evaluation must take the uncertainty in the present state of many tubesinto account as well.
An approach to dealing with some of these uncertainties using probabilistic methods wasdeveloped for application to CANDU reactors/9/. Such methods are very useful for examiningthe consequences of different assumptions about the state of the reactor core ( in terms ofcontacting tubes, deuterium pick up rates etc).
8.0 SUMMARY
Blister fracture test results together with evidence from the Pickering Unit 1 and 2 reactors havebeen used to show that a reasonable criterion for blister fracture is a blister of critical size. Inorder to apply this concept to the evaluation of the safety margins against pressure tube rupture,uncertainties in the size of blisters must be determined. These uncertainties for actual reactorevaluation will be made up primarily of uncertainties in the current states of all contacting tubesand uncertainties in deuterium pickup rates over the proposed operating period.

REFERENCES
1. GJ. Field, IT. Dunn and B.A. Cheadle. Can. Met. Quart. Vol.24, 181, 1985
2. M. Léger, G.D. Moan, A.C. Wallace and N.J. Watson, ASTM STP 1023, L.F.P. VanSwam and CM. Eucken, Eds., American Society for Testing and Materials, Philadelphia,1989, p.50-65.
3. M.P. Puis , Metall. Trans. A, 19A, 2247, (1988)
4. M.L. Vanderglas and Y.J. Kim, Int. J. Pres.Ves. and Piping 22,177, (1986).
5. A.C. Wallace, Transactions of the Ninth International Conference on SMIRT,Lausanne,1987, Vol.C, p87.
6. T. Laursen, M. Léger, Xin-Pei Ma, J.D. MacArthur, G.R. Palmer, and J.L. Whitton, J.Nucl. Mat. V.165, 156, 1989
7. J.D. MacArthur, T. Laursen, Xin-Pei Ma, G.R. Palmer, J.L. Whitton and M. Léger,J. Trace and Microprobe Techniques, 6(l),29-46, 1988.
8. T.P. Byrne, D.R. Metzger and M. Léger. Proc. of SMiRT Conf. Tokyo, Japan, B13/1,1991
9. D.V. Leemans, M. Léger and T.P. Byrne, IntJ. Pres.Ves & Piping V.56,37,1993

Figure 1: A blister from a Pickering Unit 1 Zircaloy pressure tube showing extensive radial-
hydrides beneath the blister.
Figure 2: A radial-normal section of a blister showing cracks within the blister in a variety
of orientations. The axial direction of the tube is horizontal.

120
100-
•T1
CJ*
R0F
I180
60
40
20
" • \
^T a a • • \Nj?" ^jV^ii" X
XA A"B *
«OHT-ZrNb
aWRL-Tens.•
ZIrcaloy+
DHC
LOW.BND
UP.BND
200 400 60C 800 1000 1200
STRESS AT FRACTURE (MPa)
Figure 3:
Figure 4:
The relationship between blister profile height and fracture stress in blister tests
under both rising load and DHC initiation conditions.
.5 1 1.5 2 2.5Olstince Through Tube WtlKen)
Results of modelling blister stresses showing the increase in surface tensile stress
with increasing hydride density in the blister. The percentages are fractions of the
final density.
1C

E ca aa. 01
i
25
15
10
\
\
\
\
\
\
200T
-400 BOO
DEPTH IN MICRONS
IGOO 1000 1200
Figure 5: The "equivalent depth" (rectangle) has the same volume fraction of hydride
through the wall as the actual blister (curve).
30 40 60
PROFILE HEIGHT Cuilc
Figure 6: Relation between "equivalent depth" and profile height
l i

OHT-ZrNb
WRL-Tens.•
Zîrcaloy+
DHC
LOW.BND
UP.BND
200 400 600 800 1000 1200
STRESS AT FRACTURE (MPa)
Figure 7: Blister fracture results shown in terms of "equivalent depth"
12

9. INSPECTION PROCEDURES FOR ASSESSMENTOF BLISTER FORMATION/CRACKING
M.P. Dolbey (OH Technologies)
RECORD: m:\WPBATA\PBia)FCHB-ZR2JT93-0909

INSPECTION PROCEDURES FOR ASSESSMENTOF BLISTER FORMATION /CRACKING
M.P. Dolbey
1.0 INTRODUCTION
There are various types of inspection that can provide information about a pressure tube'scondition with respect to blister formation and cracking. These include spacer location, pressuretube / calandria tube (PT/CT) gap measurement, detection of PT/CT contact, detection of crackedblisters, detection of uncracked blisters, measurement of hydrogen by taking scrape samples andmeasurement of hydrogen using non-destructive methods.
Spacer location and PT/CT gap measurement give an indication (not always conclusive ) ofwhether contact, a necessary condition for blister formation, is present India has alreadydeveloped these methods and have reported that they give good results III. They will not bediscussed further here.
Detection of PT/CT contact and the detection of cracked and uncracked blisters are performedusing ultrasonic methods. India has developed an ultrasonic inspection capability, III, but it hasbeen operated at what we believe is too low a sensitivity, 111. This paper describes our ultrasonicmethods and experience related to contact and blister detection.
The measurement of hydrogen by taking scrape samples is addressed elsewhere at this meeting.The measurement of hydrogen using non-destructive methods is still under development.Information about one such method, which is also expected to provide improvement in blisterdetection, was provided at the Bombay meeting in February 1994, /3/. No further details of thesemethods are available at this time.
2.0 ULTRASONIC INSPECTION SENSITIVITY
The CIGAR (Channel Inspection and Gauging Apparatus for Reactors) ultrasonic flaw detectionsystem is used to detect PT/CT contact and cracked blisters. A brief description of the systemis given. The key to the success of this system is its sensitivity or "calibration" and this isdiscussed with reference to functional and regulatory standard requirements. Spot focussed orline focussed probes can be used for flaw detection. The advantages and disadvantages of eachare discussed.
2.1 CIGAR Ultrasonic Flaw Detection System
The CIGAR ultrasonic flaw detection system utilizes one normal beam (NB) probe and four 45°shearwave (SW) probes. The probes and their relative positioning have been described earlier IAl.
All probes are operated in pulse-echo mode for flaw detection; ie a short pulse of ultrasound isgenerated by the probe, and the probe then "listens for" or receives any of the ultrasound that is

reflected back (echoed) from suitably oriented surfaces or flaws. Because of their orientation, theNB and SW probes operate quite differently.
The NB probes generate a sound beam that is perpendicular to the tube surface. This produceslarge responses from the entry surface (interface response) and multiples of echoes from the farsurface (backwall echo response). The presence of a flaw will disturb the beam and cause areduction in the amplitude of the surface responses and, if the flaw is suitably oriented, it mayproduce additional echoes between the surface responses. The primary function of the NB probeis to detect volumetric flaws such as debris damage pits, fuel bearing pad wear marks and flawsnot suitably oriented for the SW probes. PT/CT contact usually attenuates NB backwall echoresponse but it is mixed with other effects (eg fuelling scratches etc) making interpretationdifficult.
The SW probes send sound into the tube at an angle. The tube surfaces, if perfectly smooth, donot reflect any ultrasound back to the probes. Hence, in the absence of suitably oriented flawsno response is produced. Suitably oriented flaws for these probes are ones that either have a facetthat is perpendicular to the beam of ultrasound or that intersects a tube surface to form a cornerthat is perpendicular to the beam of ultrasound (a corner reflector). The CIGAR SW probesproduce narrow focussed beams directed only in the axial and circumferential directions. Flawsoriented more than a few degrees off the beam axis will produce little or no response at theprobe.The primary function of the SW probes is to detect radial axial and radial circumferentialcracks. They are also sensitive to surface scratches and a variety of other flaws. PT/CT contactand cracked blisters both produce response primarily on the SW flaw detection probes. Hencefurther discussion will be confined to the SW probes only.
In addition to its orientation, the size and reflectivity of a flaw influence its response. The spotfocussed SW probes used by the CIGAR system have a 6 dB beam diameter between 0.5 and1 mm. Hence for suitably oriented reflective flaws longer than ~1 mm the probe response willincrease with flaw depth levelling off to a maximum for flaws > 1 mm deep.
All other things being equal, the reflectivity of a flaw increases with increasing relative acousticimpedance of the tube and flaw materials, and thickness of the flaw relative to the wavelengthof the ultrasound perpendicular to the beam, 151. Thus wide flaws or calibration notches on thetube surfaces that are filled with water or gas are highly reflective. However flaws such asdelayed hydrogen cracks (DHCs), which are narrow and tightly filled with oxide (the acousticimpedance of which is closer to that of the tube material), or blister cracks, which are veryirregular, are relatively less reflective.
2.2 Inspection Sensitivity and Calibration.
The inspection sensitivity that is required to reliably detect flaws of concern usually has to beestablished experimentally using real or realistically simulated flaws. Calibration is a process ofsetting the required inspection system sensitivity and demonstrating that all parts of the systemare functioning correctly. Calibration is carried out by inspecting a calibration specimen thatcontains reference reflectors. These reflectors are usually not actual flaws of the type that are of

concern but artifacts such as EDM notches oriented as the real flaws and of sufficient dimensionsthat they can be accurately reproduced. The difference in sensitivity required to obtain equalresponse from the smallest real flaw of concern and the calibration notch must be established andsubsequently used in setting the inspection system sensitivity during the calibration process. Thisdifference in sensitivity will be profoundly affected by the type of probe that is used.
The Canadian regulatory standard governing pressure tube inspection, CAN/CSA-N285.4-xxrelates reporting and accept/reject criteria to the level of response from EDM notches. The firstversion of the Canadian standard issued in 1983, -M83, required a reference specimen with asingle axial ID notch 0.5 inch (12.5 mm) long x 0.006 inch (0.15 mm) deep, (2 x the length anddepth of that used for manufacturing inspection). A new version of the standard, -94, is in theprocess of final approval. It calls for four notch reflectors, axial and circumferential on both EDand OD, that are now 6.0 mm long x 0.15 mm deep. The standard requires that any flaw that isinterpreted to be a crack or that has a response equal to or greater than the response from thenotch minus 6 dB be sized and reported (ie 50% of the 0.15 mm notch response which isequivalent to response from a 0.075 mm notch). Flaws that are interpreted to be cracks or thatare found to have a depth greater than 0.15 mm must be assessed to determine acceptability forcontinued operation and be dispositioned if required.
The standard does not specify the type of probes to be used and accept/reject sensitivity to smallflaws is greatly affected by the choice. For example the response of a small flaw relative to thenotch response will be much smaller for a large probe with a beam that intercepts the whole areaof the notch than for a spot focussed probe that intercepts only a short length of the notch.
It may be asked how it is that the latest version of the standard has not clarified this issue. Thestandard is a compromise born of many years of negotiation between the regulators and theoperators trying to balance public safety vs economics and idealism vs practicality. With respectto flaw acceptability, the standard does say that no crack-like flaw is acceptable. The implicationis that the inspection system must be able to detect the smallest cracks within the limits ofcurrently available technology. Ontario Hydro has done its best to design and operate itsinspection systems to fulfil the intent of the standard.
The development of the CIGAR flaw detection system began in 1975 shortly after DHC had beendiscovered in the rolled joints of Pickering 3 & 4 pressure tubes. These defects were tight, oxidefilled, ID radial-axial thumbnail shaped cracks with a length/depth ratio of -4/1. A primaryrequirement of the system was to be able to reliably detect small (< 0.3 mm deep) DH cracks.The spot focussed probes that are now used were selected as giving the best combination of goodsignal to noise ratio and good sizing capability (originally by using dB drop techniques for lengthprofiling).
The CIGAR data acquisition system collects, evaluates and displays the information from theultrasonic system. To ensure the evaluation of all flaws having SW probe response equal to orgreater than the standard reference reflector in CAN/CSA-N285.4-94, the SW inspectionsensitivity is set 4 dB above that required to produce a 100% Full Screen Height (FSH) responsefrom the 0.15 mm deep notch. Thus, the reporting level (equivalent to the response from a 0.075

mm deep notch) is at 80% FSH. The SW responses are plotted as isometric C-scans as illustratedin Figure 1. At this sensitivity, the response from fuel bundle scratches on the bottom insidesurface is typically 10 to 20 % FSH. In general the signal to noise ratio is excellent allowing thedefinition of indications at least 20 dB below the reporting level.
Experimentally it was determined that the response from the smallest rolled joint DH cracks ofconcern could be less than the mandatory reporting criteria for volumetric flaws. Consequently,CIGAR inspection procedures require the evaluation of any indication in the rolled joint regionwith a response 8 dB below the reporting level, (ie 14 dB below the 0.15 mm notch response).
The subsequent discovery of cracked blisters confirmed the need for equally high detectionsensitivity because cracks in blisters are irregularly shaped and oriented, and tight when they aresmall, making them poor reflectors.
Experience has shown that debris damage and other open flaws have a high probability ofdetection when the reporting criteria of the CAN/CSA standard for both SW and NB probes areapplied.
2.3 Spot Focussed Versus Line Focussed Probes
Although spot focussed probes were selected for the original CIGAR SW flaw detection system,the above discussion does not exclude the use of line focussed probes, as long as the differencein sensitivity required to obtain equal response from the smallest real flaw of concern and thecalibration reflector is established, and subsequently used in setting the inspection systemsensitivity during the calibration process. In fact, line focussed probes are used in the SLAR(Spacer Location And Repositioning) blister detection system. Experience with this system hasshown that shallow flat bottomed holes (FBHs), used as corner reflectors, make better calibrationreflectors than notches, for line focussed probes, for two reasons. First, small misalignmentbetween a notch and the line focussed beam can cause substantial variations in response,rendering calibration unreliable. Second, if dimensions of the FBH are appropriately chosen, theFBH response is more comparable with that of real flaws of concern, allowing a more realisticoverall system check.
Line focussed and spot focussed probes each have their advantages and disadvantages. The mainadvantage of using line focussed probes is that a larger tube volume is covered per unit probemovement resulting in a reduction in inspection time and volume of inspection data. However,the signal to noise ratio of line focussed probes decreases as the length of the line focussed beamincreases. Signal is the response from real flaws of concern whereas noise is the integratedultrasonic response from the surrounding material (grain noise and surfaces scattering). Forexample, with a line focussed probe, the response from a long shallow scratch might equal theresponse from a short flaw of sufficient depth to be of concern. This may increase the numberof reportable indications that have to be characterized and sized, resulting in longer inspectiontime. Also, additional spot focussed probes may be required to perform adequate characterizationand sizing.

3.0 CONTACT DETECTION
The CIGAR ultrasonic SW flaw detection system, with inspection sensitivity set as describedabove, is used to detect PT/CT contact. Our experience is summarised below.
Soon after the problem of blister formation was recognized, the inspection of Zr 2.5% Nbpressure tubes was undertaken to locate spacers and to detect cracked blisters. In the tubes withspacers sufficiently displaced to produce contact, low level outside surface response was observedin the predicted contact zone, primarily with the circumferential looking SW probes, Figure 2.The response was similar in amplitude to fuel bundle scratches on the inside surface andgenerally less than the response from cracked blisters detected in Pickering 1 & 2 tubes (althoughthis is hard to quantify as discussed below).
Visual and metallographic examinations of removed Zr 2.5% Nb contacting tubes showed whiteoxide formation in the contact zone but no blister formation. Laboratory tests showed that cleanhigh pressure PT/CT contact alone was insufficient to produce the observed ultrasonic SWresponse. It is believed that the response is produced by reflection from small scratches or surfacedamage produced during relative motion of the tubes such as that which occurs due to thermalexpansion/contraction during heat-up/cool-down.
The ultrasonically detected contact length is usually found to be slightly less (50 to 150 mm)than that measured visually on removed tubes. It is postulated that this results from insufficienttime and load for contact damage to form at the ends of the contact zone. Similarly, recentlyformed, lightly loaded contacts might not be detected. Although there is insufficient data toconfirm these speculations, they should be considered when interpreting results.
4.0 CRACKED BLISTER DETECTION
4.1 CIGAR Method
Shortly after the 1983 rupture of Pickering Unit 2 pressure tube G16 was attributed to crackedblisters, the CIGAR inspection system, combined with a temporary drive (a system known asCIGARette 161), was used to inspect other Zircaloy-2 tubes in Pickering Units 1 & 2. Many tubeswere found to have PT/CT contact and large indications were detected at the contact zone,Figure 3.*£>••
This was the first in-reactor use of the CIGAR ultrasonic flaw detection system. Because therewas no previous experience with cracked blisters, "Grass Level Plus" inspection sensitivity wasemployed 111. The CIGAR SW probe sensitivity was increased until the inside surface responsefrom fuelling scratches was -40% FSH to ensure that any abnormal response above this "Grass"level (or noise as defined above) was observed. Later analysis demonstrated that "Grass LevelPlus" inspection sensitivity was quite variable, but on average not dissimilar to that currentlyused, ie 0.075 mm deep EDM notch response at 80% FSH. (Information published earlier, 111,stated that "Grass Level Plus" sensitivity was ~ 20 dB higher but later work showed that this wasprobably incorrect).

The large indications were typically above 100% FSH at scanning sensitivity and were interpretedto be cracked blisters. This was confirmed by metallography of removed tubes in many cases.Because of the very high hydrogen levels in the Pickering 1 & 2 tubes, blisters had formed atvirtually all contact points and it is not possible to say what level of the detected response wasdue to blister cracks and what was due to contact damage.
As mentioned in Section 3, low level indications have been observed at contact zones inoperating Zr 2.5% Nb pressure tubes that have been interpreted as contact damage. This hasbeen supported by hydrogen measurements from scrape samples indicating insufficient hydrogenfor blister formation and by metallography of removed tubes which showed no blister formation.In studying the mechanism of blister formation and growth, methods have been developed toproduce both cracked and uncracked blisters in specimens of Zr 2.5% Nb pressure tube /8/.Ultrasonic inspection of many of these blisters shows that blister crack responses generallyincrease with blister size but can be very variable. Because of the difficulty in defining aresponse level that clearly distinguishes between contact damage and blister cracks and thepotentially serious consequences of not identifying cracked blisters, other assessments such ashydrogen scrape analysis are used to ensure the safe operating condition of Ontario Hydro'sreactors.
Experience with both Pickering 1 & 2 blisters and laboratory blisters shows that they are detectedequally well with both circumferentially and axially oriented probes. Because the contact damageresponse is primarily detected by the circumferential probes, signal to noise ratio for crackedblister detection is better in the axial SW direction. This fact is exploited in the SLAR blisterdetection system.
4.2 SLAR Method
The SLAR system requires a rapid method of detecting the presence of cracked blisters duringa single axial pass through the pressure tube. An inspection is made before and after SLARinga channel. The pre-SLAR inspection objective is to avoid SLARing the channel if there is a highprobability that it contains cracked blisters. The post-SLAR inspection objective is to determineif previously undetected blisters have been cracked during the SLARing process.
A system was developed using three pairs of 45° SW curved line focussed probes. Each probebeam is refracted in the radial-axial direction and inspects > 20° of the tube's circumference. Thethree pairs are positioned to investigate the bottom 60° of the pressure tube, Figure 4, /10/.
Originally the intention was to use the single skip pairs in pitch-catch mode in addition to pulse-echo mode. However, the signal to noise ratio in pitch-catch mode was found to be too low forthis to be a useful method. Hence, only the pulse-echo mode is evaluated and the two probescovering the same area provide redundancy.
Originally, calibration was performed using a 6.35 mm long x 0.075 mm deep circumferentialEDM notch. It was found that a scanning sensitivity of notch + 20 dB was the highest practicalconsistent with an integrated background response of <10% FHS. With this sensitivity the

response of small blister like reflectors is approximately equal to that of a CIGAR probecalibrated at 0.075 mm notch sensitivity, (ie the line focussed SLAR probe requires 10 x the gainof a spot focussed CIGAR probe to get the same response from small reflectors). Later a 0.75mm diameter x 0.25 mm deep FBH, used as a corner reflector, was found to be a better referencereflector for the reasons stated above, Section 2.3. Because this reflector is omnidirectional,misalignment between probe and reflector is eliminated. Also, the gain required to achieve 80%FSH response from the FBH is equal to that of the notch + 20 dB. Response in a predictedcontact area that exceeds 50% FSH requires further investigation.
Probability of detection studies were carried out using tubes with a limited number of laboratorygrown blisters, /11/. As with CIGAR probes, the results showed considerable response variationwith depth and some small cracked blisters were not detected. However, because it is probablethat post-SLAR cracks, if they exist, will be more reflective and will occur in linear arrays, andbecause of the ability to compare before and after inspection results, the system is believed tobe effective in achieving its design objectives.
The SLAR system has been used in hundreds of channels in Bruce A, Gentilly 2, Pt LePreauand Pickering Unit 4 (as part of BLIP /121). Generally, signal to noise ratio has been good,Figure 5. Occasionally response is obtained at a garter spring spacer location. Sometimes, inchannels with contact, some increase in background response is observed in the contact zone, butit is usually less than a 10% FSH increase. In a number of Pickering Unit 4 tubes, very largeresponses were observed, usually at non-contact locations. They were determined to be largeareas of deposit that produced low level scattering that was integrated by the wide probe toproduce a very high response. The deposit is believed to have been left by water in the annulusduring the rolled joint leaks of 1974-75.
Very few "reportable blister indications" have been detected with this system. When they aredetected or if other factors warrant, additional inspection with the CIGAR system or otherassessments such as scraping for hydrogen measurement are required.
5.0 UNCRACKED BLISTER DETECTION
Blisters crack because the larger volume hydride develops tensile stress at the free surface whereit is free to bulge out. The blisters must reach some critical size before the stress is sufficient tocause a crack. Blisters below this size may be uncracked. A method for detecting uncrackedblisters was required to ensure that tubes known to be in contact did not contain blisters thatcould crack before the next inspection opportunity.
The system that was developed was based on two observed phenomena. First, the amplitude ofa shearwave is attenuated when it passes through an uncracked blister. Second, the time of flight(TOF) of the through transmission SW increases when it passes through a blister (cracked oruncracked).

A CIGAR probe module was developed with axial and circumferential pairs of single skip highrefracted angle (60°) SW probes, Figure 6. The probes were operated in pitch-catch mode asdescribed elsewhere /13/.
Blisters are composed of varying amounts of Zirconium hydride and Zirconium. The shearwavevelocity in Zirconium hydride is approximately 20% lower than that in pressure tube material.When the sound beam passes through a blister, the different material properties distort the beamcausing a reduction in amplitude at the receive probe. With small blisters, a single signal dropoccurs as the probe pair crosses the blister, Figure 7. With large blisters, a large amplitude dropoccurs at the edge of the blister and the amplitude rises in its centre, Figure 8.
As the beam passes through a blister, the lower shearwave velocity of the hydride causes anincrease in the TOF of the pitch-catch response. This can be most easily observed and measuredby performing a B-Scan through the centre of the blister as shown in Figure 9. The increase inTOF has been measured in many blisters of different sizes and it has been found to be linearlyrelated to the profile height of the blister above the tube surface, Figure 10. The sample containsboth large cracked blisters (Tube 29 data points) and smaller uncracked blisters (Tube 35 datapoints). The same type of response and relationship is found for both. These results show thatblister cracks are sufficiently tight and transparent to ultrasound that they do not significantlyaffect detection or TOF change with this method. Léger et al 191 have shown that the blister depthdetermined metallographically is -10 x the blister profile height, Figure 11.
This method has been used in only one inspection campaign at Pickering Unit 4 in 1991.Eighteen channels were inspected. Small reductions in amplitude were observed at most contactlocations. In one tube, the reduction was greater than 50% drop over an area -10° wide x 30 mmlong. An increased TOF was measured equivalent to a metallographic blister depth of 0.35 mm.Scrape sampling indicated the hydrogen content at the contact location was close to the blisterformation threshold. Subsequent metallography of the removed tube showed that a thin surfacelayer of hydride had formed but much less than the 0.35 mm predicted by the ultrasonic method.We speculate that the TOF increase was produced by the outside surface deposit at the contactlocation. However, the effect has not been explained or reproduced in the laboratory.Consequently, this method has not been used for further inspections.
REFERENCES
1. Kulkarni, P.G., R.G. Aggarwal and Manjit Singh. "BARCIS - A Semi-automated Tool forIn-service Inspection of Coolant Channels", IAEA Technical Committee meeting on"Exchange of Operational and Safety Experience of Pressurized Heavy Water Reactors",Bombay, India. February 20-25, 1994.
2. Based on private discussions between M.P. Dolbey and P.G. Kulkarni et. al., Bombay,March 1&2, 1994
8

3. Mair, D.H., M.D.C. Moles and M.P. Dolbey. "The Experience of Uncracked BlisterDetection in Bruce Nuclear Generating Station". IAEA Technical Committee meeting on"Exchange of Operational and Safety Experience of Pressurized Heavy Water Reactors",Bombay, India. February 20-25, 1994.
4. Dolbey, M.P. "Developments in Non-destructive Inspection Technology for CANDUReactors". IAEA Technical Committee meeting on "Exchange of Operational and SafetyExperience of Pressurized Heavy Water Reactors", Bombay, India. February 20-25,1994.
5. Lee,C.C, C.S. Tsai and X. Cheng, "Complete Characterization of Thin- and Thick-FilmMaterials Using Wideband Reflection Acoustic Microscopy". IEEE Transactions onSonics and Ultrasonics, Vol. SU-32. No. 2, March 1985.
6. Moles, M.D.C., M.P. Dolbey and K.S. Mahil. "Wet Channel Inspection Systems forCANDU Nuclear Reactors ... CIGAR and CIGARette". 5th Canadian Conference onNon Destructive Testing, Toronto, Ontario. October 28-31, 1984
7. Moles M.D.C. and M.P. Dolbey. "Grass Level Plus" Inspection For Hydride Blisters inCANDU Pressure Tubes". ASM 8th International Conference on NDE in the NuclearIndustry. Orlando, Florida, November 17-20, 1986.
8 Léger, M. and T.P. Byrne, "Hydride Blister Growth in Zr 2.5 wt% Nb Pressure TubeMaterial", Canadian Nuclear Society Twelfth Simulation Symposium on ReactorDynamics and Plant Control, Hamilton .Ontario, April 1986.
9. Léger, M. et al. "Growth, Fracture and Nondestructive Evaluation of Hydride Blisters inZr 2.5 Nb Pressure Tubes". Proceedings of Zirconium in the Nuclear Industry: 8thInternational Symposium, ASTM STP 1023, Philidelphia, 1989, pp. 50-65.
10. Donnelly, D.W. and M.D.C. Moles. "Ultrasonic Fast-Scan Blister Detection System".Canadian Nuclear Society, Annual Conference, St. John, New Brunswick, 14-18 July,1987.
11 Watson, N.J and M.D.C. Moles, "The Reliability of Cracked Blister Detection Using theSLAR Fast-Scan Ultrasonic System", OHRD Report # M88-51-K, July 5, 1988.
12. Dolbey M.P. and G.N. Jarvis, "Inspection and Monitoring of CANDU Reactor FuelChannels". Proceedings of the IAEA Specialists' meeting on Inservice Inspection ofNuclear Power Plants. Plzen, Czechoslovakia. June, 1989.
13. Dolbey, M.P. and A.L. Allen. "An Ultrasonic Method for the Detection and Sizing ofUncracked Hydride Blisters in Pressure Tubes." OHRD Report # M90-72-K. November20, 1990.

CIGARGENERAL FLAW DETECTION
bigar Data Identification
Generating StationUnit Number ;Channel :Reactor Face :Channel End :Channels Collected :
CW Full-Skip
BRUCE B
WESTINLET1 - 1 6
38 68 98 128 IS8 188 218 248 278 388 33S 3EB
Collection DateCollection TimeInspection HeadOperator NameAxial RangeScan Type"
07-MAY-9101:15:36BC6/H1EG/MH/JT7037 - 7159 mmGENERAL HELIX
CCW Full-Skip
7128
-7140
8 38 68 98 128 158 188 218 248 278 388 338 368
IB8Z
sax -
BSÏ.
78*
63/i-
562
FWD Full-Skip BACK Full-Skip
148
Reportableflaw
100% FSH302
2BX--
7148
8 38 68 98 128 ISB 188 218 248 278 388 33B 368 B 38 68 38 12B 158 18B 218 248 278 388 338 368
FIGURE 1. CIGAR shearwave flaw detection isometric C-Scan displaysshowing excellent signal to noise ratio at scanning sensitivity.
IAEA Consultants Meeting "PHWR PT Integrity". July 1994 10

21-APR-33 10:16:545077.5
o
S.S
Fuel scratch responseon the inside surfaceat bottom of the tube
Contact response onthe outside surfaceat bottom of the tube
100% FSH
0.0 ALL ID GATESA-. 4372mm
0.0 0.0 ALL 0D GATES 0. 0
FIGURE 2. Typical contact response using CIGAR shearwave probes.

TE FLftW DETECTION CIRC- SCAN PLAYBACK PROGRAM M -J/QN-84-OPERAÏOR: m 1 NS/NEUSOME^SCOT . PICKERING GSA - UNIT 1 - CHANNEL F-
Ia'»
(n3.
Fuel scratch responseon the inside surfaceat bottom of the tube
Cracked blister responseon the outside surfaceat bottom of the tube
--•'-••—•-•—"••-3 .-—••:.-~i ; r r — - -•*••--—•-— •- • - • - I - . • • ' - • - • : • . - . - I . . - • . . . . - . • . - . • ^ • • . - . . . • . • •
, - \ » — . - — • . I V .- .---—... —••'—..*--_ _ t"i i'. - • — \
•..•„-..'
100% FSH
160, y A U . ID CHANNELS
. . — . T - . _ - - . - _ _ • • - • ! . . - _ . - . . . . • . • _ - • V - - — • • - — - • •
—. ....
IC^J^:.^J"LJX.,-^ZI~::7~.SZ^~^IC^ I :
f-iLL 01? C I - : M j l f i . ':-
FIGURE 3. Cracked blister response in Pickering Unit 1 Zircalloy pressuretube using CIGAR shearwave probes.
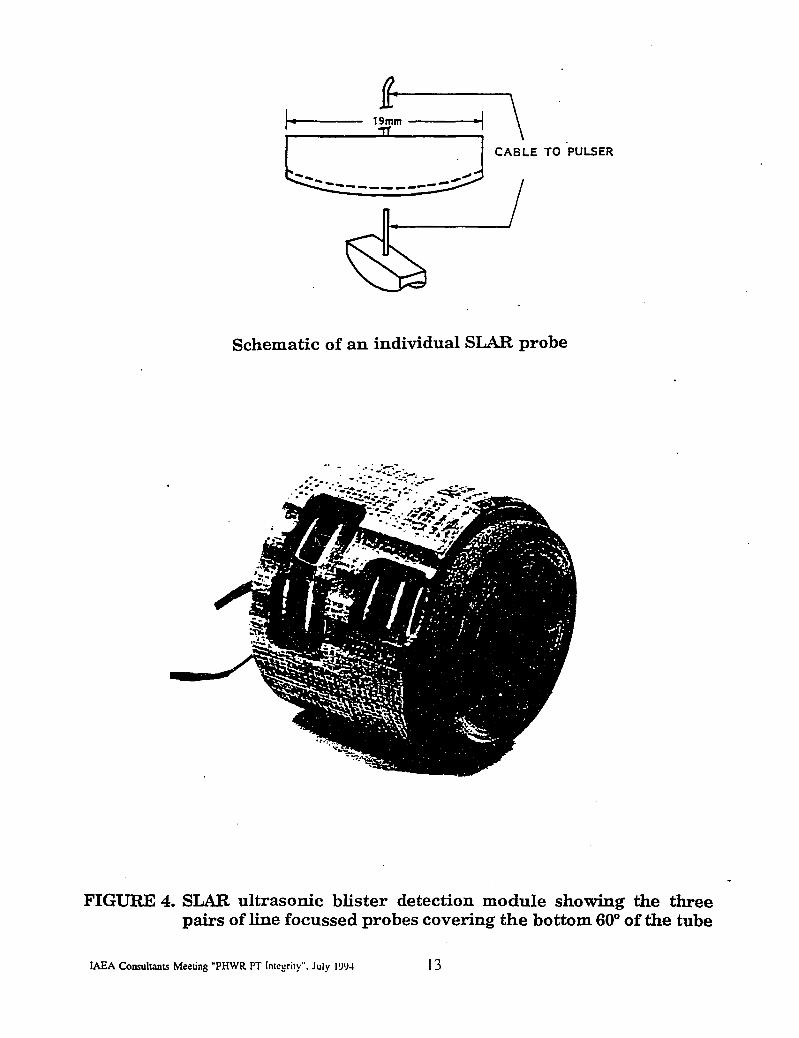
19mmTT
CABLE TO PULSER
Schematic of an individual SLAR probe
FIGURE 4. SLAR ultrasonic blister detection module showing the threepairs of Une focussed probes covering the bottom 60° of the tube
IAEA Consultants Meeting "PHWR PT Integrity". July 1994 13

SLfiR BLISTER DETECTIONSTflTIONJ BRUCER UNIT * : * CHflNMELî BIO FfiCEï U PfiSS «s 7TOOL «: NK3-TL6 THRESHOLD: 50* F Ï L E Î BtO7O2.BF.H- 13:43 25-03-93
CHflN 3c 26dBB
CHflll 5 "1
S 3*fdB r
CHflM 1C 16d8
670 1130 1590 2050 2510
30*
38S9 H3H9 H809 5269SUM [_
FiHîftL P0SIT1D» <:ram> TOOL ROTOTIOM = (Meg
I
I
FIGURE 5. Typical SLAR blister detection scan output showing generallygood signal to noise ratio. A higher response is observed in thecontact zone.
IAEA Consultants Meeting "PHWR PT Integrity". July 1994 14

Common NB Probe forCharacterization
Circumferential Pair Axial Pair
Probe configuration
• ..••-;.r'-iim
FIGURE 6. CIGAR uncracked blister detection module
IAEA Consultants Meeting "PHWR PT Imogriiy". July IW4 15

N o t e s : UCBD CIRCUMFERENTIAL PROBE PAIR. TUBE 3 5 , BLISTER 1 6 . 12 DB
7.000
y
JiOCH
ÛJDOÛ-Oi)00
i
5i)00 X(degrees)
taooo
100°/=
- Q°<
FIGURE 7. Circumferential probe UCBD C-Scan over a small blistershowing typical circular amplitude drop pattern
IAEA Consultants Meeting "PHWR PT Integrity". July 1994 . 16

N o t e s : UCBD CIRCUMFERENTIAL PROBE PAIR. TUBE 3 5 , BLISTER 4 . 12 DB
7.0W)
*
3.500 J
0J)ûû-L0J)00 5i)00 X
(degrees)
10.000
100%
h o%
FIGURE 8. Circumferential probe UCBD C-Scan over a large blister showingraised centre in circular amplitude drop pattern
IAEA Consultants Meeting "PHWR PT Integrity". July 1994 17

N o t e s : UCBD CIRCUMFERENTIAL PROBE PAIR. TUBE 3 5 , BLISTER 4 . 12 DB.
OJJOO-,37.850
-T-.+100°/c
-0%
-100°'c
38.100 38.360
FIGURE 9. Circumferential probe UCBD B-Scan across the centre of theblister shown in Figure 8. The increased time of flight throughthe blister is clearly seen.
IAEA Consultants Meeting "PHWR PT Integrity". July 1994 18

0.1
Increase in Time of Right (jis)
0.2
• Blisters in Tube #35 Uncrackedo Blisters in Tube #29 Most Cracked• Blisters in Tube #35 Ground Hush to Surface
Figure 10. Blister profile height vs increased time of flight withcircumferential UCBD measurements.
IAEA Consultants Meeting "PHWR PT Integrity", July 1994 19

100 -
80 -
~ 60 Ha»
SS 40 "
20 "
+ Air - Jet Blisters
• Loop Blisters
"i 1 i—1.0 1.2
Blister Depth (mm)
Figure 11. This illustrates the relationship found between profile heightand blister depth determined metallograpldcally.
(From Reference 9)
III
IAEA Consultants Meeting "PHWR PT Integrity". July 1994 20

10. OPERATING ENVELOPE TO MINIMIZE PROBABILITYOF FRACTURES IN ZIRCALOY-2 PRESSURE TUBES
N. Azer and H. Wong (AECL-CANDU)

OPERATING ENVELOPE TO MINIMIZE PROBABILITY OF FRACTURE IN
ZIRCALOY-2 PRESSURE TUBES
N. Azer and H. Wong
1.0 INTRODUCTIONThe failure mode of primary concern with CANDU pressure tubes is fast fracture of a through-wall axial crack, resulting from delayed hydride crack growth. This paper demonstrates theapplication of operating envelopes to minimize the probability of fracture in Zircaloy-2 pressuretubes based on Zr-2.5%Nb pressure tube experience. The technical basis for the development ofthe operating envelopes is also summarized.
The operating envelope represents an area on the pressure versus temperature diagram withinwhich the reactor may be operated without undue concern for pressure tube fracture. Theenvelopes presented address both normal operating conditions and the condition where a pressuretube leak has been detected. The examples in this paper are prepared to illustrate themethodology, and are not intended to be directly applicable to the operation of any specificreactor.
Typically, other limits are also imposed on the operating envelope related to: calandria tubeintegrity considerations; heat transport system related equipment and component; and safetyshutdown systems. These are not considered in the present analysis.
2.0 TECHNICAL BASIS
2.1 Background
Deuterium is absorbed by the pressure tube during operation and, under certain conditions, canhave a deleterious effect on fracture toughness. When the solubility for hydrogen isotopes isexceeded, hydrogen precipitates as platelets of low-toughness zirconium hydride. The fracturetoughness of zirconium alloy pressure tube material is known to be reduced by the presence ofprecipitated hydride if present in sufficient concentration. Radial hydrides are oriented normalto the applied circumferential stress and have a more significant effect than circumferentialhydrides.
If Delayed Hydride Cracking (DHC) occurs, it could lead to wall penetration and leakage. Furtheraxial growth of the crack by DHC may lead to rupture. Fast fracture would occur when the cracklength exceeded the critical crack length (CCL). It is judicious therefore, to operate the heattransport system (HTS) within limits which will ensure the stability of postulated or detectedDHC flaws in the pressure tubes.
For normal operating conditions, the limits imposed by the operating envelope are intended toaccommodate any generic reduction in pressure tube fracture properties brought about by service.This is done by demonstrating the stability of a postulated flaw.

For the case of a growing DHC flaw in which a pressure tube leak is detected, the operatingenvelope must be applied to ensure that the reactor is shutdown and depressurized withoutpressure tube rupture, thus ensuring Leak Before Break (LBB).
2.2 Flaw Stability
The stability of a through-wall flaw is determined by its axial length, the coolant pressure andtemperature at the flaw, and the material properties and dimensions of the pressure tube. Thecritical crack length (CCL) at which a flaw becomes unstable is given by:
c = K^% [eqn.l]
8af2ln[ sec (7cMah/2af)]
where: c is half of the CCL in [m]
Kc is the critical stress intensity factor in [MPaVm]
cf is the flow stress in [MPa]
oh is the applied hoop stress including pressure on the crack face in [MPa] definedby: ah=P(w+ri)/w, where r; is the inside radius of the pressure tube in [m]
M is the bulging factor defined by: M = [l+1.255c2/(rmw)-0.0135c4/(rmw)2)]1/2
rm is the mean radius of the pressure tube in [m]
w is the wall thickness of the pressure tube in [m]
2.3 Operating Envelope Calculations
For an operating pressure, Po, a postulated flaw must be demonstrated to be stable at a higherpressure, Ps, such that:
Po = P/N.
N is the margin on pressure for a given operating condition and is specified as follows:
N = 1.5 For Service Levels A and B, excluding shutdown states, e.g. for full poweroperation.
N = 1.3 For Service Level A and B shutdown states, e.g. for warmup andcooldown conditions.
N = 1.0 For Service Levels C and D, e.g. for leaking pressure tube conditions.

For Service Level A and B shutdown states, the maximum system pressure (accumulationpressure) is limited by the over-pressure protection system to approximately 1.2 times thenominal inlet operating pressure. Use of a value of N = 1.3 for operating pressures which are lessthan the nominal operating pressure exceeds the implicit margin of 1.2 on the nominal operatingpressure. The relatively low margin is based on the reactor being at zero power in the shutdownstate.
For Service Levels A and B, excluding shutdown states, the higher margin of N = 1.5 is usedin view of the fact that the reactor is at power and that this condition exists over extendedperiods of time. The margin of 1.5 is also consistent with the requirements of ASME Sectionm, NB-3228, which allows a margin of 1.5 on load provided that the full plastic limit behaviourof the structure is included in the stress analysis.
For Service Levels C and D, the lower margin of N = 1.0 is used in view of the low probabilityof a Service Level C or D event occurring. The margin of 1.0 is also consistent with the ASMESection XI criteria for reactor vessels with low upper shelf fracture toughness.
Equation 1 can be used to calculate a locus of HTS pressure versus temperature points at whicha postulated flaw would be considered stable, for a particular value of N. The locus of pointsforms a curve known as the flaw line, which represents an upper bound for the operatingenvelope. As long as the HTS condition of pressure and temperature remains at or below the flawline, the postulated flaw will remain stable.
Equation 1 defines the allowable operating pressure, P o , as:
Po = (l/N){w/(w+r,)} 2Of ArccostexpfrK^/Scaf2)}"1 [eqn 2]JCM
2.3.1 Normal Operation
Under normal operating conditions where no pressure tube leakage is occurring, a flaw ispostulated to exist. To minimize the probability of instability, a conservative value for thepostulated flaw length is used corresponding to the penetration length associated with the onsetof leakage.
2.3.2 Leaking Pressure Tube
Under conditions of a leaking pressure tube, the operating envelope may be established such thatLBB is assured. Assuring LBB involves demonstration that the leak detection mechanisms inconjunction with station operating procedures will provide the operator with sufficient warningtime to shutdown, cooldown and depressurize the reactor such that the CCL is never reached atany point in the shutdown sequence. The growth of a through-wall DHC crack is modeledthroughout the sequence of events, starting with the onset of leakage and ending with the reactorbeing placed in the cold, depressurized state. The basic analytical parameters are: the initial cracklength at penetration; the Delayed Hydride Cracking Velocity (DHCV); the leak rate versus crack

size relationship; and the CCL. It must be demonstrated that the calculated crack length is lessthan the CCL at each point in the pressure/temperature shutdown path.
The events of the shutdown sequence and their timing are dictated by specific station moistureresponse characteristics, operating conditions and operating/shutdown procedures.
In the absence of specific station information, general operating envelopes may be developedwhich will ensure LBB for a potential pressure versus temperature shutdown path. The envelopesare based on an assumed time from crack penetration to reactor shutdown which is taken togovern the final crack length at shutdown, L:
L = Lp + 2*DHCV*t (Assuming double-ended crack growth)
where:
Lp = the penetration crack lengthDHCV = the DHC velocityt = the total time from crack penetration to reactor shutdown.
LBB will be assured if the reactor is shutdown using the pressure versus temperature envelopedefined by the flaw line corresponding to the assumed time, t.
3.0 OPERATING ENVELOPES FOR ZIRCALOY-2 PRESSURE TUBES
The operating envelopes developed are based on 80 mm diameter Zircaloy-2 pressure tubes.
3.1 Pressure Tube Dimensions
Assumed pressure tube dimensions include corrosion and wear allowances specified for DouglasPoint. Diametral creep has not been accounted for. The dimensions used are as follows:
Specified Minimum Wall Thickness = 0.155 inCorrosion Allowance = 0.001 inWear Allowance = 0.002 inMinimum Wall Thickness for analysis, w = 0.152 in
= 3.86 mm
Maximum Inside Radius for analysis(Including Corrosion and Wear), r; = 1.635 in
= 41.53 mm

3.2 Penetration Crack Length
A bounding value for the crack length at penetration of a DHC crack initiated from a single pointsource in Zr-2.5%Nb pressure tubes is Lp = 20 mm. This value is assumed to also apply toZircaloy-2 pressure tubes in the present analysis.
The penetration length of 20 mm would not be valid for a flaw resulting from other initiationmechanisms. For example, a flaw initiated from multiple adjacent points, such as a row ofblisters, would be expected to have a significantly longer penetration length, as encountered withthe Pickering G16 experience.
3.3 Material Properties
Mechanical property and fracture toughness data for irradiated Zircaloy-2 pressure tubes areestablished from [1] which reports on two tubes removed from NPD. Pressure tubes G07 and F08had been irradiated to fast neutron fluences (E > 1 MeV) of 4.5 x 1025 n/m2 and 6.6 x 1025 n/m2
respectively. Measurements indicated maximum deuterium concentrations of 0.8 at% deuterium(178 ppm D) and 1.9 at% deuterium (427 ppm D) respectively.
Tube F08 showed a consistently lower toughness than tube G07, primarily due to its higherdeuterium concentration. Lower bound lines were applied to each of the data sets and used foranalysis purposes.
The flow stress was taken to be the reported transverse ultimate tensile strength.
DHCV is influenced by several factors including fluence and temperature. Axial DHCV resultsare available for unirradiated Zircaloy-2 material. Studies have demonstrated that neutronirradiation increases DHCV in Zr-2.5%Nb pressure tube material. At temperatures above 240°Cthe difference between the upper bounds for irradiated and unirradiated material is a factor of 2to 4. In the absence of results for irradiated Zircaloy-2, a factor of 3 was used to estimate DHCVfor irradiated material from the upper bound for unirradiated material:
Estimate for Irradiated Zircalov-2 Pressure Tubes:@ Inlet (T = 250°C) DHCV = 0.117 mm/hr@ Outlet (T = 300°C) DHCV = 0.360 mm/hr
3.4 Operating Envelope for Normal Operation
The operating envelopes for normal operating conditions are calculated assuming the existenceof a 20 mm long crack, that is treated as through-wall.

Two operating envelopes are calculated based on equation 2 and are shown in Figures 1 and 2.The envelope shown in Figure 1 assumes a fracture toughness associated with the lower boundline for pressure tube G07 and the envelope shown in Figure 2 assumes a fracture toughnessassociated with the lower bound line for pressure tube F08. In each case, the envelope is shownfor values of N of 1.3, and 1.5.
3.5 Operating Envelope for Leaking Pressure Tube
The operating envelopes to assure LBB during shutdown for a leaking pressure tube conditionare calculated assuming the existence of through-wall crack with a penetration crack length of20 mm.
Two sets of envelopes are calculated based on equation 2 and are shown in Figures 3 and 4. Theenvelopes in Figure 3 are based on inlet end conditions (250 °C, 10.5 MPa) and the envelopesin Figure 4 are based on outlet end conditions (300°C, 9.71 MPa). Each figure consists of flawlines corresponding to different times, t, for the interval between crack penetration and shutdownand depressurization. In each case the fracture toughness of pressure tube G07 is assumed andthe envelope is based on a value of N of 1.0.
4.0 DISCUSSION
The analysis-presented assumes the penetration crack length of 20 mm associated with a DHCflaw initiated from single point. The analysis would not be valid for a flaw resulting from otherinitiation mechanisms, such as a row of blisters, which would result in a longer penetrationlength. This is apparent from Figure 3 in which a crack having a penetration length greater thanapproximately 46 mm would not be stable at inlet conditions (250°C, 10.5 MPa).
The envelopes in the figures are based on the conditions of pressure and temperature at thelocation of the postulated flaw in the pressure tube. The differences in pressure and temperaturebetween the postulated flaw location and the reactor outlet header must be applied to the curvesin the figures to establish the operating limits in terms of the reactor outlet header conditionsbecause these are the ones on which reactor control is based.
Normal OperationAn assumption that the flaw is located at the inlet end of the pressure tube would be boundingfor all other possible pressure tube locations since the pressure is highest and the temperature islowest at this location resulting in the minimum CCL values.
The fracture toughness of Zircaloy-2 pressure tube material is known to be reduced by fluenceand the presence of sufficient amounts of precipitated hydrides. A sharp brittle-ductile fracturetransition can occur at temperatures above 200°C, the transition temperature increasing withincreasing hydrogen concentration [2] [3]. This effect is apparent when comparing the envelopesdeveloped based on toughness data from pressure tube G07 with 0.8 at% D (Figure 1) andpressure tube F08 with 1.9 at% D (Figure 2). Based on Figure 1, an inlet temperature of at least

160°C should be reached prior to achieving a full inlet operating pressure of 10.48 MPa. If thepressure tube properties associated with Figure 2 are assumed, an inlet temperature of about250 °C must first be reached.
Leaking Pressure Tube ConditionsThe envelopes may be applied as illustrated in the following example. For a pressure tube flawat the outlet end, and an assumed time from crack penetration to shutdown and depressurizationof 16 hours, the maximum flaw length associated with outlet temperature flaw growth over thisperiod is about 55 mm (see Figure 4). If the shutdown is carried out along a path whichmaintains the outlet end conditions below the 16 hour flaw line in Figure 4, the CCL will not beexceeded and LBB is assured.
Despite the fact that CCLs are longer for outlet end conditions, this end is more limiting than theinlet end in terms of the time available to detect a leak and depressurize the reactor. This isapparent by comparing inlet and outlet flaw lines in Figures 3 and 4 prepared for the same time,t = 10 hours. The outlet flaw line corresponds to a significantly longer crack length than the inletflaw line (42 mm versus 27 mm) which more than offsets the lower operating pressure andhigher toughness associated with outlet conditions. The greater outlet crack growth for a giventime is in turn due to the fact that the outlet DHCV is taken to be about three times the inletDHCV in this analysis.
These envelopes are based on the final crack length at the time of depressurization which isassumed to be achieved at either the steady inlet or outlet temperature. In actual practice, as thereactor is cooled during shutdown, the DHCV will be reduced resulting in a shorter crack fortimes after the first cooldown step. Similarly, the full initial inlet or outlet pressure is applied tothis final crack length where as the reduction in pressure during an actual shutdown processwould increase the CCL. These factors are normally accounted for in conventional, deterministicLBB analysis, which examines crack length and CCL as a function of prevailing conditions atincremental time steps.
5.0 SUMMARY
The application of operating envelopes to minimize the probability of fracture in 80 mm diameterZircaloy-2 pressure tubes has been discussed. Both normal operating and leaking pressure tubeconditions have been considered. The envelopes presented are for demonstrative purposes only,and are not intended to be directly applicable to the operation of any specific reactor.
As long as the HTS condition of pressure and temperature remains at or below the flaw line andthe assumed crack length at penetration is not exceeded, the postulated flaw will remain stable.

REFERENCES
1. Coleman, CE., Cheadle, B.A., Causey, A.R., Chow, P.C.K., Davies, P.H., McManus,M.D., Rodgers, D.K., Sagat, S., and van Drunen, G., "Evaluation of Zircaloy-2 PressureTubes from NPD", ASTM STP 1023, 1989, pp. 35-39.(AECL-9966)
2. Davies, P.H. and Stearns, C.P., "Fracture Toughness Testing of Zircaloy-2 PressureTube Material with Radial Hydrides using D. C. Potential Drop", ASTM STP 905,1986, p. 379.
3. Simpson, L.A. and Chow, C.K., "Effect of Metallurgical Variables on the FractureToughness of Zirconium Alloy Pressure Tubes", ASTM STP 939, 1987, p.585.

25.00
20.00
IS 15.00CL
10.00
5.00
0.00
0
Fig. 1 : Pressure Temperature Envelope for Normal Operation(Kc based on iower bound for PT G07 data: 4.5 X 10E25 n/m~2: 0.8 at% D)
-
-
. •S-—-
s'
s
i > i 1 1
N = 1.:
N = 1.£
25 50 75 100 125 150 175 200 225 250 275 300 325
Temperature [deg. C]
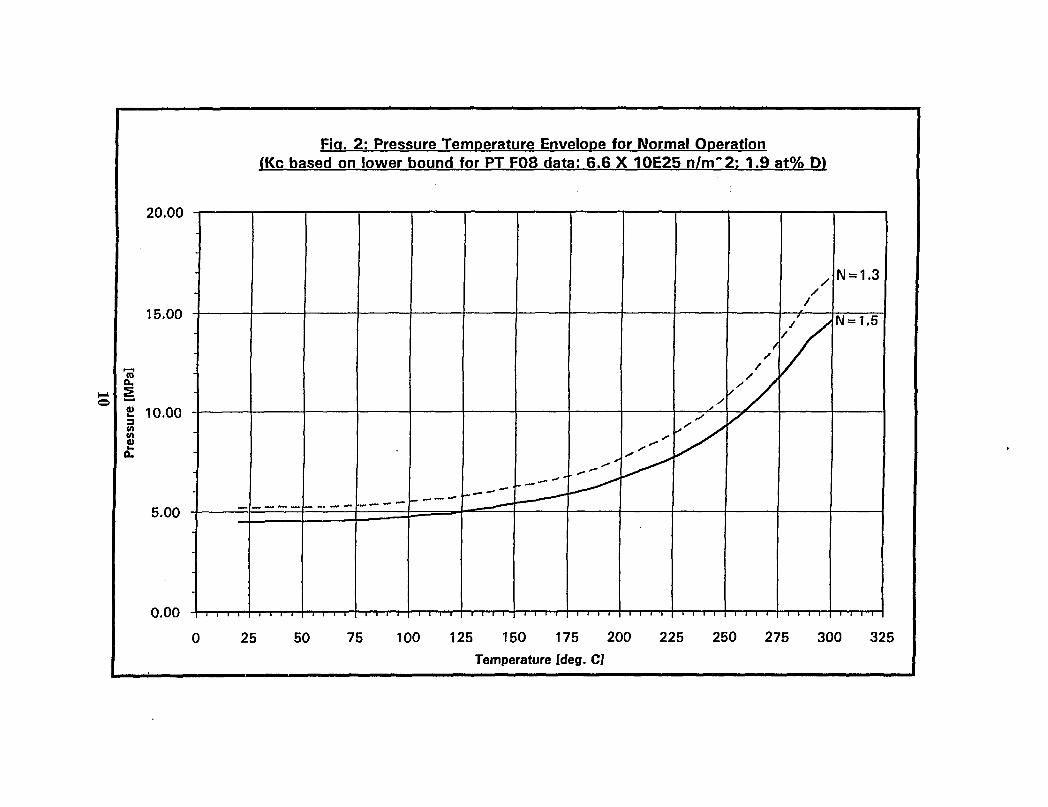
Fig. 2: Pressure Temperature Envelope for Normal Operation(Kc based on lower bound for PT F08 data: 6.6 X 10E25 n/nT2; 1.9 at% D)
20.00
15.00
£ 10.00V)<A0)
5.00 -
0.00
_——— " • "• —
. — — -
* •
/y Y
0 25 50 75 100 125 150 175 200 225 250 275 300 325
Temperature [deg. C]

Fig. 3: Pressure Temperature Envelope for Leakinq Pressure Tube(inlet End Flaws)
15.00
10.00
toa.2a>3CO0)
5.00
0.00
Flaw I engthat Shutdpwn [mm]
• t = 10 hrs- Inlet Flaw
t=20 hrs- Inlet Flaw
t=35 hrs- Inlet Flaw
lote: t = time from crack penetration to shutdown
25 50 75 100 125 150
Temperature [deg. C]
175 200 225 250

Fig. 4: Pressure Temperature Envelope for Leaking Pressure Tube(Outlet End Flaws)
15.00
10.00
Q.
5.00
0.00
Fl »w Lengt
t = 6 hrs- Outlet Flaw
t=1O hrs - Outlet Flaw
-• t = 16 hrs - Outlet Flaw
Note t = time from crack penetration to shutdown
25 50 75 100 125 150 175 200 225 250 275 300
Temperature [cleg. C]

11. WORKED EXAMPLES AND DISCUSSION
T.P. Byrne (OH Technologies) andH. Wong (AECL-CANDU)
RECORD: (H:\WPnArA\PKICSJFCHB-ZR2JT93-0&09

WORKED EXAMPLES - BLISTER GROWTH METHODOLOGIES
T.P. Byrne & H.Wong
Worked examples, regarding blister growth methodologies, were prepared and presented. Theseexamples were intended to explain and demonstrate the various concepts that are required tounderstand the phenomena associated with blister growth in CANDU Zr-2 pressure tubes. Thepresentation at the meeting in Vienna consisted of a large number of overheads (64) that wereaddressed through accompanying discussion. This paper is simply a summary of some of theconcepts that were discussed together with a selection of overheads used to support thediscussion. Some consolidation of overheads has been made in order to reduce the length of thissummary.
The concepts of equilibrium concentration distribution and the hysteresis in the terminal solidsolubility are used to demonstrate blister formation threshold, limiting blister size, the ratchettingof hydrogen to the cold spot due to thermal cycles, the shape of the two phase zone and thedissolution of blisters under changes in power level and SLAR.
The results of computer runs, showing worked parametric examples, are then presented. Theseexamples show the application of the previously-presented concepts to better understand thevarious phenomena that are observed during reactor blister assessments.

OOIXJ
I
sa
£G
70
S3
53
BU.LK
TSSP
— - - T S S D
Distance Through Wall (mm)
Figure 1: This figure illustrates the concepts of Blister Formation Threshold (BFT) andMaximum Blister Size. The TSSP and TSSD curves are dependent upon thetemperature distribution through the wall and hydrogen solubility in Zircaloy /I/ .Curves A,B and C show the equilibrium distributions of hydrogen in solution inthe temperature field for increasing bulk concentrations of hydrogen. Curve Aillustrates a case in which no blister will grow because at the coldest location(0 mm) the concentration in solution does not exceed TSSP. Curve B shows acase in which the concentration at the cold spot equals the TSSP. This conditiondefines the BFT, which is the concentration in the bulk of the tube ( in this caseat the 4mm point) that produces this condition. Curve C shows a case in whichBFT is exceeded. In this case, the equilibrium can be achieved only when ablister has grown to a depth of point D which is the intersection of the equilibriumconcentration distribution with the TSSP curve. This point defines the MaximumBlister Size. Since the TSS curves are defined by the temperature distributions,it is easy to see that reduced temperatures, such as those produced by hot shutdown conditions or reduced power operation, will shift the TSS curves downwardand can produce situations in which the BFT is exceeded for the period duringwhich these temperature reductions occur.
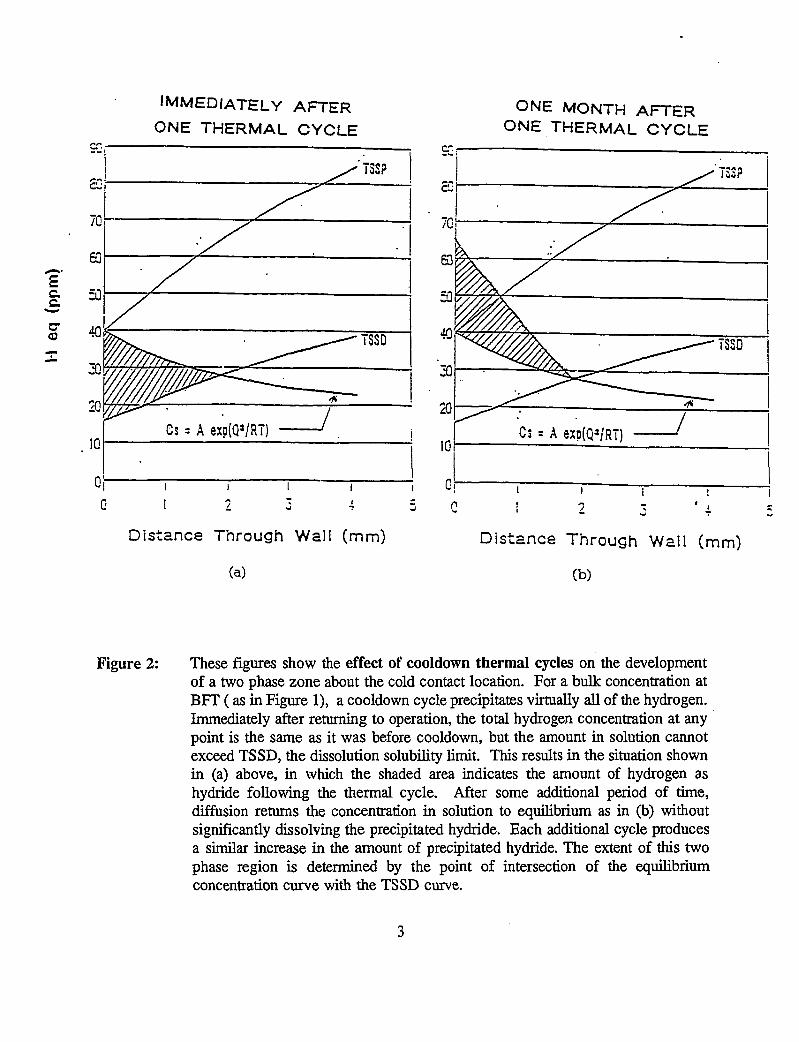
IMMEDIATELY AFTERONE THERMAL CYCLE
ONE MONTH AFTERONE THERMAL CYCLE
3
<0
Distance Through Wall (mm)
(a)
Distance Through Wall (mm)
(b)
Figure 2: These figures show the effect of cooldown thermal cycles on the developmentof a two phase zone about the cold contact location. For a bulk concentration atBFT ( as in Figure 1), a cooldown cycle precipitates virtually all of the hydrogen.Immediately after returning to operation, the total hydrogen concentration at anypoint is the same as it was before cooldown, but the amount in solution cannotexceed TSSD, the dissolution solubility limit. This results in the situation shownin (a) above, in which the shaded area indicates the amount of hydrogen ashydride following the thermal cycle. After some additional period of time,diffusion returns the concentration in solution to equilibrium as in (b) withoutsignificantly dissolving the precipitated hydride. Each additional cycle producesa similar increase in the amount of precipitated hydride. The extent of this twophase region is determined by the point of intersection of the equilibriumconcentration curve with the TSSD curve.

[H]equ.
(ppm)
TSSP
I DISSOLUTION (CHANGE IN POWER)
LOCATION
Figure 3: Blister dissolution can occur if the TSSD at the blister boundary exceeds thelocal concentration in equilibrium with the bulk concentration at the nominal tubetemperature. This is illustrated simply in the above schematic figure. In thisfigure, an existing blister (shown by the shaded region) in a temperature gradient(reflected in the TSS curves) grows when the concentration in the bulk exceedsthe curve labelled growth. The blister dissolves when the concentration in thebulk is less than the lower curve labelled dissolution. The large gap between theseconcentrations means that once blisters have grown in reactor under anyconditions (e.g. hot shutdown), they do not dissolve on returning to power becauseTSSD cannot be sufficiently increased. However, if the contact is removed, then,the TSSD curve increases to the far field level as indicated by the dashedhorizontal line, and as long as the bulk concentration is below TSSD, thendissolution will occur.

NO CYCLES
DEPTH
Figure 4: A discussion on the effects of thermal cycling on blister growth is summarizedin this figure which compares expected blister growth behaviour with and withoutthermal cycles. Since the blister depth is the equivalent depth nd includes the twophase zone caused by the ratchetting effect described in Figui , the depth for thethermally cycled case lies above that for the constant temperature field case at thelow concentrations. However, when the bulk concentration in the tube reachesTSSD for the nominal pressure tube temperature, then the thermal cycles have theeffect of reducing the blister growth rate relative to the steady case. This occursbecause each thermal cycle resets the bulk concentration in solution to TSSDwhereas without thermal cycles the bulk concentration in solution is free toincrease until TSSP is reached. Since one driving force for blister growth is theconcentration in solution, cycling has the effect of decreasing the average drivingforce and hence the blister growth rate. Another minor effect which also reducesthe growth rate is the fact that the precipitated hydride, produced under thermalcycling, reduces the volume fraction of material available for diffusion.

0.5
0.4
& 0.3
8-aI 0.2
0.1
0
1000 1500 2000
Time After Blister Initiation (days)
2500 3000
' Early Contact• Contait When Cone=30 ppm• Contact When Cone=40 ppm
0 10 20 30 40 50 60 70 80 90 100 110 120
Bulk Concentration (ppm)
Outlet Blister Growth Comparisons (PUR = 6 ppm/hot year)(Various Contact Times)
Figure 5: This figure shows the effects of late contact on blister growth. ( This waspresented following a discussion of the blister growth curves for the early contactsituation shown in /I/ . Late contact implies that the BFT has been exceededbefore the pressure tube to calandria tube contact occurs. The figure abovepresents the results for a single pickup rate ( 6 ppm Heq per year) and comparesresults for two late contact cases with the early contact case. These curves showthat in late contact cases, the blister rapidly grows to the size that it would havereached if contact had existed all along. This is shown in both time andconcentration space. Therefore, the early contact assumption provides aconservative prediction of blister size. Results were presented for different pickuprates and showed that the effect of pick up rate on growth was reduced as theconcentration at the time of contact increased.

0.5
•S
Ë
0.4 -
0.3
0.2
0.1
0
1000 1500 2000
Tune (days)
2500 3000
— — PUR = lppm/fiot yearp p y
^ = 6 ppm/hot yeare<- - PUR = 10 ppm/hot year
PUR = 20 ppm/hot yearPUR=40 ppm/hot year
0 10 20 30 40 50 60 70 80 90 100 110 120
Bulk Concentration (ppm)
Blister Growth During Quarantine (Ink Bulk Cone = 11.8 ppm (Quar BFT))
Figure 6: This figure illustrates the expected blister growth for different pickup rates ina thermal field similar to the case of a RAPPS channel under quarantine. Thisdoes not represent a likely case but is useful for comparison with the blistergrowth shown in / I / for the inlet and outlet ends.

0.5
0.4
Ije
ibin
0.3
0.1
500 1000 1500 2000
Time After Blister Initiation (days)
2500 3000
1 Inlet (PHT=250C)•Outlet (PHT=290Q• Quarantine {PffT=250C)
10 20 30 40 50 60 70 80 90 100 110 120
Bulk Concentration (ppm)
Blister Growth Comparisons (PUR = 1 ppm/hot year)(Initial Bulk Concentration = 22 ppm)
Figure 7: This figure compares blister growth behaviour for a pick up rate of 1 ppm perhot year for a channel which is quarantined when the bulk concentration is 22ppm. This concentration corresponds to BFT at the inlet of a RAPPS channel.Blister growth under quarantine is compared with the growth expected at the inletoutlet in a contacting channel that is not quarantined. Note that time in the upperfigure is measured from the time of blister initiation and this occurs later in actualtime for an outlet contact starting with 22 ppm. It is clear that quarantining resultsin larger blisters than no quarantining.

0.5
0.4 -
0.3
&Q
- 02S3m
0.1
0
1000 1500 2000
Time After Blister Initiation (days)
2500 3000
I I
Inlet (PHT=250C)Outlet (PffT=290C)Quarantine (PHT=250 C)
0 10 20 30 40 50 60 70 80 90 100 110 120
Bulk Concentration (ppm)
Blister Growth Comparisons (PUR = 6 ppm/hot year)(Initial Bulk Concentration = 22 ppm)
Figure 8: This figure is similar to Figure 7 except that the pickup rate is assumed to be6 ppm per hot year. Again quarantining is initially worse and then the results arequite close.

100
o
sg£oU
tI
90 h
80 h
I 70
60
50
10
0
T i i i i i i r î i i i T i ^ ! i i n^ i i i i l i i n i i i i i
PUR=similar to P2-G16PUR=L25*P2-G16PUR
1 i i I
0 500 1000 1500 2000 2500 3000 3500 4000
Time (days)
Figure 9: Several cases were examined to show the expected blister growth rate in aRAPPS channel if it were to exhibit the same pickup rate as that of Pickering 2Channel G-16 at the location of the rupture initiation. Two pickup rate scenariosare chosen - the Pickering case and a case of higher pickup which would resultfrom a surface ilux of hydrogen the same as G-16 but in the thinner-walledRAPPS tube!
10

0.8
0.7
0.6
I 0.5
.1 0.3CQ
0.2
0.1
0
500 1000 1500 2000 2500 3000 3500 4000
Time (days)
PUR=similar to P2-G16PUR= 1.25 *P2-G16 PUR
0 10 20 30 40 50 60 70 80 90 100 110 120
Bulk Concentration (ppm)
Blister Growth at Fuel Channel Outlet (PHT = 290 C)(Early PT/CT Contact - Variable PUR)
Figure 10: This shows blister growth for the two different pickup rate scenarios of Figure9 applied to an outlet contact in a RAPPS channel. Blister growth occurs soonerwith the higher pick up rate. The differences in blister growth in concentrationspace are small because the pick up rates are so high.
11

0 500 1000 1500 2000 2500 3000 3500 4000
Time (days)
0.8
0.7 r
0.6 -
I 0.5
M 0.309
0.2
0.1
0
PHT=290CPHT=250C
0 10 20 30 40 50 60 70 80 90 100 110 120
Bulk Concentration (ppm)
Blister Growth (PUR = 1.25 * P2-G16 PUR)(Early PT/CT Contact)
Figure 11: This figure compares the blister growth rates at the inlet and outlet of RAPPSchannels for the case of the high pickup rate from Figure 9. It is useful to recallthat some channel inlet end contacts in Pickering exhibited levels of deuterium ashigh as those at the rupture initiation point of G-16.
12

0.8
0.7
0.6
0.5
0.4
0.3
0.2
0.1
0
1000 1500 2000 2500 3000 3500 4000
Time (days)
Normal Operation (PHT=290 C)Quarantine When Bulk Cone = 19.9 ppmQuarantine When Bulk Cone=24.9 ppm
0 10 20 30 40 50 60 70 80 90 100 110 120
Bulk Concentration (ppm)
Effect of Quarantine on Blister Growth(Early PT/CT Contact - Variable PUR on Quarantine)
Figure 12: Blister growth is shown for the variable pickup case for an outlet contact. Thethree cases compare quarantining occurring at two different bulk concentrations(19.9 and 24.9 ppm) with a tube which is not quarantined. Pickup is assumed tocontinue at the unquarantined rate. Quarantining is seen to be initially worsealthough the final blister sizes at 3500 days are smaller in both quarantined case.
13

500 1000 1500 2000 2500 3000 3500 4000
Time (days) .
0.8
0.7 r
0.6
I
Dep
thB
liste
r
0.5
0.4
0.3
0.2
0.1
0
Normal Operation (PHT=290 C)Quarantine When Bulk Cone = 19.9 ppmQuarantine When Bulk Cone=24.9 ppm
0 10 20 30 40 50 60 70 80 90 100 110 120
Bulk Concentration (ppm)
Effect of Quarantine on Blister Growth(Early PT/CT Contact - Quarantine PUR = 2.02* 1.25 ppm/yr)
Figure 13: These blister growth cases are similar to those of Figure 12 except that thepickup rate during quarantining is assumed to be 2.5 ppm per year. Quarantiningis again initially worse but final blister sizes are smaller in the quarantined case.
14

SUMMARY:
Detailed discussions of blister growth phenomena were supported by computer modelling runswhich illustrated many of the effects that were discussed. In particular, the effects ofquarantining channels were thoroughly presented and Shown to be worse, in the short term, thannot quarantining channels. Although quarantining is used in India as a short term fix, there isclearly no benefit in the short term.
REFERENCES:
1. Byrne, T.P., Léger, M and Moan, G.D., "Blister Growth in Zircaloy-2 Pressure Tubes",Consultants' Meeting on "PHWR Pressure Tube Integrity", IAEA Headquarters, Vienna,July 25-29, 1994.
15


![3} tj- 7] - OSTI.GOV](https://static.fdokumen.com/doc/165x107/631c4c86b8a98572c10cd705/3-tj-7-ostigov.jpg)