LOS ALAMOS SCIENTIFIC LABORATORY - OSTI.GOV
373
LAMS-3034 , LOS ALAMOS SCIENTIFIC LABORATORY OF THE UNIVERSITY OF CALIFORNIA 0 10s ALAMOS NEW MEXICO BIOLOGICAL AND MEDICAL RESEARCH GROUP (H-4) OF THE HEALTH DMSION -- ANNUAL REPORT JULY 1962 THROUGH JUNE 1963 -ci . - -- -- --=- 8 FILE BRRCODE #'
-
Upload
khangminh22 -
Category
Documents
-
view
0 -
download
0
Transcript of LOS ALAMOS SCIENTIFIC LABORATORY - OSTI.GOV
LAMS-3034
,
LOS ALAMOS SCIENTIFIC LABORATORY OF THE UNIVERSITY OF CALIFORNIA 0 10s ALAMOS NEW MEXICO
BIOLOGICAL AND MEDICAL RESEARCH GROUP (H-4)
OF THE HEALTH DMSION -- ANNUAL REPORT JULY 1962 THROUGH JUNE 1963
-ci .
- -- - - - - = -
8
FILE BRRCODE #'
. --. e., :
LAMS4034 UC-48, BIOLOGY AND MEDICINE TID-4500 (26th E d )
LOS ALAMOS SCIENTIFIC LABORATORY OF THE UNIVERSITY OF CALIFORNIA LOS ALAMOS NEW MEXICO REPORT -EN: July 1963
REPORT DISTRIBUTED: Febwary 14, 1964
BI0IXX;ICAL AND MEDICAL RESEARCH GROUP (H-4) OF THE HEALTH DfvlsIoN -- ANNUAL REPORT
JULY 1962 THROUGH JUNE 1963
Group Leader, W. H. LMgham Dividon Leader, T. L. Shlpman
5 5
-act W-?4OCSNG. 36 with tha U. 5. Atomic Bnergy Commission
n n r n r a n n nnn
T’
CONTENTS
CHAPI’ER 1 - INTRODUCTION
CHAPTER 2 - MAMMALIAN METABOLISM SECTION
1. Retention of Intravenously Administered Cesium 13* by Man
C. R. Richmond, J. E. London, and J. E. Furchner
11
21
2 1
2. Lack of Effec t of Exercise on t h e Excretion of Cesium 137 i n Mice 34
J. E. Furchner, C. R. Richmond, and G. A. Trafton
3. D i s t r i b u t i o n of Cesium 137 i n Mice and Dogs a t ter Chronic Exposure 4 1
J. E. Furchner, C. R. Richmond, and G. A.. mafton
4. Metabolism of Y ~ n w n e e e ~ ~ i n Rats and Mice 49
J. E. Furchner, C. R. Richmond, and G. A. Traf ton
5. Retention of ZirconiumgS after O r a l and I n t r a p e r i t o n e a l Admlnistration t o Mice 53
J. E. Furchner, C. R. Richmond, and G. A. Trafton
-3-

6 .
7 .
a.
9.
Effec t ive Retent ion of Intravenously Administered Beryllium7 by Rats
C. R. Richmond, J. E. Furchner, and J. E. London
The Ef fec t of Environmental Temperature on t h e Retention of Strontium In Mice
59
65
J. E. Purchner, C. R. Richmond, and G. A. Traf ton
and C e s i u m 13' Levels of Beagle
73 Hounds
C, R. Richmond, J. E. Furchner, and J. E. London
Volume and Turnover of Body Water i n Male Yacaca mulatta and Macaca speciosa Monkeys
C, R. Richmond and J. E. London
Yalamrrlian Metabolism Sect ion Publ ica t ions
Yanuscri p t Submitted
CHAmER 3 - YAYYALIM RADIOBI0U)GY SECTION
76
81
82
83
1.
2.
83
Comparative Fundamental Physiological Parameters of Yacaca mulatta and a New Laboratory Prlmate, Macaca speciosa
J. C. Hensley and C. R. Richmond
C e l l u l a r Elements in t h e Per iphera l Blood of Yacaca mulatta and Macaca speciosa Monkeys 96
C. R. Richmond and J. E. London
-4-
30
4.
s o
6.
7 .
8.
Longevity of F i r s t and Second Generation Offspr ing from Male Mice Exposed t o Fission Neutrons and Gamma Rays
J. F. Spalding and R. F. Archuleta
Acute Radiosens i t iv i ty as a Function of Age i n Mice
J. F. Spalding, 0. S. Johnson, and R. F. Archuleta
Cold S t r e s s as a T e s t f o r Rate of Aging i n Three Lines of Mice with Dif fe ren t Histories of Ancestral X-Ray Exposure
J. F. Spalding and T. T. T r u j i l l o
Breeding C h a r a c t e r i s t i c s of Offspring from
103
112
116
Mice with F i f t e e n Generations of X I r r a d i a t i o n t o t h e Hales 124
J. F. Spalding and Y. R. Brooks
Radiation-Induced I r r epa rab le Bio logica l Damage in Three Genetic Lines of Mice with Differen t Ancestral Histories of Radiation Exposure
J. F. Spalding and R. F. Archuleta
I n a b i l i t y of the Mouse t o Recognize Gam Radiatione. I. Variable Low Dose Rate Studies in RF Mice
J. C, HenSley, J. F, Spalding, PI. F. Schweitzer, aud R. F. Archuleta
Mammalian Radiobiology Sect ion Publ icat ions
Manuscripts Submitted
129
133
141
142
1 0 5 5 4 1 9 -5-
143
143
2. Abmluto Calibration of Whole-Body Gama-Ray 137 Spoctroroter for Potassium and Cesium
152
p. N. Dean and M . A. Van Dil la
Evaluation of the Potassium4* Continuum Contribution to t h e Cesium a Sodium Iodide Crystal Spectrometer
3. Photopeak i n
162
E. C, Anderson, P. N . Dean, and M. A. Van Dilla
4. Computer Programs for Analyzfng Data 168
P. N. Dean
5. c ~ ~ I ~ ~ ~ ~ Body Burdens of Control Subjects 180
E. C. Anderson and A. E. Hargett
6 . Retention of Cesium137 by Adults 184
M, A, Van Dil la and M . J. Fulwyler
7, Metabolism of Radioiodine in Children and Adults Using Small (Nanocurle) Doses 107
At, A. Van Dilla and M. J. Fulwyler
8. Effect of Ashing Temperature on Cesium and Potassium Content of Bone 201
Y, A. Van Dilla, M. W. Rowe, and M. J. Fulwyler
9. Thermoluminescent Dosimetry with Activated Lithium Fluoride 205
p. N. Dean and J. B. Larkins
-6- 1 0 5 5 4 8 0
. '
Low-Level Counting Section Publ ica t ions
Manuscript B Submitted
224
225
CHAPTER
1.
2.
3.
4.
5.
5 - CLINICAL INVESTIGATIONS SECTION 227
Progress in t h e Establishment of Karyographic Methods as a Tool in Radiopathology 227
G. L. Humason and P. C. Sanders
Elec t ronic Measurement of C e l l u l a r Volumes. I V . Determination of Scal ing and Correction Fac to r s f o r Conversion of Voltage t o Cubic Microns 235
C. C. LUShbaUgh, D. B. Hale, and N. J. Basmann
Elec t ronic Measurement of C e l l u l a r Volumes. V. Non-Physiologic pH
Change in Red Blood C e l l s Resul t ing from
C. C, Lushbaugh, E. C, Anderson, H. 1. Israel, D. B. Hale, and N. J. Basmann
Electronic Measurement of C e l l u l a r Volumes. V I . E lec t ronic Improvement of Coulter Counter Resolution 261
c. c. LUShbaUgh, N. J. Basmann, and D. B. Hale
Electronic Measurement of Cel lu la r Volumes. V I I . D i s t i n c t Subpopulations of Red Blood Cells
Biologic Evidence f o r Two Volumetrically 270
C. C. Lushbaugh and D. B. Hale
253
1 0 5 5 b 8 I -7-
., ; ..
6 . Electronic Measurement of Cel lu l a r Volumes. V I I I . Volumetric Change of Circula t ing Erythrocytes in WWv Genet ical ly Anemic Mice Implanted w i t h w+w+ F e t a l Liver
C. C. Lushbaugh and E, S. R u s s e l l
C l i n i c a l Inves t iga t ions Sect ion Publ icat ions
Manuscripts Submitted
CKAPTER
1.
2.
3.
4.
6 - CELLULAR RADIOB1OII)GP SECTION
Preparat ion of Bacterial Deoxyribonucleic Acids
1, U. Boone and E. Campbell
Purif ication and Concentration of T-4 Bacteriophage on DEAE-Cellulose C O l U n n S
for DrSA I s o l a t i o n
1. U. Boono and E. C8npbell
Chromomme Ob8ervations In Nonirrrdiated Progeny from Several Lines of I r r ad ia t ed
Male6
I, U. Boom, P. Y, LaBauve, and J. F. Spalding
Chromosomes i n Tran8planted Leukemia of AKR Mice
I, U. Boone and P. Y. LaBauve
C e l l u l a r RadiobiololLg Sect ion Publ icat ion8
279
286
287
288
288
296
303
307
312
-0, 1 0 5 5 4 8 2
' 1 0 5 5 4 8 3
CHAPI'ER 7 - MOLECULAR RADIOBIOLOGY SECTION
1. Nucleic Acids: A Technique for Automated Base Analysis
313
313
G. R. Shepherd, D. G. O t t , and P. A. Hopkins
2. Application of Automatic Computational Tech- niques t o t h e Analysis of Ul t racen t r i fuga l Sedimentatlon-Velocity Molecular Weight Data f o r Deoxyrlbonuc'leic Acid
G. R. Shepherd, P. N. Dean, and B. J. Noland
3. The Representation of Oligonucleotides: A
Sub-Nomenclature Problem
F. N. Hayes and D. G. O t t
4. Oligonucleotide Synthesis
D. G. O t t , D. L. W l l l i 8 ~ 8 , V. N. Kerr, G. T. Fri tz , E. Hansbury, R. E. Hine, and P. N. Hayes
5. Chromatography of Nucleic Acids
A. Murray, D. F. Petersen, T. T. T r u j i l l o , and V. E. Mitchel l
Molecular Radiobiology Sect ion Publ ica t ions
Manuscripts Submitted
-9-
319
326
329
350
373
374
.^^ ^ ^ ^
CHAPTER 1
INTRODUCTION
During t h i s report period (FY 1963), r e o r i e n t a t i o n of
t h e biomedical research program toward molecular and cel-
l u l a r l e v e l s t u d i e s continued a t an accelerated rate, As a
r e s u l t , there have been a large number of changes i n organiza-
t i o n Involving new hires, terminat ions, t r a n s f e r s of per-
sonnel w i th in t h e group, and r ede f in ing and r e a l l o c a t i n g of
r e s p o n s i b i l i t i e s .
(a) Protzram Or ien ta t ion
Continuing t o increase emphasis on more fundamental
research a t t h e c e l l u l a r and molecular l e v e l s and t h e ter-
mination of Dr. Lushbaugh, Section Leader of t h e C l i n i c a l
Inves t iga t ions Section, are r e s u l t i n g i n a less d i v e r s i f i e d
biomedical research program than i n past years. During t h e
next report period (FY 1964), proJects involving c l i n i c a l
a p p l i c a t i o n s of r a d i a t i o n and r ad ioac t ive Isotopes w i l l be
brought t o a reasonable conclusion, t h e sec t ion discontinued,
1 0 5 5 4 8 4 -11-

and t h e remaining personnel t r ans fe r r ed t o other sec t ions .
Some of t h e effort of t h e Low-Level Counting Sec t ion w i l l be
d i v e r t e d also t o other s e c t i o n s because of decreased I n t e r e s t
i n f a l l o u t as a r e s u l t of t h e nuclear test ban t r e a t y . This
w i l l result i n the FY 1964 research a c t i v i t i e s being con-
f i n e d l a r g e l y t o t h e fol lowing program categories:
06-01-01 General Radiation Effects (Mammalian Radiobiology Sect ion)
06-01-02 Toxicology of Radioelenents (Maamallan Metabolism Sect ion)
06-02-02 Radiation Genet ics (Mammalian Radiobiology Sect ion)
06-04 Molecular and C e l l u l a r Level S tudies (Molecular and C e l l u l a r Radiobiology Sec t ions)
06-06 Radiological and Health Physics and Instrumenta- t i o n (Low-Level Counting Section)
The Low-Level Counting Sect ion w i l l cont inue a c u r t a i l e d
effort in environmental radiation s t u d i e s (O-S), cons i s t -
i n g of projects of p o t e n t i a l i n t e r e s t t o c i v i l defense.
(b) Terminations
The fol lowing te rmina t ions occurred dur ing or s h o r t l y
after t h e end of t h e present r epor t period:
D r . C. C. Lushbaugh (Section Leader, C l i n i c a l Investiga-
t i o n s Section).
-12-
D. B. Hale (research a s s i s t a n t , C l i n i c a l Inves t iga t ions
Section).
G. L. Humaeon (reselrrch a s s i s t a n t , C l l n l c a l Investiga-
t f o n s Section).
M. W. Rowe (research a s s i s t a n t , Low-Level Counting Sec-
t i on ) .
A. E. Hargett ( technician, Low=Level Counting Section).
M. Yagee (technfcian, Molecular Radiobiology Section).
L. T. Rivera (research assistant, C e l l u l a r Radiobiology
Sect ion)
(c) Leave of Absence
Dr. I r ene U. Boone (Section Leader, C e l l u l a r Radio-
biology Section) was granted a year's leave of absence a t
t h e end of t h e report period t o practice medicine i n t h e
Los Alamos Medical Center.
(d) Transfers within the GrouD
Dr. E. C. Anderson was t r ans fe r r ed from t h e Low-Level
Cowting Section, of which he a r e the Sect ion Leader, t o
t h e C e l l u l a r Radiobiology Sect ion to work on the sequen t i a l
biochemistry of c e l l u l a r p r o l i f e r a t i o n us ing radiotracer
methodo logy . T. T. Trujillo was t r a n s f e r r e d from t h e Mlramolian Ftadio-
biology Sect ion to, t h e Molecular Radiobiology Section,
-13- L - 1
0. S. John8on was t r a n s f e r r e d from t h e Xanarrllan Metab-
olism Sect ion t o t h e Mammalian Radiobiology Section.
N. J. Basmann and V, M. Gibbs were t r ans fe r r ed from t h e
C l i n i c a l Inves t iga t ions Sect ion t o t h e C e l l u l a r Radiobiology
Sect ion.
(e) Change in Admini8trative Responsibi l i ty
Dr. D. G. O t t was made Alternate Group Leader and
assigned t h e specific r e s p o n s i b i l i t y of supervis ing and
coord ina t ing a l l fundamental reaearch a c t i v i t i e s . T h i s
c o n s i s t s of t hose p r o j e c t s being pursued in t h e Ce l lu l a r
and Molecular Radiobiology Sections.
Dr. Y. A, Van D i l l a was made Sect ion Le8der of t h e Loa-
Level Counting Section, rep lac ing Dr. E, C. Anderson; and
Dr. D. F. Petersen was appointed Sect ion Leader of t h e C e l -
lu la r Radiobiology Section, r ep lac ing Dr . 1. U. Boone.
During t h e p a s t repor t period, a rather vigoroua r e c r u i t -
ing campaign was carried out t o f i l l vacancies created by
te rmina t ions and t o increase t h e staff l e v e l in c e l l u l a r and
molecular radiobiology, New h i r e 8 dur ing t h e report period
o r at t h e beginning of FY 1964 are as follows:
Robert L, R a t l i f f ( s t a f f member, Molecular Radiobiology
-14-
Section), Ph.D. i n Biochemistry,
Donald E, Hoard (staff member, Molecular Radiobiology
Section), Ph.D. in Blochemistry,
'.
Charles T. Gregg (staff member, Molecular Radiobiology
Section), Ph. D. In Biochemistry,
J. Coleman Heasley (staff member, M8nunalbn Radiobiology
Section), D.V.Y. , I - Mack J. Fulwyler ( s taf f member, Low-Level Counting Sec- - Evelyn M. Campbell (research assistant, Cellular Radio-
biology Section), 8.Sc. , t t

Jean S. Findlay (research o s o i s t m t , Yau8l ian Yetab-
olisap Sect ion) , B. s., m - v B i l l i e J. Noland (research assistant, Molecular Radio-
biology Sect ion) , B.A.,
4 I Glenda L. Oakley (research ass i s tant , Yaarrlian Radio-
Fannie Sapir (research assistant, Cellular Radiobiology
Section), Y, S, I
Nancy C. Brown (technician, M8u8lian Radiobiology Sec-
Roxye L. DePriest (data analyst, Low-Level Counting Sec-
Valerie Y. Gibbs (technician, Cel lular Radiobiology Ssc-
I
Leo J. Carr ( e l ec t ron ic s technician, Low-Level Counting
Section), t r ans fe r r ed from P-Division E lec t ron ic s Group.
Antonio R. V ig i l ( e l ec t ron ic s technic ian , Low-Level
Counting Sect ion) , t r ans fe r r ed from P-Division Elec t ronics
Group,
(e) New H i r e s (Pending Completion of Postdoctoral Fellow-
ships or Degrees)
Robert A. Tobey (staff member, Ce l lu l a r Radiobiology
Ph.D. I n Microbiology, - w i l l report for work here in January 1964.
Elva A. Hyatt (s taff member, Ce l lu l a r Radloblology Sec-
t i o n ) , Ph.D. in Microbiology,
11 repor t for w o
1964.
Benjamin J. Barnhart ( s ta f f member, Ce l lu l a r Radio-
Arthur G. Saporurrr (staff member, Molecular Radfo-
~ ~ ! l l report for work h8re about January
1964.
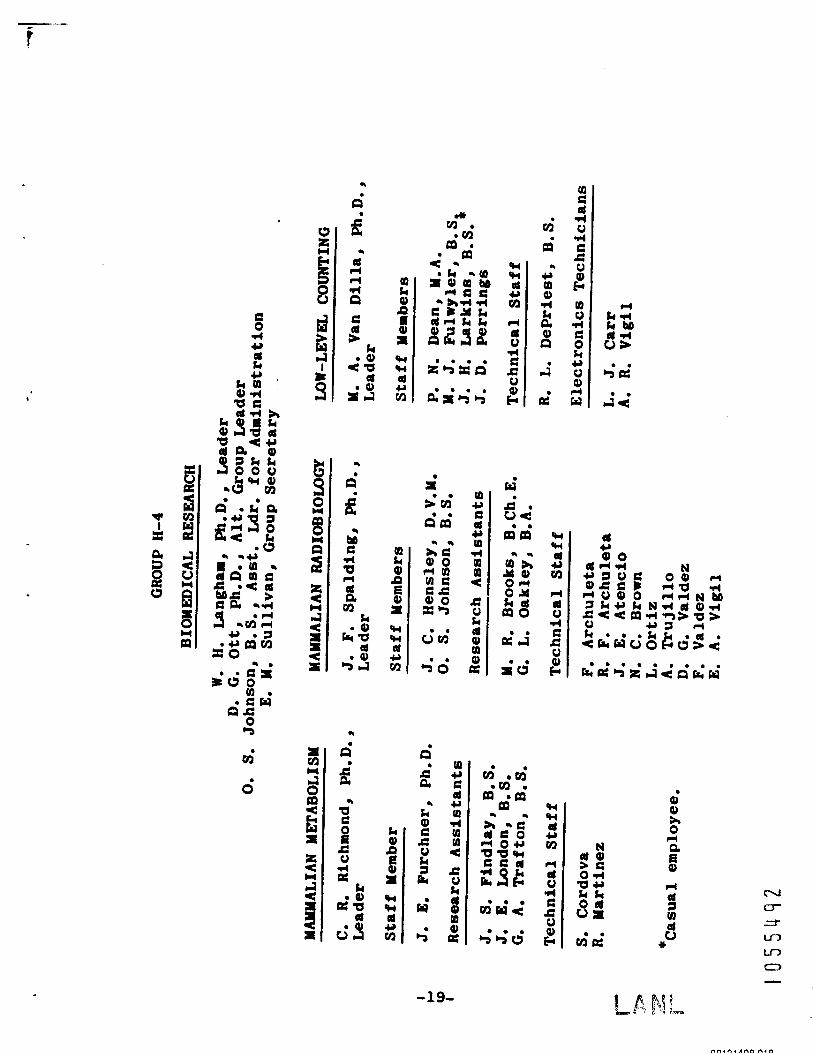
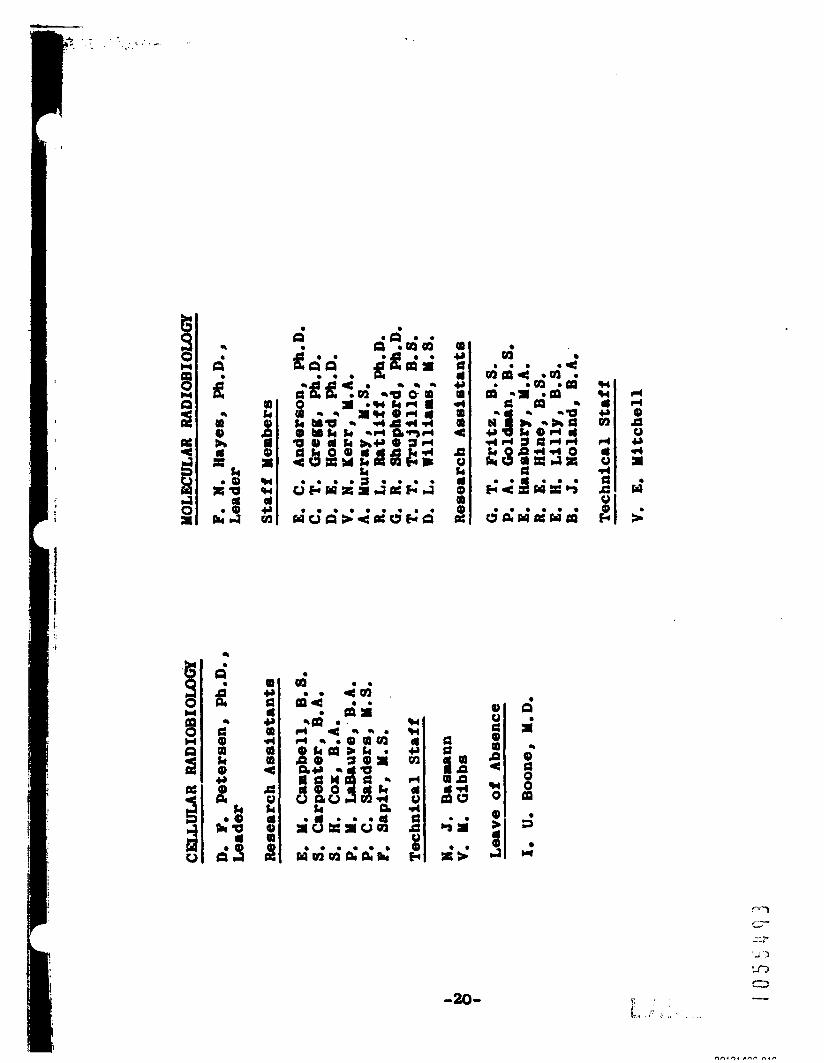
(h) Organization
A t the end of the prosent report period ( f i r s t half of
Fv 1964), the trrble of organization giving s o m e indication
of the divis ion of e f for t among the various sectfons I s
shown on the following pages.
c
-18-
f
,
. r .
0
m
d
W 4J E so +, PD 4
* r: u k 3 Q,
9) CT
m m
a
d i i
4
k 0) E E 0 k
pr a
Ed 4
(d c Id 4 0 d C E 0 8 00 0 4 C 0 k 4J 0 Q, 4 W
0
P) 9) $, 0 4
9) e" rl Id u) al u a
*
-19-
m
d i
8 m
s
.L
a? a
U
I
CHAPTER 2
MAMMALIAN MfiABOLISM SECTION
Retention of Intravenously Adminirtered C e s i d 3 2 by Man (C. R. Richmond, J. E. London, and J. E. Furchner)
INTRODUCTION
Increasing use of shor t - l ived Cs132 (6.5-day physical
half-life) f o r c a l i b r a t i o n of whole-body counting fac i l i t i es
affords a d d i t i o n a l oppor tun i t i e s for measuring b i o l o g i c a l
turnover of cesium by human subjec ts .
of Cs
(Le . , 0.67 and 0.66 M e V , r e spec t ive ly ) , t h u s al lowing t h e
s u b s t i t u t i o n of Cs132 for in vivo c a l i b r a t i o n experiments.
This report presents preliminary r e s u l t s of t h e e f f e c t i v e
r e t e n t i o n of Cs132 by 4 normal young a d u l t subjects .
The gamma-ray energy 137 I s remarkably similar t o that of 28-pear C s
132
METHODS AND MATERIALS
The Cs13' was obtained from t h e T o k a i Laboratory of t h e
Japan Atomic Energy Research I n s t i t u t e , T h i s s o l u t i o n was
-21-
neut ra l ized , sterilized, and prepared for int ravenous in jec-
t i o n (1). A t adminis t ra t ion , t he specific a c t i v i t y was
approximately 0.204 mc per gram of cesium. One
c s 132 chloride s o l u t i o n w a s administered (2) t o
between 8:OO and 9:OO a.m. The a c t i v i t y of t h e - C.L.
ml of t h e
each person
syr inges
was measured r e l a t i v e t o a Cs Id' standard before and af ter 132 i n j e c t i o n as part of t h e es t imat ion of t he amount of Cs
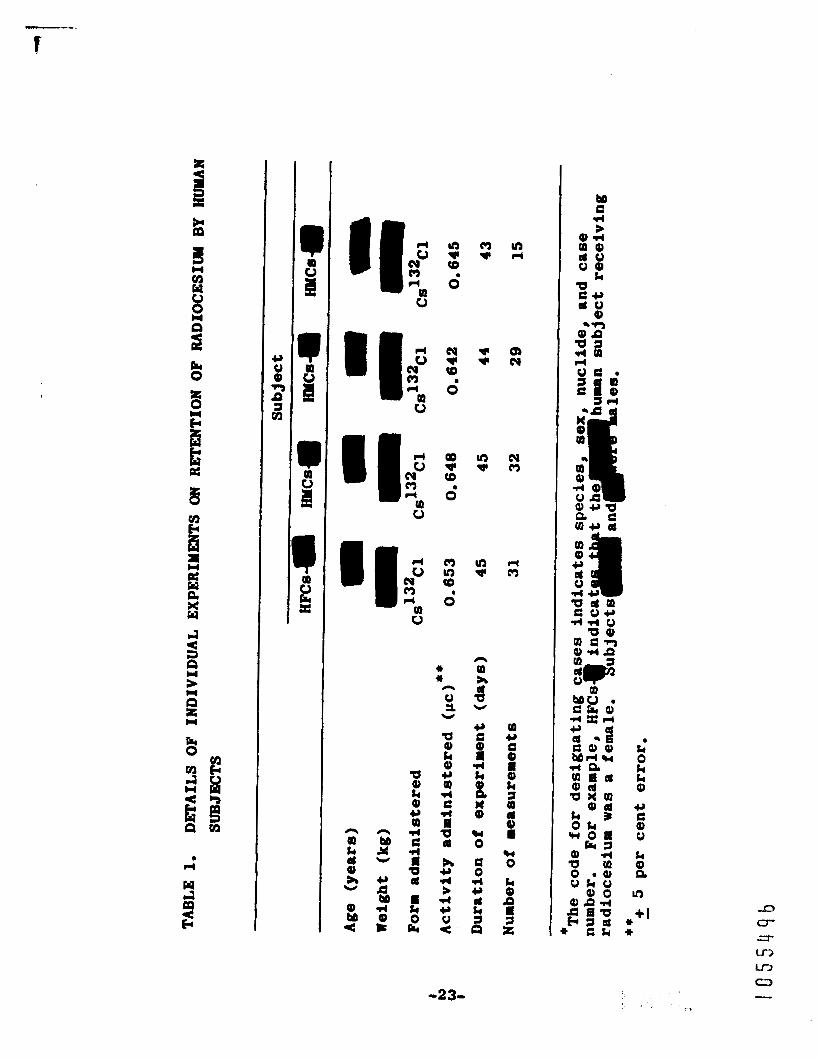
injected. Table 1 g ives some pe r t inen t experimental data
for e8ch subject. A l l were considered t o be i n good health.
Prior t o i n j e c t i o n , t h e s u b j e c t s were counted in t h e
Lo8 Alaws H u n Counter (Humco 11) t o es tabl ish normal
whole-body gamma-ray a c t i v i t i e s .
iodide spectrometer f a c i l i t y showed t h e presence of IC4' and
Cs13' only.
Measurements in t h e sodium
Counting times never exceeded 500 seconds dura-
tion throughout t h e experiment. The raw counting data were
e l e c t r o n i c a l l y processed by an IBM 7090 computer t o deter-
mine t h e count rates corrected for counter i n s t a b i l i t y a t t h e
exact t i m e s of measureneat (e.g., x is error-free in sub-
sequent data ana lys i s ) . The output of t h i s program provides
t h e input for t h e least squares curve- f i t program (3). A
s i n g l e exponent ia l func t ion was used as t h e b io log ica l model
i n t h e analysis.
-22-
u
I m d
h 0 k d 9) +r
P) M
Y
e
n M Y
Y
M 4 Q) B
Y
a
W u
W 0) k Q) *I PD rl c d a W 0
6 k 8
-23-
In d
Q) cy
cy m
r( 0
OD Y C Q) a 0, k
11 0)
w 0 k 01 P
z
a rn
9 O k O
Q O rl)
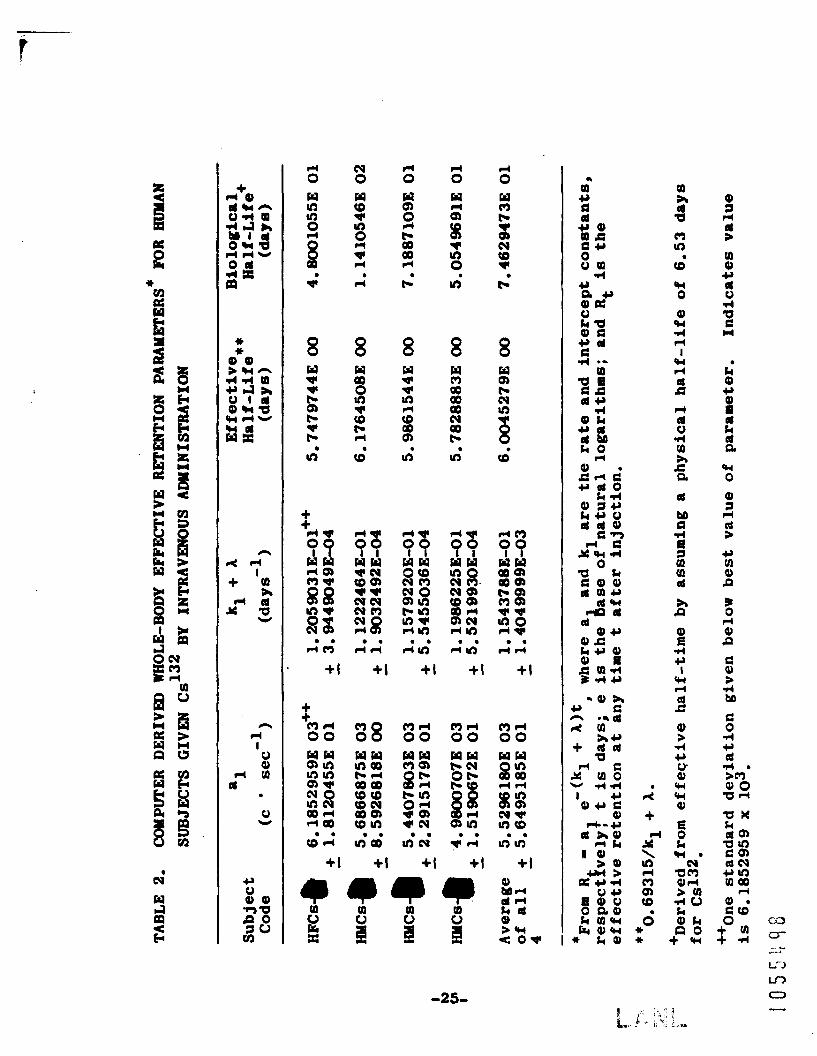
RESULTS A#D DISCUSSION
Table 2 lists t h e in t e rcep t and rate parameter8 plum
their stan-rd dev ia t ions as ca lcu la ted by the h 8 S t squ8rer
curve-f i t p r o m . The smnll standard dovlat lon8 for both
prrueters are i B d i c 8 t i V O of t h e high pro~i8101a of t h e
instrumentat ion and t h e correct choice of model. One can
also note in Table 2 tho effect of body mm.8 on a t t enua t ion
of gama a c t i v i t y a r i s i n g from within t h o body. An inverse
r e l a t i o n is ap-rent botween body m8m and meamred count
rate a t tima zero (81).
132 The mean e f f e c t i v e half-lffe (EEIL) of 6 day8 for Cs
corresponds t o a derived biological h 8 l f - l i f e (BHL) of
approxint8tely 75 day8 for stable cesium. It lrhould be em-
phasized t h 8 t a phyUIC81 half-l ife (PEL) Of 6.53 d878 W 8 8
assumed in der iv ing t h e BEL i n thlm study.
u ses 6.4 days a8 t h e PHL, the derived BEL would be about
100 days.
BHL. Thus, one must exercifre care when e a t b a t i n g BHL
values from tracer s t u d i e s done w i t h r8dionucl ides of Short
PKL.
subject .
However, If one
A 0.3-day PIIL correspond8 t o a 130-day derived
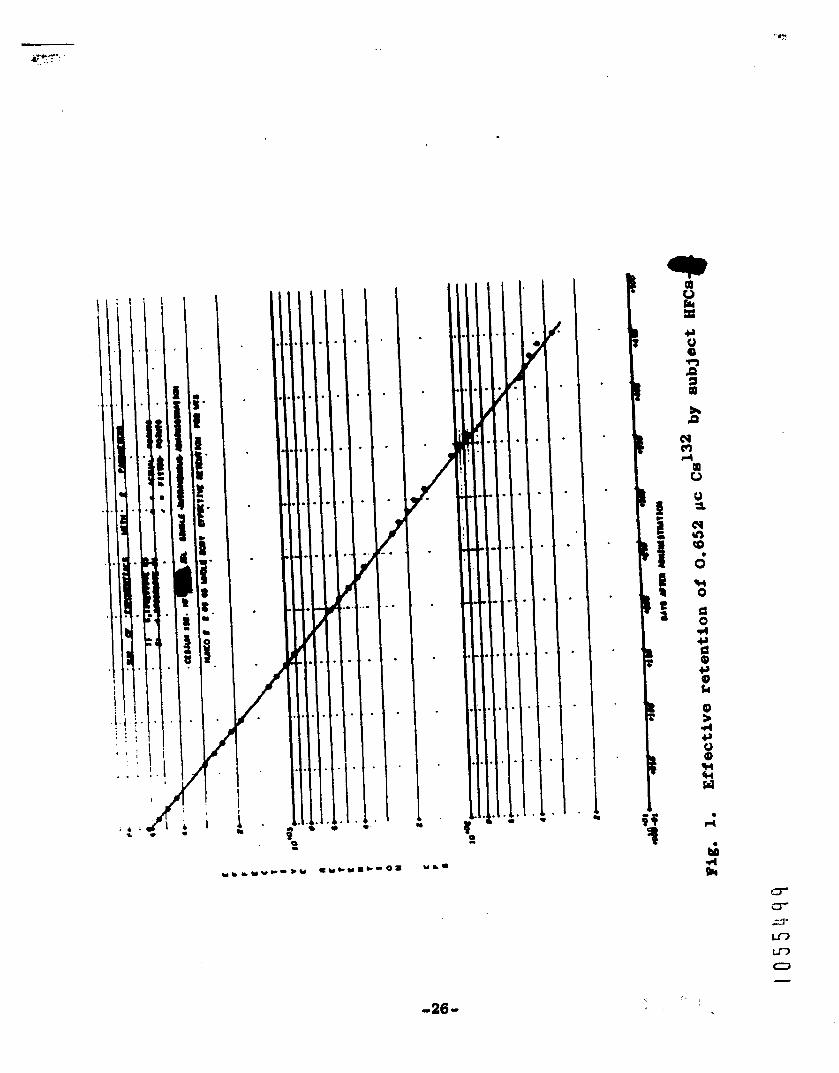
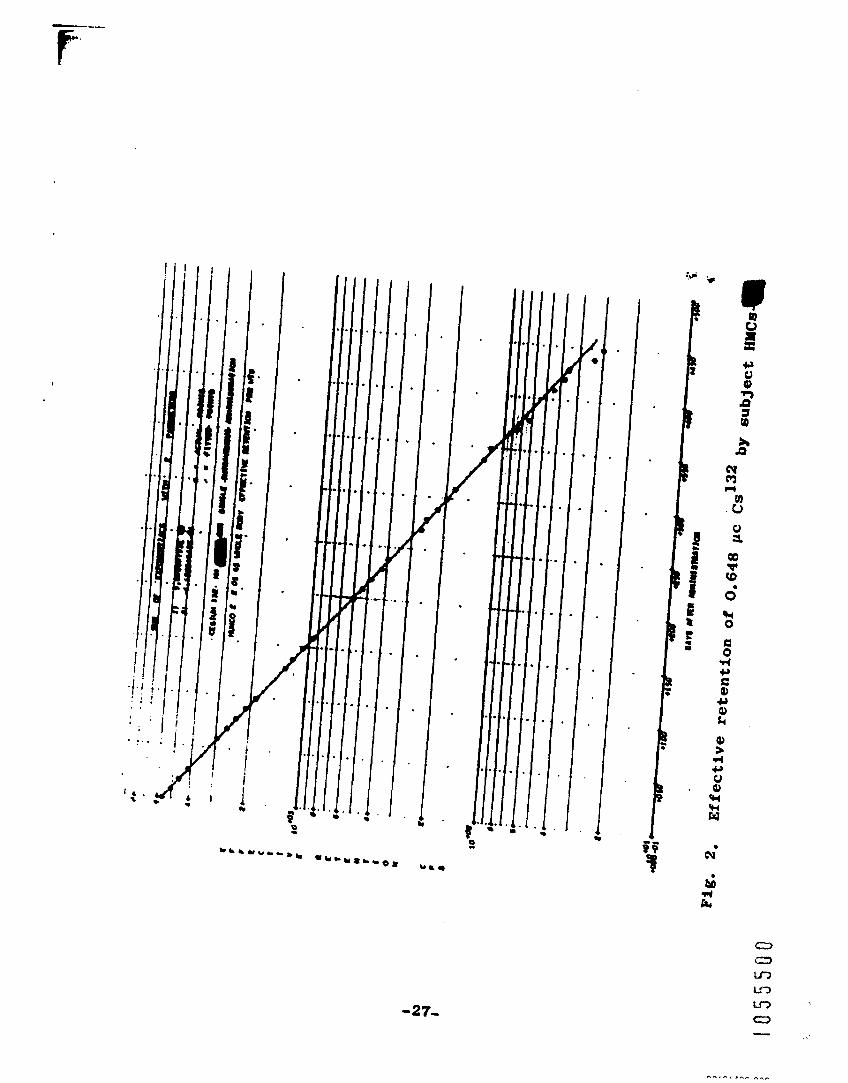
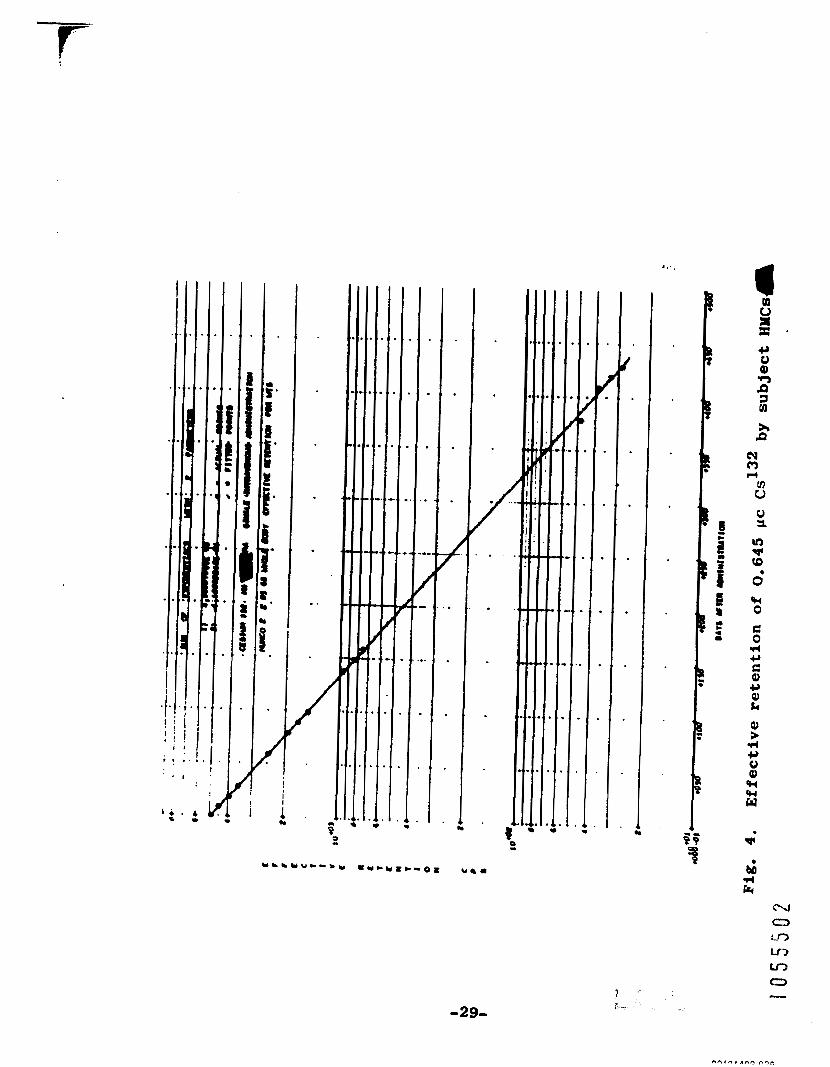
Figure6 1-4 show the t i m e course of r e t en t ion for each
F i g u r e 5 gives t he s a m e for a l l 4 subjOCt8.
Maletskos e t al. (4) report a two-exponential r e t e n t i o n
system for 5 e l d e r l y
- The BHL for the rlor
t 0 5 5 h . 9 7 -24-
?4 rl I4 0 0 0
W W d m
w Q 0 PI QD w cy
D (0
b D pc
2 0 * a w 0
tll R d a m D
to 91 0
Q) w rl rl
I w rl Q E
d Q o rl OD h E a
a
m bo a rl a 7 W u1 d
2 Q, E 4 +, I
w r( (d E
Q) > d c, W Q,
. W 4cw
Q)
8 8 W QI
k Q) +,
d k Q a w 0 Q) 3 rl 3 > +, fn Q) P
t
r( Q) P a Q) > rl bD
C 0 d c, (d d .
U d ;%
w m 00 00 QD cy QD pc
In a .
d
* 0 ii w
d N cy [o 00 Q, rl
rl a
cc)
14 QI
P
+I +I +I +I +I
+m cl 0 0 "08 F a d c c ) d f)rl
00 00 00 + Zid
Y too
-25-
-26-
I
-27-
cu o'? b
d + k

-20-
.
..
..-
I
ci
-29-

-2
-. I
8
m +, 4 7 0 3 M c 7 0 A #4
& 0 E *
4
cn 0
E 0 -4
Q
6 rl k
-30-

~ o r r e c t i o n s based on a 6.53-day PHL were used t o convert t h e
counting data t o b io log ica l re ten t ion , and t h e la t ter was
p lo t t ed a8 a func t ion of time. The BEL derived from our
cm13’ 8tudy is considerably shorter than BHL values obtained
by u s ( 5 ) and others (6-13) when Cs134 o r C s 137 was used as
t h e t r ace r . Liden (14) r e p o r t s a BHL value of 74 days f o r ,
1 subjec t following intravenous adminis t ra t ion of Cs 134 . In general , most reported BHL values f o r stable cesium range
between 100 and 150 days. Low specific a c t i v i t y is one fac-
t o r which argues aga ins t t h e use of Cs132 a s a tracer for
stable cesium. In our s t u d i e s , about 3 mg of stable cesium
were administered along wi th t h e C s 13* t o each person. The
In t e rna t iona l Commission fo r Radiologica1 Pro tec t ion reports
a value of less than lo-’ gram as t h e body content of stable
cesium.. Other workers (15) suggest a number closer t o
1.5 x loo3 gram. Regardless of t h e a c t u a l value, the admin-
i s t r a t i o n of 3 m g stable cesium does not conform t o t h e
requirements of a t r u e tracer study.
One would not a n t i c i p a t e a d i f f e rence between t h e metab-
01%- Of c8 132 and Cs 137 s t r i c t l y on t h e basis of t h e masses
of t he radionucl ides; however, t h i s p o s s i b i l i t y cannot be
completely ignored. We plan t o repeat t h i s experiment i n
severa l of t h e s a m e s u b j e c t s using c a r r i e r - f r e e Cs 137 a s
the tracer. Such s t u d i e s can be done w i t h high precision
1 0 5 5 5 0 4 -31-
when only 0.2 to 0.3 pc is administered.
that t h e Cs137 body burdens of cer tain small population
group. c u r r e n t l y are higher than them9 l e v e l s as a r e a u l t
of nuclear weapon t e s t ing .
We should add here
(1) The80 proc.dure8 were done by Dr. C. C. Luahbaugh of
t h e Cl in ica l I n v e ~ t i g a t i o n ~ ~ Section of t h i s Group.
(2) I n j e c t i o n s were made by Dr . C. C. Lushbaugh (see Ref. 1).
(3) C. R, Rfchmond, J. E. Furchner, P. No Dean, and P.
M C ~ i l l i & M , Health PhgS. - 10, 3 (1%4).
(4) c. J. M&10t8kOSJ T. C h p p J M. M. CostelloJ and A. T.
Keane, Annual Progress Report, Massachusetts I n s t i t u t e
of Technology, Radioact ivi ty Center (May 1962), pp. 41-
4s.
( 5 ) C. R, Richmond, J. E, Furchner, and W. €I. Langham,
Health PhyS. - 8 , 201 (1962).
( 6 ) E. C. Anderson, R. L. Schuch, 1. R. Fisher , and W. H.
Langhaa, Science - 125, 1273 (1957).
(7) C. E. Miller and 0. J. Steingraber , Semiannual R e p o r t
of t h e Radiological Physics Division, Argonne Natlonal
Laboratory Report ANL-5755 (1957), pp. 53-57.
-32- 1 0 5 5 5 0 5
(9)
1
IC, T. Woodward, A. G. Schrodt, J. E. AILd8rLK)LID H. A.
Claypool, and J. B. Hartgering, Division of Nuclear
M 0 d i C h 0 , Walter Reed Army I n 8 t i t u t e of Reaearch Report
DAW-1180 (1960).
C. G, Stewart, E. Vogt, A. J. W. Hitchman, and N. Jupe,
Proceedings of t h e Second Conference on t h e Peaceful
U s e s of A t o m i c Energy, Geneva, 1958, P.15, p. 220,
United Nations, New York (1958); see also: Progress
i n Nucl. Energy, Ser. V I I , Yed. Sci. - 2, 39 (1959).
K, G. Y c N e i l l and R. M. Green, Canad. J. Phys. -’ 37
528 (1959).
C. E. Miller, Argonne National Laboratory Report ANL-
5596 (1956).
E, Oberhausen, Proceedings of t h e University of New
Mexico Conference on Organic S c i n t i l l a t i o n Detectors,
U. S. Atomic Energy Commission R e p o r t TID-7612 (1961),
pp. 286-292.
Y. P. Taylor, J. Vennart, and D. Y. Taylor, Physics i n
Yed, and B i o l . - 7 , 157 (1962).
K. Liden, Acta Radiol. 56, 237 (1961).
N. Yamagata, Nature 196, 83 (1962). - -
-33-

Lack of Effect of Exercimo on tho Excretion -- of Ce8iud3' i n - Mice (J. E. ptlfchner, C. R. Richmond, and G. A. Tr8fton)
It ha8 been demon8tr8ted th8t the excre t ion rate of
C*137 in rice 18 inverse ly ro l a t ed t o e n v i r o n ~ n t 8 1 t e m -
pera tures (1). It is also w e l l known that basal metabolic
rates are Inversely related t o temperature (283). The pres-
ent r epor t describes an a t t e m p t t o modify t h e excre t ion of
by enforced exercise .
m i r t y w1 female nice 82 days old (25.1 g) were in- 137 jected with ,.. 0.5 pc of Cs C12. Within 30 minutes af ter
i n j e c t i o n , t h e cs13? a c t i v i t y in each m u s e was a888yed in
LASAC 11, a 4 r l i q u i d s c i n t i l l a t i o n counter, and then half
were returned t o cagam and the other h r l f placed In a cyl in-
drfc cage of stainlem8 steel me8h ( 8 x 16 i n . ) that revolved
a t the rate of 1.7 RPY f o r 40 minute8 every 2 hours.
groups of anlamls had free access t o Purim Lab Chow and
water. The food consumption was meroured by weighing. The
animals were weighed a t each assay.
collected and assayed per iodical ly .
data were analyzed by an IBM 7090 computer progr8med t o
Both
Urine and feces were
The whole-body counting
perform an i t e r a t i v e least squares analysis .
RESULTS
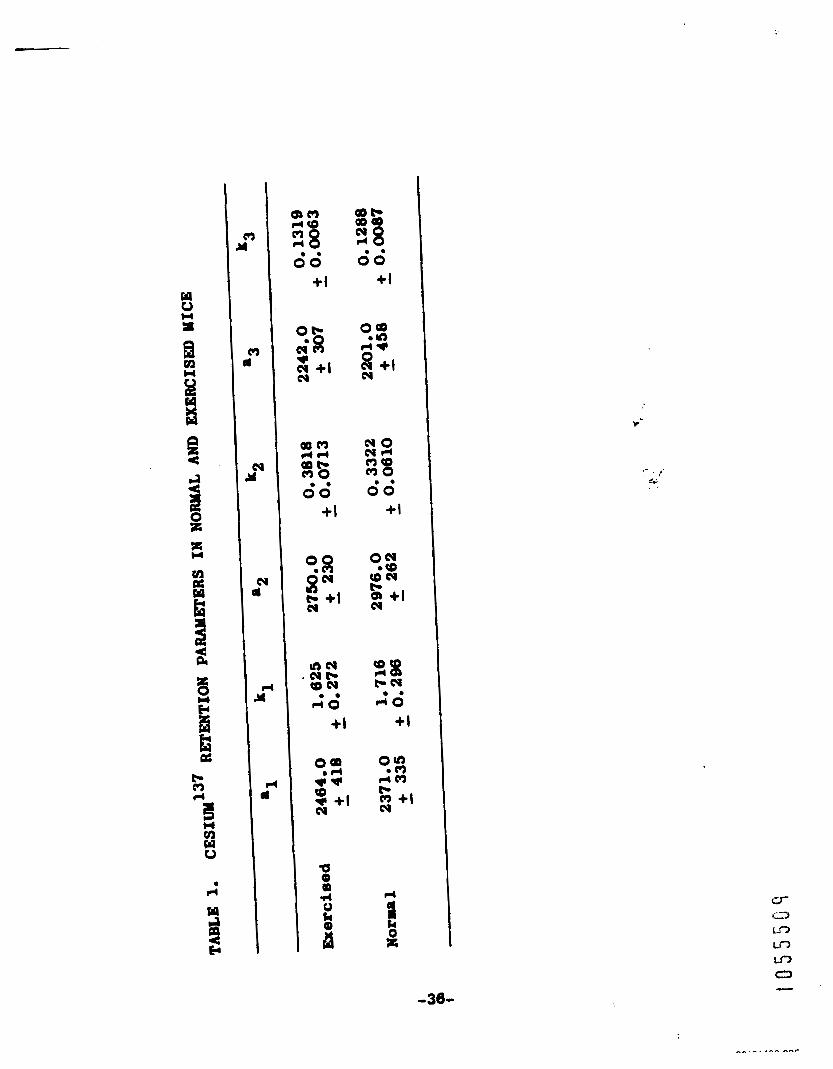
The whole-body r e t e n t i o n data for t h e experimental and
con t ro l groupa, corrected for countar f l u c t u a t i o n but not for
decay, were described by r e t e n t i o n func t ions of 3 exponential
components (Table 1). Data p o i n t s fo r each mouse were used
i n t h e least squares a n a l y s i s for t h e best f i t t o a l l t h e
points.
a long wi th t h e average va lues (which were not used in the
OnalpSlS). Deriva t ives of these func t ions are plot ted a s a
func t ion of time i n Fig. 2. The data po in t s i n Fig. 2 rep-
r e sen t t h e excre t ion rate pe r mouse per day as ca lcu la t ed
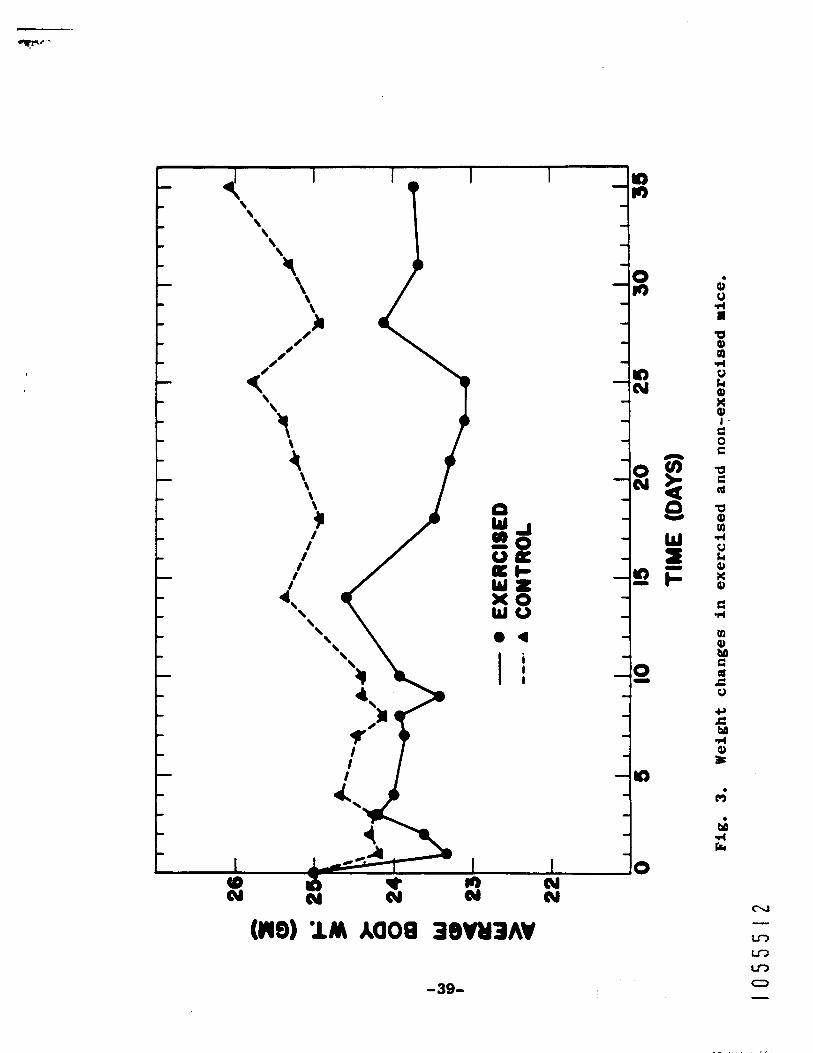
from t h e assay of t h e excreta. F igure 3 shows t h e weight
changes during t h e course of t h e experiment.
P lo t8 of t he r e t en t ion func t ions are given i n Fig. 1,
DISCUSSION
The data presented i n Table 1 and i n Figs. 1 and 2
c l e a r l y indicate no change r e s u l t e d from t h e enforced ex-
ercise. Figure 3 i n d i c a t e s t h a t con t ro l mice showed a small
weight gain, af te r an i n i t i a l loss, t ha t was absent i n t h e
exercised animals, However, t h e exercised m i c e consumed
less food (3.0 versu8 3.3 g per mouse per day) than t h e
cont ro ls . It ha8 been pointed out that inc reases i n metab-
olism due t o cold i n c r e a s e food in t ake (4,s).
t h e enforced e x e r c i s e was not vigorous enough t o increase
Presumably,
-35- t 0 5 5 5 g 8
9 0 z
3
m I
r"
cy d
u"
d d
?% c(m e cy (*1 +I
-38-

I" 1
I
2 0
I= w w w 0 W lb IL W
a
F
W d 0
B
2000 -
1000 - 800 - 600 - 400 -
200 -
100 - 80 - 60
40 -
-
1 20
Fig. 1. Whole-body retention of C ~ ~ ~ ~ l n normal and exercised mice.
-37-

5000 1 1 I 1 1 I
I
Cd" YlCL W. ADUWSTRATWW TOTAL LXCRLTIOW RATES PER MOUSE
2- -
I I I I I 1 A
- EXERCISED e---- A CONTROL 1
TIYE (DAYS)
P
w i n o W O e 4
I 1
the metabolic rate. An Increase in the RPM or In tho running
time, or both0 may incre8se thm met8bollc rate and so affect
the cesium excretion.
REFERENCES
(1) J, E.. F u r c b n O r and C. R. Rhhrond, J. Apple WySIOlo
18, 786 (1963).
E. F. Adolph, Am, J. Fhysiol. - 176, 275 (19%)).
So Brody, Bioenorgeticr 8nd GroWth, Relabold Publiahlng
Corp, , New York (3945).
Y. J, Fregley, Am, J. Phy8101, - 176, 275 (1954).
J, I,, burrer and J. P, Harmon, Am, J. Physlol. -.111 202, 375
- (2)
(3)
(4)
(5)
-10-
D i s t r i b u t i o n of C e s i u m 137 in Mice and ~ o g s af ter Chronic Expowre (J. E. Furchner, C. R. Richmond, and G. A. Traiton)
INTWDUCTION
There have been a number of reports poin t ing out bone
concent ra t ions of Ca 137 equaling or exceeding so f t t i s s u e
concent ra t ions (1,2). These reports deal wi th tracer amounts
found i n humsins. Tissue d i s t r i b u t i o n s t u d i e s of cesium after
acu te exposure show t h a t only 1 per cent is found in bone,
compared t o 80 per cent i n muscle a t 20 days (3). This
report is concerned w i t h t h e whole-body a c t i v i t y i n mice and
dogs dur ing chronic exposure t o Cs 137 and wi th t h e d l s t r ibu -
t i o n in t i s s u e s a f te r such chronic exposure.
METHODS
The dr ink ing water of 12
W i t h c6 13' a t a concentrat ion
had free access t o Purina Lab
RFl female mice waa contaminated
of about 0.06 pc/ml. The mice
Chow and t h e contaminated drink-
i n g water. The whole-body a c t i v i t y , body weight, water con-
.umpt%on, and a c t i v i t y of t h e excreta were determined period-
i c a l l y over a period of 442 days. The mice were 216 days old
a t t h e beginning of t h e experiment ( w e i g h t 29.4 g). The exper-
b e n t was terminated when ha l f t h e animals had died. Deaths
occurred on days 221, 261, 313, 348, 359, and 402. The
' 1 0 5 1 5 5 1 4 -4 1-
.^^ ̂.^
surv ivors were killed by ether 8nestheai8, and t h e fol lowing
t f s s u e s were asoayed for cs13' a c t i v i t y : pe l t , gut, l i v e r ,
kidneys, lung8, he8rt, spleen, both f e m u r s , 0varie8, u t e rus
and adherent fa t , circa88, and t h e remainder which cons is ted
blood.
Three male beagle hounds were fed -0.017 bc C s 137 on
a Purim monkey pellet for a period of 674 dags, A t that
time, t h e dogs were sacrificed with an intravenous overdose
of sodium pcmntathol. Tho following tls6uerr were a88aped for
Cs137 a c t i v f t y : p e l t , gut , l l v e r , kidneys, heart, spleen,
both femurs, ~puocle, testes, pancreat ic t i s s u e , brain, blood,
fat , and remainder.
RESULTS
The whole-body ro ten t ion data for dog8 8nd mice are
shown in Fig. 1, The i n t e g r a l of a r e t e n t i o n func t ion f o r
R single dose of Cs137 administered intravenously t o dogs
is shown as a s o l i d line, as is t h e i n t e g r a l of t h e re ten-
t i o n fuac t ion for a s i n g l e oral dose of C s 137 i n mice which
were t h e same age a t to 911 those used in t h e chronic study.
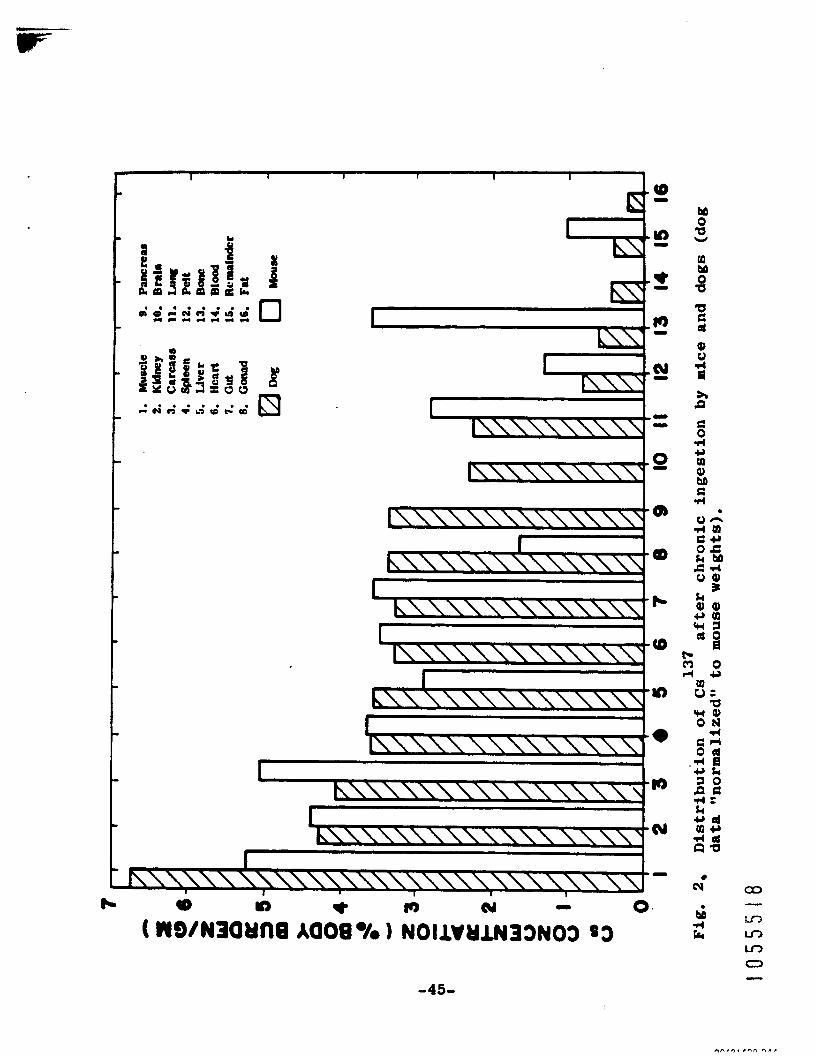
The aver8ge d i s t r i b u t i o n of Ca137 I n laice and dog. 18 shown
in Table 1 and fn Fig. 2. In Fig. 2, t h e V 8 l U 0 8 for dogs
have been t*norm&lizBd" for purposes of comparison with mlco
1 0 5 5 5 1 5 -42-

0
e t t
(3SOO MIW) NOllN3131J M O B 370HM
-43-
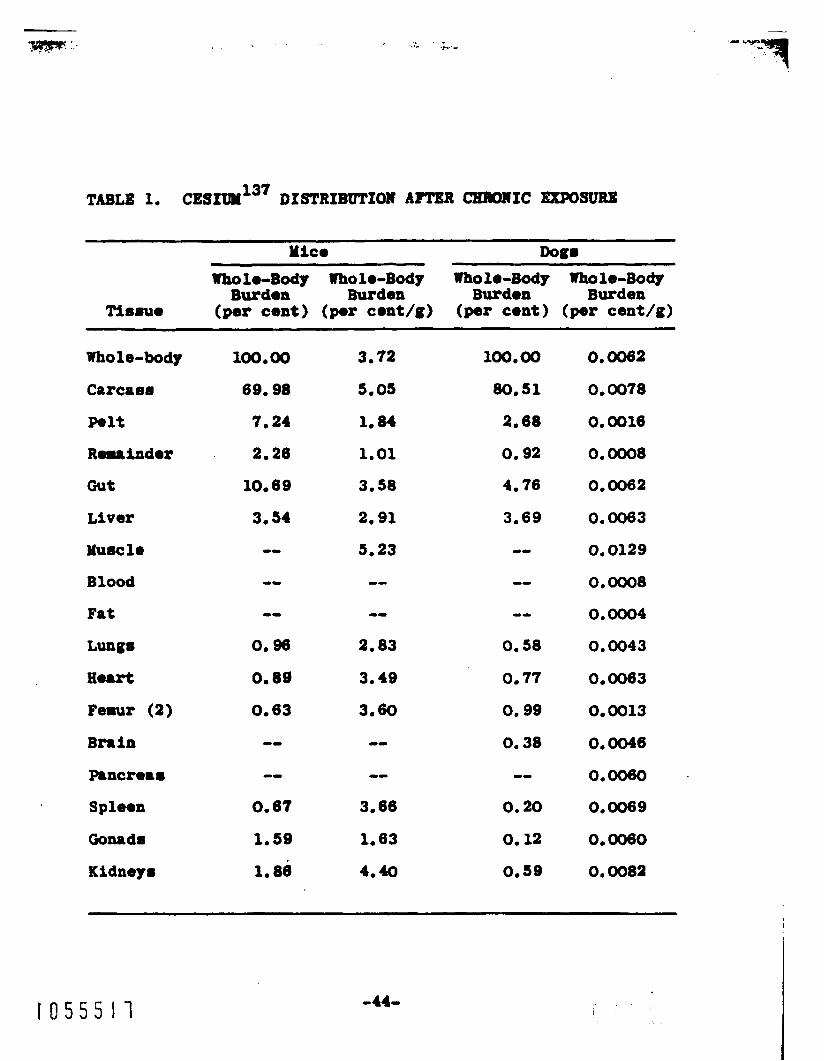
TABLE 1. CESXW 137 DISTRXBWTIOll AFTER ClllIQllIC Ex#)SURE
WhOlO-bOdy
Carcaem
Pelt
Remainder
Gut
Liver
Muscle
Blood
Fat
Lungs
Heart
Femr (2)
Brrin
P8ncre88
Spleen
Gonads
Kidney6
1OOmoO
69.98
7.24
2.26
10.69
3.54
-- 0-
-- 0, 96
0,89
Om 63
0-
0-
0.67
1 m 59
1, a i
3m72
5, os
1.81
1 m 01
3.58
2.91
5.23
-0
-- 2.83
3.49
3m60 -- -0
3.66
1.63
4.40
100.00
80.51
2.68
0.92
4.76
3.69
-0
-- -0
Om 58
Om 77
Om 99
0.38
00
0.20
0.12
0.59
0.0062
0.0078
Om 0016
OmOOO8
O.OO62
Om 0063
0.0129
OmOOO8
0.0004
Om0043
0.0063
0.0013
0.0046
Orno060
0.0069
Om 0060
Om 0081
-44-
,<-
b
9
I I I
I Y)
I I
I \\
cv t
I I
Y 0 0 W
71 E rd
N
b i l 4 zr
-45-
by multiplying tho par cen t per grm value. by 590, t h e
ra t io of dog body weight t o mouse body weight.
DISCUSSION
The whole-body r e t e n t i o n of Paice seems t o f i t t h e in-
tegral of t h e r e t en t ion funct ion sati8factorily.
t h e sharp divergence8 of t h e data points taro due t o death8
of individual mica.
the i n t e g r a l of t h e r e t e n t i o n funct ion for lntravenoumly
adrldiatered Cs137 and t h e chronic o r a l r e t en t ion data for
dog8 is not apprrent .
a factor of 2 ' t h r n t h e estimate derived from t h e in tegra l of
t h e r e t en t fon function.
from outdoor qua r t e r s dur ing mvere ly cold weather Into
heated dog runs, where they remained u n t i l they were killed.
No 80Cr80nril f luctuat ionm were apparent thereafter.
poralble t ha t a f u r t h e r component m y ba necessary t o describe
rholo-body re ten t ion , on. t h a t is not r ead i ly detected i n an
acu te erperhmt.
S o m e of
Tho r e a m n f o r tho di8crep.ncy between
The whole-body a c t i v i t y i 8 higher by
A t about T280, t h e dogs were moved
It 1s
However, if t h i s is the case, a deficiency
i n a c t i v i t y between TlOd and T225 requiram explanotion. A _ _
chronic f e d f n q experiment shows tha t t h e Cs137 equi l ibr ium
l e v e l i n mice va r l e8 d i r e c t l y with temperature (4).
The tissues may be roughly divided into 3 group8 (Table 1).
H i g h e r concentrat lorn are found i n tho kidneys, muscle, and t h e
!
-46- 1 0 5 5 5 1 9
carca6~ which i s mostly muscle.
(which are C l 0 8 e t o t h e whole-body concentrat ion) are found
Intermediate concentrat ions
i n t h e gut , l i v e r , lungs, heart, and spleen i n both species.
L o w e r concent ra t ions are found i n the pe l t and remains i n
both species. The bra in , pancrea t ic t i s s u e , and gonads
(testes) of t h e dog a r e i n t h e intermediate range.
(ovary and accessory sex organs) i n t h e mouse f a l l i n t h e lower
The gonads
concent ra t ion group, probably due t o f a t adherent t o t h e u t e rus
and Fal lopian tubes. The dog femur has a low concentrat ion
comparable to t ha t of t h e pelt, while t he mouse femur has an
in te rmedia te concentrat ion comparable t o the heart and gut.
These groups are diagrammed i n Fig. 2, where t h e values
der ived from dog6 have been t t n o m l i z e d t t fo r comparison.
n o m a l i z a t i o n i s , of course, fa l se in t h e sense t h a t organ
weights are not d i r e c t l y proport ional t o body weights.
The
It i s apparent that the bone metabolisms of t h e t w o
species differ i n respect t o Cs13'. The data of Ballou and
Thompson (5) show that t h e concentrat ion of Cs 13' i n muscle
is considerably greater than i n bone in t h e ra t* Thus, dogs
and ra t s are similar in t h i s respect and d i f f e r from man and
mouse. A t present , t h e au tho r s have no explanation for these
f indings.
1 0 5 5 5 2 0 -47-
(1) R, W. And8r80n and P. F. bu8tafwn8 Sciooco - 137, 668
(1962).
(2) #, Y a n g r t 8 8nd T, Y u u l p t a , F i r 8 t Annual Hooting of
tho Japan R.di8t&on Remarch Society (SOpt-br 1959).
(3) C. R, Bichroad, Lo8 A l a n 0 8 S c i e n t i f i c Uboratocp Report
LA-2307 (1958) . (4) J. g, hrchner 8nd C. R. Richmond, J. Appl. Wysiol . l8,
786 (IHs),
(5) J, Z, B8llou and R. C. Thompdon, Health Phys, - 1, 85
(lW8).
t 0 5 5 5 2 1 -48- i i
Y O t 8 b o l i 8 B Of Hanganome" i n bt8 and Mice (J. E. Furchner, C. R. Richmond, and G. A, Trafton)
INTRODUCTION
As pnr t of t h e program for meamring whole-body reten-
t i o n of gamma-ray-emitting isotopes w i t h 4 r s c i n t i l l a t i o n
counters, ~n'* was administered to rats and mice by var ious
routem. A 8 long a8 t h e whole-body a c t i v i t i e s rena in above
t h e lower l i m i t of t h e de t ec t ion system, t h e s t u d i e s w i l l be
cont h u e d .
RESULTS AND DXSCUSSION
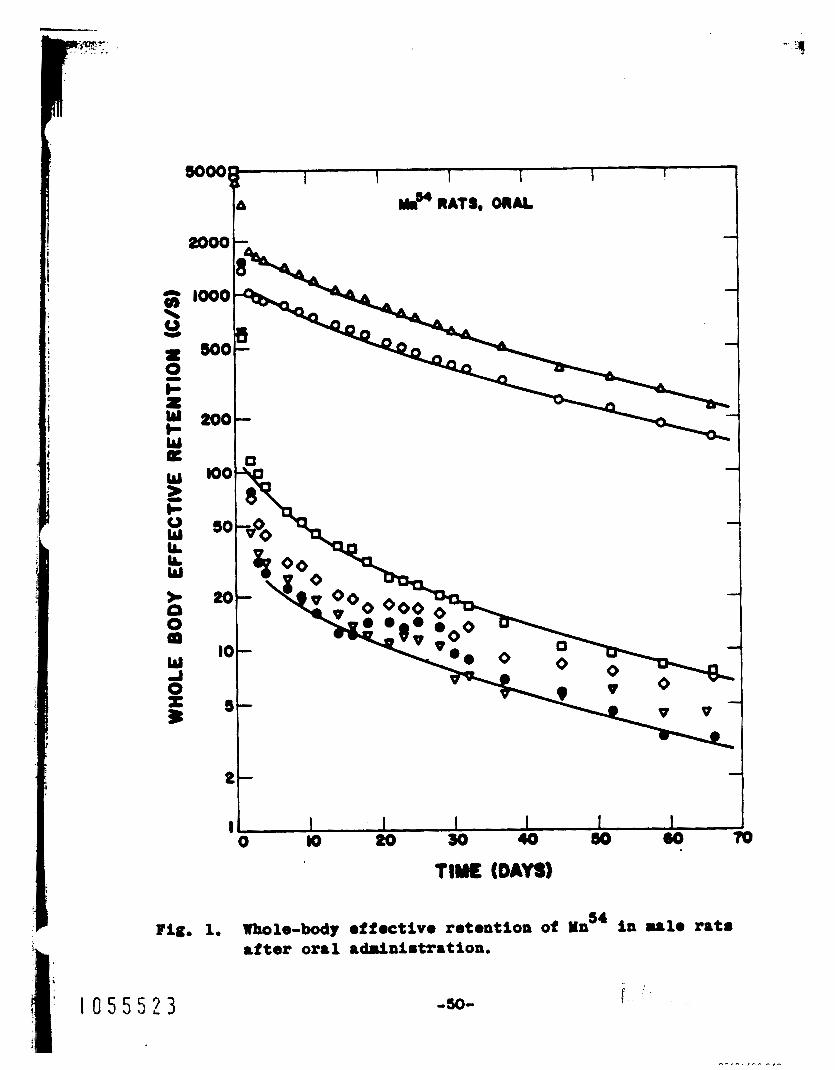
Figure 1 shows t h e v a r i a b i l i t y of r e t e n t i o n in t h e r a t
a f t e r a s i n g l e oral dose. The a c t i v i t y ( i n c/sec), corrected
for counter error but not fo r physical decay, is p l o t t e d
aga ins t t i m e . Eye-fit l i n e s are drawn fo r purpose of compar-
ison. An e f f e c t i v e half-t ime of about 30 days approximately
f i ts t h e la t ter po r t ions of t he data. A t present , no explana-
t i o n of why t w o animals re ta ined about 30 times t h e amount
r e t a ined by t h e other fou r animals is offered.
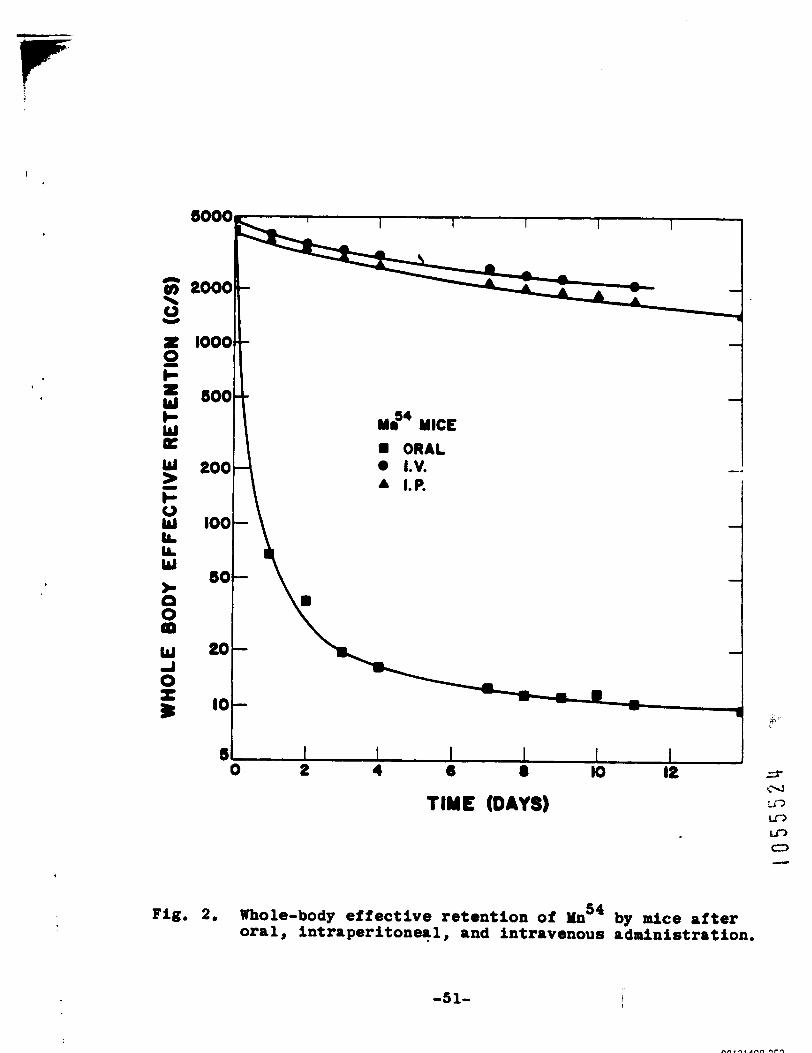
Figure 2 shows e a r l y r e t e n t i o n in mice. Here again,
t he e f f e c t i v e r e t e n t i o n I s plot ted as a func t ion of time.
Average va lues f o r each group are plotted.
t o determine t h e s ign i f i cance of t h e d i f f e rence in r e t en t ion
It is too e a r l y
after intravenous and in t r ape r i tonea l adminis t ra t ion. The - -49- 1 0 5 5 5 2 2
0
Fig . 1. Uhole-body effoct ivo retontion of YnS4 i n u l a rat8 i ai tor oral adrinistration.
1 0 5 5 5 2 3 I, -50- f
I
d4 MICE
J.V. A I.P.
ORAL
TIME (DAYS)
Fig. 2. Whole-body e f f e c t i v e retent ion of MnS4 by mice after oral, intraperitoneal, and intravenous administration.
-51-
""1". .^^ ..rm
rice retained about 0.5 per cent of t h e oral ly administered
mnganese on the third day, shoring that Intest inal ab8orp-
t l o n of t h i s element Is very low.
r a t s (excluding the 2 with high a c t i v i t y ) Is about 1 per cent.
The comparable figure for
Retention of manganese In monkeys and dogs w i l l be
moa~~ured, and addit ional rat experiments (oral ly administered
Ma ) are i n progress. 54
1 0 5 5 5 2 5 -52-
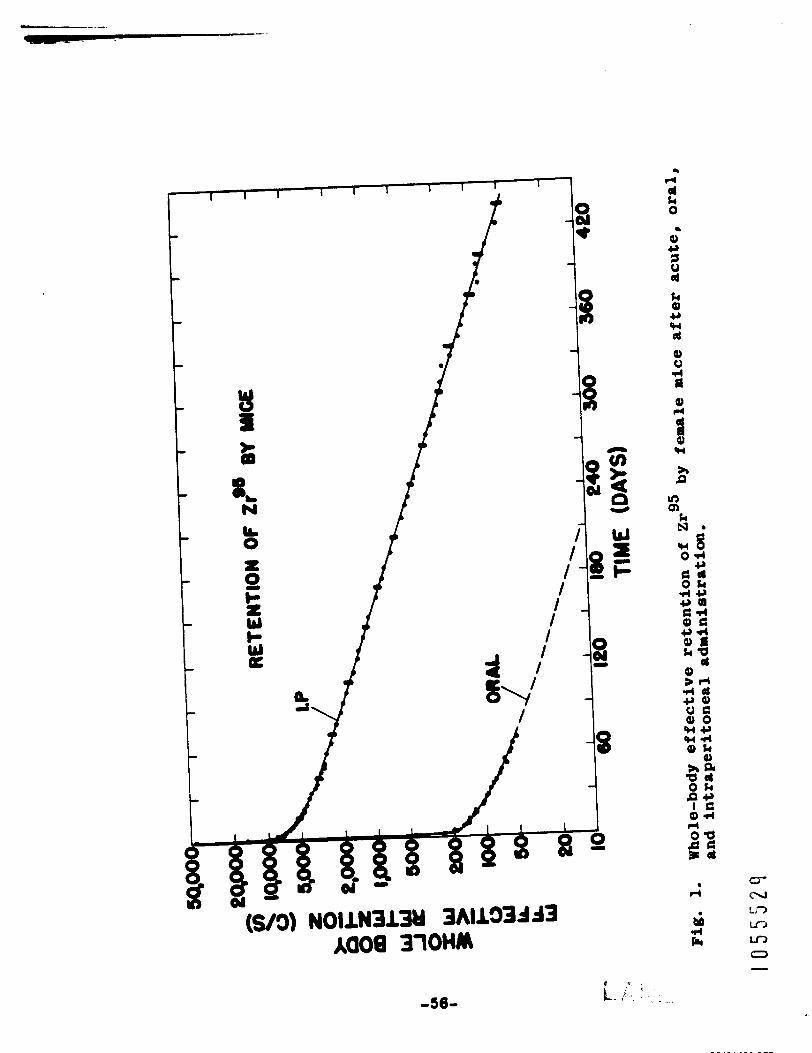
Retention of z ~ ~ ~ ~ I ~ ~ ~ a f t e r Oral 8nd I n t r a p e r i t o n e a l Adnini8tr8t ion t o Mice (J. E. Furchnor, C. R. Richmond, 8nd G. A. Trafton)
INTRODUCTION
The i nc reas ing use of zirconium imposes I n t e r e s t in t he
r e t e n t i o n and excre t ion of t h i s element. I n addi t ion , zirco-
nium has been examined for use as a means of d i sp lac ing heavy
metals deposited In bone. The present paper deals with t h e
whole-body r e t e n t i o n of zirconium i n mice. Related s t u d i e s
in rats, dogs, and monkeys are i n progress.
METHODS
Twelve RF1 female mice, 54 days old (22.5 g weight ) ,
were given about 0.215 pc of a zirconium-niobium equilibrium
mixture a8 t h e c i t ra te by gastric gavage.
paired, and t h e a c t i v i t y in each pair ars meamred in a 4a
whole-body l i q u i d r c i n t l l l a t i o n counter f o r -11 8ni'Puls.
Appropriate s tandards were also amayed. On t h e first day
after adminis t ra t ion , t h e a c t i v i t y had f a l l e n by a f a c t o r of
about 100, and t h e a c t i v i t y of t h e group (6 pairs) was then
measured in t h e Los Alamos Human Counter (HUIPCO 11). Meas-
urements were continued u n t i l t h e 67th day a f t e r admlnlstra-
t ion .
The mice were
A second group of 12 mice of t h e same age were in j ec t ed
-53- I. r'
1
iatnp.ritoamilf with t h o s u o mount of t ho zirconium-
niobium iixture and r8uy0d b tho 8-11 urlr.1 co\mtOr.
a n l u l m woro countod at appropriate intervals f o r 435 d8yr.
Tbo rholo-body counting data from t h i s group, cor rec ted f o r
countor f l u c t u r t i o n but not for phy8ic.l docay, wero then
an8lyz.d by an IEM 7090 computor prograuod t o f i t t ho data
by 8n i t o r a t i v e lea8t square8 procedure.
The
The d8t8 from each
p8ir were analyzod indiv idua l ly , and t ho data from tho 6 pair8
WOrO 8180 8mlyZ.d en 11lS.O.
RESULTS
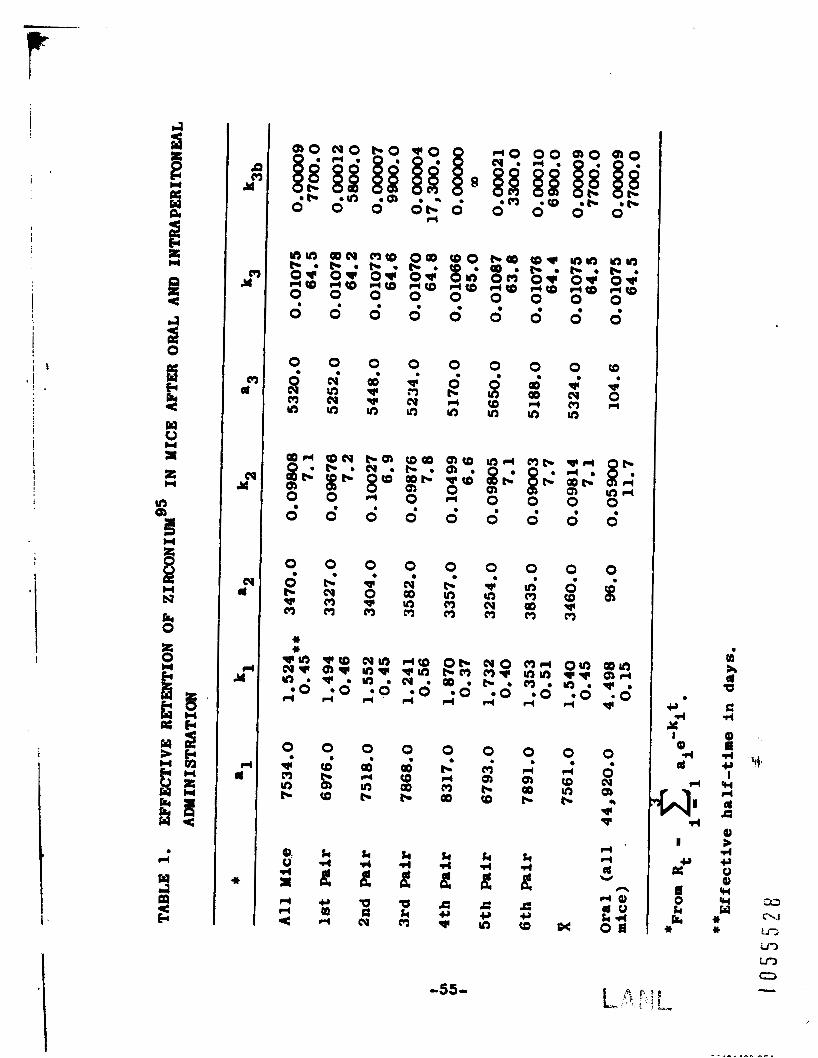
R.tontion fuactionm of 3 exponontial corponents f i t the
at8 of 08ch psir and of t h e group (I. P*),
t ho p 8 r u o t o r 8 of t h o ro t en t ion funct ion8 f o r each pair and
for t ho group.
m b l o 1 gives
Figure 1 show8 a l l t h o dat8 poin ts f o r 1 prir
of ~ c O , A t into-818, t h o d8tr point8 for t ho 6 pair8 a r o
also plottod to i nb ica to tho . raago within tho group,
8 ~ 0 t h curvo dram through the data poin ts 1s a p l o t of t h o
r e t e n t i o n funct ion derived by t h e IBM 7090,
f i g u r o a r o shom tho data po in t s f o r whole-body r e t o n t i o n
rf t o r oral a d r i n i s t r a t i o n .
Tho
In tho same
DISCUSSXON
Tbo a t 8 0 88 premontod, represent wholo-body o f f e c t i v e
t 0 5 5 5 2 1 -54-
f I
I
i b Q I
! .
I
I
I
4
0 * m In cc
e
0). 0 4 a rl 4 <
0
(0 00 b
ao'
k 4
k U k m
0 cc rl m a
e
k " k P *, *
0 4 (D ua b
e
lx * u3 i f )
LD Q i -55-
I I I I I 1 1 I 1 1
f
-36-
8
rl
b i 74 k
-- -
rc" t
!
retention.
o r a l adP in i s t r8 t ion was eye- f i t wfth t h e assumption t h a t t h e
s lope constant of t h e last component was t h e appropr ia te
conatant t o use.
by **curve peeling."
w i l l be used In a later report.
The r e t e n t i o n func t ion for t h e mice treated by
The remaining parameters were then derived
Yore sophisticated computer analpsea
The data and parameters represent ing t h e r e t e n t i o n after
in t r ape r i tonea l adminis t ra t ion show good agreement among t h e
6 pairs.
with t h e va lues der ived from t h e group as a whole ( l i n e s
labeled '*all mice" and '%** i n Table 1).
listed under 5 approach 65 days, t h e physical half-time for
The average values of these parameters agree w e l l
The half-times
Z r 90 . The rate cons tan t s for e f f e c t i v e r e t e n t i o n (%) are
t h e sum of t h e biological rate constant (k3b) and t h e physical
I rate constant (Azr) :
kg k3b + 'Zr* 95
The physical rate cons tan t for Zr 0.693 65 days, equa ls - = 0.01066. 65
from 5, t h e upper va lues of each pair in t h e las t column
i n Table 1 are the result, and t h e half-times der ived from
these rate cons t an t s range between 3000 days and i n f i n i t y .
For mice, t h e d i f f e rence botween 3oOO days and i n f i n i t y lnoy
be ignored.
I with a half-time of
When t h i s va lue Is taken
i i
! For longer-l ived ind iv idua ls , t h e d i f f e rence
t
1 1 0 5 5 5 3 0 -57-
.
map be Important If the biologic81 retention is the param-
eter of lateroat, Thass data illuatrrte the disadvantages
of s*tudyimg tho mataboliu of nuclides havfng long biolog-
ical blf-timm with isotopem having corp8rativelp short
p h Y d C a 1 b 1 f - l i V O 8 .
1 0 5 5 5 3 1 -50-
M f e c t i v e Retention of Intravenously - AdPPlnlstered ~ e r y 1 1 i ~ ~ ~ - by h t r (C. R, Richmond, J. E. Furchner, and J. E. London)
INTRODYCTION
This report summarizes our work covering t h e whole-body
e f f e c t i v e r e t e n t i o n of Intravenously administered carrier-
free Be C12 by rats.
effort t o establish metabolic parameters for var ious mamma-
7 This work is pa r t of a cont inuing
l i a n Bpecieb with I n t e r s p e c i f i c c o r r e l a t i o n s a s t h e f i n a l
goal, Studies in t h e mouse and dog are e s s e n t i a l l y complete,
as are t i s s u e d i s t r i b u t i o n s t u d i e s i n t h e r a t . A complete
summary should be ready f o r t h e next report.
METHODS AND MATERIALS
Six 70-day-old male Sprague-Dawley r a t s were used. The
average body weight f o r t h e group was about 283 g.
of 6 of t h e ani'msrls was given 5 .5 pc of carrfer-free B e
To each 7
contained in 0.11 m l so lu t ion as t h e chloride. In j ec t ion
was I n t o t h e lateral t a l l vein of t h e anes the t ized animals.
All animals were maintained in temperature con t ro l l ed (75" F)
rooam and allowed free access t o water and Purina Lab Chow.
The e n t i r e animol was measured i n t h e Los Alamos Small Animal
Counter (LASAC 111) s h o r t l y after adminis t ra t ion and a t
appropr i a t e subsequent times. A l l counting tfmes were of
100 seconds duration. Background and Be' s tandards were
-59-
-. . .
mermred before rnd after t h e exparimentr l mhals.
t i v e r e t e n t i o n p&ruoters were then detertined by cchputer
methods,
reported here.
Effec-
Rsrsult8 of urinary and fecal excret ion are not
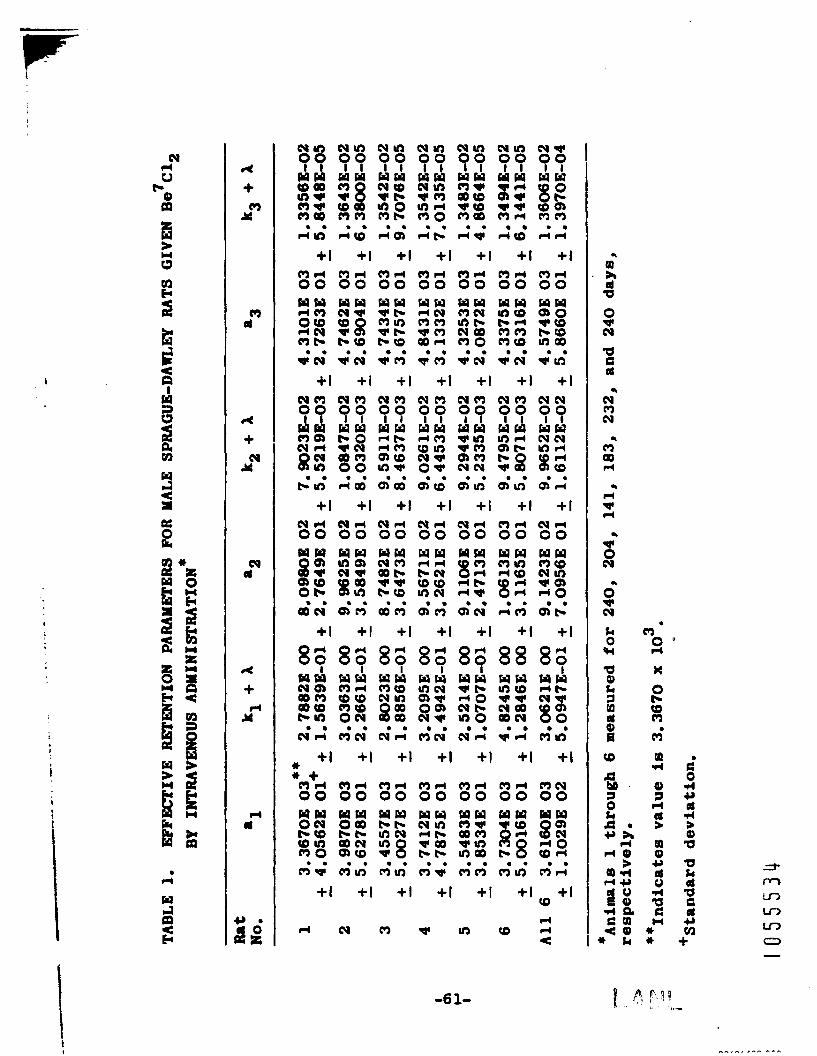
RSSULTS AND DISCUSSIOM
h b l e 1 give8 tha e f f e c t i v e r e t en t ion parameters for
each of t h o 6 animals and for a l l combined as ca lcu la ted by
t h e learnt squares curve-f i t program, The standard deviat ion
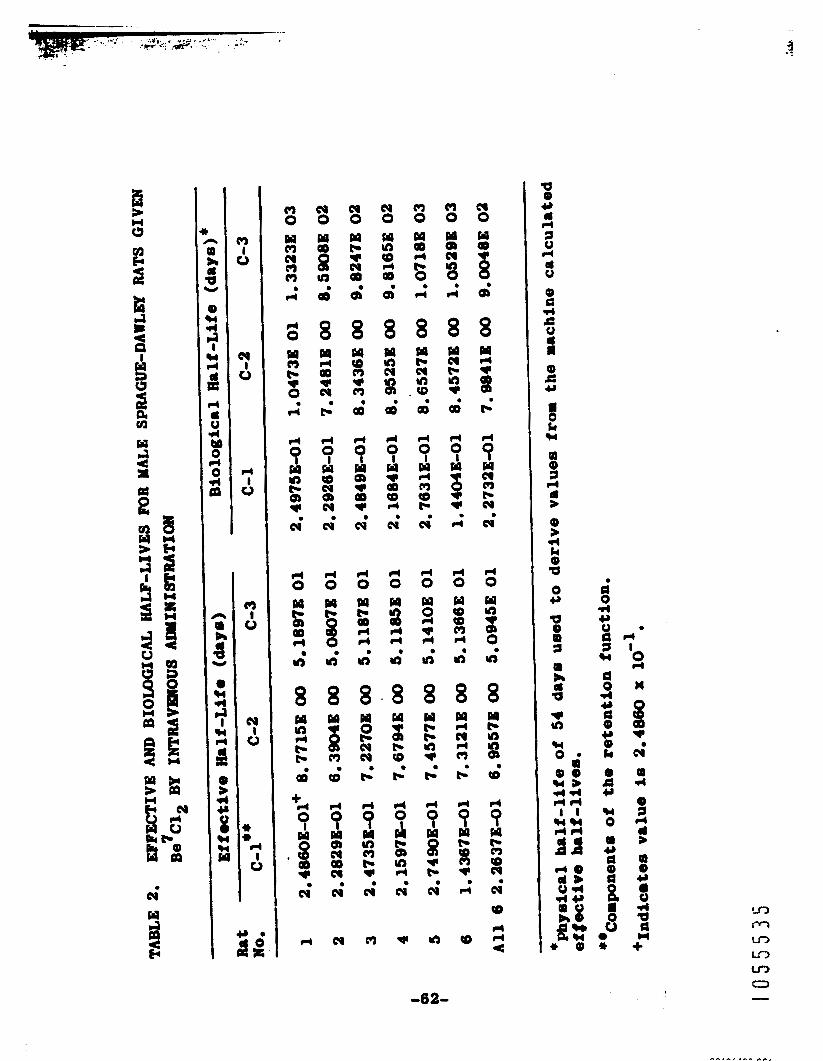
for e8ch p r r u o t e r is also given. Table 2 gives t h e effec-
t i v e and blologicrl half - l ive8 for e8ch re t en t ion component
for a l l t he a r lyses , A thr88-COnpOImnt exponential model
apporrs to f f t t h e drta q u i t e adequrtely. The value of
54 dry8 W 8 8 U 8 0 d 88 t h e physical hsrlf-life O f Be' i n these
analyses.
t o bono, 18 t h e component of mo8t i n t e r e s t a8 the e f f e c t i v e
half-l ife Is extremely close t o the 54-d8y phys ica l h r l f -
l ife, Thf s component cont r ibu te8 over 95 p e r cent of t h e
t o t a l are8 under the e f f e c t i v e r e t en t ion funct ion when in-
Component 3, which t e n t a t i v e l y may be ascribed
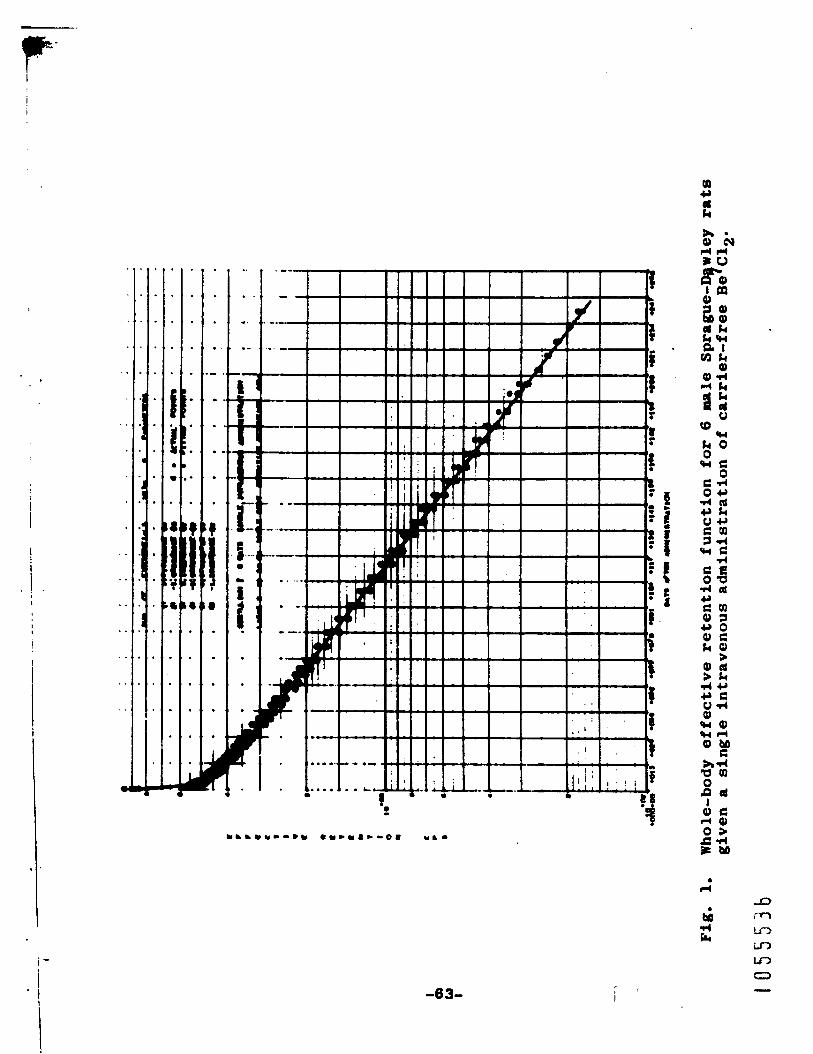
tegrated from zero t o i n f i n i t e t i m e .
coaputer der ived p lo t of t h e d8tr.
Figure 1 shows a
Str t ls t ical weighting
factors (1) were used. The a n a l y s i s requires no logarithmic
t r 8 n a f o r u t i o n s of t h e observed drt8.
In atplarry, prellainrry r e s u l t s suggest that the hard
!
I
, I
R
+ Y 0
m 3
4
+ Y cy
cy d
A
+ Y
I4
r( (t
fP
od m d m d m d m d m d m d 00 00 00 0 0 0 0 0 0 0 0
+ I + I + I + I + I + I +I
c y d c y 4 cvd c y d cvd or4 CJrC 00 00 00 0 0 0 0 00 00
-6 1-
.L
OD A cd P
0 * cy
B 3
cy o cv
o OD d
.L
rn
.)
d d( d
v 0 cy
0 b cy k 0
94
a 0) L, 1 W 3 a, 8 ctD
4
.L
. c3 o *
K
0 b CD m m
rl
.
1 1 l o o o o o o o m c y c y c y m m c y
8 . s w cy cy
* . ? w ua m Lc * cy .
d
Po t- cr) m CS
?
CD rl I 4 c
d 0 rl Y c) Q 3 w a 0 d * U 0 +I Q) k 0 A +I
w 0
Y 8 a Q
a
8 a 0 *
. d
I 9
8 X
QD 1(
cy
ID d
a 1 d a * ID
*,
0 4 U Q U +
a
-62-
. .
I
I
. .
. .
. .
. .
. .
. .
. .
. .
. . . . .
. . . . ..
. . . . .
. . . . , .
. . . . . -
.. - ' . - ' -
. . i . . . . . * . . . . . . . . , .
. . . , . . * 8 .
r .
i -63-
-1 i
ti8.u.8 biad borylllu~ more tenaciously than do other tis-
sues. Tho effectfve halt-life for t h i s component I s approx-
i u t e l y 51 drys.
1 0 5 5 5 3 1 -64-
I
The Ef fec t of Environmental Temperature on t h e Retention -- of Strontium i n Mice (J. E. Furchner, C. R. Richmond, and G. A. Traf ton)
INTRODUCTION
It has h e n demonstrated that t h e whole-body r e t en t ion
and excre t ion of Cs 137 are a funct ion of the temperature a t
which the mice are maintained (1). The p r inc ipa l s i t e of
depo8ition for cesium in mammals I s s o f t tissue. The effect
of temperature on t h e whole-body r e t e n t i o n of strontium, an
element deposited p r inc ipa l ly i n bone, is reported here.
METHODS
After a s i n g l e i n t r a p e r i t o n e a l i n j e c t i o n of about 0 . 5 pc
sr8' a t a p~ of 6.0, 30 RFl female mice (80 days, R 23 g)
were divided I n t o 3 equal groups. I n i t i a l a c t i v i t y was
determined in LASAC 111, a 4 r l i q u i d s c i n t i l l a t i o n comter (2).
After assay, t h e mice were placed i n cage6 and maintained a t
34', 22' , and 5' C (+ - 2"). Whole-body a c t i v i t y was measured
a t convenient i n t e r v a l s u n t i l 172 day8 after in jec t ion .
Weights .were recorded during t h e experiment.
The r e t e n t i o n data (In c/sec) were corrected for counter
f l u c t u a t i o n (but not fo r physical decay) and were analyzed by
an IBX 7090 computer programed for an i t e r a t i v e l e a s t squares
a n a l y s i s (3). The parameters of the func t ion descr ibing
1 0 5 5 5 3 8 -65-
r e t e n t i o n in each animal were d e t e r d n e d and tested by t h e
Duncan-Krrmer test of comparison among means (4,s). The rate
and i n t e r c e p t parameters of the func t ions descr ib ing reten-
tion for each group were determined by t he computer, a long
wi th t h e s tandard dev ia t ion of each parameter. The va lues
(c /sec) determined on each day of measurement were subjected
t o t h e Duncan-Kramer test.
RESULTS
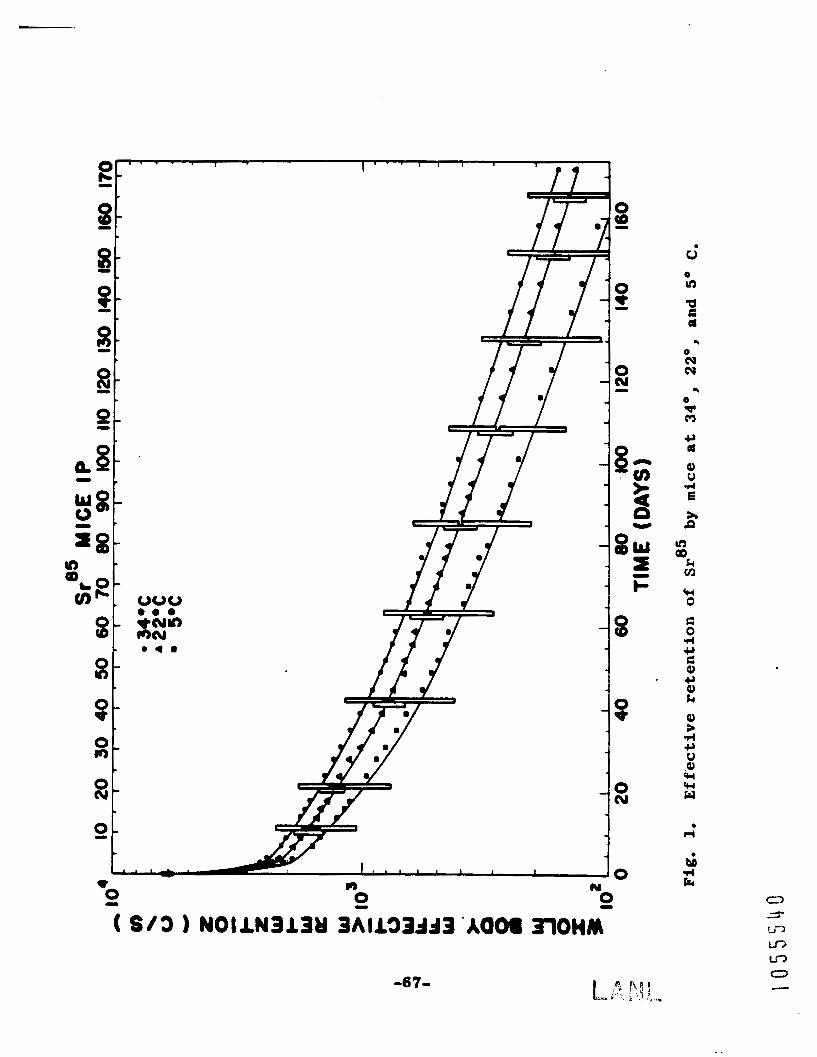
Three-component exponent ia l equation8 were f i t t o t h e
. r e t e n t i o n data of each animal and each group of animals. In
Fig. 1, where t h e u n i t s of t h e ordinate are a c t i v i t y ( i n
c/sec) and those of t h e ab8clssrr are t i m e ( i n days), p l o t s of
t he best f i t r e t e n t i o n func t ions for each group are drawn,
along wi th average va lues and v e r t i c a l bars t o show the range
of values.
of t h e data and are included t o Ind ica t e t h e assay time8.
Overlap in t h e range of values for t h e high and low tem-
perature groups is i nd ica t ed by t h e so l id por t ion of t h e
v e r t i c a l brr8.
t h e higher and lower va lues of t he 5' and 34' C animals,
respec t ive ly , throughout.
The average values were not used in t he ana lyses
The data iron t h e animals a t 22' C over lap
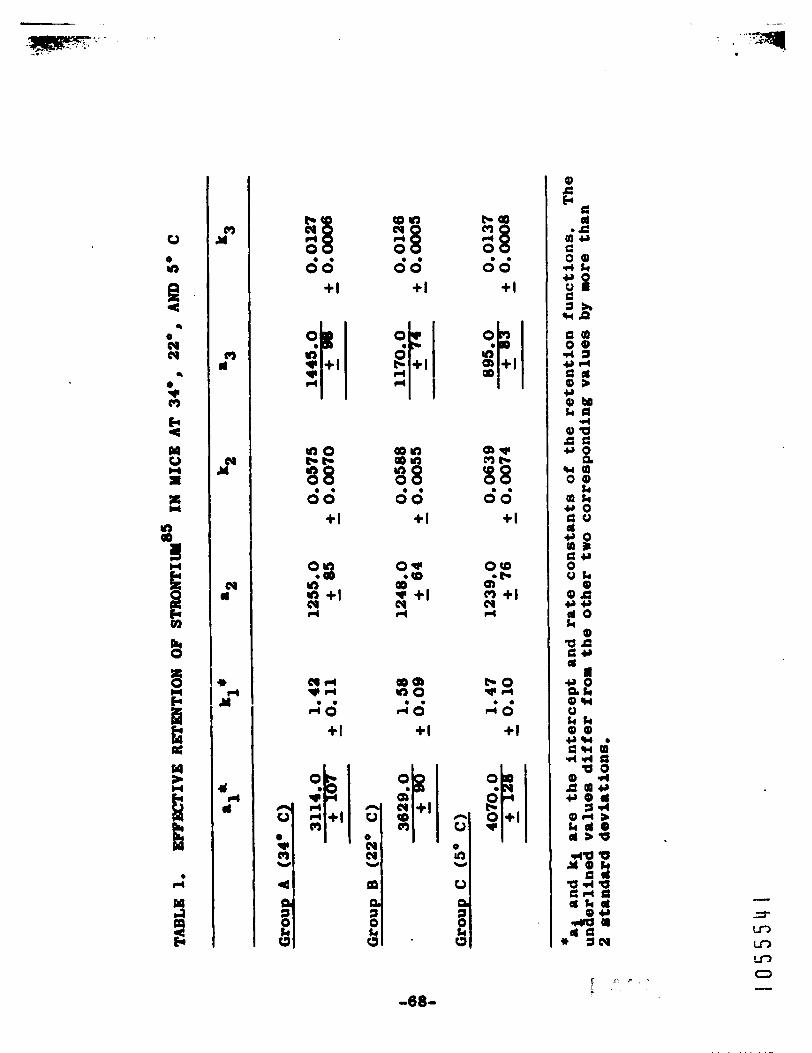
In Table 1, t h e va lues of t h e parameters d e m r i b i n g
whole-body e f f e c t i v e r e t e n t i o n are given wi th s tandard
1 0 5 5 5 3 9 -66-
a
0 n (Y 0 0 - 0
II
+I
?3 % +I 2
qj 0
o'd +
0 cy
m cy Y

P !
d O V ~ t i O ~ 8 .
from the paramotera of t he other two group. by mor. than
2 r t rnda rd dOVi8tion8 (P = 0.05). Tho r e t o n t i o n prramoters
obtainod from orch mou8e were rvorrgod, m d t h e mean values
The underlined prrrmotors (81 and as) d i f f e r
o f t h e prr8meters were subjected t o t h e Dunc8n-Kramer test
o f comparisons among means (P - 0.01). The r e s u l t s of t h i s
test agreed wfth r e s u l t s found above w i t h t h e add i t iona l d i f -
fe rence t h a t %, t h e rate constant of t h e t h i r d component
for the mice maintained a t 5 O , di f fe red from those of t h e
other two groups.
A dry-by-day comparison of t h e a c t i v i t y I n oach group
VIS made by a n a l y s i s of varlance and t h e Duncan-Kmmer test
of comparisons amongmeans. The day zero counts d i d not d i f -
fer s i g n i f i c a n t l y a t t h e 1 per cent level . The 34' and 5' C
groups differed s i g n i f i c a n t l y a t a l l times from day 1 t o
day 172; t h e 22' and 5' C teaperrture groups d i f f e r e d s i g n i f -
i c a n t l y from tho seventh t o t h e 172nd day., 8nd t h e 22' rad
34' groups differed s i g n i f i c a n t l y a t t h e 1 per cen t l e v e l
from t h e n i n t h day t o 172 days, with t h e exception of t h e
24th and 66th days, where t h e d i f f e rences were s i g n i f i c a n t a t
t h e 5 per cen t leve l .
DISCUSSION
We are amre of no tort.which wil1te.t for d i f f e rence

botroon rul t icorponont curnos.
corputor program aro not uniquo.
par8mater is not indopondant of t h e vr luos of the o thor prrrr-
The aolut ion8 der ived by t h e
Tho value given fo r any
.tor8 of tho function, T h O r O f o f O , tho t O 8 t 8 app1i.d 8re not
rppropriato, Tho 8810 re880nlng hold8 t r u e for t h e AOV test
8pp l i . d t o tho -up V 8 1 U 0 8 8t tho V 8 r i o u 8 88-p tire.,
bOC8U.O tho 8CtiVlty i n a I O U 8 0 on 8ny dry 18 not independent
Of the 8 C t i V i t p 8t 88rlIer the.. Although t h e 8igllfficmcO
lev018 do not 8pplyJ it 8 O . U C10.r th8t t h e i l l t O r C O # mr8a-
eter8 of t h a r e t en t ion func t ions differ . BOC8U80 there 8re
no r8to differences 8mng t h e m8t mpld ly moving c0mponent8~
The diffOrOncO8 8aong the me8.uroront8 are mall, The
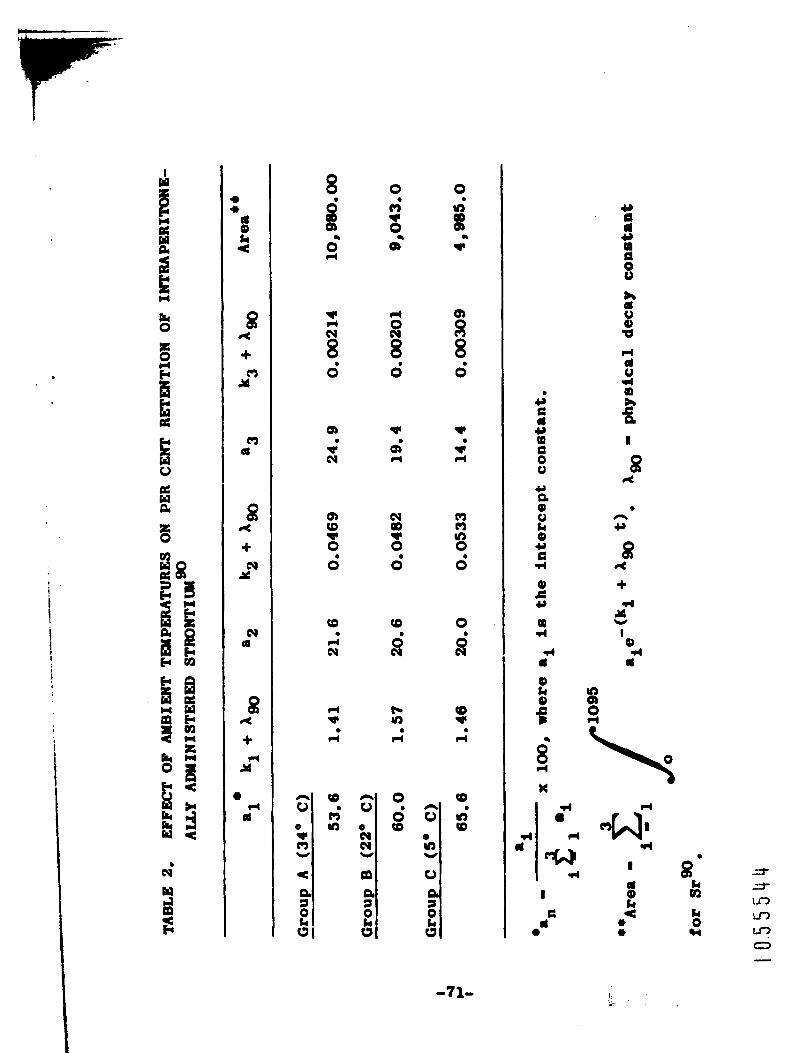
equi l ibr ium levo1 undor condi t ion8 of chronic exposure t o
t ion funct ion, would be 30 per cent lower a t 5’ C than st
22O C. Howevor, i f Sr (T1,2
t i m e body burdon In mice a t So C ( in t eg ra l between 0 and
1095 d8y8) 18 only h8lf that 8t 22’ C (Table 2). If t h e d l f -
ferencos nmng t he a r l l o s t rate coa8tants (%) are real ,
88 indlc8ted by t h e Duncan-ltrrrrer te8t8 then the s t r o n t l u r
i n t h e mo8t 810Wly noving pool 18 8ffoctod by t h e h ~ r 0 8 8 0 d
28 ye8r8) fS Umed, t h e l ife- 90
-70-
I O 5 5 5 4 3
!
* 0
< a 3 0
Y
I
- 1 0
o u a on’
& d P) k c
8 R
+ Y rn
rn 0
8 R
+ Y N
N 0
8 R
+ Y rl
rl d
0 4 % * *
Q,
8 8 d
f
w d
a
m 0 ua 0 d
0
cy d
(0 w rl
a
0
ua tD
a
-71-
rl 3
a Y E 3 0 OD E 0 0
+, a 0, u k Q) *, E rl
Q) E Y
OD rl
(I
Q k 0) E 8
rl
K 4
rl
%4 rl
I
E (I
Y a (1 0
a m
8 R 3 0 0) 0
I
8 R
0 n Y
rl Y
I v
0) rl 1
ua 0, 0 rl
\ d
I
3 0) k 4 * *
milo t o r p u a t u r e ma a f f e c t l v o in a l t e r i n g tho mount
Of 8," 108t a t the V 8 r f O U 8 =to., it 1. not Clear th8t
r e l a t i o n betrean s t r o n t i u a motabol1.r and onvlrormantrl tom-
poraturo is diroct as is that of O2 conrrurption and emvlron-
mental tnparrturo. The data proaentod her. suggest tbt
8 h O r t expo.uror ( -1 roak) a t tho.. t O ~ p O m t ~ r O 8 would r e 8 u l t
i n rmtontion patterns a f r i la r t o thoso pr.8ent.d in Fig. 1,
I ua1088 the d i f fe rence In the sxcro t lon rate found in t h e
a n h a 1 6 expo8ed t o cold 18 re8l.
J. E. hrrchnor and C. R. Richmond, J. Appl. Phpsiol. - 18,
786 (1963).
R. L. Schuch, LO8 Al8-S S c i e n t i f i c LaboMtory Report
LAYS-2455 (lseO), p. 105,
R. 8. Yoore and B. It. Zeiglar, Lorn Alaros S c i e n t i f i c
L . b o ~ t O ~ B.p~rt LA-2367 (1960).
DO B e I)UIIC81D, B I O - t r I C S 11, 1 (1955). - C. Y. I t r u O r , B i O r e t r k 8 12, 307 (1956). -
Richmond, J. E. Furchner, and J. E. London)
INTRODUCTION
Beforo 18rge rniruls can be U8.d in t r a c o r s tud ies ,
their n a t u r a l g8nun8-ray a c t i v i t l e 8 murt be accurately meas-
wed, This a c t i v i t y normally i s comprised of K40 and Cs 137 . mi. report summarizes our finding8 for 20 beagle hounds
which were mea8urod pr ior t o low-level tracer experlmento.
METHODS AND MATERIALS
&ch animal was thoroughly washed and dried before
being counted fo r 25 minutes i n t h e Los Alamos Human Counter
(Humco 11). The counting t i m e was divided into three 500-
second periods, each of which was preceded and followed by
a SOO-aecond background measuremdnt on t h e animalt8 cage.
Asups were repeated on 9 of t h e animal8 roughly 1 week
followhg the f l r r t mea8urement. Bumco 11 Cs 137 and IC 40
standard8 were a180 meamred wi th e8ch animal.
ing data were pr0~088.d by a modification of a computer
aothod progrr~med for t h e IBM 7090 by E. C. Anderson of t h e
Xm-Level Counting Section.
amount of potassium i n t h e animal from t h e rnim8lts IC4'
Raw count-
This program w i l l c r l c u l a t e t h e
-73-
8econd are emitted from
The t o t a l Cs '3' level ,

. .' .
cutpori.mntal m a l background8 in tracer experiments.
RS8ULTS M D D18CU8SIOn
It i 8 intoromting t o not. t h8 t tho amount of pota88lum por
kilogram body w i g h t is es8en t l a l ly t h e 8810 a8 that f o r
hurrn mbjoct8. A1-D t ho t o t 8 1 Csi3' burden8 (pc Cs137/g K)
are very comparable t o thoso for hurrn subjoct8 8t that
p a r t i c u l a r time (JunO-JUly, 1962). Tho replicate measure-
r e n t 8 8UggO.t th8t t h e IC4' determination i 8 somewhat more
reproducible than t h e CS337 determination, Thi8 18 becau8e
t h e prec is ion of the Cs137 meam~rerent is not a8 good 88 t h e 40 4 t o 5 per cant for E . Ago- or sex-dopondent t rend8 were
becou apglront.
v r r ~ t ~ o r r of laboratory 8 n h 8 l 8 is le88 than for human rub-
A l s o , kcau8e tho genet ic and environnontal
ject.8 on. r i g h t expect t o f i n d smaller v a r l r t l o n ~ in those
parueterm which are related t o body potassium content.
-74- 1 0 5 5 5 4 3
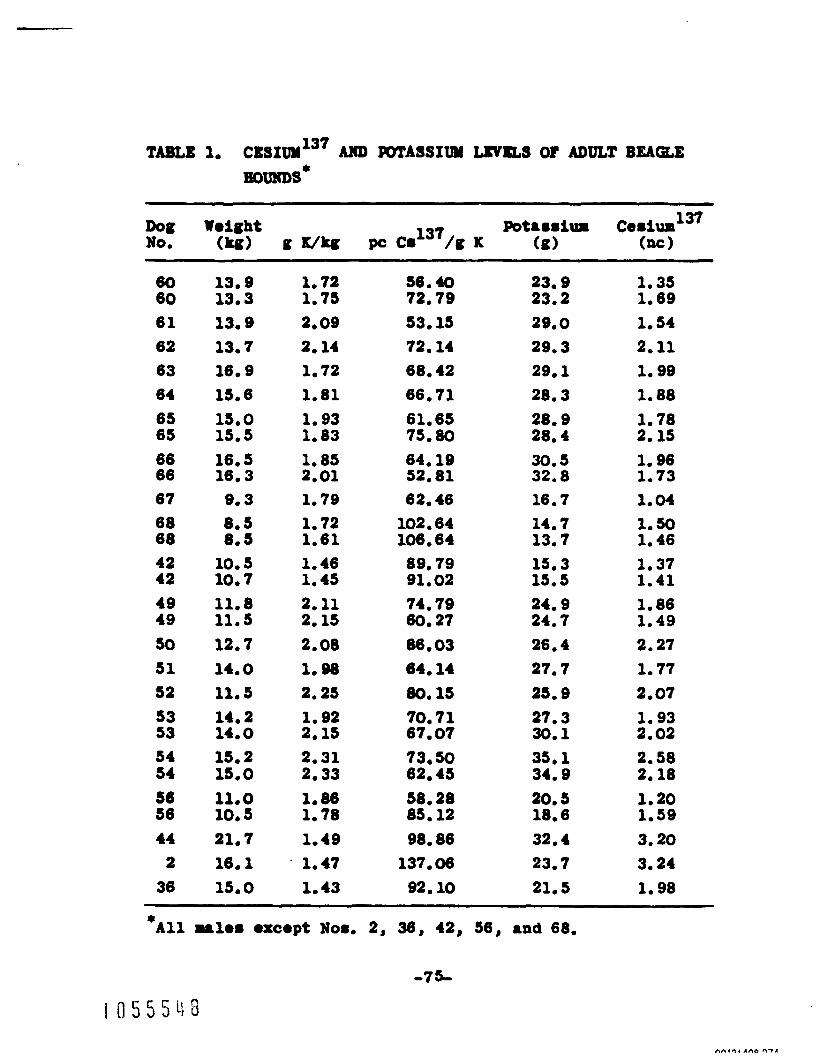
TABLE 1, CESIUY 137 AND POTASSIUM W V I L S OF ADULT BEAQE HOUNDS*
60 60 61 62 63 64 65 65 66 66 67 68 68 42 42 49 49 50 51 52 53 53 54 54 56 56 44 2 36
13.9 13,3 13,9 13.7 16.9 15.6 15.0 15.5 16,s 16.3 9.3 8.5 8.5 10.5 10.7 11.8 11.5 12.7 14. 0 11. 5 14. 2 14. 0 15.2 M a 0 11.0 10.5 21.7 16.1 15.0
1.72 1.75 2,09 2,14 1.72 1.81 1. 93 l a 83 1.85 2, 01 1.79 1.72 1. 61 1.46 1.4s 2.11 2.15 2. 08 1.98 2.25 1.92 2, IS 2.31
1,86 2.33
1, 78 1.49 1.47 1.43
56.40 73.79 53.15 72.14 68.42 66.71 61.65 75.80 64.19 52.81 62.46 102.64 106.64 89.79 91.02 74.79 60.27 86.03 64. 14 80.15 70.71 67.07 73.50 62.45 58,28 85,12 98.86 137.06 92.10
23.9 23.2 29. 0 29.3 29.1 28.3 28.9 28.4 30.5 32.0 16.7 14.7 13.7 15.3 15. 5 24.9 24.7 26.4 27.7 25.9 27.3 30.1 35.1 34.9 20.5 18.6 32.4 23.7 21.5
1. 35 1. 69 1.54 2.11 1.99 1. 08 1. 78 2-15 1-96 1.73 1.04 1.50 1. 46 1.37 1.41 1.86 1. 49 2.27 1.77 2.07 1.93 2.02 2.58 2.18 1.20 1.59 3.20 3.24 1. 98
* All =le8 .xc@pt NO., 2, 36, 42, 56, 8nd 68,
R o Bichwnd 8nd J. E. London)
method.
METKODS IWD MATERIALS
Four U108 O f 88Ch SwCieS Were U 8 0 d 8 f t O r 8 %Week
period of 8ccl inut ion in indivldu8l met8boli88 c8ger.
on body weight (l), gro88 dent i t ion, m d information from
suppl ierr , we e8tbrte t h e a-8 t o rrnge between 3 8nd
Bared
4 yerrr, E.Ch non-rne8thetlzed 8n-1 W 8 8 given .bout 1 PIC
of tritium water (HTO) by parenter81 rdaini8tr8t lon. The
volume of t h i8 Mterh l W 8 S about 0.5 al.
weighed before rad 8fter in j ec t ion t o de te r r ine t h e e u c t
amount adaini8tered. Animals were 811owed water 8d libitum
during tho experiment.
Each Syringe W 8 8
Sample8 of venou8 blood ware wlth-
drawn from t h e MphO~OuS vein on dry8 2, 7 , 10, 14, 17, and
21 af te r inject ion. Pure water '1.8 obtr ined from each
Spmple by 8 V8CUum d l 8 t i l l a t l o n procedure modified after
Cooper et a1, (2). Grch 88mplo -8 di8till.d to dryn0.m t o
-76-
avotd any pos8ible i r o t o p i c f r ac t iona t ion effects.
rl of arch HTO sample p lus 0 . 5 ml d i s t i l l e d mter and 15 m 1
8 c i n t i l l a t o r s o l u t i o n (3) were added t o a count ing v i a l 8nd
counted In a Prckard T r i - a r b counter. Adequate d i l u t i o n s
of t h e injection so lu t ion were also counted.
ratos (count8 per minute per 0.5 m l body w8ter) were f i t t e d
as a func t ion of t i m e (days) by an e lec t ron fc computer (IBH
7090) t o ob ta in t h e best f i t t o t h e data. No logarithmic
transfoxmation8 are made in t h i s procedure. Figure 1 shows
data f o r 1 animal (Macaca mulatta, No. 8 ) .
One-half
The count
Body water determinat ions were made according t o t h e
tritium d i l u t i o n pr inc ip le . However, body water eamples
were not obtained a t some assumed time of equi l ibr ium between
t h e flT0 and the body water.
regression func t ion which describes the decrease in body
water HTO a c t i v i t y m s used. Val id i ty of t h i s procedure
has been descr1b.d previously ( I ) .
Snstead, t h e intercept of the
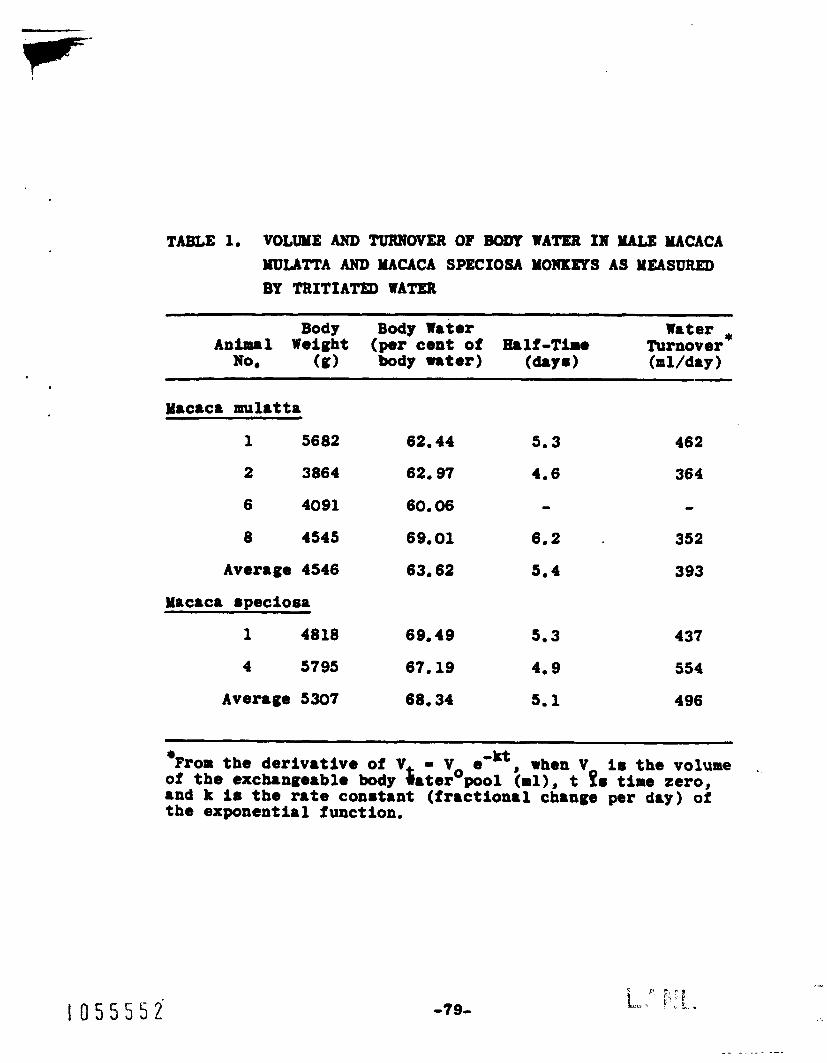
"able 1 8ummarizes body water, half-t irs, and turnover
data f o r these animals.
Is q u i t e good. No stat is t ical tests were run beC8u.e of t h e
The agreement between t h e t w o species
-11 number of animals. Two of the Y. speclosa monkeys
(not shown in Table 1) gave apparent body water voluaeg and
half-tiapes of 70 t o 80 per cent of body weight and 8bout
2 d8y8, re8pect ively. There miul8 were later found t o be
haavi ly infested wi th hookworms.
-77- P- I C "
I 0 5 5 5 5 0

Id'
Id'
I I J I I
TRITIUU WATER- YULAtTA *8 SINBLE PIARENTERAL Aoo1WtSTRATIO)J
ACTUAL POINTS
I I 1 I I 4 a tt m It0
, TINE AFTER ADY, tDAYS)
Fig. 1. Change Aa body HTO 8padfaC act iv i ty Versus days after administration for 1 u l o Y. mul8tta ronkoy.
F-
TABLE 1. VOLUME AND TURNOVER OP BODY W A m IN MALE MACACA MULATTA AND YACACA SPECXOSA YORltEpS AS MEASURED BY TRITIATED WATER
~-
Body Body Water Water * A a b u l Weight (per cent of B.lf-Tlme Turnover NO (e) body water) (by.) b l / d a y f )
Macac8 mulatta
1 5682
2 3864
6 4091
0 4545
Macaca speclosa
1 4818
4 5795
Average 5307
62.44
62.97
60.06
69.01
63.62
69.49
67.19
60.34
5.3
4.6
462
364
- - 6.2 352
5.4 393
5.3
4.9
5.1
437
554
496
From t h e d e r i v a t i v e of V - Vo cow, when V I s t h e volume of t h e cxchange8ble body L t e r pool (ml), t fs time zero, and k l o t h e rate constant ( f r a c t i o n a l ch8nge per day) of the exponential function.
i o s s s s i
-- -
t:' 5 . f:
ROmp.ctive turnover v r lues of 393 8nd 498 rl p.r dry
for t h o Y, wl8tt8 8nd Y. speclou are in good aqreemont
with valua8 of 411 8nd 465 rl per day a8 predic ted by i n t e r -
spacific relations glvon by Richmond et a1. (4).
Additioml coapr8tiv. atudi.8 U 8 h g g 8 - - O d t t h g
radionuclide8 rnd whole-body counting technique8 are now i n
mom.s*o
REFERMCES
(1) G, van W8genen 8nd H, R. C8tchpol0, Am. J. Phyrr.
Anthropol, - 14, 245 (1956).
(2) J, A, Do Cooper, N, S. Radln, and C, BOrden, J. Ub.
Clin, Had, 52, 129 (19S8).
Por l i t e r 8oluto composition (E-dioxane so lvont ) ;
0,375 g 2,S-diph~nyloxrzole, 7.5 g 2,2'-p-@enylene-
- (3)
bi8- ( b - p h O ! h p l o ~ l 8 ) .ad 125.0 Q nrrphthrlene.
(4) C, R, Richmond, W, H. Lugham, 8nd T. T. T17131ll0,
J, C e l l , Compo Phy8ia1. 59 45 (1962). -'
,
YAIQULIAN YETADOLIbY SECTION
HISLXCATSONS
Met8boll.r of Radionucllder in Man818, 11, Retention of
Iodine 13’ by Four Yamm8llan Species, Health Phys. - 9, 277
(lW3).
(2) J, E, Purchner and C. R, Rfchmond, The Effact of
EavIronront81 Terpor8turo on the Betontlon of C o ~ I u r ~ ~ ~ by
Mice, J, Appl, Phyd.01. - 18, 786 (1963),
(3) C. R, Richmond, J, E, Furchner, G, A, hrfton, and
W, E. Itragham, Corpar8tive Yet8boli.r of Radlonuc1lde8 In
MI11.18, I, Upt8ko 8ad Rotaation of Orally Adm&nirtmred
Z i d ’ by F O W Yarrulian S p O C i O 8 , E u l t h my.. - 8, 481 (1962).
-81-
(1) C. R. Richroad, J. E. m c h n o r , P. 1. 0.81, and P.
Y c U l l l i . ~ , Eloctronic mOC088ing and h8lJl l i8 O f Met8boliC
Data, 8cceptod for public8tion i n Ho8lth Phyr.
-a2-
.-
.
CHAPTER 3
MAMMALIAN R A D I O B I O ~ SECTION
Corpr r r t l ve Funduonta l Physlologlca1 Parameters of Yacoca mulatta and a New Laboratory P r a t e , Yacaca speclosr (J. C.
Hen8l.y and C. R. Richmond)
Four male Yacaca speciosa monkeys were received by
Group H-4 a8 a possible experimental prlmrte for radloblolog-
Ical s t u d l e a where frequent handling I s necessary.
mul r t ta is recognized t o be a hearty laboratory pr imate (l),
but Its Inherent f lerce nature f requent ly precludes exper-
imental procedures rhare handllng is required. Only expe-
r ienced crret8ker personnel can capably handle Y, mulatta,
and ofton theme personnel are se r ious ly in jured In handling
proc.d~O8.
Yacaca
Tho 4 Y. speciou i n t h i s colony h8ve demonstrated
remarkable doc i l i t y . Common veter inary c l i n i c a l procedures
are performed with a n ease equfvalent t o h m n pediatric
t 0 5 5 5 5 b
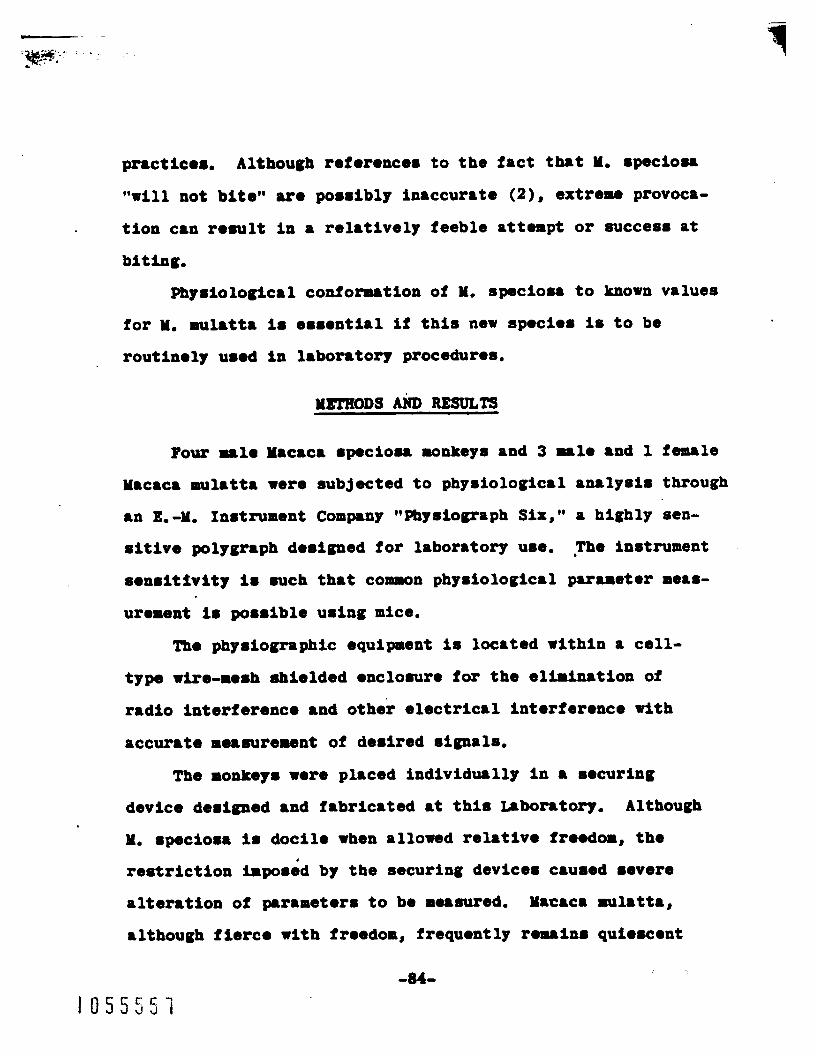
pr rc t i co r , Although references t o t h e fact th8t Y, specio88
" w i l l not bi te" are pos8ibly Inaccurate ( Z ) , extreme provoca-
t i o n can r o s u l t in a r e l a t i v e l y feeble attempt or succes8 a t
bi t ing.
Phyriologicrl conformation of Y. 8peciou t o known values
f o r Y. mulr t t8 is e s s e n t i a l i f t h i s new specles I s t o be
rout inoly u8.d in lrborrtox'y procedures.
YETRODS AND RESULTS
Four n l o MlrC8C8 s p e c i o u monkey8 and 3 u l e and 1 female
Yacacr mulr t ta were subjected t o physiologicr l a r l y s i s through
811 E.-Y. Instrument Company **Phy8iograph SI%,*' a h igh ly sen-
s i t i v e polygrrph d@signt9d for laboratory use. ,The instrument
SOn8ItSVIty 18 mch t h 8 t common php8b1ogiC81 parmeter meas-
urement is po88ible us ing mice.
The phy8IogmphIC OqUiment i 8 l O C 8 t O d within a cell-
type wire-mesh nhielded enclosure for the el iminat ion of
radio in t e r f e rence 8nd other electrical in t e r f e rence wi th
accura te measurement of d08irOd rignals.
The monkeys were pl8ced individual ly in 8 securing
device demignod rnd fabricated a t t h i s L8borrtory.
Y. speciosa is docile when allowed r e l 8 t i v o freodom, the
r e s t r i c t i o n irpos6d by the securing device8 caused severe
a l t e r a t i o n of pararetars t o bo measured. M 8 c a C 8 mu l r t t r ,
although f i e r c o w i t h freodom, frequont ly remain. quioscent
Although
-04-
1 0 5 5 5 5 1

when 8@curOd but w i l l b i te or scratch t h e oper8tor a t every opportunity. Thorof ore, 5 -/pound body woight of ''Tranvet , **
a corarPerci.1 animal t r anqu i l i zo r , war admini8torod t o pro-
c lude a l t e r a t i o n of phyriological pramoterm by hyperaxcit-
8 b i l i t p or movement.
A l l phyriological test8 on each monkey were monitored
8hul t8neou8ly ; however, each parametor wa8 t r e a t o d both
ind iv idua l ly and co l lec t ive ly . Comparisons were made on
e8tablished equiva len ts for Y. mulatta, data acquired from
Y. mulatta in t h i s colony, and data acquired from t h e Y.
speciosa mentioned above. Although neurological s t e r eo tax ic
Upp ing and psychological s tud ie s have been made on M.
spociosa (2), no l i t e r a t u r e is ava i l ab le regarding their
phy8iology. The M. mulatta and Y. speciosa used In t h i s
study were between 2-1/2 t o 3-1/2 years of age.
Body Weights
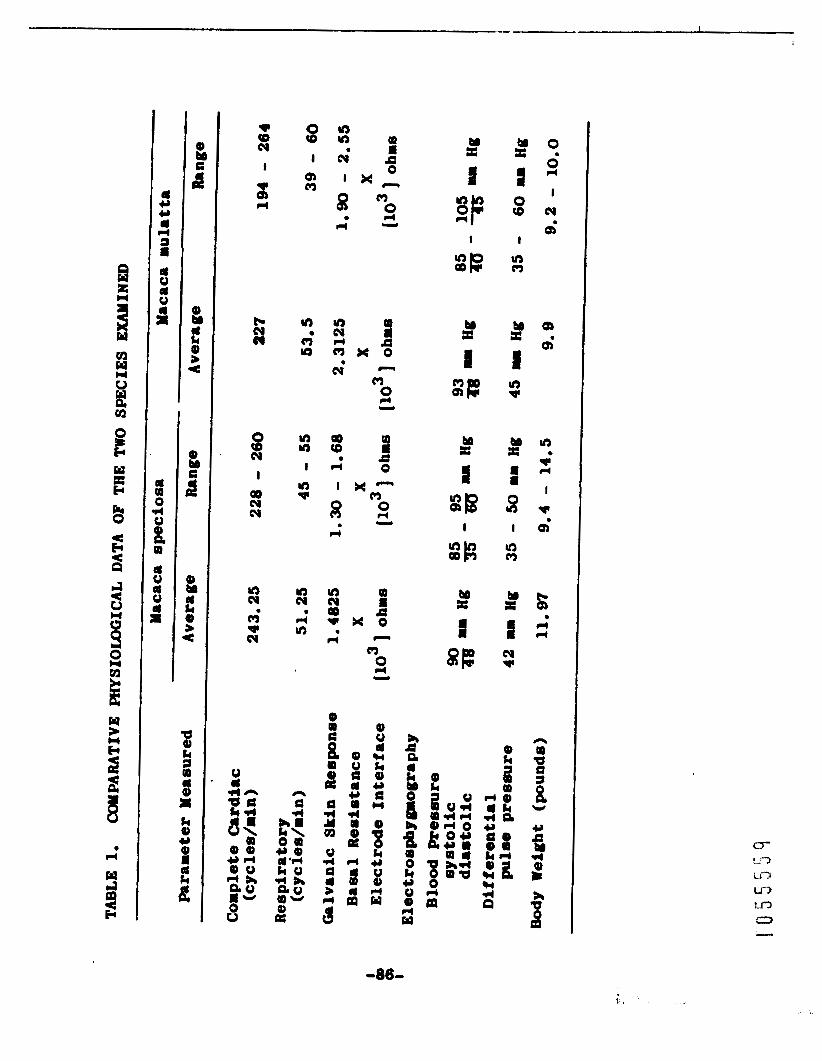
Table 1 is a compnriron of t h e p.rameter6 mea8ured. The
average body weight of t h e Y. rulat ta 8elected a t random and
aged from t h i s colony as 3 year8 of 8ge was 9.9 pounds. The
average body weight of t h e 4 Y. spociora was doterained t o
be 11.97 pounds. The weight ranges were wider in M. speciosa,
however .
-135-
Q) M
i
%: E P) * 4
0 rl
li n d
t a i
3 4 ) $ M 3 3
> c : 3
B 8 k 7 w
a k 4) Y Q) I 6
2
P In cy d E m x o
n cy 0
(3 0 P4 Y
OD OD rD I
E .~ d 0 I L c -
s Y
d
d w cy a OD P W H O
8 n d
m 0 r( Y
b) X
f d ".P
1
as M %
P SC
M E
I 2B
2E I
M X
: 8E
sr P a
M r f 0 rD
I
In m
Y X
a 0 *
M X 8 8
3 I
d m
M x a N 9(

Electrocardiographs
.
Aninul8 wore placed In t h e r e s t r a i n i n g device, and t h e
correct t r a n q u i l i z e r dore was administered intramuscularly
In t h o lef t thigh. Eloctrodes nocosu ry fo r a l l p8r.aaeters
were 8ecur.d t o record the ~ l ~ C t r O C 8 r d i o g r r m and resplrogram
slmultaneously. EKG leads were placed a t poin ts determined
by A t t a and Vance (3) a8 best suited t o record t h e p o t e n t i a l s
t o t h e r i g h t v e n t r i c l e , septum, and left ven t r i c l e , Poten-
t i a l e from t h e r i g h t v e n t r i c l e were measured best wi th lead
one electrode implanted beneath t h e s k i n I n t h e fou r th r i g h t
i n t e r c o s t a l space a t a d i s t ance of 4 c m from t h e midsternal
l i ne . Septal p o t e n t i a l s were measured best on t h e opposite
side of t h e chest a t a point rymmetrical t o lead one. Since
t h e animals were upr ight rather than supine, l e f t vent r ic -
u l a r p o t e n t i a l s were a l s o monitored from lead two. Sterile
needle electrodes were placed under t h e shaven sk in a t t h e
above points . These leads were connected t o a hl-gain pre-
amplif ier through a sh ie lded input extension cable. A t i m e
cons tan t s e l e c t i o n of 2 seconds was made, as t h i s constant
waa found t o monitor t h e low frequency response f a i t h f u l l y
t o allow reproduct ion of a l l components of t h e EKG. The
preamplifier was calibrated so t ha t a l -mi l l i vo l t impulse
cau6ed a pen d e f l e c t i o n of 1 cm.
2.5 and 5 cm/sec were used. Auscultation revealed no
Recording paper speeds of
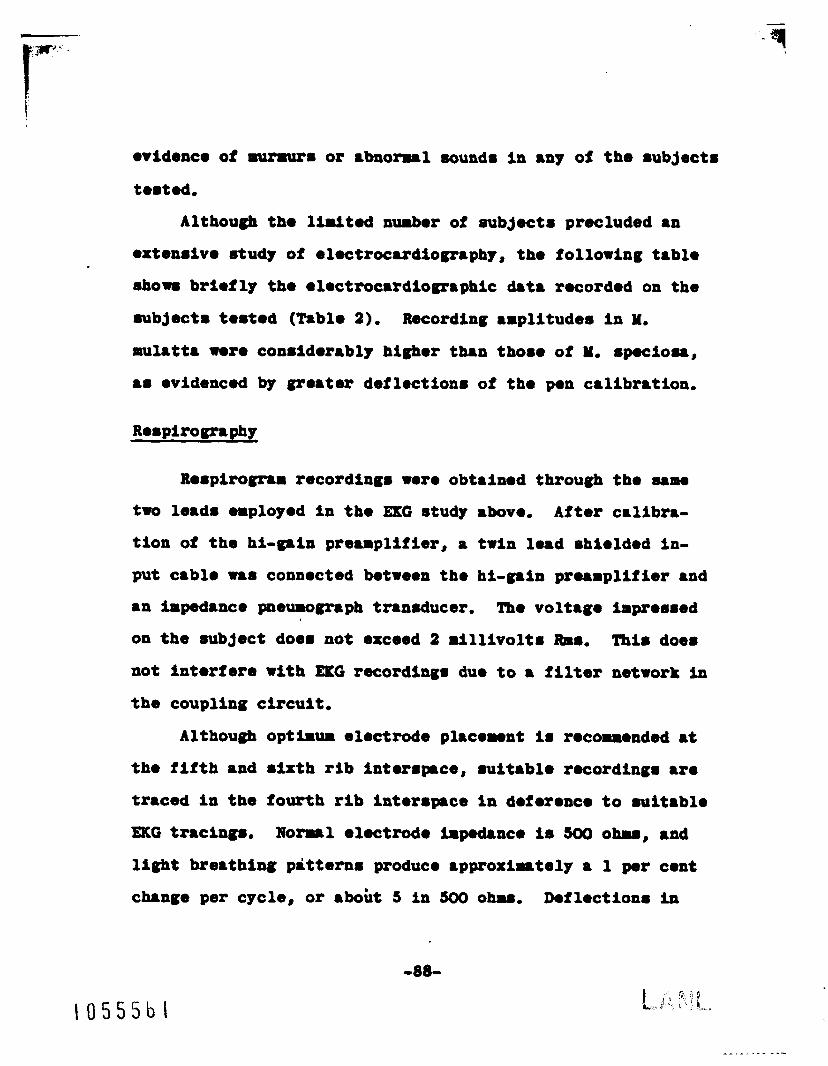
ovldence of murmur8 or rbnorrrrrl sound8 i n 8ny of tho 8ubject8
te8ted,
Although tho limited numbor of Subject8 precluded 8n
OXtOn8lVO e u d y O f OlOCtr0C8rdiOgr8phy8 tho following t 8 b l O
8how8 b r i e f l y tho O l O C t r 0 c 8 r d i O g r 8 p h i C &t8 rocordod on t h e
ml8tt8 wore con8idor8bly highor than tho88 of Y. 8p.cl088,
88 8videnc.d g rea to r def loct ion8 of t ho pori c 8 l i b r 8 t b n .
R08pirognr rocordlng8 woro obt8ln.d through tho 88mo
tWO h8dS e r p l o y ~ d I n t h o mG Study 8 b o V O . After c8llbra-
t i o n of t h e hi-gain p r e u p l i f l e r , a twin lead shielded An-
put Cab10 -8 ComOcted betreen t h e hi-gain p r O 8 B p l I f b r 8Bd
8n impedance pneumograph tmn8ducer.
on t h e 8ubJoct d m 8 not oxceed 2 r i l l l v o l t 8 -80
not l n t o r f e r o wi th EKG recording8 duo t o a f i l ter network i n
t h e coupling c i r c u i t ,
The volt8ge inpremed
Thi8 doe8
Although optimum electrode pl8comont I 8 rocouonded 8t
tho f i f t h and 8 l x t h rib intorrpace, 8uit8blo recording8 are
traced In the four th rib inter8pace in doforoncm t o m i t a b l o
X G t r ac ing r .
l ight bre8thlng p i t t e r n s produce approxinately a 1 per cont
change per cycle, or rtmirt s in 500 OW.
Normal electrode irpodance I 8 500 ohma, and
Defloction8 irr
-80-
1 0 5 5 5 b l

TABLE 3, ELECTWRDIOGRAHIIC MALYSIS
Yacrca mulrtta
Yoa.uromoat M8C8C. 8peCi088 ]Lo8 A h - 8 Normal Ranges ~ ~ ~~
M t O A V O r r g O 243/min 227/ria 160 - 333
P-R 1nt0rvri 0,087 w8.c 0.064 E/8OC 0,047 - 0.100 QRS Dur8tion 0.041 m/80c 0.065 m/sec 0,020 - 0,036
Q-T Intorvrl 0,116 m/moc 0.195 d s e c 0,107 - 0,200
1 0 5 5 5 b 2 -89-
-- I
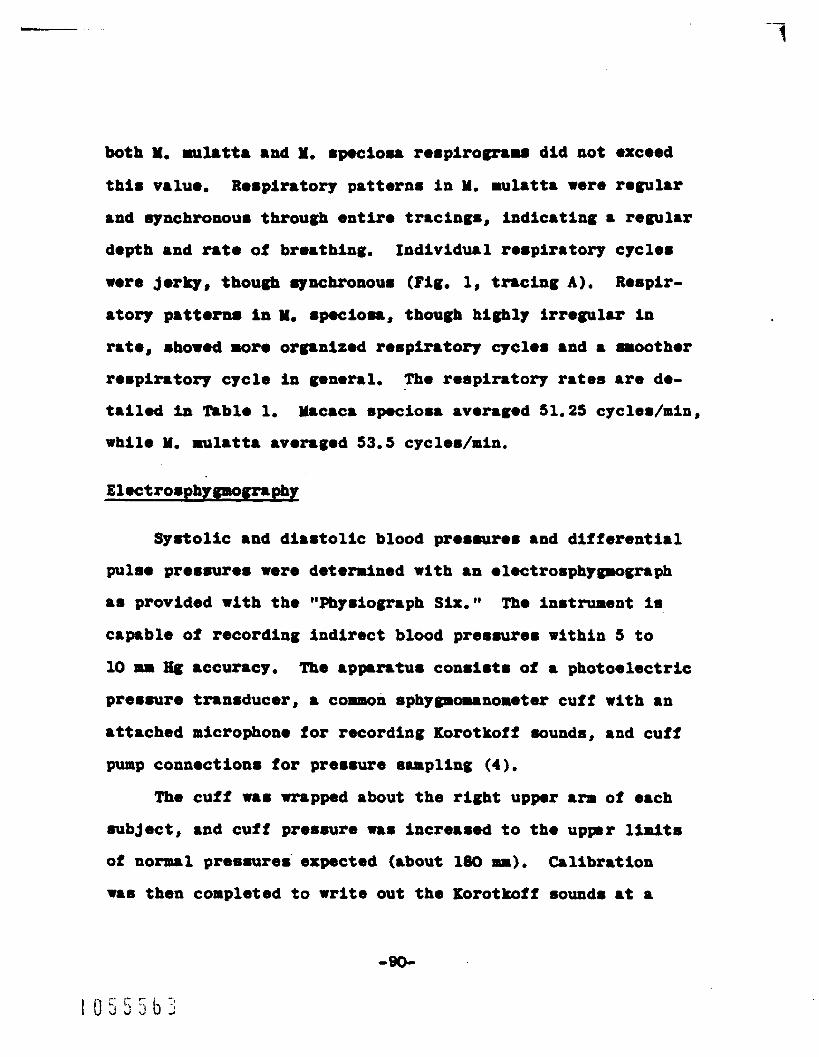
both Y, mal8tta 8nd Y, 8p.ciosa respirograu did not exceed
t h i 8 Vllue, RO8pir8tOry p a t t e r n s i n Y. m U l 8 t t 8 were regu18r
and synchronou8 through e n t i r e t rac ings , ind lc8 t ing a regular
dopth 8nd rat0 of breathing. Individu8l ro8plr8tory cycles
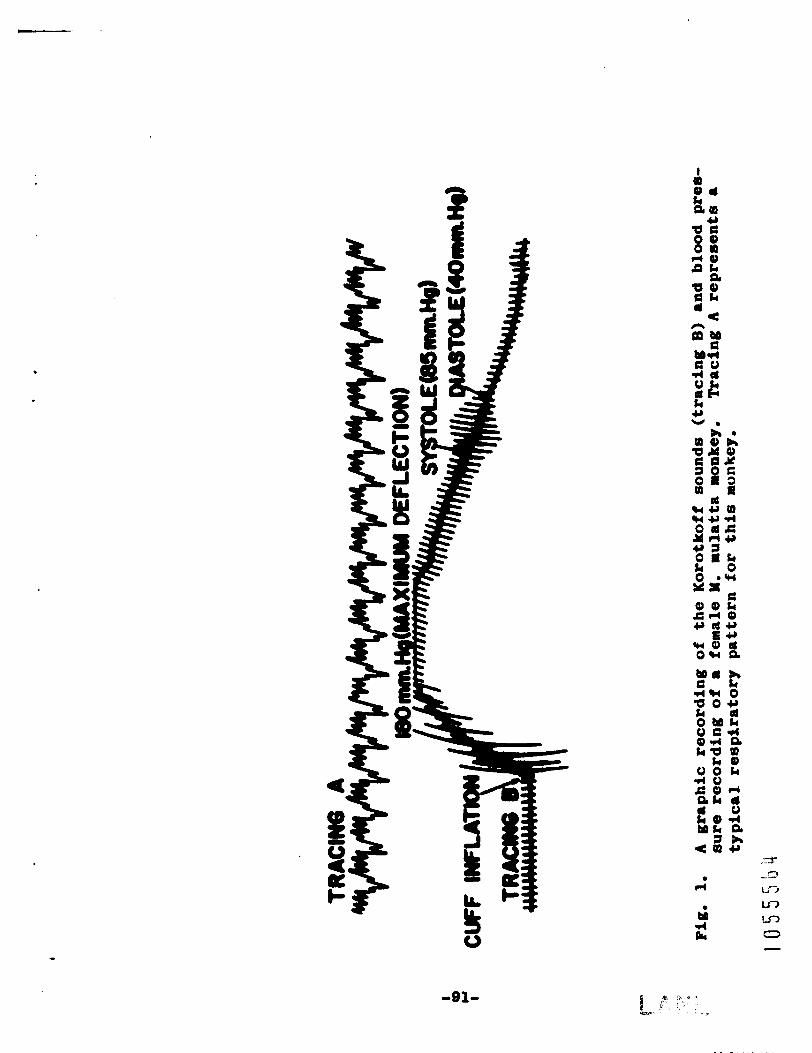
were jorky, though aynchronour (Fig, 1, t r a c i n g A). Respir-
atory pattorn8 in Y, 8pocio8a, though h ighly i r r e g u l a r I n
rate, 8how.d mom organized r o s p i r r t o r y cycle8 8nd a smoother
r e sp i r a to ry cycle In general , The r e sp i r a to ry rates are de-
t8il.d fo. Rble l. M8C8C8 S p O C i O 8 8 averaged 51.25 cycle8/min,
wh i l e Y, mulrtta averaged 53.5 cycles/min.
Eloctro8phygmogr rphy
Systol ic rad di88tolic blood pr088uro8 and d i f fe ren t181
pulso presmrro8 were de ter r ined wi th an electrosphygrograph
as provided with tho Vhy8iogrrph Six," Tho in8trument is
capable of recording i n d i r e c t blood proamre8 within 5 t o
10 111 8CCUIP.CJ. The 8pmmtUS COn8i8t8 Of l photoelectric
premmre transducer , 8 c0-n sphygmounometer cuff wi th an
attached microphono for recording Korotkofi sounds, and cuff
pump connect ions for promsure sampling (4).
The cuff W 8 8 wrapped about the r i g h t uppor a m of arch
subdect, and cuff pressure w 8 s increr8ed t o t h e upprrr limits
of normal pressures' expected (about le0 nm). Calibrat ion
w8s then completed t o W r i t 0 out t he Korotkoff 8owd8 8t a
P Y
-91-
roasonrble magnitude. Cuff pressure was t han incr088Od u n t i l
t h e upper l i m i t was once again 180 UUE Hg. While recording,
t h e pressure was slowly released t o zero. The t r a c i n g
(Fig. 1, t r a c i n g B) shows an increased pen d e f l e c t i o n a t t h e
occurrence of t h e s y s t o l i c pulse and a severe decrease In
magnitude a t t h e occurrence of t h e diastole, Macaca speciosa
averaged 90 u H g s y s t o l i c pressure and 48 mm Hg diastolic
pressure, while Y. mulatta averaged 93 mm Hg s y s t o l i c and
48 mm Hg dias to l ic pressures. Table 1 presents t h e varia-
t i o n s noted.
for M, specloaa aud 45 mm Hg fo r Y. mulatta (Table 1).
pulse pressure d i f f e rences a v e n g e d 42 mm Hg
Galvanic Skin Response
Since many s t i m u l i w i l l i n c i t e t h e galvanic skin
response, or psychogalvanic ref lex, basal skin r e s i s t a n c e
was measured t o de te rn ine a basal emotional quot ien t f o r
these animals. This, in effect, correlates t h e o r e t i c a l l y
wi th aggressivenems or d o c i l i t y of t h e two species of pr i -
mates under Inves t iga t ion . Relationship8 are only hypothet-
ical, as observed d o c i l f t y or aggressiveness cannot be meas-
ured In any other way with mathematical e f f ic iency .
fore, we must assume that basal skin r e s i s t a n c e is a func-
There-
t i o n Of basal pEYcholOgiCa1 pos i t ion 88 Syrp8thOtic 8 t - U l i
evoke l e v e l s O f CeIp~nbO, r h i b prr88ymp8thetiC 8tFPruli
i n h i b i t or reduce l e v e l s of reaponne (5).
Two oloctrod.8 (one a ground eloctrode and t h e other
tho 8on8ing eloctrode) are attachad to t h e aalrrl. Both are!
plats electrodes, t h e formor attachod t o t h e ventrum of t h e
rri8t rad tho latter t o t h e dorwr of t h e index finger. The
r ight forean ram used i n a l l instances,
A con8tant DC curren t of 20 microaspores 18 applied t o
$he electrodes, and t h e vol tage across t h e electrodes is
then umplified and recorded.
vol tage acro.8 the electrode8 I 8 di rec t ly proportion81 t o
t h e electrode re8iatance. Any given ohmic l e v e l of reuist-
ance a t t h e electrode i n t e r f a c e rill then be recorded a8 a
With constant cur ren t applied,
conotant amount over t h e basal e lec t rode res i s tance , varying
from 0 t o 1 x 10 ohms. 6
After zero c a l i b r a t i o n , t h e galvanic skin re8ponse pre-
amplifier i 8 switched t o record direct current .
skin remi8trnce inherent in t h e animal causes a r i d e deflec-
t i o n of t h e recording pen. Recal lbrat ion t o zero l e v e l then
determlnos the basal i n t e r f a c e r e r i a t a n c e between the elec-
trode. attached t o t h e aninul.
th8t calAbr8tlon love18 for Yo m u l r t t r are 64.1 per cen t
The basal
One would note in Table 1
higher than those f o r Y. speclosa, i n d i c r t i v e of a greater
re6pon.O t o t O 8 t h g procedures, though not v i s i b l e grOS81y
t o t h e ob8ervar.
renders equal nonchalance t o experimental procedure, we must
Since w e w i l l a88ume t r a n q u i l i z a t i o n
c I ' -93-
C O ~ ~ U ~ O th8t tho 8#grO88iVO naturo Of Yo r U l 8 t t 8 88 OppO..d
t o Y. mp.ciou is .ti11 . ~ p ~ r i o r ~ rog8rdl.88 of t r anqu i l i t . -
t i on , On0 ui then conclude 8 uth-tic81 quot ien t for
d o c i l i t y or 8ggr088iVOn.88 a8 ob8em.d In t ho norm81 c8g.d
a n i u l .
DISCUSSION
A compri8on Of t ho t W Y8C.C. 8 p O C h 8 i n qUO8tiOn 80-
t o i n d i c a t o 8 r o u r b b l o 8hll8ritt. D f f f * r m C O 8 , except
g r lv8a lc 8kln re8pen8e8 are s l i g h t and would not b a 8 l c r l l y
al ter romlt8 of experiment8 where Y. 8p.cio88 I s 8ub8tltutod
for Yo mulatta.
The M. 8pocio88 u8.d in t h i 8 study woro but recont ly
8cquirOd, After a r r l V 8 1 , 08ch 8 n l U l W 8 8 8ubjOct.d t o
c l i n i c a l e x a d r u t i o n , tuborculos i8 t ea t ing , t r e r tmen t for
i n t e s t i n a l pU88it08, 8nd a n t i b i o t i c thmr8py. A l l p r i m t o 8
rrrlving at t h i n Laboratory 8ro aubjoctod t o rigoroum t o s t -
ing 8nd OX8BllutiOn OVOr 8 60-d8Y poriod, l f U t r i t i O m 1 8t8t.8
of t he Y. 8p.Ci088 roceloed were l o w 8nd po88ibly beno8th
that of tho Yo wlatt8 tested, which havo boon I n t h i 8 colony
for 3 yoarm rinimur under optimum enviroruent81 condition8.
Howovor, one notes that body ro igh t rang08 8re c o n 8 i d e r 8 b l ~
higher for M, '8p0CiO88 ,
t o b. c l l n i C 8 l l y 8ound bofore php8iOlOg%C81 O V 8 l U 8 t i O l L
A l l 8 n h 8 1 8 t O 8 t . d WOPO dotominod
t O" j55b3
. -
t I
1
. !
I
. * I . .
I .
Prelirinrry ti88110 cu l tu r8 at tempts and Chr0mo-8 anal-
J 8 i . Indicate a e1088 8 h i h l r i t y of t h e two S p O C i 8 6 from thir
r tandpolnt . Hom8tologlcal and r8diomtrbolic Studi08 are in progrera
by t h e Y . a u l i a n Metabolism S8ction.
Continued extensive metabolic 8nd microscopic comparison
lire planned with po8aible replacement of the Y. mulatta in
t h h colony with the more doc i le and cooperative, b u t phy8-
i o l o g i c r l l y similar, Y. specio8a.
REFERQlCES
D. B. Lirter , R. E. Benaon, and R. J. Young, Ann, N, Y.
Acad. Sc i . 85, 758 (1960).
A. Kling 8nd J. Orbrch, Science 139(3549), 45 (1963).
A. G. Atta and P. W. Vancc, Ann. N. Y, Acad. Sci. 85,
811 (1960).
L. A. Godd.6, W. A. Spencer, and H. E, Hoff, An. B8art
J. 57, 361 (1959).
G. 8, W. Wan& Am. J. Phyrlol. Hod. 36, 35 (1957).
-
-
- -
-95- t

Col lu l a r Blowat. in tho ~~rirrhorrrl Blood of Wcrcr, mutt8 and a c & C 8 8p.ciou Yonby8 (C. R. Richmond 8ad J. E, London)
Sororal hautologic81 parameterr were roa8ured for
Yacrca m U l 8 t t 8 and H8C&C8 8 p O C i O 8 8 monkey8 prt O f 8
1.rg.r progoct t o ob ta in comp.r8tive at8 for the80 8pocies.
Thi8 report 8unarize8 the80 108.~rement8,
YICRUIDS AND MATERIALS
A l l mearuremontr were made on fresh blood removed from
the uphenous vein of the rea t ra ined non-rne8thotized anfnuls,
The Y, 8mCIO88 monkey8 hrd 3U.t c0mpl.t.d 8 6O-drY WrIod Of
quarant ine slnco a r r i v r l a t our 1 8 b O r 8 t O r y rad were in reason-
8bly good rpp r ren t hoalth, The Y. mul8tt8 mOnk.78 hrve been
maintained in our laboratory f o r rover81 yoarr and are .bout
3-1/2 ye8r8 old b8.d on gro88 dent i t ion , e8tim8te8 of t h e
supp l i e r , 8nd body me88uromnt data (1). It I 8 88. \~~1)d , oa
the b88A8 of body weight8 rnd gro88 'dent i t ioh, t h a t t h e Y,
speciou wore approximately t h e sa- age.
Heutocrft. were determined by a mlcrohoutocrit cap-
illary tube method i n m l i r t e l y after centr i fuging the u u p l e s
for 3 & U t 0 8 a t 12,500 rpm i n 80 Ad.= aicrohe-tocrit
cent r i iugo ,
counter on a 1 t o 10 d i l u t i o n of whole blood 8dju8ted t o
Erythrocyte number8 were 18088~rOd by a Coultor 3
-96-
5 p0 6.7 . For each ample, 10 cell8 ware counted 80 tbat
r e l a t i v e co l l volume could be deternined as a func t ion o f
channel number on an RIDL 100-channel analyzer.
leucocyte counts were done according t o t h e u 8 w l cllaical
laboratory procedures.
D i f f e r e n t i a l
RESULTS AND DISCUSSION
Table 1 d v e 8 t h e number of erythrocytes (10 6 per
hematocri t (m1/100 m l ) , and mean corpuscular volume (p 3 ) for
4 female and 7 =le Y. mulatta monkeys and 4 Y. specioua
monkeys of roughly slmllar weight and age.
atocr i t va lue of about 42 m 1 / 1 0 0 m l for t h e Y. SpeCb8. 1s
t h e same as that found f o r 4 Y. Yula t ta females but I s 80me-
what less th8n t h e mean of 48 found f o r t h e 7 male H. mulatta.
It should be noted, however, that the la t ter animals had been
mlatsr lned diSe8Se-free at an a l t i t u d e of -7200 feet f o r
about 2 years.
remain Inside t h e bui ld ing or to pass through a hinged door
t o an ou t s lde exercise area. Spector (2) gives a mean and
standard devia t ion of 42 + 5 fo r t h e h e r r t o c r l t value of H,
mulatta monkeys. Young e t al. (3) give a mean value of
38.8 m1/100 m 1 for 5 male Y. mulatto monkeys a t Brooks Air
Force Base, Tex8s .
with a mean body w e i g h t of 4.4 kg.
The mean hem-
Dosign o f the q u a r t e r s permits t h e animal8 t o
-
These animals were 3 years old (+ 3 months) -
-97-
1 0 5 5 5 1 0 - - -
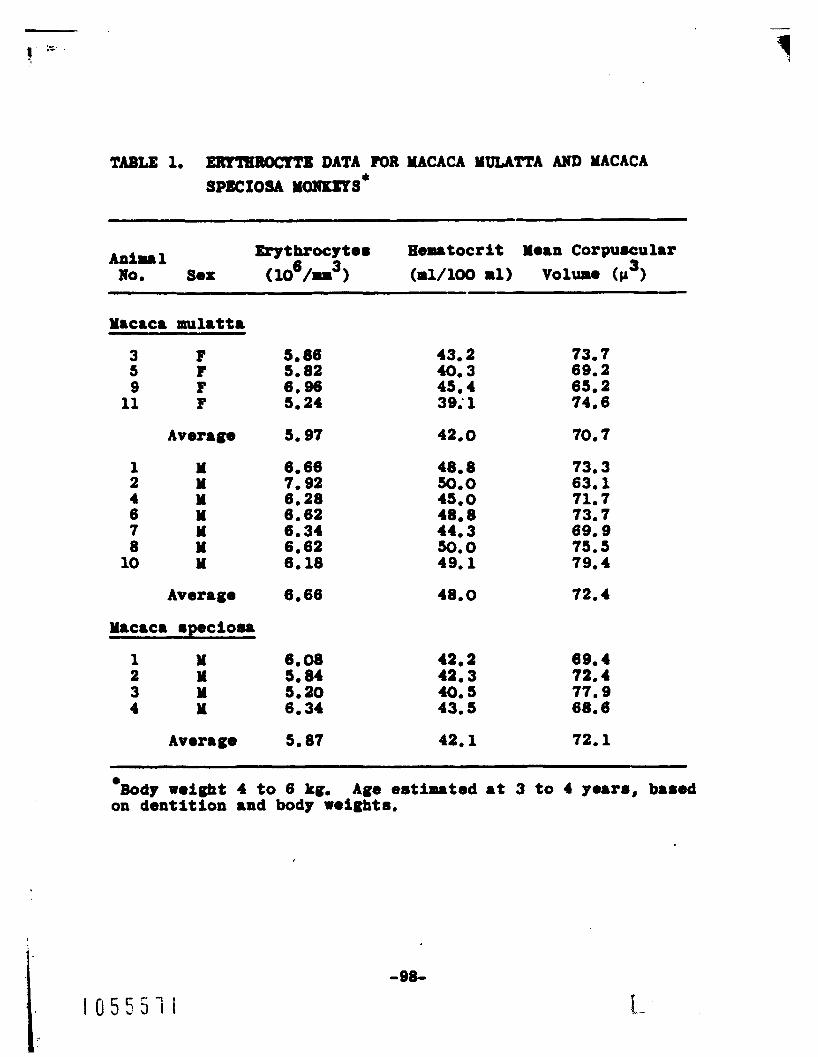
TABLE 1. mm DATA FOR YACACA YULATTA AND YACACA SPECIOSA MOMKEYS*
Erythrocyte8 Hea8tocrit Yoan Corpuscular 3 Animal
No. Sex (m1/100 ml) Voluaa ( p )
Yacaca mul8tt8
3 F 5 P 9 P
11 F
Average
1 Y 2 Y 4 Y 6 Y 7 Y 8 Y
10 Y
Y l C a C 8 8 p e C i O 8 8
1 Y 2 Y 3 Y 4 Y
Average
5.86 5.82 6.96 5.24
5.97
6.66 7.92 6.28 6.62 6.34
6.18 6.62
6.66
6.08 5.84 6.20 6.34
5.87
43.2 400 3 45.4 39; 1
42.0
50.0 4% 0 48.8 44. 3 50.0
48. a
49.1
48.0
42.2 42.3 40.5 43.5
42.1
73.7 69.2 65.2 74.6
70.7
73.3 63.1 71.7 73.7 69.9 75.5 79.4
72.4
89.4 72.4 77.9 68.6
72.1
Body weight 4 to 6 kg. Age e 8 t h t o d a t 3 to 4 years, baaed on dentition 8nd body weights.
-98-
,
Tho orythrocyto c o n c e n t r ~ t l o n 8 of Y. 8 p . c i o u worm rim-
ilar t o tho- of f-18 Y. mulatta. A l l mean value8 in
Tabla 1 wore 81rilar, although lrrgor, than the 5.444 x lo6 per cubic r i l l be t e r reported by Young et 01. (3). A r a t i o
O f .bout 0.88 e X 1 8 t 8 b o t r e m m10 Y. 8pOCbaa 8Bd male Y.
r u l a t t a for both mean hematocrit and m a n ery throcyte con-
about 72 p3 for tho mesa corpuscular volume (YCV) for ma108
of both rpocior. One might specula te t h a t t he Y. apeciora
hid not reached t h e same l eve l of a c c l i a a t i o n a s t h e Y.
COntMti-8. Thi. i 8 augge8t.d by t h e u 1 e mean V 8 l U O of
mulatta.
ilrr as t o concentrat ion of erythrocytes , he-tocrit, and
It doe6 appear t h a t these 8pecies are q u i t e rim-
cell size.
t81ned from t h e Coulter counter shows a remarkable similar-
i t y between t h e e ry throcyte profiles of these species.
Cur-rp ln8pection of t h e cell sizing dit. ob-
Spector (2) g ives no values f o r e ry th rocy te conceatra-
A YCV of 71 can
~romser (4) sugges ts a
t l o n or mern c e l l u l 8 r volume for rrcaque8.
ba estimated from Young et 81. (3).
value 0% 5 x 10 6 ery throcytes per cubic millimeter aa a
reasonable mean for "macaque erythrocytes . '* Table 2 gives leucocyte v8lues f o r 4 male8 of erch spe-
cies after a 2Ldrp period in ind iv idua l metabolim cages.
During t h i s t i m e , 811 a n h a l a were handled 8od treated i n
e8uen t l a l ly t h e sane way. The higher leucocyte concentrat ion
1 0 5 5 5 1 2 -99-
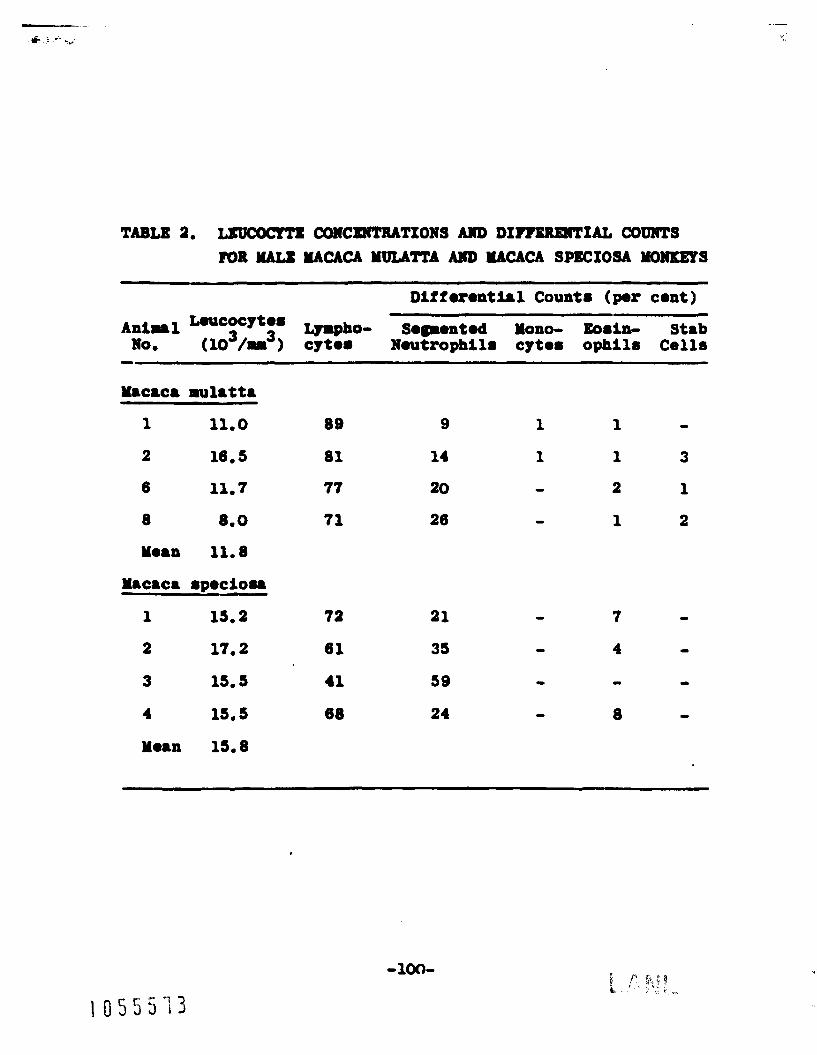
_-
Y.crc8 wlatta
1 11.0 89
2 16.5 81
6 11.7 77
8 8.0 71
Yean 11.8
3 15.5 41
4 15.5 68
Mo8n 15.8
9
14
20
26
21
35
59
24
1 1 0
1 1 3
0 2 1
0 1 2
7 0
4 0
.I 9
8 -
-100-
i n tho blood of Y. 8p.ciosr Is probably 8uggo8tlve of 8 goa-
o r a l l y pooror atate of well-being a8 cornparod with Y, mulrtta.
Youag et a1. ( 3 ) r epor t a mean of 14.68 x lo3 ~eucocyter per
cubic millimeter f o r t h e 5 Y. mulatta monkey8 moatlonod ear-
lier,
The r e l a t i v e l y high percentage of neut rophi l s In Y.
r p o c i o u NO8, 2 and 3 i m of i n t e r e s t , as these anFmrl8 were
later found t o be q u i t e heavi ly in foc ted by hookworms (Strong-
yloider). Remltr of metabolic s t u d i e s urlng t r i t i a ted wator
in tho80 anInml8 ind lca tod r b n o r ~ l l y large body wrter res-
O W O A r 8 8nd VO- rapid tWnov0r rater.
C8U8.d by t h e he8vy nematode infO8t8tiOn.
This W 8 8 promumably
The r O l 8 t l v ~ l p
high incidence of .08lnophilr in Y, r p o c l o u I8 a180 mugger-
t i V 0 O f par88itim.
D i f f e r e n t i r l leucocyte count data d i d not rgroe wi th
that reported by Young et 81, (3) . R 0 8 p . C t i V e percentrge
V 8 l U 0 8 for n0~trophi l8 , lprphocpt08, rad W8hoph i l8 Were
55.8, 39.4, m d 1.8. No othor coll typo. were given, X U -
8 0 ~ 8 (5) point8 ou t that the l i t e r r t u r o provider only .cant
rad contr8d&ctorp data on tho compoaitlon of roakey blood.
Ag.8 IO%, diu-1 and 8 O a 8 O M l factor., P I U S t h e S M f l n u -
berr of a n i n a l ~ , con t r ibu te t o t h o largo vr r i r t i ons . Recoat
work8 (6 ,7 ) give no hematological v r luo r f o r monkeya.
In 8 w r y 0 p re l in ina ry fnve8t iga t ions on t h e c e l l u l a r
-101-
funct ion rad other not8bolic 8tudi.8 should 8180 help i n
comparing Y. 8 p . c i o u with Y. wl8tt8.
-102-
Loagovity of F i r s t and Socond Generation Ofimpring i r o n Male Yico Erpoaed t o F588iOn Neutron8 8nd Gam R8ym (J. Po Spald- lag aad R. P. .Archulet8)
Itusmoll (1) b e reported evidenco t h a t bomb neutron expo-
8ure of male mlce wa8 instrument81 in reducing not only t h e
l i f e expectancy of the exposed r n i u l but also t ha t of his
offspring.
h88 been gonorally accepted as on8 of t h e human hazard8 of
exposure t o ionizing radiat ion. Because of t h e s ignif icance
of Ru88ell'r findings, It was f e l t that a slmilar experiment
d085gned 8peCif iC8l ly f o r t h e end point de8ired and done
under laboratory, r a the r than under f i e l d , coadi t fon8 was
indicated. Th8 8tudy reported below was done t o determine
t h e effect of both neutron and gaua- ray exposures t o male
rfce on loagevi ty of their first and second generat ion off-
wring:,
"hi8 f ind ing wa8 of con8lderable importance and
YETHODS AND RESULTS
Two hundred rad twenty RF u l e rice 8 rooks of 8ge were
They were u8ed t o produce t h e rice for t h e longevi ty study.
randomly divided into 11 groups, 20 rice e8ch for 10 exposure
group8 and 20 mice f o r t h e controls . Groups 1 through 5 were
given acu te doses of 32, 67, 102, 134, and 177 rads of f i s s i o n
-103-
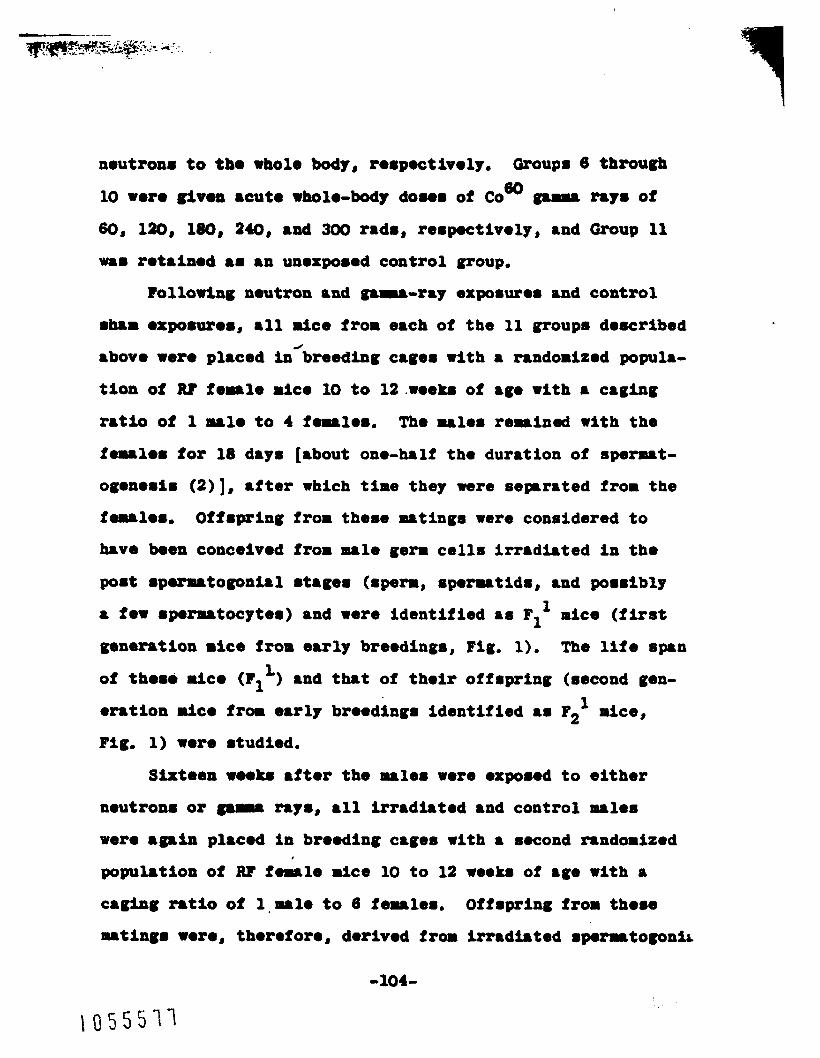
noutron8 t o tho whole body, r08poctivoly, Groups 6 through
10 wero givorr acu te whole-body dome. of cow gamma ray8 of
60, 130, 180, 240, and 300 r8d8, r e 8 p c t i v a l y , 8nd Group 11
-8 r O t 8 h . d 88 8ll unoxpo8od Control group.
Following noutron and gam-ray exposures and c o n t r o l
8h.r exp08uro8, a l l nice from e8ch of t h e 11 groups doscribed
8bovo wero pl8C.d i n k r e e d i n g cage8 wi th 8 rmdor i zod popula-
t i o n Of RI f 0 p . h nice 10 t o 12.WOek8 O f 8ge with 8 C8gbg
ratio of 1 M ~ O t o 4 femalo8. The malos remninad wi th t he
f.lul.8 for 18 day8 [about on.-half t ho dura t ion Of 8pO-t-
ogone8im (2)], r f ter which t i m e they were 8epr8ted from t h e
foulom.
h 8 V e kea conceived from m81e germ cells i r r r d l a t e d in t ho
Offspring from theme r u t i n g s were considered t o
p0.t 8 m t O g O n i a l (.pel%, e p O m t i d 8 , and po88ibly 1
8 fOW 8pOntOCptO8) 8nd Were i den t i f i ed a8 F1
generat ion rice from early breedings, Fig. 1).
of the80 rice and th8t of t h e i r o f f r p r i n g
e r a t i o n rice from early broedlng8 I d e n t i f l e d 8s
Fig. 1) wore 8tudied.
S ix teen w e o b a f t o r tho males were orporod
nice (first
The life span
(8eCOnd g@n-
P21 mice,
t o either
neutron8 or g8m8 r8y8, a l l irr8dlated and con t ro l males
were ag8in pl8c.d i n brooding cages with 8 second mndorlzed
populatfoa of RF fomalo rice 10 t o 12 WOOL. of ago with a
caging ratio of lamalo t o 6 females. Offspring f r o r t h e m
mating8 war., thoreform, dorivod from irrrdlated 8pum8togonir
-104-
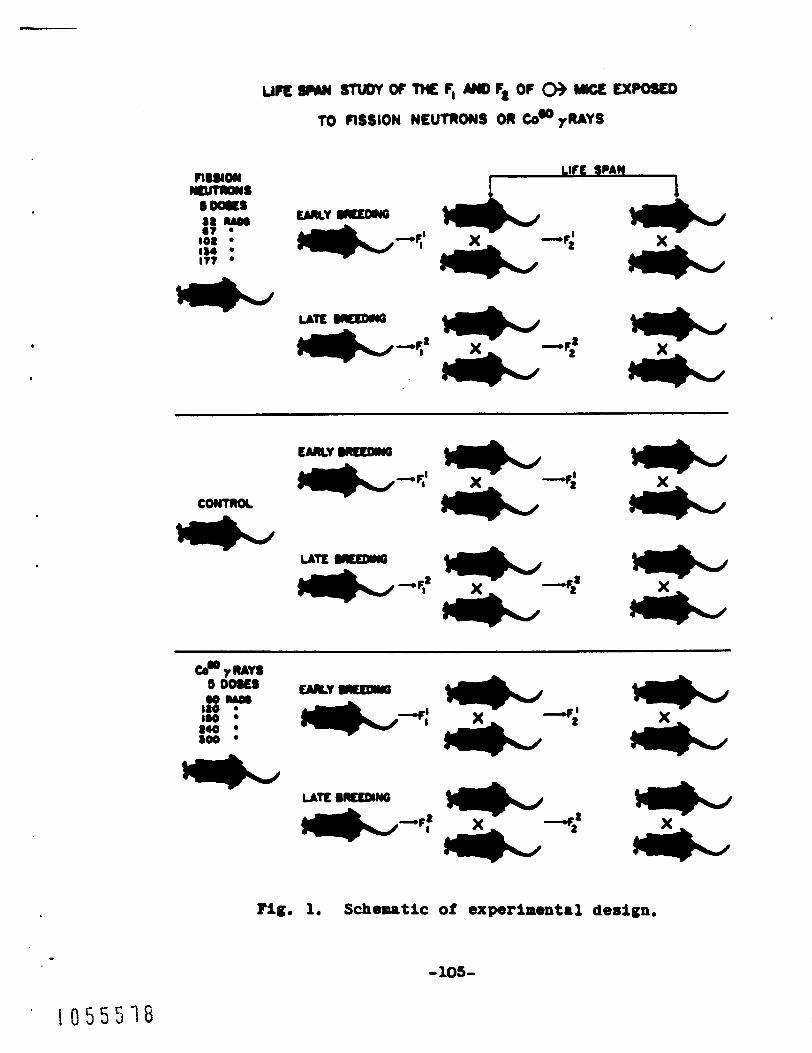
LIfL SCAN
I 1
Fig. 1. Schematic of experimental dt8Agn.
-105-

I
and woro l d o n t l f l e d am F: nico (first gonoration r i c o from 2
1 8 t O br..dAng8, Pig, l), LongeVltg O f thO8e d C 8 (Fl ) anb
th8f of tho- off8prlng (80cond gonoratlon rfce fro8 late
br..db- l d o n t l f l o d 88 F2' a c e 0 F i g , 1) were 8 t u d b d .
Tho do8.8 t o tho 81re or grmd8ir8, number of mlce ob-
80rv.d~ and tho moan length8 of l i f e for n c h of t h e group8
8r8 t abu la t ed fip mb108 1, 2, 3, 8nd 4, Amly.28 O f the88
data f8Il.d t o show any moanlngful c o r r o l a t l o n botwaen l i f e
8p.n and do80 t o tho 8l?e or gr8nd8lro In ei thor tho g8n8-
r8y or noutron ertpo8.d group.. 3fgn l f l c8n t d i f f e rences did
8PP.W botreen some do808 and I n 8 o m e I m t a n c e s between serte8.
Howover, it m8 not po88Ible t o f i t 8 8 t r 8 l g h t line, by t h e
welghtod loa8t 8qurre8 method, through t h e data I n any of t h e
fWr tab108 and t o obt8 ln a 810p which w u l d 8UggO.t t h 8 t
l i f 0 8p.P -8 affected by Oxpo8Ure of t h e 8 1 r O or gr8nd8lrO
t o Ionizing radl8t%on, In f a c t , t h e average l l f a span f o r
a l l c o n t r o l i na l e8 was 602 dry80 compared to 633 day8 for
a l l f m l o off8prlng from i m d l a t o d 8lr.r or grrrndrlre8, 8nd
c o n t r o l -1.8 had an average lafe 8-n of 593 d8y8, compared
t o 647 for 811 a810 offspring from l r r8d i r t ed sire8 or grand-
8 A r O 8 . b - b o t h 8OXe.a E I C O with lrr8df. t .d pr ren t rge Out-
l lvod t h e i r c o n t r o l c o ~ ~ t e r p a r t 8 .
do not 8upporCt tho earlier f inding8 of Rams011 (1).
Tho romlt8 of t h l 8 study
Change. in SOX r a t l o h 8 ~ 0 been 8UggO8tOd 88 a wthod of
-106-
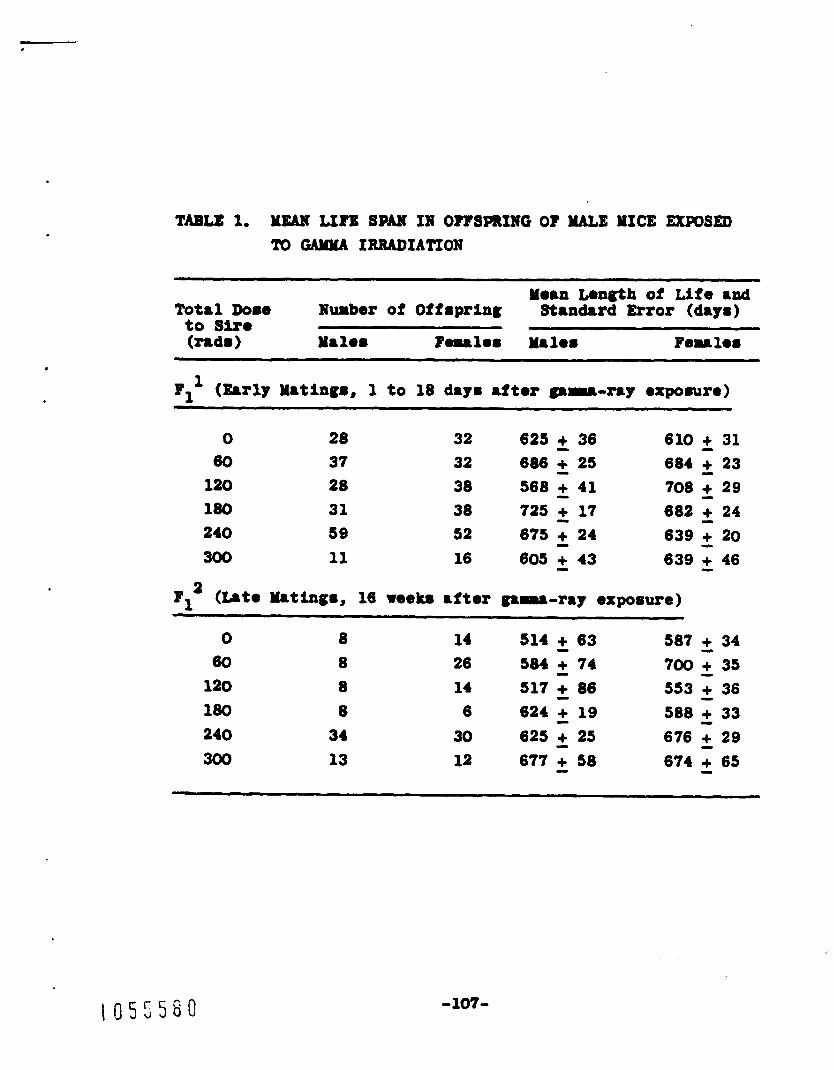
TABLE 1. YEAH LI?B SPA# IN OPFSPRIlW OF HALE MICE =#)SED TO OAYW IRRADIA'TTON
0 28 60 37
120 28 180 31 240 59 300 11
625 + 36 686 + 25 568 + 4 1 725 + 17 675 + 24 605 + 43
- 32 32 38 38 52 16
- - .I
- -
610 - + 31 684 + 23 708 + 29 682 + 24 639 - + 20 639 - + 46
- - -
0 8 60 8
120 8
180 8 240 34
300 13
514 + 63 14 584 + 74 26
14 517 - + 86 624 + 19 6
625 + 25 30 12 677 - + 58
- II,
- -
587 + 34 - 700 + 35 553 + 36 588 + 33 676 - + 29 674 + 65
- - -..
-
-107-
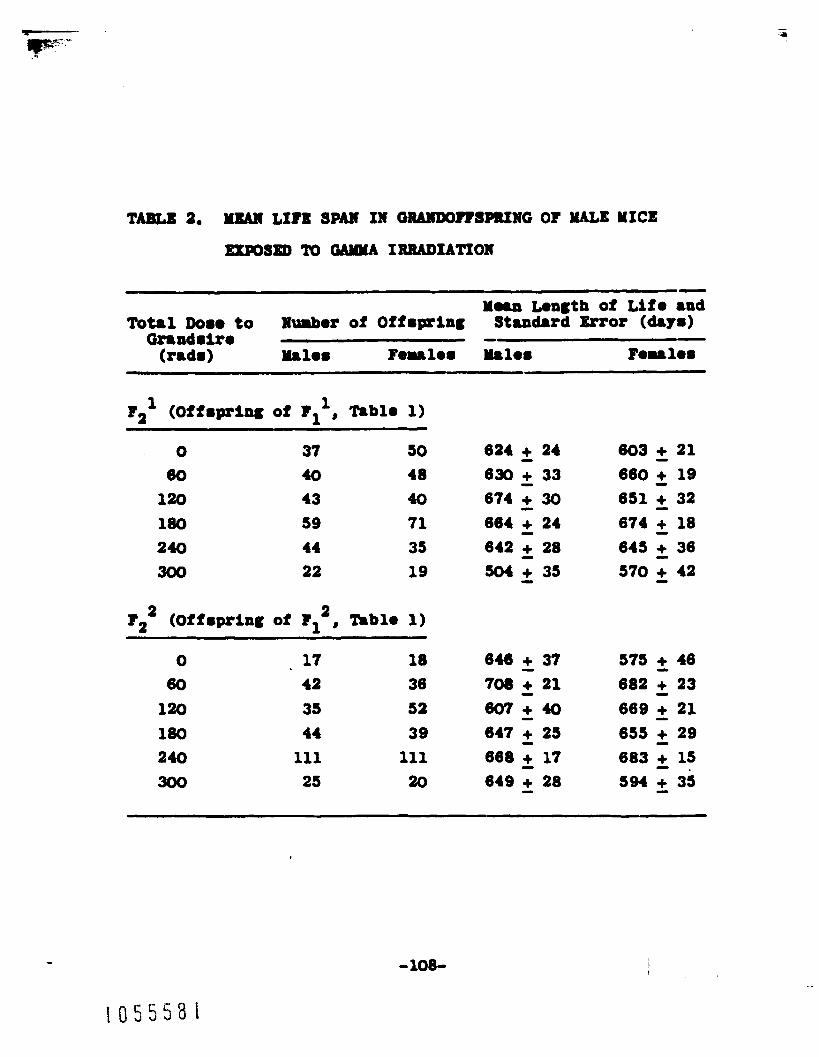
Fa1 (Offspring of Fll, mblo 1)
0 60 120 180 240 300
37 50 40 48 43 40 59 71 44 3s 22 19
?22 (Offspring of l:, h b l e 1)
634 + 24 630 + 33 674 + 30 664 + 24 642 - + 28 504 + 35
- - -..
I
-
603 + 21
651 + 32
645 + 36 570 + 42
0
660 - + 19
674 0 + 18 .I
- -
0 17 18 80 120 180 240 300
43 38 35 53 44 39 111 111 25 20
646 + 37 7- + 21 607 + 40 647 + 25 668 + 17 649 + 28
- 0
- - - -
575 + 46 682 + 23 669 + 21 655 + 29 683 + 15 594 + 35
- - - - . -
- 108- 1 0 5 5 5 8 1
"I
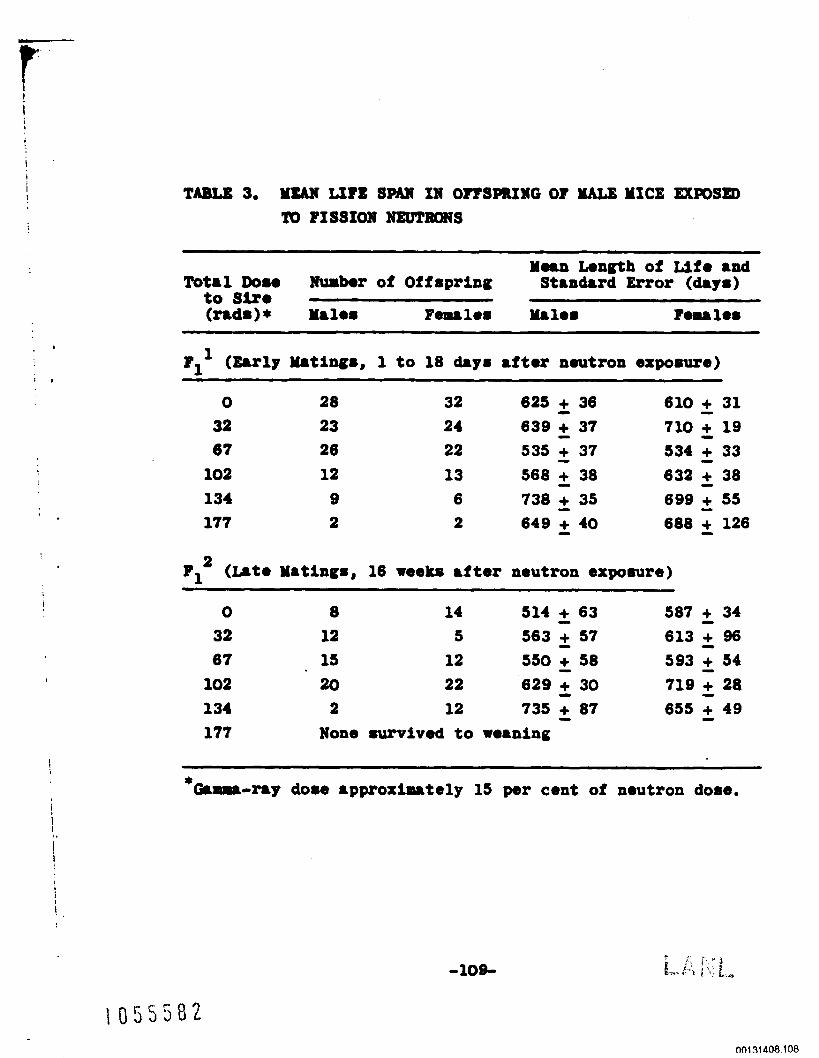
TABLE 3. YZAN LIFE SPM IN OITSPIUIG OF MALE MICE W#)S13) !lO FISSION NEUTRONS
Yoan Longth of Lifo 8nd Total Do.. Nunbar of Offspring St8adrrd Error (days)
to Sir. (md8)+ m1.8 F-108 Ma108 Females
F ~ ’ mtings, 1 to 18 days aftor n a t r o n exposure)
0 28 32 625 - + 36 610 I + 31 32 67
102 134 177
23 26 12 9 2
639 + 37 24 535 + 37 22
13 568 - + 38 738 + 35 6
2 649 - + 40
- - -
710 + 19 534 + 33 632 + 38 690 + 55 688 + 126
- - - - -
I
587 + 34 613 + 96 593 + 54 719 + 20 655 + 49
- 514 + 63 0 8 14 563 + 57 32 12 5 550 + 58 67 15 12
102 20 22 629 - + 30 735 + 07 134 2 12
177 None survived to weaning
- - - - - - -
* --my dose 8pproximately 15 per cent of neutron dose.
i 0 5 5 5 5 8 2
-109-

5
F21 (Offspring o f Fll, Table 3 )
0 37 50
67 48 57 102 12 20 134 29 34
32 38 32
177 None produced
€': (Offspring of F':, Table 3)
0 17 18
67 98 69 32 44 43
103 48 73 134 8 12
177 None produced
625 + 24 643 + 30 614 + 26
- - -
643 - + 32 380 - + 47
646 - + 37 670 - + 19 672 - + 18 679 - + 25 651 - + 38
603 + 21 -
575 I + 46 644 + - 18 662 - + 19 649 - + 16 683 - + 35
* G a m - r a y do80 approximately 15 per cent of neutron dose.
-110-
omthat lag tha gonot&c hrrrrrdr of ionizing r8d i~ t ion8 to man.
Accordfng t o gonotic t h o o v , PI off8pring froa i r r a d b t e d
8-a. Wuld b. predorinrntly -1.8 i f 8 O X - l W O d l8tb.18 were
induced by oxpornre. In thim study, tho 80% r a t f o of a l l
control mica wam 1.267, ?1 d c o from gauaoirradi.ted 8irsr
brd 8 80X of 1.1z4, and tho 8e% r a t l o of a c e from
neutron-irradiated aim8 -8 0,975.
r a t i o n were contrary to genetic thaow.
Them. comprratfve mer
(1) I, Lo Ruasell, Proc. Nat. Acad. hi. 43(4), 324 (1957).
(2) E, P. Oakberg, Aa. J. Anat, 99, 507 (1958). -
-
-111-
. -
A n o u l i u study n 8 dona (1) t o dotanrine r r d i r t i o n
U M i t i V i t ) . 88 8 f U C t l O Z h O f 8- U 8 i n g the frrction8ted do-
method, which 8110~8 for biologic81 reprir batwoen acuto
oxpomares.
sure condition, mdiore8irtmnco n 8 r a l a t l v e l y 8 t 8 b l O through
tam f i r e half of adu l t l ife, a t m l c h t h e It deteriorated
r a p i d l y u n t i l the end of the n0-1 life exp.ct8ncp.
fol lowing is 8 r e p o r t . o n acu te ndio8enritioitp as a fuac t lon
of agm u8tng t h e Lpso approach.
It warn concluded tnat under tbrt typo of expo-
The
30
Sow 2900 RF atrain v i r g i n female rice of 14 age group8
woro u8ed (Tablo 1). Mico in each ago group war. randomly
divided i n t o 8 mininu of 5 8nd 8 maxinu of 12 r c u t a X-my 30
O X p 6 U r O group. t o bmckmt the A m t o X-my O X p 8 W O 8
were rude with 8 2% IlvP X-ray machine with a beryllium
riador tub.. Bporure condi t ion8 wero a8 follow8: vol tage
2% EVP; 30 ma; Thoram18 I1 illtor; HVL 2.6 n Cu; target-
to-8pcscir.n d i r t8nco 60 cm; and do8e rata % nd8/rfn.
Following X-ray OXp08Uf08 rice were hOU8.d In 8t8nd8rd
W ~ e - b o t t O ~ C8ge8 8 d 03~0rved for 30 &y8 m8t e X ~ ~ W @ ,
-113-

-
Standard Error
Numbor (r0.L.) of Mice (rad.)
AeO
3.6 326 593 14.6
186 647 18,9
0.0 210 691 14.0
12.8 190 733 13.5
21.4 300 6 97 15.8
30, 0 363 634 ma3
42.8 131 487 18.7
51.4 120 547 35.9
ma0 157 537 16.0
68,6 125 453 5.16
77.1 179 424 22.8
85.7 149
Ma3 152
103.6 342
442
441
343
17.6
12.5
18.6
-11% i _I
Death8 were recorded d a i l y , and 30-d8y l e t h r l i t y w 8 8 sub-
joc t ed to s tandard method8 of probi t ana lys i8 t o obtrb t ho
I.,D:g for each group. The r e s u l t 8 arm tabul8ted i n Table 1
and are p lo t t ed in Fig. 1. Radioresi8tance increased with
age8 reaching maximum r e s i s t a n c e a t 13 t o 17 weeks of age,
Beginning 8t 18 t o 20 week8 of age, r e s i r t a n c e decl ined
throughout t he r-inder of t h e l i fe span, reaching a rfn-
imum a t 104 weeks (average l i fe span f o r t h i 8 s t r a i n is
96 woeks) . There w m no tapprecl8blO period of r e l a t i v e s t a b i l i t y
in r r d i o r e s i r t a n c e throughout t h e e n t i r e l i f e span. This is
not cons i s t en t w i th earlier s tud io8 whoro r a d i o r e ~ i s t 8 n c e was
tested by t h e fract ionated-method. The d i f f e rence in response
t o r ad ia t ion expo8ures by these t w o method8 8ugge8t8 8 con-
s t a n t recovery rate from sub le tha l X-ray exposures throughout
t h e g rea t e r part of t h e l i f e span, w i t h a cons tan t ly changing
s e n s i t i v i t y t o lethal X-ray expo8ures.
F i g u r e 1 Show8 incre88ed v a r i a b i l i t y O f r ad io res i s t8nce
with increased age -- a characteristic commonly associated
w i t h advancing age.
func t ion was a better f i t t o t h e data than w a s a l i n e a r one.
This is also characteristic of many biologic81 ~rameters,
It was a160 found t ha t an exponent ia l
REFERENCE
(1) J. F. Spalding and T. T. T r u j i l l o , Radi8tion Re8. -8 16 125 (1962).
1 0 5 5 5 8 1 -114-
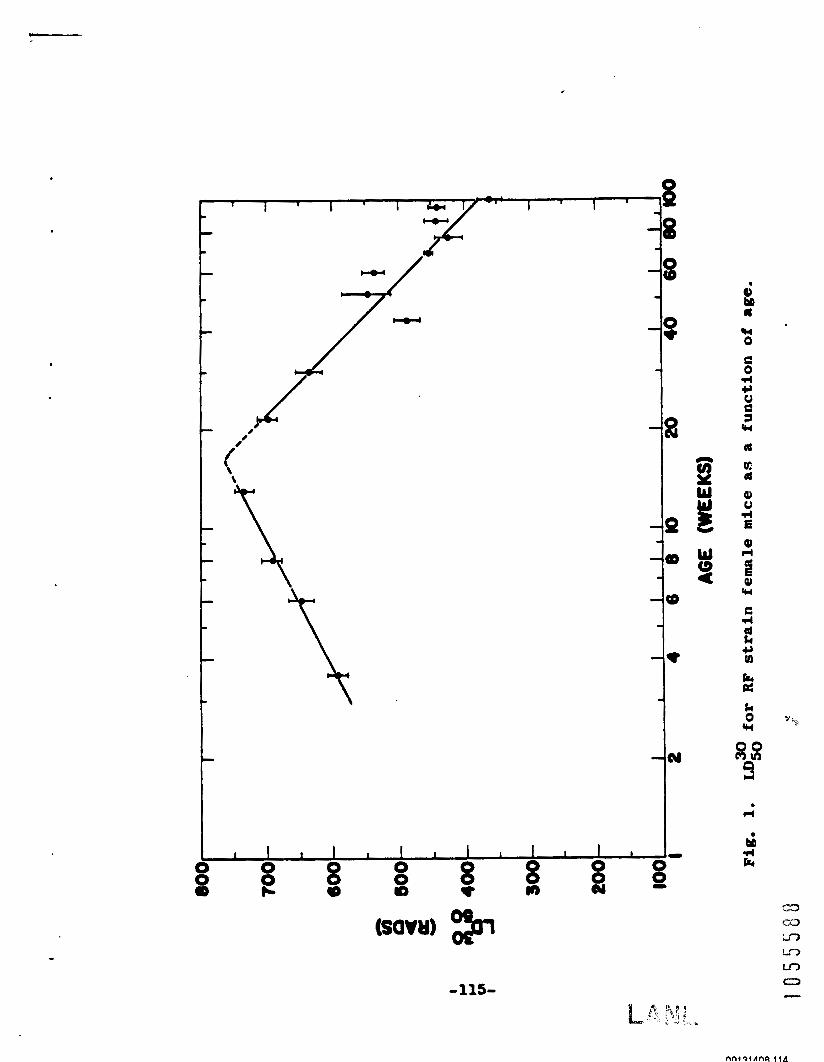
t J L I 1 1 1 I I I 1 I I
I . d
-115-
n
Y w w s Y
w (3 4
T :<*
Cold Str0.S am 8 T.8t for R 8 t O Of A W g in TWw Uno8 O f
Yico w i t h Df i fa ren t Hirtori.8 of Ancos t r r l X-R.y ~ p o r u r o (J. F. S p l d i n g 8nd T. To Trujlllo)
I ~ D U C T I O N
T b O r O 8 p p U to b@ u n y 8 - 1 & r % t i O 8 b.tWOOn 8g.d r i C 8
8nd young rice w i t h an i r r o p r a b l e bWd8n of r a d b t i o n i n j w .
The Foderatlon Procoodlng. on "Radiation and Ageing" (1) 8nd
one report by Upton (2) provido excol len t roviow8 and tho-
or108 on *Tr8d l r t l on 8glngoTg
that eltpomro of tho total body of a rarrrrl t o ionizfng
r a d i r t i o n rill reduce t h e l i fe expectancy of t h a 8xpoB.d
an-1 (2). T r u j l l l o (3) h 8 m shown that co ld stremm may be
a u s e f u l tool In comparing u i m i l a r i t i e u between chronologic
and ~~rrd~tlon-accolerated~* aging.
I t I s a gonerrrlly acc0pt.d fact
Tho genotfc ampects of t h e l i f e 8hortonlng o f f m t on
t he offspring of lrr&d%8tOd parent. -0 8180 ulrLnnm psr-
eters of r8di8 t ion injury. R u s u l l (4) was tho flrrt t o
report l i fe shortening in t ho of fupr ing of -10 rlco oxpomed
t o neutrons from an atomic detonation. Sprldlng et 81. (S)
showed a roduct lon In l l f o expectracy of mico from S genera-
t i o n s of X-irradiated mires. In contr8.t t o tho80 finding.,
an adJolned report shows no dl f fe ronco in tho l l f o awn in
t h e offspring of ulres ucp08ed t o grrded acu te dosea of
neutrons or gana rays, and off8pr iag from both early and
-116-
1 0 5 5 5 8 9

E
lato brooding wore studied. I t rust bo concluded that thore
28 .till conmIder8bla doubt 8s t o whether or not t h e gonetic
mocla8ni.r which regulator l i f e 8p.n I8 affocted by expom~ro
t o ionizing rad ia t ion . However, 8inca there i 8 SOPDO ov-
idence (4,s) that a premature aging factor m y be inherited
from mire8 expo8ed t o ionizing r ad ia t ion , and since reaist-
anco t o cold 8tr0.8 8pp88rS t o V8- W i t h age (a), f t W8S
f o l t that cold stre8s might be 8 u6eful t o 8 t t o determine
the r8te of aging of mice with 8 h i r t o r y of I r r ad ia t ed sires
a6 ampared t o t h 8 t of control mice.
hero is an attempt t o test t h i s t h e s i s .
The study reported
MEI'HODS AND RESULTS
Virgin famnle RFM s t r a i n rice from t h e following three
ba8ic line6 wolpe used: irr8dirted l i n e (granddslughtere of
t h e 15th gener r t ion of s l res given 200 r8dS of X ray8 at
re8nhg for 15 con8.cutive generrrtionm); i r r rdlr ted sub-
l i n e (granddaughters of t h e 15th generat ion of sire8 given
200 rad8 of X r a y s a t weaning f o r only t h e first 10 consec-
u t i v e gonerat ions) ; 8nd grurddrughtors of t h e 15th geriera-
t i o n of c o n t r o l l ice w i t h no h i s to ry of X i r r r d i r t i o n .
three l i n e 8 originated from one mating, 8nd brother-sister
u t b g 8 were umed i n e8ch of t h e three l ines.
Expomare condi t ions f o r irradirted male8 i n t h e
A l l
-117-
1 0 5 5 5 4 0
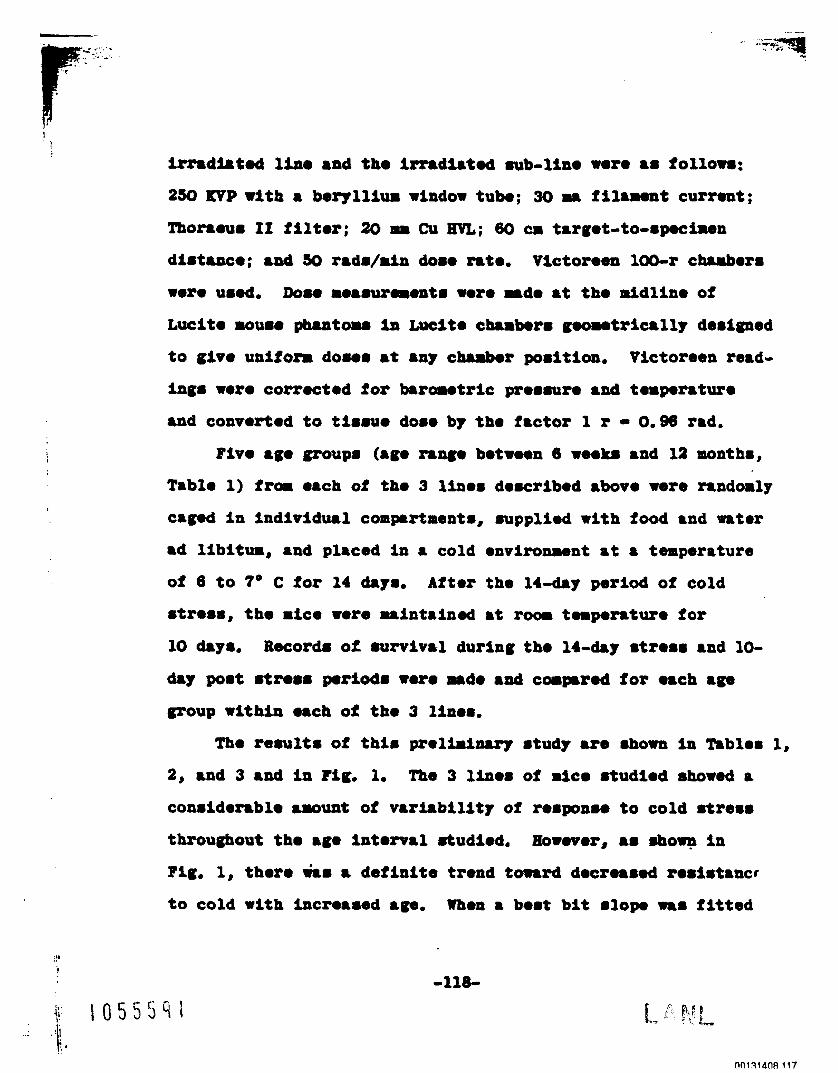
1 m d i . t . d line and tho 1rradiat.d rub-line wore a8 folloWt
250 KVP with a b o r y l l i u r window t u b ; 30 88 f l l a w n t cur ren t ;
ThOmOU. 11 f2lt.r; 20 CU 60 CB t 8 r g O t - t O - 8 m h O a
distance; rad SO rada/rin do80 rat..
wozo u8.d.
Lucito 10uma phrntou in Lucito chamberm gummtrically d08lgnOd
t o givo uniform do808 at an7 chrrbrr po8ltlorr, Victoreon read-
ing. wore corroctod for barosotrlc prommar. and temp.z%turo
and convortod t o ti8.U. do.@ bv t ho factor 1 r - 0.96 rad.
Victoreon 100-r c h u b o r 8
Do- mea.;~ramontm woro mado 8t tho aridline of
Fivo ago group8 (ago raw0 botwmn 6 reek. and 12 month.,
Table 1) from each of tho 3 l i n e 8 do.cr1b.d abovo were nndor ly
cagod in lnd iv ldua l compartments, 8uppl l .d with food and water
ad libitum, and placed In 8 cold onvlronment a t a temperrture
of 6 t o 7' C for 14 d8y8.
8tre8.8 t h e rice wore maintained at room tompnturo f o r
After the 14-day period of cold
10 d8y8. Record8 O e r U r V I V S 1 dur ing the 14-d.Y 8tre.8 and 10-
day po8t ere88 parids wore and@ a d corparod for oach age
group w i t h i n e8ch of tho 3 lino8,
Tho r08Ult8 O f t h i 8 g W O l W S l 8 r 7 8 t U d y U O 8 h O m T8b108 1,
2, rad 3 and l a Fig. 1. The 3 lin.8 of d c o r tud lod 8hoWOd a
con8ldorabla amount of v a r i a b i l i t y of ro8pon.e t o cold 8tre.8
throughout t h a ago l n t o r v a l 8tudi.d. Eovover, aa mho- i n
F ig , 1, thoro k 8 8 d e f i n i t e tread t0-N do~r0a8 .d ra8%8t.!kCr
t o Cold W i t h hCm880d 8-0 WhOB 8 b.8t b i t 810m -8 f i t t e d
1 0 5 5 5 9 1 -118-
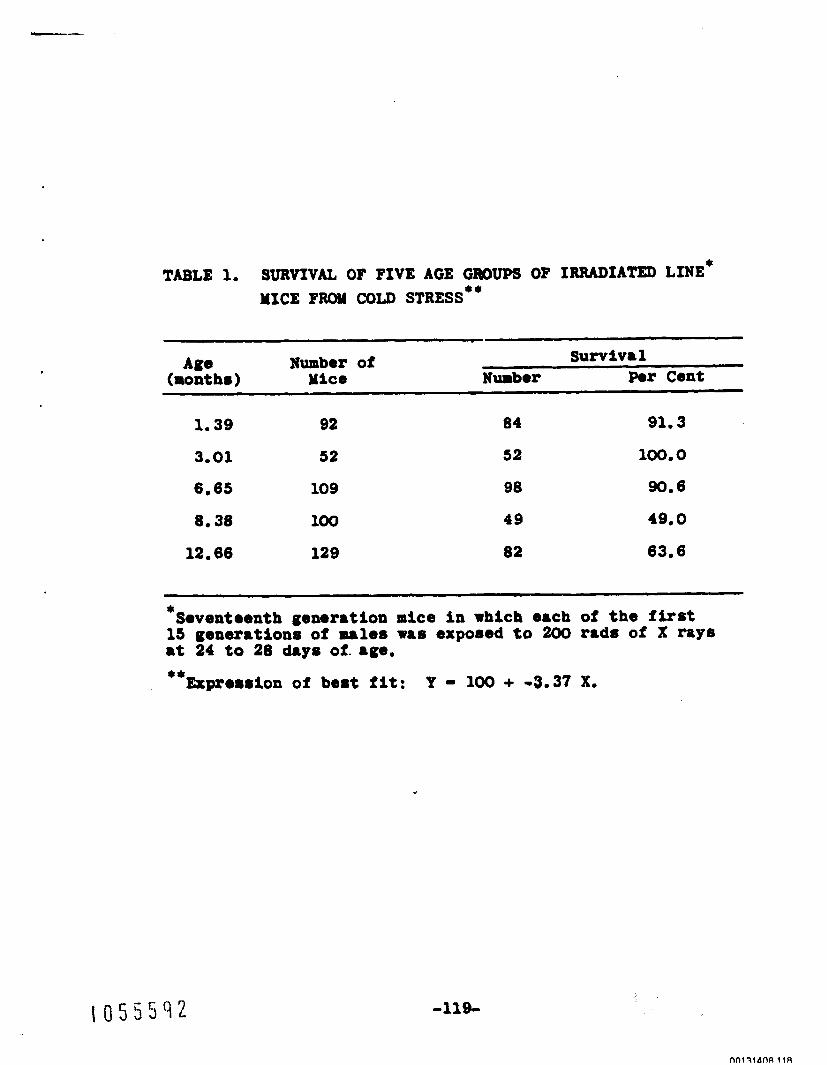
TABLE 1. suRvIvu OF FIVE AGE GROUPS OF IRRADIATED LINE* MICE PROM corn STRESS**
SUrV%V81 Age Number of (months) Mice Number Per Cent
1.39 92 04 91.3
3e01 52 52 100.0
6.65 109 90 90.6
80 38 100 49 49. 0
12.66 129 82 63.6
* Seventaenth generation mice In rhlch each of t h e first 15 generations of nales was exposed t o 200 rads of X rays a t 24 to 28 days of. age.
1 0 5 5 5 9 2 -119-
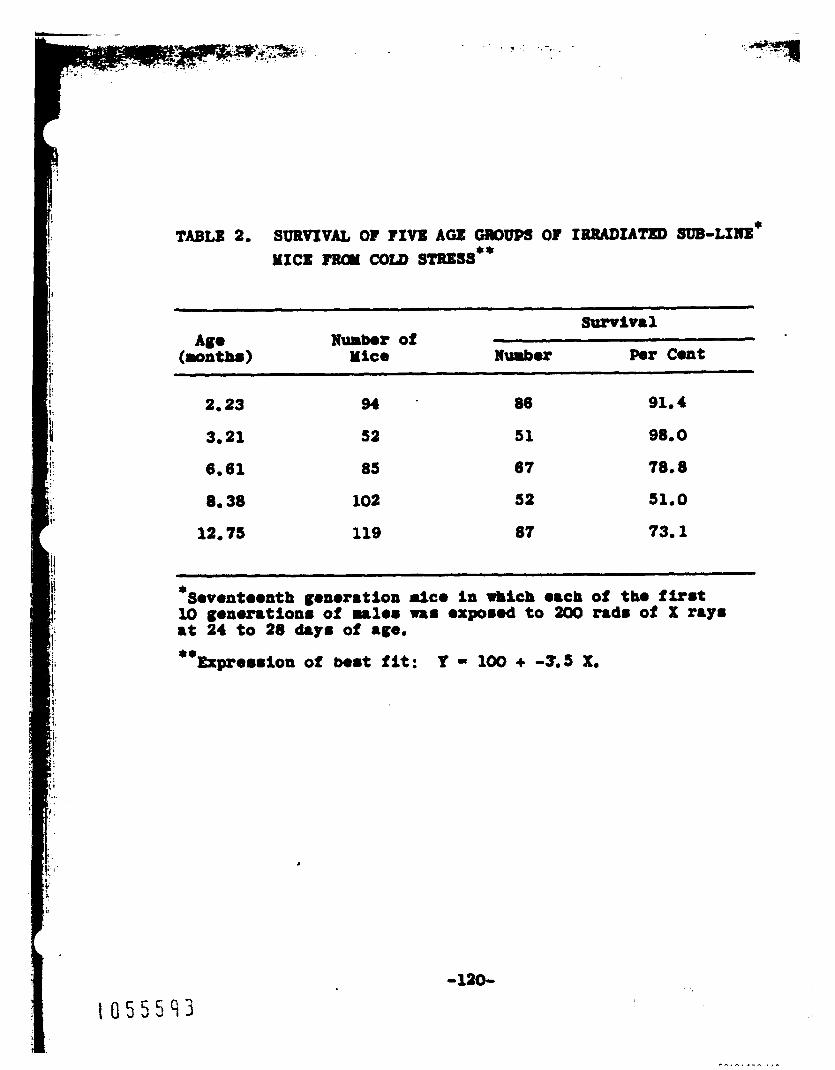
. . : .. -.. 1 .
~uroi~ri Numbor of
(aonthm) Mice Nurb~? Per Cont 4.
2e23
3.21
6.61
8.38
12.75
94
52
85
102
119
88
5 1
67
52
a7
91e4
98.0
78,8
51.0
73el
I
-120-

TABLE 3. SURVIVAL OF PIVB AGE OROOPS OF CONTROL LINE* MICE PROY COLD STRESS**
Survival Age Number of
Per Cent (months) Mice Number ~
2.18
3,04
6.65
8.59
12.46
92
52
96
90
92
87
50
07
60
67
94.5
96.1
~ O D 6
61.2
72,8
* Seventeenth generation mice with BO history of X-ray expo- uure to the line.
Expr888hl! O f b0.t f i t : Y 100 + -2.64 Xm **
-121-

43
d
-122-

F I
: * i
t o tho &t8 in h b l O S 1, 2, 8nd 3, With tho IntOrCOfl f%ltOd
a t 100 per cent , tho 8lopes were shorn t o incr0.88 in accord-
ance with t h e numbmr of generrrtions of X i r r 8 d i 8 t i o n (Fig. 1).
T u 8 ob8oFV8tion Suggests that ( u 8 h g cold str0.S 8s t h e t o r t
s p m t e m ) mice from 10 gonorations of irradi8ted mires 8ged
more r a p i d l y t u n did con t ro l nice rnd t h r t mice w i t h I S gen-
e r r t i o n e of l rnadir ted sires aged more r i p i d l y than did mice
with 10 genarr t fons of i r r a d i r t o d aires.
optimum 868 range for studying aging by t h e cold stre88 method
$8 12 t o 22 ronth8. Unfortun8telyD our environmental room
-0 u n r v a l l ~ b l e f o r t h e 8 tud ie r af ter completion of t h e 12-
month age group study.
p o s s i b i l i t y of cold s t r e a s a s a t e s t of rate of aging, but
more complete studies await t h e avnllrblllty of an envlron-
mental chamber.
In t h e mouseD t h e
These preliminary results point t o t h e
R8dir t lon Rem. - 16, 144 (1962).
(4) w. L. R u B w l , PrOC. N 8 t . AC8d. S C i . - 43, 324 (1957).
( 5 ) J. F. Spalding rad V. G. Strmg, Radiation Res. - 16,
159 (1962).
-123-

..' . .: ...7 - . . . i.; , .:..* . ' . -.: ..;, - ' . . . . ,
Brooding C h a m c t o r i ~ t i c ~ of Offspring from Mice with Fiftoorr Gonerrtlon8 of X f r r 8 d i 8 t b n t o t h o Y.l.8 (J, F. Smld ing 8nd Y, R. Brook8)
Thi8 I8 8 continuing Study i n rh ich tho bt..ding O f f I C -
ioncy of rico from X-imdiatod sire8 I8 studiod a t 5-
goneration intorval8. When t h i 8 study -8 rtartwl, l i t t l e
O r LIO h f O r U t i O I h W88 8 V 8 i l 8 b l O on t h o gOnOtfc con8oquonce
of X i r r r d h t i o n t o con8.cutivo genor8tion8 of 1lrnal8.
p r o m m was de8igned t o study t h e brooding charrcteri8tic8
Thi8
8nd nOn8pOdfic genot ic effect8 Of X i r r 8 d i 8 t i O n t o t h e Sir08
in a cont inuing population of aice.
YITBODS AND RESULTS
Breeding characteri8tics were 6tudied on 3 k s i c l ines :
(a) c o n t r o l Uno, 16 th genmration rice with no h i s to ry of
ionfzlng r r d h t l o n 8bovo Wcltqround; (b) irr8df8ted l i n e ,
0ff.W-g Of 15 goaer8tion8 Of X l r r a d l a t l o n t o t h e -108;
and (c) irr8diat.d sub-lino, 16th goner8tion r i c e i n which
only tho first 10 gonmrations of u1.8 wore ~ v o n oxpornre8
of X ray..
Fig. 1, ,
Tho or igb of t h e d c o s tudied I s i l l u 8 t m t e d in
On0 hundred 8ib p8irs of rice from e8ch of tho 3 b88ic
l ino8 wero u t o d a t waanlng and wore 811oWd t o r t e 8d libitum
-134-
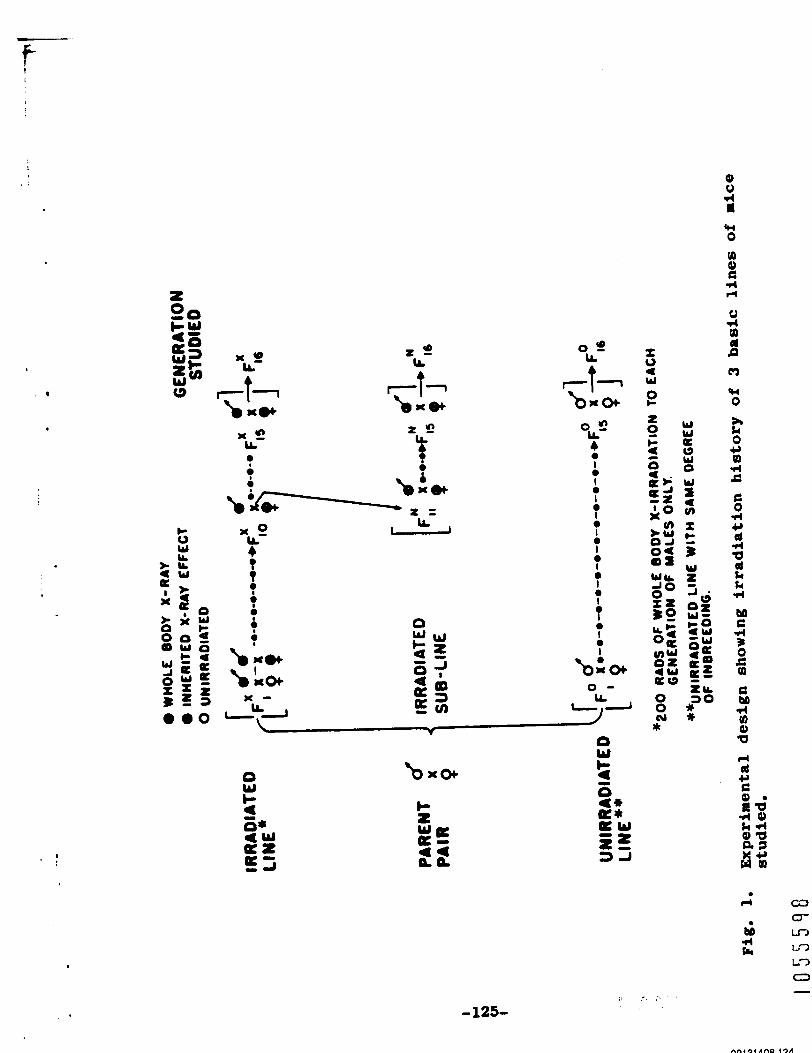
t 1
I
I
2 2 LL
4- bxec
Y * &L-
t
0 2 LL
A- b o +
o m LL- 4 0 I 0 I 0 I 0 I
c 4
b X O +
0 I 0 I 0 I 0 I 0 I
t i I 0 1
bf, 0 -
LL I- I
-125-
!
i
I
I
1- ?'
i
for their e n t i r e l i f e span,
proficiency of each l iao was maintained for line comp8rI~)ns.
The comparative product ivi ty of each of t h e 3 basic l i n e a is
t abu la t ed in Tables 1 and 2.
A record of t h e reproduct ive
Notable differencelr appear among the 3 l i n e s for severa l
charrcteristlcs,
smallest i n the irrrdiated l i n e , and intermediate i n t h e
L i t t e r size was largest in t h e c o n t r o l l i n e ,
irrrdlated sub-line.
size could k mted according t o the number 02 generat ions
exposed t o X i r r a d i a t i o n , with t h e con t ro l line rece iv ing
It was I n t e r e s t i n g t o note t h a t l i t t e r
the highest ra t ing . On t h e contrary, however, age a t las t
l i t t e r , reproduct ive l i fe , and number of conceptions are rated
in t h e reverse o rde r with t h e irradiated l i n e being rated
first, There appears t o be an a t tempt by Nature t o compen-
sate for genet ic damage causing reduced l i t t e r size by pro-
longing the reproduct ive period of t h e female.
of t h i s compensatory effect is reflected in t h e t o t a l number
of mice weaned (Table 2). Both irradiated l i n e s outranked
t h e c o n t r o l l i n e i n number of mice weaned.
The success
Such charrcteristics as l i t t e r size (Tablu l), number of
litters c a n n l b l i z e d , and number of mice bora dead (mble 2)
reflect t h e radiation-induced genet ic decrement t o the
reproduct ive e f f i c i ency of t h e irradiated l i n e and irradiated
sub-line. However, t h e extended reproduct ive l i f e of these I
2 l b e s suggests a na tu ra l compensation. i. I
4.
-126-
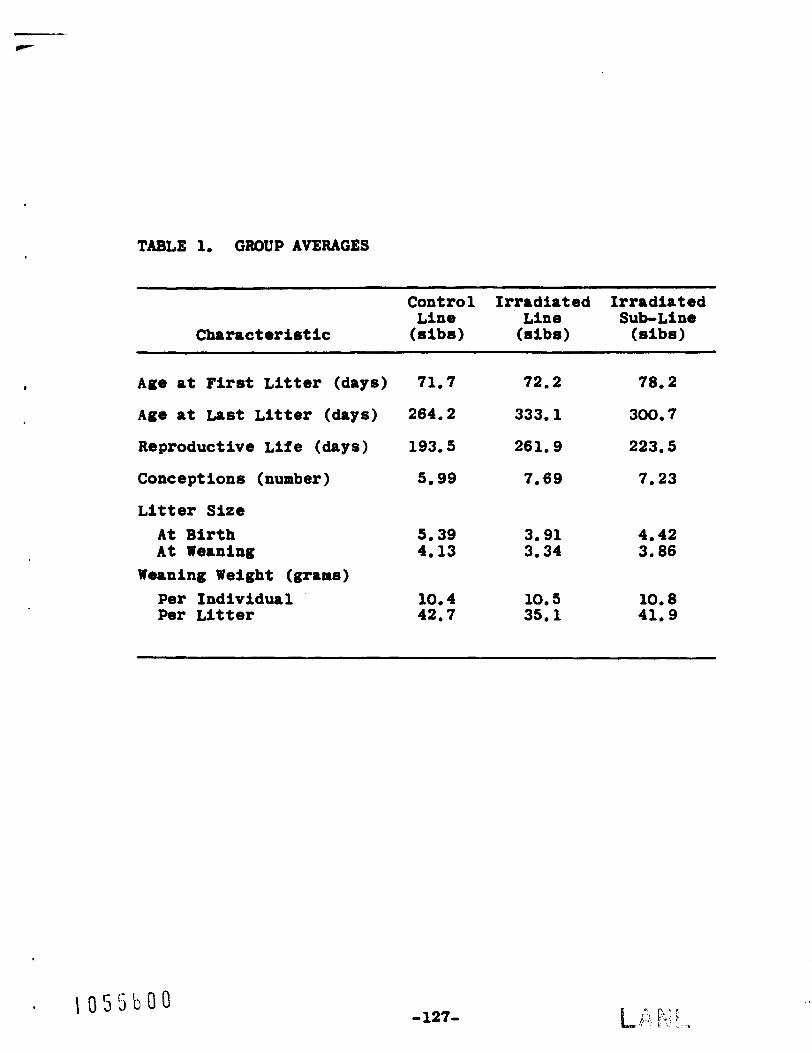
TABLE 1. GROUP AVERAGES
Control I r r a d i a t e d I r r a d i a t e d Line Line Sub-Line
Characteristic (sibs) (sibs) (sibs)
Age a t F i r s t L i t t e r (days)
Age a t Last L i t t e r (days)
Reproductive L i f e (days)
Conceptions (number)
L i t t e r S i z e A t B i r t h A t Weaning
Per Indiv idua l Per L i t t er
Weaning Weight (grams)
71.7
264.2
193.5
5.99
5.39 4.13
10.4 42.7
72.2
333.1
261.9
7.69
3.91 3.34
10.5 35.1
78.2
300.7
223.5
7.23
4.42 3.86
10.8 41.9
-127-
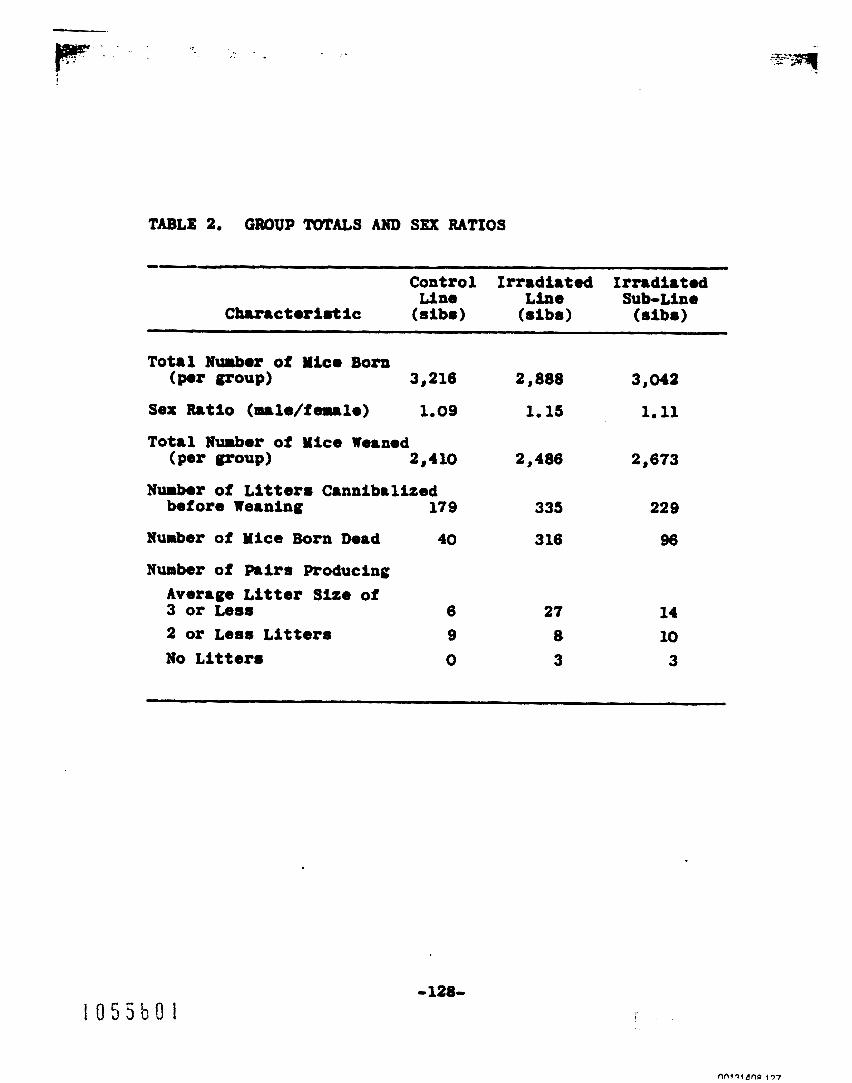
. .
TABLE 2. GROUP TOTUS AND SEX RATIOS
Total Numbor of Yico Born (I?- QrOUP) 3,216
Sex Ratio (maldf-la) 1.09
Total Number of Mice Weaned
Number of Litter8 C8nnibalized
(par gll'0UP) 2,410
before Weaning 179
Number of Mice Born Dead
Number o f Fmirs Producing Average Litter Size of 3 or Less 2 or Less Litters N o Litter8
40
6
9
0
2, a88
1.15
2,486
335
316
27 8 3
3,042
1. 11
2,673
229
96
14 10
3
-128-

Radiation-Induced Irreparable Biologic81 Darrrge in Three Genetic Line8 of Mice wi th Dif fe ren t Ances tml Histories of Radiation Exposure (J. F. Spalding and R. F. Archuleta)
INTRDDUCTION
Earlier Studlets (1,2) have shown that mice from a
gene t i c l i n e i n which t h e males received X-ray exposure each
of s e v e r a l consecut ive generat ions were less t o l e r a n t of
protracted low-intensity gamma r a y s and f r a c t i o n a t e d X r a y s
than were mice from t h e same o r i g i n but w i t h no a n c e s t r a l X-
r ay e%posure. The d i f f e rence i n r a d i o s e n s i t i v i t y between
t h e t w o l i n e s may be a t t r i b u t e d t o a number of factors.
However, i n t h e broadest sense, r ad io res i s t ance o r radio-
s e n s i t i v i t y is determined by t h e amount of Irreparable l n -
j u r y induced and t h e repair r a t e of t h e reparable por t ion of
r a d i a t i o n Injury. The following study is an attempt t o
determine which of t h e above f a c t o r s a r e pr lmari ly respon-
sible for t h e d i f f e r e n c e i n r a d i o s e n s i t i v i t y of t h e two
l i n e s .
METHODS AND RESULTS
Approximately 50 v i r g i n female mice (7 - + 0.5 months 'of
age) from each of t h e 3 basic genet ic l i n e s described i n the
preceding report were used (3), and t h e mice used In t h i s
study were seventeenth generat ion mice or litters from t h e -
1 0 5 5 t 0 2 -129-
previous study.
e X p o 8 8 d t o g 8 n a I r r a d i a t i o n a t a dose rate of 1.69 rads/&
u n t i l an accumulated dose of 1500 rads was achieved. Follow-
ing t h i s condi t ioning exposure, t h e mice were allowed 90 days
t o recuparate from t h e reparable damage induced by exposure
t o ion iz ing radiat ion,
a l l mice i n each group were placed i n individual compartments
and expomod t o low temperature stresr (6 t o 7 O C) for 14 con-
secut ive day&
t h i s 14-day cold stress and a 10-day post stre88 period was
recorded for purposes of comparison.
r e s u l t s of t h i s study.
t i a l l y lower in t h e irradiated l i n e and irradiated sub-line
than in con t ro l l i n e nice, The decreased res i s tance t o cold
stre8a in t h e lrrrdirted lines over t&at of t h e con t ro l line
may be due t o t h e amount of irreparable damge induced by
lS00 rad8 of gana-ray exposure. In other words, irreparable
dmaga in t h e irradiated lines might have been 10 t o IS p e r
cent of t h e t o t a l accumulated dose, while In t h e con t ro l l i n e
it was only 5 per cent, However, s ince cont ro l line mice
were much more r e s i s t a n t t o cold stress than mice of t h i 8
chronological age w i t h a 1500-rad gamma-ray exposure would
be expected t o be (4), these f inding8 are inconclusive and
F i f t y nice from each of t he 3 l i n e 8 were
On day 31 of t h e recovery period,
The number of mice in each group surviving
Table 1 shows the
Survival from cold stress was substan-
8UggO.t f u r t h e r 8tudiO8.
-130-
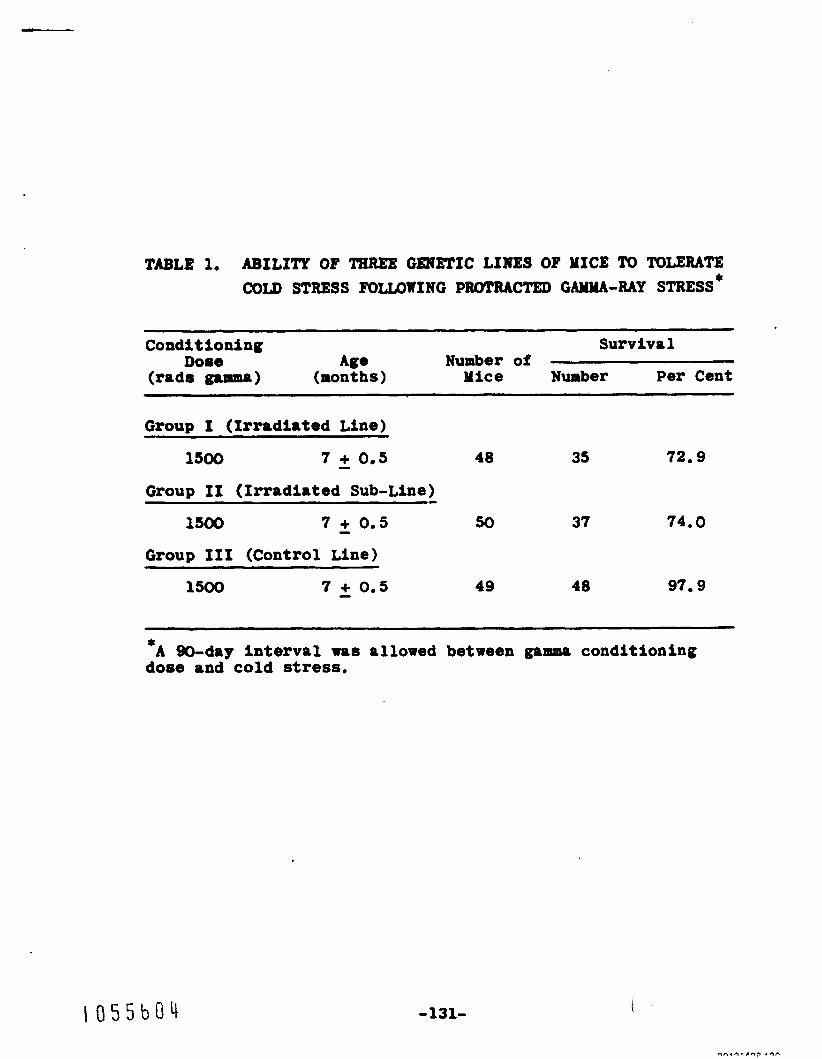
--
TABLE 1. ABILITY OF THREE GIWETIC LINES OF MICE TO TOLERATE COLD STRESS FOWWING PROTRACTED GAMMA-RAY STRESS*
Conditioning Survival
(rads t3-W (months ) Mice Number Per Cent DO60 Age Number of
Group I (Irradiated Line)
7 + 0.5 40 3s 72.9 1500 - Group If (Irradiated Sub-Line) -
7 + 0.5 50 37 74.0 - 1500
Grour, I11 (Control Line) ~ ~
7 + 0.5 49 40 97.9 - 1500
* A %day interval was allowed between gamma conditioning dose and cold stress.
-131- t

REFERENCES
(1) J. F, Spalding and V. G. Strang, Radiation Res. - lS, 329
(Isel), (2) J. F. Spalding, V. Go Strang, and W, L, LeStourgeon,
Radiation Res, - 18, 479 (1963).
(3) J, F. Spaldlug and Y. R. BCOOkb, Breeding Characteristics
of Offspring from Mice with Fifteen Generations of X
Irradiation t o the Males, this report, p. 124.
(4) J. F. Spalding and T, To Trujll lo, Cold Stress as a
Test for Rate of Aging i n Three Line8 of Mice with D i f -
ferent Histories of Ancestral X - a y Exposure, t h i s
report, p. 118.
t o 5 5 5 3 0 5 -132-

c
I n a b i l i t y of t h e Mouse t o Recognize Gamma Radiations. 1. Variable L o w Dose Rate Studies In RF Mice (J. C. Hensley, J. F. Spalding, W. F. Schweitzer,* and R. F. Archuleta)
INTRODUCTION
The recogni t ion of Ioniz ing r ad ia t ion8 by mammalian
s u b j e c t s has been reported by Andrews and Peterson (1).
These au thor s concluded t h a t no recogni t ion of X i r r a d i a t i o n
is observed by mice when exposed t o 10 r / m h or less during
a c u t e exposures, w i t h questionable avoidance noted as rates
approached 50 r/min, and d e f i n i t e avoidance response as
rates Increased. Their conclusions were based on v i s u a l
observation. O the r s have made v i s u a l observa t ions of behav-
io ra l d is turbance r e a c t i o n s in r a d i a t i o n f i e l d s (2).
No app l i ca t ion of accura te dosimetry t o a study of the
recogni t ion of r a d i a t i o n s by ind iv idua l s u b j e c t s has been
reported. The dose rates used in t h i s study are below those
of previous recogni t ion s t u d i e s t o e l lmina te i n t e r f e r e n c e of
radioneurological disorder w i t h s e l e c t i o n of pos i t i on in a
r a d i a t i o n f ie ld .
METHODS AND RESULTS
Thir ty RF mlce were selected randomly from a group of
3- t o 4-month-old mice. Observation of mice this age Indica tes
maximal c u r i o s i t y and a c t i v i t y .
* From LASL Group H-8. * 1 0 5 r j b O b
-133=
. ... -. .
Xndividurl AgP03 glr88 rod8 were irplmted r r e p t l c r l l p
SUbcUt8nOOU8ly 8 t the a b d o d n a l midline (1 c m posterior Of
t h e xiphoid i n erch mou8e).
t ioned a8 s t a t i o n a r y d o 8 b O t O r 8 ,
in l ength and 1 mm in dirueter 0- a convenient size for
b p l r ~ t 8 t I o n .
Ident ic81 AgPo3 rod6 were posi-
Rods implanted were 6 m a
Tolerance Of tho88 rods t o tissue f l u i d 8 and
exco l l en t S t r b i l i t y are recognized,
Tha range of d o a h e t r y pos8iblo wi th those rod8 an8 from
10 t o 10 r gamma. Exposure of s i g n l f i c r n c e causes forut ion
of 8trblo f luore8cent l o c i within the rods which, when ex-
cited by near u l t r r v f o l e t l i gh t , produce l l l ~ n e s c e n c e of a
wave length of 6400 A.
dose abmrbed.
5
0
Fluorescence I s r e l a t i v e t o t h e t o t a l
A Turner Fluorimeter was used f o r ana lys i s ,
A 3-cUrle COeo 8 0 U r C 0 W 8 8 u88d for exposure6 (Fig. 1). The
mice wero posit ioned 10 per cage In the crge-run assembly
shorn in Fig, 1,
theso cage po8ttion8,
Food, water, and bedding were suppl ied a t
L i g h t source8 were equ id i s t an t from
each crg. position rnd of equal i n t ens i ty ,
perrtures wero esmentiolly equal a t a l l point8,
as8embly w88 posit ioned 18 in, above t h e floor and -6 leveled,
It was assumed that environmental c l u e s as t o d i r e c t i o n from
Ambient ten-
Th. e n t i r e
the source ware 8b8ent.
The po81tIon of t h e rice m8 noted a t tho urn8 tlu erch
dry. Thlrtp-tWO obsentrtions W e r e -de rhero 90 p r cent Of
-134-
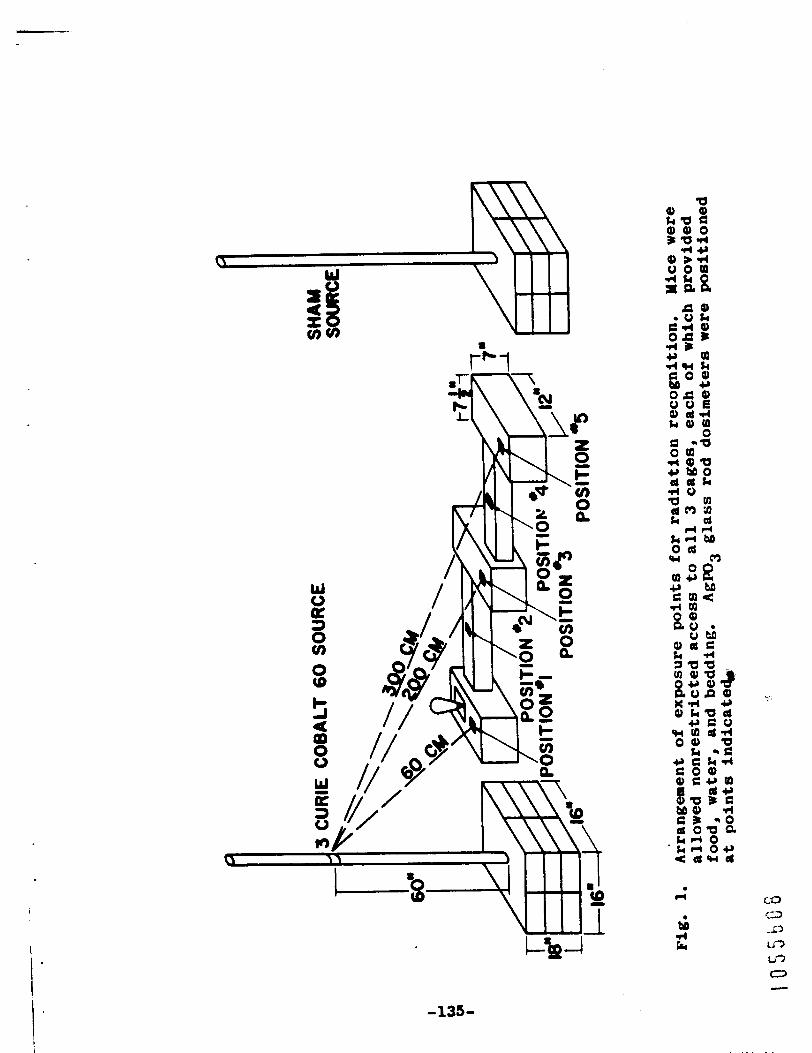
I
I
-135-

t h e subJect8 wore a t a specific pornition i n t h e cage-run
as8embly. Tho dome rate a t e8ch pos i t ion r r a also moaitored
by AQma gU.8 rod8 (Fig, 1). The t o t a l do88 t o e8ch POSI-
t i o n l a hdlcated in Pig. 2. Cage posi t ion8 I, I f , and I11
received to ta l accumulated doses of 5702.76, 2105.32, and
900.0 r, respect ively.
i nd ic r t ed dose rates ranging from 7.57 t o 1.20 r/hr (Fig. 1)
Dosinrter positionm I through V
during the 752-hour period.
The averrge accurulated doe. received by implanted
do8imet8ra w8m 2628 x 10 radi, within tho range of 2.3 x 10
t o 2.8 x 10 rad& F i g u r e 3 i nd ica t e s t h e percentage of
animals rece iv ing total absorbed doses ind ica ted in t h e range
categories of 0.05 HAD var18nce.
doae accumulation was decidedly toward t h e higher dose ranges,
Ind ica t ing a tendency t o spend a proportionately greater per-
centage of tlme during i r r a d i a t i o n In the v i c i n i t y of t h e
3 3
3
Note that d i8 t r ibu t ion of
cow source.
Figure 2 h d i C 8 t U 8 t h e observed po8ition of the mice.
Had the subjec t8 a c t a l l y spent t b e a s observed in t h e
v i c i n i t y of the source, the average actual doae would have
been 0.68 r8d/m0u8e POCO th8n t h 8 t derived iron fmplmted
dosimeters, i nd ica t ing that actual time spent i n the v i c i n i t y
of the source was greater t ' a n noted.
-136-
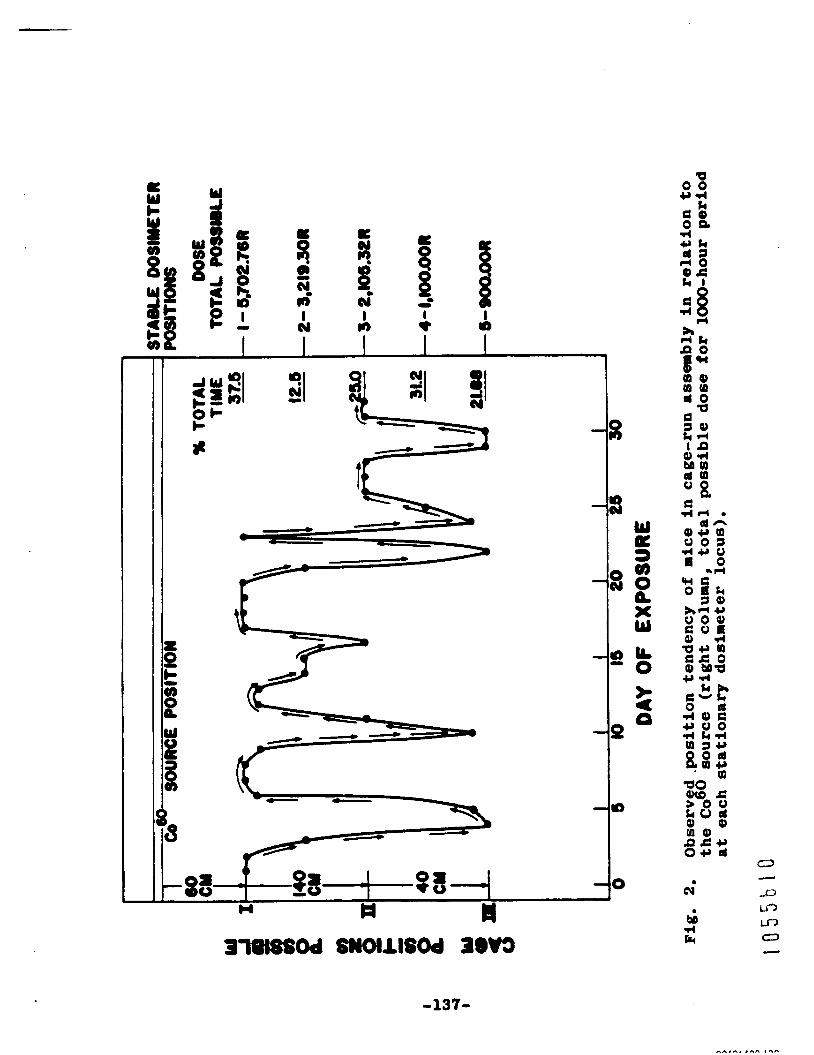
li e x w
f' -137-
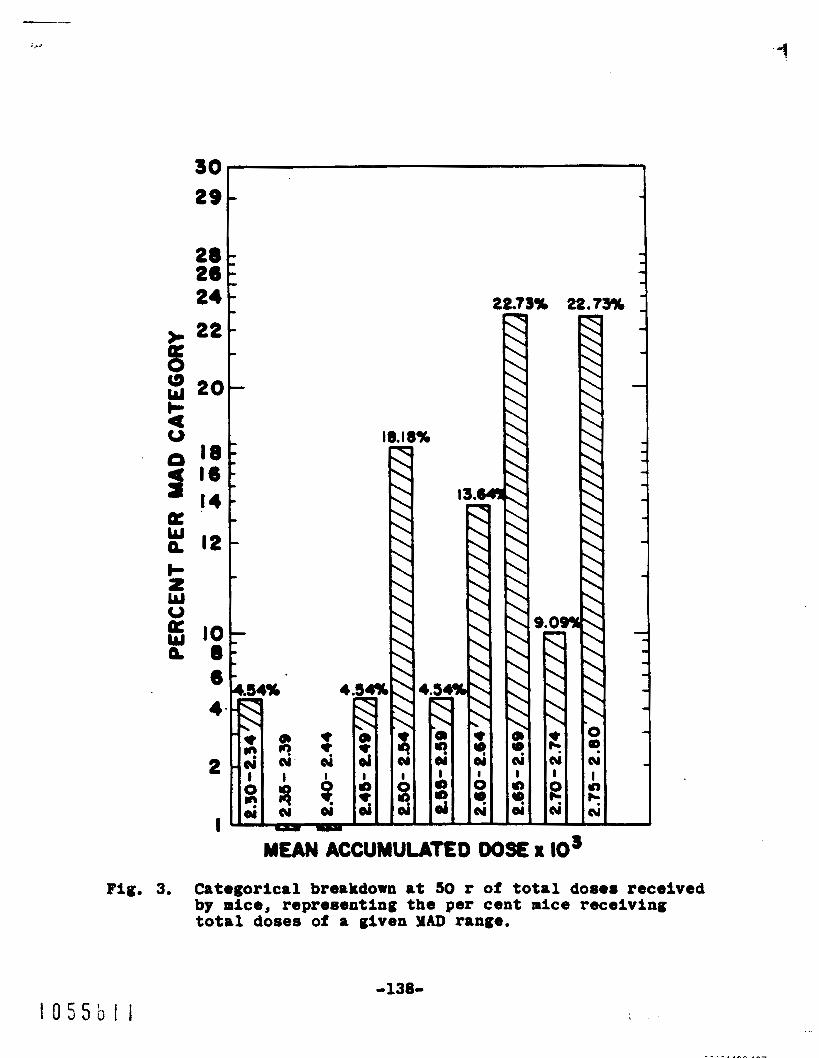
30 I 1 29 t 28 26
t 4
a 16 I4
12 = ’ I I t
2 w u = W IO a 8
18.18%
I K
MEAN ACCUMULATED 00s x IOa
F i g . 3. Categorical breakdown at SO r of total doses received by mice, representing t h e per cent mice receiving total doses of a given MAD range.
-138-
DISCUSS ION
Since there were no environmental c l u e s t o loca t ion of
t h e source i n r e l a t i o n t o t h e cage-run assembly, one must
conclude that l o w dose rate gamma r8di8tiOn8, regardless of
accumulated dose totals, do not evoke a recogni t ion response
in mice. Since dose rates were s u f f i c i e n t l y l o w t o avoid
neuro logica l disorder from exposure, and since a c t u a l expo-
sure w a s determined by ind iv idua l dosimeters carried by t h e
mice, no a l t e r a t i o n of recogni t ion evaluat ion was observed
v i s u a l l y and no *'exposure confusion" was manife8ted.
The average mouse dose rates, compared t o those of
s t a t i o n a r y dosimeters, c o n t r a r i l y ind ica ted a tendency t o
equi l ibr ium between possible dose rate points , w i th a pos-
i t i v e tendency toward positions closer t o t h e source.
More extens ive s t u d i e s are planned involving extremes
In dose rates and t o t a l possible dose f o r determination of
recogni t ion possible within exposure f i e l d s where I n a b i l i t y
t o recognize high dose rates w i l l result in e a r l y mortal i ty .
-139-
(2) H, F. mrlo~, In; Intornational Syrposiur on the
~ 8 p o X L S O of tho ~ O ~ O U 8 878t.r t o Ionizing R8di8tion8
Academic m.880 How Pork (l962), pp. 637-644.
MAMMALIAN RADIOBIOLOGY SECTION
PUBLICATIONS
(1) J, F. Spaldlng, V, G. Strang, and W. L. LeStourgeon,
ChPr8cteristics of Offsprlng from Ten Generations of X-
Irradiated Male Mice, Genetics - 48, 341 (1963).
(2) J. F. SpPldlng, V. G. Strang, and 1. L, LeStourgeon,
The Effect of Ancestral Irradiation Exposure on Radioresistance
in Their Descendants, Radiation Res. - 18, 479 (1963).
(3) J. P. S p l d l n g , Biological Recovery from Radiation
Injury, In: EnCpClOpOdi8 O f x - h y 8 and G.nrrPr Ray8 (G. Le
Clark, ed. ), Reinhold Publishing Corporation, New York (19631,
pp. 929-931.
f 0 5 5 b l 4 -141- i
MANUSCRIPTS SOBYSTIP)
(1) J. F. Spalding, Longevity of Fir& and Second
Generation Offspring from Male Mice Exposed t o Fission Neutrons
and Gam Rays;, t o be published i n Proceedings of t h e In te r -
Mti0-1 s~RO6%Ur on t h e Effec ts of I O I l i Z i B g Radiation on ~ ~
the Reproductive System, Fort Col l ins , Colo. (September 17-
19, 1962).
Genetic Ef fec t s of X I r r ad ia t ion of 10, 15, and 20 Genera-
t ion!~ of Yale Mice, 8ukPitted t o Health PhyS$CS.
(3) J, ?. Spalding and J, A. Sayeg, Dose Rate Effect8
l i shed in tho Proceodtngs of the IA66 Syrpos i~a on t h e
Biologic81 Effects of Neutron I r r ad ia t ion , Brookhaven Nation81
Laboratory (October 7-11, 163).
f 0 5 5 b f 5 -142-
.-e>-, . A ^ , ,,
Eumco 11: Sta tu8 Report (P. N. Dem and E. C. Anderson)
Eumco I1 has now been f u l l y calibrated for measuring
Cs137 and pot888iun.
done using water phmtonrs.
The Cs 13' c a l i b r a t i o n raa i n i t i a l l y
When Cs 132 became avai lab le , it
was used with human 8ubjects. C e s i u m 132 is very usefu l for
t h i s purpose In t h a t it has a 6.2-day half- l i fe and a gamma- 137 ray energy of 0.667 MeV (0.662 for Cs ). The potassium
c a l i b r a t i o n was done using
8nd a gamma energy of 1.53 MeV (1.46 f o r K ). The two cal-
wi th a half-life of 12.5 hours 40
i b r a t i o n curves are shown In Figs. l and 2. ,
Humco I w a s removed i n t h e fr l l of 1962. This allowed
t h e con8tructIon of a w e l l such th8t there IB now a s i n g l e
room containing a l l equipment 88socirted with Humco I1 and
u8ed exclu8ively for wholo-body counting. Figures 3 and 4
8bor t h e present arrangement of t h e room and equipment.
- In JInU8- 1963, a failure of t h e high vol tage supply
-143-
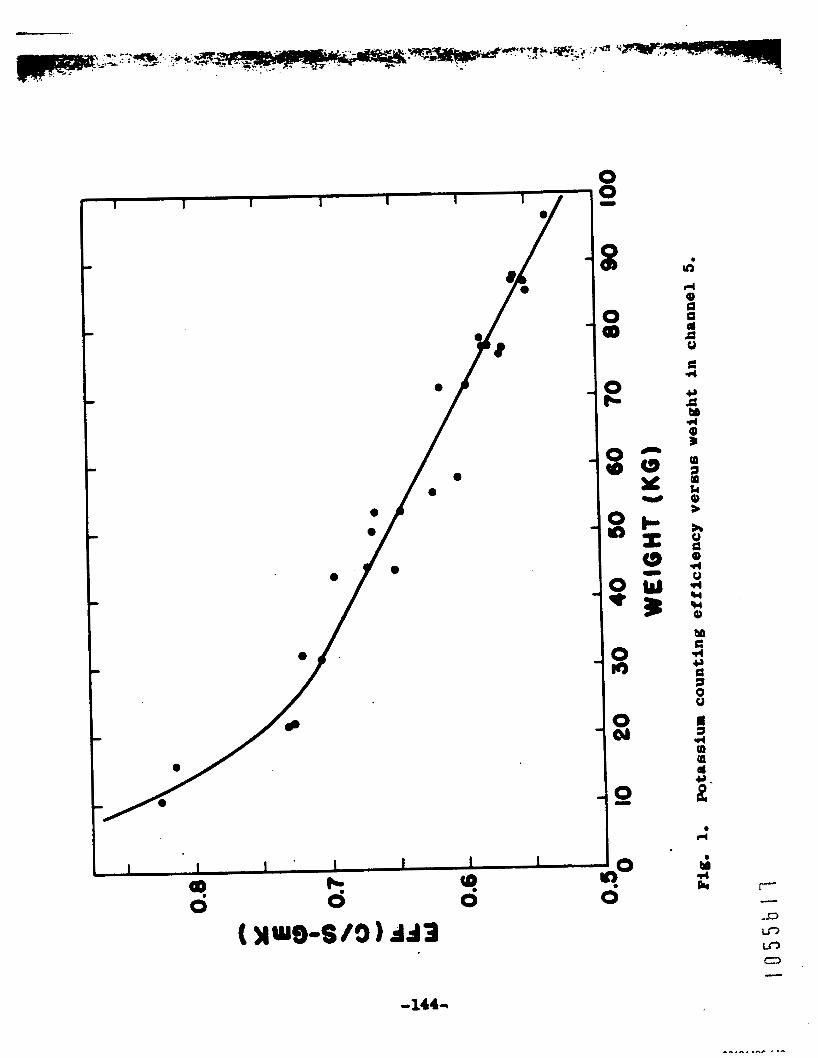
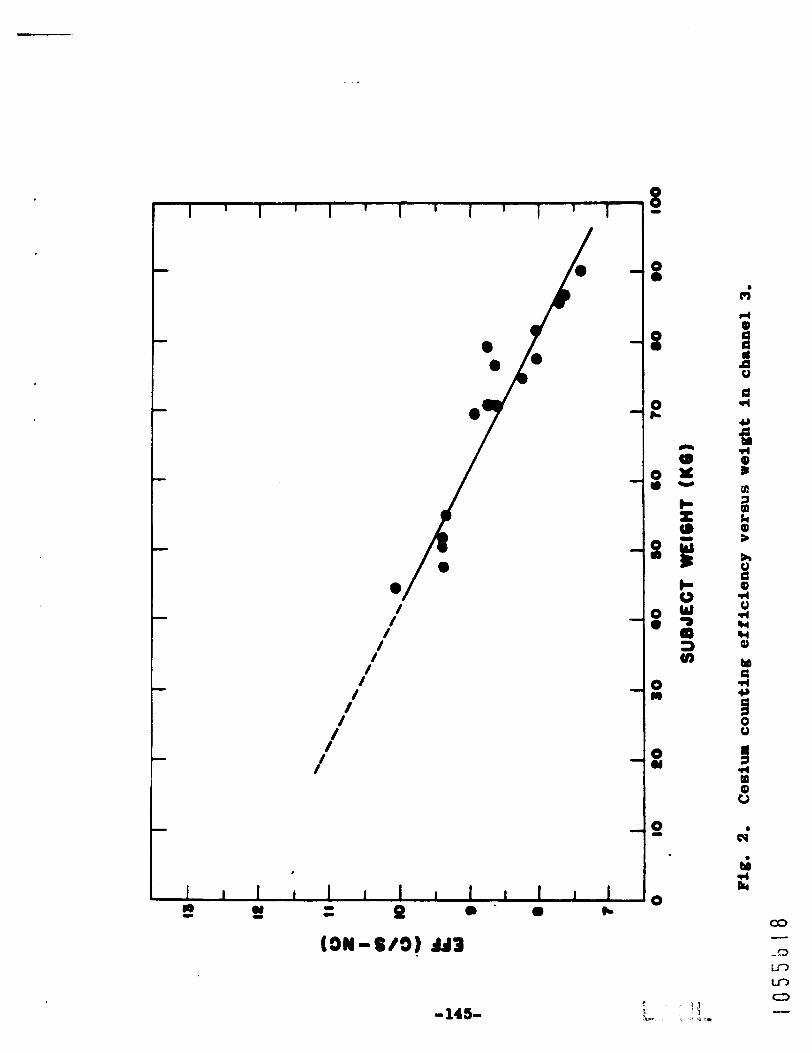
/ / / / / / / / /
4 /
4 /
I I I I I I I I I I I 1 I e 1! .I Q 0 . b
(9N-S/9) U 3
-
-145-
8 0
8
8
0 h
0 a
s
0
0 m
0 Y
P
0
C ' ! I" 8 . -s
m'
M E
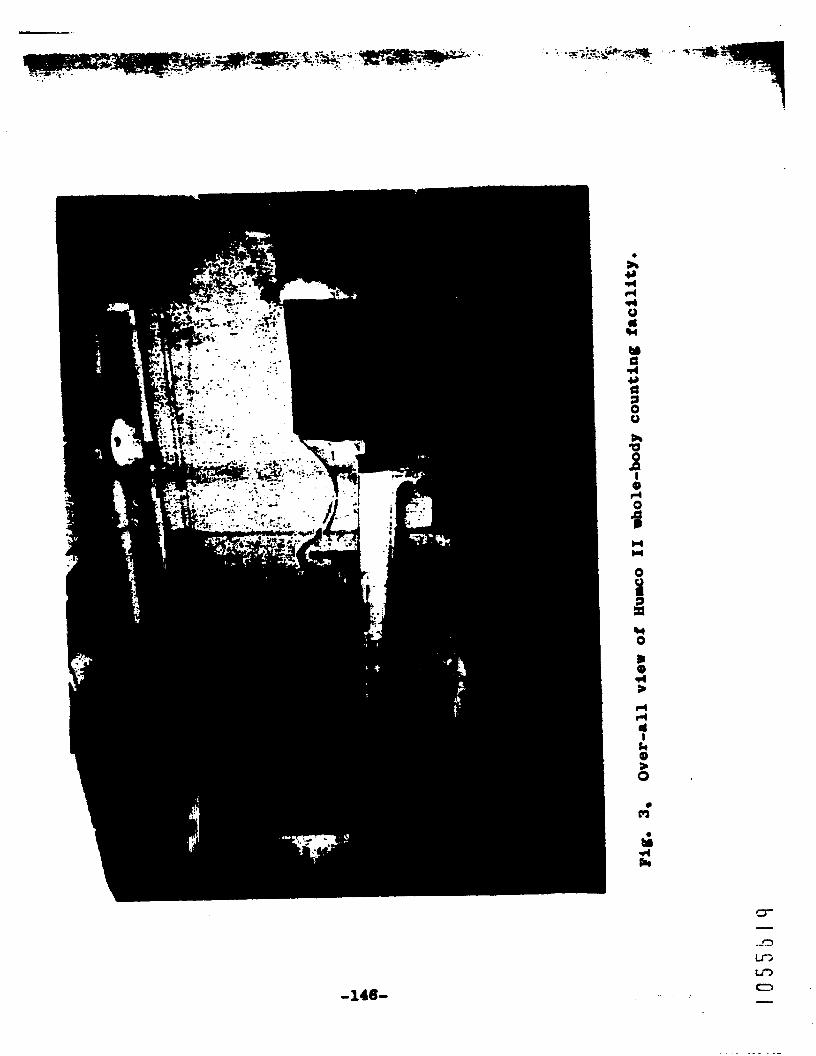
0
A
d d 0 al W
Y CI d Y e 3 0 0 A a
I Q) d 0 a n n
0
$:
B
Y 2 W 0 L 0 d > d d al 1 k Q)
8
ai m
d P,
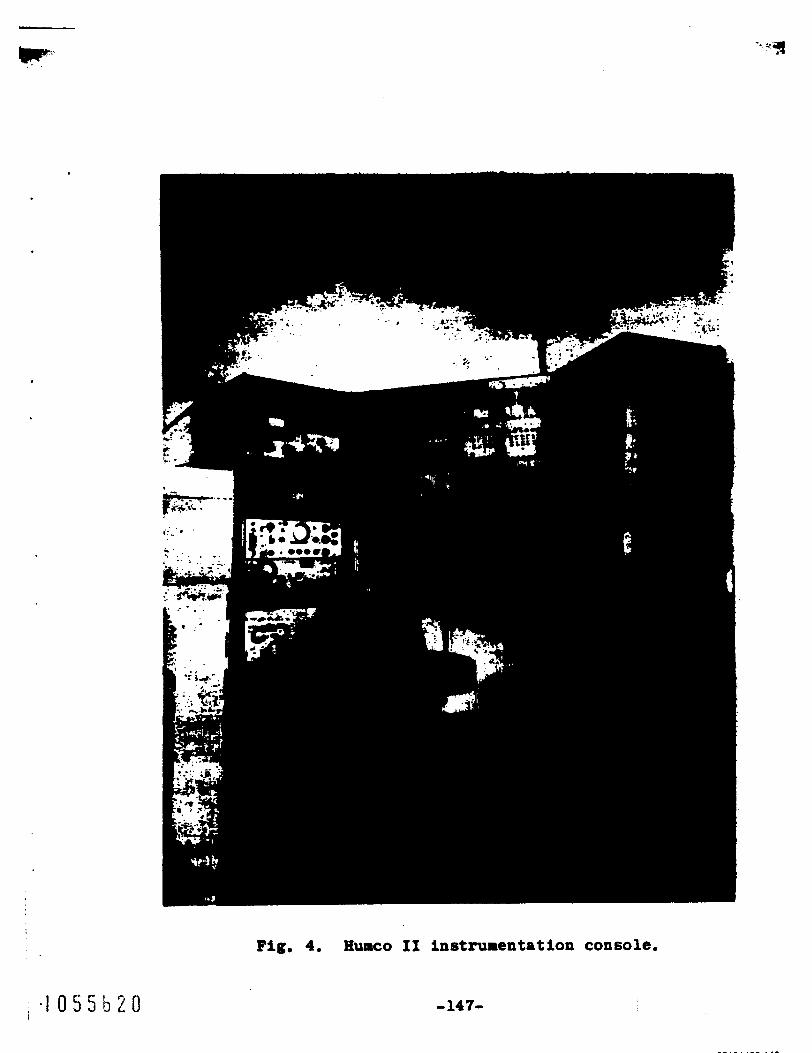
Fig. 4. Hunco I1 instrumentation console,
-147-
introducod an i a 8 t 8 b i l i t p i n t o the counter. I t is believed
th.t t h l 8 warn duo t o an O%C088iVO V01t.g:. being applied t o
tho photomult ipl ier tub08
broko dom, Sinco t h i8 condi t ion could perrrnent ly daprge
tho photomultiplier8, step8 have been t8ken t o prevent i t8
tho high V O l t 8 - supply, a8 it
r.cuIpronce. An electronic device h88 boon con8tructed such
that if t h e high vol tage ever changes (either plus or minus)
by more t h i n a prodeterrained amount, t h e high vol tage supply
w i l l be turned off. Under present operat ing condi t ions, the
W l r % t O r i 8 8.t t o tr1g-r OB 8 chang. hi* Voltage Of
- + 1 per cent,
A .light dacr0880 in 81-1 output of the photomultiplier-
8 d n t i l l a t o r combination led t o t h e flumhlng of the 8cin-
t i l la tor 8olut ion w i t h argon. It I 8 believed th8 t a ince t h e
tank ha8 a sul l diimeter vent pipe t o the It808phOr0, oxygen
had entored tha 8olutlom, thum cauming a decre.8. in pulse
hoigbt f r o m tho s c i n t i l l a t o r ,
9 month8 without irgon flurhing,
thim problem, it h88 boan decided th8 t 60 cubic feet of argon
rill be bubblod through the 8ciatlllator once every 2 month8
at tho rata of 4 cubic feet per hour.
Tho countor had opu8ted for
To pravont a ~pocurrenco of
Durbg tho t h O f r O B A p r i l 1962 t o J U n O 1963, 8 tot81 Of 40 345 1088urement8 wera made of t he g a m a c t i v i t y (both ft
and C ~ B ~ ~ ~ ) of humaa sub jec t s using Eumco 11. mi8 w i s a
\ 0 5 5 b i I - 148-
random population sample c o n ~ l 8 t l n g of vit!titors t o t h e Health
Research Laboratory and r e s i d e n t s of Lo8 Almos.
t i o n of potassium concentrat ion versus age was made on these
subJects. Two previous s t u d i e s of potassium concentrat ion
ve r sus aQe were made using Humco I and have been reported (1,
2), The present study m s made t o determine whether data
from Humco I1 would agree w i t h tha t from Humco I.
shows the r e s u l t s from a l l three s tudies . The plo t ted p o i n t s
are from t h e Humco I1 study w i t h an error of 1 standard devia-
t i o n of t h e mean (ui<n, where ui is ca l cu la t ed from t h e ob-
served scatter of t h e data, and n is t h e number of de t emina -
t l o n s ) . The somewhat larger scatter of t h e po in t s is due t o
t h e small sample size, the v a r i a t i o n i n a group of given age
and sex corresponding t o an average ai of 12 per cen t -- similar t o t h a t previously observed.
A determina-
Figure 5
The results for a d u l t females agree within experimental
error w i t h t h e previous curves. For a d u l t males, there is a
tendency for t h e present data t o lie seve ra l per cen t above
t h e previous. Tho male peak a t age 16 is about as i n t h e
1959-1960 data.
a l though t h e s ta t i s t ics a r e marginal.
these data l a t o provide an independent opera t iona l confirma-
t i o n of t h e agreement of t h e average p t a s s i u m c a l i b r a t i o n s
of Humco I and Humco 11.
The peak a t age 8 appears t o be confirmed,
The primary value of
-149-
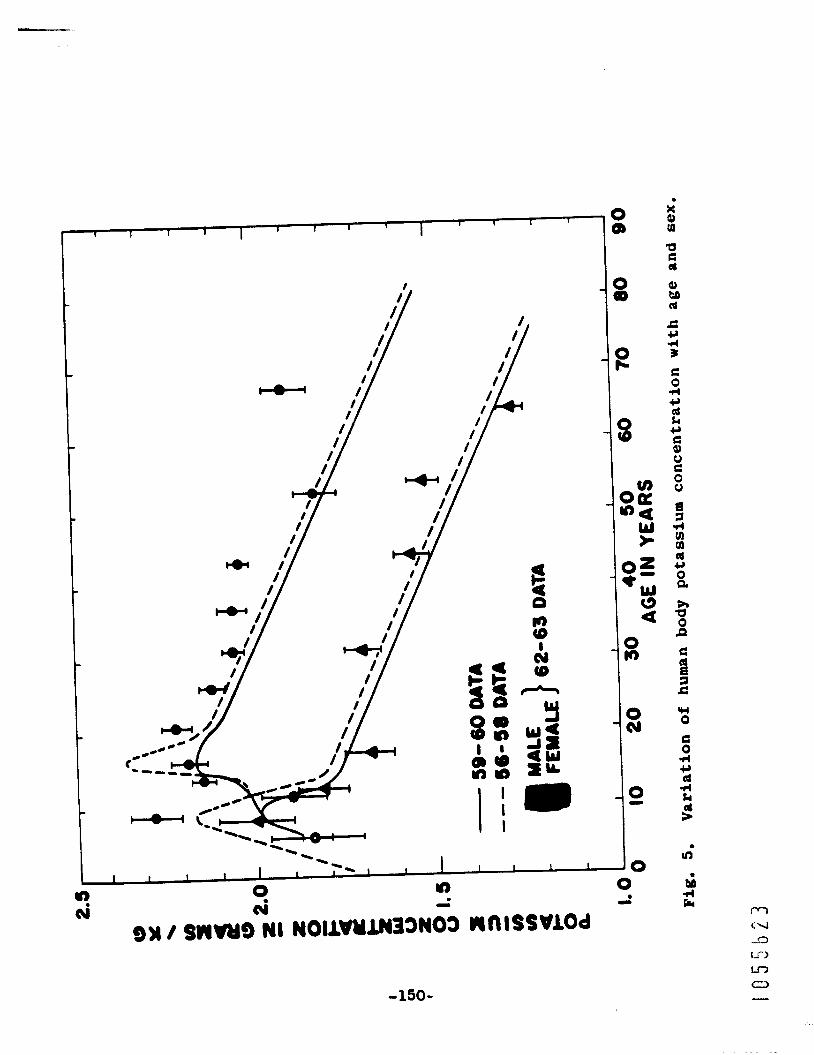
0 L
-150-
REFERmCES
(1) E, C, Anderson and W. H. Langham, Science 130, 3377 -- (1959) .
(2) E. C. Anderson and B. E. Clinton, Lo8 Alamos Sc ient i f ic
Laboratory Report LAMS-2526 (1961), pp. 121-128.
-151- > I
‘ 3 h -
- Absolute C8libr8fio1i of Whole-Bodf Gam-Ray Spectroaeter for Potasmiur and c0m1-l~~ (P. N. Dean and Y. A. Van D i l l a )
XNTRODUCI'ION
P a m t work w i t h t h e huarn gamm8-ray spectrometer a t t h i s
Laboratory did not r equ i r e absolute c a l i b r a t i o n for potassium
and Cs13'.
c a r e f u l abso lu t e c a l i b r a t i o n was necebsary, and w e took advan-
tage of t h i s opportuni ty t o calibrate t h e spectrometer a lso.
The spectrometer f a c i l i t y cons i s t s of a 9-3/8 x 6411. Naf
c r y s t a l in a movable overhead mount in a steel room made of
7-111, t h i ck steel (naval armor plate). The subject r e c l i n e s
in a t i l t i n g chair made from a standard commercial lawn chair
following t h e Argonne design (Fig, 1).
When Rumco 11 was put i n t o operat ion, however,
F ~ t a s s l u m ~ ~ and
were U S 8 d i n t h e ca l ib ra t ion ; t h e r e s u l t s for a wide
range of sub jec t weights for both counters are given below.
YETBODS
Tho K42 c a l i b r a t i o n technique has been described else-
where (1). obtained from t h e Japan Atomic Energy
Research I n s t i t u t e , was used becru8e it has a short h a l f - l i f e
(6.53 days) and emits a gamma ray of energy 0.667 Mev (0.662
for
detail (2). Tho isotope w a s administered intravenously. Tho
The Cs132 decay scheme has been reported i n .
syringes were counted both before and after i n j e c t i o n and
-152-

Fig, 1, The U s A l a m o s whole-body spectrometer. e
-153-
compared t o a d3' standard, which yielded
microcuries of Cs 13' given t o the subjects.
i b r a t i o n experiment used 4 male s u b j e c t s i n
of 28 t o 42 p a r 8 and woight range of 70 t o
t h e equivalent
The first cal-
t h e age range
81 kg. These
s u b j e c t s were counted a t 2, 3, and 4 hours t o determine t h e
mixing t h m for t h o isotope.
then counted af ter a tlmo i n t e r v a l such that t h e count r a t e
A l l succeeding subject8 were
from t h e C8 13' -8 not chanqfng wi th t l m m . An a d d i t i o n a l
8 -16 s u b j e c t s and 8 female s u b j e c t s were used i n the age
range of 23 t o 52 yerra and weight range of 44 t o 89 kg.
RESULTS
Figura 3 show. t h e counting e f f i c i ency of t h e human spec-
trometer for po tas s lu r am a func t ion of 8ubject weight. The
plotted point8 are counts per minute per gr8a of potassium
versus body weight. Only t h e ICw f u l l energy peak is wed.
The solid l i n e is a least squares computer f i t t o t h e data
points. The standard devia t ion of an ind iv idua l point Is
I, + 5.1 per cen t , so that t h e uncer ta in ty in a given potasalum
d e t e r m h 8 t i o n would be 5.1 per cen t p lus effect of counting
statistics and any other po8aible errorb. Actually, count-
ing statist ics do .not introduce the nrrjor e r r o r for adult..
Thus, f o r a -male (serial number- the s t lnda rd
devia t ion w a s 2.2 per cent f o r a %-minute count of subjec t
-154-
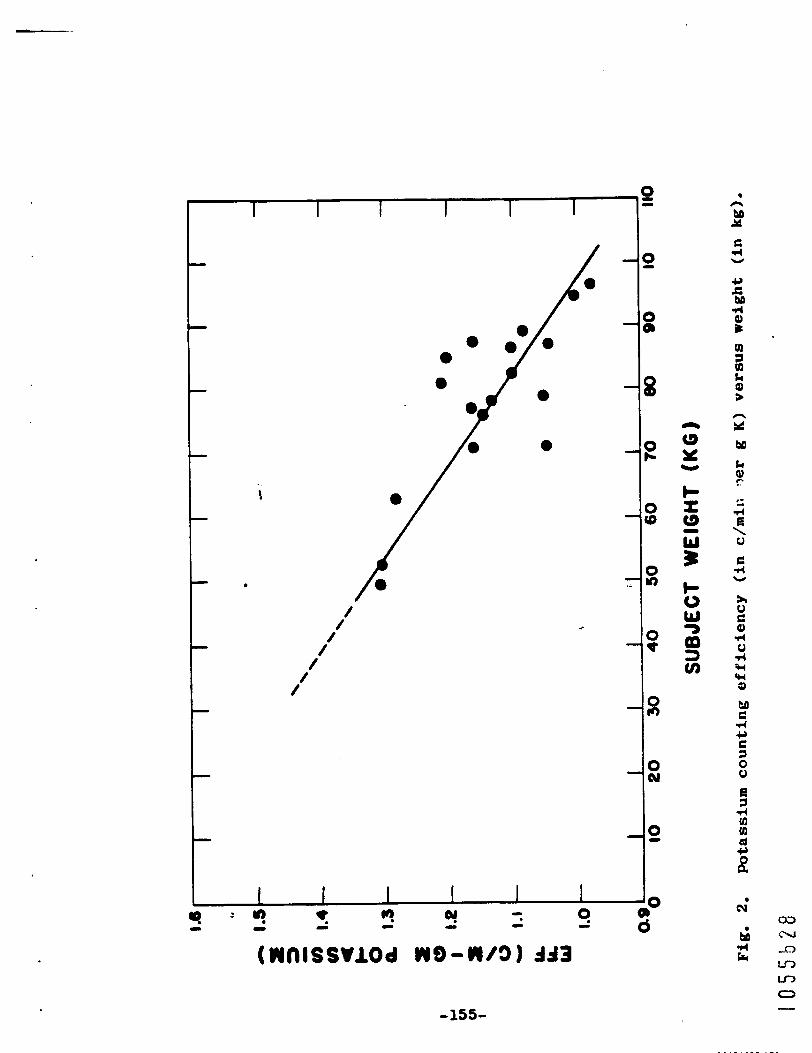
I I I 1 1 1
.
0 n M Y
C l 4
4J C M 4
Y
t
-155-

and brckground and 4 # 9 par cent for a 10-lainute count,
effect of subject weight i r appreciable , being 35 per cent
The
over t h e w e i g h t range of So to 100 kg.
Figure 3 show8 the r e s u l t s of t h a C8132 c a l i b r a t i o n
experiment, The plotted poin ts are count8 per minute per
rianocurlo of Cs 13' versus body weight. Conversion of data
In termas of Cs 137 w a 8 mrde with a c8 137 standard (Group J-11
v i a l la) mapplied by the R8diochenristrp Group of U S L . Only
tha f u l l energy pe8k above t h e continuum -8 used in comput-
i ng count rate. The solid l i n e is a least squares computer
fit t o the data points. The standard devia t ion of a s i n g l e
measurement is - + 3.6 per cent , so that the uncertainty in a
given Cs13' determinat ion would be t h i s number p l u s t h e
effect of count ing s t a t i s t i c s and any other errors. For t h e
same subJect mentioned above w i t h a Cs137 content of about
17 nonocurleu, the e r r o r due t o count ing s ta t is t ics and
e s t i r u t i o n of t h e continuum warn 6.4 par cent for a %-minute
period. The effect of weight on count ing e f f i c i ency is
considerably less than f o r potassium, being 11 per cen t over
t h e weight range of 50 t o 100 kg, Thus, the mador e r r o r for
sub3ect8 with f a l l o u t C1113' i n t he 5- t o 10-nanocurie range
is due t o count ing st8tlrtlcs, weight effects being less
important,
In comparing t h e two c a l i b r a t i o n r e s u l t s for t h e human
-150-
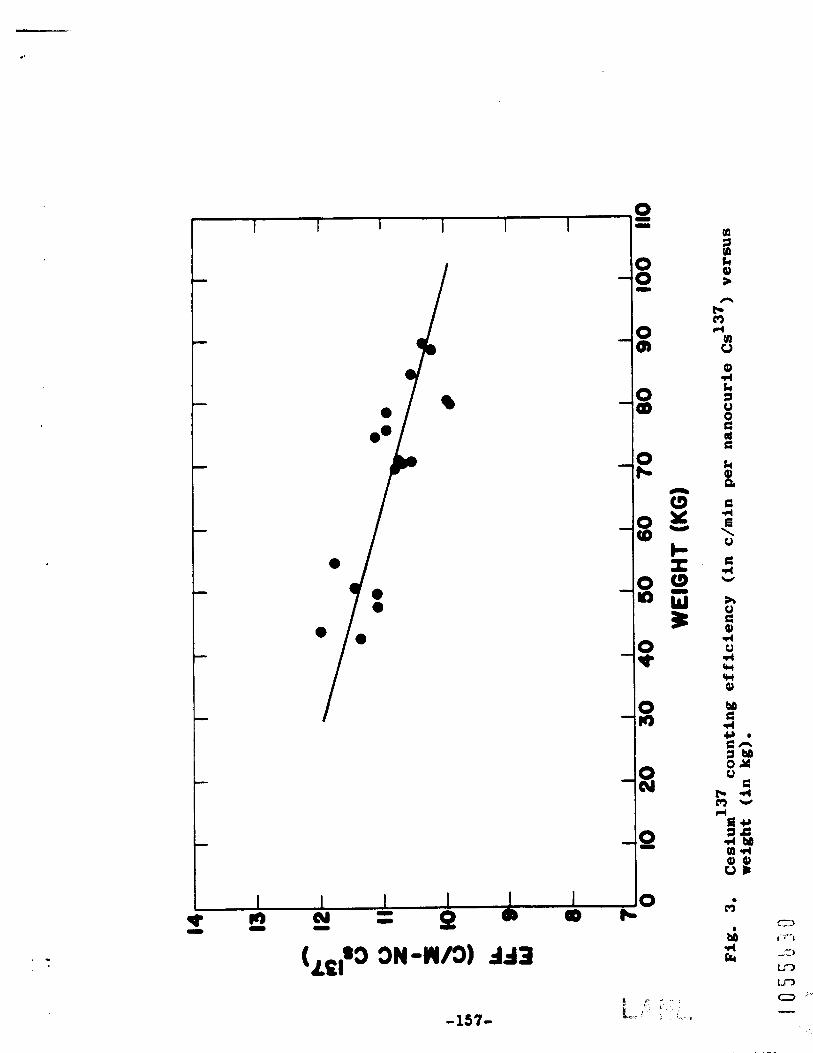
1
-157-
0 D I
0 0 I)
0 0,
0 QD
0 rc
0 (0
0 Y)
0 * 0 rr)
0 64
Q
spectrometer, t h e greater importance of counting statist ics in e a t b a t i o n of f a l l o u t CS 13’ was expected, but t h e s u l l e r
w e i g h t dependence for t h i o l s o t o w was a surprise .
exp lu r r t i on for t h i s I s apparent.
No
It is i n t e r e s t i a g t o conpare t h e c a l i b r r t l o n remlto
for t h8 spectrometer and Humco 11. One would expect the
latter to be less responsive t o t h e weight and size of a
sub jec t because it is e s s e n t i a l l y a 4 t counter, but how much
1.8. i s hard t o eotiPute a pr io r i . The r e s u l t s f o r t h e two
counters are summarized In Table 1. Note that for t h e case
Of pOta88i\ll, t h e uncertainty due t o weight for H-CO I1 IS
lower by a factor of 2.5, which is a s i g n i f i c a n t advantage.
It i 8 cur ious that t h e weight co r rec t ion v a r i e s wl th weight
in a similar fashion for t h e two counters , suggest ing t h a t
geometry effects are similar and t h e va r i a t ion is due t o
8elf-ab.orpt ion by t h e subJect. For t h e case of d3’, t h e
uncer ta in ty due t o weight for Hurco 11 is lower by a f a c t o r
of 1.2. This d i f f e rence was expected but i n t h i s case is
not a very s i g n i f i c a n t advantage.
F ina l ly , one may ask how potassium r e s u l t s on t h e same
series of noma1 subjects measured in both counters compare.
Such data are presented in Table 2 and show that one gets
t h e same answer on t he average, but t h a t measurements on an
ind iv ldua l may differ by 10 t o 15 per
devia t ion for t h i s set of subdects is
cent. The standard
4.8 per cent ,
-158- c ”
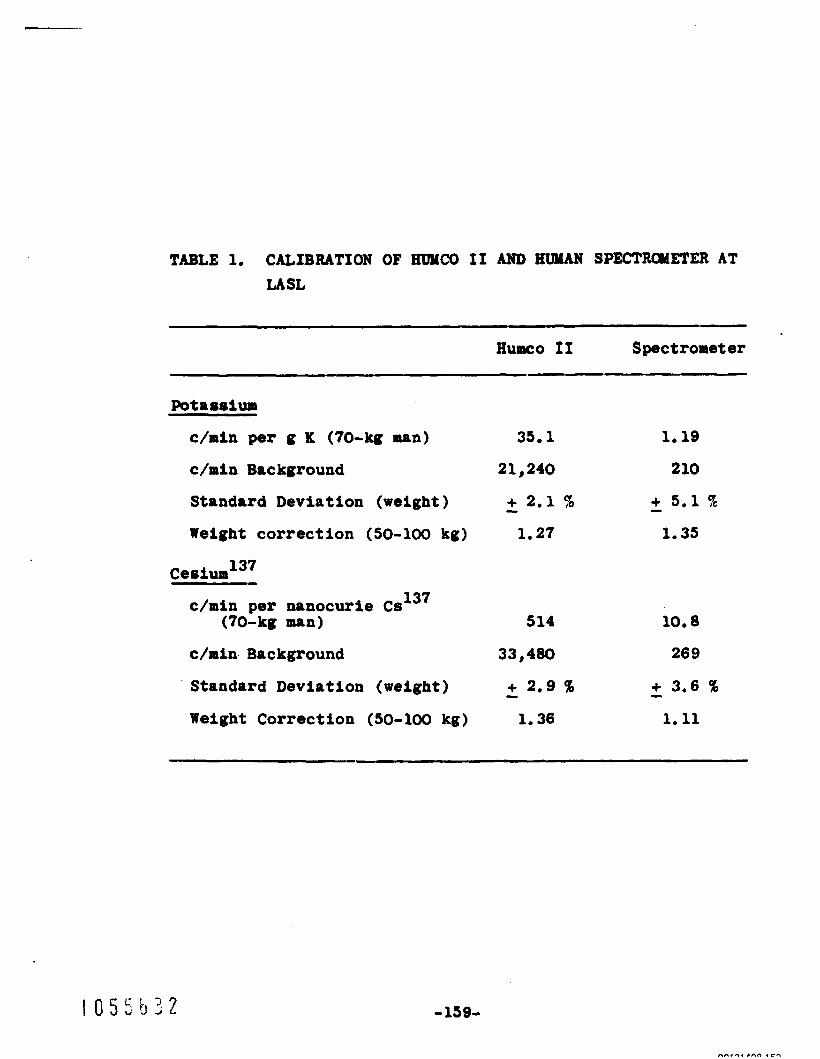
TABLE 1. CALIBRATION OF HUHCO I1 AND HUMAN SPECTRadETER AT LASL
Humco I1 Spectrometer
Potassium
c h i n per g K (70-kg man)
c/min Background
Standard Deviation (weight)
Weight correction (50-100 kg)
137 Cesium 137 c h i n per nanocurie C s
(70-kg man)
c/min. Background
' Standard Deviation (weight)
Weight Correction (50-100 kg)
35.1
21,240
+ 2.1 70
1.27 -
514
33,480
+ 2.9 %
1.36 -
1.19
2 10
- + 5.11 1.35
10.8
269
+ 3.6 X 1.11
-
-159-
nnrr..nn . r n
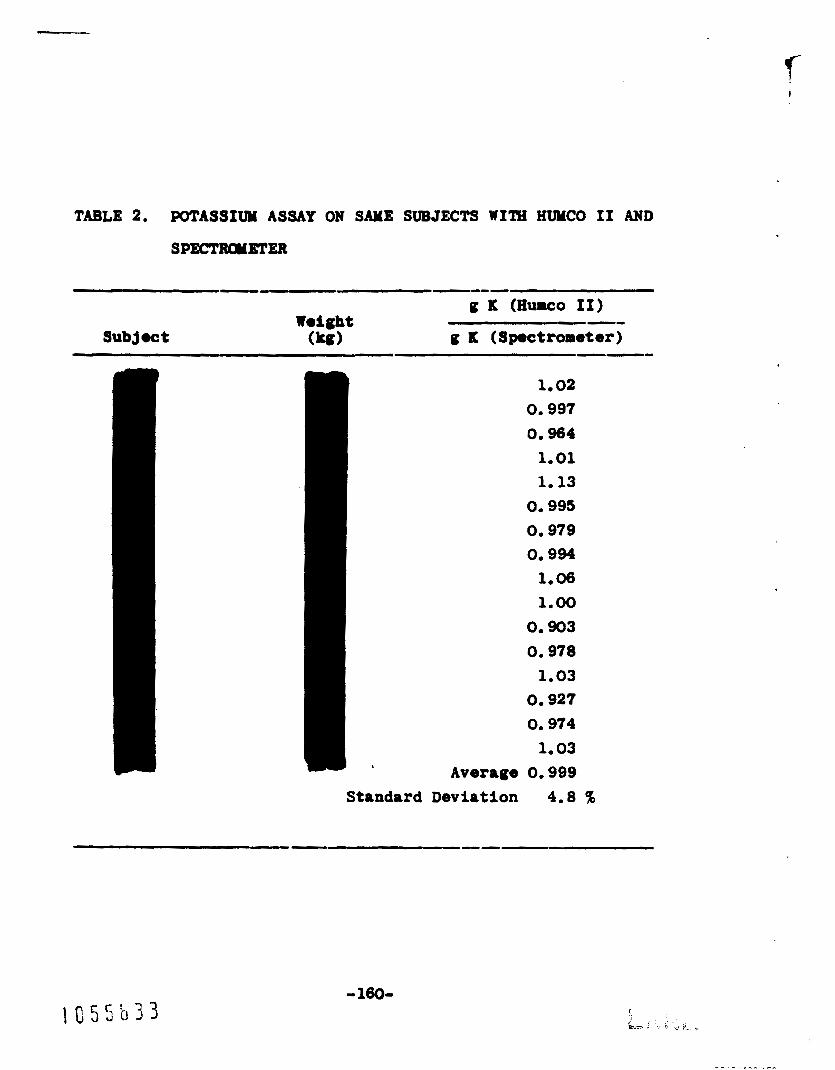
i
TABLE 2. POTASSIUM ASSAY ON SAME SUBJECTS WITH HUYCO If AND
SPECTROMETER
-- -e--
g K (Humco 11) -- Uoight g IC (Spectrometer) -- Subject tW)
1.02 0.997 0.964 1.01 1.13
0.995 0.979 0.994 1.06 1.00
0.903 0.978 1.03
0.927 0.974 1.03
Average 0.999 Standard Deviation 4.8 %I
REFERMCES
(1) P. N. Dean, Experimental Technique for High mecision
Calibration of Whole Body Counters, presented a t the
Second Symposium on Radioactivity in Man, Northwestern
University Medical School (September 1962); to be pub-
l ished in proceedings.
(2) R. Le Robinson, N. R. Johnson, and E. Eichler, Phys.
Rev. 128(1), 252 (1962). --
-161-
Evaluat ion of tho Potassiuma Continuum Contr ibut ion t o t h e
(E. C. Andaf8on, P. N. Dean, and Y. A. Van D i l l a ) C08iUm137 PhotOpO8k i n 8 SOdiUr Sodid. C2'78t.l Spectrometer
INTRODUCTXON - In making a q u a n t i t a t i v e ca l cu la t ion d t h e ~s~~~ body
burden of 8 8ubJ-t from tho m08mrod gamma-ray spectrum, it
i 8 naces68rp t o c o r r e c t for t h e counting rate from t h e
scattered g a d rays of IC4*.. This correc t ion can be evaluated
from t h e shape of t h e K~ spectrum and t h e potassium content ,
i f the lat ter is known. D r . C. E. Miller of t h e Argonne
National Laboratory has pointed out (1) t h a t while t h e ratio
of t he potassium photopeak t o t h e potassium continuum v a r i e s
with sub jec t weight, t h e shape of t h e continuum itself is
near ly independent of weight. He has proposed, t he re fo re ,
that one can determine t h e patassfurn cor rec t ion i n t h e absence
of K42 determinations of spectral sh8pe by making use of t h e
constancy of t h e ra t io of the potaeeium count in t h e energy
band 525 t o 725 kev (spanning t h e Cs137 photopeak) t o tha t
I n the energy band 775 to 1275 kev, t h e lat ter being a region
of t h e potassium continuum ly ing above t h e d3' photopeak
and below t h e Ka photopeak. He reports a value of 0 .52 for
t h i s ratio for seve ra l subJects , Dr. C. J. M81et8kOS of the
Yassachuset t8 I n s t i t u t e of Technology (2) has also s tudied
t h i s method and has found IL ratio of 0.49 and 0.53 for
-162-
2 subJects -- in good agreement wi th Hiller's value.
r e c e n t l y completed a K42 c a l i b r 8 t i o n of our 9 x 6-111. crystal
spectrometer, we had t h e opportuni ty t o check t h i s ra t io ae
a func t ion of weight for 27 subjects .
Having
METHODS AND RESULTS - 42 A group of 22 male and 3 female aubjectrr were given K
int ravenously a6 part of a c a l i b r a t i o n progrrm t o determine
t h e abso lu te e f f i c i e n c i e s of t h e WISL low-level gammp
coun te r s (3). Gamma-ray spectra were measured before and
af ter admlnis t ra t lon of t h e tracer, and n e t spectra due t o
K42 a lone were ca lcu la ted a t 5 hours, a t which t i m e no
f u r t h e r changes due t o mixing within t h e body could be de-
tected. The ra t io of counting ra te in the d3' channel
(525 t o 725 kev) t o t h a t in t h e higher energy potassium con-
tinuum (775 t o 1275 kev) was ca lcu la t ed , and t h e results are
shown I n Table 1 and In Fig. 1,
for men and 0.483 for women, are close t o t h e previously
The average values, 0.536
repor ted values.
A least squares l i n e a r r eg res s ion l i n e was f i t t e d t o
t h e data wi th t h e r e s u l t that,
R 9 (0.447 - + 0.026) + (0.00112 - + 0.00036) 91,
where R is t h e ratio, and W I s t h e s u b j e c t ' s weight ( i n kg).
-163-
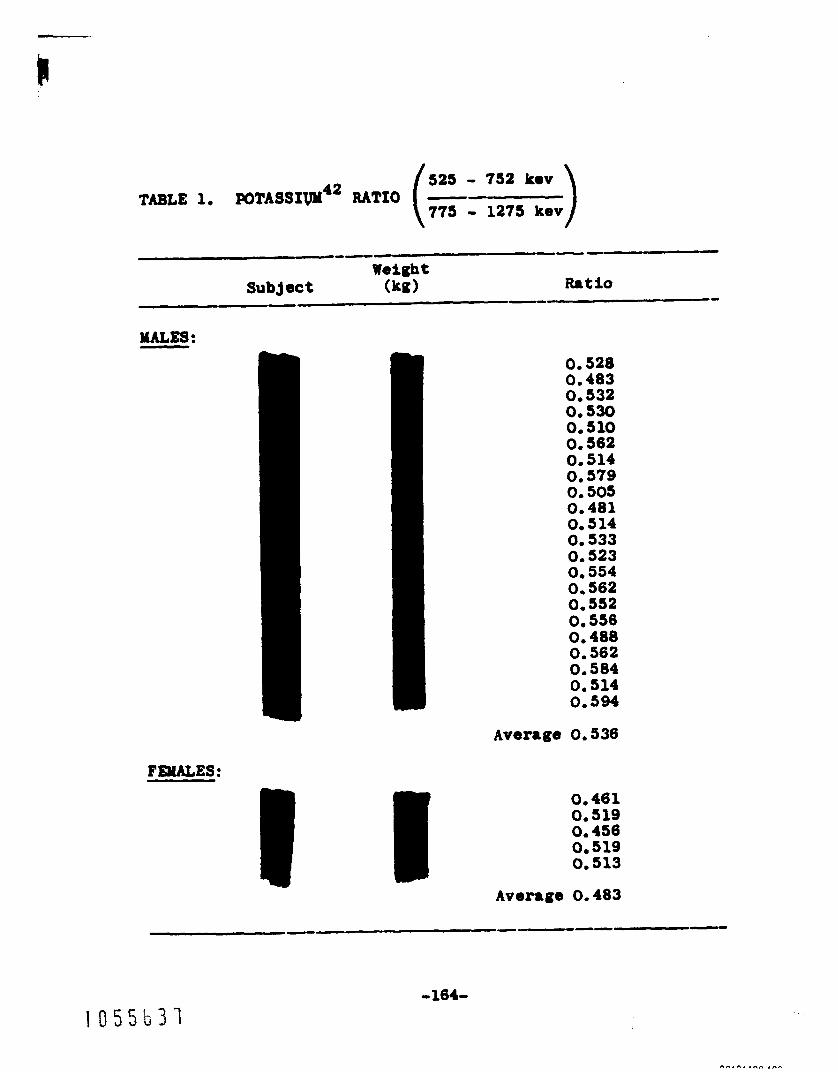
525 - 752 kmv TABLE 1, mTA3SIyY42 RATIO
0.528 0.483 0,532 0,530 0,510 0,562 0.514 0.579 0, 505 0.481 0.514 0, 533 0.523 0,554 0.562 0,552 0.556 0,488 0.562 0.584 0.514 0.594
Average 0.536
FEMALES:
I I 0.461 0.519 0.456 0.519 0.513
-164- I U S 5 b 3 - I

r,
-0 tc
-8
-8
-0 t
0 O b 0
4 4
I 1 f I I 10 8 3 2 d
0 rr)
0 0 u3 d s d
0 0
-165-
The s t anda rd dev ia t ion of t h e Indiv idua l po in t s about the
computed l i n e is 0.031, or 5.9 per cen t of t h e mean value
of R (0.526). If no dependence on weight is assumed, t h e
s tandard dev ia t ion about t he average value of R I s 6 .8 per
cent. I t is apparent that t h e weight dependence I s indeed
S-11, t h e atrndard devia t ion being reduced by only 13 per
cent when c o r r e c t i o n fo r weight is made. However, t h e ran-
dom var iance is rather large.
DISCUSSXON
The u t i l i t y of t h i s method depends on t h e magnitude of
t he Cs13' error introduced by t h e unce r t a in ty of t h e ratio,
The counting e f f i c i e n c y of K40 In t h e 525- t o 725-Mev band
is 1.24 c/min per gram for a 70-kg sub jec t w i t h our crystal.
With a body content of 140 g (average a d u l t male), t h i s
corresponds t o 174 c/min. I f t h i s quant i ty were predicted
by us ing the r a t i o R, t h e 6 per cen t uncer ta in ty In t h e
la t ter would produce a - + 10 c h i n error in t h e former.
Cs137 e f f i c i e n c y In t h i s energy band I s 13.3 c h i n p e r nano-
The
cu r i e ; therefore, t h i s error corresponds t o an 0 . 8 nanocurle
error (la) in t h e Cs 13' burden. If t h e body burden were
7 nanocuries (about the present average), t h i s error is
11 per cent.
Since t h e s tandard deviat ion of t h e frequency d l s t r lbu -
t i o n of Cs13' I n t h e population is about 30 per cent (4),
1 0 5 5 b 3 4
an error of 11 per cen t on i nd iv idua l sub jec t s i s neg l ig ib l e
i n s t u d i e s i n whfch large numbers of pzrsons are measured t o
determine t h e population average. Also fo r repeated mea8ure-
ments of t h e same indiv idua ls t o determine temporal change.,
R will presumably not change and a cons i s t en t e r r o r w i l l not
affect the evaluat ion of t he r e l a t i v e changes with t i m e . I t
would seem, therefore, t h a t t h i s method of cor rec t ion for
pDtassium would be use fu l in those cases in which complete
computer ana lyses of t h e spectra are not possible.
REFERENCES ~
C. E. Miller, Argonne National
comunfca t ion.
C. J. Yaletskos, Massachusetts
p r i v a t e communication.
Laboratory, p r i v a t e
I n s t i t u t e of Technology,
P. N. Dean, Experimental Technique f o r Sigh Precis ion
Ca l ib ra t ion of Whole-Body Counters: Application t o a
4a Liquid S c i n t i l l a t o r and a Large Sodium Iodide (Tl)
C r y s t a l Spectrometer, presented a t t h e Northwestern
Universi ty Yedfcal School, Second Symposium on the
Radioac t iv i ty of Man, Chicago, I l l i n o i s (September
7 , 1962).
E. C. Anderson and W. H. Langham, C e s i u m 13' Levels
United States Powdered Y i l k and i n t h e Population:
Summary R e p o r t , in manuscript (1963).
5-
i n
-167-
Computer Program for Analyzing D8ta (P. N, Dean)
Several comlputer program8 have boon wri t t en t o a id la
analyzing data,
analy8is faeor , mre accurate, and more economical.
program8 were wr i t t en In FORTRAN I1 for use with t h e XBM
7090 of t h e Lo8 Alamos Sc ien t i f i c Laboratory’s Computing
Center. The Center operates the compaters under w h a t is
called the Monitor System,
and data c8rdB t o the Center, which then runs batches of
problem8 on t h e computer several t l nes ’dur lng t h e day.
t h i s system, the time delay between de l iver ing a problem t o
t h e Computing Center and receiving the output (printed sheets,
fila, cards) is about 2 t o 3 hours.
This was done In an effor t t o make data
A l l
One merely d e l i v e r s his program
Under
YETEODS AND RESULTS - Program Number 1 (EAV-8)
This program is the eighth vers ion of t h e Humco AV-
erage program.
optbum counting tlmes fo r maximum statist ical accuracy using
H u p c o 11.
with 6 counting channels. To generate t h e test data, t h e
counter is operated continuously, punching a data card a t
This version was wri t ten t o inves t iga t e
The program us68 t he 8tandrrd Huco It d 8 t i card
c
predetermined i n t e r v a l s of 10 t o 500 seconds. The program
read8 i n a l l data c8rdr and d iv ides them into groups of
a r b i t r a r y size (for example, 4) . It averages these 4 cards
fo r each channel and g ives t h e average count rate i n each
channel wi th t h e observed s tandard devia t ion from t h e group
mean. . I t then separates t h e averages into sets of 4 and
averages them, e f f e c t i v e l y mult iplylng t h e counting t i m e by
a factor of 4. It cont inues t h i s operat ion u n t i l fewer than
4 averages remain.
shows t h e a n a l y s i s of t h e background s t a b i l i t y of Humco 11.
This problem arose i n at tempting t o determine the optimum
counting t h e t o ob ta in t h e maximum prec is ion i n repeated
measurements of t h e t o t a l patasslum i n an individual .
a n a l y s i s shows t h a t t h e precision of a s i n g l e determination
is l imi t ed t o about 0.7 per cent by background f l u c t u a t i o n s
with t h e optimum counting time of 30 minutes.
An example is shown i n TPble 1, which
The
Program Number 2 (SUM-1 and SUM-2)
These t w o programs are t h e s a m e except f o r input card
format. One is w r i t t e n f o r Humco If data cards, and one is
w r i t t e n for WSAC I11 data cards. These programs are simply
data manipulating programs, designed t o give the experimenter
a preliminary look a t h i s data In a convenient form before
any attempt a t data a n a l y s i s wi th other programs. They read
-169-
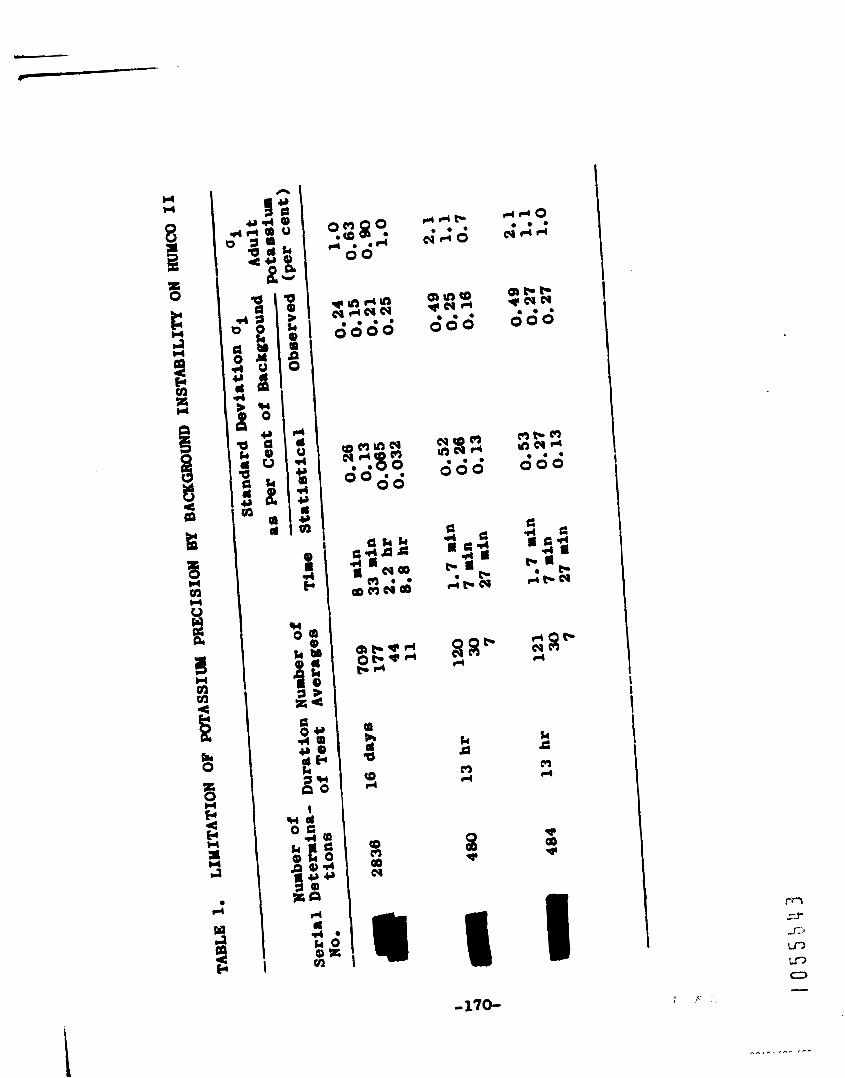
rl
PD R d 0
2
k A m rl
k c m d
=170-
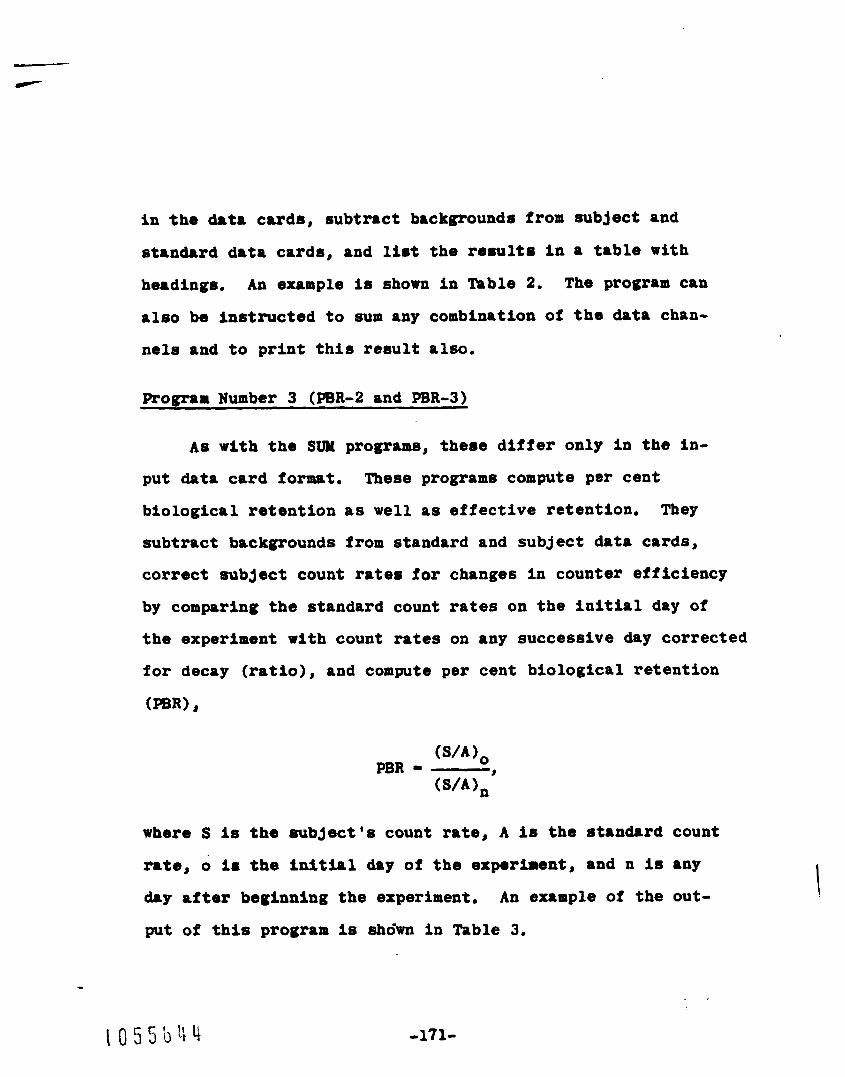
in t h e data cards, subt r8c t backgrounds from subjec t and
s tandard data cards, and list t h e results i n a table w i t h
headings. The program can
a lso be I n s t r u c t e d t o sum any combination of t h e data chan-
n e l s and t o p r i n t t h i s r e s u l t also.
A n example is shown i n Toble 2.
Program Number 3 (PBR-2 and PBR-3)
As with the SUM programs, these d i f f e r only in t h e in-
put data card format.
b io log ica l r e t e n t i o n as well as e f f e c t i v e re ten t ion , They
subtract backgrounds from standard and sub jec t data cards,
correct subject count rates for changes i n counter e f f ic iency
by comparing the standard count rates on t he i n i t i a l day of
t h e experiment wi th count rates on any success ive day corrected
for decay (rat io) , and compute per cent biological r e t en t ion
These programs compute por cen t
(nR) 8
where S is the s u b j e c t ' s count rate, A is the s tandard count
rate, d is the i n f t i a l day of t h e experiment, and n is any
day after beginning the experiment. A n example of t h e out-
put of t h i s program is sholvn in Table 3.
-171-
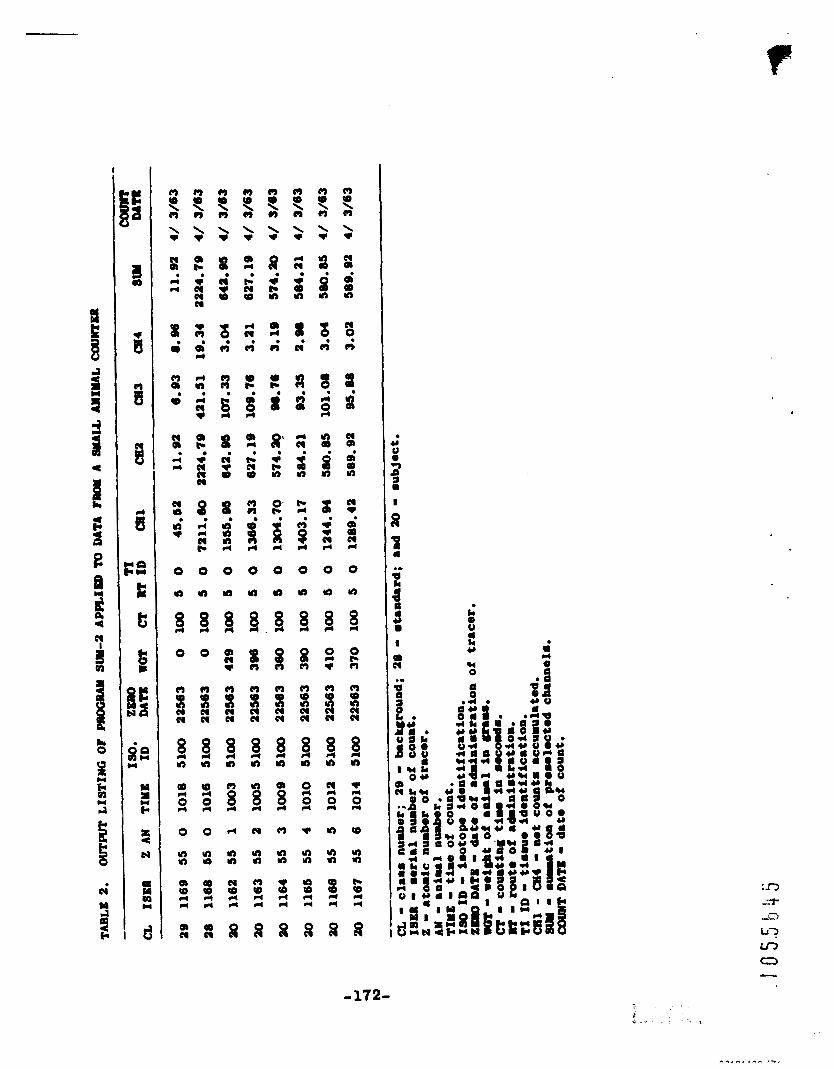
e
(9
5 9 0 IC
PI cy cy
i
x s r( a r( PI 'c
0 I,
'c cy U PI
.
8 d 4 U e
0
a
3 0
3 U
PI
8
4 2
r( a
0
d Ma
Po 50, d
r; d a 4
0
(b
8 s .I
a n
3 d
cy
8 d a
d
a d
cy
d 4
8
b 4
Y a P
a S
I
n *.)
5 ! M
R
- 172-
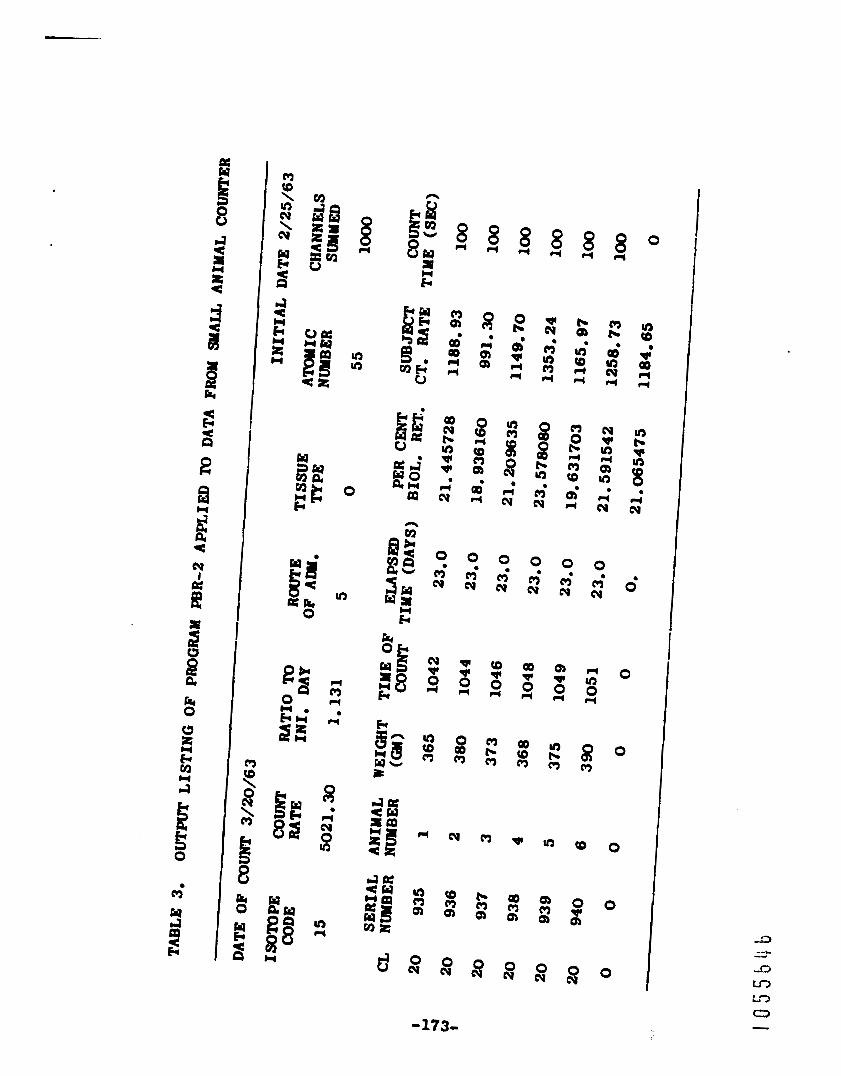
--
I
m
0 Y s E 8 hi 0
F *
g rl w 8
4
v cy m 0
b
2
8 8 b u)
cy r;
0
Ey m'
a0 f 0 rl
30 10 n
P
3 b a
t
I
c C Q U C
C
0
Q (r Q rc:
c
C cy C cv 0
N 0 cy
173-
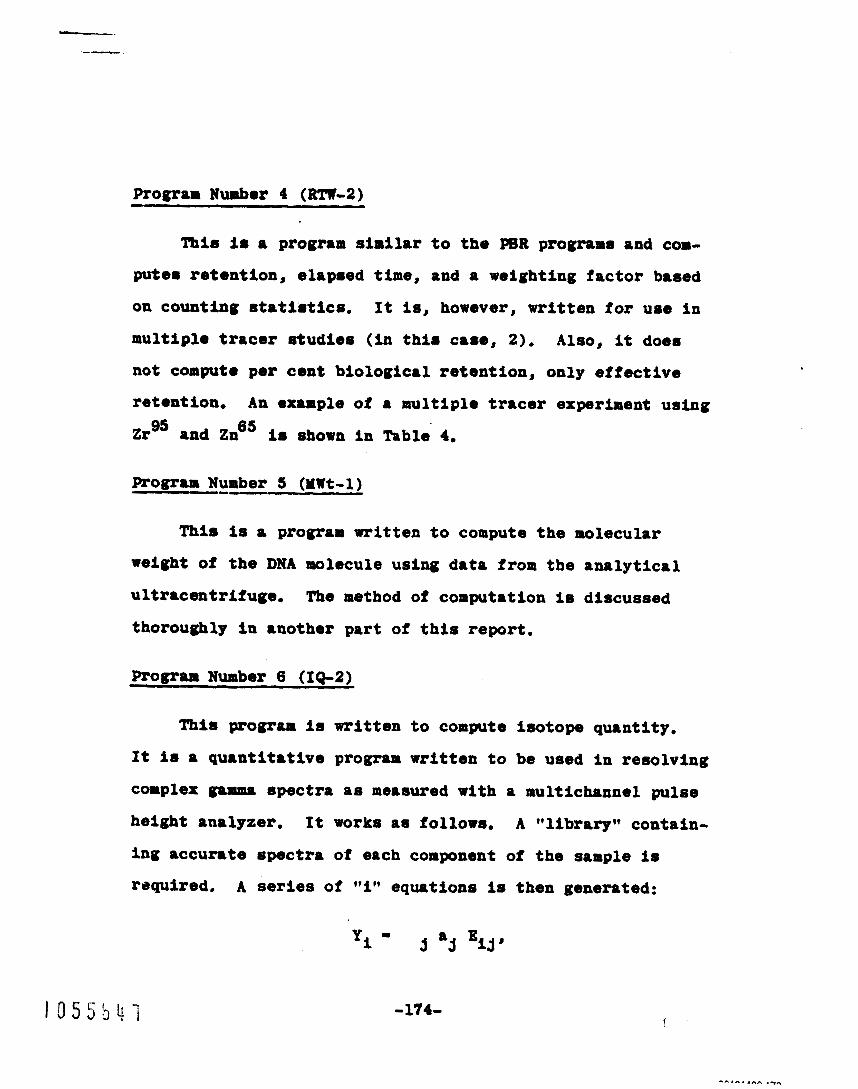
.--
Program Number 4 (RTll-2)
This is a program sini lar t o t h e mR programs and COB-
putem re t en t ion , elapsed t i m e , and a weighting factor based
ou count ing etatii~tlcs. It is, however, wr i t t en for use in
mult iple tracer s t u d i e s (in t h i 8 ~880, 2). Also, it does
not compute per cent blologlcal r e t e n t i o n , only e f f e c t i v e
retent ion.
Zrg5 and Z$' is shown in Table 4,
A n example of a mult iple tracer experfment using
Progrur Number .-- 5 (Yllt-1)
This I s a program wri t ten t o compute t h e molecular
Weight of t he DNA molecule using data from t h e analytical
u l t r r c e n t r l f u g e .
thoroughly in another part of t h i s report.
The method of computrtion I s discussed
Program Number 6 (IQ-2)
This pro@'= 18 mltteB to C O E m t O iSOt0- qU8ntity.
It I s a q u a n t i t a t i v e program written t o be used In reso lv ing
complex gamma spectra a8 mersured with a multichannel pulse
height analyzer. It works a8 f o l l o r s , A "l ibrary" contr in-
ing accura te spectra of each component of t h O sample I s
required. A series of Oi'* equations I s then generated:
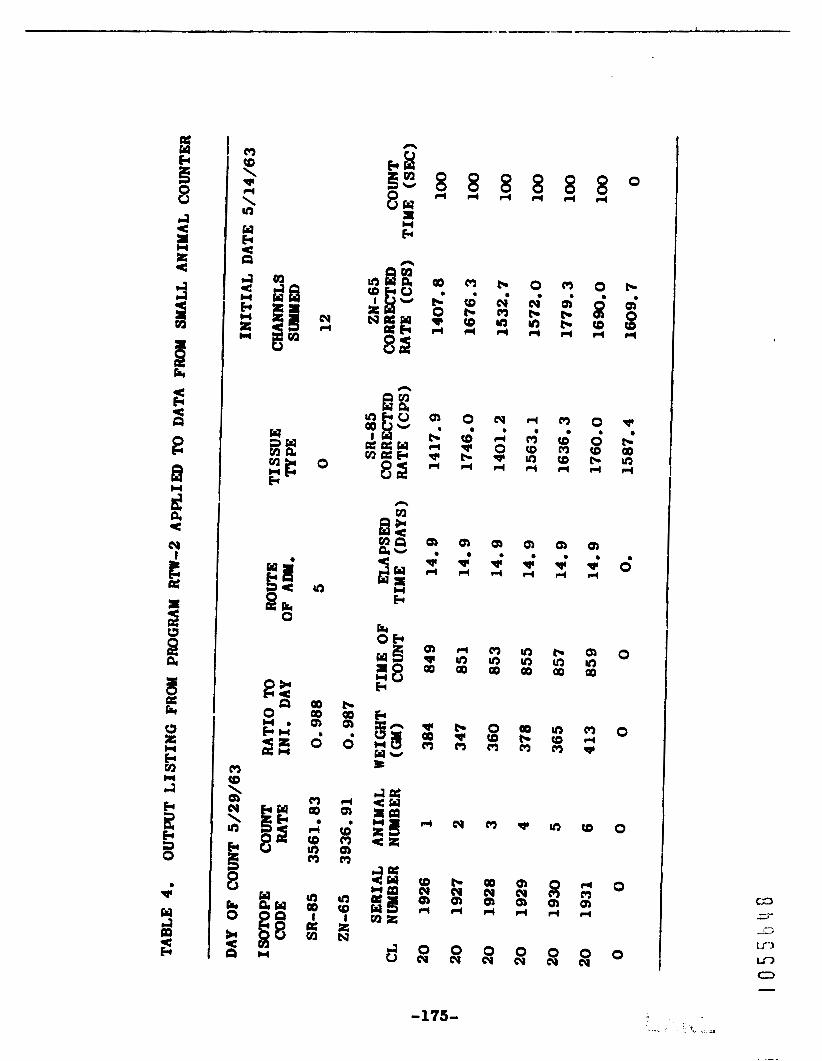
fk 0
2 n
cy rl
0
i22 O n w *
m W rl (0 In m
10 W I
8 H
d
cc 00 Q,
d
d Q,
(0 m Q) m
8
ua (0
I a N
8 4
cc cy m J?
cy r(
0 gr d
e
Q, e
I$
m ua 00
0 (0 m
m
W cy m rl
0 cy
8 rl
0 N cc
8
2
r4
(0 ua r(
m‘
Q,
5
10 10 W
00 t- m
*
Q) cy Q) rl
0 cy
8 rl
m
t- & 2
m CD m 2
Q, 8
I$
Lc In OD
ua CD m
ua
8 Q, d
0 cy
0
t-
i
* t- aD In rl
e
d
0
0
0
0
0
-175-
rhera Yl i m tho count r8te i n channel I, aj Is t h e f r a c t i o n
of 18otope j present In t h e sample, 8nd Ei3 is t h e count
rate in channel i f r o m a knom amount of luotope j,
The program so lve r f o r t h e a using t h e least squares 9 tochalque.
i 8 .horn in mble 3,
t h e input d8t8, conrrimting of library spectra and SOnrplet
spectrum, tho corputad ~Bpectfurr, and t h e r e8 idua l 8peCtluE.
The output data aro also ava i l ab le plotted on 35-mm f i l m .
FLgure 1 show. an a c t u a l plot by t h e computer of t h e sample
spectrum am anea8ured and as computed,
re8idurl rpoctrua, which should show an averrge of zero and
no pronounced perk8 t o i n d i c r t e an accura te a n r l y s i s ,
An example of t h e output l i s t i n g of t h e program
Also available in a printed form are
Figure 2 shows the
An additional progrsua is now being w r i t t e n which w i l l
be used t o analyze complex g~nraa-rrp spectra when t h e compo-
nonta of the spectra are not known.
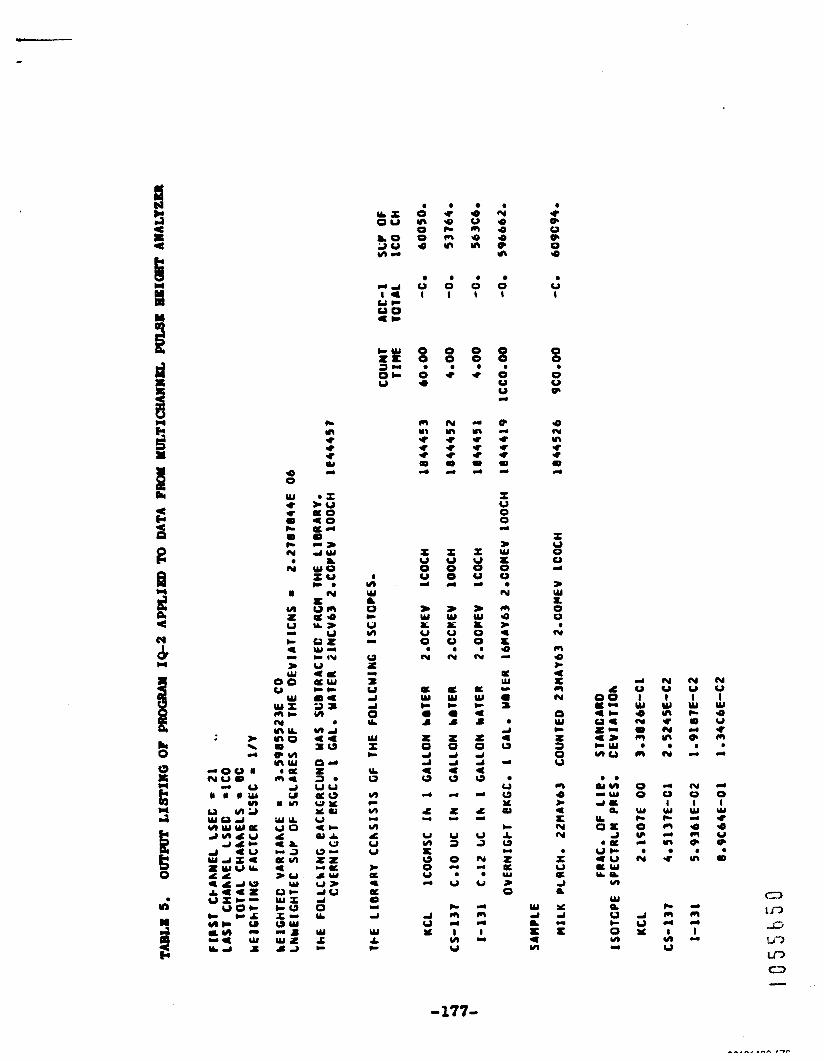
a 0 n 0 0 9
0 t
0 0 0 9
b
m Y t * 5 * m 4
I U 0 0 II
W W .; U
N 3
E Y) c s 1: 0 d d * u 4
L
U Y) E o 0 V
I.
d
d u s
b * 9 m n m
0 I
0
5 9
(Y n * 5 * e d
I u 0 0 d
w W r U 0
# N
a W m
z 0 4 4 e o d
L
U 3 0
V
)c m
I yl V
... a
LI
9 V m 9 n
b 0 t
0
* 9
I
n I * I 0 4
I U 0
u, w W L 0
3 (Y
a W t * JI
2 0 4
* u d
f U
N
a
I
u
4
LI
rr
rn
I
a Y 9 9 9 0 rrr
0 I
8 0 0 0 I
0 .. * m
LI
.I
I u 0 0
> w L 0 0
N
m 9 * t 9
d
- a
a
Ly w
4 I 0
II
u 0 % a c
0
2 OE Y)
z 0
.I
d 0 I
W 0 (Y 0 0
0
e 0
W c 0
!2 N
d u Y
N 0 I
W m I N cn N
LI
V I w IC
d n 5
m
)c rn r.
8 U U
(Y 0 I
W 9 V * m * LI
d
0 I
y1 I 9 U P 0 b
-177-

C 0 Y m 1 8
C 8
I m Y I C
8
C m & m C &
e
I -,
. . . -
. .
. . .
. . .
. . . - . . .
. . . .
. . . .
. . . . -
. . . . . . .
. . . .
- . . . . . .
. . . . . . -...
! I i I
. . . . . .
! . . . 1
*y- . . . .
. . . . . . . . . . . . . . . . . . . . . . . . . .
a
. . . . . . .
. . . . . . . . . e
. . . . , . . . , . . "
. . . . . . . .
. . . . . . . .
. . . . . . . .
. . . . . . . .
A .
0 +-+ . . . . . . . .
. . . . . . . . . . . . . . . . . . . . . . .
i .
_ . . , . _ .
. .
. . I . i
. ' 0 ' .c..
I : 1
..... .
. . . . ?: : 1-
-7 ,-.....--
i I
I I 1 - I .. .- .... , . . . . . + t : I I
6
Pig. 1.. Computed and input spctra from an anrlymlm of a 85 d X t I W 0 of Coeo, Na2', mS4, Cs137, a d (0 - input datr, and + - calculated spectmu).
-178-
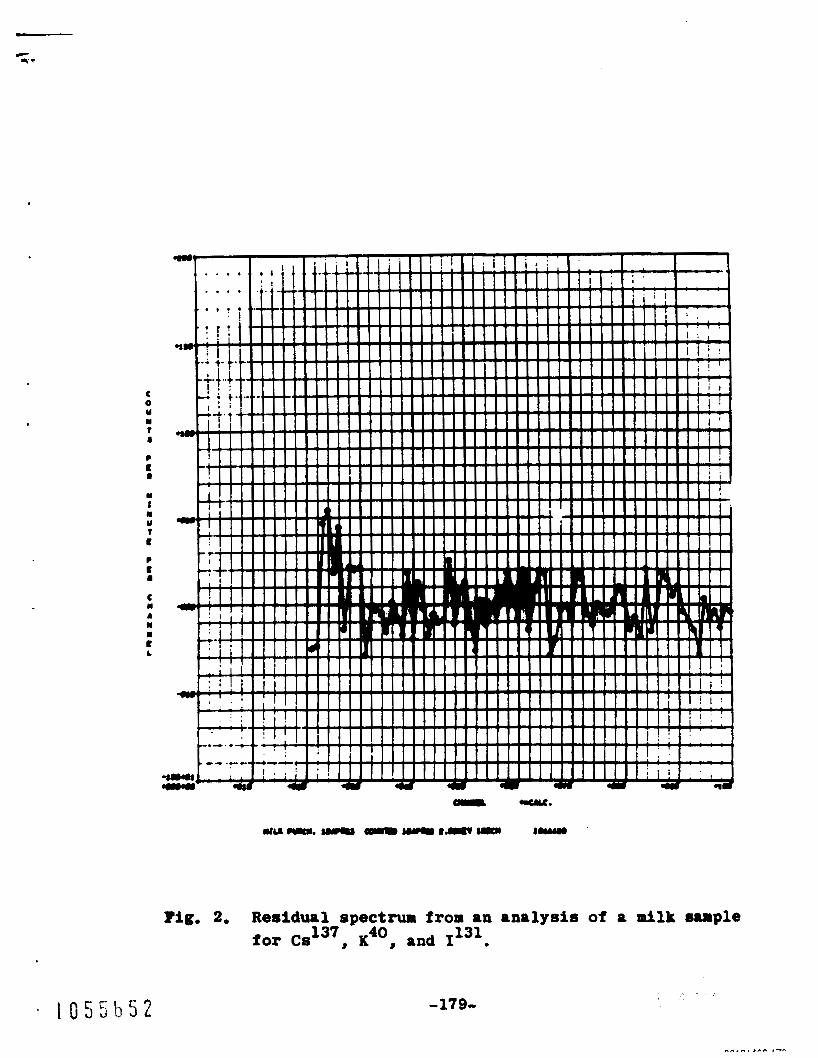
m cu.
tuum. m I-
?ig. 2. Residual spectrum from an analysis of a milk sample for Cs13', IC4*, and I 131 .
-179-
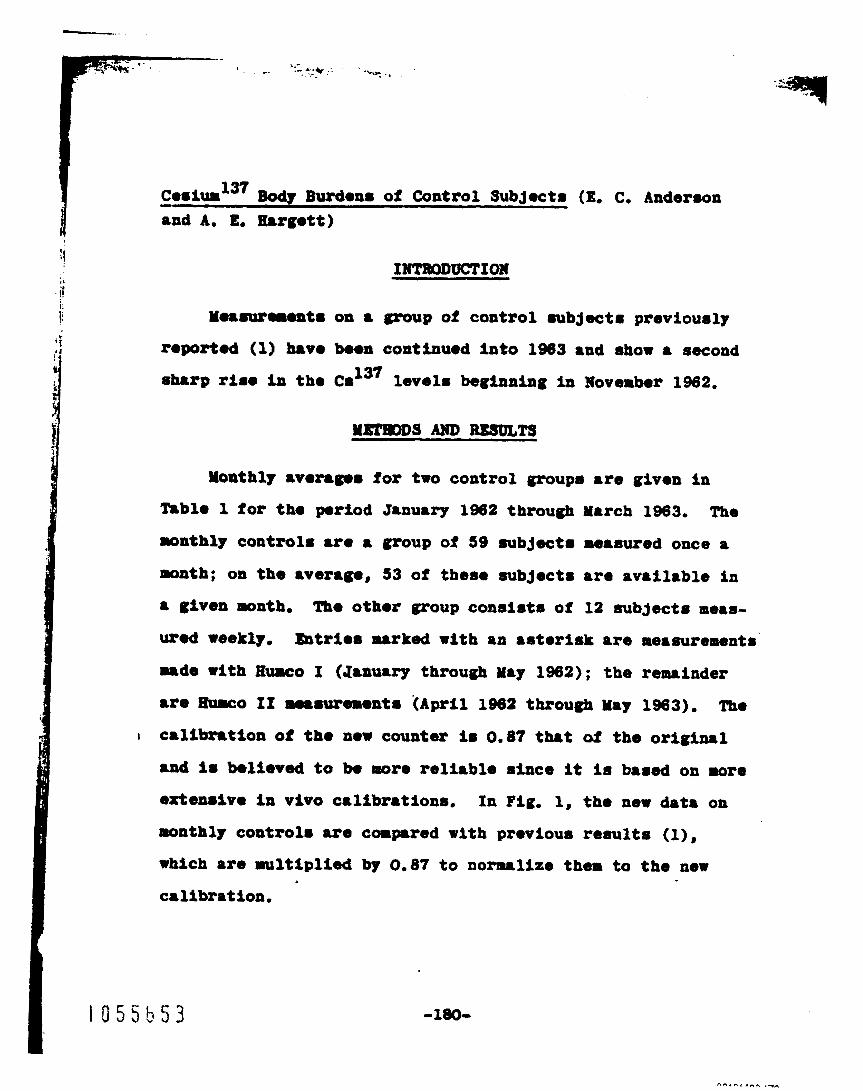
- C o ~ i u r ~ ~ ~ Body Burdon8 of Control SubJoct8 (E. C. Anderson
M . r . u r n O n t 8 OB 8 group of control mbJect8 previou8ly
r0port.d (1) havo baon coathued in to 1963 8nd show 8 second
sh8rg rime in tho d3' l e v e l s beginning in Noverbor 1982.
Monthly 8vorrgmm for two control groups are given l a
Tablo 1 for tho poriod JInuarp 1962 through March 1963. The ronthly controls iro a group of 59 subject8 measured once a
month; on the 8verag8, 53 of them subject8 8re av8ilrble In
8 given ponth.
Urod weekly.
made with H u m 0 I (January through May 1982); the reminder
Tbo othor group consbsta of 12 subjects meas-
Entriea marked with an asterisk are measurements'
U O -0 11 r#8=9BOnt8 ( A p r i l 1962 t h r O U q h May 1963). Th0
t crl ibrrt ion of tho now counter is 0.87 that of the original
and i. believed to ba more re l iable since it i r based on more
extenrrivo in vivo crl ibrations. In Pig. 1, the new data on
monthly control. are compared with previous resu l t s (l),
which are multiplied by 0.87 to normalize them to the new
crl lbrat ion. .
1 0 5 5 0 5 3 -180-

TABLE 1. CESIUN 137 BURDENS OF NEW MEXICO SUBJECTS
Monthly Controls Weekly Coatrol8
1962
47.1 + 1.7* d
January 58 47.7 + 1.4* 32 41.4 + 1.6* 41.3 + 2.1* . March 55 42.6 + l.5* 2 3
A p r i l 58 46.5 + 1.6* 18 39.3 + 1.6* 39.6 ‘i 2.4 38.8 7 1.5 6 46
45.5 + 1.3 May 58
- - 44.9 + 1.8* 21 February 55 - - - -
28 45.3 + 1.2* 10 -
* - 41.0 T 2.1 -
June J u l y August September October November
1963
January February March Apr i l May
56 54 52 59 57 49
57 51 52 47 45
39.2 + 1.0 40.6 + 1.2 40.5 + 1.4 40,O + 1.0 42.2 + 1.2 47.4 + 1.0
- - - - - -
49.1 + 1.5 51.2 + 1.7
- -
59.8 + 2.4 - 65.7 + 2.6 66.3 + 2.7
- -
45 a3 61 19 19 14
28 22 22 26 32
39.7 + 1.1 40.4 + Om8
- -
36.6 - + 0,8
54.3 - + 5.3
52.7 + 2.1 - 53.4 + 2.5 61.0 + 3.2
- -
64.0 - + 2.7 63.8 + 2.2 -
~~
* Humco I d a t a ; r e m i n d e r are Humco If me8surements.
-181-
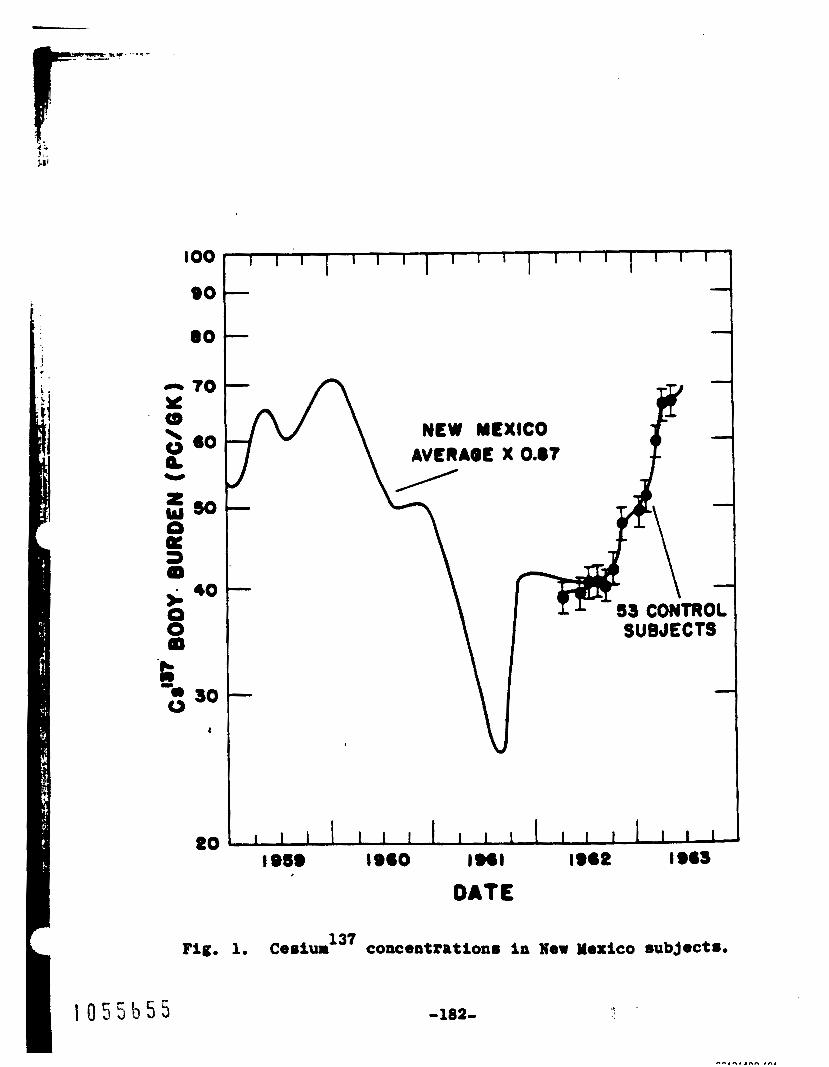
r
f 0 5 5 b
Y * w 2 eo NEW MEXICO AV€RAB€ X 0.07
SUBJECTS
-
F i g . 1. Cesi~n'~' concentrations in New Mexico subjects.
5 5 -182-

In 1962 as i n 1961, there was a sharp increase of C s 137
beginning In the f a l l of the year.
rise continued and by Aprf l the levels approached the highest
values prevlously observed at the beginning of 1960.
was l itt le or no increase i n May.
However, in 1963 the
There
(1) E. C. Anderson and A. E. Hargett, Lo8 Alamos S c i e n t i f i c
Laboratory Report LAMS-2780 (1962) , pp. 139-143.
-183-
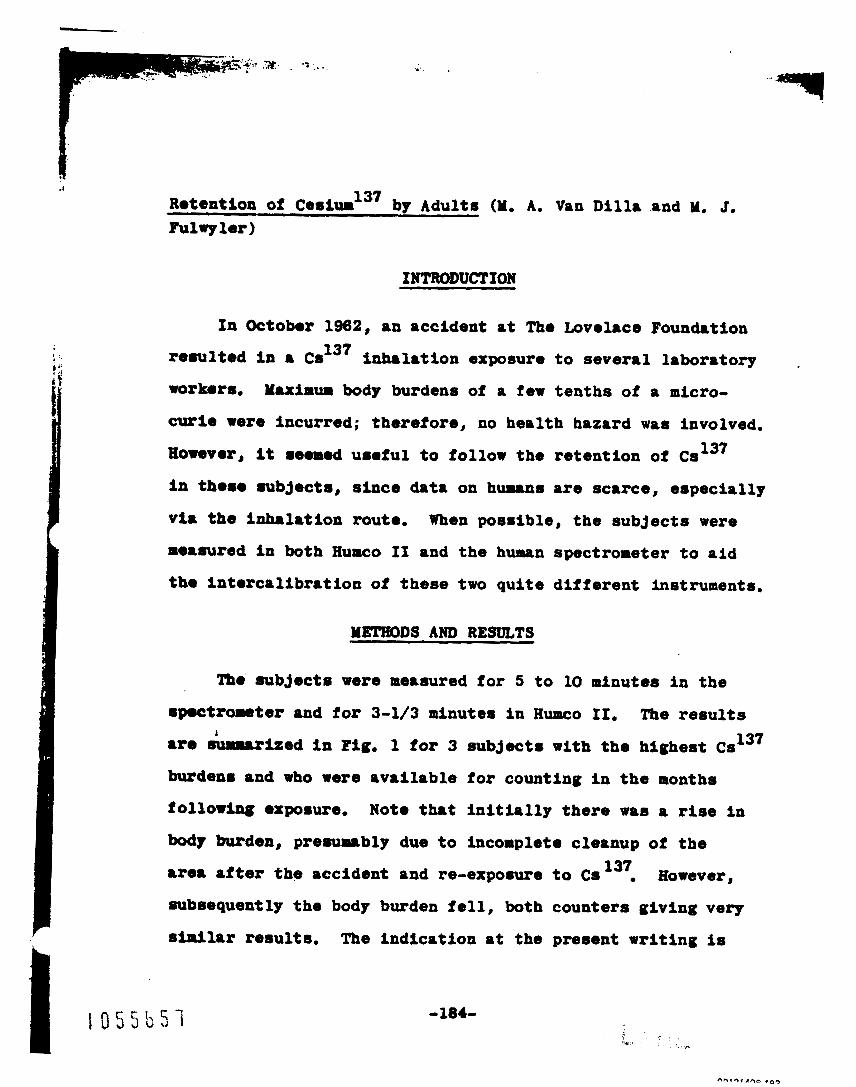
.*-. .
-4
Retention of C s ~ l d ~ ~ by Adults - (Y, A. Van D i l l a and M. J. F u l r g l e r )
INTRODUCTION
In October 1962, an accident a t The Lovelace Foundation
remalted in a d3’ i nha la t ion exposure t o seve ra l laboratory
workors,
curie were incurred; therefore, no health hazard was involved,
However, It seemmi usofu l t o follow the r e t en t ion of C s
in the.. subjects, s ince data on humans are scarce, especially
v i a the Inha la t ion route , When po8sibl0, t h e s u b j e c t s were
1~088ured la both Humco IS and t h e human spectrometer t o aid
the i n t e r c a l i b r a t i o n of these two q u i t e d i f f e r e n t Instruments,
M u i m a m body burdens of a few t e n t h s of a micro-
137
METHODS AND RESULTS
Tbe subjects were measured f o r 5 t o 10 minutes i n the
epctromter and for 3-1/3 minutes In H w o 11,
8re mummarlzed In Pig, 1 for 3 subject8 with tho highest Cs
burden. and who were ava i l ab le for counting in the months
follor&ng exposure,
body burden, presumably due t o incomplete cleanup of t h e
area after t h e accident and r e - e x p o w e t o Cs However,
subsequently t h e body burden fe l l , both counters g iv ing very
simllar results.
The r e s u l t s 137 1
Note that i n i t i a l l y there was a rise in
137
The i nd ica t ion a t t h e present wr i t i ng is
-184-
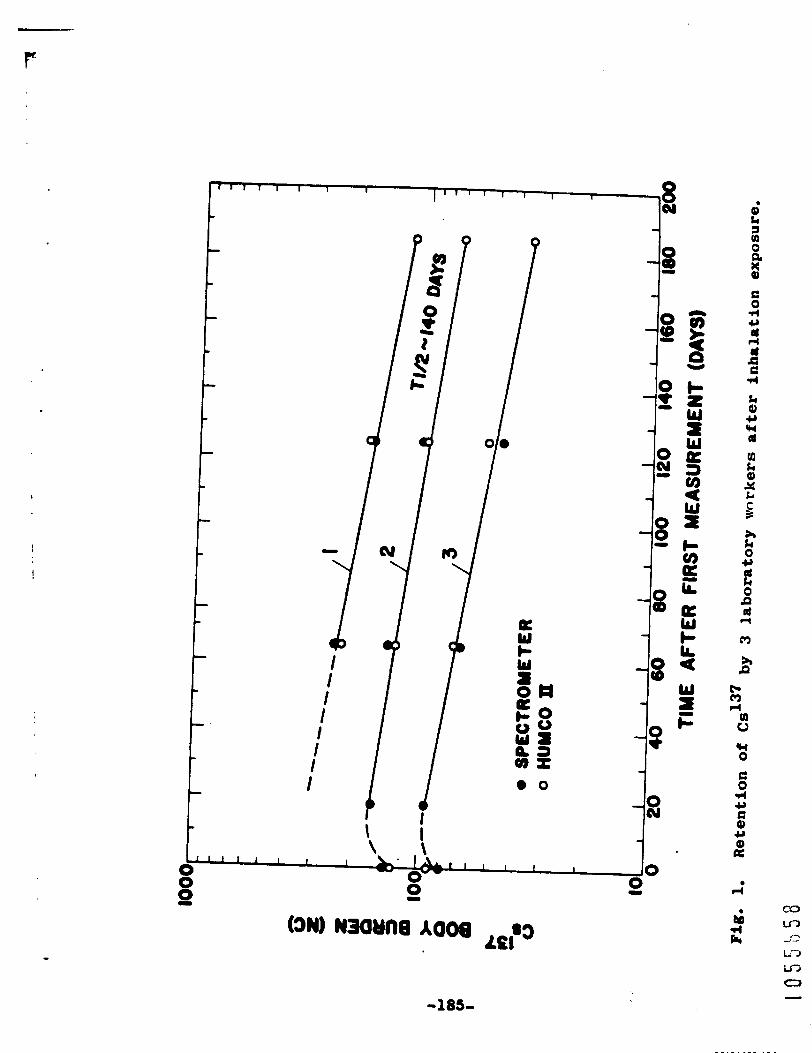
i I
I
6 a b tlo 0 a v E 0 .rl e, d d 3 E C rl
k Q) Y cw 3 00 k P) Y L C 3 A k 0 Y d k 0 P rd 4
(3
3 cc (3 d
11) 0 +I 0
E 0 rl c, C P) e,
d d
J rl k
(1) C. B. Richmond, J. Z. m h n a r , and W. E. Unghrrr,
Ewlth Phy8. -. 8, 201 (1SeZ).
i ‘ 0 5 5 b 5 q
-186-
*
Metabolism of Radioiodina I n Children and Adult8 Using Small - (N8nocurie) Doses (M. A, Van D i l l a and M. J. IWwyler)
INTRODUCTION
To etstinrte properly t h e do80 t o t h e human thyro id
r e s u l t i n g from inges t ion of r rd io iodine , it i o necess8ry t o
know t h e r e t e n t i o n of iod ine by t h e t h y r o i d as a funct ion
of t i m e , In t h e case of chi ldren, there is a s c a r c i t y of
such data. Recently it has been shown possible t o measure
much less than 1 nanocurie of f a l l o u t I 13’ i n people (1,2).
These facts have prompted t h e present experiments t o accu-
mulate rad io iodine metabolism data f o r ch i ld ren us ing doses
i n t h e 10-nanocurie range.
One of t h e problems encountered i n measuring thyro id
rad io iodine is t h e uncer ta in ty of t hy ro id depth i n neck
t i s sue . This uncer ta in ty can lead t o error due t o unknown
a t t enua t ion of r ad ia t ion by overlying t i s s u e and unknown
thy ro iddo-de tec to r geometry. Work a t very l o w l e v e l s re-
qu i r e s t h e detector c lose t o t h e thyro id , i nc reas ing geom-
e t r y e r r o r , We have attempted t o correct for these e r r o r s
us ing a double-tracer method (I 12’ and 1131) declcribed below.
Preliminary r e s u l t s on a d u l t s and ch i ld ren are given; 80
far, no d i f f e rences i n uptake o r biological ha l f - l i f e have
been observed.
-181-
. ...
-
*12s Tho method uses a r ixture of two iodine isotopes:
(60-&y h8l f - l i fa , 27-kw X rays) and I 13' (8-day half-l ife,
364-k.~ r8y8). Thi. mixture Con8tAtutes a tmc8r W i t h
two abundant photon y ie ld8 (27 and 304 Lev) widely aeparated
in energy. Becaum of t h i a energy separation, the.. photons
h8vo vox7 d i f f e ren t a t tenuat ion (l.e., half- thicknesses of
2.2 a d 6.3 CB of water, respec t ive ly) ; the r e l a t i v e attenua-
tion give8 8 mersur0 of thyroid depth. To establish this
rolat ion.hip, a polystyrene neck mockup aimilar t o the Oak
Ridgo I n b t i t u t e of Nuclsrr Studies s tandard (3) and shown In
F I G 1 W 8 8 constructed, Overlying tl86ue -8 simulated by
layer8 of lean beefsteak pressed t o uniform thicknes8 and
frozen t o the coatour of the neck mockup,
'*tiaauo'* l aye r s were rdded t o obta in 8 r e l a t ionsh ip between
x/r* md thickamw of overlying ti88u0, 8nd the correspond-
ing coTrection factor.
8Bd 3, from which can bo deterr ined both depth and the factor
Theso uniform
The results are given in F i g s . 2
1 i
nreded t o correct the observed count rate t o zero overlying f
tI88U.c . I
* Mora prodmoly, tho ratio of photopoak arms8 for a source containing equal a c t l v i t l e 8 of 1135 8nd 1131, If unoqual r c t i v i t i e s are employed In a givon exporirent, correct t h e oburved X-ray photopoak are8 by tho factor 1 - (IC - 1) (O.OSSO), where k - t h e ratio of XI31 8 C t i V i t y t o 1125 a c t i v i t y administered.
-188- 1 0 5 5 h b I I
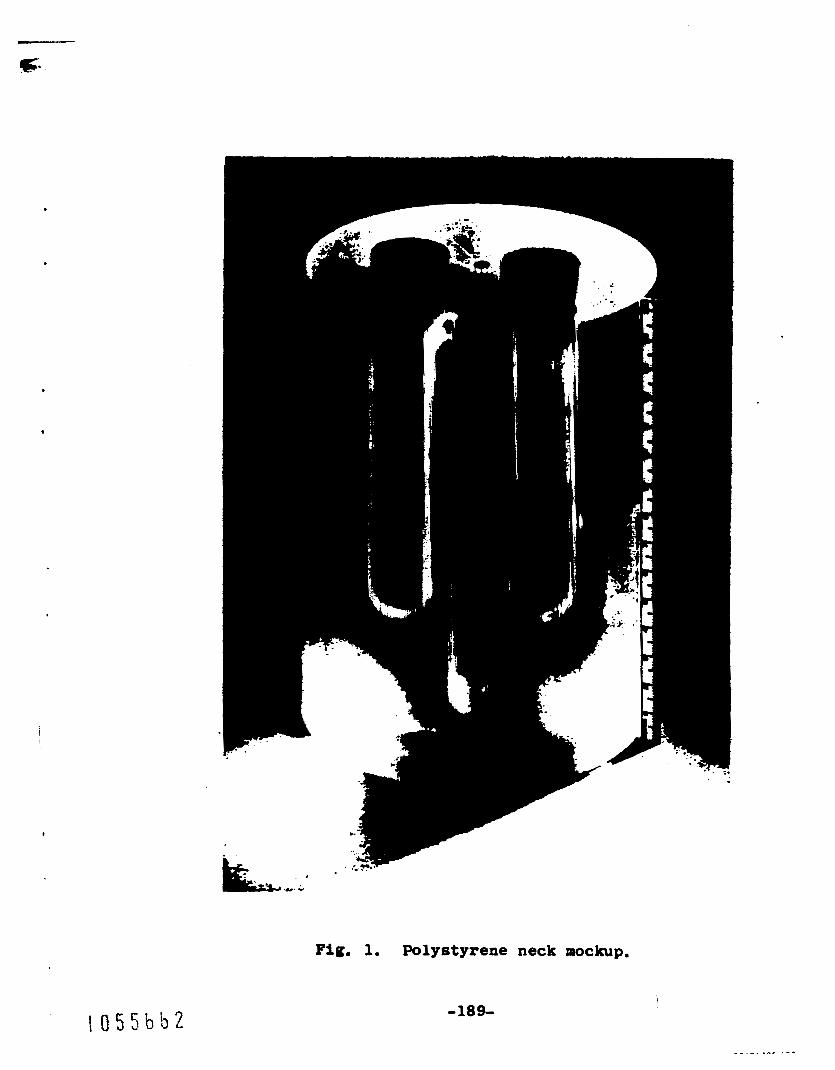
.
Fig. 1. Polystyrene neck mockup.
-189-
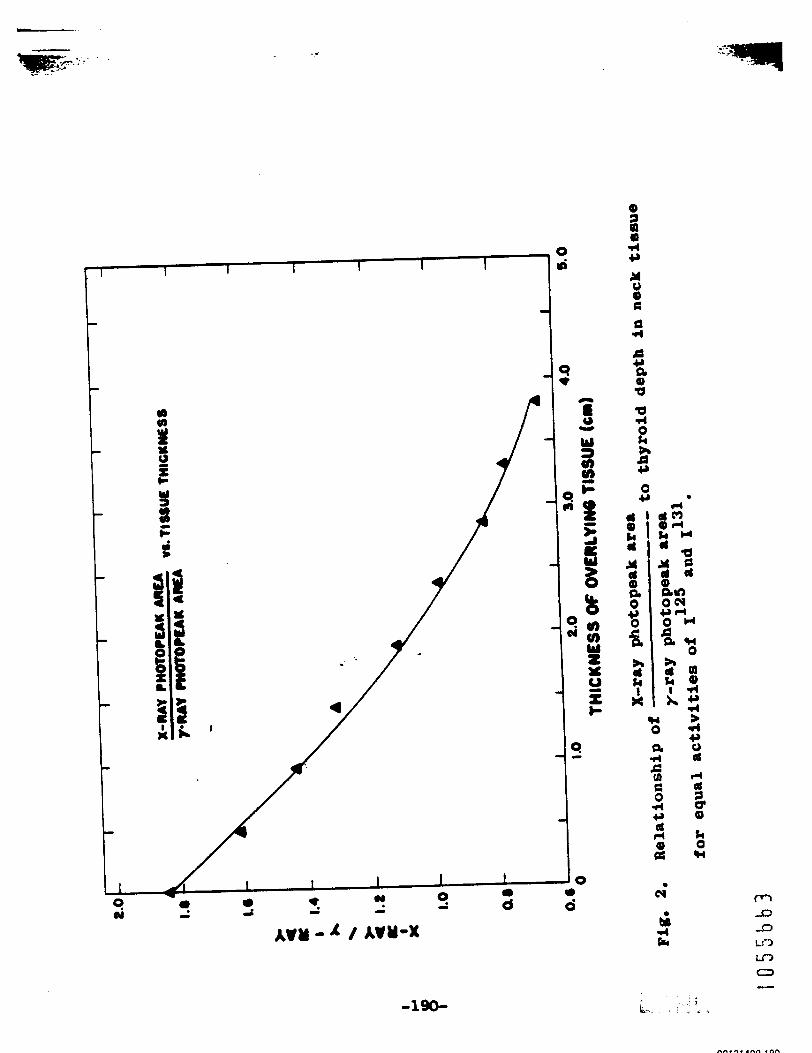
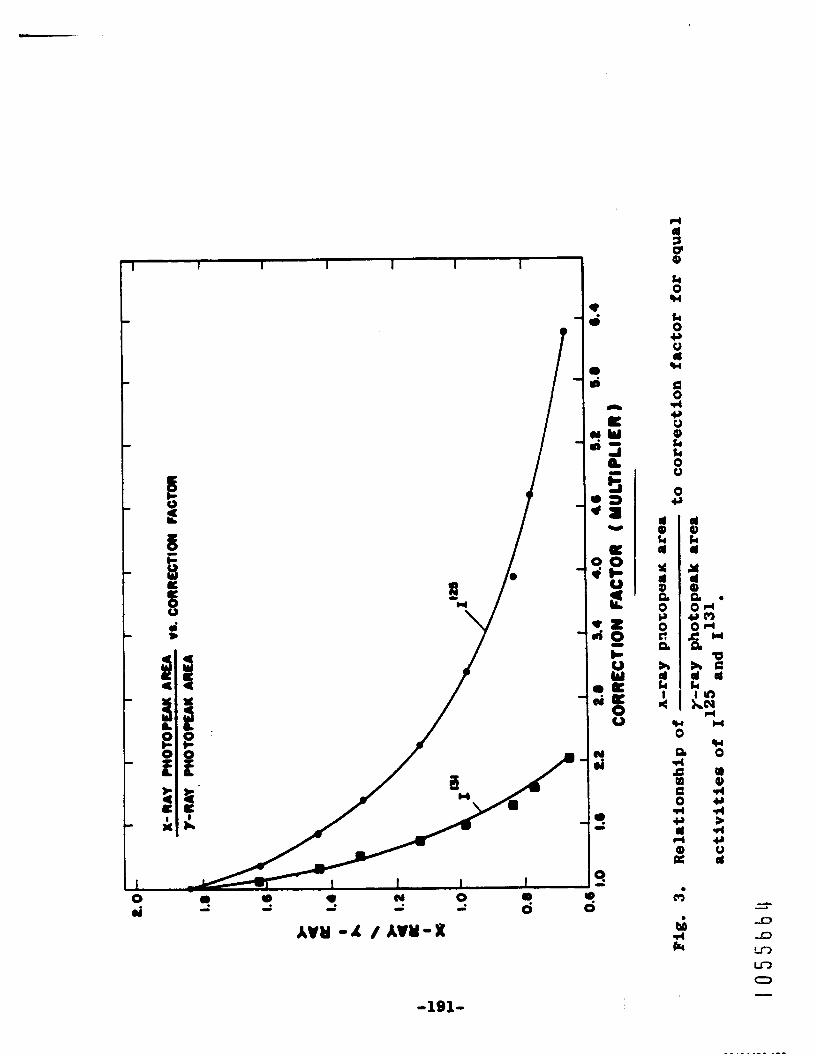
zl t' /
0
d d 3 P Q)
k 0 U
k 0 +, 0 d U
a 0 d +, 0 Q) k k 0 0
0 .r d 0) Lc 3 Y d P a 0 c, 0 r: a A d k 4
-191-

The datoctor chomon r r m 8n 8 x I-in. I a I Cry8t.l (with
a 0.00S-irr. ontry window t o rinirize a t tonu8t ion of t h e s o f t
X rays) mounted in a steel roo8 as a whole-body spectrometer,
To accouat for r o o m and subject (non-thyroid) background, a
thyro id eclipring lead shield, as deacribocl by Brucer (3) ,
i 8 umod, Tho ahiold im placed betreen t h e c r y s t a l and t h e
subject's neck, ec l ip8 ing the thyroid are8 from view of t h e
CVSt.1 (Pig. 4). Tho dUen8ions We 4 X 4 X 1/2 b. for
8 d U l t 8 md 3 X 3 x 1/2 In, for children.
Tho mbjmct reclines in a t i l t i n g chair so that t h e
herd I8 t i pped back f u l l y exposing the thyro id area. During
t h o thyroid CO\llit, nOCk-tO-C~8tal d i s t a n c e i 8 maintained
con8t8nt by 8 L u c i t e spacer rod 3-1/4 in. long fixed t o the
COnta? of tho crystal (Fig, 5). The cry8trl I8 porritioned
80 that the spacer rod l i g h t l y touche8 t h e subjec t ' 8 neck.
Counting c h i l d r e n in the age group of 4 t o 9 y e a r s is corn-
plic8t.d by t he need t o keep them still during t he 13-rinute
count. To attract and t o hold their a t t e n t i o n , a small Sonp
t e l e v i s i o n set i8 mounted above t h e crystal In such a way
th8t good vioring requires that t h e head be kept in the '
de8ired pait ion (Pig. 6). Thi8 h88 proven very SUCCO8SfU1,
although occr~lorully it I 8 d i f f i c u l t t o rowvo the c h i l d
during 8 p r t l c u l r r l ~ fa8ciarrting cartoon.
arrangment, ~ 0 n 8 i d e r 8 b l p longor counting tirrea appear t o
With t h i s
-192-
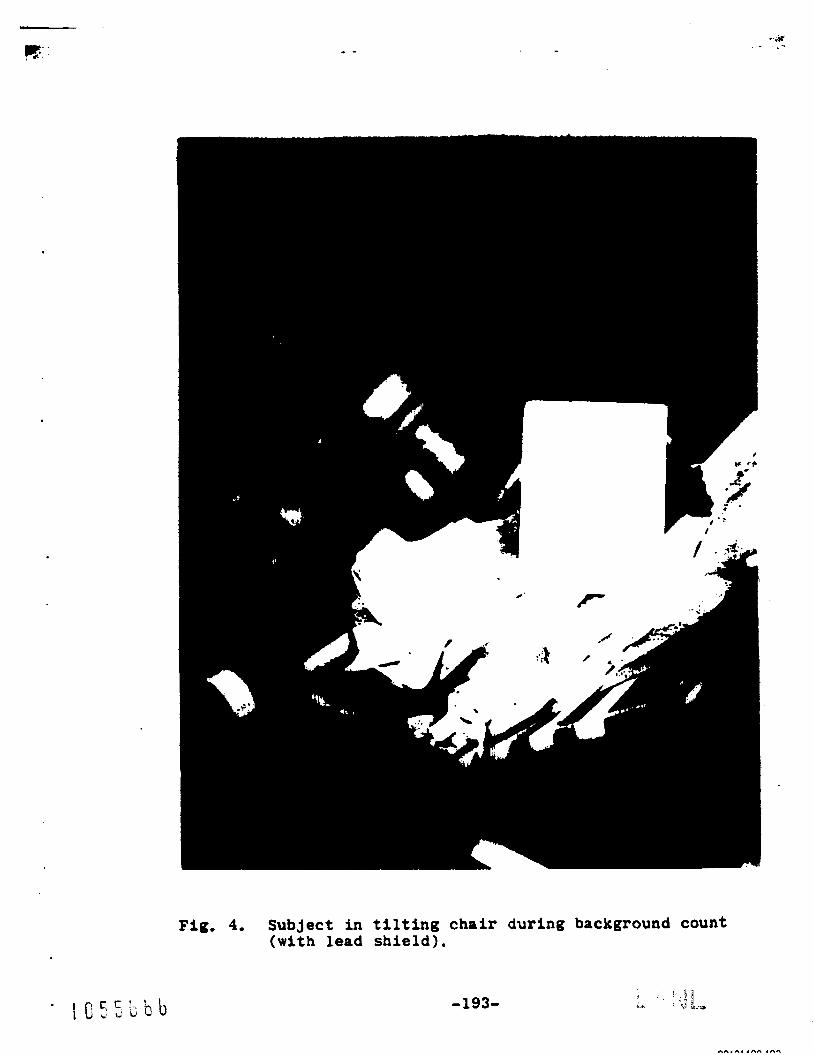
F i g . 4. Subject i n t i l t i n g c h a i r during background count (wi th l ead s h i e l d ) .
-193- I :
,'* : d 1.-
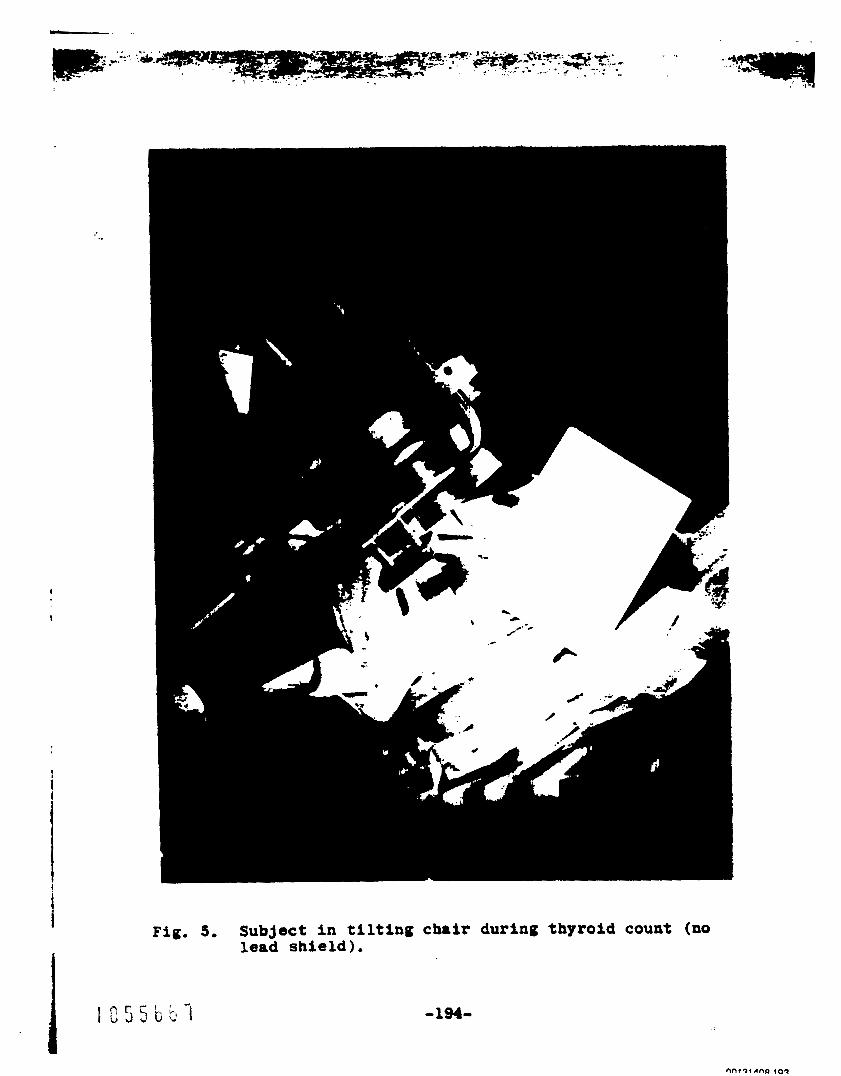
F i g . 5. Subject i n t i l t i n g ch8ir during thyroid count (no lead s h i e l d ) . I -194-

Fig. 6. Subject in t i l t i n g chair viewing television.
-195-
.. ,. ' .: .
...
bo e n t m Z y fe&8fble, D a i n g t ho m w u r a e n t , an a d u l t ro-
main8 In tho at001 room shielded from the cryrrtal by a at-l
partit iorr,
L u c i t o 8pac.r rod l i g h t l y touching tho ch i ld '8 nock,
tho ch i ld WOVOS, a reminder t o sit still and t o watch t h e
T, V, I8 u8ually adequrte,
With t h e a id of a mirror, bo is able to eeo t h o
If
EXPERIMXNTAL RRSULTS ---- An oxporlaont on a group of 6 normal adu l t8 preceded
tho oxporiront on chi ldren, Tho 1131 dome adminis tered warn
17.3 n8nocurIoe. D i f f i c u l t i e s were encountered with t h e
csrrior-free I 12' solu t ion and hence t h i s dose I s not cer-
t8h ; 6 o P S nanocuries is t h e best estimate. Unfortunately8
thla u k e a t h e X/y ratios of l i t t l e value, and an uptake
co r rec t ion cannot be der ived from t h e data. However, t h e
biological half -1ivor de t e r r ined from t h e t w o i 8 0 t O p 0 8 are
v a l i d and should agree, Thi8 w a s found t o be t h e case.
T&e r e p l t a are sumurized In Table 1,
that t h e e 8ubJocts a l l have similar (except- and normal
uptadam, while -the bfological ha l f - t i m e 8 vary considerably,
It I s t o be noted
v
Acco-to Lushbaugh e t 01, (4), t h e normal biological half- <*. -
m a r e larger than normal, whi le t h e value for sub jec t l ) l r r
q u i t e small, I t I s i n t e r e s t i n g tha t a u b j e c t m h a s a
- 196-

TABLE 1. RADIOIODINE METABOLISM IN SIX ADULTS
~
Uptake a t Tsio *Ef f Sub- Age Weight Height 7 Ikys* 9-t (prs) Sex (kg) (CB) (per cent) (days) (days)
29
23
23
22
26
15
107 7.51
P 8.07
> 200 7.76
75 7.30
90 7.46
27 6.22
- -- t Assumes 1 .5 cm overlying tissue.
-197-
himtom of low BMR, which is consirteat with hi8 relatively
Ibvlng obtained re8.onrbl8 remalts with adu l t s , only
tho qwrrtSt8t ive d i f f i c u l t y with tho 11" stood in th8 way
of .xtondSng tho o x p . r h o n t 8 t o chi ldren, This problem -8
molved by adding 0.5 pg IaI carrier t o erch doso and then
measuring t h o dose a c t u a l l y inge8ted by each child, Eight
ch i ldren , ranging i n age from 4 t o 10 year8, each received a a o n i n r l 11 nmocuries I 12' and IS nrnocurie8 I 131 or81
do808 and 15-minute aerimuremuats (10 minute8 w i t h no sh ie ld
8nd S minutam with lead shield) begao the fol lowing dry.
It ir planned t o count 3 tin08 weekly f o r 6 weeks, and then
a t le88 f requent i n t e r v r l s u n t i l t h e 1123 peak die8 away,
A t t h e present wr i t i ng (June 6, 1963), we have about 2 weekm
of dat8 proce88ed and aurrrized In nb1e 2, Note t h a t up-
take8 are very sirilrr t o those for the adu l t& Thlckae88
of overlying ti~mao i s small in a l l COBOS, r e s u l t i n g i n
siril8r cor rec t ion factors, Indicat ions are that b io log ica l
h a l f - l i v e r will be long coapared t o t h e &day physical half-
l i fe , and perhaps simllar to adu l t& Thus far, no dif-
ferenc.8 in rad io iodine metrbol58.r hrve been observed
between ch i ldren and adul ta .
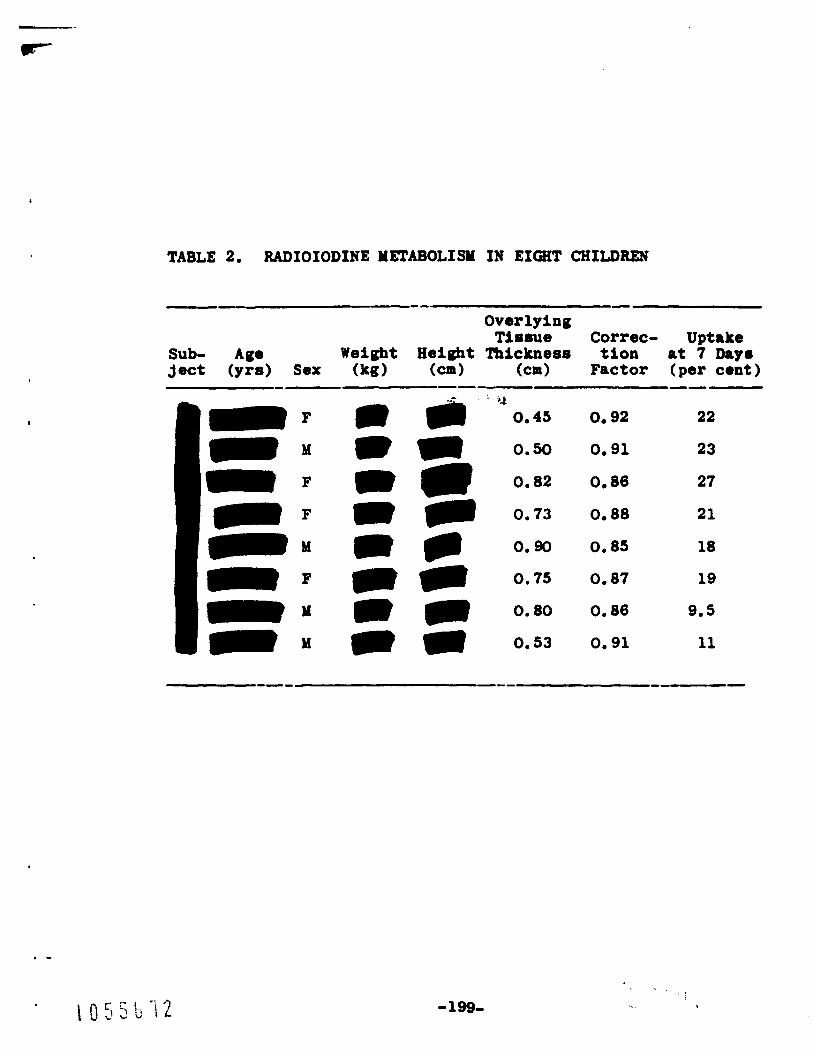
. -
TABLE 2. RADIOIODINE METABOLISM IN EIGHT CHILDREN
Overlying Tiurnre Correc- Uptake
Sub- Age Weight Height Tblckness t l o n at 7 Ihryu ject (yrs) Sex (kg) (-1 (-1 Factor (per c e n t )
. i,& - F Om45 0.92 22
m 0.73 0.88 21 m F m * O o 9 0 - F 0.75 0.87 19
M - - 0.53 0.91 11
- * m m 0.50 Om 91 23
m F m 0.82 0.86 27
0.85 18
w Y - 0.80 Om 86 9.5
-199-
I !!
.. ,
RggERQSCES
(1) H, E, palmer and F. Swanberg, Jr. , Hanford Atonic Lab-
oratory Report HU-SA-2612 (1962).
(2) Y, Elrronbud, Y, Yochizukf, A. S. Wldin, and Go R. 'ct
- Layer, Science 136(3514), -- 370 (1962).
I
Q 5 5 b i 4 I
(3)
port ORINS-19 (June 1959f. '
C, C. Lushbrugb, D. Bo hie, and C. R. Richmond, Lo8
Alamoa Scientif ic Laboratory R e p o r t LAYS2526 (1960),
(4)
p. 384,
-200-
E f f e c t of Ashlng Temperrturs on Ceslur and Potassium Content of Bone (M. A. Van D L l l a , M. W. Rowe, and Y. J. Fulwyler)
--
INTRODUCTION
In t h e summer of 1961, s e v e r a l hundred human bone ash
samples were s e n t t o t h i s Laboratory by J. L. Kulp of t h e
Lamont Geological Observatory, Columbia University. Each
sample represented the t o t a l ske le ton of cadavers obtained
i n 1953-1959 in t h e N e w York City area. A f r a c t i o n of each
sample was measured fo r Srm as part of a world-wide progran
09 the d i s t r i b u t i o n of SrW from f a l l o u t .
analyzed f o r radium. Since Dr. Kulp's group had dropped ovt
of t h i s program and t h e samples were of considerable po ten t i a l
va lue for measurement of n a t u r a l and f a l l o u t r a d i o a c t i v i t y
and trace elements, they were t r a n s f e r r e d t o t h i s Laboratory.
According t o Dr. Kulp, ashing took place a t 600 t o 900" C,
w i t h no record for t h e ind iv idua l samples; care was taken t o
avoid any contamination, and s o f t t l s s u e was removed prior
t o t h e skeletal ashing process.
S o m e were also
METHODS
Severa l of t h e samples were a s u y e d f o r potassium and
cs 137 us ing a 7-1/2 x 4-in. NaI gama-ray spectrometer. The
potassium r e s u l t s were of t h e r igh t order of magnitude f o r
bone, bu t t h e results seemed much lover t h a n expected.
-201-

I
We sumpacted that the asb lng temperature8 r i g h t bo d r iv ing
o f f appreciable and perhap8 potassium too, Luckily,
s eve ra l long bones (2 femurs, 2 f ibu la s , and 2 t i b i a s ) f ror
a beagle fed Cs137 ch ron ica l ly were ava i lab le . These bones
were chi l led i n l i qu id ni t rogen, shattered i n t o s m a l l frag-
ments, mixod, and divided i n t o 4 equal f r8c t iona . Each -8
assayed for Cd3 ' content , and then success lve samples were
ashed overntght in a muffle furnace a t 600, 700, 800, and
900' c and f i n a l l y re1@8sur0d. The r e s u l t s are shown in
Fig. 1 and make clear that muffling must be done a t lower
temperatures than were used on t h e human skeletal samples 137 t o avoid loss of Cs .
It w a ~ not poss ib l e t o detect n a t u r a l potassium in
these small bone samples; therefore, a much larger sample
of l o c a l l y purchased beef bone was measured. The gamma-ray
spectrum showed t h e presence of 12.8-day Ba140/La140 from
f a l l o u t ; t h i s was fortunate, s i n c e It eliminated t h e need
for mockups t o calibrate t h e K . That is, both barium and
lanthanum are r e f r a c t o r y (melting po in t s 725 and 826O C,
40
r e spec t ive ly , which are similar t o t h e melt ing po in t s o f '
calcium and s t ront ium) and so will be unaffected by the ash-
i ng procedure.
ray peak t o t h e 1.60-Yev La 140 peak before and a f t e r ashing
Thus, t h e ratio of the 1.46-kev K40 gamma-
(corrected for radioactive decay) is t h e f r a c t i o n of
-202- 15 I
R ""
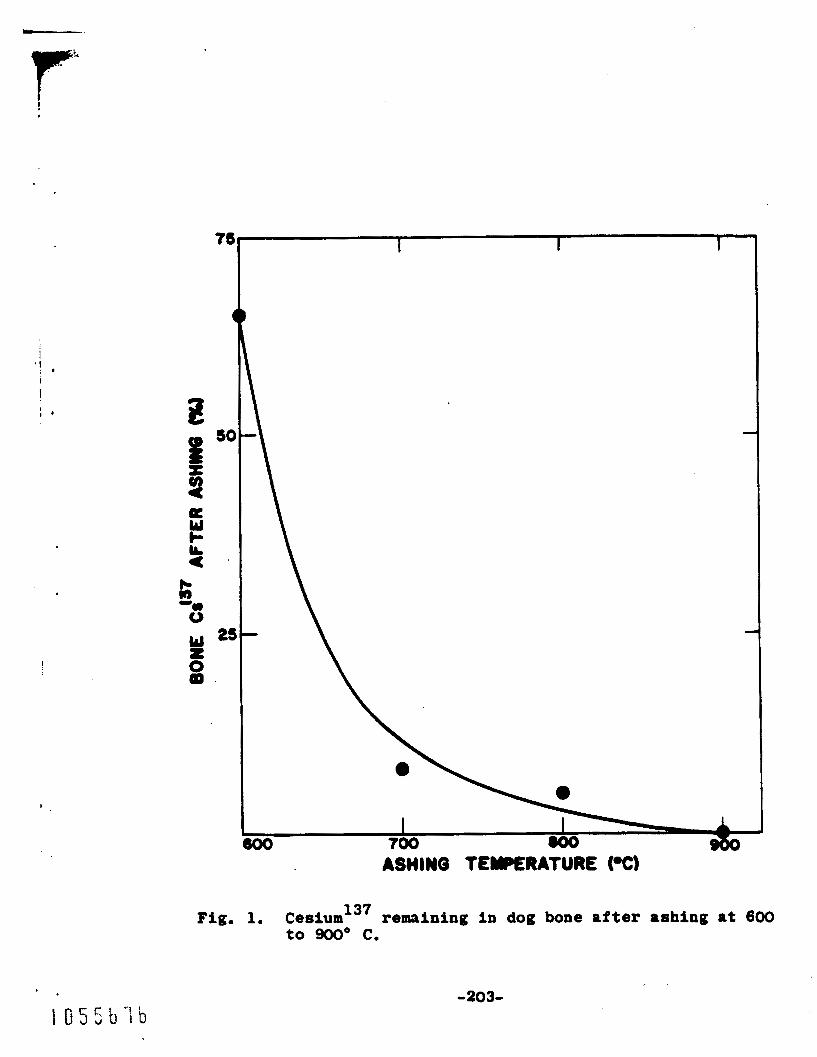
r !
' ! e I
1 I I '
!
1 0 5 5 b l b
78
so
25
I I I
F i g , 1, Cesium13' remining in dog bone after ashing at 600 to 9ooo c.
-203-
L_
po t ra8 iu r &ill In t h o ample after aahing.
that about 70 par cent of the potassium remrrfned after over-
n ight muffling: a t 600. C. A t 906' C, only 56 per cent wad
l o f t i n t h e sample,
human Skolet81 88h sup lea aro of no value for determining
tha f a l l o u t Cd3' or natural pota88ium content of t h e human
ske le ton; however, natural radium and thorium contents will
be uaaf fec ted by the r e l a t i v e l y high muffling temperatures
used and theso data would be valuable. Sono radium measure-
It -8 fwnd
* Thus, it is concludod that the Laront
montr on tho.. suplam h8ve already been made by Kulp's
group using the rrdoa emanrtion method, but no thorium mea.-
urement8 whrtaoever have been made,
rearuremonts using a gamaa-ny coincidence spectrometer.
We plan t o make such
a fer month. l a t o r , whon there t o be uaoful. A more complicated
Thir, merruremeat * W8. t00 l % t t l O B8 DOChlP p r O C O d U r 0 WA8 U s a d .

Thermoluminescent Dosimetry - w i t h Act ivated L i th ium Fluoride (P. N. Dean and J. H. Larkins) -
INTRODUCTION
In October 1962, work was begun on t h e development of
Two t y p e s of t h i s mater ia l a thermoluminescent dosimeter.
have been s tudied: A 1 2 0 3 and LIF. The material selected
f o r ou r a p p l i c a t i o n was LIF powder, primaarflp because of its
t issue-equivalence and ease in handling. A device has been
cons t ruc ted t o heat t h e powder and t o measure t h e amount of
emitted l i gh t . The normal opera t ing rangc of t h e instrument
is 100 mads t o 50 rads. I t can be extended a t the upper
end t o 20,000 rads w i t h minor changes. Dosimeter size I s
normally 100 m g of powder, contained i n polyethylene tubing
(1/16 in. i n diameter by 1-1/2 in. in length).
METHODS AND RESULTS
The u s e of thermoluminescent materials t o measure ab=
sorbed dose of ion iz ing r a d i a t i o n s has been f a i r l y extensively
covered in t h e l i terature (1-6) . Thermoluminescence is the
emission of l i g h t by a substance upon being heated a f t e r
previously being exposed to ion iz ing r8dia t ion . The amount
of l i g h t emitted depends on t he type of material used and
t h e t o t a l amount of energy absorbed from t h e ion iz ing radia-
t ion . For a p a r t i c u l a r material, t h e amount of l i g h t emitted
-205-
00131408204
i 8 proportion81 t o tho r8d do88 ab8orb.d.
mthocla of dotormlnlng the doso absorkd by t he powder.
When tho irrrdirted powder I8 herted, t h e l i g h t i n t e n s i t y I 8
There ere two
a func t ion of t m p e r a t u r e , A plot of I n t e n s i t y ver8us ter-
per8tur0, called t h o ttglor curve,t' I s shown l a Pig. 1 for
CaFa:3&% Yn (a). Either t h e perk height (m8xirUr I n t e n s i t y )
or t h e t o t a l area under the curve (tot81 l i g h t emitted) can
l i g h t eaaittd I 8 tho mor. 8ccurate ind ica t ion of doso, "&e
peak method depends too s t rongly on reproducible heating
cycles ,
T+o types of ther ro lur ine8cent materials have been used
here: A120g and LIFO The A1203, obtained from Controls for
Radiation, Xnc., warn ured i f r a t prlaurily to 8tudy t h e tech-
niques involved in heat ing the powder and mea8uriag t h e
amount of emitted lfght.
a8 the opera t ing dosimeter becau8a of i t a rather large
energy-dependence and a number of low energy traps, The
low energy trap. result In a loss of s to red energy at room
temperature and s l i g h t l y higher.
It was never seriously considered
f
The ide81 m&terial would '
have doop, stable trap.,
iron n a t u r a l A120s.
Figure 2 shots the "glow curve" *
The n u t e r i r l selected for routina use at t h i 8 Lab-
oratory was a c t i v a t e d powdered LIP crystals obtained iron
n n i m n ~ 3115
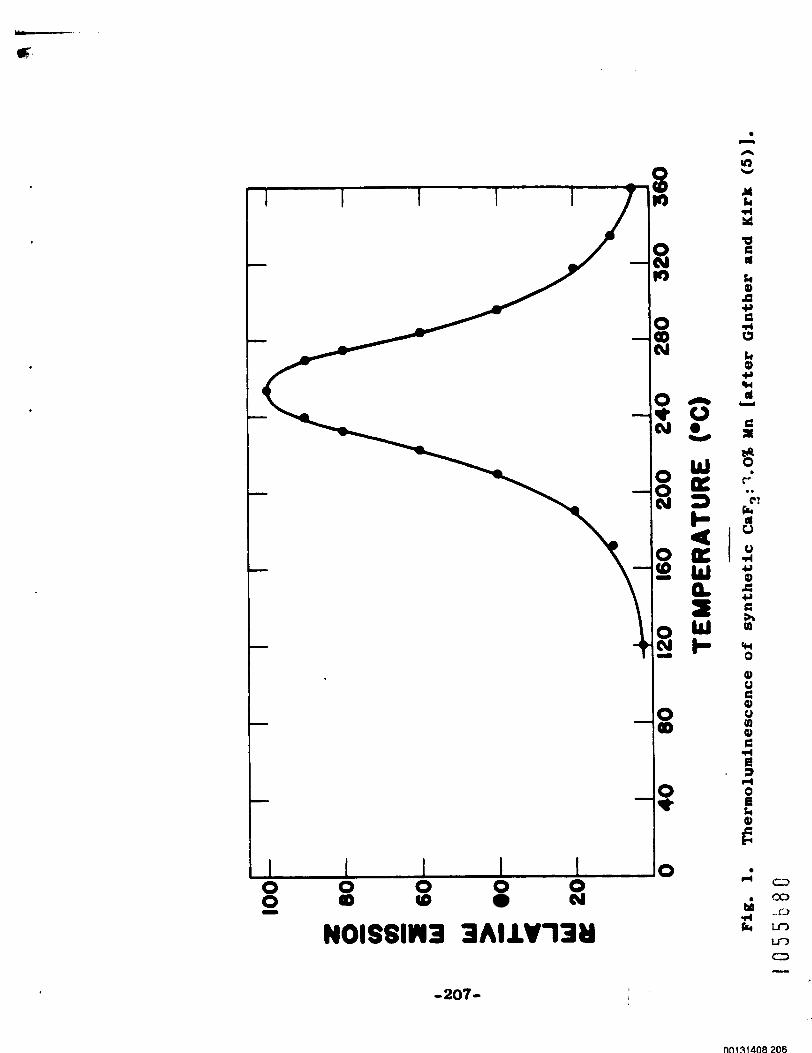
I 1 I I I 0 a 0 0
(0 0 m 0
0 0
NOISSIW3 3Al lV73i )
n n
e Y & 4 X a E d k P) E Y E rl 0 k Q) *, W d
E 31
Y
8
9
c-
E4
.. C!
0 4 c, Q) E +, E sr W
cn 0
Q) 0 E Q) 0 W 0, E rl e 3 r4 0 & Lc 0) E c.c
H
J rl k
-207-

--
w a
w
-208-
-iN
t h e ft.r8haV Chemical Company. There are two important rea-
sons for t h e s e l e c t i o n of LIF. F i r s t , t h e LIF powder can be
heated i n a i r without changing its thermoluminescent prop-
erties. Consequently, It can be re-used. Since t h e powder
can bo used in a i r , it can be put i n t o any desired container
f o r e x p o ~ u r e . Second, it is near t issue-equivalence, making
it very utseful i n depth-dose s tudies . Its response is essen-
t i a l l y Independent of energy down t o about 100 kev. A t 40 kev,
its response is 4 0 per cent above t h e value a t higher energies.
I t has been reported recent ly t h a t a s h i e l d of s t a i n l e s s steel
conta in ing 70 per cen t ho les w i l l make t h e dosimeter respons'
independent of energy down t o 30 kev.
The reader present ly i n use is t h e t h i r d one b u i l t (Fig. 3).
It c o n s i s t s b a s i c a l l y of a s ta inless steel planchet for heat-
i n g t h e powder and a photomultiplier fo r measuring t h e amount
of emitted l igh t . Figure 4 is a cross s e c t i o n of t h e reader.
The reading procedure is as follows. The exposed powder is
weighed and then placed in a s t a i n l e s s steel planchet. The
temperature of t h e planchet is raised r a p i d l y t o about 200' C
by flowing 160 amperes of curren t through it for 6 seconhs.
The temperature reached a t t h i s t i m e is then maintained by
reducing t h e c u r r e n t t o 40 amperes fo r a t o t a l readout t i m e
of 30 seconds. This hea t fng cycle has been found t o re-
lease about 99 pe r cen t of t h e stored energy wi th one heat-
ing. Figure Sa shows t h e l i g h t emitted by t h e planchet
-209-
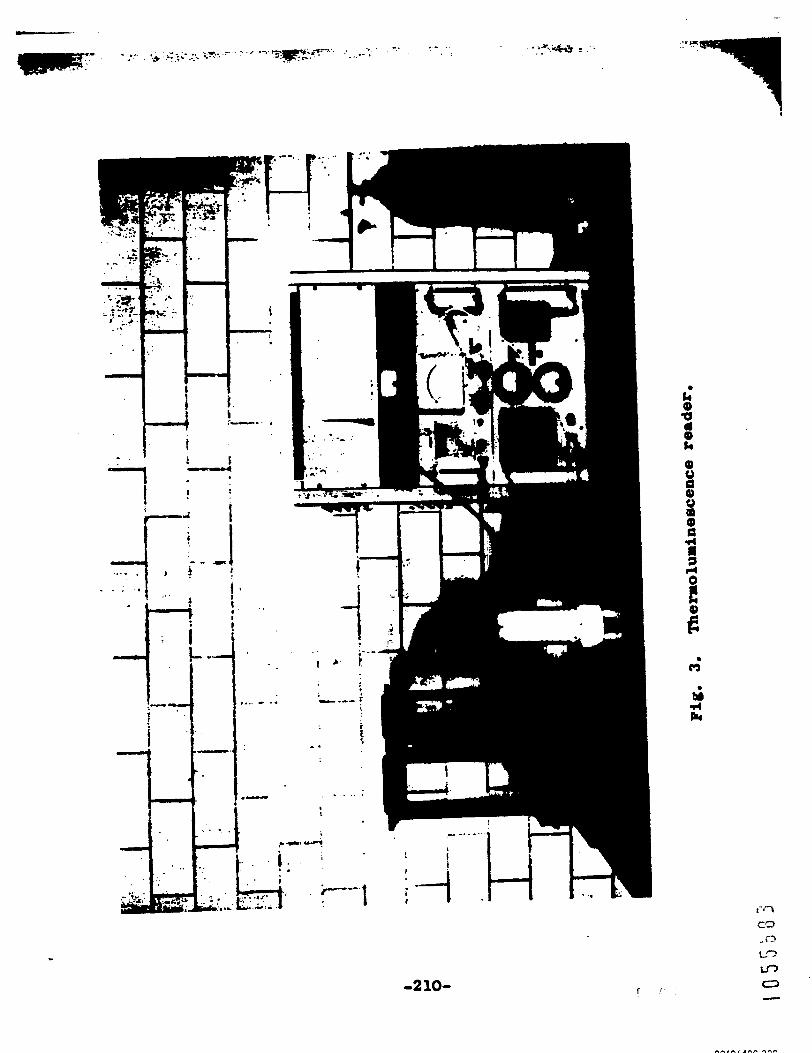
..
I... c
-210-
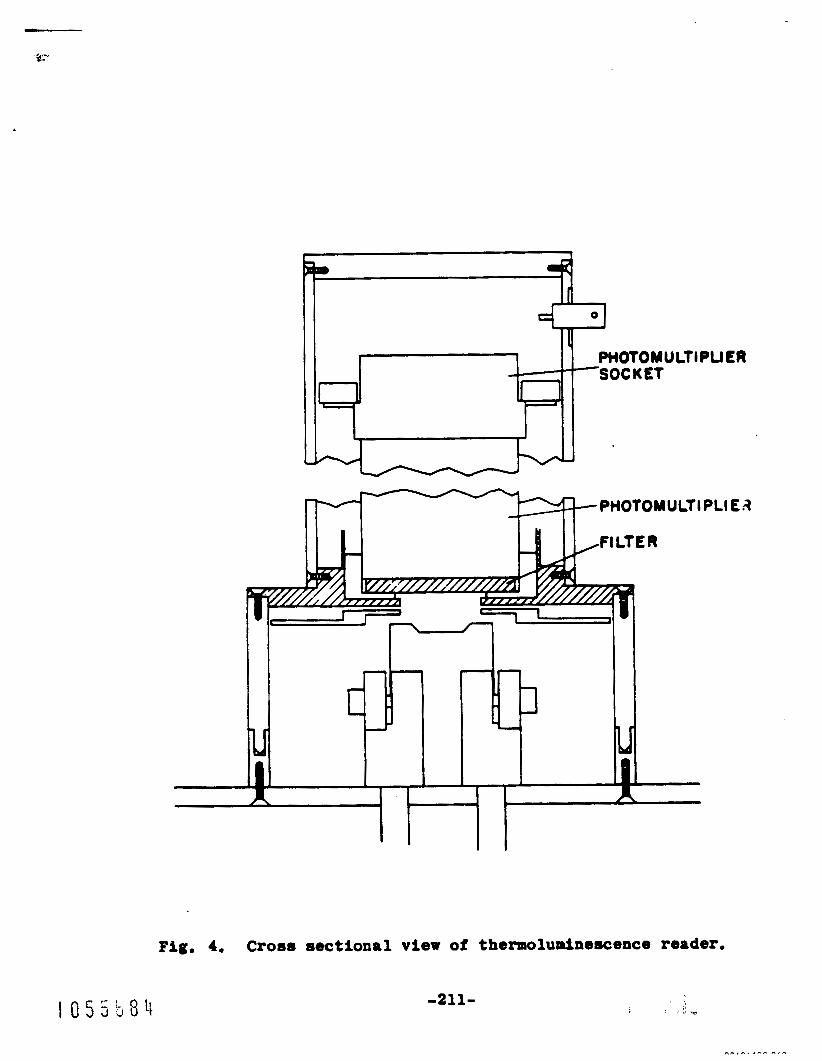
Id 71
1
PHOTOM U LTl PU LR
Fig. 4. Cross sectional view of thermoluminescence reader.
-211-
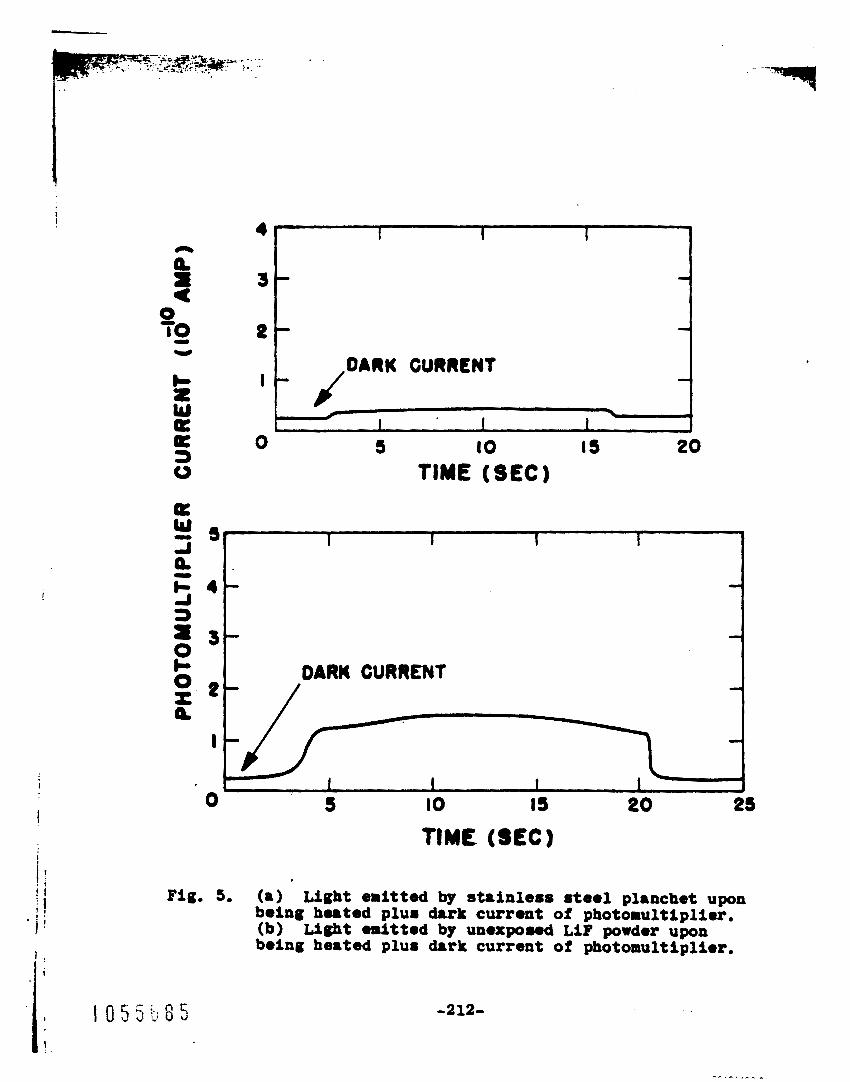
1 I
4
3
0 TO 0
Y
!
I
0 t 0 t Q
C
4
3
t
I ,DARK GURRfNf
TIME (SEC)
I 1 I 1
I 1 IO 15 20 25 5
F i g . 5. (a) being hested plum dark current of photorultiplior. (b) being he8ted plu8 d8rk current of photomultiplier.
L i g h t emitted by stainless steel planchet upon
Light sni t tod by unexpowd LIP powder upon
-212-
a lone when it is heated (black body o r thernul rad ia t ion) .
This I s one part of t h e **background** of a reading. These
graphs are obtained by recording t h e photomult ipl ier cur ren t
during t h e hea t ing cycle. Thus, t h e abacissa is i n t i m e
u n i t s and does not correspond t o t enpe ra tu re of t h e powder.
The mwder reaches maximum temperature i n s l i g h t l y more than
6 seconds. The dark cuzrent of t h e photomult ipl ier is
ind ica t ed on t h e graph. Figure 5b shows t h e l i g h t emit ted
by unexposed LIF powder upon being heated wi th our s tandrrd
hea t ing cycle. As f o r Fig. Sa, t h i s l i g h t is due t o thermal
r a d i a t i o n from t h e powder. A f i l ter has been placed between
t h e powder and t h e photomult ipl ier t o reduce t h e amount of
t h i s light that is seen by t h e photomultiplier. The amount
that does get through is equivalent t o about 50 mrads dose.
These two graphs also show why w e selected t h e above de-
scribed hea t ing cycle. A t t h e end of t h e hea t ing cycle ,
t h e i n t e n s i t y of l i g h t emitted is e s s e n t i a l l y constant.
Thus, -11 errors i n tfinfng cause only neg l ig ib l e errors
i n amount of l i g h t released. For a 10-rad sample, an e r r o r
of 1 second i n t h e t iming cyc le would cause an e r r o r i n the
reading of t h e dose of 1088 than 0 . 2 per cent. Some readers
are designed wi th a cons tan t hea t ing rate such t h a t t he t e m -
. pera ture is s t ead i ly increasing. I n t h i s case, t h e l i g h t
i n t e n s i t y is cons tan t ly changing w i t h t i m e and t h e con t ro l -
-213-
of t h e t lmlng cyc le and t h e hea t ing c u r r e n t s is much more
cr i t ical ,
The energy stored i n LIP due t o exposure t o ion iz ing
r a d i a t i o n exhibits a phenomenon known as '*fading."
that some of t h e energy is released a t room temperature.
This I s genera l ly an effect wi th a long t i m e constant .
is due t o t h e presence 02 an intermediate depth t r a p i n t h e
LIP,
exposed t o 250 KVP X r ays and read 1 hour later.
ind ica t ed is due t o the intermediate t rap .
a t a somewhrt lower temperature (looe C) than the deep t r a p
(250' C). Figure 6b (at 24 hours af ter exposure) shows t h e
disappearance of t h e pakk. Figure 70 shows a s tudy of t h i s
e f f e c t . To remove t h e f ad ing so t h a t co r rec t ions would not
have t o be appl ied to a reading depending on how long a f t e r
exposure a sample was read, t h e powder was first heated t o
110' C. The sample was baked
a t l l O o C f o r 7 minutes, 1-1/2 hours a f t e r being exposed t o
10 rads of X rays.
T h i s mean8
I t
Figure 6a shows t h e thermoluminescence of a LIF sample
The peak
I t is released
Figure 7b shows t h e r e su l t s .
The fad ing effect h a s been e s s e n t i a l l y
7
rewved.
t h e sample of about 5 per cen t , which is completely accept-
able,
Th'is causes a decrease In t o t a l l i g h t emitted by
A l imited inves t iga t ion was made t o determine t h e min-
imum dose tha t could be r e l i a b l y detected.
l a rge In t eg ra t ed '*background*' cu r ren t f ram' therm1 rad ia t ion
Due t o the rather
-214-
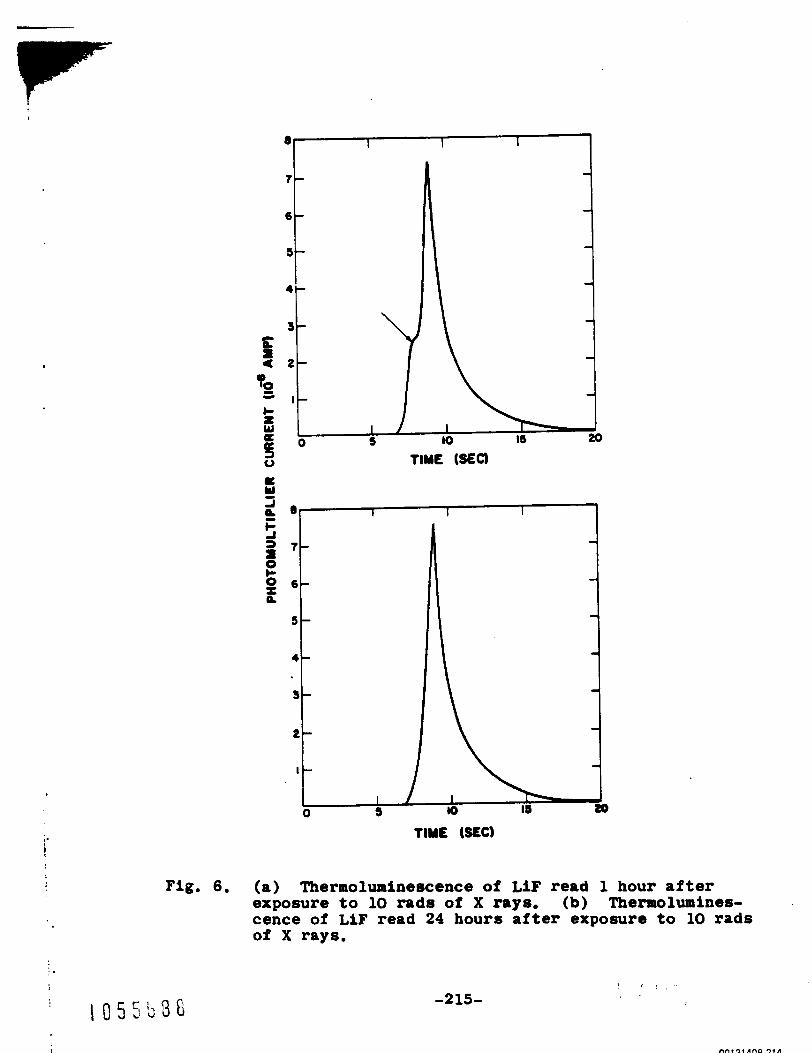
a w
i' TINE WEC1
Fig. 6. (a) Thermoluminescence of LiF read 1 hour after exposure to 10 rads of X rays. (b) Thermolumines- cence of LIF read 24 hours after exposure to 10 rads of X rays.
-215- I I '
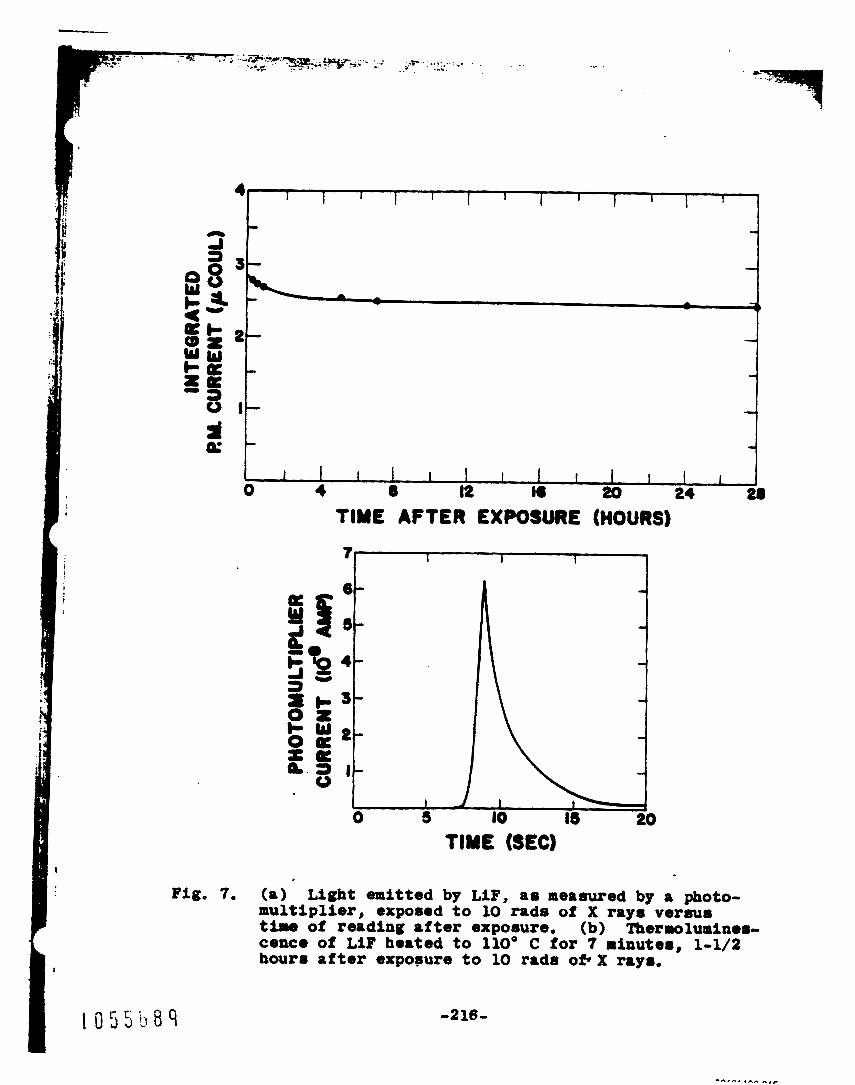
.. ., 5:
4t I I 1 1 I I I 1 I I I I 1
- - 3- -
-- . . ." s*F . . .
It I i I I I I 1 I I I I I I6 #) 24 26
TIME AFTER EXPOSURE (HOURS)
I I I I I I2 8 0 4
Fig. 7 . (a) Light emitted by LIF, a s meamred by a photo- multiplier, exposed to 10 rads of X raps ver8u8 t i m a of reading after exposure. (b) Tberwluminerr- cance of LIF hertod to 110' C for 7 minutes, 1-1/2 hours a f t e r expopure to 10 r8d8 0 f . X rays.
9 -216-

of t he powder, low doses have t o be read by u s i n g t h e
recorder. Figure 80 shows the technique. The dashed curve
is from powder t h a t has been baked a t 300' C for 1 hour t o
remove a l l energy stored i n t h e powder. The s o l i d l i n e i a
t h e photomult ipl ier cu r ren t profile from a sample tha t was
exposed t o 20 mads of 250 KVP X rays.
t h e 20-mrad dose roughly doubles t h e In t eg ra t ed cur ren t .
Based on f l u c t u a t i o n s i n t h e background of t h e powder due t o
uneven spreading of t h e powder i n t h e planchet (3 per cent
effect) and d i f f e r e n c e s i n r e s i s t i v i t y of t h e planchets, it
is f e l t that t h e lower l i m i t of usefu lness of t h i s device is
10 mrads.
roughly - + 50 per cent.
t i o n of p lanchets and handling of t h e powder, t h i s a c c h c y
can be Improved.
With t h i s powder,
The accuracy of a measurement of 10 wads is
By paying c a r e f u l a t t e n t i o n to selec-
An addi t ional d i f f i c u l t y in measuring low doses was
dircovered. Lithium f l u o r i d e was found t o be s e n s i t i v e t o
l i gh t (Incandescent, f luorescent , and e s p e c i a l l y u l t r a -
v io l e t ) .
of 100 mg of LIF t o normal room l i g h t f o r 33 minutes.
dashed l i n e is from a sample that was baked a t 300° C and
then read without being exposed t o l igh t . The curves are
I
i Figure 8b shows t h e effect of exposing a sample
The
plotted on an expanded scale, t h e d i f f e rence being equivalent
t o about 25 mr8ds. Consequently, t o measure doses less than
50 mrads, t h e powder should.be baked a t 30O0 C and immediately
-217- P o z 7
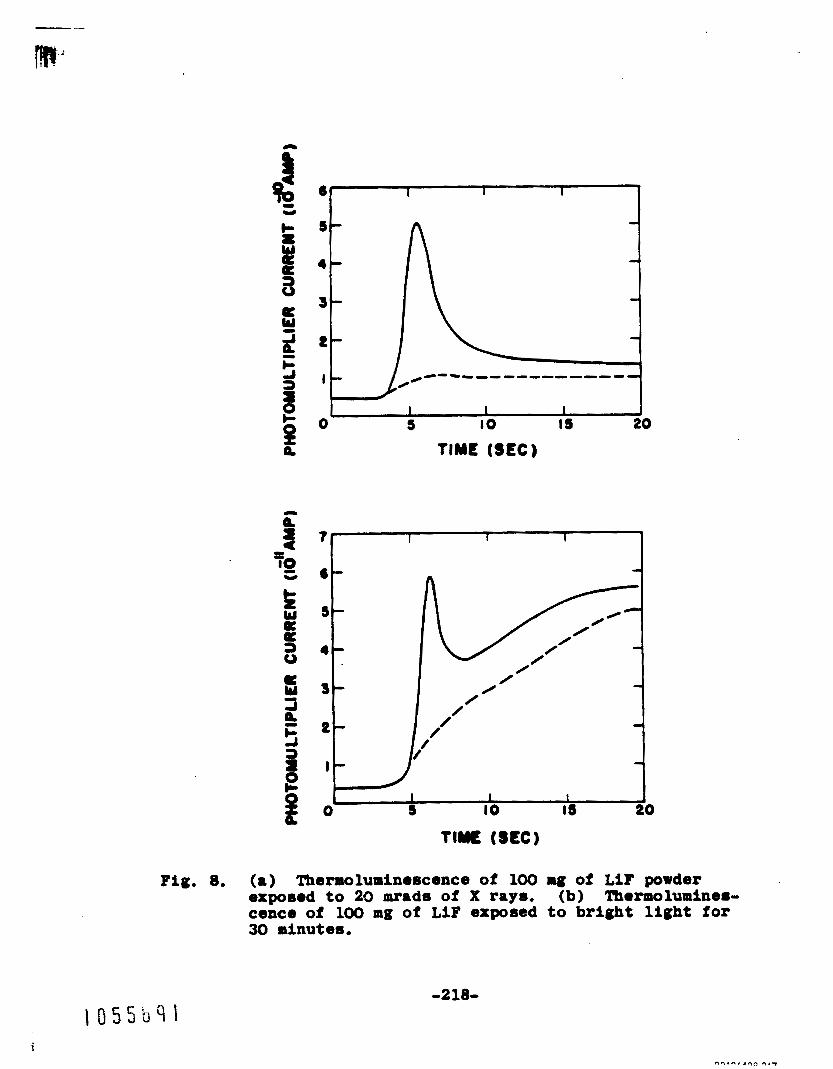
c % Y
Fig. 8. (a) Thermoluminescence of 100 rg of LiF powder exposed t o 20 mads of X rays. (b) Thermolumines- cence of 100 mg of LiF exposed to bright light for 30 minutes.
-218-
placed in l i g h t - t i g h t con ta ine r s f o r exposure (e. g. , black
pol yethy l e n e tubing).
The normal opera t ing range of t h e present instrument is
100 mads t o 50 rads, using 100-mg samples.
750 v o l t s on the photomultiplier,
upward in t w o ways. One is t o reduce the size of t h e sample.
The minimum size is l imi ted only by accuracy of weighing and
losses i n handling t h e powder. This is general ly about
10 mg, extending t h e range to 500 rads. Another way t o
extend t h e range is to reduce t h e voltage on t h e photo-
m u l t i p l i e r and consequently its s e n s i t i v i t y .
t h e e f f e c t of reducing t h e vol tage, extending t h e range a t
500 v o l t s t o 2000 rads.
This is wi th
The range can be extended
Table 1 shows
Constancy of c a l i b r a t i o n of t h e de t ec to r is checked in
t h e fol lowing manner.
and encapsulated i n t o a d i sc 1 in. i n diameter. The source
g ives 26,000 c/min.
holder and t h e photomult ipl ier put i n t o posit ion. After
wai t ing 5 minutes f o r f luorescence of t h e ZnS from room
l i g h t t o d ie out , the cu r ren t from the photomult ipl ier due
t o radiation-induced f luorescence of t h e ZnS by t h e plutonium
I s measured, Th i s is cons tan t wi th t i m e and allows for correc-
t i o n of d r i f t s i n absolu te s e n s i t i v i t y of t h e detector.
A plutonium source was mixed w i t h ZnS
The disc is placed on t h e planchet
The response of t h e LIF detector was checked aga ins t
Victoreen ion iza t ion chambers. A set of 24 100-mg samples
-219-
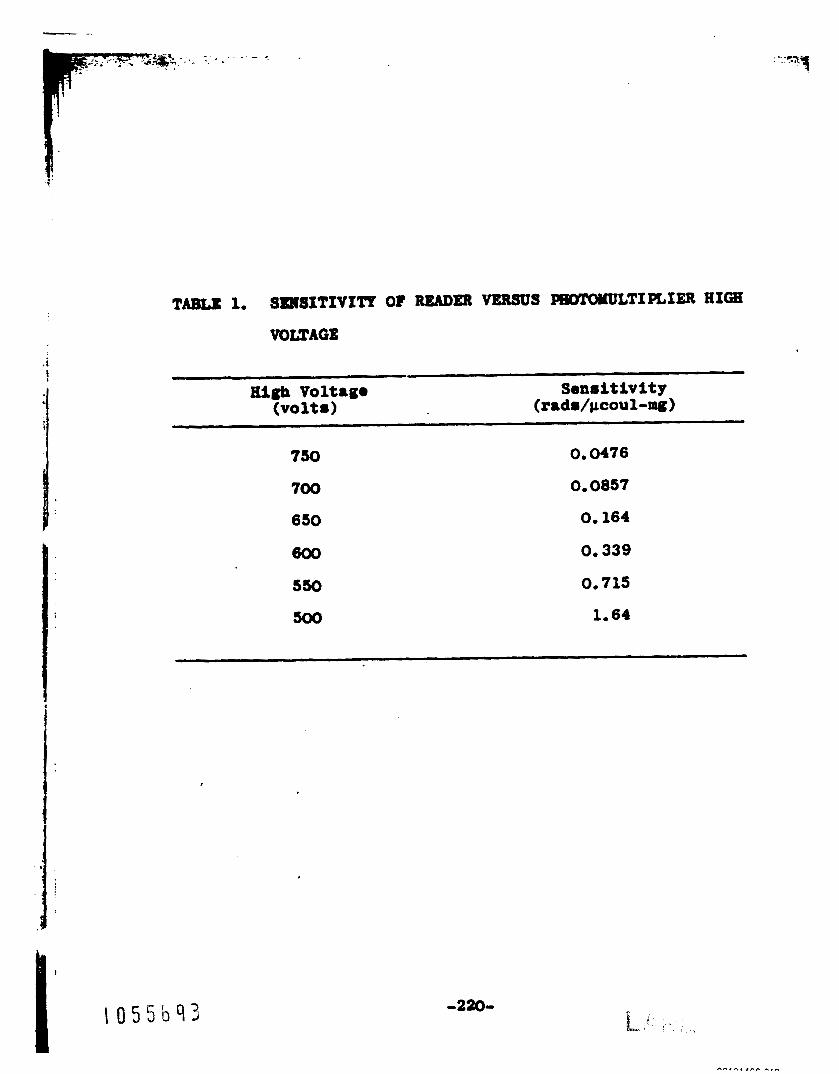
.i i
TABLE 1. SBQSSTIVITP O? READER VERSUS PaDTOyvLTIPLIER HIGH
750
700
650
600
5%
500
0.0476
0.0857
0.164
0.339
0.715
1.64
-220- L,: j . : ,
warn exposed t o t h e 100-curie Co6’ source a t t h e Biomedical
Research Group’s r8dfrrtlon exposure f m i l l t p (TA-51). They
were placed a t 8 pos i t i ons 20 t o 500 c m from t h e source,
with a dose rate range of 0.08 t o 54 r/min.
t h e dose rate (in r/mln) versus d is tance from t h e source
(In cm). The agreement between t h e ion iza t ion chambers and
the LIF is q u i t e good, The curve devia tes from l/r depen-
dence a t di8tances beyond 400 ca b e c 8 u ~ e of t h e presence of
a w a l l a t 600 c m which causes considerable backecat ter of
t h e gamma radiat ion.
Figure 9 show8
2
DISCUSSION
Thermoluminescent doshetry w i t h LIF is a very promising
technique for use In radiobiology and in h e a l t h physics
appl ica t ions . The reader described In t h i s report w a s de-
signed t o have a u s e f u l operat ing range of 100 mads to
2000 rads.
and has a proport ional response t o ion iz ing rad ia t ion ,
The dosimeter is e s s e n t i a l l y energy-independent
En-
closed In polyethylene tubing and being i t s e l f t i s sue -
equivalent , t h e do6heter would appear t o be ideal for depth-
dose s tud le8 and as a personal dosimeter fo r animals in
group s tudies , Its size I s small and any shape is possible.
There are no electrical leads to bring out. There is no
perturbat ion of t h e r ad ia t ion f i e l d due t o other p a r t s of
t h e do8imeter, as in t h e case of the condenser ion chamber.
-221-

Fig. 9. Dose rate vormu dirtrace for 100-curie Cow 80urco at TA-51.
-222- 1 0 5 5 b t i 5
- -
REFERENCES
(1) F, m n l e l s , C , A. Boyd, and D, F. Saunders, Science - 117,
343 (1953).
(2) F. T. Yorehead and F. Dlnlel8, J. Chema, Phys. - 27, 1318
(1957).
(3) J. B. Schulman, F. 8, At t lx , E. J. West, and R. J.
Ginther, Rev. Sci. Instr. - 31, 1263 (1960).
(4) J. R. Cameron, F. Daniels, N. Johnson, and G. Xenney,
Science - 134, 333 (1962).
(5) R. J. Glnther and R. D. Kirk, Report of Naval Research
LPboratory progress (September 12-20, 1956).
(6) F. Daniels and W. P. Rleman, Chemical Procurement Ageacp
Final Report NO. r-i2-so-ooi (1954).
-223-
-224-
YANUSCRIPI’S SUBMITTEI
(1) E. C, Anderson, Three-Component Body Composition
Analysis Based on Potassium and Water Determinations, sub-
mit ted t o Ann, N. Y, Acad. Sci,
(2) E. C. Anderson, Determination of Body Potassium
by 4 1 Gamma Counting, t o be published in t h e Proceedings of
the Second Symposium on Radioactivity i n Man, Northwestern
University Medical School, Chicago, Ill . (September 5-7,
1962)
(3) P, N. Dean, Computer Techniques in Gamma Spectrom-
e t r y , t o be published i n t h e Proceedings of t h e In te rna t iona l
Symposium on Natural Radiation Environment, Rice University,
Houston, Texas (April 11-13, 1963).
(4) Pm. N, Dean, Experben ta l Technique for H i g h .
Precis ion Cal ibra t ion of Whole-Body Counters: Application
t o a 4 1 Liquid S c i n t i l l a t o r and a Large Sodium Iodide ( T l )
C r y s t a l Spectrometer, t o be published in t h e Proceedings of
the Second Symposium on Radioactivity in Man, Northwestern
University Medical School, Chicago, Ill. (September 5-7,
-225-
(5) Y, 'II, Row., Y. A, Van Dl l la , and E. C, Anderson,
On the Radioactivity o f Stoa. Meteoritem, submitted to
( 6 ) Y, A, Van Dlllr and Ha J. Fulwyler, Thyroid Yetab-
oliar i n Children and Adulta Uslng Very Small (Nonocurie)
Domas of Iodin@ 12' and to be published i n the
ProceedhgS of tho Hanford Sgmposlupa on t h e Biology of
Mdioiodine, Richland, Washington (June 17-19, l S S ) , Het8lth
-226-
UiAmER 5
CLINICAL INVESTIGATIONS SECTION
Progresb in the Establishment of Karyogrrphic Yethods a8 a Tool in Radiopathology (G. L. Humason and P. C. Sanders) -
INTRODUCTION
Although I t h a s been well established by Bender e t
al. (1-5) and by t h e B r i t i s h with irradiated spondy l i t i s
cases (6 -8 ) tha t Ioniz ing r a d i a t i o n produces chromosomal
a l t e r a t i o n s in man and animals, information is lacking con-
ce rn ing (a) the minimum amount of r a d i a t i o n exposure re-
qui red t o produce such damage permanently; (b) t h e a b i l i t y
of man and other primates t o free themselves of such genet ic
damage; (c) t h e prognostic s ign i f i cance of such demonstrable
changes; and (d) t h e p l a u s i b i l i t y of us ing cytogenet ic
changes a s an index of r a d i a t i o n exposure, and of alpha and
. proton r a d i a t i o n in par t i cu la r .
-227-
METHODS
-- With these O b j 8 C t i V e S i n mind, a reliable and S b p l O
method f o r ob ta in ing prnp n e t a m s e 8 for cytogenet ic anal-
ysis and statistical c o r r e l a t i o n wi th r a d i a t i o n dOmg8S
0011r8 developed ( 9 ) through modification8 of techniquee of
Yoorhead e t al . (lo), This method worked w e l l wi th t h e
per iphera l blood of man, dog, rat, and Chicken, but did not
produce p a r t i c u l a r l y r i c h culturem of peripheral blood cel ls
from t h e Yacaca.
t h e addition of NCTC 109 t o F-10 medium (6). Adequate cul-
t u r e s of monkey blood r i c h in metaphases were recen t ly
obtained us ing as a c u l t u r e medium 7 0 per cen t NCTC 109,
10 per cent F-10 medium, 15 per cent f e t a l bovine serum,
and 5 per cent human cord serum.
wa8 added to each 3.0 rl of t h i o miXtufe. The following
tmbnique , a f u r t h e r modif icat ion of t he method of Humaeon
and Sanders (9) was found t o increase the y i e l d of cells
for cytogenet ic a n a l y s i s .
"hi8 d i f f i c u l t y seemed overcome best by
Phytohemagglutinin (0.1 m l )
1, Spin 8 t o 10 ml of venous blood 15 minutes a t
900 RPH.
about 2 t o 3 m1, plasma); t h e inc lus loa of soam red cells
presents no d i f f i c u l t y i n cul tur ing.
10 t o 15 drops of plasma t o 5 .0 m l of medium.
Draw off a l l plasma (8 t o 10 ml of blood y i e l d s
Plant In c u l t u r e medium
Incubate a t
3 7 O c for 72 hours.
1 0 5 5 1 0 1 -228-
.
* 2. Add co lch ic ine ( s t ep 4). Incubate 24 hours?.
3,
4. Treat wi th w a r m water ( s t ep 5 ) and incubate in
Spin down cells and wash wi th s a l i n e D ( s t e p 5).
hypotonic condi t ion a t 37* C for 1-1/2 hours.
cells once during t h i s period.
Resuspend
5. Fix (Step 8 ) .
Because it is more d i f f i c u l t t o 8pre.d monkey than humrn
metaphases, a method had t o be devirred t o improve t h e spread-
ing obtained in t h e Humason and Sanders method in steps 9
and 10. The fol lowing method has proved s ~ c c e ~ s f u l .
6. After acetic acid-alcohol f ixa t ion , sp in down, Dis-
card supernatant. Add 45 per cent a c e t i c ac id (aqueous) t o
t h e cells, approximately 3 t o 4 n l of f i x a t i v e t o 0.1 ml of
cells for 15 t o 30 minutes.
7 . Spin down. Discard supernatant and add enough f r e sh
45 per cent acetic acid t o t o t a l approximately 3 times t h e
o r i g i n a l volume of button of packed cells. Then wi th Pasteur
p ipe t te , thoroughly resuspend cells so that a11 clumps, i f
any, are broken. With t h e p ipe t te , place 3 or 4 separate
drops of suspension on c lean dry slides, cover wi th Petri
dish, and allow t o air-dry. After s tanding about 15 minutes,
stir drops ca re fu l ly with a c lean d i s sec t ing needle t o help
* Step numbers a s given in Ref . 9.
-229-
J
. .. .E: _._ .e.. ._-. - . . . . .
dist r fbuto tho cell8 i n the drop8 and t o reduce t h e i r concen-
t r a t i o n a t the periphery,
A Z t e r 10 t o 15 minutes of air-drying, f l u e - d r y i n g can
bo tr1.d on mom0 of t h e slide., Tip tho slide t o allow drop8
t o 8p-d m d flaw-- 88 i n 8 t O p 10. Thl8 8 0 m e t i m 8 8 he lp8
t o brork up ro luc tan t metaphasem,
8. Sta in according t o t h e method of Puck (11).
chroloaomo 8nalysem have been u d o using theme method8
on 15 Yacrcr rulatta and 11 Y. spt~ciou, W811-8pmad mota-
ph8.s. woro 801oct.d for photography, and two p r i n t s were
-de. - On0 photograph used for determining 8r13 length
mea.uromont8 using doublo a t icky tape (Scotch brand) and
mrgical silk according to t h e techniqur of Puck (11). The
othor p h O t O f p 8 p h -8 u s e d ' t o c u t ou t individual ch r0~8oM6
for tho ordor lv arrangamont a8 an adjunct t o c l r su i f i ca t ion ,
Tho chrom.ou8 wore paired and t h e k8ryotype8 completed frob
tho ro8ulting arm longth8 and t h e i r ratios, along wi th vi-
u8ing tb. 8hort arm a8 tho ordimte and t h e long arm am t h e
rbwlru (Fig, 1) r r i m found t o be of con8fderlrble a88i8tanco
in matching mnberm of 8imtlar apporring pairs of chromourre8,
-230-

r q I 1 1 1 I 1 I 1 I 1 1 I I I I 1 I I
9.0
t "t.. I T 0 I I I I I I I I I I I I I I - I 1
I .o 2.0 6.0
RELATIVE LONG ARM LENGTH (ARBITRARY UNITS)
F i g . 1. Graph showing Patau's method of grouping chromosome pairs appl ied to a n ' a a a l y s i s of Yacaca blood.
t 0 5 5 7 0 t l -231-
wero found t o bo i d o n t i c a l , agreelng wall with thoro previoualr
determined by Rothimla and Sirrinovitch (13) for Yo mulatta,
as shorn In Table 1.
Tho80 tcbchnicrl a tudie8 of t ho cytogenot lc characterlrtlc8
of normal primate blood warm prralleled wi th karpographic anal-
yaom of tho cul turod peripheral blood and skin of 4 noma1 per-
80118 and 4 p.rmon8 horn t o have been erpo8ed p r e v l o u s l ~ t o
inadvertent whole-body i r r ad ia t ion . These s tudie8 , some of
which ara still i n progross, were done i n order t o characterize
tho n8turo and frequmncy o f radiation-induced a l t e r a t i o n s of
human chmmosoum under th08e t l m u e c u l t u r a l and technological
conditlona. In t h e next phase of t h i s i nves t iga t ion , t h e blood
of wnkeyr axpoaed t o rccurately determined amounts of various
Ionizing r a d i r t i o n 8 rill be 8tudled a t i n t e r v a l a and compared ..
with the incidence of p e r s i s t e n t a l t e r 8 t i o n ~ in t h e chromosonml
cytology found in t h a blood.of irradiated persons.
(1)
(2)
Yo A. Bonder, Science - 126(8), 974 (1957).
a. A, Bender and S. Uolff, AH. N 8 t U r 8 1 1 8 t -- I S , 39 (1961).
(3) Y, A. Bond8r, - X-Ray-Induced C b r 0 r o . o ~ Aberrat ions in
Yallwllan C e l l 8 in v i t r o and i n vivo. Inodlate and
Lor mvO1 kffOCt8'0f Ionizing Radl8tlon8 (A. A. BUZZati-
T~IVU~SO, O d e ) , Taylor and PC8nCI.s Ltd, London (I-),
PP. 103-118.
-332-
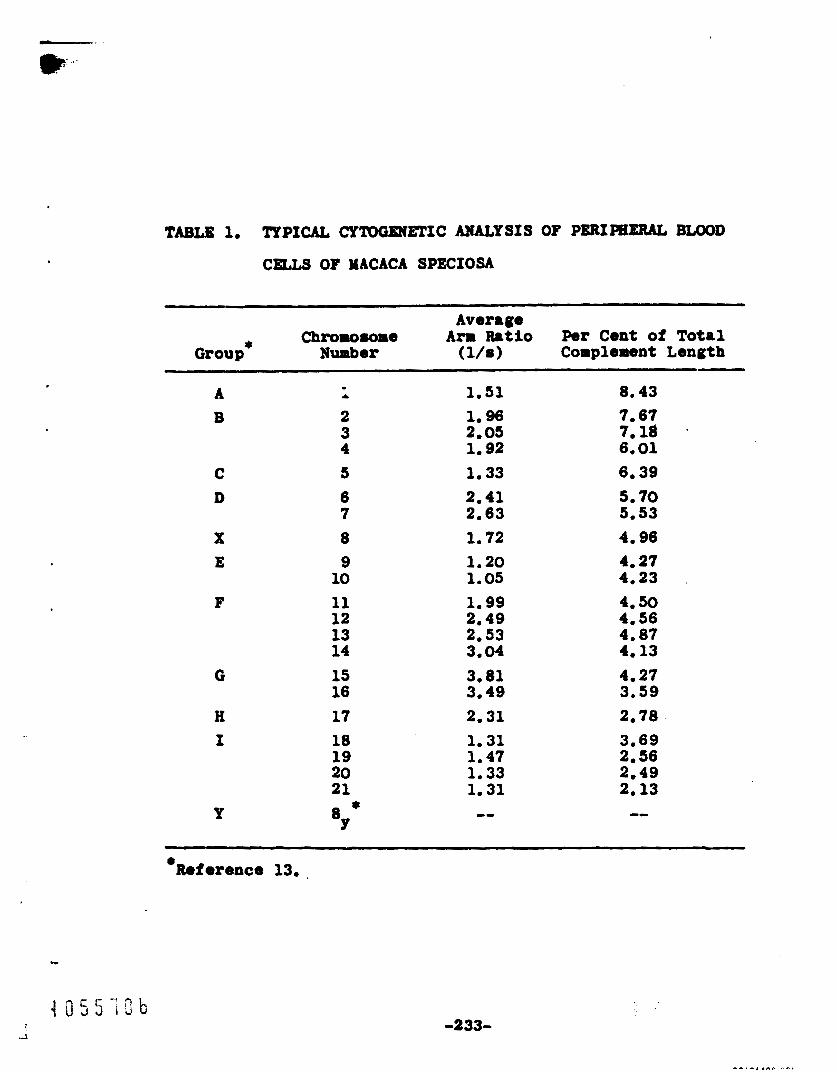
TABLES 1. TXPICAL CY’IOGmETIC ANALYSIS OF PERXWERAL B W D
C U S OF YACACA SPECIOSA
Averrge chrOr0-e A r m Ratio Per Cent of Total
Complement Length - Group* Number W S )
- A & 1. 51 8-43 B 2 10 96 7.67
3 2.05 7.18 . 4 1.92 6.01
C D
X E
F
G
H X
5 6 7 8 9
10 11 12 13 14 15 16 17 18 19 20 21
1. 33 2.41 2.63 1.72 1.20 1.05 1. 99 2.49 2.53 3.04 3.81 3.49 2.31 1. 31 1.47 1. 33 1.31
6.39 5.70
4.96 5.53
4.27 4.23 4. So 4.56 4.87 4.13 4.27 3.59 2.70 3.69
2.49 2.56
2.13 -- -- *
Y 8Y
Reference 13. .
.-
-233-
Induced Chromo.ore Aberration8 i n Hum8n Blood I r m d h t e d
in v i t ro , Biology Divis ion , Oak Ridge Hatlonail Laboratory
-port ( i s e l ) , 2s P.
Y, A. Bender and P. C. Gooch, Fer8i8tent Chromosome - Abemtionm in 1mdi.t.d H a l l . , Biologg Division, Oak
Ridga Nlt iona l L.bor8tory Report (Isel), 20 p.
I. Tough, K. E. Buckton, A, G. Balllo, and I, Me Court-
Brown, Laacet - 11, 849 (1960).
E, &oldr w. w. B U C h I I O U , and B. LBIInOX, L&BCOt - I, 977
(1SeU.
J, S, S, Stewart and A. R, Sanderuon, Lancet z, 978
(1Sel)o
G, L. Euuson 8nd P. C. Sanders, Stain Techn, - 38, 338
(1983).
P, S, Yoorherd, V. J, Mell-n, D. Y, Batipps, and D, A.
Hamgarford, mp, Cell b8. - 20, 613 (1980).
T. T, Puck, ed,, guaotitative Yaaspllan C e l l Culture,
A w r y of Methods Ueed i n the Department of Bio-
ph78ic8,, University of Color8do Medical Center, 2nd ed,
I[, Patau, Am, J, Hurrcn Genetics - 12, 250 (1980).
IC. E, Bothfels and L. Slminovltch, Chromosou - 9, 163
(lSS8).
Elec t ron ic Yearuroment of C e l l u l a r Volumes. IV. Detennina- t i o n of Scal ing and Correction Fac to r s for Conversion of - Voltage t o Cubic Micron6 (C. C. Lushbrugh, D, B. Hale, and N. J. Basmaaa)
INTRODUCTION
Elec t ron ic measurement of c e l l u l a r volumes has numerous
p o t e n t i a l a p p l i c a t i o n s i n experimental and c l i n i c a l hematol-
ogy (1=4),
l imited by d i f f i c u l t i e s involved i n accu ra t e c a l i b r a t i o n of
t h e e l e c t r o n i c appara tus and in t h e mathematical in t e rp re t a -
t i o n s of t h e r e s u l t s .
The usefu lness of these app l i ca t ions is present ly
The t r a n s l a t i o n of trequency d i s t r i b u -
t i o n prof i les of pulse he ight vo l t ages i n t o populations of
e ry th rocy te s of varying volumes p resen t s semantic d i f f i c u l t i e s
t o hematologic microscopists. A particle volume analyzer * system assembled around an e l e c t r o n i c particle counter was
r e c e n t l y described which seemed t o r e so lve many of these d i f -
f i c u l t i e s and t o produce hematologically u s e f u l r e s u l t s (1,2).
Since then, t h i s appara tus has been improved by seve ra l
commercially a v a i l a b l e e l ec t ron ic un i t s .
accu ra t e system of c a l i b r a t i o n has been developed which allows
c o r r e c t i o n for changes not only i n a p e r t u r e c u r r e n t s as
Xn addi t ion , a more
-235-
prevloumly de8crihd (1) but also f o r change8 In aperture
dilDLeter:, u p l i f t e r mas , aad PH O f t h e Conducting 8OlUtiOn
used t o arspend t h e cells.
r e s u l t i n g scaling factors show t h a t a much wider range of
partIc1.8 or cella can be sized with thia device than pre-
viously envi8ioned.
-.tea and i t8 set of ape r tu re s must be ind iv idua l ly cal-
ibrated if actual, rather than r e l a t i v e , e ry throcyte volumes
are de8ired.
comprehensive c 8 l i b r a t i o n of such equfprent and t h e develop-
ment of t h e var ioue neceusary sca l ing factors which are
needed t o convert pulse height vol tages i n t o cubic microns
so t h a t aea8urement and d i s t r i b u t i o n of c e l l u l a r volunrea
varying in slze from bacteria t o the largest BeLa cells can
be determined.
These d 8 t O n i n 8 t i O n 8 and t h e
They also revea l that such an analyzer
The preuent paper reports a method for t h e
DESCRImION OF TLlE APPARATUS -- The particle volume analyzer sys t em is compolred of
9 pieces of equipment, as shown in Fig. 1.
related e l e c t r o n i c a l l y as previously diagramed (1).
ba8ic unit8 (Pig. 1, C and E) are the aperture tube and mer-
cury manometer cha8Si8 (C), where t h e pulaerr are generated
a8 the particles pass through the aper ture (ApD) in the ap-
e r t u r e tube and are enurnrated i n the particle counter (E).
These are i n t e r -
The
This particle counter (Coulter Model A) was modified so that
the i n t e r n a l coarse c o n t r o l for ampllfying pulses af ter they
were formed could be changed a t w i l l by t u rn ing an external
d ia l knob ( 0 ) through 6 p ~ s i t i o n r . The i n t e r n a l f i n e gain
c o n t r o l was left f ixed a t 2.3 on Its d ia l , s i n c e with t h i s
s e t t i n g changes in t h e coarse gain (g) were constant.
Coul te r t h r e s h l d knob (t) was kept a t 10 in order t o delete
counts due t o -11 debr is during t h e RBC counts used wi th
The
Harct t o determine MCV. Since t h e pulses from t h e Coulter
appara tus were obtained fo r pulse he ight a n a l y s i s f r o m t h e
cathode follower c i rcu i t (l), the pos i t i on of the Coulter
threshold s e t t i n g (t) does not l i m i t t he size of t h e pulses
(PHv) going t o t h e pulse he igh t analyzer u n i t (A).
of t h e Coulter counter enables t h e choice of 8 d i f f e r e n t
D i a l a
1 0 5 5 7 1 0
c u r r e n t s ( A N ) through t h e sizing ape r tu re (ApD). The 400-
channel analyzer ( A ) I s d i v i s i b l e I n t o four 100-channel u n i t s
with separate memories so t h a t 4 analyses can be made sequen-
t i a l l y before p r i n t i n g ou t r e s u l t s .
dead t i m e is made automatical ly so that v a r i a b l e concentra-
Correct ion for analyzer
t i o n s of pmrticles are counted w i t h coslstaat s ta t i s t ica l
errors. As t h i s u a i t sorts and stores wi th vol tage of a
pulse , t h i s event is recorded on a cathode d isp lay of t h e
c o n t e n t s of t h e 100 channels and a '*countq* is sub t r ac t ed by
t h e store pulse scaler u a l t (I). This u n i t ( I ) counts down
-237-
~ ... . . -
F i g , 1. Th8 pulse height-particle V 0 1 U r e 8118lyZer a d it8
component parts:
yzer; (C) oporture tube-unoneter ch888l8;+ (D) d i g i t a l
rocordor or numerical re8dout ;++ (.E) e l e c t r o n i c
p a r t i c l a counter , pulse arpl i f ier (g), thre6hold
c o n t r o l (t), and ape r tu re cu r ren t ( A S ) con t ro l
u n i t ( 8 ) ;+ (P) X-Y plotter. c a l i b r r t i o n c o n t r o l
(A) 400-channel pulse height anal- * +*
(8 ) X-Y plot ter or a u t o r r t i c grapher;
# unit; ' ( G ) preset count c o n t r o l u n i t ; (HI pula.
height c a l i b r r t i o n c o n t r o l unit;O and (I) store
pulse r~caler unit.Oo
* Model 34-13, R8dirtIon In8trunent Development Laboratory , Inc., Yelro8e Park, I l l i n o i s , tt
'Hod01 A, C0Ult.r ElaCtroniC8, Y h d , Florid&
Mod81 2, F. L, Mo8elep Company, P.88dena, Cal i fornia ,
*Modo1 3614 H e r l e t t Packard Company, Pa10 Alto, Collfornia .
SYodal 34, Drawing 4y-40796, m s A l 8 m o s S c i e n t i f i c mtmratory.
Ss;lotiol 7 , Dfawlng 4 y - 4 ~ ~ A l u o c l s c i e n t i f i c mbrrtory,
%ode1 1560, Drawing 4Y-26828, Lo8 Ala-. S c i e n t i f i c Lab- oratow.
9od.1 750-A, Drawing 4Y-26065, Lo8 Al-8 S c i e n t i f i c Lab- oratow.
-338-
nni 71 dnA 377
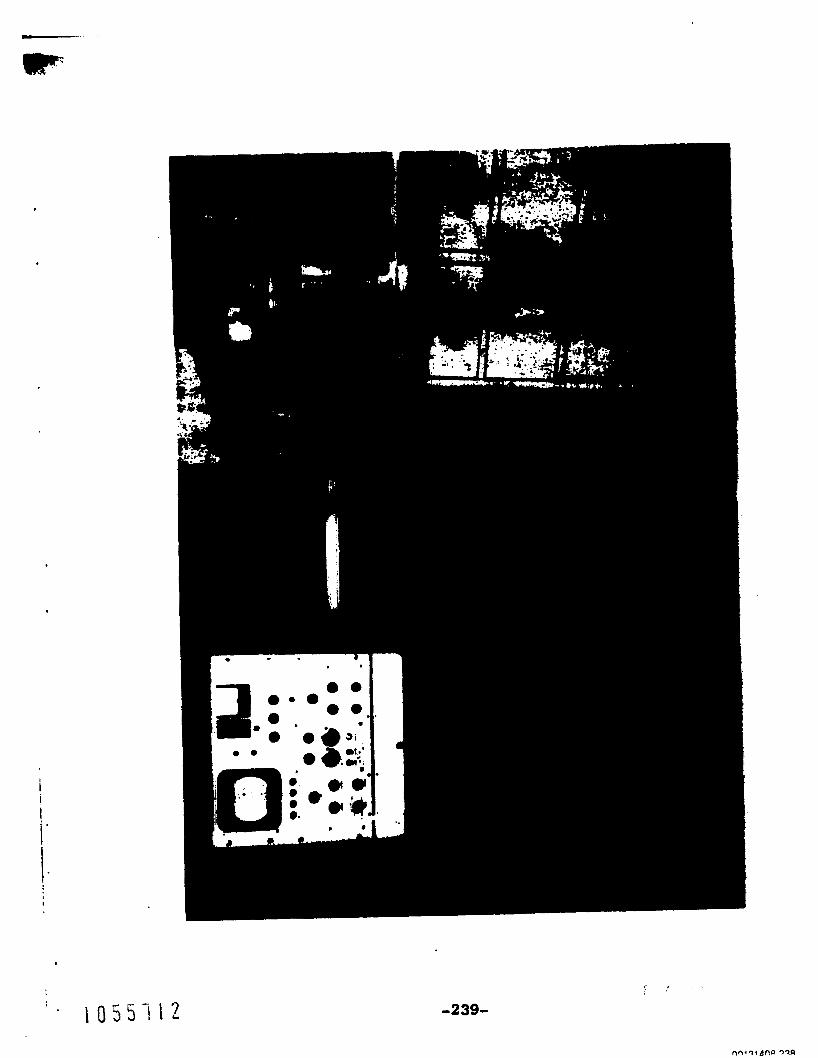
i i i i'
-239-
nniiiana 3 7 A
i n t h o u dotormixmtion8 I 8 kept a t 100,OOO. RBC concentra-
t ion in tho mlutiorr boing: aarr1yz.d I 8 kopt a t about
SO,OOO/al 80 that dead ti.l. lo88 is 10.. th8n 10 per cent ,
cornplotion of t h o 8nrlyticrrl ~ 1 3 ~ tho d8t8 8t0r.d in t h e
100-channel aru lyzor maow life p l o t t a d out on the X-Y
plottor (B) 8nd pr in t ed out on tape by the digi ta l recorder
(9) on dokand, Tho o thor 2 unit8 8hOm l a t h e 8 p p r 8 t U 8
(Pig, 1) 8ro the plotter c o n t r o l unit (F), which doternines
th8t t h o X-ll 8%08 Of tho m p b I C p l o t t e r corrs8pond 8 C C U m t O l y - ,.:- with tha analyzof, a& 8 gu&r (E), which earble8 c o n t r o l of
t h e s t r b f l f e of tho ~ 8 l y r . r by dfroct ae8 ' surnent of pal80
height voltam boing stored i n .n~ p r t i c u l a r cbnnol from 6 dw tQ dw.
In addition to t he o q u i p ~ a t 8hom In Flg. 1, 6 d i f f e -
e n t 8m-8 tubas with d%8wtor8 (Am) O f 30, 50, 70, 100,
140, 8134 a00 dpoau wore u8.d I n t h i 8 8tudw. Anothar tub. ..
too f requent ly and gener8ted e l e c t r o n i c nofm with even low
aperture currents .
t 0 5 5 1 t 3 -340-
CALIBRATION - PROCEDrJRES
This pulse height analyzer system sorts PHv v8rylng i n
height from 0.67 v o l t in channel 1 t o 67 v o l t s in channol 100,
Ins tead of 1 t o 100 v o l t s as In t h e previous analyzer (l),
t h u s necess i t a t ing determination of a new sca l ing f a c t o r (F1)
for conversion of priv t o c e l l u l a r volume (CV).
Red Blood C e l l (RBC) Method
R e d bload cel ls w i t h d i f f e r e n t mean corpttscular volumes
(MCV) were used as previously described (' .4) , and an addi-
t ional c a l i b r a t i o n was done wi th bacterial-sized latex
particles. The r e s u l t i n g l f n e (Fig. 2) drawn by stat is t ical
analysis through t h e poin ts c o r r e l a t i n g MCV with mean channel
(MCh)** revealed t h a t PHv from RBC 28.5 (r
being stored i n channel 10 a t ApD 100, ApC V, g 4.
ber 2.85 I s , then, t h e sca l ing factor (F1) which enables
conversion of any analyzer channel number i n t o p a t these
o l e c t r o n l c s a t t i n g a and physico-chemical condi t ion8 of tho
suspending 80 l u t ion (3,507 ) .
* *
3 I n volume were
The num-
3
- --- t
** Dow Chemical Company.
Mean channel (YCh) corresponds samantical ly with mean threshold (MT) i n terminology of t h e Coulter counter.
-241-
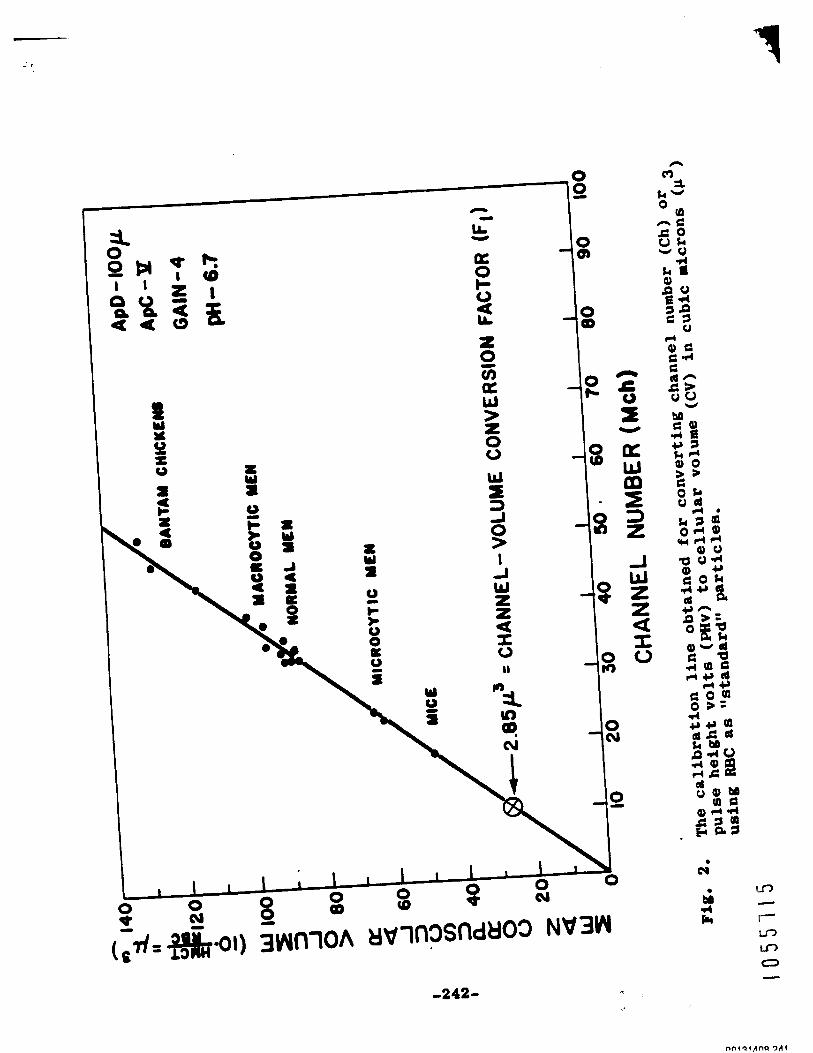
-=-----I8
w s 0,
f l -
C d- s* %
-242-
Latex Particle Method
It is not necessary, however, t o use RBC for determina-
t i o n of F
can be measured d i r e c t l y by some other means. Suspensions
of l a t e x particles of d i f f e r e n t mean diameters have recent ly
been s tandardized and have become a v a i l a b l e commercially.
The modal volume= of these particles are computed from t h e i r
known mean diameter.
particles of d i f f e r i n g mean volume, frequency d i s t r i b u t i o n
p r o f i l e s of t h e i r volumes were determinec v i t h appropriate
ApD, ApC, and g s e t t i n g s . The best f i t l i n e s f o r these data
were determined as shown in Fig. 3 ( 8 ) . The volume of
channel 10 is determined from these l i n e s , and channel volume
if o t h e r particles are a v a i l a b l e whose mean volume 1
Using three suspensions of l a t e x
conversion f a c t o r s
ApC, and g. These
w i t h F1 for animal
Correct ion Fac to r s
(F1) are then derived f o r t h e var ious ApD,
values are tabula ted i n Table 1, along
RBC .
Only one F1 needs t o be determined d i r e c t l y wi th RBC or
latex particles, s i n c e it is ps s ib l e t o determine f u r t h e r
the c o r r e c t i o n factors which w i l l compensate for u s e of other
A@, A*, and g s e t t i n g s than those used i n determining F1.
The d e f i n i t i o n s and purposes of these c o r r e c t i o n factors
are ou t l ined i n Table 2. With these numerical factors, a
-243-
*^ ,^ . .^^ -.-
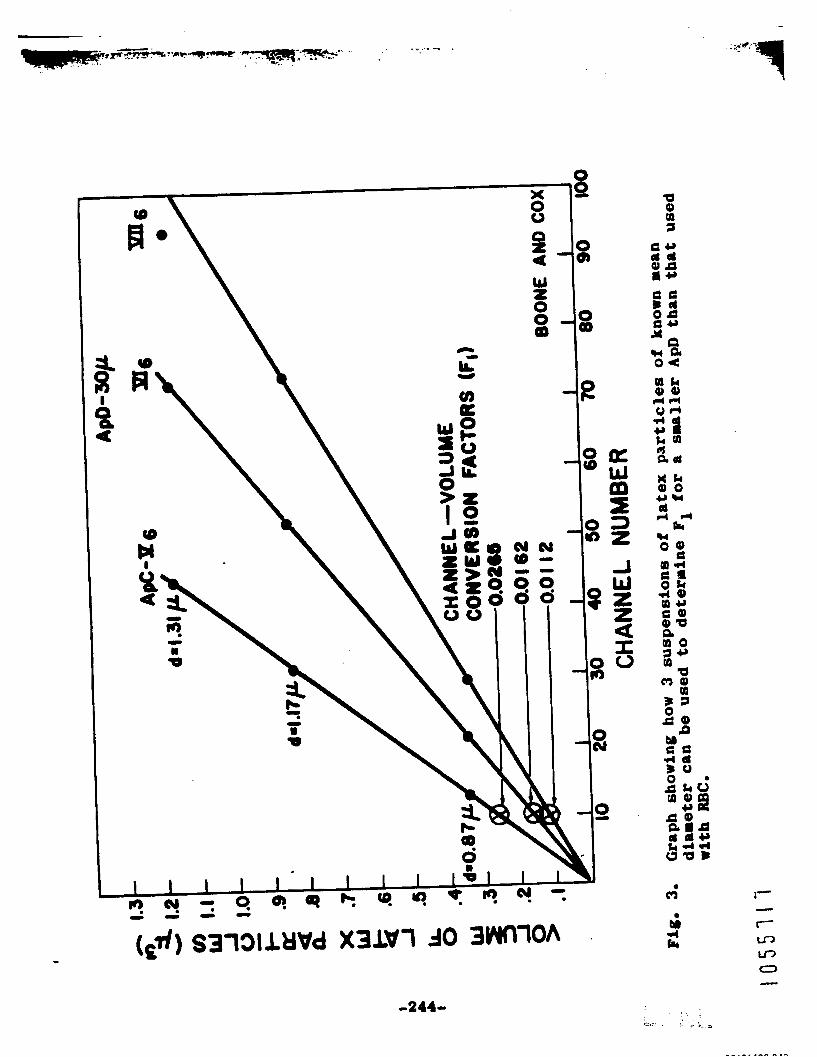
m
ai 4 Er

TABLE 1. SCALING FACTORS (F1) FOR CONVERTING CHANNEL, NUMBER
To VOLUME
Latex Particles (5) - ApD = 30 v, pH uncontrolled, 0.9 per cent sal ine
ApC V, g 6 = 0.0265 p3/Ch
A p C VI, g 6 = 0.0162 p3/Ch
ApC VII, g 6 = 0.0112 p3/Ch
Animal RBC
ApC Ij g 1 111.6 p3/Ch*
ApC V, g 4 - 2.85 p3/Ch 3 ApC VII, g 1 = 3.04 p /Ch*
* By extrapolation using corrections P3 x Fq for changes i n A p C and g.
-245-
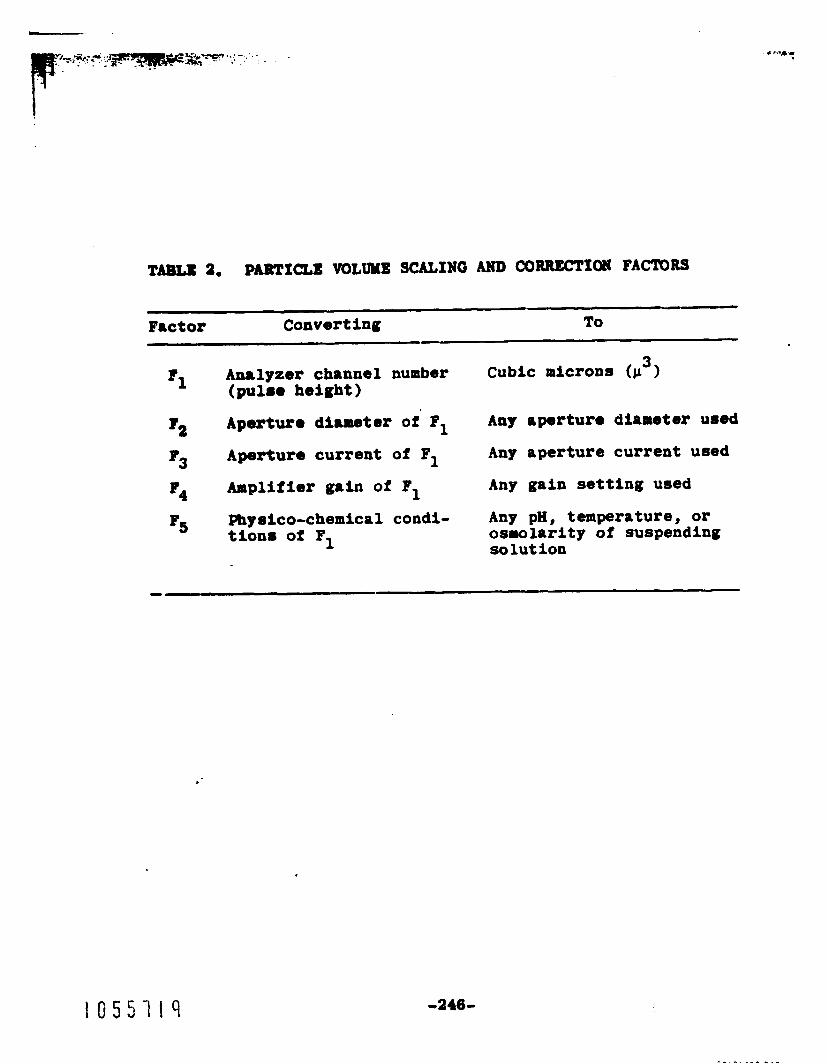
TABU 2. PAItTXCLE VOLUME SCALING AND CORRECTION FACTORS
- ~
Factor Converting TO
3 Analyzer channel number Cubic microns ( f i )
F1 (pu1.8 height)
Aperture diameter of P1 Any aperture diameter u8ed F2
Aperture current of F1
Amplifier gain of F1
Any aperture current used
Any gain s e t t i n g used *3
p4 Physico-chemical coadi- Any pH, temperature, or tion8 of PI osmolarity of suspending
solution F5
I O 5 5 1 1 9 -246-
pu l se produced by a particle of unknown size can be corrected
mathematically t o s tandard condi t ions iron those under which
t h e pulse was produced.
PROCEDURE FOR DETERMINATION OF CORRECTION FACTORS
These c o r r e c t i o n factors (Table 2) were determined by
measuring t h e s h l i t i n t h e channel number modes of popula-
t i o n s of RBC caused by changing one v a r i a b l e w h i l e a l l other
v a r i a b l e s remained fixed. No attempt was made t o measure
t h e a c t u a l size of the cells or t o determine mathematically
t h e i r mean cel l size or size of t h e c e l h a t t h e mode. The
assumption was made, based on t h e previously reported
s t u d i e s (1,2), that t h e ce l l s i z e a t t h e mode of frequency
d i e t r i b u t l o a curve of any one blood sample was constant.
t he cases of pH (5 ) and osmolarity (6), t he shift In modal
peak is due t o actual changes i n CV because of t h e expansible
RBC membrane.
In
As shown in Fig, 4, RBC fron a pa t i en t were sized a t
pH 6.7, 0.9 per cen t s a l i n e , 74O F, with ApD 140 microns
and ApC VIII, while t h e ampl i f ie r gain s e t t i n g s were changed,
Ratios were t h e n made of t h e ch8nnel numbers of t h e mode8 a t
consecut ive changes in one condi t ion while other condi t ions
were held cons tan t , as shown i n Table 3. The mean ra t io
fo r gain changes (g) determined In t h i s manner was 0.707,
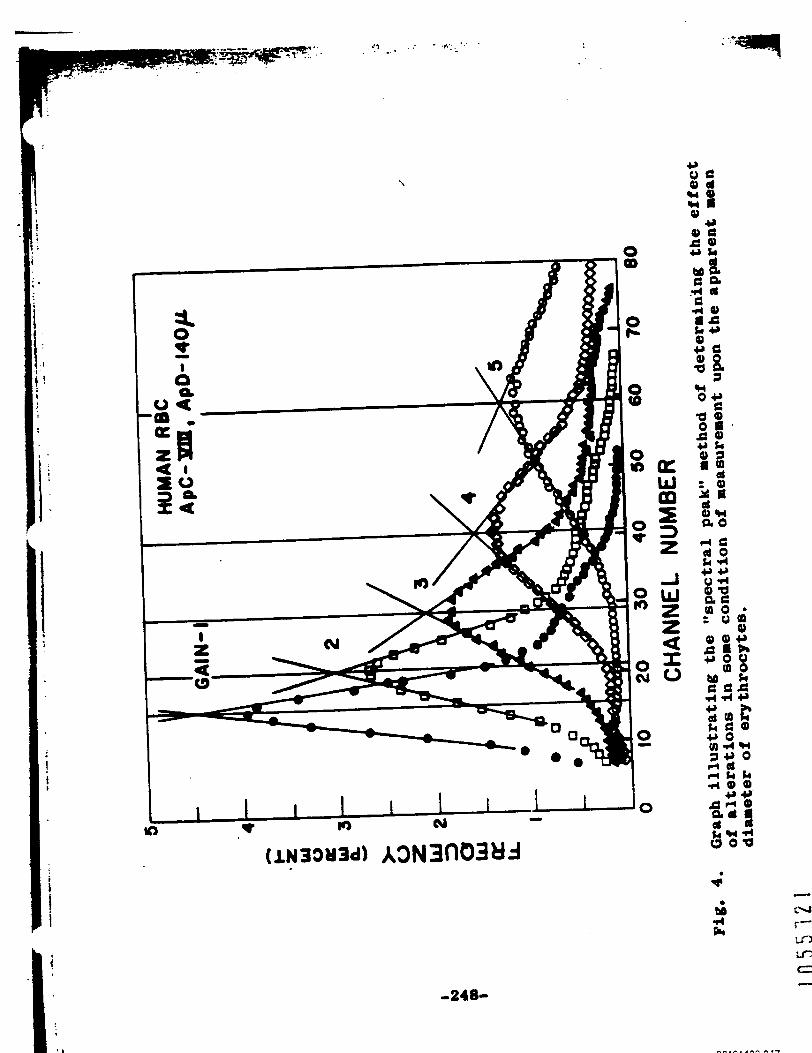
3 0
3 n
0
-248-
ss 0
0
. '.--
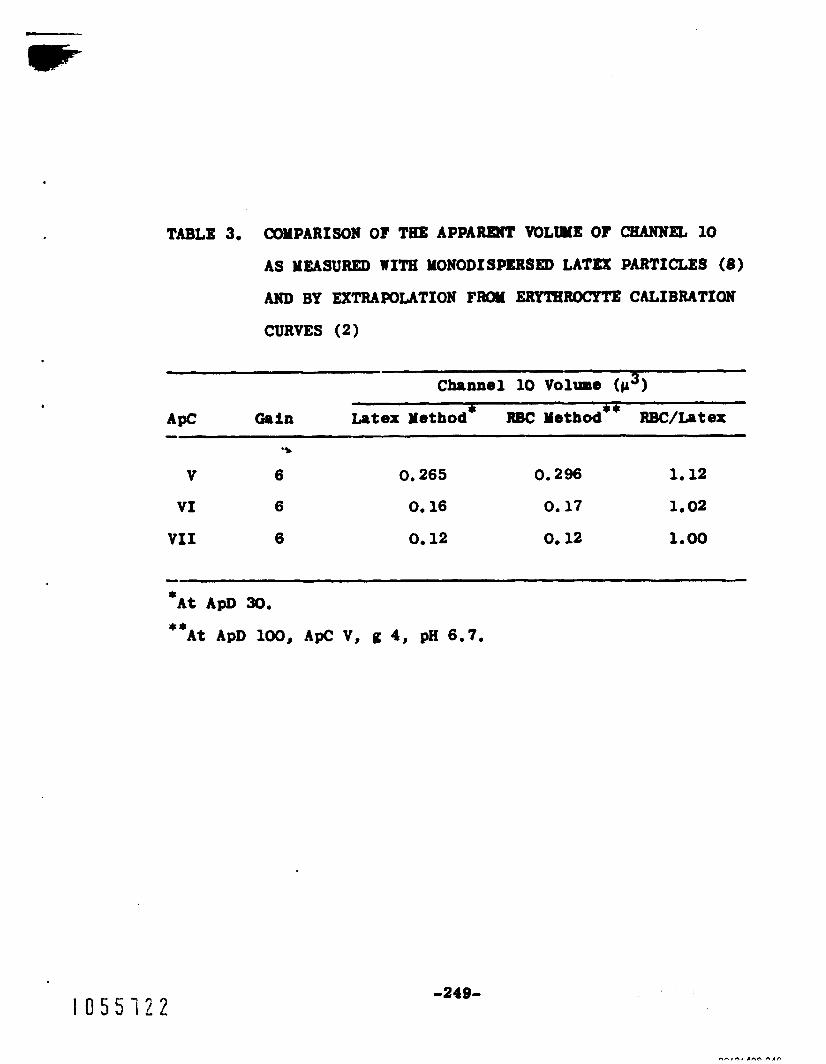
TABLE 3. COYPARISON OF THE APPARENT VOLUME OF CHANNEL 10
AS MEASURED WITH MONODISPERSED LATEX PARTICLES (8)
AND BY EXTRA#)LATION FROM ERyTIlRocyTg CALIBRATION
CURVES (2)
A S GaAn Latex Yethod* RBC Method** RBC/Latex
V
VI
VI1
6
6
6
0.265 0.296 1.12
0.16 0.17 1.02
0.12 0.12 1.00
A t ApD 30. * **
A t ApD 100, ApC V, g 4, pH 6.7.
-249-
O r G . The ra t ios for ApD and ApC changes were not
l i n e a r , and mean ratfos could not be derived. Using these
ratio., I t l o possible t o der ive the co r rec t ion factors by
which the expcsrlmentallp determined conversion factor F1
can be converted i n t o scales for t he o the r s e t t i n g s ,
U s e of Correct ion Factors
Tho accuracy of t h m e cor rec t ion factors was tested
u8ing them t o e x t r a p o l a t e from t h e F1 determined w i t h RBC
a t ApD 100, ApC V, g 4 (pH 6 . 7 ) , t o t h e FL values determined
wi th l a t e x particles a t ApD 30, ApC V, VI, and VII, a t g 6.
The remults of t h i s test (shown in Table 3 and Fig. 5) con-
f i rm the v a l i d i t y of this method of c a l i b r a t i o n and correc-
tion. Figure 5 also shows t h e range of particle sizes t h a t
can be mealnrred In channel 10 by appropr ia te changes In the
three variables A@, ApC, and g.
CONCLUSION
Tho inherent v a r i a b i l i t y of e l e c t r o n i c apparati r equ i r e s
a means of s tandard iz ing their measurements along w i t h a
method for compensating for changes i n the condi t lons under
which the measurements are made. RBC or latex particles can
be used, as described here, as a nonelectronic means of such
8tandardlzat ion that is facile and reliable.
1 0 5 5 1 5 3 -250-
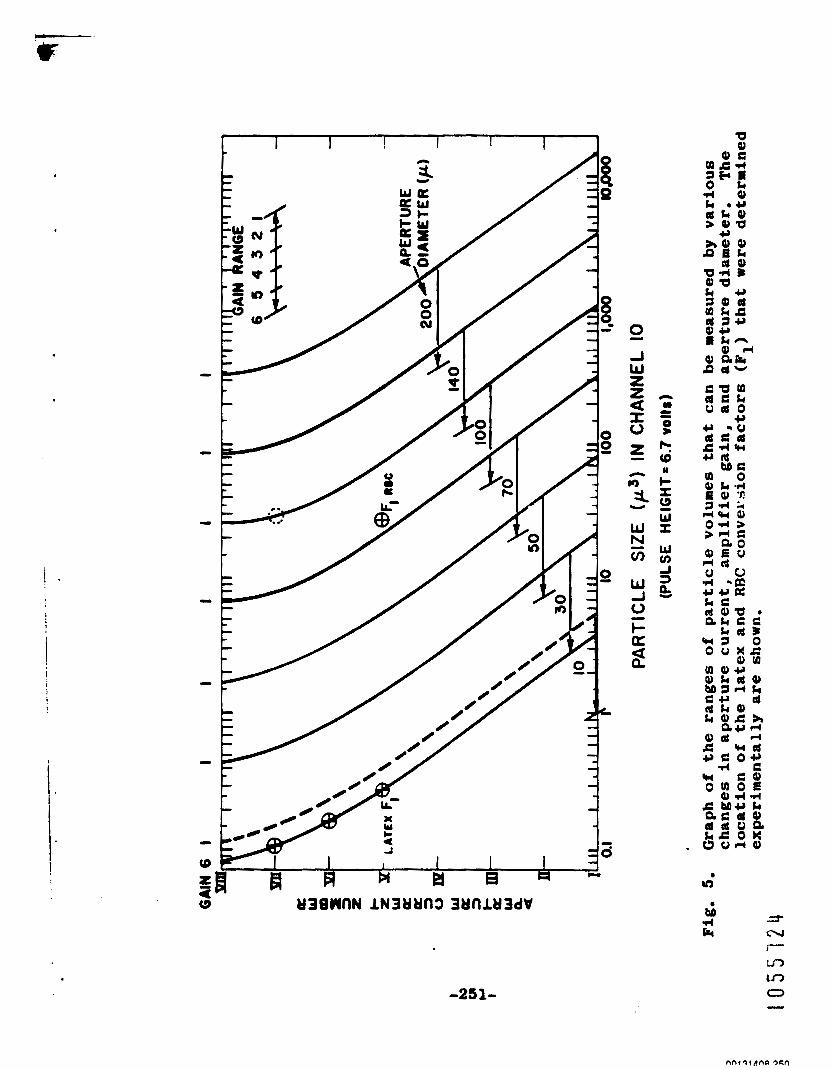
! I
a X 0 z
=i n cr)
Y
W N cn -
c rn = 0 >
In .
a
i
C, C, Lushbaugh, J. A. Yaddy, and N. J, B.s=nn, Blood
- 20, 233 (1962).
C. C. Lu8hb8ugh, N, J. BasIunn, and B. Glascock, Blood
- 20, 241 (1962).
G. Brecher, E, F. Jakobelc, Y. A. Schneidermsaa, G, 2.
W i l l i a m s , and p. J. Schmidt, Ann, N. Y. Acad. Sci, - 99,
242 (1962).
A, C. PeILCoCk, G. 2. U l l l i a m m , and H, P. Yengoli, J.
N a t a Cancer fast. - 25, 63 (1960).
C. C. Lushbaugh, E. C, Anderson, H. 1. Israel, D. B.
Ule, and 19. J, Ba8mnn, Change in Red Blood C e l l s
Resultfng from Noa-Phyrrio1ogic pH. V. This report.
D. B, Nevius, Am. J. Clin, PPth. - 39, 38 (1963).
If, E. Coulter, presented at the National Electronics
Coni erence, Chicago, Illinois (October 1956) . I. U. Boono and S. H, Cox, permn8l communication, Lo8
scientific Laboratory (1982) .
1 0 5 5 7 2 5 I -352-
E l e C t r O A i C Yaaeuremont of C e l l u l a r Volumes. V, Change IA Rad Blood C e l l 8 Ro8ulting from Non-Phy8iologic pH (C. C.
N. J. Ba8mann) LU.hbrUgh, E. Ce hder6011, H a I. 16me1, D. B m Hale, and
INTRODUCTION - Brecher et 01. (1) have shown r ecen t ly us ing t h e Coulter
counter that 0.9 per cent s a l i n e causes a n apparent Increase
in red cell voluppa when compared wi th measurements made in
plasma o r Eagle's solut ion. The u n a v a i l a b i l i t y of large ln-
expensive q u a n t i t i e s of specific plasma and t h e d i f f i c u l t i e s
involved i n making s o l u t i o n s rou t ine ly with as many d l f f e r e n t
sa l ts as contained I n Eagle's formula led u s t o look for a
cause f o r t h i s volume inc rease which might be con t ro l l ed when
us ing physfologic s a l i n e so t h a t t he " t rue size" of RBC could
be ca lcu la t ed from e l e c t r o n i c determinat ions of RBC volume
d i s t r i b u t i o n prof i les (1J2). Since 1867, when Schmidt (3)
and l a te r Nasee (4) described increase in RBC volume i n serum
under increased % tension, a r e l a t i o n s h i p between RBC size
and pH of t he suspending medium has been known t o e x i s t (5).
Although no recent s t u d i e s have been made of t h i s phenomenon,
it is genera l ly accepted t h a t RBC swell ing can r e s u l t from
changes in osmotic pressure r e s u l t i n g from pH changes
e x t e r i o r t o t h e c a t i o n impermeable membrane of t h e cel l (6,7).
1 0 5 5 1 2 b -253-
Commercially a v a i l a b l e s a l i n e is unbuffered and q u i t e
v r r i a b l o i n pcI, ranging usua l ly from 5.8 t o 6.0.
storage produces a pH as low as 4.0.
ba buffered to a desired pH without changing Its i s o t o n i c i t y
or conduc t iv i ty by appropriate amounts of phocrphate buffer.
A study of the effect of pH on RBC volumes measured elec-
t r o n i c a l l y was made us ing t h i s bu f fe r ing system and commer-
c i a l ly a v a i l a b l e sa l ine . In t h i s study, ind iv idua l blood
samples from 20 mice and 20 men were counted and sized elec-
t r o n i c a l l y i n 0.9 per cen t s a l i n e s o l u t i o n s a t 6.0 , 6.5, 7.0,
and 7.5 pH. The mean cel l volume (MCV) a t these pH's was
determined a s t h e mean analyzer channel (Ych) by i n t e g r a t i n g
t h e volume d i s t r i b u t i o n prof i les of RBC volumes measured
e l e c t r o n i c a l l y (2). In order to determine whether a p e r t u r e
c u r r e n t ( A N ) s e t t i n g s and ampl i f ica t ion (g) of t h e pu l ses
modify change in apparent volume, t h e mice were measured
e l e c t r o n i c a l l y a t ApC VIII, g 2, and t h e men a t both ApC VII,
g 1, and ApC V, g 4.
Prolonged
Sa l ine , however, can
The r e s u l t i n g data are shown in Table 1.
Figure 1 shows t h e best f i t l i n e f o r these po in t s plot ted as
t h e logarithm of t h e mean channel number of t h e mean RBC
volume ve r sus t h e pH of the s a l i n e used i n t h e determina-
t i ons . The data show that, over t h e pH range inves t iga ted ,
change i a RBC volume O C C U ~ Z I a8 .m exponent ia l func t ion of
1 0 5 5 1 2 1 -254-
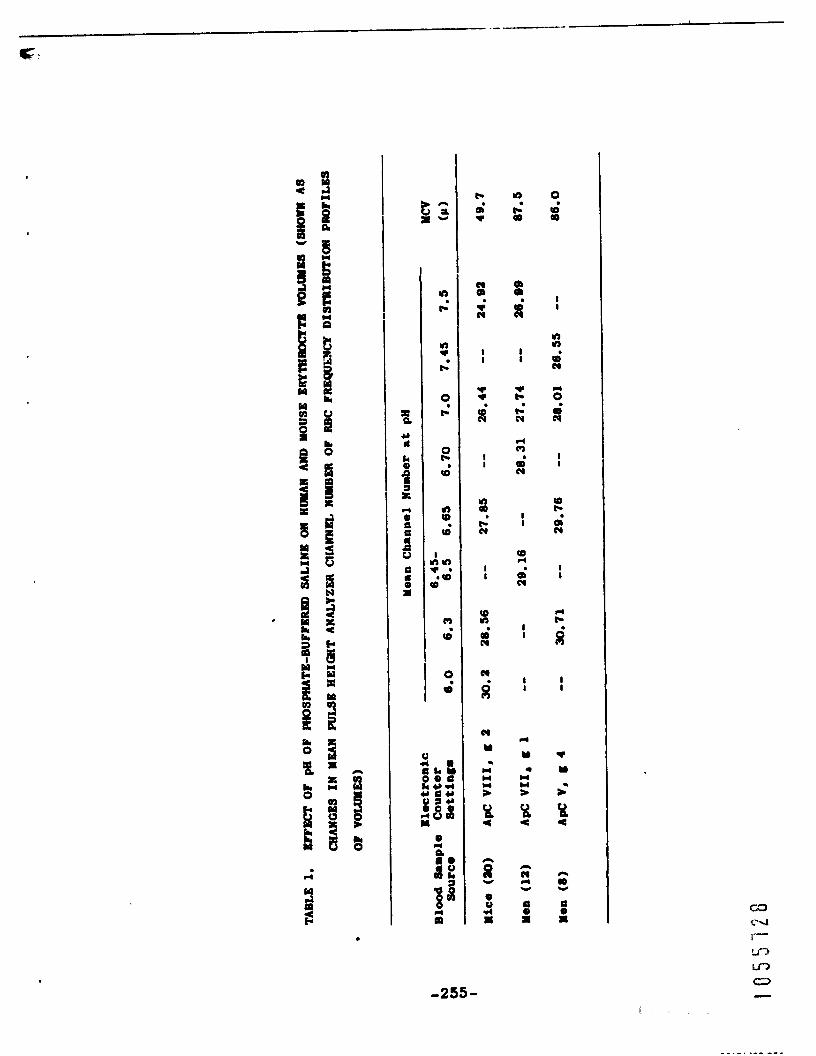
.-
C-
oo a c
8 B
Y 0
d
6il ' a p1 L
4 i H
.
-255-
0
r- QD
.
0 0
d I I
w l-
r- N
A (3
QD (0
. 0
I I
5 . 0 N
I I
I 1
r(
Y
U U > % *
n PI r( Y
9 I
0 . 3
I I
r, ua
N
d
rd
0
i I I
CD r-
cy 0'
I I
r( r-
d I I
., Y
> .L
P <
n a Y
a 0 I
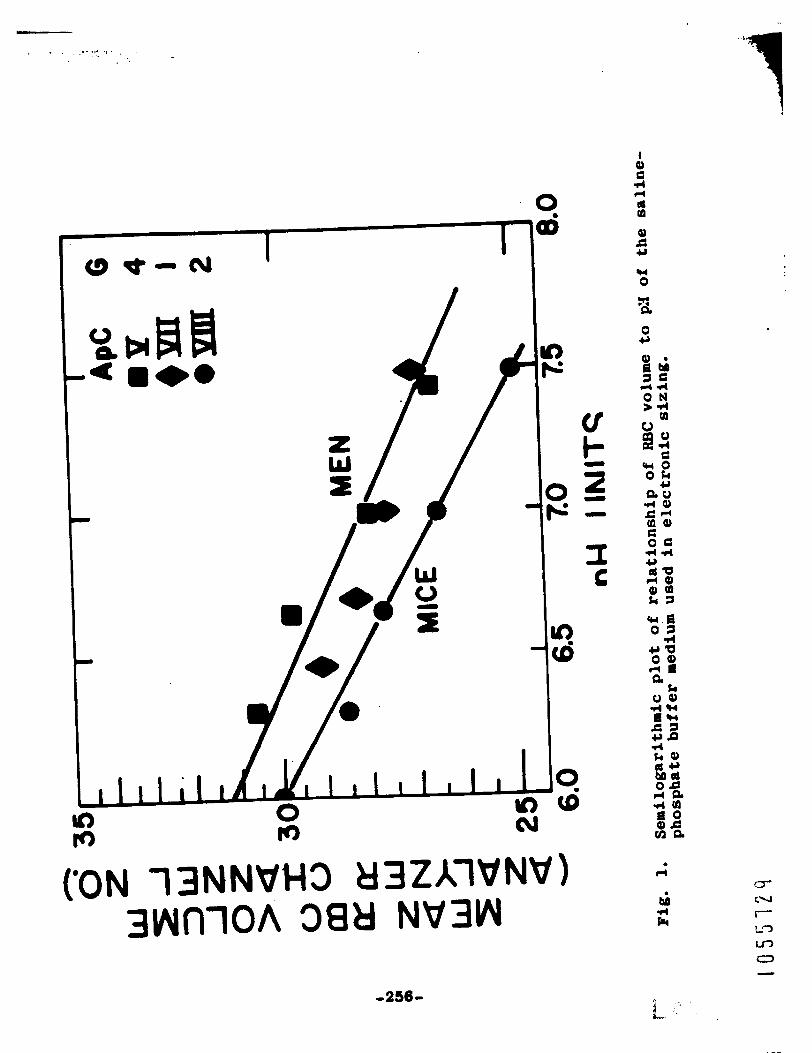
- . . .. ... ., . . . . -
I e d - W 1 0 0
-256-
chango in pH of t he m l h o so lu t ion 8u8panding t b u .
rml r t ion rh lp between RBC and pE of the nr8ponding mediur
i n p l i e s t h a t there I s no 8lngle lltruel* size of RBC; hurrn
RBC in a C i d O 8 i 8 ( 4 7 . 3 5 pH) are l a r g e r than t h e 8 u e RBC In
normal arterial blood (7,4 pg), and mamrerentr of RlBC
Tbi8
volumo 8 U 8 t be referred t o 6010 ~taadrrd Set Of conditlonm.
The actual aoamwaaent, however, could be u d e under s o m e
condi t ion of pH o t h e r than t h e **stand8rd1* If the appropriate
mathematical co r rec t ion for pB was known. Also, such 8
cor rec t ion factor f o r counting so lu t ions adequately buffered
a t the pII of human venous blood are needed, becau8e blood
sample8 open t o t h e air change pH a t t h e rate of 0.2 pH o r
more per hour and are, therefore, not measured in v i t r o a t
their in vivo pcI,
change in volume of RBC, as lnd lc r t ed by t h e channel nurber
The figure shows that t h e fraction81
(Ch) , l e proport ional t o t h e change i n pH; tha t is,
ACh
ch - It . AM.
(On a logarithmic scale, a conatant fractional decrement,
Acb/Ch, appear8 a8 a constant a b m l u t o change,) The con-
s t a n t (k) can be evaluated by sub8 t i tu t ing numerical value#
for t h e o the r parameters i n this equ8tion. [Note, however,
that t h e equat ion I s really ooly t h e d i f f e r e n t l a 1 form of
t h e exac t exponent ia l funct ion 8nd can be uaed am an
I O 5 5 1 3 0 -257-
I
-11 ( ~ , o , , ov8r tho rang0 to which 1 - X 18 8 good 8pprox-
-tion for
VolUN churec, i8 25/31 or 0.81, and th8 ap-irrtion i8
For tho tot81 r r r r p .horn i n Pig, 1, tho
good t o 2,s par coat.]
T b 1-0 of bomt f i t dnm thFoa* tho 5 mu80 point8
r h o n volumm corre8ponding t o Ch 30.0 at pE 6.0 and 28.3 at
7.01 g % V h g 8 .lop. k = 0.1% A COrpUtOr calcul8t.d
laact 8qu-m orrpoaoati.1 f i t to tho 8- at8 grvo k - 0,123, ?Or mn, tho httU m V m k 0.106, Thi8 S lop, in-
or for tho aloctronic particla sfzo mrlpzer:
1 V - F + 0.106 (AH)
whora ApE I8 tho difforenco betwoon tho
de terdnr r t ion of the sca l ing factor and
Cb NO.,
pIl umod I n t h e
7.4. Slml l r r ly , a
scaling factor (F) determined a t SOB. pH can be corrected
in t h i s Illomor t o tbrt for any other pH.
Since it I 8 -till t rue , a8 Fonder (S) pointed out In
lS48, tbt "no one knows what ought t o be taken au tho Iso-
electric point of t h e mixture of substances which en ter In to
the 8rchltecture of t h e erythrocyte, nor is enough known
about the swel l ing of anisotropic and elastic materials In
t h e neighborhood of t h e i r Isoelectric points," the choice
of pE of t h e s a l i n e solut ion used In s iz ing RBC would 8eem
t o depend OB t h e preferences and bIrae8 of t h e invest igator ,
The factor for change In RBC volume due t o pH, as determined
here, would al low interconversion of t h e data of o the r s t o
a ,s t8nd8rd or any other pH.
SUMMARY
The reported lnCre88ed stze of erythrocytes surrlysnded
in SrliOe I s due to an effect of t h e low pH of unbuffered
u l i n e 8olu t lons conmonly used i n e l ec t ron ic particle
counters. Th i s Increase i n size was found t o occur exponen-
t I 8 l l y w i t h decrease In pH and t o be 10.6 and 12.5 per cent
per pIi u n i t below 7.4 for aan and mouse, respectively.
1 0 5 5 1 3 2 -259-

. . . ' -.. - . ,. . . .. . . . . <-- . ,
. -
1 0 5 5 1 3 3 -260-
Electronic Yomurrmnt of C e l l u l u Volum8, V I , Sloc t ronic Improvuont of Coultor Countor Ro8olution (C. C. Luahbaugh, Ne J. BI.UM, 8a 0, 8. -10)
INTRODUCTI-
Resolution of anergy spec t r a depend8 upon r c c u r a t e meam-
urement of pulrre height voltage.
Xubitechek (1), r a r a l u t i o n by t h e Coulter counter i 8 not
m u h u m 8ince t h e c i r c u i t r y and apprrrtus were dealgnad pri-
mari ly for rapid enumeratfon of pulse8 rather thm voltage
me8mrement. In order t o mininrize coincidence loss due t o
2 or more particles occupying t h e sizing aperture 8lmulta-
noously, t h e pore In t he hollow glass sensing probe of t h e
Coultdr counter was made r e l a t i v e l y sha l lon (e. g., t h e ap'
e r t u r e of 100 p in diameter I s only 75 p i n depth),
l ength of t i m e a prrtfcle renubins In t h e electrical f i e l d of
tho aperture is shortened f u r t h e r by t h e r a p i d i t y wfth which
tho su8pending molution 28 dram through it,
A 6 first pointed ou t by
The
The rt80 ti.,
Of p u 1 S O S gOner8ted particle8 38 CO~p838t%VOly 8 1 0 W i n
r e l a t i o n t o their v e l o c i t y through the pore. Lengthening
t h e g r t i n g Interval of t h e pulse height analyzer does not
correct the tendency for t h i s mystem t o report loner than
a c t u a l height of the pulses, alnce t h e particle o f t e n pa8808
through t h e s e n a i t l v e volume of so lu t ion in t h e ape r tu re
before the pulse has t i m e t o reach Its full height, To
1 0 5 5 1 3 4 -261-
C O r p l i C a t . tho 8Mlvmi8 further, a l l weiC1.8 do not
through tho r p o r t u l u a t tha 8- V a l O d t t 8 b c e # a8 $8 w e l l
horn, f l u i d POVOH mora mlowly a t tho p.ripb.ry of 8 8 t r O a r
than in i t8 center. ~8 a rerult o i thim phonomonon8 the
W18.S Of tho 8;lOW.r rOV* m I C 1 . S 8 r O 8iZcsd 1IYIra ac-
c u r r t o l f thrn thorn. from tho oms with g r e a t o r ve loc i ty in
t h e c e n t r a l core.
Improoount l o roaolu t lon might bo expected with thim
8pparatua, thueiore, by mj mochaaln that prolongs the
8izing I n t e r v a l , Such prolonpption could bo rccorplishod
(a) 8lorfng dom the flow rate of the 8uspending so lu t ion ;
(b) iocroa8ing tho seaairrg volume by phymlcrl e longr t ion of
t h o rporture; (e) forcing a l l p r t i c l o s i n t o the slower
roving psriphaml are88 by o b 6 t m c t i n g tho c e n t r a l portion
of tha p a m u g . ; or (d) increa8ing t h e c r i t i ca l volume of tho
~ l O C t r i C 8 1 f f O l d .1?ouod the a p a r t u r s opOntng8 the us. of
groator -aperture c u r r o n t s t b n umually uwd,
Of th0.e 4 po88ibla moan. o f irproving remolution, the
uba of iocr08r.d aperture current. (ApC) I8 t echnic8 l ly the
mtap1-t and m o m t e8sIly varied.
aPpro8ch t o tho problem i r t o be found in the recently
rqM3rt.d work of Brechor et al, (2) th8 t show. that frequency
dimt t ibu t ion curvem of IUBC volur .8 In a s i n g l e blood sample
.how one modo at low ApC rad two modo8 a t high onem.
Sore foundation for thi8
Brmcher

corrcludod that t h e appearance of the ucond -1 froquancy
pork -8 duo to 8 ch8ngo kn RBC size c8usod by t h e higher
electrical currant 8.
Another i n t a r p r o t r t l o a of t h i s finding may bo that t h e
higher curront8 onable botter re8olut ion of pul8e he ights u)
that Urge BBC -0 ma8~~red more a c c u r r t e l y and resolved
from the w r e nuaarous smaller RBC. The presence of such a
la rgo but u o r o ~ l v o d subpopulation of large RBC i n tho a h a
d i 8 t r i b u t i o n cum08 of human EZBC wa8 suggested by Lushbaugh
e* al. (3) from 8 mathematical a n a l y s i s of t h e curves based
on t h o prosonce of 2 easily resolved subpopulations i n t h e
blood of birds. Since then, b io log ica l evidence f o r t h e
pre8eace .of a volumetr ical ly defined subpopulation of young
RBC i n mm818, a8 w e l l as in birds, amphibia, reptiles, and
f i sh , ha8 been obtained (4,5), which makes Improvement of
t h e r e s o l u t i o n of t h e Coulter counter p u l s e s with human blood
q u i t e d08irable.'
YEI'EODS AND RESULTS
Erroneou8 Sizing C8uaed by Coincidence
In the f i r a t series of experiaent8, the pos8 ib i l i t y wa8
lnvas t ig8 ted t h 8 t the second or larger volumed population
. (**BVm) of RBC wa8 f i c t i t i o u s and due t o doubling by coincidence.
This p o 8 s l b i l l t y gained support from t h e fact t h a t t h e mode
-263-

. . i . .. . . ..
of tho 'rgcc popul8tfon of bird8 n 8 a l r o e e u c t l y t r l c o th.t
of population **A," 8lthougb only 1.7 t-08 a8 Urge in ma.
Figuro 1 ahow8 the remalt obt8ln.d rhon tho blood of -11 bird8 warn reamred a t tha mau oloctronic w t t i n g . th8t
failod to remolvo t w o modal poab in t h o blood of man. A l -
though the concontr8tion of Rgc in both c8-a wa8 the 8 ~ 0 ,
tho two population8 n f o easily doflnod I n tho bird at ApC V,
g 4, ApD 100, pa 6.7 (tho common ro t t l ng8) but not In u n .
Obvlou8ly, If tho 1.rg.r rod81 peak wa8 duo t o colncldenco,
it mhould havo b n found with both blood urplea, Figuro 2
8 b W 8 b a 8U8pOn810n of 18t.X p.rtIc108, which a r o knom t o
C O l r l l i 8 t 8-e O n t i r O l Y Of mnodi.p0?8od p8rtiC1.8 but a160
containing boubletm, triplot. , otc., due t o r g g l u t i l u t l o n ,
th8t 8 p ~ O ~ i 8 t O ApC Cm rerolro w8k8 W i t h doubling rod.1-
i t ies , mi8 figuro 8180 8howm how t h o l r apparent f r ~ u e a c y
C 8 a be h C r O 8 8 . d by ch8nglng tho readout 8~a1. of t ho pul80
height analyzer memory break,
di8trlbution curve. of RBC by coincidance of particle. by
Attmptm to chango t h o frequoncy
InCra8&n(l tho WOfO Un8UCCOm8fUl b O C 8 U 8 8 Of t h e 8p-r-
en t i n a b i l i t y o f t h e Coulter couator amplifier c i r c u i t r y to
feed proper sized pulse8 t o t h a ra8lyeec a t t h e c o u n t b g ratom
uaed.
In tho sacond 8orle8 of uporImont8, RBC of difforont
modal volumo8 obtainod from difforont p r t i e n t 8 woro uud, In
08ch experiment, tho blood of two por80a8 warn 8iz.d 8ep8r8toly
f 0 5 5 1 3 i -264-
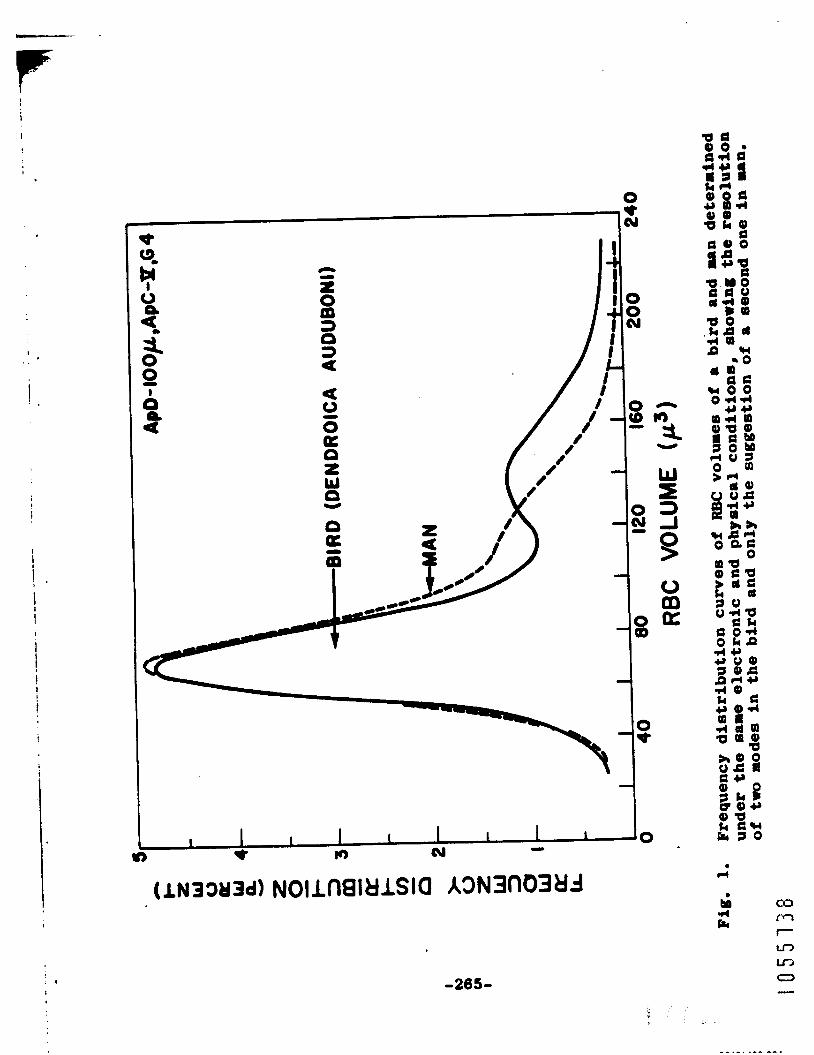
I
I
. . I
0 t cu
I
-265-
t
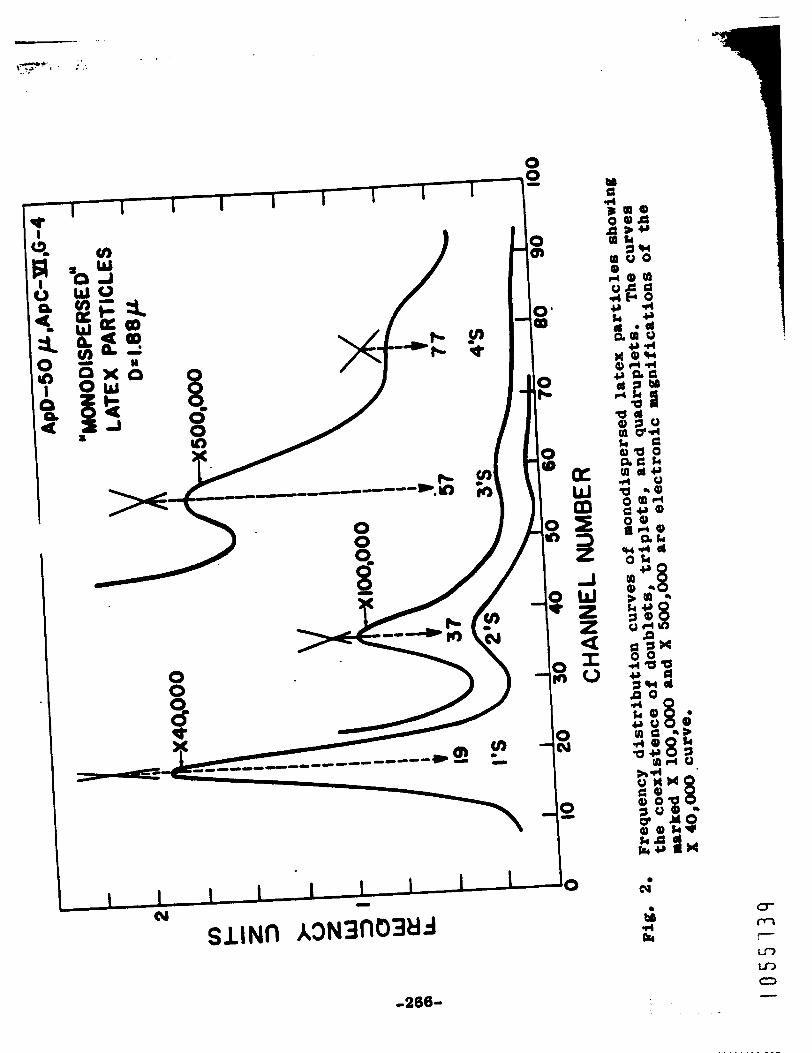
0
IG I 1 1 I I 1 1 I
cy
-286-
a t tho 89r.co.1Hnd.d8v lor ApC and g (3) 8d .gain a t tho hlgh-
,
bunan blood, Tbe t w o frequency d i r t r i b u t i o n curvor that
r e s u l t a d were then m t e d , a8 with t he 8haded curvam of
the blood of erch person w 8 8 then combined in v i t r o and
atspended in t h e saline so lu t ion and analyzed. The remlt-
ing d i 8 t r i b u t i o n of RBC volues was then pr in ted out mechan-
ically upon t h e graph,
hand graph8 in Fig. 3 rhow t h e exce l l en t corre8pondanca of
t h e predicted and experimentally obt8ined curve8. Compar-
ison of the curve8 obt8lned wi th t h e d i f f e r e n t e l a c t r o a i c
s e t t i n g s shows quite w e l l the better r e s o l u t i o n of t h e modal
peaks obtained wi th t h e higher ApC,
The mall open circles on t he r igh t -
DISCUSSION AND CONCLUSIOSS
These renrlt8 seem to show that ro .o lu t ion of pulror
iron RBC prreming through the searing ape r tu re of the Coultar
counter i s Improved by i n c r e r r i a g the ApC appropriately,
i n d i c a t e that t h e appearance of double ItBC population8 do08
not r e s u l t from enlargement of RBC due t o excessive elrc-
t r lcal cu r ren t nor coincident pile-up. The conclu8ioa would
meem warranted t h a t t h e presence of a second subpogulation
They
i !
i . I -267-
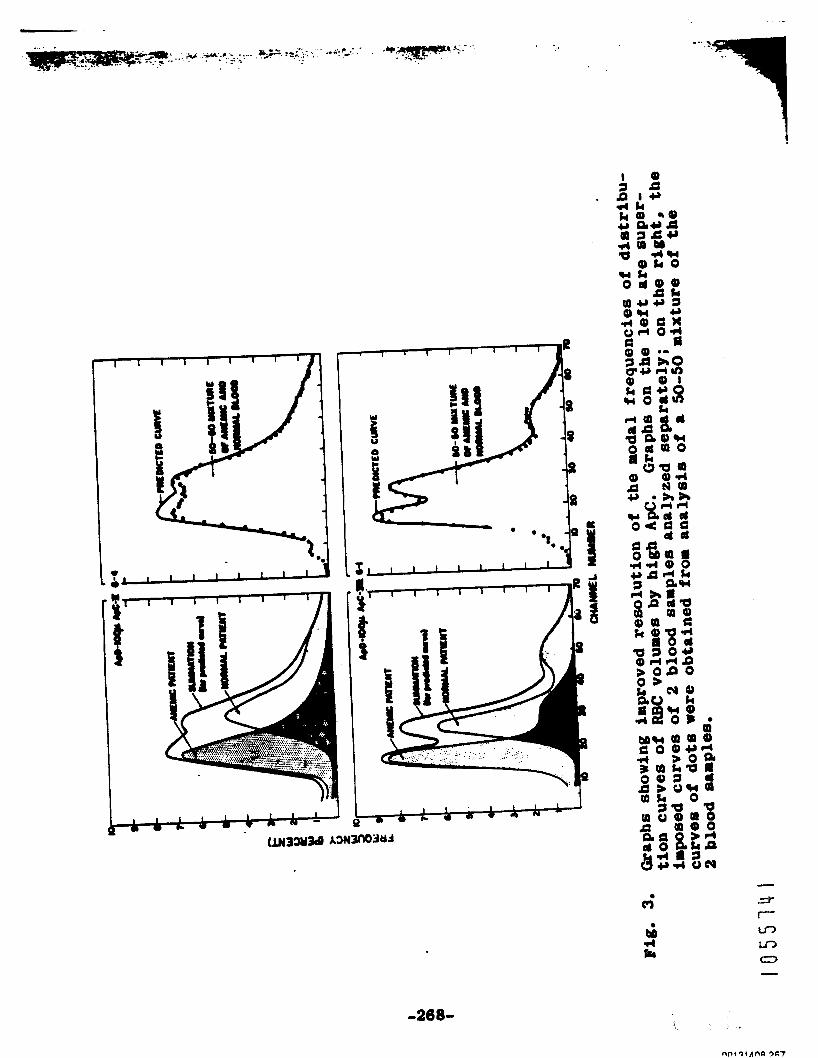
L _ .
of B8c0 romolvrble from another population of mllu modal
8 i Z O but -0 au8erouo indiVIdurl8, A 8 Bot duo to an mtifwt
of tbe t.chnIquo~ of meamrament, Thl6 coaclu8lon recelvea
further 8Uppoe fa the folloring 8tUdy, which C h r 8 C t . r i Z . 8
the "8" pogulrtion as new and young RBC,
The Increaued remlut lon obtainod hero with incru8.d
rperture current would been to encourrge a search for other
meam of improving pulme generation 60 that RBC voluma 8nd
pUl80 height have a more reliable constmt reht ionsh ip ,
(1 ) E, E, lCubit.chok, R8808rch (London) -8 13 128 (1980).
(2) 0. Brocher, E. F. Jakoblec, Y. A. Schnelderun, 0, 2,
Will iauJ 8nd P. J. Schridt, b. N. Y. Acad. SCI, 99,
242 (1962).
(3) C, C. LU8hb8Ue0 No J, Ba-nn, and B. Gl88cmk, B1-d
- 20, 241 (1962).
(4)
( 5 ) C, C, LU8hbaugh and E, S, Ru888ll, t h i o report, p. 279,
C, C, Lu8hbugh and D. 8. Hale0 thim row-, p. 270.
llloctronie M a . p r c l w a t of Collu- V o l l . VII, Bio low
Ikd Blood C a l l 8 (C, C, k.hbru* 8 d 0. B. -10)
Ihrib.rrc0 for rn V o l l m a t r i c r l l ~ D i 8 t i a c t mlbpoprr UtiOn8 Of
Soar, bialogkc rupport warn roport.6 prwioualy (1) m b w W
ing thrt it warn po88iblo to do8troy rod blood call8 around
tho modo of populitfon *'Av1 and t o le8vo 8 8ubpopul8tion of
rrrgonln-ro8i.trnt rod blood c o l l 8 around tho l o c u m of t ho
u t h o u t i c r l l ~ prodict.6 =do of popul8tion *'B.tt
malt. wore obt8in.d in tho blood of pun0 88 r o l l 88 in bird8
rhoro t h o Wt popubtiorr doe8 not roquire ~ 8 t h o u t i c 8 l d i f -
fo ron t i a t ion a t aperture curren t V and gain s o t t i n g 4,
The80 re-
Tho pre8oat 8tudy repor t8 the rcbfinnent of there ob8erv8-
taon8 by tho b e t t o r reaolu t lon obtrined by ApC V I X O g 1 (2)
8nd by t h o u80 of Po"80, 88 a hemoglobin label in newly
produced RBC,
A 8 . h t h o previou8 8tudy, incrnont8 of a 1:lOO saponin
8olution wefo addod t o m8penrion8 of h u m and rabbit IIBC
that were thon 8iz.d e lec t ron ica l ly , In order t o ident i fy
n8Wlp f o r u d RBC, . t ho r8bbi t8 refa l r b l o d w i t h F.s" (10.3 pc
59 Fe /pg Fo) am ?omq lntravenoualy 3 day8 previou8ly, Tho
r o m l t i a g ch8ngoa fn t h e dietribtation of c e l l u l a r volumoa rere

then rolrted graphicelly t o orponin concentrat ion 80 th8t tho
effect on 0.1 rl of blood of 1.0, 1.2, 1.4, 1.6, 1.8, and
2.0 rl of 1:lOO saponin made up t o 4.9 rl with s a l i n e could
be determined. The hemolytic des t ruc t ion warn stopped after
1-1/2 mAnute8 by (a) d i l u t i o n of 0.0s rl a l i q u o t t o 100 rl
for volumetric analysis, and (b) 3-minute cen t r i fuga t ion of
t he reaainder. One-ml aliquot8 of t h e mapernatant so lu t ion
after cen t r i fuga t ion were then analyzed rp.ctrophotorretricrlly
for hemoglobin content using cyanorethemaglobin, 8nd moth02
1 - m l rllquot wa8 analyzed in a No1 (T l ) cry8tal-rrll photo-
spectrometer f o r Febg content . RESULTS
Tbe r e s u l t s of there experimntm are shown graphically
h Figr. 1, 2, 3, rnd 4.
the h s a o l y t l c effect of saponin i 8 dependent upon the saponin
concent r r t ion m d tire of re rc t ion .
Figures 1 and 2 d e m n 8 t r a t e that
They 8180 .how t h a t t h e
VOluplO d i 8 t r i b u t i o n CUIVOs are 6hif t .d p r o g r @ 8 8 & V O l y t o the
r ight (18rge volumed RBC) as increa8ingly larger RBC are
do8troy.d 8ucce88ively.
t i o n "A" 8re de8tropd first and then tho80 of population "Bt8
are progres8ivelp hemolyzed. In Fig.. 3 and 4, t h e frequency
d i s t r i b u t i o n curve of rabbit RBC h88 been related to the
saponin concentrat ion that was required t o destroy a l l r abb i t
A6 t he remlt, t h o cell8 of populr-
-271-
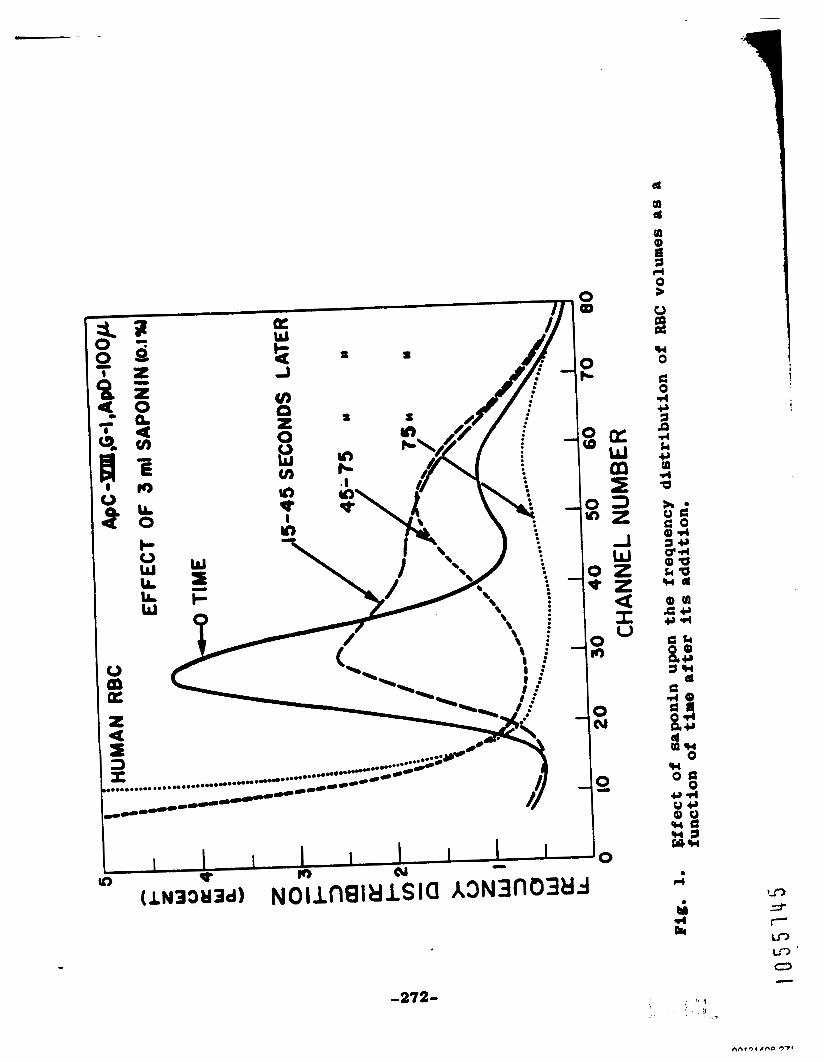
f
-272-
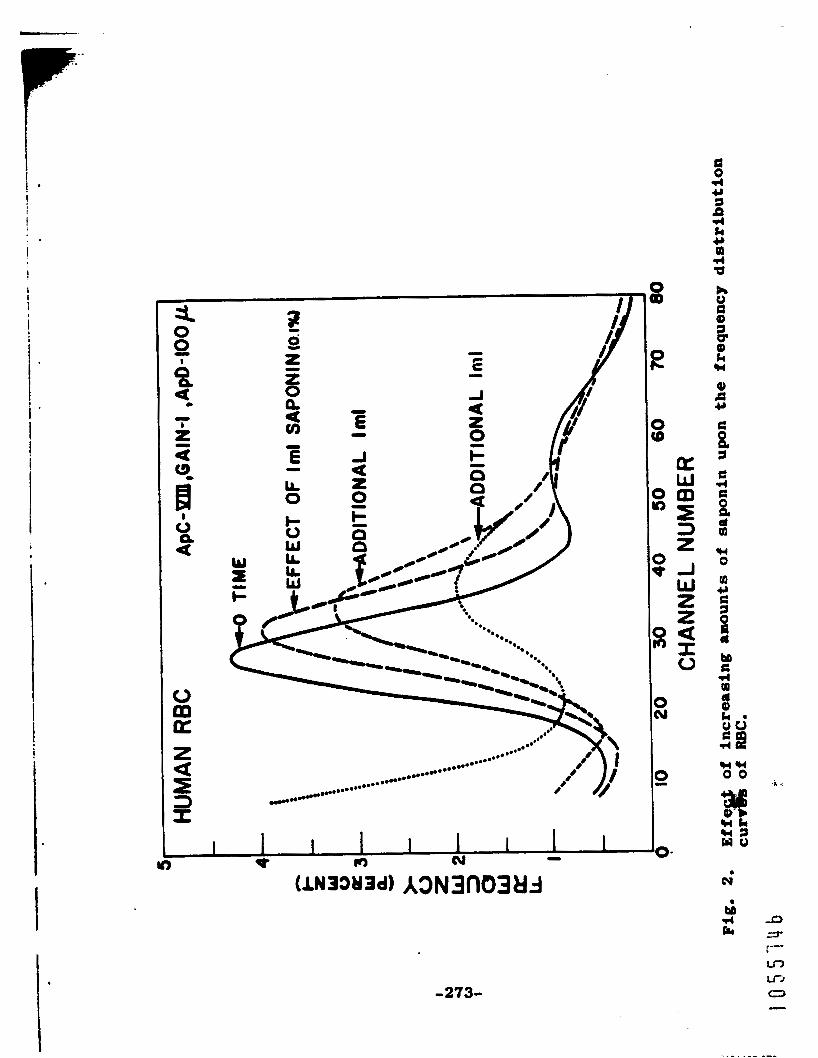
i
4) P Y
B 7 e 4 a
d W
U 0 W Y fi 7 0 P a M fi .r( W d 0) k
8l
03 :a
a (Y
-273-
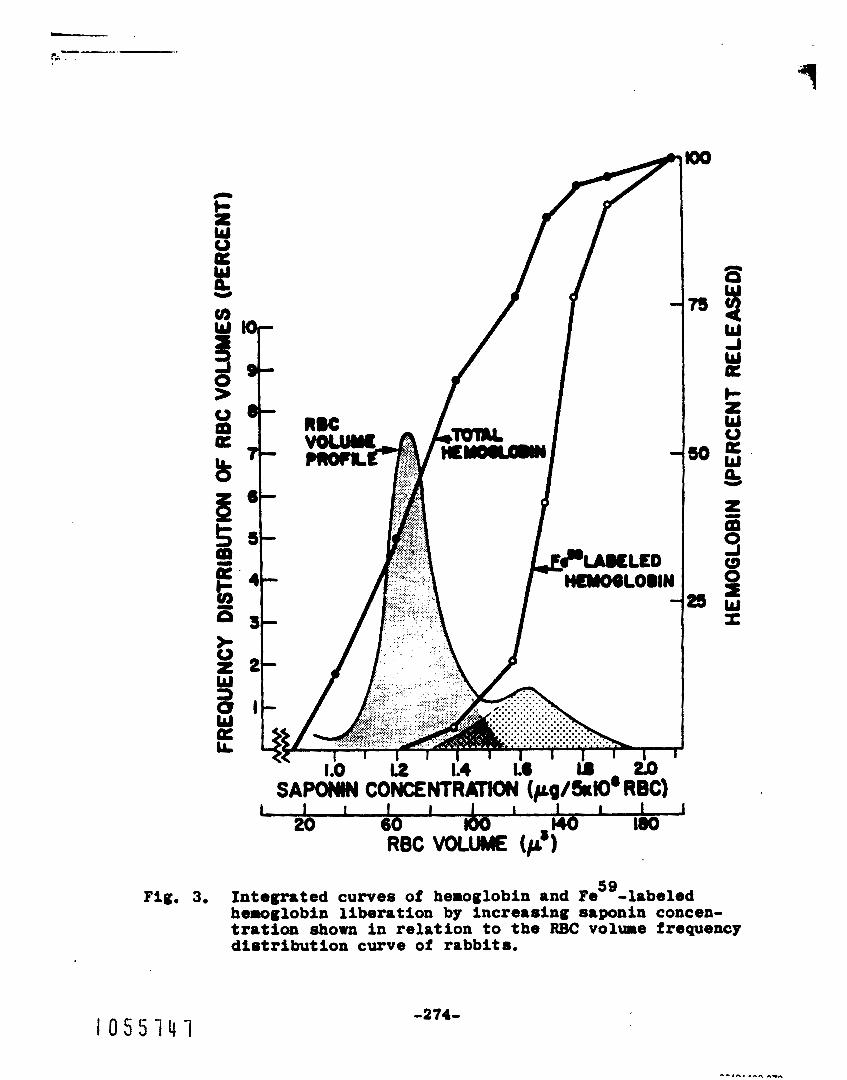
4
Integrated curves of hemoglobin and Fes9-labeled hemoglobin l iberation by increasing saponin concen- tration shown in re lat ion to the RBC volume frequency dis tr ibut ion curve of rabbits.
-274-

. .... f I ' i
I '
t
f tu557128 I i
a 0 +
1 I I I I I I I I I ieo I
I %c *!w @ 4 i
Fig. 4. Dlfferenti8ted 8rount8 of hemoglobin and FeS9-1akl.d hemoglobin l iberated by increasing uponin concentra- t i o n In r e l a t i o n to th8 REC voluae frmquencp distribu- t ion curve of rabbits.
-275- . .
.-^ .
tho ineraeat8 of aaporrin aro &om.
rhorr i n ?i(. 4 but u o .horn am tho biiforcwti.1 llouIIt of
h a o g l o b i a u u l d9 1ib.rat.d. cuxvom -0 dimmiri1.t aud di .ra.ocirtd; tho lugo8t m u n t
of h w g l o b i n -8 ualabolad and rcbl0aa.d by de8tructioo of
polpolrtion **A,** 8nd the l u g i 8 t urount of ?as' labolod
haoglobfrr wa8 obtainad
1-w #id0 of popul8tion l*B.t*
Tbe uw data 8fo
Tho hnoglobin a d d'
do8truction of tho c o l l 8 froo tho
DISCUSSIOII
. Tho80 upuiroat8 domonrtrato tbat tho mll BIK: o f
than tho l.r(c. om8 of population (9" and that tho populatfoa
though tho -.L *voldn md **youngN right - mafficiently
i
hemoglobin relea8ed by saponin destruction of t h e two a b -
popul r t ion8 of RBC was unlabeled when only t h e 8amller
880 and docram i o 8ize. Furth.rrora, tho .1tl8toaco of two
dimtinct m o d a l froquonciem in tho d i s t r i b u t i o n of tho u t u r o
and -ture RBC would seem t o f n d i c r t o th8t t h e procoss of
RBC maturation is s i g n i f i c a n t l y shorter in dura t ion than the
n t u r o l i fe of t h o RBC.
hydrazine poimoaod rabbit. appear t o .how th8t tho t i r o
Involved in t h i s volumetric change t o mature 8120 is about
half of the r ibbi t RBC l i f e 8 p n .
Exporirontr in progre.8 w i t h phenyl-
found in tho larger voluaod RBC of population %*' Tho80
f Indings rro consldered biologic evidence for the ex$8tonco i I
o f two d i 8 t i n c t 8~bpopul8tiOn8 of RBC 8nd for tho belief tbt
th8 birodrl frequency d i s t r i b u t i o n curve of RBC volumes ob-
1 1 0 5 5 1 5 0 -277-
rnd t h o o l o c t r o p h o r e t i c r l l y diffu8. homoglobin p a t t o r a changer
t o t h o " 8 b g l e " typo of normal r i c o , Thur, t h o cur0 of t h e
8 n n i . appoum t o rorult f r o m t h o a c t u a l roplacamont of t h e
a chaage in the macrocytic cell8 of t h o ho8t.
In orde r to obkia additional 8upprt f o r t h i 8 conclurion
rnd t o doterrin. rbothor u c M c y t i c WWv ICBC continuo t o bo
producod irr chhmric k p l 8 a t . d U++/rrv de@, tho d i8 t r ibu -
chhmric 8 n h a l r us-g t h o cell volurr, 8n817Z.r 8y8t . r dottirod
for t h o Coulter countor In fro8 A b o s (3). F i r r t , t h e blood
From tho Rouroo B, J8Ck80n Memorial Laboratos7, Bar Harbor, * Maine,
1 0 5 5 1 5 2 -219-
.I
! ' i!
i
I .
following laplantation in ordor t o drt.rriru tho t h o re= -rad fos tho Implaat t o .uccoOd or t o fril. Th. d c 0 WOro
n 8 dilutod t o 1 : 1 , ~ , o o O and 8u8pomd.d in 0.9 par coot 88lino buiforod at pE 6.0. Tho C o u l t u count- (Modo1 A) 8attiaga
w a r 0 ApC VIII, g 2, for which tho waling factor for convor-
RISSULTS
Tho r o w l t n of thorn rtudi.8 (?%go 1) 8hond that tha
blood from both tho .nomic and n o m 2 rico had 8 b-1
curve of IlBc voltm08 a8 prOViOU817 domibod (4). Tho IUC- CftO818, 88 r i g h t b0 UrntOd, -8 8-m t h i 8 e h o d a8 IC
dinplrcomont of tho tun p o p u h t i m i t o tho rigbt of Urga
volumo.
indicat.4 frplant faAl-, tho B#: roluro8 did not docroa8o
(Fig. lo), -10 tho volun8 woro rlmrf idonticrl wlth tho
-1 vo lun d&8trikrtiOn *on tho i rpl .nt n 8 . uccoufu l
In tho- mica 2a which tho homglobin phttorn hrd
(FtSo Id).
The romltm OS tho mocond urg.ari.l.nt (?%go 3) rh0r.d
1 0 5 5 - 1 5 3
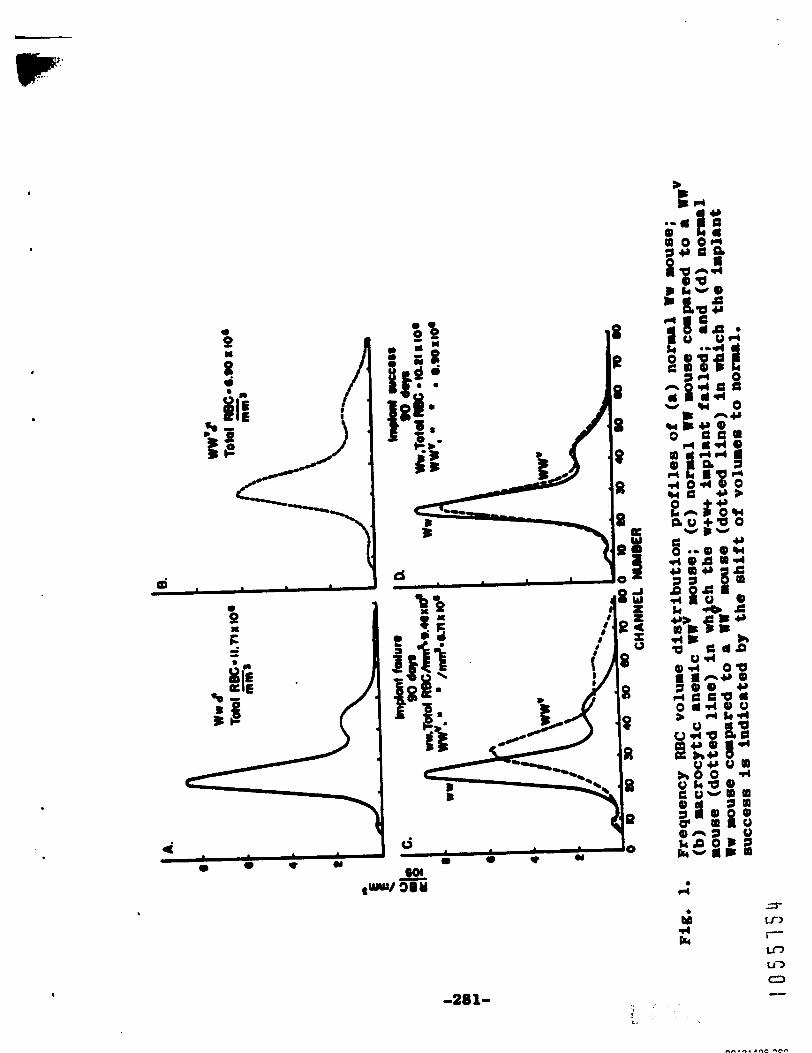
I -281- i

!
:. . . . .
I i I I 1 I I I - I I I I
/- /-
/ / I
I-& I & .1.
-203-
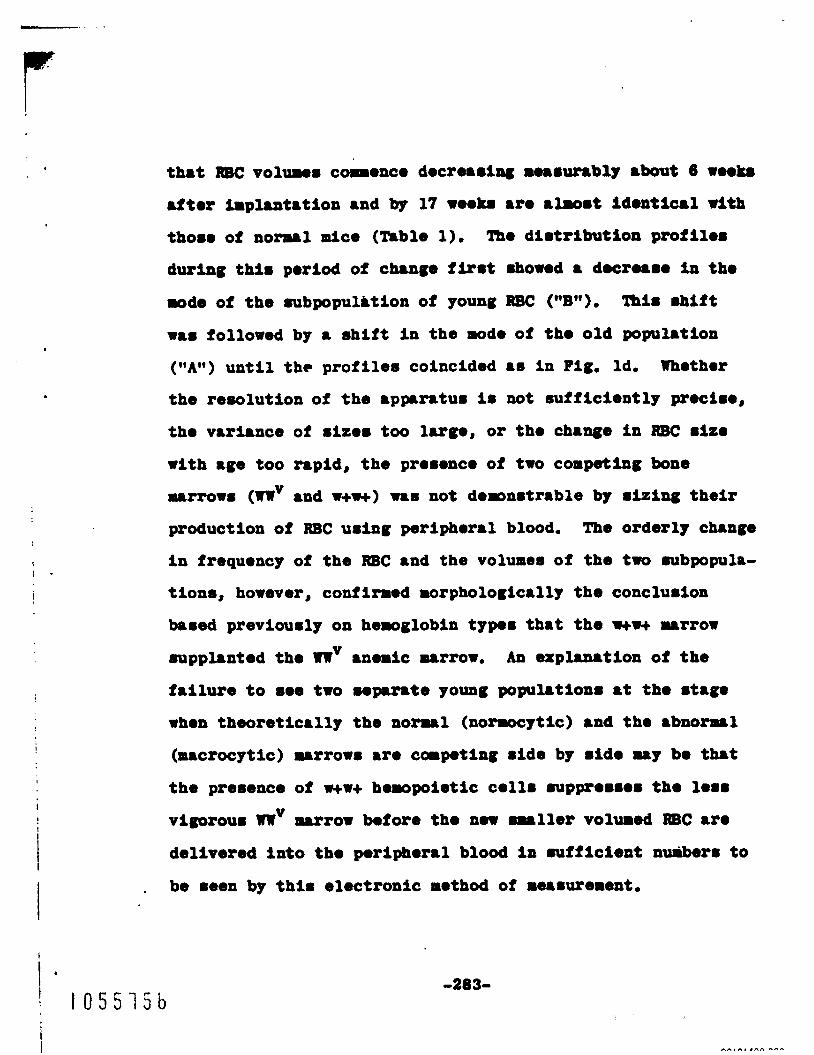
! I -
!
I
t ha t RBC voluwm COOO~CO docrn8lag w88urably about 6 woo&
aftor irplrcrrtatlon and by 17 wookm aro aln0.t idmatical with
tho.. of n o m 1 mlce (Ikble 1). Tho d i 8 t r l b u t l o n profil.8
during: tu8 porlod of change f i r & 8how.d 8 de~r0880 ln tho
rode of t h e mbpopul i t ion of young RBC ("8"). mi8 8 h i f t
was followed by a s h i f t i n t h e mode of tho old population
(**A") u n t i l t h e p r o f i l e s coincided 8s i n Fig, Id, m o t h e r
t h e r e so lu t ion of t h e 8 p p m t U 8 18 !lot I%UffiC%Ontly P r O C I 8 0 ,
t h e v r r i r n c e of sizom too large, or t h o change in Rsc 8128
with age too rapid, t h e prosonce of two competing bone
U r ' C O 1 8 (WV and w+W) -8 not dOmn8tr8ble by 8iZlng t h e i r
production of RBC U8-g pcrriphOr81 blood. Tho orderly chmga
In frequency of t h e RBC 8nd t h e volume8 of t h e two rubpopula-
t ions, however, confirmed ~OrpholOglC8llp tho conclu8ion
based previously on hemoglobin typo8 th8 t t h e w+n m8rrow
mapplanted tho WWv anemic m a r r o w . An explanat ion of the
f81lUr0 t o 600 two H p B f . t O young popul8tiOn8 a t t h e 8t8g8
when th00re t l c8 l ly the norm81 (normocytic) 8nd the abnorm8l
(macrocytic) ~8rrow8 are c a p o t i n g ride by 8ldo may bo th8t
t h e pre8ence O f wW+ b ~ ~ p o i ~ t l c C.118 8Upp0880. tho l o r 8
vlgorou8 WWv marrow bofore tho n w e l l e r volumed =C arm
del ivered I n t o tho perlphorrl blood i n rrufflclont nuiborr t o
be 8een by t h i 8 e l e c t r o n i c method of me8surement. .
I ' l 0 5 5 7 5 b
-203-

0 0 rl a rl
0
Lc r(
a rl
0
U 0 rl Y a
7i &

T b O w firrdirrm b p l f th8t 8ft.r 8UCCO88fUl bp18nt8t im0
tho chhric blood $8 dor1v.d ontiroly from tho irplrnt ovon
though nothing n m dono u p . r i r . r r k 1 l y to damtroy the gonet-
l c r l l y dotorriaod ucrocyt lc marrow of tho homt,
(4) C, C, Lu8hb.ugh0 #. J. B8-nn0 8nd 8. G188cock0 Blood
- 20, 241 (1062).
^^.^. .^^ ^^.
HIBWCATIOMLI

( 6 ) C, C, Lu8hbaugh and It, L. &huCh, C l i n i c r r l tho o f
t h o Arm Countor in Blood Cle-~co 8tud1.8, In: AdVmc.8 in
-cor Mothodolom, V o l , - 1, ProcoodbIq. of t h o F i f t h A M U ~
SJlpomin on Tracer Methodology, held on Oct0b.r 30, 1961,
Wamhitpton, 0, C, (8 , Ib thchi ld , .de), Plonum Pt.088, #OW
York (1983), pp. 314-3250
!
I
(1) G. L. HUu8on 8nd P, C, Sanders, Cul t ivr t ion and
Slfeo Proparation of Y l r v l i r n P.riph.rrr1 Blood L.uLocyt08,
muba t t ed t o Sta in Tochnologl,
(3) C, C, Lurhbrugh 8nd D, 8. 8.18, D.teX'dMtior! Of
A b - r b b i l i t p of O r a l Radioiron In Roalth and D i 8 e a 8 0 in Y8n
. b y Wholo-Body Scint i l lomotry, t o k publi8hod in t h o Procood-
I
-287-
.. .
of Proparation Bactmirl D.orclr ibo~mcloic Acid8 (I. U, Boono
6
A list of tho bactori. from which DNA ia k i n g obt8irr.d
I
I .
I
I I
8nd ch.rrctorieod by guan lno-cy to~ ino ratio8 I8 givon In
mblo 1, To dato, 8 p p o x h B t o l y 100 rg: of DIU h8r boon ob-
t8 ined f r O m Ytcrococcum l y 8 O d O i l t i C U 8 8Dd
COLI.. Tho Y. ly80dellrtlcu8 -8 - O m i n (L twptOn-yO88t
O X t m C t , rad So W C O 8 C O I I 8 -8 Q r O m i n nUtriOnt broth.
SOmti8 W C 0 8 -
Both organ1.u were (Crown rnd aor8t.d a t roo1 tcaporr turo.
Tho c o l l 8 wore l y m d in both ln8tancem by modi- l8uryl
8 U l f a t O md tho DNA 0Xtract.d by U 8 h g a chlorofon-8lcohol
procedure similar t o th8 t demcrlbod by Y8zaur (2). Coll
l y 8 i 8 of St8phylococcur aureum ham boon 8 much mor0 d i f f i c u l t
problem. The enzyme lyzozyao h88 been used 8t pE 8 t o 10.
Yicld8 h r V 0 boon low and, 8t v08at, other method8 O f C e l l
lyrir 8 r o undor 1 n v e ~ t I q . t i o n .
Eemophllur lnfluenz80 DNA ( 8 t r o p t ~ c i n - r o a i 8 t m t ) ha8
been obtained rou t ine ly In mall q u a n t i t i e 8 by tho alcohol
p r e c l p l t 8 t l o n method for genet ic t r m m f o r u t i o n s tudier .
coll8 8re grom In 8 rixture of L.vInth.1 and Eugon broth.
The
Tho C e l l 8 are lyrod with 10 pmr cont .odium d ~ % y c h o l r t e ~
S u f f i c i e n t q u r n t l t l e 8 of DNA havo boon obt r inod from Yo 1~80-
deiktIcu8, S. ~ ~ r c e m c e n m , m d €I. influorurro f o r r o l e c u l a r
refght d e t e n l m t l o n m . Y o l e c u l u walght8 determined from
8edlmentation d8t8 In the Splnco Modo1 E cen t r i fuge a t h -
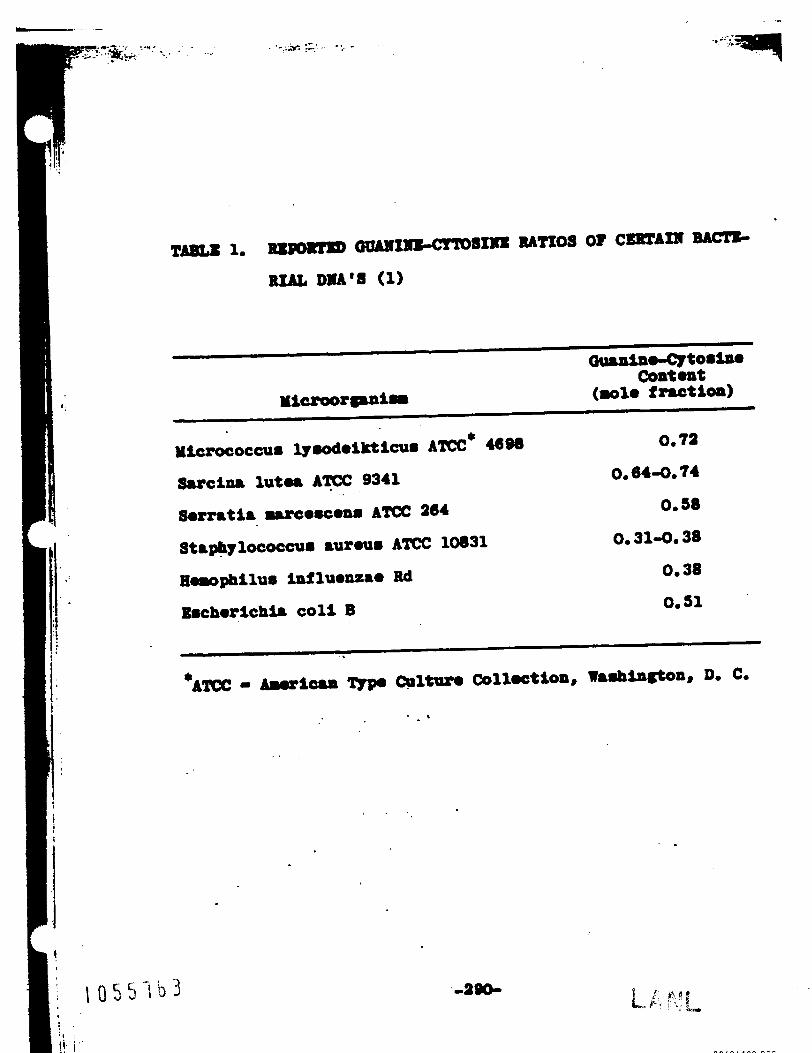
L_- -
mA frOr E8chorichi. Col i B b.8 boon obtrined C 0 8 w i n g
two nothod8 of col l lrmim for q u a n t i t 8 t i r o yi.14 8md r0l.c-
u l a r woight. The orCprr1.u woro gram tn nu t r i en t broth a t
37. C for 16 hourr. Tho bacteri. woro corrtrifut.d, -.hod,
M d resumponded i n a ro lu t ion of 0,15 Y B C 1 , 0.015 Y tri- .odium citrate, plum 0,l Y othylon.drrriaototrucot8to
(EDTA) 8t #I 8,
Irrtoly aqua1 rliquotm, On8 aliquot of c o l l murpansion wa8
ly8.d r i t h 10 per coat 8odiur d ~ c h o l r t o a t pH 10 8nd tho
other w i t h lyzozyao 81.0 a t p€I 10. -8
rap id ly 8dju8t.d t o neut r r l .
Iho c o l l 8~8pon8ioa -8 dividod i n t o 8pprox=
Aftor ly8i8, t h o
Tho DNA from 08ch 8~8poa8ion
Of lY8.d C e l l 8 W a 8 Orttr8ctOd and treated l d O B t % C 8 l l y by the
chloroform-alcohol rothod 88 provlou81y do8cribed (2), The
y io ld of DXA por g r u of r o t ro igh t of c o l l a h88d on DNA
ph08phOrU8 do ten i1u t ion8 8ad tho ~olOCu1u: Weight results
obt8in.d by tho 80diwnt8tiOn &hod aro 8hom In Table 2.
Not only -8 tho yiold of DNA lowor fro8 t ho c o l l 8 which had
boon ly8Od with lyzozym.8 but t ho ~ 1 0 ~ U l 8 r ~ ~ i g h t -8 only
half thrt of the DNA from cells l y u d wi th 10 por cent
deoxycholate.
The 1ow.r yio ld obtainod in tho l.~reoxy~o 8y8t.r could
be prrti.11~ explained on t h e b8.h of incorplote ca l l lysi8,
but the lower ro16cul8r w e i g h t obt8ln.d w i t h t h e lyeoeprs
Can m8t l i k e l p be OXpl8inOd on tho bR8i8 0% m8.0 8 C t i V i t ] r ,
-291- - i . . b , ,
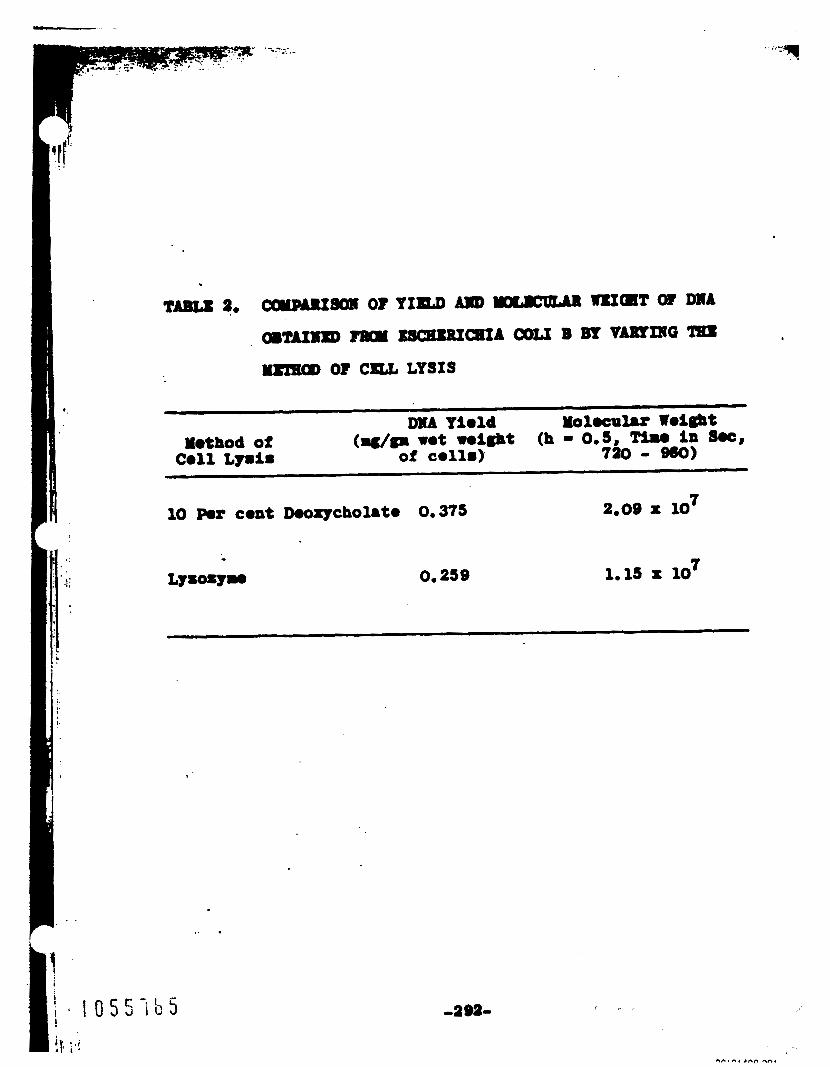
ylnBoD OF CmJi LYSIS
10 per cont Dooxycbolata 0,375 2.09 X 10‘
.. .
-2s2-

DNA from E. cal l B by a modified phon01 method (3) ha8 been
10 por cant dooxycholato In a c l t n t o - u l l n o and W T A mlu-
t lon a t ptr 10, Sodium perchlorate -8 added t o a f inal
concontratlon of 1.0 Y t o help dimmodat0 protOfn from nu-
c lo i c acid, -
Tho wholo rirtturo warn t r u t a d onto with
C h l O r O f O ~ - $ ~ 1 a1cobolJ rad tha 80-8t.d aqUOOU8 phr8@
wa8 procipltatod w i t h othyl alcohol (2). Tha praclpitatod
DIU -8 dl88olVt.d l a 8 di lu te C % t m t O - 8 8 l h a md tho m b t U r .
.halon for 25 minutom with an .qurlvoluma of phon01 a8
do8crlb.d by Handell ot rl. (9).
arat.d, and tho aqu.ou8 Wld-containing pb.80 -8 treated
with ribonuclmau, Thir -8 fo l lowd 811 addltlon81
phon01 oxtraction.
Tha two ph.808 woro mop-
The remalting DMA 8olution n8 dialyzed
-293-
. 8. tho DNA did not c l o u in
tho r0l.cul.r roigbt of tho
. dorutucation offoct8 of tho
tho ultr8cmntrifug0, 1Cith.r
DHA n e lor duo t o 8houIng or procoduro 8nd/or mow undotoctod
intorforiag 8ub8t8nco (protob, ph.001, etc,) warn p o ~ a t
in tho proparation to provont tho clmrlng of tho DXA.
rurthor 8t tnpt8 to obtain high roloculu reigbt b8ctori.l
O#A 81PO h pProme8m.
Tho 8Uthor8 aro * . iadobted to Dr, mrga B, Shophord .06
Mrm. BAllfo J , N0-d of the Yol.culur Radiobiology Soctioa
for the ro1.cul.r roight detmrrirution8,
=am- , - -
I
. ..". . - --
Purific8tioa .ad C~contrr t ion o f T 4 &ctuiom(C. on DEAB- Collulow Col- for DMA 18olation (I. 0, Boon0 8nd E. cupboll)
M8nV of tho oarliar uthodr for imol8tion rrrd purifiC8-
tioa o f T-phag.8 r8quir.d tho US. of differential corrtrifuga-
tioa a d acid precipitation techniquo8 (1).
mU88ig (2) rocontly damcribed I, mothod for purifiCStion of
T-1 and T-2 phage8 urnins thm cellulow rnion=e%chrrrgrr, rd.orb-
O a t BCTBOLA,
yield8 for imolrtion o f phage d~ribonucloic rcid (MA), a
mothod %88 h e n developod for purif ication and concontratiorr
of T-4 on DgA1FCOllulo80 rdmrbont column& Phenol-
0-ct.d T-l phrgo DNA ha8 baon propared from p h . ~ Obt8kn.d
br th i8 aothod.
Crea8.r and
"0 frcilitrto tho mothob 8nd t o Ucra880 the
. . ! i
TWO aBd C i l O - U l f Of hfflow f%1tOreO11 ( C e l i t O )
worm addod por liter of l y u t o 8ab tho ou8ponmioa f i l t o r d
On 8 Buchnor fUM.1 W i t h 8 3- t o 5-m md Of hpf lm fi1t.r-
cell covoring a #o, 3 Whatrrn f i l ter paper (1).
l y m t e was ceatrifugod a t 6OoO RR( b a Serval1 88-3 con-
triduge fo r 30 minutes.
plaquo-forrirrg uaitm/rl,
by the mtrndrrd method8 (4),
t r a t ioas in the different l y u t a fraction8 could be u d e
Tho i l l to red
me supornatant containad 1.5 x
Tho brctorioph.g’.8 woro a8say.d
E8 t lmt .8 of the pbgo concon-
8180
8t E - 400 W r 88 suggostod HOrriott O t 81, (1). A tjrpicril
op t ica l d O B 8 i t Y m088~rOmont8 Of tho V i m 8 t u rb id i ty
turbidi ty vorm8 v i m 8 t i t o r curve i8 &own in Fig, 1.
Coacoatrrtlon of Phago on DUE-Cellulo8o Colum
-297-

.
v)
w LL
0' u w .cy
r- tR L n t3

I
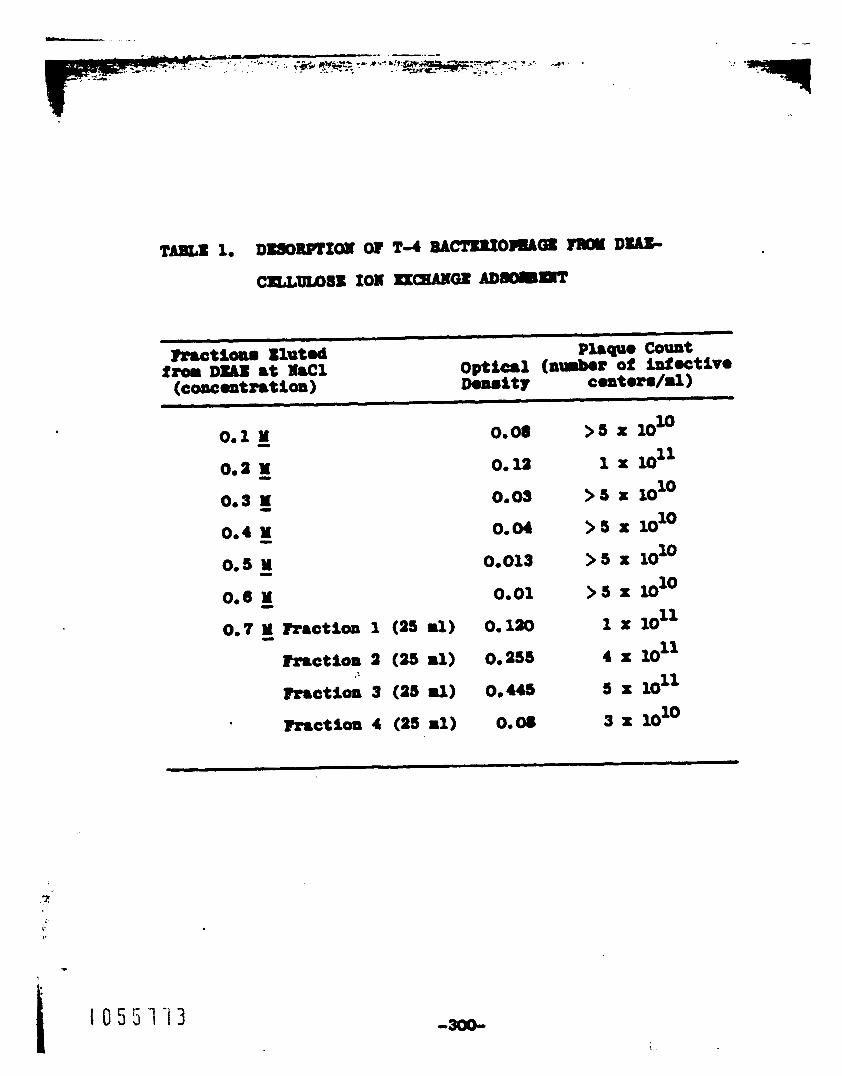
- -
> s x 1o1O
1 x loll
> a x lolo > s x 1o1O
> 5 x loro > 5 x lou)
1 x loll 4 x loll 5 x loll 3 x 1o1O
-- - - 1. .
- ._- _c .--
-70 pOr COnt Of tho V-8 in a V O l m O f lb a r i t h 8 V-8
concontration of - 2 x 10’’ part ic lom/n~, In eoatramt, tho
yiold8 obt8in.d by wing d i f f a r e n t i r l contrifugrrt ion mothod.
vary 0V0r 8 rid. 1PIDg0, and tho proC0dun i 8 t i~-con8~8%ag,
18olation of DNA
Tho concentrat ion of *go 88 01ut.d from tho D I I U -
plus 0.01 Y pbomphato buffer,
t ion m8 that d O 8 i r O d for DIU extract ion, tho malt concentra-
t ion m e in oxce88 o f that~recommended by tho phon01 extrac-
tion mothod of Hand01 and Hor8hey (5). Thuoforo, tho -11
VOlua08 (15 t o 50 al) o f concentratod -go wore contrifuged
for 1 hour a t 20,OOO x g i n 8 Spinco Yodel L contr i fuge and
t h e v i m 8 po l lo t rom8pondod In 0.1 Y NrCl plu8 0.1 Y phos-
p b t o buffor a t a phage concentration oi 2 x lo1’ *go
Althotrgb tho virua coacoatra- -
- -
porticlem/ml,
method (S), except that tho di8.olv.d phon01 in the aqueous
-8 roa0v.d by dia178$8 h8t-d of by 8h-g r i t h other.
The dIaly8i8 n 8 ca r r iod out a g a l ~ t tho phomphate-buffered
u l i n e for 4 a y e ,
d@t8rmin8tionm of tho DNA, tho phomphoru8 -8 removed by
T h m DIU n m then e x t n c t o d by tho phon01
?or phomphorus mad mol.cular weight
_. di.178i8 aga1n.t d l 8 t l l l O d Water for 4 t o 5 d.78.
A phosphorum an8ly8lm of tho T-4 phage DNA r O V O 8 h d
I
-301-
,- . ..
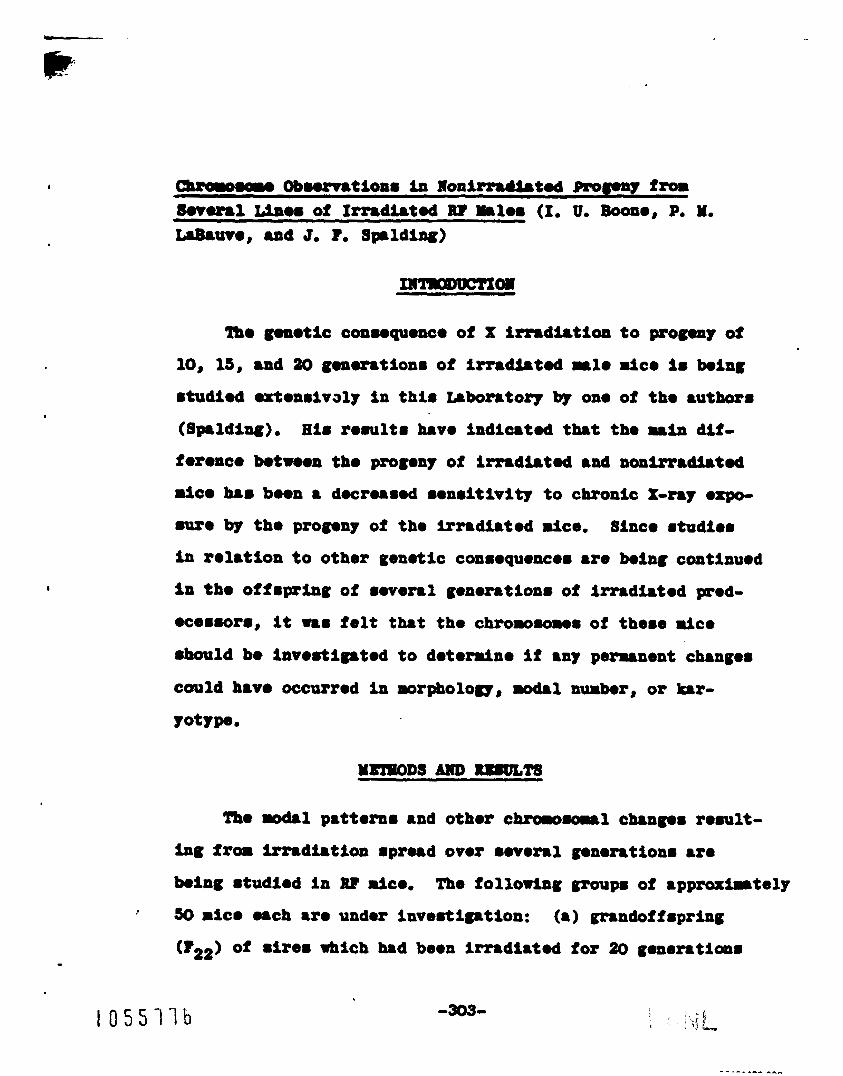
2%. gonotic conm~quonco of X i r r r d i r t i o n t o prow? of
ing from i r r a d i r t i o n 8 p r u d ovor a w o r r l g o n a n t i o n 8 8re
king 8tudi.d in R? mico. The f o l l o r i n g group8 of approx iwte ly
.. 50 rico o8ch aro undor invertiption: ( 8 ) gmndoffsprirrg
(F22) of .ire8 which had boon i r radi8t .d for 20 gonemation8 1
-303-
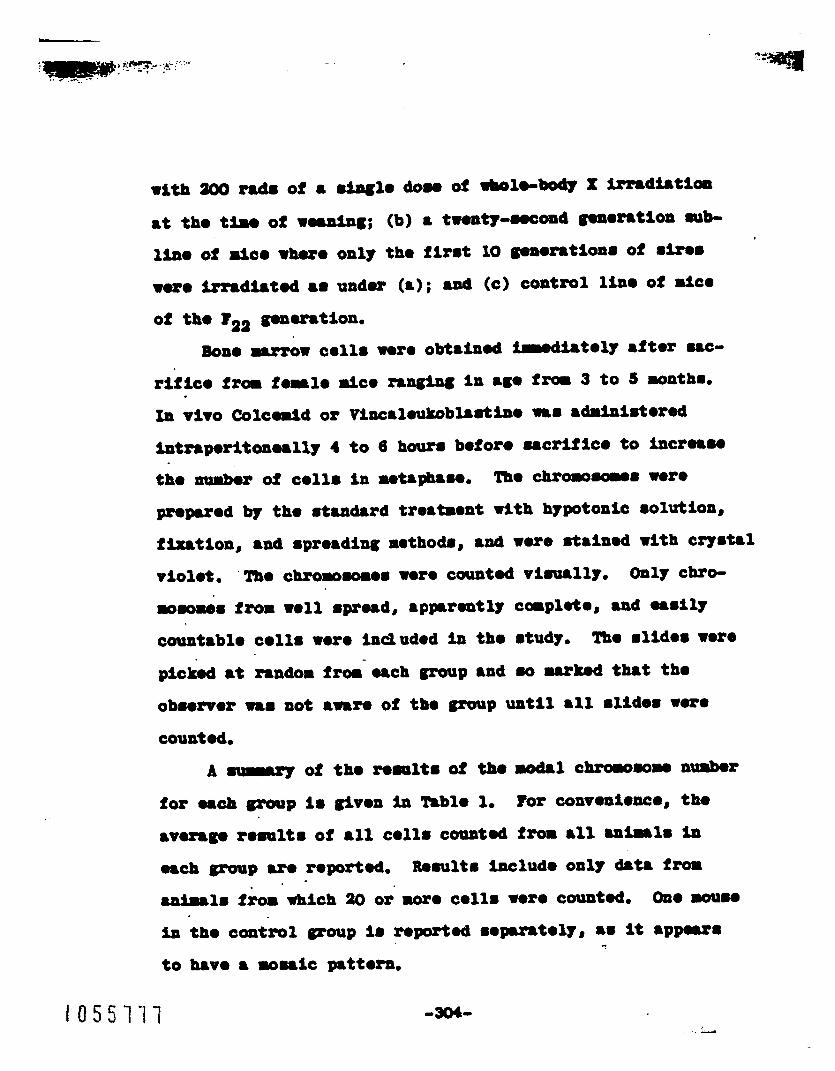
.. .
1-0 of ric. r h u o only tho flr8t 10 gmtarrrtim8 of 8-08
r-0 m d i . t @ d a8 undw (a); and (c) COntrOl 1 b O of ricm
of tho Pal g.rroratlon,
proparod by the 8trad.rd trortmant wLth hypotonic rolution,
riolot, ‘Tho chroro.or.~ r o r o countad v i r u r l l ~ , Only chro-
p f c b d at random fram- oach group m d 8o urk8d that tho
counted,
A of tho romtltm af tho modal chroromoma numbor
for uch group I 8 givon in ’hblo 1, For convon~onco, tho
avuago romltm of all collr counted irror a11 animal8 irr
oach group -0 roportml, Romaltm includo oaly d8ta from
1055111 -3OJ-
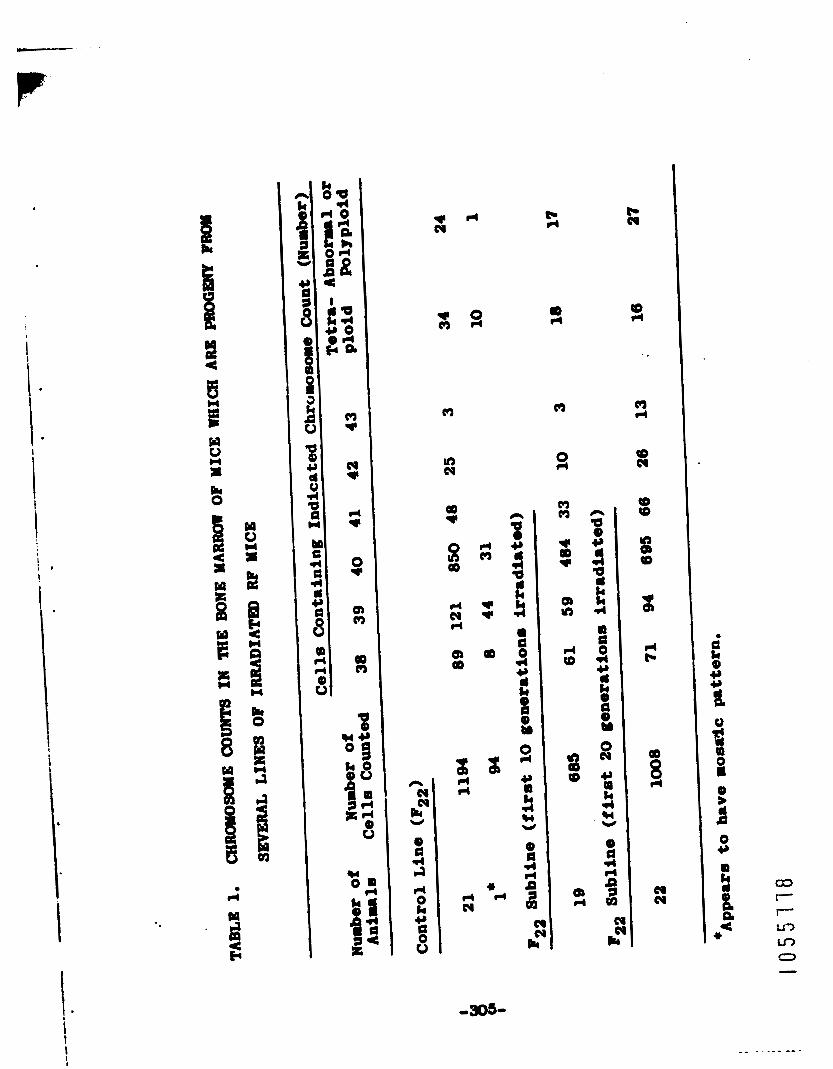
L
$ 1 ! !
5 f 0 c 3 a I 0 r( Y 3 k
e Y ga
2 Y
!I U
a I d r( P
v
8 lir CI
A cy
R" U
Q U d ma rl 0 k Y E
8
x 4
d m
* * QD
3
I) d
3 5 Q 3
rl t: m a 0 rl Y 3 k t t 0 H
Y ID k d U
0 8 4 #4
w 0 0 k
W
8
d 3 B
8
Y Y
i Q
i 0 Y
I !
r a ’ “7 -.
1 0 5 5 1 1 9

Tho obnrva t ioam that a nudor of - r l i r n tumor. con-
8irt of a col l population with anouploid chrOro.Orr, numbor
h.00 f roquont ly becn i n t e r p r e t e d a8 mapport for the thoom
th8 t 8 O U t i C chrm8-l N t a t i O n 8 (LrO b V 0 1 V . d t ho W C b -
ogonic proc.88 (182). Bowever, tho u n y domonatrrtioru t h a t
B O O p b 8 t i C C.118 c8n b . V e 8 normal diploid C h r O r O . o U l COI-
p l m n t r i t h o u t detWt8ble 8 b n O r ~ l i t i e 8 (2,3) 8UggO8t th8t
the v a r i e d r h n o r u l chraorome pattern. rhich gonerally occur
VIVO W e l l adv8nced tumor. and in i n V i t r o cultwed
cell8 are o f 8econdary Importance in t h e acquirerant o f
u l i g n a n t propertie8 and 8re probably a 8ep8rate event,
mourrul altorat&orm in rice have boon 8tudied in 8pontaa.oum
and rrdir t ion-inducod l o u k u h by lrord et 81. (l), Bay-
r0utb.r ( a ) , and Wakonig and St ich (3) with varying ron r l t8 ,
Chro-
In t h i 8 IsbOr8torp8 a tran8plantrble 1 O t l k O d 8 b.8 been C8-i.d
and 8tudiod in AKR 8lce f o r r eve ra l yoar8. Since f u t u r e i n
V i t r o ti.8Uo CultWO 8 t u d h 8 are pl8m.d U 8 b g n o r r r l and
lrukeaic cell8 from AKR mice, an in vivo 8nalpri8 of t he
. chroro.ore8 of bone m a r r o w cell8 warn parformod t o e8tabli.h
8 b880 1 h O C r i t e r i o n for t h i 8 t rm8phBt&bl0 l s ~ k ~ i r ,
1 0 5 5 1 8 8 -307-

L_ .. .
I
Tho chroromomo couatm of colla f r o m tho bono w o w of
norms1 and 1 . u k d c mice of both 8e%om 8r0 given in Tablo 1.
S b c o tho chromomom corploment m y dlffor groat17 from an-
-1 t o a n a l 8nd between louksr ic t n n 8 p l m t 8 , tho lMmlt8
f r o m 8 1ouk.llic r i c o are pre8eat.d s e p m t o l ~ , Although
thoro -8 8 gro8t.r heterogonoity In tho d l r t r i b u t i o n of
chrowaomo numbor In the leukemic d c o , tho rod81 value ro=
U h O d tbrt Of tho rr0-1 8OU80 . Tho80 r O 8 U l t 8 8 r O 8-00-
U Z B ~ rLth Uakonlg 8nd Stich (3) , rho r0port.d that in c o l l r
f r o m t h o 8plo.n 8nd thymum of AlfR n ice mort of tho 17 prirrrp
l O U k d 8 8 and 10 tr8n8pl8nt8blO l a k e d 8 6 8ad hmr8 hrd 8
rod81 chroro8or. d ip lo id number of 40,
highor porcont8ge of 8neuploid (p . r t lcu l8r ly w i t h chromorore
numbers over 40) 8nd te t raploid C.118 Wa8 10re c o m n In the
leukemic cells, Yirker chromosomes sMl8r t o thoro deecrib8d
by other8 (1,3) worm meen occ88lon8lly i n one 1mkemAc mou8e.
The occurrence of
Tho80 r O 8 U l t 8 8hOW t ha t tr8n8p18nt8blO aOOpl88th cell8
c8n h8ve 8 diploid chrorowme corplment and r-ln diploid
over 8 long serie. of t r an~fo rm.
in progr0.8 t o d e t o r r i a e If a dip lo id complement of chro-
w80mem can be u l n t 8 l n e d In tlsrue culture.
In v i t r o exparlmente are
1 0 5 5 7 8 2 -309-

d CI QD m
00 CD CI m
r( (3
rc) In
d
8 co
n
e d
f U
e
rl
ua
n
1 U
e
i k
n
d
ii I d d U
e d a
* * d
CI fi
(3
rl
r l c o
-310-
(1) C, E. Ford, J. L. Hll~orton, and R. H. Mole, J. C e l l .
Comp. Phy81ol. 52, - Suppl. - 1, 235 (1958).
K. Bayrauther, Nature - 186, 6 (IWO),
R. Wakonlg and 8. F. Stlch, J. Natl. Cancer 1n.t. - 23,
235 (1960).
(2)
(3)
(4) G. cardlll&1i8 G. C.rdimli, rnd J. B l8%r, Cancer b8.
- 21, 542 (1961).
(5) YO FOX m d I. M. ZIOSB, N i t w e - 192, 213 (ISel) .
-311-

I-
$?. r !.* I
CELLULAR RADIOBI0IX)GY SECTION
PUBLICATIONS . .
(1) D, F. Peterson, The Growth of Monodisperse Populations
of ~llrl1i.n cells E X ~ O ~ O C ~ to Internal Beta IrrrdhtiOn, In: Proceeding. o f the Ammrican Y o t h e ~ ~ a t i c r l Society Sympo 81-
(2) D, F. Petersen, Neutron Dose E b t i m t O 8 In the SL-1
Accident, Hei l th Phys, - 9, 231 (1963).
1 0 5 5 7 8 5 -312-
.. .
mmER 7
YOL=CVLAR RADIOBIOLOQP SECTIOR ..
Nucleic Acids: A Tochnlque for Autoantad B880 Anrrlymls (G. R. Sbephord, 0, 0. O t t , 8nd P, A, Eopkiar.)
I!JlTRoDUCTfO#
A technique f o r autom8tlc bame 8 n r l y s l s of hydrolyzed
nuc le i c acids 8nd 8yn the t i c polynucleotldom would be of o8lue
t o s ~ V O r 8 l molecular biology projects cu r ren t ly u n d e r ~ 8 y In
t h l 8 U b o r . t O r p . Such 8 technique mu14 8 1 1 0 W t h e 8ppliC8tfOn
of c o r r e c t i v e factors t o phosphorus d O t O n h a t h h 8 t o y i e ld
ex8ct nuc le i c 8cid concentratlon8, It would provide 8 sen-
B i t l v e technique f o r the de tec t ion of m o u l o u 8 bare8 pr088nt
I n nuc le i c 8Cldr 8nd w d t t h e r8pid dOtOrm%Mt&On Of C m p O 8 I -
t i o n of polynucleotidos synthemlzod by c h d c 8 1 or enzpaut ic
methods. Accordingly, the chroutogmphlc procedure of
Crampton et 81. (1) was lnves t lg8 tod for Its 8 u i t 8 b i l i t y for
8utoPr ted flow aarly 8is.
-313-
.. ,
grad. rinu8 m8h Dowox SOX-4 ion exchrngo re8in. Column8
0.2 I8 ammoaaum f o r u t o bufger at pH 4.0 8nd woro oluted with
movorrrl ttp.8 of concantration gr8diont8 of forrrto buffer,
CoUmn oifluoz1t8 wore monitored in a l-cr quartz flow cell
u8iag a 254-p goroicidal lamp bou~ce m d a photovolt cell
a d donritomoter. The present monitor doer not atrlctlp
follor thoow (log To/T - ecl).
w a t e r rllow. mruge of a certain anout of l ight of longer
nvelongthr which 18 not ab80rbed by the solution.
Tho Corning glar8 f i l ter
Over a
C@eain rMg8, ~ O W W O T , the r08plr80 I 8 U 8 e f U f l p prOportiOIk.1
to 4oaceatrrrtion,
potonticmetric rocorder, a8 i l lurtratod in Fig . 1,
Slution prof1108 woro recorded on a Brown
Opt- roaolution was obtainod with a flow rat. of
14 rl /b and* aa exponenti.1 gradiont following tho exproarion: . ..
. .. - -
..
*or. C . 1s. tho mixing chambor aff luont concentration a t v - n r l ; C1 I s tho concentration in tho riring ch8rb.r at v 0
0 m l ; C, l a tho concentration in tho rera?volr at v = 0 rl;
I O 5 5 1 8 1 -314-

.
.
0 t 0
w = 0
0 3 3 >
1
L
I I 1 I I I
No(S81WSWYl lN33M3d * % % e 8 8 e
-315-
-- -, .
t ’ .
v I8 t h e v o l u u of e f f l u e n t pMS8.d; A1 i 8 t h e c r o s s 8ection81
area of the r i r i n g c h u b o r ; and + I8 the cr08s 8oct lona l are8
of t h e reservoir. Mixing and r e se rvo i r ch8abers must bo equi-
b V . 1 and S i @ & - c o m ~ c t ~ d .
RESULTS
Opt- r a ~ l u t i o n wa8 rchievod with 250 ml of 0.2 ,N .. f-te buffer iB the nixing ch8rb.r rad 5oO a1 Of 1.0 - I? for-
m8te buf fe r h the rememtoir r d when + = 1.54 A1.
flow W a 8 u8ed with a herd of approximately 20 cm.
rble d i f f i c u l t y -8 experienced with peak d i s t o r t i o n due t o
tha formation of air bubbles w i t h i n the re8b bed.
Grrvi tp
Consider-
This was
eliminated by (8) m8lntairAng the r88ervoir and mixing
chubera at 42’ C, rnd (b) i n s e r t i n g a 8pecially designed
bubble t r a p between t h a miring chamber and column.
Recording per cen t tran8mission y i e lds 8 l i n o a r record
of an exponential func t ion ; such a record would not be propor-
t i o n a l t o concentration over the range of 0 t o 100 per cent T
but would be reasonably propmt iona l over the range of 35 t o
100 per cent T. QurntitAerr of b.806 appl ied t o the column
were regula ted t o remaln within t h i r range, approximately
1OO-pg q u r n t i t i e s of each. brae giving r e u i t r b l e reaponm,
Pm8Y area8 were In teg ra t ed usfog t h e half-height method and
were correlated w i t h ’ tmse quant i ty 8. a constant L,
c
-316- 1 0 5 5 7 8 9
I
quant i ty of baa. (re) area of pork (cm2)
km- 0
The data remalt ing from two dupl ica te run8 are pre80nt.d
In Table 1, In viow of th8.e encouraging remlt8, f u r t h e r
bprovementr i n t h e 8 p 8 t U W i l l b@ pur8U.d. Stable flow IPat.8,
a w n o c h r o u t l c l i g h t source, and a mechanlcrllp r i g i d l i g h t
source-flow cell-photocell asaembly map bo expocted t o improve
remolutlon and quantf ta t ion.
permit automatic column e lu t ion , regeneration, and re-
equ i l ib ra t ion .
of cros8 l i nk ing w i l l be inve8t lgated tor improved re8olution.
Purther inve8t iga t lon of recorder funct ion will be puruued,
recording as 8 log funct ion and uuing log 1/N papew, In an
at tempt t o extend and t o improve quant i t8 t ion from recorder
A tlmor solenoid assembly w i l l
Resfns of varying corposition8 and degrees
t rac ings .
-317-
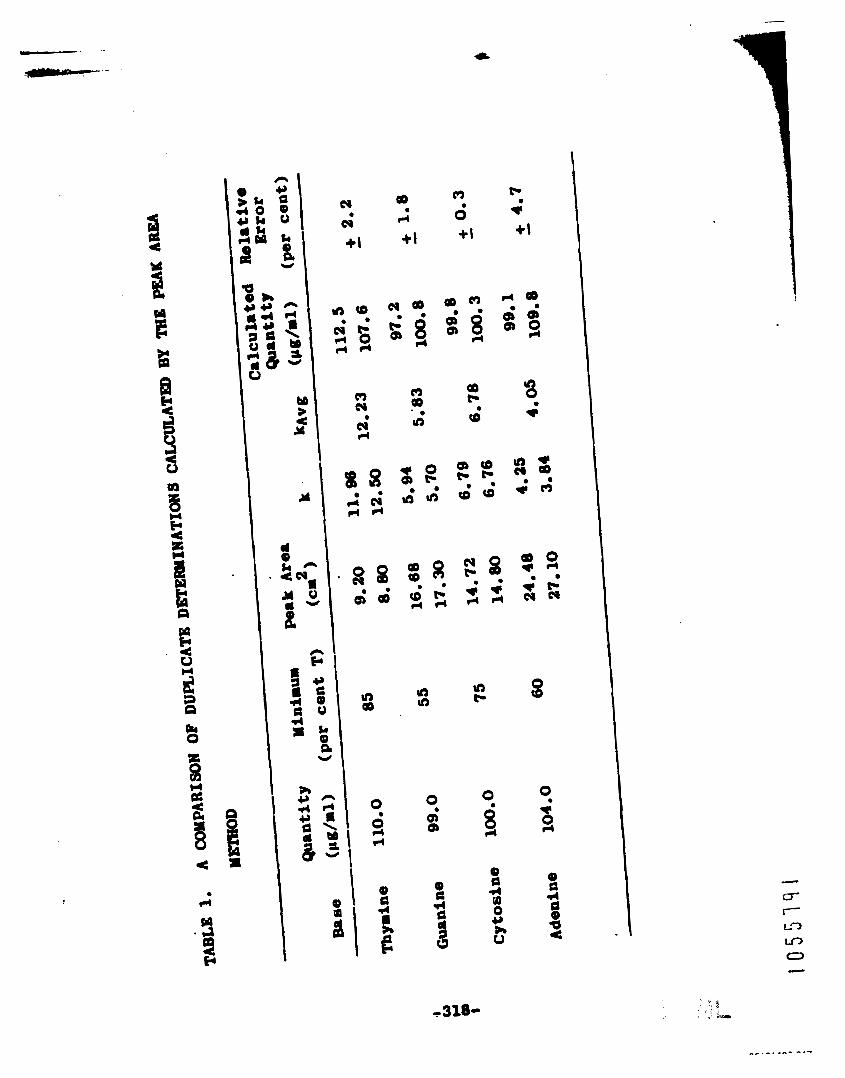
- -
I
b
Y 4
0 0
d cl
0
Q) a ; g i
0 51 d Q
b
-318-
Q) Q d
0 c
9) 8 4 P Y +r u 0 L
Appl%crrt%on of A u t o u t i c Corplt8tioul T.chniqu.8 t o tho Anrlysim of Ul t r acon t r i fug r l S.dho8t.tion-Volocit~ Y o l . c u l u , Weight Data for Dmoxy r ibonucloic Acid (Gm B, Shophord, P, It, Doan, and 8, J, Nolrnd)
INTRODUCTION
Calcul8t ion of u l t r r cen t r i fug81 molecular weight8 and
8ediaent8t ion c o e f f i c i e n t d i s t r i b u t i o n s for DNA is a lengthy
procerrs involving a l a rge number of Itoratitre corputation6,
Such c a l c u l r t i o n s r equ i r e a cons ide r rb l e i ave6 t r en t in
s k i l l e d operator t i m e and are h i g h l y suscep t ib l e t o human
error. Accordingly, a computer program was deaigned t o per-
i o n these c r l c u l r t i o n a r ccu ra t e ly and r e l i ab ly , The program
was w r i t t e n In FORTRAN I1 fo r t h e IBM 704/7090 computer (Mon-
i t o r System) rad was deeigned t o eliminate, insofar as posrrible,
pre-computer ca l cu l8 t ions on t h e part of t h e operator. Provl-
sion was nvde f o r t h e direct en t ry of dat8 i n t h e same form
in which it w 8 8 obtained expe r i r en ta l lp .
progr8m 8t t h e -8 A18-8 S c i e n t i f i c L.boP8toW h8S resulted
in an incre88e In t h e r e l i r b i l l t y of ca fcu l r t ed data 8nd h8s
encouraged t h e design of experlmentr which can e f f e c t i v e l y
Routine use of t h i s
U t i l i 2 0 t h e inCrO86Od quant i ty of d8t8 now 8va i l rb l e . .
HA-TICAL BASIS __ -~ - ~
Dot8iled mechrnicrl rnd m8theaatical de8cr ip t ions of
' 1 0 5 5 1 r - 1 2 -319-
u l t n c a n t r i f u g a l boundary migration are readily a v a i l a b l e (1,
2). %p.cfr l ly va luable in t h i s regard is t h e desc r ip t ion by
Schunker and Schachman of t h e use of u l t r a v i o l e t abuorption
technlquer i n t h e u l t r a c e n t r i f u g a l a n a l y d s of d i l u t e solu-
tion. (3). Briafly, t h e technique involvo8 t h e c l e a r i n g of
8 s o l u t i o n of macromolecules by mean8 of a high c e n t r i f u g a l
f iald. The c l e a r i n g process creates a boundary, t h e region
batreen so lvent and so lu t ion , which moves i n t h e d i r e c t i o n of
Opplied force.
l igh t In t he region of 260 ~ip, t h e boundary migrat ion may be
recorded on u l t r a v i o l e t - s e n s i t i v e f i l a and t r a n s l a t e d t o two-
d iaen8ional graphic form w i t h aa automntic scannlng and record-
ing. photoden8ltomet er.
Since DNA macromolecules absorb u l t r a v i o l e t
Our Work wa. performed wi th a Becluun/Splnco Yodel E
a r r r ly t l ca l u l t r a c e n t r i f u g e equipped with an u l t r a v i o l e t absorp-
t i o n system us ing DNA solutions w i t h 5 t o 4 0 pg DNA/ml. A n
A n 4 rotor and 30 mm 4* sec to r cel l were used throughout. A l l
measuremente~, Including those o f vibcos i ty , dens i ty , and
sedimentation, were made a t 25.0 - + O.O1° C.
t o accelerate the rotor i n t h e same manner for each run, gfwfng
t i m e s which were reproducible within - + 0.3 pur cen t for 88ch
run. F i l a 8 were developed according to the techniques of
Thom88 and B e r n 8 (4), and the resulting films were traced
us ing tho Beckroa/Spinco Analptrol photodensitometer w i t h film-
acanaing accessory.
Care 119.6 taken
1 0 5 5 1 4 3 -320-

I r ! i , .
I
j 1 - I * I
I i
I
I
I
i
f
I
Piguro 1 repromonts tho thooroticrl t i~o -8o~uon t fa l
bourd.ra.8 Ob89rVed 8t ti, t 2 # t3, 8d t 4 O f tho U I e 801Utm
a t 4 d i f fo ron t concentrat ionr . Tho i i m t i o n of a boundary
i 8 cutwO88Od 88 the ch8nge i n tho 10s Of t h o d i r t a C O Of
point h on the boundary during t h e poriod tl to t 2 f r o m the
contor of ro ta t ion .
following equation;
This value may bo incorporated into tho
2,303 d log x/dt
'T 2 r RIW 'OBS
1 60 J
t o 8 8tmd.rd 8et O f condi t ions:
va lues are the value. obtained had the s o l u t e been S 2 0 , W di8.olv.d i n a so lvent with t h e do88ity 8nd v i8cos l ty of
=tar a t 20' c. The vimcosity ratio. umd in t h o co r rec t ion
x donsitp) rat108 performed in 8 low ahear gradien t capillary
1 0 5 5 7 9 4 -321-
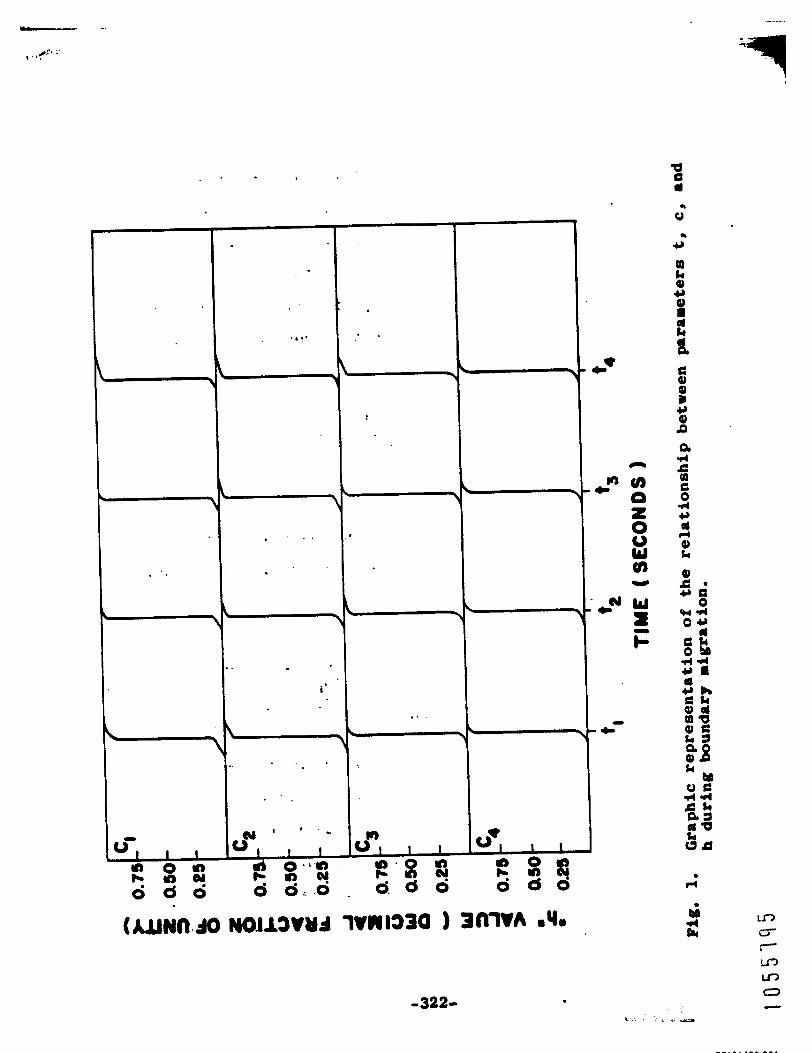
. .
Y ' . . I
i
3
. .
. .
1
m u- t"" 0 in Q
-322- c
E-
vi8comotor of t h e Ubbeholdo type a t to C.
for the
work of Tennent and Vilbrant (5). I n t r i n 8 i c Vi8Cority [q]
u y b8 obt8ln.d by t h e l i n e a r e x t r r p o l r t l o n of the ratio of
sp .c~f lc v i r c o s i t y t o concentrat ion t o Infinite di lu t ion .
The value 0.55
specific volume (v) w 8 8 obt8b.d from t h e
Values are derived from so lu t ion and lo lvont flow time- s P dens i ty produc',s obtained In a capillary V I 8 c O m e t e r .
Molecular weights are obtained by s u b a t l t u t l o n of t h e
proper va lues in t he fol lowing empirical equation ( 6 ) :
Y. W t . = 4.269 + 1.33 log (so 1 11 1/31 8
where So is obtained by t h e extrapolation of S20
or t h e i r reciprocals, t o I n f i n i t e d i lu t ion .
V8lue8, 8
Fina l ly , apparent d i f fus ion c o e f f i c i e n t s u y be obtained
from t h o slope of a p l o t of t h e 8 q U 8 r e B of t h e d i f fe rences
between t h e x values of a boundary a t h - 0.25 and h 0 0.75
8g8inst the . The slope of tha r e r u l t l n g l i n e , divided by
t h e constant 3.64, is t h e apparent d i f f u r i o n c o e f f i c i e n t i n
c m /om. 2
It luy bo meen that , with the axcept lon of 8 perfectly
rtable v e r t l c 8 l bo~ndrflr, 08Ch v8lue Of h W i l l yie ld a d i f -
f e r e n t set of values for SOBS, S208w, So' 8nd Y. U t .
.. t l o n on t h e d i s t r i b u t i o n of t h e m v8lues within a given
1nforP.-
sample I s f requent ly of i n t e r e s t t o t h e
-323-
inve.tigator In t h a t
( 8 ) On0 8 p v O B t d i f f u s i o n CO8ffSCImt for a C h C O o C m -
t r r r t ion v.lu.0
(b) I n t r l n 8 l c viscosity dorivod directly from capillary
oach t h e i n t e r v r l for
(a) One value of
til. 1at.rval.
( f ) -0 V81UO Of
each t h o i n t e rna l .
m d s o l u t i o n doa8itfu.
'OBS 08ch C o n C O n t ~ t h n .
f o r oach bound8l7 h V 8 l U @ for
f o r each boundrry h valuo for S20,r each concentrat lono
So f o r 08ch bound8rp h v8luo for each
b8 80021 that the application of a u t o u t i c C#pUt8tiOn81 toch-
nfquem ta t h o amly8ir. of u l t r r c e n t r i f u g a l 80 l .cu l . r r d g h t 8
O f f O C t 8 i -Oat 8 8 V h g O f t h o , 8a ilhCrm..d aCCUrrC7 8nd
reli.bility of r o ~ l t 8 , and enrbl.8 the exprrhOnter t o
d081m e x p e r h e n t s which can u t i l i t o theme Uta to t h o fu l l08 t . .
REFEREnCES
(1) E, It, Schachrun, Yothodm In Eosymlogy, Vol, - IV, Acadntc
Pl’O.6, MOT York (1957), pp. 32-103.
E, IC, Schrchrrn, - Ultricentrifuption i n B l 0 ~ h a d 8 t r y ,
Academic Press, New York (1959).
(2)
(3) V. 1. Schumaker rnd E. K, Schacmn, Biochlr. Biophya.
A c t 8 - 23, 028 (1957).
(4) C. A. Thomrr rnd E. I. Bernr, J, Mol. Biol. - 3, 277 (lml). (5) H, G. Tennent and G. F, Vllbrrnt, J. An. Chem. Sot. -’ 6s
( 6 ) J, Elgner, C, Schilkrrut, and P. Doty, Blochira. Blophys.
1 0 5 5 1 9 8
Acta - 55, 13 (ig02).
-325- - . , , ; ‘ r

Tho Roprosontatlon of Oligonucleo t ido~: A S u b - ~ o u n c l 8 t u r o
c o r p l u that much effor t ha8 been put Into dovi r ing 8irpl.r
and C l O a r l Y on papor and blrckbo8rd. "'her0 r r o tw 8tand8rd
W8t.88: 8 tw-d%monrional nucleo8ide 8tICk 8 t r U C t U r O (I)
which i s used whenever a l l t ho r e r c t l v e func t ions mu8t be
&own, .and r l i n e a r s t r u c t u r e (If) when only the 3'- and 5 ' -
linluge8 are repremented.
A c
Structures I and I1 represent tho 8810 rixed r ib- and dooxy-
r lbodinucleot ide, The 8 t i C k mgar numborinq runs from 1' a t
t h e top t o 5' a t t h e bottom, The l i n e r r linkage numbering
I O 5 5 2 9 4 -320- I
Imitator tho d i r e c t i o n I n rult18tick e Z W C t W 0 8 :
3' oa Its l o f t p l u s 5' on i t 8 right.
mch p ha8
Both sy8t.r. u8e the letter8 A, C, 0, U, and T, where
i n t h e 8t lck ver8ion t h e ba8.8 adonine, cyto8in8, (F1.n1ne0
u r a c i l , and t h g r i n e ar0 -t but whora b t ho l l n o a r verrion
the wcl .o8ido8 8d.1~08in8, cy t id ine , gWhO8in8, ur id ine , 8nd
thymidiam 8rm rear&. Thyridlno I 8 8 d.orlrnucl.o8lde; rherea8
t h e o the r four are ribo8ider. Tha 1Sno.r ror8ion alw, neodm
dA, dC, and dG to repre88nt dOOW8dOm8h8, dooxycytldlne,
and d.oxyguanorino.
ha8 l8d t o use of r T for It, but r ecen t ly there ha8 been agita-
ti- t o r ede f ine T 88 r ibo thyr ld lne and t o Introduce dT 8s
thymidine.
The discovery of a r lbo thy r id ine In &RNA
The u.0 of p t o represent phorphate ester IB both the
8 t i ck and llaear fom8 I 8 t r a d i t i o n a l l y rOpl8C.d by derlgnr-
t k m 8 8uch as GYP, dCDP, and ATP for S'-qUrrnyllc acid, 2'-
d .oxycyt ld ln . -S ' -d lp8~te , and adeno8ino St-trlpho8phate.
We entored the f i e l d of 01igonucl.otido 87nth88i8 with
no rroticural or t r8di t iorrrr l t los t o t h o ganor8lly u8.d nuo
cleotlde mab-no~mncl8ture. The ex i8 t ing n 8 found t o
.. bo u n 8 y 8 t e ~ 8 t l c and t roub lesom enough that N wi8h.d f o r
momthiag better and, therefore , more u8eful In our vork.
-327-
oaly by the n o r v l linear uao of p.
tho locrl nomenclature abbreviation system w i l l be used,
1 0 5 5 8 0 t -320-
O l i l o o \ r c l ~ t I d . 8ynthe8i8 (Do G. O t t , D. L. W A l l h 8 , V, N. Yorr, 0. T, ?ritz, E. H.n8bury, R. E, Hino, rnd F, N. HayO8)
Tho program of t h e Yoleculrr Radiobiology Soction in-
C l U d O 8 8 8tudY Of oliqodeoxyrlbonuclootid..: t h e i r F O p & r 8 -
t i on , chomIc81 pr~portie8, 8ad blologic81 8ignific8nce.
ThO.0 -11 Unit8 Of DNA Can 8.W. 88 8t8n-d. With C 8 t -
810W.d p l r O p O r t i 0 8 for comparimn W i t h DNA C l O 8 V 8 g O product8
i n 8equence a tudies , 1s models In r ad i8 t ion experlment8 8nd
for chemic81 8nd enzymic deqradrt ion, and a r a c t i v e partic-
lpant8 i n cell-free polymer880 s y s t e r s , To n b a r k properly
011 Our 8HbitiOu8 8tudy program, 8 8 0 h C t O d 8nd con8iderrble
nUBbOr Of ollgodooxyribonucleotide8 B U 8 t be prepared by what-
over mean8 8em B0.t appropriate.
Polymerization produce8 large rol.cu1e8 with a Pronot-
onoualy r e p o t i t i v o ~ e q u e n c e or with 8x1 unknown sequence i f a
r h t u r e of monomers is used, Stepwiro ro l ecu l8 r bui ldup
offer8 great 8equent ia l va r i e ty of known order, but progress
tor8rd large r0 locul . r is e x c o d i n g l y 8low. DXA subjec ted
t o tho a c t i o n
UIWCO of 811
t h l 8 8pprO8Ch
f r a c t i o n a t i o n
Of phO8phodI~~tOr880 Oozy808 $8 8 potOnti81
conceiv8ble oligonucleotido8, HOW proBi8hg
m y be depend8 on t h e tochnic8l =.tory of
procedures which m8t, a t t h e 8818 tine, be
1 0 5 5 8 0 2 -329- . .
i . , h ::
u l t r r s e n r i t i v o t o s t r u c t u r a l difterorrc~m rod handlo Urgo
q u r n t i t i o r of ol igonucleo t ide mixtures,
GIOIERAL DISCUSSZOM
Thu8 irr in tho synthosi8 program, Writ ham bmon l i r i t o d
t o compound. conta in ing t h o py r i r id ino barno.:
thymino.
pli8hed both wi th d i c y c l o h ~ l c a r b o d i i r i d . (DCC) (1) and
wi th o thyl polypho8ph8te (2) t o give tho r o l l known 8eri.8
(pt), w i t h 8 uxianu A of a p p r o x i u t o l y 12 a t tho termin8tIon
of our seprrrtioa procedure.
c l e 8 r l y not func t ioning In t h e rriy it h88 been roported
cy to8ine ' rnd
Polymerization of S*- thpr idyl lc r c i d ha8 been accom-
Our ethyl polyphosph8te was
( B 8 m U l 7 , to @VO poly-5 l-thymldyllc acid Of 8VOr.g. w l O C U l 8 r
weight = 18,OOO (2)] ,
author8 of Ret. 2, Dr. Wolfgang pollaunn, t o our Laboratory,
wo caa aow mako 8n e t h y l polyphosphato which convart8 5'-
t h f r i d y l i c rcid i n l o w yio lb' to polpar of conridorrbly higher
r o l o c u l ~ r roight than obtrinabla with DCC as t ho polpurizlr-
t i o n rgont , but we are q u i t e expectedly still troubled with
excess phO8phor~8 in t h e product.
With the recent v i a l t of on0 of t h e
8 t . $ W h O 8ynth.818 ha8 been d1r.ct.d 8t tb. 4 po88iblm
p y r h i d h e dinucleot ido8 in V 8 r i O U 8 8t8g08 O f ~ ~ O 8 p h O ~ l 8 t f O ~
which are i l l u s t r a t e d with thy i id ino a8 the nucleomido: t p t ,
-330-
Most of t h e 8ynthemer are by b o r n procoduro8 or by
minor EOdIfIC8tIon O f S t m d u d method8 (3-5). Nucloo8ide
rad nucleo t ide f n t e r r e d f r t e e with blocking group. mltuated
t o i n h i b i t i n t e r f e r i n g reac t ion sites and cho8en for selec-
t i v e removabili ty from t h e co~1d~n8atiOn product8 are f iret
prepared. These are i l l u s t r a t e d i n Fig. 1. The only d l f -
feronce between t h e thymine and cyt08ibe repre8ent8 t ives i s
t ha t the la t ter r e q u i r e an r n i r o y l block on the 4-amino
nitrogen.
By one-atop condon8rtlon r u c t i o n 8 , f u l l y blocked dirOr8
a r o formod according t o t h e following ropromaat8tlon8: I + I I
I 11 - t p t , I + V - tpc, I V + I1 - cp t , 8nd I V + V I - cpc, T40 t r i t p l group I 8 acid-18bIl0, and the a c y l i
group# are ba88-l8bllO, p 0 m t t i n g 8 a l O C t i V e rOMOV.1 Of
either the 3'- o r S*-block in a di ror followod by pho8phorf18- * t i o n of t h e free hydroxyl group. In t h i 8 way, 3'- and
\ 0 5 S " u ! - i -331-
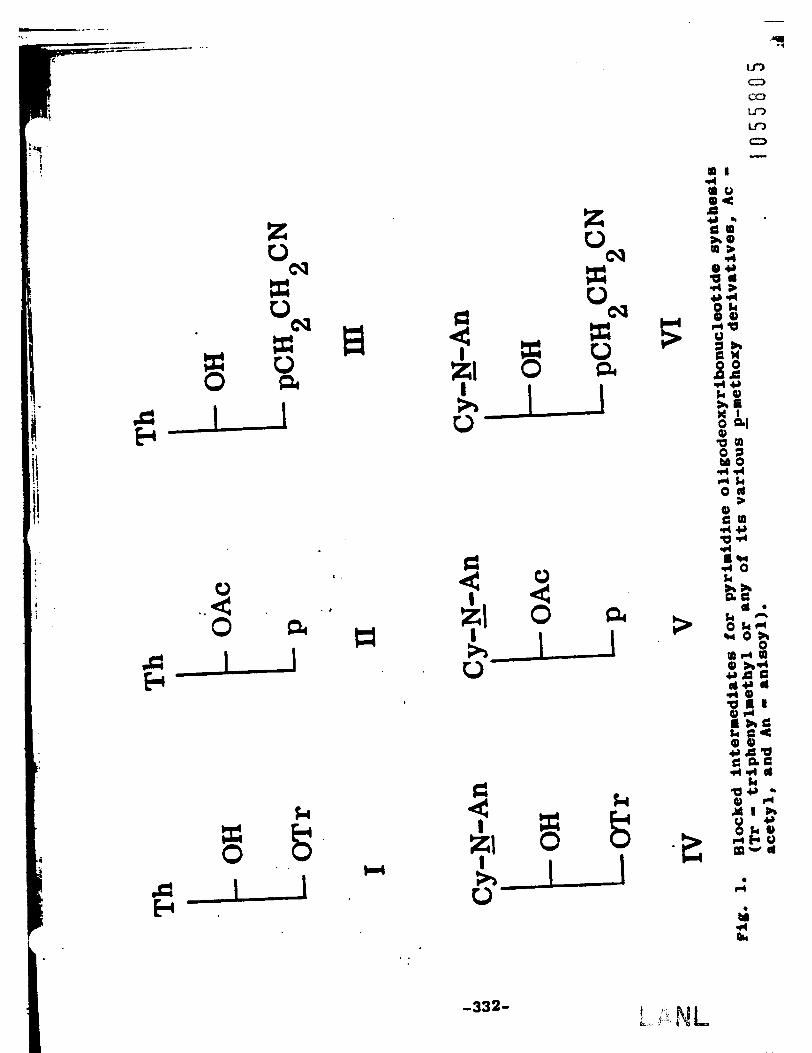
X 0
X 0 ai
,
.. 2 0
k td 8 .
H 0 . .
4 AI 1
4 b t: c)
* k 0
5
t,
-z k
By;
d
t& rl 01
-332-

i
St-phorpbtom rnd t h e St ,S~-dipho8phato of orch dinucloot ide
arm being prepared. A c y c l i c d i ror romlt8 from intr8rol.c-
u l r r condonu t ion a t high d i l u t i o n of e l t h o r t h e 3'- or 5 ' -
phosphate.
Tho 8pOChl 2-cpanoethyl-blockod nUClOOtid.88 111 8nd
VI, are u8ed for r 8 p l d 8ccess t o t h o bt-pho8phory18ted dimor.:
I11 + If B p t p t , 111 + V ----tptpC, VI + I f -pcpt, 8nd
VI + V o p c p c . Th l8 scheme I 8 ro8d i ly u o n r b l e t o u8e of
labeled nucleot ides .
A method h88 been worked ou t for convorting 8 dimer 5'-
pho8ph.to t o its St- t r lpborphate . Thus, we w i l l h8ve di-
nuc leo t ides 8t the supposedly P r O p r ChmIC81 8t8te for IB-
corpora t ion s t u d i e s wl th polyrerree 8ystems.
Specific progress in syn thes i s ir reported In t h e follow-
ing sec t ion ,
applicable t o o l igonucleo t ide synthori8. Progre68 i n pol-
p8OrimtiOn 8nd 8tepWi8e 8ynther i8 I 8 roportod hero8 but
product cha r8c te r i za t ion information i s lacking,
con8ider rb le p8per rad colurn chrorr togr8phlc d8t8 havo been
Thus far#
summed, am i s necessary for l d e n t l f l c 8 t i o n 8nd separa t ion
procodurea U 8 e d in working up reactlon8. Elemtnt81 r i c ro -
8n8178(B8, u l t r 8 v l o l e t and in f r a red 8pectrorcopic dat8, and
1 0 5 5 6 C l t i -333-
l a later rqorts,
5 t-O-Trftylthymidine D e r i V a t i V O 8 (I), Chlorotriphenyl-
methane, a 8paciflc reagent for p r l u r y hydroxyl -Up80
r O 8 C t 8 V O W 8lOwly wi th thymidine a t ]PO01 t O m p W 8 t U r O (60 par . . Cent, 1 week) 8nd afford. 70 t o 80 per Cent y i e ld8 of 5 ' 4 - - t r l t y l t h y r i d l n o (I) in hot pyridine during about 30 1ainute8.
Substitution of t h e t r f t y l ch lor ide re8gont wi th p n o t h o x y l
group8 ( 6 ) fncre8808 t h e r e a c t i v i t y of t h e re8gent 88 the
* . .
number of such groups is fncre8sed. With a 10 per cent molar
exc88s of t h e reagents , q u 8 n t I t a t i ~ e conver8ion8 of thymidine
were effected i n 40 hour6 f o r onep-re thoxpl , 13.5 hours fo r
two, and 4 hours for three on a 1 t o 10 -le acale,
. . . .
Repeated
r e c r p 8 t a l l l z a t l o n 6 f r o m dichloromethrne and cyclohexane mix-
t u r e s gave yields of pur i f ied products ranging from 95 t o
99 per cent , Since t ho ronorethoxy-, dimothory-, 8nd tri-
methoxptr l tyl radical8 are, in that order:, lncrea8lngly mor. .: .
8 O l l 8 i t l V O t o 8cIdlc hydrolysi8 and 8re much W r O re8di ly re-
moved th8n t r l t y l , they offer a good means of protectfng the
St-hy&oxyl func t ion of deoxycytidine and t h e purine au-
cl00sides and nucleot ide8 with their much more acid-labile
.
as i t s calcium salt fol lowing t h e reaction of c o n e r c i ~ l l y
a v a i l a b l e St-thymidplic acid (p t ) (as t h e pyridinium ult)
with dicylohexylcarbodlimAde (DCC) and a large excess of
hydrac ry lon i t r i l e .
y i e l d using 1- to lueaeml fony l ch lo r ide a8 the condensing
The diester w 8 8 8180 formed In exce l len t
8gent.
N-Anisoyl-2~-d.orycytldlna (IX). Compound IX has baan -~
prepared by both of the r eac t ion sequence@ i l l u 8 t r a t e d l a
Fig. 2. Tetrahydropyranylatlon of 2 * -deoxycytidine (c)
hydrochloride goes extremely slowly n1tho:i t added catalyst.
On 0.1- t o 4-mole scale wi th a large exce.6 (55 fold) of
dlhydropyran (DHP) in dlmethylforrrmide so lu t ion , t h e addi-
t i o n of 1.1 equ iva len t s (per mole) of dry HC1 I n dioxane
ca ta lyzed t h e r eac t ion t o completion In 23 hour8 a t room
temperature,
presumably the 5*-0-(2-tetrahydropprrrnyl)- - der iva t ive , whfch
dis8ppeared completely as t h e bl8- d e r i v a t i v e of higher Ri
A compound of lntermedi8te Ri first formed,
W 8 8 famed, The product, 3 t , S ' - 0 - b i 8 - ( 2 - t e t r a h y ~ o ~ ~ n y l ) - - 2'-deoxycytidine ( V I I ) , wa8 Isolated 8s a color1888 sed-
Solid m8terlr1 which ha8 aot, a8 ye t , baen C ~ 8 t 8 1 1 i Z @ d 8
Re8ctlon of V I 1 wi th an i soy l chloride in dry W r l d l n c grve
t h e - N-anlsoyl de r iv8 t ive (VIII). The la t ter product has been
extremely hard t o pu r i fy because of colored by-products aris-
lng from t h e dihydropyran reac t ion ,
'
A colorless product b e
-335-
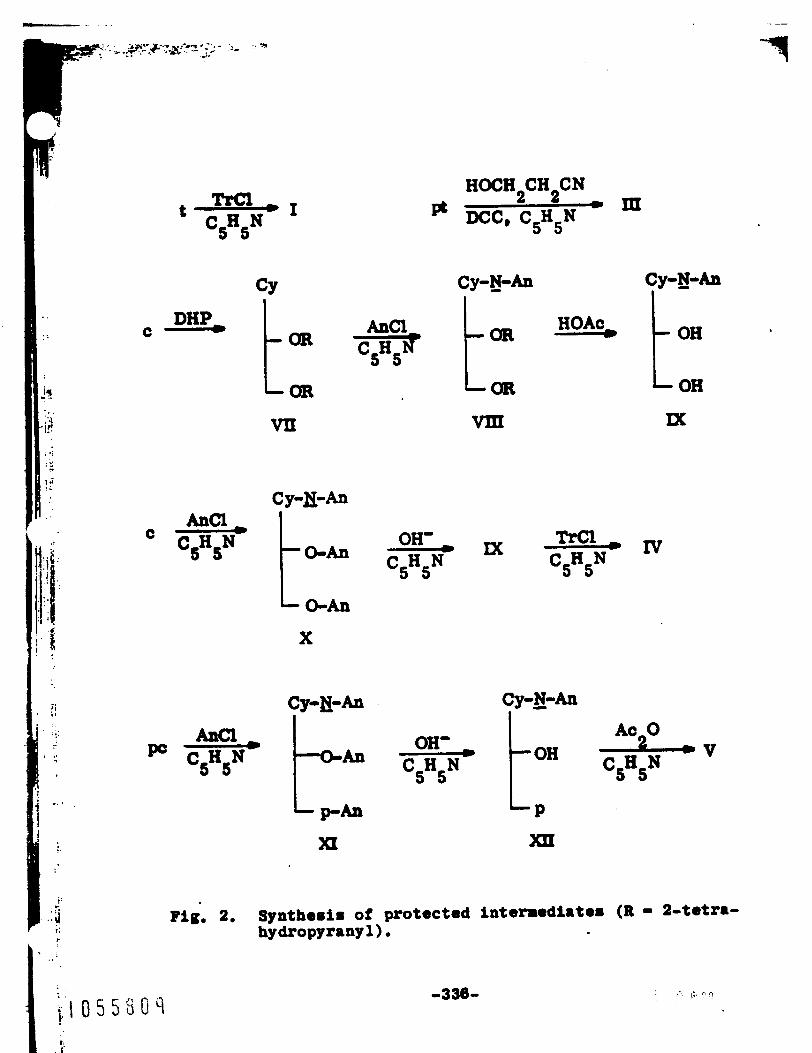
L- .
t
CY
Ana a C g H g K DHpD t C
Cy-N-h I
Ix - 0 Iv OH' . CgHSN CgHSN
Ac 0 * V toH CsHsN
OH'
Fig. 2. Synthesis o f protected interredi8t.8 (R = 2-tetr8- hydropyranyl).
-336-

i
!
baoa obtaiaod in about 35 por cont y l o l d by tho 8 1 0 W cry8.
t8ll%zatlon of V I 1 1 from 8 8IxturO of 0th- and o thy l aco t r to ,
RO-V.1 O f tho 2- to t r rh jdromranyl -Up8 With 80
a C O t l c 8cAd a t 25. W88 quit. slow, and 8 & t t l r O O f product8
W88 obtriood,
cont
S t 8ppmrS thrt rODOV.1 Of a 3 ' - O - ( 2 = t O t r 8 = - hydropynayl ) group in aquoou8 acotic 8cid, from dooxy-
c y t l d i n o d O r i V R t i V O 8 , I 8 W u t 1 7 faCflit8t.d tho p r 0 ~ 0 ~ 0
of noighboriag phomphrto group ( 7 ) .
Tho proforrod rothod of proparing compound I X i s via
tho corplatoly anfsoylated d e r t v a t i r e , 3',5'+#-trIani8oyl- e -
2'-d.o~tycytidino (X). On t h e l- t o 4-nole 8c8l0, tho y i e l d
O f U w 1 y pUr0 COlorlOS8 product 18 088Onti811y qUantitatiV0;
upon r . c r y 8 t a l l i z a t i o a from ethanol, t ho rocovory of pure
~ a t o r i a l i 8 69 t o 75 por cent rnd more I 8 obtalaod from mother
liquor., Control led hydrolysis of x, with d i l u t e .odium
hydroxido in pyridine a t 30. f o r 35 minute8 t o romove t h e 3'-
- 0- and 5'-O-ani.oyl - groups, g ives noarly 8 q u a n t i t a t i v e yiold
of - N - a n f ~ ~ l - 2 ~ - d w x j r c y t i d ~ o ( I X ) with j u 8 t a t n c o of 3'-
d.oxycytidino. Sodiu~ ion8 aro rrovod with IR-130 (pyridin-
lam) romin, rad it i 8 important that tho product bo thoroughly
warhod from tho roria with 15 to 25 par cont mridina . o lu t ioa ,
Tho r-tt.1 Of 8ni8iC 8cld i 8 0ff-t.d by t r0athg tho -1U-
t l a n b r l a f l y with 8n 8 fold thoorottcal uc.8. of IM-400
(OH-) romin. I t I 8 vary important that a l a r g o oxcorns of
-331-
. <,, ' .
prridino bo. p r e u n t to pravont adsorption of the product
and colncfbent hydrOlY818 of the - N-rnimyl group, With thor-
oug& washing of t&e remin with 25 per cen t pyridino, tho
N-Animoyl-S *a= ( d S u t h o q t r l t y l ) - 3 -d.oxfctt idlam (XV) ,
On a 1- t o 2-mhol. acali, r eac t ion of IX with chloro-(p
q u 8 n t i t r t i v e conversion t o IV in 48 hour8, In a 8iril.r re8c-
t ion of I X w i t h chlorobi8-(p-wthoxpphonyl)phenylaot~ne, I
the conver8ion is qurrnt i ta t lve In C I S hour8, After hydrol-
y8i8'of exce88 reagent and nsu t r a l i za t lon of hydrochloric
acid with a u o d i w hydroxide, the product I8 ext rac ted i n t o
'chloroform and thoroughly ra8hed with water, These products
cry8tallized from dichloromethane and cyclohexane or dichloro-
methane and bu ty l chlorida, - 3 *4Acotyl=N=aniloy1-2 '-dooxy-S'-cytidylic Acid (V).
s. .. . -, Compound V -8 propred from 2 ~ - d e o x y - 5 ~ - c y t l d y ~ l c acid (pc)
rccordiag t o t h e retactfon sequence shown in Fig, 2, Complete.
ani8oylat ton of pc was accoapliuhed after 2 hour8 in pyridino
. . . a t 25'.
pholrphoric anhydride linkage . . s e l e c t i v e l y in X I m a not foam- ',. !
iblo, since the 3 ' 4 a c y l - group was removed a t about t h e u m e
1 0 5 5 8 t I -338-
rrrto. Honco, t h e anhydride and 3'-O-acyl - group8 wore cm-
p lo to ly hydrolyzed with d i l u t e NaOE in pyr id ine 8t 25. for
br8ed on pc and Isolated as t he calcium salt.
5 * -0-Diaethoxy - t rit y It hymidy l y 1- ( 3 ' : 5 ' ) -3 ' -O-acety 1-N-
8niroyl-2~-doowycytidine (XIII). The ro rc t ion of t h o pro-
t oc tod nucloot ide (V, 0.43 maole) with 5 ' -O-dhethoxyt r i ty l - -
L I i--
thymidine (I, 0.5 mmole, 10 per cent molar excess) , as
I l l u s t r a t e d in Fig. 3, afforded an 85 per cent y i e l d of the
completely protected dlnucleoslde (XIII). The reac t ion mix-
ture was chromatographed on a DUE-cellulose anion exchrnge
column in t h e carbonate form and e lu t ed wi th a l i n e a r gra-
d i e n t (0,005 t o 0.6 - Y ) of t r l e t h y l 8 ~ n h ~ ~ bicarbonate at
pH 7.5.
t a ined pyr id ine nucleot ide, t h e eecond contained me8itylene-
su l fon ic acid, and t h e t h i r d contained unreacted V and its
pyrophosphate. The four th peak, dimethoxytritplthynidine,
e l u t e d from t h e column Blorly, 8 ince it 18 water in.oluble.
It n8 rpread OVOF about 110 tubos. The f u l l y protocted
product (XIII) alu, war olu ted very r l o r l y ; it f i r e 8pp0U.d
in f r a c t i o n 249 (10-rl f r a c t i o n r ) 8nd '1111 collected in a
to ta l of 14 liters of solvent. Since t h e concent ra t ion of
product in t h e e l u a t e wad practically constant , 4 l i terr of
Many peaks were obtained: t h e first of these con-
e
f 0 5 5 3 i 2 -339-
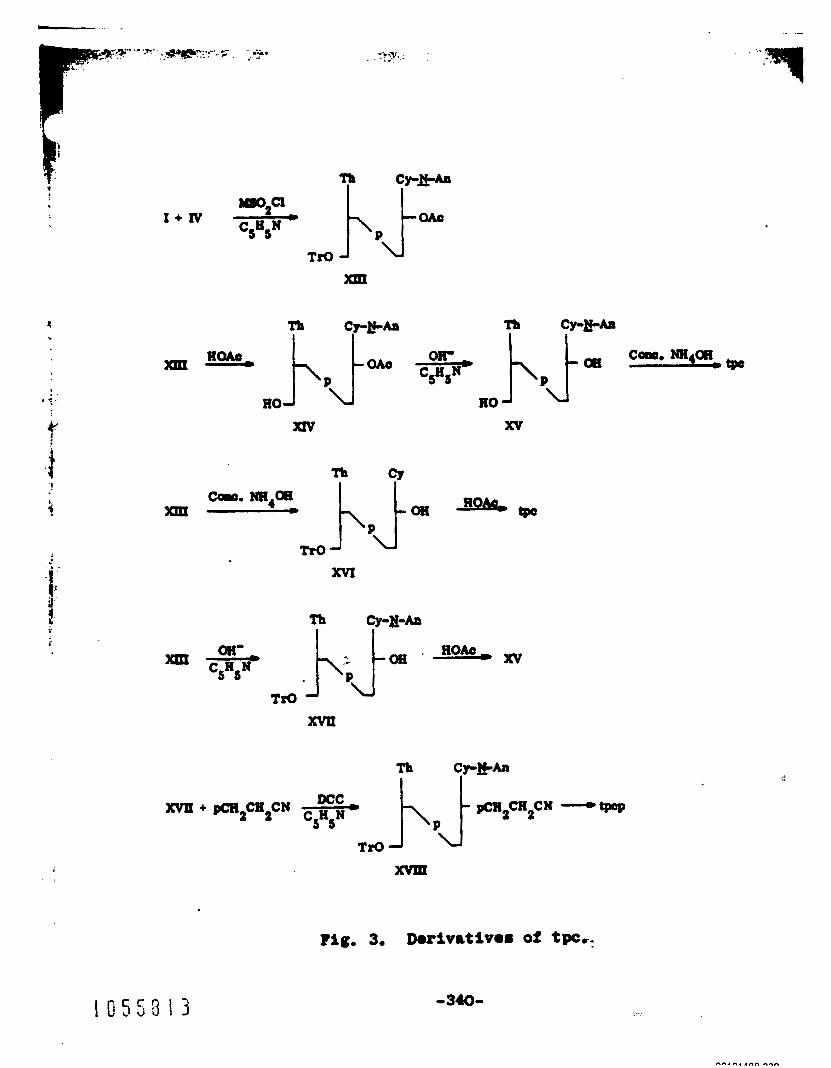
- -
:?:I' ... :
. . .I.
Th CY
. .
Pig. 3. Dorivrtivom of tpc,.
-340- 1 0 5 5 8 1 3
t I
1
!
!
5 per cent athano1 In 0.6 - Y t r io thylamonium bicrrbonrte
solution was used toward t h e end of t h e run t o hamten It8
romoval.
so lven t by r 8 p e 8 t O d ex t r ac t ion with chloroform in which It
Tho product wa8 imolated from tho large voluro of
I s quite soluble .
A mall peak which was superimpo8ed on the product poak
(tube8 586 t o 600, as demonstrated by paper c h r o ~ ~ t o g r . p b p )
was shown by hydrolysis r eac t ion8 8nd -per chromatography
t o be compound XVII, which r e su l t ed from loss of t h e 3 ' 4 - - a c e t y l group from XIII during the work-up,
The major product was p a r t i a l l y charactor izod by means
of t he r eac t ion8 shown in Fig, 3, lead ing t o t h e product8
XIV, XV, XVI, and X V I I derived from X I I I i n var ious mtages
of Its being s t r ipped of its blocking groups t o give f i n a l l y ,
tpc.
5 '-0 ' -DLnet hoxyt r i t y lthymldy l y 1- (3 ' : 5 ' )-N-8n180pl-P ' 0
-z - deoxycytidine (XVII). The majori ty of t h e product ( X I I I )
w a 8 8ubjected t o con t ro l l ed ba8ic h y d r o l y s i s with d i l u t e
sodium hydroxide In ca. 50 per cen t aqueous pyridine t o ob-
t a i n XVII. -0V.1 of sodfun Ion8 was offected by t r e a t i n g
t h e r o l u t l o n wi th IR-120 ca t lon resin (pyridinlum form).
The so lu t ion was evaporated t o dryn@88 w i t h the @I maintained
> 7 by occas iona l add i t ions of pyridine.
-341-

mridvlY1- (3 ' : 5 ' )-2 ' - d 8 ~ - 3 ' - c ~ t i d ~ l i C Acid ( tpcp)
Tho p s r t h l l y protoctod dinuclooride pho8ph.t. XVII, which
ha8 8x1 8v8 i l8b le 3'-hydroxyl group0 (188 phorphorpl8t.d wi th
2-cy8noothyl phosph8te (6) and DCC In pyridlno, as i1=
l u 8 t r r t e d in Fig . 3.
'
A f t e r add i t ion of W & t e r , r e m O V 8 1 Of
dlcyc loh .xylur08~ 8nd hydrOlyd8 O f p r O t O C f % V O group. f rO111
XVIIf, tho productr w8ro 8ubJ.cted t o ch rou tography on 8
DM&c8lluloro column (c8rbOmte form) and e lu t ed with a
lirroar grrd iont (0.005 t o 0.3 - Y) of t r i e t h y l a = o n l w b icu-
bonrte a t pIi 7 .5 .
t o the column, 20 per cent was non-nucleotide co lored -to-
ri8l that was removed by a p r e l i r i a r r y washing with W 8 t e r
8dJu8t.d t o pH 8 with t r ie thylamine,
m t t e r n of nuc leo t id i c products is shorn in Fig, 40
product, peak 3, which Is presumably tpcp as indlc8 ted by
of t h e 6100 o p t i c a l dOn8ity units app l i ed
The gr8diant e l u t i o n
The mrln
PaPOr C h r O ~ 8 t O ~ a p h p Of t h e hybrOlpEI8 product8 and the pori-
t%on.Of t h e p8rk rel'rtlve t o t h e gr8dIont0 8rountod t o 52 par
c8nt of tho nucloot lde ~ t ~ r i 8 1 .
The 8-11 perk, shown as a part of pemk 3, As now be-
l i eved t o be an artifact produced in loading t h e column.
Perk 3 -8 r o c h r o ~ t o g r a p h e d on t h e 8aae column, w i n g a
dmllorer gradien t of t r i e thp lamwniun biCarboMt@; a sing10
n o o t h peak -8 obtained.
Thynidyly1-(3': S')-dooxpcytidln8 - ( tpc ) . P.8k 1, t h e
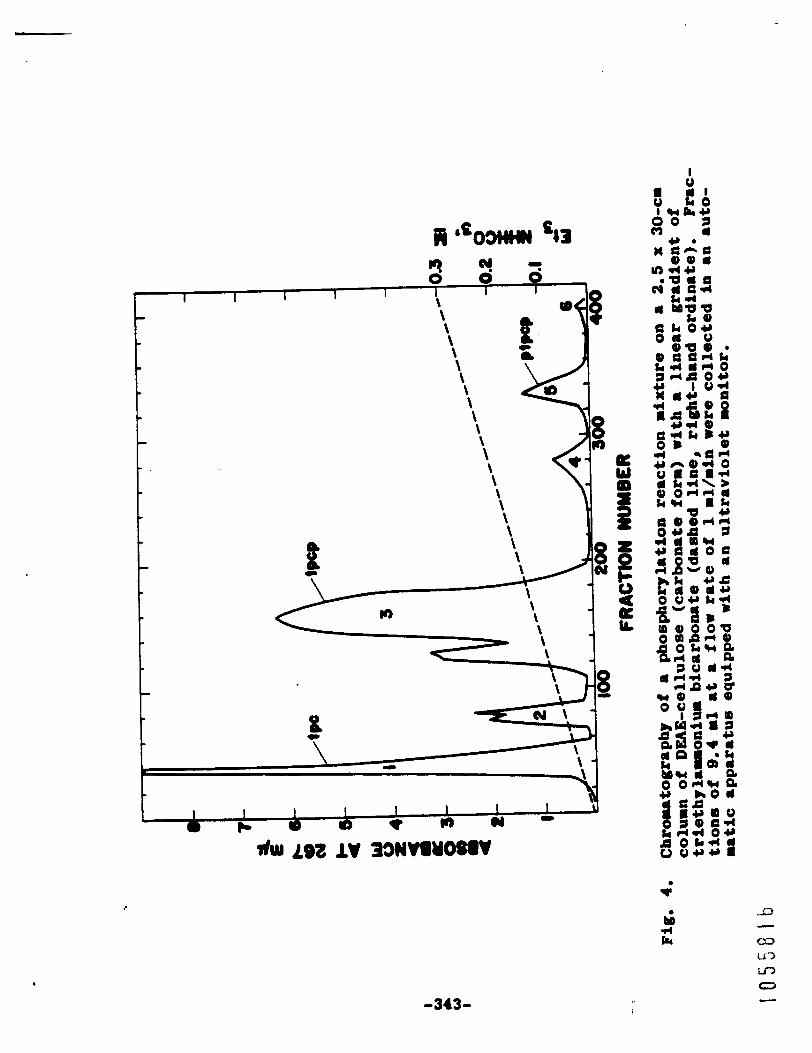
-343-
. ~ e * . , 1 I q " T --.&;*x.L$&-~.-r --
e**- r
mocond 1arg0.t~ l m bellevod to ba tpc md 8lount.d t o 32 per
c a n t of tho naterirl elutod. T h i m product arlram from in-
C a g l O t O r.iott.1 Of tho 3'-O-&C@tpl - -Up during the COB-
tr0ll.d b 8 8 i C hydrOly8i8 Of XfIS, A Careful chwk Of
t h o dogroo of h y d r o l y s h by chroa8togmphlng 1arg.r 8 l I q U O t 8
of tho .ample i m In order rhon c8r ry lng out thlm hydroly818.
Using the 88110 condltionm on t h o micromole 8~810, a l l of t ho
3 ' 4 - a C O t ~ l - block W 8 8 remotrod 8Bd in a d d i t l a & 8mll 8 W U n t
of tho - 16-animyl block. The l r t t o r factor I8 unimportant In
p h o S p h O ~ h t i O n 8 With 2-Cp8nO.thyl phO8Ph8t0, since t h e
reagent i a in excess and t h e r e s u l t i n g phoephoamide As easily
hydrolyzed in a basic medium.
Of courme, tpc would be d i r e c t l y obtained In t h e de8lred
q u a n t i t y by the hydrolymir of compound XIII, a8 ahown i n
Fig, 3,
~ ' - P b o 8 p b o r o t h ~ r i d y l y l - ( 3 ' : 5 ' ) - 2 ~ ~ d e o ~ o 3 ~ ~ c y t l ~ y l i c - Acid (ptpcp),
dlmathoxyt r l ty l group on XVII after rcnovrl of t ho 3 ' 4 - - acetyl block, a syll amount of t h p r i ~ l y l - ( 3 : 6 ) ~ ~ - 8 n l ~ y l ~ -
Although care -8 taken t o preserve the S ' 4 - -
2'-doo%ycytldlne ( X V ) -8 pre8mnt i B tho pho8phorylation
r e a c t i o n a ix tu re . The resulting coaple te ly pho8phoryl8t.d
diaer, ptpcp, Is believed t o corprire poak 5 of t h e ' e l u t f o n
pmttern i n F i g . 4 and amounted t o 5 per cen t of t h e olutod
a8 t or i. 1 ,
-344- 11
- Thymfdy ly l - (S~:31) -S1- thya id~ l i c Acid (p tp t ) , The roac-
t i o n of I1 with 1 x 1 in pyridine with the a id of p-toluene- - r u l f o a y l chloride (T8C1) gave XIX, 88 shown in Fig, 5,
Following removal of t h e base-labile acetyl rnd 2-cyanoethyl
prOtect lv8 group88 t h e r e s u l t i n g p t p t -8 pai f id by colua
chromatography on DUE-cellulose (bicrrborute f om, l i n e a r
tr iethylannonium bicarbonate g r rd i en t ) and c r y s t 8 l l ~ u t l o n
of t h e calcium mlt,
Although many e f f e c t i v e methods have r ecen t ly been
developed ( 8 ) for t h e eyntheris of nucleo t ide diph08pbrtcb6
and triphosphates, t h e preparat ion of oligonucleot ides bear-
i n g these terminal groups ha8 not been reported,
tiono shown in Fig, 5 for t h i s purpose -re developed 8nd
are q u i t e s a t i s f ac to ry , Sirilar reac t ions , employing phos-
phorirfdazolides, have been used (9) for preparing organic
po1pphOspbte8# including adenosine trfpho8pb.te, Tbe method
appears t o be simpler and t h e y i e l d s equivr lont t o t h e mre
commonly employed procedure which Involve8 pho8phOrOn0rphO-
lid.tes*
The re8c-
S'-Thyaidylic acid (pt a8 t h e pyridiaium ult) I8 con-
ver t ed t o the irtd8zolide XX by r aac t ion w i t h C O ~ ~ r C l ~ l l p
a v 8 i l a b l e c r r b o n y l d i l d d r z o l e in diretbylform8mlde m l u t i o a ..
-34s-
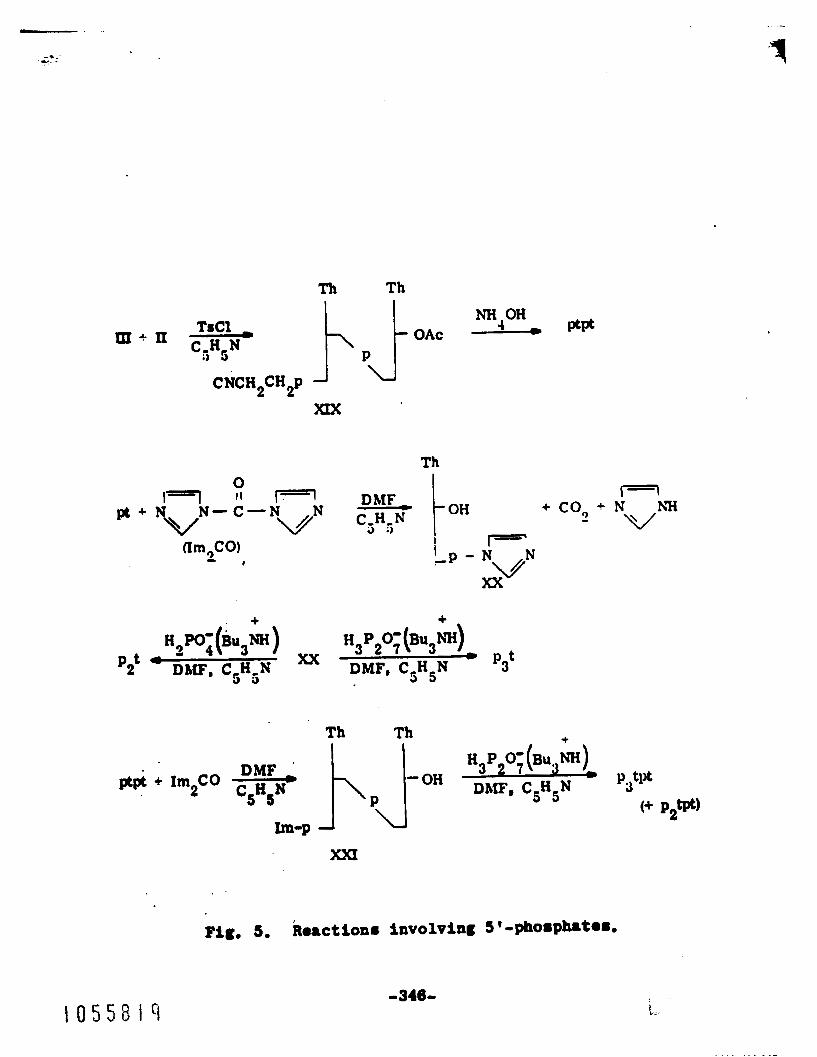
Th Th
CNCH2CH2p J U
Th
p c +
0 I===! " m t OH
i I -P -
+ co, + -
Th Th
t 0 5 5 8 I Ft

a t f001 t n p o r a t u f o ovarnight.
s o l u t i o n of XX (without f u r t h e r pu r l f i ca t lon ) with 8nhpdrou8
ronotributylamwnium orthophorphrte p v o %t. SiPilarly,
T r e a t n n t of the nrult ing
trmatrOnt Of XX with r o n o t r i b u t p l u a o a i u r pYmphO8ph8tO pr0-
duc8d p3t. In t h e latter reactioa, I t n 8 found that i r ida-
zolium pyrophorphate wag fn8oluble in d i r8 thy l fo r ru r ide (rad
a11 othor coamon organic molvontr) ; conrequontlg, excear p y r e
pho8ph8te, correrponding t o tho a m u n t of iridazo1e prO8Ont
a f to r tho preparat ion of XX, war ured.
Applicat ion of the triphosphate r eac t ion t o the di-
nuc leo t ide ptpt gave analogous r e s u l t r . The product8 were
prrif led by column chroaartogmphy on DUE-cellulo80 (bicar-
bonate forn) ur ing a l i n e a r gradient of triethylrmaonium bi-
C8rbon8to a t pH 7.5 .
approxi ru ts ly the same gradient concentrat ion a8 do oligo-
nucleot ide8 having t h e same t o t a l number of negat ive Ch8rge8;
thu8, the nucleot ide polypho8pbrtor wore q u i t e r o l l remolved.
flowever, contamination with ino rg ra i c polypbo8phrte war found
(by phorphoru8 an8ly8i r and by p8per chromatography), 8nd
other m8n8 of pur i f i ca t ion (e. g., 8d.orption and demorption
The product8 care off t he column a t
from C h 8 r C 0 8 1 ) are roqulred t o e l h i M t e tho80 by-product&
Since nucleo8lde polyphospb.to8 have been ob8erved (9)
' to d&8proporfionate in 8uch anhydrou8 reac t lon so lu t ions , the
Off@& O f t i m e of r eac t ion on y i e l d W 8 8 studied. After 8
1 0 5 5 8 8 2 0 -347-
roactlon p8riod of 1 day, t he y i e l d fol lowing columa chro-
u t o g r r p h y of p2tpt was 18 por cent , p3tpt ma 48 per cent,
p4tpt warn 1,2 per cent , and s t a r t i n g material (p tp t , etc,)
va8 18 per cant, For a 6-hour r e a c t i o n period, t h e piold8
woro: &tPt# 7 par cen t ; pg tp t , 4S por cent ; p4tpt , 0.5 per
coat; and ptpt, 25 par cont. Thur, the y i e l d of t ho derirod
product -8 t h e same in both case8, although the proportion8
of tho by-product8 Varied,
rad a8 expocted f o r this type of reac t ion , attempt8 rill be
made t o optimlze It, pa r t i cu la r ly with respect t o formation
of Inorganic polyphosphates,
Although t h e p i a l d i r 8ati8factory
REFERENCES
(1) E. G, Khorana and J. P. Vizsolyi, J, Am, Chea, Soc, -8 83
673 (1961).
(2) G, Schramm, H, Gr&h, and 1, Pollmnn, Anger, Chsm.
-8 74 53 (1962).
(3) E, Sch&ller, G, WeinUnn, and H, G, Khoranr, J, h, mea, Soc. 85, - 3SS (1963), and re ferences cited therein.
(4) H, G. Xho~~na, Sore Recent Development8 - in the Cherirtrp
- of Pho8ph.te Ester6 of Biological I n t o r e s t --’ John Uiley and Sons, New York (1961).
(5) F, Cramor, Anger. Chem. - 73, 49 (1961).
t 0 5 5 8 % f -348-
I-
#
0 Chea, Soc. - 83s 686 (1961).
( 8 ) A, Y. Yichelmon, The Chsshtry of #ucl.o8ide8 and Nu-
Cl@Ot%d88, Acrdmic mOI8, #Or York (1963).
(9) F. Cruer rad H, Neunboeffer, Ber, - 95, 1664 (1963).
i 0 5 5 3 2 2 -349-
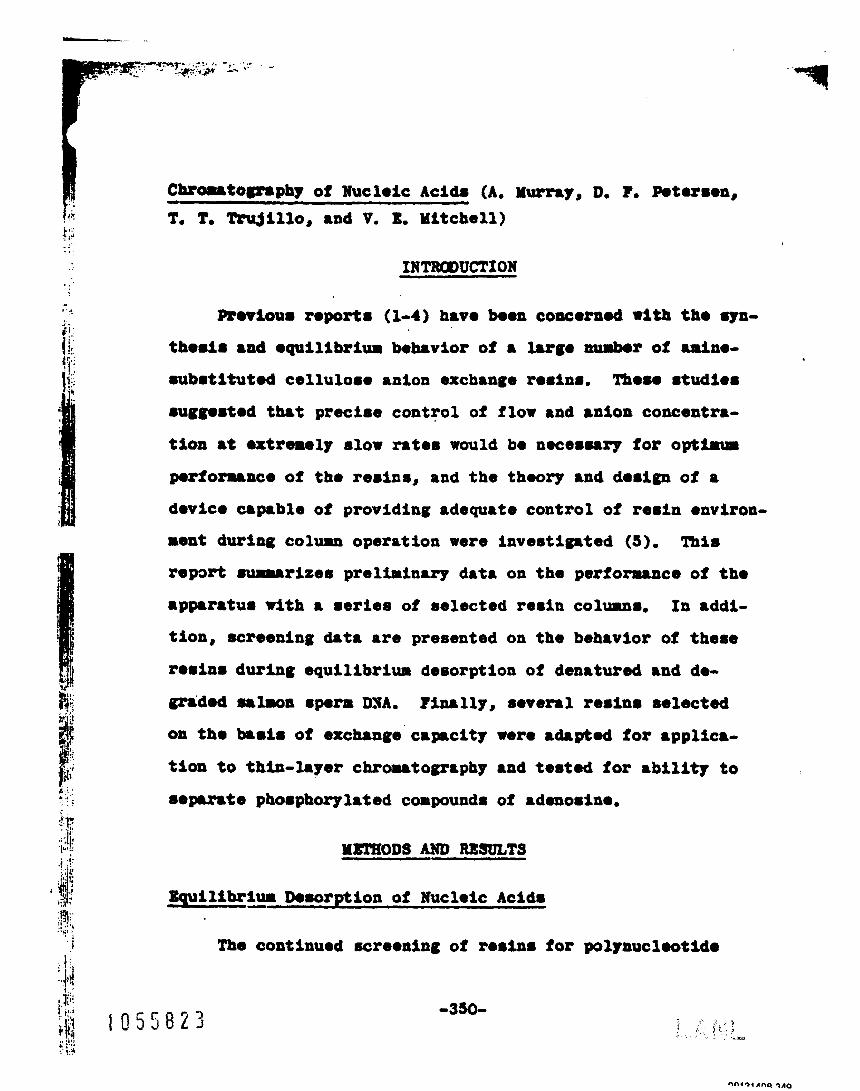
C h r o m 8 t O ~ p h y of Xuclolc A c i d . (A, M m y , D, ?. P.tOZ.mn, T, T. m i l l o , m d V. E, Mitchell)
INTRODUCTXON
Previoum rmport8 (1-4) havo bmon coacorn~d w i t h tha 8yn-
tho8ia and equlllbrlum bobrvior o f r lwgm ma8bOf of .Pino-
8ubmtitut.d cellulome anion exchange rorinm. Tho80 rtudiem
maggo8tod that precise cont ro l of flow and anion concentr8-
tion at extremely slow ratem would be noc08urp for optimum
prfocrmce of the resins, and the theory and d08ign of a
devico capable of providing adequate con t ro l of resin envlron-
meat during column operat ion were l n v e 8 t ~ g . t e d ( 5 ) .
rapart .urrrrIzer preliminary data on the perforunce o f the
8pparrrtus with a msrlea of selected re8ln columns. In addl-
t i on , 8creanlng datr are presented on t he bshrvlor of there
Thi8
reEin8 during equilibrium dO8orption Of denatured and de-
gradmi srlroa rpom DXA.
on t h o tm.18 of exctmage'cap.city worm rc~aptod for a p p l ~ c r -
t i o n t o t h b - 1 8 f O r chromatography rad temted for a b l l l t y t o 8eplMte phomphorylrted compound8 of 8dOno8ina.
IrAnallp, several resin8 mlected
YlhTIIODS AND RESULTS
milfbrlur - Demrption of Nucloic Acid8
The continued screening of roainm for p o l ~ a u c ~ . o t l d o
dosorpt ion p ropor t i e s was carried ou t under equl l lbr lum coadi-
t i o n s by batch e l u t i o n as previously described (4).
(a) Salaron 8p.m DNA (Calbioch88.) wa8 heat-denatured
a t B1,So for 6 minutes, then r ap id ly ch i l led by external ice
bath and internal app l i ca t ion of f rozen bu f fe r sa l t so lu t ion ,
80 t h 8 t t h e temperature dropped t o 50' In 15 seconds and 10'
by BO aocond8, Table 1 presen t s e l u t i o n
donaturod DNA with 26 r e r i n s arranged in
t h e desorp t ion a c t i v i t y index previously
profiles for thim
decreasing order of
found for t h e un-
denatured samples (4); average recovery was 99 per cen t
deSFite a few cases of extreme spread.
p l e t e l y absorbed, except for trace amounts i n two related
r e s i n s of rather high bindlng site density.
recovered f r a c t i o n s var ied from 4 t o t h e uxiaum porsolble 8.
In 18 cases permit t ing c o r r e l a t i o n of t h e r e l a t i v e desorp-
t i o n a c t i v i t y bde r (average 322) with that for the uno
denatured sample (average 447), 13 showed I marked decrease,
i n d i c a t i n g a p r o f i l e s h i f t t o t i g h t e r binding, wh i l e 5 re-
la88.d daar tured material a t l o r o r ionic 8tr0agth.
A l l samples were com-
The number of
(b) 2%. a b i l i t y of resins t o chaporono heat-deaaturod
malron 8p.m DNA -8 invo8t lgatad by mixing hot 8o lu t ion rfth
a heated reeln s l u r r y and allowing t he mixture t o cool after b
30 minutes. Table 2 presen t s e l u t i o n
accompanied by the corresponding data
profiles with 7 r e s ins ,
for heat-denatured and
-351- I

. ..+ r" k.
i'

f 2 m
x N
I I I
E i I
I I I
d L m
d e I - -
I I I
d
.$
I I I
d a a 1
I I
E
4 i Y
i
E P J d
9 CJ W rn L n b -
-353-
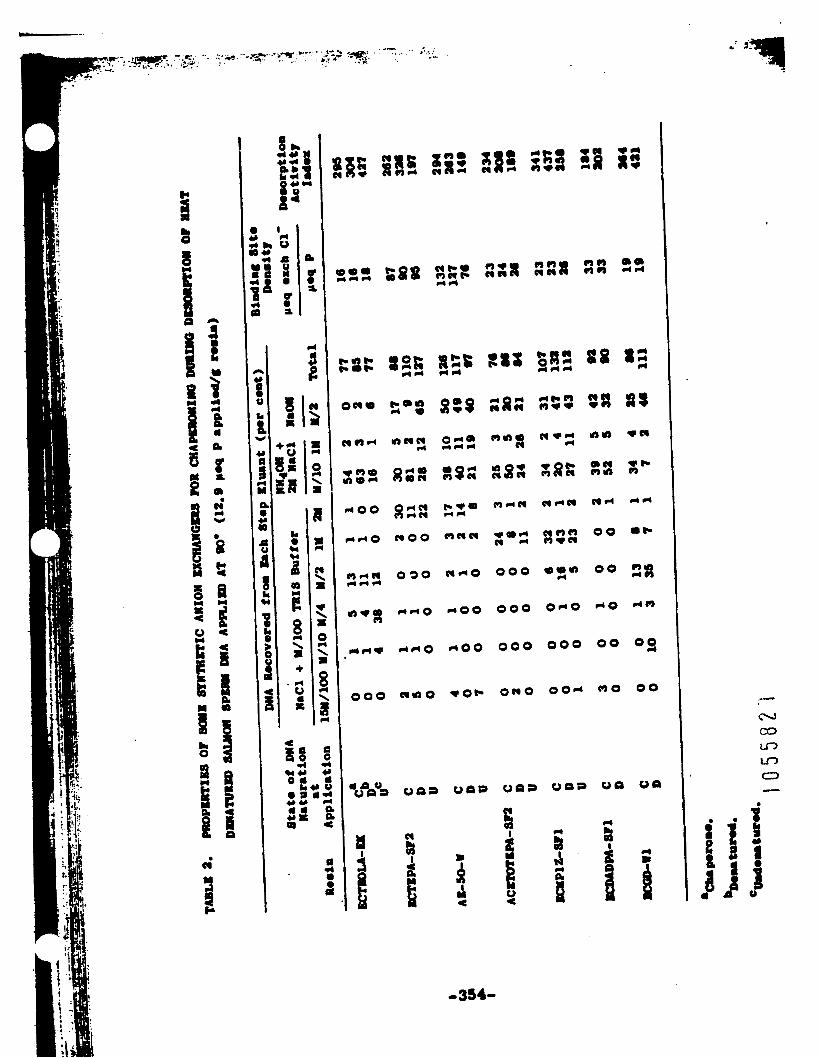
m H c l 0 3 0 u-0 H r t H
n q - - 0 - 0 0
C \
a
0 0 0 m a 0 woe
0 0 0 m z a 0 0 28
0 0 0 orto do d m
0 0 0 0 0 0 0 0 09
ouo O O d m o 0 0
u p s
E 00 a f Y
on
r(
-354-
undonatured sampler.
iadicoa Indicates t h a t these r e s i n s vary widely in a b i l i t y
t o prevent r ena tu ra t ion of DNA.
A compari8on of desorpt ion r c t f v l t y
(c) The a b i l i t y of r e s i n s t o detect de(lrrd0d DNA rrrr
inve8t ignted by coapa r imn of e l u t i o n profile8 w i t h thome of
undograded rraaples.
graded by vigoror:s roch.nicn1 shaking for 24 hours, by r&pid
passage 3 t h e 6 through a 27-g.ugo hypod8mic nmodle, by
r t i r r l n g with a V i r t i s mixer 24 hours a t 3. wi th minirum
c r v i t r t i o n , by sonica t ion 10 minute8 at 10 KC I n 8 vator-
cooled polyethylene bottle, or by exposure of both denrtured
and undenrtured samples t o 25,000 r of X rays.
Allquots of salmon 8p.m DNA were de-
Table 3 presents e l u t i o n p r o f i l e s of 2 r e r i n r wi th
4 samples of DNA subjected t o ordered sc is8 ion and 2 with
random sclsaion. In t h e former c l a s8 l f l ca t ion , .hear with
t h e needle appeared t o be least damaging.
(d) T&e effect O f aging upon DNA 8OlUtiOn8 stored 8t
refrigerator temperature was s tud iad by do tomin ing the
ch8nge in e l u t i o n p ro f i l e r , Table 4 preront r the profilar
of 4 resin8 rnd evidence t h r t horogen.ourly decreased rerin
crpacity and binding site dOn8ity ah i f t t h e profile of f m 8 h
DNA t o lower ionic 8trength8, and extonded 8torrge'of DNA
solutions a t r e f r i g e r a t o r t e rpe r r tu r ; remalt. in marked
s h i f t s to higher Ion ic strengths and raom8lously high recov-
eries by alkali.
1 ' 0 5 5 8 2 8 -335-

ci
0
m
Y) *
e-
0
0 0 0 0 0 0 0 -
0
M
PI
(3 (rl
's:
0
3 (1 3
-356-
.-- - - -
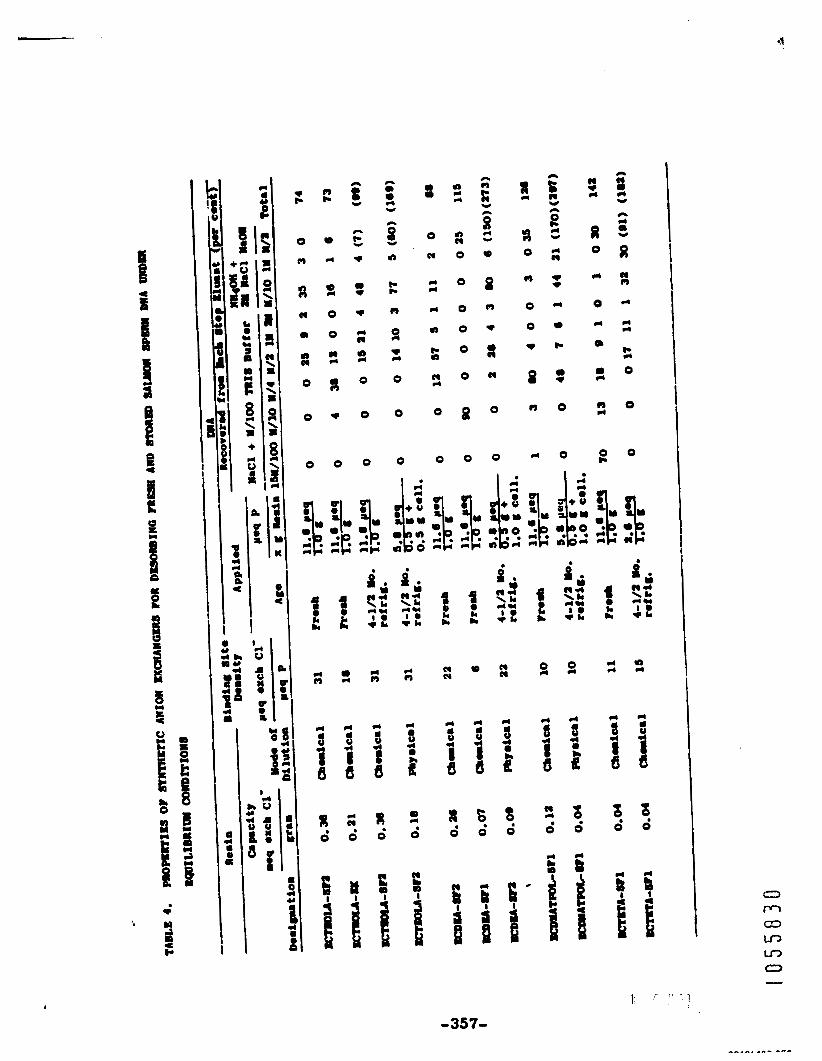
w - r - r -
o c ' o c '
0 0 0 8 0
0 0 - O * 0 0 0 0 0 0 0
I ;
$ 4 E E
n (I
d
4 8
1
(I N
c'
t
6 I
2 r( P)
c u rl
1
8 f Y
s 6
8 d
x d !4
d d (I
d
P ID
ii k
f 3 I
P 4
i (I
P J B
-357-
I
1
of n e u t r a l buffered stock m l u t l o n of slrlmon The A2430 sperm DNA under storage a t 3* gradur l ly lncrea8ed (4 per cant
at 1 week, 5 per cent In 3 woeks). A t r o o m temperature, how-
ever , the change amounted t o 21 per cent in l week and amy
account for high recoverle8 ob8erved with c e r t a i n re.1~8,
e r p e c h l l p mince the equilibrium studiem involvod 8evera l
months a t t he higher temperature.
by r e s o r t i n g t o a base l i n e de t e r r lna t lon between 310 and
230 mp, a8 employed above.
This l n c r e r s e Is halved
(e) 'Ibe properties of 50 re8ins for da8orblng mamullur
l lver -so luble RNA are being screened under equi l ibr ium condi-
tion8 a t
Column Desorption of DNA
(a ) posit ive-Displacemen t - O r 8 dlen t -Elut Ion Dov ice. The
art of chromatography does not ye t allow one t o predict the
1 0 5 5 8 3 1
exrct shape and composition of an e lu t ion gradient for beat
sepa ra t ing a complex mixture; therefor., In prac t ice , one
requires a near llnear gradient that I s reproducibla and sub-
j ec t t o independent manipulation of local portions. There
has been completed and put I n t o opor8tion a **synchrovarigradn
(Pig. 1) capable of providing p8ralle1, continuously;vari.ble
gradient-elut ion of 16 columnlr under Ident ic81 condi t ions
of cons tan t predetermined flow rate. A mlxec, buil t of
-358-
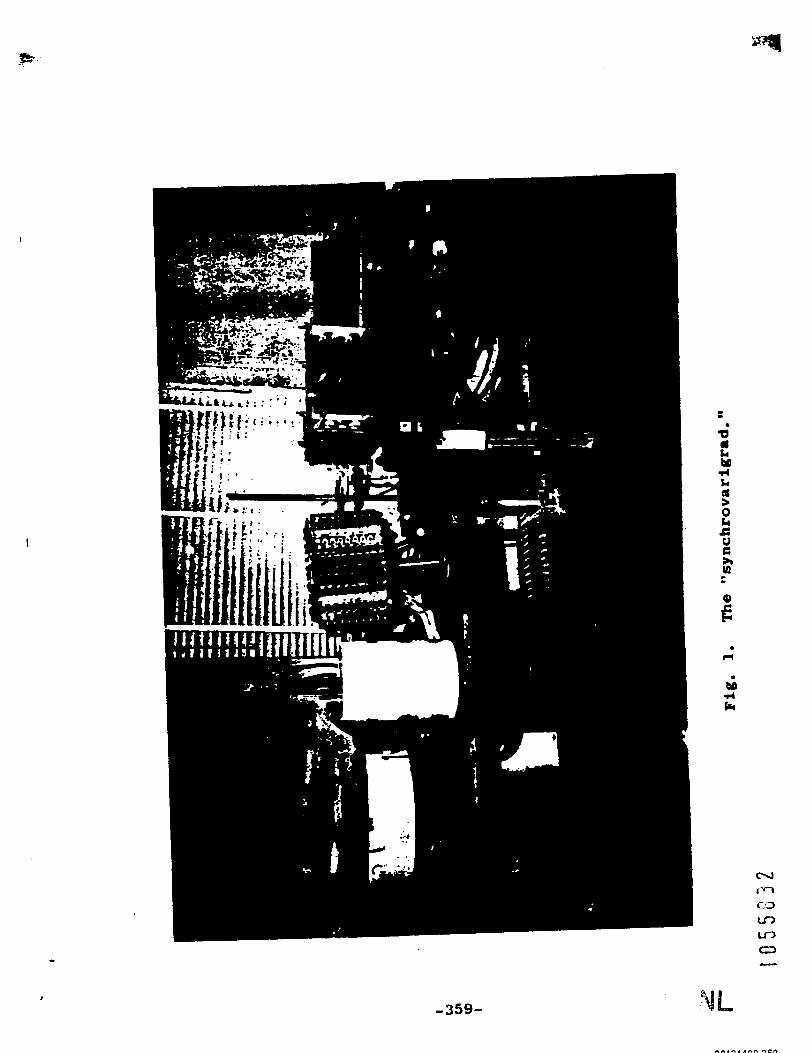
I
I
-359- L
9 identipal stacked Luci te chambers, 18 fed by a posltlv-
dl8plrcoment pump of prec is ion glas8 tubing.
are mounted i n a cage which is suspended i n glmbals and
t i l ted eccen t r i ca l ly , thereby r o l l i n g a glass marble i n each
chamber t o afford continuous mixing.
The 16 mixer8
The chambers are loaded
SUCC888iVOly from t h e bottom upward by pLB8n8 O f a tube pen-
etrating a c e n t r a l lo rd ing por t , which then self-seals by
the a u t o u t i c s e a t i n g of (L f l o a t i n g polyethylene ball . -11
orpcrrtures connect adjoining chambers 180' apart t o circumvent
laminar f l o w .
t he output t o t h e column issues from the top.
of 8pecirl de8ign are sealed with 4 s i l i c o n e rubber O-rings
iub r i ca t ed w i t h s i l i cone grease (Apiezon N for NaOH solut ion8) ,
and a l l connect ions are made by polyethylene tubing threaded
through s i l i c o n e rubber stoppers. A l l pumps ace actuated by
a s i n g l e 1 RPM synchronous motor driving a converted lathe
mechanimr through an appropriate gear box, chain, and S p r ~ ~ l e t .
The column. are packed a t 2. under 5 pal, then c l ipped t o a
metal 8creen immersed i n a stirred water bath automatical ly
maintained. a t 2' by an electrical r e f r i g e r a t i o n coil,
The pump input feeds t h e bottom chamber, and
Pump plungers
C t l i b r r t l o n of t h i s device revealed that each nfxer con-
t a ined an average volume of 964.4 - + 0.6 rl, and each of 8 pumps
del ivered 64 me88ured f r ac t ion8 a t an aver8ge rate of 16.3
- + 0.0 r1/150 minutes. Tha gradient developed lm detemined:
1 0 5 5 8 3 3 -360-
I
I
by the i n i t i a l concent ra t ions charged i n t o each chamber of
t h e mixer and pump.
d i en to obtained by loading t h e ind ica t ed number of upper
Figure 2 p r e s e n t s t h e 9 s l a p l e s t gra-
chombers with water, and t h e r e m i n d e r and pump wi th 2 - Y
NaC1; t h e curves describe t h e t h e o r e t i c a l g r a d i e n t s obtained
from t h e computer program ( 5 ) J while t h e po in t s were deter-
mined by t i t r a t i o n ,
by loading t h e chambers with 8/9, 7/9, 6/9 ..... 1/9 of t h e
l i m i t i n g concentrat ion contained i n t h e pump. A t any t i m e ,
a second gradien t may be superposed on t h e i n i t i a l one by
A t r u l y linear gradien t may be obtained
recharging t h e pump w i t h a d i f f e r e n t solut ion.
apreare t o provide t h e precise c o n t r o l of column environment
requi red f o r meaningful eva lua t io3 of a l a r g e number of
The device
amine-substi tuted anion exchange r e s ins .
(b) Choice of a B a c t e r i o s t a t i c - Agent Compatible w i t h
Materials in t h e Gradient -- Mixer. Ihe b a c t e r i a l growth con- -- t r o l p r o p e r t i e s of t r i ch lo roe thano l , chlore tone (concentra-
t i o n s of 0 . 2 5 , 0 . 5 , and 1.0 per cent) , and of chloroform
( sa tu ra t ion ) were determined by lncubat l a g lo6 spores of
b a c i l l u s s u b t i l i s i n 25 m l of t h i o g l y c o l l a t e broth f o r 7 days
a t 37O. Complete growth i n h i b i t i o n was found with a l l agents
at t h e highest concentrat ion; ch lore toae WIP ef fect ive for
6 days a t 0 . 5 per cent , but i n e f f e c t i v e a t 0.25 per cent;
t r i ch lo roe thano l was e f f e c t i v e f o r 2 days a t 0.5 per cent ,
-361 - ..
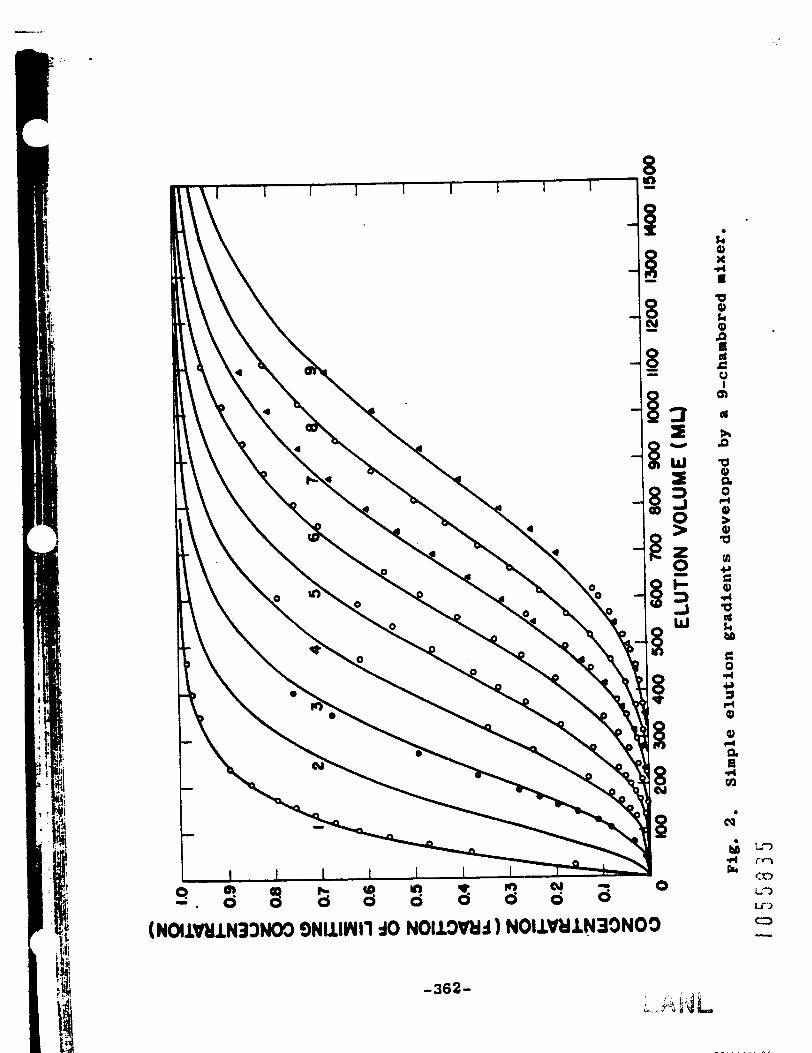
k Q) W r) 0
(d
A P
E 0
but I n e f f e c t i v e a t 0.25 per cent. Inoculat ion of f r e s h
broth with 0.5-ml a l i q u o t 8 from completely Inhib i ted cul-
t u r e s showed t h e mechanism t o be bacteriostatic rather than
bactericidal,
Lose of these reagents from s o l u t i o n through scavenging
was aSSeS6ed by shaking with granulated Luci te In poly-
e thylene bot t les for 4 days, followed by re-assay for hal-
ogenated compound by t h e Fujiwara r e a c t i o n (chloroform
99 per cen t , t r i ch lo roe thano l 20 per cent , and chloretone
relat l v e l y lltt l e loss).
On t h e basis of these f i n d i n g s and spectrophotometry i n
t h e reg ion of 315 t o 240 mp, chloretone appeared the agent
of choice.
(c) Synchronous Column Elution. - Figure 3 i s a s t y l i z e d
graphical presenta t ion of 32 comparative e l u t i o n prof i les ob-
t a i n e d at 2' with 16 r e s i n s (1 g emch) and f r e s h salmon sperm
DNA under con t ro l l ed condi t ions of f low rate, salt gradient ,
and resinDNA binding densi ty ,
spectrophotometrically (Az6* t o A310), and each contained
single smooth peaks e lu t ed by salt and by a lka l i , but In
vary ing proportions.
sodium chloride at threshold, peak, and t a i l of t h e salt peak,
Profiles were determined
The ordinate expresses t h e ro l a r i t p of
The r e s i n s are arranged l a ascending order of per cent elu-
t i o n by salt , and t h e designat ion is preceded by t h e capac i ty
f
1363- I

,,,,,,--+-- Ids - 0 Id33 tl*.o
----
1 I 1 I 0 8 0 8 d 8 d 3 a
-364-

in meq exch Cl-/g.
per cen t non-bound DNA, and p ro f i l e d i s t r i b u t i o n index (per
cen t recovery by a lka l i divided by per cent recovery by ult)
8r8 indica ted fo r each re s in .
The appropr ia te binding s i te densi ty ,
Dotted l i n e s r ep resen t a Fun a t constant DNA lordlag/g
r e s i n (var iab le binding s i t e dens i ty) , chloroform bacterlo-
B t a t , 8nd c o l l o c t l o n rate 10 m1/- minute8; mean recovery
was 100 per cent.
NaC1, 0.5 - M NaOH.
Alkaline e l u t i o n was achieved with 2 Y
Solid l i n e s represent a run a t constant binding site
dens i ty (va r i ab le DNA loading/g r e s i n ) , ch lore tone bacterio-
stab, and collection rate 10 m1/125 minutes; mean recovery
was 110 per cent. A f l a t t e r sal t gradient w 8 8 ueed (Fig. 2,
No. 9, Co 0.015 - M NaC1, 0.01 I M TRIS buffer , CL 0.85 - Y NaC1,
0.01 - M TRIS), slip, d e s p i t e larger binding s i te dens i t i e s . The genera l
increase In profi le d i s t r i b u t i o n Index a t the 2.8 X freter
flow rate is noteworthy and i n d i c a t i v e of pronounced eh i f t
t o higher i o n i c s t r e n g t h wi th depar ture from equilibrium.
The loca t ion of peaks i n t h e ordinate expresses t h e r e l a t i o n
between rise and degree of t a i l i n g .
Only ECTEOLA and ECHMTA exhibited appreciable
Table 5 presen t s mean Sobe values of 8 l g n l f l c a n t peak I
.. f r 8 c t i o n s from t h e slower run, arranged in order of increas-
ing non-bound DNA. It is apparent that these r e s i n s vary
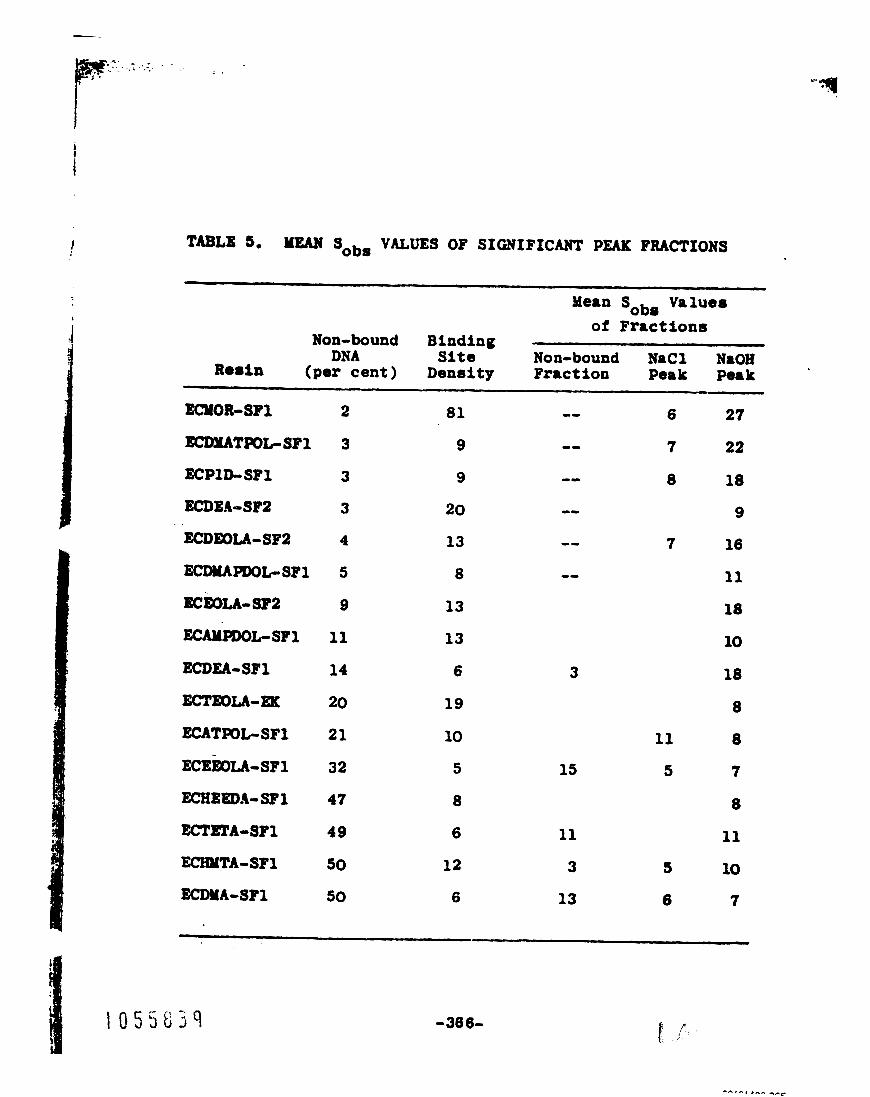
i .
TABLE 5. MEAN Sobs VALUES OF SIGNIFICANT P M FRACTIONS
Mean Sobs Values of Fractions
Non-bound Binding DNA site Non-bound NaCl NaOH R88in (per cent) Density Fraction Peak Peak - 81 00 6 27
2 ECMOR-SF1
-- 7 22 gcwlATpOGSF1 3 9
9 0- 8 18
20 -0 9
13 18
3
3
4
ECDUAPWGSFl 5
9
ECPlD-SF1
ECDEb-SP2 13 00 7 16 ECDEOLA-SF2
-0 11 8
ECEOLA-SF2
ECWPDOL-SF1 11 13 10
ECDEA-SFl 14 6 18
ECTEOLA-M 20 19 8 ECATPOGSFI 21 10 11 8 7
ECHE~A-SFl 47 8 8
ECTETA-SFl 49 6 11 11
ECDMA-SF1 50 13 6 7
5 15 5 ECE~OLA-SF~ 32
10 3 5 ECHYTA-SFl 50 12
6
3
-306-
widely in t he degree t o which they f r a c t i o n a t e a 8 l i p fr8c-
t ion ,
Spectrophotometric determinotion of ba8e r8tio8 (6) in
varioua fractions of a l l 32 p r o f i l e s f8iletd t o r evea l any
signif icrnt va r i a t ions .
Thin-Layer Chromatography
Thin-layer chromatographic techniques afford conrider.
able economy of material i n working ou t opthum condi t ion8
f o r desorpt ion, as w e l l a s providing a convenient procedure
for systematic inves t iga t ion of t h e effects of binding s i t e
dens i ty and binding i n t e n s i t y on t h e mobi l i ty of hydrophylic
*
anions, Resins of l o w , ln termedlate , and high capacity were
tested fo r a b i l i t y t o separate phosphorylated 8denosFne com-
pounds as a func t ion of i on ic s t rength . Resins were ground
in a mortar and suspended In a V i r t i s homogenizer r t nw<irPum
speed for 10 minutes t o ob ta in an appropr i a t e particle size
of approximately 10 p judged by uniformity of t h e layere.
Plates 2 x 20 c m were prepared by masking t h e edges wi th
electrical tape and applying 1 cc of a s l u r r y containfng
150 mg of re s in ,
t i l t i n g the plates, which were then air-dried aad t h e tape
Uniform spreads were obtained by gen t ly
’, removed, Commercial TL+C DEAE-CellUlOSe (BlO-R.d), p l y -
e thy lene in ine (PEI) ce l lu lose , and unrnodif l e d TLC c e l l u l o r e
-367-
were a180 used as test media, In a l l cases except unmod-
i f i e d cellulose, minioral background u l t r a v i o l e t absorbance
permitted i n t e r m i t t e n t monitoring of nucleo t ide migration on
t h e plate8 dur ing development In open dishes. Plates were
developed ascending for times ranging from 45 minutes t o
1-1/2 hours. For comparison In these experiments, 0 . 5 micro-
mole each of AMP, ADP, and ATP were spotted on chromatoplates
and developed with d i l u t e HCl , NaC1, or NH4HC03. Useful
s epa ra t ions were obtained with a l l 3 so lvents , but t he best
resolution was obtained using either ECPEDA-SF2 or ECAHYPD3L-
and ECAEPIPDOL-SF1, Ri values were propor t iona l t o HC1 concen-
t r a t i o n i n t h e region from 0.02 t o 0.05 - M, PEI-cellulose, on
t h e other hand, y ie lded exce l len t s epa ra t ions wi th both
0.05 - Y ammonium bicarbonate and 0.05 - W NaC1.
DISCUSSION J
Sycltematlc sc reening of a l a r g e number of s u b s t i t u t e d
c e l l u l o s e ion exchangers has r e s u l t e d i n t h e recogni t ion of
seve ra l f e a t u r e s of exchange chromatography amenable t o
improvement In column performance.
present s t u d i e s (S) , it uta8 recognized t h 8 t changes In flow
rate caused by resin swell ing altered e l u t i o n profiles, and
that i n t e n t i o n a l i n t e r r u p t i o n of flow rate inva r i ab ly resulte
I d In the course of t h e
-368 -
in t h e generat ion of artifact peaks.
prec i8e con t ro l , however, each emerging peak exhibited only
2 slopes and t h e i o n i c s t r e n g t h requi red f o r d e w r p t i o n be-
came more near ly dependent upon t h e equi l ibr ium conmtant for
a p a r t i c u l a r res in .
adequately c o n t r o l s column environment.
suggest t h n t t h e binding of small n b O l e C U l 0 8 cannot be com-
pared d i r e c t l y wi th t h a t of amcromolecule1.
anomalous from t h e 8tandpoint of fnacromol8cUlrr s l i p , t h u s
demonstrating several f a c t o r s i n f luencing binding. Steric
r e l a t i o n s h i p s which prevent a l l exchange sites from react ing,
such as hindrance between polycation and polyanion groups
and t h e in t e r spac ing of polycatlon groups on t h e m t r i x ,
could account for d i f f e rences in binding of small and large
molecules,
may react wi th epichlorohydrin leads t o a second order of
chemical heterogenei ty d i f f i c u l t t o con t ro l in r e s i n prepara-
tion8. While v a r i a b i l i t y in 8pnthe8i8 i m recognized (e. g.
Under condi t ion8 of
The device described i n t h i s report
There s t u d i e s
waa
The a l t e r n a t e modes by which polyfunct ional amines
=LA), di8curr ion Of the 2188 Of 8 b p l O 8 Y m O t r i C r l WOUpS
t o a t t a i n more chemically uniform binding sites i r perhaps
premature.
S tudies involving the use of unmodified c e l l u l o s e t o
disperse r e a c t i v e r e s i n p a r t i c l e s (heterogtaeous d i l u t i o n )
rad c o n t r o l l e d chemical synthes i8 (homogeneous d i l u t i o n ) may
t 0 5 5 8 4 2 -369-
I O 5 5 8 4 3 -3m -
shed l i g h t on t h e r e l a t i v e i n t e r - and i n t r a - c e l l u l o s e par-
ticle con t r ibu t ion t o binding and t h e e l u t i o n profile.
Tb8 choice of salmon sperm DNA a s a common test material
ha8 both advantages and disadvantages; spectrophotometric
indlc8tions of r e so lu t ion of t h i s gross ly heterogeneous mate-
r i a l are use fu l ly apparent, bu t s a t i s f a c t o r y cha rac t e r i za t ion
by u l t r a c e n t r i f u g a l techniques is d i f f i c u l t . The majority,
but not a l l , of t h e r e s i n s release n a t i v e material more
r e a d i l y thnn denatured. Experiments w i t h degraded DNA were
inconclusive and w i l l r e q u i r e t h e greater r e so lu t ion of col-
umn chromatography and a less heterogeneous s t a r t i n g DYA.
Sose materials appear t o be more e f f e c t i v e chaperones than
other.. fn t h i s regard, it w i l l be of i n t e r e s t t o determine
t h e effect of r e s i n absorption upon s to rage l i fe of nuc le ic
acids.
Continued i nves t iga t ion of r e s i n properties w i l l in-
volve s t u d i e s on performance r ep roduc ib i l i t y , a8 w e l l a s
more p r e c i s e cha rac t e r i za t ion of t h e polynucleotide.
present, it is not known whether any of the r e s i n s can de-
tect d i f f e r e n c e s i n polynucleotide base composition. DNA
fragments from E. coli, Serratia marcescens, and Micrococcus
ly sode ik t l cus w i l l be fractionated, w i t h def in i t ive chemical
analysis rep lac ing cu r ren t optical techniques for base evalur
A t
t ion. Defined molecular weights which can be assigned t o
I
DNA and ZragrPents derived from T-4 phage should disclose the
capac i ty of these r e s i n s t o fractionate on the basis of
molecular weight. Further screening of the equilibrium
behavior of so lub le RNA and other polynucleotides of i n t e r -
mediate molecular weight on these r e s i n s is in progress.
Evaluation of t h e exchangers synthesized i n t h i s Lab-
oratory suggestm tha t t h e i r greatest a p p l i c 8 b i l i t y may l i e
i n t h e separation of o l igonucleo t ides too large for mtisf8c-
t o r y sepa ra t ion by e x i s t i n g resins, and smaller than t h e
h ighly polymeric DXA where they lock t h e s p e c i f i c i t y of col-
umns employing specific polynucleotides as f r ac t iona t ing
meaio. Some promising prepara t ions appear t o be ECDSA,
ECMOR, and ECHMTA; these may also conveniently provide r ap id
sepa ra t ion of mononucleotides and small ol igonucleot ides by
th in- layer chromatography a s evidenced by t h e p r e l b i n a r y
s t u d i e s on phosphorylated d e r i v a t i v e s of adenosine.
It is a n t i c i p a t e d t h a t meaningful evaluat ion and some
design requirements for specific suba t i tu t ed c e l l u l o s e
exchmgers can be r ead i ly a t t a i n e d from the simultaneous
opcrr8tioa of 16 columns under condi t ion8 which allow t h e
r e s i n , g rad ien t , flow r a t e , or m l y a u c l e o t i d e t o be t h e
experimental var iable .
matic spectrophotometric monitoring of t h e e f f l u e n t from
The f e a s l b i l i t y of continuous auto-
16 columns is being invest igated.
1'0 5 5 8 4 il -371-

ACXNOWLEDCYENT
The au thor s g ra t e fu l ly acknowledge t h e assistance of Dr. .
I. U. Boone and M r . and Mrs. E. Campbell in es t ab l i sh ing t h e
efficacy of t h e b a c t e r i o s t a t i c agents, of Dr. G. R. Shepherd
In performing t h e u l t r a c e n t r i f u g a l a n a l y s i s of isolated f rac-
t i o n s , .ad of D r . W. Goad in performing t h e computer ana lys i s
of the t h e o r e t i c a l gradient e lu t ion curves.
REFERENCES
(1) A. Murray, Los Alams S c i e n t i f i c Laboratory Report LAMS-
2455 (1960), p. 138.
(2) A. Murray, E. H. L i l l y , and L. B. Cole, L o s Alamos Sci-
e n t i f i c Laboratory Report WS-2526 (1960), p. 245.
(3) A. Murray, V. E. Mitchell, and D. F. Petersen, Loa Alamos
S c i e n t i f i c Laboratory Report LAMS-2627 (1961), p. 33.
(4) A. Murray, E. H. L i l l y , V. E. Mitchel l , and D. F.
Petersen, Los AlamOS Scientific Laboratory Report LAMS-
2780 (196Z), p. 240.
(5) D. F. Petersen, A. Murray XII, W. Goad, Jr., and J. E.
Larkins, Los Alamos S c i e n t i f i c Laboratorg Report LAYS-
2780 (1962), p. 259.
E. Fredericq, A. Oth, and F. Fontaine, J. Mol. Blol. - 3, (6)
* 11 (1961).
1 0 5 5 8 4 5 -372-
MOLECULAR RADIOBIOLOGP SECTION
PUBLICATIONS
(1) E. Hambury, J. Do Perrings, and D, G, O t t , Thin-
LVer Chromatography Apparatus, J. Chem, Educ. - 40, 31 (1963).
(2) E. Hansbury, J. Langhlm, and D. G. O t t , A Pho-
tographic Method for Recording Chromatograms, J. ChronrPt. - 9,
393 (1962).
(3) G. R. Shepherd and p. C. Sanders, The Complementary
Effects of 2-Yercaptoethanol and Trypsin i n t h e Lysis of HeLa
C e l l s , J. C e l l B i o l . - 14, 346 (1962).
(4 ) G. R. Shepherd 8nd D, F. Petersen, Separat ion of
Phenol and Deoxyribonucleic Acid by Sephrdex Gel F i l t r a t i o n ,
J. Chromatog. - 9, 445 (1962).
(5) G. R. Shepherd and P. A. Hopkine, The Diot r fbut ions
of Certain Prote ins , Polypeptides and Poly.mines in an Aqueous-
Phenol System, Bfochem. Biophys. Res, Con. - 10, 103 (1963).
I ( 6 ) D. L. U l l l i a m s , Sgnthe8iU Of Carbon-14 L.beled Deoxy-
r ibonucleosides , Canad. J. Chem. SD 1742 (1-2) 0
-373-
MANUSCRIErTS SUBMITTED --
(1) D. G. Ott, Oligonucleotides. I. Acetyl and Tetra-
hydropyranyl Derivatives of 3'-uridylic Acid, submitted for
publication as a Los Alamos Sc ient i f i c Laboratory report.
(2) G. R. Shepherd and P. A. Hopkins, Determination of
Protein Contamination of Dsoxyribonuc leic Acid by the Folin-
Lowry Method, submitted to Anal. Chem.
-374-


![3} tj- 7] - OSTI.GOV](https://static.fdokumen.com/doc/165x107/631c4c86b8a98572c10cd705/3-tj-7-ostigov.jpg)