3rd SPERA Workshop - OSTI.GOV
107
INIS-mf—1*669 3rd SPERA Workshop Canberra, February 15-17,1994 PROCEEDINGS (Extended Abstracts) SOUTH PACIFIC ENVIRONMENTAL RADIOACTIVE ASSOCIATION 2 7 Us 0 0
-
Upload
khangminh22 -
Category
Documents
-
view
1 -
download
0
Transcript of 3rd SPERA Workshop - OSTI.GOV

INIS-mf—1*669
3rd SPERA WorkshopCanberra, February 15-17,1994
PROCEEDINGS
(Extended Abstracts)
SOUTH PACIFIC ENVIRONMENTAL RADIOACTIVE ASSOCIATION
2 7 Us 0 0

PROCEEDINGS
of the
3rd Workshop
of the
SOUTH PACIFIC ENVIRONMENTAL RADIOACTIVITYASSOCIATION
(SPERA)
held at
Australian National UniversityCanberra
on
15 - 17th February 1994
ISBN 0 646 22869 2
Enquiries to:G. Hancock or P. Wallbrink,
CSIRO Division of Water Resources,GPO Box 1666,
Canberra, ACT 2601Australia

CONTENTS
Forevvard KM. Matthews (president) 1
The application of 10Be dating techniques to Antarctic soils G. Claridge, 3l.B. Campbell, R.J. Sparkes
The separation of IOBe from sediments R.G. Ditchburn, N.E. Wfjitehead 4
Optically stimulated luminescence dating of a 2000 year old sequence of flood deposits 8A.S. Murray
Measuring soil loss on forest slopes following harvesting - an approach using :'°Pb 9excess to I37Cs inventory ratios PJ. Wallbrink, A.S. Murray
Fallout's trailing edge K.M. Matthews 19
Patterns of tritium movement in a tree following root injection J.R. Twining 24
Tree growth rates determined using naturally occurring radionuclides AS. Murray, 35G. Hancock, G. Brunskill, R. Argent
Uranium-thorium and oxygen isotope studies of a speleothem F. Dyer 36
Dating the time of gully incursion using 210Pb ingrowth J. Olley, A.S. Murray 39
High resolution a°Th stratigraphy and uranium redox-fronts in hemipelagic sediments 40on the Australian continental margin H.H. I'eeh
The use of radium isotopes to estimate the depth of estuarine sediments flushed each 43tidal cycle G.J. Hancock, A.S. Murray, I. T. Webster
The radiochemistry of corals in Spencer Gulf, S.A. NJ. Corlis, H.H. Veeh 47
90Sr and 137Cs deposition in New Zealand and the resulting contamination of dairy 49products - a historical analysis KM. Matthews
Migration of uranium: integrating geochemistry with biomonitoring to predict and 52evaluate its environmental impact S.F. Markich, P.L. Brown, R.A. Jeffree
Bioaccumulation of radionuclides in significant aboriginal bush foods from the Magela 53and Cooper Creek systems P. Martin, G. Hancock, A. Johnston, A.S. Murray

Radionuclide transfer factors in tropical and sub-tropical freshwater ecosystems: why 54they may be different from temperate regions P.A. Jeffree
A study of the transfer of radionuclides to food grown in soils amended with bauxite 55mining residues M.B. Cooper, P.C. Clarke
Radiological aspects of land application of effluent water from uranium mines in the 56Alligators Rivers region R. Akber, P. Martin, R. Marten, J. Pfitzner, S. Paulka
Apparent differentiation of thorium isotopes in high volume dust samples 57A.P. Summerton
Evidence for the environmental mobility of thorium from three soil profiles J. Olley, 59A.S. Murray
Environmental/laboratory equivalence: A fundamental calibration question R.G. Lyons, 60B.J. Brennan
Evaluating the global radon source S. Whittlestone, W. Zahorowski 61
Recoil sputtering N.E. Whitehead 62
Measurements of very low-level radioactivity with HPGe detectors installed in the 80Morane underground laboratory }'. Bourlat, J. Millies-Lacroix, A. Laiour
"6Ra determination in environmental samples using three different counting techniques 86R. Tinker, J.D. Smith, M.B. Cooper
Counting of live mussels on a HPGe detector P. Martin, R.A. Akber, R. Marten 87
Poster abstracts
High volume dust monitoring at Olympic Dam J.R Davey 98
The tropical freshwater bivalve Velesunio Angasi as a real-time biosensor of uranium 99levels in natural waters S.J. Markich, R.A. Jeffree, P.L. Brown
Cross-calibration discrepancies in environmental gamma dosimetry R.G. Lyons, 100B.J. Brennan
List Of Participants 101

Foreward
The 1994 Environmental Radioactivy Workshop held at the Australian National University,Canberra, Australia, 15-17 February, was the third such workshop of the South PacificEnvironmental Radioactivity Association (SPERA). Informal workshops were heldperiodically in Australia during the 1980's and it was during the last of these meetings inAdelaide (1990) that the idea of forming an association of scientists working withenvironmental radioactivity issues was first mooted. The favourable response to thesuggestion led to an inaugural meeting of SPERA in Tahiti in 1991, kindly hosted andsponsored by the Laboratoire d'Etude et de Surveillance de 1'Environment (LESE), at whichthe association was formally set up. In June 1992 SPERA was registered in South Australiaas an Incorporated Association.
The primary objective of SPERA, as stated in its constitution, is to encourage and facilitatecommunication among scientists working in the South Pacific region in the field ofenvironmental radioactivity, which involves the study of the occurrence, behaviour andimpact of radioactive species present in the environment due either to natural processes orresulting from human activities.
This objective is met primarily through the holding of "environmental radioactivityworkshops" at a frequency agreed at the Tahiti meeting of once every two years. Otheractivities of SPERA include the distribution of a biannual Newsletter and periodic analyticalintercomparisons. Joint studies may arise from the Workshops as well.
The second of the Association's workshops was held at the University of Otago, Dunedin,New Zealand, 24-26 August 1992, two years after the 1990 Adelaide meeting (with the 1991Tahiti meeting being regarded as extraordinary and therefore not in the two year cycle).Apart from being an interesting scientific meeting in itself, the Dunedin meeting will beremembered by many delegates as the time of the "big snow". The 1994 Canberra workshop,was climatically the opposite, however it did continue the pattern of high quality informativepresentations and provided a stimulating forum for the exchange of ideas. The largerattendance than that of the Dunedin meeting fostered lively debate. Scientists at the workshoprepresented a wide range of diverse organisations; ANU, ARL, ANSTO, AustralianGeological Survey, CSIRO, NSW EPA, Olympic Dam, OSS, Radiation Health WA, SAHealth Commission, and Flinders and Melbourne Universities from within Australia; Instituteof Geological and Nuclear Sciences, National Radiation Laboratory, and University ofAuckland from New Zealand; and LESE from French Polynesia.
Presentations were grouped generally around the themes of chronology, environmental impactand analytical techniques. The invited plenary speaker, Dr Graeme Claridge of New Zealand,is a soil scientist with a keen interest in Antarctica and his presentation and participationeffectively broadened SPERA's horizons to include the southern extremity of its "SouthPacific" region.
This volume of extended abstracts shows the wide range of interesting papers presented andthe nature of the work being conducted by SPERA members in the diverse organisations theyrepresent. As President, I commend all the authors on the quality of their work andpresentations, and thank them for the effort they put into making the meeting a success.
1

On the final afternoon of the workshop an open forum was held at which generalradioanalytical issues were discussed, with exchange of tips and ideas - such discussionsshould be encouraged and perhaps further developed at future meetings.
A special tribute was paid to Chris Poletiko (then working at LESE) as a founding member ofSPERA. In addition to helping to put forward the concept of the formation of SPERA in thefirst place, it was through Chris's efforts that the 1991 meeting was held in Tahiti and he hasbeen a constant source of encouragement for the organisation. Members are also very gratefulto Sue Brown (ANSTO) for her efforts in producing 2 newsletters per year. Although itshould be noted that her editorial job is only possible to the extent that members supplymaterial!
Thanks also to Peter Wallbrink and Gary Hancock of CSIRO's Division of Water Resourcesfor organising and conducting a successful Environmental Radioactivity Workshop and forpublication of this book of extended abstracts. On the social side, the SPERA tradition of anevening spent tasting local wines, which began in Dunedin, was firmly established at Canberra,though we appreciate that this may be a hard act to follow at the next venue - Darwin, 1996.
See you there,
Murray Matthews
President

The application of Beryllium-10 dating techinques toAntarctic soils
G G C Claridge1: I B Campbell1 and R J Sparks2
1 Land and Soil Consultancy Services, 23 Viewmount Nelson.2 Nuclear Sciences Division, Institute of Geological andNuclear Sciences, Gracefield, New Zealand
The soils of the ice-free areas of Antarctica have formedunder the coldest and driest climate on earth and in thealmost complete absence of any living matter. Neverthelessthey are regarded as true soils and their study has led tofurther understanding of the soil-forming process. With time,Antarctic soils show increasing development of suchcharacteristic features as a desert pavement, staining of thesurface horizon, salt horizons and coherence.
It is possible to place a sequence of soils in order ofrelative age, judged by the degree of development of theseweathering features. Soils range from very young and littledeveloped, to strongly stained soils with fine textures due tothe crumbling and disintegration of many of the coarser'stones, and with thick salt horizons. Using these criteria,soils can be placed in a series of weathering stages.
The youngest soils can be dated by correlation withthe most recent ice advances of the Quaternary, some 20,000years ago, while soils of the fourth weathering stagerecognised are considered to be around 3-4 million years old,judged by the relation of the tills on which the soils areformed to debris from small basaltic eruptions which areclearly younger than the present topography, and lie on oldertill surfaces, or are included in younger tills! Accordingly,the soils of weathering stage four are considered to be morethan 3.5 million years old, while soils of weathering stages5 and 6 must be several times older, by extrapolation. Thisimplies that the ice-free areas of Antarctica have beensubjected to climatic regimes much like that of the presentday for a very long period of time.
More recently however, evidence has been found of depositsthat are older than the soils of weathering stage 5 or 6 andwhich appear to predate much of the present topography. Thesedeposits, which are found at altitudes of over 2000m in theTransantarctic Mountains, contain diatoms which give them anapparent age of 2-3 million years. Thus, some otherindependant method of dating surfaces needs to be found in orderto resolve this apparent conflict.
In a cold arid climate with no reworking of the surfacematerial and no leaching, the total quantity of 10Be in a soilshould be a function of time. The 10Be content of some soilsof weathering stage 5 was measured by accelerator-massspectrometry. Making assumtions on the rate of influx of 10Be,ages of up to 8my were indicated.

THE SEPARATION OF 10BE FROM SILICATES
R.G.DITCHBURN AND N.E.WHITEHEADInstitute of Geological and Nuclear SciencesP.O.Box 31-312, Lower Hutt, New Zealand
ABSTRACT
An improved method of separation of cosmogenie 10Be from soils and sediments has been developed.10Be is either leached from samples with 6M HCl, or if necessary, sediments are totally decomposedwith HF and KF fusion. This paper concentrates on the latter. All of the iron, most of the aluminiumand some titanium are complexed with EDTA and retained in solution during a series ofBe(OH)2 pre-cipitations. Remnant aluminium and beryllium are leached from the last titanium/aluminium/berylliumhydroxide precipitate with NaOH. A small cation exchange column in fulfateform is employed for thefinal purification of Be from Al and the overall yield is about 90%.
Keywords: Be-10, sediments, cation exchange, ion exchange, radiochemistry, EDTA, Be.
1 INTRODUCTION
The cosmogenic radionuclide 10Be has already proved useful to date a variety of materials, includingsoils (Monaghan et al., 1992), oceanic particulates and sediments (Lao et al., 1993), ice (Nishiizumi etah, 1983), and volcanic rock (Tera et al., 1986) using accelerator mass spectometry. The Be must bechemically separated from the parent matrix in pure form, and this can be difficult if there is a largemass of matrix to be processed.
If 10Be has been deposited in the sample from the atmosphere, it is possible to remove it by leaching,and subsequent processing of the leachate. In some studies however, it is essential to analyse the bulkmatrix, for example, volcanic rocks, which may contain some subducted material including 10Be (e.g.Monaghan et al. 1988).
This paper describes the current state of our Institute's methods, which are still evolving, concentratingon the analysis of whole rocks which generally presents most problems. It follows and supersedes anumber of internal reports, which represent earlier stages of development (Ditchburn & McCabe, 1991,Wilson & Ditchburn, 1992, Ditchburn, 1993).
2 METHODS
The method can handle as much as lOg of pulverised whole rock. The first step is dissolution of thematrix and at this point 1 mg of Be is added as carrier. Carbonate fusions may be used fnr matrixdissolution but produce solid "cakes" which are slow to solubilise and silicate still has to be removed,so alternatives were explored. Sample dissolution is now done in two stages; most of the silicate is firstdecomposed with HF/HN03 in Teflon overnight and the residue is then separated and fused with asmall amount of KF. Meanwhile the HF/HN03 solution is evaporated in platinum. Fluoride and SiFare eliminated from both fractions by pyrosulfate transposition (Sill et al. 1979) in which concentratedH2SO4 is added to the solid fluoride mass, which has been transferred from one platinum basin toanother. This variation on the procedure of Sill, reduces the quantity of KF so that evolution of HF andH2S04 is minimised during the pyrosulfate transposition. This is desirable because it is not possible toremove H2S04 from the fume-hood exhaust gases even with a conventional water curtain.

The cake is dissolved in dilute HC1, diluted, boiled and filtered to remove any BaSO4. The amounts sofar found have been very minor, but this step may be important if a significant quantity of Ba is presentin the sample. If the original sample was leached with 6M HC1 (one hour at 100 C), the leachate isprocessed with the remainder of the method only from this point on.
In a series of hydroxide precipitations, EDTA (in dilute NH4OH) is added to the filtered solution whichis then adjusted to pH 9 with NH4OH. Stability constants for the EDTA complexes are in the orderFe>Ti>Al>>Be so most of the major matrix elements remain in solution when-the mixture iscentrifuged to recover the Be/Al hydroxide and are discarded. To prevent loss of Be, the final EDTAconcentration should not exceed Ig per 100ml. Generally 8g of EDTA in about 800 ml of solution issatisfactory for the first precipitation; thereafter the amounts of EDTA and solution volumes are madesmaller. In the event of "overshooting" the EDTA, aluminium can be added until a permanentprecipitate exists. The mixture is then acidified and made ammoniacal again.
After two or three precipitations, iron has been eliminated and the bulk of hydroxide is considerablyreduced. It often contains much more Ti than expected, due to the strong tendency of that element tohydrolyse despite the presence of complexing agent. Unless the excess of Ti is removed, further EDTAtreatments are ineffective in reducing the amount of hydroxide. The precipitate also becomes slow toflocculate, difficult to centrifuge and some Be will be lost.
Be and Al are extracted from Ti by leaching with cold NaOH, only a very small amount of Ti goinginto solution. After acidification and boiling to expel carbon dioxide, two more precipitations in thepresence of EDTA leave Be and traces of Al and Ti in the hydroxide precipitate to be separated afterdissolution in acid, by ion exchange. (Note that leaching the original bulk precipitate with NaOH doesnot extract all the Be.)
A drop of hydrogen peroxide and 0.25 ml H SO is added to dissolve the precipitate. It is diluted to0.25 M H2S04 and added to a 5 ml Biorad AG 50X8 column in Teflon preconditioned with the samereagent. Such a small column is possible because of the preliminary purification steps. Any remnant Ti(as amber TiO ,nH20) is eluted in the first 15 ml. Be follows in the next 15 ml which is collecteddirectly into a Pt basin. The Al remaining on the column is stripped with 25 ml of 2.5 M HC1.
The Be solution is partially evaporated and 1.0 ml HC1 added prior to taking to dryness and roastingfor 2 minutes. A few drops of 9M H2S04 is added and the evaporation repeated to concentrate the Be inone spot and eliminate boron. It is then combusted for 10 minutes. Beryllium sulfate decomposes directto the oxide, which then is made into a target for the accelerator. Yields from carrier addition tofinished accelerator target are normally about 90%.
The blank value at present is 4 x 10"13 IOBe/9Be. This is almost identical to previous values reported byother workers when the Be used as a carrier is from a laboratory supplier. The signal to noise ratioimproves if one uses the minimum Be carrier possible and the maximum sample weight, as in thepresent method. In principle it is also possible to reduce the blank levels by an order of magnitude byprocessing natural crystals of beryl from selected locations to produce an in-house supply of purer Be.
3 DISCUSSION
In any similar radiochemical purification, there is always a problem with elimination of the bulk matrix.Ion exchange methods are easily overloaded and can easily give poor separations. The power of ionexchange is best reserved for relatively pure solutions towards the end of the process.
There are quite a range of other methods in use in various laboratories. Some are much simpler,because they are dealing with a very simple matrix. Thus the work of Nishiizumi et al (Nishiizumi etal., 1983) dealt with analysis of ice for Be. The- Jid not have to eliminate large quantities of Fe, Al
and Ti. They used solvent extraction of Be ia the fonn of aa acetylacetooe cos lex into -carbontetrachleride, a cation exchange step, and final precipitation of Be as the hydroxide followed bycombustion to the oxide.
Ferromanganese nodules (Sharma et al., 1987) are also a simpler matrix, containing relatively little Aland Ti. Cation exchange separation from Fe and Mn in chloride medium is the major step.
One method applied to many samples (Tera et al., 1986) involved use of an anion column in thefluoride form, and elution of the other elements with 20 1 (!) of M HF. The Be attached itself to thecolumn as a fluoride complex and was later eluted with M HC1. However if the rock was calcium richthe yields were rather low. The authors therefore switched to a method in which an initial Al/Fe/Tiprecipitate was dissolved in HBr. Fe and Ti were selectively precipitated at pH 4.2 and Al and Be at pH9. Further precipitation at pH 5 in the presence of fluoride retained Be in the supernatant, whence itwas recovered and further processed.
Another method (Monaghan et al, 1992), for soil analysis relied on preliminary cat'ion exchangeseparations in chloride media, followed by selective hydroxide precipitations in the presence offluoride. Reversing this order is probably preferable.
Lao et al. 1993, reported a complex method for sediments partly because it required analysis of the U-series radionudides as well. However even the Be analysis section was very complex. After an initialhydroxide precipitation and solution in 9M HC1, Th, Al and Be passed through an anion column in onefraction. A pass through a anion column in nitrate form removed the Th. Further purification on cationcolumn in chloride was followed by an acetylacetone extraction, followed by extensive treatment withconcentrated nitric acid to remove organics. Yet another cation exchange step in weak chloride gave afraction pure enough for target preparation. A simpler method would be advantageous.
Most of these methods only deal with about 1 g of material or are restricted to very simple matrices.The present method can accept as much as 10 g of rock. It lends itself to preparation of a number ofsamples simultaneously.
Fresh ammonia solution should be used. Old stock may have attacked the glass containers andintroduced silica and boron into the solution. Silica may interfere with Be(OH)z precipitations, andboron could interfere with the final accelerator analysis, although in theory it is eliminated byvolatilisation. It is a bad principle to introduce possible contaminants that need to be removed later, sothis method has been designed to avoid glass surfaces where possible, and a final precipitation withammonia beyond the ion exchange step is not needed.
Safety must always be a consideration in such a process. It is rather ironic that although 10Be is beingisolated which is of negligible radiological concern, the accompanying stable Be is toxic to such anextent that it should be treated as though it were a rather hazardous radiochemical. The present methodoffers one interesting advantage from the safety point of view. If liquid fractions from other methodsare spilt, and dry, Be may be then carried round the laboratory by air currents and breathed in. In thepresent method, sulfuric acid is used as a reagent which remains liquid at room temperature, lesseningthe problem.
4 CONCLUSIONS
The method described is simpler than some described in the literature, while maintaining good yieldsand yielding targets which are pure and give consistent beams in the accelerator. Its ability to handlelarge quantities of sample, is a distinct advantage. It may also be slightly safer than some existingmethods.

5 REFERENCES
Ditchburn RG, 1993. Provisional manual for separating 10Be from sediments. Version 2. Client report1993/14. Institute of Geological and Nuclear Sciences, Lower Hutt, New Zealand.
Ditchburn RG & McCabe WJ (eds), 1991. Provisional Manual For Separating 10Be From Sediments.DSIR Physical Sciences Manual 10. Department of Scientific and Industrial Research, LowerHutt, New Zealand.
Lao Y, Anderson RF, Broecker WS, Hofmann HJ & Wolfli W, 1993. Paniculate fluxes of 230Th, ^Paand 10Be in the northeastern Pacific Ocean. Geochimica et Cosmochimica Acta 51, 205-217.
Monaghan MC, Klein J & Measures CI, 1988. The origin of beryllium-10 in island-arc volcanic rocks.Earth and Planetary Science Letters 89(3-4), 288-298.
Monaghan MC, McKean J, Dietrich W & Klein J, 1992. 10Be chronometry of bedrock-to-soilconversion rates. Earth and Planetary Science Letters 111, 483-492.
Nishiizumi K, Arnold JR, Elmore D, Ma X, Newman D & Gove HE, 1983. 36C1 and 53Mn in Antarcticmeteorites and IOBe-36Cl dating of Antarctic ice. Earth and Planetary Science tetters 62, 407-417.
Sharma P, Klein J, Middleton R & Church TM, 1987. Aluminium-26 and beryUium-10 in authigenicmarine minerals. Nuclear Instruments and Methods in Physics Research B29(l-2), 335-340.
Sill CW, Hindman FD & Anderson JI, 1979. Simultaneous determination of alpha-emitting nuclides ofradium through californium in large environmental and biological samples. Analytical Chemistry51, 1307-1314.
Tera F, Brown L, Morris J & Sacks IS, 1986. Sediment incorporation in island-arc magmas: inference?from 10Be. Geochimica et Cosmochimica Acta 50, 535-550.
Wilson GS & Ditchburn RG, 1992. Beryllium Systematics In Rock Materials And Its Separation AndPurification For Measurement On An Accelerator Mass Spectrometer. DSIR Physical SciencesReport 53. Department of Scientific and Industrial Research, Lower Hutt, New Zealand.

OPTICALLY STIMULATED LUMINESCENCE DATINGOF A 2000 YEAR SEQUENCE OF FLOOD DEPOSITS
A.S. Murray, CSIRO, Division of Water Resources, PO Box 1666, ACT "2601,Australia
Abstract
Understanding the effects of European arrival on the Australian landscape oftenrequires the ability to read the sedimentary record preserved in lakes, reservoirs and floodplains. This cannot be done with sufficient precision using I4C, and only occasionally using:"Vb. The technique of optically stimulated luminescence (OSL) dating has been tested in ayoung sequence of flood deposits, to determine whether it offers sufficient precision andaccuracy. This method uses quartz as a natural dosimeter; it is annealed by last exposure tosunlight, and then records the natural dose rate during burial. The latter is estimated byanalysis of the natural radioactivity concentrations of the burial matrix. The youngest dateobtained was 128±15 years, and two dates of 300±25 and 1950+130 years compare veryfavourably with 14C dates of 300±80 and 2010±210 years. It is concluded that OSL datinghas great potential in studies of sedimentation rate over the lat few hundred years.

'Measuring soil loss on forest slopes following harvesting
an approach using 210Pb ss to137Cs inventory ratios"
P.J. Wallbrink and A.S. Murray
CSIRO, Division of Water Resources, P.O. Boxl666, ACT, 2601
Abstract: Measurements of the anthropogenic nuclide I37Cs have been routinely used to measuresoil movement on hillslopes. However, 137Cs heterogeneity across the landscape may not resultfrom soil redistribution alone as there is considerable variability in the fallout of !37Cs due to rainshadowing and small scale runon - runoff processes. As the deposition of210Pb (excess) is similarlyaffected by these processes taking the ratio of these two nuclides may effectively remove them assources of variability, and thus provide a more constant benchmark across undisturbed landscapes.In addition to the above, these two nuclides also have different penetration characteristics inundisturbed soils and the core 137Cs/210Pb inventory ratio changes as a function of depth.Consequently, a new method is proposed that involves first determining this change in core ratioat a 'control1 location where no soil loss is believed to have occured, a number of soil samples arethen obtained from the disturbed location and the average inventory Pb/Cs ratio of these iscalculated. The volume of soil that has been removed from the disturbed site can then becalculated by the extent of depletion of this ratio compared with the ratio curve from the 'control1
site. This technique was applied to two harvested forest slopes in N.E. Tasmania which hadundergone 'normal' and 'minimal impact' logging procedures. The average core inventory ratio atthe 'control' location was 2.4 ± 0.2, compared to the means of 0.72 ± 0.1 (n=10) and 1.62 + 0.3(n=10) from the normal and minimal impact sites. These indicate average depth losses of 41 ±5mm and 16 + 3 mm and are equivalent to a nett soil loss of 450 + 50 and 165 + 301 ha"1
respectively from these slopes. It is proposed that this method offers an improvement over using137Cs alone.
Introduction:
Redistribution of fallout 137Cs has been widely used to determine patterns and rates of soil loss andsediment accumulation (Sutherland and de Jong, 1990; Ritchie and McHenry, 1990; Kachanoski,1987 and Loughran et al., 1990). Generally, an input or reference value of 137Cs is derived towhich soil inventories of 137Cs in erosion or deposition sites are then compared, and a review ofthis technique can be found in Ritchie and McHenry, (1990). The use of 137Cs often relies on theassumption that the deposition of 137Cs is uniform. However, Wallbrink and Murray (1994a)showed that deposition of 137Cs may not be uniform, and that variability can be large. Often manysamples need to be analysed to reduce the uncertainties on reference values, Fredericks andPerrens, (1988) and Sutherland, (1991) and it is possible that comparisons of the 'input' value pointvalues from suspected eroded or deposition sites may be in error.
It is proposed that some of the inherent variability in 137Cs distribution may be reduced by thecomparative use of 137Cs and 210Pbexcess. These two nuclides are predominantly deposited by

rainfall, and consequently their distribution may be similarly affected by rainsbadowing anddifferences in soil permeability. The ratio of the total inventories of these nuclides should remainmore constant across undisturbed landscapes. This ratio will also reflect soil erosion staus indisturbed areas. Differences in these values can then be compared to a control curve derived fromthe differential nature of penetration of these nuclides from within an adjacent reference area.
In March and April 1991 the Tasmanian Forest Commission logged parts of the St Helens stateforest (Tasmania, Latitude 42°S, Figure 1) as part of an experimental program to examine erosionunder two different harvesting conditions. The first represented their standard logging practices(Plot 2) and the second was a minimal impact approach (Plot 3), it was expected Inat soil loss fromPlot 2 would exceed that of Plot 3. This presented an ideal opportunity to test the Pb/Cs methodalongside the more traditional '"Cs technique.
Consequently, this paper presents and tests a new quantitative method for determining soil loss,based on comparison of areal averages of 2IOPb/137Cs inventory ratios with a calibration curvederived from measurements of fine layers of soil in a 'control' location. This method is thenapplied to two harvested forests and comparisons of the traditional 137Cs technique with the newmethod are made. Reasons for differences between these are explored.
Site description and sample treatment
The St Helens forest is dry sclerophyll and consists predominantly of Eucalyptus seberii. Theunderstorey is largely nonexistent due to frequent burning. The lithology is predominantly granite,with outcrops occurring on ridgetops and some slopes. All the measured plots had slopes less than15°, and the soils here are described as yellow podzolics which have been formed on adamellitegranites. They have shallow, 2-15 cm, sandy A-horizons which overlay yellow gravellysandy/loams, and are classified as Uc2.21 (Northcote)(Nielson, Tas. For. Com., pers. comm.).
After the forest was logged a series of 400 m"2 plots were cordoned off (Figure 1): Plots 1 and 4were adjacent to each of the harvested areas and left as control sites: Plot 2 had been subject to .standard harvesting procedures that included crown and stem removal from the site and soil banksto 60 cm high pushed up by bulldozers to reduce water flow over the disturbed soil; and Plot 3which had a 'minimal impact1 harvest in which crowns and waste were left on site, vehiclemovement over the area was kept to a minimum and no soil banks were installed.
The radionuclide concentration of the soil from each of the representative areas was measured bytaking between 9 and 10 representative soil tubes from within each plot. The tubes had a diameterof 100 mm and depth of 300 mm and contained approximately 2500 g's of soil. Each tube wassectioned in the laboratory and measured independently to improve 2IOPbex resolution. All sampleswere oven dried, ashed at 400° C to determine Loss on ignition, then analysed by routine gammaspectrometry for 137Cs, "6Ra and 2l°Pb as described by Murray et al., (1987). All samples werecounted for a minimum of 85 K sees.
Soil loss at St Helens using I37Cs
There are several methods available for converting percentage '"Cs loss to soil loss rates andinclude: empirically derived relationships between the reduction in l37Cs activity and soil loss suchas those developed by Elliott et al. (1990) and Ritchie and McHenry, (1975); theoretical modelssuch as the proportional method of Kachanoski (1987); the gravimetric method , Brown et al.,
10

(1981); profile distribution models, Zhang et al. (1990) and mass balance models, Fredericks andPerrens, (1988). A review of these is given in Walling and Quine, (1990). With the exception ofZhang et al., (1990) these methods are derived for use on cultivated soils, which assume mixing ofl37Cs to at least the depth of the plough layer, and also calculate rates of loss in terms of an annualaverage and are therefore not applicable to the current study in which loss is essentiallyinstantaneous, the soil is uncultivated and the nuclide is concentrated toward the soil surface.
Nonetheless it is possible to compare 137Cs depletions from the harvested plots as an indicator ofpotential ioss. The reference value of 137Cs in the St Helens forest can be taken as the average ofthe twenty cores taken at the undisturbed forest plots 1 and 4 (810 + 90 Bq m"2). This can becompared to the average 137Cs values of713 + 86 and 689 + 106 Bq m"2 at the disturbed sites 2and 3, giving relative 137Cs depletions of 12 and 15 % respectively at these sites. These depletionsimply that plot 2 has undergone less erosion than plot 3, although the uncertainties on the averageplot values strongly overlap and suggest that there is no real difference between them. This isprobably because 137Cs profiles at St Helens do not have a surface maximum and there is reducedsensitivity for measuring surface erosion processes. As a result of this comparisons of 137Csdepletions are not able to discriminate between the effects of the two plot treatment processes.
Soil loss at St Helens using 210PbeiCMJ
Useful separation between the two sites is achieved however if a similiar approach is undertakenwith the 210Pbcx data from the same samples. Measurements in soils show that 2l°Pb (excess) has astrong maximum at the surface (Matthews and Potipin, 1985; Nozaki et al., 1978), because of itsconstant replenishment with rainfall and strong chemical reactivity. Thus, 210Pbtx has betterresolution and sensitivity than 137Cs within the upper sections of soils due to its greater rate ofchange with depth. The average flux of 210Pbexcess from the 'reference1 plots 1 and 4 is 1,821 +239 Bq m"2, and can be compared to the average inventory values of 497 +118 and 1010+110Bq m"2 from Plots 2 and 3, which represent 73 + 24 and 44+10 % relative depletions respectively.Clearly Plot 2 has had a greater proportional loss of 210Pbcxthan plot 3, and when these areintegrated over the 210Pbexces, profile suggest losces of 20 + 6 and 11 + 3 from 2 and 3 respectively.This is reasoneably consistent with the observed losses. However, because 210Pb is subject to thesame fallout and distribution effects as l37Cs, the uncertainties involved using 210Pbexcess alone aresignificant. Nonetheless it is encouraging that estimating the proportional depletion of 210Pbproduces sensible results, this suggests that it should receive further attention elsewhere.
A new approach using 2l°Pb/U7Cs ratios
Theory
An alternative to these proportional depletion approaches is to measure the inventory ratios of210Pbexcess to 137Cs in the 'reference' and disturbed parts of the landscape. This may reduce theirinherent variability as both are predominantly deposited by rainfall, and their distribution could besimilarly affected by rainshadowing and differences in soil permeability (Wallbrink and Murray,1994). The ratio of the inventories of these nuclides should remain approximately constant andhave reduced variability at reference sites. Alternatively, the addition or removal of soil willchange this ratio at disturbed regions of the landscape. These changes in ratio can then bequantified by comparing them with their ideal measured distributions in an 'undisturbed' location.
11

A characteristic of these two nuclides is that they have different depth distributions in undisturbedAustralian soils. Because these nuclides are distributed differently within the soil profile, the coreinventory ratio value of (2IOPbexcess to 137Cs), is unique at different depths. This change in2IOPb/137Cs ratio with depth can be observed if the soil is measured quite precisely in thinincrements, at a location where no soil loss is believed to have occurred. The cumulativeinventories of each nuclide can be calculated from depth by summing the areal concentrationswithin each increment towards the surface. The lowest value occurs at the profile bottom, as theradionuclide activities reach detection limits, and the maximum value occurs at the soil surface,therefore the 'control' curve is defined by the nuclide which has the shallowest penetration. Fromthis a calibration curve of ratio change in uneroded soil conditions can be derived in which the coreinventory ratio at depth x represents the ratio of the sum of the areal concentrations of 210Pb and137Cs remaining in the soil below that point. Confidence can be placed in this 'control' location if ithas the same overall inventory ratio as the average from the reference plots. In this case theirsimiliar proportions imply that the 210Pbexand I37Cs soil distributions are representative.
Having established a mean 'reference' area Pb/Cs inventory ratio and derived a useful 'control'curve that has the same net ratio as the 'reference' it should be possible to interpret changesobserved in ratios elsewhere. For example a change in inventory ratio can occur by the removal of210Pbexcess enhanced surface soil, in which case the mean ratio value would decrease as soil isremoved. The measured ratio can then be interpreted by matching it with the 'control' calibrationcurve. The point of intersection of the 'disturbed1 ratio value with that on the 'control' determinesthe amount of soil required to remain in the landscape to support that inventory ratio. It is thenpossible by difference to calculate the depth of soil removed. If the soil density is known thenmm's depth loss can be converted to a mass loss in t ha"1.
Other factors which make 210Pb excess useful as a comparative element to 137Cs in soil loss studiesinclude i) its strong binding to soil particles and subsequent redistribution within landscapes bysoil erosion processes ii) the input value, and variance, can be measured independently in the samemanner as 137Cs and iii) it is a gamma emitter at 46 KeV and can be measured at the same time as137Cs by routine gamma spectrometry.
Sampling strategy and results:
The mean 210Pbexcess/137Cs inventory ratio was calculated for each plot by averaging the inventoryratios from each of the soil tubes within that plot, in turn derived from the individual 137Cs and210Pbexcess measurements. At the disturbed plots 2 and 3 these were 0.72 +.09 (n=10) and 1.62+.28 (n=10) respectively and compare with the values of 2.25.0.2 (n=20) derived from theaverage of all cores taken within the undisturbed 'reference1 plots 1 and 4.
A 'control' core was taken from Plot 1 using the routing method described by Wallbrink andMurray, (1994b) in which successive depth layers of soil are obtained from the surface down(Figure 2). This method allows vertical depth sampling at 1 mm depth increments to 30 mm andthen 10 mm increments to 300 mm. Surface area was 0.16 m2 in the top 30 mm and 0.04 m2 forsamples below 30 mm. In these soils the median grain size was in the 250-500 u.m range,indicating a useful minimum vertical uncertainty of about 0.5 mm in these soils.
The total core inventory of both 210Pbexcess and 137Cs from the undisturbed Plot 1, werecalculated to be, 1530 + 80 and 620 + 40 Bq m'2. These were determined by summing the arealconcentrations from each depth increment in the core with the layer above it (Figure 2) starting
12

from the base. The change in core inventory ratio with depth was then plotted (Figure 3). Thisgives a total core inventory ratio of 2.4:1 which agrees well with the average 210Pbexcess/137Csinventory ratio derived from the 'reference' plots (2.25 + 0.2).
Net soil loss at St Helens
To determine average soil loss from sites 2 and 3 their mean ratio values can be compared to the'control' core ratio curve (Figure 3) obtained from Plot 1. The inventory ratios from plots 2 and 3of 0.72±0.09 and 1.62±0.28 intersect at 41±5 and 14±3 mm respectively. This suggests that onaverage 40 mm of soil has been removed from the highly disturbed plot 2 and 15 mm from plot 3.The density in the top 10 cm of these granite soils was measured at 1.1 g cm"3 and corresponds tonet soil loss of 450±55 and 150±33 t ha"1 respectively compared with the 'reference' plots.Although, these results have not been confirmed by an independent technique, they are supportedby visual observation. The dark organic A horizon at Plot 3 was still largely intact, however atplot 2 only remnants of the original A horizon remained and significant areas of brown clay Bhorizons were exposed. Measurements of 210Pbexcess, n?Cs and the short lived (53 days)cosmogenic isotope 7Be on suspended sediments leaving these plots during rainfall were also lowerfrom plot 2 than 3.
These soil loss estimates are difficult to compare with those from other methods (eg. Roberts andChurch, 1986), as most are derived as annual averages. Differences between annual averages andpoint estiamtes can occur because the latter is much more dependent on the coincidence of factorssuch as disturbance and rainfall regime. The sampling in this project was undertaken 14-15 monthsafter logging operations began. If the time between harvesting and measurement had been less orother rainfall conditions had occured over this period, then loss rates could be different. Theremust also be confidence that the 'control' or 'reference1 areas are not eroding, in which case ratiodifferences are only relative. In this experiment measurements were made over the same timeperiod and location and so also can be compared in this way and suggest, that at 450 versus 150 tha-' respectively, there was a threefold decrease in yield from the plot harvested under minimalimpact guidelines.
Conclusions
The 210Pbcx, 137Cs inventory ratio method presented here is not only limited to use in areas where
soil loss is being considered alone. For example it should also be possible to interpret thegeomorphic setting of ratios that are higher than 'reference' values. In this instance a high ratiocould result from either 1) the addition of 210Pb enhanced surface soil from upslope surface washand/or sheet erosion processes or 2) the affected area may have undergone erosion, and thereforeremoval of 137Cs, some timj in the last 30 years, and then been exposed to recent 2l°Pb fallout.Either of these landscape scenarios could be validated by determining whether the total flux of137Cs or 210Pbexcess is consistent with that expected from fallout alone. In this way, it may bepossible to deconvolve erosion history of landscapes by analysing both the core inventories of 137Csand 210Pbexcess and their respective distribution shape and ratio to one another.
It is therefore proposed that taking the ratio of 2l°Pbexcess to l37Cs across a landscape reducesvariability in these nuclides due to fallout processes and effectively establishes a more robuststandard by which measurements of erosion can be assessed. This benchmark should have lessvariability than either l37Cs or 21 OPbexcess alone.- When this is combined with their differential
13

depth distributions within soils their combined use is presented as a powerful new tool in studyingerosion processes that ultimately will make estimates of soil erosion more accurate.
Acknowledgments:
The authors would like to thank Dr Cathy Wilson, CSIRO for providing air fares and livingallowance for the duration of work at St Helens. Webe Reyenga and Frank Dunin - CSIRO, TomLynch, John Diggle and others from The Forestry Commission of Tasmania provided valuablesupport in the field. Craig Smith - CSIRO processed the soil samples for radionuclide analyses.
References:
Elliott, G.L., Campbell, B.L., and R.J. Loughran, 'Correlation of erosion measurements and soilcaesium-137 content1, J. Appl. Radial. Isot., 41, (8), 713-717, 1990.
Fredericks, D.J. and S.J. Perrens, 'Estimating erosion using caesium-137: II. Estimating rates ofsoil loss', IAHS Publ. no. 174, 233-240, 1988.
Kachanoski, R.G., 'Conparison of measured soil 137-Cesium losses and erosion rates'. Can. J. SoilSci., 67, 197-203, 1987.
Loughran, R.J., Campbell, B.L., Elliot, G.I., and D.J. Shelly, 'Determining the rate of erosion ongrazing land using Caesium-137', Applied Geography, 10, 125-133, 1990.
Matthews, K..M. and Potipin, K.,'Extraction of fallout 210Pb from soils and its distribution in soilprofiles', J. Environ. Radioactivity, 2, 319-331, 1985.
Nozaki, Y., DeMaster, D.J., Lewis, D.M. and Turekian, K.K., 'Atmospheric 210Pb fluxesdetermined from soil profiles', J. Geophys. Res., 83:C8, 4047-4051, 1978.
Quine, T.A. and D.E. Walling, Hates of soil erosion on arable fields in Britain: Quantitative datafrom caesium-137 measurements', SOIL USE AND MANAGEMENT, 7:4, 169-176.
Ritchie, J.C. and J.R. McHenry, 'Fallout Cs-137: A tool in conservation research', J. Soil andWater Conserv., 30, 283-286, 1975
Ritchie, J.C., and J.R. McHenry, 'Application of radioactive fallout Cesium-137 for measuring soilerosion and sediment accumulation rates and patterns: A review', J. Environ. Qual., 19, 215-233,1990.
Roberts, R.G. and M. Church, The sediment budget in severely disturbed watersheds, QueenCharlotte Ranges, British Columbia', Canadian Journal Forest Research, 16:5, 1092-1106, 1986.
Sutherland, R.A., and E. de Jong, 'Estimation of sediment redistribution within agricultural fieldsusing caesium-137, Crystal Springs, Saskatchewan, Canada', Applied Geography, 10, 205-221,1990.
Sutherland, R.A. "Examination of Caesium-137 areal activities in control (uneroded) locations',SOIL TECHNOLOGY, 4, 33-50, 1991
14

Walling, D.E. and T.A. Quine, 'Calibration of Caesium-137 measurements to provide quantitativeerosion rate data1, LAND DEGRADATION AND REHABILITATION, 2, 161-175, 1990.
Wallbrink, P.J. and A.S. Murray, 'Re-evaluation of predicted soil movement on the basis of 137Csvariability in reference sites in the ACT' submitted IAHS 1994(a).
Wallbrink, P.J. and A.S. Murray,' Distribution and variability of 7Be in soils under differentsurface cover conditions: Applications to Soil Erosion, submitted to Wat. Res. Res. 1994(b).
Zhang, X., Higgitt, D.L. and D.E. Walling, 'A preliminary assessment of the potential for usingcaesium-137 to estimate rates of soil erosion in the ILoess Plateau of China', Hydrological SciencesJournal, 35, 267-276, 1990.
15

Study plots
Cleared forest
Natural forest
-.. • Road
•—_- Conlour interval 10m
l i800 m
I
Figure 1: Location diagram of St Helens field study area, Tasmania, Australia, showing relativepositions of experimental plots within the St Helens state forest.
16

0
a) Concentration b) Concentration c) Cumulative inventory(Bqkg-1) (Bqkg-1) (Bqm-2)
0 40 80 120 160 0 10 20 30 40 0 400 800 1200 1600f 0
30
E e o J
Q 90 H
120 H
210phruexcess
Figure 2: Plot 1 'control' core cumulative areal concentrations of 137Cs and :'°Pb(excess) in discretesoil increments, (summed from the base).
17

Inventor}7 Ratio
0
0.0 0.5 1.0 1.5 2.0 2.5i i , i , , , , i , , , , i , i , i i I , , , i
£S
ex<uQ
10 -
20 -
30 -
40 -
50 -
60 -
70 -
80
oN)
35'
1 +p'o
0
- 10
Plot
Range of predicted
depth of soil removal
20
- 30
L 40
Plot 1 core
Plot 4 core
Plot 2 - 50
- 60
L- 70
80
Figure 3: Inventory ratio of cumulative 137Cs and 210Pbexcess at different depths for 'control' coreGraph shows intersection of Plot 2 and 3 average inventory ratio values.
18

fir 4tFallout's trailing edge
K M MatthewsNational Radiation LaboratoryPO Box 25099, Christchurch, New Zealand
Atmospheric concentrations of the long-lived fission product 137Cs peaked in 1964 inNew Zealand, 2 - 3 years after the high-yield weapon tests by the USSR and USA in1961 and 1962, and then declined rapidly before a further transient increase duringtests by France at Mururoa, 1966 - 1974. By 1985 artificial radioactivity in air andrainwater had declined to levels which were generally undetectable. The NationalRadiation Laboratory (NRL) monitoring programme was thus revised in 1985 (NRL,1986) with the introduction of high-vclume air sampling equipment at Kaitaia andHokitika.
With the high-volume equipment the detection limit for caesium-13 7, expected to bethe last detectable fission product remaining in the atmosphere, was approximately 0.5nBq/m3. This was, however, still above prevailing atmospheric contamination levels inNew Zealand. During 1993 the filters from the Kaitaia site were re-analysed asquarterly, 6-monthly or yearly bulked samples with sample volumes of the order of 4 x10⁵ - 1.6 x 10⁶ m3, and reduced 137Cs detection limits of 0.07, 0.04 and 0.02 nBq/m3,respectively. This allowed the detection and measurement of the extremely lowatmospheric 137Cs concentrations prevailing in the New Zealand region since 1986.This paper presents the results of these measurements.
Atmospheric sampling was conducted using centrifugal-fan pumps with 500 cm2
polycarbonate filters (Carl Freudenberg, Germany - type FA2311), The volume of airsampled during the weekly monitoring period was typically 3 x 10⁴ m3. For the bulkfilter analyses the filters were packed into 600ml re-entrant beakers and analysed withcounting times of up to 7 days, with a HpGe detector of 13% relative efficiency.Filters were aggregated quarterly for the 1986, 1987 and 1988 monitoring periods; six--monthly for 1988; and yearly for the 1989 - 1992 period.
Caesium-137 was detected in all quarterly filter aggregates during 1986 and 1987, andin the first and fourth quarter aggregates only in 1988, with concentrations in the range0.08 uBq/m3 to 0.36 |iBq/m3 as plotted in figure 1. It was detected again on the yearlyaggregates for the 1989 - 1992 period with results in the range 0.02 uBq/m3 to 0.25 |aBq/m3, as plotted in figure 2, together with annual averages for 1986 - 1988 periodcalculated from quarterly or 6-monthly (1988) measurements.
The annual variation in atmospheric 137Cs levels depicted in figure 1 is typical of theperiodicity of stratospheric fallout in the troposphere, with summer peaks detected atground level following winter-spring injections through the tropopause, indicating thatthe detected 137Cs was of stratospheric origin.
The trend in annual average concentrations illustrated in figure 2 indicates a decayprocess with a half-life of the order of 1.3 years. This decay trend introducesspeculation as to the possible source of the 137Cs. The only possible sources wouldhave been weapons test debris or the Chernobyl reactor disaster of April 1986. The
19
single pre-Chernobyl quarterly measurement result (January - March 1986, fig 1)suggests an earlier source and other results from the NRL monitoring programme(NRL, 1987) have previously indicated that Chernobyl debris was not detectable inNew Zealand.
The United Kingdom Atomic Energy Authority (AEA) has also monitored atmospheric137Cs levels at various sites world-wide since 1960 with results published in a series ofannual reports (AEA, 1966). The nearest AEA site to the NRL Kaitaia site is atAspendale in Melbourne, Australia, at latitude 38°S. Because of the similarity of theKaitaia (35°S) and Aspendale latitudes, trends in atmospheric I37Cs concentrationswould be expected to be similar at the two sites. The limit of detection for the AEAmeasurements was 0.2 - 0.7 laBq/m3 and the atmospheric 137Cs concentration reachedthis level in 1985. The trend in annua1 average atmospheric 137Cs concentrationsduring the 1966 - 1984 period, calculated from the published AEA results (AEA,1966), is depicted in figure 3. The AEA results indicate a discontinuity in the finalyears, with the decline in levels being arrested during the 1978 -1983 period (figure 3).This discontinuity was presumably due to stratospheric 137Cs from the Chineseweapons tests of 1976 - 1980 and its spread over several years would have beencaused by the 2 - 3 year delay normally observed between Northern Hemispheredetonations and peak stratospheric fallout levels in New Zealand.
The final 6 years of Aspendale data and the Kaitaia data from 1986 are plottedtogether in figure 4 where it appears that the two sets of data form part of the samedecay curve. The data are plotted again logarithmically in figure 5 together with twopossible linear regression lines. The existence of a linear relationship between the twosets of data rules out the possibility of 137Cs input from Chernobyl. The two regressionlines indicate half-lives of 1.3y (dashed line) or l.Oy (solid line) with the latter agreeingwell with earlier estimations (Matthews, 1993) of the atmospheric half-life of 137Cs.
It appears, therefore, that the final "glimpse" of atmospheric 137Cs allowed by thebulked filter analyses was actually of residual debris from Chinese nuclear weaponstests, and that Chernobyl debris did not enter the lower atmosphere over New Zealand.
The bulked filter analyses represent the most sensitive atmospheric l37Cs measurementsperformed in New Zealand to date and the reaching of this final limit of detection in1992 (at 0.02 jiBq 137Cs/m3) indicates that at southern latitudes the era of atmosphericcontamination by weapons test fission products is essentially over.
References
Matthews K M, 1993: Radioactive fallout in the South Pacific: a history. Part 3. Strontium-90 andcaesium-137 deposition in h'ew Zealand and resulting contamination of milk. Report NRL 1993/4,National Radiation Laboratory, Christchurch.
NRL, 1986: Environmental radioactivity annual report 1985. Report NRL F/65, National RadiationLaboratory, Christchurch.
NRL, 1987: As above. Report NRL F/66. National Radiation Laboratory. Christchurch, 1987.
AEA, 1966: Radioactive fallout in air and rain. AERE report series, commencing with report R5260(1966). United Kingdom Atomic Energy Research Establishment. Harwell.
20

Quarterly average atmospheric Cs-137levels, Kaitaia
04S
0.4
fieEu3u
0.3
eo
E 0.1
009
1988 1987 1988
LLD
1989
Year
Annual average atmospheric Cs-137levels, Kaitaia
0.1
033
au
I
ais
ocr
ioE
ai -
009
LLD
iwa 1M7 1M8 1M«
Year1M1

Annual average atmospheric Cs-137levels, Aspendale
140
120
£o100
au
& 8 0r^«•»
3C "Scr18U
40
20
67 « « 70 71 73 74 75 78 77 78 78 80 81 82 83 84
Year
Annual average atmospheric Cs-137levels, Aspendale and Kaitaia, 1979 -1991
45
|_oJ3U
I
"
2.5
Socr
EJU
E
05
fN
n 8 0 e i 8 2 8 3 B 4 U M
YearU 89 «0 R1

Ln (atmospheric Cs-137 concentration)
to
8
3
B
0
P* a
a
8
8
8
S
HII
/
/"
o•<
no
§ -2-
-n
cr(0

/4i/ fe ^M ffo
Measurement of tritiated water transpiration from tree leaves followingroot injection.
John R. Twining
Environmental Science Program, Ecological Impacts GroupAustralian Nuclear Science and Technology Organisation
PMB 1, Menai N.S.W., 2234Background
The Sydney Water Board, and! presume most other similar bodies world-wide, suffer from infestation of sewer systems by tree roots. Although a smallproblem on an individual basis, the problems posed by these infestations areexacerbated by the scale of the systems for which the organisations involvedare responsible and are a major drain upon resources. In Sydney, the smallsewers draining suburban areas are the main source of concern.
In Sydney, blockages caused by root infestation are detected by regulartractor-mounted video inspections or by reports from residents. Followingidentification, the blockages are usually cleared by cutting or tearing the rootwith an "electric eel". However, this is a very temporary solution. Damagedtissues in healthy root systems are generally rapidly repaired, especially asthe environment concerned is rich in both water and nutrients. Infestationsoften regain problem sizes within 6 months of physical removal.
Thus, the Water Board are looking for a cheaper and more permanentsolution to this problem. If this were to involve chemical control, the primaryconcerns are: a) that safety of workers and the general public is maintained;b) That the treatment is non-residual (i.e., there is no long-term hazard at thesite of application nor hazards presenting downstream of the site); and c) thatthe treatment is non-systemic (i.e., that the trees infesting the sewer are notdestroyed and thereby become a public relations problem for the Board).
To this end ICI offered a new product, Sanafoam Vaporooter, that wasclaimed to destroy roots and root function and, when incorporated into a groutapplied to the pipes following initial treatment, would prevent re-infestation forup to 3 years. The product is registered as a Class 6 poison. It is non-specific(i.e., It will kill anything and it has been used as a soil iiimigant to kill weedsand weed seeds, nematodes, fungi and soil insects) and non-systemic (i.e., itwill only kill tissue that it contacts). The active constituent is 10-30% methamsodium which is very soluble and stable in concentrated solution. However,on dilution or heating, or in the presence of alkali or metal salts, thesubstance decomposes rapidly to liberate methyl isothiocyanate, a highlytoxic and volatile gas with low solubility. The vapour is very reactive,combining quantitatively with any organic matter, living or dead.Consequently no residue is expected, and it is impractical to attempt toidentify any chemical indicators of its action in roots or other material from atreated sewer. The outermost layers of roots will show some evidence ofchemical burn which will be proportional, to some degree, to the duration andintensity of the dose. The unstable nature of the active ingredient and thereactive nature of the decomposition product together with the typical
24

conditions found within sewerage systems, restrict the scope of analyticalmethods for determining concentrations of either in sewer water or roots.
The Water Board were looking for a means of assessing the efficacy of thetreatment.After discussion, it was agreed that ANSTO would assess the.useof tritiated water as a means of determining the water transport function inroots. The proposed method of assessment is based upon measuring the rateat which tritiated water (HTO) is moved away from the root infesting the sewerby the normal transpiration stream. The method assumes that the treatmentapplied to the sewer drastically reduces, if not destroys, root function. Thisshould be reflected in a significant increase in the delay of HTO arrival at theleaves following application to the affected root. Any significant flux from theaffected root would indicate inadequate treatment as water flow from theaffected root would encourage subsequent re-invasion of the sewer. Ifdeemed suitable, this tracer would in turn be used to determine the efficacy ofthe ICI treatment in inhibiting root function. Constraints on the study were arestricted budget ($3,800 in total) and time frame (with 2.5 months fromidentifying the tree root infestation to reporting of findings) and these shouldbe considered when assessing the reported findings.
A literature review was carried out on the methods which have been used toassess transpiration flux in plants (particularly trees) over the past 30 years.The most applicable method involves injection of tritium into the xylem tissueof the tree followed by collection of transpirate to observe the pattern oftritium arrival. A report by Kline etal. (1972) gives the most concise anduseful description of the mode of application.
Aim
The aim of this study was to determine the practicality of using HTO in themanner described above by undertaking a exercise in the field.
Materials and Methods
Tree selection
An approximately 8m high tree (Callistemon sp.) with roots invading the sewerwas identified by routine video inspection performed by Water Board staff.The tree was located in Kiewarra St., Lakemba.
Excavation of the roots
The sewer was located some 1.2m below ground level. Labourers from theWater Board excavated the hole and in doing so inadvertently cut through thelargest roots infiltrating the sewer despite being advised of the fragile natureof the roots. The cut roots were of barely adequate size for the study. Onesmall root remained, damaged but intact. This root may not have been part ofthe tree to be sampled. At this point, there was a joint Water Board andANSTO decision made to proceed with the study using this small, damagedroot.
25

Injection of tritiated water
It was originally intended that small holes would be drilled diagonally into theroot so as to inject the label directly into the stele of the root (beyond theCasparian strip and into the xylem tissue) where it was to be sealed in withsilicone sealant. However, the remaining root was so small that grooves werecut instead. Into these grooves was administered 0.2 ml_ of tritiated water atan activity of 40 WiBq total. Due to cohesion, a significant quantity of thismaterial dispersed into the site adjacent to the root before the root wascoated with the sealant. Once the sealant had cured the site was backfilledwith sand.
Minor matter safety approvals were sought and received from the AnstoSafety Assessment Committee and the NSW Health Commission, RadiationHealth and Safety Section.
Collection of transpirate
Transpirate was collected by enclosing leafy branches around the tree inpolythene bags that had a 220 L maximum capacity. The branches wereevenly spaced around the tree at a height of approximately 4 m and labelledA-F in a clockwise fashion from the most south-westerly. The bags weresealed around the branch stems with masking tape. Transpiration watervapour condensed in the bags and was collected after some hours. The bagswere generally removed overnight to allow the tree to re-establish normalmetabolic behaviour between samples. When two samples were collected inone day the bags were thoroughly aired between samples. A backgroundsample was collected from the tree on the day prior to the injection takingplace.
From the literature it was expected that most of the HTO should pass throughto the leaves between 1.5-3 days. Thus a sampling protocol was set up todetect a peak within this time scale. Sampling was extended to determine thetime required for the HTO levels to return to background values as this wouldbe important in determining the appropriate times for re-administration of asecond HTO injection following treatment with the root inhibiting product.
Sample preparation and tritium analysis
The samples were collected in new PVC bottles directly from the sample bag.These were returned to the lab where particulate matter not excluded duringsampling was removed and collected volumes measured. Aliquots of 9 mLwere added to 11 mL of Instagel liquid scintillant in 20 mL polyethylenescintillation vials for counting in a standard tritium window on a BeckmanLSC. Tap water blanks, HTO standards and transpirate backgrounds weresimilarly prepared. All samples were ranked by colour and one in every sixsamples was selected from this ranking to provide a quench correction curveusing the internal spike method. For these samples, following initial counting,1 ml of standard HTO was added to each vial which was then recounted. Theproportion of activity detected over activity added thus indicated the degree ofquench.
26
Results
Table 1 shows the times and duration of sampling from each of the bags aswell as the volumes collected and the gross and net tritium activities.
The average volume of wator collected (Figure 1) showed differencesbetween the bags which were probably due to both the amount of foliage andthe relative insolation of the bag. Despite this there was a reasonably evenspread between sample bags.
However, when water collections made at each time were compared (Figure 2a-f) some wider variations were discerned. Ambient temperature, humidityand light intensity may have all influenced transpiration rate during sampling.Note the variation in transpirate volume collected per hour from day to day.Although sampling was carried out over a 6 hour period on 16/12/92 nosample was collected within any of the bags (table 1). That day wascompletely overcast with a constant light rain. As well, despite the fact thatthe bag collections could not be directly compared because the amount ofleaf material in each of them varied, it was apparent that collections werereduced on a relative basis on the southern side of the tree. The differencesdue to the direction of sunlight were best shown in the earliest sample timeswhen morning and evening collections were taken, particularly in Bags B andD which were completely shadowed by the rest of the tree in the morning andafternoon respectively, where the patterns of collection rate are reversed.Once sampling was established across the middle of the day this variationbetween bags was removed.
For tritium analysis, the samples ranged from moderately to highly coloured.This was reflected in the quench correction curve for the rank selectedsamples shown in figure 3. Quench curves are often non-linear and the twolinear correction lines were considered to provide sufficient correction withinthe constraints of the study. Apart from Bag C, the earliest samples (9/12/92)in particular were highly colour quenched and, as such, the corrected valuesfor these samples may have a high degree of error.
Transpired tritium was detected at varying activities in all bags over thesampling period. However, unlike the average water transpiration rates, theaverage amount of tritium transpired by each the branches varied widely(Figure 4). Bags A, E and F despite being on the far side of the tree from thesite of injection, all have relatively high average fluxes. This indicates a poordegree of mixing of water taken up by roots in the trunk of the tree before it istranspired. This suggestion was supported by the pattern of tritium flux ineach bag at collection times over the sampling period (Figure 5 a-f). Thesefigures indicate that the flux might have been common to 3 pairs of bags. Thepairs were A + F, B + D and C + E. These pairs not only had similar timesequences in the tritium flux but also had similar quantities of total activity.
From the average tritium flux, corrected for volume (Figure 6), there appearedto be three peaks in HTO transpiration over the 3 week period. The first peakwas associated with the initial sample following injection, the second at about4 days and the third unresolved after 3 weeks. It should be noted in figure 6that the point at 151 hours was actually a null point as no water, and hence
27

no tritium, was collected at that time. Hence the value had a zerodenominator.
The tree also began to show some effect of the sampling during theexperiment. Leaves near the tops of the bag exposed to the sun for longerperiods started to burn off after a week. Some of the twigs were broken duringthe bagging process. Despite this most of the bagged leaves retained goodcondition for the duration of this exercise.
Discussion
In principle the process worked. Tritium was detected in the transpirate of thetree. The overall pattern of HTO flux observed in this experiment and shownin figure 6 was not typical of that seen by other researchers. A characteristicflux curve following tritium injection into the trunk of a tree is shown in figure7, taken from Murphy and Luvall (1979). There are several possible reasonsfor the behaviour of tritium in this experiment which are explained in the nextparagraph. As some of these explanations involve variables which would becommon in nature it leads me to question the almost ideal response indicatedin the literature survey.
The peak seen on the first day was due to high values from Bags B and Dand has at least four possible explanations. First, it may have been due todirect adsorption of HTO from the atmosphere due to evaporation from thesite of injection. This was unlikely as bags B and D are on opposite sides ofthe tree and also the leaves in bag C, on the branch most directly over thesite of injection, contributed the least enhanced concentration of tritium at thattime. Second, it may have been due to contamination in the laboratory.However, the samples were processed in two batches and only these two,first-day samples showed any evidence of possible contamination whichshould have been more widely and randomly distributed if that were the case.Third, it may have been due to tritium movement through the tree from theinjected root. Although the movement was very rapid when compared toliterature values the result obtained was possible. Fourth, the high valuesmay have been an artefact of the high degree of quenching in these samples.These earliest samples were the most highly coloured and thus had thehighest upward correction factor applied to the analytical results. It is feasiblethat the errors involved generated the observed peak.
The second peak observed at about 4 days, due to values from all bagsexcept B and D, may be explained by tritium flux from the injected root but thedelay was about twice that expected from the literature. This may have beendue to the use of root injection rather than trunk injection with the inherentincrease in path length for water movement. An alternate explanation is thatthe detected activity represented HTO which had moved from the injectionsite to relatively undisturbed roots where it had been absorbed andtranslocated.
The third peak, which was unresolved at over 500 hours, may haverepresented HTO movement to other roots, particularly as it occurred afterthe only rain event experienced in the study period as this event may have
28

enhanced dispersal of the HTO. In this context it should be noted that, asdistinct from earlier times, this uptake was similar in pattern across all bags.Alternatively, intrusion of new root growth into the area adjacent to the site ofinjection may have occurred followed by adsorption of tritium which hadremained in situ.
The different flux rates and specific activities in each bag, despite ali beingsampled simultaneously, implied that water absorbed by the roots was notwell mixed within the tree before it was transpired. This was an importantfinding as it indicated that future studies in which tritiated water is notreleased outside the root must include several sampling bags widelydispersed on the tree to ensure that the tritium flux is observed.
Environmental parameters significantly affected the water flux over the periodof the experiment. From subjective observation these may have includedinsolation, temperature and relative humidity. This was to be expected and assuch needs to be controlled for in any future exposures by using similarplants in the vicinity unaffected by the sewer treatment.
Conclusions and Recommendations
Tritiated water did move through the tree at a measurable rate and variationsin the flux were observed. As such the method is amenable to the task ofassessing the efficacy of the treatment process. However the pattern ofmovement was non-ideal for a number of reasons. These includedenvironmental and possibly physiological factors but problems with theexcavation and injection were the main cause of concern.
Severance of the largest roots infesting the sewer at the site was the majorproblem. Any root activity in the area was undoubtably affected by this majordisturbance. Arising from this occurrence, the use of a small damaged rootled to release of HTO into the site around the root. This "free" water furtherconfounded results by probably moving from the site of injection and by beingavailable for uptake by other roots.
Tracing the movement of tritiated water from treated roots can only berecommended for assessing the efficacy of the root inhibition treatments if thesite of infestation can be excavated without damage to the roots, and if theHTO can be injected and sealed within a root of adequate dimensions,.
Should these shortcomings be overcome there will also be the requirement tocontrol for environmental variables in sampling protocols carried out bothbefore and after any treatment. It is recommended that a tree, of the samespecies, similar size and condition, in the vicinity of the infesting tree but notitself infiltrating the sewer, be selected to act as a control.
To correlate the responses of the 2 trees it is recommended that at least 3simultaneous HTO injection trials be undertaken prior to application of thetreatment to the sewer. Three paired data sets are considered the minimumrequirement to get any statistically significant comparison between thetreatment and control plants.
29

Acknowledgments
Funding for this study was provided by the Wastewater Assets Group of theSydney Water Board. Mr D. Brown of the Board facilitated this funding andorganised identification and excavation of the study site. At ANSTO, .Dr. D.Stone provided an assessment of the 1C! product and Mr G. Spelmanassisted with field work and tritium analysis.
References
Kline J. R., M. L Stewart, C. F. Jordan & P. Kovac, 1972. Use of tritiatedwater for determination of plant transpiration and biomass under fieldconditions. Pp 419-437 in Isotopes and Radiation in Soil-Plant Relationshipsincluding Forestry. Proc. Symp. 13-17 Dec 1971, Vienna. IAEA 1972.
Murphy C. E. Jr & J. C. Luvall, 1978. Tritium cycling in a tree spiked withtritiated water. Pp 179-181 in Savannah River Laboratory EnvironmentalTransport and Effects Research. Annual Report -1978. T. V. Crawford,compiler. Publ. Nov. 1979. Report No. DP-1526.
Table 1.
Date
9-Dec
10-Dec
11 -Dec
12-Dec
Sampling details and results of tritium analyses of transplrate.
Time Bag
1000 A1700 B
CDE
930 A1300 B
CDEF
1330 A1600 B
CDEF
900 A1300 B
CDEF
1330 A1800 B
CDEF
930 A1400 B
CDEF
Activity
cpm7.70
9.30
29.7510.6011.105.55
7.00
10.407.30
7.45
6.85
5.05
7.15
7.70
7.50
7.65
5.90
15.006.10
10.306.95
10.857.45
22.306.50
10.456.35
14.7579.8540.95
6.45
18.006.45
24.3572.00
Quenchfactor
j.0.14
0.05
0.55
0.080.11
0.67
0.32
0.41
0.71
0.53
0.44
0.64
0.26
0.29
0.35
0.38
0.54
0.71
0.50.61
0.73
0.60.52
0.23
0.51
0.55
0.63
0.58
0.60.7
0.62
0.59
0.65
0.58
0.54
Co rr.Activity
cpm55.00
186.0054.09
132.50100.91
8.28
21.8825.3710.2814.0615.577.89
27.5026.5521.4320.1310.9321.1312.2016.899.52
18.0814.3396.9612.7519.0010.0825.43
133.0858.5010.4030.51
9.92
41.98133.33
less blank Time from Volume6.34 Injectioncpm hrs
48.66 7179.6647.75
126.1694.57
1.94 2715.5419.033.94
7.72
9.23
1.55 3121.1620.2115.0913.79
4.59
14.79 515.86
10.553.18
11.747.99
90.62 566.41
12.663.74
19.09126.7452.16 764.06
24.173.58
35.64126.99
coll.ml
2331801031987285264316013016
25515888102132135215316626516341520243120941101742057194
26521081
Date Time Ba
13-Dec 1100 A1700 B
CDEF
14-Dec 1030 A1600 B
CEF
16-Dec 1000 Nc1630
18 to 900 A1 9-Dec 1300 B
(27hr) CDEF
22-Dec 1000 A1600 B
CDEF
30-Dec 930 A1600 B
CDEF
Time Bag Activity Quench Com less blank Time fromfactor Activity 6.34 injection
cpm •«• cpm cpm hrs88.95 0.65 136.85 130.51 103
8.50 0.56 15.18 8.84
20.85 0.53 39.34 33.006.70 0.56 11.96 5.62
33.70 0.2 168.50 162.16166.65 0.68 245.07 238.7387.95 0.69 127.46 121.12
9.80 0.66 14.85 8.51
32.80 0.62 52.90 46.5662.60 0.57 109.82 103.48
130.10 0.57 228.25 221.911000 No significant condensation In any bag
43.20 0.64 67.50 61.169.43 0.67 14.07 7.73
35.88 0.61 58.82 52.488.47 0.52 16.29 9.95
39.72 0.47 84.51 78.1754.52 0.69 79.01 72.6749.29 0.68 72.49 66.1516.62 0.68 24.44 18.1075.91 0.68 111.63 105.2933.66 0.59 57.05 50.7181.81 0.72 113.63 107.2984.93 0.74 114.77 108.43
131.53 0.75 175.37 169.0339.45 0.75 52.60 46.26
113.10 0.72 157.08 150.7431.92 0.63 50.67 44.33
117.22 0.74 158.41 152.07169.44 0.73 232.11 225.77
126
151
243
318
510
Volumecoll.ml
35012813313592165330154195210125
800350430750390450400150190300230170600270325290270370
30
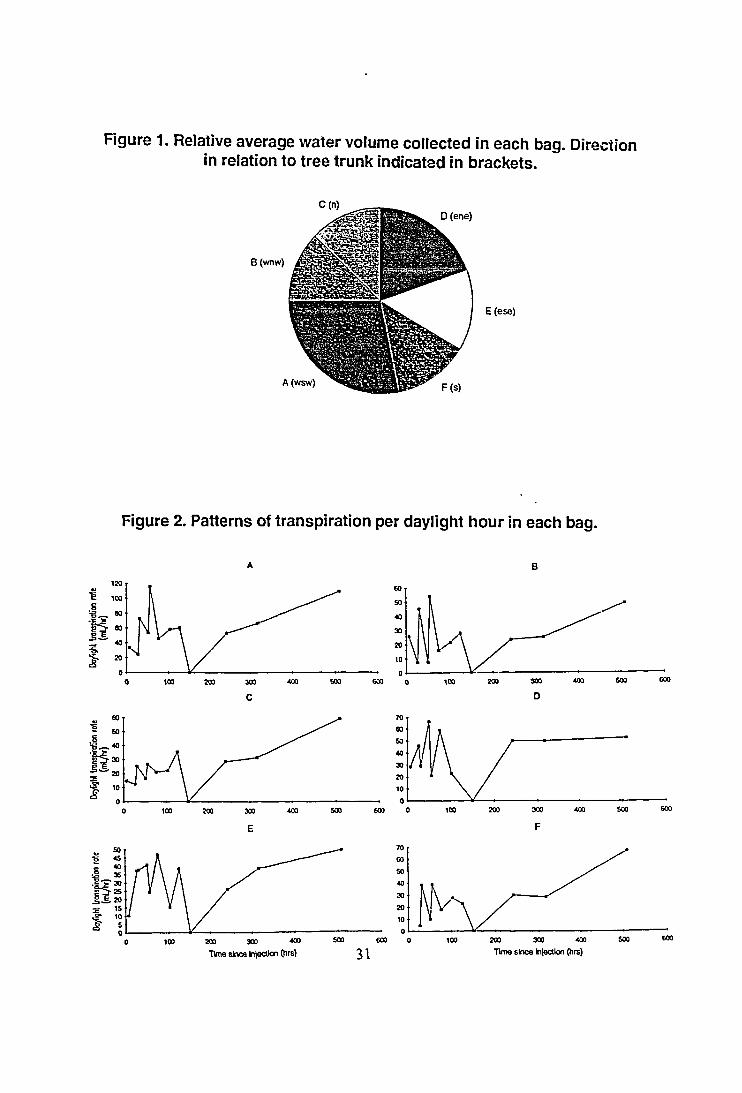
Figure 1. Relative average water volume collected in each bag. Directionin relation to tree trunk indicated in brackets.
C(n)D (ene)
B(wnw)
E(ese)
A(wsw) F(s)
Figure 2. Patterns of transpiration per daylight hour in each bag.
KB 300 400
Time sines Injection (hrs) 31200 300 400
Time since Injection (hrs)

Figure 3. Tritium quench curve for selections from colour rankedsamples.
4 5 6
Sample number
Figure 4. Relative average tritium flux collected in each bag.
C(n)D (ene)
B(wnw)
A(wsw)
E(ese)
F(s)
32
Rgure 5. Patterns of tritium flux per daylight hour in each bag.
1600
1400
1200
1000
800
600
400
200
0
JOO 300 400Ttn>« s)nc« injection ht»
200 300 400
T1m« tine* ln)«ct)on hrt
Figure 6. Tritium activity in 9 mL aliquots averaged for all bags at eachsampling time.
140.00 -r
120.00 - •
0.00
200 300
Time since iri tion (hrs)400 500 600

Figure 7. A typical tritium flux curve, taken from Murphy & Luvall (1979).
I j I I I IBranches
o— a Needles•— • Bagged waterA— A Bagged needles
Bagged branches
0 2 4 « fl 10 11 14 U
Time, days
34

TREE GROWTH RATES DETERMINED USINGNATURAL RADIOACTIVITY
A.S. Murray, G. Hancock, G. Brunskill and R. Argent
Abstract
The growth rates and ages of trees can give important information about the effects ofriver regulation, rate of recruitment and sustainable harvesting, and age by association ofgeomorphological structures such as 'in channel' bars and mobile river channels. UnfortunatelyAustralian hardwoods do not usually lay down annual rings; growth is controlled byflood/drought cycles rather than light/temperatrure. To determine whether changes in theconcentrations of naturally ocurring radioelements could provide a dating technique,measurements have been made of 210Pb and radium isotopes in two eucalypt and one mangrovespecies. There is a considerable excess of 210Pb over its parent ~6Ra (half life 1600years) in theeucalypts, but not in the mangrove. ~6Ra does not show any systematic variation inconcentration with radial location in the trunk, but both 2l°Pb (21years) and ~8Ra (5.76years)decrease smoothly through the heartwood. The ~8Ra/22t>Ra ratio remains constant in thesapwood, suggesting an open system, but in the heartwood of one eucalypt the rate ofdecrease in this ratio provides an age of about 65 years, compared with the known age of 66years. In contrast the rate of decrease of the 210Pb concentration provides an age of more thanlOOyears; a lead biological half life of about 23 years is required to get agreement with theknown age. The radium ratio model is insensitive to the biological half life of radium. Asimilar lead biological half life is required for agreement between the radium ratio and 210Pbages of another eucalypt of unknown age. This firate biological half life has considerableimplications for those studies which use trace element concentrations in tree rings as asurrogate for changes in environmental concentrations with time. The radium ratio techniquealso gives a growth rate in a mangrove consistent with estimates of ring growth rates. It isconcluded that radium isotopes may provide a generally applicable method of estimatinggrowth rates over the last 70 years.
35

URANIUM THORIUM DATING AND OXYGEN ISOTOPESTUDIES OF A SPELEOTHEM
FJ. Dyer
A combination of uranium and thorium f230!!!/234!)) dating with the study of stableisotope ratios (1SO/16O) was applied to a stalagmite in an attempt to build up apaleoclimatic picture of the region of Bat's Ridge near Portland in south westernVictoria. This work was carried out as the research component of an Honours Thesis atMelbourne University in 1991 under the supervision of Dr J.D. Smith and Dr V.M.McRae.
The stalagmite studied was 24 cm high and ranged from 3cm in diameter at the tip to8cm at the base. It had a large number of moonmilk sections, few clear stratigraphicsequences and had some porous sections. It was divided into 12 sections to be dated andthe moonmilk separated from the samples to be studied separately.
The method of dating used involved further development of the one used in the marinechemistry laboratory. It is based on the ingrowth of 230Th from parent 234U and isapplicable to carbonates in which there has been a deposition of natural uranium withoutthorium. The radionuclides were chemically separated and measured by alphaspectrometry. The chemical recover}' of the radionuclides was determined by standardaddition of a 232U/228Th tracer of known activity at the start of the procedure.
To determine relative temperatures at the time of deposition, a procedure formeasurement of 18O/16O ratio in the calcite was developed. A vacuum line to produceand collect CO2 from small samples of calcite was designed, based on similar equipmentused by McRea (1950)1. It consisted of a rotatable reaction vessel (in which anhydrousphosphoric acid was reacted with powdered calcium carbonate from the stalagmite)connected to a water trap and then a removable 10ml sample tube. Each section wasable to be isolated. The C02 collected was analysed for 180/16O ratio using an isotoperatio mass spectrometer.
The method gives good recovery of uranium (average 51%) and thorium (average 62%)which is important as initial amounts are low. Apparent ages (Table 1.) determinedshowed little variation along the length of the stalagmite and little correlation withstratigraphic sequences. All apparent ages were around 9.5 kyears. This indicated thatclosed system conditions had not existed since the formation of the stalagmite.
When equilibrium fractionation prevails during deposition, 6C and 8CC across growthlayers should be consistent and 6C and 8CC along the growth layers should show nocorrelation. A correlation between 5C and 5CC was observed (Table 2.) along growthlayers for the Bat's Ridge stalagmite. This supports the finding of the uranium andthorium dating, that the stalagmite was not formed under 'closed system' conditions.
The 6C values of -3 and -6 are similar to those reported from Mexico which has a similarclimate to Bat's Ridge and they contrast well with values of -17 to -20 reported for thecolder climate of Canada2.
36

Table ]stalagm
.. Uranium and Thorium activities taken from a verticalite. M in the sample column indicates a moonmilk sami
Sample
A&BC
CMD
DME
EMFGH
G&HMI
IMJK
KML(i)Uii)
Distancefrom
tip(cm)
1.53.5
5.0
7.0
9.010.512.511.514.0
15.518.0
21.521.5
Activity mBq/g
230rh
0.21+/-0.020.17+7-0.010.16+/-0.020.15+/-0.010.10+7-0.010.15+7-0.020.20+7-0.010.11+7-0.010.13+/-0.010.12+/-0.010.23+/-0.010.17+/-0.020.15+/-0.050.15+7-0.010.16+7-0.020.13+7-0.020.14+/-0.030.27+/-0.09
234u
2.27+/ -0.071.90+/-0.051.92+/-0.071.95+7-0.051.44+/-0.051.90+/-0.072.00+/-0.101.38+7-0.072.02+/-0.061.77+7-0.068.68+7-0.102.15+7-0.061.40+/-0.121.65+7 -0.041.54+/-0.050.16+7-0.051.62+/-0.051.26+7-0.05
1 section of the Bat's Ridge3le.
Age(kyears)
10.7+7 -1.010.4+/-0.9
9.28.4+/-0.9
8.08.9+7-1.4
11.49.3+7-1.37.2+7-0.8?7.7+7 - 0.8
2.89.1+7-1.0
12.310.3+7 -1.111.8+7-1.7
9.19.8+7-2.526.3+7-10.5
Table 2. Craig corrected values for the stalagmite samplesLocation
ABCDEFGHIJKL
Craig corrected delta values forthe central stalagmite samples
so.-10.079-10.622-10.269-9.671-9.822-9.507-9.842-9.619-8.974-9.388-9.273-9.529
5,-4.200-5.183-4.706-4.273-4.421-4.027-4.376-3.922-3.922-4.045-4.831-4.198
Craig corrected delta values forthe stalagmite samples from the
left hand side60.
-10.110-10.301-9.565-8.975-9.959-10.120-9.598-9.170-8.852-9.198-9.123-9.388
6,-4.431-4.504-3.403-3.897-4.562-4.490-4.541-4.314-3.944-5.083-4.157-4.076
EXTABS.DOC
37

1. McCrea, J.M., (1950) On the Isotopic Chemistry of Carbonates and aPaleotemperature Scale. Journal of Chemical Physics 6V 849-857
2. Harmon, R.S., (1975) Late Pleistocene Paleoclimates in North America as Inferredfrom Isotopic Variations in Speleothems. Ph.D. Thesis, McMaster University, Hamilton,Ontario
38

ff?
Dating gully incision using 210Pb ingrowth
Jon Olley and Andrew MurrayCSIRO Division of Water Resources
During the last century large areas of South-eastern Australia were cleared for farming. Thesechanges in land use often produced drastic changes in the erosional and hydrologicalbehaviour of the cleared catchment, many of which are now deeply gullied. Despite beingfairly recent these changes in catchment behaviour are generally poorly documented. Thispaper examines the potential and the problems of using :'°Pb ingrowth to date the formation ofa gully. In many catchment Fe and Mn oxides are deposited at the groundwater surface as aresult of changes in redox conditions. ^Ra is co-deposited with these oxides resulting in a^Ra excess over its parent 230Th at the groundwater surface. Gully incision causes a lowingof the groundwater table removing the 226Ra horizon from contact with the groundwater.Providing the time depenency of the Ra deposition is known, or can be assumed, and theradon retention can be determined then subsequent ingrowth of 210Pb can be used to provide aminium age for the gully incision.
39

HIGH RESOLUTION TH-230 STRATIGRAPHY AND URANIUM REDOX-FRONTS
IN HEMIPELAGIC SEDIMENTS ON THE AUSTRALIAN CONTINENTAL MARGIN
H HERBERT VEEH
School cf Earth SciencesFlinders University of South Australia
Bedford Park SA 5042
High resolution sampling of sediment cores from the West
Australian continental margin has provided detailed information on
processes which control the extent of uranium-series
disequilibrium in hemipelagic sediments. These processes appear to
be related to glacial/interglacial sedimentation dynamics and
hence offer the potential for paleoceanographic reconstructions in
a critical area.
The downcore variations in decay-corrected excess Th ( Th*o)
ran be interpreted in terms of paleoclimatic and paleoceanographic
processes, if an independent time frame of reference (radiocarbon
dates, oxygen isotope stratigraphy) is available. In addition, a
comparison between the measured burial flux of Th and the
predicted flux of scavenged Th to the seafloor at a given core
location provides information on the abundance and scavenging
efficiency of particles in the water column. Thus the burial flux
of Th*o may serve as a proxy indicator of past variations in
productivity and/or lateral sediment redistribution (Fig 1).
The interpretation of Th data in the sediments is complicated
by the occurrence of authigenic uranium, indicated by a sudden
increase in U/Th ratios above terrigeneous background values and
LI/ U activity ratios close to that of modern seawater at soiie
distance below the sediment/water interface. This is thought to be
a diagenetic feature, caused by diffusion of uranium from bottom
water into the sediment down to the level where reduction leads to
precipitation of uranium from pore water. The location of these
uranium redox fronts appears to be a function of the burial flux
of organic matter, but their timing is uncertain, making the
necessary correction for in situ ingrowth of Th somewhat
ambiguous (Fig 2).
40

Th230xo (dpm/cm2/ky)5 10 is 56•
400 (a)
Th230xo (dpm/cm2/kv)o . . . s . . . ,'p; . .'?. . . .is
100-
Eo
200-
0.co
wo-
400 J (b)
100-
E200-
CLo>
300-
400->
Th230xo (dpm/cm2/kv)3 10 15 20
(c)
100
Eo
200-
O.0)Q
300-
400 J
Th230xo (dpm/cm2/ky)5 to \*> i6
(d)
Fig 1. Predicted (dashed line) and observed (solid line) burial
flux of Thxo at different locations on the West Australian
continental margin, showing increased productivity and/or lateral
input of resuspended sediment during the last glacial maximum
(shaded). The reduced (less than predicted) burial flux of 23°Thxo
prior to the last glacial maximum at location (d) indicates net
removal of fine sediment components by winnowing due to bottom230
currents. Thxo = age corrected initial excess 23OTh.
41
Th230x (dpm/g)10- i r 10
100-
Eo
200-
a.o
300-
(a)
Th230x (dpm/g)10- i 10
100-
Eo
200
CL05O
MO-
400 J (b)
Th230xo (dpm/g)0 . . . . = ? . 1P
100-
Eo
200-
Q.0>Q
300-
400 J (c)
100-
Eo
200-
CL(D0
300-
400
Th230xo (dpm/g)S 10
(d)
23OFig 2. Th vs depth profiles in a sediment core at 956 m water
depth without (a, c) and with (b, d) correction for in SJLtliZ3O
ingrowth of Th due to authigenic uranium associated with aZ3O
redox front. Thx = excess ' Th (i.e. unsupported by detritalZ3O
uranium). Thxo = age corrected initial excess Th.
42

THE USE OF RADIUM ISOTOPES TO ESTIMATE THE DEPTH OF ESTUARINE
SEDIMENTS FLUSHED EACH TIDAL CYCLE
G.J. Hancock', A.S. Murray" and I.T Webster"
1CSIRO Division of Water Resources, Canberra, ACT.b CSIRO Centre for Environmental Studies, Canberra, ACT.
The rate of transfer of solutes through sediments and across the benthic boundary can affect
the transport and fate of pollutants. Radium isotopes can give information on the extent of
sediment-surface water interaction in estuaries. Radium has been shown to exhibit strongly
non-conservative behaviour in the estuaries of several major rivers, eg. the Mississippi, the
Hudson and the Amazon Rivers (Moore and Scott, 1986; Li et al., 1977; Key et al., 1985).
As fluvial sediments encounter increasingly saline water, the competing effects of dissolved
cations replace radium in ion-exchange sites on the sediment (Benes 1990), resulting in a net
addition of dissolved radium to the estuary (Li et al., 1977). Similar behaviour is observed in
the Bega River estuary. The concentrations of all radium isotopes increase with salinity in the
upper reaches of the estuary to values well above those expected from conservative mixing
(Figure 1). The 226Ra/BOTh activity ratio (AR) of both suspended and bottom sediments in the
estuary show significant decreases along the length of the estuary (Figure 2), indicating that
they are the source of the dissolved radium. Mass balance calculations indicate that > 95% of
the additional dissolved radium is supplied by bottom sediments.
Bottom sediment porewater samples in the estuary contain high activities of ~3Ra and r4Ra
relative to the surface water, indicating that porewater-surface water mixing is responsible for
the transfer of radium into the water column. Tidal pumping is the believed to be the primary
process responsible for this mixing (Webster et al., 1994). As water moves towards the
mouth of the estuary, surface water radium concentrations increase due to increases in salinity,
and due to the exchange of surface water and porewater which occurs each tidal cycle. In the
lower region of the estuary the increases in radium activity are countered by the dilution
effects of low activity seawater, and radium concentrations level off, or decrease (Figure 1).
The activities of the short-lived isotopes increase at a much faster rate than ^Ra, indicating
that isotope half-life influences its abundance in solution. In an experiment aimed at simulating
this estuarine process, freshwater Bega River sediment was successively leached with new
aliquot's of saline water. The first ten teachings were performed on one day. The leached
43

sediment was stored for 3 weeks, and an llth leaching performed. The results (Table I,
Figure 3) show that the desorbed activities of all the measured radium isotopes decrease with
each successive leaching, up to the I Oth leaching, due to the gradual removal of
ion-exchangeable radium from the sediment. The ~4Ra/~6Ra and ~5Ra/~°Ra AR's for the first
10 leachings remain relatively unchanged, indicating that the relative desorption of each
isotope is approximately the same. However, after the 3 week period there has been an
increase in desoibed "4Ra, due to ingrowth from its sediment bound parent (~sTh). By
contrast, the desorbed concentrations of the longer lived isotopes have continued to decrease.
The overall result is an increase in the "^Ra/^Ra from an initial value of about 3.2, to a value
of 9.9 ±1.1 after storage. This result indicates that it is the higher rate of higher rate of
activity generation of short-lived isotopes in estuarine bottom sediments which is responsible
for their high porewater activities. The continued flushing of bottom sediments by tidal
pumping leaches radium on a time-scale which allows little regeneration of the long-lived "6Ra
activity, but significant regeneration of the shorter-lived isotopes.
Table 1. Results of sequential leaching experiments.
leach no.
1
A
7
10
11*
224RamBq/L
104 ±6
50.6 ±8.5
37.0 ±7.1
26.3 ±5.1
60.1 ±8.3
"8RamBq/L
67.1 ±5.4
34.9 ±4.1
19.4 ±2.5
15.0 ±2.8
11. 2 ±0.9
22°RamBq/L
32.4 ±2.0
16.1.^-1.2
10.1±1.0
7.1 ±0.7
6.1 ±0.7
~8Ra/"6Ra
2.07 ±0.13
2.17±0.18
1.92 ±0.1 5
2.11 ±0.31
1.85 ±0.14
^Ra/^Ra
3.2 ±0.2
3.1 ±0.3
3.9 ±0.7
3.7 ±0.6
9.9±1.1
* Note leach no. 11 was performed 3 weeks after leaches 1-10.
The distribution of radium in the Bega estuary has been modelled using a one-dimensional
advection-diftusion equation (Webster et al., 1994). In this equation, the flux of each radium
isotope from bottom sediments depends on the ion-exchangeable radium activity generated by
thorium parents in bottom sediment (y), and on the depth of sediment flushed each tidal cycle(Hs,). The values of y can be determined experimentally, and by varying Hj so that the surface
water radium concentrations predicted by the model match the observed concentrations, an
estimate of Hs is obtained for each isotope (Table 2). From the distribution of 2:4Ra and "3Ra
in the estuary a depth of 13-17 cm is obtained for Hs, which is considered realistic. The values
of Hs derived from the longer-lived isotopes (~8Ra and 226Ra) are much greater, indicating that
other processes influence their distribution. One of these processes could include the slow
reduction and dissolution of Fe-Mn oxides associated with bottom sediments, and the
subsequent release of radium bound therein.
44

Table 2
Isotope
=4Ra
~3Ra::sRa
"*Ra
Hs(m)
0.13
0.17
1.8
144
20 30
salinity (ppt)40
Fig. 1 Radium isotope concentrations in surface water(filled circle) of the Bcga estuary against salinity. Thedashed line represents the concentrations expected fromconservative mixing of the river water and seawater(filled square) end-members.
on
1.6
1.4
1.2
1.0
08
CN 06 ,CN
0.4 |
0.2 -j
0.0
bottom sediment
suspended sediment
0 5 10 15 20 25 30
salinity (ppt)
Fig. 2 The ::'Ra/:;°Th AR of suspendedand bollom scdimcni againsi salinily. Thedecrease of Ihc AR with rising salinitjindicates a loss of ::6Ra from the sediment.
crmE
120
100
80 -
60
a «o20
porewater
-* > -*- -*
10, 15 20
salinity (ppt)
surface water
25 30
Fig. 3 ;24Ra in surface and porewatersamples as a function of salinity in theBega estuary.
45

References
Benes P. (1990). Radium in (continental) surface water. In Tlie Environmental Behaviour of
Radium Vol. 1, Chap. 4-3, pp 373-418.
Key R.M., Stallard R.F., Moore W.S. and Sarmiento J.L. (1985). Distribution and flux of
^Ra and ~sRa in the Amazon River estuary. J. ofGeophys. Res. 90,6996-7004.
Li Y.H., Mathieu G., Biscaye P. and Simpson H.J. (1977). The flux of ::*Ra from estuarine
and continental shelf samples. Earth and Planet. Sci. Lett. 37, 237-241.
Moore D.G. and Scott M.R. (1986). Behaviour of ~6Ra in the Mississippi River mixing zone.
J. ofGeophys. Res. 91,14317-14329.
Webster I.T., Hancock G.J. and Murray A.S. (1994). On the use of radium isotopes toexamine pore water exchange in an estuary. Litnnol. Occeanogr. 39, (8) 1917-1927.
46

RADIOCHEM1STRY OF CORALSIN SPENCER GULF, S.A.
"Nicholas J. CORLIS'and H. Herbert VEEH
School of Earth Sciences
Flinders University of South Australia
Bedford Park, S.A. 5042
Spencer Gulf in South Australia (Fig 1) is an inverse estuary,
with strong seasonal contrasts. This feature produces variable
density banding in local scleractinian corals (Plesiastrea
versipora), made visible by using x-radiographs. An assessment of2?fi 27R
Ra (via Th) and bomb-produced radiocarbon in the corals has
shown this banding to be annual. Consequently, the corals can be
used for retrospective studies of the radiochemsistry of local
waters.
In an effort to obtain an historic record of dissolved *" Pb in
Spencer Gulf water, based on the analysis of corals, a procedure
was adopted which only measures lattice bound Pb and excludes
Pb associated with the particulate phase. Our results show that
Pb is deficient with respect to its parent Ra in Spencer
Gulf corals, in contrast to corals in open ocean regions where
Pb is generally found to be in excess of Ra. This deficiency
is due to rapid scavenging of Pb by particulates in the gulf
environment. The 1 Pb record in a coral from the western margin
(Fig 2a) of Spencer Gulf is more "noisy" than that of a coral from
the eastern margin (Fig 2b). This contrast is thought to be caused
by temporal 2 Ra variations in the western part, of Spencer Gulf
due to circulation dynamics, and/or by the proximity of
uraniferous basement rocks of Eyre Peninsula as a potential source
of variable radium input via ephemeral streams.
47

Fig 1. Location map of Spencer Gulf (depth contours in meters).
•X- Location of corals used in this study.
00O
"°Pb (dpm/lOOg)20 4 0 60
1 1J INITIAL "0Pbj (20 dpm/lOOg)
" 1
11
I t i -
32-
1
(a)
0004—
•- (7 15 dpm/IOOg)
Xa.
6-
B-
14-
•""Pb (dpm/ lOOg)20 4 0 60
INITIAL ""Pb(4 5 dpm/IOOs)
60
(7 0 dpm/lOOg)
210.Fig 2. "" Pb data and "best fit" model curves for 2 corals from
the western (a) and eastern (b) margin of Spencer Gulf, with mean2Z<5Ra and initial 21°Pb values as shown. Depth scale refers to
depth below coral surface along maximum growth axis. Mean growth
rates of 3.8 mm/yr (a) and 3.4 mm/yr (b) are based on annual
density bands and radiometric data ( Ra and bomb- C).
48

Stronrium-90 and caesium-137 deposition in New Zealand and theresulting contamination of dairy products - a historical analysis
Murray MatthewsNational Radiation LaboratoryPO Box 25099, ChristchurchNew Zealand
This paper summarises a recent review of records of fallout deposition and milkradioactivity in New Zealand during the period 1961 - 1990. The purpose of thereview was two-fold: to summarise an extensive set of data in a form which wasaccessible to other researchers, and to draw as many conclusions as possible from thehistory of fallout in order to aid decision making in any future environmentalcontamination events.
Fallout deposition occurred in 3 main phases in New Zealand: 1953 - 1960 due toearly nuclear weapon tests by the USA, USSR and UK before 1959; 1961 - 1967 dueto high-yield tests conducted by the USA and USSR during 1961 and 1962; 1967 -1978 due to tests by France at Mururoa; with traces of deposition later due to tests byChina. Heaviest deposition occurred in 1964 when, on average over all New Zealandmonitoring sites, 130 Bq 90Sr and 250 Bq 137Cs were deposited per square metre. Therelative amount of 90Sr or 137Cs deposited in any year within any region of NewZealand depended solely on the relative rainfall received in the region during the year,with no latitudinal effects. The deposition of 90Sr displayed an annual cycle withmaximum deposition occurring in October-November and minimum in June.Following peak deposition periods, annual 90Sr deposition decreased rapidly, with ahalf-life of 0.9 years, suggesting a mean atmospheric residence time for long-livedweapons test debris of 1.3 years. Contributions of the different test series to the total90Sr deposited were estimated to be roughly: USA, USSR and UK tests of 1945 -1958, 25%; high-yield tests by USA and USSR of 1961 and 1962, 50%; French testsof 1966 -1974, 20%; and Chinese tests, 5%.
Concentrations of 90Sr and I37Cs in cows' milk peaked in 1965 at nation-wide averagelevels of 0.4 Bq/g Ca and 2.2 Bq/g K, respectively and had decreased to the limits ofdetection by 1986. Relative milk 90Sr levels in all monitoring regions, and relative137Cs levels in most regions, were found to be linearly related to the relative annualregional rainfall or fallout deposition, with no significant local variations due to soileffects. In regions where soils are of volcanic origin, however, local milk 137Cs levelswere significantly higher than expected on the basis of deposition, due to the relativelypoor caesium-fixing ability of such soils.
Milk 90Sr and 137Cs levels were found to vary cyclically throughout the year with 137Cslevels displaying, on average, a peak during the January - March period, and minimumlevels in July - August; while 90Sr levels in the North Island regions peaked sharply inthe July - September period.
Monthly milk 137Cs levels, in regions not displaying local soil effects, were found tocorrelate significantly with I37Cs deposition two months earlier suggesting the
49

possibility of predicting short-term increases in milk 137Cs levels from monthlydeposition.
Following the 1965 peak in milk 90Sr and 137Cs concentrations, levels in all regionsdecreased rapidly for 4 - 5 years at rates displaying average half-lives of 1.7 years and1.5 years, before slower decay processes predominated with half-lives for the tworadionuclides of approximately 7 years and 9 years, respectively. Models relatingregional annual average milk contamination levels to annual fallout deposition aredeveloped in the report in terms of foliar and root uptake by vegetation. Approximatecontributions of the different weapons test series to gross milk 90Sr levels in NewZealand throughout history were estimated to be similar to the above depositioncontributions.
The effective dose commitments in New Zealand due to dietary contamination by 90Srand 137Cs during the period 1953 - 1985 were estimated to be 0.04 mSv and 0.32 mSv,with maximum annual increments (1965) of 3.5 [iSv/y and 31 uSv/y, respectively. By1985 the annual effective dose commitment due to both radionuclides had reduced to3.5 uSv/y.
Concentrations of 90Sr and 137Cs in New Zealand milk since 1990 have remained atlevels near the limits of detection, with annual average 90Sr levels in Auckland,Taranaki and Westland of 0.03 Bq/g Ca; and I37Cs levels in Auckland and Westland of0.1 Bq/g K, and 0.4 Bq/g K in the volcanic Taranaki region.
The conclusions from the review are summarised as follows:
Fallout deposition
1. Pollution released to the stratosphere results in peak deposition at southernlatitudes 2 years later,
2. Following this peak the annual deposition decreases with a half-life of about 0.9years, indicative of an atmospheric residence time of 1.3 years.
3. Deposition in any area of New Zealand is directly related to rainfall and relativeregional depositions may be estimated from relative annual rainfall data.
4. Deposition varies during the year, with maximum New Zealand depositionoccurring in October-November and minimum in June.
Milk contamination
1. Contamination of milk by 137Cs and 90Sr reaches peak levels during, and in the yearfollowing, the peak fallout deposition year.
2. Strontium-90 levels in milk throughout NZ and, I37Cs levels in regions fromManawatu south, are directly related to deposition which, in turn, is rainfall dependant.
50
Relative regional milk contamination levels may be assessed from relative regionalrainfall data.
3. Caesium-137 levels in milk from volcanicTegions are higher than those from otherregions, with levels in Taranaki being about 4 times the national average.
4. Milk 90Sr and 137Cs levels vary cyclically throughout the year, peaking on average inthe January-March period at up to 40% above annual average, and with minimumlevels in July-August.
5. Strontium-90 levels in town-supply milk may be higher than average due perhaps todiet supplements.
6. Monthly average milk 137Cs levels appear to correlate with 137Cs deposition 2months earlier, thus allowing possible prediction through the empirical relationship:
Milk-Csj+2 = 0.05 x Dep-Csj Bq/gK
where Dep-Csj is the 137Cs deposition in month /', Bq/m2.
7. Annual average milk 90Sr levels may be modelled in terms of foliar and root grassuptake of deposited fallout, while milk 137Cs levels appear to be influenced by two soiluptake pathways involving long-term and short-term exchange processes. In the initialyear of deposition, the foliar pathway contributed an average of 88% of the gross milk90Sr contamination, while the short-term soil pathway contributed over 90% of theimmediate milk 137Cs contamination.
8. Strontium-89 levels in milk are of the order of 7 times 90Sr levels, during peakperiods. Iodine- 13 1 is unlikely to be a significant milk contaminant in New Zealand.
9. The average dose commitments due to ingestion of foodstuffs contaminated by 90Srand 137Cs in New Zealand may be estimated from the empirical relationships:
DSr = 0.02
DCs = 0.13DepCs /iSv
where Dep = cumulative deposition, Bq/m2.
Ordering information
The full report may be ordered from the National Radiation Laboratory at a cost of$NZ20.
The report's title is: Report NRL 1993/4 (1993)
Radioactive fallout in the South Pacific: a historyPart 3: strontium-90 and caesium-137 deposition in New Zealand andresulting contamination of milk.
51

ffg
MIGRATION OF URANIUM: INTEGRATING GEOCHEMISTRY WITH BIOMONITORING TO
PREDICT AND EVALUATE ITS ENVIRONMENTAL IMPACT
Scott J. MarkichA-8, Paul L. BrownA and Ross A. JeffreeA
A Environmental Science Program, Australian Nuclear Science and TechnologyOrganisation, Private Mail Bag 1, Menai, NSW, 2234, Australia
B School of Biological and Bioiiedical Sciences, University of Technology,Sydney, P.O. Box 123, NSW, £007, Australia
The potential ecological impact of the migration of elevated concentrationsof uranium into receiving waters downstream of a uranium mine site has beeninvestigated by integrating geochemical and biomonitoring techniques. Thisstudy concluded that selected behavioural responses of a freshwater bivalveexposed to a variety of uranium concentrations in a well defined syntheticriver water, both in the presence and absence of a model fulvic acid (FA),was closely correlated with the inorganic forms of uranyl present, aspredicted using the geochemical code HARPHRQ. However, the addition of adefined quantity of the model FA to the synthetic water delayed the declinein the behavioural responses of the bivalves to the uranium, by thecomplexation of uranyl by the model FA. To properly model and evaluate thegeochemical behaviour of uranium in aquatic systems requires the inclusionof data on interactions between the uranium and humic substances,especially FA. Geochemical modelling of the speciation of uranium mayassist in predicting its impact on biota exposed to elevated concentrationsin natural waters resulting from releases of uranium mine effluent.
52

Bioaccumulation of Radionuelides in
Significant Aboriginal Bush Foods
from the Magela and Cooper Creek Systems
Paul Martin, Gary Hancock*, Arthur Johnston & Andrew S. Murray*
Alligator Rivers Region Research Institute
Jabiru, N.T., Australia 0886
a Present address: CSIRO Division of Water Resources, Canberra, ACT, Australia
ABSTRACT
Activity concentrations of the radionuclides 210Pb, 210Po, 226Ra, 238U, 234U, 232Th and230Th were measured in edible flesh of a number of aboriginal bush food items from theMagela and Cooper Creek systems in the tropical Northern Territory of Australia.Food items studied were fish, buffalo, pig, magpie goose, filesnake, goanna, turtle,fresh-water shrimp, fresh-water crocodile and two types of plant roots. Water and soilactivity concentrations were also measured to enable the calculation of concentrationfactors.
For most edible flesh samples, activity concentrations followed the approximate order:2iop0» [226Ra ~ 2>°Pb] > [234U ~ 238U] > [23°Th - 232Th]. The 2>opo/210Pb activityratio was particularly high (greater than 100) for pig flesh. The highest soft tissueactivity concentration recorded was 45000 ± 2000 mBq/kg wet weight for 210Po in onesample of turtle liver.
Concentration factors for fish species fall into three groups. Group 1 (bony bream andsleepy cod) had factors about five times higher than for Group 2 (eight other speciesincluding barramundi). Some smaller fish species are eaten whole and have relativelyhigh concentration factors due to the inclusion of bones and viscera. Variability withlocation and season was small in comparison with inter-group variability. Measuredfactors were generally significantly higher than IAEA default values for freshwater fish.
Factors for turtle flesh were similar to those for fish in group 1, but were about afactor of 10 higher for liver. Factors for magpie goose, filesnake, fresh-water shrimp,goanna and crocodile flesh were also of the same order as for fish in groups 1 or 2.
53

Radionuclide Transfer Factors in Tropical and Sub-TropicalFreshwater.Ecosystems:
Why they may be different from Temperate regions.
Ross A. JeffreeEnvironmental Science Program
PMB 1, Menai, 2234
A new four-year IAEA Co-ordinated Research Program will be determiningtransfer factors for radionuclides in terrestrial and freshwatercompartments in Tropical and Sub-tropical environments. The details ofthis Program will be outlined, as well as relevant results from ourexperimental investigations of metal kinetics in freshwater organisms fromtemperate and tropical regions of Australia. These findings have led to ahypothesis, based on physiological and limnological factors, which predictshigher transfer factors for selected radionuclides in tropical freshwaterenvironments relative to their temperate counterparts. This hypothesiswill be detailed for critical evaluation.
54

A STUDY OF THE TRANSFER OF RADIONUCLIDES TO FOOD GROWN IN SOILSAMENDED WITH BAUXITE MINING RESIDUES
Malcolm B. Cooper and Patrick C. Clarke
Australian Radiation Laboratory, Lower Plenty Road, Yallambie VIC 3085
Sandy soils of the coastal plain area of Western Australia have poor phosphorous retentioncapacity which leads to pollution of surface water bodies in the region. An investigation is beingcarried out into the application of bauxite mining residues (termed "red mud") to vegetable andcrops in order to increase the phosphorous retention and reduce leaching. As the thorium andradium-226 concentrations in the "red mud" residues are in excess of 1 kBq/kg and 300 Bq/kg,respectively, one important aspect of this study is to determine if the commercial use of theseresidues on agricultural land could result in an increase in radionuclide concentrations in certainfoodstuffs. The levels of long-lived radionuclides of the thorium and uranium series in a varietyof vegetable crops grown under controlled conditions in amended soils have been determined.The effect on radionuclide uptake of varying the rates of application of "red mud" andphosphate fertilisers is being examined. It has been shown previously that fallout caesium-137 insandy soils of the region transfers readily to food and grazing crops and this aspect is also beinginvestigated. The radiological health implications of uptake of radionuclides is discussed.
55

RADIOLOGICAL ASPECTS OF LAND APPLICATION OF EFFLUENT WATER FROM URANIUMMINES IN THE ALLIGATORS RIVERS REGION
R. Akber, P. Martin, R. Marten, J. Pfitzner and S. PaulkaAlligators Rivers Region Research Institute
Office of the Supervising ScientistPMB2, Jabiru NT 0886, Australia
Land application of excess water is an important part of water managementplans of uranium mining operations in the Alligators Rivers Region. Theeffluent is slightly elevated in concentrations of the uranium seriesradionuclides. Consequently the behaviour and impact of appliedradioactivity is studied for the development of an adequate regulatoryregime.
This paper presents the results of the research undertaken by the ARRRI tostudy the fate and impact of radionuclides being applied to the landapplication area at ERA uranium mine at Ranger.
In brief:* The applied radionuclides are adsorbed within the surface few
centimetres of the soil. Subsequent remobilisation is small (-1%).
* Less than 10% of the applied radioactivity is expected to held byplants. Absorption of radionuclides via foliage during spray irrigationis the dominant uptake mechanism.
* The annual average dust resuspension factor estimate (~10~a Bqm~3 air/Bqnrz of applied load) is subject to revision through further research.
The land application area is within the project boundaries of ERA RangerUranium Mine. Radiological impact on the members of the public depends onthe land use, human occupancy and distribution of radionuclides afterrehabilitation of the site. The relative significance of various radiationexposure pathways will be briefly discussed in the presentation.

APPARENT DIFFERENTIATION OF THORIUM ISOTOPES IN
HIGH VOLUME DUST SAMPLES
ALVIN. P. SUMMERTON
RADIATION PROTECTION BRANCH
SOUTH AUSTRALIAN HEALTH COMMISSION
PO BOX 6, RUNDLE MALL SOUTH AUSTRALIA 5000
The analysis of airborne participates collected on filter media is a common procedurefor the evaluation of pollutants which may be inhaled. The data obtained from highvolume air samplers (HVAS) can be used to calculate resuspension factors* for surfacecontaminants in soil and/or to evaluate the environmental impact of anthropogenicactivities such as mining.
For environmental samples, the long-lived radionuclides (half life > 24 hr) 210pb ancj^Be are usually found in greatest concentration. However other nuclides from thenatural uranium and thorium decay series will also be present, albeit at lowerconcentrations. Filters from HVAS may be analysed for these nuclides for studiesassociated with either of the applications indicated above.
Locally raised dust would be expected to be the major contributor to the mass of air-borne particulates collected on a filter if there is significant human activity within aboutone kilometre of the sampling site. Dust raising activities distant (> 2 km) from thecollection site would be expected to contribute little to the paniculate mass, although asignificant contribution to radionuclide concentrations might occur if, for example, aradioactive ore is being mined and/or milled.
The proposition that the radionuclide distribution in the airborne particulates parallelsthat observed for the soil must be questioned. Data obtained in the desert environmentin South Australia indicate that differentiation of uranium and thorium decay seriesnuclides has occurred. In particular the activity ratio 230Th/2327n is larger than inthe surrounding soil - an observation consistent with the absence of 232jn containingmineralisation. The data cannot be simply attributed to contamination by a radioactiveore or residue. Similar results have also been obtained in a tropical environment in theNorthern Territory.
The analytical data will be discussed and possible explanations for these observationssuggested.
* the resuspension factor for a particular nuclide = airborne activity concentrationsurface activity density.
57

The arguments discussed in this presentation have been based on severalobservations, the most important of which follow:
. the activity concentration of radionuclides from the naturaluranium and thorium series in "soil" increases as the averageparticle size decreases
. for a sieved "soil" with particles less than 75 micron theconcentration of the uranium series is about 30 Bq/kg and for thethorium series is about 45 Bq/kg
. in air borne dust, the concentration of the uranium series is about60 Bq/kg and the thorium series about 30 Bq/kg
. air borne dust typically has an average particle size of about 10microns or less
The uranium series concentration in dust is as anticipated for a "soil"sample with an average particle size much smaller than 75 micron (firstobservation in the above list). However it is important to note that thethorium series content is much less than would be expected applying asimilar argument.
The observed concentrations in the dust can not be simply explained bycontamination from nearby uranium ore processing operations. "Fall out" ofore may well rationalise the observed concentration of the uranium seriesnuclides but such "fall out" can not account for the observed thoriumseries content. This is actually lower than that found in the finest soilfraction analysed.
To explain the observed dust concentrations it is necessary to propose somemechanism which allows the separation of uranium series nuclides from thethorium series. The simplest proposal is that the separation is based on adifference in the density of the mineral species which contain thenuclides. For example, in weathered soils the uranium series may bepredominantly associated with clay minerals, which have an SG of about 2,whereas the thorium series may be associated with minerals such asmonazite, with an SG of approximately 5.
When dust is raised from fine "soil" particles, the denser particles, whichcontain the thorium series nuclides, would settle out more rapidly and thusyield a dust apparently deficient in the thorium series, as observed. Thissimple suggested mechanism is yet to be experimentally confirmed.
Because similar observations have been made in South Australia and theNorthern Territory, the apparent differentiation of the thorium isotopesseems to be a general effect and caution is essential in the interpretationof analyses for air borne dust samples. Two examples follow:
. It is not reasonable to propose that the impact of a uranium minecan be simply determined by analysis of dust collected manykilometres from the mine. Corrections for the effect described abovemust be included.
. It appears that resuspension factors for natural nuclides, such asthorium isotopes, are probably site specific and should therefore bedetermined experimentally at the site of interest.
58

Evidence for the environmental mobility of thoriumfrom three soil profiles
Jon OUey and A ndrew MurrayCSIRO Division of Water Resources, POBox 1666, CANBERRA, ACT 2601
Thorium, because of its low solubility, has been generally considered to be immobile in theenvironment. However, recent work has suggested that the transport of thorium inassociation with colloids or chemical complexes maybe important. This paper presentsevidence from three geomorphologically distinct sites which indicates that thorium has beenmobilized within the soil environment. The :30Th/:?2Th ratio in soil samples is shown to be thesame as the parent rock 2vTh/:?:Th ratio, suggesting that no differential mobilisation ofthorium isotopes has occurred during soil development at each of the sites. However, theconcentrations of thorium isotopes vary within each of the soil profiles and indicate thatthorium has been both gained and lost relative to the parent rock. Evidence is presentedwhich shows that up to 40% of the thorium isotopes present in the soils are associated withthe reducible fraction. This fraction consists predominantly of secondary iron-manganeseoxides which have been precipitated from ground-water. The association of the thorium withthe secondary oxides implies that the thorium has been mobilized in groundwater, and thentrapped by coprecipitation with, or sorbtion onto the iron and manganese oxides. The^Th/^Th ratios in 0.45um filtered ground-water and stream-water samples from one of thesites are shown to be the same as the parent rock and soil :30Th/:3:Th ratio. After filtration ofthese samples a fine flocculate formed in the filtrate, indicating the presence of colloidalmaterial. The thorium concentrations in the water samples are correlated with aluminium andiron concentrations. This combined with the observation of the flocculate suggests that thethorium is being transported in association with colloids. From the above a model is proposedfor the mobility of thorium within the soil environment.
59

0°S
ENVIRONMENTAL/LABORATORY EQUIVALENCE:A FUNDAMENTAL CALIBRATION QUESTION
R.G. LYONS AND BJ. BRENNAN
DEPT OF PHYSICS, UNIVERSITY OF AUCKLAND,
PRIVATE BAG, AUCKLAND, NEW ZEALAND
FAX +64 9 3737 445
Calibration of environmental radiation dose rates is generally carried out with reference
to a laboratory standard, but the essential difference between a "point source/point
detector" model, which laboratory irradiation approximates, and the "infinite
source/infinite detector" model, appropriate to the environmental situation is not always
appreciated. However it has a significant bearing on the validity and accuracy of
environmental dose rate estimates. The physical concepts are discussed with reference to
TL dosimetry. One of the problems commonly recognized in environmental dosimetry
and laboratory calibrations is that TL phosphors are more sensitive to low energy gamma
radiation than they are to high energy gamma radiation (Fig). Because of this, TL
capsules used for environmental gamma dosimetry are commonly shielded to "prevent
overestimation of the gamma dose" and ensure equivalence between dosimeter materials
and the environmental absorbing material. It is argued that these observed effects result
from experimental laboratory conditions, in particular boundary effects. They are thus
not directly transferable to environmental monitoring, and such transfer may lead to
systematic errors in dose estimation. Correct estimation must explicitly consider any
differences in boundary effects between the calibrating and environmental situations;
relevant phenomena include attenuation and charged particle equilibrium as well as the
different energy spectra. Calculations must therefore be carried out for specific
environmental/experimental configurations and are by no means trivial (work in
progress).
Dosimetry, calibration, gamma radiation, TL, thermolumiescence, attenuation, charged
particle equilibrium, boundary effects, systematic error, energy absorption, radiation,
environment
60

EVALUATING THE GLOBAL RADON SOURCE
S. WHITTLESTONE and W. ZAHOROWSKI
ANSTO, PMB 1, MENAI, NSW 2234
A major problem for global atmospheric transport modellers is how to verify theirmodels. Radon gas is emitted from land, and not from the ocean, so it can be used as atracer for long range movement of air masses. As models become more sophisticated,they require more accurate estimates of the radon source. It is only practicable to meas-ure radon emanation from a small part of the earth's surface. This work describes apreliminary study of the use of large-scale aerial gamma surveys of Australia in con-junction with spot measurements of radon flux, to estimate the flux from the wholecontinent
61

RECOIL SPUTTERING FROM SOURCES OF ALPHA EMOTE]
NJELWHTITHEAD
INSTITUTE OF GEOLOGICAL AND NUCLEAR SCIENCESP.O.BOX 31-312 _LOWER HUTT, NEW ZEALAND
ABSTRACT
It is shown both theoretically and experimentally that very concentrated alpha sources emitdaughter products by recoil, but also large quantities of the parent, by a process called "recoiing". This effect was discovered more than seventy years ago, and was erroneously calledgregate recoil" effect. The effect appears to be due to extensive matrix damage by both the aljcle and recoil nucleus, causing emission of large numbers of atoms into the environment. .almost forgotten today it has practical implications which include stability of alpha sources foimetry, laboratory safety, disposal of nuclear waste and possibly prospecting for uranium.
Keywords:Uranium, alpha spectrometry, sputtering, alpha recoil, polonium.
1 INTRODUCTION
This study arose from the observation in our laboratory that electrodeposited alpha standardsabsolute detector calibration appeared to lose activity during storage over 10 years. This tunexpected findings. The Harwell spike was used to some extent for absolute calibration, butracy and precision of the concentration Harwell supply is limited, and it seemed better to maktion solutions from a primary standard. Therefore from 1981 on, very pure uranium oxide wasfrom an analytical grade uranium salt, and a weighed amount dissolved and electroplated to e:onto conventional stainless steel disks. The electroplating solution was scavenged with ferric 1and counted, to confirm the absence of any unplated uranium. Thorium standards were simihed. The disks were used to calibrate the alpha detectors, and it was found that the precision oicy calibration was limited to about ± 1 %, not by the counting statistics, but by the reproducibilmechanical placement of the disks under the detectors.
After counting, the disks were stored in a cabinet anticipating they might be used in future fotion of new detectors, nevertheless there was a tendency over the years to prepare and use fidards rather than the older disks. In 1992-1993 some older disks were re-used for calibrationwere also recounted in some previously calibrated detectors. Slight discrepancies were foun<gramme of more intensive testing showed many other discrepancies, due to losses of radionucjust daughter products (which might be expected through alpha recoil) but parent radionuclideThis finding has received no recent comment in the literature, but a similar phenomenon wasmany decades ago. There are important contemporary implications which are discussed below
2 EXPERIMENTAL
The laboratory archives all counted disks, and it seemed recounting some disks from routinimight be useful also. It was anticipated that losses from disks would be only a few percentlimited severely the choice of disks which might be worth counting, because in most cases fton the disks (derived from environmental samples) would be insufficient to achieve a smallsearch was made for disks with unusually high activity. AH archived calibration disks (plated '
62

amounts of U, Th, Pa, Po or Harwell spike) were suitable. A few disks containing activityfrom environmental samples, chiefly from the soils of Niue Island, were also suitable. They o^Pa and 23CTh. All disks were recounted using standard recently calibrated geometry, and soon more th?^ one detector, to confirm the resi^ts^ Disks had beea stored on a plastic electricalating material with their active faces uppermost and were counted in the same orientation. 1peared in good condition, without material flaking off.
In order to discover in an accelerated time frame the magnitude of the effect, an old uranium fa deposit of somewhat crumbling black oxide on the surface) was placed in a vacuum chambeipolyethylene film suspended 2 cm above it for two weeks, again the foil was electrically insulaground. The polyethylene was later counted under a conventional alpha detector and also analU by Rutherford Backscattering, using a 3 MeV Van de Graaff accelerator.
3 RESULTS
The percentage less of activity is plotted in figure 1 as a function of the age of the source. Irabout 0.8% of activity is lost per year, but isotope ratios within spectra do not change significalmost all cases. For example, in a uranium source, both 234U and 238U are lost at similar rates
Losses of radionuclides were progressively more severe the older the archived disks. The radiclost from the disks were both parents and daughters. If only one alpha emitter was present (e.
'Pa) losses were still similar.
Microscopic examination of the polyethylene film could find no impurities on the film largemicron or so, yet counting the film on an alpha detector showed clearly that both 234U and ~present (figure 2).
Rutherford backscattering (RBS measurements) showed 2 /zg/cm2 U was present on the pohfilm. That amount was within statistical error the same as the amount accumulated on the filllated from the alpha spectrometry measurement. The RBS measurement showed transfer of 1specifically 238U from the foil to the film. This is equivalent to 4 x 10⁹ U atoms/cnr/sec emilthe surface of the uranium foil; a veritable shower of atoms.
Similarly an alpha detector deliberately left in the vacuum chamber for two weeks, about 15from the foil but not in line-of-sight, accumulated significant U (again both 234U and 238U) orface as shown in figure 3. This showed that contamination was possible anywhere within the c
4 DISCUSSION
A search of the modern literature shows little mention of such a phenomenon. Instead, most raists and environmental geochemists believe that in the surroundings of a radioactive source,products will be greatly enriched compared with the parent radionuclide because of alphawhich the recoil particle leaves the solid. This is manifested in the well known 234U/238U ratlin seawater, and higher ratios in fresh waters. Alpha recoil certainly predominates in the enviand imagining a mechanism for expulsion of the parent radionuclide requires some thought.
4.1 History
The older literature documents the phenomenon in a number of publications. One of the easiesble references is the book by Rutherford (1930), which referred to the emission of clustersfrom very active alpha sources. He called this "aggregate recoil" referring back to the originaltwo independent workers, Lawson in Britain, and Charme" in France, in the period during and

First World War. In a series of publications (some of which Rutherford gives^ erroneous^ references for)they showed that there is a general emission of atoms from sources such as 210Po and 212Pb (the lattercontaining alpha-emitting Po), not just the recoil products, but parent undecayed atoms as well(Lawson, 1918, 1919, 1920, 1924, Channi, 1927a,b, 1928).
In figures 4 and 5 is shown some of the photographic evidence published by Chamie", 1927b,1928.Sources were exposed in air and photographic plates suspended above them. After a suitable time theplates were developed. They do not show general fogging of the plates as would be expected withuniform deposition of atoms, but clusters with intense alpha activity, and in some cases halos whichcorrespond to two alpha energies. This implies that clusters of radioactive atoms have been emittedfrom the source, hence the name "aggregate recoil". Work on solutions, showed similarly that aggre-gates of atoms appeared to be emitted into the liquid phase. In the discussion which follows it willemerge that these aggregates or clusters are a red herring, but the above work definitely showed thatparent atoms are emitted from intense alpha sources.
4.2 Formation of dusters
Arguing that a cluster of atoms can be emitted from z solid bound together creates an energetic difficul-ty. In a cluster of atoms there is continuous vibration but almost always at an energy per atom less thana few eV, otherwise the bonds between the atoms would break and the solid fly apart. If a cluster of100 atoms is given an energy of many keV instantaneously without moving the cluster, the nverageenergy per bond is hundreds of eV per bond and the material disintegrates. A cluster of atoms suddenlygiven an energy of tens of keV would therefore fly apart under its own internal energy, except in thevery unlikely event of each atom having exactly the same kinetic energy within a fraction of an eV,which could only happen if the cluster was very slowly accelerated. It seems unlikely that an aggregateor cluster of atoms can be ejected intact at high energy by any reasonable process. What then is theexplanation of the clusters observed in the photographic studies?
The modern scientist may firstly invoke the presence of dust. It is well known that radon decay daugh-ter products attach themselves readily to dust particles in the atmosphere (e.g. United Nations ScientificCommittee on the Effects of Atomic Radiation, 1977), and hencs clusters of radioactive atoms arefound, which are cleared by ciliary action from the lungs much more easily than if they were singleatoms.
Secondly, clusters can be produced merely by sudden expansion through a nozzle into a vacuum(Yamada et al., 1993). It seems to be a general phenomenon, not particularly related to the radioactivenature of a source.
Thirdly, clusters are also formed in sputtering (the process in which a beam of energetic particles orions is directed at a solid surface and causes emission of atoms). There has been controversy about theform in which atoms are ejected from such targets. Previously workers have argued either for ejectionof small clusters of atoms or for ejection of individual atoms and recombination. It appears that consen-sus is slowly emerging, and that the latter is correct. Formation of clusters appears to take place ontime scales of the order of 1 /is (Urbassek, 1989), hence the process is so fast that to observers withlimited equipment it appears atoms are ejected in clusters.
Theory predicts the emission of many single atoms of low energy (Robinson, 1984). As many as 70distinct species may be emitted (Becker et al., 1986). Other experimental evidence (Gnaser & Oechsn-er, 1990) showed that under conditions of keV bombardment the amounts of 2 and 3 atom clusters wereproportional to the square and cube of the atomic yield which suggested to those authors fast combina-tion of individual atoms to form dimers and trimers. Wucher et al. 1993, were able to show that only17% of atoms left the surface of a target in a bound form, and that the yield of a cluster of size n, wasproportional to n*-S, in other words the probability of an initial large cluster decreases rapidly with
64

size.
The conclusion is that in sputtering, atoms are emitted singly at first, but combine extremely rapidlyeven in a vacuum, to form clusters. Dust may further encourage clustering. In a later section it will beargued that a process akin to sputtering is taking place in alpha emitting sources, so it is necessary toexamine sputtering processes more closely.
4.3 Atom displacements during sputtering
If a beam of ions from a special source is directed y. a solid target with an energy of a few keV manyatoms are ejected (see figure 6). Many of the original atoms in the beam are implanted, and some arere-ejected after collisions with the target. Ultimately if the bombardment is intense a small crater willform in the target.
Robinson, 1983, found that for each 10 keV uranium ion bombarding a uranium target, 10 target atomswere emitted. Using the data presented by Andersen & Bay, 1981, in their review, it may be shownthat for uranium atoms bombarding solid uranium at 50 keV, about 40 atoms will be emitted if U atomsare beamed perpendicularly onto a target. If the angle is greatly different, say at a small or grazingangle to the surface, the yield increases by a factor of about 5-6, and at least 200 atoms are likely to beemitted. The point of this is that sputtering processes emit very large numbers of atoms.
A secondary effect (Sigmund & Sckerl, 1993) is that the emitted atoms are slightly enriched (2-8%) inthe lighter components of the matrix, such as isotopes of lighter mass.
4.4 Limitations of the sputtering analogy
Atoms which cause sputtering come from outside the sample, and are directed downward into it.Although this causes emission of atoms back towards the beam, the largest effects are likely to bedownwards into the sample, and most of the energy will be dissipated there. If the energy is beingdirected from within the sample upwards, one can imagine that the effects will be considerably greater,and that many more atoms will fly off from the sample.
An alpha decay is very energetic (several MeV) compared with the usual energies in sputtering (10-100keV) or energies of molecular bonds (several eV). It seems obvious that a single alpha decay near thesurface of a solid is so energetic that the alpha particle itself must break most of the molecular bondsnear its track, and expel some of the surface atoms by sputtering. Similarly the recoiling daughternucleus, carrying typically an energy of several tens of keV, must break many thousands of molecularbonds and expel surface atoms.
Zimen & Mertens, 1971, in a study of radioactive sources called this the "knock-out effect". Anotherappropriate name suggested here is "recoil sputtering", and the process is illustrated in figure 7. De-tailed modelling has not yet been done for this experimental configuration, but the theoretical tools areavailable. It seems safe to say that alpha decay processes in the near-surface layers of uranium metalwill cause recoils of far more than 200 atoms per decay, (the maximum calculated from sputteringexperiments with uranium atoms having the energy expected for recoil nuclei).
Other authors (Nilsson, 1966a,b, Rogers, 1966, Zimen & Mertens, 1971, Fleischer & Raabe, 1978)have found as many as one thousand uranium atoms emitted from a foil per fission event, but calcula-tion shows that for the case of uranium the atoms emitted should be overwhelmingly from the frequentalpha decay recoils rather than the relatively rare fission-product-induced recoils.
65

4.5 Experimental/Theoretical discrepancies
The experimental evidence in the present paper shows that either the magnitude of recoil sputtering isgreatly underestimated, or other new effects are present as well. The results do not show the selectiveisotope enrichment of light isotopes reported by Sigmund and Sckerl, 1993, because the effect is small,and probably the statistical precision of the present experiments was not high enough.
It may be calculated from the 0.8% loss per year rate from sources archived in air (about 100/tg Uwere initially present on many of the sources), that the loss is a high 6xl06 atoms.cm.sec"1. The ratein vacuum in the experiment with the U-foil and polythene gave an even higher result - 4xl09
atoms.cm^.sec"1. At most, from a foil 1 mm thick one expects 8 decays/sec, so this implies an improb-ably high minimum emission rate of about SxlO5 atoms.cm^.sec"1. These emission rates are manyorders of magnitude higher than the results from sputtering experiments and more significantly, higherthan the total available decay energy. In an alpha decay of a uranium atom the energy available for thesystem alpha particle-recoil nucleus is about 4.5 MeV (about 70 keV for the daughter nucleus). The U-U bond energy is only 2.3 eV. If all the available energy in the alpha decay was used to break bonds,about 2xl06 bonds might be broken and 2xl06 atoms released. It is much more likely that only a smallpercentage would actually gain enough energy to fly away from the sample. These results are muchlower than the observed 6xl06 and 4x10* atoms per second. There therefore seems to be a major dis-crepancy, but there is obviously plenty of energy available for expulsion of many atoms from the sur-face of a sample. Perhaps emission is helped by mechanical change of properties; perhaps hi an alphaemitter, considerable internal damage occurs and the structure may become disorganised or porous, andlose atoms more rapidly from the surface than would be expected.
It may be important that many alpha particles in a thin source leave the surface with a positive charge(see figure 8) and leave a residual negative charge on the source. It may be speculated that this charge,rapidly spread throughout the source, will encourage emission of particles with transient negativecharge, which may help to account for the experimental results, especially since archived sources in thecabinet, and the uranium foil used were electrically insulated from ground.
4.6 The importance of concentration of alpha emitters
Alpha decay creates havoc in a sample, disrupting large number of molecular bonds, and causing largenumbers of individual atoms to be ejected. If the original recoiling atom is ejected, it is only one ofmany (see again figure 7).
Given the destructive nature of alpha emission, and the prolific and near-random emission of sourceatoms it may start to be unclear why there is good evidence of preferential emission into the environ-ment of daughter nuclei giving 234U/238U ratios sometimes greatly above 1.00. The reason lies in thecomposition of the matrix around the decaying atom. If a uranium atom exists in that matrix in verylow concentration, and decays, the atoms sprayed out with the daughter nucleus are mostly not otheruranium atoms. Since the mean concentration of U in rocks is about 1 atom in a few hundred thousandmatrix atoms (equivalent to 1 mg kg"1), this suggests that on average there will be preferential emissionof the daughter nucleus, rather than another rare undecayed U atom. The more concentrated the alphaemitter, the higher the probability that undecayed radioactive atoms will be emitted. One might there-fore expect to see this phenomenon in concentrated alpha sources, and in solid foils of radioactivemetals, rather than environmental situations.
Would one expect to see the phenomenon in U ore deposits? If so, it might be a prospecting tool, andone might expect 234U/238U ratios to approach 1.0 closely in groundwaters in the vicinity of ore bodies,because both isotopes would be dissolved, not just the U by recoil. Unfortunately this seems mostlyto contradict observation (Morgan, 1972, Cowart, 1980, Osmond and Cowari, 1981, Levinson et al.,
66

1982, and Short et al. 1988,) and most authors report 234UP8U ratios were consistently above 1.0 ingroundwaters in contact with U deposits. This is supported by leaching studies on U minerals (Kigoshi,1971, Kobashi & Tominaga, 19S2, Sheng & Kuroda, 19S4), which gave similar results. ApparentlyCherdyntsev (an early Russian authority on alpha recoil cited in Levinson et al., 1982) reported theopposite for groundwater from U deposits - he found 234U/U8U ratios of unity. This may depend on theage of the deposits. As suggested by Petit and others, 1985, if a concentrated U ore is older than 300Ma, the rate of dissolution increases rapidly, probably due to radiation damage, and there will begeneral dissolution of the matrix, rather than selective dissolution of 234U. Thus damage caused byrecoil may yet be indirectly useful in prospecting; but only in very old deposits.
Probably one will see "room-temperature vaporization" of radioactive materials mainly in the radio-chemical laboratory. Alpha sources of high-activity are well known to be unstable in the medium term,as judged by leakage tests. Part of the reason is radiation damage, but some will undoubtedly be fromthe recoil sputtering effect, in which atoms are sprayed constantly from a source. Thus six-month livesare quoted for some intense alpha sources (Greene et al., 1972) and activity seems to be lost even fromenamel matrices (Vershinin et al., 1976).
4.7 Other applications
There are a few modern findings which probably are examples of the recoil sputtering phenomenon, buthave not been clearly recognised as such. One is the problem of the hyper-mobility of alpha emitters inair filters, and the other the unusual contamination of alpha detectors by polonium.
McDowell et al., 1977, reported that alpha-emitting Pu traversed laboratory HEPA air filters muchfaster than beta emitters. They thought that aggregate recoil was responsible, theorising that smallparticles trapped in the filters emitted smaller particles as aggregates and the force v/as sufficient tomobilise the primary particles by a kind of pogo-stick effect. However Kops et al., 1985, calculatedthat the number of alpha decays would be too small, and preferred the idea, very similar to that pro-posed here, that small particles of alpha emitters tended to give out a spray of individual atoms, whichwere easily carried through filters. A corresponding mechanism does not usually exist for beta emitterssince the total energy of decay is much less.
Although it is less certain, the; above principles may also apply to the special case of Po. Curtiss, 1930,in experiments with pure 210Po found that initially the decay did not follow the exponential law, butdecreased faster than it should. Because this work was done in 1930, he attributed this to aggregaterecoil, i.e. early abnormal loss of 2IOPo, but eventual stabilisation of the surface. This raises the ques-tion whether 21(To sources today are assumed to be more stable than they really are. Sill, 1970, Fleer &Bacon, 1984, found contamination of alpha detectors with 21GPo which they attributed to volatilisation inthe vacuum of the counting chamber and found it worst for fresh Po surfaces. In work in our labora-tory and in others (Hamilton & Smith, 1986, Bigu, 1992) this contamination has been noted, especiallywith 209Po, but we have continued to find significant contamination even from aged 209Po sources.Although Po is volatile in air above 100 C and may be volatile in the vacuum of an alpha chamber,there may also be a contribution from these secondary recoil processes. This is supported by the factthat the experiments of Curtiss, 1930, were performed in dry air, not vacuum. The possibility of vola-tilisation seems remote for uranium, thorium or protactinium, and thus the evidence in this paper fromthose sources is additional clear evidence for recoil sputtering.
Recoil sputtering will obviously be important when alpha emitting wastes of high intensity are disposedof. High intensity sources will self-disperse far more rapidly than expected, and the most effective wayto slow this process is dilution with inert materials.
It should especially be noted that laboratory alpha sources will tend to contaminate each other if storedtogether.
67

5 Conclusions
Atoms are continuously emitted from alpha emitting sources by a process of recoil sputtering. In mostenvironmental cases the atoms are inert matrix atoms but if the matrix is a relatively pure alpha emit-ter, undecayed parent atoms will be emitted. This leads to decrease of the activity of alpha sources, andgenera] contamination of the area around them by the most insidious means possible - atom by atom.Archiving alpha sources and preserving their alpha activity is therefore impossible. This in theoryshould also be a factor making measurements of the half-life of some alpha-emitting radionuclides moredifficult.
6 Acknowledgment
I thank Ian Vickridge and Bill Trompetter for the RBS measurement and modelling of sputtering usingthe TRIM program.
7 References
Andersen HH & Bay HL, 1981. Sputtering yield measurements. Topics in Applied Physics 47, 145-218.
Becker O, Della-Negra S, Le Beyec Y & Wien K, 1986. MeV heavy ion induced desorption frominsulating films as function of projectile velocity. Nuclear Instruments and Methods in PhysicsResearch B16, 321-333.
Bigu J, 1992. Contamination of a-particle detectors by desorption of 222Rn progeny from metal surfac-es. Applied Radiation and Isotopes 43, 747-751.
Chamig C, 1927a. On the existence of groups of atoms of radioelements in acid solutions and on sur-faces activated by emanation. Comptes Rendues de I'Academie des Sciences, Paris 185, 770-772.
ChamiS C, 1927b. On the grouping of atoms of radioactive elements in mercury. Comptes Rendues deI'Academie des Sciences, Paris 184, 1243-1245.
Chamig C, 1928. On the phenomenon of grouping of atoms for emanations and mixtures of radioele-ments. Comptes Rendues de I'Academie des Sciences, Paris 186, 1838-1840.
Cowart JB, 1980. The relationship of uranium isotopes to oxidation/reduction in the Edwards carbonateaquifer of Texas. Earth and Planetary Science Letters 48, 277-283.
Curtiss LF, 1930. Probability fluctuations in the rate of emission of a-particles. Journal of Research ofthe National Bureau of Standards 4, 595-599.
Fleer AP & Bacon MP, 1984. Determination of 210Pb and 210Po in seawater and marine particulatematter. Nuclear Instruments and Methods in Physics Research 223, 243-249.
Fleischer RL & Raabe OG, 1978. Recoiling alpha-emitting nuclei. Mechanisms for uranium-seriesdisequilibrium. Geochimica et Cosmochimica Acta 42, 973-978.
Gnaser H & Oechsner H, 1990. Emission-angle integrated yields of neutral clusters in sub-keV-energysputtering. Nuclear Instruments and Methods in Physics Research 58(3/4), 438-442.
Greene RE, Pressly RS & Case FN, 1972. A review of alpha radiation source preparation methods and
68

applications. Oak Ridge Report ORNL^819. U.S.A.E.C., Oak Ridge, Tennessee.
Hamilton TF & Smith JD, 1986. Improved alpha energy resolution for the determination of poloniumisotopes by alpha speetrometry.. Applied Radiation and Isotopes 37, 628-630.
Kigoshi K, 1971. Alpha-recoil thorium-234: dissolution into water and the uranium-234/uranium-238disequilibrium"in nature. Science 173, 47-48.
Kobashi A & Tominaga T, 1982. Study on physicochemical states of uranium, thorium and radiumisotopes in some radio-active minerals by the leaching method, Radiochimica.acta 30(4), 205-212.
Kops JAMM, Scholten LC, Deworm JP & Zeevaert T, 1985. Penetration of ultra-fine particles throughHEPA filters. In Gaseous Effluent Treatment in Nuclear Installations, eds Fraser G & Luykx F,Graham and Trotman, London, 73-85.
Lawson R\V, 1918. The Pulverisation of metals through a- and B-rays. Sitzungsberichte der AkademieWissenschaften in Wien 127, 1315-1337.
Lawson RW, 1919. The aggregate recoil of radioactive substances emitting alpha rays. Nature 102,464-465.
Lawson RW, 1920. Aggregate recoil accompanying the decay of substances emitting alpha-rays. Sit-zungsberichte der Akademie Wissenschaften in Wien 128, 795-830.
Lawson RW, 1924. The anomalous emission of a-particles from polonium. Nature 114, 121-122.
Levinson AA, Bland CJ & Lively RS, 1982. Exploration for U ore deposits. In Uranium series disequi-librium: applications to environmental problems, eds Ivanovich M & Harmon RS, ClarendonPress, Oxford, 351-383.
McDowell WJ, Seeley FG & Ryan MT, 1977. Penetration of HEPA-filters by alpha recoil aerosols.Health Physics 32, 445-447.
Morgan JW, 1972. Radioactive series disequilibrium in uranium economic geology. Atomic Energy inAustralia 15(2), 8-13.
Nilsson G, 1966a. Ejection of uranium atoms from electropolished of uranium metal by fission frag-ments. Journal of Nuclear Materials 20, 231-235.
Nilsson G, 1966b. Ejection of uranium atoms from sintered UO by fission fragments in different gasesand at different gas pressures. Journal of Nuclear Materials 20, 215-230.
Petit JC, 1985. Radiation-enhanced release of uranium from accessory minerals in crystalline rocks.Geochimica et Cosmochimica Ada 49(3), 871-876.
Robinson MT, 1983. Computer simulation of the self-sputtering of uranium. Journal of Applied Physics54(5), 2650-2659.
Robinson MT, 1984. The role of non-local inelastic energy losses in sputtering. In U.S.E.A.C. rept.ORNL-6128, U.S.A.E.C., Oak Ridge, Tennessee, 25-26.
Rogers MD, 1966. Ejection of uranium atoms from sintered U0r Report AERE-M1818. U.K.A.E.A.,Harwell, United Kingdom.
69

Sheng ZZ & Kuroda PK, 1984. The alpha-recoil effects of uranium in the Oklo reactor. Nature 312,535-536.
Short SA, Lowsoa RT & Ellis. J, 19&S. UP'U aad 230TkP*U activity ratios in the colloidal phasesof aquifers in lateritic weathered zones. Geochimica el Cosmochimica Acta 52, 2555-2563.
Sigmund P & Sckerl MW, 1993. Momentum asymmetry and the isotope puzzle in sputtering by ionbombardment. Nuclear Instruments and Methods in Physics Research BS2, 242-254.
Sill CW & Olson DG, 1970. Sources and prevention of recoil contamination of solid-state alpha detec-tors. Analytical Chemistry 42, 1596-1607.
United Nations Scientific Committee on the Effects of Atomic Radiation, 1977. Sources and Effects ofIonizing Radiation. United Nations, New York.
Urbassek HM, 1989. Sputtering of large clusters: information from mass spectra. Radiation Effects andDefects in Solids 109(1-4), 293-300.
Vershinin NV, Lyarskij PP & Bodrova DA, 1976. Assessment of the activity fixation in industrialalpha sources. Report SAAS— 204. Staatliches Amt fuer Atomsicherheit und Strahlenschutz,Berlin, Berlin, German Democratic Republic, 79-83.
Wucher A, Wahl M & Oechsner H, 1993. The mass distribution of sputtered metal clusters. I Experi-ment. Nuclear Instruments and Methods in Physics Research B83, 73-78.
Yamada I, Brown WL, Norhby JA & Sosnowski M, 1993. Surface modification with gas cluster ionbeams. Nuclear Instruments and Methods in Physics Research B79, 223-226.
Zimen KE & Mertens P, 1971. Nuclei in solids and knock-out effect. Zeitschrift der Naturforschung26a(4), 773-775.
70

Captions
Figure 1. Loss of alpha activity from archived sources with time
Figure 2. Alpha spectrum of polyethylene exposed to U foil.
Figure 3. Detector Background after indirect exposure to U foil in vacuum.
Figure 4. Clustering seen on photographic plate after exposure to Ra.
Figure 5. Clustering seen on photographic plate after exposure to Th descendents
Figure 6. Sputtering, in which an incoming heavy particle causes backwards loss of atoms into theenvironment.
Figure 7. "Recoil sputtering" in which a recoiling daughter nucleus after alpha decay causes loss ofmany matrix atoms into the environment.
Figure 8. Dlustration of build-up of negative charge on an alpha emitting particle.
71

Percentage Activity Loss
-10 -5 10 15o
ro -
IQCD
COOc-3nCD
01
CD
ro
72

tn4Jc
oID
OCU
OO
O00
oin
OC\J
Spectrum of Polyethylene exposed to U foil.
U-238 U-234
0 100 200 300 400 500 600 700
Channels

oin
Detector background after indirect
om
inj->cZ3oU
Oai
exposure to U foil in vacuum
U-234 + U-238Th-228
Po-212
I JL 1 1 1
0 200 400 600 BOO
Channels

f. -
SEANCE DU 23 MAI 1927. . 12/|5»- t
a la suite de 1'autie, on voit deu.\ circonferences concentriques limitant deuxgroupes de rayons issus dumeme centre, le rapport des rayons des circon-ferences etant egal a celui desparcours (exemple : Th C et Th C', Jig. i).
frjg i —Micrnphotographic de la repai t i l ioa da depot Fig i —Micropholograplue d»* la repar t i t ion du poloruuiactif d u ' t h o r i u m ' d a n s le meicure Les rayons des dans le jnercuie Les rayons des etoilcs correspontienetoiles corresponflent a 34 microns pour le Th C et a 27 microns. ' aA 6i,5 microns pour le Th C'. H ( ^
La forme de etoiles est toujouis circiilaire et bien debsinee. On observe, . _ . ,1 ~_ f. • I -,,- ^^ rv^ r>Mf\nM -no-p rloii-y nil 7^111 <;i PIT IX Ttini's PPS

SEANCE DU 2$ JUIN 1928.
En examinant la photographic au microscope, on voit sur un fond clair•des etoiles'avec des rayons correspondant aux rayons a du radon (Jig. 2)lorsque la projection se fai t instantanement apres Inspiration et que le
Fig. r . — Groupements 'd 'atomes de1 'emanat ion du rad ium dans lernercurc (H;iA et f{aC').
Fig. 2.— Groupernenls d'utoiues de. I ' emanat ion du rad ium projetee
directement sur la p laque pho-tographic] tie.
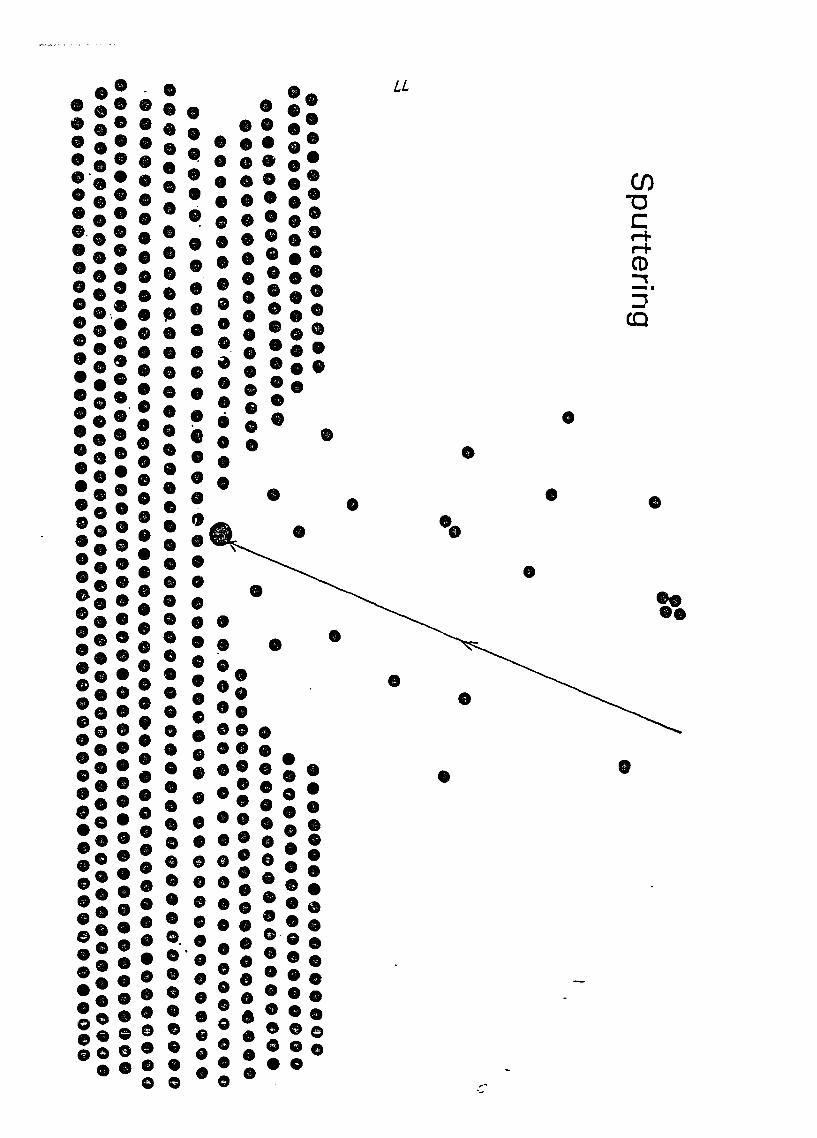
LL
• :•:••® J e © @ ® 9O ? 9 0 99 ©9 • O I A 9 a •
C/)T3Cr-fr-fCD2J§
5'CQ
o*
0 99e 09
•
• 99
• A •9 ? 0
9
• 9
©
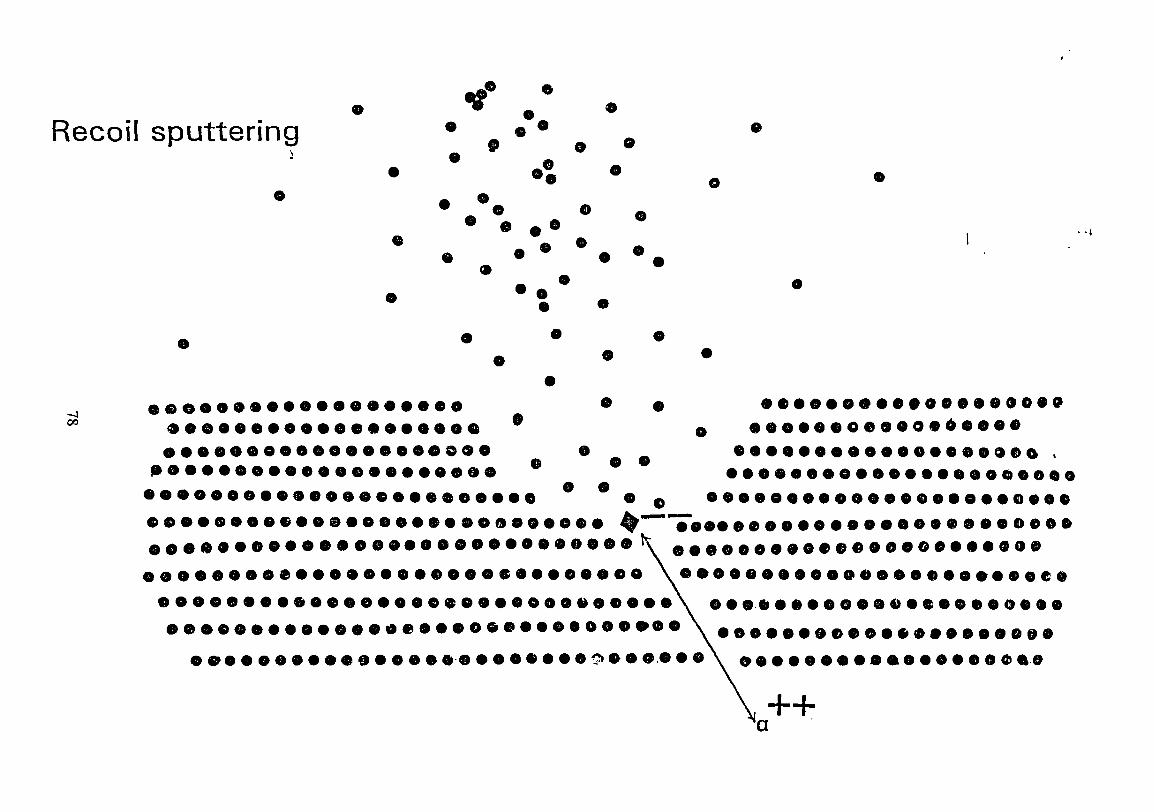
Recoil sputtering
o o ©- -i
00eooooo90ooeoeooeoo
o o o o o o o o o o o o
eooeooooeooooo
o
o« e o oo o o c o o o o d o o e c
e oo o e o o e o e o oo e o o 90 o
eooee
o o o o o o o o o o o o o o o o o o o o o o o o oo o e o o o o o o o o e o e o e o o o o e o e0 * 0 0 0 0 0 0 0 0 0 0 0 o o o o o o o o e e o»
e e o o o o e o o o o o o o o o o o o o x o eo o 0 0 0 0 0 0 0 0 0 0 0 0 0 0 0 0 0 0
o o o o o o o e o o o o o o o o o o e e oooooo^ooeooo s

Alpha emission

SOUTH PACIFIC ENVIRONMENTAL RADIOACTIVITY ASSOCIATIONSFIDSPERA WORKSHOP
Australian National University. Canberra, Australia15- 17 February 1994
MEASUREMENTS OF VERY LOW-LEVEL RADIOACTIVITY WITH HPGe DETECTORSINSTALLED IN THE MODANE UNDERGROUND LABORATORY
Yves BOURLAT, Jean-Claude MILLIES-LACROIX and Alain LATOURService Mixte de Securile Radiologiqus (S.M.S.R.)
BP 208. 91311 Montlhery Cedex (FRANCE)
SMSR's appointed tasks include the health physicsand environmental monitoring of the South Pacificnuclear test sites and the whole of French Polynesia.From 1991 to 1993, SMSR has installed three gam-ma spectrometry units with a very low backgroundnoise in the Modane underground laboratory, for thepurpose of detecting the lowest possible concentra-tion levels relating to those radionuclides which maybe present in the environment as trace elements.
The Modane underground laboratory is a Frenchlaboratory jointly operated by the Centre National dela Recherche Scientifique and the Atomic EnergyCommission. The laboratory is located in the Alps,near the mid-point of the 13-kilometer Frejus roadtunnel at the French-Italian border, at an elevation of
1260 metres. The distance between our mainlaboratory, located in Montlhery, and the Modanelaboratory is approximately 700 km. The rock shield,consisting essentially of micaschist, has anapproximate thickness of 1700 m, equivalent to4400 m of water. The shield reduces the flux ofcharged particles from cosmic radiation by a factorof 3 x 10⁶ relative to the flux observed at groundlevel.
At the beginning of 1991, SMSR installed a high-purity Germanium detector in the ModaneLaboratory. In view of that detector's outstandingperformance, two more detectors of the same typewere installed in the first half of 1993 (figure 1).
" ' V
' -•' 'A v-W''nWf>*V- >**£;:»>j*r.• •' -,-. «w>si, >,«*hv>r«fe.V$-y?••*,*•• 3Mf*M*Z3Sl»f*xJ
Figure 1: General view of the three S.M.S.R. measurement systems
80

Efficiency (%)
1
_i-
J-
! 1 DE! | planar H
i°°OT3^s!
—
J •*-_1OO rm3 ^
""•
— -s^_500cm3 "
ETECTOR N' 1P Ge. n type. 23 cm'
""S
\^^
^J
1
-< -
>
~n
Figure 2: Low-noise J-type cryostat and shielded enclosure (shown with a 100 cm3 container andits appropriate copper filler on top of the detector hood)
These detectors are of different designs :-The first one, a planar, high-purity n-type Germa-
nium detector, is used in the 10 to 400 keVenergy range.
- The second one, a coaxial high-purity n-typeGermanium detector, has a sensitive volume of207 cm3 and 52 % relative efficiency. The peakto Compton ratio is 61 at 1332 keV.
- The third detector is a coaxial, high-purity p-typeGermanium detector with a sensitive volume of360 cm3 and 99 % relative efficiency. Its peak toCompton ratio is 75 at 1332 keV.
The shielding enclosure (figure 2) is comprisedof 1 5 cm of old lead and 1 5 cm of electrolytic copper.The air volume between the shield and detector isminimized through the insertion of suitable fillercylinders made of electrolytic copper. Threemeasurement configurations are used, namely 20,100 and 500 cm3.
Efficiency curves for the three geometries andfor the three detectors are sho ,vn on the figure 3. Asan example, in the case of detector N° 3 and with a20 cm3 container, absolute efficiency at 137Csenergylevel (661 keV) is 6.5 %.
30 50
Efficiency (%)
Energy (keV) 300
o.s
iT,
-*
1
20cm3
e-'>^ ^100 cm-
-— M— ,500cm3
^
DETECTOR N' 2coaxial HP Ge. n type, 207 cm'
T
— -i
~o.
a;
^S
-1
^^
\
^
'v
^
-I,
,
-*,
I
" .
"
^
^
^V
"M
\T
40 100 Energy (keV) 50° 100° 200°
EHiciency (%)
The figure 4 shows the background noiserecorded at Modane for the three detectors over ameasurement period of 1 0 000 min. The backgroundnoise levels are extremely low. N° 2 detector showsa few 40K and 60Co impurities, which were stronglyattenuated in liie construction of N° 3 detector. Thislast detectorshows a lower background noise level,while its efficiency is higher. The many peaksobserved in the background noise of the detectorare essentially due to radon daughter products ; themeasurement was made without the usual copperfiller to limit the air volume in the enclosure.
o.s
/i
J
^
(
I
/
f
/
/
s
/
/
>
'
1V
20cm3
TIUU MM
500 rm 3
- ,
DETECTOR N° 3 _]coaxial HP Ge, p type. 360 cm3
^v
^*-
~--
— ^
^^w|
-Ht^>-
;
^
^
~*l
f**1
^v
** X
^
^^i
^-»
^>"""-*1.
^ 1to 100 Energy (:<eV) soo 1000 2000
Figure 3: Detector efficiencies
81

50 -
125
40
DETECTOR N* 1Planar HP Ge, n type. 23 cm-
30 4
•". oto -*•» 03
20•o ? £n- S > i° ci i' CM
•• « o S1 5 S i
™i \ a a °-\ °- ^ 2
1 T CMT , | 1 ,1 W
ilhLhiiiiu/ •' ••"'• "*-rillif,sl, ii;i.ti:titiini.;,ii."-l,..7'.Mi;«..Ll,,i., .;am— '-•- 1 ..i..j.u_.l ..—.—.i0 50 100 150 200 250
<n7°^UJin_jO.
60 •
50 •
40
30
20
10
:>.5:
300 350 400ENERGY (keV)
3 DETECTOR N° 2^ Coaxial HP Ge, n type, 207 cm3
Q.0
cy >0J£
toT~
Sw"r^>. u_JC
1"s§s >? s >
CJ «*..
a. eg Jt > >
1 e ? S 5 |J3 — " >£
1 ^ - 2 2, •» ° T
1 ° 0 it
lllliteii. t • i i 8 '[I," n^W(fflriW(iif|niMiiiKJjLl jHJi U |Uinl|JViii!i'J M! in'' ii i1" L. J'..,ui»..f,/i,i_.c,.
0 200 400 600 800 1000 1200 1400
m70TUJin
o.60
50
40
30
20
10
0
!<• ui ( t in« •• n t ii ut n Hill w jii^ii i *j «'j
1600 1800 2000ENERGY (keV)
DETECTOR N° 3Coaxial HP Ge, p type, 360 cm3
>
>"-> ^1 % 1»s« s « •* sJ? C J? t** IT) ^ O
"-«-"•- ^> " ? 5 ™T ' N ' C O ' " ~ I J C . * Q ~ J ^ — t D i y <U r" >
• * Ri . SS fti ^ " ^ > ^ ? - ^ -k:> "^T> ** w£^sl S~ S 2 ~~S 1« S =" 1> " " -> ^£ i » O J " 7 ' ' ^ w r , i o to.* o^1^ c n ' ^ ' ' x ^^°-§.5 £g ^ | o ? 3 3? S« S 7 | 1 ^
i a Ww c3 S S m 2 ^ S o O w vi! ill n il I 1 ^ ^ s to ^ i o ° »-tlllllt 1 1! Llil 'lll> 1 '1 I I I I c\t ^ *^
lr|i(Wwl|5CT*M^l/(riliiilfilll'k "'L-'i'i •!» "|-'BIII tiilu; 'iiJ, .1, «I Ji_l j iiL
7 <5<: 23 rj(?
i200 400 600 800 1000 1200 1400 1600 V.,00
ENERGY (keV)
i_4: Background spectrum observed on the three HP Ge detectors installed in the Modane UndergroundLaboratory (8 192 channels, 10 000 minutes)
82

2500 •
I6OO -
900 -
JOO -
100 -,
BACKGROUND COMPARISON(MONTLHERY and MOD\NE measurements)
MODANE
l^i^^rt^fel^'l/lAlBt^liilUA'^llWliilll[I^tjMilB^l^t!iillnl!'l^lll^
500 15001000Energy (keV)
re 5: Comparison of backgrounds in Montlhery and Modane
2000
The figure 5 shows, for illustrative purposes, thebackground noise recorded with detector N° 2 atModane and at Montlhery during a recording periodof over 9 days. In the Montlh4ry laboratory, locatedat ground level, the detector was installed in a verylow noise, cylindrical shielded enclosure comprisedof 15 cm of lead and 15 mm of electrolytic copper.In the spectrum recorded at Montlhery, one obser-ves, in addition to the usual lines due to naturalradioactivity (lead X rays, 214Pb, 21431. <»OK) thepresence of many lines due to cosmic radiation(annihilation of 511 keV, activation of Germaniumand Copper); these lines are totally absent from thespectrum recorded at Modane.
The table 1 and the figure 6 summarize thecounting rates for the entire background noisespectrum, for all three detectors. For detector N° 1,the count is approximately 0.25 count per minute.For detector N° 2, it is 1 count per minute and (ordetector N° 3, 0.5 count per minute. At Montlherythe detector N° 2 background noise was 70 timeshigh*^ (70 counts/min.). In the case of detector N°3, it can be estimated that it is would have been 200times higher.
BACKGROUND (pulses.VoV.1000 s)
001
0.001
00001400 BOO 1200 1600 2000
ENERGY (keV)
Figure 6: Background level comparison in Modane andMontlhery laboratories
Laboratory
Modane
Montlhery
Detector
n°1
n°2
n°3
n°2
Integratedcount rate(pulses/s)
0.0047
0.0167
0.0085
1.16
Energyinterval(keV)
8-400
20 - 2000
40 - 2000
25 - 2000
Table 1: Background noise at Modane and at Montlhery
83

Detection limits, computed from the backgroundnoise spectrum on the basis of a 10 000 minutesrecording time, range from a few 10-* Bq to a few10'3 Bq for 137Cs, according to the geometricalconfiguration (table 2). In practice, the gain variesaccording to the sample analyzed; limits are loweredby a factor of 3 to 5.
Detection limit (Bq)
Geometry
20cm3
100cm3
500 cm3
Del. n" 2
9.0.10"1.8.103
3.4.103
Del. n° 3
4.7.1 Q-4
9.0.10-1.5.10-'
Table 2: Detection limit for 137Cs (calculated on thebackground noise)
Applications to samples collected in the environment
The first application is the monitoring of theatmospheric radioactivity at Tahiti, Mururoa andMontlhery (France). A measurement was made foreach sample, corresponding to a six-month period,in our Montlhery laboratory and in the Modaneunderground laboratory (table 3). The filtered airvolume was approximately 450 000 m3. Our Moda-ne detectors made it possible to make accuratemeasurements of 137Cs activity, which, in Polynesia,is between 5.10"8 and 2.10-7 Bq/m3, although slightlylower in Mururoa. In France, the 137Cs is 5 to 10times higher, and the 134Cs traces resulting from theChernobyl accident were still detectable in the halfof 1992 (approximately 3.10-8 Bq/m3) ; we werethus able to estimate that 60 % of the137Cs originatedfrom Chernobyl. As an example the figure 7 givesthe measurement spectra for the first half of 1992.
The second illustration is the determination ofthe 137Cs profile in Polynesian oceanic watersdown to a depth of 2000 metres. At depths in excessof 800 metres, measurements made in Montlherydid not permit an accurate determination of 137Cs
'00I (pulses)
300-f
2004
100
MONTLHERY1st semester 1992
550 600 650
200'
ISO
100
50
(pulses) >
01> 00 to
S 0
P w
oCM
1(M
S
o
L~M
700 750 800Energy (ke^
TAHITI (FAAA)1st
>
CM
(52JCM
U.IJJ . LL_ U.
semester 1992
> >
i i" rfS ^(M ^
j«i IjA- Jk»JJ_A.A- J. I. .^fl.J.4
850
550
20 T N
600 650 700 750
15 •
(pulses)
BOO 850
Energy (keV)
BACKGROUNDAT MODANE
550 600 750 800 B50
Energy (keV)Figure 7: l34Cs and l37Cs atmospheric radioactivity atMontlhery and Tahiti (1st semester)
(detector n° 2, 10 000 minutes. 0.25 keV/channel)
activity; this, however, could be achieved with theModane detectors. Activity at 2000 m depth isapproximately 0.02 Bq/m3 (table 4).
Laboratory
7Be
2JNa
40K
'"Cs
"7Cs
ModaneMontlhery
ModaneMontlhery
ModaneMontlhery
ModaneMontlhery
ModaneMontlhery
TAI1st semester
(2.78±0.12).103
(2.88±0.13).10'3
(2.06±0.15).10'7
(2.32±0.82).107
(1.33±0.10).10'5
(1.35±0.14).10S
<2.5.10-«<1.6.1G"7
(1.81±0.21).10'7
(2.0910.7 1).10'7
-im2nd semester
(3.47±0.14).103
(3.33±0.37). 10'
(1.71i0.08).10s
< 2.9.10'
(1.46±0.22).10-7
MURL1st semester
(3.3910.1 4). 10'3
(3.5910.1 7). 10'3
(2.8710.1 7). 10'7
(2.7310.68).10-7
(2.1110.10).10-5
(2.0410.16).105
< 2.0.10'<1.2.10'7
(9.311 .6). 10"6
(7.916.2). 10-'
1ROA2nd semester
(3.74+0.15).10-3
(3.7310.36). 10'7
(2.0610.09).105
< 2.6.10*
(5.911. 5). TO*
MONT1st semester
(3.5010.1 5).103
(3.5310. 17). 1C'3
(4.0610.21). 1C'7
(4.0810.95).10-7
(1.5310.10).10S
(1.54±0.14).10-s
(3.4511. 08). 10-'<1.6.107
(7.9910.49).107
(8.311 .0).10'7
LHERY2nd semester
(2.8310.12).103
(2.7310.32). 10'7
(1.31±0.07).10's
<2.8.10-«
(5.3410.38).10-7
Table 3: Atmospheric radioactivity measurements (Bq/m3) in Polynesian stations and at Montlhery in 1992•: no measurement
84

Depth(metres)
surface-50
-100-200-300-400-500-600-800-900
-1000-1250-1500-2000
Sampledvolume(litres)
590599568560562543577566546569545555390396
"'Cs activMontihery
measurement
2.84 ± 0.262.77 ± 0.262.78 1 0.262.77 1 0.262.37 ± 0.221.8510.180.84 ± 0.090.32 ± 0.04
0.058 ± 0.0220.03710.0210.098 ± 0.0300.050 1 0.020
< 0.059< 0.058
ty (Bq/m3)Modane
measurement
.--.---
0.333 1 0.0350.09010.0130.05010.0100.10010.0160.038 1 0.0080.022 1 0.0080.022 1 0.009
Table 4:137Cs profile in seawater collected outsideMururoa(1990)
The figure 8 shows the profile observed close toMururoa ; the slight increase, still unexplained,observed at 1000 m may be due to the closure of thesampling bottle at the wrong depth.
V
aLU
1750
/ . — —__*-^^
t
i
^r^
0 0,5 1 1.3 2 2.5 3 3ACTIVITY (Bq'm1)
Figure 8: 137Cs profile in seawater collected outsideMururoa (1990)
The third example relates to measurements onocean plankton. Here again, 137Cs measurementscould be made at Modane; activity was found to be10-2 Bq/kg of fresh plankton (table 5). Consideringthe activity of surface seawater (2.5 Bq/m3) onearrives at a concentration factor of about 5, a figurewhich was confirmed by further sampling.
In conclusion, the following points can bestressed:
- In the Modane underground laboratory, detector. background noise is reduced by a factor of 70 to
200- Detection limits are markedly improved, gain
varies according to the sample analyzed(improvement factor of 3 to 5)
Radio-nucfide
40|<
"7Csi.cpb
^Ra^Th«5U2MU.
Activity (Bo/kimeasured atMontihery
28.0+1.2< 0.032
2.53 ± 0.310.764 ± 0.031
< 0.045(6.5±1.6).10J
0.72 ± 0.29
g wet weight)measured at
Modane
22.311.2(1.391 0.58). 102
2.75 ± 0.290.779 ± 0.029
(4.0410.96).102
(4.7 ± 1.1).102
0.75 ±0.11
': from "«Th measurementTable 5: Polynesian plankton radioactivity
- A wide range of applications is open inenvironmental investigation and monitoring.
References:
/!/ BOURLAT Y.. MILLIES-LACROIX J.-C. and ABT D.Measurement of low-level radioactivity in the Modane under-ground laboratoryInternational Committee lor Radionuclide Metrology ICRM V3.Teddington (UK). June 1993Nuclear Instruments and Methods in Physics Research, A339(1994) p. 309-317/2/MALM H.L.. WATT M.M.. BOSTOCK I., CAMPBELL J.L.,JAGAM P. and SIMPSON J.J.Background reduction in germanium spectrometers: materialselection, geometry, and shieldingNuclear Instruments and Methods in Physics Research, 223(1984) p. 420-425/3/BUSTO J.. DASSIE D., HUBERT F., HUBERT Ph.. ISAACM.C., I2AC C.. JULLIAN S., LECCIA F. and MENNRATH P.Ultra low radioactivity measurements in the Frejus UndergroundLaboratoryNuclear Physics B (Proc. SuppU, 28A (1992) p. 425-429/4/HEUSSER G.The background components of germanium low-levelspectrometersNuclear Instruments and Methods in Physics Research, B17(1986) p. 418/5/BRODZINSKI R.L., MILEY H.S., REEVES J.H. andAVIGNONE F.T.Ultra-low background germanium spectrometry: Techniquesand resultsNuclear Physics B (Proc. Suppl.), 28A (1992) p. 415-419/6/VERPLANCKE JanLow level gamma spectroscopy: low, lower, lowestNuclear Instruments and Methods in Physics Research, A312(1992) p. 174-182/7/MOUCHEL D. and WORDEL R.Measurement of low-level radioactivity in environmental samplesby gamma-ray spectrometryApplied Radiation and Isotopes, Vol. 43, N° 1/2 (1992) p. 49-59/8/LINDSTROM R.M., LINDSTROM D.J., SLABACK L.A. andLANGLAND J.K.A low-background gamma-ray assay laboratory for activationanalysisNuclear Instruments and Methods in Physics Research, A299(1990) p. 425/9/ARTHUR R.J., REEVES J.H. and MILEY K.S.Use of low-background germanium detectors to preselect high-radiopurity materials intended for constructing advanced ultralow-level detectors.IEEE Trans. Nucl. Scv NS-35(1) (1988) p. 582/10/ MILLIES-LACROIX J.-C, BOURLAT Y. et ABT D.Mesure de tres faible radioactivite dans le laboratoire souterramde Modane. Application d la mesure de traces dans les prelev-.-ments effectues dans Penvironnement.Journees de Spectrometrie gamma et X. St Remy-les-Chevreu-se (France) Oct. 1993
85

RADIUM-226 DETERMINATION IN ENVIRONMENTALSAMPLES USING THREE DIFFERENT COUNTING
TECHNIQUES
R A. TINKER, J. D. SMITH AND M. B. COOPER*
SCHOOL OF CHEMISTRYUNIVERSITY OF MELBOURNEPARKVILLE, VIC, 3052.*AUSTRALIAN RADIATION LABORATORYYALLAMBIE, VIC, 3052
Radium-226 in the environment is commonly found in low concentrations requiringsensitive techniques for detection. Alpha spectrometry, gamma spectrometry and liquidscintillation counting all have different limitations. To obtain optimum counting statisticsthe selection of an appropriate procedure is important. The decision process forselection of the best procedure depends on the properties of the analytical procedure,precision, selectivity and sensitivity. Method selection is also influenced by the samplesize and concentration The precision of each technique relies on the total activity andcounting time. Precision, total activity and counting time are investigated under theinfluence of counter background, detection efficiency, sample size and concentration.The lower limit of detection is also examined. In this paper method selection guidelinesare illustrated for radium-226 in seawater, sediment and biological material.
Radium-226, alpha spectrometry, gamma spectrometry, liquid scintillation counting,counting statistics, method selection, precision, counting time, counter background,detector efficiency, sample size, lower limit of detection, environmental samples.
86
Counting of Live Mussels on a HPGe Detector
Paul Martin, Riaz A. Akber and Rainer Marten
Alligator Rivers Region Research Institute
Jabiru, NT., Australia 0886
ABSTRACT
Four mussels collected from Mudginberri billabong were counted live on a HPGe detector.Count tinw was from 2 to 3 days. Radionuclidcs detectable by this method included 226Ra,214Pb, 2l4Bi and 210Pb from the uranium series and Ac and 212Pb from the thorium series.The measured z^Rn retention varied from 7% to 17%. The 228Ac/22«Ra and 212Pb/228Ac ratioswere used to give an estimate of the mussel age based upon the known 228Ra/226Ra - age and228Th/228Ra - age relations for mussels from Mudginberri billabong.
Two mussels were recounted after living for several months in a 50:50 mix of water fromRanger Uranium Mines retention pond no. 2 with Magela Creek water. The 234Th peak at 63keV was then measurable, probably due to uptake of the parent ^U. This means that livecounting cannot be used for detection of 226Ra releases from uranium mine pond waters, as235U interferes with the 226Ra peak at 186 keV. The method does show promise for studies ofthe kinetics of uptake of uranium in mussels.
1. INTRODUCTION
The freshwater mussel Velesunio angasi has been extensively investigated as a possiblebiological monitor of pollution (e.g. Humphrey & Simpson 1985, Allison & Simpson 1989).This mussel is known to accumulate a number of metallic elements over time, including naturalseries radionuclides such as radium and polonium (Jeffree & Simpson 1986, Johnston cf al.1987). Unfortunately, normal methods of radionuclide analysis require destruction of themussel, so that a time series of measurements for a single mussel is not possible. The workdescribed here was undertaken to determine whether a quantitative or semi-quantitativemeasure of uranium-series radionuclides in a live mussel could be obtained by counting themussel on a High-Purity Germanium gamma-ray spectrometry detector.
2. EXPERIMENTAL
Five test mussels were obtained from Mudginbcrri Billabong on the Magela Creek on 17thApril 1991. After marking the shells, the mussels were placed in the sandy bottom of Magela
87

Creek inside an enclosed area just downstream of Georgetown Bilfobong. All nrassdsthen counted once in May on a HPGe detector and returned to Magela Creek after counting.
Counting was done with the mussel King on a plastic petri dish on top of the detector.. When\iewed from above the mussel hinge was to the left upper comer so that all counts wereperformed with the mussel King on the same side (Figure 1). The mussel and petri dish weresurrounded with plastic wrapping ("Glad-wrap") to prevent contamination of the detector. Themussels were taped to prevent them from opening their shells and moving on the dish. Tablr 1gives the mass, length, height and width of the mussels measured just prior to the first count.
On 12th June a water sample of approximately 200 L was collected from Ranger UraniumMine's retention pond 2. A subsample was analysed for radium, uranium and thorium isotopesby alpha-particle spectrometry (Table 2). The remainder was kept in a large, covered plasticcontainer for use in the mussel experiments. Before subsampling, the water was always stirredto suspend and mix any sediment. On 21st October a final subsample was taken for thedetermination of uranium and radium isotopes. Between June and October the ^'U activityconcentration in the filtered subsamples had not changed significantly; over the same period,the 226Ra activity concentration decreased to approximately 55% of its original value (Table 2).
On 12th June the mussels were removed from Magela Creek and placed in buckets containing 5kg of Magela Creek sand and 12 L of water (Magela Creek water for mussels M2 and M4 anda 50:50 mixture of RP2 water.Magela Creek water for mussels Ml and M3). For theremainder of the experiment the mussels were kept in these buckets except \vhen counted. Thewater was changed approximately weekly.
Table 1. Mass, length, height and width of the test mussels.
Mussel Mass Length Height Width(g) (mm) (mm) (mm)
Ml 34 68 39 25
M2 24 62 38 21
M3 17 56 32 19
M4 24 58 36 23
88

Table 2. Uranium, radium and thorium isotope analysis of RP2 water (sample RTI910)collected 12th June 1991. Uncertainties are one standard deviation due to counting statisticsonly.
Sample(mBq/L) (mBq/L) (mBq/L)
12.6.91
Filtered 26500 ±700 278 ±11 <1.6 1.08 + 0.02
Residue 105 ±4 77 ±4 16.0 + 0.6 0.94 + 0.05
21.10.91
Filtered 27000 ±700 149+12 1.08+0.02
3. CALIBRATION
All test mussels died during the course of the uptake experiment. The mussel shells weresubsequently cleaned and each half-shell filled with a mixture of casting resin and a weighedquantity of a uranium ore (CANMET uraninite BL-5). By counting the two combined half-shells in the same position as the original live mussel, an approximate calibration of thecounting geometry for each mussel could be obtained for the uranium series nuclidcs. Thismethod assumes that for the live mussels the radionuclides are evenly distributed throughoutthe shell volume. Although this assumption is incorrect, the resultant error is likely to beconsistent enough and small enough that the calibration method could be regarded as at leastsemi-quantitative. Experiments are currently under way to check the accuracy and precision ofthe method by counting a number of mussels live and subsequently analysing the mussel fleshby normal methods.
Analysis of the spectrum at 186 keV is complicated by the fact that this spectral line has acontribution from two isotopes: 226Ra and 235U. Using the absolute intensities of their gammaemissions (Marten 1992), calibrations have been calculated for each of these isotopes in theabsence of the other isotope (Table 3; in the case of uranium, the calibration is calculated interms of ™U assuming the natural z^U^U activity ratio of 0.04604).
Absolute efficiency curves were produced based on these calibration factors. Figure 2 showsthe efficiency curves for the largest (Ml) and the smallest (M3) of the mussels. The efficiencycurves for M2 and M4 are virtually identical and lie between the curves for Ml and M3.Interpolation between the points on each curve allows us to obtain calibration factors for peaksfrom nuclides of the thorium series (Table 4).
89

Table 3. Calibrations for each mussel obtained by filling shells with a mixture of resin andCANMET uraninitc BL-5. Units are counts per kilosecond per Bq.
Nuclidc Peak Ml M2 M3 M4(keV)
2i«>Pb 46 1.08 1.27 1.53 1.26
23<Th 63 1.17 1.34 1.60 1.33
23°Th 67 0.11 0.14 0.15 0.14
23SU 186 0.59 0.64 0.76 0.65
22«Ra 186 0.79 0.86 1.02 0.87
2»<Pb 295 2.55 2.86 3.26 2.79
2i<Pb 352 4.15 4.66 5.32 4.65
2»«Bi 609 2.70 2.99 3.38 2.96
Table 4. Calibrations for each mussel obtained from absolute efficiency curves. Units arecounts per kilosccond per Bq.
Nuclide Peak (kcV) Ml M3 M2 and M4
22«Ac 338 1.4 1.8 1.52»2Pb 239 7.0 9.6 7.4
4. RESULTS
Subtracting background count rates for the detector (Table 5) and dividing by the calibrationfactors obtained above gave the activities in Bq/mussel summarised in Table 6. Previous workon a set of mussels collected from Mudginberri billabong (Johnston era/. 1987) gave typicalflesh activity loads (in Bq/mussel) of 0.005 to 0.01 for ™*\}, 0.0005 to 0.002 for Th, 1 to 5for 226Ra and Q.2 to 1 for 210Pb for mussels of a similar size to those in this study. Data foractivity concentrations in mussel shells are presently available only for two sets of musselscollected from Georgetown billabong in 1982 and 1983. The measured 226Ra activityconcentrations for these samples were 13 Bq/kg dried shell, representing approximately 0.1 Bq226Ra for shells of the size measured in this study. The measured 2l°Pb activity concentrationswere between 5 and 10 Bq/kg, or approximately 0.05 Bq per mussel.
Given the low 230Th concentration in mussel flesh, it is not surprising that the 67 kcV peak wasnot detectable for any live mussel counts. The 63 keV peak from 234Th (daughter of U) wasalso undctectable for all counts except those where the mussel had been kept in 50:50
90

RP2:creek water. Where ^HTi was undetectable the 186 keV peak was interpreted as arisingsolely from 226Ra.
The measured 222Rn retention rates varied from 7% to 17%. These low retention rates meanthat 222Rn (laughters cannot be used as reliable measures of 226Ra. The 186 keV peak gives agood measure of 'Ra, but only in the absence of uranium. The results for 234Th in musselsMl and M3 show that measurable uptake of either ^Th or more likely the parent 23SUoccurred over the course of the 50:50 RP2:Magela water experiments. Consequently, livecounting probably cannot be used for detection of 2:6Ra releases from mine pond waters withelevated levels of uranium. However, the method does show promise for studies of the kineticsof uptake of uranium.
Figure 3 shows the age dependence of the zzsRa/^Ra ratio for a collection of mussels fromMudginberri billabong as determined by Johnston eta/. (1987). If we assume that ^Ac (t^ =6.1 hours) is in equilibrium with its parent 228Ra in the mussel, then we can obtain an estimateof the age of each mussel while it is still alive (Table 7). This method of age determinationrequires knowledge of the 228Ra/226Ra - age relation for mussels from the source billabong.This may be obtained by measurement of the yearly mean 228Ra/226Ra ratio in the water andapplication of the model of Johnston etal. if the assumption is made that the ratio in the waterhas not varied significantly c 'er the life of the mussel.
The 212Pb/228Ac ratio determined for the larger mussels (Ml, M2 and M4) was close to 1.0.Consequently, the retention of 220Rn in the mussel must be close to 100% during counting, andwe can take the 2I2Pb/228Ac ratio to be a measure of the 2?8Th/228Ra ratio. Again, applicationof the known age dependence of the 228Th/228R3 ratio for Mudginberri billabong mussels(determined by Johnston et al. 1987, Figure 4) gives a method of determination of the age ofthe mussel (Table 7).
Table 5. Above-continuum background count rates (counts per kilosecond) for the detectorused.
Peak(kcV)
46
63
67
186
239
Bgd count rate
1.85 + 0.07
0.26 ± 0.07
0.30 ±0.04
0.42 ±0.04
4.72 + 0.32
Pcak(kcV)
295
338
352
609
Bgd count rate
0.24 ± 0.02
0.86 ±0.08
0.91 ±0.13
0.64 ±0.02
91

Table 6. Calculated activities for each count in Bq/mussel. Uncertainties are one standard deviation due to counting statistics only.
VO
Nuclide Peak(keV)
Count time (days)
Uran:um series
234Th 63
226Ra 186
2"Pb 295
2i<Pb 352
2"Bi 609
2iopb 46
222Rn*
222Rn/226Ra
Thorium series
22«Ac 338
2i2?b 239
228Ac/226Ra
212pb/228Ac
Ml
15.5.91
2
10.2 ±0.6
0.9410.13
0.93 ± 0.08
0.76 ± 0.09
1.1 ±0.4
0.87 ±0.05
0.09
1.86 + 0.23
1.92 + 0.09
0.18 ±0.02
1.0±0.1
Ml
4.10.91
3
14.6 ±0.4
2.39 ±0.11
2.03 ± 0.08
2.16 ±0.09
1.4 ±0.4
2.16 + 0.05
1.63 ±0.18
1.61 ±0.07
1.0±0.1
M3
20.5.91
3
3.7 ± 0.3
0.57 ±0.07
0.44 + 0.05
0.39 ± 0.06
0.5 ± 0.2
0.45 ± 0.03
0.12
0.84 ±0.13
0.46 ± 0.05
0.23 ± 0.04
0.5±0.1
M3
16.7.91
3
2.0 ±0.2
0.51 ±0.08
0.43 ±0.05
0.44 ± 0.06
0.5 ± 0.2
0.45 ±0.04
0.91 ±0.14
0.60 ± 0.05
0.7 ±0.1.
M4
24.5.91
3
9.3 ± 0.4
0.88 ± 0.09
0.62 ± 0.06
0.63 ± 0.07
1.5 ±0.3
0.68 ±0.04
0.07
1.99 ±0.17
1.74 ±0.07
0.21 ±0.02
0.9 ±0.1
M2
28.5.91
3
13.4 ±0.5
2.38 ±0.11
2.31 ±0.07
2.27 ±0.09
2.3 ± 0.3
2.31 ±0.05
0.17
1.96±0.18
2.24 ±0.07
0.15 ±0.01
1.1 ±0.1
M2
5.8.91
2
11.7 ±0.5
2.03 ±0.1 2
1.93 ±0.08
1.73 ±0.10
1.9 ±0.4
1.89 ±0.06
0.16
2.00 ±0.21
1.96 ±0.08
0.17 ±0.02
1.0 ±0.1
* 222Rn is the weighted average of the activities of 2UPb and 214Bi determined from the peaks at 295, 352 and 609 keV.

Table 7. Mussel ages calculated from isotope ratios. Uncertainties are one standard deviation due to counting statistics only.
Nuclide
228Ac/226Ra
Age (years)
212pb/228Ac
Age (years)
Ml
15.5.91
0.18 ±0.02
27
1.0 + 0.1
>20
Ml
4.10.91
1.0+0.1
>20
M3
20.5.91
0.23 + 0.04
14
0.5+0.1
6
M3
16.7.91
0.7 + 0.1
10
M4
24.5.91
0.21+0.02
19
0.9 ±0.1
20
M2
28.5.91
0.15 ±0.01
>35
1.1±0.1
>20
M2
5.8.91
0.17 ±0.02
33
l.OiO.l
>20

5. CONCLUSIONS
Radionuclides detectable by live counting of mussels from Mudginberri billabong included226Ra, 2I4Pb, 214Bi and 2'°Pb from the uranium series and 228Ac and 212Pb from the thoriumseries. Further tests will be required before the accuracy and precision of the method is known,so the technique should be regarded as semi-quantitative only for the measurement of absoluteactivities.
The measured 222Rn retention varied from 7% to 17%, so that 226Ra cannot be determined viathe radon daughter. 226Ra can be determined from the peak at 186 keV where the water has alow uranium content; however, rapid uptake of uranium by the mussel means that live countingprobably cannot be used for detection of 226Ra releases from uranium mine pond waters. Themethod does show promise for studies of the kinetics of uptake of uranium in mussels.
Measurement of the 228Ac/226Ra and 2l2Pb/228Ac ratios are capable of giving an estimate of theage of a live mussel provided the ratio - age relation for mussels from the source billabong isknown.
6. REFERENCES
Allison, H.E. & Simpson, R.D. (1989). Element concentrations in the .freshwater mussel,Veksunio angasi, in the Alligator Rivers Region. Technical Memorandum 25, SupervisingScientist for the Alligator Rivers Region.
Humphrey, C.L. & Simpson, R.D. (1985). The biology and ecology of Vclcsunio angasi(Bivalvia: Hydiidae) in the Magela Creek, Northern Territory. Open File Record 38 (in 4parts), Supervising Scientist for the Alligator Rivers Region.
Jeffree, R.A. & Simpson, R.D. (1986). An experimental study of the uptake of Ra-226 by thetissue of the tropical freshwater mussel Velcsunio an£as/(Sowerby) under varying Ca and Mgwater concentrations. Hydrobiologia 139, 59-80.
Johnston, A, Murray, A.S., Marten, R., Martin, P. & Pcttersson, H. (1987). Bioaccumulationof radionuclides and stable elements in the freshwater mussel, Velesunio angasi. AnnualResearch Summary 1986-87, Alligator Rivers Region Research Institute. Supervising Scientistfor the Alligator Rivers Region, AGPS, Canberra.
Marten, R. (1992). Procedures for routine analysis of naturally occurring radionuclides inenvironmental samples by gamma-ray spectrometry with HPGe detectors. Internal Report 76,Supervising Scientist for the Alligator Rivers Region.
94

Mussel
* Petri Dish
side view top view
Figure 1. Method of live counting. Mussels were taped to prevent them opening the shell andmoving on the detector.
10-
ocO)"oM—
03
OOT
1-
—P-| , 1 , ,—|—,—r~r-\
100 1000Energy (keV)
Figure 2. Absolute efficiency curves for mussels Ml and M3.
95

.35 -
10CMCMIo
IT
00CMCMI .25 Ho
o:
.15
Georgetown BillobongMudginbcrri BillabongModel
T
10I
20Mussel age (y)
i
40
Figure 3. Dependence of the radium activity ratio on age for mussels from Mudginbcrri andGeorgetown (normalised) billabongs. From Johnston era/. (1987).
20Mussel age (y)
Figure 4. Dependence of theFrom Johnston etal. (1987).
ratio on age for mussels from Mudginbcrri billabong.
96

PosterAbstracts
97

POSTER PAPER
HIGH VOLUME DUST MONITORING AT OLYMPIC DAM
J.F.DAVEYOLYMPIC DAM OPERATIONS
P.O. Box 150Roxby Downs S.A. 5725
A network of high volume dust samplers has been operating around the Olympic Damcopper/uranium mine since before the commencement of surface metallurgical processing in1988. The samplers continually collect airborne dust at eight sites around operation andresidential areas. Filters are changed weekly and monthly composites from each site arepresented to the laboratory for full radiochemical analysis. Five of the long lived uraniumdecay products, U238, Th230, Ra226, Pb210 and Po210 are separated and counted. TheSouthern Boundary Site (SBS) site 23 kilometres south of the operation has been identifiedas a background site. Data from this site is used for background subtraction to enableassessment of operation contribution to radiation exposure at three critical residentiallocations. A further two high volume samplers fitted with particle separator heads are rotatedbetween sites to obtain additional information on radionuclide concentrations in the sub 10micron fraction. It is evident from data collected to date that Pb210 and Po210 are almostexclusively contained in the sub 10 micron fraction while U230, Th230 and Ra226 are moreevenly distributed across the entire particle size range sampled by the standard teflon basedfilter. Further intercomparison trials are currently under way to investigate the performanceof a new polycarbonate filter capable of greater dust retention and requiring less frequent filterchanges.
98

THE TROPICAL FRESHWATER BIVALVE VELESUNIO ANSASI AS A REAL-TIME BIOSENSOROF URANIUM LEVELS. IN NATURAL HATERS
Scott J. MarkichA-B, Ross A. JeffreeA and Paul L. BrownA
A Environmental Science Program, Australian Nuclear Science and TechnologyOrganisation, Private Mail Bag 1, Menai, NSW, 2234, Australia
B School of Biological and Biomedical Sciences, University of Technology,Sydney, P.O. Box 123, NSW, 2007, Australia
Extensive deposits of uranium are known to exist in the Alligators RiversRegion of Northern Australia. The Ranger deposit, situated in the magelaCreek catchment, is the main deposit being mined at present, but others maybe mined in the future. During the wet season large volumes of water mayaccumulate at the mine site, and disposal of excess water by release toMagela Creek is one option to keep mine waste waters in manageablequantities. However, due to legislative requirements, elevated uraniumconcentrations present in waste waters at the Ranger Uranium Mine may limitdischarge into the receiving waters of Magela Creek. Since uranium has ahigh propensity for solubilisation and migration in natural water, it posesa potential hazard to aquatic organisms exposed to effluents resulting fromthe mining and milling of uranium.
The freshwater bivalve Velesunio angasi is ubiquitous and abundantthroughout the Magela Creek catchment. Bivalves are well known to respondto adverse chemical environmental impacts by isolating their soft tissuesfrom the aquatic medium by valve closure. The sensory acuity (viaspecialised regions including the osphradium) and associated repertoire ofbehavioural response can be employed to assess subtle effects exerted bychemical contaminants, such as uranium, that ultimately can influence thesurvival of an aquatic organism. Therefore, the valve movement behaviourof V. angasi was measured during exposure to varying levels of waterborneuranium, in the context of using the valve movement behaviour of thisbivalve species to indicate the biological significance of elevated uraniumwater levels.
The results indicate that several components of the valve movementbehaviour of V. angasi provide quantifiable and ecologically interpretablesub-lethal endpoints for the rapid and sensitive evaluation of waterscontaining elevated levels of uranium.
99

CROSS-CALIBRATION DISCREPANCIES INENVIRONMENTAL GAMMA DOSIMETRY
R.G. LYONS AND B.J. BRENNAN
DEPARTMENT OF PHYSICS, UNIVERSITY OF AUCKLAND, PRIVATE BAG,
AUCKLAND, NEW ZEALAND
Some field measurements of environmental gamma dose rate using a Canberra field
gamma spectrometer with a Nal detector are compared with those obtained using TLD
and show a systematic discrepancy close to a factor of two. Possible reasons for the
discrepancy are discussed, including environmental factors (non-homogeneity, radon
escape, moisture content, time variability) and calibration factors for both the TL and the
spectrometer (shielding, annealing, laboratory/environmental comparisons). None
offers a sufficiently substantial adjustment to reconcile the disagreement in the results
given by the two methods. In fact some of the actual and potential systematic errors
revealed suggest that the discrepancy may be worse than the data suggest. Comparison
with dose rates estimated from radionuclide concentrations could not determine which
method was more accurate as the correlation between these estimates and the previous
ones was negligible, casting some doubt on the accuracy of the concentration estimates.
The danger of relying on a single method of estimating dose rate without careful cross-
calibration is highlighted.
Gamma; radiation; dosimetry; environmental radiation; cross-calibration; calibration;spectrometer, TL dosimeters.
100

LIST OF PARTICIPANTS
Riaz AkberOffice of the Supervising Scientistprivate Bag 2Jabiru, N.T. 0886Tel: (089) 799711; fax (089) 792076
Susan BrownANSTOPMB 1Menai, NSW, 2234Tel: (02) 7173862; fax (02) 7179260
Graeme Claridge33 Kotari RoadEastbourneNew ZealandTel: (04) 5628492
Yves BourlatSMSR/SESEBP 208-91311 MontlheryFranceTel: 33 1 60836625; fax 33 1 60836672
Malcolm CooperAustralian Radiation LaboratoryLower Plenty RoadYallambie, Vic. 3085Tel: (03) 4332211; fax (03) 4321835
Nicholas CorlisSchool of Earth SciencesFlinders UniversityS.A.Tel: (08) 2769239; fax: (08) 201 2676
Bruce DicksonCSERO Division of Exploration and MiningPO Box 136North Ryde, NSW, 2113Tel: (02) 8878767; Fax: (02) 8878909
John DaveyOlympic Dam OperationsPO Box 150Roxby Downs S.A., 5725 ,Tel: (086) 718368; fax (086) 711135
Fiona Dyer21 CainAve.Northcote, Vic., 3070Tel (03) 2635702
George GandyEnvironmental Protection AgencyPO Box 136Regents Park, NSW, 2143Tel: (02) 7955484; fax: (02) 6494470
Frank HarrisOffice of the Supervising ScientistPO Box E348,Parkes, ACT, 2600Tel: (06) 2741774; fax: (06) 2735014
Gary HancockCSIRO Division of Water ResourcesPO Box 1666Canberra, ACT, 2601Tel: (06) 2465739; Fax: (02) 2465800
Vladimir Jamnicky3/24 Nunyah Ave.ParkholmeS.A. 5043.
Ross JefireeEnvironmental science ProgramANSTOPMB 1, Menai, NSW, 2234Tel; (02) 7173583; fax (02) 7179260
101

Robyn JohnsonAustralian Geological Survey OrganisationGPOBox378Canberra, ACT, 2601Tel (06) 2499111
Andrew JohnstonS.A. Health CommissionPO Box 6Rundle Mall, Adelaide, S.A.Tel: (08) 2266523; fax: (OS) 2266255
Ruth LyonsUniversity of AucklandPrivate Bag 92019Auckland, New ZealandTel: 64 9 3737599; fax: 64 9 3737445
Scott MarkichEnvironmental science ProgramANSTOPMBl.Menai, NSW, 2234Tel; (02) 7173814; fax (02) 7179260
Lindsay MartinAustralian Radiation LaboratoryLower Plenty RoadYallambie, Vic. 3085Tel: (03) 4332211; fax (03) 4321835
Paul MartinOffice of the Supervising Scientistprivate Bag 2Jabiru, N.T. 0886Tel: (089) 799711; fax (089) 792076
K. Murray MatthewsNational Radiation LaboratoryPO Box 25-099Christchurch, New ZealandTel: 64 3 3665059; fax: 64 3 3661156
Andrew MurrayCSIRO Division of Water ResourcesPO Box 1666Canberra, ACT, 2601Tel: (06) 2465818; Fax: (02) 2465800
Jon OlleyCSIRO Division of Water ResourcesPO Box 1666Canberra, ACT, 2601Tel: (06) 2465826; Fax: (02) 2465800
John PfitzncrOffice of the Supervising Scientistprivate Bag 2Jabiru, N.T. 0886Tel: (089) 799711; fax (089) 792076
Chris PoletikoIPSN/LESEBP 519 PapeeteFrench PolynesiaTel: 689 481707; fax: 689 430231
Alvin SummcrtonRadiation Protection BranchS.A. Health CommissionPO Box 6, Rundle Mall, AdelaideTel: (08) 2266525; fax: (08) 2266255
Richard TinkerChemistry DepartmentMelbourne UniversityVictoriaTel: (03) 3447093; fax: 3475180
L.F. (Bill) ToussaintRadiation Health18 Verdun St;Nedlands, W.A. 6009Tel: (09) 3463317; fax: (09) 3811423
102

John TwiningANSTOPMB 1Menai, NSW, 2234Tel: (02) 7173060; fax: (02) 7179260
H. Herbert VeehSchool of Earth SciencesFlinders UniversityS.A.Tel: (08) 2012306; fax: (08) 201 2676
Peter WallbrinkCSIRO Division of Water ResourcesPO Box 1666Canberra, ACT, 260 1Tel: (06) 2465823; Fax: (02) 2465800
Neil WhiteheadInstitute of Geological and Nuclear SciencesPO Box 3 13 12Lower Hutt, New ZealandTel: 64 4 5704653; fax: 64 4 57046457
Wlodek Zahoro' vskiANSTOPMB1Menai, NSW, 2234Tel: (02) 7173804; fax: (02) 7179260
103


![3} tj- 7] - OSTI.GOV](https://static.fdokumen.com/doc/165x107/631c4c86b8a98572c10cd705/3-tj-7-ostigov.jpg)