4“4h% @FJ - OSTI.GOV
149
4“4h% @FJ 05585 .— —.—._ -1 21 ‘T World Gas Conference - June 6-9, 2000- Nice - France REPORT OF WORKING COMMITTEE 2 PRODUCTION OF MANUFACTURED GASES RAPPORT DU COMITE DE TRAVAIL 2 PRODUTION DE GAZ MANUFACTURES Chairman/President Francis S. Lau United States of America
-
Upload
khangminh22 -
Category
Documents
-
view
0 -
download
0
Transcript of 4“4h% @FJ - OSTI.GOV

4“4h% @FJ05585
.— —.—._-121 ‘T World Gas Conference - June 6-9, 2000- Nice - France
REPORT OF WORKING COMMITTEE 2PRODUCTION OF MANUFACTURED GASES
RAPPORT DU COMITE DE TRAVAIL 2PRODUTION DE GAZ MANUFACTURES
Chairman/President
Francis S. Lau
United States of America

I
DISCLAIMER
Portions of this document may be illegible
in electronic image products. Images are
produced from the best availabie original
document.

ABSTRACT
The Committee’s work during this triennium focused on 4 topic areas. They are: the potential ofhydrogen in meeting long term energy demands, future development prospects for manufactured gasunits/gasification of coal, biomass, and opportunity materials for the production of electricity andchemicals, recovery of methane from coal seams, and update on management of contaminated gassites.
This report presents the status and the potentials of present and future opportunities for the gasindustry in the areas of manufactured gases including hydrogen and coal bed/mine methane. Theidea of hydrogen as an energy carrier is getting increased attention these days for its promise ofsuper clean emissions at the point of use. The development of fuel cells for stationary and mobileapplications has highlighted the need of hydrogen production, storage and infrastructure. Hydrogenappears destined to be a major energy source of the future. The industry for gasification is growing,particularly for the production of electricity and chemicals from opportunity fuels, such as petroleumcoke from refineries. Coal and biomass are also getting increased interests due to their promise ofhigh efficiency and lower emissions. Methane from coal mines is also getting increased attention duenot only to its environmental benefits but also to its favorable own economics. The future of theenergy industry will be price and environmentally driven. A well-informed gas industry will be in aposition to continue to play a major role in the future of the energy industry world-wide.
RESUME
Les travaux du comite durant ce triennat ont porte sur 4 sujets: Ie potentiel de I’hydrogene a satisfaireIes besoins a long terme en energie, Ies opportunities de developpement futures pour la gazeificationde charbon, biomasse et autres combustibles interessants pour la production d’electricity et deproduits chimiques, la recuperation du gaz de houille et I’avancement des travaux menes sur Ies sitesgaziers pollues.
Ce rapport presente la situation et Ie potentiel des occasions presentes et futures pour l’industriegaziere clans Ies domaines des gaz manufactures, dent l’hydrogene et Ie gaz de houille. La possibilityd’utiliser I’hydrogene en tant que vecteur d’energie est considered de plus en plus serieusement dufait de I’absence totale d’emission de polluants Iors I’utilisation. Le developpement des piles acombustible a mis en Iumiere Ies Iacunes en matiere de production d’hydrogene, de stockage etd’infrastructure. L’hydrogene devrait jouer un rble considerable clans Ie paysage energetique futur.L’industrie de la gazeification est en croissance, particulierement pour la production d’electricity et deproduits chimiques a partir de combustibles pouvant se reveler interessants tel que Ie coke de petroleclans Ies raffineries. Le charbon et la biomasse jouissent egalement de plus d’attention du fait deprogres en matiere de rendement et d’emissions. II en est de m~me pour Ie gaz de houille nonseulement a cause des avantages environnementaux mais aussi a cause d’une bonne rentabilityeconomique. Les prix et Ies considerations environnementales continueront a determiner Ie futur desindustries de I’energie. Une industrie gaziere bien informee sera bien placee pour continuer a jour unrde majeur clans [e devenir energetique de la planete.

TABLE OF CONTENTS
1- Abstract
2 – Topics of the Committee Report
3- Round Table Sessions, Oral Papers and Committee Report
4 – Introduction
5- SG2. I The Potential of Hydrogen in Meeting Long-term Energy Demands
6- SG2.2 Future Development Prospects for Manufactured Gas Units/Gasification
7 – Coalbed Methane Report
8- Manufactured Gas Plant Site Remediation Update
Appendix A - Gasification Plant Database
Appendix B - Membership of the Committee and Committee Meetings

TOPICS OF THE COMMITTEE REPORT
SG2.I The Potential of Hydrogen in Meeting Long-term Energy Demands
SG2.2 Future Development Prospects for Manufactured Gas Units/Gasification
Coalbed Methane
Manufactured Gas Plant Site Remediation
ROUND TABLE SESSIONS, ORAL AND POSTER PRESENTATIONS
Round Table Session RT21Theme: “Managing Carbon Dioxide Emission in the Energy ConversionProcess”
List of oral and poster presentations
Papers:
021 Hydrogen activities in the EU Work Programme (511), Italy, Abraham Bahbout, GiamperoTartaglia
022 Hydrogen Energy Program (WE-NET) of Japan Ministry of International Trade and Industry(176), Japan, Kenzo Fukuda
023 Natural Gas and Hydrogen - Partners in an energy future (81) USA, Cathy Gregoire Padre,Neil Rossmeissl
024 Syngas and fuel gas from gasification of coal and wastes at Schwarze Pumpe, Germany(138), B. Buttker, H. Hirschfelder, W. Seifert, Helmut Vierrath
025 Coal bed methane enhancement with C02 sequestration (47), UK, Paul Freund, John Gale
Poster:
P201 Development of on-site high-purity hydrogen manufacturing equipment (239), Japan, HirokiFuruta
P202 From Landfill gas to towngas (247), China, James Y.C. Kwan, Philip K.S. SiuP203 Investigation of methane production efficiency from coal beds using computer simulation (54),
Poland, Stanislaw Rychlicki, Jakub Siemek, Jerzy StopaP204 Coal gas comeback to the energy market-Moving bed gasification in combined gas cycle for
electricity and heat production (101 ), Czech Republic, Zdenek Bucko, Jaroslav Crha, JiriPeterka, Frantisek Straka, Jiri Stritzko, Miroslav Zdrahal

4- INTRODUCTION
This is the last of a series of reports preparedManufactured Gases. When IGU was first established in
by the Committee on the Production of1913, all member countries has their uas
indust~ based primarily in the production’ of town gas from coal. In the nineteen fifties and sixt;s,natural gas began to replace town gas in many parts of the world, due largely to its wide spreadavailability and superior properties over town gas from coal. Then in the nineteen nineties theindustry experiences significant growth when the global economic expansion demanded not only lowcost energy, but reliable and clean energy for fueling their economic growth around the world. Naturalgas fits the bill. For the next triennium 2000-2003, the subject matter for the Committee on theProduction of Manufactured Gases will be taken up by the Committee on Exploration and Productionof Gases.
The gas indust~ in some parts of the world is experiencing deregulation and marketcompetition, not only from other gas companies but also from other energy industries. In addition,there is a growing number of new combined utilities providing both gas and electricity and then thereare the mega energy companies that offers all forms of energy including water and other services totheir customers, the one-stop shop. A well informed gas industry will be in a position to play a majorrole in the future of the energy industry worldwide. In this last report of the Committee on theProduction of Manufactured Gases, the committee has identified three areas of potential opportunitiesfor the gas industry: hydrogen, gasification of fossil and renewable resources, and coal mine/bedmethane. The report preparation on ‘Hydrogen in meeting long-term energy demand’ was undertakenby Study Group 2.1 chaired by Mr. Y Asaoka of Japan. The report preparation on ‘FutureDevelopment Prospects for Manufactured Gas Units/Gasification’ was undertaken by Study Group 2.2chaired by Mr. W. Seifert of Germany. In addition, updated reports on Coalbed Methane wasprepared by S Rychlicki of Poland and on the Manufactured Gas Plant Site Remediation wasprepared by M. Bernhart of Germany.
Summary of the work of Study Group 2.1
In parallel with the steady increase in world energy consumption, global environmentalproblems have become a major concern for energy policy planners. Population increase andaspirations for higher living standards worldwide will exacerbate the problem and drastic energy policychanges must take place to ensure the survivability of the planet. The 21st century will require ajudicious mix of energy sources to provide a transition from unsustainable fossil fuels to sustainableenergy sources that will solve both local and global environmental problems.
Although all fossil fuels produce anthropogenic C02 and are available in finite amounts,natural gas is considered to be the least environmentally damaging fossil fuel. In addition, its resourcebase might be secure for the long term by the enormous amount of natural gas estimated available ingas hydrates (methane trapped in cage-like structures existing in enormous volumes in the arctic anddeep oceans). Wkh the increase in demand for clean fuels and the possibility of very large increasesin resource volume, it is clear that the natural gas era is just beginning.
In light of the study of the Intergovernmental Panel on Climate Change (IPCC, a UnitedNations Organization) on the effects of carbon emissions, natural gas is also the logical transition fuelto low-carbon-content fuels, given its high hydrogen-to-carbon ratio. It is the natural transition fuel tohydrogen energy systems.
The potential of hydrogen energy systems was recognized worldwide with the oil crisis of the1970’s, when many countries initiated large research and development (R&D) programs related tohydrogen, particularly hydrogen produced from nuclear power that was expected to be “too cheap tometer.” However, the cost of hydrogen production proved to be high. In addition, hydrogen could notbe rapidly deployed as an immediate substitute for petroleum. Given these factors, interest andfinancial support waned. Interest in hydrogen was renewed in the 1990’s with the recognition of itspotential role in solving global environmental problems related to greenhouse gases. Significantadvances have been made in hydrogen R&D, particularly in renewable-based hydrogen productiontechnologies. Although costs remain high, the environmental benefits of hydrogen are recognized as

very attractive. Large-scale investments in the development of fuel cells for automotive and powerapplications have revived industrial interest in hydrogen and very large investments are being madeby a number of companies.
Hydrogen, like electricity, is an energy carrier that must be produced from other prima~energy sources. H can be derived from coal, oil, natural gas, biomass, waste, and even water throughthe use of nuclear and renewable power. Both electricity and hydrogen are clean, versatile, and easyto use. In contrast, only hydrogen can be stored in large quantities for long periods of time and usedas a chemical feedstock or material treating gas. Moreover, hydrogen can be used in all energyapplications. Given these advantages, hydrogen could become an important energy carrier for the21st century and beyond.
However, hydrogen as a fuel, with its excellent environmental properties and versatility, islikely to make significant inroads into the marketplace before the second half of the 21st century. Thisis both a challenge and a major opportunity for gas companies who will need to plan for thesechanges by improving existing conversion technologies, developing new ones, and by examining thepotential of the existing large-scale natural gas infrastructure for hydrogen transmission anddistribution.
The IGU asked this Study Group to answer three questions, in order to survey the thoughtsand intentions of the gas industry regarding Hydrogen. The answers may be summarized as follows:
What specific role can hydrogen assume in meeting global energy demand?What will be the most likely captive markets (regional, niche or others)?
Hydrogen can be an excellent or even ideal form of energy to counter the greenhouse effectand global warming. It can be produced with low C02 emissions from renewable or from fossil fuelswith C02 sequestration. Its utilization will surely become necessary before the latter half of the 21stcentury when the supplies of fossil fuels, with the exception of coal and super heavy oils (tar sand,etc, ..), are expected to dwindle or become prohibitely expensive because heavy environmental taxes.
In the transition period, hydrogen will be used as an energy carrier when and where it will becost effective. Government mandates or incentives can ease the transition to clean fuels in the shortterm, but hydrogen must ultimately succeed in the marketplace without any direct governmentsupport. However, as governments become more reluctant to bear the costs of the environmental andpublic health effects of energy use and as they continue to tighten environmental standards andincrease energy taxes, hydrogen as an energy carrier is likely to become competitive in not such adistant future, possibly well before the latter half of the 21st century.
It is unlikely that new long-distance infrastructures will be built for hydrogen in the near future.Existing natural gas infrastructures, compatible with hydrogen with minor modifications, will be used atfirst. This will give the present gas (transportation) companies a considerable competitive edge overother energy companies in the 21st century.
Because hydrogen can be produced from a wide variety of feedstocks, such as coal, naturalgas, biomass and solar energy, it can be produced nearly everywhere on earth. Hydrogen is thusattractive for developing as well as industrialized nations. The production and use of hydrogen islikely to follow different economics for different regions of the world, depending on whether it isproduced using local resources and consumed in the community or produced on a large scale andexported or traded.
In recent years, significant economic resources have been applied to the development of fuelcells for automotive applications. The hydrogen-powered fuel cell vehicle is projected by majorautomotive manufacturers to be cost-competitive in the next decade . This economic advantage isdue to the 2.0 to 2.7 times greater efficiency of the fuel cell vehicle compared to the conventionalpetroleum-fueled internal combustion engine vehicle. This higher efficiency more than overcomes the25 ?4.energy loss encountered when natural gas is converted to hydrogen.

Rural areas in industrialized countries without adequate power and gas distribution networksand developing countries without dense infrastructures are excellent markets for independenthydrogen systems that come close to the vision of a hydrogen energy economy, where all energyneeds are supplied by renewable resources with little or no environmental impact. The systemincludes the production of hydrogen from renewable resources coupled with hydrogen storage anduse in fuel cells. These markets may become the driving forces for the development of smallstationary fuel cells and renewable hydrogen systems and this development will help reduce the costof fuel cells for the benefit of the gas industry.
After markets have been identified, which [primary energy source and] production processesappear to be the most promising (solar, hydro, nuclear, biomass, wastes) ?
In the first half of the 21st century, non-renewable sources, such as natural gas, are the mostlikely resources for hydrogen production. Technologies ranging from small to large capacities arecurrently available. It is expected that hydrogen production processes will be further improved in thefuture, especially the small capacity processes. Hydrogen production from coal and super heavy oils,whose world reserves are high, is characterized by high investment costs and is therefore, likely to beused only for large-scale production. Since COZ emissions are produced in large quantities duringhydrogen production from fossil fuels, sequestration or further utilization of COZ in chemicals mayneed to be considered. The energy industry has started to respond to the challenge with newprocesses such as the carbon black plasma process which produces carbon and hydrogen fromnatural gas, and improved steam methane reforming processes which provide C02 sequestrationopportunities.
Although possibilities exist for producing hydrogen from non-fossil resources, there are manyproblems to be solved. For distributed, renewable-based hydrogen systems, storage andtransportation of hydrogen are particularly important and are areas of continuing research anddevelopment by governments and industry. Other goals and areas for improvement are:
Higher efficiency and capacities for hydrogen production from renewable resourcesPhotovoltaics (PV), electrolysis, etc, . ..)Reduced cost of renewable-based systemsMore systematic collection of biomass and wastes for hydrogen productionHigher confidence of the public in the safety of the use of hydrogen
Hydrogen production from non-fossil fuels on a regional scale is anticipated to become cost-competitive during the latter half of the 21st century. However, production with high efficiencyprocesses using fossil fuels, especially natural gas, will be necessary much sooner.
What role should IGU take or play?
As the conclusion of this report, it is proposed to the IGU to significantly increase the level ofits activity on the subject of hydrogen as an energy carrier and to consider the following proposals foraction: The IGU should install a permanent committee, or task force, coordinating all knowledgegathered on hydrogen to keep its members updated about the development of hydrogen technologiesand markets.
● The IGU should continuously encourage new R&D or coordinate existing R&D among itsmembers on production, storage, transpofiation and utilization of hydrogen energy with along-term and broad viewpoint. [t should see hydrogen as the promising fuel for the secondhalf of the 21 ‘t century, instead of limiting its view to the narrow context of natural gasutilization for the production of hydrogen.
● The IGU should be represented at international conferences (e.g. the World HydrogenEnergy Conference, etc, . ..) in the field of hydrogen as an energy carrier, similarly to whatwas done by IGU in the field of LPG and computer technologies. The IGU should be amongthe sponsors of these conferences

● The IGU should make funding available for R&D activities on Hydrogen and include thesubject of hydrogen as an energy carrier in its traditional activity of requesting R&D proposals.
Summary of work done by SG 2.2
The International Gas Union’s (IGU) Committee on Manufactured Gas commissioned a studygroup to evaluate the current status of gasification throughout the world. The study assessesgasification potential role and will assist the IGU and the gas industry in planning a course of action.Today, there are approximately 385 gasifiers operating at 138 sites in 22 countries. These gasifiersconvert all types of carbon-based feedstocks, such as coal, natural gas, petroleum coke and residues,industrial and municipal waste, and biomass, to 378 million cubic meters per day of synthesis gas, anamount equivalent to nearly 13,200 MWe of electricity. These gasification plants provide industrialcustomers with hydrogen for petroleum refining, synthesis gas for the manufacture of premiumchemicals, environmentally superior transportation fuels, and electricity.
The development of gasification processes and supporting technologies is continuing in manycountries throughout the world. Neatly 38,000 MWth of synthesis gas are produced; the plannedcapacity in the next 5 years is expected to add another 10,000 MWth. Near-term markets areevidenced by the increasing number of applications in the petroleum refining industry throughout theworld, with new plants being announced each year. Plants for the gasification of biomass andmunicipal wastes are also beginning to be deployed. Such markets exist for gasification because ofthe availability of low-cost feedstocks, making the technology economical in niche applications. Thesuperior environmental emissions performance of the process compares favorably to competingtechnologies. The process is able to co-produce products of higher value, allowing competitivelypriced power to be produced, and it has the potential of capturing and sequestering carbon dioxide,thereby reducing global carbon dioxide emissions.
Over the next decade or so, the coal gasification market is expected to increase as a result oflower capital and operating costs due to technological improvements, lower coal prices, and increasedpower demand in developing nations such as China and India. Other markets are also expected todevelop in this time frame-for example, the pulp and paper industry. Ultimately, because of the vastreserves of coal, in addition to other carbon-based feedstocks, gasification is expected to play a keyrole in the transition to a “hydrogen economy” and in the sequestration of carbon dioxide. With furthertechnical innovations and an expected continued rise in natural gas prices, the cost of hydrogen fromcoal and other carbon-based feedstocks is expected to be competitive w“th hydrogen produced fromnatural gas in the future.
This report presents an overview of the most essential aspects of gas manufacture. It islimited to a description of the various technologies utilizing a large number of feedstocks, excludingthe gasification of natural gas. A listing of the most important gasification projects throughout theworld, including commercial plants, demonstration plants, plants in planning/construction, and pilotplants is contained in the report.
Based on the data and analyses in the report, it is evident that the development andcommercialization of gasification is continuing worldwide involving many organizations. The WOC 2Committee on Manufactured Gas recommends that the IGU and the gas industry continue to monitorthese developments and explore existing and new market opportunities for the supply of syntheticnatural gas, and gas for power generation and steam production. In addition, opportunities should beexplored for the manufacture of chemicals and fuels to enhance the industry’s competitive position inthe market and to improve the return to investors. The committee also recommends that the gasindustry begin to develop a strategic plan that will ensure its leadership position in the “hydrogeneconomy” and the mitigation of carbon dioxide emissions. Finally, the gas industry should continue toactively support the development and demonstration of gasification and supporting technologies sothat economic performance targets can be achieved in advance of the market.

SG2-ITHE POTENTIAL OF HYDROGEN
IN MEETING LONG-TERMENERGY DEMANDS
I

TABLE OF CONTENTS
INTRODUCTION
1 Safety Aspects of Hydrogen Use
2 Source Assessment
2.1 Non-Fossil sources2.2 Fossil sources2.3 Nuclear Sources
3 Environmental Benefits of Hydrogen
3.1 Control of COZ in the atmosphere3.2 Emissions of COP and other pollutants from hydrogen
4 Review of Hydrogen Technologies and Economics
4.1 Production4.2 Transportation and storage4.3 Utilization
5 Hydrogen Energy Projects
5.1 Introduction5.2 Multi-Projects5.3 Demonstration Projects
6 Future Impact of Hydrogen Energy to the Gas Industry and the role of IGU
6.1 Economics of hydrogen introduction into the market6.2 Introducing hydrogen into the market6.3 IGU support for R&D activity on hydrogen energy
References

INTRODUCTION
For this triennium the topic under the responsibility of WOC2 to the production ofmanufactured gases. Somewhat broadening this initial scope, this study group (WOC2-SG2.I ) hasinvestigated all technical aspects related to hydrogen energy beyond production. This was inspiredby a number of developments with regard to hydrogen:
. The (potentially) strategic importance of hydrogen to the world energy supply, especiallywith regard to the convergence of electricity and gas markets.. The shift of the energy market toward a global market, and distributed generation.● The ever-tougher environmental constraints and increased public concern overenvironmental issues.. The emergence of important hydrogen-based technologies, particularly fuel cells.● The potential of natural gas to become the preferred energy carrier during the longtransition to a sustainable energy economy based on renewable.
In this report, hydrogen was evaluated with the interest of gas industries in mind.
The chairman and secretary of this study group exchanged opinions with the secretary of theWOC 9 SG 9.4 “Ultra-Long-Term Global Energy Scenario Group” which is preparing energy scenariosfor the 21st century to analyze the role of natural gas. Because these efforts progressed in parallel, itwas not always possible to have sufficiently frequent exchange of opinions between the two studygroups, and a few statements in the reports may not be fully in line with each other.
Study Group 2.1 sought the cooperation of several organizations directly involved indeveloping hydrogen energy, such as the U.S. Department of Energy and WE-NET Center in Japan.Also gas companies in each member nation participated. The SG 2.1 met five times over the three-year report development period. Discussions between the members and the advice of the WOC 2committee are reflected in the outcome of this survey.
The study group’s goal was to answer the three questions asked by the IGU regardinghydrogen:
. What specific role can hydrogen assume in meeting global energy demand? What will bethe most likely captive markets (regional, niche, or others)?. After markets have been identified, which [primary energy sources and] productionprocesses appear to be the most promising (solar, hydro, nuclear, biomass, wastes)?. What role should IGU take or play?
This report was prepared by:Mr. Yoshikiyo AsaokaChairman of the Study Group 2.1Mr. Takayuki AzumaSecretary of Study Group 2.1Mine. Helene VerbockhavenDr. Jacques Saint-JustDr. Giuseppe ViscardiMr. E. A. M. de NieMr. Nico HanschenMr. Bengt RidellMs. Catherine E. Gregoire Padro
Japan
JapanFranceFranceItalyNetherlandsNetherlandsSwedenUnited States
The SG2. I meetings were held as follows:
Ist meeting at Malmo in Sweded on May 1319982nd meeting at Praha in Czech Republic on on October 261998Authors’ meeting at Nijimegen in the Netherlands on January 21,2219993rd meeting at Firenze in Italy on April 2319994th meeting at Leipzig in Germany on October 61999

1. SAFETY ASPECTS OF HYDROGEN USE
Thepublic perception ofhydrogen asadangerous substance is, possibly, the most serioushurdle that hydrogen will have to overcome before it can become widely accepted [1]. Safetyregulations in all countries favor conventional fuels, and despite an impressive industrial safety recordthat demonstrates that hydrogen can be used safely, the Hindenburg episode remains a counter-demonstration for the public and for safety regulatory bodies. Ironically, recent investigations into thecause of the Hindenburg accident have revealed that the skin of the dirigible was coated with a highlyflammable material, resulting in the fire that ultimately destroyed the vessel [2]. In fact, theHindenburg’s sister ship operated safely for more than one million flight miles with a non-flammableenvelope. In addition, gas companies throughout the world distributed town gas, a mixture of carbonmonoxide (CO) and hydrogen, for more than half a century with a safety record that was marred onlyby accidents as a result of the toxic nature of CO.
The safety aspects of hydrogen have been studied thoroughly [3,4,5]. They are bestappreciated by comparison with other fuels in similar situations. All the studies start by compiling thephysical and chemical properties of the fuels, and then list the risks at various stages of the fuel chain,from production to use. Among the risks, fire and explosive hazards are paramount because theyconcern the end users. A comparison of combustion and explosion behaviors of hydrogen andnatural gas is given in Table 1.1. The differences between the two fuels can be traced to theirphysical properties, see Table 1.2.
Behavior/HazardHydrogen is Natural gassafer is safer I
I Leak rate I lx IVelocity of dispersion lx IFlamrnahilitv ram= lx ILower flarnrnahilitv limit I x I
DetonabiiityHazar[
t range xd duration x
i EXD10SiVF3enerav. ~er unit VOILHTV5 x1Uncontrolled ianition I lx I1CO emission lx I I~Severity of fire damage lx I I
Table 1.1: Safety comparison of hydrogen and natural gas
Depending on the application and on the importance given to the individual safety criteria, thestudies [3,4,5] rank either hydrogen or natural gas as the safer fuel, by a small margin.
[n unconfined situations, it is almost impossible to detonate hydrogen because its highvelocity of dispersion prevents a high-enough concentration in air. In confined situations, hydrogen ismore dangerous than natural gas, as its higher flame velocity makes the transition from deflagration todetonation and explosion easier for hydrogen. However, this also means that hydrogen burns quicklywithout spreading out and is less likely to cause extensive damage to surroundings.
Further comparisons of the fuel behaviors in relation to safety can be found in the safetystudies [3,4,5] mentioned. They all agree that, if a few specific precautions are taken, hydrogen is nomore dangerous, on average, than natural gas or gasoline for vehicular and stationary uses andapplications in unconfined areas. Gaseous or liquid hydrogen could be stored, transported anddistributed on a large scale, much as it is today in industry and the merchant market. Most problemsrelated to hydrogen safety, such as steel embrittlement, have long been solved or are wellunderstood.
A few gas companies are now considering hydrogen/natural gas blends for distribution. Earlystudies concluded that most natural gas distribution systems could safely transport up to 20%hydrogen by volume with few or no modifications [6]. In terms of safety of combustion, gas blends

containing 20% hydrogen were found to be the limiting mixtures for appliance burners, but pilotburners would have to be modified for hydrogen fractions higher than 11%. Few studies have beenperformed on the transportation of hydrogen in polyethylene lines. However, a recent Dutchinvestigation pointed out that the distribution of 17’3!0hydrogen blends would result in a 0.4% increasein total leakage, which is a negligible increase ~].
For progress on the concept of ‘rHydrogen as an Energy Carrier,” safety should not representa major obstacle at any stage, but further demonstrations will be mandatory [3]. Major projects thathave already been initiated (storage of liquid hydrogen in Hamburg + 200 kWe fuel cell) andconcluded (demonstration plant at Neunburg vorm Wald [4]) are quite instructive and convincing indemonstrating the safety of hydrogen-based energy systems.
Safety aspects and regulations are intimately linked. Because of hydrogen’s reputation andwith today’s regulations being more strict than in the past, the safety regulations concerning hydrogenwill always be more severe than those concerning conventional fuels. However, no fuel is or ever willbe perfectly safe, so the benefits of hydrogen as a fuel combined with the strict regulations shouldhelp overcome all justified and unjustified safety concerns. The present interest in hydrogen and fuelcell vehicles (FCV) may also accelerate the process. The safety standards concerning hydrogen arenot yet established but an International Standards Organization Technical Committee deals with theissue. The European Commission also has taken action in this area [8]. On a national level, theGerman safety organization, the TUV, has issued guidelines for hydrogen that have beenextrapolated from natural gas handling procedures [9]. This is a reminder that in view of theirexperience with both natural gas and town gas (which contained up to 50’-% hydrogen), gascompanies will be in a good position to accommodate hydrogen as a new fuel from the standpoint ofsafety and to contribute to solving safety problems. 1 4
I Hydrogen I Methane I GasolineDensity of gas, kg/mS (STP, 293 K 100 kPa\\ I 0084 1065 144a i
Higher heating value, kJ/g . . ..-Thermal conductivity of gas, mWcm-’ K-’ (STP) 1.897 i:3i 0;112Diffusion coefficient in air at standard conditions. cmz/s 0.61 0.16 0.05
_. .,___ ...- / 1 ----- 1---- I . . .
I 1418 1555 I 48 1
itv limits in air. vol YO I 4.0-75 15.3-15 II -7.6 1Detonability limits in air, VOI ?40 18.3-59 6.3-13.5 1.1 -3.3Limiting oxygen index, VOIYO 5 12.1 11.6’Stoichiometric composition in air, VOI ‘XO 29.53 9.48 1.76
I Minimum energy for ignition in air, mJ I 0.02 10.29 10.24 IAutoignition temperature, K 858 “813 “500 -744Flame temperature in air, K 2318 2148 2470Flame emissivitv. YO 17-25 25-33 34-43
I Maximum burnina velocitv in air. m/s LSTP) 13.46 I 0.45 ! 1.76 1Detonation velocity in air, km/s (STP) 1.48-2.15 1.4-1.64 1.4- I.7CEnergy 0 of explosion, mass-related, gTNT/g 24 11 10Energy a of explosion, volume-related, gTNT/m~ (STP) 2.02 7.03 44.2
Table 1.2: Combustion and explosion properties of hydrogen, methane and gasoline
a 100 kPa and 15.5°Cbaverage value for a mixture of Cl -C4 and higher hydrocarbons including benzeneC based on the properties of n-pentane and benzened theoretical explosive yields
2. SOURCE ASSESSMENT
2.1- Non-fossil sources
The most common non-fossil sources for hydrogen production are:● Organic renewable sources i.e. biomass or biomass-derived liquids and gases (ethanol,etc.).

. Water with hydrogen production by electrolysis with non-fossil electricity; e.g., hydropower,nuclear power, wind power, solar power, and geothermal electricity.
The following table gives an overview of the situation today and a possible future potential forhydrogen production.
Global Solar energy Hydrogen Hydrogen Hydrogen Hydrogenenergy Earth surface from from from from wind
Year Conversion EJ biomass’) PV 2) hydropower power 4)3)
EJ EJ EJ EJEJ
1996 I382 1009000 0 0 0,010 0
2030 I497-755 1009000 c1 <q 11
Future 1500-1000 1009000 113 580 20 )-20
. 10% of the surface of the earth cultivated with energy crops or wood
. PV on 1YOof the surface of the earth used for electrolysis of water
. Hydropower, total potential 15,000GW production about 200 EJ only a small part canin practice be considered for hydrogen production. The total theoretical wind energy is estimated to 1200 EJ, but only a small part can inpractice be considered for hydrogen production
2.1.1- Biomass and waste
The most common biomass in use for energy production is wood. Much of world’s energyrequirements are still met by individual supplies of wood and other forms of biomass. Thestatistical details are very unreliable, and estimates vary. The most common large-scale useof biomass is waste wood from the pulp and paper industry, forest residues, or wood fromdemolition of buildings.
Waste as refuse from organic material is also a common source of raw material for energyproduction worldwide.Official statistics show that:
● The 430 largest wood-fired power plants have a capacity of7120 MW. The 349 largest waste incineration plants have a capacity of 5931 MW
The reserves of renewable resources are more or less unlimited. The limits are in most casesthe economic realities.
2.1.2- Electrolysis of water from non-organic renewable energy
Electricity can be produced from renewable via hydroelectric power, wind power, solarthermal, PV (photovoltaics) and Solar-Stirling engines. Producing hydrogen from nonorganicrenewable requires different amounts of land, depending on the technology. The table belowdescribes the land requirements for different technologies operating in the world’s sun belt[11]:

I Area reauired Aream2/kW ‘ m2/GJ, hydrogen(year)
PV, technology of today 3-5 4-6Solar Stirling engine 2-3Thermal process 3-5 4-6Wind power 4-6 a) 5-10 a)Hydroelectric power 16-900 11-500
a) Total area, including power plant, access roads, power connections
Investigations have been made in many regions in the sun belt to determine suitable placesfor large-used[12]:
●
●
●
●
scale hydrogen production from solar energy. The following criteria have been
Global radiation from the sun >2300 kWh/m2Firm soil without risk for severe sandstorms.No obstacles from vegetation.The soil should not be usable for activities such as agriculture or settlement.
RegionNorthern AfricaSouthern AfricaSaudi ArabiaCentral AsiaNorth AmericaSouth AmericaAustraliaTotal
Area suitable for solar power andhydrogen production
Geographical Total area Very good GoodLatitude 1000 km2 Conditions Conditions18-29 N 844 402 44220-32 S 33.7 17.7 1616-32 N 429 155 27426-34 N 174 17433-36 N 70 7019-27 S 95 25 7020-30S 235 235
1881 600 1281
Solar energy resources are most abundant in the great deserts in northern Africa and SaudiArabia. However, these resources are remote and can be difficult to explore.
2.2- Fossil sources
Proven resources of fossil fuels, primarily oil, coal, and natural gas, are estimates of thequantities that can be viably extracted with present economic and technical conditions. Expressed inrelation to present rates of consumption, they amount to [13]:
. 226 years production of coal.● 42 years production of oil.. 65 years production of natural gas. [14]
The estimate of hydrate resources is not included in the production of natural gas.
The proven reserves consist of the known, discovered, and developed fraction of the earth’stotal resources. They can be increased by additional prospecting or by rising prices, which means thatnew and more expensive methods of recovery become viable.
The proven resources are (1995) [15]:
Reserves Production / yearCoal 1032 Gton 4530 MtonCrude oil 67.5 Mbarrel1017 Bill. barrelNatural gas 150,4 Tm3 2,3 Tm3

The estimate of hydrate resources is not included. Most scientists estimate the low side ofhydrate resources as approximately 2,680 Tm3 to, on the high side, 7,240,000 Tm3.
The proven resources of fossil fuels are vast and they can, with high probability, be enlargedif more exploration were to be done. In practice, hydrogen production will not be limited if fossilsources are allowed as raw material. A generaI estimation is that there are at least the same amountsof useful resources to be discovered as the proven resources of today [16].
2.3- Nuclear sources [17]
In 1996, 17% of the global electricity production came from nuclear energy. Four hundredand thirty-two nuclear reactors were in operation world wide with a total capacity of 340 GWe. Thedevelopment and expansion of the nuclear power industry has been very slow and is dependent oneconomical and political factors. The assessable resources of uranium and other raw material fornuclear power are almost unlimited. From a technical point of view, nuclear power could be a majorresource for the production of hydrogen, using cheap surplus electricity from nuclear power plants toelectrolyte water.
The future growth of nuclear power depends on the future public perception of thecomparative benefits, costs, environmental factors and risks of alternatives.
3. ENVIRONMENTAL BENEFITS OF HYDROGEN
Use of hydrogen as a fuel will immediately affect and sharply reduce local atmosphericpollution. Fuel cells emit few pollutants, and only nitrogen oxide (NO,) will have to be controlledduring combustion. Unlike petroleum fuels, accidental spills of hydrogen will not pollute water ordamage ecosystems because it disperses rapidly in the atmosphere.
In this chapter, hydrogen is discussed from the standpoint of climate change and carbondioxide (C02) and other emissions.
3.1- Control of C02 in the atmosphere
3.1.1- Prospect of debut of hydrogen
Five alternative versions of a Low C02-Emitting Energy Supply System (LESS) that mayreduce greenhouse gas (GHG) emissions from about 6 Gt-C in 1990 to 2 Gt-C in 2100 wereconstructed. The purpose of these energy supply systems was to stabilize the COZconcentration below 500 ppm in 2100. Their combined potential contributions to futureenergy supplies by the year 2100 have been assessed at the level of the global energysystem in the second report of the Intergovernmental Panel on Climate Change (IPCC) [18].The prerequisites for LESS follow
. World population grows from 6 billion in 1999 to 9.5 billion by 2050 and 10.5 billionby 2100.● Gross domestic product (GDP) grows 6.9-fold by 2050 (5.3-fold and 13.6-fold inindustrialized and developing countries, respectively) and 24.6-foId by2100 (12.8-foldand 68.3-fold in industrialized and developing countries, respectively), relative to1990.●Global primary commercial energy use roughly doubles, with no net change forindustrialized
countries but a 4.4-fold increase for developing countries, 1990-2100.
The alternative versions of LESS were constructed with features that made each optionmarkedly different from the others, and some important features distinguishing thealternatives were highlighted. Four variants involve a high degree of emphasis on theefficient use of energy; the fifth explores the implication of much greater energy demandgrowth, as shown below.

. A nuclear-intensive (Nl) variant
. A natural gas-intensive (NGI) variant● A coal-intensive (Cl) variant● A high-demand (HD) variant
In each variant, COZ sequestration is required to stabilize the COZ concentration below 500ppm; cumulative requirements for sequestering C02 become greater in the order of NGI, Cl,and HD. The global primary energy use for alternative LESS constructions by2100 is shownin Fig. 3.1.1. Hydrogen will make its debut in all variants around the year 2050, to control theCOZ concentration. The resources for hydrogen are shown in Fig. 3.1.2. Natural gas plays animportant role in producing hydrogen., - -
1400
1200
1000
: 800
8Q 600a
400
200
0
1990 2025 2050 2075 2100
I I
BINS NGICIHO BINt NGICIHD BI M NGI CI HI) BI NS NGI CI HD
■ coal NOiIE%Nuclear
HNaturalGasElHydro ElBiomass
E%!IntermittentRenewable ❑SolarHydrogen
BEBkm ass- Wenaie V-t;N ENuckar-Z@naiE Vaz%t;NG ENab.nalGas-hknsirs Vazimt;CkCcalrMi?rdeV-eHD=H@-D6nandVdsnt
Fig, 3.1.1 Global primary energy use for alternative LESS construction
3.1.2- Benefit of early introduction of hydrogen into the market
The substitution of a solar hydrogen energy system for the conventional fossil-based systemwas analyzed using a dynamic model. By substituting different energy sources and/or energycurrencies in the energy market, this model provided information on interactions between theenergy system and the socio-economic system [19].
Different dates of inception and different initial rates of hydrogen introduction into the energymarket were analyzed. In the model, hydrogen penetration into the energy market wasassumed to be logistic; the time period required to take 50?4. of the energy market wasselected to be equal to half the time required to go from 10?4.to 90?/. of the market, the so-called “takeover time”. This time was arbitrarily selected to be 40 years, which is shorter thanthe historical takeover time for most fuels or energy technologies. However, it is longer thanthe lifetime of the energy equipment and infrastructure. Simulation results of C02 in theatmosphere are shown in Fig. 3.1.3.
Model simulation for the period between 1950 and 1990 showed good agreement with thehistorical records. If the world economy were based solely on fossil fuel use, fossil fuel

WI I 1
4s0 2025 2050 2075 2100
~r 250 I2ccl 1 1
I
per ~Ye
50
0EM ffi cl Ho SIN ffi Cl HD E1/N1 NG Cl HO B1/Nl NG Cl HD
SMethanol from Natural F23Methanolfrom E4Methanolrlom 9 Hydrogen from Natural❑Hydrogen from E Hydrogen from ❑ Solar
Bl=Biomqea-lntenaive Varianfi Nl=Nuclear-intensive Variant NGl=Natural Gas.Cl=Coal-intensive Variant HD=High-Demand Variant
Fig. 3.1.2 Resources for hydrogen
-+ -.*-,.
●
-“
a 1950 1975 2000 2025 2050 2075 2100
L.--.,no H2
— H2 in 202{
--- H2 in 200(
Fig. 3.1.3 Effect of different hydrogen incetXion dates on C07 content in the atmosphere(ref. ~. Barbir, H.J. Plass, Jr. and-T. N: Veziroglu, Int. J. Hydrogen Energy, Vol. 18, N03, 1993)
consumption would start to decline some time in the middle of the next century, after reachinga peak at three times today’s level. The C02 content in the atmosphere would continue togrow until the end of the century, reaching 700 ppm (almost double what is today). In thecase where solar energy and hydrogen use is introduced into the energy market, energyconsumption would continue to increase and hydrogen introduction would dramatically reduceCOZ in the atmosphere, which would reach a maximum of 520 ppm before 2050. Afterward, itwould decrease, eventually reaching pre-industrial Revolution levels. The figure also showswhat would happen to the C02 content if the transition to the solar hydrogen energy system isdelayed by 25 years. C02 would continue to increase until approximately 2070, reaching 620ppm if hydrogen is introduced in 2025. This suggests that an early transition to the solarhydrogen energy system would benefit the economy and the environment in the long run.

3.2. - Emissions of COZ and other pollutants from hydrogen
On a global level, with no COZ emitted during hydrogen oxidation, greenhouse gas emissionscould be reduced. However, the whole hydrogen life cycle, from production to transportation, storageand use, must be considered. Only cycles that have no net carbon consumption (and therefore no netC02 emission) will help reduce greenhouse gas emissions.
3.2.1- Production
(1) From biomassAlthough biomass contains carbon, it is a step ahead of fossil fuels where COZ emissions areconcerned. When grown and harvested in a sustainable manner, any emitled carbon isrecycled into new biomass, resulting in virtually no net COZ emissions. Depending on theregion, the land requirements for energy crop growth could be large.
(2) From hydropowerThe environmental impact of hydroelectric plants should be considered in terms of resourceuse rather than emissions, which are negligible.
Because water reservoirs can require huge tracts of land, they can have a severeenvironmental impact. The social costs can also be high if people have to move from theirhomes or abandon their source of livelihood.
(3) From solar PVProducing hydrogen by electrolysis from solar energy is an environmentally friendly vision.No polluting emissions are associated with producing either electricity or hydrogen. However,emissions are associated with the production of photovoltaic panels and other equipment, andlarge land areas will be required.
(4) From fossil fuelsFossil fuel will for technical and economical reasons be the major source for the production ofhydrogen in the near future. Hydrogen produced from fossil fuels will generally emit COZwhich can increase the amount of fossil-based C02 in the atmosphere and contribute toclimate change. In the far future processes which emits only small amount or no COZ willprobably take over as a major sources for the production of hydrogen as an energy carrier.
One promising alternative is the plasma pyrolysis method developed by Kvaerner wherenatural gas will be split into carbon black and hydrogen practically without emission of COZ.The first commercial full scale plant for combined production of carbon black and hydrogen isthe Karbomont plant, located in Montreal, Canada. The capacity of the plant is 20,000 tonnesof carbon black and 50 million Nm3 hydrogen.
Producing hydrogen from fossil fuels may be very positive for the environment as it can bedone through processes, which virtually have no emissions of C02. The hydrogen can thenbe used as fuel in high efficient processes, such as fuel cells, without harmful emissions.
(5) From nuclear powerDuring the 1970s, nuclear power was considered to be the perfect energy source forhydrogen production. Nuclear power plants generally run continuously at full capacity. Thesurplus energy could be used to produce hydrogen via electrolysis of water. Except for therisks of radiation leakage and the need for long-term, safe radioactive waste disposal, thisseems to be perfect solution. However, in some countries, new nuclear power plants can nolonger be considered, for political and economical reasons.
3.2.2- Use
(1) Electricity and heat productionThe only emissions produced by using hydrogen in energy conversion processes are watervapour and, in some cases during burning, NOfi The NO, produced can be reduced to verysmall amounts by having the correct amount of excess air during burning or, even better, by

using catalytic burning. The temperatures during catalytic burning are much lower thanduring flame burning and the temperatures can be easily controlled. The production of NO,can then be avoided.
The water vapour produced will have a small effect on the local atmospheric conditions. Insome cases, it can be condensed and used as liquid water. For instance, astronauts use thewater produced in fuel cells as drinking water.
(2) In aircraft [20]Currently all aircraft use kerosene or similar jet fuels. Burning kerosene in a turbine producesmostly C02 and water. There are also CO, unburned hydrocarbons, NO. S0, andparticulate. The NOX can have a significant detrimental effect on the ozone layer by reactingwith other elements in the troposphere.
When kerosene is replaced by hydrogen, the C02 emissions are eliminated entirely. Wateremissions are 2.6 times higher and some NO, will remain but there are no other pollutants.
The CRYOPLANE project studied the consequences of high-altitude vapour emissions fromhydrogen-fuelled aeroplanes. [21] CRYOPLANE is a joint research project between Russia,Germany and Canada, where liquid hydrogen-fuelled aeroplanes are studied.
The water emissions either remain or become ice clouds (contrails). The water vapour in theupper atmosphere might have an effect on global climate change. Whereas C02 remainsactive in the atmosphere for more than 100 years at any altitude, water vapour remains for sixmonths to a year in the stratosphere and only three to four days at ground level.
4. REVIEW OF HYDROGEN TECHNOLOGIES AND ECONOMICS
4.1- Production
Water is by far the most abundant source of hydrogen. Another important source is the groupof compounds that can be defined as hydrocarbon materials. They include organic matter (biomass),as well as fossil raw materials.
The bulk of hydrogen production today is based on fossil raw materials. The table below isbased on statistics from 1988 and covers hydrogen produced as the main product and as a by-product.
World hydrogen production.
Origin Billion Nm3/year Percent
Natural gas 240 48Oil 150 30Coal 90 18Electrolysis 20 4
Total 500 1004.1.1 Production from non-fossil energy resources
(1) Biomass as a hydrogen resourceAgriculture waste, forest residue, urban wood waste, and trees and grasses grown as energycrops, are process feedstocks collectively referred to as biomass. Organic wastes such asmunicipal waste and sewage sludge may also be regarded as biomass. Because biomassconsumes as much C02 in its growing cycle as is produced when it is transformed intoenergy, it is considered to be C02-neutral. The simplest way to obtain energy from biomass isto burn it, in much the same way as with fossil fuels.
(2) Gasification of biomassGasification is a form of partial oxidation, and some oxidant must be supplied, such as air,oxygen or steam. The product gas consists mainly of hydrogen (Hz), CO, C02 and methane

(CHA), with some higher hydrocarbons (tar) and steam. A number of biomass gasificationfacilities are in operation around the world, although none are currently producing hydrogenfor sale.
The projected economics of hydrogen production via biomass gasification are shown inFigure 4.1. The boundary limits represent two feedstock sources - waste biomass (i.e.,agricultural and forest residues) (middle and lower curves) and dedicated feedstocks (uppercurve). Larger production facilities may not be able to obtain sufficient waste feeds forsustained operation, and are likely to require the higher-cost dedicated feeds.To calculate the hydrogen price (for this and all subsequent figures in this report), mid-1998USD, a discount rate of 10YO, no taxes, no depreciation, and an economic life of 20 yearswere used. The price is based on the lower heating value of hydrogen (10,795 kJ/Nm3). Allproduction cost figures use the same scale for ease of comparison.
(3) Pyrolysis followed by reforming [22]A simple way of treating biomass is by pyrolysis, i.e. heating in an inert atmosphere. Theresult is a liquid product called pyrolysis oil. This oil may be treated by steam reforming orpartial oxidation for the production of hydrogen. Although there are a number of commercialpyrolysis facilities throughout the world, none produce hydrogen for sale.
60
9 50~ _ -Biomass: $46/T —Biomass: $13/T - - ,Biom ass: $0/T
@ 40e
0 ! 10.01 0.1 1 10
Facility Size (million Nm3/d)
Figure 4.1 Economics of hydrogen production via biomass gasification
The projected economics of hydrogen production via biomass pyrolysis are shown in Figure4.2. In this concept, small pyrolysis facilities (fed by waste biomass) supply a centralizedreforming facility. Two processing options are included: reforming of the entire liquid (uppercurves), and intermediate processing of the liquid to extract valuable chemicals as coproductsfollowed by reforming the residual liquid to produce hydrogen (lower curves).
(4) Hydrogen from waterWater is the most abundant source of hydrogen. Hydrogen can be produced by the watersplitting reaction:
2H20 ● 2HZ + Oz
Because water is a very stable compound, the splitting requires large amounts of energy: 286kJ/mole under standard conditions. (This energy maybe recovered by reversing the reaction,hence the function of hydrogen as an energy carrier.) The energy input may be heat,electricity, or light, resulting in splitting reactions known as thermolysis, electrolysis andphotolysis of water, respectively.
5) Thermal water splittingAt sufficiently high temperatures (> 2000”C), water will decompose into hydrogen and oxygen.Such high temperatures may be attainable by high concentrations of solar radiation.Promising results have been obtained in small-scale experiments.

‘1—. ————.——..——-—.-— ———...—.——-. -—-
. - - . Refamed, Oils $220fi — Refamed, as $1Iofr
— - Wfcvmed,CJW$55/T --4. Cqnxkmt, as $220/r i
. — CO.pmdwl,oils $WYr - - CQ+rO&lcl,ok Wvr
J20
----- --- +A --- ----- ----- --
,0------
.,. ——
———.—. _ _
FacilitySize(millionNm3fd)
Figure 4.2 Economics of Hydrogen Production via Biomass Pyrolysis
Thermochemical cycles with several stages operating at relatively low temperatures (<1000”C) have been studied. The so-called UT-3 Process, which originated at the Universityof Tokyo, has probably been studied most extensively.
Hydrogen via metal oxide reduction is also an indirect approach to solar thermal watersplitting. Some metal oxides can be reduced at high temperatures according to:
MXOY ~ XM + y/202
The metal can subsequently be reacted with water to produce hydrogen:
XM + yH20 ● MxOY + YH2
(6) Water electrolysisA small amount (47.) of the world’s hydrogen production is produced by electrolysis of water.For users requiring small amounts of extremely pure hydrogen, electrolysis can be cost-effective.
Water electrolysis using renewable energy is the ultimate goal in a “hydrogen economy”.Much development work has been done lately to adapt conventional grid-connectedelectrolyzers for intermittent power sources such as PV and wind power.
Water can be split by the input of electric energy. Generally, three technologies areconsidered for water electrolysis: alkaline electrolysis, polymer membrane electrolyte (PEM)electrolysis, and high temperature steam electrolysis.
Alkaline electrolyzers are named after the alkaline solution used as electrolyte. The reactionstaking place at the electrodes are:
Cathode: 2H20 + 2e- ~ H2 + 20 H-
Anode: 20 H- ● 1/202 + H20 + 2e-
The sum is the water splitting reaction. The operating temperature is usually around 80°C;the operating pressure may range from 1 to 30 bar.
The electric power consumption may range from 4-5 kWh/Nm3 of hydrogen produced,corresponding to energy efficiencies of 88-70’% (based on the HHV of hydrogen). Modern,advanced electrolyzers may reach efficiencies >90Y0. So far, only alkaline electrolyzers havebeen used for industrial water electrolysis.
PEM electrolyzers employ a solid electrolyte; i.e., a proton conducting polymer membrane,The basic reactions occurring at the electrodes are:

Cathode: 2H+ + 2e- ● H2
Anode: HzO ~ 1/202 + 2H+ + 2e-
PEM electrolyzers are usually operated at -80°C and can be designed for high-pressureoperation. An etliciency of 957. has been demonstrated at 1 A/cmz with an electrode of 2500cm2.
High temperature water electrolysis is also based on solid electrolytes. IQ this case, ceramicmembranes that conduct oxygen ions at high temperatures (800-1000 C) are required toachieve sufficient conductivity.
The basic reactions at the electrodes are:
Cathode: H20 + 2e- ● Hz + 02-
Anode: 02- ~ 1/202 + 2e-
The technology was developed to a prototype stage in Germany in the 1980s but has notbeen further developed for industrial use.
The economics of hydrogen production via electrolysis are shown in Figure 4.3, for severalelectricity prices. Alkaline electrolysis is a commercial process; the other technologies areunder development. In all cases, the price of electricity plays a significant role in thehydrogen price, representing 40-80% of the hydrogen price.
- - Electricity:$0.08/kWh
50- — — “Electricity$0.04/kWh ● .s
-..
~---
● . .‘Electricity $0.02/kWh -.*
■ -.. =..740- — -9- PV-based -2000 . . ..-&
8- A- PV-based -2010
.=n313- . + wnd-~~ed - 2131J00 -“-.c.—. -+- Wind-based-2010 A
---
$● -.
---g 20
----OY
--p~1
10-
0.01 0.1 1 10
Facility Size (million Nm3/d)
Figure 4.3: Economics of hydrogen production via electrolysis
(7) Photoproduction of hydrogenVarious approaches have led to the development of photolytic hydrogen productionprocesses, including photochemical, photoelectrochemical and photobiological productionprocesses. The first category is, at present, only of academic interest the two latter groupswill be discussed here.
Photoelectrochemical hydrogen production is achieved by combining PV electricity generationwith water electrolysis in a single device. The potential advantages over conventional PV-electrolysis are that simpler and more compact systems, with potentially better efficiencies,may be obtained. Considerable progress has been made, and efficiencies of around 12-13’%have been achieved.

Photobiological hydrogen production is based on the ability of certain microorganisms toproduce hydrogen metabolically, either by splitting water or converting organic material intohydrogen and COZ. Photosynthetic bacteria can convert organic compounds such as sugarsand other organic wastes into hydrogen.
A number of research efforts are focused on the development of these long-term hydrogenproduction technologies. Hydrogen prices are expected to be $10-$15/GJ when theseprocesses are fully developed.
4.1.2- Production from fossil energy resources
The whole range of fossil fuels, from natural gas to coal, can be used to produce forhydrogen. The main processes employed in industrial hydrogen production are steammethane reforming (SMR), partial oxidation (POX) and combinations of these. Pyrolyticcracking is another option.
(1) Steam reforming and partial oxidation of hydrocarbonsConventional SMR is a well-established process, usually performed in large plants becauseeconomy of scale is important. The reaction is endothermic, requiring 222 kJ/mole (of CHA).The heat is normally supplied by burning additional natural gas and/or purge gas from theproduct purification unit.
The economics of hydrogen production via steam methane reforming are shown in Figure 4.4.The curves represent natural gas costs of $1 .50/GJ, $3/GJ and $6/GJ.
Autothermal reforming (ATR) is a combination of SMR and POX applied to light hydrocarbonfeedstock (natural gas, liquid petroleum gas (LPG), and naphtha).
Novel approaches to the production of hydrogen from hydrocarbons are being studied anddeveloped. The description of the traditional steam reformer would indicate a demand for amore compact and efficient unit. In particular, more efficient heat integration, avoiding a largeexport of steam, would be desirable. A reformer designed by Haldor Tops@e, called the heatexchange reformer [23] goes a long way toward meeting these requirements.
50 —N, ,”,.! G., : S81GJ — .Na, ural Gas: $3)GJ
- - Natural Gas: $1 50, GJ
c
;>
10 ----. .=-- ,____
-------- -------.-
0 I I0,01 0,1 1 ?0
Facilily Size (mllll. n Nm3fd)
Figure 4.4: Economics of hydrogen production via SMR
Another novel design is the gas-heated reformer (GHR) by ICI Katalco. This is also a heat-exchange type reformer with convective heat transfer, but without a burner.

At Marie in Germany,. the so-called Huls Process, using the plasma splitting of natural gas toproduce hydrogen and acetylene (CZHZ), has been in full-scale commercial operation since1940.
At the MIT Plasma Science and Fusion Center, development of plasma heated reformers isunderway. These so-called plasmatrons can be operated with a broad range of fuels, andhydrogen-rich gas (50-75% HZ 25-50% CO) can be efficiently produced in a wide range ofsizes.
During hydrogen production from hydrocarbons, the COZ produced is usually released to theatmosphere after separation from the hydrogen product. The options of C02 sequestration;i.e., disposal in the sea or in underground formations, or its large-scale use for enhanced oilrecove~ (EOR), are being discussed as measures to reduce COZ emissions to theatmosphere from fossil-fuelled power stations or chemical plants. This is also an option for“COz-free” hydrogen production from fossil fuels.
Calculations indicate that sequestration of C02 would result in a relatively small incrementalcost for large SMR and POX hydrogen production facilities. Hydrogen prices would beexpected to rise by 25Y0, assuming 70-85% of the C02 is captured and sequestered.
(2) Coal gasificationModern coal gasification is a form of partial oxidation, accomplished by reacting coal withoxygen and steam at high temperatures. The resulting gas is purified and passed throughshift reactors for conversion of HzO and CO to COZ and Hz. Several processes have beendeveloped for coal gasification in different types of reactors and at varying temperature andpressure conditions. A large proportion of the world’s hydrogen production is still based oncoal gasification - 18% world-wide and in Germany, as high as 30’XO[24].
The economics of hydrogen production via coal gasification are shown in Figure 4.5. Thecoal feedstock costs range from $0.75/GJ to $3/GJ.
p’-.
70-
----
0 d I0,01 0.1 1 ?0
Facility Size (million Nm31d)
Figure 4.5: Economics of hydrogen production via coal gasification
Some novel approaches to coal gasification, such as gasification in liquid iron (MIP or MoltenIron Process), are being studied. Also, in situ underground gasification of coal is considered.
(3) Pyrolysis of hydrocarbonsHydrocarbons can be cracked; split into elemental components by pyrolysis. It has been, andstill is, employed to produce “carbon black.”
The two main approaches being considered are catalytic cracking and high-temperatureplasma pyrolysis of hydrocarbons. Plasma pyrolysis appears to be a more fruitful approachbeside the Huls Process mentioned earlier. The Norwegian Company Kva?rner has

developed the concept into an industrial process for producing carbon black and hydrogen,called the CB&H process. With natural gas feed, the electric energy requirement is about 1kWh/Nm3 of hydrogen produced. Purity of the hydrogen is >99Y0, feedstock use is close to100%, and the process is virtually emission-free. The plant is designed to operate on bothnatural gas and heavy oil as feedstock.
(4) Small-scale distributed hydrogen productionWith the advent of fuel cells, a new market for small-scale hydrogen production may emerge.In fact, a new generation of steam reformers dedicated to fuel cells is under development.The reformer is normally an integrated part of the fuel cell plant, accounting for about one-third of the investment cost.
Distributed production of hydrogen fuel is an interesting option for supply of this clean fuel inthe transportation sector. There are infrastructures for distributing hydrocarbon fuels andnatural gas in most industrialised countries and these systems can, after modifications, alsobe used to distribute hydrogen.
On-board hydrogen production in vehicles is an alternative to carrying hydrogen in thevehicles. Liquid fuels such as methanol or gasoline are easily carried on board and can besupplied via current infrastructure.
Methanol is quite easy to reform, requiring temperatures as high as only 300”C. Smallcompact methanol reformers have been developed and demonstrated in prototype FCVS byDaimler-Benz and Toyota. Small POX units for vehicles have also been developed. Theycan convert any hydrocarbon fuel to hydrogen-rich gas, are simpler and cheaper thanreformers, and respond faster to load changes.
4.2- Transportation and storage
Often hydrogen is not produced in close proximity to where it is to be used, or at productionrates equivalent to consumption rate. Thus transportation and storage are required, and can addsignificantly to the cost of the delivered hydrogen. In addition to the method of transportation andstorage, distance from point of production to point of use, and time between production and end-useaffect the final cost of hydrogen.
Hydrogen can be stored as either a pressurized gas or a liquid. It can also be stored inchemical or physical combination with other materials, such as metal hydrides, chemical hydrides,glass microsphere, and cryo-adsorbers. Depending on storage size and application, several types ofhydrogen storage can be differentiated:
● Stationary large storage systems: These are typically storage devices at the productionsite or at the start or end of pipelines and other transportation pathways.. Stationary small storage systems: These are used at the distribution or final user level; forexample, a storage system to meet the demand of an industrial plant.. Mobile storage systems for transport and distribution: These include large-capacity devices,such as liquid hydrogen tankers - bulk carriers, and small systems, such as gaseous or liquidhydrogen truck trailers.. Vehicle tanks: These are used to store hydrogen fuel for road vehicles.
Because of hydrogen’s low density, its storage always requires relatively large volumes and isassociated with either high pressures (thus requiring heavy vessels) or extremely low temperatures,and/or combination with other materials (much heavier than hydrogen). Table 4.1 shows achievablestorage densities with various types of hydrogen storage. Some novel hydrogen storage methodsmay achieve even higher storage densities, but have yet to be proven in terms of practicality, cost andsafety.

1 Storage Type I kg H ~lkg I I kg H ~/m3
Large volume storage(l~ to
104m3geometric volume)
Underground storage 5-1o
Pressurized gas
(above ground)0.01-0.014 2-16
Metal hydride 0.013-0.015 50-55
Liquid hydrogen -1 65-69
Stationary small storage (1 to
100m3 geometric volume)
Pressurized gas cylinder 0.012 -15
Metal hyride 0.012-0.014 50-53
Liquid hydrogen tank 0.15-0.50 -65
Vehicle tanks (0.1 to 0.5m3
geometric volume)
Pressurized gas cylinder 0.05 15
Metal hydride 0.02 55
Liquid hydrogen tank 0.09-0.13 50-60
Table 4.1: Hydrogen storage types and densities
4.2.1- Compressed hydrogen gas
Most merchant hydrogen produced today is handled and stored as compressed hydrogengas. Storage aboveground in pressure vessels is common practice. Underground storage,suitable for large quantities, is practiced in only a few cases. It is transported in pressurevessels by rail, road, sea or, in some cases, by pipeline.
(1) Bulk storage of compressed hydrogen gasUnderground storage is common practice for bulk storage of natural gas, and with minormodifications the same technology is also applicable to hydrogen. The main options forunderground gas storage are:
. Depleted oil or gas reservoirs
. Aquifers
. Mined rock caverns● Flushed-out caverns in salt domes
Relative to all other methods, underground storage is the least costly for all production ratesand storage times, primarily because of its low capital costs. The primary cost contributor iselectricity consumption during gas compression. One drawback to underground storage isthe amount of unrecoverable cushion gas. Underground storage adds $1-2/GJ to thehydrogen price.
Aboveground compressed hydrogen is stored in pressure vessels of various shapes andsizes, ranging from the common 50-liter steel bottles at 200 bar to huge tanks containingseveral thousand Nm3 of gas. Aboveground compressed gas storage varies significantlydepending on the storage pressure and time in storage. The lowest costs are for high-

pressure, short-term storage, whereas the highest costs are for low-pressure, long-termstorage. The added costs for hydrogen storage are $2-35/GJ.
(2) Distribution of compressed hydrogen gasA common way of distributing compressed hydrogen gas is in 50-liter steel bottles. In theUnited States, special trailers transport larger cylindrical vessels, known as “tubes.” InGermany, a special container for rail transport has been constructed. This “Grossflasche” isabout 12m long, 2m in diameter, and carries about 10,800 Nm3 of Hz at 400 bar.
Pipeline distribution of compressed hydrogen gas is industrial practice in both Europe andNorth America. The oldest system was built in 1939 in the Ruhr district of Germany. It is 210km long and carries hydrogen between producers and consumers at a rate as high as100,000 Nm3/h. The longest pipeline in the world connects northern France with Antwerp,Belgium, and runs a distance of 400 km. Both networks are owned and operated by theFrench company Air Liquide.
In the United States, there are several hydrogen pipeline networks, the most extensive beingin the Gulf Coast region. The longest, operated by Air Products in Houston, Texas, is morethan 100 km long.
Pipeline transport of hydrogen is very economical for regions served by these networks.Incremental costs for hydrogen are $1-2/GJ, depending on delivety rate and distance.
(3) Glass microsphereGlass microsphere are another facet that has been investigated for the past 20 years. Thehydrogen is stored in very small spheres, 25-500 microns in diameter. The storage is filledunder high pressure and heat and emptied by heating. Lawrence Livermore Laboratories inthe United States is working to develop this method.
4.2.2- Liquid hydrogen
Another obvious way of densifying hydrogen is to liquefy it. Liquid hydrogen has a density of70.8 g/1, corresponding to an energy density of 2.36 kWh/1. This is about one-fourth theenergy density of gasoline or diesel. Due to the low boiling point, storage and handling ofliquid hydrogen involves special procedures.
“Slush hydrogen,” a mixture of solid and liquid hydrogen, has been suggested as a fuel forspace- and aircraft. It would give about 15% higher energy density than liquid hydrogen andthus reduce the volume required for fuel storage on board.
Hydrogen liquefaction is routinely performed in several large industrial plants. Approximatelyone-third of the energy in hydrogen is required for the liquefaction process, primarily aselectrical energy.
(1) Storing liquid hydrogenLiquid hydrogen is stored in cryogenic tanks (Dewar vessels) ranging in size from a few litresto several thousand cubic meters. The large storage tanks at the Kennedy Space Centercontain 3200 m3. To keep the liquid hydrogen below its boiling point, very eficient insulationis required. Double tanks are employed, the space between them is kept under vacuum andfilled with insulating material. In any case, boil-off cannot be completely avoided.
Storing hydrogen as a liquid adds $5-15/GJ to the price. The lower cost increment isgenerally for long-term storage of large quantities of liquid hydrogen. Short-term storage ofsmall quantities of liquid hydrogen is relatively expensive, due to the capital costs, and thepotential for higher boil-off rates with increased surface-to-volume ratios.
(2) Distributing liquid hydrogenCurrent practice is to transport liquid hydrogen in tank trailers carrying about 50 m3. Suchroad transport is quite common in the United States and Europe. The cost of transporting

liquid hydrogen is $0.25-5/GJ, depending on distance [25].
Sea transport of liquid hydrogen is the subject of intensive study and development by the WE-NET program in Japan. Sea transport of liquid hydrogen will be quite similar to sea transportof LNG, which is practised world wide on a large scale. Cost estimates for sea transport ofliquid hydrogen range from $13-$1 5/GJ, depending on distance.
Air transport of liquid hydrogen is considered to be advantageous because it enables thehydrogen production site to be accessed directly, and is fast enough to prevent losses causedby boil-off. Boil-off hydrogen could also be used to fuel the aircraft.
4.2.3- Bonded hydrogen
Some compounds exhibit hydrogen densities even higher than those of liquid and solidhydrogen. Hydrogen carriers may be liquid or solid materials. Sorbents with physicallyadsorbed hydrogen are considered to be solid hydrogen carriers here.
(1) Liquid hydrogen carriersLiquid hydrogen carriers, sometimes called “liquid hydrides,” are relatively easy to store andtransport and have reasonable energy densities.
Methyl cyclohexane has been extensively studied. It has been considered for hydrogentransport both in the EQHHPP and the WE-NET, but was abandoned in these projects, to theadvantage of liquid hydrogen.
Alcohol and hydrocarbons such as methanol, ethanol, gasoline, and other fuels, can beregarded as hydrogen carriers but not as regenerable ones. They contain relatively highproportions of hydrogen, which maybe given off by reforming.
(2) Solid hydrogen carriersSome solid materials can carry large proportions of hydrogen, are regenerable, and canabsorb and release hydrogen under relatively mild temperature and pressure conditions.Solids are easily stored and handled, and represent a safe alternative for hydrogen storage.
Metal hydrides are formed by reacting hydrogen with various metals, alloys, or intermetalliccompounds. Some exhibit extraordinary high hydrogen densities, as much as twice thedensity of liquid hydrogen. The main obstacles so far have been low capacities per weight,high dehydriding temperatures, and high costs.
During formation of the metal hydride, hydrogen molecules are split and hydrogen atoms areinserted in spaces inside the lattice of suitable metals and/or alloys. In this way, effectivestorage is created comparable to the density of liquid hydrogen. However, when the mass ofthe metal or alloy is taken into account, the metal hydride gravimetric storage density is about0.07 kg of H*/kg of metal for a high temperature hydride such as MgH2, as shown in Table4.2. It gives a comparison of some hydriding substances with liquid hydrogen, gaseoushydrogen and gasoline.
Carbon adsorption is a technique commonly used in gas treatment. Densities equivalent to, orbetter than, those of metal hydrides have been achieved. Some are known as fullerenes andare called “Buckey balls” or “nanotubes.” Another type is called “graphite nanofibers” (GNF).The nanotubes can store 8-9% hydrogen and have good kinetics at room temperature. Thegraphite nanofibers, however, appear to be quite sensational: a capacity of 70% Hz (byweight) was initially claimed by researchers at Northeastern University in the United States in1997. These results have not been confirmed at other laboratories, and some doubt abouttheir validity has been voiced [24].

Hydrogen
Medium Contentkg/kg
1 MgHz 0.070 ! 0.101 I 9,933 ! 14,330
I Mg2NiHl ! 0.0316
VHZ 0.0207
FeTiH1.gs 0.0175
TiF%TMmzH1.g 0.0172
LaNi5HT.O 0.0137
R.E.NijHG.s 0.0135
Liquid Hz 1.00
0.081 I 4,484 ! 11,494
3,831 .
0.096 2,483 13,620
0.090 2,440 12,770
0.089 1,944 12,630
0.090 1,915 12,770
0.071 141,900 10,075Gaseous Hz
(100 bar)1.00 0.0083 141,900 1,170
Gaseous Hz(200 bar)
1.00 0.0166 141,900 2,340
I Gasoline 1-1- 1 47.300 I 35.500
Table 4.2: Hydriding substances as hydrogen storage media
4.2.4- Hydrogen storage on-board vehicles
Compressed hydrogen gas in pressure vessels is an option being explored. It seems to be agood option for larger vehicles, such as buses, where enough pressure vessels can be placedon the vehicle roof or inside the vehicle. It may not be the ideal solution for the personalautomobile as it currently requires too much space. Higher-pressure storage tanks (350 bar),constructed of carbon-wrapped aluminium tanks, are under development. These tanks areexpected to significantly reduce the space requirements for on-board hydrogen storage.
Liquid hydrogen in Dewar vessels has been demonstrated by BMW in Germany for severalyears. Very eficient tanks have been developed, and the boil-off has been steadily reduced.The refueling time has been cut down to -3 minutes. The latest version of BMWS liquidhydrogen tank holds 120 liters, equivalent to 30 liters of gasoline.
Metal hydrides have been employed for hydrogen storage in vehicles. Daimler-Benz hasconcluded that metal hydrides are too heavy and too expensive. They are now in favour ofcompressed hydrogen for larger vehicles and methanol for small FCVS. Japanese carmanufacturers such as Mazda and Toyota are still working on the metal hydride option.Carbon materials such as nanotubes or nanofibers have not yet been tested in vehicles. Theyare in the early stages of development, kut could provide an ideal solution if their promisesare fulfilled.
Alcohol and hydrocarbons are considered by most car manufacturers today to be the mostrealistic alternative for hydrogen storage in FCVS. The main argument is that fuel must beeasily available, and that establishing an adequate infrastructure for hydrogen will be toocomplicated and expensive, at least in the short-medium term.
4.2.5- Hydrogen storage and transportation costs
The cost of transporting hydrogen is a strong function of the technology used, the amount ofhydrogen transported, and the distance that the hydrogen is transported. Figures 4.6 and 4.7show the effect of quantity and distance, respectively, for a variety of storage andtransportation technologies.

● ✎ ✎ ✎ ✎ ✎ ✎ ✎ ✍✝✍✍✍✍✍✍✍ ✎ ✎ ✎ ✎ ✎ ✎ ✎ ✎ ✎ ✎ ✎✎✎ ✎ ✎ ✎ ✎ ✎✎
-*W-ST + ~T
- .LH2s-r ~ .~~T
—M+sT - * ‘M%LT
a... .-=-.------ ---- -“------ --,
1 ,
103 I,ooo Io,cal wo,ooo I,ooo,coo Io,ooo,m
A-mrltstold (GJ,u-rv)
CG Compressed Gas, LH2: Liquid HZ MH; Metal Hydride ST Shori –Term storege, LT Long-Term storage
Figure 4.6: Transportation Costs – Varying Amounts
The cost of transporting hydrogen can add significantly to the overall cost of hydrogen. Thetechnology used to transport hydrogen and the distance from point of production to the pointof use both affect the transportation costs. Figure 4.7a shows the cost of transportinghydrogen over a distance of 250km. If existing natural gas pipelines can be used to transporthydrogen, the additional cost is very small. In this case, new compressors would be requiredand costs reflect the capital expense and the operating costs for hydroen compressorstations. At 250 km and for large quantities (>25 million kg/yr), a new pipeline is the next-most cost-effective transportation method. However, at distances greater than about 200 km,the new pipeline is the most costly method of transporting 10 million kg/yr, as shown in Figure4.7b. In these figures, the new and existing pipeline were assumed to be 0.25 meters indiameter, and the cost of the new pipeline was assumed to be $1 million/mile.
4.3- Utilisation
4.3.1- Power production
(1) Internal combustion engines [26]Hydrogen has been used as fuel for ICES since the 1920s. No major modifications areneeded to convert a conventional gasoline engine to hydrogen. The efficiency is considerablyhigher, around 20%, if the engine uses hydrogen as fuel. The power output is lower around15% less than the gasoline fuelled engine [27,28].
The aspect of low emissions is one of the important advantages with hydrogen as fuel forICES compared to gasoline or diesel engines. The only products from hydrogen combustionare water vapor and, in some cases, a small amount of NOX.
(2) Fuel cells [29]Current fuel cell technologies use hydrogen as the primary fuel. Natural gas is often thepreferred feed, where hydrogen is produced from the natural gas in an external reformer. Inhigh-temperature fuel ceils, the natural gas can also be reformed inside the fuel cell.

1,000.007 Ixk, -+- Gas - Truck ——0— Liquid - Truck
100.00-- A- - ILiquid - Rail — -X - Hydride - Truck
‘k+ – ‘- - “W ‘pen”’~Existing Pipeline
-——+
-—-—— ---- ---- ---- ---
10.00--------- --- ..—. .-. .— . . . . . . . . . . .-
------ ______ -_.-
0“’017=———70.01 I K
H
0 10 20 30 40 50
Production Rate (million kg/yr)
Fig. 4.7a: Cost of transporting hydrogen a distance of 250 km
100.00
10.00
1.00
0.10
0.01
.~“”
—
~ Gas . Truck ~ Liquid - Truck
~New pi eline~
I / I I 1 1
0 200 400 600 800 1000
Distance (km)
Figure 4.7b: Cost of transporting 10 million kg of hydrogen per year
(3) Gas turbines [26]In principle, gas turbines can use hydrogen as fuel in the same way as any other gas. Thefact that hydrogen burns very cleanly is an advantage as there will be no sediment orcorrosion on the turbine blades. The tu}bine inlet tempe~ature, and thus the efficiency, can beincreased. The technology for large gas turbines using hydrogen as fuel is still underdevelopment.

Polymer 60-90”CElectrolyteFuel cell(PEFC)
(PAFC)Molten Carbonate 650°CFuel Cell (MCFC)Solid Oxide Fuel 650-l ooOOCCell (SOFC)
Acidic polymer ionexchangermembrane
Phosphoric acid
Alkali-carbonates
Stabilized zirconia
Vehicles, I 40-60%aerospace,combined heat anpower (CHP)
i
Stationary power 1 45-60V0~lant CHPStationary power I 60-61%
Table 4.3: Characteristics of various types of fuel cells.
A hydrogen combustion turbine cycle used for a power plant with high capacity has neverbeen fully developed. A 50-MW combined cycle prototype plant is planned as part of the WE-NET program in Japan, to be produced and operated by 2020. This plant will have anelectrical efficiency of about 65% (LHV). The turbine inlet temperature will be as high as1700”C. As the exhaust from the gas turbine is vapor, there are several alternative processcycle for the bottoming cycle, such as a Rankine cycle. Westinghouse has proposed aRankine cycle with reheat and recuperation with a net efficiency of above 70% (LHV).
A hydrogen-fueled micro-turbine originated from a commercially produced turbocharger hasbeen demonstrated in a laboratory. At a turbine sped of 30,000 rpm the power output was 16kW. The maximum efficiency was 34’%0.
(4) Gas boilerUsing hydrogen in a gas boiler is about the same as using natural gas. A number of smallwell-known changes must be made. When burning hydrogen, more water vapor is produced.By using flue gas condensation, the energy conversion efficiency can increase by as much as18%. The high combustion temperature can increase the amount the NOW This can beavoided by using the correct amount of excess air or catalytic burning; as described below.
(5) Catalytic burnersIn the presence of a suitable catalyst, catalytic combustion may take place at temperaturessignificantly lower than flame temperatures. Due to the low temperatures, no NO. is formed. ~
4.3.2- Transport applications
(1) AutomotiveOne major incentive for using hydrogen as fuel for cars and buses is to avoid depleting fossilfuel reserves. Another advantage is the low emissions from fuel cell vehicles fueled byhydrogen.
Fuel cells can be used as power source for cars and buses. All the major car manufactureshave development programs for fuel cell driven cars. Daimler-Chrysler/Ballard is the leader indeveloping a commercial car using a PEFC fuel cell as energy source. They havesuccessfully built several test vehicles. Toyota has also an advanced fuel cell program withtest vehicles using fuel cells.The cost of supplying hydrogen for transportation applications is shown in Figure 4.8.

40 I
:l!\
0 ‘+F %--~ 20 .
.-- . . . .x . . . . . . . . .- ”=--- . . .
I
15 I
0 50 100 Nun%& of Cars @PDay 250 300 350
Figure 4.8: Hydrogen Costs for Vehicle Refueling Stations
(2) ShippingThe advantages of using hydrogen as fuel for ships are low emissions and high efficiency.Ferryboats and coastal shipping, where the emissions are an important factor, are interestingapplications.
(3) SubmarinesAn air-independent and silent propulsion system is needed aboard a submarine. Many yearsago, PEFC was identified as the most efficient solution for propulsion systems forsubmarines. Siemens in Germany developed a 34kW PEFC module for use on board asubmarine at the request of the German navy. The PEFC plans to be installed on the GermanSubmarine Class 212. The fuel cells will run on pure oxygen and pure hydrogen. The oxygenwill be stored as liquid oxygen inside the submarine and the hydrogen will be stored in metalhydride cylinders on the outside of the vessel. [37]
(4) Hydrogen-powered aeroplanesLiquid hydrogen has several advantages as a fuel for aeroplanes. The most obviousadvantage is the high energy content (142 MJ/kg), 2.8 times higher than for conventional jetfuel. The efficiency of the engines is higher, as the gas inlet temperature can be raised. Theuse of hydrogen will avoid problems with sediment and corrosion of the turbine blades oftencaused by dirty jet fuels. This means more payload, smaller engines, and, of course, a muchcleaner exhaust from the engines.
4.3.3- Chemical and metallurgical industries
(1) Chemical indushy
(a) Ammonia and fertilizer productionAmmonia is the backbone of the fertilizer industry and is produced via a reactionbetween hydrogen and nitrogen. This industry consumes more than 200 billion m3hydrogen per year or more than 50% of the hydrogen produced in the world [38].(b) Hydrogen peroxideHydrogen is used a raw material for the production of hydrogen peroxide, which isused mainly to bleach paper. One example of a modern plant is the Kemira plant inHelsingborg, Sweden.
(2) Petroleum industry
(a) Crude processingIn the petrochemical industry, hydrogen is catalytically reacted with hydrocarbons inmany ways to refine fuels by hydrocracking or hydroprocessing. In modern refineries,

the hydrogen requirement is about 1YOwt of the crude processed. World wide, about80% of the hydrogen necessary in refineries originates from the thermal and catalytictreatment of oil but it is likely that the trend toward more natural gas reforming willcontinue.
(3) MetallurgicalapplicationsIn the production of nickel, hydrogen is used in the reduction stage. Hydrogen is also used asa reducing gas for catalysts to convert metal oxide into active metal.
Hydrogen offers energetic and environmental benefits in the production of iron. Iron ore isreduced to low-carbon sponge iron with hydrogen as a reductive gas. In heat treatingprocesses hydrogen is used to remove oxygen.
Hydrogen can be used as an external agent and alloying element to treat materials to improvetheir structure and properties.
4.3.4- Hydrogen in the space industry
Hydrogen is used for various applications in the aerospace indusby.
(1)Rocket fuelHydrogen is a basic fuel in the space industry. The high energy content per weight isthe most important factor. Almost all aerospace rockets are powered by boostersusing a mix of liquid hydrogen and liquid oxygen.
(2) Energy and water sourceThe alkaline, AFC, fuel cell is lightest, most compact device to produce energyaboard a spaceship such as the U.S. space shuttle. Pure oxygen and pure hydrogenare used as fuel for the AFC. By-product water is produced for use as drinking waterfor the astronauts. The fuel cell is the main water source aboard the space shuttle.The AFC fuel cell is reversible: it operates as a water electrolyzer with electricityprovided by PV panels. The fuel cell, in association with PV and the hydrogen andoxygen, is an efficient, compact system for both energy and water production aboardthe space shuttle and space stations.
4.3.5- Others
(1) Other industrial use
(a) Electronics industryIn the electronics industry, hydrogen is used to reduce silimn tetrachloride to siliconin the production of wafers and circuits.
(b) Glass and optical fibers manufacturingIn the glass industry, hydrogen is used in nitrogen gas to prevent oxidation of themolten tin bath. In the flame polishing of edges and in the production of optical fibersvia flame deposition, clean combustion, which uses hydrogen as a fuel, is required.
(c) Corrosion protectionHydrogen very efficiently reduces oxygen to water, and thus prevents oxidation andcorrosion of materials, for instance in pressure vessels. One example is in nuclearreactors of the LWR type, where traces of oxygen in the process water can causeintergranular stress corrosion cracking. Hydrogen is used to decrease oxygen levelsto below 100 ppb.
(d) Cooling of generatorsHydrogen has a very high heat capacity, which makes it ideal for cooling. It iscommonly used to cool big power generators.

(e) LubricantHydrogen has the lowest viscosity of all lubricants and can be used as lubricant inrotating equipment, e.g., power generators. Hydrogen has a viscosity of about 0,009cp at atmospheric pressure and 25°C. In parallel with this, hydrogen also acts as acoolant, since gaseous hydrogen has a high heat transfer coefficient.
(f) Oil and fat hydrogenationHydrogen is used extensively to decrease the degree of saturation in fats and oils.This results in changes to properties (increased melting point and improvedresistance to oxidation) that enables preservation for longer periods.
(g) Hydrogen as lifting agentHydrogen is the lightest of the elements. It was used in the past in airships as thelifting gas. Today hydrogen is used in weather balloons since it is both cheaper andprovides greater lifting power than helium.
5. HYDROGEN ENERGY PROJECTS
5.1- Introduction
Hydrogen research projects are underway worldwide. In general, these projects are at thebasic and applied research stage, and are conducted at universities, national research institutes, or bygovernment agencies. In some cases, private companies are involved, usually in applied research ordevelopment. The Iceland Hydrogen Company Project, for example, is supported by the Icelandgovernment, and companies such as Royal Dutch Shell, Norsk Hydro, and Daimler-Chrysler.
Most of the advanced research is conducted in the United States (DOE, NREL), Japan (MITI,WE-NET), and Europe (especially in Bavaria). On a higher level, the United Nations’ InternationalEnergy Agency and the European Commission are coordinating activities by member countries.
The speed of development for hydrogen technology is so rapid that the best way to keep upto date is via the Internet. Some general Internet websites (URLS) are listed here; other websites arewritten in the following texts
URLS of projects by governmental organizations:USA htttx//www.eren. doe.uov/hvdrouen/, htttx//www.nrel. uov/ceb.html andhttrxllwww.ttconxcomlnhalindex.htmJapan: htt~://w.enaa.or. i~/WE-NET/oraanize/oraanize e.htmlUnited Nations: httrx//www.risoe. dk/svs-ucc/
URLS of projects by NG or private organizations:Germany: httrx//w.hvweb. de/index-e.htmlUK: httrx//www.e-sources. com/hvdroaen/urlres. htmlSwitzerland: htttxllwww.icec.chl
The ongoing hydrogen projects are listed in Table 5.1.
Most of the ongoing hydrogen projects consist of research and demonstration. The DOE andWE-NET projects have significant budgets and a great variety of tasks; therefore, both are introducedas multi-projects. Others are categorized as demonstration projects. Those classified asdemonstration projects are divided into two subcategories: production, transportation and storage,and conversion; and utilization (especially hydrogen fueling stations & transportation).
5.2- Multi-Projects
(1) DOE Hydrogen ProjectsThe U.S. Department of Energy Hydrogen Research and Development Program conducts
research and engineering development in the areas of hydrogen production, storage, and utilization,

Project I Country I Outline Participants
blULT1- PROJECT
DOE Project United States lLong-term H2 energy plan to develop H2 INational Laboratories, universities,
WE-NET Project
production, storage; and utilization technology, and government laboratories, and privateintroduce H2 into the market industry
Japan Establishing technologies capable of introducing an The Institute of Applied Energy,international energy network. Basic technologies for Engineering Advancement Association ofhydrogen production, transportation and storage, Japan, WE-NET Centre and many privateand utilization companies
DEMONSTRATION
r
HYSOLAR
t--
Euro QuebecHydro-Hydrogen
Pilot Project
I (EQHHPP)
PROJECTGermany IPV and hydrogen production (30kW) Research lGermany: DRL, Stuttgart Univ. Saudi:
Saudi Arabia for system and utilization KACST, Univ. in Riyadh, Jeddah, Dhahrar
Norway/Canada Annual capacity of 20,000 tonnes of carbon black Kvaernerand up to 50 million Nm3 hydrogen produced byCB&H process using plasma
Norway/Sweden lCB&H process IKvaerner
Cologne, lConvert landfill gas into hydrogen and hydrogen IGermanv Ibeina fed into a fuel cell ICanada: IH2 p~oduction by hydropower in Canada and lCanada: Hydro-Quebec and other 12
Germany, Italy, transportation to Europe participants Germany: LBS andFrance, Belgium, Development of hydrogen vehicles and hydrogen other 23 participants
Switzerland station1 I
Table 5.1: Hydrogen Projects (1)

DEMONSTRATION PROJECT (HYDROGEN FUELING STATION & TRANSPORTATION)Project Count~ Outline Participants
EQHHPP Erlangen, Service of 92-passenger bus with 210 L liquid MAN, Linde, BMW, Autobus Oberbayern,Germany hydrogen as city bus from April in 1994 Erlanger Stdtwerke, Stadtwerke Munchen, TUV
Liquid hydrogen station is installed
Hydrogen Project Munich, Germany Plan to convert the vehicles in the airport into Bayern government, Linde, SWB, Daimler-Munich Airport hydrogen vehicles Benz, Aerospace, Munchen Airport, Lufthansa,
Hydrogen by water electrolysis fuelling station and MAN, BMW, Fiat, Ford, LBST, TUV etc.,liquid hydrogen station
Wasserstoff- Germanyllceland Six vehicles have been converted to hydrogen Hermes versand Service, HHA Hu,burger,Energy-Iceland vehicles and used with high pressure hydrogen H.AG, HEW electric, MDEU, AGA Gas, HGWTransfer Project vessel. Hydrogen is the by-product in DOW. H. Gas etc.,
(W. E.I.T)
Expo 2000 Berlin Berlin, Germany Hydrogen FCV will be serviced between Tegel EXPO, MAN, De Nora, Air Liquidairport and Zoologischer station from July in 2000.
Fuel Cell Drive Germany A 12m-long bus with hydrogen FC will be Bayern government, Linde, Siemens, MAN,Project for developed and be run in Erlangen. LBSTMunicipal
CommercialVehicles
Karlsruhe H2 I KarlsruheGermany IA bus with hydrogen FC will be serviced in IBadewerk AG, Karlsruhe Stadtwerke, GHW,refueling
InfrastructureProject
Spain HISPANIAPlan
Karlsruhe. Hydr~gen by water electrolysis will be MAN, Mannesmann Denmag Energie undprepared. Umweltechnik
I ISpain lThe hydrogen FC Vs remodeled from Suzuki-VitaralNational Institute of Aerospace Technology
are tested from 1998. 15kW solar PV and water (1.N.T.A), Santana Motor S.A., Isofoton S.A. Airelectrolysis system is used. Liquide Spain, etc.,
Iceland Project Iceland Hydrogen/FC company in Iceland was established Daimler-Chrysler, NorskHydro, Royalin February 1999. The bus with hydrogen FC will Dutch/Shellbe operated in Reykjavik.
England Zevco has equipped one of the famous London Shell Oiltaxicabs with a 5 kW fuel-cell and battery buffer.
I I 1
Table 5.1 Hydrogen project in the world (2)

:hflf7NlRTRATlf3N PRf) IFCT (HW_)RnGl=N FIJELING STATION).,., -,.” ,, ”...-.. . ..-” --- ,,, , --------- -— ------ ..-. .— .-,
Project Country Outline Participants
2HHPP Montreal Canada/Montreal The bus with hythane was developed as city bus Hydro quebec, Electrolyser, Gazand has ben serviced from 1994. Hythane station Metropolitan Inc., Hydrogen Consultants,was installed. NOVABUS, Societe de transport de la
Communaute urban de m\Montreal, etc.,
Vancouver CanadaNancouver Three 62-passenger buses with the FC produced Canada government, Hydro Quebec, BCHydrogen Bus by Ballard are running from March in 1998. Transit, Ballard, Electrolyser, etc.
Project Hydrogen is produced from Alkaii waterelectrolysis.
Clean Air Now/ Los Angeles, Three trucks with hydrogen engine have been run White House/DOE, SCAQMD,Clean Air>rox Los Angeles United States from 1995. The hydrogen is produced from Solar Now, Praxair, Zerox, Electrolyser, Solar
Project PV/Alkali water electrolysis Engineering, etc.
Chicago Bus Chicago, IL Three 62-passenger bus with hydrogen FC by Chicago Transit Authority, Ballard, Air~roject Chicago United States Ballard have been run from January in 1998. Products, Hydrogen Components
Liquid hydrogen storage/vaporization/fueling withpressure system is used.
‘he H2 Fuel Bus Augusta, GA A 27-passenger bus with hydrogen hybrid engine is DOE, ERDA, Augusta Richmond,,%oject Augusta United States tested from April in 1997. Hydrogen in the Fueling Westinghouse. Sava Rover, Southeastern
station is storaged as High pressure hydrogen. Tech. Center, etc.,
(drogen Project in Palm Springs, CA Two hythane bus, one bus with hydrogen FC, three DOE, DOD, SCAQMD, CEC, Federal Transitle Palm Springs United States trucks with hydrogen engine and four vehicles with Administration, Coachella Valley Ass. OfDesert Resort hydrogen FC will be introduced from 1999. Two Govern. etc.
Region water electrolyzer will be installed.
difornia Fuel Cell California, United 50 FCVS will be run during 2000 till 2003.Partnership States
— . . .. . . ,-.Table 5.1 Hydrogen project m me worm K2J

for the purpose making hydrogen a cost-effective energy carrier for utility, buildings, andtransportation applications.
The goals of the program include:. Developing hydrogen production technologies for short-, mid-, and long-termtargets. Developing low cost and low weight hydrogen storage technologies, addressingboth stationary and transportation-based applications, as well as the transport ofhydrogen. Developing and optimizing methods for utilization of hydrogen in safe, efficientsystems that produce little or no pollutants. Validating sustainable hydrogen systems for utility and vehicular applications. Evaluating and analyzing technologies and processes to identify the pathways thatwill enable hydrogen implementation.
The R&D program includes a large number of projects, covering near-, mid-, andlong-term processes. A sampling of some of the nearer-term activities is given below
. Hydrogen Production Technologies Approaches to producing hydrogen fromnatural gas and biomass with short-term goals are:● Natural gas to hydrogen: Sorbent enhanced reformer; Ion transport membrane(lTM); and Plasma reformer. Biomass to Hydrogen: Pyrolysis; Supercritical water gasification of high-moisturebiomass
Hydrogen Storage Technologies: Approaches with short- and mid-term goals:● Metal hydride storage tank● Carbon nanotube systems● Novel storage concepts (fullerene, nanofibers, polyhydrides, chemical hydride)
Hydrogen Utilization: Approaches with short-term goals:s Design of a 5-kW fuel cell system● Fabrication and deployment of fiber optic sensors
The Technology Validation Program is prepared to support industry in thedevelopment and demonstration of hydrogen systems in the utility and transportation sectors.A number of validation projects are being supported by the Program, with a minimum of 50%cost share from the industrial project participants. These include:
●
●
●
●
●
●
Renewable/Hydrogen Utility ProjectHydrogen/Bromine Reversible Fuel Cell with 85% round-trip efficiencyElectrolysis/Solar Thermal Stirling EngineElectrolysis/Fuel Cell for IslandsElectrolysis/Electric Generation for remote village in AlaskaLand-fill gas to hydrogen production and generation of electricity
(2) WE-NET ProjectsThe World Energy Network (WE-NET) aims to establish technologies capable of
introducing an international energy ne~ork to satisfy energy demands, and to develop coreelementary technology as well as preparation of conceptual design of the total system. Thisnetwork will be used in a wide variety of fields, such as hydrogen production, conversion,transportation, storage, generation of power, and fuel for transportation. The R&D program isdivided into nine subtasks:
Subtask 1: Investigation and study for evaluating and reviewing R&DRegarding each individual technology development constituting systems such ashydrogen utilization technologies including hydrogen production, hydrogentransportation and storage, hydrogen-combustion turbines, studies are to be

implemented for the constant overall coordination of the project, the overall evaluationof developed results, and the optimization of development schedule.
Subtask 2: Review and investigation for promoting international cooperationIn order to establish a worldwide system, periodic information exchange is petformedwith international organizations and relating countries, while procedures andmeasures are to be studied for developing the project as an international jointresearch effort.
Subtask 3: Conceptual design of the total systemDevelopment of a conceptual design of the total system consisting of such facilitiesas power generation using renewable energy, hydrogen production, transportationmedium production, storage, transportation, and utilization is to be conducted tomake technological and economical evaluations. The effect of the introduction ofhydrogen energy is to be estimated on a worldwide level and on an individual countrylevel. Development of safety measures and evaluation technologies is to beconducted from the perspective of the total WE-NET system.
Subtask 4: Development of hydrogen production technologyTechnologies necessary for a bench-scale plant are to be established bydevelopment of elementary factors such as solid polymer electrolyte (ion exchangemembrane), anode and cathode catalysts, and materials for electrolyzers, andimplementation of bench-scale tests.
Subtask 5: Development of hydrogen transportation and storage technologiesNecessary investigations, basic research and elementary technology developmentare to be conducted for hydrogen production, transportation, and storage, in order toobtain data necessary to determine an optimum system for mass transportation andsmall-scale storage transportation.
● Development of large-capacity hydrogen liquefaction facilities● Development of liquid hydrogen transportation tanker. Development of liquid hydrogen storage facilities● Development of devices for common use. Development of hydrogen absorbing alloys for small-scale transporting andstorage system
Subtask 6: Development of cryogenic materials technologyStructural materials usable with liquid hydrogen and proper welding methods are tobe studied, with development of new materials as necessary. Basic data for theexisting materials will also be obtained. The requirements for materials related to thedevelopment of hydrogen transportation and storage describing in Subtask 5 are tobe determined.
Subtask 7: Feasibility study on utilization of hydrogen energyInvestigation, studies and proposals of applicable technologies are to be conductedconcerning end-use technologies and future demand of hydrogen in future in variousfields, such as power generation, industry, transportation, and civil application. Inaddition, studies of various methods of using hydrogen gas, liquid hydrogen, andmethanol, will be conducted to clarify the merits and demerits of each technology.The themes to be developed in hydrogen utilizing technologies are to be selected. Inaddition, technologies that use the cryogenic energy of liquid hydrogen are to bestudied to evaluate the processes.
Subtask 8: Development of a hydrogen-combustion turbineThe required investigation and development of elementary technologies for thefollowing items are to be studied for hydrogen combustion turbines. Because of theirextraordinary high efficiency as a hydrogen utilizing technology, the technologiesnecessary for the development of a pilot plant will be pursued.

● Development of the combustion control technology. Development of turbine-blades, rotor and other major components● Development of major auxiliary equipment● Development of super-pyrogenic materials
Subtask 9: Study of innovative and leading technologyInnovative and leading technologies and current technologies are to be studied,investigated and evaluated. Fundamental research is to be conducted on promisingtechnologies.
5.3- Demonstration Projects
5.3.1 Projects related to Production, Transportation and Storage, andConversion
(1) Production
Hydrogen from PV. HYSOLAR project Saudi Arabia (large scale H2 production on a PV farm)
and Solar Wasserstoff and Bayern project, Nuenburg vorm Wald(hti~://w.st.dlr. de/en/tisvstem/~roiects/solhvd.htm )
● Helsinki University Technology (NEMO 2 project solar house, H2 from PV as
both energy source and buffering medium)
Hydrogen from fossil fuels● Karbomont, Montreal, Canada. The first full-scale plant using the Kvaernercarbon black process for production of carbon black and hydrogen. Theprocess is based on plasma pyrolysis and it can convert methane into carbonblack and hydrogen without emission of COZ.
● The Netherlands, CGR gas utility is planing to build a plant based on theKvaerner carbon black technology for the production of hydrogen. Thehydrogen will be used to upgrade the natural gas in the existing grid.
. Germany, KolnPlans in an advanced stage to convert landfill gas into hydrogen. The hydrogenwill then be fed into a fuel cell CHP (source: http://w.h~eb.de).
(2) Transportation and storage
. Euro Quebec Hydro-Hydrogen Pilot Project, Germany/Canada (study oftechnology and economics of transportation by ship of LH2)
(httrx//www.wasserstoff. de/LBST/Proiekte/EQHHPP 92.htm, German languageonly)
(3) Conversion
● Fuel cell is the key technology for conversion from hydrogen to electricity andheat. Fuel cell has two functions at present, namely the hydrogen generatorwith reformer and hydrogen converter with cell.
. Various projects devoted to the application of the five fuel-cell types: alkaline,phosphoric acid (PAFC), molten carbonate, solid oxide (SOFC) and PEMFC.PAFC is not at the research stage and many plants operate as commerciallyplant as in Table 5.2.

Dat& Feb. 1999summarizedbvOsakaGas
Capacity I Number I Japan I U.S.A I Europa I Korea and other countries
50kW lUnderOperationI 16 0 1 I 1Accumulation 61 0 4 2
100kW Under Operation 7 0 0 0Accumulation 20 0 0 0
200kW UnderOperation 46 67 19 6Accumulation 70 67 19 6
500kW Under Operation 2 0 0 0Accumulation 4 0 0 0
lMW Under Operation o 0 1 0Accumulation 3 0 1 0
5MW Under Operation o 0 0 0Accumulation 1 0 0 0
1lMW Under ODeration o 0 0 0Accumulation 1 0 0 0
Sum UnderOperation 71 67 21 7
Accumulation 160 67 24 8Sum of capacity under operetmn .-_kW_..-. -11700 13400 5130 1250-..*- .. . . . . . ..A-.—. L.-J-—...- .-...-..A..- . . ..--..Accumulated eapacily I kW I 40,050 I 13,400 I 5,280 I 1,300
Table 5.2 Size and capacity of PAFC in the world
. MCFC Fuel Cell at MTUMTU/Friedrichshafen (Germany) has developed the so-called “Hot Module”on the basis of molten carbonate fuel cell (MCFC) technology licensed by theAmerican company Energy Research Corp (ERC). The work has been donein collaboration with Haldor Topsoe and Elkraft/ Denmark, Ruhrgas AG andRWE AG/Germany. The special feature of the Hot Module is the arrangementof all system components in a small thermally insulated vessel. This reducessystem costs considerably (goal: 2,300 DM/kWe or approximately US$ 1,350per kWe). The MCFC generates electricity and heat at operatingtemperatures of 650”C.
The system demonstrator MCFC unit has an electric power output of 280kWe and is divided into three subsystems: MCFC hot module and its directperiphery, electrical and control systems including an inverter, and a fuelprocessor. The direct current produced passes a pulse regulated inverter anda transformer to reach the 400 VAC level. Auxiliary electric consumers (e.g.blowers) are fed from this internal electric supply system. The electricalefficiency is 50Y0. In combination with a steam turbine, electric efficiencies of65% can be reached without externally reforming the fuel gas. The typicaloperation mode planned is grid-connected operation, although stand-aloneoperation is feasible. The first system demonstrator will be in operation at, aRuhrgas facility in Dorsten, followed by product optimization. Severaldemonstration units will be operated. Commercialization is planned afterward.
1Sum
18
67
7
20‘1381622414010
a1166259
.31,48060030
. PEFC Fuel cell in Berlin 250 kWeThe company Ballard, Canada will install a 250 kWe PEFC fuel cell in Berlinfor a consortium of German utilities BEWAG, HEW, PreussenElektra, VEAGand EDF from France. The hydrogen is produced from natural gas in areformer. Commissioning of the plant is scheduled for 1999. Photo 5.3.1shows the cell stack of 5 kW PEM manufactured by Ballard

Photo 5.3.1: Cell stack of 5 kW PEM manufactured by Ballard
● SOFCThe market leader of SOFC is Siemens/Westinghouse with their tubulartechnology. In the Netherlands in the village Westervoort the technology isdemonstrated in a 100 kWe CHP plant. The plant started operation in thebeginning of 1998 and has been in operation more than 6000 hours. The first250 kWe plant with a pressurized SOFC combined with a gas turbine in thesame process is planned to start operation in year 2000 in Irvine, California,USA. A similar project a 1 MW plant is planned to be biult in Europe withsupport both from EU and DoE, USA.
Shell Hydrogen and Siemens/Westinghouse also pIan to join forces in thedevelopment of a power plant concept using natural gas without emittingcarbon dioxide to the atmosphere. The power plant shall combine the tightemperature fuel cell of the SOFC type with the COZ sequestration technologypresently being developed by Shell. The C02 produced in the SOFC shall bepumped into exhausted petroleum or natural gas fields for the long-termstorage.
Other important developers of SOFC technology are:. Sulzer, Switzerland, planar Hexis technology. Rolls Royce, UK, inter planar IP-SOFC● Forschungzentrum Julich, Germany, planar SOFC. CFCL, Australia, Planar SOFCc Mitsubishi Heavy Industry, Japan
5.3.2- Projects related to utilization
At present, low-emission vehicles are being developed to use alternative fuels, suchas natural gas and methanol. In addition, hybrid vehicles or zero emission vehicles(ZEV) such as electric vehicles, methanol-FCVs and hydrogen-FCVs are beingdeveloped. Introducing hydrogen-based vehicles into the market will be a slowprocess because of the lack of a hydrogen infrastructure. However, the ultimate ZEVS(most efficient with no C02 emissions) are hydrogen-FCVs. In many places,hydrogen-FCVs and hydrogen fueling stations are being actively developed anddemonstrated for practical use. These will soon be widely demonstrated in Canada,the United States, Germany, and Japan.
EQHHPP ErlangenA 92-passenger hydrogen bus with 21OL liquid hydrogen has been in operation as acity bus since April 1994. It can run 250 km on one refueling. A liquid hydrogenstation has been installed.
Germany, Munchen AirportFor this project, the whole chain of hydrogen uses in transportation is tested. Somebuses and a car were hydrogen-powered beginning in May 1999. The buses run on

GHZ and the car on LHz. The gaseous hydrogen is produced via water electrolysis ina plant on the premises. The liquefied hydrogen is supplied as industrial hydrogen.(http://www.hyweb. de/h2muc/introe. html )
Photo 5.3.2: Hydrogen - powered low- floor articulated bus in MuenchenWasserstoff-Energy-lceland Transfer (W. E.I.T)
Thirteen companies in Hamburg have developed this project. Six vehicles (BenzSprinter) were converted to hydrogen and have run since March 1998. They usehigh-pressure hydrogen storage, with the hydrogen supplied by DOW (produced as aby-product). The compressed hydrogen will soon be imported from Iceland.
Photo 5.3.3: Hydrogen fueling station in Hamburg
Expo 2000 BerlinThe hydrogen FC bus produced by MAN/De Nora with a 350 L liquid hydrogen vesselon the ceiling will run between Tegel airport and the Zoologischer station beginning inJuly 2000. After 9 months, the bus will run sent to Copenhagen and Lisbon for 3months.
Fuel Cell Drive Project for Municipal Commercial VehicleA 12 m long bus with hydrogen fuel cell will be developed by 2000 and will run inErlangen, Germany. The planned specifications are: output of FC: 30 kW X 4,distance with one filling: 300km, high-pressure vessel: 1530 L, 250 bar.

Karlsruhe Hz Refueling Infrastructure ProjectA fuel cell bus using hydrogen supplied from a high-pressure vessel will run inKarlsruhe from 1999 to 2002. Hydrogen produced by water electrolysis will be used.
Spain Hispana PlanThe operation test for the hydrogen FCVS remodeled by Suzuki Vitara (20k W PEFC)will perform for 3 years (1998-2001). High-pressure hydrogen vessels are used. Thehydrogen fueling station with hydrogen by water electrolysis is installed.
Iceland, ReykjavikCreating the world’s first “Hydrogen Economy,” an Icelandic consortium, Vistorka(EcoEnergy Ltd), formed a joint venture with Daimler Chrysler, Norsk Hydro andRoyal Dutch Shell: Icelandic Hydrogen and Fuel Cell Company. With Iceland’sblessing, Daimler Chrysler and Shell announced plans to try to turn the tiny countryinto the world’s first “hydrogen economy,” eventually replacing gasoline and diesel inall its cars, buses, and fishing fleet with nonpolluting hydrogen(htttx//wvvw.msnbc. com/news/242000. as~ ).
The consortium will test various applications using hydrogen fuel cells or hydrogencarriers. One of the first could be hydrogen fuel cell powered bus service inReykjavik. The joint venture’s ultimate aim is to convert both the public and privatetransportation sectors, including fishing vessels. Work will also be carried out toevaluate effective systems for the production, storage, and distribution of hydrogenand hydrogen carriers.
England, LondonZevco has equipped one of the famous London taxicabs with a 5 kW fuel cell andbattery buffer, shown in Photo 5.3.4. The project is conducted by Shell Oil UK incooperation with Zevco
EQHHPP MontrealThe bus engine, which can be operated on Hythane (80?4. natural gas and 20!4.hydrogen), was developed and two buses have been in city service since 1994.These buses will be moved to Palm Springs and they will serve as city buses from2000. The original ICE operated on natural gas. The buses are equipped with ahigh-pressure hydrogen storage vessel. The Hythane fueling station is installed.
Vancouver Hydrogen Bus ProjectThree 62-passenger-buses with fuel cells were produced by Ballard. They have beenused as city buses since March 1998. High-pressure hydrogen storage is used. Thehydrogen fueling station is installed, where the hydrogen is produced by alkali waterelectrolysis.
Clean Air Now/ Xerox Project, Los AngelesThree Ford Ranger trucks with modified hydrogen ICES have been used by Xeroxsince 1995. The trucks can run 170 km with one filling of high-pressure hydrogen.The hydrogen station is installed, where the hydrogen is produced by PV (48 kW) andalkaline water electrolysis.
Chicago Bus Project, ChicagoBallard produced three buses with hydrogen fuel cells. They have been used as citybuses

Photo 5.3.4 London Taxi with a 5 kW fuel-cell(source: http://www.zevco. co.uk )
Photo 5.3.5 Hydrogen bus in Chicago Bus Project
since January 1998. The high-pressure hydrogen vessels are used and the bus canrun 250 km on one filling. Liquid hydrogen storage/vaporization/fueling with a high--pressure system is used in the fueling station.
The H2 Fuel Bus Project, Augusta, GeorgiaA 27-passenger bus with a hydrogen hybrid engine has been tested in the city sinceApril 1997., The hydrogen is stored in the vehicles with metal hydride system(Mischmetal alloy 1.3wt% at 80”C). It can run 190 km on one filling. The hydrogenfueling station is installed, where high-pressure hydrogen is stored. The bus will bemoved to Las Vegas, Nevada in 1999.
Hydrogen Project in the Palm Desert, CAThe goal of this project is to develop a clean, sustainable transportation system for acommunity. The project is managed by a consortium that includes the City of PalmDesert, California, the Schatz Energy Research Center, and El. DuPont de Nemours& Co. Theproject involves four main tasks: (1) designing, building, and operating a fleet ofpersonal utility vehicles and neighborhood electric vehicles powered by hydrogenPEM fuel cells; (2) designing, building, and operating a refueling infrastructureappropriate for future hydrogen-based transportation systems; (3) developingmaterials and manufacturing techniques for PEM fuel cell production; and (4)

designing and constructing a PEM fuel cell service and diagnostic center. Photo5.3.6 shows the developed vehicle. (Details fromhttrx//www.eren .doe.clov/hvdroaen/develomhtm).
Photo 5.3.6 FC powered personal utility vehicle
California Fuel Cell Partnership, CaliforniaFifty fuel cell vehicles will be introduced in the city from 2000 to 2003. Twenty-fiveDaimler-Chrysler NEBUS, 25 NECARIV, and 5 Ford P-2000 are planned. The type ofhydrogen fueling station is not determined.
6. FUTURE IMPACT OF HYDROGEN ENERGY TO THE GAS INDUSTRYAND THE ROLE OF IGU
6.1- Economics of hydrogen introduction into the market
As shown in the previous chapters, the movement to convert from fossil fuels to a low-carbon,hydrogen-rich fuel is being accelerated because of environmental concerns. Natural gasplays an important role in this movement, as a clean fuel and as an important source forhydrogen.
6.1.1 Environmental cost
In most energy markets today, the cost of energy use is represented by the marketprice. Trends toward including externalities are growing in many regions, to accountfor the true cost of exploration, production, transportation and use of fuels, particularlythe costs of environment effects.
Combustion of fossil fuels produces various gases, such as CO,, SO,, NO,,hydrocarbons, and other organic compounds that cause air pollution, smog, and acidrain, and destroy the earth’s protective ozone layer. Air pollution damages theterrestrial ecosystem, affecting humans, animals, crops, and buildings. The productsof combustion in the atmosphere, mainly COZ, absorb and trap infrared radiation,causing global climate change.
In general, the costs of these negative effects are not currently included in the marketprice of the fossil fuels. These costs are paid by society through taxes to supportmilitary operations in the Middle East, through increased medical expenditures forlung and other diseases, increased insurance premiums, and a reduced quality of

living. These “hidden” costs are called external costs, externality costs, orenvironmental cost [39,40].
For simplicity, the term environmental cost will be used. The magnitude of theenvironmental costs, estimated by a number of researchers, varies considerably. Thisis due in part to the evaluation methods used, where some impacts may or may notbe included, and in part due to the variation in amounts of pollutants depending onlocation. The broad spread of cost estimates summarized with the maximum,minimum, and medium value from the literature is shown in Table 6.1.1. [40]
I Medium I Max I MinNO. (!3/ka) I 5.4
——,C02(q),1)CO ($/kg)Paficlac (!t/kn)
Table 6.
Table 6.1.1 Environmental Unit Cost
1.2 presents other environmental costs estimated by Barbir et al [41]. In thiscase, the military cost for settling the dispute in the Middle E-ast was included.
Species of environmental costDamage to environment
Influence on human
Influence on animals
Influence on plants
Influence on hydrosphere ecosystem
Influence on structures
Influence on air pollution
Influence by strip mine
Influence by climate change
Influence bv rise of sea level
Coal
3.480.511.350.181.120.980.491.390.32
lSum of damages I 9.82Military cost
Sum of external cost ($/GJ) 9.82
Oil
2.830.421.091.050.9
0.79
1.130.268.47
1.7
10.17
Natural ga<
2.09
0.30.810.110.670.59
0.840.195.6
5.6
Table 6.1.2 Environmental cost for the usage of fossil fuel
Estimates of environmental costs are likely to increase as research continues into theeffect of human activity on the environment [42]. At present, it is estimated thatenvironmental damage accounts for more than 10% of the gross world product [39].Based on these data, carbon taxes have been already introduced in some countries.As more and more countries recognize the importance of environmental costs,cleaner energy systems will be introduced into the market.
6.1.2 .- Economical priority of hydrogen
Current production costs of hydrogen were shown in Chapter 4.In the DOE program, the cost of hydrogen production via different technologies in2010 is targeted to be [43]: from natural gas using improved processes, $6 to$8/MMBtu ($6.3 to 8.4/GJ).via gasification or pyrolysis of dedicated biomass crops,approximately $6 to $8/MMBtu ($6.3 to $8.4/GJ).from sunlight and water, the ultimategoal, is $10 to $15/MMBtu ($10.5 to $f5.8/GJ).

Hydrogen from natural gas and biomass is predicted to be cost-competitive with otherfuels, even in the early 21st century. Moreover, if environmental costs are included,cleaner energy sources such as hydrogen are clearly cost effective alternatives tofossil fuels.
Trends around the world are leading to the inclusion of environmental costs indetermining the cost effectiveness of alternative energy systems. With improvementsto steam reforming and other production technologies making natural gas-to-hydrogen processes very attractive in such an energy environment, gas companiesshould plan to make the maximum use of natural gas in the coming hydrogen era.
6.2- Introducing hydrogen into the market
6.2.1- Transition to a hydrogen economy
In order for hydrogen to be a viable long-term option, some nearer-term strategiesmust be implemented. The transition to a hydrogen economy in the DOE HydrogenProgram is shown in Figure 6.2.1 [44]. This strategy shows the introduction ofhydrogen into energy systems first as additives, then into niche markets for electricvehicles, followed by storage of intermittent renewable electricity, and finally as awidespread energy carrier. A global energy system cannot be replaced in the shortterm, and building a parallel, competitive energy system is not practical. Thehydrogen economy will gradually replace the current fossil-based energy economy.For example, the existing natural gas pipeline nehvork can be used to transporthydrogen-enriched gas as we transition to a hydrogen energy system.
One realistic application of the hydrogen energy system is for remote villages, wherehydrogen can provide fuel and electric power needs using indigenous or localresources. Such a system comes much closer to the hydrogen energy industry’svision of all energy being supplied by renewable energy. The plan calls for thedevelopment of hydrogen systems to compete with renewabl~fossil hybrids (i.e., PV-diesel generator systems), starting in the developing world or other remote areasaway from an electrical power grid, such as in Alaska or on resort islands. Thismarket will become the true link to a renewable hydrogen future [45].
Hydrogen-Energy-Based
Economy, Mature Utilization
Increase in and Infrastructure
Niche Markets Infrastructure .
Electric Vehicles dIncrease in Renewable Electricity
Additive to Dedicated Production A“Natural Gas and Consunmtion II
Methanol 4Gasoline
mLong Term
LI Present Near Term Midterm
Fig. 6.2.1 Transition to a Hydrogen Economy
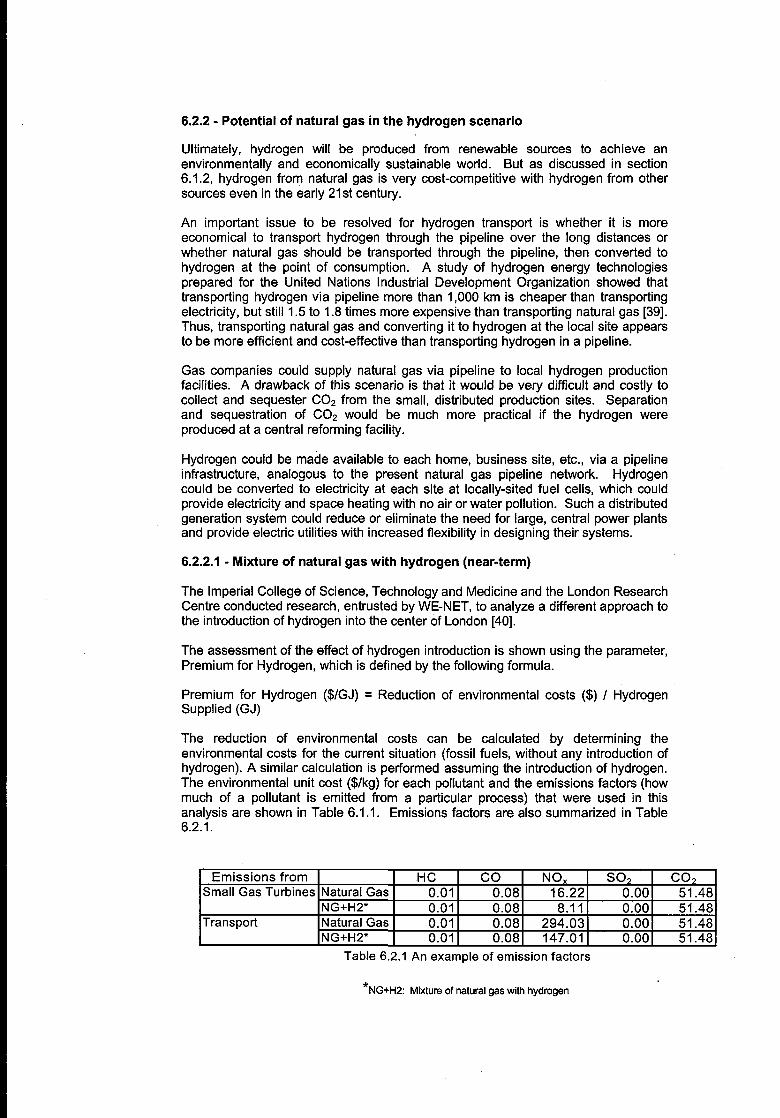
6.2.2- Potential of natural gas in the hydrogen scenario
Ultimately, hydrogen will be produced from renewable sources to achieve anenvironmentally and economically sustainable world. But as discussed in section6.1.2, hydrogen from natural gas is very cost-competitive with hydrogen from othersources even in the early 21 st century.
An important issue to be resolved for hydrogen transport is whether it is moreeconomical to transport hydrogen through the pipeline over the long distances orwhether natural gas should be transported through the pipeline, then converted tohydrogen at the point of consumption. A study of hydrogen energy technologiesprepared for the United Nations Industrial Development Organization showed thattransporting hydrogen via pipeline more than 1,000 km is cheaper than transportingelectricity, but still 1.5 to 1.8 times more expensive than transporting natural gas [39].Thus, transporting natural gas and converting it to hydrogen at the local site appearsto be more efficient and cost-effective than transporting hydrogen in a pipeline.
Gas companies could supply natural gas via pipeline to local hydrogen productionfacilities. A drawback of this scenario is that it would be very difficult and costly tocollect and sequester COZ from the small, distributed production sites. Separationand sequestration of C02 would be much more practical if the hydrogen wereproduced at a central reforming facility.
Hydrogen could be made available to each home, business site, etc., via a pipelineinfrastructure, analogous to the present natural gas pipeline nehvork. Hydrogencould be converted to electricity at each site at locally-sited fuel cells, which couldprovide electricity and space heating with no air or water pollution. Such a distributedgeneration system could reduce or eliminate the need for large, central power plantsand provide electric utilities with increased flexibility in designing their systems.
6.2.2.1- Mixture of natural gas with hydrogen (near-term)
The Imperial College of Science, Technology and Medicine and the London ResearchCentre conducted research, entrusted by WE-NET, to analyze a different approach tothe introduction of hydrogen into the center of London [40].
The assessment of the effect of hydrogen introduction is shown using the parameter,Premium for Hydrogen, which is defined by the following formula.
Premium for Hydrogen ($/GJ) = Reduction of environmental costs ($) / HydrogenSupplied (GJ)
The reduction of environmental costs can be calculated by determining theenvironmental costs for the current situation (fossil fuels, without any introduction ofhydrogen). A similar calculation is performed assuming the introduction of hydrogen.The environmental unit cost ($/kg) for each pollutant and the emissions factors (howmuch of a pollutant is emitted from a particular process) that were used in thisanalysis are shown in Table 6.1.1. Emissions factors are also summarized in Table6.2.1.
Emissions from HC co NOX so, co,Small Gas Turbines Natural Gas 0.01 0.08 16.22 0.00 51.48
Nr3+H2* 0.01 0.08 8.11 0.00 51.48Transport Natural Gas 0.01 0.08 294.03 0.00 51.48
NG+H2* 0.01 0.08 147.01 0.00 51.48
Table 6.2.1 An example of emission factors
*NG+H2 Mixture of natural gas with hydrogen

Using the data, the reduction of the environmental costs between the two systems isthe difference between the two environmental costs. The premium for hydrogen canthen be evaluated as the reduction of the environmental costs divided by the amountof hydrogen. Comparison of the premium for hydrogen with a cost of hydrogenproduction shows how much benefit the introduction of hydrogen would bring.
In the case of a mixture of hydrogen and natural gas widely distributed to all gasconsumers regardless of their speci~c applications, the benefits of supplying themixture of natural gas with hydrogen is calculated using the methods described atsection 6.1.2. The calculations were carried out using high, low and median valuesfor environmental unit cost in Table 6.1.1 with their emission factors. The results areshown in Table 6.2.2.
Value ($/GJ) NG + H2
Environmental CostBased on High 48
Medium 10
Low 7
Table 6.2.2 The premium for hydrogen as an additive to natural gas
The report states that, if they assume a cost of production for hydrogen ofapproximately $6/GJ from natural gas, then the introduction of hydrogen in a mixturewith natural gas can be cost-effective at all the calculated cases. This study indicatesthat the distribution of mixture of natural gas and hydrogen could be part of atransitional strategy for the development of a hydrogen economy.
6.2.2.2- Hydrogen from natural gas for the automotive fuel (Mid-Term)
An analysis of energy consumption and C02 emission is reported from the standpointof total energy flow for different forms of transportation and usage, through naturalgas fields to consumption in the vehicles [46].
Figure. 6.2.2 shows the energy flow and the energy conversion efficiency in thisanalysis. Natural gas is the primary energy source and three different routes topossible usage as fuel for vehicles are analyzed, namely compressed natural gas(CNG) which leads to CNG/lCE; hydrogen which leads to hydrogen/FC/Motocmethanol which leads to methanol/lCE and
Primary Energy Fuel for Vehicle
36% 87% 98% 92%
Mining Compression
78% 88%
I
[Petroleum
Distillation E Gaadine
Refining
Efficiency at
Fuel Production 17.6%
75’3%-
50%
56”2%–Ezzl
16.6%
60.5%
a
Methanol ICE
Methanol Fuel Cdl
Reforming80%
FC Drive:50Y.
16%
83”8%+322.!d
Total Efficiency
13.3%
28.1%
10.2%
24.2%
13,3%
Figure 6.2.2 Flow of the Fuel for Vehicle based on Natural Gas as Primary Energy

methanol/Reformer/FC/Motor. A metal hydride system is used for the storage of hydrogen inthis calculation. Figures 6.2.3 and 6.2.4 show the energy consumption and C02 emission,respectively for the four routes. In each figure, data for a gasoline/lCE system are shown forcomparison
GaEDhe-K!E
M ethano>
Rehnn er-FuelC elLM otor
HZ-FuelCelhMotmr
CNG-Z!E
o 2 4 6 8 10
Eneq Conmmpth ~ J/&kklg WOXkbad ~ J)
Figure 6.2.3 Energy Consumption from Production to Utilization
I I
Gasohe-~E
M etharmkReknm er-FuelC eILM obr
H2-FuelCelLMobx
CNG-12E
I
0 20 40 60 80 100 120 140 160
C02Emk.skm&C/ckkhg wok bad lMJ)
Figure 6.2.4 COZ Emission from Production to Utilization
The most efficient use of natural gas with the lowest emissions of C02 is the case ofhydrogen/FC system. The total efficiency is higher for hydrogen/FC/motor for thesites where natural gas is transported only through the pipeline, since the conversionloss at the LNG production and through the marine transport are not included.Again, these results imply that natural gas will play an important role in a transitionperiod.
6.3.1- Status of IGU
The transition period to a hydrogen energy system will be a very long one, butmovement toward this clean, sustainable energy system has accelerated, driven bygrowing environmental concerns. IGU should prepare to use the pipeline network forhydrogen transportation in the near and mid term, to break into the hydrogen era.

Now is the time for gas companies to determine how to push the introduction ofhydrogen and to propose a hydrogen commercialization plan.
6.3.2- Important and priority technologies in gas companies
6.3.2.1- Production technologies
(1) Steam Methane ReformingInitially, the introduction of hydrogen will be based on fossil fuel technologies, such assteam methane reforming as described in section 4.1.2. Fossil fuels are still readilyavailable and the costs of producing hydrogen from PV and other renewable sourcesare very likely to remain higher than for producing hydrogen from reformingtechnologies, at least until about 2010 [47].
Steam methane reforming has been the most efficient, economical, and widely usedprocess for hydrogen production. Steam methane reforming also provides a platformfor COP sequestration. The reforming process produces a relatively pure stream ofC02 as a by-product. This stream lends itself to capture much more convenientlythan does the flue gas stream from combustion of natural gas [45]. Steam methanereforming to hydrogen and sequestering by-product C02 results in nearly 40% lesslife-cycle C02 emissions than the gasoline scenario. Gas companies have keytechnologies for steam methane reforming.
(2) Gasification of BiomassGasification of biomass uses either waste or dedicated feedstocks, such as grassesor trees grown specifically as an energy source. An important environmentaladvantage of using sustainable grown biomass as a hydrogen feedstock is that theC02 emitted by the process contributes little to the increase in total C02 in theatmosphere. This is because C02 is consumed by the biomass while growing, andthe conversion process returns the COZ to the air.
The whole system is very similar to a coal gasification plant, except for the unit forpretreatment of the biomass and the design of the reactor. This technology would beused for hydrogen production on a relatively large scale. Because of the lowercalorific value per unit mass of biomass compared to coal, for a set hydrogenproduction rate, the biomass processing facility is likely to be larger than that of a coalgasification plant [39].
Gas companies could make the most of their expertise in gasification technologies byapplying it to biomass gasification.
6.3.2.2- Transportation technologies
(1) Transportation by pipelinesHydrogen is transported via pipelines either in relatively short links between nearbyproduction and utilization sites (up to 10 km) or in more extensive networks (roughly200 km). Figure 6.3.1 shows the principal hydrogen pipelines around the world[39,48].
As a rule, transporting hydrogen through pipelines requires larger diameter piping andmore compression power than natural gas for the same energy throughput.However, hydrogen’s lower pressure loss could enable the recompression stations tobe twice as far apart. As described in section 6.2.2, in economical terms, moststudies found that the cost of large-scale hydrogen transportation is about 1.5 to 1.8times that of natural gas [39].
In addition, safety issues must be well understood and characterized before hydrogenwill be accepted by the public. This can be accomplished by modeling hydrogen leakbehavior and by developing rapid, sensitive hydrogen leak detection systems.
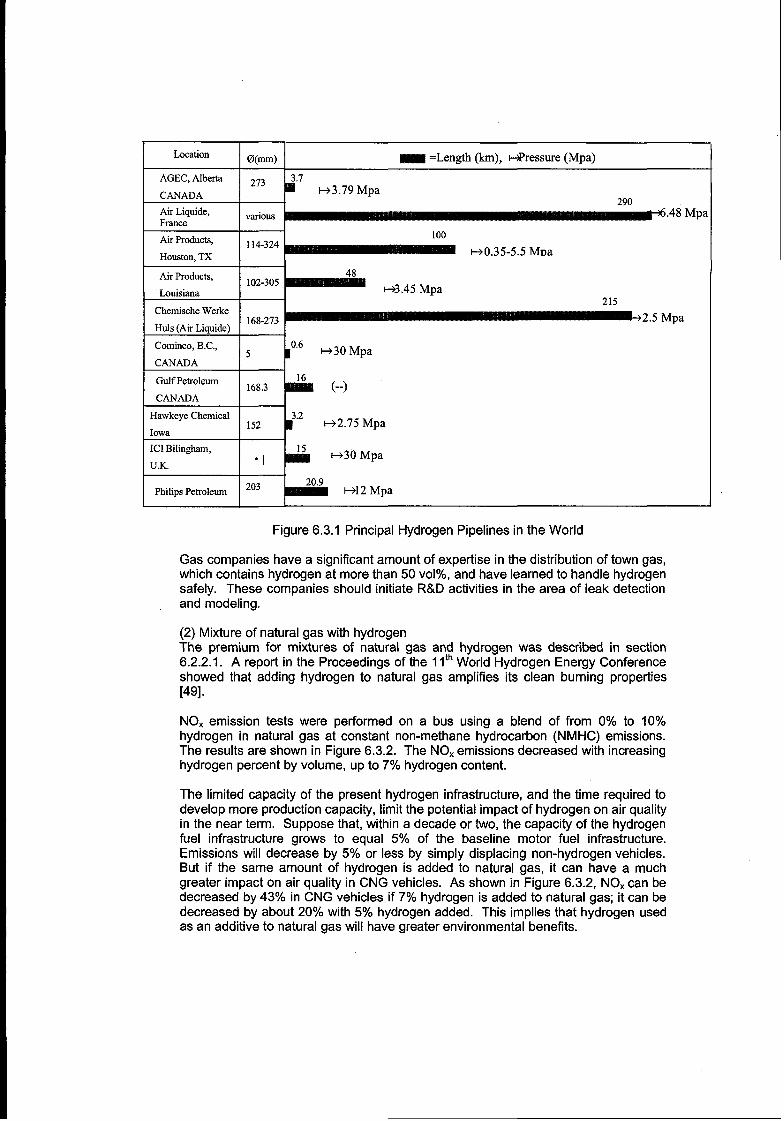
Location @(mm) m =Length (l@, #ressure (Mpa)
~“’ ‘37’Mpa 7Qn
Ak Liquide,I
-. .
various fi,48 MpaFrance
Ak Products, 100114-324
Houston,TXHC).35-5.5 Mva
Air Products, 48102-305
Louisiana H3.45 Mpa215
ChernischeWerke168-273 I H2.5 Mpa
Huis (Air Llquide)
EullL_v “’””paGulf Petroleum
+
16168.3 (--)
CANADA
HawkeyeChemical
i
3.2152 w2.75 Mpa
Iowa
ICI Bilingham, 15“1
-30 MpaU.K.
203 20.9PhilipsPetroleum 1+12 Mpa
Figure 6.3.1 Principal Hydrogen Pipelines in the World
Gas companies have a significant amount of expertise in the distribution of town gas,which contains hydrogen at more than 50 VOIYO,and have learned to handle hydrogensafely. These companies should initiate R&D activities in the area of leak detectionand modeling.
(2) Mixture of natural gas with hydrogenThe premium for mixtures of natural gas and hydrogen was described in section6.2.2.1. A reporl in the Proceedings of the 1Iih World Hydrogen Energy Conferenceshowed that adding hydrogen to natural gas amplifies its clean burning properties[49].
NOX emission tests were performed on a bus using a blend of from 0% to 10’XOhydrogen in natural gas at constant non-methane hydrocarbon (NMHC) emissions.The results are shown in Figure 6.3.2. The NOX emissions decreased with increasinghydrogen percent by volume, up to 7% hydrogen content.
The limited capacity of the present hydrogen infrastructure, and the time required todevelop more production capacity, limit the potential impact of hydrogen on air qualityin the near term. Suppose that, within a decade or two, the capacity of the hydrogenfUel infrastructure grows to equal 5’%. of the baseline mOtOr fuel infrastructure.Emissions will decrease by 5% or less by simply displacing non-hydrogen vehicles.But if the same amount of hydrogen is added to natural gas, it can have a muchgreater impact on air quality in CNG vehicles. As shown in Figure 6.3.2, NOX can bedecreased by 43% in CNG vehicles if 7% hydrogen is added to natural gas; it can bedecreased by about 20!4. with 5’% hydrogen added. This implies that hydrogen usedas an additive to natural gas will have greater environmental benefits. -
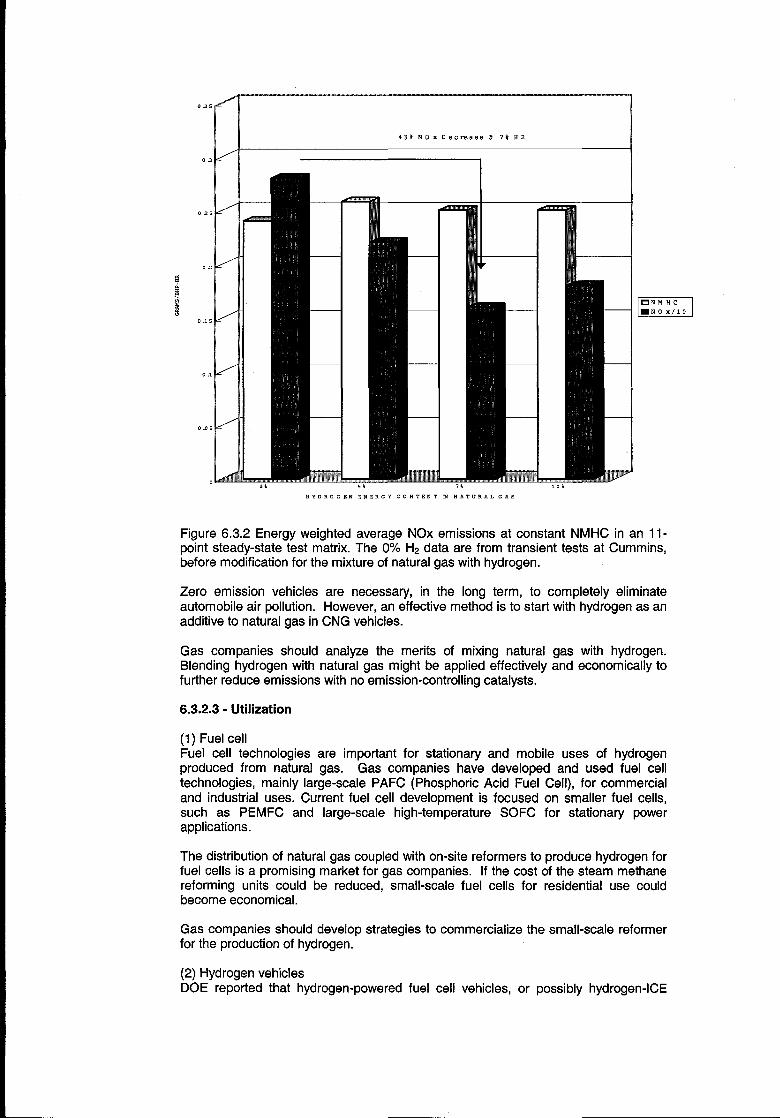
43% NOx Decrease@ 7%H2
I
5% 7*
EzIl
X, DRO. EIJENEFLOYC ON TEN TmNATURALG ,S
Figure 6.3.2 Energy weighted average NOX emissions at constant NMHC in an 11-point steady-state test matrix. The O% Hp data are from transient tests at Cummins,before modification for the mixture of natural gas with hydrogen.
Zero emission vehicles are necessary, in the long term, to completely eliminateautomobile air pollution. However, an effective method is to start with hydrogen as anadditive to natural gas in CNG vehicles.
Gas companies should analyze the merits of mixing natural gas with hydrogen.Blending hydrogen with natural gas might be applied effectively and economically tofurther reduce emissions with no emission-controlling catalysts.
6.3.2.3- Utilization
(1) Fuel cellFuel cell technologies are important for stationary and mobile uses of hydrogenproduced from natural gas. Gas companies have developed and used fuel celltechnologies, mainly large-scale PAFC (Phosphoric Acid Fuel Cell), for commercialand industrial uses. Current fuel cell development is focused on smaller fuel cells,such as PEMFC and large-scale high-temperature SOFC for stationary powerapplications.
The distribution of natural gas coupled with on-site reformers to produce hydrogen forfuel cells is a promising market for gas companies. If the cost of the steam methanereforming units could be reduced, small-scale fuel cells for residential use couldbecome economical.
Gas companies should develop strategies to commercialize the small-scale reformerfor the production of hydrogen.
(2) Hydrogen vehiclesDOE reported that hydrogen-powered fuel cell vehicles, or possibly hydrogen-lCE

hybrid vehicles are the only markets that are projected to be cost-competitive ornearly cost-competitive with fossil fuel (gasoline-powered) vehicles. This economicadvantage is due to the 2.0 to 2.7 times greater efficiency of the FCVS compared tothe ICE, which is greater than the 30% energy loss when converting natural gas tohydrogen. This results in an overall improvement in efficiency of 1.5 to 1.8 times for ahydrogen-lCE hybrid electric vehicle. No other near- or mid-term hydrogenapplication provides these advantages without assuming major increases in the costof fossil fuels [45]. In addition, these clean systems offering major reductions inurban air pollution, and greenhouse gas emissions.
As discussed in 6.2.2, the mid-term application is expected to be in the transportationsector and a cost-effective, geographically dispersed, hydrogen fueling inf restructureshould be developed. Gas companies can penetrate the hydrogen vehicle market bybuilding on the infrastructure for NGV (Natural Gas Vehicles).
Gas companies are reluctant to install hydrogen dispensing stations until hydrogenvehicles are on the road; and the automobile industries will be hesitant to buildvehicles until there are a significant number of refueling stations [45]. Gas companiesshould develop cost-effective and geographically dispersed hydrogen stations byusing the pipeline network and natural gas fueling stations in a transition step to ahydrogen era. Mixtures of natural gas and hydrogen could also be supplied at thesestations.
Fig. 6.3.3 shows a hydrogen station in which natural gas is converted to hydrogenand then supplied to vehicles.
H2 STATDN l?uelCellVti&
Figure 6.3.3 Hydrogen fueling station for fuel cell vehicles
Gas companies should be ready to use their own pipeline network to supply hydrogenfueling stations. These stations could also function locally to add hydrogen intonatural gas at the point of use, as is described in sections 6.2.2.1 and 6.3.2.2.
Companies that enter the energy supply and infrastructure market early will have adistinct advantage over the competition.
6.3,3- Proposal for IGU activity
After exhaustive research and discussion with experts in the field, the mainconclusion that can be drawn is that if there is going to be hydrogen economy, thepath to development will be via natural gas. Gas industries should consider hydrogento be a business opportunity competitive industries such as oil companies plan tomake their business in the field of renewable through the first half of the nextcentury. Gas industries have the advantage in the hydrogen arena at this point.Study Group 2.1 would like to propose the intensification of activity concerning thefollowing items to the IGU:
1

Install a permanent committee or task force to coordinate all knowledge gathered onhydrogen.
Continuously encourage new R&D or coordinate existing R&D among its members onproduction, storage, transportation, and utilization of hydrogen energy with a long-term and broad viewpoint. It should see hydrogen as the promising gaseous fuel forthe second half of the 21 ‘t century, instead of limiting its view to the narrow context ofnatural gas utilization for the production of hydrogen.
Be represented at worldwide academic conferences (e.g. the World Hydrogen EnergyConference, etc.) in the field of hydrogen as an energy carrier, as well as in the fieldof LPG and computer technologies. The IGU should also be among the sponsors ofthese conferences and make funding available for R&D activities. The IGU shouldinclude the subject of hydrogen as an energy carrier in its traditional activity ofrequesting R&D proposals.
CONCLUSION
The IGU posed three questions to this study group, in order to survey the thoughtsand intentions of organizations regarding this subject. The answers may be summarized asfollows:
1. What specific role can hydrogen assume in meeting global energy demand?What will be the most likely captive markets (regional, niche or others)?
Hydrogen can bean excellent or even ideal form of energy to counter the greenhouseeffect and global warming. It can be produced with low C02 emissions from renewable orfrom fossil fuels with C02 sequestration. Its utilization will surely become necessary beforethe latter half of the 21st century when the supplies of fossil fuels, with the exception of coaland super heavy oils (tar sand, etc, ..), are expected to dwindle or become prohibitelyexpensive because heavy environmental taxes.
In the transition period, hydrogen will be used as an energy carrier when and where itwill be cost effective. Government mandates or incentives can ease the transition to cleanfuels in the short term, but hydrogen must ultimately succeed in the marketplace without anydirect government support. However, as governments become more reluctant to bear thecosts of the environmental and public health effects of energy use and as they continue totighten environmental standards and increase energy taxes, hydrogen as an energy carrier islikely to become competitive in not such a distant future, possibly well before the latter half ofthe 21st centuty .
It is unlikely that new long-distance infrastructures will be built for hydrogen in thenear future. Existing natural gas infrastructures, compatible with hydrogen with minormodifications, will be used at first. This will give the present gas (transportation) companies aconsiderable competitive edge over other energy companies in the 21st century.
Because hydrogen can be produced from a wide variety of feedstocks, such as coal,natural gas, biomass and solar energy, it can be produced nearly everywhere on earth.Hydrogen is thus attractive for developing as well as industrialized nations. The productionand use of hydrogen is likely to follow different economics for different regions of the world,depending on whether it is produced using local resources and consumed in the communityor produced on a large scale and exported or traded.
In recent years, significant economic resources have been applied to thedevelopment of fuel cells for automotive applications. The hydrogen-powered fuel cell vehicleis projected by major automotive manufacturers to be cost-competitive in the next decade .This economic advantage is due to the 2.0 to 2.7 times greater efficiency of the fuel cellvehicle compared to the conventional petroleum-fueled internal combustion engine vehicle.This higher efficiency more than overcomes the 25 % energy loss encountered when naturalgas is converted to hydrogen.

Rural areas in industrialized countries without adequate power and gas distributionnetworks and developing countries without dense infrastructures are excellent markets forindependent hydrogen systems that come close to the vision of a hydrogen energy economy,where all energy needs are supplied by renewable resources with little or no environmentalimpact. The system includes the production of hydrogen from renewable resources coupledwith hydrogen storage and use in fuel cells. These markets may become the driving forcesfor the development of small stationary fuel cells and renewable hydrogen systems and thisdevelopment will help reduce the cost of fuel cells for the benefit of the gas industry.
2. After markets have been identified, which [primary energy source and] productionprocesses appear to be the most promising (solar, hydro, nuclear, biomass,wastes) ?
In the first half of the 21st century, non-renewable sources, such as natural gas, arethe most likely resources for hydrogen production. Technologies ranging from small to largecapacities are currently available. It is expected that hydrogen production processes will befurther improved in the future, especially the small capacity processes. Hydrogen productionfrom coal and super heavy oils, whose world reserves are high, is characterized by highinvestment costs and is therefore, likely to be used only for large-scale production. SinceC02 emissions are produced in large quantities during hydrogen production from fossil fuels,sequestration or further utilization of COZ in chemicals may need to be considered. Theenergy industry has started to respond to the challenge with new processes such as thecarbon black plasma process which produces carbon and hydrogen from natural gas, andimproved steam methane reforming processes which provide COZ sequestrationopportunities.
Although possibilities exist for producing hydrogen from non-fossil resources, thereare many problems to be solved. For distributed, renewable-based hydrogen systems,storage and transportation of hydrogen are particularly important and are areas of continuingresearch and development by governments and industry. Other goals and areas forimprovement are:
. Higher efficiency and capacities for hydrogen production from renewable resources● Photovoltaics (PV), electrolysis, etc, . ..)● Reduced cost of renewable-based systemss More systematic collection of biomass and wastes for hydrogen production. Higher confidence of the public in the safety of the use of hydrogen
Hydrogen production from non-fossil fuels on a regional scale is anticipated tobecome cost-competitive during the latter half of the 21st century. However, production withhigh efficiency processes using fossil fuels, especially natural gas, will be necessary muchsooner.
3. What role should IGU take or play?
As the conclusion of this report, it is proposed to the IGU to significantly increase thelevel of its activity on the subject of hydrogen as an energy carrier and to consider thefollowing proposals for action: The IGU should install a permanent committee, or task force,coordinating all knowledge gathered on hydrogen to keep its members updated about thedevelopment of hydrogen technologies and markets.
●The IGU should continuously encourage new R&D or coordinate existing R&Damong its members on production, storage, transportation and utilization of hydrogenenergy with a long-term and broad view oint.
SPIt should see hydrogen as the
promising fuel for the second half of the 21 century, instead of limiting its view to thenarrow context of natural gas utilization for the production of hydrogen.
●The IGU should be represented at international conferences (e.g. the WorldHydrogen Energy Conference, etc, .. .) in the field of hydrogen as an energy carrier,

similarly to what was done by IGU in the field of LPG and computer technologies.The IGU should be among the sponsors of these conferences
●The IGU should make funding available for R&D activities on Hydrogen and includethe subject of hydrogen as an energy carrier in its traditional activity of requestingR&D proposals.
REFERENCES
1- Hydrogen Energy System, Production and Utilization of Hydrogen and Future Aspects. Y.Yurum Ed., NATO ASI Series; Series E: Applied Sciences-vol.295, Kluwer AcademicPublishers, 19952- What really downed the Hindenburg, Popular Science, November 1997.3- Investigation on Safety, Regulations and Acceptability of Hydrogen, Final Report, Euro-Quebec Hydro-Hydrogen Pilot Project, Commission of the European Communities and theGovernment of Quebec, November 1993 and references therein.4- Safety Concept of the Solar Hydrogen Demonstration Plant at Neunburg vorm Wald,Germany. H. Rainer, in Proceedings of the 12th World Hydrogen Energy Conference, 21-25June 1996, J.C. Bolcich and T,N. Veziroglu, Ed., vol. 3, p 1945, 1998.5- International Clean Energy Network Using Hydrogen Conversion (WE-NET), NEDO, 1995Annual Summary Report on Results, p. 39, March 1996.6- Blending of Hydrogen in Natural Gas Distribution Systems. Public Service Electric andGas Co. NTIS Reports CONS-2925-1, 2 and 3, June 1, 1976- April 30, 1978.7- GASTEC report GL/981085/HZR/003B8 -R. Wurster, EIHP Coordination Office, L-B-Systemtechnik GmbH, htttx//hvweb.de9- Hydrogen Power, the commercial future of “the ultimate fuel,” D. Hart,. Financial TimesEnergy Publishing, 1997.10- Grondalen, “Vate framidens energibarare” (Eng. Hydrogen the energy carrier of thefuture), Sweden, 1998. Elforsk rapport 98:19.11 - Ogden & Nitsch and others, 1993 “Solar hydrogen, renewable energy”. Earthscanpublications London and Island Press, Washington D.C.12- Winter and Nitsch, 1998 “Hydrogen as an Energy Carrier.” Springer Verlag.13- Energy in Sweden 1998, NUTEK14- Figures calculated from Snare, Italy natural gas and energy statistical data 1997.15- Energy statistics, NUTEK, Sweden.16- nternational Energy Outlook 19995 Energy Information Administration U.S. GovernmentPrinting Office, @ 1995.17 - Verfondern, 1997, “Considerations on hydrogen as a future energy carrier and itsproduction by nuclear power,” Forschungzentrum Julich, Germany.18- The second report at IPCC. (1995).19 -T. hf. Veziroglu, F. Barbir. (1998). Hydrogen Energy Technologies. Prepared for UNIDO.20- Hart. Hydrogen Power, The commercial future of the ultimate fuel, Financial TimesEnergy Publishing.21 - Heinz G. Klug, Daimler Benz Aerospace Airbus GmbH. (1997) Presentation atHypothe , Grimstad, Norway.22 - Mann, M.K. 1995a. “Technical and economic analyses of hydrogen production viaindirectly heated gasification and pyrolysis,” Proceedings of the 1995 US DOE HydrogenProgram Review, Volume 1, NREIJCP-430-20036-VOI. 1, pp. 205-236.23- Kasalev and Turner A Monolitic Photovoltaic-Photoeletrochemical Device for HydrogenProduction Science vol. 280 April 17, 1998, p. 425-427.24- Gaudernack, Hydrogen status report 1998, IFE, Norway.25 - Amos, W. 1998. “Costs of Storing and Transporting Hydrogen,” Draft, NationalRenewable Energy Laboratory, May.26- Johansson,Kent, Sycon Energikonsult AB “Hydrogen as fuel for turbines and engines,”Malmo, Sweden February 1999.27- Veziroglu, T. Nejat, Babir Frano, “Hydrogen Energy Technologies,” UNIDO - UnitedNations Industrial Development Organization, Vienna, 1998.28 - National Renewable Energy Laboratory (a DOE national laboratory), “AdvancedHydrogen Utilization Technologies,” DOE/GO-l 0095-067, DE 95000272, August 1995.

29- Axby, Fredrik, Sycon Energikonsult AB, “Hydrogen as fuel for fuel cells,” Malmo, SwedenJanuary 1999.30- On pure hydrogen at atmospheric pressure with ZEVCO Mk II. The eficiency at 40% ofnominal power is 57 Y. and at 100% of nominal power the efficiency is Ai’~o.
31- For a Ballard Fuel Cell with an electric power of 205 kW.The efficiency at idle is 60% andat full power 40 Yo. The fuel cell is running on compressed hydrogen gas.32- According to HEW test plant in Hamburg.33- The PAFC have been presumed efficiency over 60% if the fuel cell is developed for purehydrogen as fuel.34- The figures are taken from use of natural gas since MCFC run on only hydrocarbons.35- Science and technology of ceramic fuel cells, N.K A4hh, Elsevier Science 1995.36- If SOFC is coupled with a turbine cycle, efficiency can reach as high as 80?4.. Tom J.George et. al.37 - Sattler, Gunter, Ingenieurkontor Lubeck, Germany, “PEFCS for naval ships andsubmarines...,” Presentation at the Grove seminar in Londonr UK, September 1997.38- Hart, D. 1998. Hydrogen Power, The commercial future of ‘the ultimate fuel,’ FinancialTimes Energy Publishing, London.39 -T. N. Veziroglu, F. Barbir. (1998). Hydrogen Energy Technologies. Prepared for UNIDO40- D. Hutchinson, N. Lucas, D. Hart et al. (1997) Conceptual Design of the Total System.WE-NET Report.41 - F. Barbir, T.N. Veziroglu, and H.J. Plass, Jr. (1990). Environmental Damage Due toFossil Fuel Use, Int. J. Hydrogen Energy, 15, pp. 739-749.42- J. Gretz. (1995). Euro-Quebeck-Hydro-Hydrogen Project. Advanced Technologies ofHydrogen Energy, NTS, 62643- Strategic Plan for DOE HYDROGEN PROGRAM. (1996). p 7, January.44- HYDROGEN PROGRAM Overview. (1995). p.11, February.45- Strategic Planning for the Hydrogen Economy. (1998). National Hydrogen Association.46- K. Morita, O. Kobayashi. (1999). Outlook for Energy Resources and Vehicles. AutomobileTechnologies, Vol. 53, No. 5,9-14.47- The second report at IPCC. (1995).48- J.D. Pottier, Hydrogen Transmission for Future Energy Systems, in Hydrogen EnergySystem, Utilization of Hydrogen and Future Aspects, Y. Yurum (cd.), NATOASI Series E-295,(1995). 181-194, Kluwer Academic Publishers, Dordrecht, The Netherlands.49 -J. Fulton, F. Lynch. (1996). Leveraged Use of Hydrogen in Internal Combustion Engines,Proceedings of the 1lth World Hydrogen Energy Conference, 123-132.


TABLE OF CONTENTS
1- Introduction
2- Gasification-State of Technology
2.1- Gasification Technologies2.2- Coal Gasification2.3- Biomass Gasification2.4- Gasification of Waste Materials2.5- Gasification of Heavy Refinery Residues2.6- Size of Plants2.7- Gas Purification
3- Environmental Aspects of Gasification
3.1- Gaseous Emissions3.2- Liquid Effluents3.3- Solid Effluents
4- Gasification Process Economics
4.1- Gasification Process Economics--Today4.2- impact of Technology Advances4.3- Hydrogen Manufacture
5- Pros and Cons of Gasification
6- Prospects for the Future
6.1- Coal Gasification6.2- Gasification of Refinery Waste6.3- Gasification of Biomass6.4- Waste/Garbage Gasification6.5- Hydrogen
7- Conclusions and Recommendations
6- References
9- Acronyms
Appendix A: Gasification Plant Database

This report has been prepared for the International Gas Union by
Dr. Wolfgang Seifert, GermanyChairman, WOC2 Manufactured Gas Study Group on Gasification
Dr. Hannes Kunert, GermanySecretary of the Study Group
Dr. Luigi Carvani, Italy
Mr. Yukio Ogawa, Japan
Mr. Erik Polman, The Netherlands
Mr. Rainer Reimert, Germany
Mr. Lars Sjunnesson, Sweden
Mr. Gary Stiegel, United States
Mr. Peter Verstegen, Netherlands

I - Introduction
For many years, the manufacture of gas from coal was the basis of the entire gasbusiness. Three types of production shared the market: coke oven gas, town gas fromblowing and steaming of coal, and dedicated town gas coal gasification. With the introductionof natural gas into the fuel market, the latter two techniques nearly vanished. In the 1970’s,uncertainty about price and accessibility of crude oil and natural gas stimulated a revival ofcoal gasification technology. Hence, for the past three decades, IGU Committee B, and inrecent years WOC2, has monitored the research, development, and commercialization offossil fuel gasification technologies to produce gas for distribution in the public grid, withparticular emphasis on coal as the feedstock.
In the triennial reports of Committee B, overviews were given on the contemporarystateof-the-art of gasification. These included descriptions of research and developmentactivities and demonstration and commercialization projects. The reports were accompaniedby statistics on coal reserves, production, and consumption. As the advantages of price andaccessibility for crude oil and natural gas grew, the gas industry increasingly lost interest inthe gasification of coal. This loss of interest has been further compounded by the abundantamount of unconventional reserves of natural gas, extending the reserves’ lifetime to wellover a hundred years. Moreover, the unattractive economics of gas produced from coal whencompared to natural gas, and the common goal to globally reduce emissions of C02, havecurtailed activities in most countries producing synthetic gas for distribution. Realizing this in1998, the Technical Committee of the IGU decided to change the focus of WOC2 and transferthe subject of manufactured gas to a subtopic under WOCI beginning in 2000.
Though many gas industry participants in the IGU have ended their involvement inmanufactured gas, active gasification development continues, especially outside the gasindustry. Instead of manufacturing gas for public service, current producers generally havetwo goals: to produce gas for internal use or to utilize unconventional/low-cost fuel. Internaluses of synthesis gas produced from coal or residual oil include applications in combined-cycle power generation and chemical synthesis. Municipal wastes, biomass, and hazardouschemicals are examples of unconventional fuels that are currently the subject of intenseinvestigation by the gasification community. In the gasification process, such materials aretransformed into environmentally benign products.
Electric power companies, petroleum refiners, and municipal authorities are the majoroperators of today’s gasification plants. However, the high capital investment of these plantsdictates the use of low-cost (opportunity feedstocks) to make the plants economically viable.
In countries where waste disposal is highly penalized (e.g., in Germany), operatorswith a need for clean gas often use the gate fee (or tipping fee) for imported waste material tomake the economics of gasification favorable. in such cases, manufactured gas wouldreplace either natural gas or light fuel oil. The situation is similar to that in countries where atax is put on the release of C02, as in Sweden. Such fees enhance the use of renewablesuch as biomass for gasification. In the U.S., growing environmental concerns on the use ofcoal combined with low natural gas prices have reduced coal’s share of power generation.The U.S. government is sponsoring most of the gasification research with the goal of makinggasification the cornerstone technology for energy plants in the 21 ‘t Century. Gasification isattractive because of its potential to achieve near-zero emissions and the possibility ofconcentrating and removing C02 while using coal and other abundant low-cost solid andliquid feedstocks. Research and development sponsored by the U.S. Department of Energy isaimed at making it possible early in the 21st Century to make the cost and environmentalperformance of gasification competitive with that of natural gas.
In the refining industry, the use of residual oil and petroleum coke gasification forproducing synthesis gas for a combined-cycle power system, is a convenient way of utilizingan intermediate process stream that is costly to upgrade. Gasification of petroleum residuehas already been employed in refineries for many decades. As more environmentalrestrictions are placed on the use of heavy fuel oil, and as heavier crudes have to beexploited, gasification will become even more common in refineries.

Although the role of manufactured gas in the gas industry has sharply diminished inmost countries over recent decades, there are still places where manufactured gas will have areasonable future. China is one example because of the long distances between consumersand the sources of natural gas. Moreover, engineering firms, technology developers, andequipment manufacturers are actively developing and commercializing gasificationtechnologies.
With the diminishing interest of the gas industry and the reorganization of the IGUCommittee, this will be the final in a series of reports on manufactured gas prepared by theManufactured Gas Committee, WOC2. This report was prepared to provide a well-documented basis for individuals and organizations interested in manufactured gas. Thereport provides a foundation on gasification-based technologies that may be useful to futurecommittee members interested in taking up the challenge of manufacturing gas. Since priorreports have documented the different stages of development of gasification, this reportfocuses on an overview of gas manufacturing. The most relevant existing processes andongoing developments form the main part of the report. References to literature are providedto give the reader a starting point for seeking further information.
In contrast to the preparation of previous reports, detailed process descriptions areomitted. Such descriptions can be found in the prior reports and in the literature. With thedevelopment, application, and commercialization of gasification occurring outside the gasindustry, this report emphasizes new feedstocks and new uses for the gas product.
2- Gasification-State of Technology
2.1- introduction to Gasification
Gasification is the process of converting a carbon-based feedstock into a gaseousfuel. Compared to pyrolysis or coking, gasification requires a gasifying medium, i.e., anoxidant and steam, to effect the desired reactions. In general, gasification produces no liquidby-product. In most cases today, the products from gasification are either synthesis gas--amixture containing hydrogen and carbon monoxide as the desired components--or fuel gasthat also contains methane and possibly some higher hydrocarbons.
Most of today=s gasification processes operate at high temperatures, approximately1400 ‘C, and at elevated pressures, up to 8 MPa, in the presence of oxygen, or in somecases, air. The gasification process comprises the following steps:
Atomization of fuel by a burnerVaporization and devolatilization of liquidPartial oxidation of the vaporous hydrocarbons with air or pure oxygenReforming of the hydrocarbons with steamGasification of any intermediate coke with steamShift conversion of the carbon monoxide with steam
The primary chemical reactions occurring in the gasification process are illustrated inFigure 1 for coal but are equally applicable to other carbon-containing feedstocks. Whenhigher hydrocarbons are cracked, soot might also be formed.
Partial oxidation of the fuel provides the energy necessary to maintain the high operatingtemperature for devolatilization and/or vaporization of the feedstock, and for driving theendothermic gasification and reforming reactions. The gasification temperature is controlledby the addition of steam. Depending upon the gasifier type and operating conditions, thecomposition of the raw synthesis gas is typically in the ranges shown in Figure 1. The amountof nitrogen contained in the product is dependent on the purity of the oxygen feed. The rawgases from high-temperature gasification processes usually contain carbon dioxide and watervapor, and smaller quantities of hydrogen sulfide, methane, ammonia, and particulate matter.The raw synthesis gas is subsequently cleaned of impurities to meet the requirements ofdownstream process units. Once cleaned, the synthesis gas can be used to produceelectricity, steam, fuels, chemicals, hydrogen, and substitute natural gas.

Gasification with Oxygenc + ’12O* co
Combustion with OxygenC+02 C02
Gasification with Carbon Dioxidec + co~ 2C0
Gasification with SteamC+HZO _CO+Hz
Gasification with Hydrogen
c + 2H2~ CH4
Water-Gas ShiftCO + HZO Hz + C02
vMethana tonCO+ 3H* CH4 + HZO
Gasifier GasComposition
(Vol %)
H2 25-30co 30-60C02 5-15H20 2-30CH4 O-5
H2S 0.2-1Cos 0-0.1N2 0.5-4Ar 0.2-1
NH3 + HCN 0-0.3
Ash/Slag/PM
Figure 1: Gasification Process Overview
An important feature of gasification is the ability to convert any carbon-containingfeedstock into gaseous products. Figure 2 provides a summary of the current and plannedgasification capacity by primary feedstock. As shown, nearly 35,000 MWth of synthesis gasare produced today from coal or petroleum. Coal and petroleum are by far the dominantgasifier feedstocks, accounting for nearly 80% of total capacity, whereas natural gas,petroleum coke, and biomass constitute less than 20% of total capacity.
Almost all planned capacity additions will be based on coal and petroleum. Most ofthe current coal usage is attributed to SASOL in South Africa and the Dakota GasificationPlant in the U.S. Gasification units based on liquid feedstocks are often integrated intorefineries and petrochemical plants. These units produce either hydrogen for the refiner’shydrogenation processes or synthesis gas for the manufacture of chemicals. In refineryapplications, the plants produce hydrogen for various hydrogenation processes frompetroleum coke, residue, and other oil-bearing waste streams. These feedstocks are the so-called bottom of the barrel, and are not easily transformed into naphtha or’diesel oil. In thefuture, gasification will offer refiners an alternative to coking for processing residue, therebypromoting a “zero residue” refinery.
Figure 3 provides the breakdown of how the synthesis gas capacity is distributedamong applications. Chemical production is by far the leading consumer of synthesis ‘gastoday; however, the amount used for power generation is expected to approach this in thenext five years. The remaining synthesis gas is used for the production of transportation fuels(SASOL) and synthetic natural gas (Dakota Gasification Co.)

8
25,000
20,000
15,000
10,000
5,000
0Coal Petroleum Gaa Petcoke Biomaaa
Figure 2: Gasification Capacity by Primary Feedstock
s
25,000H Planned
20,000- H Real
5,000- —
Chemicals Power F-TLiquids Gaseous Fuels
Figure 3: Gasification Capacity by End Use Application
Coal gasification has been the fundamental technology for the production of synthesis gas,town gas, chemicals, and fuels. With increased availability of cheap natural gas and oilbeginning in the mid sixties and continuing to date, worldwide development of coalgasification has been slowed. However, gasification projects are developing throughout theworld.
Figure 4 shows the actual and projected growth in capacity beginning in 1970 andcontinuing through 2003. The capacity increases in 1977 and 1982 are primarily due to thestartup of Sasol II and Ill. Over 10,000 MWth capacity is planned to be added worldwide ontothe existing 38,000 MWth capacity within the next 5 years. The current and expectedincreases are mainly due to refinery applications. Most of the current gasification capacityexists in Western Europe, Asia and Australia, Africa and the Middle East, and North America.As shown in Figure 5, Western Europe, Asia and Australia, and North America are theregions where new capacity is expected to be added during the next five years.
2.2- Coal Gasification
Since the advent of coal gasification in the 19th century, a number of differentprocesses have been developed. These processes may be classified as 1) continuous,batch or cyclic; 2) autothermal or allothermal; 3) concurrent, counter-current, orfluidized-bed; or 4) atmospheric or pressurized.

60,000HPlanned
50,000
40,000
30,000
20,000
10,000
0
1970 1973 1976 1979 1982 1985 1988 1991 1994 1997 2000 2003
Figure 4: Cumulative Worldwide Gasification Capacity in MWth Synthesis Gas Outputl
25,000 -❑ Planned
20,000- HReal
15,000
10,000
5,000
0Western Asia & Africa & North Eastern c&sEurope Australia Middle America Europe & America
East FSU
Figure 5: Gasification Capacity by Geographic Region
Today, only continuous processes operating at high pressures are being considered.There are three basic gasification technologies, each having its own distinguishing features:1) fixed-bed gasification, 2) fluidized-bed gasification, and 3) entrained-bed gasification. Foreach of these technologies, there are several processes and applications.
Figure 6 presents the capacity of synthesis gas produced by several differenttechnologies for the three gasifier types discussed above. Until recently, the Lurgi dry ashfeed gasifier dominated the market, with coal being the primary feedstock. The Texacoslagging gasifier capacity now exceeds that of Lurgi and is expected to command the bulk offuture capacity additions.
Fixed-Bed GasificationThe best known fixed-bed gasification process was developed in the thirties by Lurgi in Germany,where town gas was produced by the gasification of brown coal (lignite). This is a pressurized countercurrent-flow gasification process in which the feedstock is fed at the top of the gasifier through a
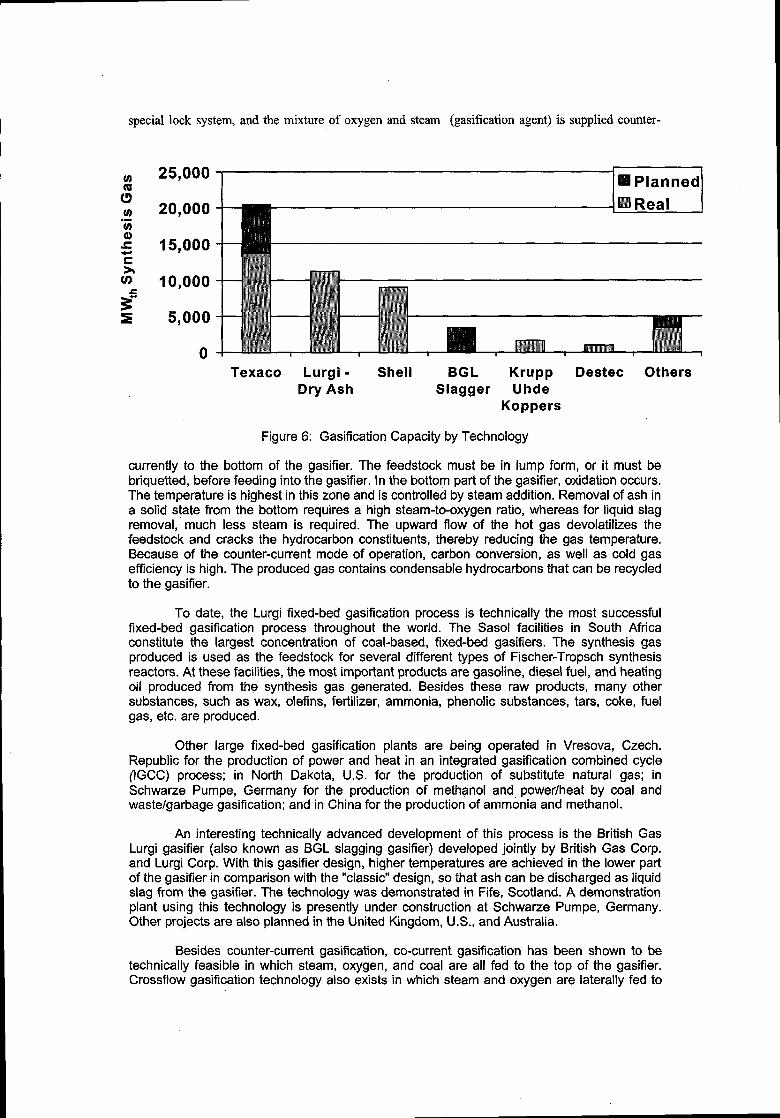
special lock system, and the mixture of oxygen and steam (gasification agent) is supplied counter-
25,000
20,000
15,000
10,000
5,000
0Texaco Lurgi - Shell BGL Krupp Destec Others
Dry Ash Slagger UhdeKoppers
Figure 6: Gasification Capacity by Technology
currently to the bottom of the gasifier. The feedstock must be in lump form, or it must bebriquette, before feeding into the gasifier. In the bottom part of the gasifier, oxidation occurs.The temperature is highest in this zone and is controlled by steam addition. Removal of ash ina solid state from the bottom requires a high steam-to-oxygen ratio, whereas for liquid slagremoval, much less steam is required. The upward flow of the hot gas devolatilizes thefeedstock and cracks the hydrocarbon constituents, thereby reducing the gas temperature.Because of the counter-current mode of operation, carbon conversion, as well as cold gasefficiency is high. The produced gas contains condensable hydrocarbons that can be recycledto the gasifier.
To date, the Lurgi fixed-bed gasification process is technically the most successfulfixed-bed gasification process throughout the world. The Sasol facilities in South Africaconstitute the largest concentration of coal-based, fixed-bed gasifiers. The synthesis gasproduced is used as the feedstock for several different types of Fischer-Tropsch synthesisreactors. At these facilities, the most important products are gasoline, diesel fuel, and heatingoil produced from the synthesis gas generated. Besides these raw products, many othersubstances, such as wax, olefins, fetillizer, ammonia, phenolic substances, tars, coke, fuelgas, etc. are produced.
Other large fixed-bed gasification plants are being operated in Vresova, Czech.Republic for the production of power and heat in an integrated gasification combined cycle(lGCC) process; in North Dakota, U.S. for the production of substitute natural gas; inSchwarze Pumpe, Germany for the production of methanol and, power/heat by coal andwaste/garbage gasification; and in China for the production of ammonia and methanol.
An interesting technically advanced development of this process is the British GasLurgi gasifier (also known as BGL slagging gasifier) developed jointly by British Gas Corp.and Lurgi Corp. With this gasifier design, higher temperatures are achieved in the lower partof the gasifier in comparison with the “classic” design, so that ash can be discharged as liquidslag from the gasifier. The technology was demonstrated in Fife, Scotland. A demonstrationplant using this technology is presently under construction at Schwarze Pumpe, Germany.Other projects are also planned in the United Kingdom, U.S., and Australia.
Besides counter-current gasification, co-current gasification has been shown to betechnically feasible in which steam, oxygen, and coal are all fed to the top of the gasifier.Crossftow gasification technology also exists in which steam and oxygen are laterally fed to

the gasifier. To date, these latter fixed-bed gasification processes have only been tested insmall plants and have been developed primarily for the gasification of biomass.
Fluidized-Bed GasificationFluidized-bed gasification was developed commercially in Germany during the
1920’s. In later years, this process has been the basis for the production of synthesis gas inthe chemical industry. The process has continued as a base technology for coal, and in thelast 15 years, has broadened its application to the gasification of biomass and wastematerials. As a fluidized bed behaves somewhat similarly to a continuously stirred tankreactor, carbon can be almost completely converted. Additional oxygen supply in thefreeboard region reduces the hydrocarbon content of the product gas to nearly any desiredlevel. The circulating fluidized bed is a variation of the fluidized bed. It exhibits some newfeatures with respect to specific throughput and reduction of hydrocarbon content.
Advanced fluidized-bed coal gasification technologies are represented by the high-temperature Winkler gasification (HTW) process, Institute of Gas Technology (IGT) U-Gastechnology, the Kellogg-Rust-Westinghouse (KRW) process, and the Asea Brown Boveri –Combustion Engineering (ABB-CE) process. The fluidized-bed gasifier technologies haverecently been extended to the processing of biomass and waste materials, including refusederived fuel (RDF). IGT’s Renugas process is a modification of the UGas coal gasificationprocess.
Some important demonstration plants using fluidized-bed gasification technologiesare in operation at the following locations: 1) Berrenrath, Germany--HTW gasifieL and 2)Reno, Nevada, U.S.--KRW fluidized-bed gasifier. Additional details about these projects canbe found in Appendix A.
Entrained-Bed GasificationA characteristic attribute of the entrained-bed gasifier is the co-current feeding of
steam, oxygen, and the carbon-based feedstocks. Here, the coal is pulverized and fed to thegasifier, either dry or in a water slurry, where it reacts at short residence times in the presenceof oxygen and steam at temperatures above 1400 ‘C. Excellent carbon conversion isachieved, and the synthesis gas contains only a small amount of methane and no tars or oils.
The most important commercial entrained-bed gasification processes are the Texaco,Shell, Destec, and Prenflo processes. In the Texaco and Destec processes, coal or othercarbon-based feedstock is fed to the reactor in a water suspension (“slurry”). Destec differsfrom Texaco in that the former has two stages of feed instead of one and is concurrent upflowrather than concurrent downflow. The Shell and the Prenflo processes feed dry coal to thegasifier with the former operating in concurrent downflow mode while the latter operates in aconcurrent upflow mode.
Large demonstration plants are in operation at the following locations: 1) Puertollano,Spain - Prenflo; 2) Buggenum, Netherlands - Shell; 3) Tampa, Florida, U.S. - Texaco; and 4)West Terre Haute, Indiana, U.S. - Destec. Additional details about these projects and othersare provided in Appendix A.
In the 1980s and 1990s, the Chinese petroleum indust~ licensed Texaco and Shellgasifiers for the production of hydrogen from petroleum coke and heavy residues. Thechemical and fertilizer industries also licensed Texaco gasifiers for ammonia and methanolsynthesis plants to replace some of the smaller ammonia plants that use the water gasprocess to supply synthesis gas. China is expected to build more gasifiers in the next twodecades because of its coal-based economy.
Integrated Gasification Combined CycleCurrently, about 40% of worldwide electricity generation is produced by means of the
“classic” pulverized coal power station process using boilers comb!ned with a steam turb!necycle. There are also many commercial plants in which natural gas and oil are used to powercombustion turbines, producing steam and power. Today, natural gas and crude oil arerelatively cheap; therefore, the use of gasification as an alternative for power and heat

generation must compete with natural gas and oil. This is also true for the production ofsynthesis gas for chemical syntheses, such as methanol and ammonia.
Gasification for generating power, heat, fuels, and chemicals has achieved technicalsuccess in specific situations in the U.S., Europe, and Africa. To be economically competitivewith natural gas and oil in today’s market, these technologies must process feedstocks thatare cheaper than coal and produce products that are more valuable than electricity.Possibilities exist today to introduce the IGCC process in some countries at a commercialscale. Such plants must operate at high availability and high et%ciency, and be costcompetitive to achieve commercial acceptance. Some examples are gasification incombination with gas turbines, steam turbines, and the use of heat at the generating locationsuch as in a large industrial area. The availability of natural gas for cheap power generationhas resulted in a surplus of capacity; therefore, some anticipated applications of IGCCprocesses have not materialized to date.
Combined-cycle processes utilizing gasification are basically suitable for processingother carbon-containing substances besides coal, such as residues with high-sulfur contentfrom refineries, various waste materials, petroleum coke, etc. It is possible to utilize theenergy content of a variety of feedstocks to produce electricity, heat, and other high valuecoproducts, thus making the cost of electricity competitive with that from natural gascombined-cycle plants.
The environmental superiority of IGCC processes due to low emissions of SO., NO,,and unburned hydrocarbons is indisputable. Another environmental advantage is thereduction of carbon dioxide emissions in comparison to combustion, due to gasification’shigher thermal efficiency. This helps to lessen the greenhouse effect.
Other Processes[n underground coal gasification, it is technically possible to make fuel gases while
avoiding the many disadvantages of traditional mining. The process involves blowing air oroxygen and steam through a preheated underground coal seam. A mixture of hydrogen andcarbon monoxide (and nitrogen if air is used) k produced, similar to the gas produced bymore conventional means. The first technical trials were made using this approach in thethirties and fifties in the former USSR and in the United Kingdom. A successful demonstrationof the technique was also carried out in the U.S. in relatively shallow seams about 250 mdeep. In the U.S., greater quantities of coal are found at this depth than in other countries.
Although underground gasification has been demonstrated at shallow depths, theultimate goal is to achieve successful gasification at greater depths. Remaining taserves inEurope tend to be much deeper, and the European Commission has funded trials in Spain atdepths up to 500-600 m. From these trials, it will be possible to confidently extrapolate thetechniques to depths of 1000 m and more to access the deeper British and Belgian coals.
In Japan, a Syear program was initiated in 1996 for the development of a new coalhydrogasification process, i.e., the ARCH process. Because Japan’s gas supply is becomingincreasingly dependent on imported liquefied natural gas, it is considered important todevelop coal hydrogasification technology to secure a stable supply of low cost substitutenatural gas (SNG) from coal. The program, funded by the Japanese government, includesindustrial partners such as Tokyo Gas, Osaka Gas, Toho Gas, Mitsubishi Heavy Industry, andBritish Gas. The ARCH process uses an entrained, two-stage gasitler with recycled flow. Inthis process, hydrogen and pulverized coal are fed to the gasifier operating at high-temperature (800-1200 “C) and high-pressure (3.07.0 MPa) conditions.
As a result of the chemical reactions in the gasifier, SNG and liquid hydrocarbons canbe produced very efficiently. Three operational modes in which the SNG yield, thermalefficiency, and liquid hydrocarbon yield are maximized can be set in the process. Followingfundamental development of the technology, pilot demonstration plants are expected to belaunched.

Gasification of coal at high temperatures with large specific outputs per generator in aslag or liquid metal bath has been tested intensively. Such processes have been proven at acommercial scale. An example is the KHD process for coal gasification with oxygen in a liquidiron bath. Utilization of such processes at an industrial scale has not been successful in thepast.
2.3- Biomass Gasification
For this report, three biomass sources can be distinguished, i.e., biomass residue,biomass energy crops, and sewage sludge. Although there are many technologies for theconversion of biomass to useful products, the discussion below focuses only on theapplication of gasification.
Although the total energy potential of biomass worldwide (crop residues, forestresidues, biomass plantations) is very high (about 300 EJ per year), their use for energyproduction is modest. The costs of recovery, transportation and storage can be too high, orthe residues can be more valuable if used for other applications, such as building materials,paper manufacturing, and animal fodder. The following discussion highlights some importantaspects of the use of biomass for energy production.
In Europe, wood as a household fuel constitutes almost 75% of the biomassconsumed. In contrast, wood use in the industrial and power generation sectors is onlymodest. The use of wood and other organic matter for district heating is only important in afew countries, e.g., Denmark and Finland. Currently, wood, wood residues, straw, and otheragricultural residues are under-utilized as is also the potential for energy crops, mainlybecause of the high cost of conversion. Despite this, biomass makes a contribution to theEuropean energy supply as shown below
. Below 10% in the Netherlands, Belgium, Luxembourg, Germany, United Kingdom,and Italy.. From 10 to 20’%.in Denmark, and Spain.. From 20 to 30°A in Greece, Poctugal, and France.. From 30 to 400/. in Austria and Ireland.● Above 400/. in Finland and Sweden.
It is only high in those countries where biomass utilization is promoted by governmentregulations. The use of biomass can be considered an environmentally and climaticallysound option for energy production because it is a renewable resource and a means ofclosing the carbon cycle.
Some important biomass gasification projects are listed below more details of theseand other biomass gasification projects can be found in Appendix A.
An important challenge that must be overcome for the commercialization of biomassgasification is the removal of tars and other contaminants from the raw fuel gas. The efficientand cost effective removal of these materials is necessary for employing high efficiency gasturbines for power generation. Numerous technologies for tar removal have been tested, suchas water scrubbing, electrostatic precipitation, catalytic cracking, thermal cracking, andfiltration. However, only catal~lc cracking appears to be reliable for large-scale fluidized-bedand small-scale downdraft gasifiers. Hot gas cleaning technologies using ceramic filtershave also been the subject of investigations for particulate and alkali removal. Fundamentalknowledge of the formation of tars and nitrogen compounds, the characteristics of the ash,and the fate of alkali metals is lacking for biomass feedstocks.
A major analysis of the role of energy technologies in reducing or offsettinggreenhouse gas emissions by 2010 recognized three carbon-neutral, biomass-derivedcontributions: cellulose-derived ethanol, combined heat and power IGCC units in the forestindustries, and biomass cofiring in utility coal-fired boilers. The gasification of biomass couldsignificantly contribute to the energy supply in the future if environmental protection is the

Q!m!Y
Germanyrejects
Swedenbiomass
Swedenchips
Finland
Us.
Location
Rtidersdorf
(near Berlin)
Varo
Varnamo
Wilen/Kurkelaother
Burlington, VT.
Technology
Lurgi Circulating
Fluidized-Bed Gasifier
Kvaerner Circulating
Fluidized-Bed
Ahlstrom Pressurized
Fluidized IGCC
Bioneer-Counter-
Current Fixed-Bed Gasifier
Battelle Process
Feedstock
Biomass, wood, and
Wood waste and
Wood waste and
Biomass, wood, and
organic substances
Wood and biomass
driver. It is difficult to predict the level of this contribution. For the European Union, thechallenge of biomass development must be considered at the regional level. Appropriatemeasures, consistent with existing policy in other sectors, would give a clearer outlook for themid term and help define the most effective forms of intervention.
Commercial biomass gasifiers are already in use in the U.S. to generate heat andsteam. Current development activities are focused on producing electricity and integratinggasification with various cleanup systems to ensure a high-quality and reliable gas product.The U.S. program has a dual-pathway strategy involving both low and medium heating valuegas production. IGT’s high-pressure Renugas system is capable of generating either low ormedium heating value gas, depending upon whether it is air- or oxygen-blown.
The low-pressure strategy in the U.S. is based around two develo ers of air blown!systems producing low heating value gas of approximately 15-20 MJ/Nm . The Renugas
project, operating at 1-2 MPa using bagasse as feed, was located at the HC&S sugar mill atPia, Maui, Hawaii (45-90 t per day throughput). The plant was operated by Westinghouse totest its high-temperature ceramic filters in a hot-gas cleanup unit. Operation of the plant hasbeen terminated primarily due to difficulties with feeding the bagasse to the gasifier
By using alternative feedstocks, the value of gasification technologies is enhancedcompared with the present worldwide predominance of Iandfilling and/or combustion. Thehigh environmental standards administered in Germany, and other countries at federal andstate levels limiting the amounts of gaseous emissions, wastewater, and other wastes, arehaving a significant impact on industry. With the implementation of the new recyclingeconomy law in Germany, recycling is being vigorously promoted. Positive impacts on thedevelopment of gasification have also resulted from new regulation of municipal solid waste(TASI), and from the special collecting system for used household packaging materials (DSDsystem) in Germany.
The Battelle gasification system, an indirect gasifier, is located in Vermont. Theproduct gas from this 200 t per day unit is co-fired in a 50 MWe traveling wood-fired grateboiler at the Burlington Electric Joseph C. McNeil Station. The initial gasifier power output willbe 8 MWe. The second phase will demonstrate the use of low heating value product gas in agas turbine of about 8 MWe capacity, and will continue to produce about 4 MWe by means ofco-firing with wood in the boiler, resulting in a total of 12 MWe. The proposed Minnesota Agri-Power Project, a 75 MWe integrated gasification combined-cycle plant using alfalfa stems, willalso employ the IGT Renugas gasifier.

Today in the U.S., more than 70’%. of the electric power generated from biomass isgenerated by recovering process heat. Wood-fired systems account for 88Y0,,landfill gases,8%, agricultural waste, 3%, and anaerobic digestion, 1%. There are nearly 1000 wood-firedplants in the U.S., typically ranging from 10-25 MWe. Only a third of these plants offerelectricity for sale. The rest are owned and operated by the paper and wood productsindustries for their own use. Most of today’s biomass grid-connected power installations arethe smaller scale independent power and co-generation systems. To date, utilities have beeninvolved in only a handful of dedicated wood-fired plants in the 40-50 MWe size range, and insome co-firing of wood and municipal solid waste in conventional coal-fired plants.
In the U.S., the electric power industry, and especially the biomass power industry, isin a period of great uncertainty. Deregulation, state non-fossil mandates, recent FederalEnergy Regulatory Commission (FERC) rulings, expiration of Public Utility Regulatory PoliciesAct of 1978 (PURPA) contracts, potential loss of Energy Policy Act (EPACT) tax credits, andpolicy changes in the 1995 Farm Bill all contribute to this uncertainty. Simultaneously, manyutilities are experiencing pressure to provide waste or residue disposal service for industrialand agricultural customers.
There appear to be niches wherein biomass power systems and biomass gasificationare either competitive or desirable. The success of projects targeted at these niches isdependent upon numerous factors. Among the most important of these are a reliablefeedstock supply, cost, and reliable advanced technology. In the U.S., most of the biomassand black liquor cogeneration capacity will be retired or replaced over the next 20 years.IGCC offers an alternative for steam and power generation while being able to recoverchemicals. In 1994, 1.2 EJ of black liquor was consumed by the U.S. pulp and paperindustry.
2.4- Gasification of Waste Materials
The utilization of waste/garbage by means of gasification technologies is a relativelynew technical development in Europe, especially in Germany. The incorporation ofgasification preceding incineration to improve its performance and the recovery of the cleansynthesis gas are two approaches being developed. During the last 10 years in Germany,efforts have been strengthened to further develop this technology. Today, there are wastegasification plants in Italy, the Netherlands, and the United Kingdom and, at a smaller scale,in Sweden. At the same time, encouragement to use waste/garbage has come fromexperience with various gasification processes. Gasification of coal and oil has beenextended to other feedstocks such as industrial and household garbage, sewage sludge,biomass, and waste plastics, alone or mixed with other fuels.
The effect of European environmental legislation on future development ofgasification and alternative utilization technologies for garbage/waste processing is stillunclear. Discussions are underway regarding standards for the quality of waste-gas fromgarbage incineration plants, co-firing processes in power stations, utilization of substitute fuelsin the cement industry, and for other thermal processes. Gasification at high pressure witheffective purification offers an option for realizing low pollutant emissions and complying withecological demands.
If higher demands are placed on reducing emissions from combustion processes, thechances for deploying gasification are substantially improved because of its economical andenvironmental superiority to combustion processes. This is generally valid in developedindustrial countries in Europe, Canada, Japan, and the U.S., as well as in developing regionswith large populations such as Mexico, Brazil, China, India, etc.
If the advantages of gasification are given more consideration and suitableenvironmental regulations are in force, then it should be possible to successfully operatecommercial installations for gasifying garbage and waste. For greater industrial use ofgasification technology for waste/garbage utilization, an effective collection system for thewaste materials and the receipt of a tipping fee are essential. An example of this is the world’slargest waste gasification facility located at Schwarze Pumpe, Germany, where up to 220 kt/d

of solid waste materials is processed in a fixed-bed gasifier and up to 50 kt/d of oils in anentrained-bed gasifier. Synthesis gas is produced for the manufacture of methanol and to fuela gas turbine. Currently, a BGL slagging gasifier is under construction at Schwarze Pumpe incollaboration with the Lurgi Corporation for processing waste materials. Based on the successof a demonstration scheduled from 1999 to 2001, efforts will be undertaken to market theprocess in Europe and Asia.
Municipal solid waste (MSW) gasification is also progressing in other countries, suchas the U.S. Global Energy, Inc., the exclusive Iicensor of the BGL slagging gasifier for BritishGas Corporation, is exploring the possibilities of constructing a 400 MWe IGCC plant inKentucky. This facility will co-feed coal and briquettes formed from municipal waste andsewage sludge. The huge tipping fee for sewage sludge drives the economics for the plant. Ithas also been reported that consideration is being given to the coproduction of electricity andFischer-Tropsch products. Producing such value-added products have been shown tosubstantially improve process economics. Other projects sponsored by the U.S. Departmentof Energy are also focusing on processing MSW and co-feeding coal with alternativefeedstocks to various gasification processes. Additionally, an atmospheric fluidized-bedgasification plant has been operating commercially in Chianti, Italy, for the gasification ofrefuse derived fuels (RDF) since 1992. Circulating fluid ized-bed technology is preferred in theNetherlands, where one pilot plant is in operation and another is planned. Global Energy Inc.also plans a larger project in England.
Besides gasification, there are also combined processes in which a pyrolyzer stageprecedes a gasification stage. Technical progress has gone as far as construction ofdemonstration plants, such as the Thermoselect Process and the Noell process. Acommercial Thermoselect plant is under construction at Karlsruhe, Germany, withcommissioning planned in 1999.
2.5- Gasification of Heavy Refinery Residues
At a time when refinery heavy ends could become a great problem, the use ofgasification represents a viable solution to a potential over-abundance of heavy fuel oil.Gasification is the only technology that can convert low-value, undesirable refinery streams toa fuel, providing an alternative to natural gas and oil distillates for use in modern combustionturbines. Recently, thanks to extensive financial and technical support from several majorvendors, research organizations, and governments, the gasification of heavy refinery residuesfor power generation has become a technical reality. Gasification is best applied to high-sulfur, high-metal vacuum residues in combination with concentrating technologies such assolvent extraction or visbreaking. The economics of gasification are likely to improve as thedemand for high-sulfur fuel oil declines.
In refineries, hydrogen can be extracted from the syngas and used for hydrotreating,with the remaining syngas being used to make power and steam. In the future, refinerieshaving an over abundance of heavy residues will likely compare the economics of gasificationto that of coking when making investment decisions for processing heavy feedstocks. Cokingmay ultimately be displaced by gasification. Electric power production can be accomplishedusing the well-established gas turbine combined-cycle process, commonly applied in refinerysystems using natural gas or refinery gas. The combined-cycle is much more efficient thanthe conventional steam cycle. Minor modifications for gas turbine combustion and fuelhandling systems have been developed and tested to accommodate synthesis gas and arenow used commercially by several manufacturers. The modifications are necessary becauseof the low heating value of the fuel gas, approximately 1/8 to 1/3 of the heating value ofnatural gas. Though most current interest in gasification today is directed at combined-cyclepower generation, a gasification market based on the production of chemicals and premiumfuels is also under development.
Several major refinery gasification projects for heavy oil and petroleum cokegasification are listed below. Additional details are given in Appendix A.

Name, Location GasifierStart-U~
Feedstock
Visbreaker Tar
Product QQw.Y
115 MWeShell, Pernis
Netherlands
API Energia,
Falconara, Italy
ISAB Energy
Priolo Gallolo,Sicily
Sarlux, Sarroch,
Sardinia
Shell1998
Hydrogen,
Electricity
ElectricityTexaco1999
High-Sulfur
Residue
High-Sulfur
Asphalt
280 MWe
Texaco1999
Electricity, 512 MWe
Hydrogen,Steam
Texaco2000
High-Sulfur
Visbreaker Tar
Hydrogen, 550 MWe
Steam,Electricity
Exxon, Singapore Texaco2000
Residual Oil Hydrogen, 160 MWe
coElectricity
Singapore Syngas,
Singapore
Texaco2000
Residual Oil Hydrogen, 75 MWe
coElectricity
40 MWe
240 MWe
100 MWe
240 MWe
365 MWe
536 MWe
Texaco, El Dorado,
Kansas, U.S.
Star, Delaware City,
Us.
Farmland Industries
Coffeyville, Kansas
Exxon, Baytown
Texas, U.S.
Total - EdF
Gonfreville, France
Leuna
Germany
Texaco1996
Petroleum
Coke
Petroleum
Coke
Petroleum
Coke
Petroleum
Coke
Refining
Residues
Refining
Residues
Electricity,
Steam
Texaco1999
Electricity
Texaco1999
Ammonia
Electricity
Texaco2000
Hydrogen,
Electricity
Texaco2003
Electricity,
Steam
Shell1985
Hydrogen,
coElectricity
Vacuum
Residue
Ammonia, 283 MWeGelsenkirchen
Germany
Shell1973
MethanolElectricity

Shell’s Pernis refinery in the Netherlands has installed a heavy-residue gasificationunit which will provide 3.34x1 OGN m3/d hydrogen for the refinery’s hydrocracker and syngas tofuel a combined-cycle unit to generate 115 MWe net power for sale. Stat_-up occurred in1998.
The El Dorado gasification project is located in the U.S. at Texaco’s El Dorado,Kansas refinery. The gasification plant is sized to gasify only the lowest value streamsproduced by the refinery. It is fed with 150 tld of petroleum coke and 15 ffd of refinery wastestreams. Products of this unit are 40 MWe of power, and 81.6 ffh of steam, pressurized air,nitrogen, and oxygen, all of which are utilized inside the refinery.
The IGCC projects underway in Italy are supported by incentives based on the sale ofelectricity. The API Energia Project, located at Faiconara, Italy, is a joint venture between APIand Asea Brown Boveri. The plant is sized to gasify 60 t/h of high-sulfur (s-i’~o) residue toproduce steam for the refinery and syngas, which will fuel an ABB combined-cycle plant togenerate 280 MWe of net power. Start-up is scheduled for late 1999.
The ISAB Energy Project is a joint venture between Erg Petroii and Mission Energy,located in Priolo Gallolo, Sicily. This plant is sized to gasify 120 t/h of high-sulfur (5-7%)asphalt to produce steam and hydrogen for the refiney, and syngas to fuel a Siemenscombined-cycle plant to generate 512 MWe of net power. Start-up is scheduled for late 1999.
The Sarlux Project is a joint venture between Saras and Enron, located in Sarroch,Sardinia. The plant is sized to gasify 145 ffh of high-sulfur visbreaker tar to produce steamand hydrogen for the refinery and syngas to fuel a General Electric combined-cycle plant togenerate 550 MWe of net power. Start-up is scheduled for the first quarter of 2000.
Star Enterprise, a joint venture between Texaco and Saudi Aramco, is adding twoTexaco gasifiers to the existing power plant in the Delaware City refinery in the U.S. that willgenerate electricity and steam from petroleum coke. The majority of the electricity and steamproduced in the project will be used in the refinery.
A Texaco gasification plant is under construction for Singapore Syngas Pte. Ltd., onJurong Island. The unit will gasify low-value refinery feedstock from the Singapore RefiningCompany and will supply carbon monoxide to an acetic acid plant owned by the HoechstCelanese Company.
Total and Electricity de France (EdF) will join with Texaco to build an IGCC powerplant, located at Gonfreville, Normandy. The plant is sized to produce 365 MWe of electricityand 250 ffh of steam. It will be suitable for processing low-quality petroleum residues. Theplant is the first of its kind in France and will come on stream in 2003.
The Gelsenkirchen and Leuna refineries in Germany are using a partial oxidation unitfed with visbreaker tar for the production of methanol and ammonia.
Gasification technology has the unique ability to generate electricity and/or chemicalsdepending on downstream needs. The synergy of co-production can improve the overalleconomics of an integrated gasification combined-cycle project. The syngas primarycomponents, i.e., carbon monoxide, hydrogen, and carbon dioxide, can be separated from themixture and sold as pure compounds, or they can be processed to make a wide range ofmore complex chemicals. The Exxon Baytown, Texas, refinery gasification project in the U.S.is an example of where the project economics are improved by selling the carbon monoxideand hydrogen to others.
Hydrogen and carbon monoxide are building blocks for chemicals such as acetic acidand oxo-alcohols (e.g. at Eastman Chemicals), for the production of liquid fuels (e.g. atSasol), and the manufacture of synthetic natural gas (e.g. at Dakota Gasification). Integratingfeedstock and energy needs is essential to making the gasification route economically viable.The required H2-to-C0 ratio is very important for most major applications. For Fischer-Tropsch synthesis or methanol production, the ratio is about 2 to 1. Consequently, the syngas

from higher-hydrocarbons gasification, after cleaning, has to be processed in a CO-shiftsystem to convert sufficient CO to meet the required H2-to-C0 ratio of 2 to 1. An alternativewould be to allow the shift and synthesis reactions to occur in the same reactor (e.g. Sasoliron-based Fischer-Tropsch technology).
With the continued decrease in the quality of petroleum crude, feed conditioning andhandling become more onerous, sulfur and ash content increase, and carbon (or soot)formation in the gasifier increases. The product stream may also require more rigorousprocessing. The soot and ash have to be removed in a scrubber section and reprocessed ordisposed of. The ratio of hydrogen to carbon monoxide in the syngas is influenced by thecarbon to hydrogen ratio of the feedstock; the heavier the hydrocarbon, the lower the ratio ofhydrogen to carbon monoxide.
The viability of gasification will depend upon the perceived value of the feedstock andthe ability to optimize marketing of the gasification products to consuming industries. Thecosts of gasification are variable, depending upon such issues as economy of scale, locallabor costs, and applicable engineering standards. Furthermore, gasification costs are usuallyestimated in conjunction with downstream processing equipment necessary for the deliveryof a syngas suitable for conversion to the specified end product. Accordingly, gasificationinvestment costs are best addressed on a project-specific basis. Approximate figures basedon European economic conditions, which compare costs of syngas production by natural gaspartial oxidation and by vacuum residue and coal gasification, are as follows
Natural Gas Heavv Oil Qc@
Energy Consumption 1.0 1.3 1.7Investment Cost 1.0 1.4 2.4Product Value 1.0 1.2 1.7
The natural gas partial oxidation route appears to offer the lowest capital investmentand production costs. Syngas production by gasification of vacuum residue in a refinery isnecessary to utilize the crude oil to the fullest extent possible. Gasification plants operating onheavy oil are somewhat less complex and have lower costs than a coal-based IGCC plant.(See Section 4, Gasification Process Economics, for coal based systems.)
The expected reliability and availability of gasification combined-cycle plants havereceived considerable attention, as increased plant complexity might imply reducedavailability. Yet, it has been found that individual plant systems are generally very reliable andtheir integration has led to very positive results. Operating experience at several plants showsthat an availability of 90% is achievable for a single gasification train, whereas facilities suchas air separation units, sulfur recovery systems, and water treatment systems have up to 99%availability. Single-train IGCC plants are projected to have an equivalent availability of at least85%. If backup fuel is available to the gas turbine, then the power generation availability canapproach 94-95Y0.
2.6- Size of Plants
In the planning, design, and construction of gasification plants, the size of the plant ineach case is very important. For commercial-scale industrial plants, larger size plants areusually more economical than smaller plants, It is also very important that, in addition to highoutput capacity, high thermal efficiency can be achieved through minimizing energy losses,properly integrating process steam, and recycling. The three basic gasification types arecharacterized by very high product outputs, particularly the fixed-bed and the entrained-bedgasifiers. An output of 40,000 to 60,000 Nm3/h can be technically realized without problems.Examples of such plants are located in Sasolburg, South Africa; Vresova, Czech. Republic;Buelah, North Dakota, U.S.; and the waste gasification plant at Schwarze Pumpe, Germany.Other very large demonstration plants are at Puertollano, Spain (320 MWe); Buggenum,Netherlands (253 MWe); Tampa, U.S. (250 MWe); Terre Haute, U.S. (262 MWe); Pernis,Netherlands (300 MWe).

In today’s market, gasification processes for power generation are not competitivewith natural gas combined-cycle because of the high-capital cost of gasification and the lowcost of natural gas. Only when very low-cost feedstocks are employed, higher value co-products are produced, and the technology is integrated with an existing facility can anacceptable rate of return on investment be realized making gasification competitive withnatural gas. This is especially true for coal-based power generation, but similar results havealso been obtained for the gasification of liquid hydrocarbons. A case in point is thecommercial waste/garbage gasification plant at Schwarze Pumpe. This plant is the result theof successful integration of old gasification facilities with many new technologies, i.e., gas andsteam turbines, a methanol plant, preparation facilities for sewage sludge, extrusion plants forthe compacting of mixed used plastics, etc. Receiving waste materials at a zero or negativecost can make gasification an economical option. Additional revenues can also come from thesale of the final products, i.e., electricity and methanol. In this way, gasification-basedtechnologies can be competitive under various market conditions.
For small gasification pIants, determining the optimal capacity is a difficult task.Investment costs are indeed lower, but the cost for gas cleaning facilities can be very high.Typical small-scale gasifiers have thermal capacities in the range of 100 to 5000 kW. Exactdata on the optimal capacity cannot be given because of the many impacts to consider, suchas local conditions, the specific market situation, the demand for energy such as electricityand/or steam, the technical and economic conditions concerning the manufacture ofchemicals from synthesis gas, etc.
Even for smaller gasifiers, the development of suitable evaluation models is importantbecause smaller gasifiers, i.e., fixed-bed or fluidized-bed, are the preferred technology forgasification of biomass or other renewable energy materials. An essential problem for smallergasifyhg equipment is the implementation of an effective and cheap gas purificationtechnique, such as for tar and dust removal. This problem is addressed in Section 2.7, GasPurification.
2.7- Gas Purification
Gas purification/processing is the systematic treatment of gases to meet specific end-use gas requirements to ensure proper downstream operations. The technical development ofgas processing has followed a similar development path as gas production processes, i.e.,beginning with simple process steps and leading to more highly technical gas purificationsystems.
Early industrial manufactured gas was produced by “classic” coal gasification andcarbonization plants. It was necessary to purify the produced gases. Direct application ofthese gases as fuel gas without purification stages, such as cooling, separating, scrubbing,and/or filtering is rarely possible. For many years, gas purification was necessary toeconomically recover by-product chemicals from condensates, e.g. tar, aromatic compounds,ammonia, and sulfur, and the production of fuels and chemicals, e.g. paraffins, gasoline,diesel fuel, heating oil, wax, alphaolefins, etc.
For many years, gasification and coking plants for hard and brown coal were animportant part of the chemical industry in countries with little natural gas. With the availabilityof an economical supply of natural gas and oil, the importance of by-products in coal refiningprocesses as raw materials for the chemical industry has continuously decreased. Today,there are only a few commercial plants producing multiple products from coal, e.g. Sasol,South Africa. The first two facilities in the U.S. at an industrial scale are Eastman Chemicalsand Dakota Gasification.
By-products from “classic” thermal coal refining processes, and also from the latergasification plants for biomass, heavy oils, or wastes/garbage, as a rule, do not contribute toincreased process efficiency, and usually make the total process more costly. However, thevalue of the by-products, in many cases, can affect whether or not the gasification process iseconomically viable.

The following describe some basic principles of gas treatment, including somediverse special requirements of new technologies:
. Mechanical processes for the separation/elimination of substances in variousstates of aggregation.● Thermal processes for cooling and condensation, as well as heat exchange andthe thermal separation of substances.● Diffusion processes, such as adsorption, absorption and rectification, and reactionsfor conversion and separation of trace contaminants.
The multitude of gasification processes, the wide range of feedstocks, and the verydifferent demands for syngas have led to diverse gas treatment processes. These processesare discussed with reference to various gasifiers and technology applications. In this briefsection, it is not possible to describe completely all technologies for gas purification.
The syngas use dictates the amount of gas cleaning and purification technologyrequired. Syngas applications range from town gas, fuel for gas turbine combined-cycle,chemicals and fuels production, and fuel for fuel cells. Each particular gasifier type producesa raw product that requires special gas purification. For IGCCS, there are strict requirementsfor the quality of the fuel. The gas quality requirements are even stricter if the syngas is usedin chemical synthesis processes, such as methanol and ammonia. The ability to produce highquality gas at competitive costs could be critical for the economics of the IGCC process. Thepermissible content of impurities in syngas is very low (less than 1 mg S/m3, even 0.1 mg/m3).In general, fuel gases for the combined-cycle process need not be purified to the low levelrequired for chemical synthesis. This is due to the ability of the gas turbine to withstand higherlevels of chemical contaminants than what catalysts can be exposed to. So long as the sulfurcontent of the gas is sufficiently lowered to prevent corrosion inside the gas turbine, only dust,alkali, and tar need to be removed. The discussion below presents some of these uniquerequirements.
Fixed-Bed GasifierThe characteristic feature of the product gas from the fixed-bed coal-fueled gasifier is
the presence of tar, hydrocarbons, fine coal dust, hydrogen sulfide, ammonia, and phenoliccompounds. Similar characteristics are also observed with other feedstocks such as biomassor waste materials. The following basic process steps are necessary 1)cooling/condensation, 2) tar removal, 3) removal of benzene and other hydrocarbons, 4)removal of hydrogen sulfide and carbon dioxide, and 5) gas drying.
As a rule, the hot raw gas at 500-7000 C contains large quantities of steam besidesthe above-mentioned impurities and is purified by director indirect cooling in several stageswhereby water, tars, light hydrocarbons, and fine carbon dust are condensed and separated.The condensate from the first cooling stage is undesirable and its disposal is important forcommercial application of the fixed-bed gasifier. After further cooling--mostly indirect coolingwith steam generation-the gas has to be purified of carbon dioxide, hydrogen sulfide, organicsulfur compounds, hydrogen cyanide, nitrogen oxides, metal carbonyls, dioxins, furans, etc
Fluidized-Bed GasifierCharacteristic of this gasifier type is the discharge of flue dust, consisting of ash and
unburned carbon, in the syngas product. The product gas can be recycled to the gasifierabove the fluidized bed for secondary gasification or combusted in a separate unit. Furtherprocessing of the gas is carried out by means of a waste heat boiler, cyclone separators, anda scrubber cooler. Final purification of the syngas is the same as for fixed-bed gasification,
Entrained-Flow GasifierThis gasifier type operates at a very high gasification temperature, i.e., above the ash
melting point (1500-1 600 ‘C). The organic content of the feedstock is mostly converted tocarbon dioxide, hydrogen, carbon monoxide, and water so that, upon cooling, no tars, oils,benzene, or phenoiic substances condense out of the gas stream. The purification of the rawgas and the gas condensate is much easier than for fixed-bed and fluidized-bed gasification.

Gas Purification TechnologiesA complete presentation of all the various gas purification processes is not possible
here. Many processes have been developed, but relatively few are being used at an industrialscale. These technologies have been discussed in some detail in the IEA Coal Researchreport, “Gas Cleaning for Advanced Coal-Based Power Generation’’[2]. Two important typicalprocesses are discussed below.
Rectisol ProcessThe Rectisol process developed by Lurgi is the most important commercial gas
purification process. It is being used at several sites including Sasol, Vresova, SchwarzePumpe, Eastman Chemicals, and Dakota Gasification. The process involves the physicalwashing of the raw gas with organic solvents at very low temperatures (-35 to -70 ‘C) andhigh pressures. It removes undesirable substances in the raw gas such as hydrogen sulfide,ammonia, hydrogen cyanide, organic sulfur compounds, carbon dioxide, hydrocarbons, andwater. Washing agents are organic, oxygen-containing chemicals with polar characteristicssuch as alcohols, ketones, esters, and ethers. Methanol is the most commonly used agent.The process is capable of producing syngas suitable for chemical synthesis.
Claus ProcessThis process, with its many variations, is very popular in the purification of gases
produced from coal and other feedstocks containing high levels of sulfur. It is used to recoversulfur from the regeneration gases of the solvent washing processes, such as Rectisol. Theapplication is independent of the gasification process used. For the usual commercialquantities of sulfur production, the Claus process is often used. Claus plants produce a goodgrade of sulfur while exporting steam and require little operator attention. The Claus plant alsohas the ability to destroy ammonia, BTX, and other hydrocarbons, and it converts mercaptansand disulfides to sulfur. The use of oxygen has become well established as a means forincreasing Claus plant capacity and handling lean feeds in new plants.
Recently, considerable attention has been given to catalyst development by catalystvendors, and sophisticated combinations of catalysts are available so that a standard 3-stageClaus unit can achieve about 98% sulfur recovery in a well-controlled plant. Thesedevelopments involve the use of titania-based catalysts and alumina catalysts with optimumpore size distribution for the Claus reactions. The use of an oxygen-scavenging catalyst as aguard against sulfur poisoning can extend the life of the alumina catalyst.
Other ProcessesVery high sulfur recoveries require treatment beyond the Claus stages. Such
processes have used a hydrolysis/reduction stage that converts the sulfur species in theClaus tail gas to hydrogen sulfide. Most tail gas processes consist of a hydrogenation stage,followed by hydrogen sulfide recovery, such as an amine process. This is followed by anoxygenation stage, such as the Selectox and Redox processes, which yield elemental sulfur.
The amine-based process, which is well established and can reliably achieve above99.8% sulfur recovery, has been the most frequently selected process for IGCC processes.For very high recoveries, a COS hydrolysis unit upstream of the amine contactor is requiredas well as treatment of vent gases from sulfur degassing and storage facilities.
Processes for scrubbing sulfur dioxide from tail gas incinerator effluent, such as theWellman-Lord process have been applied. This simplifies the Claus process and permits thedisposal of other sulfurous off-gases in the incinerator. The Clausorb process is a jointdevelopment by Parsons and Calgon Carbon Corporation, and absorbs sulfur dioxide fromthe incinerator effluent on a special carbon bed to produce an effluent with less than 100ppmv of sulfur dioxide. Solvent-based sulfur dioxide recycle processes which work similarly toan amine unit can also be applied downstream of the incinerator, but normally these havelittle economic advantage over the conventional amine-based tail gas unit.
Conventional gas purification units operate with high efficiency for dedusting,separation of trace metals, and desulfurization. A major disadvantage of these processes isthe need to cool the gas to a low temperature, thereby adversely affecting the overall thermal

efficiency of the process. In comparison, high temperature dry gas purification can result in anincrease of thermal efficiency of 2-3 percentage points (see Tables 1 and 2 in Section 4.0).Based on current sorbent technologies, operating temperatures of 350-500 “C are required foreffective desulfurization. The key to the successful commercialization of this technology is thedevelopment of stable, regenerable, and attrition resistant sorbents. Dedusting of the gasstream using barrier filters has also been developed at the pilot scale for operations up to 400‘C. At these temperatures it is believed that alkali metals will condense and be retained in thefilter cake. The Pifion Pine IGCC plant in the U.S. is the only plant in the world employing bothhot gas desulfurization and high temperature barrier filters. The Wabash River project in theU.S. is currently demonstrating the performance of barrier filters in an IGCC plant. Thepresent state of development is described in the IEA Coal Research reports, “Hot GasCleanup of Sulfur, Nitrogen, Minor, and Trace Elements’’[3] and “Hot Gas ParticulateFiltration. ”[4].
3- Environmental Aspects of Gasification
The increasing importance of environmental protection throughout the world presentsgasification technology with an interesting challenge. The most efficient and clean powersystems currently use natural gas as the fuel. Recent developments in gas turbine technologyhave increased the efficiency of natural gas-fueled combined-cycle power plants to levelsclose to 60% (LHV). This, in combination with the high hydrogen-to-carbon ratio of naturalgas, results in low specific carbon dioxide emissions.
Because most known reserves of fossil fuels consist of coal, development is nowunder way to enable the clean and efficient use of coal-derived fuel in gas turbines. Moreover,the use of a renewable fuel like biomass in gasification combined-cycle can yield zero netemissions of carbon dioxide.
The environmental advantages of gasification depend on a number of factors, suchas fuel characteristics, gasification and gas cleaning technology, and final gas utilization.These impacts are reviewed in this section, with emphasis on the gasification of coal andwoody biomass for power generation in IGCC.
3.1- Gaseous Emissions
Particulate matter, sulfur dioxide, nitrogen oxides, hydrocarbons, carbon monoxide,and carbon dioxide are typical emissions from energy conversion facilities using solid fuels.Gasification and subsequent combustion of the generated syngas facilitate the control ofsome of these pollutants as discussed below.
Sulfur dioxide (S02) results from oxidation of the sulfur content of the fuel. Hence, it ismainly a problem in fossil fuel gasification, since the sulfur content of biomass is generallylow. In a gasifier, the conditions are reducing so that sulfur is mostly converted to hydrogensulfide (HZS). H2S not removed from the produced gas will be oxidized to S02 duringsubsequent combustion. Wet scrubbing, as discussed in Section 2.7, can remove up to 99%of the sulfur in the raw gas. The liquid sorbent is then regenerated, and the regeneration gasis processed by the Claus process to produce elemental sulfur.
Coal and biomass usually contain varying amounts of nitrogen. Oxidation of this fuel-bound nitrogen results in NOW Because of the reducing environment of gasification, a majorpart of the fuel-bound nitrogen is converted to ammonia (NHS), which is readily removed in ascrubber. This reduces the formation of NOX in subsequent combustion processes. It doesnot, however, affect the production of thermal NOX during combustion of the gas.Nevertheless, it is generally easier to control the formation of NO. when combusting gaseousfuels rather than solid fuels. By adding sufficient steam or nitrogen to the gas turbinecombustor, NOX emissions as low as 9 ppm have been reported at the Wabash River IGCCPlant with only a small penalty on thermal efficiency. Wabash meets or exceeds existing NewSource Performance Standards in the U.S.5 Wabash produces the following emissions: S02,0.04 kg/GJ; NOX, 0.06 kg/GJ; and CO, 0.02 kg/GJ.

The amount of unburned hydrocarbons released in the utilization of syngas dependsmainly on the combustion technology employed. However, the amount and composition. oftars in the fuel gas may also have an effect. Tars from biomass gasification are especiallystable and require high temperature and sufficient residence time to be completely converted.To prevent problems with tars condensing in gas cooling and cleaning equipment, they areoften cracked or removed upstream of the gas turbine combustor. Therefore, emissions ofpolycyciic hydrocarbons, dioxins, and furans are not expected to be a problem [6].
Another source of hydrocarbon emissions is the fuel dryer, often-used in biomassgasification. In the dryer, wet fuel is dried using hot flue gases. As the fuel is heated, water isevaporated. If the temperature is too high, volatile compounds, such as terpenes, arevaporized and exit with the fuel gases. The extent of this release depends on fuel type andtemperature in the dryer. Also, fine fuel particles may be entrained in the fuel gas,necessitating particulate cleanup. An alternative technique is to dry the biomass withsuperheated steam. When the steam is condensed patilcles and volatile species are patilallytrapped in the condensate, which may require further treatment.
Carbon monoxide (CO) and hydrogen are the major constituents of the syngasproduct. While methane, carbon dioxide, steam, and, in the case of air-blown gasification,nitrogen are present in minor amounts (see Figure 1, Section 2.1). Combustion normallyconsumes almost all of the CO, leaving only a small amount in the flue gas. However, sincethe heating value of syngas is lower than that of natural gas, and since additional dilution bysteam or nitrogen is used to control thermal NO,, complete combustion may be diftlcult.Further investigation of this is needed.
Depending on the gasification technology, syngas contains particulate matterconsisting of ash, unreacted char, and, in the case of a fluidized-bed gasifier, bed material.These are potentially harmful to the hot parts of the gas turbine and have to be removed. Thiscan be done by means of cyclones, filters, and/or scrubbers so that additional particulatecontrol is not required in the flue gas stream. (See Section 3.3, “Solid Residues”.)
At present, considerable attention is being directed to the emissions of carbon dioxide(CO,) resulting from the energy conversion process. Here, a distinction can be made betweenfossil and renewable fuels. Both give rise to emissions of COZ but, provided it is grown in asustainable way, biomass is generally not considered to increase the concentration of C02 inthe atmosphere. The use of fossil fuels, on the other hand, results in a net release of C02,directly proportional to the carbon content of the fuel.
To limit C02 emissions, high conversion efficiency is important. IGCC technology hasthe potential to achieve this. Another advantage of IGCC processes is its ability to provide ahigh concentration of C02 in the syngas. Using a shift converter and chemical absorption ofC02, 80-90’%. of the C02 maybe removed. There is, however, an efficiency penalty, and new,more efficient technologies are needed.
The U.S. Department of Energy (DOE) has several active programs focusing on theconcentration and extraction of C02 from gasification processes. The use of regenerablesorbents is being explored as a means of capturing C02 from intermediate process streamsand combustion flue gas. Technologies are also being developed for separating hydrogenfrom shifted synthesis gas. The use of high temperature molecular sieves and protonconducting membranes are the focal point of several projects. Technologies for the captureof C02 via hydrate formation represent a low temperature approach compared to theconventional process. Preliminary analyses of both approaches have shown minimal impacton thermal eficiency compared to the use of conventional technologies such as Selexol, Theeconomics of the membranes-based technology are presented in Section 4.3. This advancedapproach appears quite promising. DOE has also initiated a major program to developtechnologies for sequestering the COZ produced from processes such as those describedabove. If sequestration can be demonstrated to be a cost-effective approach to mitigatingC02 emissions, low-cost, lower efficiency processes maybe the choice over more expensivehigher efficiency processes.

3.2- Liquid Effluents
The amount of liquid effluent depends strongly on the gas-cleaning methodsemployed. The various types of gas-cleaning equipment may give rise to additional ordifferent liquid effluents. Cooling of syngas before cleaning often results in condensation ofwater. Additionally, water may be added in a wet scrubber in order to wash out particles,chlorides, ammonia, etc. Before discharge of this process water, some cleaning is usuallyrequired.
The condensate stream from the low temperature gasification processes may containvarious compounds such as acetic acid, phenolic substances, and other oxygenatedorganics. Hence, further treatment (for example, separation of tars for recycling orincineration) is required before disposal. Low pH value and high chemical oxygen demand areother issues of concern. Biological treatment, possibly combined with chemical treatment andPH adjustment, is normally assumed to solve theseproblems. [7,8]
In coal-based IGCC plants, sour water is condensed from the syngas in the gascooling equipment. Some of this water may be recycled for process purposes and excesswater is stripped of dissolved gases, except ammonia, and discharged [9]. IGCC plants havealso been designed for zero discharge of water. The Tampa Electric IGCC plant is one suchfacility [1O].
For pressurized gasification systems, where compression of the syngas is notrequired, it is thermodynamically advantageous not to cool the syngas to lower temperaturesthan necessary. For hot gas cleanup technologies, the normal temperature limit isapproximately 500 ‘C, low enough to condense alkali metals that could damage the gasturbine. Such a system often consists of a gas cooler, a hot gas filter, possibly a catalyst forremoval of NH3, and a system with a dry sorbent for sulfur removal, such as in the case ofcoal-derived gas. This system, when fully developed, would eliminate wastewater streamsfrom the gas cleaning process. Hot gas filtration is discussed in detail in IEA Coal Researchreports [3,4 ]
3.3- Solid Residues
The main solid residue is ash, both bottom and fly ash. The ash discharged from afixed-bed gasifier, whether solid or liquid is relatively harmless for handling and disposal.There are many cases where ash or slag from the process can be used as a supplementalmaterial in the construction industry. The ash from fluidized-bed gasifiers, together withlimestone or dolomite, is rejected in the solid phase. Entrained-bed gasifiers reject bottom ashin the form of molten slag. After solidification, this material is normally very resistant toleaching [11].
Ash from relatively clean biomass fuels can be used as fertilizer, whereas coal ashwill most likely have to be disposed of in landfills or used in the construction industry. Theseissues are discussed in detail in the IEA Coal Research Report, “Management of By-Productsfrom IGCC Power Generation.’’[12].
4- Gasification Process Economics
As described in the foregoing sections, gasification technologies have been employedworldwide in a variety of applications. These facilities have generally satisfied a particularneed or opportunity that made the specific project economically viable under thosecircumstances. These situations have included such things as government subsidies orincentives, project specific financial arrangements, or the availability of low-, zero-, or evennegativ=cost feedstocks. Because of these special arrangements and the specific siting ofthe various projects, getting a firm understanding of the economics of existing gasification-based projects is difficult.

Inthe following subsections, theeconomics ofvarious gasification-based processesare presented. The first subsection presents IGCC economics using gasifier technologies thatare either commercialized or undergoing commercial demonstration to provide an indicationof today’s costs for such systems. This is followed by a comparison of the economics offuturistic advanced technologies. This analysis provides an indication of the impact oftechnological advances and continued deployment beyond the first facility (i.e., the learningcurve) on the cost of gasification plants. Finally, the economics of advanced processes for themanufacture of hydrogen and the collection of carbon dioxide for sequestration areaddressed. These results will be valuable in addressing carbon dioxide mitigation strategies inresponse to the Kyoto protocol and the eventual transition to a hydrogen economy.
To provide the reader with a better basis with which to compare technologies in eachcase, a common basis was established for comparative analysis. For all cases, a greenfieldsite was selected in order to eliminate any special siting considerations that could impactproject costs. Within each subsection, process contingencies and the economic assumptionsemployed to derive the final product costs are internally consistent. Therefore, the differencesbetween the various options presented are primarily due to the technologies employed in theprocesses. Specific details surrounding all the cases presented are contained in the citedreferences.
4.1- Gasification Process Economics - Today
Studies were performed to establish base cases for commercially available (or nearlyavailable) IGCC power plant systems having a nominal size of 400 Mwe [13-18]. Six differentgasifiers were evaluated, including the Destec, Texaco, Shell, KRW, British Gas Lurgi, andKRW transport gasifiers, Both conventional acid gas removal (AGR) technology andadvanced hot gas cleaning using a transport desulfurizer were evaluated for each gasifier.For the cases using AGR, Claus/Scot technology was employed for the recovery of elementalsulfur. In those cases employing hot gas cleaning, the S02 generated during sorbentregeneration dictated the use of a sulfuric acid plant to recover sulfur. In each case, amodified Westinghouse 501 G gas turbine was used for the coal-derived fuel gas, and a three-pressure-level subcritical reheat steam cycle was used for the bottoming cycle. For theoxygen-blown gasifiers, a high-pressure air separation process was employed and integratedwith the gas turbine. An 85% capacity factor was assumed for the analysis.
In each of the studies, the feedstock was an Illinois No. 6 coal costing about $1 .23/GJ(as received). The cost of electricity was determined following the guidelines set by the EPRITechnical Assessment Guide (TAG). All costs are reported in 1997 dollars. Tables 1 through4 present the results of the analyses. Since the intent of the analyses was to compare gasifierand gas cleaning technology performance and cost, many of the process variables were heldconstant. As a result, the cases presented do not necessarily represent the optimizedsystems for the particular gasifier.
Each of the gasification technologies assessed can offer an advantage in one ormore of the areas of performance or cost. However, for each advantage, there arecompensating factors that tend to negate that patilcular advantage. In reviewing the results ofthe analyses of the technologies, each of the overall comparison factors (such as total plantcapital, cost of electricity, thermal efficiency, coal consumption, or power generated), whentaken collectively, causes all of the technologies to fall within plus or minus 10% of theaverage, which is within the accuracy of the analysis. However, as one might expect, theTexaco quench gasifier case is the least expensive and has the lowest thermal efficiency.Regardless of this, no single gasifier technology stands out as economically superior to therest. The selection of a particular gasifier type must consider the specific application, size,and feedstock to be processed.
There are a number of notable observations regarding the differences behveen thetechnologies. The technology cases in which hot-gas cleanup was used were in general morethermally efficient by an average of several points, compared to the cold-gas cleanup cases.However, this higher efficiency did not translate into an improved cost-of-electricity (COE), asthe estimated COE values fell within the same range. In these cases, the cost savings

realized by using the transport hot gas desulfurization technology is offset by the higher costof the sulfuric acid plant required to process the sorbent regenerator SOL-containing off-gascompared to processing the hydrogen sulfide from the AGR in the lower cost Claus/Scot unit.
The capital cost of the oxygen plant is one of the major cost items in the oxygen-blown systems, contributing between 13-15% of the plant capital cost. Eliminating this cost byusing an air-blown system such as the KRW fluidized-bed gasifier would seem to offer amajor cost savings. However, the significantly greater costs of this gasifier and the gascleaning system (related to the increased volume of gas processed due to the nitrogen in theair) readily compensated for the oxygen-plant cost. Using the lower cost transport gasifieroperating in an air-blown mode provides for some cost reduction over the fluidized-bedgasifier. The air-blown systems, however, have limited utility, especially when cogenerationand coproduction applications are considered, or when carbon dioxide capture may berequired in the future.
The results presented in Tables 1 through 4 are based on a typical labor cost of thestandard reference, mid-western, U.S. (labor productivity factor of one). The costs of thesetechnologies can be substantially reduced when being designed, fabricated, and constructedin regions having low labor costs as in developing countries such as China and India. Usinglow cost, locally available feedstocks--such as biomass, petroleum coke, or refinery heavyoil/wastes--would further reduce costs.
Oxidant OxygenCoal Feed Rate, t/d 2833Oxygen/Air Feed Rate, ffd 2155Gas Turbine Power, MWe 273.0Steam Turbine Power, MWe 173.5Mist/Aux Power, MWe -48.1Net MWe 398.5Total Plant Cost, K$ 462,857Total Plant Cost, $/kW 1161Annual Operating Cost, K$ 65,711COE (mills/kWh) 46.2HHV, % net efficiency 44.8
1
HHV, MJ/(Nm3) 11.38
Texacow/Quench
Oxygen30702522
271.9154.1-44.4381.7
435,3291141
67,12847.239.6
9.30
Texacow/Radiant &Convective
CoolingOxygen
30122474
272.5192.4-54.5410.4
500,8261220
69,83248.143.4
11.11
Shell
QYs@L28582306
273.0188.3-54.3407.1
501,5871232
67,85947.945.4
11.73
==+=
Air O en3026 25509938 1334
271.7 272.4172.7 131.2-24.5 -34.C419.9 369.5
489,620 469,8961166 1272
68,706 65,88C46.1 50.244.2 45.4
5.48 13.75
Table 1: Process and Cost Performance of Baseline Cases with Cold Gas Cleanup [13-1 8]

Gasifier
~Oxidant
Rate, t/dGas Turbine Power,
E$lkWAnnual OperatingCost, K$COE mills/kWhHHV, ‘%.netefflciencHHV, MJ/(Nm )
Destec
QfY&
2058
271.1
172.0
-46.3
396.9462,113
1164
67,279
47.047.4
9.69
CoolingOxygen Oxygen Air
2797 2732 28222297 2204 8977
271.2 271.6 271.8
184.9 189.2 181.0
-49.2 -53.1 -23.8
,9.28 I 11.381 5.34
KRWWINOIn-BedSulfur
_
28229463
272.9
170.8
-24.7
419.1503,673
1202
71,722
48.046.3
5.22
TTransport Transport
a=271.4 272.1
160.1 141.9
-19.5 -32.7
*I
64,4171 67,551
-1-,5.83! 8.39
Table 2: Process and Cost Performance of Baseline Cases with Hot Gas Cleanup [13-1 8].
Destec Texaco Texaco KRW Shell BGLQuench Radiant & Air-Blown
Convective No In-BedCooling S Capture
Coal/Sorbent Prep/Handling 25700 27191 26830 16557 17290 31650
Oxygen Plant 62609 67357 68800 -.. 66970 44822
Compression 2611 --- 3434 11849 1867 ---
Gasifier 47168 24032 56706 84512 71311 60490Gas Cooling/Cleaning 28508 36734 301 I-M finn~7 7RI 73 38637
Gas Combustion Turbine 47827 45211 5HRSG/Steam Turbine 47827 45211 5OtherSub-Total, Process PlantEngineering and Contingency
ITotal Plant Cost I 462857 I 435329 I 500826 I 48~20 I 501587 [ 469896 I
Table 3: Capital Cost Summary for Base Cases with Cold Gas Cleanup [13-1 8].(All Costs in $K)

Destec Texaco KRW KRW ShellRadiant & Air-Blown Air-Blown
Convective w/in-Bed No In-Bed
I Cooling / S Capture I S Capture ICoal Sorbent 24608 I 25470 I 27002 I 16039 I 16755Prep/HandlingOxygen Plant 59839 64781 --- --- 65067
Compression 6102 5311 11699 13925 4592Gasifier 36533 44860 75487 80842 65187Gas Cooling/Cleanup 45017 50244 69968 74085 35689Gas Combustion 53837 53857 53976 54195 53937TurbineHRSG/Steam Turbine 47595 49264 49197 47322 50028Other 82059 88135 93576 90353 87373Sub-Total. Process 355590 381922 380905 376761 378628PlantEngineering and 106523 115068 129012 126912 114092ContingencyTotal Plant Cost 462113 496990 509917 503673 492726
TransportAir-Blown
22979
---
7891593585625053897
4638974619
321383
114873
436256
Table 4: Capital Cost Summary for Base Cases with Hot Gas Cleanup [13-1 8].(All Costs in $K)
To provide a more definitive cost estimate for gasification plants, the U.S. Departmentof Energy has undertaken a project with Bechtel Corporation to optimize the design ofgasification-based processes. The study will utilize Bechtel’s innovative process template’development approach for engineering and cost control to improve plant design, increaseoperating efficiencies, and reduce costs for four specific cases: 1) coal-based IGCC, 2)petroleum coke-fed cogeneration 3) coal and coke-based coproduction, and 4) integrationgasification fuel cell (IGFC). Through this approach, cost savings are expected throughreductions in equipment count, tightening the scope of inside battery limits, reduction inequipment size, reduction in construction materials, creation of alliances with suppliers, andreduced home ol%ce and construction services costs. Based on the application of thisapproach to other technologies, it is anticipated that a 20’XOreduction in total installed cost canbe achieved. Such a reduction in cost could move gasification from its current project-specificposition to the technology of choice.
4.2- Impact of Technology Advances
In today’s power generation market, gasification is not competitive with natural gascombined-cycle because of the high capital cost of gasification and the low cost of naturalgas. While the cost of natural gas on an energy content basis is substantially higher than coaland most other available feedstocks, the differential between natural gas and otherfeedstocks such as coal is not sufficient to pay back the additional capital costs of building agasitler and support systems. Only when very low-cost feedstocks are employed, when thelocal cost of gas is high, or when the technology is integrated with an existing facility can anacceptable rate of return on the investment be realized.
However, technology advances hold the key to achieving the economic targetsneeded to make gasification technologies competitive for all feedstocks. Tables 5 and 6present a comparison of the performance and costs of three advanced IGCC processconfigurations with current technology. Each of the cases in this set of comparisonsrepresents an increased increment of performance improvement in the gas turbine selectedand integration improvements. The expected time frame for deployment of these advancedtechnology cases is provided. For this set of case studies, the compared processes weredesigned for a greenfield site processing Illinois No. 6 coal (costing $1.19/GJ) with an 85%capacity factor. In each case, sulfur was recovered as sulfuric acid and sold as a by-product.All costs are expressed in 1998 dollars.
7TransportOxygen
---mm-l
3464382172
441984445654036
~
4362183267
340905
3110781
451686

The reference IGCC plant configuration is based on the U.S. Department of Energy’sWabash River Coal Gasification Repowering Clean Coal Demonstration Project, and isconsidered to be a First-of-a-Kind (FOAK) facility with start-up in 2000. The IGCC processemploys two gasifier trains using Destec oxygen-blown pressurized gasifiers followed by heatrecovery, barrier filters, chloride guard bed, COS hydrolysis, and amine absorption. TwoGeneral Electric 7F gas turbines are employed in the combined-cycle power island.
The Destec “G” and “H” cases are similar to the reference case, except that eachnow employs a transport reactor for hot gas desulfurization (HGD) of the raw synthesis gas.The former process employs the Westinghouse “G” Advanced Turbine System (ATS), whilethe latter uses a General Electric “H” ATS engine.
The fourth case employs two trains of the Kellogg air-blown transport gasifier with in-bed desulfurization. With this gasifier, total plant costs have the potential for being lower thanthat for other gasifier types. A transport reactor for high-temperature desulfurization is againused, but only as a polishing reactor. A General Electric “H” ATS gas turbine is alsoemployed.
The performance results and the capital costs obtained from the analysis of eachprocess configuration are presented in Tables 5 and 6. As the results show, advancedtechnologies have great potential for increasing thermal efficiency, lowering capital andproduction costs, and ultimately reducing the cost of electricity. The thermal efficiency of theprocess is increased substantially through the use of hot gas desulfurization and ATS. Thenearly 10-point increase in thermal efficiency of the process results in a 20% reduction in theemission of carbon dioxide per kWe generated. This improved performance will be a keyfactor in the selection of gasification-based processes in a carbon-constrained world. Inaddition, the emissions of sulfur and nitrogen oxides are significantly reduced in comparisonto the base case system that included cold gas cleanup and the lower temperature gasturbine. For the transport gasifier case, the capital cost is approaching the commercial targetof $850/kWh, a cost that is believed to be competitive with natural gas combined-cycle.
These results clearly indicate the impact of advanced turbine, gasification, and gascleanup technologies. However, there are other technologies that can also have a significantimpact on cost and efficiency. For instance, in oxygen-blown gasification processes, the airseparation unit accounts for nearly 15% of the total plant cost. Advanced air separationtechnologies employing mixed -conducting ceramic membranes have been shown to have amajor impact on the economics and performance of the IGCC process [20]. The membrane-based technology reduces the cost of oxygen production by 31%, translating to an overallreduction in capital cost of nearly $1 15/kWe. In addition, the efficiency of the process wasimproved by almost two points. Advanced technologies for enriched air, improved materialsand instrumentation, less costly sulfur recovery technologies, more et%cient bottoming cycles,etc., all have potential for further reducing the cost and improving the performance ofgasification-based technologies.
The data presented in Tables 5 and 6 are the costs for the first plants built with theindicated technologies; therefore, the costs are likely to be somewhat higher than that forsubsequent plants using the same technologies. Cost reductions are expected to occur as aresult of increased operating experience that leads to improved, optimized process designs.An indication of what cost reductions might be expected from the deployment of successiveplants is provided in Figure 7. The slope of the three “learning curves” was obtained from ananalysis of cost data associated with the deployment of other advanced technologies in themarketplace in the recent past. Assuming that the results of this “learning curve” analysis areapplicable, Figure 7 clearly shows that the deployment of additional gasification plants beyondthe first facility could result in substantial reductions in total plant cost. In all cases, the cost ofsubsequent plants is at or below $1 ,000/kW, Because of the technical risks associated withthese plants, the first facilities are usually able to attract some type of financial incentive tomake the project economically viable. However, without continued incentives for the first fewsuccessive facilities, realization of these potential cost reductions may not occur.
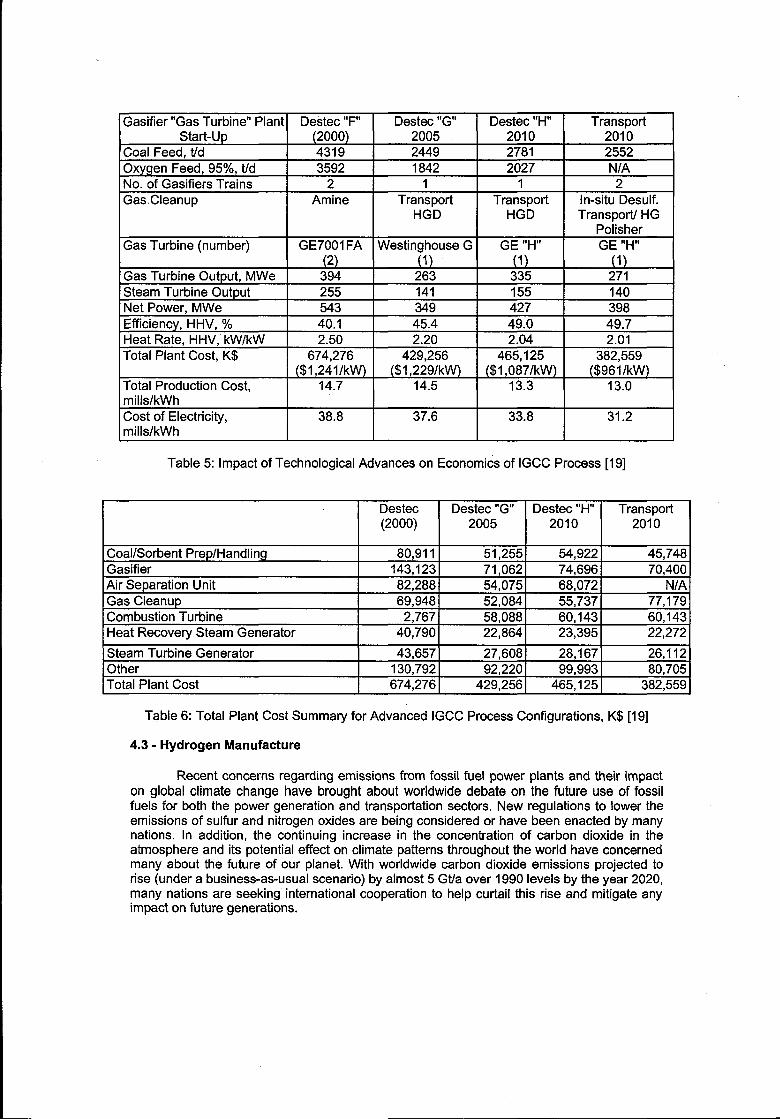
IGasifier “Gas Turbine” Plant I DeiSec “F” I Destec “G” I Destec “H” I TransportStart-Up (2000) 2005 2010 201”0
Coal Feed, ffd 4319 2449 2781 2552Oxygen Feed, 95%, t.ld 3592 1842 2027 N/ANo. of Gasifiers Trains 2 1 1 2Gas Cleanup Amine Transport Transport In-situ Desulf.
I I I HG”D I HGD I Transport/ HG
I I I I PolisherGas Turbine (number) GE7001 FA I Westinghouse G I GE “H” GE “H”
(2) (f) (1) (1)Gas Turbine Output, MWe 394 263 335 271Steam Turbine Output 255 141 155 140Net Power, MWe 543 349 427 398Efficiency, HHV, ‘Y. 40.1 45.4 49.0 49.7Heat Rate, HHV, kW/kW 2.50 2.20 2.04 2.01Total Plant Cost, K$ 674,276 429,256 465,125 382,559
($1 ,241/kW) I ($1 ,229/kW) 1( $1 ,087/kW) [ ($961/kW)Total Production Cost, I 14.7 14.5 13.3 13.0mills/kWhCost of Electricity, 38.8 37.6 33.8 31.2mills/kWh
Table 5: Impact of Technological Advances on Economics of IGCC Process [19]
Destec Destec “G” Destec “H” Transport(2000) 2005 2010 2010
Coal/Sorbent Prep/Handling 80,911 51,255 54,922 45,748Gasifier 143,123 71,062 74,696 70,400Air Separation Unit 82,288 54,075 68,072 NIAGas Cleanup 69,948 52,084 55,737 77,179Combustion Turbine 2,767 58,088 60,143 60,143Heat Recovery Steam Generator 40,790 22,864 23,395 22,272
Steam Turbine Generator 43,657 27,608 28,167 26,112Other 130,792 92,220 99,993 80,705Total Plant Cost 674,276 429,256 465,125 382,559
Table 6: Total Plant Cost Summary for Advanced IGCC Process Configurations, K$[19]
4.3- Hydrogen Manufacture
Recent concerns regarding emissions from fossil fuel power pIants and their impacton global climate change have brought about worldwide debate on the future use of fossilfuels for both the power generation and transportation sectors. New regulations to lower theemissions of sulfur and nitrogen oxides are being considered or have been enacted by manynations. In addition, the continuing increase in the concentration of carbon dioxide in theatmosphere and its potential effect on climate patterns throughout the world have concernedmany about the future of our planet. With worldwide carbon dioxide emissions projected torise (under a business-as-usual scenario) by almost 5 Gt/a over 1990 levels by the year 2020,many nations are seeking international cooperation to help curtail this rise and mitigate anyimpact on future generations.

$1,400
$1,2011
$1,000
$400
6200
\ Efficiency. 4.0.1 % Efficiency. 45.4%
11-~~g~~~~c~o~~~d oxygen BlowrI Entrained Ead
GE iF‘ Gasif~r witiliot Gaa Filter
Nat Output .543 MWEand Transport Reac@r Oxygen Blown
Cryogenic~ 51MG Erdmined Bed GaeifwrNet Output -349 MWe with Hot Gas Filterand
Transmrt Reactobn
1
Transf& Membrane, GEH-ATS
Net Output -439 MWe
@ 4 #2000 2002 2004 2006 2006 2010 2012 2rM4- 2016
YEARS
Figure 7: IGCC Capital Cost and Efficiency Improvements
Many believe that, ultimately, hydrogen in combination with highly efficient fuel celltechnology will be the fuel and technology of choice for both the power generation andtransportation markets. In the longer term, it is anticipated that hydrogen will be producedfrom the gasification of genetically altered crops and/or through photovoltaic decomposition ofwater. Both of these technologies have many technical challenges to overcome before theyare economically competitive with fossil-based technologies for transportation fuels andpower generation. Because of the world’s abundant supply of fossil fuels, coal, in particular,the hydrogen produced during the transition to a hydrogen economy would most likely begenerated from fossil fuels.
The environmental challenges facing the use of fossil fuels have stimulated atremendous effort in the development of concepts and technologies to eliminate emissions ofsulfur and nitrogen oxides and to concentrate and sequester carbon dioxide. The U.S.Department of Energy’s Office of Fossil Energy is embarking on a major effort called Vision21 to address the future needs of the power and fuels market, while simultaneouslyrespecting the environment. Besides achieving near-zero levels of emissions and thesequestration of carbon dioxide, this program is focusing on the development of modular-typeenergy plants that achieve thermal efficiencies in excess of 60% and are capable of utilizingany carbon-based feedstock and producing multiple products. As part of the program and toaddress the hydrogen economy, several concepts are being investigated and technologiesbeing developed for the production of hydrogen from coal.
Today, synthesis gas and hydrogen are produced from natural gas by steamreforming or partial oxidation, both processes being capital and energy intensive. However, asthe cost of natural gas escalates relative to coal and other carbon-based feedstocks,gasification-based processes that utilize advanced technologies have the potential forproducing these two important products competitively and in an environmentally friendlymanner. Tables 7 and 8 below present the results of a study that compares conventional coalgasification approach for the manufacture of coal-based synthesis gas and hydrogen and twoadvanced technologies for producing hydrogen. To calculate the synthesis gas and hydrogenproduct cost, the following economic assumptions were made: all costs are given in 1998dollars, a discount rate of 6.4% after taxes was used, depreciation was based on AcceleratedCost Recovery System (ACRS) class, and an economic life of 30 years was assumed.Although absolute numbers are provided for the cost of hydrogen, the values are dependentupon the economic assumptions used in the analysis. It is therefore best to look at the

differences between cases to see the affect of using advanced technologies for producinghydrogen.
I I Synthesis I Hydrogen I Hydrogen I Transport I
Table 7: Synthesis Gas and Hydrogen Plant Performance and Cost Summary [21-23]
Synthesis Hydrogen Hydrogen TransportGas (Conv.) (Adv.) (Adv.)
Gasification 80,939 78,937 54,027 22,397Air Separation Unit 54,806 55,157 74,852 77,837Hydrogen Separation/Gas Cleaning 27,965 113,614 47,467 48,207Combustion Turbine --- ..- 16,844 15,272Heat Recovery Steam Generator --- 18,489 9,669 9,671Steam Turbine Generator 7,431 15,959 --- 3,690Other 82,304 92,117 103,746 119,970Total Plant Cost 253,445 374,273 306,605 297,044
Table 8: Synthesis Gas and Hydrogen Plant Total Plant Cost Summary, K$ [21-23]
For the synthesis gas and the conventional hydrogen processes, coal is gasifiedusing an oxygen-blown Destec gasifier operating at 2.9 MPa (abs). The raw synthesis gas iscooled to 330 ‘C and cleaned of particulate using candle filters. The synthesis gas is furthercleaned of chemical contaminants using a Nahcolite chloride guard bed, a COS hydrolysisunit, and a conventional acid gas removal process. The cleaned synthesis gas exits the plantat about 2.4 MPa (abs). For the hydrogen case, the clean synthesis gas is shifted and thehydrogen is separated from the process using pressure swing adsorption. In addition, the C02that is generated is concentrated for off-site use or disposal. The hydrogen sulfide removedfrom the synthesis gas in both cases was converted to sulfuric acid.
Unlike that for synthesis gas, the first advanced hydrogen plant case employs twosmaller diameter high-pressure Destec gasifiers operating at 6.9 MPa (abs). Following thegasifier, steam is injected into the raw synthesis gas stream to lower the temperature to about790 ‘C before particulate removal using candle filters. The particulate-free synthesis gasenters a hydrogen separation device where the water-gas shift reaction occurssimultaneously with the separation of hydrogen, producing 99.5% pure hydrogen. Thehydrogen is cooled and recompressed from 103 kPa (abs) to 2.4 MPa (abs). The COz-richstream leaving the hydrogen separation device contains about 5% of the fuel value of the inletgas stream. The gas is fed to an oxygen-fired ATS combustor which converts CO, Hz, andHZS to C02, MO, and S02. The hot gas is expanded through the ATS turbine expander toproduce electric power. The exit gas is cooled and treated in a mnventional flue gasdesulfurization (FGD) unit where the sulfur is recovered as gypsum. The cleaned COZ productis further cooled and can be sent off-site for utilization or sequestration. In the transporthydrogen case, an oxygen-blown transport gasifier is substituted for the Destec gasifier.
The performance and costs for the four cases are presented in Table 7. All four caseswere sized to process 2,270 t/d (dry) of Pittsburgh No. 8 coal (< 10’%0ash) costing $0.95/GJ.A breakdown of the plant capital costs is given in Table 8. It is clear from the results thatproducing hydrogen from coal-derived synthesis gas using pressure swing adsorption with

CO* collection is not an economically viable approach. Besides the high cost of the hydrogenproduct, the process produces less hydrogen because of limitations in the commercial shiftconversion unit. This further exacerbates the problem of carbon dioxide emissions andsequestration.
On the other hand, employing advanced high-temperature hydrogen separationtechnologies has potential for marked improvements in the cost of hydrogen from coal. Inaddition, the thermal efficiency is higher compared to the use of conventional technology. Thecost of $3.841GJ for producing hydrogen from coal is not significantly greater than the$3.37’/GJ hydrogen cost estimated for steam reforming of natural gas (assuming natural gasat a cost of $2. 16/GJ). Use of the potentially lower cost transport gasifier results in a furtherreduction in the cost of hydrogen. With the use of lower-cost feedstocks such as petroleumcoke in the advanced cases, hydrogen from gasification can compete with the cost ofconventional hydrogen from natural gas.
The advanced hydrogen processes used in this analysis have several technologicalhurdles that must be overcome. Preeminent is the development of the high-temperatureseparation device, This unit is envisioned to be a ceramic membrane, either of the molecularsieve type or a proton conducting membrane. Both technologies are currently underdevelopment and have shown promise for this application. The second critical area is thehigh-temperature barrier filters and the fate of alkalis in the gas stream. Currently, there areno filters that can operate in a reducing gas environment at the temperatures used in thestudy. Nevertheless, there are approaches to circumventing the filter problem with little or noimpact on processes performance and economics.
Sensitivity analyses were performed on the advanced hydrogen plants employing theDestec gasifier to assess the impact of multiple process trains to capitalize on economies ofscale. Increasing the output of the plant by a factor of five results in a synthesis gas cost of$2.7WGJ, while the hydrogen cost was reduced to $3.32/GJ. With the larger plants andpossibly the incorporation of advanced air separation technology, it appears that the cost ofhydrogen from coal can be competitive with conventional natural gas-based processes.
In a carbon-constrained world, the carbon dioxide produced from such processeswould have to be sequestered. If the cost to sequester carbon dioxide is assumed to be$16.5/t of CQ (equivalent to about $60/t of carbon sequestered), an additional cost of about$1 .9UGJ would have to be added to the final cost of hydrogen. Under this scenario, the costof hydrogen from the advanced process would be about $5.69/GJ.
5- Pros and Cons of Gasification
Gasification has many positive attributes compared to other technologies. Theseunique advantages of gasification-based processes have created a significant market inindustrial applications. Gasification is the only technology that offers both upstream (feedstockflexibility) and downstream (product flexibility) advantages. As mentioned before, all carbon-containing feedstocks including hazardous wastes can be readily gasified after properpreparation to produce clean synthesis gas for further processing. Because of its ability to uselow-cost feedstocks, gasification is the technology of choice for many industrial applications,such as in refineries, chemical plants, and the pulp and paper indust~. IGCC, andgasification-based processes in general, is also the only advanced power generationtechnology capable of coproducing a wide variety of commodity and premium products, inaddition to electricity, to meet future market needs. It is this ability to produce value-addedproducts that has made gasification economical in select situations.
Compared to combustion systems, IGCC is one of the most efficient andenvironmentally friendly technologies for the production of low-cost electricity. Furtherincreases in efficiency can be achieved through the integration of fuel cells. These higherefficiencies translate to lower carbon dioxide emissions, a consideration for future powerplants. In addition, the gasification process can be readily adapted with advancedtechnologies for the concentration of carbon dioxide with little impact on cost and thermaleficiency.

Because gasification operates at high pressure with a reducing atmosphere, theproducts from the gasifier are more amenable to cleaning to reduce ultimate emissions ofsulfur and nitrogen oxides, as well as other pollutants than those from combustion processes.In general, the volume of fuel gas that is cleaned of contaminants in an IGCC plant is typicallyone-third the volume of flue gases that must be treated in a conventional power plant.Processing lower volumes of gas translates to lower capital cost for pollution prevention. Theremoval of sulfur, nitrogen, and other contaminants from the reducing gas is also much easierthan from combustion products. This results in sulfur and nitrogen oxide emissions beingmore than an order of magnitude less than those of conventional combustion processes.
The by-product ash and slag from the gasification process has also been shown to benonhazardous. As such, the material can be readily used for landfill without added disposalcost. In addition, the ash and slag can be used in construction materials or further processedto produce value-added products.
Although the above attributes have made gasification technology economicallyattractive in a broad range of industrial applications, gasification has some potential hurdles toovercome before it is the technology of choice for all potential applications. Capital cost iscurrently the major impediment to deployment of the technology. The high cost can be’attributed to redundant equipment and over design due to lack of experience with thetechnology for a given application. Special handling and pretreatment necessary forprocessing alternative feedstocks such as municipal waste, biomass, hazardous materials,etc., and the added processing of undesirable by-products, such as tars produced from fixed-bed gasifiers, also adds to the processing cost. Air-blown gasifiers have been employed as ameans to reduce capital cost through the elimination of the cryogenic air separation unit.However, this approach is only applicable for power generation applications, and not for theproduction of fuels and chemicals or the capture and sequestration of carbon dioxide.
Construction costs for large greenfield gasification plants are high. However,gasification processes can be readily integrated into refineries and chemical plants. Throughproper integration and the use of existing infrastructure, the overall cost of a project can besignificantly reduced. Except for specific situations such as in the gasification of biomass, theconstruction of small gasifier systems is not economical. For biomass gasification, smallgasifiers are necessary because of the limited quantities of feedstock available. However, thehigh tar content of the product gas from such gasifiers usually dictates the need for expensivepurification processes prior to use in combustion turtines.
Today, the advantages of gasification-based technologies are being exploitedwhenever economically justified, and the disadvantages are being addressed through theconcerted research and development efforts of many organizations and governmentsthroughout the world. Both the U.S. and the European Union are actively involved insponsoring research to further the development of this vitally important technology. Althoughpublic authorities in Genmany and other European countries, as well as elsewhere around theworld, have accepted gasification for processing various waste materials, the economicsuccess of any gasification-based project will depend on many conditions, as discussed inSection 2.6.
6- Prospects for the Future
The principles of current gasification processes are now half a century old. BeforeWorld War 11,gasification was employed mainly to produce town gas. In the 1940s, thedevelopment of an economical process to produce pure oxygen through cryogenic separationenabled gasification to be employed in other applications, specifically production of synthesisgas as an intermediate for producing chemicals and fuels. Electric power generation accountsfor most of the current growth in gasification capacity. Much of this new and projectedgasification capacity is in industrial applications where power and steam are coproducedalong with synthesis gas for hydrogen or other chemical production.
Future growth in gasification capacity will likely be sustained by its uniqueadvantages. Gasification is the only technology that can handle a variety of feedstocks and

can produce, in addition to steam and power, a slate of high-value products includinghydrogen, environmentally superior transportation fuels, and chemicals. This flexibility offerssignificant hedges against market and environmental risks. Coproduction can improveprocess economics by offsetting synthesis gas generation costs with the sale of excess powerto the grid. Furthermore, coproduction reduces business risk by allowing the company toadjust to the forces of the market, producing the products that have the highest value. IGCCalso offers environmental advantages over other coal-fueled systems by its ability to processwastes and to limit air emissions to levels comparable to natural gas combined cycle plants.
Technical advances in gas turbine, fuel cell, gas cleaning, and gas separationtechnologies are expected to improve the performance of future generations of gasification-based systems. R&D contracts w“th industry are being sponsored in the United States todevelop advanced gasifier designs that have the potential to reduce capital and O&M costs,improve thermal efficiency, and process alternative feedstocks. Research is also beingconducted to integrate the entire system, i.e. advanced separation technologies andgeneration of value-added market products.
6.1- Coal Gasification
The main use for coal is, and will continue to be, for power production byconventional combustion plus steam cycle, or alternatively, by the IGCC process. The stageof development of the two technologies is very different. Combustion technology is wellproven, while IGCC, though promising higher efficiency, is still at the demonstration stage.Knowledge of IGCC technology is concentrated mainly in the United States and WesternEurope. At present, the future of IGCC plants is not clear, with different considerationsapplying in industrialized and developing countries.
[n industrialized countries, IGCC technology has to overcome serious competitionfrom other commercial technologies, and the current unfavorable competitive position of fuelgas and synthetic gas relative to oil and natural gas. Coal-based systems also suffer fromhigher COZ emissions compared to oil and gas, and produce large amounts of residual ash,which must be disposed of. Energy forecasts for developing countries predict a slow increasein electricity demand and, consequently, few new installations, with the exception of replacingold plants. In a deregulated market, natural gas power plants are favored because of theircurrent lower cost and faster return on investment.
IGCC processes are capital intensive, needing economies of scale to be an attractiveinvestment option. Because of the complexity of the process, the size of plant must be atleast 250 MWe to produce power at reasonable costs. Even for this size, the cost of electricityis higher than for smaller natural gas combined-cycle plants, especially with recent progressin gas turbine technology. However, gasification economics can be improved by integrationwith industrial applications. As examples, gasification can operate on low-cost opportunityfeedstocks, it can be used to convert hazardous waste into useful products, reducing oreliminating waste disposal costs, and it can coproduce power, steam, and high-valueproducts for use within the host plant or for export. Another feature of IGCC is that when gasprices escalate, it can be used to convert natural gas combined cycles to coal-based systemsby retrofitting with a gasifier to supply coal-derived fuel gas to the gas turbine.
Natural gas is predicted to be plentiful for at least the next 20 years. In spite of theabove discussion, the following are some positive viewpoints of coal gasification:
. Coal reserves are sufficient for many decades and are many times larger than theknown reserves of oil and gas. Though only a small increase is forecast for the use ofcoal in the next 20 years, over a longer period, the prospects are greater. IGCCplants must compete against the high thermal efficiency of natural gas power plantsreaching 55’XO(LHV). In coming decades, efficiencies are expected to reach 60’%(LHV) using advanced gas turbines. To benefit from the advantages of combinedcycles, coal and heavy residues must first be gasified. The challenge, therefore, is tomaximize the efficiency of converting the energy content of the feedstock into fuelenergy and/or sensible heat for use in a combined cycle.

. Coal usage could be advanced by technical breakthroughs. Examples includeimproved gasifier and air separation unit designs, novel processes for synthesis gasproduction, advanced bottoming cycles, integration with fuel cells, and economicalC02 sequestration approaches. These advances potentially could increase powerproduction efficiency in excess of 60% (LHV) while simultaneously producing multipleproducts and achieving near zero levels of emissions.
. In the near term there is a good probability that co-gasification of coal and wasteswill find industrial applications, arising from the capability of gasification to eliminatewastes in an environmentally benign and efficient way.
In developing countries the picture varies. It seems clear that in the coming decadescoal will be intensively used by countries with large reserves of coal, especially China andIndia, to support their industrialization programs. Coal can be used for power generation, butalso for town gas, particularly in China where most manufactured gas is produced from cokeovens and recovery processes. Gasification in China produces less than 10% ofmanufactured gas. For power generation, there will be some competition between simplecoal combustion combined with the classic steam cycle and the more sophisticated, but alsomore efficient, costly, and less polluting IGCC processes. Rapidly growing power demands indeveloping countries are resulting in large (up to 1200 MW) projects, and IGCC is competitiveat that scale. In some countries, coal supplies are of poor quality and, thus, technologies suchas IGCC can be much more cost competitive with conventional technologies. The future ofcoal gasification in developing countries will depend considerably on the financial andtechnological support policy of industrialized countries.
6.2- Gasification of Refinety Wastes
Gasification has a synergistic application in the refining industry where it can be usedto process refine~ wastes, avoiding waste disposal costs and increasing the yield fromincreasingly sour crude oil. The large quantities of high-energy streams produced at therefinery can be gasified to generate power, steam, and synthesis gas. Refineries are heavyusers of power and steam, are large users of hydrogen (extracted from synthesis gas), andare often located in close proximity to large chemical complexes (potential customers for boththe power and the synthesis gas coproduct).
A near-term market is emerging in the refining industry, with over 60 projectscurrently in operation or under construction that process petroleum feedstocks (including fueloil, refinery residue, petcoke, naphtha, etc.), generating over 19,000 MWth of synthesis gasoutput [1]. The high-temperature, entrained-flow gasifier is widely used in applications withrefine~ feedstocks. Other key process steps include air separation (the process requirespure oxygen), heat recovery and utilization, gas purification, sulfur recovery, and thecombined cycle power block. Competition among vendors has resulted in major costreductions and performance improvements for key process steps.
Several trends are occurring which could make IGCC the technology of choice formany more refineries [24]. Deregulation of power generation (in the U.S. and Europe) allowsindependent power producers to sell power to the grid, creating a market for excess electricityproduction. The immediate demand for additional baseload generation capacity in someregions of Europe provides opportunities for coproducing power at refineries via gasification.The hazardous waste classification of refinery residues in the U.S. makes this waste anattractive, negative cost fuel for power generation. And the effort to move refineries towardzero residues requires that wastes be utilized rather than discharged, while at the same timeresidue production is rising due to an increased demand for higher quality transportationfuels.
A large potential market for coproduction of electricity, chemicals, fuels and otherhigh-value products is just over the horizon for gasification, the only technology that offersboth upstream (feedstock flexibility) and downstream (product flexibility) advantages.Deploying IGCC in near-term industrial applications, such as refining, combined with

government sponsored R&D, setves as a bridge to the commercialization of advanced IGCCsystems.
6.3- Gasification of Biomass
The world energy market is expected to continue to be dominated by fossil energy inthe coming decades; however, good opportunities exist for the production of energy frombiomass in developing countries. These countries lack their own fossil energy reserves andhave limited financial capabilities to import large amounts of fossil energy to support theireconomic development. In this situation, biomass energy may become an important energysource where the climate is suitable for biomass production, such as in Asia, Africa, and LatinAmerica.
The technology for biomass conversion into electricity involves either combustion orgasification. Though biomass gasification combined-cycle plants can reach a higher efficiencythan combustion plants, the technology is still in the developmental phase, perhaps becomingcommercial by 2003. Development of this modern technology is concentrated in WesternEurope and North America. Compared to other energy projects, such as coal and hydro, thecapital needs for biomass energy projects are relatively low because of their smaller size.
In developed countries, the benefits of biomass gasification include its potential as arenewable energy process to reduce carbon dioxide emissions. One application for biomassgasification is its use as a clean and efficient replacement for aging black liquor and biomass-fueled steam turbine cogeneration capacity in the pulp and paper industry. The gasificationprocess can efficiently convert the biomass waste from pulp and paper mills into steam andpower, or synthesis gas fuel for kiln operation, while also destroying hazardous chemicals andreducing sulfur emissions. These environmental benefits may induce governments in Europeand North America to increase support for biomass energy projects, which is crucial forfurther development of these technologies.
6.4- Waste/Garbage Gasification
The thermal utilization of waste, separately or mixed with conventional feedstocks, bymeans of gasification is an interesting new technical development, especially in Germany.This new line may also be of interest in other industrial countries. The largest gasificationplant of this kind is operating successfully at Schwarze Pumpe, Germany.
Because of the lack of space for landfills in some countries and increasingly stringentenvironmental regulations, it is anticipated that utilization of thermal processing techniques forwaste will increase in the future. A trend for the use of gasification is especially perceptible inEurope. The efficient recovery of energy from waste gasification processes may only bepossible when pre-separated waste is used. Another possibility is the m-gasification of wastein large coal gasification plants. The latter process is in direct competition with coalgasification. Under favorable conditions, it may be hoped that gasification of waste materialsin the future wi II find greater application.
6.5- Hydrogen
With a finite supply of fossil fuels in the world and ever increasing concerns overglobal climate change due to carbon dioxide emissions from the burning of carbon-basedmaterials, hydrogen will likely become the fuel of choice for future generations. When burned,hydrogen is a clean, non-polluting fuel, its combustion product being only water. Today, over99% of all hydrogen is produced from fossil fuels and is utilized in the refining industry for themanufacture of transportation fuels and in the chemical industry, primarily for ammoniasynthesis. Steam methane reforming and methane partial oxidation technologies are theprimary processes employed in its production; however, both technologies are very energyand capital intensive. As a result of the high production costs and the lack of a significantdistribution infrastructure, hydrogen has not yet found wide application in other energymarkets such as power and transportation.
Although many believe that a hydrogen industry, and with it the hydrogen economy,will eventually evolve, the transition is expected to take several decades to complete. In the
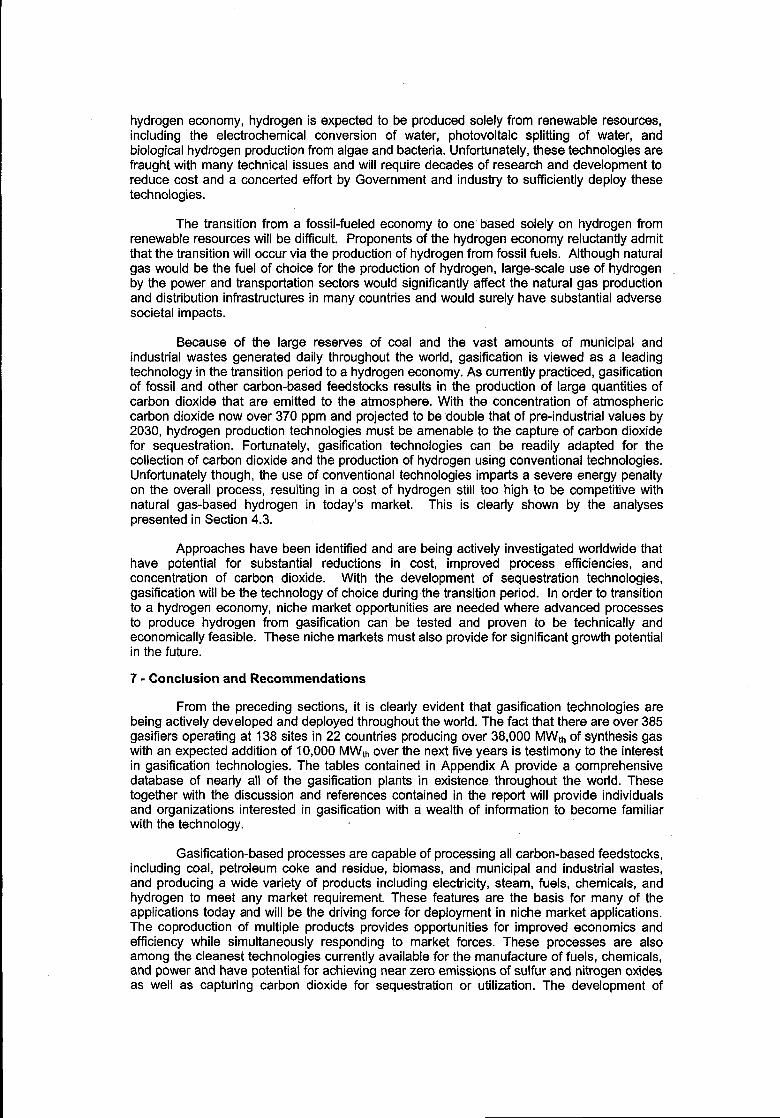
hydrogen economy, hydrogen is expected to be produced solely from renewable resources,including the electrochemical conversion of water, photovoltaic splitting of water, andbiological hydrogen production from algae and bacteria. Unfortunately, these technologies arefraught with many technical issues and will require decades of research and development toreduce cost and a concerted effort by Government and industry to sufficiently deploy thesetechnologies.
The transition from a fossil-fueled economy to one based solely on hydrogen fromrenewable resources will be difficult. Proponents of the hydrogen economy reluctantly admitthat the transition will occur via the production of hydrogen from fossil fuels. Although naturalgas would be the fuel of choice for the production of hydrogen, large-scale use of hydrogenby the power and transportation sectors would significantly affect the natural gas productionand distribution infrastructures in many countries and would surely have substantial adversesocietal impacts.
Because of the large reserves of coal and the vast amounts of municipal andindustrial wastes generated daily throughout the world, gasification is viewed as a leadingtechnology in the transition period to a hydrogen economy. As currently practiced, gasificationof fossil and other carbon-based feedstocks results in the production of large quantities ofcarbon dioxide that are emitted to the atmosphere. With the concentration of atmosphericcarbon dioxide now over 370 ppm and projected to be double that of pre-industrial values by2030, hydrogen production technologies must be amenable to the capture of carbon dioxidefor sequestration. Fortunately, gasification technologies can be readily adapted for thecollection of carbon dioxide and the production of hydrogen using conventional technologies.Unfortunately though, the use of conventional technologies imparts a severe energy penaltyon the overall process, resulting in a cost of hydrogen still too high to be competitive withnatural gas-based hydrogen in today’s market. This is clearly shown by the analysespresented in Section 4.3.
Approaches have been identified and are being actively investigated worldwide thathave potential for substantial reductions in cost, improved process efficiencies, andconcentration of carbon dioxide. With the development of sequestration technologies,gasification will be the technology of choice during the transition period. In order to transitionto a hydrogen economy, niche market opportunities are needed where advanced processesto produce hydrogen from gasification can be tested and proven to be technically andeconomically feasible. These niche markets must also provide for significant growth potentialin the future.
7- Conclusion and Recommendations
From the preceding sections, it is clearly evident that gasification technologies arebeing actively developed and deployed throughout the world. The fact that there are over 385gasifiers operating at 138 sites in 22 countries producing over 38,000 MWth of synthesis gaswith an expected addition of 10,000 MWt~ over the next five years is testimony to the interestin gasification technologies. The tables contained in Appendix A provide a comprehensivedatabase of nearly all of the gasification plants in existence throughout the world. Thesetogether with the discussion and references contained in the report will provide individualsand organizations interested in gasification with a wealth of information to become familiarwith the technology.
Gasification-based processes are capable of processing all carbon-based feedstocks,including coal, petroleum coke and residue, biomass, and municipal and industrial wastes,and producing a wide variety of products including electricity, steam, fuels, chemicals, andhydrogen to meet any market requirement. These features are the basis for many of theapplications today and will be the driving force for deployment in niche market applications.The coproduction of multiple products provides opportunities for improved economics andefficiency while simultaneously responding to market forces. These processes are alsoamong the cleanest technologies currently available for the manufacture of fuels, chemicals,and power and have potential for achieving near zero emissions of sulfur and nitrogen oxidesas well as capturing carbon dioxide for sequestration or utilization. The development of

advanced technologies that lead to lower costs, reduced emissions, and higher thermalefficiencies will provide gasification with many new markets opportunities in the future.Gasification is expected to become a key technology in the transition to a hydrogen economy.
Based on the information contained in this report, the WOC 2 Committee onManufactured Gas recommends the foIlowing:
. Continue monitoring the technology development and commercialization activitiesin industry and governments throughout the world.. Explore existing and new market opportunities for the supply of synthetic naturalgas, and gas for power generation and steam production.● Investigate opportunities for supplying synthesis gas for the manufacture ofchemicals and fuels,. Develop a strategic plan to ensure a leadership position in the hydrogen economyand the mitigation of carbon dioxide emissions.. Actively support the development and demonstration of gasification and supportingtechnologies to meet future market requirements.
8- References
1 – Simbeck, D., “Worldwide Gasification Industry Report,” Presented at the GasificationTechnologies Council Meeting, Washington DC, April 22, 1999.2 -K. V. Thambimuthu, 1993: Gas Cleaning for Advanced Coal -Based Power Generation.IEACFU53, IEA Coal Research, London.3-S. C. Mitchell, 1997: Hot Gas Particulate Filtration. IEA Coal Research, London.4 -S. C. Mitchell, 1998: Hot Gas Cleanup of Sulfur, Nitrogen, Minor and Trace Elements.lEACCC/12, IEA Coal Research, London.5- Keeler, C. G., “Wabash River In Its Fourth Year of Commercial Operations,” Presented atthe 1999 Gasification Technologies Conference, San Francisco, October 18, 1999.6- lEAGREEN. http://ieagreen. org.uk./emis6.htm.7- Bridgwater, A. V. 1995: The Technical and Economical Feasibility of BiomassGasification for Power Generation. Fuel Vol. 74, no. 5, pp. 631-653. Elsevier Science Ltd.8- P. Schulze - Lammers ,1985: Environmental Aspects of Biomass Gasification. pp. 874-878 in Energy from Biomass, 3d E.C. Conference, Venice, ISBN O-85334-396-9.9 - Keeler, C., and Stultz J. 1998: Operating Experience at the Wabash River CoalGasification Repowering Project. pp. 53-66 in Proceedings Volume II - Sixth Clean CoalTechnology Conference, Reno, Nevada.10- Berry, T. et al., 1998: Tampa Electric Company Polk Power Station lGCC-Project. ProjectStatus, Presented at Advanced Clean Coal Technology International Symposium 1998,Tokyo, Japan.11- Takematsu, T., and Maude C., 1991: Coal Gasification for IGCC Power Generation.IEACW37, IEA Coal Research, London, ISBN 92-9029-190-7.12- L.B. Clark, 1991: “Management of the By-Product from IGCC Power Generation,” IEACR/38, IEA Coal Research, London.13- “Texaco Gasifier IGCC Base Cases,r’ U.S. DOE Federal Energy Technology CenterReport No. PED-IGCC-98-OOI (rev. 1), July 1998.14- “Shell Gasifier IGCC Base Cases,” U.S. DOE Federal Energy Technology Center ReportNo. PED-IGCC-98-O02, July 1998.
15- “British Gas/Lurgi Gasifier IGCC Base Cases,” U.S. DOE Federal Energy TechnologyCenter Report No. PED-IGCC-98-O03, September 1998.16- “Destec Gasifier IGCC Base Cases,” U.S. DOE Federal Energy Technology CenterReport No. PED-IGCC-98-O04, September 1998.17- “Transport HGCU Gasifier IGCC Base Cases,” U.S. DOE Federal Energy TechnologyCenter Report No. PED-IGCC-98-005, September 1998.18- “Air Blown KRW Gasifier IGCC Base Cases,” U.S. DOE Federal Energy TechnologyCenter Report No. PED-IGCC-98-006, September 1998.19- Parsons Infrastructure & Technology, “Market-Based Advanced Coal Power Systems,”Final Report, Contract No. DE-AC 01-94 FE 62747, December 1998.20- Stiegel G. J., “ Mixed Conducting Ceramic Membranes: A New Paradigm for GasSeparation and Reaction, presented at the Sixteenth Annual Membrane Technology PlanningConference, Boston, Mass, December 7-9, 1998.

21- Parsons Power Group, Inc., “Decarbonized Fuel Production Facility, Base CaseComparisons,” Letter Report, Contract No. DE-AM01-98-FE65271, June 1999.22 - Badin, J., DeLallo, M., and Temchin J. ‘rDecarbonized Fuel Production Facility, ATechnical Strategy for Coal in the Next Century, “ Presented at the PowerGen InternationalConference, December 9-11,1998.23- Parsons Energy and Chemical Group Inc., “ DeCarbonized Fuel Plants Utilizing InorganicMembranes for Hydrogen Separation,” Presented at the Twelfth Annual Conference of FossilEnergy Materials, Knoxville, TN, May 12-14, 1998.24 – J. M. Klara, B. J. Tomer, and G. J. Stiegel, “A Market-Driven Commercialization Strategyfor Gasification-Based Technologies,” Presented at Power-Gen International ’97, Dallas,Texas, December 9-11, 1997.
Bibliography
20th World Gas Conference-Copenhagen, 10-13 June, 1997, Report of Committee B,“Production of Manufactured Gases and Hydrogen.” ‘
Status of Development and Market Penetration of Clean Coal Technologies (CCT) for PowerGeneration--A Thermie Type B Action on Clean Coal Technologies (CCT), EU Seminar,Dusseldorf, 1998.
‘rBiomass Gasification and Pyrolysis-State of the Art and Future Prospects, edited byM. Kaltschmitt and A. V. Bridgwater, CPL Scientific Limited, 43 Kingsfisher Court, NewburyRG 145SJ, United Kingdom.
Overend, R, P. (National Renewable Laboratory, Golden, Colorado, U.S.) and Costello, R.(Department of Energy, Washington, D.C.): “Bioenergy in North America: An overview ofliquid biofuels, electricity and heat.”
Ph.C. Philippe Chartier and C.S. Catherine de Silguy (Agency for Environment and EnergyManagements, Paris, and S.D. Serge Defaye and L.B. Liliane Battais (C. L.E.R., Comite’deLiaison des Energies Renouvelables, Paris (France): “Perspectives for biomass energy in theEuropean Union.”
Maniatis, K., Papadoyannakis, M. A. Segerborg-Fick, DG XVII & DG X11, EuropeanCommission, Rue de la Loi, 200, Brussels.
Craig, K.R., Bain, R. L., Overend, R. P. (National Renewable Energy Laboratory, 1617 ColeBoulevard, Golden, Colorado): “ Biomass Power Systems - Where are we going, and how dowe get there? - The Role of Gasification, presented at EPRI Conference on New PowerGeneration Technology, October 25-27, 1995, San Francisco, California.
Oettel, E., Unger, T., Seifert, G. (Stork Comprimo GmbH, Magdeburg, Germany): Review,prepared in the framework of the European reports: “Review of a integrated fixed-bedgasification systems with small output.”
“Gas Cleaning Technologies for Small Scale Biomass Gasifies,” Ph. Hasler, R. Buhler, EUProject IOR3-CT 95-0084, Task IV, 1996, Report prepared within the framework of the NonNuclear Energy Programme Joule III of the European Commission.
Waste Wood - Energy-related and material utilization, removal, process engineering,logistics, Editoc R. Marutzky, Fraunhofer - Company and W. Schmidt, office for environmentof the country NRW, VDI - Publishers, 1996 (Special Publications).
Gasification Processes for the waste disposal, Editoc M. Born and R. Berghoff, Coordination:VDI - Educational Establishment, Special Publications. VDI - Publishers/Springer Publishers,1998.
Gasification-’’The Gateway to Cleaner Future” Conference of lchemE, 23-24 September1998, Dresden, Germany.

H. Mohry, H.-G. Riedel, “Cleaning of the Air”, VEB German Publication for Basic Industry,1979.
W. Fritz, H, Kern, “Cleaning of Off-Gases”, Vogel Publication, 1992.
J. Schmidt, “Process of Gas Preparation, “German Publication for Basic industry, 1970,
H. Mohry, H.-G. Riedel, “Cleaning of Off-Gases, “German Publication for Basic Industry,1970.

9-Acronyms
abs - absoluteACRS - Accelerated Cost Recovery SystemAGR - acid gas removalAPI - American Petroleum InstituteATS - advanced turbine systemBTX - benzene, toluene, and xyleneCCT - clean coal technologyCH4 - methaneCO - carbon monoxide/COz - carbon dioxideCOE - cost-of-electricityCOS – carbonyl sulfideDOE - Department of EnergyDSD - the special collecting system in Germany for used household packaging materialsEJ - exa (1018) jouleEPACT - Energy Policy ActEPRI - Electric Power Research InstituteFERC - Federal Energy Regulatory CommissionFGD - flue gas desulfurizationFOAK - first-of-a-kindGJ - giga (109) jouleGt/a -giga(109) tonnes annuallyH2- hydrogenH2S - hydrogen sulfideHCN - hydrogen cyanideHGCU - hot gas cleanupHGD - hot gas desulfurizationHTW - high-temperature WinklerIEA - International Energy AgencyIGCC -- integrated gasification combined cycleIGFC - integration gasification fuel cellIGT - Institute of Gas TechnologyIGU - International Gas UnionK$ -thousand dollarsKRW - Kellogg-Rust-Westinghousektld - thousand tonnes per daykW - kilowattkWh - kilowatt hourLHV - lower heating valuem3- cubic metermg - milligramsMJ - mega (106) jouleMPa - megapascalsMSW - municipal solid wasteMWe -megawatt electnc/MWth - megawatt thermalN - NormalNH3 - ammoniaNOX - nitrogen oxideppm - parts per millionppmv - parts per million volumePURPA - Public Utility Regulatory Policies Act of 1978R&D - research and developmentRDF - refuse derived fuelSNG - substitute natural gasS02 - sulfur dioxides/SOx - sulfur oxidet - tonneTAG - Technical Assessment GuideTASI - new regulation in Germany of municipal solid waste

Coalbed Methane Report
TABLE OF CONTENTS
1- Introduction
2- Coal and Colbed Methane Reserves and Resources
3-Technical Processes for Colbed Methane Recovery
3.1- Methane Drainage or Degasification from Mines
3.2- Methane Recovery by Wells in Unmined Areas
3.3 – Technologies Associated with Methane Recovery
4 – Guidelines for Economic CBM Production
5 – CBM Projects
6- Conclusion
7- References

Introduction
Given the widespread distribution of coal-bearing strata around the world, it isreasonable to assume that high-quality basins with commercial possibilities for coalbed gasproduction exist. Thick, gas-filled coal seams are present on all populated continents asshown by coal production statistics and numerous methane-related mining disasters. In somecountries, such as China, the potential gas resources contained in the coal seams mayexceed the conventional gas resource base. However, it is still too early to know howefficiently and quickly this enormous international gas resource can be utilized as aneconomic gas reserve.
It has been known for some time that methane in coalbeds is hazardous for coalmining operations. In order to reduce this hazard, methane began to be removed fromdeposits. Initially the main objective of the procedure was to reduce the methane hazard.Then attention was drawn to the possibility of using the methane as an energy source.Methane extracted by advanced methane-removal methods, carried out in the course of coalproduction, has been accepted as a complementary energy resource. Its existence is beingestimated systematically to be included as part of the world balance of resources.
The method of active methane removal from coalbeds through boreholes drilled fromthe surface was developed in the United States in the 1970s and 1980s. This drew attentionto methane as a substance that could be produced independently of regular coal production.In those areas where coal is not mined, methane can be a principal objective in coalbeds, aswell as in the surrounding permeable rocks.
Since the early 1990s, there have been significant developments in coal minemethane recovery, particularly in the number of active recovery and use projects, and thevolume of methane sold. Today, there are at least 17 mines with active methane recovery anduse projects in the US, recovering almost 50 bn ft? (1.4 bn m3) of methane annually, or about134 m ft3/day (3.8 m m3/day). Mines inject most of this methane into commercial gaspipelines, but a small amount is used for power generation or heating.
In the past twenty years, annual coalbed methane (CBM) production in the US hasgrown from negligible amounts to more than 28.3 bn m3 from more than 6000 wells,accounting for 5 per cent of annual domestic gas production. Latest estimates by the EnergyInformation Administration (US Department of Energy) place US proved CBM reserves at 300bn m3 (10.6 Tc9.
The observed variability of coalbed methane content is determined by a whole rangeof primary and secondary factors connected with the origin, accumulation, and migration ofgases in the coal-bearing strata, as well as the characteristics of the coal. According to theliterature, the most important factors are as follows: degree of advance of the process ofconversion of organic matter to coal (degree of coal metamorphism), bed conditions(temperature and pressure), physiochemical properties and petrographic composition ofcoals (especially their sorptive properties), the chemical composition of the gases, thereservoir-filtration properties of the coal deposits (especially fracturing), and the presence ofan impervious sealing overburden. These factors are, as a rule, interrelated andinterdependent, which makes it necessary to adopt a complex approach to the quantitativedescription of coalbed methane content and resource potential.
Coal and coalbed Methane Reserves and Resources
Stated simply, the coal resource base worldwide is large. The proven reserves ofcoal are generally accepted to be those quantities which geological and engineeringinformation indicate with reasonable certainty can be recovered in the future from knowndeposits under existing economic and operatin conditions. Known reserves logged at the
19end of 1994 exceeded 29,365 EJ, about IxIO tonnes (1 ,718.9 EJ in Africa; 8,870.4 EJ inCentral and Eastern Europe; 5.6 EJ in Middle East; 7,044.6 EJ in North America; 287.0 EJ inSouth America; 2,675.5 EJ in Western Europe; and 8,763.5 EJ in Western Pacific and Asia).The largest coal reserves are located in Central and Eastern Europe (30%), West Pacific and

Asia (30%), and North America (24%). In 1994, the largest amounts of coal were produced inthese same three regions. However, these proven reserves are only a portion of the totalcoal resource, which may be as much as 25 times greater. Four countries Russia, China, theUnited States, and Canada account for nearly 90’?4.of the total. In view of this very largeamount of coal, it is reasonable to infer the existence of a large world coalbed gas resource.
Worldwide CBM resources may range from 84 trillion m3 to more than 350 trillion m3(3000 to 12.600 Tcf) (table 1).
Country bn tonnes trillion m3
Russia 6500 17-113
China I 4000 I 30-79 I
United States I 3970 I 7.8- 18.4 I
Canada I 7000 I 8.5-12 I
Australia I 1700 I 8.5- 14.2 I
Germany 320 2.83
United Kingdom 190 1.70
Kazakhstan 170 1.13
Poland 160 2.83
India 160 0.85
Southern Africa’ 150 1.13 IUkraine 140 1.70
TOTAL 24.460 84-358Source: Kuuskraa et al., 1992
● includes Republic of South Africa, Zimbabwe and Botswana
Table 1: Coal and coal seam gas resources in selected countries
Technical Processes for Coalbed Methane Recovery
Unlike typical natural gas reservoirs, methane in coalbeds is mainly in the adsorbedform. Coal, as a rock medium, varies considerably. Typical beds usually have a Iaminarstructure and a low permeability on the order of a few md. Therefore, the main problem ineficient methane recovery from coalbeds lies in initiating the process of methane releasefrom the coal (gas resorption is associated with a “swelling” of the body of coal), stimulationof the coal medium, and maintenance of proper production conditions.
The ways of removing methane from coalbeds include:● Through horizontal holes drilled in the face of the coal seam being mixed.. Through vertical holes drilled into the coal seam for venting.. Through holes drilled from the surface to coalbeds, similarly to ~pical gasreservoirs.● Extraction of methane with ventilation air from the working areas of coal mines.. Extraction of methane through gob wells drilled from the surface to a depth abovethe coal seam being mined.
As was mentioned earlier, methane has to desorb from the coal before it can flow tothe well. Gas resorption increases as the coalbed brine is removed from the coal. Disposalof these brines by injection into disposal wells, by surface disposal, or by treatment to recoverusable water supplies is an integral part of methane recovery from coal.
When methane extraction via vertical wells drilled from the surface is to take placefrom beds which are not and will not be mined for coal, methane resorption is increased byhydraulic or gas/ nitrogen, C02/ fracturing or cavitation. When applying these processes, itshould be realized that Young’s Modulus for coal is small; therefore, high fracturing pressures

and backfilling having a suitable granular structure (sand filling) and porosity (gravel filling)have to be applied.
In hydraulic fracturing, a fracture zone or system of fractures is formed in coalbeds.As already mentioned, the coal matrix has a very low permeability, and the fracture systemsare the main channels of gas flow. To achieve reasonable drainage of the methane resource,wells have to be closely spaced. Low-cost techniques for drilling and completion of wells areessential for economic recovery.
Most of the current projects fall into one of the following two categories:. Natural gas projects that produce coalbed gas from unmined coal, mine seams orbasins.. Mining-related projects with a primary aim to improve mine safety and productivityby draining methane from the coal and mine by vertical, horizontal, and gob (cavedarea) wells.
The mining projects also have environmental incentives. By recovering the gas and utilizing itas a clean burning fuel, methane (a potent greenhouse gas) emissions to the atmosphere arereduced.
Methane Drainage or Degasification from Mines
The history of coal mining contains records of thousands of methane-initiated mineexplosions. Methane is explosive in concentrations of 5 to 15% in air. The methane contentof mine air must be maintained well below the explosive concentration to minimize the risk ofexplosion from pockets of mine air with higher than average methane content.
Underground mines throughout the world use ventilation systems to dilute methane toconcentrations well below the explosive level. In gassy coal mines, however, such systemsare often incapable of safely and economically handling the methane emissions. In suchsituations, additional mine degasification techniques are used to pre-drain or vent themethane from the coal seams and surrounding strata. Many mining operations vent theproduced gas to the atmosphere, although some mines use the gas for on-site powergeneration and space and water heating. In situations where the methane concentration is ofpipeline-quality natural gas, the methane may be fed to collection and pipeline systems. Thequality of the methane produced in these systems can be high, meeting pipelinespecifications for the recovered methane.
In 1992, a Coal Industry Advisory Board study entitled “Global Methane Emissionsfrom the Coal Industry” estimated that global methane emissions from the world coal industrywere about 23 xl OGtonnes per year, of which only about 7% was being recovered andutilized.
The commercial viability of coalbed methane (CBM) recovery and utilization projectsis determined by three basic factors: geology, technology, and the economy. Geology andtechnology determine the efficiency or technological potential for recovery; the economicenvironment largely determines the extent of utilization.
Methane Recovery by Wells in Unmined Areas
The United States is the world leader in the development of technologies to exploitCBM as a primary energy source. The first case of the extraction of CBM from the surface,and not as part of a mining operation, took place in 1931.
The development of technology for recovery of coalbed methane and coal minemethane began in the 1970’s under U.S. Bureau of Mines sponsorship. Responsibility for thisactivity was shifted to ERDA (the U.S. Energy Research and Development Agency) in 1975and to ERDA’s successor, DOE (the U.S. Department of Energy) in 1977. The technologywas deemed by DOE to be ready for commercial implementation in 1982, and theresponsibility for commercial development of the technology was shifted to the Gas Research

Institute (GRI). GRI’s leadership and the passage of the Section 29 tax credit provided theneeded support for development of a production and transportation infrastructure andcontinuing technical improvements, i.e., technology in the Black Warrior Basin of Alabamaand the San Juan and Raton Basins in Colorado and New Mexico. Without this tax credit, it isdoubtful that the current level of coalbed methane production would have been achieved.The tax credit applied to coal bed methane wells started before December 31, 1992, andcredit for any given well extended for 11 years from the date of initial production.
The techniques to recover gas from coal were not used on a commercially significantbasis, however, until 1977, when a successful series of wells was established in the San JuanBasin. There has been considerable development since that time, and it is now estimatedthat there are over 8,000 operational CBM wells in the United States. Coalbed methane isofficially recognized as part of the U.S. natural gas reserves and represents about 6% of totalU.S. natural gas production. A typical well in the northern portion of the San Juan Basin hasa peak production rate of about 15,000 to 30,000 m3/d and may be expected to produce 30 to40xI Oem3 over its operating life.
ELsewhere, CBM pilot projects in the field are being started with commercialintentions in dozens of countries as diverse as Australia, Canada, China, Britain, Poland,Germany, France, Russia, Belgium, Spain, and Zimbabwe. With this high level of interestand activity, we are seeing the birth of a new energy industry, not merely confined to the U.S.coal basins, but one truly international in scope and potential.
Technologies Associated with Methane Recovery
Many of the techniques for producing CBM have been adapted from conventionaloilfield drilling, completion, stimulation and production operations. However, coal’s unusualbehaviour and nature as both a source rock and reservoir rock for natural gas (andoccasionally oil) demand new technologies and ideas from many disciplines.
The methods used for extracting CBM and conventional gas deposits differconsiderably. In the process of CBM extraction, the following phenomena occur: formationwaters saturating the coalbed fracture system must first be produced to achieve the free flowof methane from the coal deposit, allowing gas resorption from the coal surface to take placeat lowered reservoir pressure (below the so-called resorption pressure). Original coalporosity is generally low, seldom exceeding 6’ZOand about 2’XOon the average. Coalbedthickness in most cases ranges from a few meters to a dozen. In such a situation, verticalboreholes (where the contact area with the deposit is minimal) do not usually ensure gasproduction in industrially interesting quantities. Production from such boreholes usually doesnot exceed around m3/min and some stimulation is necessary. The most important yield-intensification procedure is hydraulic fracturing, in the course of which a vertical or horizontal,highly permeable fracture is formed around the borehole. In this way, conditions for theformation of fluid inflow are changed. The pressure is lowered below resorption pressure andgas is liberated from the coal mass below the borehole in large volumes.
Low thickness and porosity are the main differences between CBM deposits andconventional gas deposits. Permeability is also very low and strongly anisotropic. Laboratoryexperiments prove that permeability is greatest in a direction perpendicular to that of themaximum strain propagation; therefore, the objective of each intensification procedure is tocreate a fracture running perpendicular to the line of maximum natural coal permeability.
The investigation of coalbed fracturing and its impact on methane filtration has shownthat these beds have an organized structure of fractures, connected with the way the bedswere laid down. With these studies it has been possible to determine coefficients of methanepropagation within the coalbed, both vertically and horizontally in relation to the bedding.
Anisotropy of coal permeability also results from the existence of a system of naturalfractures, which may open up as the pressure grows. This may result in water flow out of themedium and the formation of obstructions that inhibit crack propagation caused by excessiveconcentrations of the backfilling material. It should be borne in mind that fine coal particles

migrating with the sealing fluid may also add to the lowered permeability of the fractureformed.
To increase CBM flow rates, the accepted practice recommends opening up withhorizontal boreholes, possibly followed by their fracturing if the yield is still unsatisfactory. Asopposed to hydraulic fractures, the plane of which is generally disadvantageous from thepoint of view of yield growth, horizontal boreholes cut the deposit in a direction perpendicularto the line of best coal permeability. Opening up with a horizontal borehole is considered tobe more advantageous than vertical borehole fracturing for strongly anisotropic coalbedpermeabilities. Due to the complicated nature of the natural stresses in coalbeds(non-uniform field of stresses), it is extremely difficult to predict the behavior of inducedfractures without prior studies.
It should be stressed that CBM gas deposits differ considerably from deposits insedimentary rocks, with regard to the composition of the gas and its origin (coalbed gascontain 98% methane on the average) and the physical and chemical phenomena affectinggas flow to the borehole. In the case of coal-beds, permeability and porosity depend more orless significantly on the overburden pressure. Presently, phase flows in coal are being studiedand the initial results are proving how important this issue is.
The United States has become the world leader in developing new and improvedtechnologies for the recovery of methane from coal seams. Research over the past decadehas resulted in important discoveries as to the best method of reservoir evaluation, creation offractures and cavity formation, control of damage to structures and production techniques.Typically, pilot exploration wells are drilled using conventional techniques, with the primaryobjective of maintaining borehole stability and pressure control by drilling with mud. However,such techniques can be modified to suit any CBM basin worldwide.
The U.S. experience also provides guidelines for estimating well costs, as well as forthe recognition of potential obstacles for coalbed methane production. Generally, CBMproduction is preceded by sustained periods of water removal from the formation. Water ismainly disposed of by outflow through a vertical borehole or as surface run-off. Either ofthese alternatives may result.in the need to construct parallel gathering systems for gas andwater, which obviously adds to the expense of CBM production. CBM wells are often shallowand, as a result, are relatively inexpensive to drill and commission. However, the applicationsof available technologies to maximize output rates may add to the costs considerably.
Guidelines for EconomicCBM Production
While technological advances have increased the commercial viability of coal seamgas, practical experience in the U.S. has demonstrated that only under certain conditions areeconomically viable gas production rates possible. The many technical factors affectingproduction rates may be grouped into two categories relating to gas content (i.e., the amountand composition of occluded gases present within the coals) and reservoir deliverability (i.e.,the ability of the gas to migrate through the reservoir to a production well). The optimizationof these two factors forms the criterion for coal seam gas exploration. In most geologicalsettings, inadequate gas deliverability presents the greatest technical barrier to economicCBM production. Without adequate permeability even a hugely extensive gas resource maybe valueless.
In the upcoming years it can be envisaged that the growth and development of CBMproduction outside the U.S. will be facilitated by the design of new technologies and,principally, by the extension of such known techniques in the field of stimulation andexploration as:
●
●
●
●
●
Open hole dynamic (cavitated) completions.Advanced, improved hydraulic fracture initiations.Enhanced recovery of CBM by inert gas (e.g., nitrogen) injection.Multi-component seismic investigation of coalbed reservoirs.Improved reservoir simulation parametric techniques.
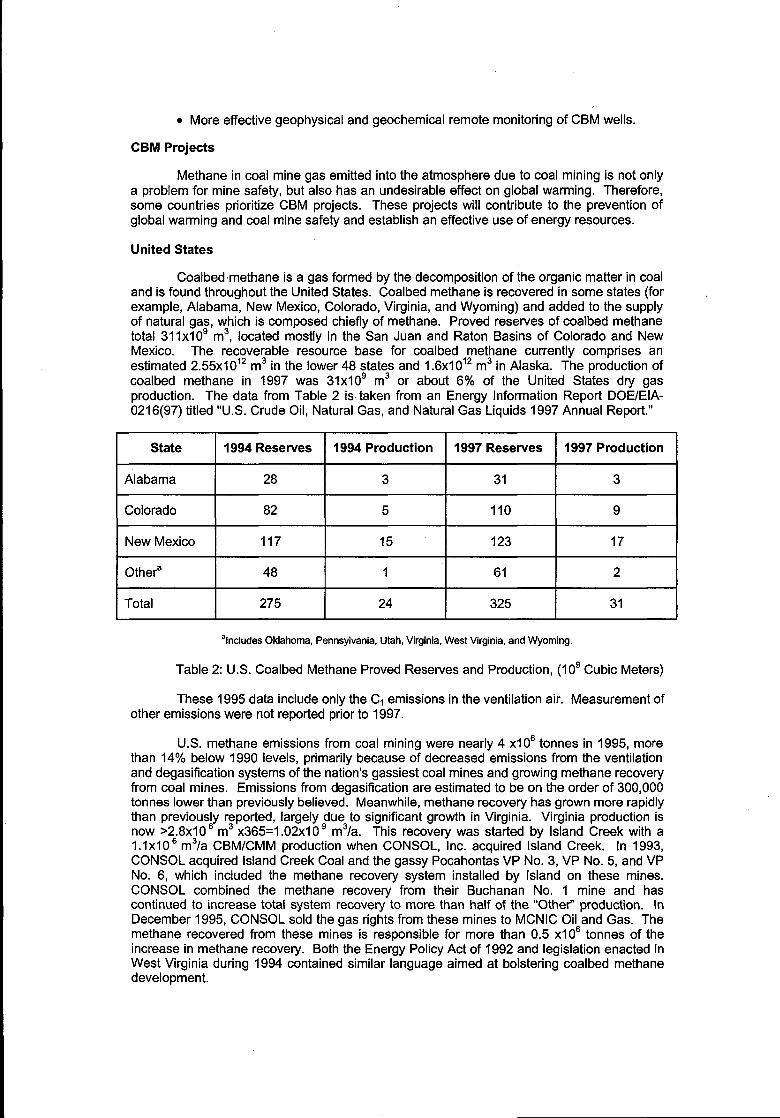
● More effective geophysical and geochemical remote monitoring of CBM wells.
CBM Projects
Methane in coal mine gas emitted into the atmosphere due to coal mining is not onlya problem for mine safety, but also has an undesirable effect on global warming. Therefore,some countries prioritize CBM projects. These projects will contribute to the prevention ofglobal warming and coal mine safety and establish an effective use of energy resources.
United States
Coalbed methane is a gas formed by the decomposition of the organic matter in coaland is found throughout the United States. Coalbed methane is recovered in some states (forexample, Alabama, New Mexico, Colorado, Virginia, and Wyoming) and added to the supplyof natural gas, which is composed chiefly of methane. Proved reserves of coalbed methanetotal 31 1x10⁹ m3, located mostly in the San Juan and Raton Basins of Colorado and NewMexico. The recoverable resource base for coalbed methane currently comprises anestimated 2.55x1 012 m3 in the lower 48 states and 1.6x10¹² m3 in Alaska. The production ofcoalbed methane in 1997 was 31xl 09 m3 or about 6% of the United States dry gasproduction. The data from Table 2 is taken from an Energy Information Report DOE/EIA-0216(97) titled “U.S. Crude Oil, Natural Gas, and Natural Gas Liquids 1997 Annual Report,”
State 1994 Reserves 1994 Production 1997 Reserves 1997 Production
Alabama 28 3 31 3
Colorado 82 5 110 9
New Mexico 117 15 123 17
Othe? 48 1 61 2
Total 275 24 325 31
‘Includes Oklahoma, Pennsylvania, Utah, Virginia, West Virginia, and Wyoming.
Table 2: U.S. Coalbed Methane Proved Reserves and Production, (109 Cubic Meters)
These 1995 data include only the Cl emissions in the ventilation air. Measurement ofother emissions were not reported prior to 1997.
U.S. methane emissions from coal mining were nearly 4 XIOGtonnes in 1995, morethan 14!4. below 1990 levels, primarily because of decreased emissions from the ventilationand degasification systems of the nation’s gassiest coal mines and growing methane recoveryfrom coal mines. Emissions from degasification are estimated to be on the order of 300,000tonnes lower than previously believed. Meanwhile, methane recovety has grown more rapidlythan previously reported, largely due to significant growth in Virginia. Virginia production isnow >2.8xI Oe m3 x365=1 .02xI 09 m3/a. This recovery was started by Island Creek with a1.1x1 OGm3/a CBM/CMM production when CONSOL, Inc. acquired Island Creek. In 1993,CONSOL acquired Island Creek Coal and the gassy Pocahontas VP No. 3, VP No. 5, and VPNo. 6, which included the methane recovery system installed by Island on these mines.CONSOL combined the methane recovery from their Buchanan No. 1 mine and hascontinued to increase total system recovery to more than half of the “Other” production. InDecember 1995, CONSOL sold the gas rights from these mines to MCNIC Oil and Gas. Themethane recovered from these mines is responsible for more than 0.5 xl OGtonnes of theincrease in methane recovery. Both the Energy Policy Act of 1992 and legislation enacted inWest Virginia during 1994 contained similar language aimed at bolstering coalbed methanedevelopment.

Australia
A project of 5 years duration was begun in 1996 with CSIRO on Mine Gas Controlwithin a framework of collaborative coal mine safety research. The objectives of the projectare to control gas emission in an underground coal mine and to make an optimum evaluationof the technology of gas drainage.
In the year 1997-1998, the following two tasks were undertaken:
1.Creation of drainage holes in a disused mine to develop, test, and demonstrateeffective gob drainage methods for abandoned mine workings.
Experiments were done with drainage holes from the surface and two types ofunderground holes. The first underground drainage type was a method used inJapan, where long horizontal holes are drilled in the roof. Some of these longhorizontal holes are used for gas drainage from the Iongwall front abutment to reduceemissions from this fractured area onto the face. Other holes at higher levels areused to drain gas from the gob. The second type of underground drainage holes wasthe use of vertical cross-measure holes drilled from the gate roads to capture thelateral gas emissions from the coal seam.
2.Gas flow estimation and measurement in the gob to predict the gas flow patternswhich will allow the development of drainage techniques and ventilation to managethe gas emission during and after mining, while controlling spontaneous combustionin the gob.
The process included modeling gas-flow in a gob using computer-generated fluiddynamics (CFD) codes, collecting field experimental data to verify models, anddesigning operational techniques for control using ventilation, boreholes, and novelgob sealing systems.
Belgium
Belgium, like other European countries, has a long history of producing CBM inassociation with coal mining operations. During the fifties, Europe was able to produce up to1.8 xl OGm3/d, of which Belgium contributed up to 0.3 XIOGm3/d. The particularly high yieldsof methane at this time were due mainly to the beneficial effect of the mining operations onthe permeability of the strata and overlaying coal. Methane was produced from wells drilledahead of the future gob area (de-stressed and fissured area created above the mining front).
Based on the important experience gained during these years and the newdevelopment of the Coal Bed Methane (CBM) industry in the United States, the potential ofareas away from previous mining works are presently re-evaluated. A description of the coalbasin structure is given with the delineation of potential areas for CBM production. Twotargeted areas (=75 km2) with coal resources at depths estimated between 700 and 1250meters have the potential for a plateau of production of approximately one million m3 of gasper day.
China
China is the world’s largest producer of coal, producing 1.4x10⁹ tonnes in 1997.China is also the world’s largest consumer of coal, which provides about 75% of the country’stotal energy needs. CBM emissions are closely associated with mining activity. The methanegas discharged into the atmosphere as a by-product of coal mining is said to have a 20 to 60times larger greenhouse effect than carbon dioxide on a molecular basis. In China, themethane content of coal is particularly high because most of the coal production is fromunderground mines at deep levels containing far more methane as than open-cast mines.
~Annually, the total CBM emitted is estimated at 19x1 OG m by the United NationsDevelopment Program (UNDP), about 5x1 OGm3 by U.S. EPA and 7.7x10G m3 by the Ministryof Coal Industry (MOCI). This quantity seems set to rise in the future because coal output is

increasing and mines are getting deeper. In 1996, the total CBM recovered was 618.6x1 OGm3, roughly 8’%0of total emissions.
In spite of the fact that methane gas is a clean and useful energy source, most of thegas removed to increase mine safety in China has been discharged into the atmospherewithout being used. If the coal mine gas exhausted from mines was recovered and usedeffectively, the emission of methane gas, at present having a significant greenhouse effect,could not only be controlled, but could be effectively utilized as a source of energy. In view ofthe situation in China, CBM projects were initiated with a view to reducing global warming,improving mine safety, and utilizing the CBM as an energy source by efficient recovery andeffective use.
Underground removal and utilization of CBM started in the Chinese coal miningindustry in the 1950s. Within the last 10 years, considerable progress has been made inexploration from the surface and in the development of CBM extraction in virgin coal seamswith the powerful support of the Chinese government and the active participation ofinternational communities and foreign investors. The experience and results gained in bothunderground drainage and surface drilling confirm that the exploitation and utilization ofChina’s CBM resources will be promising and profitable.
A stat~owned company, China United Coalbed Methane Corporation Ltd. (CUCBM)is empowered to undertake exploration, development, and production of CBM in cooperationwith foreign companies. The development of CBM from surface boreholes has greatpotential. CUCBM has set targets for CBM production in China from surface boreholes of1x1 09 m3 annually by the year 2000 and 10xl 09 m3 annually by 2010.
The large CBM resource in China provides a reliable and substantial basis for theexploitation of CBM. It is characterized by a relatively concentrated regional distribution.Geographically, about 62% of the total CBM resources lie in North China; 66% of the total isin coal seams at depths between 1,000 and 2,000 meters. The total resource is 30-35xI 012m3 at depths up to 2,000 m.
The course of development of China’s CBM industry may be divided into threestages:
● Underground venting and drainage of coal gas.● Surface drilling and extraction of CBM.● Establishment and development of a CBM industry.
In 1993, the number of coal mines where a coal gas venting system was in placereached 115, which produced an annual total of 534x1 OGm3 of gas.
Potential barriers to CBM development are:. Lack of technology.. Focus on CBM removal for mine safety as the principal concern, rather than CBMuse.● Lack of infrastructure.● Lack of awareness of environmental issues.● Lack of funds for investment in CBM.
The following projects, among others, are at a development stage:. CBM Development in Panzhuang Mine. APEC Coal Mine Gas. CBM Exploration and Development in the Yangquan Coal Area● Texaco Huaibei CBM Development● Arco and Philips. UN-GEF Development of CBM Resources● UN Deep CBM Exploration
1. CBM Development Project in Panzhuang Mine: The project located in PanzhuangMine - Jincheng CMA, was started in 1994 as a joint undertaking between Jincheng

CMA and an American partner, Sine-American Energy Co. Ltd., in equal shares. Sofar there are 7 surface wells. Four are in stable production, with singlewell peakproduction exceeding 10,000 m3/d. Water removal for gas production at the other 3wells is underway, with gas production in the range of 500-1800 m3/d. The gasproduced is being used for power generation, and a small 2x120 kW power plant is inoperation. A further four x220 kW units have been ordered and will becomeoperational shortly.
CBM development using surface wells has to be adapted to suit site-specificconditions. American experience cannot be directly applied without being modified.For example, initial production from well No. 2 reached more than 10,000 m3/d, butwas not sustainable at this level. By using a high pumping rate, requested by theAmerican partner, the well became clogged with sand and fine coal. In another case,the No. 3 well initially had a packer installed to block water coming from underneaththe target seam. Stable gas production was recorded at more than 12,000 m3/d.When the packer was removed, the water level rose, effectively stopping gasproduction. The water problem persisted for a considerable time. In later wells,pumping was maintained at an appropriate rate, and stable gas production of 5,000m3/d was achieved for more than a year.
2. APEC Coal Mine Gas Project: This 6-year project was begun in 1997 by TiefaCoal Mining Administration (CMA) under an agreement between the Coal Ministry ofChina and MITI of Japan on CMG recovery and utilization in the framework ofreducing emissions of greenhouse gas.
Tiefa CMA is located in the northwestern part of Shenyang City in Liaoning Provinceand has a mining area of 618 km2. It is one of China’s largest coal miningadministrations and comprises eight coal mines currently in operation and one mineunder development. The coal-bearing formation of these coal mines is thought tohave been laid down in the late and middle Jurassic period of the Mesozoic Era, andthe coal is bituminous. The coalbed has an inclination of 4-10 degrees andcomprises 22 coal seams in total. Measured coal reserves are 2.1xl 09 tonnes, andCMG reserves are estimated at 23.5x10⁹ m3. These coal mines are, therefore,designated as high-methane concentration coal mines. The gas content of the coalranges from 12 to 17 m3 per tonne on average at T{efa CMA. As these figures arerather high compared with most coal seams in other countries, and the density of coalseam distribution is high, the potential coal mine gas resource of Tiefa CMA isconsidered to be large.
In 1997, these coal mines produced 13.6x1 OGtonnes of coal and emitted 128x1 OGm3of pure methane. As indicated by factual data, these coal mines are considered to belikely candidates for being chosen as models for the gas recovery and utilizationproject. Concerning the coal mining method, all the coal mines employ the retreatingIongwall mining method. At present, the deepest working face is about 600 m belowground and 10-11 working faces are in constant operation. Moreover, these coalmines are well modernized in terms of their safety records.
About 74% of the CMG generated during the coal mining operation is discharged toatmosphere by the main fans, and the remainder, about 26Y0, is forcibly inducted andrecovered by blowers. A proportion of the methane recovered by the blowers issupplied as household fuel to 24,000 houses within the colliery zone of the TlefaCMA.
At present, the ratio of utilization to total volume of emitted gas is only 5.5’Yo,which isextremely small compared with the ratio of 35% in the case of Taiheiyo Colliery,Japan. Most of the gas is, therefore, discharged into the atmosphere. The objectiveof this project is the construction of a model plant to collect and distribute gas and touse it for house gas in Tieling city near the coal mines of Tiefa CMA, or for powergeneration.

In 1997-1998, many fundamental studies were done. These were necessary for thedetailed design of the gas drainage methods and gas delivery pipeline. Theyincluded the evaluation of gas reserves of the district, underground gas emission rate,present gas pipeline network, future gas demand in this district, etc. Based on thisstudy, a gas recovery of 34.9x1 OGm3 annually, an average gas concentration of42.39!o, and a gas utilization ratio of 27.9% are planned in 2000, and the followingthree options for gas utilization have been proposed:
● Supply the recovered gas only to houses of the coal mining complex.● Build a main pipeline between Tiefa Coal Mine and Tiling City (35 kmdistant). The recovered gas is to be supplied to houses of the coal mine andTieling City. An electric power generator with a small capacity (about 1 MW)has been installed as a supplementary electric power source fueled by thegas supply.. Install a gas-fired electric power generator (about 12 MW).
One of the above three cases was to be chosen and a detailed scheme for gasdrainage, gas supply, and power generation was to be made in 1998. Construction ofthe electric power generator and the pipeline is scheduled to take place between1999 and 2000 (or 2001), depending on the chosen option. The plant is budgeted foroperation until 2002.
When the gas recovery and utilization technology, as described above, is introducedand completely implemented, the recovery and utilization ratio will be raised to 357.or 40x106 m3/a from the present 5.5% or 7x10⁶ m3/a. It is estimated that theemissions of carbon dioxide greenhouse gases will be reduced by about 454,000tonnes annually.
3. CBM Exploration and Development in the Yangquan Coal Area: The project inYangquan City, Shanxi Province, will adapt vertical wells from the surface, drilled inadvance of mining excavations, to recover CBM. Under this project, CBM will be solddirectly to end-users in the nearby cities and towns. The project plans call for drilling184 wells. The production capacity is about 200xI OGm3 annually. The lifetime of theproject is 20 years. The stable production period is 15 years.
4, Texaco Huaibei CBM Development: On January 8, 1998, CUCBM and Texacoofficially signed a PSC for the cooperative exploitation of CBM in Huaibei, AnhuiProvince. The area allocated as a concession for this project is 2,676 km2, with anestimated volume of CBM exceeding 60xI 09 m3. As of the end of 1998, three CBMexploratory wells had been drilled to obtain production data and provide the basis fora feasibility report. If the project is viable, Texaco will select an appropriate area todrill four or five production wells around an exploration well. If these wells aresuccessful, development will follow. Finally, Texaco will drill 300 surface wells, andthe total gas production is expected to be 500xI OGm3. The extracted gas will besupplied to domestic users, power generators, and chemical producers. Projectrevenues will come from gas sales to household and industrial users as well asincome from sales of electricity generated using CBM.
5. Arco and Phillips: On June 29, 1998, CUCBM together with Arco and Phillipssigned four PSCS for the cooperative production of CBM in the Sanjiao, NorthSanjiao, Shilou, Linxing concessions of Shanxi Province. The total area of theseconcessions is a proximately 8700 km2 and the estimated volume of CBM resources
J’3exceeds 440xI O m . By the end of 1998, 4 CBM exploratory wells had been drilledin the Sanjiao project and 2 wells in the Linxing project.
By the year 2010, it is planned that annual CBM production will reach IOXI 09 m3, ofwhich 7x1 09 m3 will come from Shanxi Province and a complete market for a CBMdevelopment and utilization system will have been formed, laying a good foundationfor long-term CBM development.

6. Global Environmental Fund of the World Bank Development of CBM Resources:In 1992, the UNDP began a 5-year technical assistance CBM project in China. Boththe UNDP and the Chinese Party have contributed approximately U.S. $1Oxl OGto theproject. Star Mining Corp. is implementing the study on behalf of the former Ministryof Coal. One of the main achievements of the project is that it has drawn attention to ,and enhanced the status of CBM production with the Chinese government. Theproject has four subprojects, which are located at Tiefa (Liaoning Province), Kailuan(Hebei Province), Van (Shaaxi Province), and Songzao (Sichuan Province). So far,the subprojects of Tiefa, Kailuan, and Van have been completed, while the Songzaosubproject is still in progress.
Kailuan Subproject This subproject was jointly implemented by Kailuan CMA andGustavson Associates Inc. Three wells were drilled from the surface into a coal seamprior to mining. Good daily gas production has been achieved from 1 well (2000m3/d), but production has been low from the others, even though stimulationmeasures (fracturing) have been taken. Drilling was undertaken with a secondhandsurface rig procured by the UNDP, and there have been some problems and delayscaused by the need to import spares. Gas produced from one of the surface wellshas been used to augment the town gas system nearby. The revenue of the projectwill come from gas sales to local consumers.
Tiefa Subproject: This subproject was implemented by Tiefa CMA and REI Co. Itspurpose was to introduce gob well and long horizontal borehole drilling technologiesto Chinese coal mines. Three gob wells were drilled from the surface to 40-50 mabove the working seam, which lies at a depth of 500-600 m. Additionally, three longin-mine horizontal boreholes were directionally drilled into the gob area using adownhole motor, the longest borehole extending 305 m. Total gas production was1.67x1 OGm3 from the in-mine boreholes and 08xI OGm3 from the surface gob wells.Meanwhile, the methane removal efficiency was increased by 57.2’% overconventional methods (cross-measures borehole).
Van Subproject The purpose of this subproject was resource assessment. It wasimplemented by Central Coal Research Institute Van Branch. Data collection hasbeen completed for 17 mining areas and a database on national coal bed methaneresources has been established. Seventeen coal seams have been completelytested and 10 more exploration wells have been drilled in 12 mining areas. Twomajor technology-transfer training courses, each of 3 weeks duration, have been heldin Xi’an, in 1996 and 1997, with U.S. cooperation.
Songzao Subproject: The purpose of this subproject was to drill long in-seamdirectional boreholes. REI Co. and Songzao CMA undertook the subproject. Twoboreholes were drilled in Shihao mine and Datong No. 1 mine. Both boreholes faileddue to soft rock, gas outburst, and drill-rod bogging.
7. UN Deep CBM Exploration Project The UNDP sponsored Deep CBM ExplorationProject in Linxing, Shanxi Province, was initiated in August 1993 and completed inDecember 1996. It was carried out in three phases. The first phase was geologicalevaluation to select target areas. The second phase involved gas productionexperiments in selected target areas using a small-scale group of surface wells. Thethird phase evaluated overall development potential and the economics of thedevelopment areas.
In the first phase, eight areas were selected for initial evaluation, with four of these forfurther evaluation. In the second phase, seven surface wells were drilled in the Liulinarea for trial production and achieved a satisfactory outcome. Of the 7 productionwells, 6 wells had stable production of more than 1000 m3/d, and one well had a peakproduction of 7050 m3/d. The well also had a long stable production of 400-6000m3/d. Computer simulation of production from the 7 wells over a 20-year periodindicated that over 47x1 OGm3 of gas could be extracted.

Economic evaluations of gas utilization as town gas, as fuel for small power plants,and as raw material for activated carbon and other chemical products were carriedout, showing promise of economic benefits.
Czech Republic
In the Czech Republic, CBM resources are estimated to be 51-371 xl 09 m3, of which12-88x1 09 m3 are verified. The most interesting is the Ostrava-Karvina Coal Basin, 1600 km2in area, which accounts for 99.8% of methane emissions from mines. There are coal seamswith an average coal thickness of 150 m. The methane content of the coal is from 4.4 to 20m3/t. Annually, gas extraction plants produce about 120xI OGm3 of methane. CBM is beingrecovered from both abandoned coal mines and virgin coal seams.
OKD, DPB PASKOV Inc. took part in a pilot project of the exploration of CBM in1994-1997. Prospecting took place in the carboniferous virgin coal seams of the Czech Partof the Upper Silesian Coal Basin. The present annual coal production is about 13x1 Oetonnes. The company owns concessions in 10 prospecting areas with a total area of 196km2. These areas are situated outside the present mining areas. CBM reserves atprospecting areas of OKD, DPB PASKOV Inc. were estimated at 10-20XI 09 m3. Threesurface core boreholes (VA-1, TR-2, and DP-I ) were sunk in different parts of the basin toprovide basic information about the gas content of the coal seams. Three hydraulic fractureswere induced in two of these wells. On the basis of these results, and along with the resultsof the earlier measurements of gas content, the basic favorable and unfavorable geologicalparameters were determined for the needs of CBM exploitation.
France
The output of the Lorraine Coal Field in the East of France is 4.5x1 Oetonnes annuallyof clean coal. The volume of methane is 184.106x10⁶ m3 annually (56Y0 CH4), drawn from 3operational collieries and from disused workings. Extraction is achieved from old workingsand the active Iongwall-face workings by means of drill holes and confined chambers. Theunderground methane network is equipped with gas sensors (CHA, 02, CO), temperatureprobes, and pneumatic sluices, permitting remote gas content control and adjustment fromthe surface.
Germany
The coal basin in the Saar is the second largest coal mining district in Germany. Thecoal-bearing stratum stretches from the open surface to a depth of over 5,000 m. Activemining today takes place at depths between 600 m and 1500 m. The individual seamthickness of seams ranges from 0.5 to over 5 meters. The gas content of the coal is 4 to 10m3/t.
To date, several deep boreholes have been sunk in three exploratory phases for theextraction of CBM. Following the American example, among others, initial stimulations withfracture technology were tested at the beginning of the 1990’s. In borehole Aspenliubel 1,which produced a continuous gas output from 1996-1997, the b6rehole completion (deep wellpumps) had to be replaced when extraction began because of complicated extractioncondition (mixtures of gas and water). The results obtained from the Saar CBM projectsubstantiate the technical feasibility of extracting gas from coal seams. Within the scope of ademonstration project sponsored by the EU, the project was scheduled to be continued in1998 with a further borehole in Saarland.
India
India is the world’s third largest coal producer. More than half of India’s energyrequirements are provided by domestic coal. Of that, coal represents approximately 70’70 ofthe fuel used for power generation. Annual coal production in 1997 was 299x1 Oetonnes andcoal consumption about 311 xl OGtonnes.

Given the large coal resources in India, CBM could play a substantial role in futureactivities. CBM could cut India’s energy deficit and the surging demand for imported naturalgas. The estimated resource base is between 850x109 m3 and 4075xI 09 m3, ranging in theDamodar Valley from 283x109 m3 to more than 3226x109 m3, and in the Cambay Basin about311 X109 m3 for coal seams behveen 610 and 1524 meters deep.
In 1993, the first CBM drilling program was started in India in Northern Gujarat.Under the program, three wells were drilled. Two of the wells, LBM No. 1 and LBM No. 2, areabout 10 km apart. Both wells were completed and stimulated. The third well, LBM No. 3,was drilled as an offset to LBM No. 1 as part of a planned five-well pilot project. Based ondata from these three CBM wells and several dozen well logs from the surrounding area, itcan be shown that the three main coal seams are consistently thick and laterally persistentthroughout the Mehsana CBM project area. In addition, the gas content values are in therange of 5 to 7 m3/t, surprisingly high given the low rank of the coal.
In 1994, Amoco India Petroleum Co. was awarded a government concession for CBMevaluation in virgin coal at the Ranganj, Jharia, East Bokaro, and North Karanpura coal fields.Based on rank, thickness, and limited sorption isotherm data, Amoco India estimated CBMresources to be 283 to 680xI 09 m3 and recoverable gas in the order of 40xI 09 m3 in theunmined coals of these fields.
In September 1996, Amoco India suspended the project because it was unable tosecure a commitment from the government to fund or build a gas pipeline into the remoteDamodar fields. Furthermore, a mutually satisfactory production agreement for gas salescould not be concluded.
Japan
Ishikari coal field is the most gassy coal field in Japan. Until 1995 there were manycoal mines in this coal field. Due to the great depth and large gas emission, all coal mineswere closed and there is no coal mines in this coal field nowadays. The maximum workingdepth was 1200 m below surface, average gas content was 9,5 m3/t and average specific gasemission was 45,1 m3/t. The gas is still emitted from abandoned goaf through shafts.
In order to evaluate the possibility of gas production from surface boreholes and ofgas recovey from the abandoned goaf, re-evaluation of coal and gas reserves and simulationof gas production from the surface wells were carried out.
There are some obstacles for development and utilisation of CBM. One is lack of apipeline network system for natural gas in Hokkaido. Therefore, utilisation of CBM is limited.And the selling price of electricity is very low. As a result, gas is used for fuel of small scalepower generation and generated electricity is used for private use. Another constraint is thatdrilling cost is very expensive. The drilling cost of 500 m length well is about from 0,5 to 1,0million dollars. This is the biggest problem for development and utilisation of CBM project.
Kazakhstan
The Government of Kazakhstan and the joint stock company lspat-Karmet (an lndian-Kazakhstan joint venture), are interested in developing feasibility studies and subsequentinvestment for coalbed methane capture and utilization in the Karaganda coal mining basin.
Methane has long been ventilated from the Karaganda coal mining basin in an effortto protect worker safety and reduce the incidence of explosion. Interest in reduction ofgreenhouse gas effects, in air quality, and in the potential energy potential of the methane hascaused the Government to begin investigating the possibility of extraction of the coalbedmethane and its utilisation. Studies have verified that there is gas in commercial volumesavailable and that there is a substantial regional market for the gas as a fuel. Indeed, someexperts believe that this is the best methane extraction project opportunity in the formerSoviet Union.

The project site would be the mines of the Karaganda coal mining basin in NorthernKazakhstan. The mines are owned by a joint stock company, lspat-Karmet, and by theGovernment of Kazakhstan.
Poland
In 1994, the total energy consumption in Poland was about 4.18 PJ: 76% coal, 15%oil, 8% natural gas, and 1‘Y. hydroelectric. Coal is not only the dominant fuel in Poland’seconomy, but it is also the main source of foreign exchange earnings for the country. In1995, over 98% of oil and almost 80% of natural gas was imported.
Poland is fourth in the world in the production of hard coal with total reserves of 102to 150xI 09 tonnes and 40xI 09 tonnes recoverable; hence, CBM could become an integralpart of the energy economy. CBM could help offset some of the debt incurred by the coalindustry and could help balance the trade deficit by reducing the need to import natural gas.
Poland has the potential to be the second largest CBM producer in the world, on thebasis of the reserves in two of the three major coal basins. Resource estimates for the UpperSilesian coal basin range from 351 to 1300xI 09 m3 and in the Lower Silesian and Lublin basinfrom 76 to 150xI 09 m3.
Methane extraction from coal seams and surrounding rocks in Polish minesencounters considerable difficulties arising first of all from the low porosity of the rocks, beingrestricted in general to behveen 2 and 12’Yo. Thus, methane removal prior to extractionoperations is characterized by low effectiveness both in relation to the quantities of recoveredmethane and its concentration in methane drainage pipelines. Because of this, in manycases methane is released to the atmosphere from the methane drainage pipeline. Inaddition to the methane removed from mine workings by ventilation systems in the UpperSilesian mines, an annual additional 650xI OGm3 of CH4 are released to the atmosphere. Theefficiency of classic methane extraction does not exceed 40Y0. In the majority of cases themethane is recovered from post-longwall gobs.
An increase of methane-removal efficiency to as much as 80% can be expected afterbroader implementation of an overlying methane extraction method. However, favorableconditions for the application of this method do not always occur, even in multi-seamconditions. It seems that there are considerable chances to increase the methane drainageeffectiveness by using directed fracture techniques. Considering the technological ease ofuse, the methodology may be widely applied to achieve initial methane removal from thedeposits. Similarly, it has frequently been used to reduce the rockburst hazard.
Studies on CBM projects in Poland continue, principally in the Upper Silesian CoalBasin. Potential barriers to CBM development are:
. Lack of technology--There is a need to enlarge gas storage facilities and to improvemethane drainage systems.. Taxes--More favorable tax conditions could help to stimulate CBM utilization.Adaptation to a market economy--The inefficient hard coal industry is struggling tocompete in the market economy. Government-controlled coal prices and “socialemployment” remain as serious barriers.
In Poland, the following projects have been undertaken:
1. Amoco Poland Ltd. project in Upper SilesiaIn 1993, Amoco Poland was awarded a 486 kmz concession, including virgin coal and4 exploration concessions. The company was committed to a total of 15 boreholes,at least 8 of which could be developed to production level. Drilling operationscommenced in November 1994 and were concluded 2 years later. The entireprogram entailed drilling 25,515 meters of boreholes.

2. Electrogaz Ventures Ltd. Project in Upper SilesiaThis tract contains four exploration concessions and is bordered by several minesthat use some of the gas drained from their workings. The company has suspendedthe program because the developer claims that the concession is impeded by highenvironmental protection requirements from local authorities.
3. PolTex Methane-Texaco Inc. Project in Upper SilesiaThis area contains five exploration concessions. In a joint venture with McKenzieMethane Poland, PolTex drilled 7 wells to depths of 1400 to 1850 m. Four more havereportedly been drilled. In May 1995, PolTex acquired the remaining interest fromMcKenzie Methane, and in March 1997, PolTex signed an agreement with TexacoPoland to acquire the rights to appraise and develop CBM.
4. Metanel S,A. Project in Upper SilesiaAt the beginning of June 1994, the company completed the first exploratory well. Thetest results recovered high-methane gas with little sulfur- or nitrogen-containingimpurities. Gas will be produced from coalbeds 1 or more meters thick in a reservoirlocated at a depth of 510 to 1000 meters. Metanel plans to drill 70 wells and to reacha production total of 150x1 OGm3. A problem with saltwater disposal was resolved bystoring it in a sandy reservoir 1000 m below ground level.
5. McCormick Energy Project in Upper SilesiaIn 1993, McCormick Poland was awarded a concession in an area of virginexploration in the eastern part of the basin. The company signed a contract to drill 9wells on 2 license blocks covering 243 km2. The project is presently suspended.
Russia
Russia is the world’s fourth largest coal producer. In 1997, the coal mines produced261 xl OGtonnes of coal. Russia is also one of the world’s largest producers of CBM. CBMconstitutes 15’XOof the total national anthropogenic methane emissions.
CBM recovery and utilization projects are expected to encourage local economicdevelopment by potentially offsetting the number of jobs lost during restructuring and byenhancing the financial viability of coal mines. CBM projects may improve the profitability ofmines by increasing revenues or by decreasing costs. A project with as few as 10 of themines in the Kuznetsk Coal Basin, could achieve annual reductions of 4.6x1 OGtonnes of C02equivalent.
To improve the situation for utilization of CBM in the coal mining regions of theRussian Federation, the Skochinsky Institute of Mining, PechorNllproekt and the mineassociations “Vorkutaugol,” “Leninskugol,” and “Belovougol,” carried out investigations andmine observations in order to determine efficient technologies and conditions of recovery bydegassing mines of coalbed methane suitable for utilization. Among others, the methods ofadjacent seam and gob degassing through wells drilled from the mine workings and thesurface, as well as different schemes of degassing the seams being mined with undergroundwells, were studied. The results obtained in the Kuznetsk coal basin are interesting and the
. studies are continuing. To be successful, projects need input and cooperation from severalmain ministries, local authorities, and other institutions in Russia. The Technical WorkingGroup (TWG) will promote cooperation.
Potential barriers to CBM development are:. Lack of experience in using CBM as fuel.. Political instability.● Lack of capital.● Lack of information available to outside investors.

The most important CBM project is connected with the utilization of CBM in a boilerhouse at the Pervomayskaya Mine. The mine releases 14,000 tonnes annually of methane.Presently, none of it is being used. The project will involve the conversion of boilers to burn6.50 tonnes annually of CBM with coal, which will serve as a model for expanding CBM use inthe Kuznetsk Coal Basin. Estimated CBM resources associated with the coal reserves of theKuzbass mines range from 194 to 342x1 09 m3. The project has three main components:
. Enhanced drilling.
. Creation of centralized systems of collection and separation.
. Reconstruction of a boiler house to co-fire coal and methane. The fuel mixture willhave an average methane concentration of 40% or greater, and a potential energyequivalent of 38 GJ/h. The gas input may vary from less than 10’XOto up to 100% oftotal fuel supply, depending on the furnace design and the needs of the boileroperator.
CBM will be used to produce electricity and for heating. The project has specialimportance, in that it will help to solve the problem of safety at the workplace. There havebeen a few accidents in the region, which have killed several people in recent months throughmethane exposure. The Administration of the Kuzbas region and the Ministry of Fuel andEnergy have provided support for this project.
South Africa
South Africa is the fifth largest producer of coal in the world, with annual production in1997 at 220xI OGtonnes, and consumption at 154x1 OGtonnes. South Africa contains theseventh largest coal reserves in the world (54x109 tonnes). Because of these large reserves,CBM could become a viable and profitable energy source for South Africa. CBM couldobviate the future need to import natural gas. Several areas have been identified as havingpotential for CBM development. More mines are expected to open in which CBM technologiescould be incorporated. If these mines are not approved by government officials in responseto environmental activism, Sasol (South Africa’s third largest coal producer) will have toexplore other ways to further expand production at its existing room-and-pillar mines.Potential barriers to CBM development are:
. Allocation of ownership rights has not yet been determined (except in theSpringbok Flats Project).● Current government subsidies are deterring foreign investment.Treatment of development costs precludes the write-off of development costs againstother income.● There is potential for preferential tax treatment.● Political changes within in the country have created a situation where dramaticimprovements are needed in the country’s infrastructure in order to enable it to meetthe needs of all its people.There could be a transition from energy self-sufficient policies to new energy policies.
In November 1995, a pre-feasibility study was undertaken at Springbok Flats,Northeast Transvaal the rural areas of Lebowa, Venda, and Gazankula. The pre-feasibilitystudy analysis indicated a potential methane production of 0.71 xl OGm3, which could beabsorbed by markets in the immediate vicinity. In December 1996, Phase I of the feasibilitystudy was started. The Phase I study included drilling four core holes to measure gascontent, geophysical logs of the holes, and reservoir simulation. The success of Phase Iwould determine if Phase II would be made. Phase II would consist of drilling larger holes forpermeability testing, another round of reservoir simulation, a detailed inventory of possiblenatural gas markets and applicable gas pricing, and a detailed economic analysis of allaspects of the project. The study is to include an environmental impact assessment that willencompass an evaluation of the benefit of natural gas substitution for coal and firewood heatenergy. The Phase I drilling was completed in November 1998. The wells drilled in theLebowa Region yielded no natural gas. This ended the project with no funding given forPhase II activities.

Turkey
Only preliminary investigations to assess Turkey’s coalbed methane capture andutilization potential have been conducted. Turkey does notcurrently have any economicallysignificant CBM production. The Black Sea Coast area of Turkey has substantial hard coaland coal-related resources; substantial amounts of methane are continuously emitted fromthe coal mines. Recovery and use of this methane could be beneficial because of reducedfuture methane-related hazards to miners and improvement to the local and globalenvironment.
Turkey has a growing demand for energy. The Turkish nation is now dependentupon imported energy for a substantial portion of its energy needs. In particular, natural gasdemand is increasing faster than the supply. The demand for natural gas used for powergeneration is increasing even more rapidly than overall demand. Gas will be a key factor inTukey’s future economic performance and strategic stability. Turkey needs reliable gassupply sources and would benefit by reduced imports.
CBM from the Zonguldak hard coal region could be a very significant factor inTurkey’s energy economy. Development of the methane gas resources would alleviate someof the current and future shortages of energy in Turkey. The resources identified could fuelgas-fired power plants and supply raw material to a newly created petrochemical complex.Electric power could be distributed to the power grid and targeted to existing and newindustries. The CBM in-place resources in two districts of the Zonguldak hard coal region arepresently estimated to be at least 3x10¹² m3 (TCM). Assessment of CBM resources in thethird largest district is continuing.
No policies specifically impeding CBM development have been identified. Potentialbarriers are the requirements for and the logistics of importing equipment. Training of Turkishpersonnel is needed. Infrastructure for operations and equipment mobility must be developedas must maintenance facilities and machine shops. Power plant development will generatedemand for turbines, electrical equipment, transformers, transmission lines, electronicequipment, and computerized systems.
A joint venture engaged the services of Raven Ridge Resources, Incorporated, tosurvey and estimate the CBM resources of the Zonguldak hard coal region, Districts 1 and 2,during 1997. District 1 covers 1870 square kilometers and District 2, 2605 square kilometers.Raven Ridge Resources have estimated that the CBM resources in Districts 1 and 2 in theWestphalian coal and sandstone reservoirs exceed 2.56x10¹² m3, most of which is thought tolie in sandstone reservoirs.
The aggregate thickness of the Westphalian coal-bearing strata exceeds 1,000meters. Raven Ridge Resources have not estimated the resources of the Namuriancoal-bearing interval that underlies the Westphalian Kozlu coal measures. Numerousprospective coals and sandstones occur in the Namurian sediments in which significantcoalbed methane gas resources may occur. Westphalian coal samples collected fromactively mined areas were analyzed to determine source rock characteristics. The testingsuggests that these coal samples can be classified as humic, are mature to late-mature TypeII and Type Ill kerogen coals, and area likely source of gas condensate and minor quantitiesof oil.
CBM’S legal status in Turkey is now clarified. Many relevant Turkish laws andregulations are not officially translated into English. CBM evaluations may differ from naturalgas.
Ukraine
~ Ukraine is one of the most inefficient users of energy. Collections of payments forgas and electric power are poor, and much of that is in barter rather than cash. Therefore,CBM could forestall the future need to import natural gas.

EuroGas, Inc., through its 100’% owned subsidiary EuroGas Ukraine, controlssubstantial coal-bed methane reserves in Western Ukraine and Donetsk-Donbas area.
EuroGas created a joint venture Company, named EuroDonGas, with MakievkaMining Company. This joint venture prepared a wok program to drill three wells in 1999 toconfirm reserves estimated at 6 Tcf of gas, according to Ukrainian and foreign specialists.The gas will be produced from sandstones overlying coal seams from depths of between 600m to1200 m.
EuroGas formed another joint venture with Alternative Fuel Corporation to developvast resources of methane for the Gorskaya Mine in the Donbas area. Three wells and twogob wells are planned for this area. This program will be conducted with probable cooperationwith Global Environmental Fund of World Bank. Again, the estimated resources are in therange of 5 to 7 Tcf of gas.
The last area of coalbed methane development in Ukraine is the area of WesternUkrainein Lublin Coal Basin. EuroGas formed a joint venture with ZahidUkrGeologyia (UkrainianCompany base in Lviv). Resources are estimated at 2 Tcf.
Also under development in Ukraine are the GEF Coalbed Methane Recovery Projectat Gorskaya Mine, Lugansk Oblast, and the CBM project in Lviv-Volyn Coal Basin.
The GEF Coalbed Methane Recovery Project consists of drilling wells from thesurface, gas production tests and, if warranted, connection to a gas pipeline for high-qualitygas and on-site electricity for low-quality gas. In the case of CBM in the Lviv-Volyn CoalBasin, three CBM gas wells were drilled to depths of 400-500 m. Zahidukrgeologia estimatesthe geological reserves at this site at approximately IOXI 09 m3.
Potential barriers to CBM development are:. Lack of experience in licensing and technology.● Inadequate framework for private sector development.. Legislative and legal framework for investments not complete.. High taxes.. No cash payments for energy supplied.
Conclusion
Many of the techniques for producing CBM have been adapted from conventionaloilfield drilling, completion, stimulation and production operations. However, coal’s unusualbehaviour and nature as both a source rock and reservoir rock for natural gas (andoccasionally oil) demand new technologies and ideas from many disciplines.
Innovative production technologies for CBM will continue to evolve as we gain newtechnical understanding and insight into the nature and behaviour of coal seam gasreservoirs. All coal basins are different, however, and no one suite of technologies can beprescribed in a given area without careful geological and engineering evaluations. Even then,modifications will be necessary for successful exploitation. Not all technologies are applicablein all areas, and the gas in some coal deposits is beyond the reach of even the mostadvanced technologies and the strongest desires.
The availability of technology, the environment, and the optimistic outlook andgrowing demand for natural gas are, and will be, the main motivations for CBM developmentefforts around the world, as we have seen already in Australia, China, India, Poland, Russiaand Ukraine. Interest is growing in other European, Asian and South American countries aswell. Whether we consider the oilfield environment or the mine environment, the outlook ismost encouraging.
Worldwide coalbed methane resources, once considered as a new “unconventional”natural gas resource, are now being recognized as a potential source of methane in many

countries with extensive coal basins. To date, industrial production of CBM has beendemonstrated only in the U.S. This is because, in that country, the geological and economicconditions are particularly favorable. As a result of this situation, new technologies (open holecavity, multi seam frac, etc.) have been developed by American specialists.
Coal deposits occur abundantly in many locations throughout the world.Unfortunately, for most of the countries, and especially European countries, the geologicalconditions are not as simple as in the American basins, having complex basin structures andvery low coal permeability. Unmodified use of U.S. coalbed methane technology could leadto disappointing results. Good gas productivity in coalbed methane projects will probably onlybe achieved through the adaptation and development of existing technologies in exploration,drilling, and production fields. Applying strictly classical oil and gas technologies does notseem to be capable of producing adequate results. Exploitation of European CBM resourceswill be a challenge for the next century. Success depends on our ability to change our way ofthinking and to find solutions for the real difficulties of CBM exploitation.
In the United States, the existing natural gas pipeline system has provided a readymeans for distributing and marketing the extracted CBM. However, establishing natural gasmarkets outside of the U.S. will be more challenging. In locations such as Eastern Australia,China, or Southern Africa, there are no existing pipeline facilities for the distribution and saleof the gas. The construction of hundreds of miles of pipeline may be required to connect theCBM production sites to the consumers’ market.
In addition to the lack of distribution facilities for the gas, a market to use the gas mayalso need to be established. This may require a long-term procedure to convert urban andindustrial centers to natural gas use, the installation of gas-fired electric power plants,especially cogeneration facilities, and the construction of new chemical plants for fertilizer ormethanol production. The use of the gas as a fuel for vehicles, such as CNG or LNG, mayalso provide alternative markets for extracted CBM.
REFERENCES
1- Bellus F. (1995). Coalbed Methane: Assessment and Prospects. /GU Report.2 - Coal Industry Advisory Board. (September 1993). Global coalbed methanerecovery and use: current practices and prospects for expansion.
3 - Energy Information Administration. (October 1997). Emissions of GreenhouseGases in the united states – 1996. Washington, DC, DOE/EIA-0573(96).4- Grindley T. /July – September 1999/.Private information.5- Hirosawa H. Status of the APEC coal mine gas project. Japan Coal Energy Center.6- Karwasiecka M., and KwarciFiski J., (1994) - Zestawienie wynikow badafi Iaboratoryjnychdotyczlcych gazonocmoceci we gli kamiennych GZW wraz z ich weryfikacja i wst~ pna analizaw przestrzennej zmiennoceci. Oddzia3 Gornoo?liski Pafistwowego Instytutu Geologicznego,Sosnowiec.7- Kuuskraa V,A., and Boyer C.M. (1993). Economic and Parametric Analysis of Coal bedMethane. A.A.P.G. Studies h Geology, ~.373-394.8- Kuuskraa V.A., Boyer C. M., and Kelafant J.A. (October 1992). Hunt for quality basins gasabroad. 01 and Gas Journal.9- Levine J.R. (December 1994). Coalbed gas: A technical overview. Coa/bed MethaneReview, ~.10- Marshall J. S., Bibler C., Schultz. /September 1998/. Waste not Want not. CBM Review.11- Mostad M. /May 1999/. Coal Methane Potential of the Southern Coal Basin of Belgium.Proceedings of International Coalbed Methane Symposium, Alabama, USA12- Murray D.K., Schwochow S.D. /September 1998/. Keeping the Drive Alive. CBM Review.13- Murray D.K. (December 1994). Coal bed gas: A world of abundant energy. Coa/bedMethane Review ~.14 - Niea M., (1993). Z30La metanu w forrnacjach we glonocenych. Materia~ Szko~Eksploatacji Podziemnej 93, t. 2, Ustroii.15- Ohga K., Shimada S. /May 1999/. Evaluation of CBM Potential of Ishikari Coal Field,Japan. Proceedings of International Coalbed Methane Symposium, Alabama, USA

16- Rychlicki S., and Twardowski K. (1995). Likelihood Evaluation of the Laboratory Tests ofMethane Content in Coals of the Upper Silesian Coal Basin. Mathematical Methods inGeo/ogy. international Conference, Prague.17- Rychlicki S., Twardowski K., Kwarciiiski J., and Karwasiecka M. (1995). Analiza zmianzawarto=ci metanu w we glach kamiennych Gornocellskiego Zag36 bia We glowego. Mat. VIInternational Conference Mining and Metallurgy University, 22-23 June.18- Seminar and Roundtable on Coalbed Methane Development and Potential. World Bank.September 1998.19- Siemek J., Rychlicki S., and Rybicki Cz. (1994). Perspectives of Methane Recoveryfrom Coal Beds in Poland. 14th World Petroleum Congress, Natural Gas Processing, PosterSession, Stavanger.20- Stefanov P.1. (Moscow 1939). On certain regularities in the worldwide stratigraphic andpaleogeographic distribution of the fossil coals geological reserves. In Xll Cong. Geol. Int. -Vol. 1. 282.21- Stiegel G. /October 1999/. Private information.22- Szpunar T., Herrnan Z. and Budak P. (1992). Metodyka badaii hydrodynamicznych wotworach wiertniczych wykonywanych dla pozyskania gazu ze ZSOLwe gla kamiennego. Praceniepublikowane lGNiG Krakow.23- Tailakov O.V. /September 1999/. Adapting to Change. CBM Review.24- Twardowski et al. (1997). Ocena metanonomno~ci we gli kamiennych Gornoa?lqskiegoZag36 bia We glowego na podstawie wynikow pomiarow otworowych. Wyd. CentrumPPGGMiE PAN, Krakow.25- Twardowski K., and Rychlicki S., (1995). Evaluation of Gas Content in Coals of theUpper Silesian Coal Basin by Using Well Logging. International Gas Research Conference.Cannes, France, Vol. 1.26- U.S. Environmental Protection Agency, OtTce of Air and Radiation. (September 1997).Identifying Opportunities for Methane Recovery at U.S. Coal Mines: Dratl Profiles of SelectedGassy Underground Coal Mines. Washington, DC, EPA 430-R-97-020. 3-7-3-8.27- Way S.C., et al. (Oct. 1986). Hydrologic Characterization of Coal Seams for MethaneRecovery Single Phase Saturated and Unsaturated Flow Parametric Study. Report of GasResearch Institute, Chicago.28- Weil W., Herman Z. and Witek W., (1996). Techniczne, technologiczne i ekonomiczneaspekty pozyskiwania metanu z pok’adow we gla oraz doskonalenie meted projektowania wPolsce. Technika Naftowa i Gazownicza, nr 2.29- Wyman R. E., and Kuuskraa V.A. (September 1995). Deep coal seams: potential forlong-term natural gas supplies. WT. 774.
Acknowledgement
This report was prepared by S. Rychlicki of Poland with inputs from K Schultz of UnitedStates.

MANUFACTURED GAS PLANT SITE REMEDIATION UPDATE
Approach to the Management of Contaminated Gas Sites
Historically gas was manufactured from coal in gasworks. Such activities began in themiddle of the 19th century and lasted until the end of the 1970s when natural gas becamedominant world wide. The gasworks also produced many by-products, e.g. tar, liquor, spentoxide etc., which were sold to chemical industry or used for other purposes. It’s a matter offact, that the by-products comprise harmful components e.g. monocyclic and polycyclicaromatic hydrocarbons, cyanides, phenols, ammonia, heavy metals etc. Because of thenumber and the type of the by-products, every former manufactured gas plant has to beconsidered as potentially contaminated. After gas producing activities were terminated formergasworks buildings often were demolished and some of the contaminated soil was removed.However, there are still many sites having the potential to contaminate adjacent land andsurface or ground water.
In most cases former gasworks sites are owned by operating gas companies. There-fore former IGU Subcommittee B3 prepared a report with the title “Approach of ContaminatedGas Sites” in the year 1997. For the triennum 1997-2000 it was decided, that new foundedIGU WOC 2 should extend and update the results, which were given in the study. For thispurpose a questionnaire (see annex 1) was sent to 24 member countries of IGU to gatherinformation on new investigation, risk assessment and cleanup procedures of contaminatedgas sites, to come to know any modifications of the respective countries’ specific conditionsand experiences made since the years 1995/96.
Because there are only few new information from responses to the questionnaireand basicly no new information on cleanup procedures of contaminated gas sites even in theliterature, it seems, that the study worked out by former Subcommittee B3 is still up to date.Therefore it was decided to prepare a brief summary of the former report of Subcommittee B3and include new information, which were provided by Japan, Sweden, Austria, CzechRepublic and France.
It is important to the owner of a historical gas site to estimate the risk, which mightarise from the contamination of the site. To assess the risk two different approaches arepossible. On one hand there are standard values of concentrations of contaminants of soiland groundwater in different countries, which allow a formal judgement between “normal” and“polluted”. However the procedure used to choose the standard values is a point ofdisagreement. Even if research is further continued, they imply a risk level corresponding to agenerai scenario, making the values unreliable. In any case, it is important to clarify themethodology and the assumptions taken for the determination of guideline values.
On the other hand a site specific risk assessment could be made, that includes all thefactors that contribute to the risk at a specific site. The difficulty of this approach is the factthat it can produce different responses depending on the subject to protect (human,groundwater resources, environment). In fact, national requirements are often too general andsometimes not applicable to industrial areas. In such cases, the risk to assess has to beclearly explicit, for example the protection of groundwater or of human health on the site. Theformer B3 Subcommittee members have remmmended the risk-based approach in theirreport.
About the protection of groundwater there is a world wide consensus. If groundwateris used as drinking water, the concentration of contaminants has to be that low, that no badinfluence on human health is expected. The contamination limitations for groundwater areclearly regulated in every country. The situation is different for soil contamination. The term“soil contamination” not in all countries is clearly defined. The human risk with contaminatedsoil is that of breathing, ingesting pollution or skin contact. A risk to groundwater may arise, ifsurface water percolates through the contaminated soil and dissolves contaminants andtransports them into the groundwater. The regulations and general policies on soil protection

are decided by a national authority, generally a national agency for environment. Only a fewcountries have special laws on soil protection. In the majority of cases, specific regulations oncontaminated land are included in a more general law on environment protection. Mostcountries (to a greater or lesser extend) link the potential for soil contamination and thepotential for pollution with laws concerning groundwater, surface water, site workers or publichealth.
The procedure of investigation and remediation (rehabilitation) of contaminated areasand also the cost depend on the requirements given by the national or regional authorities.Some countries base their policies on total cleanup of the land to prepare for any futureregulations and kind of land use. Other countries attempt only to prevent risks that could arisetaking into account the particular use of the site. Even if former industrial sites shall be usedfor housing or business this pragmatic approach is being adapted due to technical constrainsand a lack of money.
The methodology used for the management of contaminated sites can be divided intohvo steps: The first step comprises a historical and desk study, on-site investigations of soil,subsoil and groundwater including chemical analysis. It aims to assess the present conditionof the site and its environment. It is completed by a risk assessment which considers thecontamination of the site and its future use. During the second step -if found to be necessary-the buildings are treated, e.g. storage facilities are discharged, and remediation and treatmentof contaminated soil takes place. According to the type of pollution this treatment can use acombination of various technologies: thermal, physical, chemical or biological. The secondstep includes the subsequent monitoring of the site.
The major problem of owners of former gasworks sites are the cost of a possible re-habilitation. Because the cost of rehabilitation could reach the order of 10 to 20 million US $detailled investigations are necessary to plan remediation activities and to avoid unnecessarycost. These detailled investigations should give a comprehensive overview of thecontaminated areas on the site and should allow to choose a rehabilitation technologycapable to reach the aims of the owner or the regulations of the authorities. Table 1 showscost often given for the different types of treatment for soils polluted by substances such astar or heavy hydrocarbons.
Cost Estimate [US $ per ton of
Remediation Technique polluted soil]
Thermal incineration 150 to 500Thermal resorption 75 to 300Soil washing (including treat-merit of 100 to 500by-products)Biological treatment 30 to 200
Table 1: Estimation of remediation cost
Experience throughout the world shows, that the management of contaminated sitescan be much improved if owner applies several simple principles. First, the owner must avoidto work on a hurry. Time can help to collect data and to define optimal strategies fortreatment, even it takes several years. Care must be taken about the communication betweenregulators, present and future owners of the sites. Last, a pragmatic approach must be taken,using as much as possible available knowledge in geology, chemistry and toxicology, lookingfor simple methods for identifying and estimating risks related to the exposure of people andthe present and future use of the site.
The questionnaire resulted in new information about some countries as to follow
Japan:Soil contamination related to former gas works has not actualized as a problem.

The problem of contaminated land has arose predominantly by the detection ofheavy metals’ and organic chlorine compounds contaminations of soil and groundwater fromthe 1970s up to now. A list of sites where pollutants had been detected is published by theEnvironmental Agency almost every year. The total number of cases is rather low (375 sitesin 1996).
In January 1999 the Environment Agency set forth the “Guidelines for Surveys andMeasures of Soil and Groundwater Contamination”, in which survey methods, substancesconcerned and pollution condition judgement criteria are described. While laws andregulations are enacted mainly by the Environment Agency, some local governments haveestablished their own ordinances and requirements. There are no laws stipulating costresponsibility in cases of soil contamination.
However, R&D programs are promoted by each gas company to develop new reme-diation technologies and study the possibility of reducing remediation costs.
Sweden:
Sweden had had about 50 gas works, which had been listed by the National Envi-ronmental Protection Agency in 1993. The administration has not yet imposed anyrequirements concerning gas works sites and there has been no recent discussion about this
No R&D programs exist but in an older gas works of Stockholm city soil remediationwas tried through some kind of oxidation process without success.
Austria:
The requirements for remediation activities of former gas works sites are decidedcase by case.
Czech Republic:
Czech Ministry of Environmental Protection is responsible for national legislationabout contaminated sites. There is some experience of soil remediation technologies such asincineration, extraction and venting.
France:
Gaz de France had inherited former french gas companies on nationalisation in1946 and is still owner of 467 manufactured gas plant sites. Even if no impact on humanhealth has been detected and even if the risks seem to be virtual, Gaz de France has toprevent any environmental consequences of residues in the subsoil of the sites. Currently theFrench government seems to accelerate its policy in terms of remediation of contaminatedsites. There is an inventory list of about 896 contaminated sites published in November 1997.
However, France is still defining soil guideline values for simplified risk assessment,which are called “valeurs de constant d’impact”. There is no intention to define ‘soil guidelinevalues for the detailed risk assessment but a site-specific evaluation. Risk analysis studiesprovided by industrial companies have to be valued by independent experts and the use ofmodels (health, pollution migration) have to be linked with field measurements. Thediscussion about basic principles used for deciding conditions and the objectives ofremediation are still in progress.
R&D programs for gas companies are developed by Gaz de France, Elf Aquitaine andCharbonnages de France
Acknowledgement
This report was prepared by M Bernharl of Germany with inputs from R Reimert of Germany.

APPENDIX A - GASIFICATION PLANT DATABASE
lAppendix for Status Report “Gasification”llComrnercial Gasification Plants I
I I IIComoanv/Owner lStatus lTechnoloqY
I I I
IFeedstocks lTarget Products lCapacityI
=
South Africa
Sasolburg
Sasol Limited Sasol 1 1955 Fixed-Bed GasifierSasol 2 1980 (FDV)-Lurgi-Type
Sasol 3 1982 25 bar,ca.1000-l 10O°C
Sasol Advanced Svnthol, ,--,.,
Sub-bituminous Fischer-Tropsch products Supplier from 34% of the
coal for FDV Fuels and oils total liquidconsumption
(ash content 25- Chemical products:ammonia, in South Africa
. .Sasol Slurry Reactor
installed: 97 gasitiers .----- .
76-80 gasifier synthesisgas
continuouslyin operation 454,000 t/a tar, 181,000 tla ammonia
UnitedStates Dakota Gasification Startup: 1984 Fixed-Bed Gasifier (FD~ North Dakota lignite Synthetic Natural Gas( SNG ) 4.42 x 10’% NmA3/d synthetic natural gas
North Dakota Company Lurgi-Type Phenols,cresylic ecids,krypton,
(North Dakota) 14 Gasifiers xenon,nitrogen,ammonia,
Lurgi-Methanation Process carbon dioxide,naphtha
Czech.Republic SokolovCoal CO. startup 1980 Fixed-Bed Gasifier (FDV) Czech.hard browncoal Electricity 300 MWe capacity
Vresova Lurgi-Type with extraordinaryhighash UP to 400 MWth
26 gasifiera melting point Steam largest congeneration unit in the world
lGCC-Process
Czech.Republic Zavody Pro Zpraco- Startup 1970 Entrained-Flow Gasifier Vacuum residue Oxochemicals and methanol 4,200,000 m’3/d
Most rani Ropy a Uhli Shell-Process Fuel gas for power 313 MWe
6 Gasifiers Steam for powerI lGr_W-Pmna.ac
FGermany
SchwarzeI
Pumoestances
10wnecBerlin WateriAuthnritv I
Ire%\ olefin,fertilizer,solvents,
phenoliccompounds,tars,coke Gasificationfrom 29x 10’6 ffa coal777 x 10% NmV!
---- , ,-.,.,-”
1995 F~ed-Bed Gasifler Lumpy waste productsin Synthesis gas for Up to 220,000 t solid waste materials
Lurgi-Type mixturewith coal( ligniteor Methanol Plant per annum for Fixed-Bed Gasifier
7 Gasifiers installed hard coal )
Entrained-Flow Gasifier Fuel Gas for Gas-/Steam turbine Up to 70,000 t extern liquidwaste oils
under oressure. temoera- par annum for Entrained-Flow Gasifierm!irt hvnmctl mts
------ .... —..—_.~.—–-—.–,.- .- -.ture above meltingpointof FSVLiq_- -,-------- 1ash from FDV-process and IMethanol Plantl 30,000 t/aRArathsnnl nlzmt nthm’ Iim lid wactn nilc I l~as-lSteam turbine max. 215 MWth,.,”., ,.a, ,“, p.-., ,. -., ,-. ,,7”, = .. -”.- ---- ——- .- .-— ..-. — .
lGCC-Procass or max. 76 MWe
China Since 1987 F~ed-Bed Gasifier Hard Brown Coal Town Gas with high Detailed data unknown
Harbin (FDV)-Lurgi-Type (classified) contentby methane
5 Gasifiers in operation
Netherlands Shell International DemonstrationPlant Entrained Flow Gasitier Heavy Refinety Residues Syngas for gas turbine Gas turbine 142 MWe
Rotterdam Oil Products up to 1997 Shell-Process with high sulphur content Steam turbine:204 MWe
Shell Netherlands 65 bar, 1350 “C Hydrogen for hydrcracker 285 Vd hydrogento refiningof oils
Ratlinaderij B.V. lCommercial Plant 3 parallel gasifiers lines up to 1650 t per day 4,650,000 NmA3/d syngas
Isince middle 1998

lGCC-Process
United States EquilonEnterprises Since 1996 Entrained- Flow Gasifier Refinety waste products/ Fuel gas for generating of power
El Dorado
80,559 mA31dSyngas
LLC TexacoProcess Petcoke
Kansas
and steam 6 MWe
1 Gasifier 35 MWe, 81,650 kg/h steam
Italv SAFI Plant Since 1992 Fluidized Bed Gasifier Refuse Derived Fuel (RDF) SvrmaslGreve in Chianti I Iat atmosDh. oressure I I I I
( near Florence, TPS-Technology
Tuscany ) 2 Gasifiers
Germany Rtidersdorfer start-up: 1996 Fluidized Bed Gasifier Biomass,wood,rejects Fuel gas for cement kilnfiring 100 MWth
Riidersdorf Cement Company Lurgi-Type ( probablythe largest biomass gasifier
(near at Berlin) I atmospheric rx’essure uo till now)
( Circulating Fluidized Bed )1 Gasifier
Zambia Nitrogen Chemicals since 1970 Entrained-Flow Gasifier Bituminouscoal Syngas 65 MWe, gas turbine
Kafue of Zambia Shell-Process Ammonia,Methanol 877,000 NmA31d
4 Gasifiers in operating
lGCC-Process
Australia C.S.R.Chemicals since 1971 Entrained-Flow Gasifier Heavy fuel oil Syngas 17 MWe
Rhodes,N.S.W. Ptv.Ltd. Texa@Process 228,432 Nm”31d
lGCC-ProctssChina China National since 1987 F~ed Bed Gasifier lAntracite coal Syngas for gas turbine, 170 MWe capacity
Shanxi Technology Impart (FDV) Lurgi-Type with dry Steam for steam turbine, 2,282,492 NmA31d
CO.[CNTIC) ash discharae I AmmonialGCC-Process
China China National I.Since 1985 Entrained-Flow Gasitier Visbreaker residue Syngas for ammonia
Urumqi
Unknown
Technology Petr& TexamProcess Steam for powerIeum Corp./Sinopec 1 Gasifier
China China National Since 1988 Entrained-Flow Gasifier Visbreaker residue Syngas for of ammonia UnknownNingria Petrochemical Texa@Process Steam for power
Corp./Sinopec 1 Gasifier
China China National since 1987 Entrained-Flow Gasifier Visbreaker residues Syngas for productionof UnknownDaoina Petrochemical Cara. TexaaProcess oxachemicals
Sino~ 1 Gasifier Steam for power generating
China China National I.Since 1995 Entrained-Flow Gasifier Heavy oil Syngas IUnknown
Dalian Liaoninq Petrochemical CorD. TexaceProcess Electricitv,steam
Isinopac 11Gasifier
China IDalian Chemical ]Since 1996 IEntrained-Flow Gasitier lVisbreaker residue ISvncrasfor ammonia Unknown
I ,GAaw r ,“b=.. I ,~l=u,l,city,steamI 1 Cseifbr I
Dalian,Liaoning IndustrialCorp..-
1l-a. . ..-. D----- I I!=la+A,
I , vu”,,,”, I I IChina Lu Nan Chemical Since 1993 IEntrained-Flow Gasifler lBitiminouscoal lSyngas for ammonia lCapacity 537,057 Nm’3/d
Tenaxian.Shandaa lndustrv[GrouD) ITexacc-Process I IElectricitv,steam 140 MWe
ituminouscoal lFuel gas and Town eras 13,000,000NmA3/d I
COJCNTIC 1 GasifierChina Shanghai Pacific Since 1994 IGT U-GAS Gasitier ]BilWujing,Shanghai Chemical Corp. Since 1994 6 Gasifiers in operating 1Clnf.t.ifiit, f h., n-e +, mhir
2 Gasifiers in reserve
,~,-, -v “v -0 .U, “me 1223 MWe I
IElectricityby steam turbine

lGCC-Process
China Shanghai Pacific lSince 1995 Entrained-Flow Gasifier Antracite
Wujing,Shanghai Chemical Corp.
Syngas for methanol UnknownTexa@Process Town gas
2 GasitiersChina Shougang Ironand Since 1995 Entrained-Flow Gasifier coal Town gas,Fuel gas 1,500,000 NmA3/d fuel gas
Beijing Steel Co. Texac@Process, 1 Gasitier Electricity 112 MWe
China Weihe FertilizerCo. Since 1996 Entrained-Flow Gasifier coal
Xian,Shanxi
Syngas for ammonia UnknownTexaco-Process Electricity
2 Gasifier
China Zhenhai Refining Since 1983 Entrained-Flow Gasitier Visbreaker residue Syngas for ammonia 2,100,000 NmA3/d syngas
Ningbo,Zhejiang &Chemicals Co. Texa@Process Steam 156 MWe
China BeijingNo.4 Since 1995 Entrained-Flow Gasifier Heavy oil Syngas for oxochemicals Unknown
Beijing Chemical Texaco-Process
China Unspecified Owner Since 1995 Entrained-Flow Gasifier Vacuum residue Syngas for ammonia 2,100,000 Nm’3/d
Hohhot Shell-Process Electricity 156 MWe
1 Gasifier Steam for power
China Unspecified Owner Since 1996 Entrained-Flow Gasifier Vacuum residue Syngas for ammonia 2,100,000 NmA3/d
Juijiang Shell-Process Electricity 156 MWe
1 Gasifier Steam for power
China Unspecified Owner Since 1996 Entrained-Flow Gasifier Vacuum residue Syngas for ammonia 2,100,000 NmA3/d
Lanzhou Shell-Process Electricity 156 MWe
1 Gasifier Steam for power
China,Unspecified Unspecified Owner Since 1981 Entrained-Flow Gasifier Vacuum residue Syngas for methanol and oxo- 715,000 NmA3/d
Location Shell-Process chemicals 53 MWe
1 Gasifier Electncity,steam
China Unspecified Owner Unknown Entrained-Flow Gasifier Vacuum residue Syngas for productionof 60,000 NmA3/d
Unspecified site Shell-Process oxochemicels 4 MWe
1 GasifierIndia FertilizerCorp.of Since 1974 Entrained-Flow Gasifier Heavy oils Syngas for ammonia 2,800,000 NmA3/d
Haldra India Shell-Process Fuel gas for power 209 MWe
4 GasifierlGCC-Process
India FertilizerCorp.of Since 1980 Entrained-Flow Gasifier Bituminouscoal Syngas for ammonia 2,000,000 NmA3/d
Korba India Koppers-Totiek-Process Fuel gas for power 149 MWe
3 Gasitiers, 1 reserve Steam
lGCC-Process
India FertilizerCorp. of Since 1975 Entrained-Flow Gasifier Heavy fuel oil Syngas for ammonia 2,600,000 NmA31d
Nangai India Shell-Process Fuel gas for power 209 MWe
4 Gasifiers Steam
lGCC-Process
India FertilizerCorp.of Since 1979 Entrained-Flow Gasifier Bituminouscoal Syngas for ammonia 2,000,000 NmA3/d
Rameguadam India Koppers-Totzek-Procass Fuel gas for power 149 MWe
Andhra Pradesh 3 Gasifiers Steam
lGCC-ProcassIndia FertilizerCorp.of Since 1979 Entrained-Flow Gasifier Bituminouscoal Syngas for ammonia 2,000,000 NmA3/d

lTalcher.Orissa ]India I IKo!mers-Totzek-Process ]Fuel aas for oower 1149 MWe
13Gasifiers Isteam
India IFertilizerCoro.of ]Since 1967 IEntrained-Flow Gasifier lRefinerv oils,Na~htha lSvnaas for ammonia 11,200,000 NmA3/d
Gorakhpur India Shell-Process Fuel gas for pewer 89 MWe
3 Gasitiers Steam
India FertilizerCorp.of Since 1965 Entrained-Flow Gasifier Off-gas from refine~, Syngas for ammonia 800,000 NmA3/d
Trombav India Shell-Process naDhtha Fuel aas for oower 60 MWe.4 Gasifiers Stea; “
India
Bharuch Gujarat Gujarat Fertilizer Since 1982 Entrained-Flow Gasifier Refinery residue oil Syngas fw ammonia and 2,800,000 NmA3/d
Corm TexamProcess methanol 209 MWe
1 Gasifier,1 Reserve Fuel gas for power
Steam
Egypt NitrogenWorks of Since 1966 Entrained-Flow gasifier Off-gas from refinery Syngas for productionof ammonia 778,000 NmA3/d
Talkha Societe el Nasr de KoiIDers-Totzek-Process Fuel aas for aeneretina of Dower 58 Mwe
Engrois 3 Gasifiers Steam
Indonesia Indonesian Since 1972 Entrained-Flow gasifier Fuel oil Syngas for ammonia 900,000 NmA3/d
Surabaya Government Shell-Process furtherdetails are not known Fuel gas for power 67 MWe
3 Gasifiers Steam
Japan Ube Ammonia Since 1964 Entrained-Flow Gasifier Coal and petcoke Syngas for ammonia 2,150,000 NmA3/d
Ube Citv IndustryCo.Ltd. TexamProcess Fuel erasfor rmwer 160 MWe
3 Gasifiers,l Reserve Steam
Japan MitsubishiPetro- Since 1961 Entrained-Flow Gasitler ]Crude oil Syngas for ammonia 400,000 Nm’3/d
Yokkaichi chemicals Shell-Process, 2 Gasifiers Fuel gas for power, steam 30 MWe
JaDan Unspecified Owner Since 1980. exact Entreined-Flow Gasitier lVacuum residue Svrmas for methanol 520,000 NmA3/d
Unspecified.-
status unknown lTexa@process IFuel gas for power 139 MWelocation I I 12Gasifiers I ISteam
Malaysia Shell MSD(Malaysia) Sinc8 1993 Entrained-Flow Gasifier Natural gas/middle distillates Syngas/Fuel gas for power 2,150,000 NmA3/d
Binlulu,Sarawak Sdn.Bhd. ) Shell-Process and steam 160 MWe
1 GasifierlGCC-Process
PhiliDDinas UnspecifiedOwner Start-urxl 974 Entrained-flowGasifier Heavv oil Unknown, tmmable electricity Unknown
Unspecified TexaaProcess withgas-/steam turbine
location
South Korea Honam Fertilizer Commercial or a Entrained-flowGasifier Heavy fuel oil Syngas for ammonia 500,000 NmA3/d
Seoul Demonstration Plant, Shell-Process Fuel aas for Dower 37 MWe
not specified exactly 1 Gasifier Steam
Start-up 1969
South Korea UnspecifiedOwner Date unknown, Entrained-Flow Gasifier Vacuum residue Syngas/Fuel gas for power 364,000 NmA3/d
Unspecified f Commercial or Shell-Process and steam [ aas-/steam turbine ) 29 MWe
location Plant ) 1 GasitierTaiwan Chinese Petroleum Since 1964 Entrained-Flow Gasifier Bitumen,heavy oils Syngas for chemical synthesis 4,543,680 NmA3/d
Kaohsing Corp. TexaoProcess Hydrogenand carbon monoxide, 338 MWe
2 Gasifier Power and steam with turbines

lGCC-Process
Brazil \Company Cosigua Since 1977 Entrained-Flow Gasifier Bunker C fuel oil Syngas,fuel gas for power 1,224,000 NmA3/d
Santa Cruz.Rio de TexamProcess Gas-/steam turbine 91 Mwre
Janeiro 1 Gasifier
lGCC-Process
Brazil UnspecifiedOwner Unknown Entrained-Flow Gasifier Asphalt residue Syngas for ammonia 3,300,000 NmA31d
Unspecified Iocat. Shell-Process, 1 Gasifier
Cuba lCubanitro Company Since 1967 Entrained-Flow Gasifier lHeavy fuel oil Syngas for ammonia 400,000 NmA3/d
Matanzas I Shell-Process I Power 30 MWe
1 Gasifier Steam
Dominican Repub- Falconbridge since 1971 Entrained-Flow Gasifier Lightfuel oil,Reducinggas Syngas/Fuel gas for power 1,440,000 NmA3/dof fuel gas
Iic,unspecified Dominicania Shell-Process with gas-/steam turbine 107 MWe
location 12 Gasifiere
lGCC-Process
Puerto Rico Oxochem.Enterprise Since 1970 Entrained-FlowGasifier Refining-offgas, naphtha Syngas for chemical synthesis 600,000 NmA3/d
Unspecified Shell-Process Fuel gas for power 45 MWe
location 2 Gasitier Steam
Puerto Rico Unspecified Owner Unknown Entrained-flowGasifier Orimulsion Fuel gas for power Unknown
Unspecified Texacc-Process Steam
location 1 Gasifier
Czech.Republic Zavody Pro Zpram Since 1972 Entrained-Flow Gasifier Heavy oils,Asphalt Syngas for chemical production 1,400,000 NmA3/d
Most rani Roov a Uhli Status todav not Shell-Process Svnaas for oower 104 MWe
knownexactly 2 Gasifier Steam
United States Equilon Enterprises Since 1967 Entrained-Flow Gasitier Heavy fuel oil Syngas for power 1,420,000 NmA3/d
Wilmington,CA LCC Texa~Process Hydrogen 106 MWe
1 Gastier Steam
United States Motiva Ente@es Since 1984 Entrained-Flow Gasifier Heavy residue oils Syngas for power Unknown
Convent LCC Texa@Process Hydrogen
Louisiana 1 Gasifier Steam
United States Eastman Chamical Startup 1992 Entrained-Flow Gasifier Bituminouscoal, grinded, Chemical substances Capacity about 907 f/d
Kingsport Company Gasifier 1993 Texaco - Process with a high sulphurcontent Methanol (max.54t/h)
Tennessee LPMeOH: 1997 Sulphur 272 t/d methanol
( demonstration Syngas production:1,930,000 NmA3/d
reactor ) I Power outtwk 100 MWeI I
Belgium lAmmoniaque ]Since ;963 IEntrained-Flow Gasifier lHeavy fuel oil lSyngas for ammonia 1480,000 N“mA3/d
Willebrook ]Svntheticrue I IShell-Process I IFuel aas for ~wer 136 MWe 1
2 Gasitiers Steam
Belgium Ammoniaque since 1965 Entrained-Flow Gasifier Heavy fuel oil Syngas for ammonia 300,000 NmA3/d
Willebrook Synthetique Shell-Process Fuel gas for power 22 MWe
1 Gasifier Steam
Belgium Union Chemique Since 1965 Entrained-Flow Gasifier Heavy fuel oil Syngas for ammonia 600,000 NmA3/d
Zandvoorde Bedriiven S.A. Shell-Process Fuel aas for wwer 45 MWe
12Gasifiers ISteam
Finland IUnspecified Owner IUnknown IEntrained-Flow Gasifier lVacuum residue lFuel gas for power 16,800,000 Nm’3/d syngas

IPolvoo I I Is~cdl.nrnencc 1 &acifiar ISteam !506 MJJe 1
Finland lTyppi Oy Fertilizer lSince 197? Ic
Oulu I I
,,,.,,! ~. ---”-, . --”,,,”, ----- _-—
Lntrained-Flow Gasifier Heavy fuel oil Syngas for ammonia 300,000 NmA31d
Shell-Process Fuel gas for power 22 Mwe
1 Gasifier Steamia 300.000 NmA3/d
.
Finland Typpi Oy Fertilizer Since 1965 Entrained-Flow Gasifier Heavy fuel oil Syngas for ammoni
Oulu Shell-Process Fuel gas for power -- ,., . .
1 Gasifier Steam
France Rhone-Poulonce Since 1989 Entrained-Flow Gasifier Natural gas Syngas for chemical processes 264,000 NmA31d
Pent-d+Claix Chimie De Base TexaoProcess Fuel gas for power 20 MWe
I 1 Gasifier Steam
France Oxc-Chimie Paris Commercial or Demo Entrained-flowGasification Heavy fuel oil Syngas for oxochemicels 200,000 NmA3/d
Lavera Plant since 1968, Shell-Process Fuel gas for power 15 MWe
( exact status today 1 Gasifier Steam
unknown)
France Oxo-Chimie Paris Since 1991 Entrained-Flow Gasifier Heavy fuel oil Syngas for oxochemicals 590,976 NmA31d
Lavera Texac~Process Fuel gas for power 44 MWe
1 Gasitler Steam
Germany BASF AG Since 1966,exact Entrained-Flow Gasifier Heavy fuel oil Syngas for oxochemicals Unknown
Ludwigshafen status unknown TexaaProcess Fuel gas for power
1 Gasitier SteamGermany BASF AG Since 1967,exect Entrained-Flow Gasifier Heavy fuel oil Syngas for oxochemicals Unknown
Ludwigshafen status unknown Texa@Process Fuel gas for power
1 Gasitier Steam
Germany BASF AG Since 1969,exact Entrained-Flow Gasifier Vacuum residue,heavy fuel Syngas for oxochemicals Unknown
Ludwigshafen status unknown, Texa~Process oil Fuel gas for power
1 Gasifier Steam
Germany BASF AG Since 1968,exact Entrained-Flow Gastier Fuel oil Syngas for hydrogen 980,208 NmA3/d
Ludwigshafen status unknown Texaco-Process Fuel gas for power 73 lvfWe
3 Gasifier,1Reserve Steam
Germany BASF AG Since 1974,exact Entrained-Flow Gasifier Vacuum residue,heavy oil Syngas for methanol
Ludwigshafen
Unknown
status unknown Texaco-Process Fuel gas for power1 Gasifier Steam
Germany SAR GmbH Since 1986 Entrained-Flow Gasifier Vacuum residue Syngas for oxochemicals 1,200,000 NmA3/d
Oberhausen-Hol- TexacoProcess Hydrogen 89 MW
ten 1 Gasifier Fuel gas for ~wer
Germany Chemische Werke Since 1967 Entrained-Flow Gasifier Fuel oil Syngas for chemical production 400,000 NmA31d
Marl/Westfalen Huls AG status today not Shell-Process Fuel gas for power 30 MWe
knownexactly 1 Gasitier
Germany Chemische Werke Since 1967 Entrained-Flow Gasifier Fuel oil Syngas for chemical production 450,000 NmA3/d
Marl/Westfalen Huls AG statustoday not Shell-Process Fuel gas for power 34 MWe
knownexactly 1 Gasifier
Germany Deutsche Shell AG Since 1973 Entrained-Flow Gasifier Heavy fuel oil,residuefrom Syngas for chemical production 1,400,000 NmA3/d
Godorf Shell-Process reflne~ Hydrogen 104 MWe
2 Gasifiers Fuel gas for power
Germany Erdolraffinerie Since 1964,today Entrained-Flow Gasifier Heavy fuel oil,naphtha Formerly town gas,today fuel gas, 900,000 NmA3/d

Mannheim Mannheim GmbH status not known Shell-Process synthesis gas 67 MWe
exactly 3 Gasifiers
Germany Farbwerke Hoechst Since 1970 Entrained-FlowGasifier Heavy fuel oil Formerly syngas for oxochemicals 300,000 NmA3/d
FrankfurUMain AG Shell-Process Status today not known exactly 22 MWe
1 Gasifier Power
Germany Gewerkschaft Since 1962 Entrained-FlowGasifler Naphtha,naturalgas Syngas for ammonia 600,000 NmA3/d
Castrop Rauxel Victor Status today not Shell-Process Fuel gas for power 45 MWe
knownexactly 2 Gasifiers Steam
Germany Mitteldeutsche Since 1986 Entrained-FlowGasifier Vicbreaker residue,heavy Syngas for methanol 7,200,000 NmA31d
Leuna Erdokaffinerie Shell-Process fuel residues from refinery Hydrogen and electricity 536 MWe
(Mider GmbH) 5 Gasifiers Steam
Germany Ruhrchemie AG Since 1963 Entrained-FlowGasifier Heavy fuel oil Syngas for oxochemicals 300,000 NmA3/d
Oberhausen- Status today not Shell-Process Fuel gas for power 22 MWe
Holten known exactly 1 Gasifier Steam
Germany Ruhrchemie AG Sin@ 1969 Entrained-FlowGasifier Heavy fuel oil Syngas for oxochemicals 300,000 NmA3/d
Oberhausen- Shell-Process . Fuel gas for power 22 MWe
Holten 1 Gasifier Steam
Germany Union Kraftstoff Since 1958 Entrained-Flow Gasifier Heavy fuel oil, naphtha Syngas for methanol 400,000 NmA3/d
W esseling AG Status today not Shell-Process Fuel gas for power 30 MWe
known 2 Gasifiers Steam
Germany Union KraftstoffAG Since 1961 Entrained-Flow Gasifier Heavy fuel oil,naphtha Syngas for methanol 400,000 NmA31d
W esseling Status today Shell-Process Fuel gas for power 30 MWe
unknown 2 Gasifiers Steam
Germany Union KraftstoffAG Since 1961 Entrained-FlowGasifier Heavy cracked residue Syngas for methanol 300,000 Nm’3/d
W esseling Status today Shell-Process Naphtha Fuel gas for power 22 MWe
unknown 1 Gasifier Steam
Germany Union KraflstoffAG Since 1964 Entrained-Flew Gasifier Heavy cracked residue Syngas for metehnol 600,000 NmA3/d
Wesseling Status today Shell-Process Fuel gas for power 45 MWe
unknown 2 Gasifiers Steam
Germany Union KraflstoffAG Since 1969 Entrsined-FlowGasifier Heavy cracked residue Syngas for methanol 1,400,000 NmA3/d
W esseling Status today Shell-Process Fuel gas for power 104 MWe
unknown 2 Gasifiers Steam
Germany VEBA Chemie Nerd Sinca 1964 Entrained-FlowGasifier Heavy fuel oil Syngas for ammonia 600,000 Nm’3/d
Erkenschwick, AG Status today Shell-Process Fuel gas for power 45 MWe
Hannover unknown 2 Gasifiers Steam
Germany VEBA Chemie AG Since 1973 Entrained-Flow Gasifier Vacuum residue Syngas for ammonia and 3,800,000 NmA31d
Gelsenkirchen Status today not Shell-Process methanol 283 MWe
known exactly 4 Gasifiers Fuel gas for power
Germany VEBA Chemie Nerd Since 1965 Entreined-Flow Gasifier Heavy fuel oil Syngas for ammonia 300,000 NmA3/d
Erkenschwick, AG Status today Shell-Process Fuel gas for power 22 MWe
Hannover unknown 1 Gasifier Steam
Germany VEBA Chemie Nerd Since 1965 Entrained-FlowGasifier Heavy rhel oil Syngas for ammonia 600,000 NmA3/d
Salzgitter AG Status today Shell-Process Fuel gas for power 45 MWe
unknown 2 Gasifiers Steam
Germany VEBA Chemie Nerd Since 1966 Entrained-FlowGasifier Heavy fuel oil Syngas for ammonia 300,000 Nm’3/d

Salzgitter AG Status today Shell-Process Fuel gas for power 22 MWe
unknown 1 Gasifier Steam
Ireland NitriginEireann Since 1965 Entrained-Flow Gasifier Heavy fuel oil Syngas for ammonia 400,000 NmA3/d
Arklow Teoranta Status todav Shell-Process Fuel aas for oower 30 MWeunknown 2 Gasifiera Stea; ‘
Norway Norsk Hydro since 1965 Entrained-Flow Gasifier Heavy fuel oil Syngas for ammonia 1,000,000 NmA3/dHerova Status todav not Shell-Process and methanol 74 MWe
knownexactly 2 Gasifiers Fuel gas for power
Norway Norsk Hydro Since 1965 Entrained-Flow Gasifier Heavy fuel oil Syngas for ammonia 700,000 Nm’31dHeroya Status today not Shell-Process and methanol 52 MWe
knownexactly 1 Gasitier Fuel gas for powerPortugal Sociedade Portugi- Since 1961 Entrained-Flow Gasitier Heavy oil, naphtha Syngas for ammonia Unknown
Lisbon sa de Petroauimica Status todav not TexaceProcess Fuel aas for oower.S.A.R.I. “
-,knownexactly 1 Gasifier Steam
Portugal Quimigal since 1982 Entreinad-Flow Gasifier Vacuumresidue Syngas for ammonia 2,400,000 NmA3/d
Barreiro Shell-Process Fuel gas for power 179 MWe
1 Gasifier SteamlGCC-Procass
Spain Abonos Sevilla S.A. Since 1963 Entrained-Flow Gasitier Heavy fuel oil, naphtha Syngas for ammonia 200,000 NmA3/dSevilla Shell-Process Fuel gas for power 15 MWe
1 Gasifier Steam
Spain Abonos Sevilla S.A. Since 1968 Entrained-Flow Gasitier Heavy fuel oil, naphtha Syngas for ammonia 200,000 NmA3/d
Sevilla Shell-Process Fuel erasfor rmwer 15 MWe
1 Gasifier SteamSpain Compania Insular Since 1959 Entrained-Flow Gasifier Heavy fuel oil, naphtha Syngas for ammonia UnknownLas Palmas,The del Nitrogenous.A. Status today not Texacoprocess Fuel gas for power
Canary Islands knownexactly 1 Gasifier SteamSpain ]Refineria de Petro- Since 1963 Entrained-Flow Gasifier Heavy fuel oil,n aphtha Syngas for ammonia Unknown
Carkxaena Ileas de Escombr& TexaceProcess Fuel gas for power
ras S.A. 1 Gasifier Stea; “
Sweden AfBSvenska Sal- Since 1964 Entrained-Flow Gasifier Heavy fuel oil Syngas for ammonia 400,000 NmA3/d
Keeping peterverken Shell-Process Fuel gas for power 30 MWe
2 Gasifiers
Sweden
SteamAJBSvenska Sal- Since 1964 Entrained-Flow Gasitier Heavy fuel oil Syngas for ammonia Unknown
Kvamtoru oeterverken Status todav Texaco-Process Fuel aas for Dower
unknown 1 Gasifier st& “
United Kingdom Shell Chemical Co. Since 1958 Entrained-Flow Gasifier Heavy fuel oil Syngas for ammonia 800,000 NmA3/d
Shell Haven Shell-Process Fuel gas for power 60 MWe
4 Gasifiers Steam
Unitad Kngdom Shell Chemical Co. since 1958 Entrained-Flow Gasifier Heavy fuel oil Syngas for ammonia 300,000 NmA3/d
Shell Haven Shell-Process Fuel aas for oower 22 MWe
1 Gasifier SteamUnited Kingdom South Eastern Gas Since 1961 Entrained-Flow Gasifier Heavy fuel oil, lightnaphtha Fuel gas for town gas 800,000 NmA3/disle of Grain Board Shell-Process Fuel gas for power 60 MWe

I 14Gasifiers I(town gas generating shutdown
propably)Finland Owner unknown Since 1995 Bioneer Counter - Current Biomass,wood,otherorganic
Wilen and Kurkela Foster WheelerFuel gas for heat, Capacities from 10-30 MWth
Good operationex- Gasifier materilas,highflexibilityat Fuel gas cleaning is solved well, Avarage performance time 8000 hoursEnergy Oy has periences ( classicaldesign from coal feedstocks data show a high reliability,ahigh per year, availability 95-97 %all marketing rights gasifier ) degree of utilisation,highefficien-
cy also under part load, low speci- In summaty 4 applicationsin tirung
fic emissions lime kilnsSweden Owner unknown Since 1996 Circulating- Fluidized Bed Biomass,woodwastes Fuel gas for heat 35 MWth output
Varo Gasitier Other specified data are not known atKvaemer Process present
Germany Energiezentrum Since 1998 F~ed-Bed Co-Current Demolitionwood specially Fuel gas for heat and power Afler complete erection and commissi~Espenhain near Espenhain Gasifier from formerly surrounding ( CHP - Process) ning:3 JUCH-Gasifier with 4 MWth eachLeipzig Juch Process industrialareas and 3 engine/generator units of 850 kWe
3 Gasifiers Disposal capacity wiil be 32,000 t demo
Appendix for Status Report “Gasification”2.Demonstration Plants
1 1 1 1 1 1
Country/Site ICompany/Owner ]status lTechnology IFeedstocks ]Target Products lCapacityI I I I I I
1
Spain Elcogas S.A.(Ass& lStartup: 1992 Entrained-FlowGasifier High-ash coal(50%) in mixture Fuel gas for gas turbine and steam Design fuel:50% coke and 50% coalPuertollano ciationof 8 Euro- Prenflo-Process with petroleum coke(5070) for steam turbine Mass flow2,800 t/d
pean Utilitiesand 3 Goal: Commercial ( Feeding of dry coal to the from nearby refinery Sulphur (Claus-Proc-ess) LHV22,550 kJ/kg, HHV23,095 kJ/kgtechnologysupplier Plant from 2001 on reactor,temperaturesabove Also different coals such as 4,300,000 NmA3/d
1500”C, pressure about 26 hard coal,lignite,anthracite, Electricityand steam Power output Gas turbine 190 MWebar,Iiauid slaa discharae ) residues from refineiv Steam turbine 145 MWe
,“ .-,
]Liquidslag discharge lTotal,neti 335 MWe
I I IGasific. aaent 85% oxvaen IEfficiency Gross: ( LHV ) 47 % IIGCC - Process ( Largest unitworldwide based on coal )
Netherlands Demkolec B.V. Startup 1993 Entrained-FlowGasifier Coal and petroleumcdke Fuel gas for gas turbine and Combine power station with 253 MWeBuggenum (EngineeringCom- ( Commissioningwith Shell - Process, specified as Basis were testing runs steam for operatingof the steam Up to 2000 t coal per hour(Province Limbg.) pany,100% owner natural gas, 1. Demkolec - Process with 16 differentcoal species turbine Efficiency about 48%
IDemon- 1 I IIDutch Electricity Istration period up to 1(Gasificationagent 95 % Iin the Shell - Gasifier in lGenerating from electricityand lGoals: Increasing by efficiencyto larger as
Houston,Generating Board 1997 ) oxygen with steam ) TX,U.S. steam 50%, capacity up to 400 MWeN.V.Sep lGCC-Process by capacity to 400 MWe
United States Tampa Electric Startup 1996 Entrained-FlowGasifier Coal as coal-water-slurry Fuel gas for gas turbine and Designed for 1,810 t/d coalTampa, Florida Company (In July 1996 was Texaco - Process in a stable suspension steam for steam turbine Gas turbine: 192 MWeL Ifirst

and Teca Power synthesis gas ) ( Gasificationagent: 95% IPetroleum coke Sulphunc acid Gross: 313 M!!/eService(TPS) oxygen, temperaturelarger Net: 250 MWe
1,400 “C, solid content in slurry
UP tO 64% )lGCC-Process
UnitedStates Sierra Pacific BeginningCommissg. Fluidized-Bed-Gasifi@ion Low-sulphurWestern U.S. Fuel gas for gas turbine 601 t/d of coalcoal
Pinon Pine Power Company’s June 1996 (Kellog-Rost-Westinghouse Eastern U.S. Coal Steam for steam turbine Gas turbine: 61 MWeReno,Nevada Tracy Station Startup 1997 Reactor - KRW ) Electricity Steam turbine: 46 MWe
20 bar, 1,000 “C Gross: 107 MWeHigh-gas desulfurization Net: 100 MlIGCC - Process Efficiency 40.7 % (?&-i
I Synthesis gas: 2,635,000 NmA3/d ‘United States Dow Plaquemine since: 19831985 Entrained-Flow Gasifier ICoal-Water-Slurry Fuel gas for gas turbine 161 MWePlaquemine ( among the first Destec - Process ( basis ( oxygen-blowngasifier has been ope-Louisiana plantsworldwidefor Shell Gasifier ) Electricity rating successfully at Plaquemine since
lGCC-Technology ) IGCC - Process middle 1987 )UnitedStates Destac Dynegg Inc. Startup 1992 Entrained-Flow Gasifier Bituminousgrinded coal with Syngas for power generating 262MW (new GE7A combustionturbine)West Terre Haut Houston ( Begin operatindwith Coal-Water-Slurry a high sulphur contentfrom with gas turbine and steam for In the first 8 month were producedIndiana PSI Energy,lnc. natural gas; first coal Owgen with %~o locallymined steam turbine 2,470 TJ (dry). . . ..-. —.l~_a_~asnKIVer lPlamtlelcJ,lndlana ]run 1995) llGCC-Process lFeedstock as coal-water- ]By-products:Sulphurand Slag lTotal coal processed:139,000 t IOasl- 1ficationProject slurry Longest continuouscoal run:253 hoursGermany Noell Energy-and startup 1993 Noel-Conversion-Process Municipalwaste and other Syngas for chemical substances Detailed data were not available intheFreiberg Disposal Engineerg. ( Plant is operating First stage Pyrolysis waste products Productionof power, steam public reportsSaxonia GmbH also as pilotplant) Second s4age:Entrained-Flow Sewage sludges
(a company from Special technology gasifier By-productsfrom thePreussag) for processingof chemical industty
variruISwsste nrn-1 1
------- ------ ~.- 1 IIducts
II
I I I I I
India Sanghi Cement startup scheduled: Fluidized- Bed Gasifier Lignite,coke(as startupfuel) Syngas/Fuel gas for power Gas turbine(standard turbinePG65511 B)Sanghipuram Project End of 1997 ( air blowngasifier under Limestone (bad material)Hotiyay/Motibar
production with 39.16 MW at ISO conditionswithSanghi Industries pressure ) in combinationwith Steam for steam turbine
Villagesnatural gas
Ltd./lBlL Energy hot gas clean up technologies Sulphur Fuel inputwith lignite 137.7 MJ/MMBtu/hSystems Ltd. of Carbona,Finland Inc. ) Fuel inputwith naphtha 113.2MJ/MM BtuIgnifluidBoilers Tampella - ProcessIndia as coordinator
per hourlGCC-Prccess
I1
Austria Zellstoffwerke Startup 1986 Fluidized- Bed Gasifier lBiomass,speciallytree bark Fuel gas for heating 35MWthPols Pots AG start-up:1986,plant ( Circulating Fluidized Bed - Detailed data unknownat present
is in operating Lurgi - Process)
Finland Kenira Oy Startup: 1988 Fluidized Bed Gasification IPeat,Biomass Syngas for ammonia Throughput up to 25 t/h feedstockOule HTW - Winkler - Process) Fuel gas for power Several thousands of hours operating
1 Gasifier.1Obar I Steam exnerincfi

Germany IRheinbraun AG startup 1986 IFluidized Bed Gasifier Lignite Syngas for chemical production 864,000 NmA3/d
Hurth-Berrenrath ( closed in 1998 ) Fuel gas for power 64 MWe
I 11Gasifier Steam1
Italy ILVA Steel Works Startup 1996 IEntrained-Flow Gasifier Blast furnace gas Fuel gas for power Unknown,specifieddate are notTaranto (other data unknown) Steam presentlyknownSweden Ahlstrom CO.FI Since 1997 Fluidized Bed Gasifier W oad waste,chips Fuel gas for powerVamamo,SW
Net power production: 6 MWthFoster&Wheeler Ah[strom- Pressurized Flui- Staam District heat 9 MWthSydkraft, SW dized Process), 1 Gasifier, Electrical efficiency 44 %
950-1000 OC,HeatGas Cleaning
lGCC-Process[ first mocessworldwide)
United States Consortium Pichtr, Startup 1997, today Fkridized Bed Gasifier under Bagasse Fuel gas for power 3.8 Uh throughputHawaii HC&S,lGT,HNEl, partillyin commissi~ pressure Currently Westinghouse SteamPaia Maui Parsons;supported ning lGT-Renugas Air/Oxygen- tests the high-temperature Methanol
Pra-by State of Hawaii Cass ceramic filters
825-900°C,3-20barI Hot aas cleanina with ceramic
filters
Netherlands SMG Since 1990 Fixed-Bed Gasifier Sewage sludge Fuel gas for heat 2 Technical lineswith respectively 500kWth
Vlissingen (in operationtoday ) ( Downdraft Gasifier ) SteamTechnology supplierSMG
Netherlands SMG Startup 1998/99 Fluidized- Bed Gasifier IResidue-derived fuels(RDF) Fuel gas for heat 22,680 t/a are plannedBorsele commissioningis Circulated - Fluidized- Bed - Further detailed data not known Further informationconcerning the b+
Dlanned in 1999sta- Process, 1 Gasifier I ainnina of test ohase are not knownl~usat present not lTechnology suppliecTPS
. .
exact knownDenmark Owner unknown StSrtUP 1996 FMed - Bed Gasifier Biomass,wood,otherorganic In the first stage fuel gas for g+ Capacity planned: 4 MWthHarbaare ( Counter-Current- Process) materials neration of heat,in the second Capacity planned in second siege: 1.2
lMWe -I I lTechnoloav suDDlieEVoiand. Istaae fuel aas after aas cleanina
la new aspect is the appli~ Ifor productionof power in gas
I I hion of some sewndarv aa- Ienaine I.-sificationby injecting from
extra airItaly Daneca,SpA Since 1997 Fixed Bed Gasification Refus~derived fuel ( RDF) IFuel gas for heat and for power Planned capacity in first stage:3 MWthVillasantina (Up - Draft - Process ), a par- as pellets or also fluffy, and 0.6 MWe ;planned capacity in secondIsala d’Elba tial oxidationunit ,preheated wood chips,briquettesof stage 6 MWth
air cleans the gas, conven- PET bottleshave been gasi- Overall biomass to electricityefficiency
tional wet scrubber, active fied is rather low (20Yo)
carbon filter Daneca confidenta possible improvementbv efficiency UDto 30%
Germany Wamsler-Umwelt- Sinca 1994 FMed - Bed - Gasifier. .
Biomass,waad,waste wood, Fuel gas for heat Planned capacity for these three plantsMunich,Bavaria technik GmbH,other 3 unitswere realized ( Dawn-Draft- Process) plastics,textiles and in a second stage for power 600-1 ,500k Wth
owner unknown ( current status 1 Gasifier with wet aas (manv testina runs were aas enaine Planned cmacitv of aas enaine: 200kWe

unknown ) cleaning and dust separation @ried out)
Technology now is offeredby Umwelt-Engineering
Hugo Petterson,WiesbadenSpain GASBI Specified status at Fixed - Bed - Gasitier IBiomass,wood Fuel gas for generation of heat Planned capacities:150-1 500 kWth
locationunknown present unknown ( Down-Drafl-Process ) Further mncrete informationunknownParaguay Owner unknown Since 1995 Fixed - Bed Gasifier Biomass from variuos sources Fuel gas for heat and power Capacity 1.4 MWth, largest unit in theLoma Plats ( today shutdown ( Down - Draft - Process) wood,wastewood Power over engines field of small-scale gasifier
because cheaper manufacture 72,000 operating hourspower over electricity “Doublethroat’’-Gasifier
grid )Switzerland HTV Energietechnik Since 1993/94, Fixed - Bed Gasifier Waste wwd Fuel gas for heat and power Max.capacity of this type gasifiecl MWeKestenholz AG modified in 1995, ( Down - Draft - Process) (15-20% moisture,ash con- with gas engine units (a project consistingof 850 kWe each
( plant shall be in Gasifier has a double wall tent 3-5%) (an importantproblem is the gas of 3 lines gasifier installationsis underOperating as a de) throughwhich producer gas cleaning for operating of gas preparation in Espenhain,near Leipzig;
exchange heat with the fuel engine; woling,filter,ash/slag )
bed ( JUCH - Gasifier )another applicationfrom Juch - Gasifier )
Appendix for Status Report “Gasification”3.Pilot Plants
I I I I I ICountrv/Site IComDanv/Owner Istatus lTechnoloov IFeedstocks ITaroet Products ICaDacitv
Italy Thermoselect S.A. Pilotanlage/Demon- Combined Carbinization- Municipal Waste
Verbania/Fond@ UEC Environmantal strationPlant GasificationTechnology Syngas/Fuelgas for heating and Throughput pro Iine:about 10 t (
totemax.capaci-
Engineering Cons. since 1992 ( Thermoselct - Process) Wastewater Sludge and power with gas engines W)(a wmQanv from Gasificationfrom other waste Droducts Svnaas about 240.000 NmA3/d. . .
]Alba and Krone) compressed and pra-.-
1Pre-wndition:handling in the I I
I I Iheated waste mata~nlc Inlant ml let ha nnecihln
,... ..._1 1
, ,...”, ,.., ” , . .. . .. .... . -- “---.-.J and ISLIIDhIJrfrom the aas mwificationin a melting bath with materials must hold a mini-
1 I Ioxvaen Imum heatina value
Temperatureup to 2000”CGermany Noell Energy-and startup: 1993 Combined Canonization- Coal,various other fuels, Fuel gas for heat and power
Freiberg Disposal Engineerg. ( Plant has operated Gasification Technology
Detailed data were not available
Municipalwaste and other Synpa= fnr chemir..l svnthesis
Saxonia GmbH also as demonstra- (Nmll-Convemifim-Drfifi=@=\ ,.,- eta nr,w+,.-*e .,-.11-.
(a company horn tion plant) Firts stage: Py
Preussaa) Sewnd staae -, ,.,~,,.- , ““–”, ”.A,. VL” ,, ”,,, “,, V,, ,,W, ,
=-- .-. -. .-. . . -,-------- 1
>,”, ,-, , “--u , , ., U-.U “, ““.””.0 ,-,, esoondina requirementsof/rolysis ISewage sludges Ithe custumersFr,trc,ir,,a,-1 - I R\ J-rIr,m,-1,,,+= fr,-.m ,-hami,-=i I I
Flow Gasifier at pressure industry
Japan Joint-Venture-Deve- Since 1991 Entrained-Flow Gasitier Various wals from own Fuel gas for power( gas turbine) Capacity 200 ffd grinded wal
Iwaki City lopment-Projectbet- GoakDevelopment Targetown technical efforts origin and heat in mmhinatbn with Canacitw 175 MN*
Fukushima Prefec- ween several wm- from a new lGCC- for an improvementfrom the ,“ “.”... ,, .“, -,.,”1
---- ----- . . . . . . . . . . .1--r--..,..-.-.....
15ctaam t,whinn I
ture Ipanics and with IProcess with a high IknownTexaco-Process lTechnical and ewnomical targets:The

I
I
I
i-LN( ,– 1. ---- --- ------- IFenen
--.,..—, -“.. ,, U$Z,-,UI ,-, raumuuuqm.. --- . . . . . .
IRant shallbe in oge lTechnoloovsuoolii k not I Inthnr ,++. -m not known I1 I I -.,.,, .A’.---
Iratino Iknrnun ‘- “
E===l. . .
Detft Universii si& 1985, FhWized-Sed Gasifier C@ and straw,m!scanthus Fuel gas for testingof d~ent 1.5 Mwthoutput,maDetft Univemity ( MultinaticmalPm. status todayrid ( Circulated Flukfiied Seit as pei$ets gss cleaningprocesses and ana- Pressure UPto 1 MP~
ject ) under pressure ) Testing of various mixingrates tysisfmmgasdepende ntonfeed- (withthe pilotplant am made fundamental1 Gaa#ii,temperature up frrxllcoalt obiomass
Istock mixtums hvestiaatk
to 900 “c FueJ@S for heatUnited Kingdom Millbmok Industrial StaWP: 1998 FNed-Bed GasHier Wood,waste wood~~.N- . . . . . -
Fuelgasfor heatandpower IZW KWe ( plarllm Wlpul ).— — I
iR7mnmming qualii ofI -,.----a--Iproducedgases)-------- . ---- -. .4.... \
.m tsmte uwne,w. ( Down-Draft-Gasiikw) waste thnberwas testedIreland” results unknown
Finland W-T startup unknown Fluidii - Sed GasjfIer Feedstocks are different Testing of variQusbiomassfeed- Capacity of plantm kWthkJcatfQnunknown U* pressure biomass materialsalso in stocks in gasificationprocess Tasting plant in small-scale pilotplantfor
1 P!antlobar IMendii Wittrotfw fuels Generation of fualgasarlcfpurifk detarrnhation of pmjecl data for a greater(on requestin operating) cation of this gas plant in future(forkistance a demtrzk
tion plant)Sioh “cmtdfwerke Since 1995 t%ed - ~ Gasifiw B~ from the farm, Fuelgasfor twatandpower Planned capacityl MWth and 25 kWe
Arnest,Soti Ger- Serlii GmbHjoint (Down -Dmft Pros) Wood,wasteWod Electri@ generatingwith gas other spmMieddata unknownw valtum company Amertcan High Temperatum
Uketye@na
Gasifier in coqmtkm
with KHD HumbokftBioheizstoffwake SJnce 1898 ~Ked - 8ed Gasifiw Bmmassfrom the farm, Fuelgastiheatand poww Planned capacityl MWth and 25 kWe

Flensburg ]GmbH 1(Down - draft - Process, wacd,waste wood ]Electricitygenerating with gas 10ther specified data unknown(North Germany) Iin co-operartionwith KHD engine 1(Analog Arnest, South Germany)
lRosenheim I I 1(Down- Draft - Process, Isourcesjfor instance straw ]Electricity~eneratina with aas IContinuousoDel
Humbolctt ) IGermany lWamsler Inc. ISince 1997/98 Fixed - Bed Gasifier IBiomass from different lFuel gas for heat and power IPlanned capacity 650 kWth per line
‘ationfor 6800 hoursBavaria
.- --installationoperate fullv and agriculturemaducts Ienaine has been achieved
automatically) nominal gas productionof Wamsler-Ga-Germany Owner unknown since 1997/98 Fwed - Bed Gasifier Biomass from different Fuel gas for heat and power Planned capacity 650 kWth per lineSchlieben ( founded by Euro- ( Down -Drafl Process, sorcas Electricitygeneratingwith gas Testing from 12 various types of biomassnear Cottbus pean Commission) installationooarate fullv Fuel size60mm maximal ermine fl IRIS-..
IBranaentmrg I I
., 1- –- ,– ,--- - I------- --,------
1--------------_r_._.—.—..,
1----- .— ---- . . . . -. .=.. .-
1.--.-
Iautomaticallv) Idimension I Inominal aas moducfionof WaI
., , I “.
! sifier440mA3/himsler-Ga-
United Kingdom200 kWe output
Wellmann Process Since 1990s in ope- Fixed - Bed Gasifier Biomass from different Fuel gas for heat and power Capacity of pilotplant 100 kWth,very littlelocationunknown EngineeringLimited rating (Up - Draft Gasifier ) sorces,wood,wastewood Electricitygenerating with gas capacity
type must be uniform,lumpy, as main feedstock engine( main problemfor engine installationwith capacities 2-5 MWthmax.70mm operating:tcohightar ccmtent,tar could be perhaps compatetively
must be removed before fuel gas Developments in future for this biomassDenmark Volund iVS since 1996 FKecl- Bed Gasifier FeadstocksBiomass, spedal Fuel gas for heat with a boiler Installed capacity4-5 MWthHaboare (Up - Drafl- Process, wood chips ans straw ( 4MWth ) for districtheating gas boiler with 4 MWth capacity
with automaticfaedirw and (moisturecontentmax.20% ) heatina
ash removal system,gas Planned in second stagegene~cleaning system included tion of power with gas engine orhot gas cyclone,gas/oil with a hot air turbine( 2 options)heat water boiler)
France Societe’Matiezo In operating since FMad - Bed Gasifier Faedstockwood chips or Fuel gas for heat and in a second Installed capacities:l 00,200 and 600 kWth
. the oldest installationhas already ope-(small~scalebiomass
-. --q;ette form rated 24,000 hourswithoutany engine
gasifier) problems )France Gazo-Chevet In operating since FKed - Bed Gasifier Feedstocks:woodchips up Fuel gas for heat and power Installed capacities in the range of 110-
00 kWth
Ilocationunknown I Isome yeara 1(Down - Draft Process) laWicUlturalresidues in bri. ktaae for Dowerwith gas encrine I( I
locationunknown (manufacturewho same yeara (Up - Draft Process ), to 80 mm and/or maize husks, with gas engine ( option) 2,2((Set up all installa- has bean active for (small-scale biomass over 40 installationsworld- More specifieddata are unknowntionsoutsideof many yeara in the gasifier) wideEuroDe) field of small-scale
lxmass gasmers)
USA Southern Company Gasification Transport Gasifier/Reactor Various bituminouscoals Syngas/Fuelgas for testing of hotPower Systems &US Department equipment being High Temperature, High gas cleaning and for test powerDevelopment of Energy installed& checked Pressure Gas Filtration generation in fuel cells andFacility (PSDF) startup 2000 “ Particulate Control Systems advanced combustionturbinesLocatian:
IWilsonville, AL i I I I I I IUSA Universityof North Operational Fast circulatingfluid-bed Sub-bituminouscoal Syngas/Fuelgas for power Coal feed rate of 130 kgih or fuel gasTransport Reactor Dakota Energyand transportreactorwith hot Bituminouscoals or chemicals production productionof 37,800 NmA3/dDevelopment Unit Environmental gas filtration Petroleum coke‘(TRDU) Research Center Biomass

I
I
(
I
I
I
Grand Forks, ND I&us Depertnwlt I IIof Enerov I I I
usA U-of North Opsmtil Bubbling fluidized bed Waste pkstics, MOmass, Sylgasmelgas Coal feedrateof43 k@orfueigasCartwnizer/lWi Dakota Ener&yand Not currentlybeing sub-biiminous coals, @UCtiOil of 13,5(M NmW/dGasification Environmental used MtuminowscoalsReactorGrand Fcrks, ND ReseaI@ Center
&us Departmentti EneKw
usA Institute-i Gas Built.andoperated fluidiied bed gasifier Coal, biomass, autofluff, Fuel gas for electricpcxverand 11 ffd of biimassChica@, IL Technology sinceeady 1980s refuse derived fuel synthesisgas for chemicals 4.5 t/d of coal
production
USA Texaco operational Texaco entmii gadii Coal and otherlmv-valu3fuel Synthesis gas for chemicals and Coal feed of 0.9 t/d orResearch fuel gas for fmver production 32 kg/h of oil produciwGasificationUnit 1,fXXl NmA3/dof H2 + CO from coal or
Montebello 2,100 NmK3/dof H2 + CO from oilTechnolow Center
South El Monte, CA
USA Texaco Idle and mdhtmlled Texaco enfrainergasifii Coal and otherlow-valuefuel Synth-”s gas for chemicals and Coal feed of 23 t/d orGasificationPilot fuel gas for power productionUnit
790 kgfhoil producing
37,500 Nm’3/d of H2 + CO from coal orMontebello 543,280NmA31dof H2 + CO ti’omoilTechnologyCenterI%uth El Monte, I I I I I I I
Appendix for Status Report “Gasification”4.Plants in Plannina,under Construction/Proiects
i I I i I I I1 I I I I I
Country/Site lCompany/Owner Istatus ]Teelmology lFeedstocks ITarget Prcducts lCapacity I
United Kingdom, Notthumtnain May 1996:begin Fluidued - Bed Gasitier Dried Sewage Sludge Fuel ~S for power Capeaty 20 MWthNorthumbrian Water Limited conceptionalphase ( Lurgi- Residue - Thermal -
by Lurgi,November Gasikation Process) Process variation:productgas 6 MWe gas turbine1998end for gas motw
GoakEngineeringup Two SfaQ!&3dXKti0rl ZOfla,
to April 1999 sepamte by reducingzoneBuilding/Operating:up to middle2(W ;DemonstrationPlant
Nefhdands Dutch UtilltyN.V. startup planned Fluidii - Bed Gasifier Waste wood Fuelgasfwheat andpower20Q0
85 MW th
Geerbuiinbarg ElectriMtelts-Prodkt. withckculated bed Capadty Offeedstoclc

matachappij DemonstrationPlant ( CFB - Process) 150,000 ffaZukt-Nededand
Italy Jointstockcompa- Planned startup Fluidized- Bed - Gasifii B- wood or agrWture Syngasforpowrand heatina capacity 12 MWe2001
Cascina,near nyowedby USF with circulatedbed resktues ) combined@ unit( Nuovo Pg- 17 MWthPisa,Tuscany Srnogless,Electrici- DemonstraticmPlant ( Lurgi- Process at atrnosph. none)
dade de Portugal, pressure )Energia Verde,LurgiEnergy, IGCC-P~Fumagaf4
Italy At present near to Bioneer- Updraft - Gasitler Refuse from vanuoussources Syngaatofuel aboilerforp3wer Capacity: 1.5 MWthElba bhd w~ (Finland)Tuscany PilotPianf
Italy JointVenture startup: scheduled Entrained - Flow Gasitler Residues from oil refinmy Steam fcxthe refin~ Capatity 260 MWeFakonara,near between AH and late 1999 ( Texa@Process ), with hgh sulphurcontest SyntheQs gas as tkl for an
quenchg.Asea BrownBoveri equipment (5-7%) ABB combinedcycle unit
DemonstrationPlant 2 Gasifiem
Italy ISAB Energy Proj., Sfatiup p4anned late Entrahed - Flow GasMer Residues from oil refinery Steam and hydrogenfor the Capcity 520 MWePrioloGargallo (Joint venture 1999 ( Texa~Prooess ), quenchg. with hgh sulphurocmtent refineryand synthesisgas as a fuelSicily between Erg Peti DemonstrationPlant equipment (5-7% s) for a combinedcycle unit( ABB ) Throughput109 frh feedstock
Ii and M&ion 3 Gasifters Vibreaker residueEnergy ) lGCC-Process
Italy Sarlux P@ecf startup scheduled Entrained - Flow Gasifter Residues from oil refinery Steam and hydrogenfor the Capacity 560 MWesarroch (Jointventure for the first quafler ( Texaco.Process ), quenchg. with hgh sulphurcontentSardhia
refineryand synthesisgas as a fuelbetween SARAs in 2000 equipment (5-7%) foracombined cycJeunit(GE) Throughput131.5 t/h feedstockand ENRON ) 3 Gasiks Vibreaker residue
DexnonstrathnPlant lGCC-ProcessItaly SULCIS Presentfyin desigti Entrained - Flow Gaaii Minimum 50% of localSulcis Synthesii gas as a fuel for a cofn- Capacity450 MWePortovesme (Temporary asso- engineenngphase ( Shell-Process) cd (sulphur6-6 %, ash 17- bined cycle unit ( Ansaldo )
I ISardinia
20%)Ciationof the mrn- withundergoingenvi- (acertainpattat coalalsoim-panies Ansaldo, ronmental impact lGCC-Prmxss pofedcoel)Sonndel,Montan evaluation)ConsuKfng,Techint, commercialPlantDestec ), I
Italy Agip Raffinazione startupscheduled Entrained- Flew Gaaifier Lquid retinery rewues Fwelgasfmpowerand heat ]UnknownPorio Maghera s.p.A. in 1999 ( Texacc-Process ) from differentsources ( integratedin the completerefin~
Canmercial Plant 1 Gasifii process )
IItaly Agip Raffinazione startupscheduled Entrained- Flow Gaaifiir LiquU refinery reskfueand oil- Fuel gas for power and heat lUnknovmTaranto s.p.A. in 2000 (TexaaPmceas ) water-emulsions
1 Gasifier( integated in the completerefinery
My Conswtium fromprocess )
In plannbg,exact Fluicfized- Bed Gaslfier Wocd-SRF,fo=t materlala, Fuelgasfor powrandheat [Installed-14.3 MWe
1
I

Di Cascaras Enel(lT),Lurgi(DEIT data fm startiing-up under atmosph. pressure Biomass (TargetDeveiop-nent of an etTec- Net electric outputil 1.9 MWe),
ENERGY-Farm LeRene(lT),SWP(U unknownm
( Lwgi - Process, 1 Gasifii, tiva IGCC-P recess for this biomass) overall effMenc@3%
SGT(UK),EDp(PO) 900”C,l,4bar) 6.75 f/h throughputlGCC-Process
UnitedKingdom Global Energy Presentfyin design/ Fued - Bed Gasifier Organic waste, munic@l Synthesk gas gash powerP%nedarasx
Outpti351 MWe, Station loadAFT-Projecf in engineeringphase, in the specificationas solkl waste (MSW) and/or and heat ( gas /steam turbine) of 40 MWe (it is planned being
slaggingSOm England cooplafion with undergoingenviran- gas”~r municipalsludgepowder
Fte Erwgy Ltd.and mental imoactevalu- BGL- Slagging p~shown tf-!atthe productioncan
(MSP),combined with coal or bemadeperhaps atverylcwrW etsfieti Davebp- atkm lGCC-Process coke cm.ts in U.K.)ment Centre Ftiein Scotland
Unked Kngdom TexacdMksion In planning:Mgn/ Entrained- Flow GaEWI -I from dfierent depcs”k Fud gas for pwer and heat capacity unknownPembroke,Waies Energy engineering TexamProcess
Commercial Plant 1 GasifiiIGCC - Procass
Untied Kingdom Ftie Power Ltd. startup scheduled FLxed- Sed Gasifiir Coal,waste materials,munici- Fuel gas for power and heat Basis for the new technicalCardenden Ftie, ( a jointventurewith in 2001 ( BritishGas- Lurgi- Process ) pal waste in mixtur@udges ( gaskteam turbine ) devalopmenL75 MWe AFT4GCC-Scouand Global Energy ) Pilot P!.ant/Dernon- and etc. plant in Scotland,target buikfing-up
strationPlant in the lGCC-Processsecond stage )
a kWe plant in Southern England
UnitedKingdom Consortiumfrom In planning,exacf Fluidized- Bed Gasifier Wood-SRF Fuel gas for pwer and heat Installed capacity 10 MWeAir Valley Yorkshire(UK),Gea data far starling-up under atmospheric pressure (GoaI:Development of an effective Net electric output8.O MWe
(ARBRE-Project) (DE), CGC(FL),TPS unkmwn ( TPS - Process), 1 Gasifier, lGCC-Process for bomass )(Sw) 900 “C, 1,6 bar 6.75 f/h is plannedthroughputOwnerARBRE 1 Gasifiir.85Cr-800°C 1 Fihar I
lEnergy LimitedChina lBijingCoking 11[1pldll[ll[!gBs4ina I ICommercial
IGCC - process1’- “---’-- in 1998 Entrained- Flow Gasifier Coal from owndepc&s Syngas for productionof methanol Unknown
Plant (TexamProcess ).,~, , ! --,,.
China -. ,– ”--- --- l—.--—--- . .. -------- I ---- ..-.,, .,.. ,, ““-wHunan
,“,.1~- ,M pwuu
IcomrnercialIF’’--’ ‘‘‘------ ‘------ ‘ ,I I
., IIDono llna
IIln okrnnino in 1996 IEntrained - Flnw Ga4fier Ifkal frnm mm ,-inmn.dtc IQ,m... f,-w -,+, .% of ~~~ Unknown
rm u 1( Iex.dl-u-rlcwess ) I I11Gasifiar
I I I I I
china Hubei Company In planning in 1996 Entrahed - Flow Gasifier Ccla.Ifrom owndepositsHubei
Unknown UnkncwnCommercial Plant ( Texa~Process )
1 Gasifiirchina JiIin Chemical in planning in 1999 Entrshed - Fknv Gasifkx Vibreaker residue Syngas for productionof ammoniaJilin
UnknownIndustrkdCorp. commercial P!arlt ( Texa~Process )
1 Gasifttrchina Jin Ling In planning in 1996 Entrained- Flow Gasifiir Coal from owndeposits Fuelgasfor power andheatJiangsu Commar&l Piant
Unknown( Texac@Process )1 Gae-fi
I I-------- I I I
china lNanjing Chemical I In planningin 1999 lEntrained - Fknv Gastfiir lEureka pitch pyngas forproduc60n Ofarnmonia lUnkrvmvn I
,’
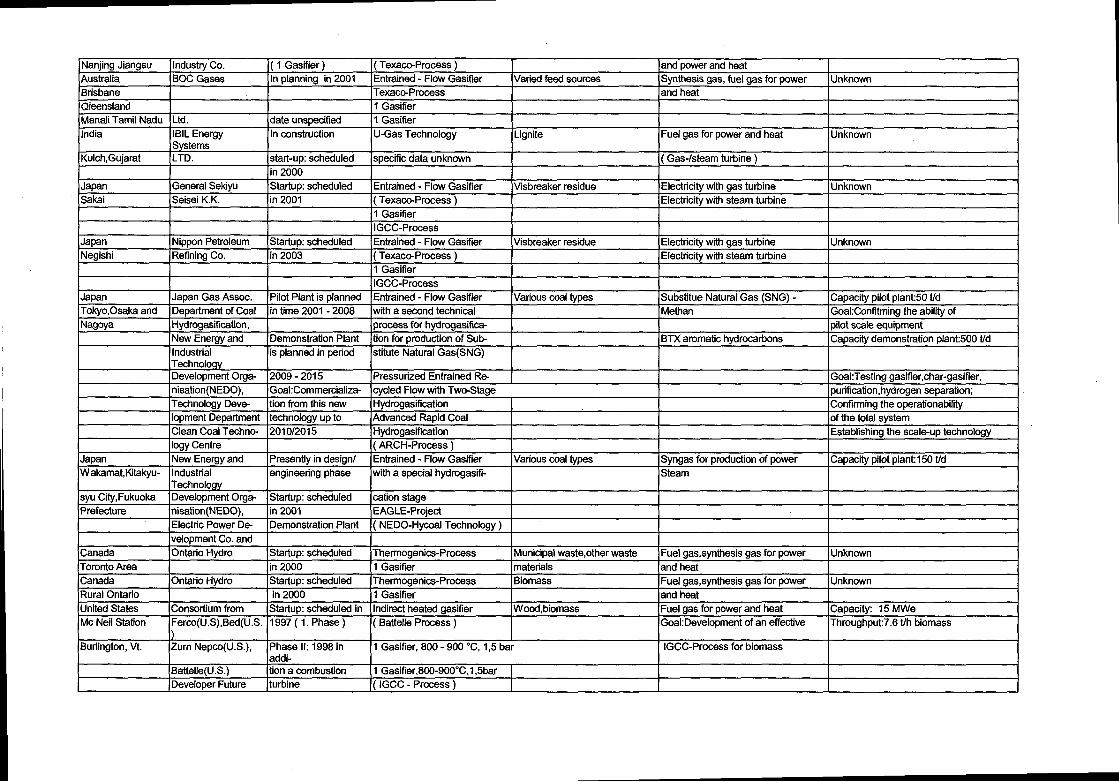
Nanjing Jiangsu IndustryCo. ( 1 Gasifier ) ( TexaceProcess ) and power and heat
Australia BOC Gases In ptanning in 2001 Entrained - Flow Gasifier Varied feed sources Synthesis gas, fuel gas for power
Brisbane
UnknownTexac@Process and heat
r2ieensland 1 Gasifier
Manali Tamil Nadu Ltd. date unspecified 1 Gasifier
India IBIL Energy In construction U-Gas Technology Lignite Fuel gas for power and heat UnknownSystems
Kulch,Gujarat LTD. start-up:scheduled specificdata unknown ( Gas-/steam turbine)
in 2000
Japan General Sekiyu Startup scheduled Entrained - Flow Gasifier Visbreaker residue Electricitywith gas turbheSakai Seisei K.K.
Unknownin 2001 [ Texaco-Process) Electricitywith steam turbine
1 GasifierlGCC-Process
Japan Nippon Petroleum Startup scheduled Entrained - Flow Gasifier Visbreaker residue Electricitywith gas turlineNegishi RefiningCo.
Unknown
in 2003 ( Texaco-Process) Electricitywith steam turbine
1 Gasitier
I I 1lGCC-Process I IJa~an lJaoan Gas Assoc. Ipilot Plant is Dlanned ]Entrained - Flow Gasifier lVarious coal tvoes lSubstitue Natural Gas K3NG) - lCaoacitv Dilot~lant50 t/d
Tokyo,Osaka and Department of Coal in time 2001-2008 with a second technical Methan Goal:Confitmingthe abilityof
Nagoya Hydrogasification, process for hydrogasifi~ pilotscale equipment
New Enercrvand DemonstrationPlant fion for moductionof Sub- BTX aromatic hydrocarbons Canacitv demonstrationolant:500 t/d
I Industrial Iis planned in period Istitute Natural Gas(SNG) I 1 I I
nisafion(NEDO)~ Goal:Commercialize cycled Flow with Twc-Stage“-. .
purifkation,hydrogenseparation;TechnologyDeve- tion from this new Hydrogasification Confirmingthe operationabilityIopment Department technologyup to Advanced Rapid Coal of the total system
Clean Coal Techno- 201 0/201 5 Hydrogasification Establishingthe scale-up technologylogy Centre ( ARCH-Process)
Japan New Energy and Presently in design/ Entrained - Flow Gasifier Various coal types Syngas for productionof power Capacity pilotplant 150 t/d
W akamat,Kitakyu- Industrial engineering phase with a special hydrogasifi- SteamTechnology
syu City,Fukuoka Development Orga- Startup: scheduled cation stagePrefecture nisation(NEDO), in 2001 EAGLE-Project
Electric Power Ds- DemonstrationPlant ( NEDO-Hycoal Technology )Ivelopment Co. and IInmtOtimUl,drn !C+=)+)im. eehzAi ,1.ari !Thamnn,anifie.Drn,-r.,e e \ M, ,t+,-ir.a~ Wastqother waste IFuel gas,synthesisgas for power IUnknown IlCanada ,=00,=00”, ,,”, ” “w, .“~. e“, ,“WW,UU I , , ,“, ,r,Uy,.,,,--, ,“--e ,.,”, ,,”,ya,
TorontoArea I lin 2000 11Gasifier materialsP.n.rka Ionfarifi i-b+,-, IQtat+, ,n. cr-h.a,-1, dad lTh.amfitwanifi. -Dw.ea.e I Ri,?rna.e
and heat
“u, ,Qww -, ,,W, ,“ , ,,”, ” “.”, . ..y. ““! !....”!”” , , ,U, , , ,“~w, ,,W.-, , “wee L.,,”, , ,“”” Fuel gas,synthesisgas for power Unknown
Rural Ontario in 2000 1 Gasifier and haat
United States Consortiumfrom Startup scheduled in Indirectheated gasifier Wood, biomass Fuel gas for power and heat Capacity 15 fvfWe
Mc Neil Station Ferw(U.S),Bed(U.S. 1997 (1. Phase ) ( Battelle Process ) GoatDevelopment of an effective Throughput7.6 t/h biomass
) IBurlington,Vt. Zurn Nepco(U.S.), Phase H: 1996 in 1 Gasifier, 800-900 “C, 1,5 bar lGCC-Process for biomass
addi-Battelle(U.S.) tion a combustion ‘1Gasifier,800-900°C,l ,5bar 1Developer Future turbine ( IGCC - Process)

Energy ResourcesCompany,Atlanta,GA
United States MinnesotaValley Presently in planning Fluidized- Bed Gasifler Biomass from variuos sources Fuel gas for power and heat Planning data: exactly unknown
Minnesota-Agri- Alfalfa Producer, Target “Closed loop” ( under pressure or without (In a firts stage over boiler and in 75 MWe - combined cycle plant
Power-Project - Westinghouse Elec- biomass power in pressure ) a second tage with gas turbine)
MnVAP) tric Corp.,Stone& Minnesota at the IGT - ProcessW ebster,CarbonzJ end 2002 IGCC - Process
Kvaerner,lGT,Cityof Granite Falls and
Universityof Minn=
IsotaFrance lTotal France Startup: scheduled Entrained - Fiow Gasifier Fuel oil Syngas for productionof hydrogen UnknownGonfrevilleIorcher in 2003 Texaco-Process Fuel gas for power and heat
1 GasifierGermany RheinbraunAG Startup:planned Fluidized- Bed Gasifer Lignite Fuel gas for power and heat Unknown
Hurth-Berrenrath in 2000 ( HTW-Process )1 Gasifier
Germany Noell Energy-and Startup: planned in Noel-Conversion-Process Municipalwaste,dewatered Fuel gas for power and heat UnknownNortheim Disposal GmbH 1999/2000 First stagePyrolysis - sewage sludge
and other companies Second stageEntrained - FlowGasifier
Spain Repsol Petroleo In planning Uhde - Gasification Process PetCoke Fuel gas for power and heat UnknownSA
Ciudad Real I Irfate Imlmnwn I1 G.asifier I I I I
Brazil lElectrobras.BR Iln Dlannina.desian IFluidized- Bed Gasifier lAariculturalmaterials.Euk~ IFuel aas for oower and heat IDetailed data unknown IStae Bahia Chesf completed under atmospheric.pressure Iyptus
Shell Brazil DemonstrationPlant ( TPS - Technology) Net electr.output:32 MWein future 1 Gasifier,850-900Z,l,5 bar Efficiency 41 %,overall
IGCC - Process 14.6 tlhDenmark ConsortiumElsam In planning,design Fluidized- Bed Gasifier under Wwd,-SRF,forest materials Fuel gas for power and heat Installed capacity 7.9 MWe
BIOCYCLE-Project (DK),Elkraft(DK), completed pressure (TargetDevelopment of an effec- Net electric output 7.2MWe
Tractebel(BE) and ( CFB - Process) tive lGCC-Process in the next Net heat output 6.75 MWthyears)
Veag(DE) lGCC-Process Overall efficincy 77.3%n m.,L. .--4 -.-..,.
IQ.L UI I leeusLuGK I
, -- .... -. -,. . .--” -- , I I----- , , .-. , .-.-..,. .= ~. “--”--- 1
I4 r-beifia.I , “C4e,,,”, I I I
Netherlands Royal Schelde, Startup: planned lFluidized - Bed Gasifier IPlanned feedstocke:parkwood, ]Fuel gas for heat and power lPlanned capaci~ 30 MWe
(locationunknown NBM and TPS in 1999 !under atmospheric rxessure Idemolitionwwd !Gas-/steam turbine !
.. ... . . .. . . , -. — ------- , 1 1 1
lTmhnAwm, c, ,ntdiar.TP.Q
,, ,(Jointventure) Demonsfrafionpl~nf I( ~FR - F’rnr=s ~ I I
, ““, ,,,v,”~, ““~~,,”, , , “
Norway Kvamer,otherwm- Status unknown Fixed - Bed Gasifier Various biomass and diff~ Fuel gas for heat and in a sewnd Informationto capacities,fhroughput,
locationunknown panics are not ( Couter -Current Process rent waste products stage tmwer over gas engine output and specific data includingfirst
known with liquidslag discharge ) operationexperiences unknown

Austria ConsortiumVokrnd In construction Indirect - Air - Cycle Gasifier Forest materials,woodwaste Fuel gas fcr heat and power Installed capacity 2.4MWe
Graz (DK),H+F Innotech Date for mmmissi~ (Up -Draft - Moving Bed
(TINA-Project)Gas-/steam turbine Net electric output2.O MWe
(DE), Mehldau(DE), ning unknown) Gasifier under atmospher. Net heat output4.7 MWthABB Energy(AU), pressure )
Austrian Energy,Overall efficiency66.6%
Technology supplier Volund Throughput 1.6 ffh
Steweg(AU) IGCC - Process (planned data )
Germany Company Bi@Heiz- In planning FMed - Bed Gasifier Various biomass and other Fuel gas for heat and in a second Planned capacities: up to 500 kWeBerlin stoffwerk Berlin Data for commissi~ ( Down - Draft Process) waste substances(for in- stage for power over gas engines
GmbH ning unknown) Process is to see as a com- stance wood,paper,straw,petitorto Wamsler-enginee- peat,all briquettes)
ringGermany DMT In design phase, Fluidized - Bed Gasifier Coal and biomass in different Fuel gas making for variuos app- Specified data are not known
Research Project further data unknown ( Allothermal Process for blendings Iicationsin future:hydrogen,power, presently
biomass gasification)
Germany Elbewerk Ro131ausynthesisgas
Startup canstructiin FMed - Bed Gasifier Biomass from different sources Fuel gas for heat and power Planned capoacity4.5 MWe
Elbewerk RofUau, Wissenschaftlich- in 1996 ( Down - Draft Process) ( special quality requirements
near Leipzig technischesZen- Goal: Demonstration 7 gasification unitswith up to for feedstocks concerningtrum fLirMotoren- Plant for power with 700 kWe for each gasitier, shape and size for down-
und Maschinenfor- biomass as feedstock (in summary planned 7 Gasi- drafl gasifier )schuna GmbH (Proiect has bean not fier)
~inis~ed)
Germany Easymcd Energi* In planningand deve- New Technologythree reac- Feedstockwaste wood, Fuel gas for heat and in a second Planned capacity: 5 MWelocationunknown technik GmbH Iopmenta new reac- tors in serieUnderscrew but also other biomass ma- stage for power with gas engine ( Easymod believe that unitsfrom on
tor concept, begin- Gasifier,Thermal Cracker, terials 1 MWe can operate successfully)
nina has been made Reduction Reactorin 1992 (gasificationwith air/steam)
DemonstrationPlantGermany EHAG In construction CarbwV- Process Wocd and waste wood Fuel gas for heat and power Planned capacity5 MWthElsterwerda Comprimo BAG and in 1999 ( Low-Temperature Gasifici+ over gas engines in a second stage
UET Freibera and DemonstrationPlant tion combined with a En- 1 IFEE Brandenburg trained-Flow Gasification)
France Owner unknown It shall be in planning FMad - Bed Gasifier Biomass,agriculturalwastes Fuel gas for heat and in future Data to capacity unknown
locationunknown and construdlon ( Down - Draft Process) also for power
several pilotplants Technology supplier Chevel
CHP - Process
Switzerland Ensofor In planning Combined - Gasification - Biomass from different Fuel gas for heat and power Planned capacities: up to 6 MWe
locationunknown Time table unknown Pyrolysis Process sources Specifreddata unknown
Plan consisitsfrom two
stages:pyrolysisreactorand gasificationreactor(Tar cracking for purifiedgas )
Switzerland Dasag Energy Pilot Plant/Demon- So-tailed” Open - Core”- Siomass from different Fuel gas for heat Capacity of 300 kWthlocationunknown Engineering Ltd. strationPlant Gasifier with very simple wn- sources Testing of the various gas cleaning Dasag wants to commercialize
( Status today not struction Waste productsfrom agncul- installationsfor clean fuel gas the system with standard units
known ) ture of 300,600 and 900 kWth

Appendix B
Memberships and Meetings of Committee B
Membershi~
F. Lau (Chairman)1.R. Reimert (Vice-Chairman)L. Sjunnesson (Secretary)M. A. FeghouliH. BrotzenbergerF. StrakaJ. Saint-JustF. Joulani1.M. DalmazzoneY. AsaokaK. SimE. PolmanQ. JamalS. RychlickiJ. Valentim da TerezaG. Didevichl.KarpD. Petrovic
Meetinas
Kracow, PolandMalmo, SwedenPraha, Czech RepublicFlorence, ItalyLeipzig, Germany
USAGermanySweedenAlgeriaAustriaCzech RepublicFranceIranItalyJapanKoreaNetherlandsPakistanPolandPortugalRussiaUkraineYugoslavia
October ’97May ’98October ’98April ’99October ’99


![3} tj- 7] - OSTI.GOV](https://static.fdokumen.com/doc/165x107/631c4c86b8a98572c10cd705/3-tj-7-ostigov.jpg)