Final COL812 project report - ResearchSpace
82
Safety in Mines Research Advisory Committee Rating system for coal mine roofs Draft Final Report I Canbulat & T Dlokweni Research Agency : CSIR Miningtek Project No : COL 812 Date : September 2002 Report No : 2002-0528
-
Upload
khangminh22 -
Category
Documents
-
view
0 -
download
0
Transcript of Final COL812 project report - ResearchSpace
Safety in Mines Research Advisory Committee
Rating system for coal mine roofs
Draft Final Report
I Canbulat & T Dlokweni
Research Agency : CSIR MiningtekProject No : COL 812Date : September 2002Report No : 2002-0528

2
Executive summary
It is standard practice in the majority of rock engineering applications to use a rock mass
classification method to evaluate the condition of rock, i.e. to quantify, in an objective manner,
the characteristics of good or bad roof. These rockmass classification methods are routinely
used in civil engineering and in tunnel excavations.
Although many rock engineering departments in South Africa use locally developed
classification systems, these are sometimes descriptive in nature and undocumented and in
most cases restricted in use to the mine on which they were developed. There is currently no
standardization that will allow a locally developed method to be applied by a person employed
by another company. The local systems cannot be compared with one another, nor can one set
of results be converted to an equivalent rating in another system.
This project attempted to overcome the problem by evaluating and documenting all the existing
systems that are used in South Africa and others that have been developed in other countries,
and proposing the way forward for the development of a system that could be used universally
on South African collieries (Phase2). Alternatively, the information presented in this report could
be used to enhance local systems.
The review of all existing systems highlighted that in the mining industry the Q and RMR
classifications form the basis of many empirical design methods as well as the basis of failure
criteria used in many numerical modelling programs. Application of these systems in South
African mines, specifically in coal, have been limited due to the lack of acceptance of the
techniques from the industry, which can be attributed partially to the lack of personnel trained in
the use of such systems and/or the generally good coal roof conditions in South Africa
compared to the rest of the world. Where these systems have been used it has been mainly for
portal design or feasibility studies, and there has been little documentation on their use in South
Africa.
It is considered that the CMRR could overcome most problems associated with the application
of rock mass classification systems in coal mining. However, due to the fact that the system is
based on case histories from the United States, certain modifications need to be made to the
system to cater for the different conditions in South African collieries. From initial research
carried out so far in using the CMRR in the context of South African coal mining, it appears that
appropriate modifications can be made.

3
The shortcomings of CMRR, which were identified during the application of CMRR are that:
- Exposure into the roof is required (underground CMRR only)
- Only the bolted height is rated. In South Africa, 2.0 m into the roof is the height that is
usually rated.
- Although sets of joints have been considered in CMRR, single joints can have an influence
and should thus also be included.
- Joint orientation is not taken into account (underground CMRR only).
- Stress adjustment is required in the rating system to account for the influence of high
horizontal stress (underground CMRR only)
- No adjustment is made for the effects of blasting (underground CMRR only)
- The position of soft or hard layers into the roof is not taken into account (both underground
and borehole core CMRR)
- Skilled personnel to carry out ratings are required (both underground and borehole core
CMRR)
The investigation into the rating systems being used in South Africa highlighted that roof rating
systems are applied mainly for planning purposes, and not for determining any change in
conditions underground. However, rating systems have also been developed in South Africa by
Ingwe Coal Rock Engineering (a division of BHP Billiton Energy Coal), in which support systems
are changed based on the ratings obtained for underground conditions.
Impact Splitting Tests, Section Physical Risk Rating and the Section Performance Rating
systems developed in South Africa are described as being most effective and appropriate for
South African conditions. They can distinguish different roof conditions necessary for initial
planning and support design. They can also be used for identifying changing conditions while
mining and determining the best response to the different conditions. These systems are also
found to be the best systems to address the risk (Variable Step Model) used by sectors of the
coal mining industry.
It is finally concluded therefore that adoption of the CMRR system for South African conditions
is neither appropriate nor necessary.

4
Acknowledgements
The authors gratefully acknowledge co-operation given by many mines and funding from
SIMRAC. Dr. C. Mark and Mr. G. Molinda are also thanked for their input in this project.
Ingwe, Anglo Coal, Sasol Coal Rock Engineering Departments and Dr. BJ Madden are also
thanked for their valuable contributions.

5
Table of Contents
Executive summary ........................................................................................... 2
Acknowledgements ........................................................................................... 4
Table of Contents .............................................................................................. 5
List of Figures ................................................................................................... 7
List of Tables ..................................................................................................... 8
List of contracted Enabling Outputs .................................................................10
1.0 Introduction ........................................................................................11
2.0 Literature review .................................................................................13
3.0 In depth study of CMRR ......................................................................14
3.1.1 In depth study of Coal Mine Roof Rating (CMRR) ........................................18
4.0 Rating systems being used in South African collieries .........................214.1 Rating systems developed for planning purposes .........................................214.2 Proactive rating systems developed for changing conditions ....................29
5.0 Individual Colliery Systems .................................................................325.1 Arnot Colliery.............................................................................................................325.2 Bank Colliery .............................................................................................................37
5.3 Twistdraai Colliery....................................................................................................415.4 Kriel Colliery ..............................................................................................................44
5.5 New Denmark Colliery.............................................................................................465.6 Syferfontein Colliery................................................................................................475.7 Results from Greenside and Goedehoop Collieries .......................................49
5.8 Application of pro active systems .......................................................................495.9 Windows Based Program ......................................................................................50
6.0 Conclusions and Recommendations ...................................................51
Appendix A: Literature Review .........................................................................52
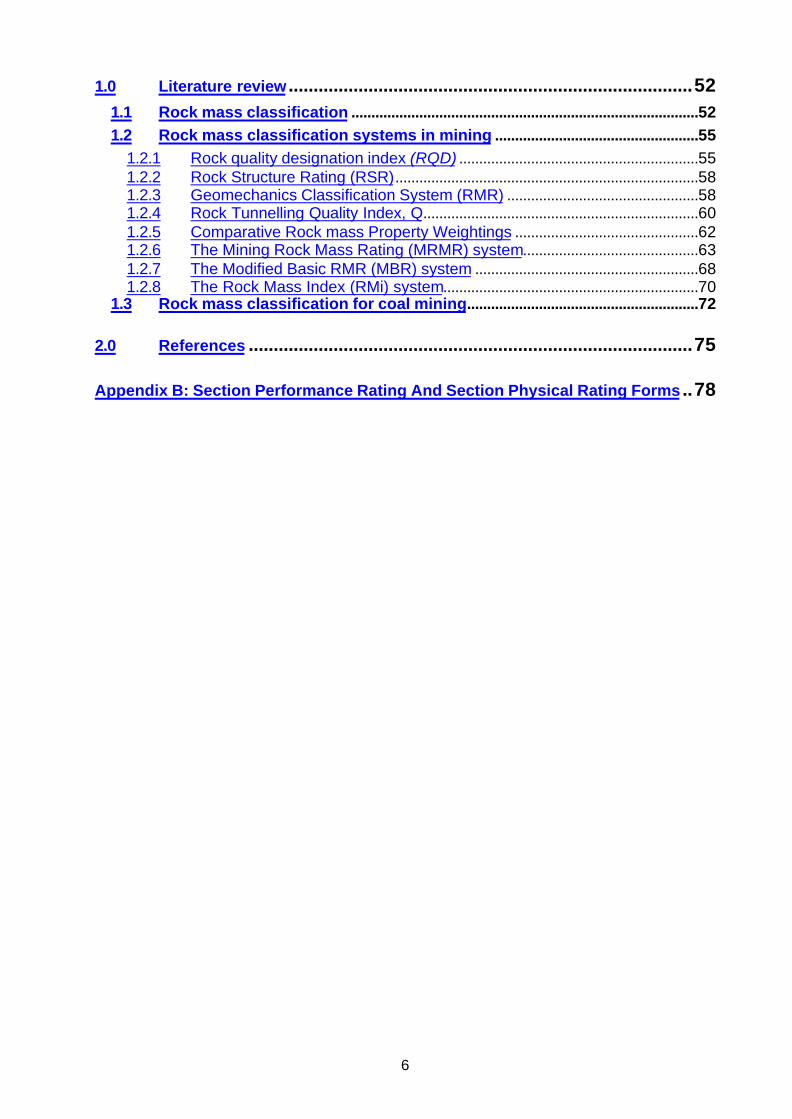
6
1.0 Literature review .................................................................................521.1 Rock mass classification .......................................................................................52
1.2 Rock mass classification systems in mining ...................................................55
1.2.1 Rock quality designation index (RQD) ............................................................551.2.2 Rock Structure Rating (RSR)............................................................................581.2.3 Geomechanics Classification System (RMR) ................................................581.2.4 Rock Tunnelling Quality Index, Q.....................................................................601.2.5 Comparative Rock mass Property Weightings ..............................................621.2.6 The Mining Rock Mass Rating (MRMR) system............................................631.2.7 The Modified Basic RMR (MBR) system ........................................................681.2.8 The Rock Mass Index (RMi) system................................................................70
1.3 Rock mass classification for coal mining..........................................................72
2.0 References .........................................................................................75
Appendix B: Section Performance Rating And Section Physical Rating Forms ..78
7
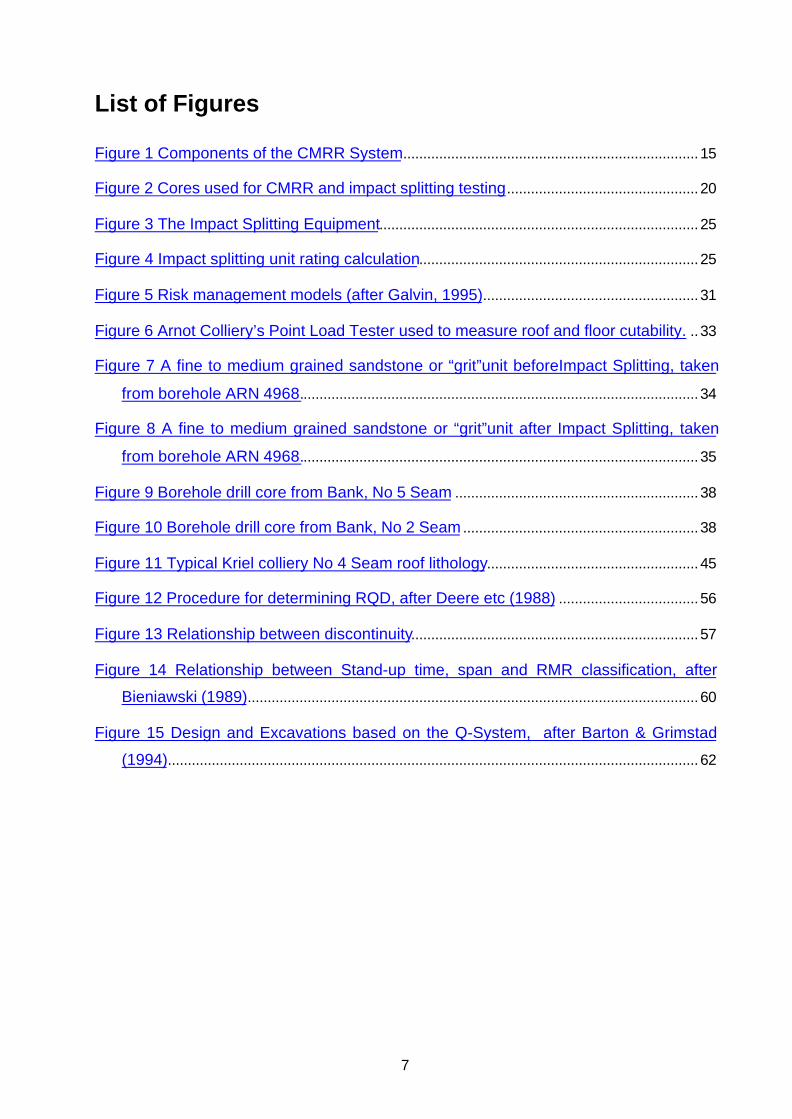
List of Figures
Figure 1 Components of the CMRR System..........................................................................15
Figure 2 Cores used for CMRR and impact splitting testing................................................20
Figure 3 The Impact Splitting Equipment................................................................................25
Figure 4 Impact splitting unit rating calculation......................................................................25
Figure 5 Risk management models (after Galvin, 1995)......................................................31
Figure 6 Arnot Colliery’s Point Load Tester used to measure roof and floor cutability. ..33
Figure 7 A fine to medium grained sandstone or “grit”unit beforeImpact Splitting, taken
from borehole ARN 4968....................................................................................................34
Figure 8 A fine to medium grained sandstone or “grit”unit after Impact Splitting, taken
from borehole ARN 4968....................................................................................................35
Figure 9 Borehole drill core from Bank, No 5 Seam .............................................................38
Figure 10 Borehole drill core from Bank, No 2 Seam ...........................................................38
Figure 11 Typical Kriel colliery No 4 Seam roof lithology.....................................................45
Figure 12 Procedure for determining RQD, after Deere etc (1988) ...................................56
Figure 13 Relationship between discontinuity........................................................................57
Figure 14 Relationship between Stand-up time, span and RMR classification, after
Bieniawski (1989).................................................................................................................60
Figure 15 Design and Excavations based on the Q-System, after Barton & Grimstad
(1994).....................................................................................................................................62
8
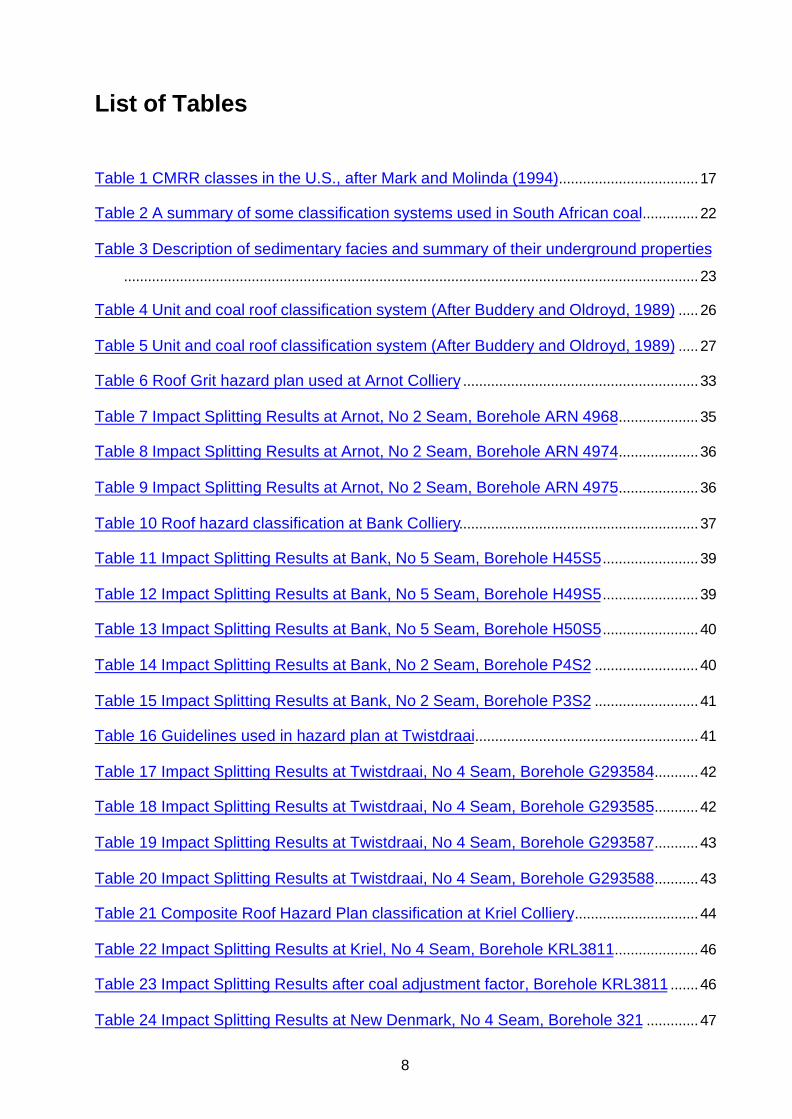
List of Tables
Table 1 CMRR classes in the U.S., after Mark and Molinda (1994)...................................17
Table 2 A summary of some classification systems used in South African coal..............22
Table 3 Description of sedimentary facies and summary of their underground properties
................................................................................................................................................23
Table 4 Unit and coal roof classification system (After Buddery and Oldroyd, 1989) .....26
Table 5 Unit and coal roof classification system (After Buddery and Oldroyd, 1989) .....27
Table 6 Roof Grit hazard plan used at Arnot Colliery ...........................................................33
Table 7 Impact Splitting Results at Arnot, No 2 Seam, Borehole ARN 4968....................35
Table 8 Impact Splitting Results at Arnot, No 2 Seam, Borehole ARN 4974....................36
Table 9 Impact Splitting Results at Arnot, No 2 Seam, Borehole ARN 4975....................36
Table 10 Roof hazard classification at Bank Colliery............................................................37
Table 11 Impact Splitting Results at Bank, No 5 Seam, Borehole H45S5........................39
Table 12 Impact Splitting Results at Bank, No 5 Seam, Borehole H49S5........................39
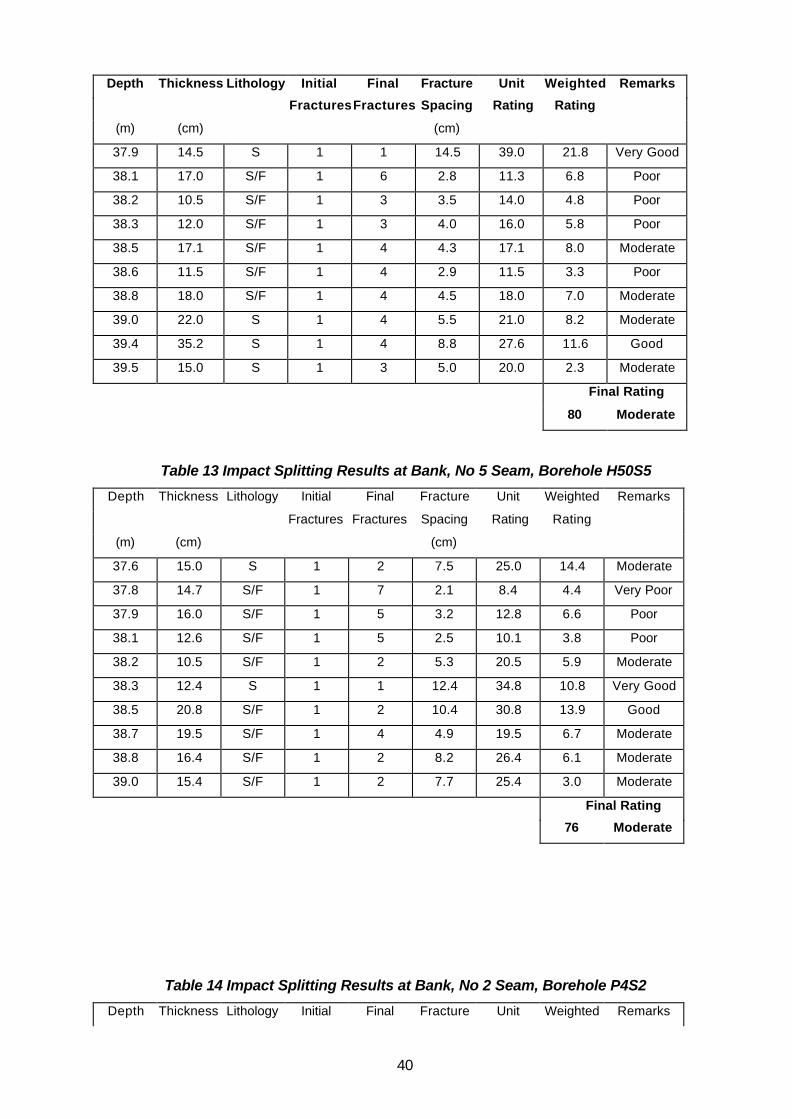
Table 13 Impact Splitting Results at Bank, No 5 Seam, Borehole H50S5........................40
Table 14 Impact Splitting Results at Bank, No 2 Seam, Borehole P4S2 ..........................40
Table 15 Impact Splitting Results at Bank, No 2 Seam, Borehole P3S2 ..........................41
Table 16 Guidelines used in hazard plan at Twistdraai........................................................41
Table 17 Impact Splitting Results at Twistdraai, No 4 Seam, Borehole G293584...........42
Table 18 Impact Splitting Results at Twistdraai, No 4 Seam, Borehole G293585...........42
Table 19 Impact Splitting Results at Twistdraai, No 4 Seam, Borehole G293587...........43
Table 20 Impact Splitting Results at Twistdraai, No 4 Seam, Borehole G293588...........43
Table 21 Composite Roof Hazard Plan classification at Kriel Colliery...............................44
Table 22 Impact Splitting Results at Kriel, No 4 Seam, Borehole KRL3811.....................46
Table 23 Impact Splitting Results after coal adjustment factor, Borehole KRL3811 .......46
Table 24 Impact Splitting Results at New Denmark, No 4 Seam, Borehole 321 .............47

9
Table 25 Guidelines used in hazard plan at Syferfontein colliery.......................................48
Table 26 Impact Splitting Results at Syferfontein, No 4 Seam, Borehole V118043........48
Table 27 Impact Splitting Results, Borehole V118043 after coal adjustment factor........48
Table 28 Some of the classification systems and their main applications.........................54
Table 29 RMR Ratings of Bieniawski over the years............................................................59
Table 30 Influence of Basic Rock Mass Properties on Classification, after Milne (1988)
................................................................................................................................................62
Table 31 Correlation between RMR and Q, after Choquet and Hadjigeorgiou (1993)....63

10
List of contracted Enabling Outputs
NO. ENABLING OUTPUT
Phase1
1.1 Literature survey on published coal mine roof rating systems
1.2 In depth study of CMRR
1.3 Collection and study of SA rating systems
1.4 Parallel application of existing systems underground
1.5 Comparison of results of existing systems
1.6 Report
Phase2
2.1 Combine best elements into new system
2.2 Create Windows program, produce final report
2.3 Launch at workshop
11
1.0 Introduction
South Africa is the third largest coal exporting country after the United States of America and
Australia. According to the Department of Minerals and Energy Affairs (DME), 2000, 223 Million
tonnes of coal were extracted from South African mines in 1999. During the course of the daily
underground operations, workers are regularly exposed to major safety hazards. Roof failures in
underground South African coal mines are a major safety hazard as well as a substantial
operational burden. From the South African Mines Reportable Accidents Statistics System
(SAMRASS), 2000, a total of 231 accidents were reported from coal mines in South Africa. The
number of underground accidents was 147, with 53 resulting from falls of ground. While these
figures have been steadily decreasing over the last 5 years, the rates are still about 3 times
greater than in the United States (Mark 1999).
Producing a mine plan with safe, stable roadways can be a complex exercise. The structural
competency of the mine roof is directly related to geological conditions that can vary from mine
to mine and also within the same mine. In a continuing effort to reduce the safety hazards in the
South African coal mining industry, the Safety in Mines Research Advisory Committee
(SIMRAC) has been funding research into determining the major causes of roof falls in South
African collieries and providing solutions. A part of this research is the investigation of roof rating
systems in coal mines using rock mass classification systems. These systems aim to guide the
mine rock engineer in providing quick and easy field techniques that quantify geological
characteristics of the roof in a standardized manner for engineering analysis.
Rock mass classification systems constitute an integral part of empirical mine design. The use
of such systems can be either implicit or explicit. They are traditionally used to group areas of
similar geotechnical characteristics, to provide guidelines of stability performance and to select
appropriate support. In more recent years, classification systems have often been used in
tandem with analytical and numerical tools. There has been an increase of work linking
classification indexes to material properties such as modulus of elasticity, m and s for the Hoek
& Brown failure criterion, etc. These values are then used as input parameters for the numerical
models. Consequently the importance of rock mass characterization has increased over time.
The primary objective of all classification systems is to quantify the intrinsic properties of the
rock mass based on past experience. The second objective is to investigate how external
loading conditions acting on a rock mass influence its behaviour. An understanding of these
processes can lead to the successful prediction of rock mass behaviour for different conditions.

12
The earliest reference to the use of rock mass classification for the design of tunnel support is
by Terzaghi (1946) in which the rock loads, carried by steel sets, are estimated on the basis of a
descriptive classification. Since Terzaghi (1946), many rock mass classification systems have
been proposed, the most important of which are as follows:
− Lauffer (1958)
− Deere (1970): Rock Quality Designation, RQD
− Wickham et al (1972): Rock structure Rating (RSR – Concept)
− Bieniawski (1973): Geomechanics Classification, Rock mass Rating
− Barton et al. (1974): Q- System
Most of the multi-parameter classification schemes by Wickham et al (1972), Bieniawski (1973,
1989) and Barton et al (1974) were developed from civil engineering case histories in which
most of the components of the engineering geological character of the rock mass were
included. Studies of these systems have shown that their main application is for hard and soft
jointed rock masses. Several classification systems have been developed and modified for
underground coal mining. Most rock engineers locally and abroad have been using locally
developed classification systems that are in most cases not well documented and are restricted
to the developer of such systems or the mine on which the system was developed. Furthermore,
these systems cannot be compared with one another or results converted to an equivalent
rating in another mine. In this project, the rock mass classification systems in mining are
reviewed with an emphasis on the RMR by Bieniawski, Q-System by Barton, RQD by Deere
and CMRR system that was developed in the United States by Mark and Molinda, (NIOSH), and
Impact Splitting Test developed by Oldroyd and Buddery. This forms a part of the current
COL812 project that aims at developing a custom made system for South African Coal Mines.
13
2.0 Literature review
An extensive literature review regarding rock mass classification systems was conducted and is
summarised in Appendix A. It has been found that in mining engineering design, the Q and
RMR classifications form the basis of many empirical design methods as well as the basis of
failure criteria used in many numerical modelling programs. However, application of these
systems in South African mining industry, specifically in coal, has been limited due to a lack of
acceptance from the industry. Where these systems have been used it has been mainly for
portal design or feasibility studies and in many cases, are not documented.
It was considered that the CMRR could overcome most problems associated with the
application of rock mass classification systems in coal mining. However, due to the fact that the
system is based on case histories from the United States, certain modifications would have to
be made to the system to cater for the different conditions in South African collieries.

14
3.0 In depth study of Coal Mine Roof Rating (CMRR)
The United States Bureau of Mines (USMB) have developed the Coal Mine Roof Rating
(CMRR) classification system to quantify descriptive geological information for use in coal mine
design and roof support selection (Molinda et al, 1994). This system results from years of
geologic ground control research in longwall mines in the United States. The CMRR weighs the
geotechnical factors that determine roof competence, and combines them into a single rating on
a scale from 0-100. The characteristics of the CMRR are that it:
- Focuses on the characteristics of bedding planes, slickensides, and other discontinuities
that weaken the fabric of sedimentary coal measure rock.
- Applies to all U.S. coalfields, and allows a meaningful comparison of structural competence
even where lithologies are quite different.
- Concentrates on the bolted interval and its ability to form a stable mine structure.
- Provides a methodology for geotechnical data collection.
The USBM is currently engaged in research to further develop the CMRR to be applicable to
other coal mines around the world. The principle behind the original CMRR system (1994) is to
evaluate the geotechnical characteristics of the mine roof instead of the geological description.
CMRR emphasizes structurally weak or strong units instead of geologic divisions. The structure
of the system is similar to Bieniawski’s RMR system in that the important roof parameters are
identified, their influence on roof strength is quantified and the final rating is calculated from the
combination of all the parameters. Figure 1 shows the parameters that compose the CMRR
system. The system is also designed such that the final rating/unsupported span/stand-up time
relationship is comparable to that of the RMR. However, the CMRR is intended to be a universal
system for coal mining and to initially exclude time-consuming and expensive laboratory
analyses. Later, Molinda and Mark (1999) documented a revised approach that takes into
consideration the Point Load Test.
An important attribute of the CMRR is its ability to rate the strength of bedded rocks in general,
and of shales and other clay-rich rocks in particular. Layered rocks are generally much weaker
when loaded parallel to bedding, and the CMRR addresses both the degree of layering and the
strength of the bedding planes. Recent research has shown that most coal mine roofs are
subjected to high horizontal stresses. The CMRR has been modified by Molinda and Mark
(1999) to retain its ability to identify those rocks that are most susceptible to horizontal stresses.

15
Figure 1 Components of the CMRR System
Data gathering for the system relies only on observation and simple contact tests using a ball
peen hammer, a 9 cm mason chisel, a tape measure and sample bags. All the data is recorded
in a designed data sheet that is used to calculate the final rating. A Lotus 1-2-3 spreadsheet
program is available from the U.S. Bureau of Mines for use with the CMRR rock mass
classification. The information that is recorded on the data sheets is entered into the
spreadsheet program, creating a permanent computer record of the field notes. The calculation
is based on rating the exposed roof that is divided into structural units. Each unit is rated
individually mainly on an evaluation of the discontinuities and their characteristics. Next, the
CMRR is determined for the mine roof as a whole. The ratings of the units within the bolted
interval are first combined into a thickness-weighted average. Then a series of roof adjustment
factors are applied with the most important being that of the strong bed. It has been found that
the structural competence of a bolted mine roof is largely determined by its competent member.
All the parameters are combined to calculate the final CMRR.
The following is a summary of the factors that contribute to the final unit rating value:
a) Compressive strength of intact rock: The ball peen hammer test is used to place rock
into five classes, depending on the nature of the indentation.
b) Cohesion of discontinuities: The strength of the bond between the two faces of a
discontinuity is estimated by observation of roof behaviour, assisted by the chisel test.
c) Roughness of discontinuity: The surface of the discontinuity is classified as “rough”,
“wavy”, or “planar” by observation.
d) Intensity of discontinuities: The average observed distance between discontinuities
within a unit.
e) Persistence of discontinuity: The observed areal extent of a discontinuity plane.

16
f) Moisture sensitivity: Estimated from an immersion test, and only considered if significant
inflows of groundwater are anticipated or if the unit is exposed to humid mine air.
After the individual unit ratings have been determined, they are summed into a single rating for
the entire mine roof and adjustments are applied from tables provided by the USBM by taking
account of the following:
- Strong beds in the bolted interval
- Number of lithologic units contacts
- Groundwater and
- Surcharge
Individual ratings and adjustment factors are rated in Tables publish by USBM (1994).
Mark and Molinda (1999) modified the original CMRR described above owing to the lack of its
application before any mining because it requires underground observations. An entirely new
system was developed to determine the CMRR from exploratory drill core using the Point Load
Tests (PLT) to determine the strength parameters that account for approximately 60% of the
final rating. The new system uses both diametral (parallel to bedding) and axial (perpendicular
to bedding) PLT’s. The diametral tests allow the estimates of bedding plane cohesion and rock
anistrophy, both of which are critical to estimating susceptibility to horizontal stresses.
Traditional core logging procedures are used to determine discontinuity spacing and roughness.
To ensure compatibility with the original CMRR (1994), the new rating scales were verified by
comparing drill core results with nearby underground mining exposures.
A large database of strength ratings of rocks has been assembled through extensive point load
testing and logging in the United States. Over 2000 PLT (both axial and diametrical) have been
made on common coal measure rock types from mines representing most U.S. coal fields.
The CMRR has been determined for 97 roof exposures from 75 coal mines across the United
States by Molinda and Mark (1994). All of the major U.S. coal basins are represented, with sizes
ranging from small new mines to some of the largest longwall operations. The data has been
partitioned to reflect the following three broad classes of roof based on a scale of 0-100: weak
(0-45), moderate (45-65), and strong (65-100). Table 1 shows the CMRR classes with
corresponding geological conditions.
CMRR has been integrated into support design programs like the USBM Analysis of Longwall
Pillar Stability (ALPS) program in calculation of safety factor for given coal pillar sizes based on

17
applied loads and strength of the pillar. A similar case study in Australia by Mark et al (1999)
has used the CMRR to develop a new methodology for chain pillar design called the Analysis of
Longwall Tailgate Serviceability (ALTS). In both cases, statistical analysis from case histories of
CMRR values have been used in conjunction with existing pillar design formulae to develop a
relationship between the Safety Factor and Roof Rating. The combination of CMRR with
empirical formulas has improved the accuracy of design of gate entry systems in the U.S. by
integrating case histories developed through in-mine data collection techniques with numerical
modelling and empirical pillar design formulas.
Table 1 CMRR classes in the U.S., after Mark and Molinda (1994)
CMRR Class CMRR Region Geological Conditions
Weak 0-45 Claystones, Mudrocks, Shales
Moderate 45-65 Siltstones and Sandstones
Strong 65-100 Sandstones
Butcher (1999) has been documenting the application of the CMRR to South African strata
conditions since it was first introduced to coal mining industry in 1998. Since that time, the
system has been used on a limited basis owing to the fact that South African coal operations
have generally been conducted in good geotechnical conditions compared to other parts of the
world. Furthermore, rock classification systems have generally suffered due to the lack of
trained Engineering Geologists or Rock Mechanics Engineers who can implement such
systems.
Geotechnical site investigations were conducted (as part of SIMRAC COL613) from 20 fall of
ground incident sites in South African coal mines. The CMRR classification system was used to
classify the roof conditions at the fall sites. In addition to that, Bieniawski’s Rock mass Rating
and Laubscher’s Mining Rock mass Rating were used as comparisons with the CMRR. A stress
damage survey was also undertaken to relate rock mass damage to the horizontal stress
regime. In addition a coal cleat damage was done to relate maximum horizontal stress direction
to cleat orientation. All CMRR values obtain from the underground mapping sites fell in the
weak class i.e. on a scale 0-100, between 0-45. Many observations from the fall of ground site
mappings in South Africa were found to collate with experiences gained in the United States.
However, a wide range of CMRR values were noted in some areas where roof conditions
deteriorated in close proximity of major dykes or sills.
In another study by Butcher et al 2001, further CMRR classification studies were carried out as
part of a SIMRAC project to create a geotechnical database of the South African coal fields for

18
design input into open mining operations. The following conclusions with respect to CMRR
values for South African coal mines were made:
• Roof shale’s were generally below CMRR of 45 (weak)
• Sandstones were generally above CMRR of 45 (moderate to strong)
• Siltstones generally fell in the moderate CMRR range (45-65)
These observations correlate closely to Mark’s (1994) work that siltstones and sandstones in
the U.S. were moderate to strong. The CMRR has been found to be robust enough to classify
and describe the roof conditions that are found in South Africa and that it was easy to learn the
technique. Experiences by Butcher (1999) with the RMR and MRMR systems showed a limited
application compared to the CMRR, as they tend to overate the ground conditions by at least
one class. The RMR over rated roof conditions due to lack of sensitivity in the allocation of joint
condition and fracture values.
However, despite these advantages in some cases the CMRR values gave a wide range in
areas of high horizontal stresses and in proximity of major geological features. In one case the
method over rated roof conditions (CMRR=55) in an area where orientation of major/minor
geological features resulted in roof collapses due to its inability to cater for these in the unit
contact adjustment.
3.1 Evaluation of CMRR
Both CMRR underground and drill core CMRR have been tested as part of this study. Mr. G.
Molinda of NIOSH (one of two developers of CMRR) visited South Africa in October 2001, and
these tests were conducted with his assistance.
During this study, the greatest difficulty experienced underground with the trials of CMRR was to
find roof exposures with sufficient height. It was sometimes possible where there were air
crossings, however, most of the time in most of the sections, CMRR could not be applied.
Therefore, the underground visits suggested that for quick and comparative results, a detailed
rating system which requires exposure of roof should only be used in the planning stage on
borehole cores.
One other problem experienced underground was the effect of a single discontinuity which
could cause significant damage to the roof. Because CMRR only takes sets of discontinuities
into account, it was observed that the effect of single joints should also be included in a coal
19
mine roof rating system. Also, the direction of joint or joints should be included. Although drill
and blast method is not a common mining practice in South Africa, blasting damage should also
be included in a rating system. A recent SIMRAC project (COL613) highlighted that
approximately 10 per cent of all falls of ground in South African collieries, that were monitored
during the course of the project, were caused by high horizontal stress. This highlights the
importance of an adjustment factor in a rating system to account for high horizontal stress.
Other important shortcoming of CMRR was the rated height into the roof. As will be discussed in
a later chapter of this report in South Africa usually 2.0 m into the roof is rated using rating
systems. One advantage of this is that if the rating system is used for comparison purposes, it is
important to rate the same height in each rating. Also, the effect of soft layers high into the roof,
even if significantly thinner than those lower in the sequence, can affect the stability of roof.
Therefore, it is strongly suggested that a rating system should always rate the same height into
the roof.
During this task, there was difficulty in comparing underground CMRR with locally developed
systems owing to the fact from the collieries visited, their systems were not developed for rating
the roof, but for planning purposes. This part of the project therefore could not be carried out.
However, impact splitting testing and CMRR were compared on surface using drill cores. This
highlighted the major shortcoming of CMRR with respect to the relative positions of stiff and soft
layers in the roof. Figure 2 shows three different 0.9 m long cores. Each core contains three
different 0.3 m long layers, namely, sandstone, shale and siltstone, but set up in different
sequences, e.g. sandstone is positioned at the top, middle or bottom of the different core runs
respectively.
The results obtained from CMRR were exactly the same for all three cores. That means that
CMRR does not consider the position of soft or stiff layers within the roof strata. However,
impact splitting tests resulted in three different ratings based on the position of stiff sandstone
layer into the roof that affects the stability of the roof. This indicates that the CMRR does not
rate the stability of roof. Rather it rates the quality of roof as a whole without considering the
positions of different layers in the roof. This has major implications in collieries, since in many
cases the support design is based on the stiffness of the immediate roof layer. The last
shortcoming of CMRR is requires skilled personnel and some degree of training.

20
Figure 2 Cores used for CMRR and impact splitting testing
In summary, the shortcomings of CMRR, which were identified during the application of CMRR
are summarized below:
- Exposure into the roof is required (underground CMRR only)
- Only the bolted height is rated. In South Africa, 2.0 m into the roof is the height that is
usually rated.
- Although sets of joints have been considered in CMRR, single joints can have an influence
and should thus also be included.
- Joint orientation is not taken into account (underground CMRR only).
- Stress adjustment is required in the rating system to account for the influence of high
horizontal stress (underground CMRR only)
- No adjustment is made for the effects of blasting (underground CMRR only)
- The position of soft or hard layers into the roof is not taken into account (both underground
and borehole core CMRR)
- Skilled personnel to carry out ratings are required (both underground and borehole core
CMRR)
- Subjectivity rating is not entirely eliminated

21
4.0 Rating systems being used in South African
collieries
4.1 Rating systems developed for planning purposes
Van der Merwe (2001) developed the first roof rating system in South Africa in 1980, using Rock
Quality Designation (RQD). In this rating system the critical height into the roof was taken as
2.0 m. This height of the roof was initially rated with RQD. Following a splitting test conducted
with a chisel at regular distances along the core, RQD was re-applied and final results were
compared with the initial results. The final rating was then obtained based on the difference
between the initial and final RQDs. Due to possible discrepancies resulting from the use of
chisels with different geometries and forces, van der Merwe developed a standard chisel for all
roof rating tests. However, this system has not been documented by van der Merwe. A
summary of the rating systems that have been documented for use in coal mining in South
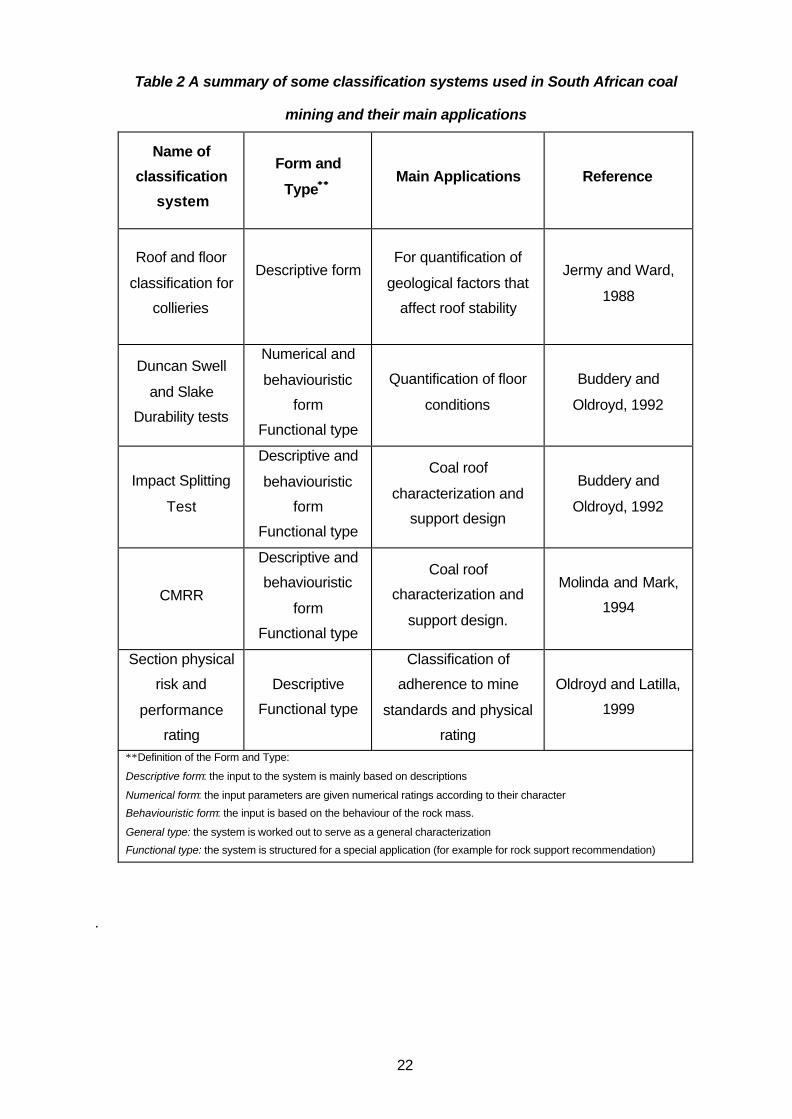
African is given in Table 2.
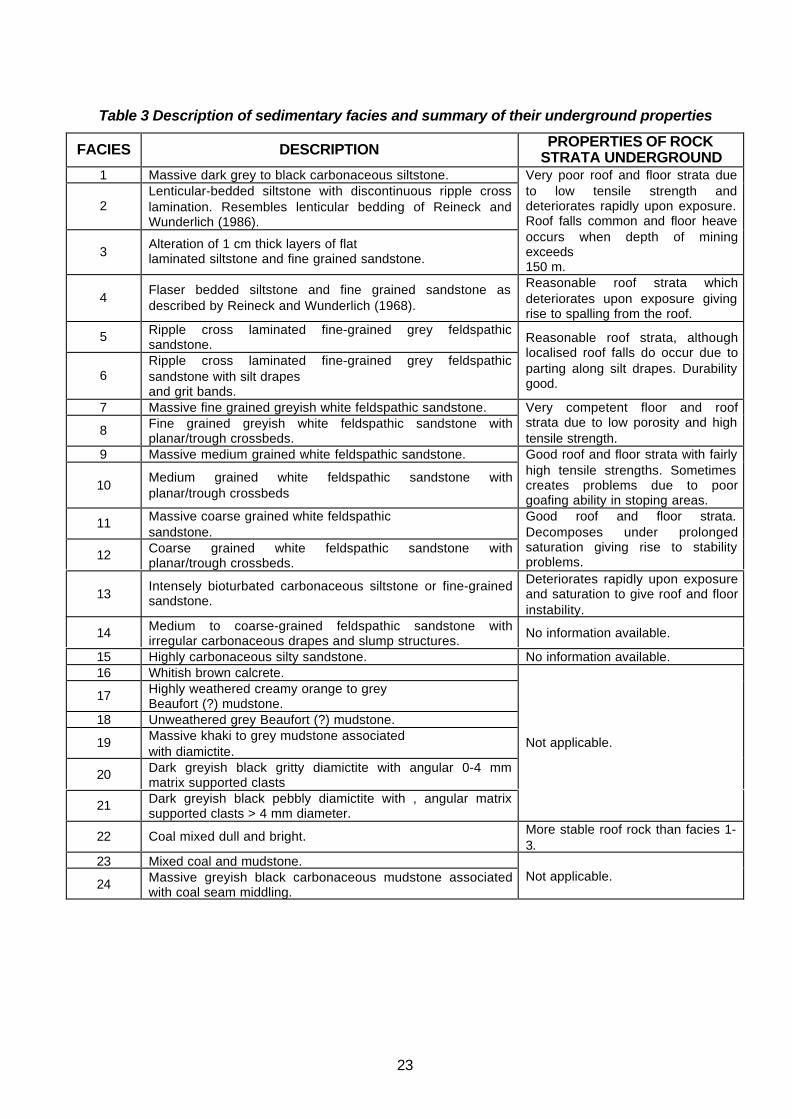
Jermy and Ward, 1988 conducted an investigation into relating geotechnical properties of
various sedimentary facies to their observed underground behaviour to quantify geological
factors that affect roof stability in coal mines. Twenty-four distinct facies types were determined
from borehole cores from a number of collieries throughout South Africa. A database of 10 000
tests from core samples was compiled from the Waterberg, Witbank, Highveld, Eastern
Transvaal, Klip River, Utrecht and Vryheid Coalfields. The results from the tests have shown
that those facies with lower direct tensile strengths generally gave rise to unstable roof
conditions. Furthermore, the low direct tensile strengths of the argillaceous facies were found to
be very important when considering the behaviour of these rocks underground. The arenaceous
facies were found to have higher average direct tensile strengths. However, the authors found
that this can be reduced dramatically by the presence of argillaceous or carbonaceous partings
within the rock which can affect the roof stability. Other tests that were included in the
assessment were the Brazilian Disc Strength and the Uniaxial Compressive Strength but these
were found not to be of importance when considering the weakness of the rock in tension.
Description of sedimentary facies and summary of their underground properties is given in
Table 3.
22
Table 2 A summary of some classification systems used in South African coal
mining and their main applications
Name of
classification
system
Form and
Type∗∗ ∗∗Main Applications Reference
Roof and floor
classification for
collieries
Descriptive formFor quantification of
geological factors that
affect roof stability
Jermy and Ward,
1988
Duncan Swell
and Slake
Durability tests
Numerical and
behaviouristic
form
Functional type
Quantification of floor
conditions
Buddery and
Oldroyd, 1992
Impact Splitting
Test
Descriptive and
behaviouristic
form
Functional type
Coal roof
characterization and
support design
Buddery and
Oldroyd, 1992
CMRR
Descriptive and
behaviouristic
form
Functional type
Coal roof
characterization and
support design.
Molinda and Mark,
1994
Section physical
risk and
performance
rating
Descriptive
Functional type
Classification of
adherence to mine
standards and physical
rating
Oldroyd and Latilla,
1999
∗∗Definition of the Form and Type:
Descriptive form: the input to the system is mainly based on descriptions
Numerical form: the input parameters are given numerical ratings according to their character
Behaviouristic form: the input is based on the behaviour of the rock mass.
General type: the system is worked out to serve as a general characterization
Functional type: the system is structured for a special application (for example for rock support recommendation)
.
23
Table 3 Description of sedimentary facies and summary of their underground properties
FACIES DESCRIPTION PROPERTIES OF ROCKSTRATA UNDERGROUND
1 Massive dark grey to black carbonaceous siltstone.
2Lenticular-bedded siltstone with discontinuous ripple crosslamination. Resembles lenticular bedding of Reineck andWunderlich (1986).
3Alteration of 1 cm thick layers of flatlaminated siltstone and fine grained sandstone.
Very poor roof and floor strata dueto low tensile strength anddeteriorates rapidly upon exposure.Roof falls common and floor heaveoccurs when depth of miningexceeds150 m.
4Flaser bedded siltstone and fine grained sandstone asdescribed by Reineck and Wunderlich (1968).
Reasonable roof strata whichdeteriorates upon exposure givingrise to spalling from the roof.
5 Ripple cross laminated fine-grained grey feldspathicsandstone.
6Ripple cross laminated fine-grained grey feldspathicsandstone with silt drapesand grit bands.
Reasonable roof strata, althoughlocalised roof falls do occur due toparting along silt drapes. Durabilitygood.
7 Massive fine grained greyish white feldspathic sandstone.
8 Fine grained greyish white feldspathic sandstone withplanar/trough crossbeds.
Very competent floor and roofstrata due to low porosity and hightensile strength.
9 Massive medium grained white feldspathic sandstone.
10Medium grained white feldspathic sandstone withplanar/trough crossbeds
Good roof and floor strata with fairlyhigh tensile strengths. Sometimescreates problems due to poorgoafing ability in stoping areas.
11 Massive coarse grained white feldspathicsandstone.
12 Coarse grained white feldspathic sandstone withplanar/trough crossbeds.
Good roof and floor strata.Decomposes under prolongedsaturation giving rise to stabilityproblems.
13Intensely bioturbated carbonaceous siltstone or fine-grainedsandstone.
Deteriorates rapidly upon exposureand saturation to give roof and floorinstability.
14 Medium to coarse-grained feldspathic sandstone withirregular carbonaceous drapes and slump structures.
No information available.
15 Highly carbonaceous silty sandstone. No information available.16 Whitish brown calcrete.
17 Highly weathered creamy orange to greyBeaufort (?) mudstone.
18 Unweathered grey Beaufort (?) mudstone.
19 Massive khaki to grey mudstone associatedwith diamictite.
20 Dark greyish black gritty diamictite with angular 0-4 mmmatrix supported clasts
21 Dark greyish black pebbly diamictite with , angular matrixsupported clasts > 4 mm diameter.
Not applicable.
22 Coal mixed dull and bright. More stable roof rock than facies 1-3.
23 Mixed coal and mudstone.
24 Massive greyish black carbonaceous mudstone associatedwith coal seam middling.
Not applicable.

24
Buddery and Oldroyd (1992) developed a roof and floor classification system for collieries. The
following philosophy was applied in devising a suitable classification system:
- The rock property tests should be related to the expected mode of failure of the strata.
- The whole spectrum of strata should be tested with particular emphasis being placed on
obtaining the properties of the weakest material.
- Large numbers of tests should be able to be conducted simply, quickly, at low cost and in-
house.
Roof failure in South African coal mines is strongly related to the frequency of laminations or
bedding planes. In their roof classification, Buddery and Oldroyd (1992) considered a Coal Rock
Structure Rating (CRSR) system to classify the roof condition. Tests to indicate the propensity
of the laminations or bedding planes to open and separate will therefore be ideal for planning
stages. The tests should indicate the mode of failure of the roof and it should be easy for a
large number of the tests be conducted in-house. This was initially based on three parameters:
RQD, the results of impact splitting tests, and a parameter related to joint condition and
groundwater. Due to the impracticality of satisfactorily distinguishing between drilling-induced
and natural fractures in the coal measures strata, the RQD parameter was discarded from the
system. The third parameter proved to be difficult to determine irrespective of the roof type. It
was, therefore, decided to confine the determination of roof ratings to the results of impact
splitting tests.
The Impact Splitting Test involves imparting the same impact to the core every 20 mm intervals.
The resulting fracture frequency is then used to determine a roof rating. The instrument shown
in Figure 3 consists of an angle iron base which holds the core. Mounted on this is a tube
containing a chisel with a mass of 1.5 kg and a blade width of 25 mm. The chisel is dropped
onto the core from a constant height according to core size, 100 mm for a 60 mm diameter core
and 64 mm for 48 mm diameter core. The impact splitter caused weak or poorly cemented
bedding planes and laminations to open, thus giving an indication of the likely in situ behaviour
when subjected to bending stresses.

25
Figure 3 The Impact Splitting Equipment
It is suggested that, when designing coal mine roof support, 2.0 m of strata above the
immediate roof should be tested. If the roof horizon is in doubt, then all strata from the lowest
likely roof horizon to 2.0 m above the highest likely roof horizon are tested so that all the
potential horizons may be compared. In this classification system, the strata are divided into
geotechnical units. The units are then tested and mean fracture spacing for each unit is
obtained. An individual rating for each unit is determined by using one of the following
equations:
ROOF HORIZON
t (m)
h (m)
fs (cm)
ROOF HORIZON
t (m)
h (m)
fs (cm)
t (m)
h (m)
fs (cm)
Figure 4 Impact splitting unit rating calculation
For fs < 5 rating = 4fs
For fs > 5 rating = 2fs+10
Where fs = fracture spacing is in cm
26
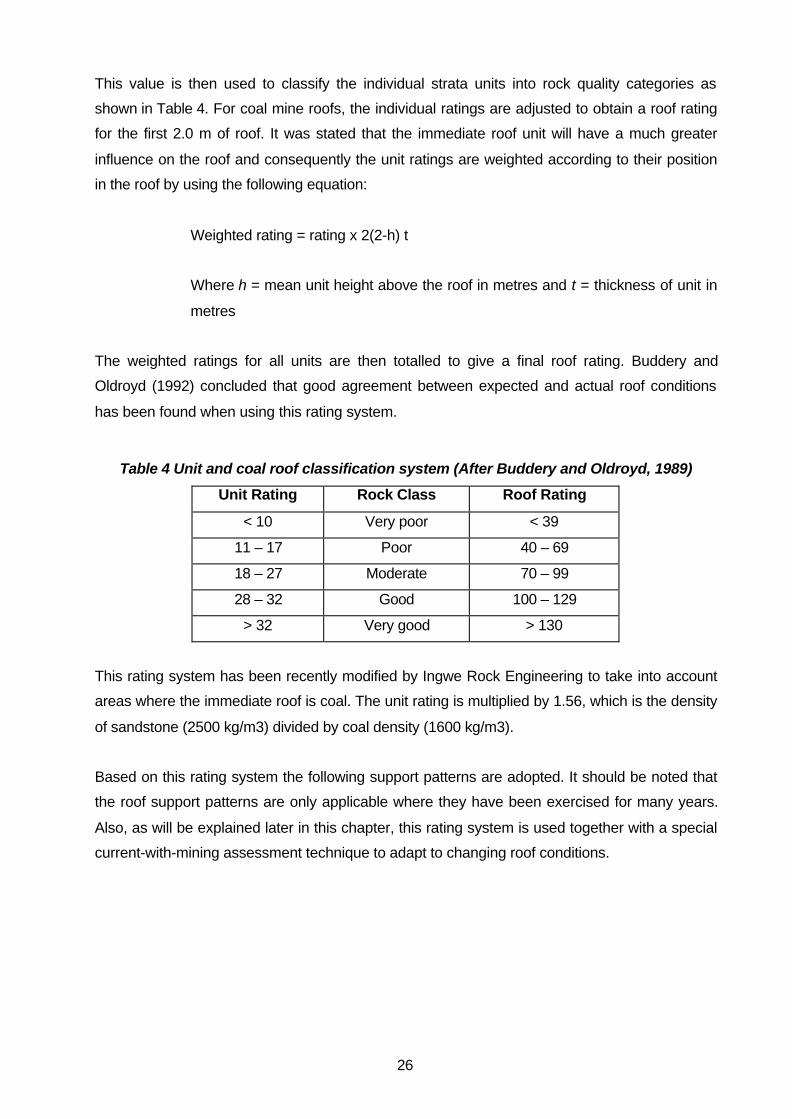
This value is then used to classify the individual strata units into rock quality categories as
shown in Table 4. For coal mine roofs, the individual ratings are adjusted to obtain a roof rating
for the first 2.0 m of roof. It was stated that the immediate roof unit will have a much greater
influence on the roof and consequently the unit ratings are weighted according to their position
in the roof by using the following equation:
Weighted rating = rating x 2(2-h) t
Where h = mean unit height above the roof in metres and t = thickness of unit in
metres
The weighted ratings for all units are then totalled to give a final roof rating. Buddery and
Oldroyd (1992) concluded that good agreement between expected and actual roof conditions
has been found when using this rating system.
Table 4 Unit and coal roof classification system (After Buddery and Oldroyd, 1989)
Unit Rating Rock Class Roof Rating
< 10 Very poor < 39
11 – 17 Poor 40 – 69
18 – 27 Moderate 70 – 99
28 – 32 Good 100 – 129
> 32 Very good > 130
This rating system has been recently modified by Ingwe Rock Engineering to take into account
areas where the immediate roof is coal. The unit rating is multiplied by 1.56, which is the density
of sandstone (2500 kg/m3) divided by coal density (1600 kg/m3).
Based on this rating system the following support patterns are adopted. It should be noted that
the roof support patterns are only applicable where they have been exercised for many years.
Also, as will be explained later in this chapter, this rating system is used together with a special
current-with-mining assessment technique to adapt to changing roof conditions.

27
Table 5 Unit and coal roof classification system (After Buddery and Oldroyd, 1989)
Roof Rating Estimated Support Comment
Very Good 1.2m x 16mm point anchor, 5 bolts in intersections only
Good1.2m x 16mm point anchor, 5 bolts per intersection, 2bolts per row with rows 2m apart
Moderate1.5m x 16mm full column, 9 bolts per intersection, 3bolts per row with rows 1.5m apart
Poor2.0m x 20mm full column, 16 bolts per intersection, 4bolts per row with rows 1m apart, possibly with W-straps
Reduce road widths to lessthan 6m
Very poorSpecialised support, e.g. a combination of cableanchors, trusses, shotcrete, W-straps, etc
Very poor roofs areuneconomic and are usuallyonly traversed to get toreserves.
Sasol Coal has developed a roof rating system based on fall of ground accidents. Analyses of
fall of ground (FOG) accidents in group collieries indicated that almost all such accidents
occurred near dykes and underneath rivers. The collieries have been divided into four groups
indicating the roof conditions based on these two criteria. These areas are marked on mine
plans as “Normal”, Class “C”, Class “B” and Class “A”. The worst and the best ground conditions
are expected in Class “A” and “Normal” respectively. Although there is no difference in specified
mining parameters between the “Normal” and Class ”C”, Class ”C” gives the section a warning
to be aware of possible changes in ground conditions thereby giving the section time to ensure
their support systems are strictly adhered to before reaching Class “B” area. In Class "C" areas,
a spare roofbolter and tell tales should be kept for possible roof deterioration.
On each special area plan, a borehole log is also attached to indicate to mining personnel the
roof conditions in the area. This also assists mining personnel in determining what length of
roofbolt to use in the area. The same mining group has also developed a rating system to be
used on borehole cores in greenfield areas, called Percentage Lamination Plan. This plan
assists mining personnel in determining;
- the thickness of laminated material,
- whether the laminated stratum is high or low in the roof,
- whether the lamination is such that intersection failure can occur,
- whether the section is approaching ground where drastic changes in roof conditions can
occur.
This plan indicates the percentage laminated strata in the direct roof and is available in the
following ranges: the first metre of roof, the second meter of roof and the first two metres of roof.

28
There are also rating systems used in South Africa that geological based. Since the geological
characteristics of roof vary from mine to mine, such a rating system is only applicable for a
particular mine and/or area. The geologists usually conduct observations to find a particular
layer into the roof, during the logging of boreholes. This information is then marked on mine
plans referred to as Roof Hazard Plans. In geology based rating systems, the thickness of
particular layers is also found to be important. Therefore, for some mines, the roof rating is
based on the thickness of particular layers, such as sandstone, shale or siltstone, and the roof
support pattern is determined by the quality of the roof. It was also found that geological
discontinuities are important and play a major role in the quality of roof, therefore, some mines
adapted rating systems based on these features.
The investigation into the rating systems being used in South Africa highlighted that roof rating
systems are being used mainly for planning purposes, and not to determine the changing
conditions underground. However, rating systems have also been developed in South Africa by
Ingwe Coal (Oldroyd and Latilla, 1999), in which support systems are changed based on
evaluation of underground conditions.

29
4.2 Proactive rating systems developed for changing
conditions
Mechanised mining allows sections to be developed at a rapid rate, typically more than 1000 m
per month for most sections, this can result in a variety of conditions being encountered in a
single section in a very short time. Ingwe Coal Rock Engineering (a division of BHP Billiton
Energy Coal) has identified a number of accidents in their mines that are caused primarily by
the inability to recognise changing conditions and therefore failing to apply necessary counter
measures timeously. Furthermore, one of the Codes of Practice (CoP’s) in terms of the South
African Mine Health and Safety Act, 1996, requires mines to compile a mandatory Code of
Practice to combat rock fall accidents.
In order to address the problems and requirements mentioned above, Ingwe Coal Rock
Engineering has designed two underground forms: the “Section Physical Risk Rating” for
measuring the physical conditions and the “Section Performance Rating” for determining how
well the underground section personnel react to the conditions. Both forms are essentially risk
matrices defining various scenarios, each with a certain weighting. The forms have been
successfully applied for bord and pillar operations for the past 5 years in the Ingwe and
Eyesizwe collieries.
The Section Physical Risk Rating form is a basic questionnaire requesting information regarding
geological conditions relevant to roof and sidewall stability, the mining method, and the support
system with geological information to determine a physical ranking ensures that the total system
is examined. The Section Performance Rating form is designed to measure how conditions
determined by the Section Physical Risk Rating are being addressed. Furthermore, the form
also measures compliance with the Support Rules and Strata Control Standards. Both forms
can be easily adapted for specific conditions. Should geological discontinuities, for example,
represent a major problem in a particular area or for a specific mining method, then the
importance of these features may be highlighted as a separate item with its own sub-divisions or
by changing the weighting.
In summary, the following are some of the benefits of using the Ingwe Coal Rating forms:
- The rating forms enable quantification of previously subjective observations.
- Different auditors, i.e. shift supervisors, mine overseers and rock engineers, use the same
format. This allows meaningful comparisons to be made in individual sections.

30
- A visit (audit) is structured such that people observe and record all potential hazards. It
enables trends to be monitored and forms an integral part of the section management plan.
Ingwe describes the Impact Splitting Tests, Section Performance Rating and Physical Risk
Ratings as a system that can be used during the planning stage and assigning appropriate
support patterns; for identifying changing conditions while mining; determining the best reaction
to those conditions. This system also ensures a better engineering design for roof support in
collieries. As is well known the design of roof support for underground coal mines involves a
large number of variables. It is, therefore, not possible to develop one design for a support
system design, (as one might do in a civil or mechanical engineering environment). The need is
to have a number of designs which are able to cope with both the variability and the unknowns
associated with the mining environment and its inherent risk. It is, therefore, essential to adopt a
risk-based management process in relation to ground control.
Three common risk management models are typically used to deal with a variable risk
environment (Galvin 1995):
a) Compromise Model: A fixed compromise level of risk management is adopted. The
setting of the absolute level is often based on historical evidence, experience and
perception of acceptable/unacceptable risk levels. Compromise risk management
accepts that an increase in risk will not be catered for in the management plan.
b) Maximum Risk Model: This model represents designing all systems to cater for the
worst case or highest level of risk. Whilst it caters for all credible increase in risk, it is
usually prohibitively complex and/or expensive for the majority of the time. It may be
appropriate for a nuclear reactor but is likely to render most coal mines uneconomic.
c) Variable Step Model: This recognises that risks change with time, location and/or
operation and the controls for the risks should change accordingly. The basis of this
process working correctly is timely identification of change in the risk level, triggering a
change in the control strategy.
It is not intended, in this report, to pursue the application of risk management techniques.
However, it is important to understand their suitability and role in underground mining and
ground control management. Of the models discussed above, the third, Variable Step Model, is
considered most appropriate for ground control management (Galvin 1995), which can be
adopted using Ingwe’s systems.

31
Compromise model
Maximum risk model
BasStandard
IncreasedStandard
IncreasedStandard
IncreasedStandardVariable risk model
Time, Location, Operation
Time, Location, Operation
Time, Location, Operation
Figure 5 Risk management models (after Galvin, 1995)

32
5.0 Individual Colliery Systems
A number of hazard rating systems are used by the coal mines in South Africa. Some of these
have already been documented but in most cases the systems are individually designed and
implemented by the mines themselves. In light of this, it was necessary to investigate different
hazard systems used at collieries by conducting visits to coal mines. It was decided that this
task would be approached in three stages:
1. Documenting the colliery’s hazard rating system;
2. Applying an existing system to test it against the colliery’s system.
3. Comparison of results of the existing systems to the colliery’s rating system.
One of the difficult parts before the start of this project task was to directly compare the different
rating systems used in different collieries. The reason for this is that most of the systems are not
documented and as already mentioned; differ from one mine to another. It is for this reason that
impact splitting was considered as the most effective system to apply at each mine in order to
test it against the mine’s system and also to test one mine’s results against another mine.
Section Performance Rating and Physical Risk Ratings were also conducted underground to
test their applicability at each colliery.
The research was conducted at eight collieries in the Witbank and Highveld Coalfields. The
collieries that assisted in this investigation were Arnot, Bank, Kriel, New Denmark, Goedehoop,
Greenside, Syferfontein and Twistdraai. This section of the report presents the results of the
investigations at each colliery.
5.1 Arnot Colliery
At Arnot, a rating system is used to predict the anticipated underground conditions by the
geology department during planning. The plan is based on the thickness of the gritstone (coarse
grained sandstone), which is a strong stratum that can act as a self-supporting beam and is
therefore referred to as the Roof Grit Plan. The grit is divided into 5 thickness categories and
classified. Support recommendations are then made as shown in Table 6. The underlying
principle in terms of support recommendations is: the thinner the grit, the longer the anchorage
length will be. The geologist also makes use of a Point Load Tester, shown in Figure 6 to
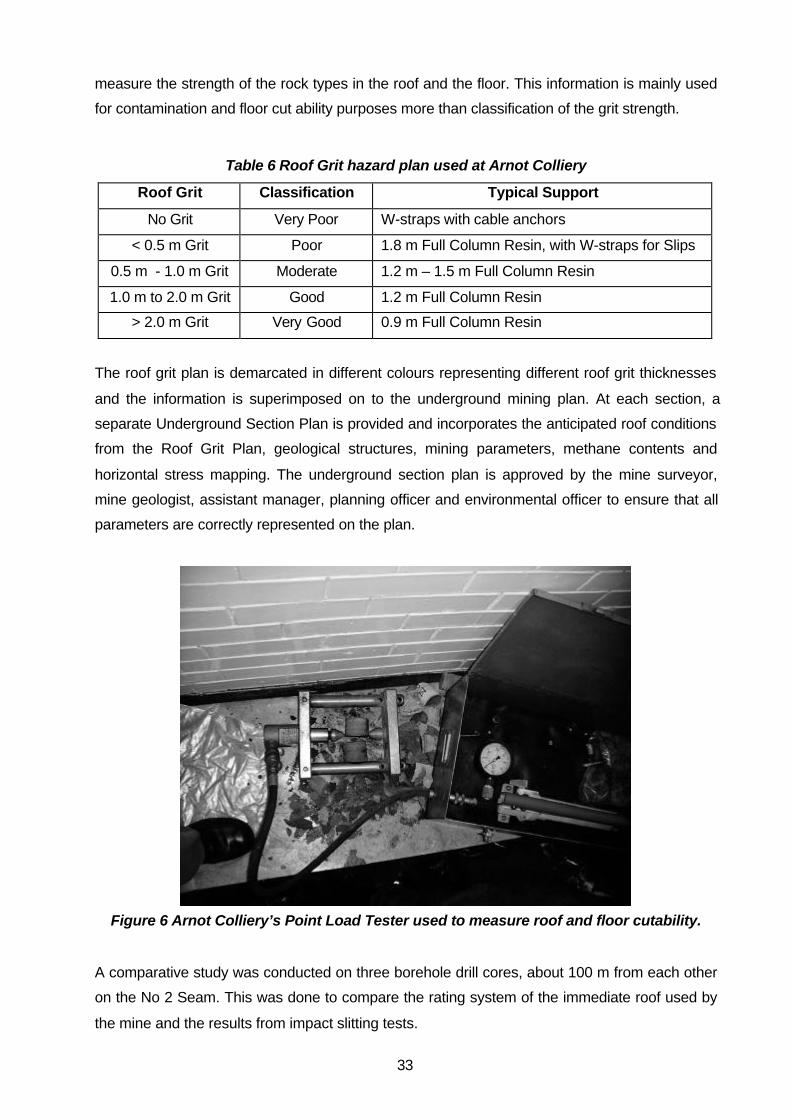
33
measure the strength of the rock types in the roof and the floor. This information is mainly used
for contamination and floor cut ability purposes more than classification of the grit strength.
Table 6 Roof Grit hazard plan used at Arnot Colliery
Roof Grit Classification Typical Support
No Grit Very Poor W-straps with cable anchors
< 0.5 m Grit Poor 1.8 m Full Column Resin, with W-straps for Slips
0.5 m - 1.0 m Grit Moderate 1.2 m – 1.5 m Full Column Resin
1.0 m to 2.0 m Grit Good 1.2 m Full Column Resin
> 2.0 m Grit Very Good 0.9 m Full Column Resin
The roof grit plan is demarcated in different colours representing different roof grit thicknesses
and the information is superimposed on to the underground mining plan. At each section, a
separate Underground Section Plan is provided and incorporates the anticipated roof conditions
from the Roof Grit Plan, geological structures, mining parameters, methane contents and
horizontal stress mapping. The underground section plan is approved by the mine surveyor,
mine geologist, assistant manager, planning officer and environmental officer to ensure that all
parameters are correctly represented on the plan.
Figure 6 Arnot Colliery’s Point Load Tester used to measure roof and floor cutability.
A comparative study was conducted on three borehole drill cores, about 100 m from each other
on the No 2 Seam. This was done to compare the rating system of the immediate roof used by
the mine and the results from impact slitting tests.

34
Table 7 to Table 9 show the results of impact splitting of the three borehole drill cores. The
mine geologists classified borehole drill core ARN 4968 as Roof Grit of 2.19, i.e. “Very Good”
roof. From, Table 7 the final rating of 145 from impact splitting also classifies the borehole drill
core as “Very Good” roof. The lithological codes used in the table are described as follows:
SF : Shaley sandstone/siltstone
S/F : Interlaminated Sandstone/Shale
S : Sandstone
Figure 7 shows a unit in the roof before impact splitting. The initial fractures are counted before
the impact splitting, i.e. one on this case. Figure 8 shows the same unit after Impact Splitting
with 3 final fractures.
Figure 7 A fine to medium grained sandstone or “grit”unit beforeImpact Splitting, takenfrom borehole ARN 4968.

35
Figure 8 A fine to medium grained sandstone or “grit”unit after Impact Splitting, takenfrom borehole ARN 4968.
Table 7 Impact Splitting Results at Arnot, No 2 Seam, Borehole ARN 4968
Depth Thickness Lithology Initial Final Fracture Unit Weighted Remarks
Fractures Fractures Spacing Rating Rating
(m) (cm) (cm)
46.5 13.2 S/F 1 6 2.2 8.8 4.5 Very Poor
46.7 20.0 S/F 1 2 10.0 30 21.2 Good
47.0 25.2 S 1 4 6.3 22.6 17.6 Moderate
47.3 34.5 S 1 2 17.3 44.5 38.2 Very Good
47.6 24.5 S 1 1 24.5 59 27.4 Very Good
47.8 24.0 S 1 2 12.0 34 11.5 Very Good
48.4 61.6 S 1 2 30.8 71.6 24.5 Very Good
Final Rating
145 Very Good
Table 8 and Table 9 show the results from impact splitting of the other two borehole drill cores.
The final ratings of borehole drill cores ARN 4974 and ARN 4975 are 155 - “Very Good” roof -
and 172 - “Very Good” roof. The mine geologists classified the borehole drill cores as Roof Grit
of 1.95 - “Good” roof -and 2.09 -“Very Good” roof respectively. These results show a good
correlation between impact splitting tests and the roof grit plan classification. The exact
correlation in this case is owed to the fact that the immediate roof was composed of the same
rock type for all three borehole drill cores. The exact correlation of the gritstone rating is that the
mine geologist was very experienced with the geology of the area being mined. The advantage

36
of impact splitting is that it quantifies the roof condition as opposed to the mere description of
the thickness of the gritstone. Moreover, where gritstone is not so obvious (i.e. 50 % sandstone
and 50 % shale), then the mine’s system may result in errors due to the subjectivity of the
geologist.
Table 8 Impact Splitting Results at Arnot, No 2 Seam, Borehole ARN 4974
Depth Thickness Lithology Initial Final Fracture Unit Weighted Remarks
Fractures Fractures Spacing Rating Rating
(m) (cm) (cm)
43.6 32.5 S/F 1 5 6.5 23 27.5 Moderate
43.9 36.0 S/F 1 5 7.2 24.4 26.3 Moderate
44.3 41.8 S 1 2 20.9 51.8 47.9 Very Good
44.8 45.3 S 1 2 22.7 55.3 33.6 Very Good
45.2 44.0 S 1 1 44.0 98 19.3 Very Good
Final Rating
155 Very Good
Table 9 Impact Splitting Results at Arnot, No 2 Seam, Borehole ARN 4975
Depth Thickness Lithology Initial Final Fracture Unit Weighted Remarks
Fractures Fractures Spacing Rating Rating
(m) (cm) (cm)
44.8 15.5 F/S 1 4 3.9 15.5 9.2 Poor
44.9 10.0 F/S 1 3 3.3 13.3 4.8 Poor
45.2 24.2 F/S 1 6 4.0 16.1 12.7 Poor
45.3 11.5 F/S 1 3 3.8 15.3 5.1 Poor
45.8 57.5 S 1 4 14.4 38.8 49.0 Very Good
46.1 21.0 S 1 2 10.5 31.0 9.2 Good
46.3 23.2 S 1 2 11.6 33.2 7.5 Very Good
46.7 37.0 S 1 1 37.0 84.0 74.8 Very Good
Final Rating
172 Very Good
Underground visits were conducted to assess’ adherence to the underground anticipated
physical conditions and mine standards using Ingwe’s Physical Rating System and Performance
Rating System. These systems were successful in identifying possible hazards but because
they originated from a different mine, some parameters could not be recorded owing to different
specifications e.g. Arnot’s standards of support spacing are not included in the rating systems.

37
5.2 Bank Colliery
At Bank Colliery, a roof hazard plan only exists for the No 5 Seam. The hazard plan is based
mainly on geological structures, roof type above the coal seam (from boreholes), horizontal
stresses, and surface structures e.g. pans. Geological structures include dykes and sills with
associated burnt coal areas. The roof type above the coal seam is described from exploration
boreholes and is classified from the lithological description of the borehole as shown in Table 10
.
Horizontal resistivity measurements are carried out on surface to determine the depth of
weathering to assist in mine planning. Weathering allows increased water content which can
affect the strength of the roof. Individual boreholes were analysed and the classification of
normal, poor and bad roof is done according to the composition of the immediate roof and the
overlying strata.
Table 10 Roof hazard classification at Bank Colliery
Classification Roof type
Normal roofShale or siltstone of more than 30 cm thick
overlain by sandstone
PoorInterlaminated, laminated, fissile and micaceous
sandstone, siltstone and shale less than 30 cm
Bad roofDolerite intrusions, deep weathering of the roof
and faults
The hazards identified in the roof hazard plan are included in all section plans issued by the
survey department. When mining towards an area that has been demarcated in the roof hazard
plan, various procedures come into effect in terms of personnel awareness and roof support.
A comparative study was done on a total of five borehole drill cores, three from the No 5 Seam
and two from the No 2 Seam. These borehole cores were mainly drilled for future planning and
thus their numbers are the temporal numbers used by the drillers which may differ in future. The
results of impact splitting of the five borehole drill cores from No 5 Seam and No 2 Seam are
presented from Table 11 to Table 15. The lithological codes used in the table are described as
follows:
S : Sandstone
S/F : Sandstone/Shale interlaminated
F : Shale

38
Figure 9 shows an example of the borehole drill core of the Sandstone/Shale interlaminated roof
from the No 5 Seam. In Figure 10 the weaker roof composed mainly of shale is shown.
Figure 9 Borehole drill core from Bank, No 5 Seam
Figure 10 Borehole drill core from Bank, No 2 Seam
The final rating from impact splitting of borehole drill core H45S5 is 79 which is classified as
“Moderate” roof. A similar classification of “Moderate” was obtained from the final ratings of drill

39
cores H49S5 and H50S5 i.e. 80 and 76. These results from the three borehole drill cores could
not be directly compared to the colliery’s rating system due to the fact that the borehole drill
cores were done for future planning purposes by a drilling contractor. Furthermore, due to staff
changes, the new geologist had difficulty in learning the previous system which resulted in the
system not being updated. However, impact splitting results show a good correlation between
each other from all three tests, which were taken in close proximity i.e. distance between them
is less than 500 m.
Table 11 Impact Splitting Results at Bank, No 5 Seam, Borehole H45S5
Depth Thickness Lithology Initial Final Fracture Unit Weighted Remarks
FracturesFractures Spacing Rating Rating
(m) (cm) (cm)
38.0 14.5 S 1 2 7.3 24.5 13.7 Moderate
38.1 12.7 S/F 1 5 2.5 10.2 4.6 Poor
38.3 14.5 S/F 1 5 2.9 11.6 5.6 Poor
38.4 16.4 S/F 1 4 4.1 16.4 8.1 Poor
38.6 12.5 S 1 1 12.5 35.0 11.9 Very Good
38.7 14.2 S 1 1 14.2 38.4 13.3 Very Good
38.8 12.0 S/F 1 2 6.0 22.0 5.8 Moderate
39.0 14.5 S/F 1 2 7.3 24.5 6.8 Moderate
39.1 11.5 S/F 1 2 5.8 21.5 4.1 Moderate
39.2 11.0 S 1 1 11.0 32.0 5.0 Good
Final Rating
79 Moderate
From Table 14 and Table 15, the final ratings obtained from the No 2 Seam are 20 and 13
which indicate “Very Poor” roof in each case. The weakness of the shale in this case made it
difficult to rate up to 2 m into the roof due to the shale being easily broken by merely picking it
up from the borehole drill core box. However, the results show the advantage of impact splitting
over the colliery‘s system in its ability to readily quantify the roof instead of a mere description
that can change from one person to another.
Table 12 Impact Splitting Results at Bank, No 5 Seam, Borehole H49S5
40
Depth Thickness Lithology Initial Final Fracture Unit Weighted Remarks
FracturesFractures Spacing Rating Rating
(m) (cm) (cm)
37.9 14.5 S 1 1 14.5 39.0 21.8 Very Good
38.1 17.0 S/F 1 6 2.8 11.3 6.8 Poor
38.2 10.5 S/F 1 3 3.5 14.0 4.8 Poor
38.3 12.0 S/F 1 3 4.0 16.0 5.8 Poor
38.5 17.1 S/F 1 4 4.3 17.1 8.0 Moderate
38.6 11.5 S/F 1 4 2.9 11.5 3.3 Poor
38.8 18.0 S/F 1 4 4.5 18.0 7.0 Moderate
39.0 22.0 S 1 4 5.5 21.0 8.2 Moderate
39.4 35.2 S 1 4 8.8 27.6 11.6 Good
39.5 15.0 S 1 3 5.0 20.0 2.3 Moderate
Final Rating
80 Moderate
Table 13 Impact Splitting Results at Bank, No 5 Seam, Borehole H50S5
Depth Thickness Lithology Initial Final Fracture Unit Weighted Remarks
Fractures Fractures Spacing Rating Rating
(m) (cm) (cm)
37.6 15.0 S 1 2 7.5 25.0 14.4 Moderate
37.8 14.7 S/F 1 7 2.1 8.4 4.4 Very Poor
37.9 16.0 S/F 1 5 3.2 12.8 6.6 Poor
38.1 12.6 S/F 1 5 2.5 10.1 3.8 Poor
38.2 10.5 S/F 1 2 5.3 20.5 5.9 Moderate
38.3 12.4 S 1 1 12.4 34.8 10.8 Very Good
38.5 20.8 S/F 1 2 10.4 30.8 13.9 Good
38.7 19.5 S/F 1 4 4.9 19.5 6.7 Moderate
38.8 16.4 S/F 1 2 8.2 26.4 6.1 Moderate
39.0 15.4 S/F 1 2 7.7 25.4 3.0 Moderate
Final Rating
76 Moderate
Table 14 Impact Splitting Results at Bank, No 2 Seam, Borehole P4S2
Depth Thickness Lithology Initial Final Fracture Unit Weighted Remarks
41
Fractures Fractures Spacing Rating Rating
(m) (cm) (cm)
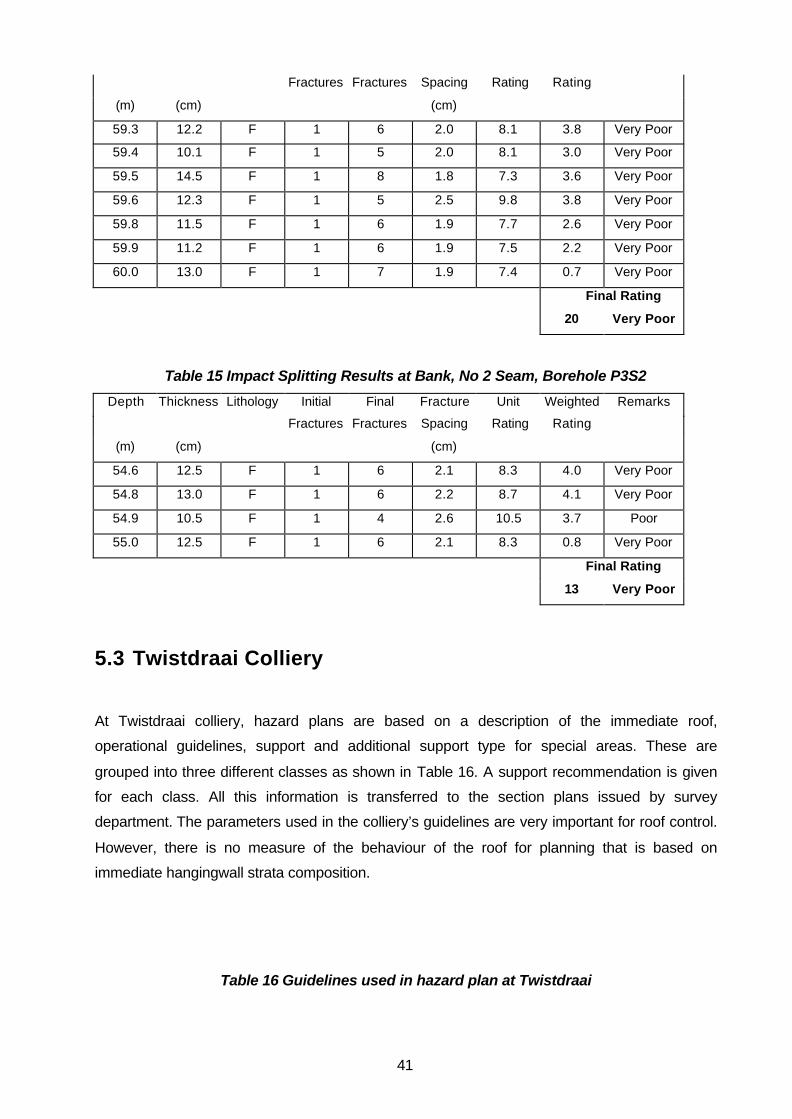
59.3 12.2 F 1 6 2.0 8.1 3.8 Very Poor
59.4 10.1 F 1 5 2.0 8.1 3.0 Very Poor
59.5 14.5 F 1 8 1.8 7.3 3.6 Very Poor
59.6 12.3 F 1 5 2.5 9.8 3.8 Very Poor
59.8 11.5 F 1 6 1.9 7.7 2.6 Very Poor
59.9 11.2 F 1 6 1.9 7.5 2.2 Very Poor
60.0 13.0 F 1 7 1.9 7.4 0.7 Very Poor
Final Rating
20 Very Poor
Table 15 Impact Splitting Results at Bank, No 2 Seam, Borehole P3S2
Depth Thickness Lithology Initial Final Fracture Unit Weighted Remarks
Fractures Fractures Spacing Rating Rating
(m) (cm) (cm)
54.6 12.5 F 1 6 2.1 8.3 4.0 Very Poor
54.8 13.0 F 1 6 2.2 8.7 4.1 Very Poor
54.9 10.5 F 1 4 2.6 10.5 3.7 Poor
55.0 12.5 F 1 6 2.1 8.3 0.8 Very Poor
Final Rating
13 Very Poor
5.3 Twistdraai Colliery
At Twistdraai colliery, hazard plans are based on a description of the immediate roof,
operational guidelines, support and additional support type for special areas. These are
grouped into three different classes as shown in Table 16. A support recommendation is given
for each class. All this information is transferred to the section plans issued by survey
department. The parameters used in the colliery’s guidelines are very important for roof control.
However, there is no measure of the behaviour of the roof for planning that is based on
immediate hangingwall strata composition.
Table 16 Guidelines used in hazard plan at Twistdraai

42
GuidelineMaximum
Roadwidth
Maximum
Cutting Distance
Class A 6.0m 9.0m
Class B 6.6m 18.0m
Class C 7.2m 24.0m
A comparative study was done on a total of four borehole drill cores from the No 4 Seam and
the results are presented from Table 17 to Table 20. The lithological codes used in the table are
described as follows:
S : Sandstone
S/s : Sandstone/Siltstone (Predominantly Sandstone)
The final rating of 159 from impact splitting classifies the borehole drill core as “Very Good” roof.
Final ratings of 107 (“Good”), 221 (“Very Good”) and 195 (“Very Good”) were obtained from
other three impact splitting tests. The results show a good correlation in quantifying the
expected roof conditions. Even though the colliery’s system did not quantify the roof conditions,
the geologist’s description of the expected conditions was also a “Good” roof.
Table 17 Impact Splitting Results at Twistdraai, No 4 Seam, Borehole G293584
Depth Thickness Lithology Initial Final Fracture Unit Weighted Remarks
Fractures Fractures Spacing Rating Rating
(m) (cm) (cm)
153.0 23.0 S/s 1 8 2.9 11.5 10.0 Poor
153.2 22.0 S/s 1 5 4.4 17.6 12.9 Moderate
153.4 20.0 S/s 1 3 6.7 23.3 13.5 Moderate
154.1 70.0 S 1 2 35.0 80.0 112.0 Very Good
154.4 26.0 S 1 2 13.0 36.0 9.7 Very Good
154.7 36.0 S 1 4 9.0 28.0 4.2 Good
155.0 27.0 S 1 1 27.0 64.0 -3.6 Very Good
Final Rating
159 Very Good
Table 18 Impact Splitting Results at Twistdraai, No 4 Seam, Borehole G293585
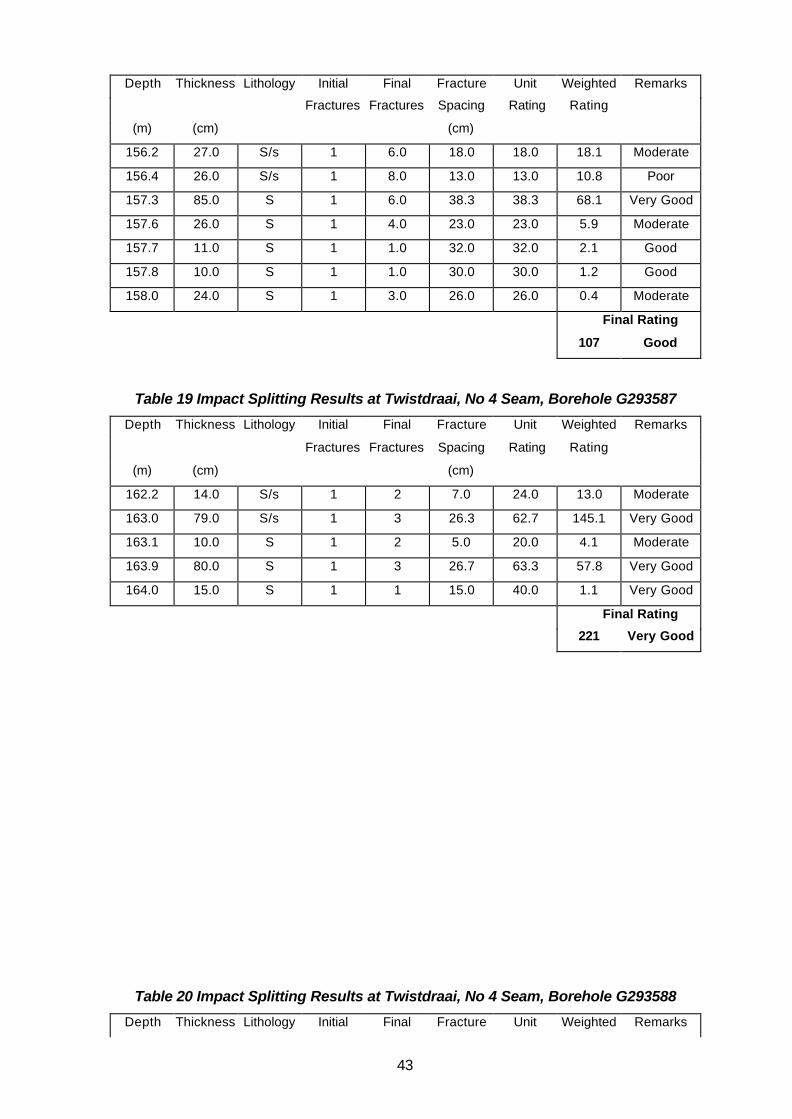
43
Depth Thickness Lithology Initial Final Fracture Unit Weighted Remarks
Fractures Fractures Spacing Rating Rating
(m) (cm) (cm)
156.2 27.0 S/s 1 6.0 18.0 18.0 18.1 Moderate
156.4 26.0 S/s 1 8.0 13.0 13.0 10.8 Poor
157.3 85.0 S 1 6.0 38.3 38.3 68.1 Very Good
157.6 26.0 S 1 4.0 23.0 23.0 5.9 Moderate
157.7 11.0 S 1 1.0 32.0 32.0 2.1 Good
157.8 10.0 S 1 1.0 30.0 30.0 1.2 Good
158.0 24.0 S 1 3.0 26.0 26.0 0.4 Moderate
Final Rating
107 Good
Table 19 Impact Splitting Results at Twistdraai, No 4 Seam, Borehole G293587
Depth Thickness Lithology Initial Final Fracture Unit Weighted Remarks
Fractures Fractures Spacing Rating Rating
(m) (cm) (cm)
162.2 14.0 S/s 1 2 7.0 24.0 13.0 Moderate
163.0 79.0 S/s 1 3 26.3 62.7 145.1 Very Good
163.1 10.0 S 1 2 5.0 20.0 4.1 Moderate
163.9 80.0 S 1 3 26.7 63.3 57.8 Very Good
164.0 15.0 S 1 1 15.0 40.0 1.1 Very Good
Final Rating
221 Very Good
Table 20 Impact Splitting Results at Twistdraai, No 4 Seam, Borehole G293588
Depth Thickness Lithology Initial Final Fracture Unit Weighted Remarks

44
Fractures Fractures Spacing Rating Rating
(m) (cm) (cm)
163.6 0.1 S 1 1 10.0 30.0 11.7 Good
163.7 0.1 S 1 2 5.0 20.0 7.4 Moderate
163.9 0.1 S 1 2 6.5 23.0 10.4 Moderate
163.4 0.3 S 1 1 29.0 68.0 60.1 Very Good
163.7 0.3 S 1 1 25.0 60.0 37.7 Very Good
163.9 0.2 S 1 1 20.0 50.0 20.6 Very Good
164.1 0.3 S 1 1 27.0 64.0 27.5 Very Good
164.3 0.2 S 1 1 19.0 48.0 10.3 Very Good
164.9 0.6 S 1 3 18.3 46.7 10.0 Very Good
165.0 0.1 S 1 3 4.7 18.7 -0.8 Moderate
Final Rating
195 Very Good
5.4 Kriel Colliery
At Kriel colliery, a roof hazard plan has been developed for the No 4 Seam by rating the roof
lithology (e.g. Sandstone) and thickness of coal left in the roof. ( shown in Figure 11) to form a
Composite Roof Hazard Plan with the ratings shown in Table 21 . Due to changes of personnel,
the new geologists could not describe how the scores, rating and ranking numbers were
obtained. The classifications in Table 21 are coloured differently and demarcated in the
composite roof hazard plan together with areas of floor roll and sill transgression.
Table 21 Composite Roof Hazard Plan classification at Kriel Colliery
Score Rating Rank
5 21 - 25 Strong
4 16 - 20 Moderate
3 11 - 15 Weak - Moderate
2 6 - 10 Weak
1 1 - 5 Very Weak

45
Figure 11 Typical Kriel colliery No 4 Seam roof lithology
During this investigation, there was no drilling taking place at Kriel colliery and thus our impact
splitting tests were only limited to the borehole drill cores done by the mine from time to time for
problem areas. Only one impact splitting test was conducted on borehole drill core KRL3811
and the results are presented in Table 22 and Table 23. The lithological codes used in the table
are described as follows:
S/f : Sandstone with shale bands
C : Coal
When plotted on the composite roof hazard plan, the borehole drill core was on the border of
the areas demarcated “Moderate” and “Very Weak”. Based on the colliery’s system, without
underground observations, any of the rankings between Moderate to Very Weak could classify
this borehole. However, the impact splitting tests rated it as moderate (“Final rating of 95”). The
results presented in Table 22 are before a coal adjustment factor of 1.56 was applied as
explained in the literature review.

46
Table 22 Impact Splitting Results at Kriel, No 4 Seam, Borehole KRL3811
Depth Thickness Lithology Initial Final Fracture Unit Weighted Remarks
Fractures Fractures Spacing Rating Rating
(m) (cm) (cm)
44.0 19.5 S/f 1 1 19.5 49.0 36.4 Very Good
44.3 25.5 S/f 1 2 12.8 35.5 30.4 Very Good
44.5 18.5 C 1 7 2.6 10.6 5.7 Poor
44.6 12.5 C 1 5 2.5 10.0 3.3 Very Poor
44.8 20.5 C 1 7 2.9 11.7 5.5 Poor
45.0 20.0 C 1 8 2.5 10.0 3.7 Very Poor
Final Rating
85 Moderate
Table 23 Impact Splitting Results after coal adjustment factor, Borehole KRL3811
Depth Thickness Lithology Initial Final Fracture Unit Weighted Remarks
Fractures Fractures Spacing Rating Rating
(m) (cm) (cm)
44.0 19.5 S/f 1 1 19.5 49.0 36.4 Very Good
44.3 25.5 S/f 1 2 12.8 35.5 30.4 Very Good
44.5 18.5 C 1 7 2.6 16.5 8.9 Poor
44.6 12.5 C 1 5 2.5 15.6 5.1 Poor
44.8 20.5 C 1 7 2.9 18.3 8.5 Moderate
45.0 20.0 C 1 8 2.5 15.6 5.8 Poor
Final Rating
95 Moderate
5.5 New Denmark Colliery
The Roof Hazard Plan has been established to indicate potential hazards that may affect the
safety of the employees. The hazards that are identified are:
- Dykes and sills with associated burnt coal areas
- Laminations, partings and shale from surface
- Sudden change in floor gradient
- All areas of poor roof identified from roof sounding
- Excessive bord widths
- All bord widths exceeding 9 m due to over cutting or scaling
- Horizontal stress concentrations and historical roof fall problems
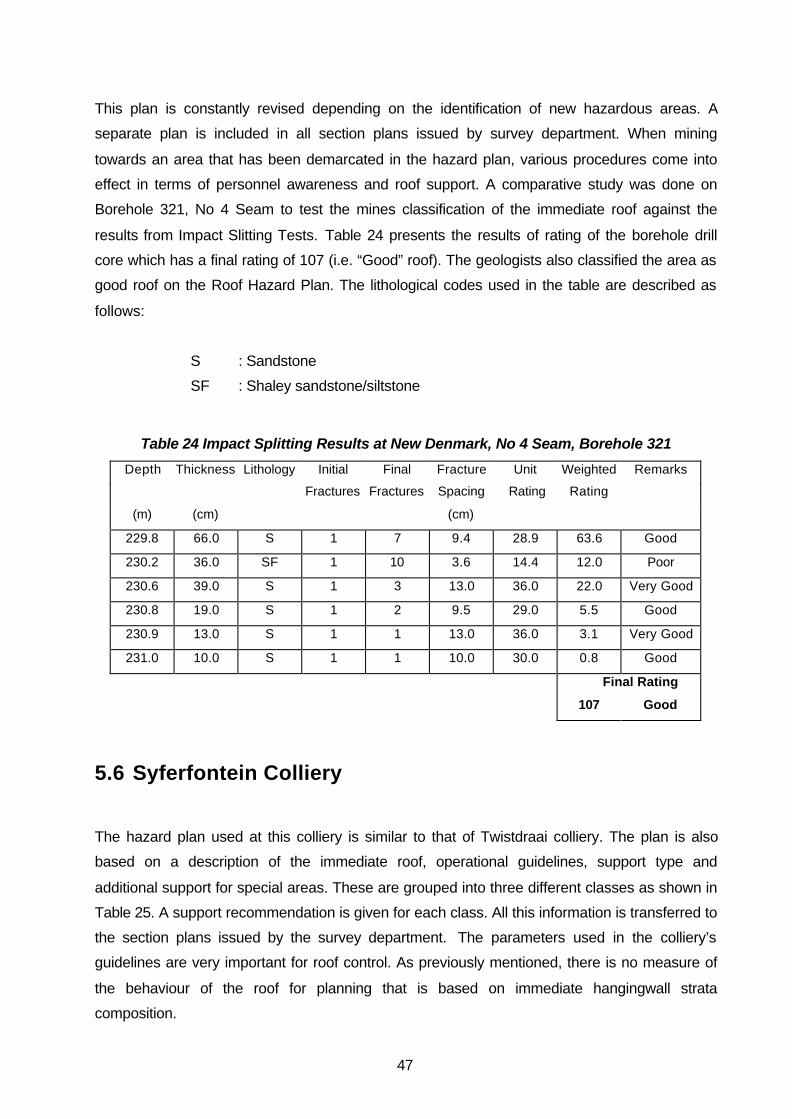
47
This plan is constantly revised depending on the identification of new hazardous areas. A
separate plan is included in all section plans issued by survey department. When mining
towards an area that has been demarcated in the hazard plan, various procedures come into
effect in terms of personnel awareness and roof support. A comparative study was done on
Borehole 321, No 4 Seam to test the mines classification of the immediate roof against the
results from Impact Slitting Tests. Table 24 presents the results of rating of the borehole drill
core which has a final rating of 107 (i.e. “Good” roof). The geologists also classified the area as
good roof on the Roof Hazard Plan. The lithological codes used in the table are described as
follows:
S : Sandstone
SF : Shaley sandstone/siltstone
Table 24 Impact Splitting Results at New Denmark, No 4 Seam, Borehole 321
Depth Thickness Lithology Initial Final Fracture Unit Weighted Remarks
Fractures Fractures Spacing Rating Rating
(m) (cm) (cm)
229.8 66.0 S 1 7 9.4 28.9 63.6 Good
230.2 36.0 SF 1 10 3.6 14.4 12.0 Poor
230.6 39.0 S 1 3 13.0 36.0 22.0 Very Good
230.8 19.0 S 1 2 9.5 29.0 5.5 Good
230.9 13.0 S 1 1 13.0 36.0 3.1 Very Good
231.0 10.0 S 1 1 10.0 30.0 0.8 Good
Final Rating
107 Good
5.6 Syferfontein Colliery
The hazard plan used at this colliery is similar to that of Twistdraai colliery. The plan is also
based on a description of the immediate roof, operational guidelines, support type and
additional support for special areas. These are grouped into three different classes as shown in
Table 25. A support recommendation is given for each class. All this information is transferred to
the section plans issued by the survey department. The parameters used in the colliery’s
guidelines are very important for roof control. As previously mentioned, there is no measure of
the behaviour of the roof for planning that is based on immediate hangingwall strata
composition.

48
Table 25 Guidelines used in hazard plan at Syferfontein colliery
GuidelineMaximum
Roadwidth
Maximum
Cutting Distance
Class A 6.0m 9.0m
Class B 6.6m 18.0m
Class C 7.2m 24.0m
A comparative study was done on borehole drill core V118043 from the No 4 Seam and the
results are presented in Table 26 and Table 27. The lithological codes used in the table are
described as follows:
SF : Shaley Sandstone/siltstone
SC : Sandstone/Coal (Predominantly Sandstone)
C : Coal
Table 26 Impact Splitting Results at Syferfontein, No 4 Seam, Borehole V118043
Depth Thickness Lithology Initial Final Fracture Unit Weighted Remarks
Fractures Fractures Spacing Rating Rating
(m) (cm) (cm)
84.1 15.0 C 1 5 3.0 12.0 6.9 Poor
84.2 10.0 C 1 2 5.0 20.0 7.2 Moderate
84.5 29.0 C 1 4 7.3 24.5 22.8 Moderate
84.8 26.5 C 1 4 6.6 23.3 16.4 Moderate
84.9 10.0 C 1 4 2.5 10.0 2.3 Very Poor
85.0 11.0 SC 1 2 5.5 21.0 4.8 Moderate
85.1 10.0 SF 1 3 3.3 13.3 2.5 Poor
85.3 19.0 SF 1 6 3.2 12.7 3.8 Poor
85.4 13.0 SF 1 2 6.5 23.0 3.8 Moderate
Final Rating
70 Moderate
Table 27 Impact Splitting Results, Borehole V118043 after coal adjustment factor
Depth Thickness Lithology Initial Final Fracture Unit Weighted Remarks
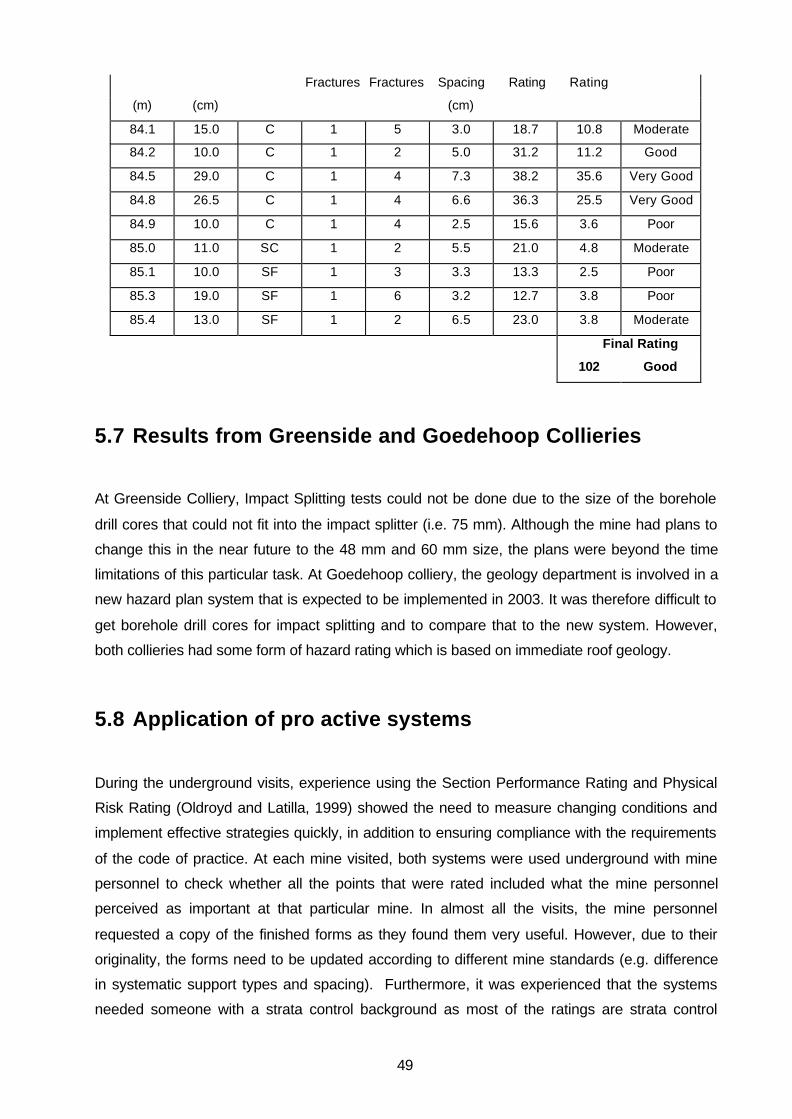
49
Fractures Fractures Spacing Rating Rating
(m) (cm) (cm)
84.1 15.0 C 1 5 3.0 18.7 10.8 Moderate
84.2 10.0 C 1 2 5.0 31.2 11.2 Good
84.5 29.0 C 1 4 7.3 38.2 35.6 Very Good
84.8 26.5 C 1 4 6.6 36.3 25.5 Very Good
84.9 10.0 C 1 4 2.5 15.6 3.6 Poor
85.0 11.0 SC 1 2 5.5 21.0 4.8 Moderate
85.1 10.0 SF 1 3 3.3 13.3 2.5 Poor
85.3 19.0 SF 1 6 3.2 12.7 3.8 Poor
85.4 13.0 SF 1 2 6.5 23.0 3.8 Moderate
Final Rating
102 Good
5.7 Results from Greenside and Goedehoop Collieries
At Greenside Colliery, Impact Splitting tests could not be done due to the size of the borehole
drill cores that could not fit into the impact splitter (i.e. 75 mm). Although the mine had plans to
change this in the near future to the 48 mm and 60 mm size, the plans were beyond the time
limitations of this particular task. At Goedehoop colliery, the geology department is involved in a
new hazard plan system that is expected to be implemented in 2003. It was therefore difficult to
get borehole drill cores for impact splitting and to compare that to the new system. However,
both collieries had some form of hazard rating which is based on immediate roof geology.
5.8 Application of pro active systems
During the underground visits, experience using the Section Performance Rating and Physical
Risk Rating (Oldroyd and Latilla, 1999) showed the need to measure changing conditions and
implement effective strategies quickly, in addition to ensuring compliance with the requirements
of the code of practice. At each mine visited, both systems were used underground with mine
personnel to check whether all the points that were rated included what the mine personnel
perceived as important at that particular mine. In almost all the visits, the mine personnel
requested a copy of the finished forms as they found them very useful. However, due to their
originality, the forms need to be updated according to different mine standards (e.g. difference
in systematic support types and spacing). Furthermore, it was experienced that the systems
needed someone with a strata control background as most of the ratings are strata control

50
related and constitute a big weighting in the final rating. The following is a summary of the
points to note about the underground section rating systems:
− A structured check list ensured that the user observed and recorded all potential
hazards. It also ensures that they are attended and re-evaluated again for
improvement in the conditions.
− Different inspectors, i.e. shift supervisors, mine overseers and rock engineers, use
the same format. This allows meaningful comparisons to be made in individual
sections.
− Systems need to be applied by someone who has a strata control understanding.
− The systems could be used on any mine with small modifications to the control
instructions (e.g. support types)
5.9 Windows Based Program
A Microsoft Windows based program has been developed in Visual Basic for Microsoft Excel.
The program consists of the Impact Splitting calculations, the Section Risk and Section
Performance rating forms.

51
6.0 Conclusions and Recommendations
The purpose of this project was to develop a roof rating system by evaluating and documenting
all the existing systems that are used in South Africa and others that have been developed in
other countries, and proposing the way forward for the development of a system that could be
used universally on South African collieries. The results presented in the previous chapter have
shown that, although many collieries have hazard plans, these plans do not readily quantify the
mechanistic behaviour of the roof strata, they are mostly descriptive and are subject to different
opinions. Furthermore, there is no uniform methodology behind the development of these plans,
which makes it difficult for another person to apply them.
It was considered that the CMRR could overcome most problems associated with the
application of rock mass classification systems in coal mining. However, due to the fact that the
system is based on case histories from the United States, certain modifications would have to
be made to the system to cater for the different conditions in South African collieries.
Impact Splitting Test has been found to be the most appropriate system to eliminate human
error in core rating. The advantage of impact splitting over the individual colliery‘s geology
based rating systems is its ability to readily quantify the roof instead of a mere description that
can change from one person to another. Geology based systems have been developed based
from experience by mine personnel that certain soft or hard layers in the roof were a major
cause of instability. During this study, Impact Splitting has shown a very good correlation with
the geology based rating systems. The system can therefore be used during planning for good
prediction of conditions ahead of mining. Furthermore, the system requires minimal training time
(about half-hour) and therefore does not require skilled personnel.
In conclusion, Impact Splitting Tests, Section Performance Rating and Physical Risk Ratings
systems developed in South Africa are considered to be as effective and appropriate for South
African conditions. They can distinguish different roof conditions necessary for initial planning
and support design. They can also be used for identifying changing conditions while mining and
determining the best response to the different conditions.
It must be noted that borehole core based systems like the Impact Splitting are dependent on
the quality of the core. Layers that are very weak or have very low cohesion can easily break
during the drilling process. Geophysical techniques may therefore be more accurate in such
cases for prediction of these layers.

52
Appendix A: Literature Review
1.0 Literature review
1.1 Rock mass classification
A number of empirical methods have been developed to predict the stability of rock slopes and
underground openings in rock and to determine the support requirements of such features. The
various approaches used for coal mine roof stability assessment can be categorized as follows:
• Analytical methods
• Geological methods
• Observational methods
• Empirical methods
Analytical approaches generally make use of the fundamental concepts of strength of materials,
solid-state mechanics, structural analysis and numerical modelling. Geological approaches
basically try to quantify geological structures and other features affecting roof stability. There are
various methods used to identify such features, such as core drilling, geological mapping and
roof fall mapping. This type of approach has been applied in various coal mines around the
world where geological features such as sandstone channels were the main cause of roof falls.
Observational methods rely on instrumentation in an attempt to monitor movement and detect
measurable instability in mines. Observational methods are the best for back analysis to check
the results and predictions of the other methods. In underground mining, the instrumentation is
installed to determine stresses, loads, strains and displacements to evaluate the stability of
openings. The empirical methods of analysis employ the rock mass classification systems for
assessing the stability of underground excavations.
An important issue in rock mass description and characterization is to select parameters of
greatest significance for the actual type of design or construction. There is no single parameter
or index, which can fully designate the properties of a jointed rock mass. Various parameters
have different significance and only if combined can they describe a rock mass satisfactorily
(Bieniawski, 1984). In situ testing of rock masses has brought out very clearly the enormous
variations that exist in the mechanical behaviour of a rock mass from place to place. According
to Lama and Vutukuri (1978) the engineering properties of a rock mass depend far more on the
system of geological discontinuities within the rock mass than of the strength of the rock itself.
53
Further, the strength of a rock mass is often governed by the interlocking bonds of the unit
"elements" forming the rock mass. Terzaghi (1946) also concludes that, from an engineering
point of view, a knowledge of the type and frequency of the rock discontinuities may be much
more important than the types of rock which will be encountered.
Similarly, Piteau (1970) has stressed the importance of distinguishing between the behaviour of
the rock and the rock mass, especially for hard rocks. Thus, characterizing a discontinuity
system in a way that describes the variability of its geometric parameters constitutes an
essential step in dealing with stability problems in discontinuous rock masses (Tsoutrelis et al.,
1990). This does not mean that the properties of the intact rock material should be disregarded
in the characterization. After all, if discontinuities are widely spaced, or if the intact rock is weak,
the properties of the intact rock may strongly influence the gross behaviour of the rock mass.
The rock material is also important if the joints are discontinuous. In addition, the rock
description will inform the reader about the geology and the type of material at the site.
Although the importance of rock properties in many cases are overridden by discontinuities, it
should be remembered that the properties of the rocks very much determine the formation and
development of discontinuities. Therefore, an adequate and reliable estimation of the nature of
the rock is often a primary requirement. For some engineering or rock mechanics purposes the
mechanical characterization of rock material alone can be used, namely for drillability,
crushability, aggregates for concrete, asphalt etc. Also, in assessment for the use of fullface
boring machines (TBM), rock properties such as compressive strength, hardness, anisotropy
are among the more important parameters.
Kirkaldie ( 1988) mentions a total of 28 parameters present in rock masses which may influence
the strength, deformability, permeability or stability behaviour of rock masses: 10 rock material
properties, 10 properties of discontinuities and 8 hydro geological properties. Because it is often
difficult or impossible in a general characterization to include the many variables in such a
complex natural material, it is necessary to develop suitable systems or models in which the
complicated reality of the rock mass can be simplified by selecting only a certain number of
representative parameters.
Several rock mass classification systems have been developed and evolved over many years.
Table 28 shows some major developments in classification systems over the years.
An important observation on the systems developed is that the following parameters are the
most frequently by applied in design and classification systems:
• The rock material (rock type, geological name, weathering and strength)

54
• The degree of jointing
• In situ stresses
Table 28 Some of the classification systems and their main applications
Name ofclassificationsystem
Form and Type∗∗ ∗∗ Main Applications Reference
The Terzaghi rockload.
Descriptive andbehaviouristic formFunctional type
Design of steel Support intunnels
Terzaghi, 1946
Lauffer's stand-uptime.
Descriptive formGeneral type
Input in tunnel design Lauffer, 1958
The new Austriantunnelling method(NATM)
Descriptive andbehaviouristic formFunctional type
Excavation and design inincompetent ground
Rabcewicz etal, 1954
The unifiedclassification of soiland rocks
Descriptive formGeneral type
Based on particles andblocks for communication
Deere et al.,1969
Rock classificationfor rock mechanicalpurposes
Descriptive formGeneral type
Input in rock mechanics Patching andCoates, 1968
The rock qualitydesignation RQD
Numerical formGeneral type
Based on core logging andused in other systems
Deere et al.,1967
The rock structurerating RSR
Numerical formFunctional type
Design of steel Support intunnels
Wickham etal.,1972
The Rock massRating RMR
Numerical formFunctional type
Tunnel, mine and foundationdesign
Bieniawski,1973
The Q-system Numerical formFunctional type
Design of support inunderground excavations
Barton et al,1974
The Modified RockMass Rating MRMR
Numerical formFunctional type
Tunnel, mine and foundationdesign
Bieniawski,1977
The unified rockclassificationsystem
Descriptive formGeneral type
Based on blocks and used forcommunication
Williamson,1980
Basic geotechnicalclassification (BGD)
Descriptive formGeneral type
For general use ISRM, 1981
The GeologicalStrength Index(GSI)
Numerical formFunctional type
Design of support inunderground excavations Hoek, 1994
The CMRRDescriptive andbehaviouristic formFunctional type
Coal Roof characterizationand support design.
Molinda andMark, 1994
The Rock massIndex (RMi)
Numerical formFunctional type
General characterization,design of support.
Palmström,1995
∗∗Definition of the Form and Type:
Descriptive form: the input to the system is mainly based on descriptionsNumerical form: the input parameters are given numerical ratings according to their characterBehaviouristic form: the input is based on the behaviour of the rock mass in a tunnelGeneral type: the system is worked out to serve as a general characterizationFunctional type: the system is structured for a special application (for example for rock support recommendation)

55
Also such features as:
• Orientation of main discontinuities or joint set
• Joint condition
• Block shape or jointing pattern
• Faults and weakness zones and
• Excavation features (dimension, orientation, etc) have been considered as important
parameters in rock masses.
1.2 Rock mass classification systems in mining
The Geomechanics classifications Rock mass Rating, RMR and the Norwegian Geotechnical
Institute (NGI) Q-system are the most commonly used. Both of these systems incorporate Rock
Quality Designation RQD and are based on actual case histories. Because of the dynamic
nature of the two systems, they have been modified and employed in a study of coal mine roof
conditions around the world. The RMR and Q systems have evolved over time to better reflect
the perceived influence of various rock mass factors on excavation stability. The introduced
modifications have arguably enhanced the applicability of these classification systems, but there
are still areas of potential errors and confusion. This section of the literature discusses the
evolution of these systems as well as problems associated with estimating the Q, RMR and
RQD indexes. Changes associated with the classification systems are of two forms. The first
one lies with the actual properties of the systems, the way these are determined on site and the
associated weight assigned to each parameter. The second form is the evolution of support
recommendations as new methods of reinforcement such as cable bolting and reinforced
shotcrete gained acceptance.
1.2.1 Rock quality designation index (RQD)
The Rock Quality Designation index (RQD) was developed by Deere et al (1967) to provide a
quantitative estimate of rock mass quality from drilling core logs. RQD is a modified core
recovery index defined as the total length of intact core greater than 100mm in length, divided
by the total length of the core run. The resulting value is presented in the form of a percentage
as shown in Figure 12. RQD should only be calculated over individual core runs, usually 1.5
metres long.
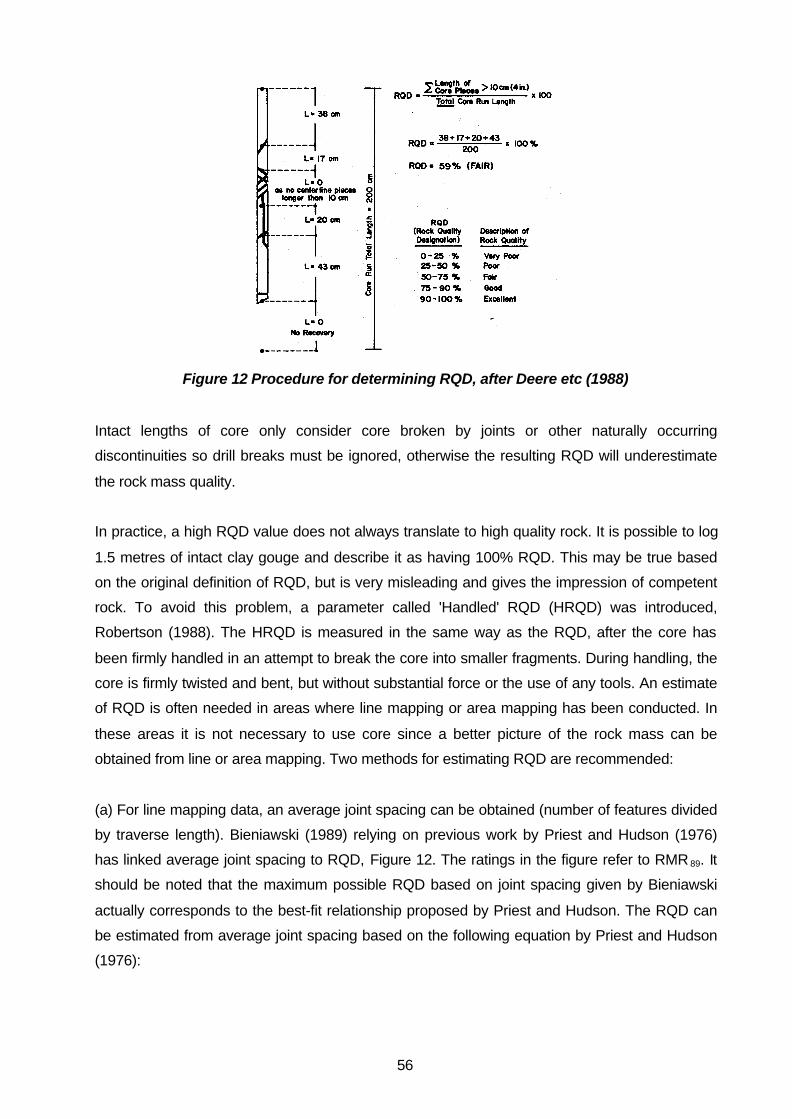
56
Figure 12 Procedure for determining RQD, after Deere etc (1988)
Intact lengths of core only consider core broken by joints or other naturally occurring
discontinuities so drill breaks must be ignored, otherwise the resulting RQD will underestimate
the rock mass quality.
In practice, a high RQD value does not always translate to high quality rock. It is possible to log
1.5 metres of intact clay gouge and describe it as having 100% RQD. This may be true based
on the original definition of RQD, but is very misleading and gives the impression of competent
rock. To avoid this problem, a parameter called 'Handled' RQD (HRQD) was introduced,
Robertson (1988). The HRQD is measured in the same way as the RQD, after the core has
been firmly handled in an attempt to break the core into smaller fragments. During handling, the
core is firmly twisted and bent, but without substantial force or the use of any tools. An estimate
of RQD is often needed in areas where line mapping or area mapping has been conducted. In
these areas it is not necessary to use core since a better picture of the rock mass can be
obtained from line or area mapping. Two methods for estimating RQD are recommended:
(a) For line mapping data, an average joint spacing can be obtained (number of features divided
by traverse length). Bieniawski (1989) relying on previous work by Priest and Hudson (1976)
has linked average joint spacing to RQD, Figure 12. The ratings in the figure refer to RMR 89. It
should be noted that the maximum possible RQD based on joint spacing given by Bieniawski
actually corresponds to the best-fit relationship proposed by Priest and Hudson. The RQD can
be estimated from average joint spacing based on the following equation by Priest and Hudson
(1976):

57
-0.1 = 100 e (0.1 1)λ λ⋅ +RQD
where λ = 1/(joint frequency)
Figure 13 Relationship between discontinuity
spacing and RQD after Bieniawski (1989)
Relating joint spacing to average RQD using Figure 13 will likely lead to conservative estimates.
Consequently the use of the RQD equation above is probably more appropriate. It should be
noted, however, that this relationship is also dependent on the direction of the traverse. For a
given average joint spacing there is a significant range in possible RQD values. RQD should not
be calculated from line mapping based on the same approach used for core (sum of un-jointed
mapped distances greater than 100mm). Line mapping distances are seldom accurate enough
to warrant this approach.
(b) For area mapping, a more three-dimensional picture of joint spacing is often available.
Palmström (1982) suggested that, when no core is available but discontinuity traces are visible
in surface exposures, the RQD may be estimated from the number of discontinuities per unit
volume. The suggested relationship for clay-free rock masses is:
RQD = 115 – 3.3Jv
Where Jv is the sum of the number of joints per unit length for all joint sets known as per
volumetric joint count. RQD is intended to represent the rock mass quality in situ and is a
directional dependent parameter whose values may change significantly depending upon the
borehole orientation. RQD has been widely used in rock mechanics around the world and has
been related to Terzaghi’s rock load factors and to rockbolt requirements in tunnels. In the
context of rock mass classification systems, the most important use of RQD has been in the
RMR and Q rock mass classification systems covered later in this literature review. The main

58
drawbacks to RQD are that it is sensitive to the direction of measurement, and it is insensitive to
changes of joint spacing, if the spacing is over 1m. The main use of RQD is to provide a
warning that the rock mass is probably of low quality.
1.2.2 Rock Structure Rating (RSR)
Rock Structure Rating (RSR) classification is a quantitative method developed by Wickham et al
(1972) for describing the quality of a rock mass and selecting appropriate support. Despite this
system being the first one to make reference to shotcrete support, most of the case histories
used in the development of this system were relatively small tunnels supported by means of
steel sets. The significance of the RSR system in the context of rock mass classification is the
introduction of the concept of rating each component to arrive at a final rating value of:
RSR = A + B + C
where parameter A relates to general assessment of geological structures; parameter B relates
to effect of discontinuity patterns and parameter C relates to groundwater inflow and joint
condition. Although the RSR classification system is not widely used today, it has played a
significant role in the development of the classification schemes that will be discussed in this
literature review.
1.2.3 Geomechanics Classification System (RMR)
Bieniawski in (1976) published a rock mass classification called the Geomechanics
Classification System or the Rock Mass Rating (RMR) system. Since then, this system has
been refined, as more case records have been examined and Bieniawski has made significant
changes in the ratings assigned to different parameters. Table 29 summarizes the evolution of
the RMR ratings until 1989 as well as the modifications to the weights assigned to each factor.
59
Table 29 RMR Ratings of Bieniawski over the years
1973 1974 1975 1976 1989RockStrength
10 10 15 15 15
RQD 16 20 20 20 20DiscontinuitySpacing
5
Separationof joints
5
Continuity ofjoints 10 10 10 10 15
GroundWater
10 10 10 15 15
Weathering 15 30 25 30Condition ofjoints
15 30 25 30
Strike andDiporientation
15
Diporientationfor tunnels
3-15 0-12 0-12 0-12
The components of the system have remained the same and are as follows:
- Uniaxial Compressive Strength (UCS) of rock material
- Rock Quality Designation, RQD
- Spacing of discontinuities
- Condition of discontinuities
- Groundwater conditions
- Orientation of discontinuities
In the application of this system, the rock mass is divided into a number of structural regions
and each region is classified separately. The final RMR value is the sum of the ratings of each
of the above parameters. A set of guidelines has been published by the author for selection of
support in tunnels in rock based on the final value of the RMR. Figure 14 shows the relationship
between the RMR value, stand-up times and maximum unsupportable spans. The main factors
that have been changed with the RMR system are the weightings given to joint spacing, joint
condition and ground water. In assessing both RQD and joint spacing, the frequency of jointing
is included twice. In the 1989 version of RMR, the weighting factor for the spacing term was
reduced and the influence of both water and joint condition was increased. A further important
modification to the RMR was in the definition of different rock mass classes (i.e. very good,
good rock, etc.).

60
Figure 14 Relationship between Stand-up time, span and RMR classification, afterBieniawski (1989)
In the latest version of the RMR system, the condition of discontinuities was further quantified to
produce a less subjective appraisal of discontinuity condition. This brings RMR closer to the Q-
system that will be described later which allows the assessment of discontinuity condition by two
independent terms, Jr and Ja. Despite efforts to specifically modify the RMR system for mining
(Laubscher (1976), Kendorski et al. (1983) etc.) most mines use one of the versions of RMR
given in Table 29. Depending on the required sensitivity and the design method used, this might
lead to discrepancies. The main advantage of the RMR system is that it is easy to use.
Common criticisms are that the system is relatively insensitive to minor variations in rock quality
and that the support recommendations appear conservative and have not been revised to
reflect new types of reinforcement.
1.2.4 Rock Tunnelling Quality Index, Q
On the basis of an evaluation of a large number of case histories of underground excavations,
Barton et al (1974) of the Norwegian Geotechnical Institute proposed a Tunnelling Quality Index
(Q) for the determination of rock mass characteristics and tunnel support requirements. The
numerical value of the index Q varies on a logarithmic scale from 0.001 to a maximum of 1,000
and is defined by:

61
r w
n a
RQD J JQ = × ×
J J SRF
where:
- RQD is the Rock Quality Designation
- Jn is the joint set number
- Jr is the joint roughness number
- Ja is the joint alteration number
- Jw is the joint water reduction factor
- SRF is the stress reduction factor
It has been suggested that RQD/Jn reflects block size, Jr/Ja reflects friction angle and Jw/SRF
reflects effective stress conditions. The main advantage to the Q classification system is that it
is relatively sensitive to minor variations in rock properties. Except for a modification to the
Stress Reduction Factor (SRF) in 1994, the Q system has remained constant. The descriptions
used to assess joint conditions are relatively rigorous and leave less room for subjectivity,
compared to other classification systems. One disadvantage of the Q system is that it is
relatively difficult for inexperienced users to apply. The Jn term, based on the number of joint
sets present in a rock mass, can cause difficulty. Inexperienced users often rely on extensive
line mapping to assess the number of joint sets present and can end up finding 4 or more joint
sets in an area where jointing is widely spaced. This results in a low estimate of Q. An important
asset of the Q system is that the case studies employed for its initial development have been
very well documented. The use of the Q system for the design of support has also evolved over
time. In particular Barton has introduced a design chart that accounts for the use of fibre-
reinforced shotcrete. This has been based on increased experience in tunnelling. For most
mining applications, however it is common to rely on the design chart shown in Figure 15.
In mining, the use of the ratio of Excavation Span/Equivalent Support Ratio (ESR) is limited. In
open stope design this term is replaced altogether by the hydraulic radius. Alternatively one can
assign different ESR values dependent on the type of opening (e.g. 5 for non-entry stopes, 1 for
Shaft etc.). As there are limited documented case studies this involves considerable judgment.
The next section looks at the weightings given to the different parameters used in the Q and
RMR classification systems, and how the two systems are related.

62
Figure 15 Design and Excavations based on the Q-System, after Barton & Grimstad(1994)
1.2.5 Comparative Rock mass Property Weightings
Both the Q and RMR classification systems are based on a rating of three principal properties of
a rock mass. These are the intact rock strength, the frictional properties of discontinuities and
the geometry of intact blocks of rock defined by the discontinuities. For the Q system, the intact
rock strength is only a factor in the context of the induced stress in the rock as defined by the
SRF term. In order to investigate the influence of these parameters, the approximate total range
in values for RMR and Q are used as a basis of comparison. Table 30 shows the degree by
which the three principal rock mass properties influence the values of the Q and RMR
classification.
Table 30 Influence of Basic Rock Mass Properties on Classification, after Milne (1988)
Q RMR76
Basic Range in Values 0.001 to 1000 8 to 100
Strength as % of the Total Range 19% 16%
Block Size as a % of the Total Range 44% 54%
Discontinuity Friction as a % of the Total Range 39% 27%
Table 30 shows the surprising similarity between the weightings given to the three basic rock
mass properties considered. Despite this it should be noted that there is no basis for assuming
the two systems should be directly related. The assessment for intact rock strength and stress is
63
significantly different in the two systems. Despite these important differences between the two
systems, it is common practice to use the rating from one system to estimate the rating value of
the other. The following equation proposed by Bieniawski (1976) is the most popular, linking Q
and RMR:
RMR = 9lnQ + 44
Referring to Table 31, it is evident that the equation above does not provide a unique correlation
between RMR and Q. Depending on the overall intact rock and discontinuity properties and
spacing, different relationships between Q and RMR can be expected. Another difference
between RMR and Q is evident in the assessment of joint spacing. If three or more joint sets are
present and the joints are widely spaced, it is difficult to get the Q system to reflect the
competent nature of a rock mass. For widely spaced jointing, the joint set parameter Jn in the Q
system appears to unduly reduce the resulting Q value.
Table 31 Correlation between RMR and Q, after Choquet and Hadjigeorgiou (1993)
Correlation Source Comments
RMR = 13.5 log Q + 43 New Zealand Tunnels
RMR = 9 ln Q + 44 Diverse origin Tunnels
RMR = 12.5 log Q + 55.2 Spain Tunnels
RMR = 5 ln Q + 60.8 South Africa Tunnels
RMR = 43.89 - 9.19 ln Q Spain Mining Soft rock
RMR = 10.5 ln Q + 41.8 Spain Mining Soft rock
RMR = 12.11 log Q + 50.81 Canada Mining Hard rock
RMR = 8.7 ln Q + 38 Canada Tunnels
RMR = 10 ln Q + 39 Canada Mining Hard rock
1.2.6 The Mining Rock Mass Rating (MRMR) system
The geomechanics classification (RMR) has been extended for different mining environments.
Initially, Laubscher and Taylor (1976) applied this technique in asbestos mines in Africa while
Ferguson (1979) used this classification for mining tunnels and haulages.
Laubscher and Taylor (1976) made some essential additional adjustments to the RMR system
to cater for diverse mining situations. The fundamental difference was the recognition that in situ
rock mass ratings (RMR) had to be adjusted according to the mining environment so that the

64
final ratings (MRMR) could be used for mine design. The adjustment parameters are given as
weathering, mining induced stresses, joint orientation and blasting effects.
Adjusted RMR parameters are as follows:
- Blasting damage adjustment (AB), (0,8-1,0),
- In situ stress and change in stress adjustment (AS), (0,6-1,2), and,
- Major faults and fractures (S), (0,7-1,0).
Adjusted RMR=RMR*AB*AS*S where: maximum value of AB*AS*S is 0,5. In recent years, there
have been some modifications and improvements to the system. Laubscher (1984) has
emphasised a comprehensive system based on a comparison between the in situ rock mass
strength and the mining induced stresses. The important key point here is that the application of
this system should be applied to an intact rock mass rather than to a broken rock mass.
Laubscher (1990) revealed that it is possible to use the ratings to determine an empirical rock
mass strength (RMS) which is adjusted as above to give a design rock mass strength (DRMS).
This figure is extremely useful when related to the stress environment and has been used for
numerical modelling. Also, these ratings provide good guidelines for mine design purposes.
In addition, Laubscher (1990) indicated in a separate study that the average numbers can be
misleading and the weakest zones may determine the response of the whole rock mass. It is,
therefore, necessary to identify narrow and weak geological features that are continuous within
and beyond the stope or pillar, and rate them separately.
The Intact Rock Strength (IRS), joint/fracture spacing, and joint condition/water must be
included into the assessment of geological parameters. The analysis of these is as follows:
Intact rock strength (IRS)
The definition of IRS is a function of uniaxial compressive strength of the rock between fractures
and joints. As mentioned before, the results of laboratory testing carried out is usually not
representative of the average rockmass values because the samples are invariably the
strongest pieces. Undoubtedly, the presence of weak and strong intact rock and deposits of
varying mineralisation affects the value of IRS for a defined zone. An average value is assigned
to the zone with the knowledge that the weaker rock will have a greater influence on the
average value. In such cases, the IRS for the weak and strong zones is determined separately,
and expressed as a ratio. Knowing the percentage of weak rock and selecting the appropriate

65
curve which defines the relationship of weak rock IRS expressed as a percentage of strong rock
IRS, the average IRS can be estimated as a percentage of strong rock IRS.
A detailed empirical chart to determine an average IRS, where the rock mass contains weak
and strong zones, was presented by Laubscher (1990).
Spacing of fractures and joints
Spacing is the distance between all the discontinuities and partings, and does not include
cemented features. Two techniques have been developed for the assessment of this parameter
(Laubscher, 1990).
a) measuring the rock quality designation (RQD) and joint spacing (JS) separately. The detailed
analysis of RQD is presented in the previous sections. In the assessment of joint spacing rating
developed by Taylor (1980), the three closest-spaced joints are used to read off the rating. The
equations for all lines defined in the chart of assessment of joint-space rating (R), for the
different number of joints, are as follows:
one joint set;
R=25*((26,4*log10*x)+45)/100
two joint sets;
R=25*((25,9*log10*xmin)+38)/100*((30*log10*xmax)+28)/100
three joint sets;
R=25*((25,9*log10*xmin)+30)/100*((29,6*log10*xint)+20)/100*((33,3*log10*xmax)+10)/100
where x=spacing*100 measured in metres
b) measuring all the discontinuities and recording these as the fracture frequency per metre. It is
possible to have a rating value for a rock mass either from a measurement of all the
discontinuities that are intersected by the sampling line or from a borehole log sheet. In
comparing these two techniques, it is concluded that the fracture frequency per metre technique
is more sensitive than the RQD for a wide range of joint spacings.
Joint condition and water
Joint condition is an assessment of the frictional properties of the joint (not fractures) and is
based on expression, surface properties, alteration zones, filling, and water. Originally, the
effect of water was catered for in a separate section; however, it was decided that the
assessment of joint condition allowing for water inflows would have greater sensitivity.
66
Adjustments
In order to estimate the value of MRMR, the rock mass value derived by the RMR system is
multiplied by an adjustment percentage as already defined in the earlier part of this section.
Weathering
Weathering must be taken into consideration in decisions on the size of an opening and the
support design. Its effect is time dependent, and influences the timing of support installation and
the rate of mining. The basic three parameters, IRS, RQD or fracture frequency per metre, and
joint condition, are affected by weathering. The relation between these parameters could be
summarised as below:
- An increasing number of fractures will result in a decreased value of RQD
- Chemical composition changes taking place have a significant effect on the IRS
- Alteration of the wall rock and the joint filling will affect the joint condition
Laubscher (1990) published a table delineating adjustment percentages related to degree of
weathering, after a period of exposure of various years.
Joint orientation
Size, shape and orientation of an excavation play a significant role in rock mass behaviour. The
attitude of the joints, and whether or not the bases of blocks are exposed, has a significant
bearing on the stability of the excavation, and the ratings must be adjusted accordingly. In his
adjustment procedure, the attitude of the joints with respect to the vertical axis of the block has
the most important role. As gravity is the most significant force to be considered (in shallow
mines), the instability of the block depends on the number of joints that dip away from the
vertical axis. A modified orientation adjustment applies to the design of pillars or stope
sidewalls. The applicability of this rating has been described in detail by Laubscher (1990).
Mining-induced stresses
Laubscher (1990) indicated that the major influences on mining induced stresses, arising as a
result of the redistribution of field (regional) stresses, are the geometry and orientation of the
excavations. The redistributed stresses that are of interest are major, minor and differences;
hence it is essential that the magnitude and ratio of these stresses are known.

67
a) Major Stress
The maximum principal stress can cause spalling of the wall parallel to its orientation, crushing
of pillars, and the deformation and plastic flow of soft zones. The deformation of soft intercalates
leads to failure of hard zones at relatively low stress levels. A compressive stress close to
perpendicular joints increases the stability of the rock mass and inhibits caving.
b) Minor Stress
The minimum principal stress plays a significant role in the stability of the sides and back of
large excavations., the sides of openings, and the major and minor apexes that protect
extraction horizons. The removal of a high horizontal stress on a large stope sidewall will result
in relaxation of the ground towards the opening.
c) Stress differences
A large difference between major and minor stresses has a significant effect on jointed rock
masses resulting in shearing along the joints. The effect increases as the joint density increases
(since more joints will be unfavourably orientated) and also as the joint condition ratings
decrease.
The factors, which should be considered in the assessment of mining-induced stresses, have
been listed by Laubscher (1990).
Blasting effects
Some adjustment would be required since the blasting operation forms new fractures and
loosens the rock mass resulting in some movement on joints. These factors vary the rating
between 80 % and 100 % depending on the technique of opening, i.e. boring, conventional
blasting, etc.
Strength of the rock mass
Laubscher (1990) emphasised that the strength of the rock mass cannot be higher than the
corrected average IRS of a zone and large specimens, i.e. the “rock mass”, will be equal to 80
% of the value obtained from laboratory tests on small specimens, if there is no joint.
68
The following empirical formula is adopted to calculate the RMS.
10080
80)(
xCxBA
RMS−=
where:
A= total rating of rock mass,
B= IRS rating,
C= IRS.
Design strength of the rock mass
The definition of the design rock mass strength (DRMS) is given as the strength of the
unconfined rock mass in a specific mining environment. Laubscher (1990) explained that the
size of the excavation will affect the zone surrounding the excavation in terms of instability
conditions. Adjustments, which relate to that mining environment, are applied to the RMS to give
the DRMS. As the DRMS is in MPa, it can be related to the mining-induced stresses. Therefore,
the adjustments are those for weathering, orientation, and blasting. It is concluded that the
value of DRMS, which can be related to the total stresses, is the unconfined compressive
strength of the rock mass.
1.2.7 The Modified Basic RMR (MBR) system
The MBR system was developed by the US Bureau of Mines to examine how a ground
classification approach could be used fruitfully in planning support for drifts in caving mines. It
follows closely the RMR system and incorporates some ideas of Laubscher. Bieniawski (1984)
explained that key differences lie in the arrangement of the initial rating terms and the
adjustment rating. It is still possible to use very preliminary geotechnical information from drill
holes. The MBR is also a multi-stage adjustment and its rating is the result of the initial stage
and is the simple sum of the raw ratings.
Bieniawski (1984) pointed out that the MBR is an indicator of rock mass competence without
regard to the type of opening constructed in it. There are three stages to the determination of
the MBR value:
The first step in using the MBR system is the collection of representative data on intact rock
strength, discontinuity density and conditions, and groundwater conditions as defined in the

69
RMR. The only difference in the application of RMR is the importance ratio of each parameter to
be considered in the evaluation. Tables and figures for ratings and adjustments are presented
by Kendorski et al., (1983).
The second stage is to consider the “development adjustments”. The objective in the
development adjustment is to initially stabilise the opening during development so that
permanent support may use its full capacity to resist the abutment loading increment. The third
stage deals with the additional deformations due to abutment loadings. After the extraction ratio
is computed, the blasting damage, termed as severe, moderate, slight, or none, is assessed,
and the induced stress adjustment is determined. The horizontal (Φ h) and vertical (Φv )
components of the stress field must be computed or estimated and the adjustment can then be
done for the appropriate effective extraction ratio, depth and stress field. The next adjustment is
for fracture orientations. The third stages are development and production adjustments. The
multiplication of these three adjustments, having a value between 0,45 and 1,0, with the MBR
will give the AMBR value.
The final stage is to consider the role of structural geology and mining geometry as defined as
“production adjustments”. The basic parameters to be considered in the development
adjustments are as follows:
Development adjustments
- blasting (AB, 0,8-1,0),
- induced stresses (AS, 0,8-1,2), and
- fracture orientation (AO, 0,7-1,0).
Production adjustments
- major structures (S, 0,7-1,1),
- distance to cave line (DC, 0,8-1,2), and
- block/panel size (PS, 1,0-1,3).
Adjusted MBR (AMBR) = MBR*AB*AS*AO
Final mining MBR (FMBR) = AMBR*DC*PS*S
Disadvantages
The MBR is an adapted version of prior work of Bieniawski and Laubscher with a modification
for caving, which is radically different from driving a tunnel. In developing the modifications and
adaptations for the MBR system, all data were collected for horizontal drifts in mines. Thus, the
MBR system is not necessarily valid for non-horizontal workings (inclines, raises, and shafts) or
for other mining methods.

70
1.2.8 The Rock Mass Index (RMi) system
The RMi system proposed by Palmstrom (1996) is based on defined inherent parameters of the
rock mass and is obtained by combining the compressive strength of intact rock and a jointing
parameter. The jointing parameter represents the main jointing features, namely block volume
(or density of joints), joint roughness, joint alteration, and joint size. Quantitatively, the RMi can
be expressed as:
RMi=σc JP.
where:
σc= the uniaxial compressive strength of intact rock measured on 50 mm samples;
JP= the jointing parameter, which is a reduction factor representing the block size and
the condition of its faces as represented by their friction properties and the size of the
joints. The influence of JP has been found by using calibrations from test results.
Because of problems in obtaining compression test results on rock masses at a scale
similar to that of typical rock works, it was possible to find appropriate data from only
eight large-scale tests and one back-analysis. These have been used to arrive at the
following mathematical expression as:
DVBjCJP 2.0=
where VB is given in m3, and D = 0 37 jC0.2
The joint condition factor is expressed as:
JC= jL( jR / jA)
where:
jL = factors for joint length,
jR = joint wall roughness and,
jA = continuity and joint surface alteration
The factors jR and jA are similar to the joint roughness number (Jr) and the joint alteration
number (Ja) respectively in the Q-system. The joint size and continuity factor (jL) has been
introduced in the RMi system to represent the scale effect of the joints.

71
The RMi is numerical and therefore differs from earlier general classifications of rock masses,
which are mainly descriptive or qualitative. Palmstrom (1996) discusses three applications of the
RMi. These include;
- determination of the constants in the Hoek-Brown failure criterion for rock masses,
- assessment of stability and rock support in underground excavations, and
- quantification of the classification applied in the New Austrian Tunnelling Method
(NATM).
Some of the benefits and limitations of the RMi system are explained by Palmstrom (1996) as
follows:
- The RMi will significantly improve the use of geological input data, mainly through its
systematic use of well-defined parameters in which the three-dimensional character of rock
masses is represented by the block volume.
- The RMi can easily be used for rough estimates when only limited information on the
ground conditions is available, for example, in the early stages of a project, where rough
estimates are sufficient.
- The RMi is well suited for comparisons and exchange of knowledge between different
locations. In this way it can improve communication between those involved in rock
engineering and design.
- The RMi offers a platform suitable for engineering judgement. RMi is a general parameter
that characterises the inherent strength of rock masses, and may be applied in engineering
design. Because the RMi is composed of real block volumes and common joint parameters
for rock masses, it is easy to relate it to field conditions. This is important in applying
engineering judgement.
- The RMi system covers a wide spectrum of rock mass variation, and therefore has
possibilities for wider applications than other rock mass classification and characterization
systems used today.
Any attempt to mathematically express the variable structures and properties of jointed rock
masses in a general failure criterion may result in complex expressions. By restricting the RMi to
uniaxial compressive strength alone, it has been possible to arrive at the relatively simple
expressions in the above equations. Because simplicity has been preferred in the structure as

72
well as in the selection of parameters in RMi, such an index may result in inaccuracy and
limitations. The main limitations relate to:
- The range and types of rock masses covered by the RMi. Both the intact rock material and
the joints exhibit great directional variations in composition and structure, resulting in a
large range in compositions and properties of rock masses. It is not possible to characterise
all of these combinations in one single number. Nevertheless, the RMi probably
characterises a wider range of materials than most classification systems.
- The accuracy in the expression of RMi. The value of the jointing parameter (JP) is
calibrated from a few large-scale compression tests. Both the evaluation of the various
factors (jR, jA and Vb) used in obtaining JP and the size of the samples tested, which in
some of the cases had a small number of blocks, may be sources of error in the expression
for JP. Therefore, the value of RMi found may be approximate. In some cases, however,
errors in the various parameters may partly neutralise each other.
- The effect of combining parameters that vary in range. The parameters used to calculate
the RMi generally will express a certain range of values. As with any classification system,
combining such variables may cause errors. In some cases, the result is that the RMi may
be inaccurate in its characterisation of the strength of the complex and varied assemblage
of materials and defects that constitute a particular rock mass. For these reasons, the RMi
may best be considered as a relative index in its characterisation of the rock mass strength.
1.3 Rock mass classification for coal mining
The original RMR classification system was based on case histories drawn from civil
engineering. As a result, the system was regarded by the mining industry as conservative and
several changes were made to make the system more applicable to mining applications. A
Modified Rock Mass Rating (MRMR) was presented by Laubscher (1977, 1984), Laubscher and
Taylor (1976) and Laubscher and Page (1990).
Rock mass classification systems, specifically Q-system and RMR have been widely applied for
tunnels in civil engineering and in mining. The first attempt to apply these systems in coal
mining was made by Djahanguiri (1978) in rock mechanics study of underground mining of a
thick coal seam in Wyoming. Subsequent to that, Bieniawski, Rafia and Newman (1979) used
the Rock Structure Rating (RSR), Q-system and RMR to study the coal mine roof conditions

73
affected by mining with an automated extraction system (AES) developed by the National Mine
Service Co. with the U.S. Bureau of Mine (1979).
The authors concluded that the Geomechanics classification systems were useful in the
assessment of roof conditions but needed to be modified for application in coal mine roof rating
as follows:
- Reduce the number of classification parameters
- Inclusion of effects of field stresses and
- Correlating roof support requirements with rock mass classes.
The three problems experienced by Bieniawski et al (1979) that for evaluating coal mine roof
conditions using the geomechanics classification systems were:
a) The lack of geotechnical data from in-mine engineering, geological mapping and core
logging needed as input parameters for the classification systems.
b) The need for more information on the relationship between the stand-up time and the
span of coal mine roof, so that the chart in Figure 14 could be applied with greater
confidence to U.S. coal mining.
c) The need for simplification of classification systems for coal mining by modifying them as
already discussed above.
Several other coal mine roof classification systems have been proposed. Hylbert (1978) devised
a roof characterization scheme based entirely on geology, i.e., lithologic and structural features.
Four roof categories were defined based on whether discontinuities were present or a
sandstone channel was in contact with a shale zone. Instances or roof falls were then related to
each category. In many instances, stastical approaches have been used in coal roof
classification to link geological parameters with categories of mine roof such as good, moderate,
bad and fallen. Support recommendations were then made for each category of roof. Most of
these methods have not been well documented and are limited to application to areas where
they originated.
The geomechanics classification systems have also been applied in Indian Coal Mines for
support selection. Sinha & Venkateswarlu (1985) modified the Bieniawski’s RMR system to a
new CMRS classification applicable to Indian mines. The non-applicability of the Q-system and
RMR approaches for tabular mining is related to the parameters used in the evaluation and to
those excluded. The Q-system gives more importance to joint attributes whereas in coal

74
measure strata bedding planes play a greater role. The Stress Reduction Factor, SRF values
were also found not relevant to Indian coal mining stress fields.
The CMRS was developed by taking into consideration the mining conditions in Indian coal
mines. Statistical analyses of geological parameters of the roofs were done to determine their
relative importance. The five parameters selected were the RDQ, rock strength, groundwater
seepage, rock weatherability and structural features. Whilst the other parameters are similar to
that of Bieniawski’s RMR, emphasis was given on weatherability and structural features which
were the main factors contributing in roof problems in India. The ratings were given separately
for each rock type in the immediate roof bed. The RMR for the whole roof was obtained by
weighting the RMR of each bed with its thickness to get the combined RMR. This system was
applied to 47 coal mines in India and the support recommendations have been documented to
be successful.
75
2.0 References
Barton, N. 1979. Suggested Methods for the Quantitative Description of Discontinuities in Rock
Masses International Journal of Rock Mechanics and Mining Sciences & Geomechanics
Abstracts , Vol. 15 No 6: 319–368.
Barton, N., Lien, R., Lunde J. (1974). Engineering classification of rock masses for the design
of tunnel support. Rock mechanics 6, 189-236.
Bieniawski, Z.T. 1973. Engineering classification of jointed rock masses. The civil engineer in
South Africa, December.
Bieniawski, Z.T. 1976. Rock mass classification in rock engineering. Proceedings of the
symposium on exploration for rock engineering, Johannesburg, November 1976, 97-106.
Bieniawski, Z.T. 1984. Rock Mechanics design in mining and tunnelling, A.A. Balkema,
Rotterdam.
Brady, B.H.G., Brown, E.T. 1985. Rock mass structure. Rock Mechanics for Underground
Excavations, 48-85.
Brown, E.T. 1980. Rock Characterisation Testing and Monitoring – ISRM Suggested Methods.
Published for the Commission on Testing Methods International Society for Rock Mechanics by
Pergamon Press Oxford, 211 pp.
Brown, E.T. 1981. Rock characterisation, testing and monitoring – ISRM suggested methods,
Pergamon Press, Oxford, 211p.
Brummer, R.K. 1987. Fracturing and deformation at the edges of tabular gold mining
excavations and the development of a numerical model describing such phenomena. Ph.D.
Thesis Rand Afrikaans Univ., Johannesburg.
Brummer, R.K.1988. Active method to combat the rockburst hazard in South African gold
mines. CARE ’88, Conference Applied Rock Engineering. Newcastle upon Tyne, London, 35–
43.

76
Buddery, P. S. and Oldroyd, D. C. (1992), Development of roof and floor classification
applicable to collieries. Eurock’92. Thomas Telford, London.
Deere, D.U., Hendron A.J. Jr., Patton F.D. and Cording E.J. (1967). Design of Surface and
Near Surface Construction in Rock. In Failure and Breakage of Rock. C. Fairhurst ed. Society of
Mining Engineers of AIME, New York, pp. 237-302.
Department of Minerals and Energy Affairs (2000). Mineral production and sales statistics,
2000.
Hoek, E. and Brown E.T. (1980). Underground Excavations in Rock, p. 527. Institution of
Mining and Metallurgy, London.
Karmis M. and Kane W. (1984). An analysis of the geomechanical factors influencing coal
mine roof stability in APPALACHIA. Proceedings of the second international conference on
stability in underground mining. Lexington, KY pp. 311-328.
Kendorski, F. R., Cummings, Z.T., Bieniawski and Skinner E. (1983). Rock mass
classification for block caving mine drift support. In Proc. 5th Int. Congress Rock. Mech. ISRM,
Melbourne pp. B51-B63.
Lang, B., Pakalnis R., and Vongpaisal S. (1991). Span Design in wide cut and fill Stopes at
Detour Lake Mine. 93rd Annual General Meeting: Canadian Institute of Mining, Vancouver,
paper # 142.
Laubscher, D.H, Taylor, H.W. 1976. The importance of geomechanics classification of jointed
rock masses in mining operations. Exploration for rock engineering, ed. Z.T. Bieniawski, A.A
Balkema, Rotterdam, Vol. 1, 119-128.
Laubscher, D.H. 1975. Class distinction in rock masses. Coal, Gold, and Base Minerals of S.
Afr., Vol. 23, No. 6, 37-50.
Laubscher, D.H. 1984. Design aspects and effectiveness of support systems in different mining
conditions. Trans. Inst. Min. Metall. Vol. 93.
Laubscher, D.H. 1990. A geomechanics classification system for the rating of rock mass in
mine design. Journal of the South African institute of mining and metallurgy, vol. 90, no. 10.
257-273, October.
77
Mark, C. 1999. Ground Control in South African Coal Mines, a U.S. perspective. National
Institute for Occupational Safety and Health, Pittsburgh, PA.
Mark, C., Chase, F., Molinda, G. 1994. Design of Longwall Gate Entry Systems Using Roof
Classification. New Technology For Ground Control, Proceedings: USBM Technology Transfer
Seminar, Washington D.C., pp. 5-17.
Milne, D. (1988). Suggestions for standardization of rock mass classification. MSc Dissertation,
Imperial College, University of London, pp. 123.
Molinda, G.M., and Mark, C., 1994. Coal Mine Roof Rating (CMRR): A Practical Rock Mass
Classification For Coal Mines. Information Circular 9387, Pittsburgh Research Center, U.S.
Bureau of Mines, Pittsburgh, PA. pp. 1-33
Palmstrom, A. 1996. Characterising rock masses by the RMi for use in practical rock
engineering. Part 1: The development of the Rock mass index (RMi). Tunnelling and
underground space technology, vol. 11, No. 2, 175-188.
Priest, S.D. and Hudson J.A. (1976). Estimation of discontinuity spacing and trace length
using scan line surveys. Int. J. Rock Mech. Min. Sci and Geomech., Vol. 18, pp. 183-197.
Robertson, A.M., (1988). Estimating Weak Rock Strength, AIME-SME Annual Meeting,
Phoenix, AZ., Preprint #88-145.
Samrass 2000, South African Mines Reportable Accidents Statistics System, 2000.
Sinha A. and Venkateswarlu Y. (1986). Geomechanics classification for support selection in
Indian coal mines – case studies. Proceedings of the fifth international IAEG congress. Buenos
Aires, pp. 159-164.
Terzaghi, K. 1946. Rock defects and loads on tunnel support. Rock tunnelling with Steel
Support. Commercial Shearing Co., Youngstown, Ohio.15-99.
Van der Merwe, J. N. (2001), Personnel communication.
Van wyk, J (2001), Personnel communication
Wickham, G.E., Tiedemann, H.R. and Skinner, E.H. (1974). Ground support prediction model,

78
Appendix B: Section Performance Rating And Section
Physical Rating Forms
79
SECTION PERFORMANCE RATING FORM FORM : MF02 Rev 1.4 (16/03/2001) Mine : ____________________ Seam : ______________ Section : ___________________ Date : ________________________ Panel : ____________________ Visited by : __________________ Bolt type : ___________________ Mining method : _________________________ Roofbolter Type:_____________________
FOG Stats (Previous 6 months)
Fatal -10 Lost time Injury -7 High Potential Incident (eg. Major fall of supported ground)
-5 Property Damage -3 None 5
Temporary support (includes onboard
temporary support)
Not being used -5 Not used due to incorrect length/breakdown
-3 Not observed / no clear evidence of incorrect use
3 Not used but system such that no exposure to
unsupported roof
4 Correctly spaced and properly set against
roof (on board)
5
Slip Support Very poor (more than 2 slips not detected or bolted)
-8 Poor – 1 or 2 slips not detected or bolted
-5 All slips identified but bolt length incorrect / slips not plotted on
miner’s plan
-3 No slips or slips well bolted but not marked
4 Good. All slips correctly supported
5
Horizon control Roof control poor at pillar corners, small brows not trimmed
down or bolted
-5 Very poor – numerous (>4 ) brows created
-3 Poor – 4 or less brows created Frozen coal left against roof
-1 No brows created but thin shale band left in
immediate roof
1 Horizon control good – no brows created
3
Brow Support Very poor – 3 or more brows not supported
-5 Poor – 1 or 2 brows not supported
-3 Low step down middle of roadway / split due to dipping seam – bolts on wrong side.
-1 Brows supported but spacing or bolt length
incorrect
1 Good- brows well supported with correct
length bolts
2
Cutting direction (% cut off-line)
> 12 % -5 9.1 – 12 % -2 6.1 – 9 % 0 3 – 6 % 4 < 3 % 5
Road width control Average > 1m -5 Average 0.5 to 1m -3 Average 0.2 to 0.5m -1 Averaged < 0.2m 0 On design width 5 Intersection cutting * Diagonal >3m deviation -5 Diagonal 2 to 3m deviation -2 Diagonal 1 to 2m deviation 0 Diagonal <1m deviation 2 Correct length 5
* Intersection corner to corner distances for various bord widths 7 = 9.8m 6.5 = 9.1m 6.0 = 8.4m 5.5 = 7.7m Cutting beyond
unsupported slips CM seen cutting beyond slips -5 CM inferred to have cut beyond
slip -3 Not observed / No clear evidence of CM cutting beyond slips 4 CM clearly not cutting
beyond slips 5
Support of intersections Seen to be cutting into unsupported intersections
-5 Pre-supported intersection not holed properly
0 All intersections supported before being cut
1 All intersections supported before being cut and extra bolts in enlarged intersections / over-cut areas
3
Bolt installation quality Crimps not broken/plates loose/broken bolts not replaced on 10% or more of installations
-10 Crimps not broken/plates loose/broken bolts not replaced
< 10% of installations
-2 Protruding thread length variable 0 Most defective or damaged bolts replaced and 95% or more of installations to standard
5
Roofbolting Controls (may be added)
Torque correctly set on machine 2 Hole length control correct 2 Adequate drill bit size control 2 Correct resin and not time expired 2
Support - General Incorrect support type or length being used
-8 Incorrect colour coding -3 Extra bolts in hollow roof areas 2 Additional support always installed (e.g. “W” straps on slip/timber in sliped areas)
3
Maximum cutting distance ahead of
support
> 2m more than stipulated maximum
-5 < 2m more than stipulated maximum
0 Not observed / No clear evidence of cutting too far
4 Clearly not exceeding stipulated maximum 5
People working under unsupported roof
People seen to be working under unsupported roof/clear evidence
of people working under unsupported roof
-10 People inferred to be working under unsupported roof
-5 Not observed / no clear evidence that people are working under
unsupported roof
4 Clear evidence that people are not working under unsupported roof
5
General (these ratings may be added)
Non adherence to approved mining layout
-10 Tell tales correctly installed and monitored
5 Sufficient sounding sticks and pinch bars of correct length
2 Lines and bolt positions definitely not marked ahead of support
2
Roof inspections and sounding
Inspections and sounding clearly not done to standard
-10 Inspection and sounding suspected to be sub-standard
-5 Inspection and sounding done throughout face areas only
3 Roof and sidewalls inspected and sounded well according to standard
5
Barricades and last row of bolt indicators
Not installed -5 > 2 Missing -3 2 or less missing, rest well installed 2 Unsafe / unsupported roof well demarcated 5

80
Mine : __________________________________ Seam : ________________ Section : _____________________ Date : _________________________________________
Bolt spacing (systematic) Average spacing more (>0.1m) than stipulated -5 Average spacing within 0.1m of stipulated 5 Average spacing less (< 0.1m) than stipulated 6 Bolt spacing (discontinuities) Average spacing more (>0.1m) than stipulated -5 Average spacing within 0.1m of stipulated 5 Average spacing less (< 0.1m) than stipulated 6
Barring Numerous loose pieces -2 Occasional loose pieces -1 Conditions such that no barring needed
1 General standard of barring very good
3
Mining height control Incorrect roof horizon being mined. Coal beam thickness not being monitored
-5 Not applicable, mining full seam to sandstone roof or coal roof in excess of 1m thick.
4 Correct roof horizon being maintained and where applicable, coal beam thickness properly recorded
5
Training No essential personnel have attended SC course
-5 Few essential personnel have attended SC course
-3 Most essential personnel have attended SC course
3 All essential personnel have attended SC course
5
Waiting place (These ratings may be added)
Safely sited 2 Recommended height report available
2 Correct support rule on notice board 2 Section management plan up to date 2
POINTS IN TABLE ARE A GUIDE ONLY ADJUST AS REQUIRED, e.g., IF NOT SATISFIED WITH PERFORMANCE REDUCE POINT ACCORDINGLY PREVIOUS RATING : ____________________ ABBREVIATIONS : N/A = NOT APPLICABLE N/M = NOT MEASURED N/C = NOT CHECKED
Total (max 100)
Section Performance Rating : Very poor <30% Poor 30-45% Moderate 46-60% Good 61-75% Very good 76-90% Excellent.>90% Recommendations / Action Plan : ________________________________________________________________________________________________________________________ _______________________________________________________________________________________________________________________________________________________ _______________________________________________________________________________________________________________________________________________________ _______________________________________________________________________________________________________________________________________________________ _______________________________________________________________________________________________________________________________________________________ _______________________________________________________________________________________________________________________________________________________ _______________________________________________________________________________________________________________________________________________________ _______________________________________________________________________________________________________________________________________________________ _______________________________________________________________________________________________________________________________________________________ Recommendations made by:____________________________________________ Designation:___________________________________ Date:_______________________ Received by:_________________________________________________________ Designation:___________________________________ Date:_______________________

81
Mine : ________________________________ Section : __________________________ Date : ______________ COMMENTS :
1. Spot check/s on spacing between rows of bolts (systematic support): -____________________________________________ ______________________________________________________________________________________Avg:___________
2. Spot check/s on spacing between bolts along slips :_____________________________________________Avg:___________
3. Spot check/s on slip frequency : ____________________________________________________________Avg:___________
4. Spot check/s on intersection diagonal (split turn off) : __________________________________________________________
5. Bord width spot check/s : ________________________________________________________________________________
6. Tell – Tale Readings (If applicable): _______________________________________________________________________
7. Spot checks on Sounding Stick and Pinch Bars:______________________________________________________________
8. Spot checks on bolt installation quality: ____________________________________________________________________
9. Spot check on pillar corner brows:_________________________________________________________________________
10. Check on SC course attendance : S/Boss Miner R/Bolt 1
R/Bolt 2 CM 1 CM 2
11. Main recommendations from previous visit : ---______________________________________________________________ _____________________________________________________________________________________________________________ _____________________________________________________________________________________________________________ _____________________________________________________________________________________________________________ _____________________________________________________________________________________________________________ _____________________________________________________________________________________________________________

82
BORD AND PILLAR SECTION PHYSICAL RISK RATING FORM FORM : MF01 Rev1.4 (16/03/2001) Mine : ______________________ Seam : ______________________________ Section : ___________________________ Panel : _____________________________ Date : _________________________ Completed By __________________________ Signed: ____________________________ Suggested risk categories : <30 Special Area 31 to 60 Moderate Area >60 Good Area
Points Section Performance Rating
< 30% -5 30 – 45% -2 46 – 60% 0 61 – 75% 1 76 – 90% 3 > 90% 5
Mining Method
Stone Development / B10
-5 Top Coaling -2 Bottom Coaling 3 Longwall Development
5 CM bord and pillar 8 Conv. Bord & pillar
10
Roof Lithology Shale/Mudstone 0 Shale / Sandstone interlaminated
2 Coal and shale 4 < 0.5m Coal 6 > 0.5m Coal 8 Massive sandstone
10
Roof Conditions
Very poor (falls frequently some time after being exposed)
-5 Poor (falls occasionally some time after being exposed)
-2 Variable (conditions change unpredictably from area to area)
0 Moderate (occasional slabbing after being exposed)
3 Fairly Good (occasional hollow areas identified)
8 Good (no hollow or false roof areas detected)
10
Pillar Conditions
Highly jointed <2m spacing / burnt coal
-5 Moderately jointed >2m spacing
-2 Frequent spalling 0 Occasional spalling 1 Occasional pillar corner deterioration
3 Good pillar conditions
5
Discontinuities Within 10m of a dyke or fault
-5 Slips less than 5m apart -2 Slips 5 to 10m apart or within 50m of a dyke or fault
0 Slips 10 to 20m apart
3 Slips more than 20m apart
8 No slips 10
Influence of Discontinuities
Severe (falls > 1m common some time after being exposed)
-10 Very strong (falls > 1m high common immediately after being exposed)
-7 Strong (falls < 1m high some time after being exposed)
0 Moderate (falls <1m high immediately after being exposed)
3 Slight (small falls < 0.2m immediately after being exposed)
7 Negligible (no discernable influence on roof stability) (no slips =10)
9
Other Geological Conditions
Severe weathering 0 Slight weathering or false roof
1 Wet roof or coal floor 2 Floor / roof rolls or dipping seam
3 Floating stone / soft floor
2 Damp roof No geological problems (5)
3
Mining Height > 5m -5 4.5 to 5m -2 4.0 to 4.5m 2 3.0 to 4m 3 2.0m to 3m 4 < 2.m 5
Systematic Support
None 0 Intersection only 2 2.5m grid 6 2m grid 8 1.5m grid 10 1m grid 12
Systematic Support Type
Point Anchor 0.6m
-4 Point Anchor 0.9m
-2 Point Anchor 1.2m
2 Point Anchor ≥ 1.5m
5 M16 Full Column Resin ≥ 1.5m
6 M20 Full Column Resin ≥ 1.5m
7
General (Must be added)
Signs of horizontal stress roof failures e.g. guttering / large falls without slips
-10 Shallow workings <40m Experimental or trial roof support / panel layout
-5 Within 50m of surface water course or dam/pan or above low SF workings
0 General back-bye conditions (Good 5 / Fair 0 / poor -5).
5 0
-5
Tell tales or other roof performance monitoring method not required
4 Tell tales being systematically installed
5
Advance per month (m)
> 1800 2 1600 to 1800 4 1400 to 1600 6 1000 to 1400 8 600 to 1000 10 < 600 12
PREVIOUS RATING : TOTAL
Received by : Designation : ______________________ Date : _________________________ Summary of changed conditions / Remarks : ___________________________________________________________________________________________________ ____________________________________________________________________________________________________________________________________________ Remedial Action/s to be taken : _______________________________________________________________________________________________________________