Financial Analysis Project – Final Paper
45
RUNNING HEAD: FINANCIAL ANALYSIS PROJECT – FINAL PAPER 1 Financial Analysis Project – Final Paper Jennifer M. Harding Cardinal Stritch University MBA 521 August 28 th , 2014
Transcript of Financial Analysis Project – Final Paper

RUNNING HEAD: FINANCIAL ANALYSIS PROJECT – FINAL PAPER 1
Financial Analysis Project – Final Paper
Jennifer M. Harding
Cardinal Stritch University
MBA 521
August 28th, 2014

FINANCIAL ANALYSIS PROJECT – FINAL PAPER 2
Purpose of Analysis
All managers need to understand where value comes from in
their firm. The purpose of this analysis is to identify the
financial strategy and performance of this particular publically
traded company. The process of understanding the risk and
profitability of a company by analyzing reported financial info,
especially annual and quarterly reports are vital to identifying
the company’s overall financial performance. I wanted to analyze
Coca Cola because the company has so much history and is one of
the most recognizable brands in the world. I have always enjoyed
researching food and beverage companies because of my background
in the food service industry. I have always been fascinated by
brand power of food and beverages and the corporations that are
behind particular brands and products.
Company Background and History

FINANCIAL ANALYSIS PROJECT – FINAL PAPER 3
The Coca-Cola Company is an American multinational beverage
corporation and manufacturer, retailer, and marketer of
nonalcoholic beverage concentrates and syrups. Headquartered
in Atlanta, Georgia, the company is best known for its flagship
product, Coca-Cola, invented in 1886 by pharmacist John Stith
Pemberton in Columbus, Georgia. The Coca-Cola formula and brand
was bought in 1889 by Asa Griggs Candler (December 30, 1851 -
March 12, 1929), who incorporated The Coca-Cola Company in 1892
(Wikipedia, 1). The company operates a franchised distribution
system dating from 1889 where The Coca-Cola Company only produces
syrup concentrate which is then sold to
various bottlers throughout the world who hold an exclusive
territory (Wikipedia, 2). The Coca-Cola Company owns its anchor
bottler in North America, Coca-Cola Refreshments. Muhtar A.
Kent is a Turkish-American business executive. He is currently
the Chairman and Chief Executive Officer (CEO) of The Coca-Cola
Company. He was appointed to the position of Chief Executive
Officer of the Company in 2008 and became Chairman of the Board
in 2009 (Wikipedia, 1).
Major Operations

FINANCIAL ANALYSIS PROJECT – FINAL PAPER 4
The Coca-Cola system is not a single entity from a legal or
managerial perspective, and the company does not own or control
all of their bottling partners. While many view the company as
simply "Coca-Cola," their system operates through multiple local
channels. The Company manufactures and sells concentrates,
beverage bases and syrups to bottling operations, owns the brands
and is responsible for consumer brand marketing initiatives. Coca
Cola’s bottling partners manufacture, package, merchandise and
distribute the final branded beverages to Coca Cola customers and
vending partners, who then sell their products to consumers
(Wikipedia, 2).
All bottling partners work closely with customers (grocery
stores, restaurants, street vendors, convenience stores, movie
theaters and amusement parks, etc.) to execute localized
strategies developed in partnership with Coca Cola. Customers
then sell their products to consumers at a rate of more than 1.9
billion servings a day.
In January 2006, company-owned bottling operations were
brought together to form the Bottling Investments operating

FINANCIAL ANALYSIS PROJECT – FINAL PAPER 5
group, now the second-largest bottling partner in the Coca-Cola
system in terms of unit case volume.
Distribution
Coca-Cola’s portfolio features 17 billion-dollar brands
including Diet Coke, Fanta, Sprite, Coca-Cola Zero, Vitaminwater,
Powerade, Minute Maid, Simply, Georgia and Del Valle. Globally,
Coca Cola is the number one provider of sparkling beverages,
ready-to-drink coffees, and juices. Through the world’s largest
beverage distribution system, consumers in more than 200
countries enjoy Coca Cola beverages at a rate of 1.9 billion
servings a day (Profile, 2).
Beverages bearing the trademark "Coca-Cola" or "Coke"
accounted for approximately 78% of the company's total gallon
sales. According to the 2007 Annual Report, Coca-Cola had gallon
sales distributed as follows:
43% in the United States
37% in Mexico, India, Brazil, Japan and the People's Republic
of China
20% spread throughout the rest of the world

FINANCIAL ANALYSIS PROJECT – FINAL PAPER 6
In 2010, it was announced that Coca-Cola had become the first
brand to top £1 billion in annual UK grocery sales. Coca-Cola is
the best-selling soft drink in most countries, and was
recognized as the number one global brand in 2010. While the
Middle East is one of the only regions in the world where Coca-
Cola is not the number one soda drink, Coca-Cola nonetheless
holds almost 25% market share (to Pepsi's 75%) and had double-
digit growth in 2003 (Profile,1). Similarly, in Scotland, where
the locally produced Irn-Bru was once more popular, 2005 figures
show that both Coca-Cola and Diet Coke now outsell Irn-Bru.
In Peru, the native Inca Kola has been more popular than Coca-
Cola, which prompted Coca-Cola to enter in negotiations with the
soft drink's company and buy 50% of its stakes. In Japan, the
bestselling soft drink is not cola, as (canned) tea and
coffee are more popular. As such, The Coca-Cola Company's
bestselling brand there is not Coca-Cola, but Georgia.
Since 1919, Coca-Cola has been a publicly traded
company. One share of stock purchased in 1919 for $40, with all
dividends reinvested, would be worth $9.8 million in 2012, a
10.7% annual increase, adjusted for inflation (Wikipedia, 1). In

FINANCIAL ANALYSIS PROJECT – FINAL PAPER 7
1987, Coca-Cola once again became one of the 30 stocks which
makes up the Dow, the Dow Jones Industrial Average, which is
commonly referenced as the performance of the stock market. It
had previously been a Dow stock from 1932 to 1935. Coca-Cola has
paid a dividend, increasing each year for 49 years (Company
Records, 2). Stock is available from a direct purchase program,
through Computershare Trust Company, but unlike many programs,
has investment fees.
Competition
Coca-Cola competes in the nonalcoholic beverages segment of
the commercial beverages industry. The nonalcoholic beverages
segment of the commercial beverages industry is highly
competitive, consisting of numerous firms. These include firms
that, like Coca-Cola, compete in multiple geographic areas, as
well as firms that are primarily regional or local in operation.
Competitive products include numerous nonalcoholic sparkling
beverages; various water products, including packaged, flavored
and enhanced waters; juices and nectars; fruit drinks and
dilutables (including syrups and powdered drinks); coffees and
teas; energy and sports and other performance-enhancing drinks;

FINANCIAL ANALYSIS PROJECT – FINAL PAPER 8
dairy-based drinks; functional beverages; and various other
nonalcoholic beverages (Profile, 2). These competitive beverages
are sold to consumers in both ready-to-drink and other than
ready-to-drink form. In many of the countries in which Coca-Cola
does business, including the United States, PepsiCo, Inc., is one
of their primary competitors. Other significant competitors
include, but are not limited to, Nestlé, Dr Pepper Snapple Group,
Inc., Groupe Danone, Kraft Foods Inc. and Unilever. In certain
markets, Coca-Cola’s competition includes beer companies. The
company also competes against numerous regional and local firms
and, in some markets, against retailers that have developed their
own store or private label beverage brands (Profile, 3).
Competitive factors impacting Coca-Cola’s business include,
but are not limited to, pricing, advertising, sales promotion
programs, product innovation, increased efficiency in production
techniques, the introduction of new packaging, new vending and
dispensing equipment, and brand and trademark development and
protection (Company Records, 1). Coca-Cola’s competitive
strengths include leading brands with a high level of consumer
acceptance; a worldwide network of bottlers and distributors of

FINANCIAL ANALYSIS PROJECT – FINAL PAPER 9
Company products; sophisticated marketing capabilities; and a
talented group of dedicated associates. Coca-Cola’s competitive
challenges include strong competition in all geographic regions
and, in many countries, a concentrated retail sector with
powerful buyers able to freely choose among Company products,
products of competitive beverage suppliers and individual
retailers' own store or private label beverage brands (Company
records, 2).
Working capital
A measure of both a company's efficiency and its short-term
financial health. Working capital (abbreviated WC) is a
financial metric which represents operating
liquidity available to a business, organization or other
entity, including governmental entity. Along with fixed assets
such as plant and equipment, working capital is considered a
part of operating capital.
Working capital = current assets – current liabilities
Although working capital is improving year over year, the
company is still underperforming compared to industry average.
Current ratio

FINANCIAL ANALYSIS PROJECT – FINAL PAPER 10
A liquidity ratio that measures a company's ability to pay
short-term obligations
Current ratio=Current Assets/Current Liabilities
Coca-Cola’s current ratio is increasing year after year. The
company is over performing in its industry.
Quick ratio
An indicator of a company’s short-term liquidity. The quick
ratio measures a company’s ability to meet its short-term
obligations with its most liquid assets. For this reason, the
ratio excludes inventories from current assets, and is
calculated as follows: The quick ratio measures the dollar
amount of liquid assets available for each dollar of current
liabilities. Thus, a quick ratio of 1.5 means that a company
has $1.50 of liquid assets available to cover each $1 of
current liabilities. The higher the quick ratio, the better
the company's liquidity position.
Quick ratio = (current assets – inventories) / current
liabilities, or
= (cash and equivalents + marketable securities
+ AR) / current liabilities

FINANCIAL ANALYSIS PROJECT – FINAL PAPER 11
Coca-Cola’s quick ratio is improving year after year. The
company is over performing in its
industry.
Accounts receivable turnover
Accounts receivable turnover is the ratio of net credit sales
of a business to its average accounts receivable during a
given period, usually a year. It is an activity ratio which
estimates the number of times a business collects its average
accounts receivable balance during a period.
Accounts receivable turnover = Net Credit Sales / Average
Accounts Receivable
Coca-Cola’s accounts receivable turnover has been slightly
increasing. The company has been over performing in its
industry.
Average collection period (number of days’ sales in
receivables)
The approximate amount of time that it takes for a business to
receive payments owed, in terms of receivables, from its
customers and clients.

FINANCIAL ANALYSIS PROJECT – FINAL PAPER 12
Calculated as: Average Collection Period = (Days x AR) /
Credit Sales
Where:
Days = Total amount of days in period
AR = Average amount of accounts receivables
Credit Sales = Total amount of net credit sales during period
The average collection period has been slightly improving over
the last 3 years. The company is underperforming in its
industry however, Coca-Cola’s operation runs much differently
than industry competitors due to its emphasis in syrup
distribution, directly affecting this ratio.
Inventory turnover
A ratio showing how many times a company's inventory is sold
and replaced over a period. The days in the period can then be
divided by the inventory turnover formula to calculate the
days it takes to sell the inventory on hand or "inventory
turnover days."
Inventory Turnover = Sales / Inventory OR
Inventory Turnover = COGS / Average Inventory

FINANCIAL ANALYSIS PROJECT – FINAL PAPER 13
Coca-Cola’s inventory turnover has been decreasing year over
year. The company has been underperforming in its
industry.
Ratio of liabilities to stockholder’s equity
A measure of a company's financial leverage calculated by
dividing its total liabilities by stockholders' equity. It
indicates what proportion of equity and debt the company is
using to finance its assets.
Debt/Equity Ratio = total liabilities / stockholder’s equity
If the debt/equity ratio for Coca-Cola = 1.5 it means that for
every dollar that shareholders
own, Coca-Cola owes $1.50 to creditors.
This ratio has been worsening year over year and the company
is also underperforming in its
industry.
Ratio of fixed assets to long-term liabilities
The fixed-assets- to long-term-liabilities ratio is a way of
measuring the solvency of a company. A company's long-term
debts are often secured with fixed assets, which is why
FINANCIAL ANALYSIS PROJECT – FINAL PAPER 14
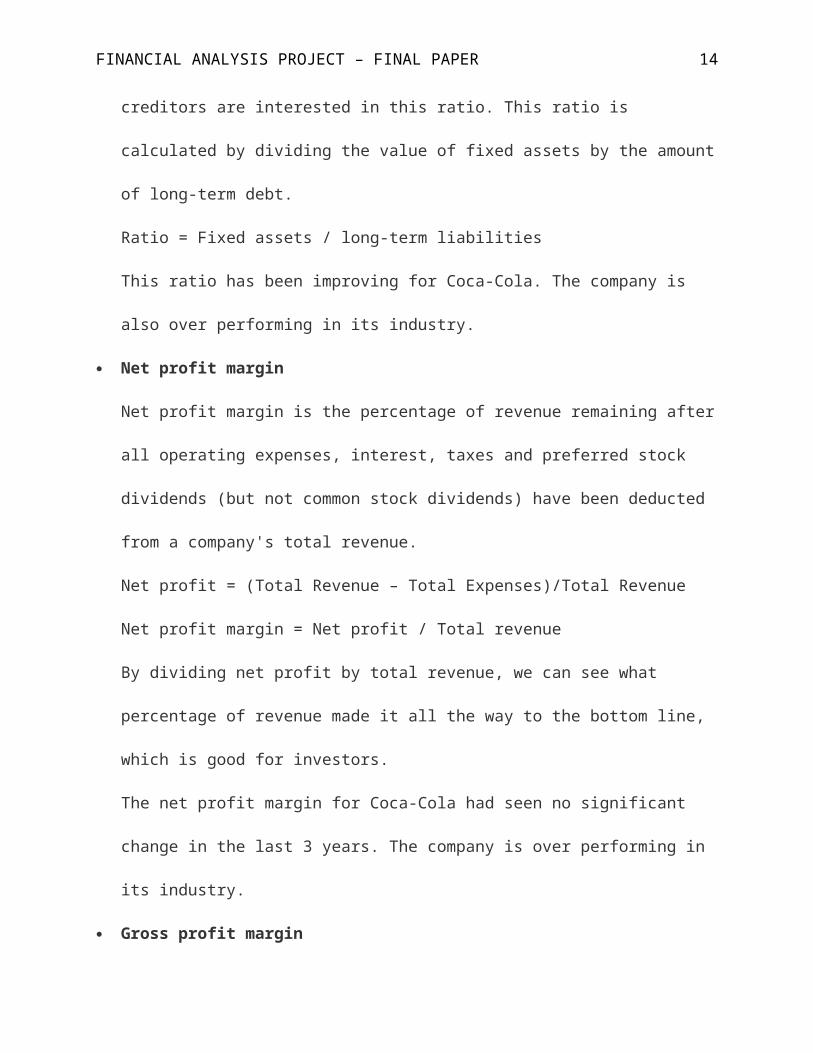
creditors are interested in this ratio. This ratio is
calculated by dividing the value of fixed assets by the amount
of long-term debt.
Ratio = Fixed assets / long-term liabilities
This ratio has been improving for Coca-Cola. The company is
also over performing in its industry.
Net profit margin
Net profit margin is the percentage of revenue remaining after
all operating expenses, interest, taxes and preferred stock
dividends (but not common stock dividends) have been deducted
from a company's total revenue.
Net profit = (Total Revenue – Total Expenses)/Total Revenue
Net profit margin = Net profit / Total revenue
By dividing net profit by total revenue, we can see what
percentage of revenue made it all the way to the bottom line,
which is good for investors.
The net profit margin for Coca-Cola had seen no significant
change in the last 3 years. The company is over performing in
its industry.
Gross profit margin

FINANCIAL ANALYSIS PROJECT – FINAL PAPER 15
A financial metric used to assess a firm's financial health by
revealing the proportion of money left over from revenues
after accounting for the cost of goods sold. Gross profit
margin serves as the source for paying additional expenses and
future savings.
Gross Profit Margin = (Revenues-COGS)/Revenue
The gross profit margin for Coca-Cola had seen no significant
change in the last 3 years. The company is over performing in
its industry.
Times interest earned
A metric used to measure a company's ability to meet its debt
obligations. It is usually quoted as a ratio and indicates how
many times a company can cover its interest charges on a
pretax basis. Failing to meet these obligations could force a
company into bankruptcy. Also referred to as "interest
coverage ratio" and "fixed-charged coverage."
Times Interest Earned (TIE) =
Earnings before interest and taxes (EBIT) / Total interest
payable contractual debt

FINANCIAL ANALYSIS PROJECT – FINAL PAPER 16
Times interest earned has been improving for the company.
Coca-Cola is also over performing in its industry.
Total asset turnover (ratio of nets sales to assets)
The total asset turnover ratio measures the ability of a
company to use its assets to efficiently generate sales. This
ratio considers all assets, current and fixed. Those assets
include fixed assets, like plant and equipment, as well as
inventory, accounts receivable, as well as any other current
assets. The lower the total asset turnover ratio (the lower
the # Times), as compared to historical data for the firm and
industry data, the more sluggish the firm's sales.
Total asset turnover = Net Sales/Total Assets = # Times
The lower the total asset turnover ratio (the lower the #
Times), as compared to historical data for the firm and
industry data, the more sluggish the firm's sales. This may
indicate a problem with one or more of the asset categories
composing total assets - inventory, receivables, or fixed
assets.

FINANCIAL ANALYSIS PROJECT – FINAL PAPER 17
Total asset turnover has been on the decline for Coca-Cola for
the last 3 years. The company is underperforming in its
industry.
Rate earned on total assets (return on assets)
An indicator of how profitable a company is relative to its
total assets. ROA gives an idea as to how efficient management
is at using its assets to generate earnings. Calculated by
dividing a company's annual earnings by its total assets, ROA
is displayed as a percentage. Sometimes this is referred to as
"return on investment".
Return on assets = Net Income / Total Assets
Coca-Cola’s ROA has been decreasing slightly over the last 3
years. The company is underperforming in its industry.
Rate earned on total stockholder’s equity (return on equity)
The amount of net income returned as a percentage of
shareholders equity. Return on equity measures a corporation's
profitability by revealing how much profit a company generates
with the money shareholders have invested.
ROE is expressed as a percentage and calculated as:
Return on Equity = Net Income/Shareholder's Equity

FINANCIAL ANALYSIS PROJECT – FINAL PAPER 18
Coca-Cola has been on a slight decline the past 3 years. The
company has been
underperforming in its industry.
Rate earned on common stockholder’s equity
Ratio indicating the earnings on the common stockholders'
investment. Rate earned on common stockholder’s equity is
calculated as a percentage and calculated as:
Rate earned on common stockholder’s equity =
(Net income - preferred dividends) / average common
stockholders' equity.
There has been no change with this metric the last 3 years,
however the company is underperforming in its industry.
Earnings per share on common stock
The portion of a company's profit allocated to each
outstanding share of common stock. Earnings per share serves
as an indicator of a company's profitability.
Calculated as:
(Net income – Dividends on preferred stock) / Average
outstanding shares

FINANCIAL ANALYSIS PROJECT – FINAL PAPER 19
Earnings per share on common stock has been increasing for
Coca-Cola. The company is also over performing in it
industry.
Beverage Industry Defined
The beverage industry refers to the industry that produces
drinks. Beverage production can vary greatly depending on which
beverage is being made. The website ManufacturingDrinks.com
explains that, "bottling facilities differ in the types of
bottling lines they operate and the types of products they can
run" (Sharma, 1) Other bits of required information include the
knowledge of if said beverage is canned or bottled, hot-fill or
cold-fill, and natural or conventional. Innovations in the
beverage industry, catalyzed by requests for non-alcoholic
beverages, include beverage plants, beverage processing, and
beverage packing (Sharma, 1).
Coca-Cola Financials 2011-2013

FINANCIAL ANALYSIS PROJECT – FINAL PAPER 20
2011 2012 2013 Status Industry
average
Working capital 25,4
97
30,3
28
31,3
04
Improvi
ng
23,500
Ratio of fixed assets to
L.T. liabilities
2.86 2.76 2.60 Improvi
ng
2.2
Ratio of liabilities to
S.E.
1.36 1.45 1.51 Decreas
ing
1.22
Total asset turnover 1.58 1.56 1.52 Decreas
ing
2.3
Current ratio 1.05 1.09 1.13 Increas
ing
1
Quick ratio .92 .97 1.0 Increas
ing
.59
Rate earned on total
assets
11% 11% 10% Decreas
ing
11.8%
Earnings per share on
common stock
1.90 2.01 1.95 Increas
ing
1.52
Accounts receivable
turnover
9.46 10.0
9
9.62 Improvi
ng
9.32

FINANCIAL ANALYSIS PROJECT – FINAL PAPER 21
Average collection period 38.5
8
36.1
8
37.9
6
Improvi
ng
31.2
Times interest earned 19 19.2 19.5 Improvi
ng
15.4
Inventory turnover 15.0
5
14.7
1
14.3
0
Decreas
ing
15.5
Net profit margin 25.3
%
26.9
%
28.4
%
n/a 18%
Gross profit margin 61.2
%
60.9
%
61.2
%
n/a 43%
Rate earned on common S.E. .42 .42 .42 n/a .63
Rate earned on total S.E. .27 .27 .26 decreas
ing
.36
Coca-Cola Common Size Income Statement
2013 2012 2011
Net Operating Revenues 100.0 100.0 100.00

FINANCIAL ANALYSIS PROJECT – FINAL PAPER 22
0 0
Cost of Goods Sold -39.32
39.68 -39.14
Gross Profit 60.68%
60.32%
60.86%
Selling, general and Admin. Expenses -36.94
36.94 -37.47
Other operating charges -1.91 -.93 -1.57
Operating Income 21.83%
22.45%
21.82%
Interest income 1.14 .98 1.04
Interest expense -.99 -.83 -.90
Equity income, net 1.28 1.71 1.48
Other income (loss), net 1.23 .29 1.14
Income before income taxes 24.50%
24.59%
24.58%
Income taxes -6.08 -5.67 -6.03
Consolidated net income 18.41%
18.92%
18.55%
Net income attributable to non controllinginterests
-.09 -.14 -.13
Net income attributable to shareowners 18.32%
18.78%
18.42%
The in-depth analysis of key financial ratios in this
project helps in measuring the financial strength, liquidity
conditions and operating efficiency of the company. It also

FINANCIAL ANALYSIS PROJECT – FINAL PAPER 23
provides valuable interpretation separately for each ratio that
helps organization implementing the findings that would help the
organization to increase its efficiency (Sharma, 1).
Ratios are only post mortem analysis of what has happened
between two balance sheet dates. For one thing, they gain no clue
about the future. Ratio analysis in view of its several
limitations should be considered only as atoll for analysis
rather than as an end itself (Sharma, 1).
From the analysis it is evident that the gross profit ratio
is good, where as operating ratio is around optimum level to the
industry standards. As a whole, the liquidity position of the
company is good. Thus finally the company must try to improve its
profit margins as they are below industry levels. This
improvement may also bring up its return on investment and
overall efficiency to the company. The business environment of
the company is reasonably good. The company’s track record is
always oriented towards profitable growth and with strong
fundamentals.

FINANCIAL ANALYSIS PROJECT – FINAL PAPER 24
Demand for carbonated soft drinks has been negatively
affected from the concerns of the growing health, nutrition and
obesity concerns of today’s population. Carbonated soft drinks
have dropped from 60% to 35% of the total US beverage volume
(Seghetti, 1). Carbonated soft drink companies such as Coca-Cola
have also been under a lot of heat because of public policy
challenges regarding the sales of soft drinks in grade schools.
Recent trends have led to a change from carbonated soft drinks to
diet beverages, sports drinks, and flavored water.
Coca-Cola faces a risk from increasing price movements for
commodities that are required in for its operations (Seghetti,
2). Changes in the prices of these raw materials will pass onto
the customers if the company wishes to remain profitable. This
change and potential increase in price of products could
potentially result in a loss of customers, as they may choose to
switch to more inexpensive alternatives. Coca-Cola faces price
risk on commodities such as aluminum, corn and resin which
affects the cost of raw materials used in the production of
finished products. In addition, Coca-Cola is exposed to commodity

FINANCIAL ANALYSIS PROJECT – FINAL PAPER 25
price fluctuations on crude oil. This is important because this
affects the company's cost of fuel used in the movement and
delivery of its products (Seghetti, 2).
In the fiscal year 2010, Coca-Cola reported very strong
financial performance with a reported net income of $36.1
million, or $3.93 net income per share. Throughout the year,
Coca-Cola saw an improvement across many channels of their
business that helped drive an increase in case volume of 4.4%
(Seghetti, 3). This was the highest volume growth the company has
seen in over five years. Coca-Cola is also focusing its efforts
to improve the balance sheet in order to better position the
company to react to opportunities when they are available. This
dedication is shown through the decrease of long-term debt by
over $450 million in past 10 years. Coca-Cola plans to continue
to use its available annual cash flows to reduce long-term debt.
Coca-Cola is on the smaller end when compared in market
capitalization to its competitors and the industry. This is
because the company strictly focuses on bottling distribution

FINANCIAL ANALYSIS PROJECT – FINAL PAPER 26
aspects, whereas its competitors develop, market, sell, and
distribute their products.
Based on its positive operating, gross, and net margins, we
can see that Coca-Cola operates under profitable conditions.
Although the company converts an above median percentage of its
revenues to gross profits, it fails to do the same for operating
and net profits (Seghetti, 4). The company’s 6.36% operating
margin and 2.61% net profit margin is far lower than the
competitors listed and the overall industry average. In addition,
Coca-Cola saw its earnings drop despite of positive revenue
growth during the past fiscal year. When compared to the industry
average, Coca-Cola is heavily lagging behind in both these
metrics.
In the last 7 years, the company has been averaging a
compound annual growth rate of just under 5%. In addition to the
higher revenues, profit margin is slightly improving year over

FINANCIAL ANALYSIS PROJECT – FINAL PAPER 27
year. The Company has a debt to total capital ratio of
75.44% which is relatively high when compared with the non-
acoholic beverages industry's norm. Coca-Cola is moving in the
right direction as it is decreasing its debt-to-total capital
ratio year over year; on the other hand, the industry is actually
moving the opposite direction as its debt-to-total capital ratio
is increasing (Seghetti, 4). When compared with competitors that
are similar in market capitalization, the company’s quick ratio
is high. With a quick ratio of 1.13 and an interest coverage
ratio of 1.75, the company should be able to comfortably repay
its debt. Looking at Coca-Cola’s cash conversion cycle, we see
that it is almost twice as large as the industry average. This is
a bad sign as this shows that the company takes a longer time
than its competitors to convert resource inputs into cash flows.
In the 7 year time span, Coca-Cola is showing steps in both
reducing its dependence on debt and also increasing its

FINANCIAL ANALYSIS PROJECT – FINAL PAPER 28
liquidity. Its LT Debt/Equity ratio has decreased substantially
from 765.15 to 315.76. This is the same case for LT Debt/ Total
Capital ratio, which decreased from 87.34 to 75.44. Looking at
the liquidity metrics, we see that all three ratios have
increased during the timeline. This is a positive sign as the
company is better positioning itself to handle any unanticipated
conditions.
From the above timeline, I can see that while ROA, ROC, and
revenue per employee are on an upward trend, ROE has been very
volatile. ROA has almost doubled from 1.64% in 2004 to 3.05% in
2010. ROC has increased from 5.87% to 8.10% in these same 7
years. Revenue per employee has been on a constant rise and
increased almost by $93,000 within this time span. However, we
cannot really deduce anything from ROE since there doesn’t seem
to be a noticeable trend. ROE hit its high in 2004 at 37.38% and
had its low in 2008 at 9.24%. Since then, ROE has recovered and
continued to hover around its usual range of 30%.

FINANCIAL ANALYSIS PROJECT – FINAL PAPER 29
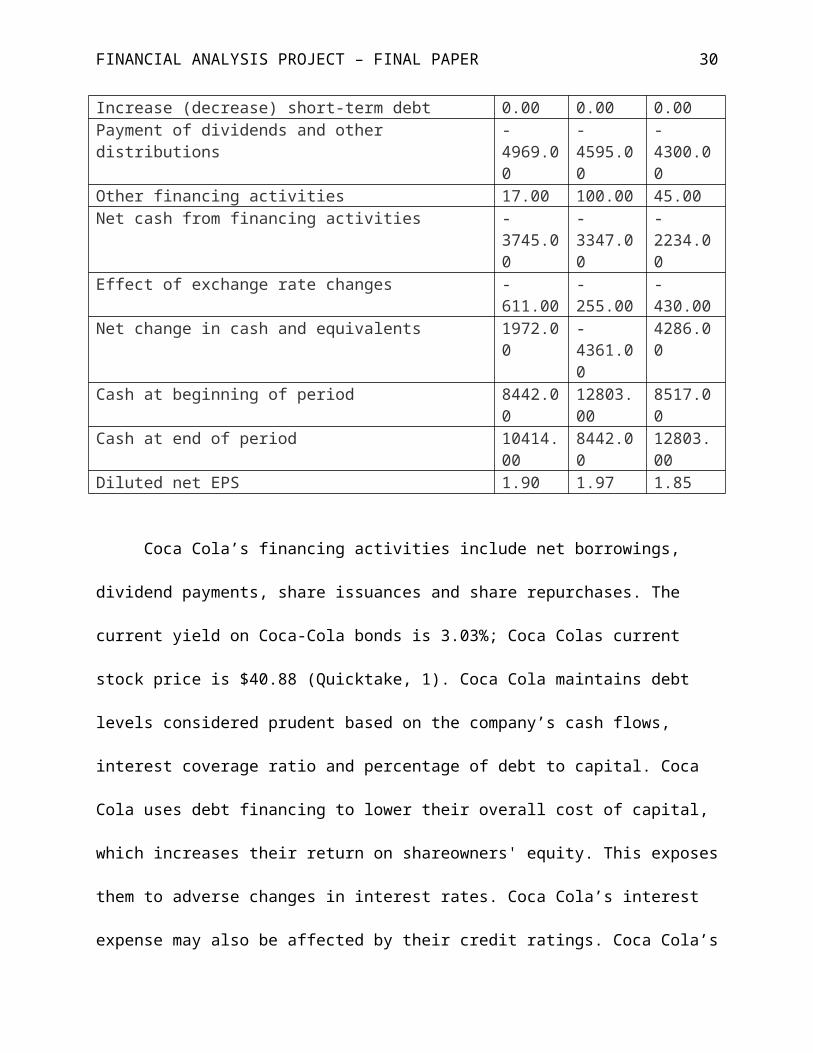
Cash flows from operations, investments and other financial
activities:
2013 2012 2011Net Income 8626.0
09086.00 8634.0
0Depreciation/Amortization and depletion 1977.0
01982.00 1954.0
0Net Change from Assets/Liabilities -
932.001080.00 -
1893.00
Net cash from Discontinued Operations 0.00 0.00 0.00Other operation activities 871.00 657.00 779.00Net case from operating activities 10542.
0010645.00
9474.00
Property and equipment 2439.00
2637.00 -2819.00
Acquisition/disposition of subsidiaries 519.00 654.00 -415.00
Investments -1991.00
-9234.00
803.00
Other investing activities -303.00
-187.00 -93.00
Net cash from investing activities -4214.00
-11404.00
-2524.00
Uses of funds:
2013 2012 2011Issuance (repurchase) of capital stock -
3054.00
-3070.00
-2944.00
Issuance (repayment) of debt 4711.00
4218.00
4965.00
FINANCIAL ANALYSIS PROJECT – FINAL PAPER 30
Increase (decrease) short-term debt 0.00 0.00 0.00Payment of dividends and other distributions
-4969.00
-4595.00
-4300.00
Other financing activities 17.00 100.00 45.00Net cash from financing activities -
3745.00
-3347.00
-2234.00
Effect of exchange rate changes -611.00
-255.00
-430.00
Net change in cash and equivalents 1972.00
-4361.00
4286.00
Cash at beginning of period 8442.00
12803.00
8517.00
Cash at end of period 10414.00
8442.00
12803.00
Diluted net EPS 1.90 1.97 1.85
Coca Cola’s financing activities include net borrowings,
dividend payments, share issuances and share repurchases. The
current yield on Coca-Cola bonds is 3.03%; Coca Colas current
stock price is $40.88 (Quicktake, 1). Coca Cola maintains debt
levels considered prudent based on the company’s cash flows,
interest coverage ratio and percentage of debt to capital. Coca
Cola uses debt financing to lower their overall cost of capital,
which increases their return on shareowners' equity. This exposes
them to adverse changes in interest rates. Coca Cola’s interest
expense may also be affected by their credit ratings. Coca Cola’s

FINANCIAL ANALYSIS PROJECT – FINAL PAPER 31
capital structure consists of 54.2% debt and 45.8% equity
(Quicktake, 2). The company monitors their interest coverage
ratio and the rating agencies consider the ratio in assessing
credit ratings. However, the rating agencies aggregate financial
data for certain bottlers along with the company when assessing
their debt rating. As such, the key measure to rating agencies is
the aggregate interest coverage ratio of the Coca Cola and
certain bottlers. Coca Cola’s global presence and strong capital
position give them access to key financial markets around the
world, enabling them to raise funds at a low effective cost. This
position, coupled with active management of Coca Cola’s mix of
short-term and long-term debt and their mix of fixed-rate and
variable-rate debt, results in a lower overall cost of borrowing.
Coca Cola’s debt management policies, in conjunction with their
share repurchase programs and investment activity, can result in
current liabilities exceeding current assets.
The graph illustrated below compares Coca Cola’s stock price
trends with the major competitors in the beverage industry, Pepsi
and Dr. Pepper Snapple group. This graph shows the trends between
2011 and 2013 Yahoo Finance, 1).

FINANCIAL ANALYSIS PROJECT – FINAL PAPER 32
Coca Cola Strengths (WSJ, 3)
1. The best global brand in the world in terms of value: The Coca
Cola Company is the most valued ($77,839 billion) brand in the
world.
2. World’s largest market share in beverage: Coca Cola holds the
largest beverage market share in the world (about 40%).

FINANCIAL ANALYSIS PROJECT – FINAL PAPER 33
3. Strong marketing and advertising: Coca Cola’ advertising
expenses accounted for more than $3 billion in 2012 and
increased firm’s sales and brand recognition.
4. Most extensive beverage distribution channel: Coca Cola serves
more than 200 countries and more than 1.7 billion servings a
day.
5. Customer loyalty: The firm enjoys having one of the most loyal
consumer groups.
6. Bargaining power over suppliers: The Coca Cola Company is the
largest beverage producer in the world and exerts significant
power over its suppliers to receive the lowest price available
from them.
7. Corporate Social Responsibility. Coca Cola is increasingly
focusing on customer social responsibility programs, such as
recycling/packaging, energy conservation/climate change,
active healthy living, water stewardship and many others,
which boosts company’s social image and result in competitive
advantage over competitors.
Coca Cola Weaknesses (WSJ, 4)

FINANCIAL ANALYSIS PROJECT – FINAL PAPER 34
1. Significant focus on carbonated drinks: The business is still
focusing on selling Coke, Fanta, Sprite and other carbonated
drinks. This strategy works in short term as consumption of
carbonated drinks will grow in emerging economies but it will
prove weak as the world is fighting obesity and is moving
towards consuming healthier food and drinks.
2. Undiversified product portfolio: Unlike most company’s
competitors, Coca Cola is still focusing only on selling
beverage, which puts the firm at disadvantage. The overall
consumption of soft drinks is stagnating and Coca Cola Company
will find it hard to penetrate to other markets (selling food
or snacks) when it will have to sustain current level of
growth.
3. High debt level due to acquisitions: Nearly $8 billion of debt
acquired from CCE’s acquisition significantly increased Coca
Cola's debt level, interest rates and borrowing costs.
4. Negative publicity: The firm is often criticized for high
water consumption in water scarce regions and using harmful
ingredients to produce its drinks.

FINANCIAL ANALYSIS PROJECT – FINAL PAPER 35
5. Brand failures or many brands with insignificant amount of
revenues: Coca Cola currently sells more than 500 brands but
only few of the brands result in more than $1 billion sales.
Plus, the firm’s success of introducing new drinks is weak.
Many of its introduction result in failures, for example, C2
drink.
Coca Cola Opportunities (WSJ, 4)
1. Bottled water consumption growth: Consumption of bottled water
is expected to grow both in US and the rest of the world.
2. Increasing demand for healthy food and beverages: Due to many
programs to fight obesity, demand for healthy food and
beverages has increased drastically. The Coca Cola Company has
an opportunity to further expand its product range with drinks
that have low amount of sugar and calories.
3. Growing beverages consumption in emerging markets: Consumption
of soft drinks is still significantly growing in emerging
markets, especially BRIC countries, where Coca Cola could
increase and maintain its beverages market share.

FINANCIAL ANALYSIS PROJECT – FINAL PAPER 36
4. Growth through acquisitions: Coca Cola will find it hard to
keep current growth levels and will find it hard to penetrate
new markets with its existing product portfolio. All this can
be done more easily through acquiring other companies.
Coca Cola Threats (WSJ, 5)
1. Changes in consumer tastes: Consumers around the world become
more health conscious and reduce their consumption of
carbonated drinks, drinks that have large amounts of sugar,
calories and fat. This is the most serious threat as Coca Cola
is mainly serving carbonated drinks.
2. Water scarcity: Water is becoming scarcer around the world and
increases both in cost and criticism for Coca Cola over the
large amounts of water used in production.
3. Strong dollar: More than 60% of The Coca Cola Company income
is from outside US. Due to strong dollar performance against
other currencies firm’s overall income may fall.
4. Legal requirements to disclose negative information on product
labels: Some Coca Cola’s carbonated drinks have adverse health
consequences. For this reason, many governments consider to

FINANCIAL ANALYSIS PROJECT – FINAL PAPER 37
pass legislation that requires disclosing such information on
product labels. Products containing such information may be
perceived negatively and lose its customers.
5. Decreasing gross profit and net profit margins: Coca Cola’s
gross profit and net profit margin was decreasing over the
past few years and may continue to decrease due to higher
water and other raw material costs.
6. Competition from PepsiCo: PepsiCo is fiercely competing with
Coca Cola over market share in BRIC countries, especially
India.
7. Saturated carbonated drinks market: The business significantly
relies on the carbonated drinks sales, which is a threat for
the Coca Cola as the market of carbonated drinks is not
growing or even declining in the world.
Summary of a Recent Press Release (Coca Cola Company, 1)
The Coca-Cola Company and Monster Beverage Corporation
announced today that they have entered into definitive agreements
for a long-term strategic partnership that is expected to
accelerate growth for both companies in the fast-growing, global

FINANCIAL ANALYSIS PROJECT – FINAL PAPER 38
energy drink category. The new, innovative partnership leverages
the respective strengths of The Coca-Cola Company and Monster to
create compelling value for both companies and their shareowners.
Importantly, the partnership strategically aligns both companies
for the long-term by combining the strength of The Coca-Cola
Company's worldwide bottling system with Monster's dedicated
focus and expertise as a leading energy player globally.
Details of the Transactions:
Equity Investment: In an effort to align long-term interests, The
Coca-Cola Company will acquire an approximately 16.7% ownership
interest in Monster (post issuance) and will have two directors
on Monster's Board of Directors. The Coca-Cola Company expects to
account for its investment in Monster under the equity accounting
method.
Business Transfers: To optimally align product portfolios and
enable those portfolios to benefit from each company's respective
brand marketing, production and distribution strengths and
optimize the parties' capital and resource allocation, The Coca-
Cola Company will transfer ownership of its worldwide energy

FINANCIAL ANALYSIS PROJECT – FINAL PAPER 39
business, including NOS, Full Throttle, Burn, Mother, Play and
Power Play, and Relentless, to Monster; and Monster will transfer
its non-energy business, including Hansen's Natural Sodas, Peace
Tea, Hubert's Lemonade and Hansen's Juice Products, to The Coca-
Cola Company.
Distribution: The Coca-Cola Company and Monster will amend their
current distribution agreement in the U.S. and Canada by
expanding into additional territories and entering into long-term
agreements. The Coca-Cola Company will become Monster's preferred
distribution partner globally and Monster will become The Coca-
Cola Company's exclusive energy play. These agreements will
deliver sustainable value to The Coca-Cola Company's global
system and accelerate Monster's opportunity to grow
internationally.
Pursuant to the terms of the transaction agreements, at the
closing, The Coca-Cola Company will make a net cash payment of
$2.15 billion and transfer its worldwide energy business to
Monster. In exchange, Monster will issue to The Coca-Cola Company
the shares of Monster common stock, transfer its non-energy

FINANCIAL ANALYSIS PROJECT – FINAL PAPER 40
business to The Coca-Cola Company, and enter into expanded
distribution arrangements. The transaction, which is expected to
close late in 2014 or early in 2015, is subject to customary
closing conditions, including receipt of regulatory approvals.
Muhtar Kent, Chairman and CEO if Coca-Cola stated the following:
"The Coca-Cola Company continues to identify innovative
approaches to partnerships that enable us to stay at the
forefront of consumer trends in the beverage industry. Our
equity investment in Monster is a capital efficient way to
bolster our participation in the fast-growing and attractive
global energy drinks category. This long-term partnership
aligns us with a leading energy player globally, brings
financial benefit to our Company and our bottling partners,
and supports broader commercial strategies with our
customers to bring total beverage growth opportunities that
will also benefit our core business. We are excited to
evolve our long-time partnership. Monster has been an
important part of our global system since 2008, so we have
experienced first-hand Monster's performance-driven and

FINANCIAL ANALYSIS PROJECT – FINAL PAPER 41
entrepreneurial culture, proven success in building and
extending the Monster brand and their strong product
innovation pipeline. We believe this partnership will create
compelling and sustainable value for our system and our
shareowners."
FINANCIAL ANALYSIS PROJECT – FINAL PAPER 42
References
(2014). Profile. Retrieved from http://finance.yahoo.com/q/pr?
s=KO+Profile
The Coca-Cola Company. In Wikipedia. Retrieved July 28, 2014, from
http://en.wikipedia.org/wiki/The_Coca-Cola_Company
The Coca-Cola Company. (2014). Company Records. Retrieved from
http://www.coca-colacompany.com/our-company/company-reports
2014. Coca Cola Buys Stake in Monster Beverage for $2 Billion. Retrieved from
http://www.forbes.com/sites/maggiemcgrath/2014/08/14/coca-cola-buys-stake-in-
monster-beverage-for-2-billion/
2014. Coca Cola Co. Retrieved from
http://quicktake.morningstar.com/stocknet/bonds.aspx?
symbol=ko

FINANCIAL ANALYSIS PROJECT – FINAL PAPER 43
2014. Swot Analysis: Coca Cola. Retreved from
http://online.wsj.com/article/PR-CO-20140814-912941.html
Seghetti, Nicole. (November 22, 2013). Biggest Risks Facing Coca Cola.
Retrieved from
http://www.fool.com/investing/general/2012/11/22/the-biggest-
risks-facing-coca-cola.aspx
Sharma, Arhi. (2014). Financial Analysis:Comparative analysis of
Pepsi and Coca Cola.
Yahoo Finance Chart. (2014). Retrieved from
http://finance.yahoo.com/echarts?
s=KO+Interactive#symbol=KO;range
Retrieved from
http://www.scribd.com/doc/167352637/Financial-Analysis-
Comparative-Analysis-Of-Coca-Cola-And-Pepsi

FINANCIAL ANALYSIS PROJECT – FINAL PAPER 44
Changes Made:
Added section on the major operations of coca cols and why I
picked this company for my analysis.

FINANCIAL ANALYSIS PROJECT – FINAL PAPER 45
Added references to paper, mostly in part3.
Added commentary regarding the overall beverage industry, insight
in the company’s financial ratios compared to the industry
averages and what they mean to Coca Cola.