Ambient noise H/V spectral ratio in site effects estimation in Fateh jang area, Pakistan
9
RESEARCH PAPER Ambient noise H/V spectral ratio in site effects estimation in Fateh jang area, Pakistan S. M. Talha Qadri • Bushra Nawaz • S. H. Sajjad • Riaz Ahmad Sheikh Received: 24 August 2014 / Accepted: 29 December 2014 Ó The Author(s) 2015. This article is published with open access at Springerlink.com Abstract Local geology or local site effect is a crucial component while conducting seismic risk assessment studies. Investigations made by utilization of ambient noise are an effective tool for local site estimation. The present study is conducted to perform site response analysis at 13 different sites within urban settlements of Fateh jang area (Pakistan). The aim of this study was achieved by utilizing Nakamura method or H/V spectral ratio method. Some important local site parameters, e.g., the fundamental fre- quencies f 0 of soft sediments, amplitudes A 0 of corre- sponding H/V spectral ratios, and alluvium thicknesses over 13 sites within the study area, were measured and analyzed. The results show that the study area reflects low fundamental frequency f 0 . The fundamental frequencies of the sediments are highly variable and lie in a range of 0.6–13.0 Hz. Similarly, amplification factors at these sites are in the range of 2.0–4.0. Keywords Local site effect Ambient noise H/V spectral ratios Fundamental frequency Amplification factor Alluvium thickness 1 Introduction It is quite obvious from the history of human civilization that man has been struggling to defeat the natural disasters since its origin. Earthquakes are one of those deadliest events that change the entire landscape, and they are associated with tectonic processes. Heavy life losses, disaster to property, disturbance to the normal life pattern, and termination of the developmental processes of a country or region are some of disastrous impacts of these inevitable events (Ram Kumar 2009). There is a need to study and understand the contributing factors in this aspect for safety purpose and remedial measures. So earthquake disaster prevention/reduction and mitigation strategy is of global concern today. Local site conditions can significantly enhance the risk factor in areas adjacent and remote from the epicenter. Every site exhibits its particular seismic response at which ground motion can be amplified. If it coincides or corre- sponds with the fundamental frequencies of manmade infrastructures, then there is great possibility of disaster. In the recent past, San Francisco earthquake 1989, Mexican earthquake 1995, Los Angeles earthquake 1995 are a few classical examples of amplification of ground motion triggered as a consequence of local site conditions (Ansal et al. 2004; Slob et al. 2002; Street et al. 2001). In 2001, the epicenter of Bhuj earthquake was about 400 km away from Ahmedabad (India), but it was highly affected by earth- quake because the city was located over the younger alluvial deposits (Ranjan 2005). The areas located on young unconsolidated sedimentary deposits experienced greater amplification of ground motion due to impedance contrast (Hunter et al. 2002). Sediment thickness and physical properties of the material vary from place to place, which can result in trapping and amplification of seismic waves during a seismic event resulting in different resonant frequencies at very small distances (Paudyal et al. 2012).This resonance frequency is very important because it represents the frequency at which S. M. Talha Qadri (&) B. Nawaz S. H. Sajjad Department of Earth Sciences, University of Sargodha, Sargodha, Pakistan e-mail: [email protected] R. A. Sheikh College of Earth and Environmental Sciences, University of the Punjab, Lahore, Pakistan 123 Earthq Sci DOI 10.1007/s11589-014-0105-9
Transcript of Ambient noise H/V spectral ratio in site effects estimation in Fateh jang area, Pakistan

RESEARCH PAPER
Ambient noise H/V spectral ratio in site effects estimation in Fatehjang area, Pakistan
S. M. Talha Qadri • Bushra Nawaz •
S. H. Sajjad • Riaz Ahmad Sheikh
Received: 24 August 2014 / Accepted: 29 December 2014
� The Author(s) 2015. This article is published with open access at Springerlink.com
Abstract Local geology or local site effect is a crucial
component while conducting seismic risk assessment
studies. Investigations made by utilization of ambient noise
are an effective tool for local site estimation. The present
study is conducted to perform site response analysis at 13
different sites within urban settlements of Fateh jang area
(Pakistan). The aim of this study was achieved by utilizing
Nakamura method or H/V spectral ratio method. Some
important local site parameters, e.g., the fundamental fre-
quencies f0 of soft sediments, amplitudes A0 of corre-
sponding H/V spectral ratios, and alluvium thicknesses
over 13 sites within the study area, were measured and
analyzed. The results show that the study area reflects low
fundamental frequency f0. The fundamental frequencies of
the sediments are highly variable and lie in a range of
0.6–13.0 Hz. Similarly, amplification factors at these sites
are in the range of 2.0–4.0.
Keywords Local site effect � Ambient noise � H/V
spectral ratios � Fundamental frequency � Amplification
factor � Alluvium thickness
1 Introduction
It is quite obvious from the history of human civilization
that man has been struggling to defeat the natural disasters
since its origin. Earthquakes are one of those deadliest
events that change the entire landscape, and they are
associated with tectonic processes. Heavy life losses,
disaster to property, disturbance to the normal life pattern,
and termination of the developmental processes of a
country or region are some of disastrous impacts of these
inevitable events (Ram Kumar 2009). There is a need to
study and understand the contributing factors in this aspect
for safety purpose and remedial measures. So earthquake
disaster prevention/reduction and mitigation strategy is of
global concern today.
Local site conditions can significantly enhance the risk
factor in areas adjacent and remote from the epicenter.
Every site exhibits its particular seismic response at which
ground motion can be amplified. If it coincides or corre-
sponds with the fundamental frequencies of manmade
infrastructures, then there is great possibility of disaster. In
the recent past, San Francisco earthquake 1989, Mexican
earthquake 1995, Los Angeles earthquake 1995 are a few
classical examples of amplification of ground motion
triggered as a consequence of local site conditions (Ansal
et al. 2004; Slob et al. 2002; Street et al. 2001). In 2001, the
epicenter of Bhuj earthquake was about 400 km away from
Ahmedabad (India), but it was highly affected by earth-
quake because the city was located over the younger
alluvial deposits (Ranjan 2005).
The areas located on young unconsolidated sedimentary
deposits experienced greater amplification of ground
motion due to impedance contrast (Hunter et al. 2002).
Sediment thickness and physical properties of the material
vary from place to place, which can result in trapping and
amplification of seismic waves during a seismic event
resulting in different resonant frequencies at very small
distances (Paudyal et al. 2012).This resonance frequency is
very important because it represents the frequency at which
S. M. Talha Qadri (&) � B. Nawaz � S. H. Sajjad
Department of Earth Sciences, University of Sargodha,
Sargodha, Pakistan
e-mail: [email protected]
R. A. Sheikh
College of Earth and Environmental Sciences, University of the
Punjab, Lahore, Pakistan
123
Earthq Sci
DOI 10.1007/s11589-014-0105-9

soft sediments amplify the ground motion caused by a
seismic event. This particular phenomenon is called the site
effect (Paudyal et al. 2012). Due to anisotropic and heter-
ogeneous characteristics of the site soil layer, local site
conditions are considered more adaptable and compliant
compared to the path effect (Ren et al. 2013). Natural
disturbances such as wind, sea tides, or cultural noise such
as industrial and traffic noise produce low-amplitude
vibrations. These low-amplitude vibrations are termed the
ambient noise. Various researchers have shown that hori-
zontal motion exceeds the vertical motion in soft ground
(Nakamura 1989). Many scientists such as Chavez-Garcıa
et al. (1990, 1996), Bard (1999), Bour et al. (1998) have
utilized H/V and proven the reliability and credibility of
this technique. H/V method is a very reliable method for
estimating alluvium thickness by means of fundamental
frequencies of the soft sediments (Morales et al. 1991;
Yamanaka et al. 1994; Parolai et al. 2002; Panou et al.
2005). Contrary to the fundamental frequency f0, amplifi-
cation factor A0 reveals disagreement between opinions
and findings of different scientists. Numerous scientists
have reached satisfactory correlation, while others failed to
do so (Horike et al. 2001).
Fateh jang is a small town situated within the longitu-
dinal range of 72�3802600E–72�5003700E and latitudinal
range of 33�320700N–33�400700N at a distance of nearly
50 km from Islamabad (Federal Capital of Pakistan). New
developmental projects are expected to accelerate as a
result of ongoing construction of New Islamabad
International Airport in the study area, which will be
operational by April 2015. This airport is conjectured to be
a contemporary marker structure symbolic representation
of the twenty-first century, as it will be its political and
trade entrance via the capital of Pakistan, Islamabad. The
Civil Aviation Authority (CAA) has declared that it is to be
named Gandhara International Airport, and it will be
operational from April 2015. Therefore, Fateh jang area
has been selected for the case study keeping in view the
future perspective and its prime significance. As far as the
recent deposits are concerned, thick alluvium, along with
conglomerates, covers most of the study area (Qaisar et al.
2008).
Fateh jang lies in the south of Main Boundary Thrust
(MBT) which indicates complex folding and faulting
(Jaswal 1990). Rocks of Eocene to Paleocene ages have
been thrust over molasses sediments. Study area reflects
region of deformation during Neogene age situated in the
footwall of MBT (Faisal 2005). These blind thrusts and
imbrications of MBT disappear in overlying Murree for-
mation (Faisal 2005). Stratigraphic succession of the study
area is shown in Fig. 2. Fateh jang is seismically active
area owing to its location in Himalayan foreland. As far
as seismic zonation map (developed by Pakistan Meteo-
rological department) is concerned, Fateh jang lies on the
border of zone 2-B and zone 3 (Fig. 1). Therefore, the
study area exhibits moderate level seismicity, and suffered
from significant damage during Mw 5.3 earthquake in
1993 (Qaisar et al. 2008).
Fig. 1 Seismic zonation map designed by Pakistan Metrological Department and the satellite image representing sites of data acquisition within
study area
Earthq Sci
123

Numerous fresh water streams in the Murree Formation
drain into the northern area of Fateh jang. The overall
drainage pattern of the study area (Fig. 3) is medium-to-
fine dendritic which represents the homogeneous soft
material. A medium-to-fine dendritic drainage without any
angularity is freely developed in soft materials, and there is
no control of soft material over development of drainage
pattern (Way 1973).
As the substrate of the study area and its surrounding is
soft and easily erodible, the meanders with variable sin-
uosity develop due to low stream gradient. Meandering
streams are the characteristic geomorphic feature of fine-
grained soft sediments (Plummer et al. 2005). The sinuous
curves develop as a result of increase in stream’s velocity
on the outside of the curve, and this high velocity erodes
the material on respective river bank, whereas the
stream’s velocity is low on the inside, and results in the
deposition of sediments. Usually, sand bars are deposited
in the form of arcuate ridges of sand. The position of the
meanders is not fixed (Plummer et al. 2005). As far as the
study area is concerned, the meandering streams are not
mature enough for the development of oxbow lakes.
Almost the same patterns of drainage system and mean-
dering streams have been observed from Fateh jang areas,
which clearly indicate the presence of soft sediments in
the study area. In the context of the importance of the
study area, the aims of this work are evaluating the local
site effects, and estimating the fundamental frequencies of
soft soil f0 and corresponding H/V amplitude levels A0
utilizing the H/V spectral ratio. It will help us understand
the mechanism of sediment-induced amplifications trig-
gering the disaster and to identify the most hazardous
zone within the study area. The findings of the study will
be beneficial for the town planners as well as for the
policy makers to design the mitigation strategies to
combat the effects of frequent earthquakes with local or
distant epicentral locations.
1.1 H/V method
The H/V method has received worldwide concentration
from all over the world due to its simple methodology
along with its ability to produce quick information about
dynamic characteristics of ground and structures (Nakam-
ura 1989). Another advantage of this technique is the
simplicity in data collection and its implementation in
areas of moderate-to-low seismicity. H/V method is also
called as Nakamura method which was at first introduced
by (Nogoshi and Igarashi 1971) and modified by Nakam-
ura. This technique is based on recording of microtremors
or ambient noise which is short-period vibration, which
resulting from coastal effects, atmospheric loading, wind
interaction with structure and vegetation, and cultural
sources like traffic, trains, construction, and factories. To
record microtremors, most researchers use only one or a
few seismometers that can measure very weak ground
motions. This method proves to be time effective and
demands fewer instruments compared to requirements in
classical geophysical techniques (Nakamura 1989). More-
over, it is a passive technique which can be readily used in
urban areas. Moreover, Nakamura technique does not
require any seismic event to occur. Due to wide ranges of
noise sources, microtremors occur in a wide frequency
range of 0.02–50 Hz, and this makes it possible to explore
the depths of more than 100 m depending upon the sensi-
tivity of sensor (Horike 1985). Reliability of this technique
is significantly enhanced if we have knowledge of the
sediment thickness or S-velocity structure of subsurface
(Bard 1999). The microtremors are recorded with three
components that include two orthogonal horizontal com-
ponents and one vertical component. A microtremor time
series recording represents the convolution of (i) source
effects, (ii) propagation effects of source to receiver, (iii)
the effect of the recording instrument, and (iv) the response
Fig. 2 Stratigraphic succession of Fateh jang area after Latif (1968)
and Shah (1977)
Earthq Sci
123

of the site. These four factors are multiplied in the fre-
quency domain, and given certain assumptions; the divi-
sion of horizontal Fourier amplitude spectrum by the
vertical spectrum can remove the first three effects, thereby
isolating the site response (Molnar et al. 2007). In spite of
its limitations, H/V method is a preliminary step toward
site characteristics’ estimation and microzonation of areas
of interest (Qaisar et al. 2008).
1.2 Datasets and methodology
H/V method which was modified by Nakamura (1989) is
one of the most utilized techniques for the analysis of site-
response analysis these days. This technique makes use of
spectral analysis of ambient noise to illustrate the site
response in urban environment. The H/V spectral ratio is
based on impedance contrast, which means the presence of
Fig. 3 Satellite image of the dendritic drainage pattern within the study area
Earthq Sci
123

overlying of soft sediments on a harder bed rock. The
present study was conducted by acquiring ambient noise
data at 13 different data points (Fig. 1) by means of CMG-
40T broad-based seismometer. Acquired data were dis-
played on the receiver (laptop) by means of the software
termed ‘‘SCREAM’’ which played an efficient role in
acquiring, viewing, recording, transmitting, and replaying
the GCF data received through any Guralp seismometer.
Recorded ambient noise was inspected to check erroneous
measurement by displaying and viewing GCF files of
ambient noise data on SCREAM software. Guidelines from
SESAME (2004) were considered during data acquisition
and processing steps to check the reliability of ambient
noise data. Some of the conditions for data reliability such
as f0 [ 10/Iw, nc (f0) [ 200 (where nc = nw 9 Iw) and
A0 C 2 were checked keeping in view the guidelines from
SESAME (2004). These data reliability parameters are
shown in Table 1. On the basis of information presented in
Table 1, acquired data appear reliable. Although sampling
rate of 50 Hz is sufficient for geotechnical purpose, sam-
pling rate of 100 Hz was yet used to record the maximum
number of types of ambient noise during data acquisition
(SESAME 2004). In order to develop good soil/sensor
coupling, seismometer was directly installed on the ground
Table 1 Reliability of frequency peaks/curves on the basis of parameters defined by guidelines modified by SESAME (2004) against each
station
Sr. no Latitude (�N) and Longitude (�E) f0 (Hz) A0 C 2 f0 [ 10/Lw Nw nc = nw 9 Lw nc (f0) [ 200 Comment
1 33.562972, 72.650368 0.6 2.5 0.4 19 475 285 Reliable
2 33.560653, 72.628470 4.6 3.2 0.4 17 425 1,955 Reliable
3 33.565894, 72.638792 0.8 2.1 0.4 13 325 260 Reliable
4 33.5765131, 72.647352 3.0 2.0 0.4 13 325 975 Reliable
5 33.567648, 72.644325 0.7 4.0 0.4 16 400 280 Reliable
6 33.5685572, 72.640754 4.2 2.2 0.4 15 375 1,575 Reliable
7 33.565447, 72.647801 12.0 2.3 0.4 18 450 5,400 Reliable
8 33.5621563, 72.6318812 2.3 2.3 0.4 16 400 920 Reliable
9 33.560923, 72.637180 3.1 2.9 0.4 13 325 1,007.5 Reliable
10 33.571751, 72.651999 13.0 2.3 0.4 12 300 3,900 Reliable
11 33.5772997, 72.6551628 3.4 3.3 0.4 16 400 1,360 Reliable
12 33.557069, 72.635061 5.1 2.8 0.4 13 325 1,657.5 Reliable
13 33.560362, 72.642386 6.6 2.6 0.4 17 425 2,805 Reliable
Table 2 Tabular display of 13 sites of data acquisition along with corresponding fundamental frequencies f0, amplification factors A0, and
alluvium thicknesses H
Serial no Latitudes and Longitudes Fundamental frequency
f0 (Hz)
H/V amplitude
(A0)
Approx. thickness of alluvium H(m)
= 108 f0-1.551 (Parolai formula)
1 33.562972, 72.650368 0.6 2.5 238.5
2 33.560653, 72.628470 4.6 3.2 10.1
3 33.565894, 72.638792 0.8 2.1 152.7
4 33.5765131,72.647352 3.0 2.0 19.6
5 33.567648, 72.644325 0.7 4.0 187.8
6 33.5685572, 72.640754 4.2 2.2 11.7
7 33.565447, 72.647801 12.0 2.3 2.3
8 33.5621563,72.6318812 2.3 2.3 29.7
9 33.560923, 72.637180 3.1 2.9 18.7
10 33.571751, 72.651999 13.0 2.3 2.02
11 33.5772997, 72.6551628 3.4 3.3 16.2
12 33.557069, 72.635061 5.1 2.8 8.63
13 33.560362, 72.642386 6.6 2.6 5.8
Earthq Sci
123

using spikes on the base of seismometer. With a sampling
rate of 100 Hz, a continuous recording of ambient noise for
10–20 min was conducted keeping the studies of different
scientists in view (Ohta et al. 1978). Software ‘‘Geopsy’’
played a vital role during ambient noise data processing.
Each recording was then split into a 25-s window through
short-term average (STA)/long-term average (LTA) anti-
trigger. A value of 2 s was selected for STA, while a value
of 30 s for LTA with low and high thresholds of 0.2 and
2.5, respectively. While processing ambient noise data,
Cosine taper is applied at both ends of the selected signal
window to overcome the sudden and unexpected discon-
tinuities which can affect the Fourier Spectrum (Chatelain
and Guillier 2013). Fourier amplitude spectra were
smoothed by applying Konno–Ohmachi algorithm along
with the Cosine taper (width = 0.25 %) and smoothing
constant with a value of 40.00 (Konno and Ohmachi 1998).
Weak signals were improved by means of automatic gain
control (AGC), and instrumental effects were removed
using DC suppression. These processing steps were carried
under the guidelines provided in the manual of Geopsy
software (can be seen at www.geopsy.org). Next step is to
compute H/V in each window by integrating the horizontal
(north–south, east–west) components with a quadratic
mean. Finally, H/V is averaged over all selected windows.
H/V curves in Fig. 5 indicate the average H/V curve (black
line), the H/V amplitude A0 standard deviation curves
(dashed lines), and the peak frequency standard deviation
domains (the two vertical gray areas). The peak frequency
is the value at the limit between the two gray areas. IDW
method (Inverse Distance Weighted method) of interpola-
tion was also applied on datasets by means of the software
Arc GIS. Interpolation was applied to identify the spatial
extent of fundamental frequency f0 and the alluvium
thickness H datasets within the study area as shown in
Table 2.
Fig. 4 Interpolated map representing a alluvium thickness distribution H in meter; b fundamental frequency f0 in Hz; c amplification factor A0
Earthq Sci
123

Fig. 5 Amplitudes of H/V spectral ratios as a function of fundamental frequencies
Earthq Sci
123
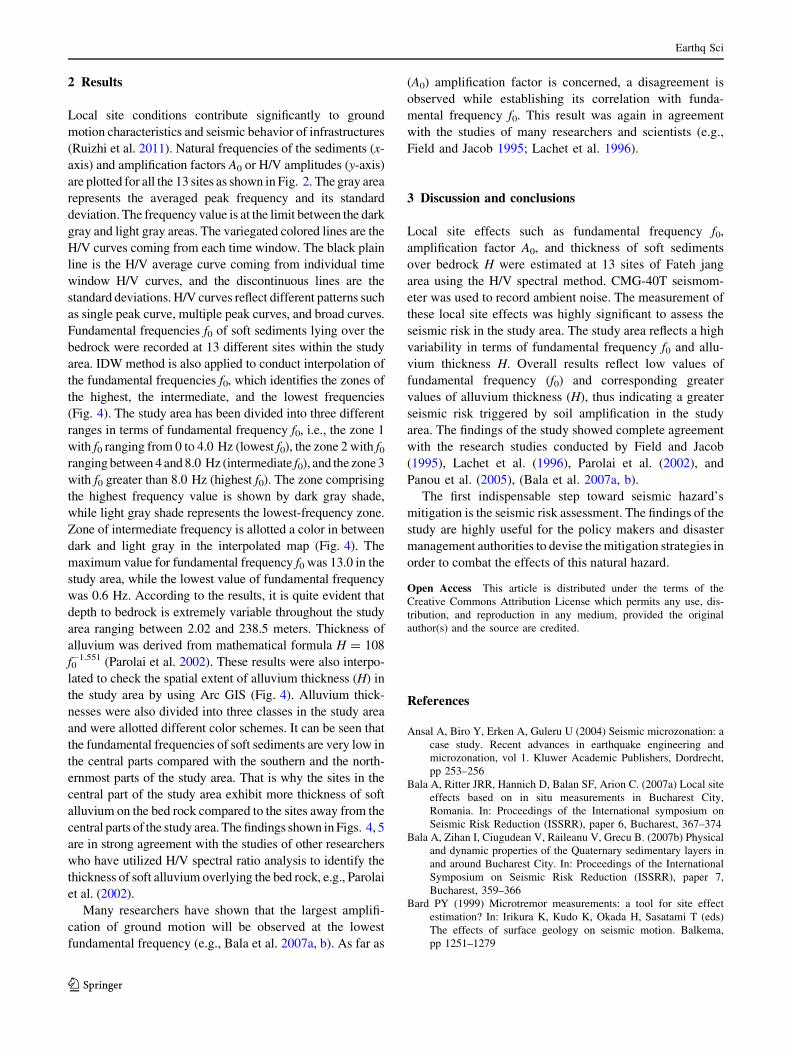
2 Results
Local site conditions contribute significantly to ground
motion characteristics and seismic behavior of infrastructures
(Ruizhi et al. 2011). Natural frequencies of the sediments (x-
axis) and amplification factors A0 or H/V amplitudes (y-axis)
are plotted for all the 13 sites as shown in Fig. 2. The gray area
represents the averaged peak frequency and its standard
deviation. The frequency value is at the limit between the dark
gray and light gray areas. The variegated colored lines are the
H/V curves coming from each time window. The black plain
line is the H/V average curve coming from individual time
window H/V curves, and the discontinuous lines are the
standard deviations. H/V curves reflect different patterns such
as single peak curve, multiple peak curves, and broad curves.
Fundamental frequencies f0 of soft sediments lying over the
bedrock were recorded at 13 different sites within the study
area. IDW method is also applied to conduct interpolation of
the fundamental frequencies f0, which identifies the zones of
the highest, the intermediate, and the lowest frequencies
(Fig. 4). The study area has been divided into three different
ranges in terms of fundamental frequency f0, i.e., the zone 1
with f0 ranging from 0 to 4.0 Hz (lowest f0), the zone 2 with f0ranging between 4 and 8.0 Hz (intermediate f0), and the zone 3
with f0 greater than 8.0 Hz (highest f0). The zone comprising
the highest frequency value is shown by dark gray shade,
while light gray shade represents the lowest-frequency zone.
Zone of intermediate frequency is allotted a color in between
dark and light gray in the interpolated map (Fig. 4). The
maximum value for fundamental frequency f0 was 13.0 in the
study area, while the lowest value of fundamental frequency
was 0.6 Hz. According to the results, it is quite evident that
depth to bedrock is extremely variable throughout the study
area ranging between 2.02 and 238.5 meters. Thickness of
alluvium was derived from mathematical formula H = 108
f0-1.551 (Parolai et al. 2002). These results were also interpo-
lated to check the spatial extent of alluvium thickness (H) in
the study area by using Arc GIS (Fig. 4). Alluvium thick-
nesses were also divided into three classes in the study area
and were allotted different color schemes. It can be seen that
the fundamental frequencies of soft sediments are very low in
the central parts compared with the southern and the north-
ernmost parts of the study area. That is why the sites in the
central part of the study area exhibit more thickness of soft
alluvium on the bed rock compared to the sites away from the
central parts of the study area. The findings shown in Figs. 4, 5
are in strong agreement with the studies of other researchers
who have utilized H/V spectral ratio analysis to identify the
thickness of soft alluvium overlying the bed rock, e.g., Parolai
et al. (2002).
Many researchers have shown that the largest amplifi-
cation of ground motion will be observed at the lowest
fundamental frequency (e.g., Bala et al. 2007a, b). As far as
(A0) amplification factor is concerned, a disagreement is
observed while establishing its correlation with funda-
mental frequency f0. This result was again in agreement
with the studies of many researchers and scientists (e.g.,
Field and Jacob 1995; Lachet et al. 1996).
3 Discussion and conclusions
Local site effects such as fundamental frequency f0,
amplification factor A0, and thickness of soft sediments
over bedrock H were estimated at 13 sites of Fateh jang
area using the H/V spectral method. CMG-40T seismom-
eter was used to record ambient noise. The measurement of
these local site effects was highly significant to assess the
seismic risk in the study area. The study area reflects a high
variability in terms of fundamental frequency f0 and allu-
vium thickness H. Overall results reflect low values of
fundamental frequency (f0) and corresponding greater
values of alluvium thickness (H), thus indicating a greater
seismic risk triggered by soil amplification in the study
area. The findings of the study showed complete agreement
with the research studies conducted by Field and Jacob
(1995), Lachet et al. (1996), Parolai et al. (2002), and
Panou et al. (2005), (Bala et al. 2007a, b).
The first indispensable step toward seismic hazard’s
mitigation is the seismic risk assessment. The findings of the
study are highly useful for the policy makers and disaster
management authorities to devise the mitigation strategies in
order to combat the effects of this natural hazard.
Open Access This article is distributed under the terms of the
Creative Commons Attribution License which permits any use, dis-
tribution, and reproduction in any medium, provided the original
author(s) and the source are credited.
References
Ansal A, Biro Y, Erken A, Guleru U (2004) Seismic microzonation: a
case study. Recent advances in earthquake engineering and
microzonation, vol 1. Kluwer Academic Publishers, Dordrecht,
pp 253–256
Bala A, Ritter JRR, Hannich D, Balan SF, Arion C. (2007a) Local site
effects based on in situ measurements in Bucharest City,
Romania. In: Proceedings of the International symposium on
Seismic Risk Reduction (ISSRR), paper 6, Bucharest, 367–374
Bala A, Zihan I, Ciugudean V, Raileanu V, Grecu B. (2007b) Physical
and dynamic properties of the Quaternary sedimentary layers in
and around Bucharest City. In: Proceedings of the International
Symposium on Seismic Risk Reduction (ISSRR), paper 7,
Bucharest, 359–366
Bard PY (1999) Microtremor measurements: a tool for site effect
estimation? In: Irikura K, Kudo K, Okada H, Sasatami T (eds)
The effects of surface geology on seismic motion. Balkema,
pp 1251–1279
Earthq Sci
123
Bour M, Fouissac D, Dominique P, Martin C (1998) On the use of
microtremor recordings in seismic microzonation. Soil Dyn
Earthq Eng 17:465–474
Chatelain JL, Guillier B (2013) Reliable fundamental frequencies of
soils and buildings down to 0.1 Hz obtained from ambient
vibration recordings with a 4.5-Hz sensor. Seismol Res Lett
84(2):199–209
Chavez-Garcia FJ, Sanchez LR, Hatzfeld D (1996) Topographic site
effects and HVNR. a comparison between observation and
theory. Bull Seismol Soc Am 86:1559–1573
Chavez-Garcıa FJ, Pedotti G, Hatzfeld D, Bard PY (1990) An
experimental study of site effects near Thessaloniki (Northern
Greece). Bull Seismol Soc Am 80:784–806
Faisal S (2005) A comparative study of the structural styles in the
Eastern Kala-Chitta Range (Fateh jang-HassanAbdal Transect),
Potwar Plateau National Center of Excellence in Geology,
University of Peshawer, N. Pakistan
Field EH, Jacob KH (1995) A comparison and test of various site
response estimation techniques, including three that are not
reference site dependent. Bull Seismol Soc Am 85:1127–1143
Geopsy Software Manual at www.geopsy.org
Horike M (1985) Inversion of phase velocity of long-period
microtremors to the S-wave-velocity structure down to the
basement in urbanized areas. J Phys Earth 33:59–96
Horike M, Zhao B, Kawase H (2001) Comparison of site response
characteristics inferred from microtremors and earthquake shear
waves. Bull Seismol Soc Am 91(6):1526–1536
Hunter JA, Benjumea B, Harris JB, Miller RD, Pullan SE, Burns RA,
Good RL (2002) Surface and down hole shear wave seismic
methods for thick soil site investigation. Soil Dyn Earthq Eng
22(9–12):931–941
Jaswal TM (1990) Structure and evolution of Dharnal oilfield,
Northern Potwar Deformed Zone, Pakistan. Thesis of Master of
Science in geology, Oregon State University
Konno K, Ohmachi T (1998) Ground-motion characteristics estimated
from spectral ratio between horizontal and vertical components
of microtremor. Bull Seismol Soc Am 88(1):228–241
Lachet C, Hatzfeld D, Bard P-Y, Theodulidis N, Papaioannou C,
Savvaidis A (1996) Site effects and microzonation in the city of
Thessaloniki (Greece) comparison of different approaches. Bull
Seismol Soc Am 86:1692–1703
Latif MA (1968) Contribution to geology and micropaleontology of
Hazara, West Pakistan. Verh Geol Bundesanst 3:92–94
Molnar S, Cassidy JF, Monahan PA, Dosso SE (2007) Comparison of
geophysical shear-wave velocity methods. In: Ninth Canadian
Conference on Earthquake Engineering Ottawa, ON, Canada
26–29 June 2007
Morales J, Vidal F, Pena A, Alguacil G, Inanez JM (1991)
Microtremor study in the sediment-filled basin of Zafarraya,
Granada (Southern Spain). Bull Seismol Soc Am 81(2):687–693
Nakamura Y (1989) A method for dynamic characteristics estimation
of subsurface using microtremor on the ground surface. Quart
Rep RTR 30(1):25–33
Nogoshi M, Igarashi T (1971) On the amplitude characteristics of
microtremor (part 2). J Seismol Soc Japan 24:26–40 (in Japanese
with English abstract)
Ohta Y, Kagami H, Goto N, Kudo K (1978) Observations of 1-5
second microtremors and their application to earthquake
engineering. Part I. Comparison with long-period accelerations
at the Tokachi-Oki earthquake of 1968. Bull Seismol Soc Am
68:767–779
Panou AA, Theodulidis N, Hatzidimitriou P, Savvadis A, Papazachos
CB (2005) Reliability tests of horizontal to vertical spectral ratio
based on ambient noise measurements in urban environment: the
case of Thessaloniki city (Northern Greece). Pure Appl Geophys
162:1–22
Parolai S, Bormann P, Milkereit C (2002) New relationships between
Vs thickness of sediments and resonance frequency calculated by
the H/V ratio of seismic noise for the Cologene area (Germany).
Bull Seismol Soc Am 92(6):2521–2527
Paudyal YR, Yatabe R, Bhandary NP, Dahal RK (2012) A study of
local amplification effect of soil layers on ground motion in the
Kathmandu valley using microtremor analysis. Earthq Eng Eng
Vib 11:257–268. doi:10.1007/s11803-012-0115-3
Plummer Charles C, McGeary D, Carlson DH (2005) Physical
Geology, 10th edn. McGraw-Hill, New York, pp 241–242
Qaisar M, Khan Karam, Iqbal Talat, Mahmood Tariq, Daud Shah M
(2008) Fateh jang (Pakistan) Earthquake of February 17, 1993:
source mechanism and intensity distribution. J Himalayan Earth
Sci 41:45–52
Ram Kumar M (2009) Geological hazards: causes consequences and
methods of containment. New India Publishing Agency, New
Delhi, pp 1–22
Ranjan R (2005) Seismic Response Analysis of Dehradun City, India.
M.Sc thesis submitted to International Institute for Geo-
information Science and Earth Observation Enschede, The
Netherlands
Ren YF, Wen RZ, Hiroaki Y, Toshihide K (2013) Site effects by
generalized inversion technique using strong motion recordings
of the 2008 Wenchuan earthquake. Earthq Eng Eng Vib 12:
165–184
SESAME (2004) Guideline for the implementation of the H/V
spectral ratio technique on ambient vibrations: measurements,
processing and interpretation. SESAME European research
project, WP12, pp 1–62
Shah SMI (1977) Stratigraphy of Pakistan: Mem. Geol. Surv, vol 12.
Geological Survey of Pakistan, p 138
Slob S, Hack R, Scarpas T, Bemmelen BV, Duque A (2002) A
methodology for seismic microzonation using GIS and SHAKE-
a case study for Armenia–Colombia. Engineering geology for
developing countries. In: van Rooy JL, Jermy CA (eds)
Proceedings of 9th Congress of the International Association
for Engineering Geology and the Environment, Durban, South
Africa, 16–20 September 2002
Street R, Wooery EW, Wang Z, Harris JB (2001) NEHRP soil
classifications for estimating site-dependent seismic coefficients
in the upper Mississippi embayments. Eng Geol 62(1–3):123–135
Way DS (1973) Terrain Analysis, Stroudsburg. Pennsylvania, Dow-
den Hutchinson and Ross
Wen RZ, Ren YF, Shi DC (2011) Improved HVSR site classification
method for free-field strong motion stations validated with
Wenchuan aftershock recordings. Earthq Eng Eng Vib 10(3):
325–337
Yamanaka H, Takemura M, Ishida H, Niwa M (1994) Characteristics
of long period microtremors and their applicability in explora-
tion of deep sediments. Bull Seismol Soc Am 84:1831–1841
Earthq Sci
123