Ambient noise levels in north central Italy
14
Ambient noise levels in north central Italy S. Marzorati and D. Bindi Istituto Nazionale di Geofisica e Vulcanologia, Via Bassini 15, I-20133, Milano, Italy ([email protected]) [1] The characteristics of background seismic noise in north central Italy have been investigated by means of velocity power spectral analysis within the frequency range 0.1–15 Hz. The method proposed by McNamara and Buland (2004) has been applied to estimate the probability density function (PDF) of power spectra computed for ten different stations. Since the target region is the most industrialized area of Italy, a large variability among the power spectra for different sites is observed in the frequency range 1– 15 Hz, with the noise levels at two stations exceeding the New High Noise Model (NHNM) of Peterson (1993). The 95th percentile of the PDF varies from 165 to 125 dB (relative to (m/s) 2 /Hz). This variability could significantly affect the detection capabilities of a network installed for recording the small to moderate size seismicity occurring in north central Italy. We also observed that the dispersion of the powers, estimated at each site as the difference between the 95th and the 5th percentiles, shows a positive trend with frequency that can be ascribed to the diurnal variation of the background noise levels. In the frequency range 0.1–1 Hz, the dominant feature is the double frequency (DF) peak of microseisms generated by oceanic storms. At one of the considered stations, the seasonal variability of the maximum amplitude of the DF peak has been observed in the period from April 2004 to December 2005. Considering the barometric maps provided by the UK Meteorological Office, we observed that the strongest powers in the range 0.10–0.25 Hz occur when intense storms are present over the North Atlantic Ocean, whereas the measurements of the height, frequency, and azimuth of the sea waves at two buoys of the Rete Ondametrica Italiana deployed in the Adriatic and Tyrrhenian seas suggest that the DF microseisms in the frequency range 0.25–0.50 Hz are generated by storms over the Mediterranean Sea. Finally, the analyzed region is characterized by two large-scale geologic features, namely, the Po Plain and the Alps. The impedance contrast between these two units causes a noise reduction of about 10 dB in the frequency range 0.2–0.6 Hz. Components: 6660 words, 10 figures, 2 tables. Keywords: seismic noise; probability density function; microseisms; cultural noise; north Italy. Index Terms: 3270 Mathematical Geophysics: Time series analysis (1872, 4277, 4475); 4299 Oceanography: General: General or miscellaneous; 7299 Seismology: General or miscellaneous. Received 23 January 2006; Revised 14 June 2006; Accepted 18 July 2006; Published 27 September 2006. Marzorati, S., and D. Bindi (2006), Ambient noise levels in north central Italy, Geochem. Geophys. Geosyst., 7, Q09010, doi:10.1029/2006GC001256. 1. Introduction [2] The installation of a seismic network requires the selection of sites suitable for housing the recording stations. The site selection procedure is generally a sequence of compromises between the selected network geometry, which depends on the assumed monitoring purposes, and the criteria G 3 G 3 Geochemistry Geophysics Geosystems Published by AGU and the Geochemical Society AN ELECTRONIC JOURNAL OF THE EARTH SCIENCES Geochemistry Geophysics Geosystems Article Volume 7, Number 9 27 September 2006 Q09010, doi:10.1029/2006GC001256 ISSN: 1525-2027 Copyright 2006 by the American Geophysical Union 1 of 14
Transcript of Ambient noise levels in north central Italy
Ambient noise levels in north central Italy
S. Marzorati and D. BindiIstituto Nazionale di Geofisica e Vulcanologia, Via Bassini 15, I-20133, Milano, Italy ([email protected])
[1] The characteristics of background seismic noise in north central Italy have been investigated by meansof velocity power spectral analysis within the frequency range 0.1–15 Hz. The method proposed byMcNamara and Buland (2004) has been applied to estimate the probability density function (PDF) ofpower spectra computed for ten different stations. Since the target region is the most industrialized area ofItaly, a large variability among the power spectra for different sites is observed in the frequency range 1–15 Hz, with the noise levels at two stations exceeding the New High Noise Model (NHNM) of Peterson(1993). The 95th percentile of the PDF varies from �165 to �125 dB (relative to (m/s)2/Hz). Thisvariability could significantly affect the detection capabilities of a network installed for recording the smallto moderate size seismicity occurring in north central Italy. We also observed that the dispersion of thepowers, estimated at each site as the difference between the 95th and the 5th percentiles, shows a positivetrend with frequency that can be ascribed to the diurnal variation of the background noise levels. In thefrequency range 0.1–1 Hz, the dominant feature is the double frequency (DF) peak of microseismsgenerated by oceanic storms. At one of the considered stations, the seasonal variability of the maximumamplitude of the DF peak has been observed in the period from April 2004 to December 2005. Consideringthe barometric maps provided by the UK Meteorological Office, we observed that the strongest powers inthe range 0.10–0.25 Hz occur when intense storms are present over the North Atlantic Ocean, whereas themeasurements of the height, frequency, and azimuth of the sea waves at two buoys of the ReteOndametrica Italiana deployed in the Adriatic and Tyrrhenian seas suggest that the DF microseisms in thefrequency range 0.25–0.50 Hz are generated by storms over the Mediterranean Sea. Finally, the analyzedregion is characterized by two large-scale geologic features, namely, the Po Plain and the Alps. Theimpedance contrast between these two units causes a noise reduction of about 10 dB in the frequency range0.2–0.6 Hz.
Components: 6660 words, 10 figures, 2 tables.
Keywords: seismic noise; probability density function; microseisms; cultural noise; north Italy.
Index Terms: 3270 Mathematical Geophysics: Time series analysis (1872, 4277, 4475); 4299 Oceanography: General:
General or miscellaneous; 7299 Seismology: General or miscellaneous.
Received 23 January 2006; Revised 14 June 2006; Accepted 18 July 2006; Published 27 September 2006.
Marzorati, S., and D. Bindi (2006), Ambient noise levels in north central Italy, Geochem. Geophys. Geosyst., 7, Q09010,
doi:10.1029/2006GC001256.
1. Introduction
[2] The installation of a seismic network requiresthe selection of sites suitable for housing the
recording stations. The site selection procedureis generally a sequence of compromises betweenthe selected network geometry, which depends onthe assumed monitoring purposes, and the criteria
G3G3GeochemistryGeophysics
Geosystems
Published by AGU and the Geochemical Society
AN ELECTRONIC JOURNAL OF THE EARTH SCIENCES
GeochemistryGeophysics
Geosystems
Article
Volume 7, Number 9
27 September 2006
Q09010, doi:10.1029/2006GC001256
ISSN: 1525-2027
Copyright 2006 by the American Geophysical Union 1 of 14

that a given site has to meet for being suitableto house a station. The selection criteria aregenerally based on off-site and in-field studies[Trnkoczy et al., 2002]. The off-site studies in-clude several considerations that exploit the apriori knowledge of the geographic region ofinterest, such as consideration of the seismo-geological and topographic conditions, accessibil-ity of the sites, data transmission and powerconsiderations. Moreover, the presence of poten-tial seismic sources acting in the analyzed regionhas also to be investigated during these studies.The off-site studies are followed by fieldwork ateach potential site. During the visit at each site,the conclusions drawn from the off-site studies arechecked (e.g., the easy of accessibility is verified,the availability of the power line is checked) andnoise measurements are performed. The charac-terization of the noise range at a given site, aswell as its spectral content, is an important taskfor establishing the theoretical performance of theseismic network. Since the characteristics of seis-mic noise depend greatly on both weather con-ditions and man-made activities, the noisewindows should be acquired with a daily frequencyand over periods long enough to sample all thefeatures of the seismic noise variability. Moreover,the length of each acquired time window shouldallow to resolve the spectral noise characteristics inthe frequency range typical of the sensor that has tobe installed. A detailed description of site selectionand the nature of seismic noise can be found in theIASPEI New Manual of Seismic Observatory Prac-tice [Bormann, 2002; Trnkoczy et al., 2002].
[3] In this work, we exploit noise measurementspreviously performed in several locations of northcentral Italy, to investigate the noise range forsites belonging to different geological settings,such as the alpine or large alluvial basin environ-ments, and placed in areas with a different degreeof urbanization. After a careful data processing,we apply a statistical approach based on powerspectral density functions (PSDs) to evaluate andcompare the range of seismic noise for differentstations [McNamara and Buland, 2004]. We com-pare the characteristics of the background noisepower with the level of anthropic noise andconsider the weather conditions in the NorthAtlantic Ocean and in the Mediterranean Sea.Finally, the reduction of noise power in themicroseism frequency band due to the seismic
impedance contrast between the Po Plain and theAlps is investigated.
2. Data Processing and Method
[4] Since we analyze data coming from severalexperiments not all designed for site selectionpurposes, the data set we handle is inhomogeneousin many aspects, such as data acquired by eithershort-period or broadband sensors, different set-tings of the acquisition protocols, and differentextension in time of the monitoring activity at eachsite. We investigate the variation of seismic noiseby computing the Probability Density Function(PDF) for a set of Power Spectral Densities (PSDs),following McNamara and Buland [2004]. Weprocessed time series 2 min long, recorded at bothnighttime and daytime with a sampling rate of 62.5sps; we removed the mean and we applied a digitalButterworth filter with passband 0.05–25 Hz forthe broadband sensors and 0.1–25 Hz for the short-period ones. Each time series is divided into 8 seg-ments of 40 s, overlapping by 75%, to reduce thevariance in the PSD calculation [Cooley and Tukey,1965] and applying a 10% cosine taper to reducespectral leakage. The spectrum of each segment iscomputed via the FFTW algorithm [Frigo andJohnson, 1998]. Finally, the instrumental responseis removed.
[5] The total power, representing the PSD estimate,is obtained from the square of the amplitudespectrum multiplied by the standard normalizationfactor 2Dt/N, where Dt is the sample interval andN is the number of samples [McNamara andBuland, 2004]. The PSD estimate is adjusted forthe scale factor (1/0.875) due to cosine tapering[Bendat and Piersol, 1971].
[6] The PSD obtained for each 2 minute time seriesis estimated as the average of the PSDs computedfor each of the 8 separate overlapping time seg-ments and converted into decibels with respect tovelocity (m/s)2/Hz. Then the PSDs are used toconstruct the PDF for each station. We compute adistribution of probability at re-sampled discretefrequencies Fc evenly spaced in a logarithmicscale. Each frequency Fc is selected as the geo-metric mean frequency within a one octave inter-val, i.e., Fc = (F1 * F2)
0.5, where the consideredinterval extends from frequency F1 to F2 = 2F1.The next Fc is then computed by shifting theinterval by one-sixteenth of an octave. Powers
GeochemistryGeophysicsGeosystems G3G3
marzorati and bindi: ambient noise levels in italy 10.1029/2006GC001256
2 of 14

are averaged over ±10% of Fc and grouped intobins 1-dB wide, ranging from �200 to �80 dB.The frequency distribution at each Fc results fromthe number of spectral estimates that fall into a bindivided the total number of spectral estimates. ThePDF has been computed without isolating thehorizontal components from the vertical ones.Figure 1 shows the PDFs for the 10 stationsdescribed in Table 1. Some stations are equippedwith broadband (Nanometrics Trillium, flat re-sponse in the frequency range 0.025–50 Hz) orenlarged-band (Lennartz-3D/5s, flat response in therange 0.2–40 Hz range) sensors, while other sta-tions are equipped with short-period sensors (MarkL4-3D or Lennartz-3D Lite/1s). After some cali-bration tests [see also Parolai et al., 2001], weassume that the power spectra estimated for short-period recordings corrected for instrumental re-sponse are reliable for frequencies >0.2 Hz, whilethe power spectra for broadband or enlarged-bandinstrumentally corrected recordings will be dis-cussed for frequencies >0.1 Hz. Finally, we alsocompute the PDF mode, mean, 5th, and 95thpercentile.
3. Geological Settings
[7] The investigated area is included in the Alpineorogenesis, a zone between the Africa and Europeconvergent plate margins. The post-Oligocene ex-tensional systems in the western Mediterranean,governed by rollback of subduction zones andback-arc extension [Rosenbaum and Lister,2002], concurred to set out the current geomorpho-logical features. In the analyzed area we distin-guish two main sectors: the first covers part of thecentral and Southern Alps, while the secondencompasses part of the Po Plain (Figure 1).
[8] The Alpine sector mainly consists of metamor-phic basement (hercynian metapelites, minorquartzites, metabasites, marbles, granitoids,orthogneiss) to the north of the Insubric line(Figure 1) and of carbonate platform, basinal andshallow marine deposits (limestones, dolomites,turbidites) in the Southern Alps [Carminati andSiletto, 1997; Milano et al., 1988; Siletto et al.,1993]. The Alpine chain is typified by deep valleysfilled with glacial and fluvioglacial deposits. The
main valleys led to the Po Plain, with widemorainal amphitheaters.
[9] The Po Plain is a syntectonic sedimentary basinforming the infill of the Pliocene-PleistoceneApenninic foredeep, bounded by Apennines tothe south and by Alps to the north [Amorosi etal., 1996]. The maximum depth of the Quaternarydeposits ranges between 1000 and 1500 m [Pieriand Groppi, 1981] and covers the foreland of thetwo mountain chains. The superficial geologicallayers are fluvial terraces and alluvial deposits. Thedensity of rocks ranges from 2.20 (Quaternarydeposits) to 2.80 (Mesozoic rocks) g/cm3 [Cassanoet al., 1986]. On the basis of the shear wavevelocity and density values, a heterogeneous dis-tribution of acoustic impedance within the investi-gated region exists. In particular, a strong lateralcontrast between the Alps and the Po Plain isexpected, the acoustic impedance being higher inthe Alps.
[10] Table 1 shows the main characteristics of theconsidered seismological stations. The sites areclassified by adopting the simplified geologicalmap recently proposed by Bordoni et al. [2003].The outcropping formations are classified intothree classes, from rock to soft soil (Table 2),following the EuroCode8 [European Committeefor Standardization, 2002]. Most of the sites de-scribed in Table 1 belong to class A (rock site),even if all the three geological conditions arerepresented.
4. Infrastructural Settings
[11] The target region (Figure 1) is the mostindustrialized area of Italy. A significant transportnetwork, with both highways and railways, hasbeen developed in this area where the residentpopulation is about 15 million of inhabitants.Furthermore, the sector of the Po plain includedin the investigated area is characterized by anintensive agricultural activity. Thus several strongsources of noise are distributed within this area. AGeographical Information System (GIS) map of theinfrastructures has been created to display a likelydistribution of the anthropic source of noise(Figure 1). The map shows the density of indus-tries, the most relevant roads and railways, and the
Figure 1. PDFs for the selected sites in north central Italy. The New High Noise Model (black solid line) and theNew Low Noise Model (black dashed line) of Peterson [1993] are also shown. The map shows the station locations,the infrastructures, the urbanized areas, and the density of industries.
GeochemistryGeophysicsGeosystems G3G3
marzorati and bindi: ambient noise levels in italy 10.1029/2006GC001256marzorati and bindi: ambient noise levels in italy 10.1029/2006GC001256
3 of 14

Figure 1
GeochemistryGeophysicsGeosystems G3G3
marzorati and bindi: ambient noise levels in italy 10.1029/2006GC001256
4 of 14

distribution of civil buildings. The density ofindustries has been computed by normalizing thenumber of economic entities to the area of themunicipal district. The information about the eco-nomic entities has been provided by the ItalianInstitute for Statistics, ISTAT (http://www.istat.it).The informational layer about civil buildings hasbeen derived from the map of census sections asdefined in the ISTAT practices. Figure 1 shows thatthe density of industries, transport ways and civilbuildings is higher in the sector between thesouthern border of the Alps and the northern partof the Po Plain.
5. Discussion
[12] The background seismic noise is generated byseveral types of sources. While the high frequencyseismic noise (frequency >1 Hz) is mainly causedby man-made activities [Kulhanek, 1990; Okada,2003; McNamara and Buland, 2004], the seismicnoise for frequency <1 Hz is mainly determined by
weather conditions [e.g., Longuet-Higgins, 1950;Friedrich et al., 1998]. In this section, we detail thenoise power estimated for the selected sites consid-ering the frequency bands 0.1–1 Hz and 1–15 Hzseparately.
5.1. Frequencies >1 Hz
[13] Man-made activities are the dominant sourcesof high-frequency noise, referred to as culturalnoise and originated from the coupling of trafficand machinery energy into the Earth. Figure 1shows the PDFs for the analyzed stations. Sincethe cultural noise attenuates within several kilo-meters in distance, both the level and the shape ofthe noise power in the high-frequency range arestrongly different from site to site. The highestnoise levels are observed for those stations locatedclose to areas with high density of industries andinfrastructures (MER2, MI61, SONC, CTLE,NEGR, ASO2). In particular, the PDFs for stationsCTLE and SONC, located in the middle of the PoPlain, exceed the New High Noise Model (NHNM)
Table 1. Seismological Stationsa
CodeLong.,North
Lat.,East
Elevation,m Sensor
InstallationType Depth Class
MI61 9.93 45.64 253 Mark L4 - 3D/1 s basement of a municipal building surface BMI50 9.29 46.01 219 Mark L4 - 3D/1 s cave <10 m ASONC 9.86 45.41 90 Mark L4 - 3D/1 s hole in the ground surface BMAR2 10.12 45.74 600 Nanom. -Trillium/40 s basement of a little civil building surface AMER2 9.42 45.67 350 Nanom. -Trillium/40 s concrete in shelter surface BASO2 11.92 45.8 221 Lennartz - 3D Lite/1 s medieval fortress on rock surface ANEGR 10.95 45.5 167 Lennartz - 3D/5 s abandoned iron mine <10 m ABAG3 10.46 45.82 807 Lennartz - 3D/5 s basement of a school on rock surface AMAL3 9.86 46.29 2030 Lennartz - 3D/5 s concrete on rock surface ACTLE 9.76 45.27 66 Lennartz - 3D Lite/1 s basement of a farm surface C
aThe classes are explained in Table 2.
Table 2. Geological Description of the Considered Sitesa
Class Lithotype Vs, m/s Description
A rock >800 Marine clay and all the others rocks (LowerPleistocene and Pliocene); volcanic rockand deposits
B stiff soil 400 < Vs < 800 colluvial, alluvial, lacustrine, beach, fluvialterraces, glacial deposits and clay(Middle-Upper Pleistocene); sand and looseconglomerate (Pleistocene and Pliocene);travertine (Pleistocene and Holocene)
C soft soil <400 colluvial, alluvial, lacustrine, beach, fluvialterraces deposits (Holocene)
aThe lithotypes are grouped into three categories, A, B, and C, following Bordoni et al. [2003].
GeochemistryGeophysicsGeosystems G3G3
marzorati and bindi: ambient noise levels in italy 10.1029/2006GC001256
5 of 14
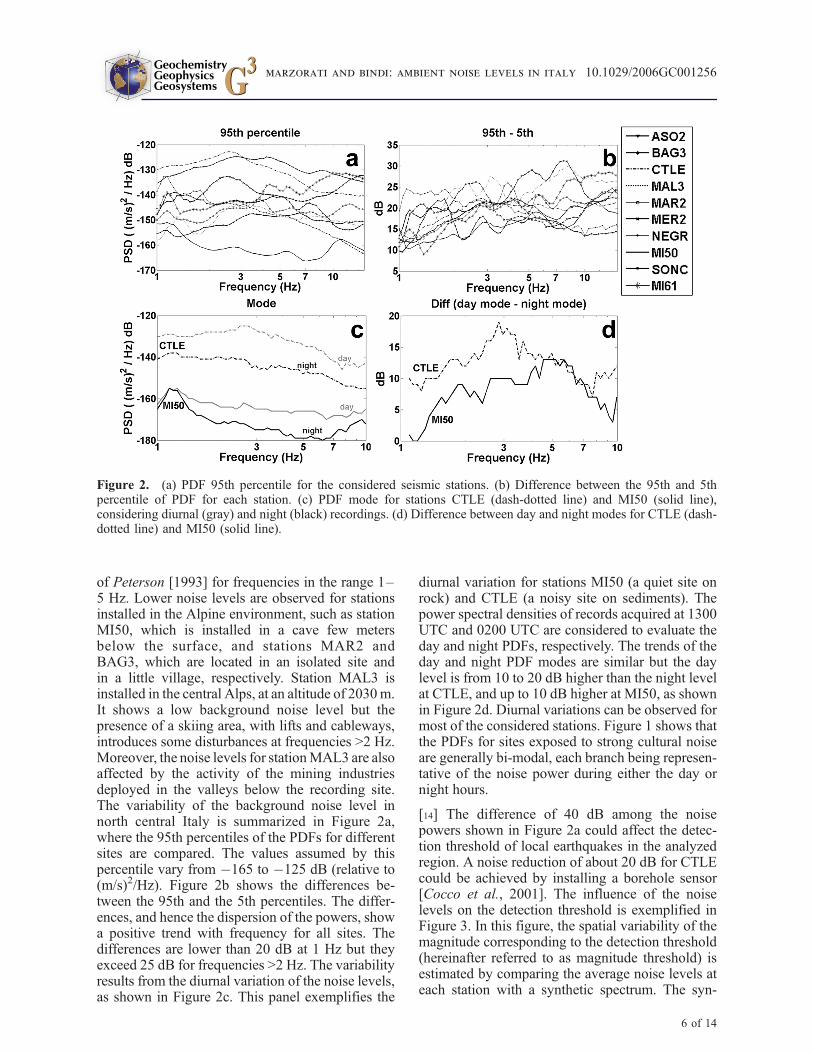
of Peterson [1993] for frequencies in the range 1–5 Hz. Lower noise levels are observed for stationsinstalled in the Alpine environment, such as stationMI50, which is installed in a cave few metersbelow the surface, and stations MAR2 andBAG3, which are located in an isolated site andin a little village, respectively. Station MAL3 isinstalled in the central Alps, at an altitude of 2030m.It shows a low background noise level but thepresence of a skiing area, with lifts and cableways,introduces some disturbances at frequencies >2 Hz.Moreover, the noise levels for stationMAL3 are alsoaffected by the activity of the mining industriesdeployed in the valleys below the recording site.The variability of the background noise level innorth central Italy is summarized in Figure 2a,where the 95th percentiles of the PDFs for differentsites are compared. The values assumed by thispercentile vary from �165 to �125 dB (relative to(m/s)2/Hz). Figure 2b shows the differences be-tween the 95th and the 5th percentiles. The differ-ences, and hence the dispersion of the powers, showa positive trend with frequency for all sites. Thedifferences are lower than 20 dB at 1 Hz but theyexceed 25 dB for frequencies >2 Hz. The variabilityresults from the diurnal variation of the noise levels,as shown in Figure 2c. This panel exemplifies the
diurnal variation for stations MI50 (a quiet site onrock) and CTLE (a noisy site on sediments). Thepower spectral densities of records acquired at 1300UTC and 0200 UTC are considered to evaluate theday and night PDFs, respectively. The trends of theday and night PDF modes are similar but the daylevel is from 10 to 20 dB higher than the night levelat CTLE, and up to 10 dB higher at MI50, as shownin Figure 2d. Diurnal variations can be observed formost of the considered stations. Figure 1 shows thatthe PDFs for sites exposed to strong cultural noiseare generally bi-modal, each branch being represen-tative of the noise power during either the day ornight hours.
[14] The difference of 40 dB among the noisepowers shown in Figure 2a could affect the detec-tion threshold of local earthquakes in the analyzedregion. A noise reduction of about 20 dB for CTLEcould be achieved by installing a borehole sensor[Cocco et al., 2001]. The influence of the noiselevels on the detection threshold is exemplified inFigure 3. In this figure, the spatial variability of themagnitude corresponding to the detection threshold(hereinafter referred to as magnitude threshold) isestimated by comparing the average noise levels ateach station with a synthetic spectrum. The syn-
Figure 2. (a) PDF 95th percentile for the considered seismic stations. (b) Difference between the 95th and 5thpercentile of PDF for each station. (c) PDF mode for stations CTLE (dash-dotted line) and MI50 (solid line),considering diurnal (gray) and night (black) recordings. (d) Difference between day and night modes for CTLE (dash-dotted line) and MI50 (solid line).
GeochemistryGeophysicsGeosystems G3G3
marzorati and bindi: ambient noise levels in italy 10.1029/2006GC001256
6 of 14

thetic spectrum is computed by considering the w-square source model [Brune, 1970] for a distribu-tion of earthquakes located at each node of aregular grid having a step of 25 km. The sourcespectrum is propagated to each station consideringthe 1/R geometrical spreading term. We assumedthat an earthquake is detected by the network whenthe signal-to-noise ratio, computed over the 1 to10 Hz frequency range, is larger than 3 for threestations, at least. During the day hours (top leftpanel), the smallest magnitude thresholds are rele-vant to earthquakes occurring within the areadelimited by the stations installed in the Alpineenvironment, while during the nighttime (top rightpanel) the area corresponding to the smallest de-tection thresholds becomes wider since the noiselevels at the stations installed in the Po Plaindecrease during the nighttime. To stress the influ-
ence of the noise levels on the detection threshold,the bottom frames of Figure 3 show the estimatedmagnitude thresholds assuming that all the stationshave a noise level equals to either the noise level atstation CTLE during the daytime (bottom leftpanel), or the level estimated for station MI50during the nighttime (bottom right panel). Whilein the former case the smallest detected threshold isclose to 2.5, in the latter case the threshold magni-tude is <2 for earthquakes occurring within a widearea.
[15] Figure 1 shows that a peak around 1.1 Hz ispresent in the PDFs for the considered sites, eventif it is partially masked by the high level of thebackground noise affecting the recordings of somestations (e.g., SONC and CTLE). Figure 4, toppanel, exemplifies the variation with time of thePSD maximum in the range 1–1.2 Hz, considering
Figure 3. Results of the synthetic test performed for estimating the spatial variability of the detection thresholds ofthe network deployed in the analyzed area (white triangles). Top panels: the threshold magnitude has been computedby comparing the average daytime (left panel) and nighttime (right panel) noise levels at each station with the Brune[1970] source model attenuated for the 1/R geometrical spreading. Bottom panels: detection thresholds estimatedusing the daytime average noise level of station CTLE (left panel) and the nighttime average noise level of stationMI50 (right panel) for all the stations.
GeochemistryGeophysicsGeosystems G3G3
marzorati and bindi: ambient noise levels in italy 10.1029/2006GC001256
7 of 14

the night recordings at stations BAG3, MAR2, andCTLE. The maxima oscillate around an averagevalue of �159 dB, �155 dB, and �137 dB forBAG3, MAR2 and CTLE stations, respectively,excluding three intervals where a significant di-minishment of the maxima takes place. The inter-vals A and C correspond to August 2004 and 2005,respectively, whereas interval B spans the daysfrom 23 December 2004 to 9 January 2005. Sincethe three intervals correspond to periods of lowindustrial and anthropic activities (summer andChristmas holidays in Italy), we conclude that the1.1 Hz peak is correlated with the level of theanthropic activities. Array measurements will beperformed both to determine the noise sources forthe 1.1 Hz peak and to investigate alternativeexplanations for its origin [e.g., Correig andUrquizu, 2002], since the presence of a spectral
peak at multiple stations with a constant frequencycould be exploited to study temporal variation inthe properties of the Earth’s crust.
5.2. Frequencies in the Range 0.1–1 Hz
[16] In the frequency range 0.1–1 Hz, the PDFsshown in Figure 1 are dominated by a peak calledthe double-frequency (DF) peak [Longuet-Higgins,1950]. It is generated by ocean waves traveling inopposite directions and having equal period; thesuperposition of these waves generates gravitystanding waves of half-period that cause a non-linear pressure perturbation that propagates to theocean bottom. The DF microseism level dependson the amplitude of ocean waves, the size of thegeneration region and on the propagation charac-teristics [Longuet-Higgins, 1950; Hasselmann,1963; Friedrich et al., 1998; Bromirski and Duen-nebier, 2002]. The correlation between the DFpeak and the presence of ocean storms is supportedby the observation of seasonal variability of the DFfeatures. Figure 5 shows the noise seasonal vari-ability for station MAR2, which is equipped with abroadband sensor. We estimated the PDF by con-sidering the summer (left panel) and winter (middlepanel) recordings. For frequencies <1 Hz, theseasonal variability of noise is evident. In winter,the noise power is higher than in summer and thepeak of the mode is shifted toward lower frequen-cies (Figure 5, right panel), in agreement withearlier works [e.g., Stutzmann et al., 2000]. It isworth noting that the winter and summer noiselevels shown in Figure 5 are similar for frequencies>1 Hz since the short-period background noise ismainly dominated by man-made activities, as pre-viously discussed. Figure 6 shows the maximumvalues, in the range 0.1–0.3 Hz, of the powerspectral densities relative to 2872 daily recordings
Figure 4. Night PSD maximum values in the range1.0–1.2 Hz for stations CTLE, MAR2, and BAG3 fromJune 2004 to October 2005. The solid lines are themoving averages computed over five measurements.Sectors A and C identify August 2004 and 2005,respectively. Sector B ranges from 23 December 2004 to9 January 2005.
Figure 5. Seasonal variations of noise level for station MAR2. (left) PDF of summer recordings; (middle) PDF ofwinter recordings; and (right) PDF mode of winter (blue solid line) and summer (red dashed line) recordings.
GeochemistryGeophysicsGeosystems G3G3
marzorati and bindi: ambient noise levels in italy 10.1029/2006GC001256
8 of 14

from March 2004 to November 2005. The corre-lation of DF level with seasons is evident forstation MAR2 and the maximum values show aperiodic behavior with a difference of about 25 dBbetween the winter and summer recordings. Somevalues behave as outliers with respect to the meantrend. Most of these values are relative to the DFmicroseisms generated by intense Atlantic storms.Figure 7 shows the example of September 2005.We detect some significant meteorological eventsby analyzing the barometric maps of AtlanticOcean and Europe collected from the UK Meteo-rological Office (http://www.metoffice.gov.uk/weather/charts/index.html) and the sea height mea-sured at two buoys belonging to the Rete Onda-metrica Italiana (http://www.apat.gov.it). Duringthe days 14, 21, and 27 September, three strongDF peaks appear in spectral components of stationMAR2, in the range 0.10–0.25 Hz; in correspon-dence to these days, deep sea level pressure min-ima are present over the North Atlantic Ocean(Figure 7). The locations of the barometric minimasuggest the presence of North Atlantic storms ableto generate the DF microseisms within some of thesource regions previously detected by Friedrich etal. [1998]. They analyzed broadband continuousrecordings at the Grafenberg array (southern Ger-many, about 500 km north of the Po Plain) to locatethe generating areas of DF microseisms.Performing a frequency-wave number analysis,they identified five source areas: the strongestsource is located near the north Norwegian coast
while minor sources are located in the AtlanticOcean at the latitudes of Ireland and France (fordetails, see Figure 6 of Friedrich et al. [1998]).Finally, they detected a source region also in theMediterranean Sea. The locations of the strongestevents in Figure 7, which occurred on 21 and 27September, are in good agreement with two of thesource regions identified by Friedrich et al. [1998].
[17] The PSDs in Figure 7 show the presence ofDF peaks also in the range 0.25–0.50 Hz. Thepresence of two frequency bands for the DF peak isemphasized in the left middle panel of Figure 7,where the PSD is normalized to the mean spectralamplitude at each frequency [Bromirski et al.,2005]. Figure 8 shows the height of the sea wavesmeasured at two buoys deployed in the TyrrhenianSea (buoy LSP) and in the Adriatic Sea (buoyANC). The frequency and azimuth of sea wavesmeasured at the buoys on 12, 17, 18, and 29September are also shown. The frequency rangesfrom 0.15 to 0.22 Hz and the propagation azimuthsare about 63� and 220� for the Adriatic andTyrrhenian seas, respectively, which means thatthe sea waves propagate almost perpendicular tothe coasts. If we assume that a superposition ofthese waves and those reflected from the shorelinesare able to generate gravity standing waves of half-period, then the observed maxima in the range0.25–0.50 Hz are quite well correlated to the localconditions in the Adriatic and Tyrrhenian seas. Thesplitting of the DF peak into two peaks has been
Figure 6. Maximum values of PSD in the range 0.1–0.3 Hz for station MAR2. Recordings at 0200 UTC and 1200UTC from March 2004 to November 2005 are considered.
GeochemistryGeophysicsGeosystems G3G3
marzorati and bindi: ambient noise levels in italy 10.1029/2006GC001256
9 of 14

previously observed by Stephen et al. [2003] andBromirski et al. [2005]. In particular, Bromirski etal. [2005], who referred to these peaks as long-period DF (LPDF) and short-period DF (SPDF),
concluded that short-period DF microseisms aregenerated by rapid shift of local winds and bynearby storms [see also Kibblewhite and Ewans,1985; Herbers and Guza, 1994] while long-period
Figure 7. (top left) PSDs in the frequency band 0.1–1.0 Hz, for station MAR2 during September 2005. (middleleft) The same as in the top left panel but the PSDs are normalized to the mean spectral amplitude at each frequency.The right panels show, from top to bottom, the barometric maps of 14, 21, and 27 September 2005. The black ellipseshighlight the barometric minima over the Atlantic Ocean and the respective associated values of PSD for stationMAR2. The red rectangles delimit the investigated area in north central Italy (bottom left). The purple ellipses refer toFigure 8. The maps have been provided by the UK Meteorological Office (http://www.metoffice.gov.uk/weather/charts/index.html).
GeochemistryGeophysicsGeosystems G3G3
marzorati and bindi: ambient noise levels in italy 10.1029/2006GC001256
10 of 14

DF microseisms are often generated in near-coastalareas, where the swells from distant storms arereflected by the shoreline, and only under favorableweather conditions in the open ocean [see alsoBromirski and Duennebier, 2002]. Furthermore,Bromirski et al. [2005] showed that the energyassociated to the SPDF does not propagate effi-ciently along the oceanic floor and it attenuateswithin few hundred kilometers. In our case, theLPDF microseisms are generated in the NorthAtlantic Ocean and travel for some thousand kilo-meters through the European continental crust,while the SPDF microseisms seems to be generatedin the Mediterranean Sea, few hundred kilometersfar from the considered sites.
5.3. Noise Reduction due to LateralImpedance Contrast
[18] Finally, we investigate the reduction of noisepower when the seismic waves propagate acrosstwo adjacent media with different acoustic imped-ance, defined as the product between the seismicvelocity and density of each medium. Figure 9shows the PDFs for three stations installed indifferent geological contexts: station MAR2 is
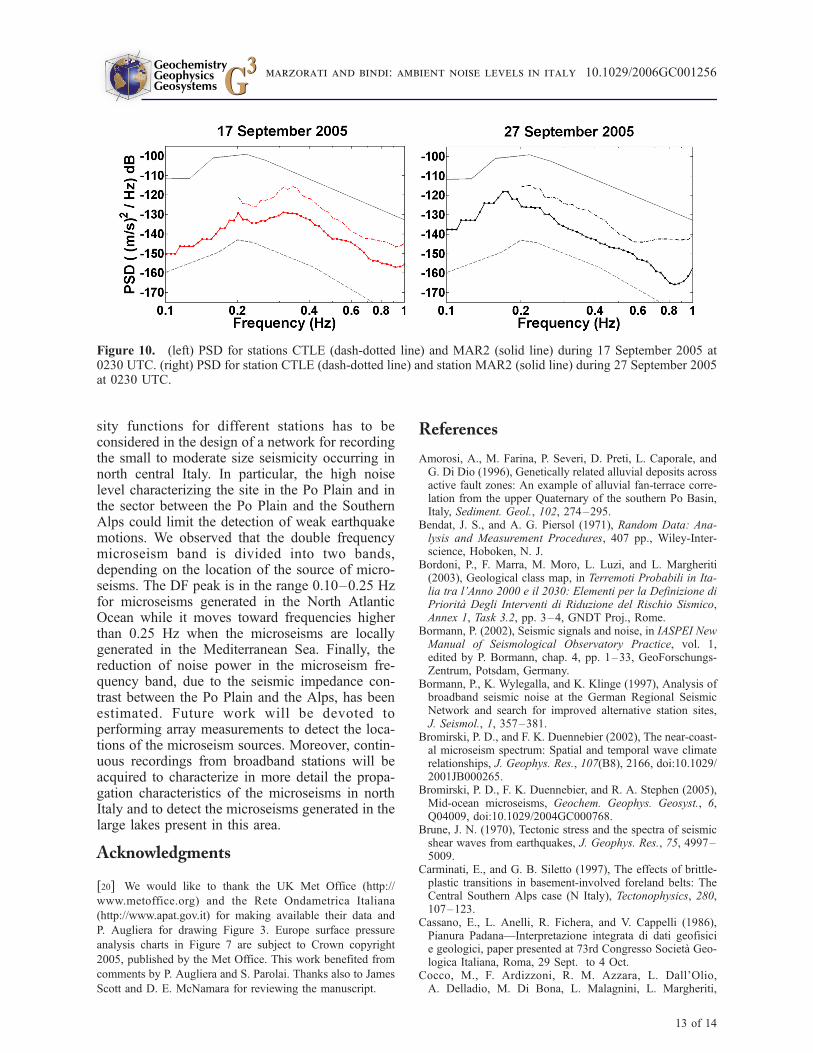
installed on rocks in the southern Alps (class Aof Table 1), station CTLE is installed over a thicksedimentary cover in the Po plain (class C) andASO2 site is located on a Pliocene hill at themargin of the Po Plain, partially covered by PoPlain sediments (class B). Since the power spectrafor frequency >1 Hz are strongly influenced by theman-made activities and the maximum amplitudeof the DF peak cannot be reliably estimated be-cause CTLE and ASO2 are equipped with short-period sensors, we compare the 5th percentile ofPDFs over the frequency range 0.2–0.6 Hz. Weobserve an average power reduction for MAR2 ofabout 15 dB and 7 dB when compared with thepowers for CTLE and ASO2, respectively. Thestronger reduction of noise power between CTLEand MAR2 agrees with a higher average lateralimpedance contrast between the Po Plain and theAlps than the average impedance contrast betweenthe Pliocene hills and the Alps. To confirm the roleplayed by the geology in the reduction of noisepower, Figure 10 compares the power spectraldensity computed at stations CTLE and MAR2for data recorded on 17 September 2005 (at 0230UTC) and on 27 September 2005 (at 0230 UTC),that we previously discussed (Figures 7 and 8). In
Figure 8. Data relative to buoys located in the Tyrrhenian Sea (LSP) and in the Adriatic Sea (ANC) operated by theRete Ondametrica Nazionale. (bottom left) Locations of the buoys (LSP, ANC) and the seismic station (MAR2). (topleft) Average height (Hm0) of sea wave at LSP (black) and ANC (gray) during September 2005; the purple ellipseshighlight the maximum amplitude of waves, and the respective associated values of the PSD are shown in Figure 7.Both the recorded sea wave frequency (top right) and azimuth (bottom right) relevant to the maximum sea heightduring 12, 17, 18, and 29 September 2005 are also shown.
GeochemistryGeophysicsGeosystems G3G3
marzorati and bindi: ambient noise levels in italy 10.1029/2006GC001256
11 of 14
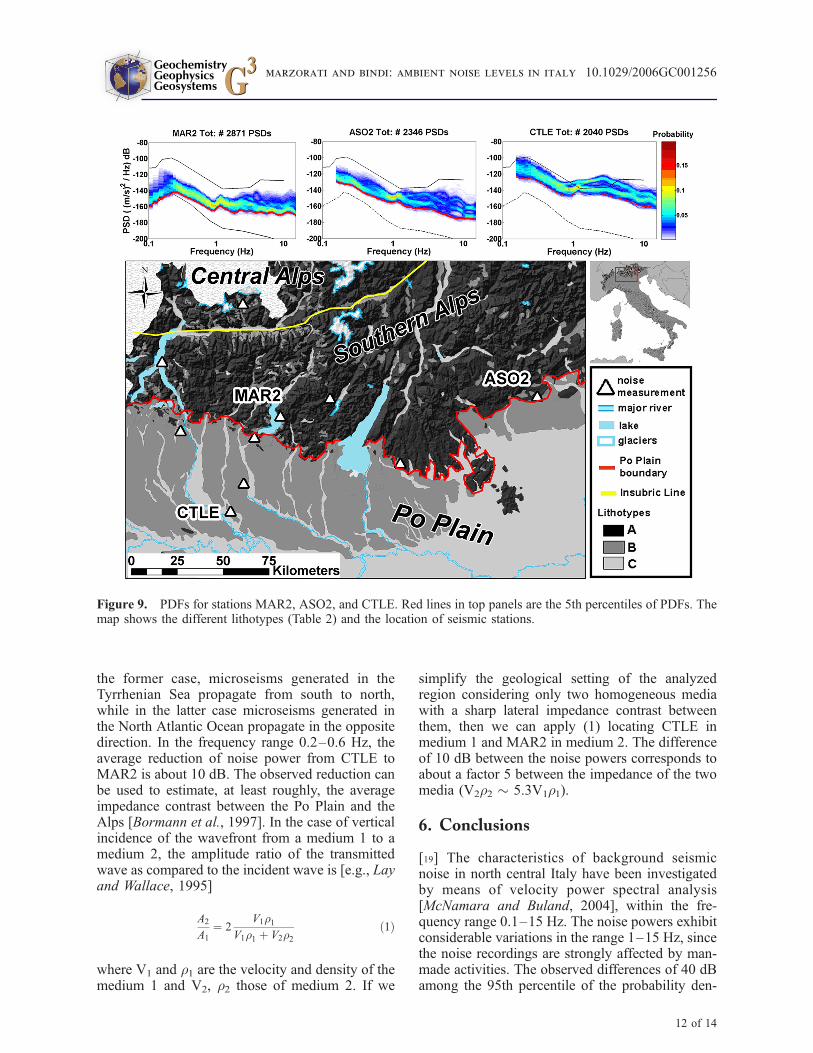
the former case, microseisms generated in theTyrrhenian Sea propagate from south to north,while in the latter case microseisms generated inthe North Atlantic Ocean propagate in the oppositedirection. In the frequency range 0.2–0.6 Hz, theaverage reduction of noise power from CTLE toMAR2 is about 10 dB. The observed reduction canbe used to estimate, at least roughly, the averageimpedance contrast between the Po Plain and theAlps [Bormann et al., 1997]. In the case of verticalincidence of the wavefront from a medium 1 to amedium 2, the amplitude ratio of the transmittedwave as compared to the incident wave is [e.g., Layand Wallace, 1995]
A2
A1
¼ 2V1r1
V1r1 þ V2r2ð1Þ
where V1 and r1 are the velocity and density of themedium 1 and V2, r2 those of medium 2. If we
simplify the geological setting of the analyzedregion considering only two homogeneous mediawith a sharp lateral impedance contrast betweenthem, then we can apply (1) locating CTLE inmedium 1 and MAR2 in medium 2. The differenceof 10 dB between the noise powers corresponds toabout a factor 5 between the impedance of the twomedia (V2r2 � 5.3V1r1).
6. Conclusions
[19] The characteristics of background seismicnoise in north central Italy have been investigatedby means of velocity power spectral analysis[McNamara and Buland, 2004], within the fre-quency range 0.1–15 Hz. The noise powers exhibitconsiderable variations in the range 1–15 Hz, sincethe noise recordings are strongly affected by man-made activities. The observed differences of 40 dBamong the 95th percentile of the probability den-
Figure 9. PDFs for stations MAR2, ASO2, and CTLE. Red lines in top panels are the 5th percentiles of PDFs. Themap shows the different lithotypes (Table 2) and the location of seismic stations.
GeochemistryGeophysicsGeosystems G3G3
marzorati and bindi: ambient noise levels in italy 10.1029/2006GC001256
12 of 14
sity functions for different stations has to beconsidered in the design of a network for recordingthe small to moderate size seismicity occurring innorth central Italy. In particular, the high noiselevel characterizing the site in the Po Plain and inthe sector between the Po Plain and the SouthernAlps could limit the detection of weak earthquakemotions. We observed that the double frequencymicroseism band is divided into two bands,depending on the location of the source of micro-seisms. The DF peak is in the range 0.10–0.25 Hzfor microseisms generated in the North AtlanticOcean while it moves toward frequencies higherthan 0.25 Hz when the microseisms are locallygenerated in the Mediterranean Sea. Finally, thereduction of noise power in the microseism fre-quency band, due to the seismic impedance con-trast between the Po Plain and the Alps, has beenestimated. Future work will be devoted toperforming array measurements to detect the loca-tions of the microseism sources. Moreover, contin-uous recordings from broadband stations will beacquired to characterize in more detail the propa-gation characteristics of the microseisms in northItaly and to detect the microseisms generated in thelarge lakes present in this area.
Acknowledgments
[20] We would like to thank the UK Met Office (http://
www.metoffice.org) and the Rete Ondametrica Italiana
(http://www.apat.gov.it) for making available their data and
P. Augliera for drawing Figure 3. Europe surface pressure
analysis charts in Figure 7 are subject to Crown copyright
2005, published by the Met Office. This work benefited from
comments by P. Augliera and S. Parolai. Thanks also to James
Scott and D. E. McNamara for reviewing the manuscript.
References
Amorosi, A., M. Farina, P. Severi, D. Preti, L. Caporale, andG. Di Dio (1996), Genetically related alluvial deposits acrossactive fault zones: An example of alluvial fan-terrace corre-lation from the upper Quaternary of the southern Po Basin,Italy, Sediment. Geol., 102, 274–295.
Bendat, J. S., and A. G. Piersol (1971), Random Data: Ana-lysis and Measurement Procedures, 407 pp., Wiley-Inter-science, Hoboken, N. J.
Bordoni, P., F. Marra, M. Moro, L. Luzi, and L. Margheriti(2003), Geological class map, in Terremoti Probabili in Ita-lia tra l’Anno 2000 e il 2030: Elementi per la Definizione diPriorita Degli Interventi di Riduzione del Rischio Sismico,Annex 1, Task 3.2, pp. 3–4, GNDT Proj., Rome.
Bormann, P. (2002), Seismic signals and noise, in IASPEI NewManual of Seismological Observatory Practice, vol. 1,edited by P. Bormann, chap. 4, pp. 1–33, GeoForschungs-Zentrum, Potsdam, Germany.
Bormann, P., K. Wylegalla, and K. Klinge (1997), Analysis ofbroadband seismic noise at the German Regional SeismicNetwork and search for improved alternative station sites,J. Seismol., 1, 357–381.
Bromirski, P. D., and F. K. Duennebier (2002), The near-coast-al microseism spectrum: Spatial and temporal wave climaterelationships, J. Geophys. Res., 107(B8), 2166, doi:10.1029/2001JB000265.
Bromirski, P. D., F. K. Duennebier, and R. A. Stephen (2005),Mid-ocean microseisms, Geochem. Geophys. Geosyst., 6,Q04009, doi:10.1029/2004GC000768.
Brune, J. N. (1970), Tectonic stress and the spectra of seismicshear waves from earthquakes, J. Geophys. Res., 75, 4997–5009.
Carminati, E., and G. B. Siletto (1997), The effects of brittle-plastic transitions in basement-involved foreland belts: TheCentral Southern Alps case (N Italy), Tectonophysics, 280,107–123.
Cassano, E., L. Anelli, R. Fichera, and V. Cappelli (1986),Pianura Padana—Interpretazione integrata di dati geofisicie geologici, paper presented at 73rd Congresso Societa Geo-logica Italiana, Roma, 29 Sept. to 4 Oct.
Cocco, M., F. Ardizzoni, R. M. Azzara, L. Dall’Olio,A. Delladio, M. Di Bona, L. Malagnini, L. Margheriti,
Figure 10. (left) PSD for stations CTLE (dash-dotted line) and MAR2 (solid line) during 17 September 2005 at0230 UTC. (right) PSD for station CTLE (dash-dotted line) and station MAR2 (solid line) during 27 September 2005at 0230 UTC.
GeochemistryGeophysicsGeosystems G3G3
marzorati and bindi: ambient noise levels in italy 10.1029/2006GC001256
13 of 14

and A. Nardi (2001), Broadband waveforms and siteeffects at a borehole seismometer in the Po alluvial basin(Italy), Ann. Geofis., 44(1), 137–154.
Cooley, J. W., and J. W. Tukey (1965), An algorithm formachine calculation of complex Fourier series, Math. Com-put., 19, 297–301.
Correig, A. M., and M. Urquizu (2002), Some dynamicalcharacteristics of microseism time-series, Geophys. J. Int.,149, 589–598.
European Committee for Standardization (2002), Design pro-visions for earthquake resistance of structures: Seismic ac-tions and general requirements of structures (draft), CEN/TC250, ENV 1998-1-1, EUROCODE 8, Brussels, May.
Friedrich, A., F. Kruger, and K. Klinge (1998), Ocean gener-ated microseismic noise located with the Grafenberg array,J. Seismol., 2, 47–64.
Frigo, M., and S. G. Johnson (1998), FFTW: An adaptivesoftware architecture for the FFT, in Proceedings of the1998 IEEE International Conference on Acoustics, SpeechAnd Signal Processing, vol. 3, pp. 1381–1384, Int. Electron.and Electr. Eng., New York.
Hasselmann, K. (1963), A statistical analysis of the generationof microseisms, Rev. Geophys., 1, 177–210.
Herbers, T. H. C., and R. T. Guza (1994), Wind-wave nonli-nearity observed at the seafloor, Part I: Forced-wave energy,J. Phys. Oceanogr., 21(12), 1740–1761.
Kibblewhite, A. C., and K. C. Ewans (1985), Wave-wave in-teractions, microseisms, and infrasonic ambient noise in theocean, J. Acoust. Soc. Am., 78, 981–994.
Kulhanek, O. (1990), Anatomy of Seismograms: Developmentin Solid Earth Geophysics, 178 pp., Elsevier, New York.
Lay, T., and T. C. Wallace (1995), Modern Global Seismology,521 pp., Elsevier, New York.
Longuet-Higgins, M. S. (1950), A theory of the origin ofmicroseisms, Philos. Trans. R. Soc. London, Ser. A, 243,2–36.
Milano, P. F., G. Pennacchioni, and M. I. Spalla (1988), Alpineand pre-Alpine tectonics in the Central Orobic Alps (South-ern Alps), Eclogae Geol. Helv., 81, 273–293.
McNamara, D. E., and R. P. Buland (2004), Ambient noiselevels in the continental United States, Bull. Seismol. Soc.Am., 94(4), 1517–1527.
Okada, H. (2003), The Microtremor Survey Method, Geo-phys. Monogr. Ser., vol. 12, edited by D. V. Fitterman,and M. W. Asten, 135 pp., Soc. of Explor. Geophys., Tulsa,Okla.
Parolai, S., P. Bormann, and C. Milkereit (2001), Assessmentof the natural frequency of the sedimentary cover in theCologne area (Germany) using noise measurements,J. Earthquake Eng., 5(4), 541–564.
Peterson, J. (1993), Observations and modeling of backgroundseismic noise, U.S. Geol. Surv. Open File Rep., 93-322.
Pieri, M., and G. Groppi (1981), Subsurface geological struc-ture of the Po Plain, in Progetto Finalizzato Geodinamica,pp. 1–11, Cons. Naz. delle Ric., Rome.
Rosenbaum, G., and G. S. Lister (2002), Reconstruction of theevolution of the Alpine-Himalayan orogen—An introduc-tion, J. Virtual Explor., 8, 1–2.
Siletto, G. B., M. I. Spalla, A. Tunesi, J. M. Lardeaux, andA. Colombo (1993), Pre-Alpine structural and meta-morphic histories in the Orobic Southern Alps, Italy, inPre-Mesozoic Geology in the Alps, edited by J. F. VonRaumer and F. Neubauer, pp. 585–598, Springer, NewYork.
Stephen, R. A., F. N. Spiess, J. A. Collins, J. A. Hildebrand,J. A. Orcutt, K. R. Peal, F. L. Vernon, and F. B. Wooding(2003), Ocean Seismic Network Pilot Experiment, Geochem.Geophys . Geosys t . , 4 (10) , 1092, doi :10.1029/2002GC000485.
Stutzmann, E., G. Roult, and L. Astiz (2000), GEOSCOPEstation noise levels, Bull. Seismol. Soc. Am., 90(3), 690–701.
Trnkoczy, A., P. Bormann, W. Hanka, L. G. Holcomb, andR. L. Nigbor (2002), Site selection, preparation andinstallation of seismic station, in IASPEI New Manualof Seismological Observatory Practice, vol. 1, edited byP. Bormann, chap. 7, pp. 1–106, GeoForschungsZentrum,Potsdam.
GeochemistryGeophysicsGeosystems G3G3
marzorati and bindi: ambient noise levels in italy 10.1029/2006GC001256
14 of 14