Supplement of Ambient nitro-aromatic compounds
14
Supplement of Atmos. Chem. Phys., 21, 1389–1406, 2021 https://doi.org/10.5194/acp-21-1389-2021-supplement © Author(s) 2021. This work is distributed under the Creative Commons Attribution 4.0 License. Supplement of Ambient nitro-aromatic compounds – biomass burning versus secondary formation in rural China Christian Mark Garcia Salvador et al. Correspondence to: Mattias Hallquist ([email protected]) and Song Guo ([email protected]) The copyright of individual parts of the supplement might differ from the CC BY 4.0 License.
-
Upload
khangminh22 -
Category
Documents
-
view
5 -
download
0
Transcript of Supplement of Ambient nitro-aromatic compounds

Supplement of Atmos. Chem. Phys., 21, 1389–1406, 2021https://doi.org/10.5194/acp-21-1389-2021-supplement© Author(s) 2021. This work is distributed underthe Creative Commons Attribution 4.0 License.
Supplement of
Ambient nitro-aromatic compounds – biomass burning versus secondaryformation in rural ChinaChristian Mark Garcia Salvador et al.
Correspondence to: Mattias Hallquist ([email protected]) and Song Guo ([email protected])
The copyright of individual parts of the supplement might differ from the CC BY 4.0 License.

Supplement for
Ambient Nitro-Aromatic Compounds - Biomass Burning versus Secondary
Formation in a Rural City in China
Christian Mark Salvador1, RongZhi Tang2, Michael Le Breton1, #, Lin Jie Li1, Michael Priestley1,
Epameinondas Tsiligiannis1, Wenfei Zhu3, Limin Zeng1, Hui Wang1, Ying Yu1, Min Hu1, Song
Guo2,*, Mattias Hallquist1,*
Figure S1. Typical desorption profile FIGAERO settings used in this study

NAC 1 C6H4N2O5 (183.004)
NAC 2 C6H5NO3 (138.019)
NAC 3 C6H5NO4 (154.014)
NAC 4 C6H5NO5 (170.009)
NAC 5 C7H5NO4 (166.014)
NAC 6 C7H6N2O5(197.020)
NAC 7 C7H6N2O6 (213.015)
NAC 8 C7H7NO3 (152.035)
Figure S2. High Resolution peak fitting of individual nitro-aromatic compounds (NACs) (part 1)

NAC 9 C7H7NO4 (168.030)
NAC 10 C7H7NO5 (184.024)
NAC 11 C8H7NO4 (180.030)
NAC 12 C8H8N2O5 (211.035)
NAC 13 C8H9NO3 (166.050)
NAC 14 C8H9NO5 (198.040)
NAC 15 C9H9NO4 (194.045)
NAC 16 C10H7NO3 (188.035)
Figure S2. High Resolution peak fitting of individual nitro-aromatic compounds (NACs) (part 1)

Figure S3. Diurnal profile of nitro-aromatic compounds measured in gas and particle phase (part 1)

Figure S3. Diurnal profile of nitro-aromatic compounds measured in gas and particle phase (part 2)

Table S1. Physical information of nitro-aromatic compounds (NACs) measured in this study
$ A post-campaign calibration of nitrophenol, nitrocatechol, and dinitrophenol was utilized to characterize the sensitivity factor of NACs. The FIGAERO filter for the
collection of particle phase was doped (20-30 μL) with freshly prepared standards in methanol solvent. The calibration was performed using the same thermal desorption
profile to characterize ambient aerosols. The filters were then desorbed in the same way as for the field sampling. Sensitivities calculated for nitrophenol and dinitrophenol
were enormously low, which will result in unusual high mixing ratios of NACs. Instead, the concentration of all the NACs were calculated based on the sensitivity factor of
nitrocatechol.
*Classification: (NP) Nitrophenol; (NC) Nitrocatechol, (DNP) Dinitrophenol, (NB) Nitrobenzoic acid analog
** All concentrations presented here are in ng m-3. The first and second values indicate concentration in gas and particle phase, respectively.
NACs Sensitivity
Factor$ Class*
Exact
Mass
[M-H]
Campaign
Ave_Conc
Daytime
Conc
Night-time
Conc
Regime Concentration
1 2 3 4 Fp
C6H4N2O5 0.009 DNP 183.004 151.99/17.00 241.29/20.45 99.90/15.05 108.47/28.39 135.70/12.26 184.45/20.16 203.86/11.46 13.03
C6H5NO3 0.019 NP 138.019 444.42/56.70 529.98/59.60 394.51/55.18 623.76/161.89 275.43/14.66 622.00/78.54 423.64/24.09 9.11
C6H5NO4 0.272 NC 154.014 93.46/21.99 124.03/19.36 75.63/23.58 116.82/63.27 74.23/10.75 107.77/22.15 105.30/8.94 17.90
C6H5NO5 - NC 170.009 23.62/10.24 28.41/7.03 20.83/12.13 27.96/25.98 19.75/10.35 27.32/4.23 23.66/1.46 28.09
C7H5NO4 - NB 166.014 64.92/7.49 97.81/8.72 45.73/6.80 54.84/11.69 54.38/5.05 79.15/9.86 90.43/5.20 13.39
C7H6N2O5 - DNP 197.020 40.98/4.64 64.31/4.85 27.33/4.54 31.09/10.64 32.44/2.67 56.36/5.24 51.38/2.59 14.25
C7H6N2O6 - DNP 213.015 39.27/14.14 49.49/12.45 33.31/15.16 47.35/30.09 32.44/14.97 47.08/7.74 34.69/2.09 24.24
C7H7NO3 - NP 152.035 260.91/47.36 319.55/50.95 226.71/45.41 416.36/141.28 111.15/9.27 423.91/67.61 230.60/18.76 12.00
C7H7NO4 - NC 168.030 131.57/26.67 187.64/25.82 98.87/27.23 178.51/74.00 90.45/10.10 164.80/32.36 153.06/13.25 16.59
C7H7NO5 - NC 184.024 53.95/10.66 70.92/8.66 44.05/11.85 57.83/25.36 42.52/7.33 64.42/9.64 72.85/5.94 17.62
C8H7NO4 - NB 180.030 36.92/6.17 50.18/6.12 29.19/6.22 35.94/13.41 28.77/4.09 46.97/6.53 48.04/3.19 15.16
C8H8N2O5 - DNP 211.035 45.11/8.77 64.33/9.62 33.90/8.30 47.45/20.17 36.42/6.93 55.20/7.23 52.60/3.28 17.03
C8H9NO3 - NP 166.050 158.13/33.43 191.86/35.36 138.45/32.41 275.86/105.37 56.13/5.96 264.20/45.85 132.63/12.75 13.91
C8H9NO5 - NC 198.040 52.05/12.01 63.14/9.23 45.58/13.65 80.44/37.39 29.94/5.54 69.00/11.10 62.29/5.01 17.60
C9H9NO4 - NB 194.045 87.01/17.48 110.42/13.56 73.35/19.80 131.44/58.59 45.51/6.06 118.43/16.73 124.23/9.10 14.90
C10H7NO3 - NP 188.035 29.24/3.99 36.75/4.17 24.85/3.90 31.69/9.01 21.98/1.70 38.19/5.29 33.28/3.13 11.89

Table S2. Correlation coefficient (r) of mixing ratios of NACs in gas and particle phase. Values in red highlight
the nitrophenols with strong association between the gas and particle phase.
NAC All Regime
1 2 3 4
C6H4N2O5 0.351 0.321 0.417 0.643 0.589 C6H5NO3 0.828 0.949 0.537 0.835 0.793 C6H5NO4 0.355 0.233 0.448 0.199 0.001 C6H5NO5 0.147 0.071 0.261 -0.023 0.104 C7H5NO4 0.285 0.543 0.115 0.51 0.476 C7H6N2O5 0.173 0.375 0.199 0.272 0.124 C7H6N2O6 0.38 0.534 0.606 0.516 0.549 C7H7NO3 0.835 0.937 0.672 0.867 0.858 C7H7NO4 0.505 0.511 0.502 0.524 0.593 C7H7NO5 0.156 0.118 0.243 0.044 0.357 C8H7NO4 0.262 0.146 0.363 0.397 0.587 C8H8N2O5 0.296 0.256 0.363 0.52 0.758 C8H9NO3 0.838 0.917 0.642 0.887 0.873 C8H9NO5 0.602 0.854 0.392 0.404 0.806 C9H9NO4 0.474 0.756 0.51 0.352 0.799 C10H7NO3 0.57 0.406 0.521 0.657 0.374

Figure S4. Correlation analysis of C9H8NO4 and levoglucosan for the analysis of the contribution of
biomass burning using EC tracer method. Red points are the data used to determine [NAC/lev]BB
(A.U. =arbitrary units)

Table S3. Measured concentration of major gaseous atmospheric components in Dezhou, China constrained in
the model (mean ± standard deviation)
Species Mixing Ratio, ppbv
CO 1213±683
NO 21±25
O3 17±11
NO2 26±9
Catechol 0.0061±0.0025
HONO 2.948±2.17
HCHO 4.832±2.834
HNO3 1.123±0.98
Propylene 2.244±1.718
Isoprene 0.047±0.129
Ethane 11.37±8.557
Ethylene 7.731±5.212
m/p-Xylene 0.699±0.852
o-Xylene 0.242±0.349
Toluene 1.676±2.122
Styrene 0.152±0.277
Trimethylbenzene 1,3,5- 0.032±0.117
Trimethylbenzene1,2,4- 0.091±0.173
Trimethylbenzene1,2,3- 0.033±0.121
Propane 7.418±7.137
Acetylene 6.133±5.849
Dichloromethane 4.993±20.014
Isobutane 1.687±1.388
n-Butane 3.742±3.727
Acetaldehyde 3.203±1.702
Acetone 2.408±1.153

Figure S5. Sensitivity test physical loss rate (PLR) of nitrocatechol

Figure S6. (Top) Diurnal profile of OH, NO3, and HO2 radicals calculated in Dezhou. Variabilities are given in standard deviation (Bottom) . Overall production of
CATEC1O from the reaction with OH, NO3 and NO. Minor contributors (<1%) are not included.
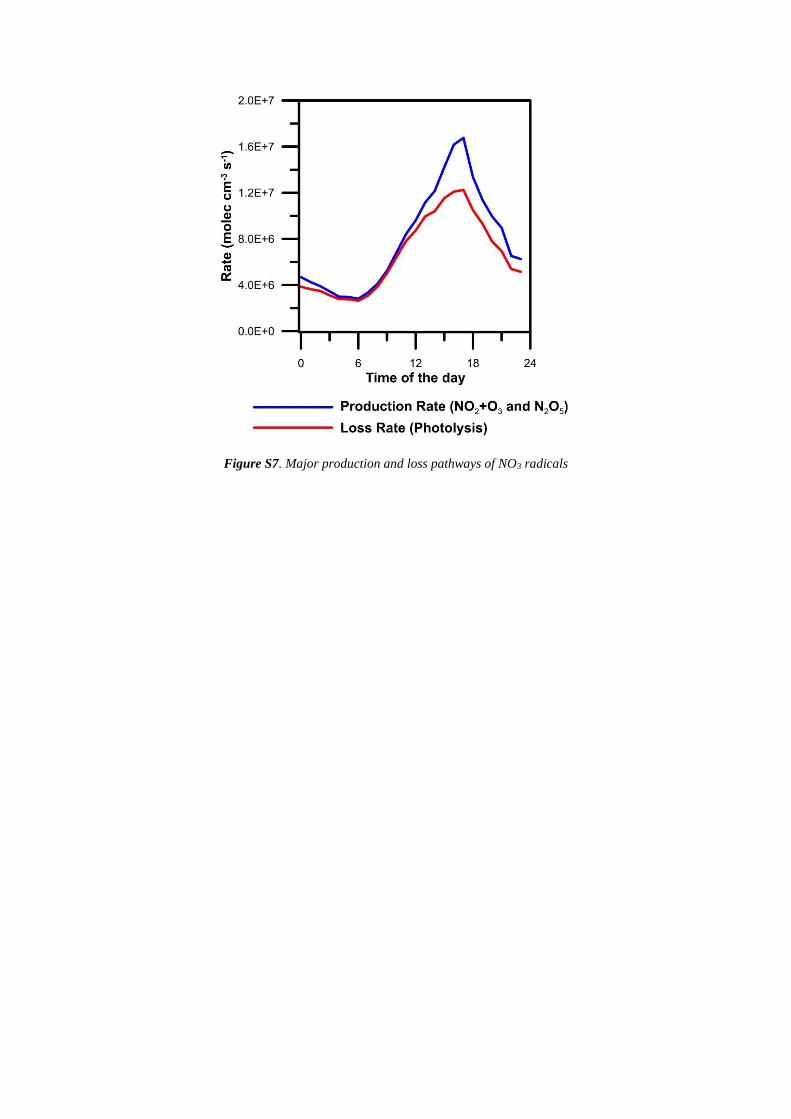
Figure S7. Major production and loss pathways of NO3 radicals
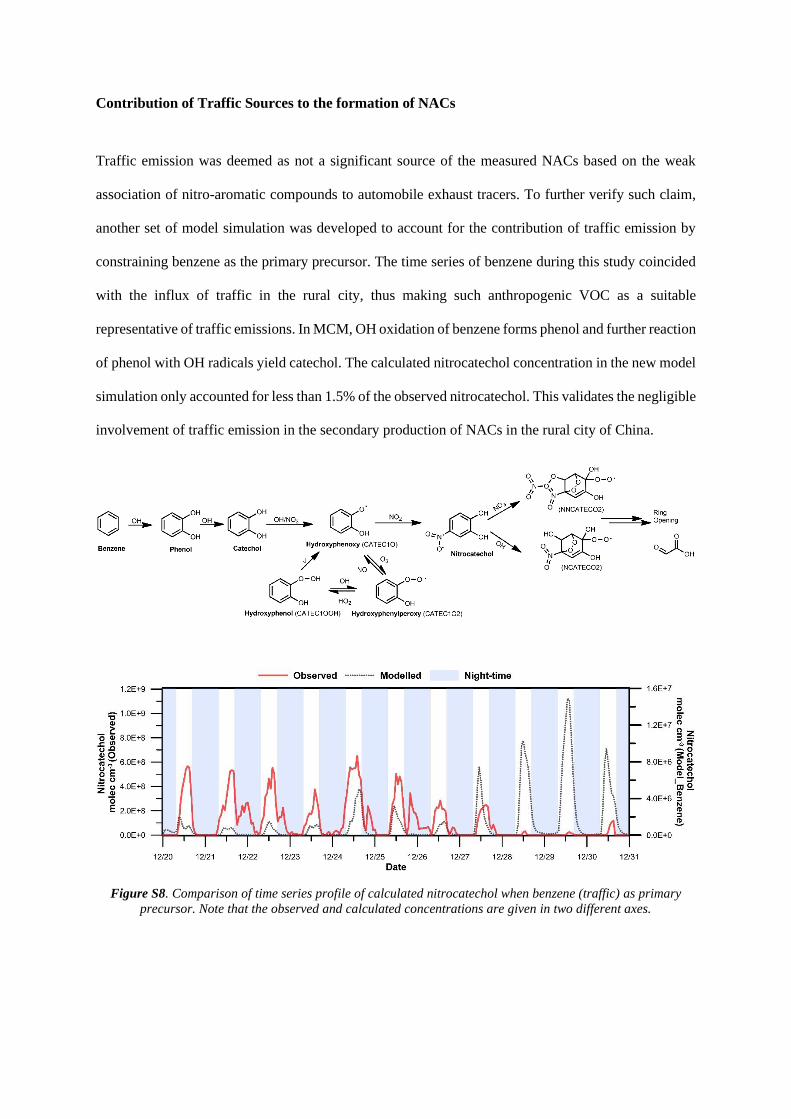
Contribution of Traffic Sources to the formation of NACs
Traffic emission was deemed as not a significant source of the measured NACs based on the weak
association of nitro-aromatic compounds to automobile exhaust tracers. To further verify such claim,
another set of model simulation was developed to account for the contribution of traffic emission by
constraining benzene as the primary precursor. The time series of benzene during this study coincided
with the influx of traffic in the rural city, thus making such anthropogenic VOC as a suitable
representative of traffic emissions. In MCM, OH oxidation of benzene forms phenol and further reaction
of phenol with OH radicals yield catechol. The calculated nitrocatechol concentration in the new model
simulation only accounted for less than 1.5% of the observed nitrocatechol. This validates the negligible
involvement of traffic emission in the secondary production of NACs in the rural city of China.
Figure S8. Comparison of time series profile of calculated nitrocatechol when benzene (traffic) as primary
precursor. Note that the observed and calculated concentrations are given in two different axes.