Student Teacher Ratio - REFERENCE NOTE
13
REFERENCE NOTE No. 16/RN/Ref./July/2016 For the use of Members of Parliament NOT FOR PUBLICATION 1 STUDENT-TEACHER RATIO Prepared by Shri Jayadev Sahu, Additional Director (23035025) and Smt. Lata Bansal, Joint Director of Lok Sabha Secretariat under the supervision of Smt. Kalpana Sharma, Joint Secretary and Smt. Anita Khanna, Director. The reference material is for personal use of the Members in the discharge of their Parliamentary duties, and is not for publication. This Service is not to be quoted as the source of information as it is based on the sources indicated at the end/in the text. This Service does not accept any responsibility for the accuracy or veracity of the information or views contained in the note/collection. MEMBERS' REFERENCE SERVICE LARRDIS LOK SABHA SECRETARIAT, NEW DELHI
-
Upload
khangminh22 -
Category
Documents
-
view
0 -
download
0
Transcript of Student Teacher Ratio - REFERENCE NOTE
REFERENCE NOTE
No. 16/RN/Ref./July/2016
For the use of Members of Parliament NOT FOR PUBLICATION1
STUDENT-TEACHER RATIO
Prepared by Shri Jayadev Sahu, Additional Director (23035025) and Smt. Lata Bansal, Joint Director of Lok Sabha Secretariat under the supervision of Smt. Kalpana Sharma, Joint Secretary and Smt. Anita Khanna, Director.
The reference material is for personal use of the Members in the discharge of their Parliamentary duties, and is not for publication. This Service is not to be quoted as the source of information as it is based on the sources indicated at the end/in the text. This Service does not accept any responsibility for the accuracy or veracity of the information or views contained in the note/collection.
MEMBERS' REFERENCE SERVICE
LARRDIS
LOK SABHA SECRETARIAT, NEW DELHI
STUDENT-TEACHER RATIO
Student-Teacher Ratio also referred to as Pupil-Teacher Ratio (PTR) is the
average number of pupils per teacher at a specific level of education in a given school-
year.1
The Right of Children to Free and Compulsory Education (RTE) Act, 2009, lays
down the norms and standards relating inter alia to Pupil-Teacher Ratios (PTRs),
buildings and infrastructure, school-working days, teacher-working hours, etc. It
provides for rational deployment of teachers by ensuring that the specified pupil-teacher
ratio is maintained for each school, rather than just as an average for the State or District
or Block, thus ensuring that there is no urban-rural imbalance in teacher postings. It
also provides for prohibition of deployment of teachers for non-educational work, other
than decennial census, elections to local authority, state legislatures and parliament, and
disaster relief.2
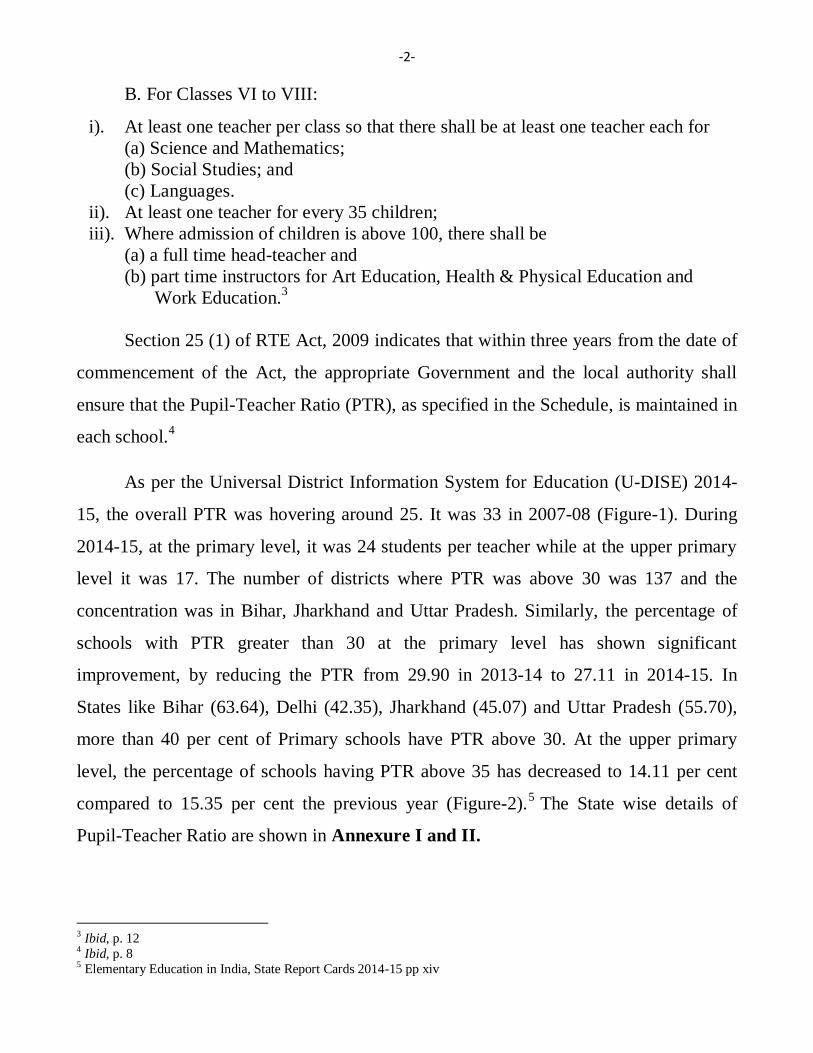
The RTE Act, 2009 which became operative with effect from 1 April 2010,
prescribes that the Pupil-Teacher Ratio (PTR) in schools should be maintained as per
the following specified levels:
A. For classes I to V:
i). Two teachers for up to sixty admitted children
ii). Three teachers for 61-90 children
iii). Four teachers for 91-120 children
iv). Five teachers for 121-200 children
v). One Head Teacher, other than the five teachers, if the number of admitted
children exceeds 150; and the PTR (excluding Head Teacher) shall not exceed
forty if the number of admitted children is above 200.
1 Educational Statistics at a Glance, 2014, p.40 2 The Right of Children to Free and Compulsory Education Act, 2009, p. 8,12&13
-2-
B. For Classes VI to VIII:
i). At least one teacher per class so that there shall be at least one teacher each for
(a) Science and Mathematics;
(b) Social Studies; and
(c) Languages.
ii). At least one teacher for every 35 children;
iii). Where admission of children is above 100, there shall be
(a) a full time head-teacher and
(b) part time instructors for Art Education, Health & Physical Education and
Work Education.3
Section 25 (1) of RTE Act, 2009 indicates that within three years from the date of
commencement of the Act, the appropriate Government and the local authority shall
ensure that the Pupil-Teacher Ratio (PTR), as specified in the Schedule, is maintained in
each school.4
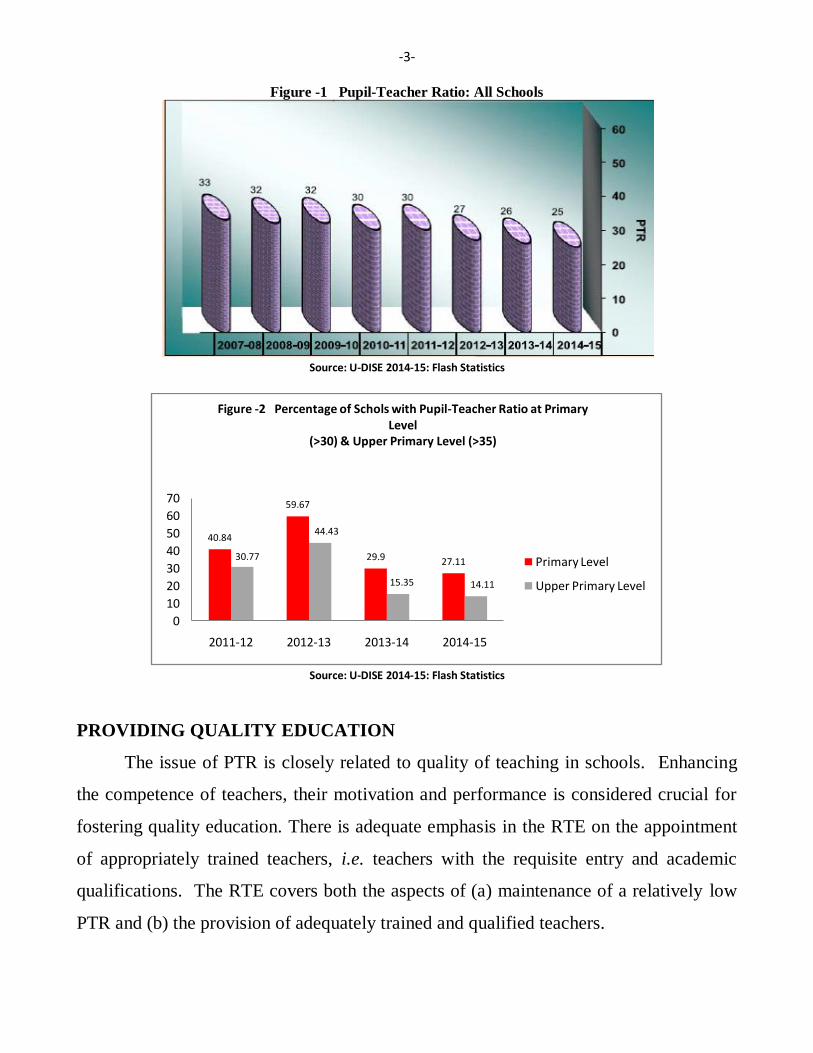
As per the Universal District Information System for Education (U-DISE) 2014-
15, the overall PTR was hovering around 25. It was 33 in 2007-08 (Figure-1). During
2014-15, at the primary level, it was 24 students per teacher while at the upper primary
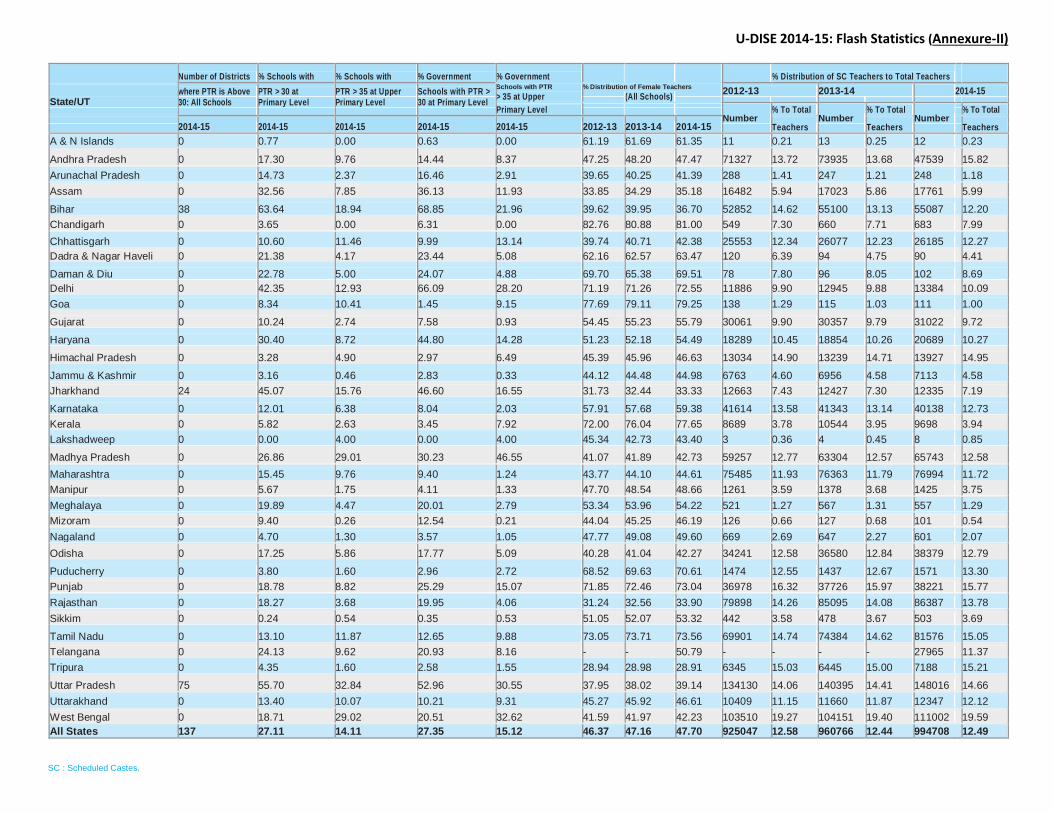
level it was 17. The number of districts where PTR was above 30 was 137 and the
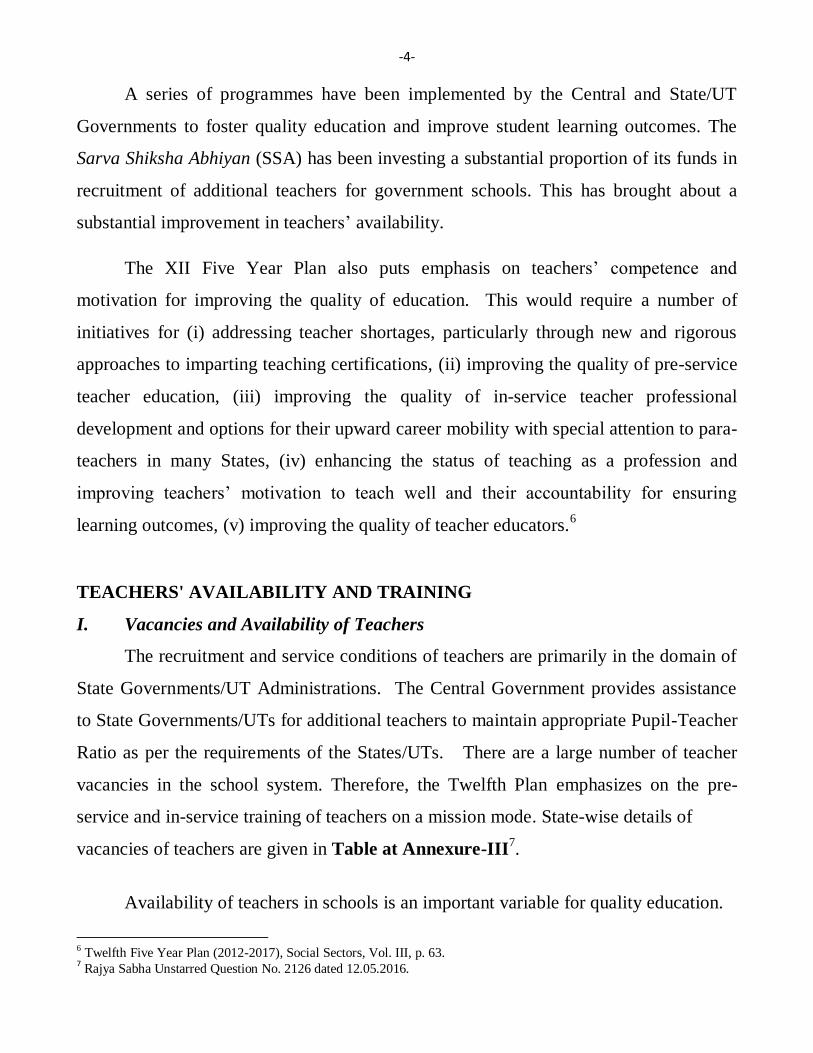
concentration was in Bihar, Jharkhand and Uttar Pradesh. Similarly, the percentage of
schools with PTR greater than 30 at the primary level has shown significant
improvement, by reducing the PTR from 29.90 in 2013-14 to 27.11 in 2014-15. In
States like Bihar (63.64), Delhi (42.35), Jharkhand (45.07) and Uttar Pradesh (55.70),
more than 40 per cent of Primary schools have PTR above 30. At the upper primary
level, the percentage of schools having PTR above 35 has decreased to 14.11 per cent
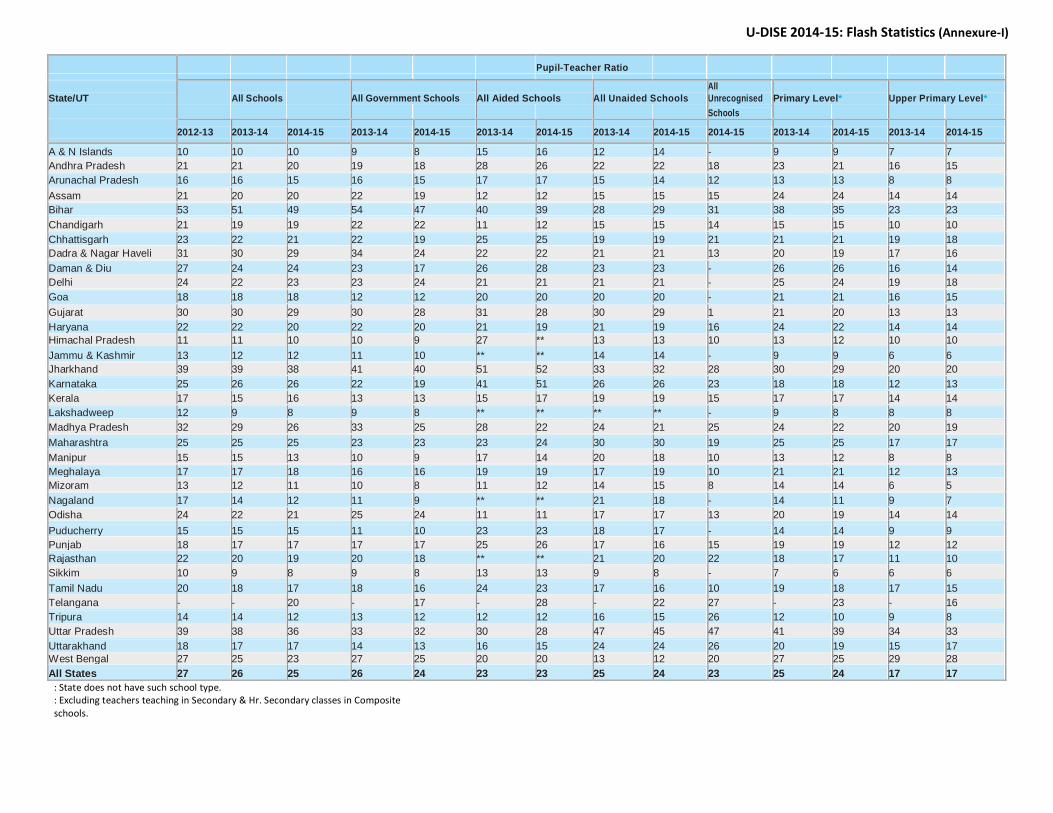
compared to 15.35 per cent the previous year (Figure-2).5 The State wise details of
Pupil-Teacher Ratio are shown in Annexure I and II.
3 Ibid, p. 12 4 Ibid, p. 8 5 Elementary Education in India, State Report Cards 2014-15 pp xiv
-3-
Figure -1 Pupil-Teacher Ratio: All Schools
Source: U-DISE 2014-15: Flash Statistics
Source: U-DISE 2014-15: Flash Statistics
PROVIDING QUALITY EDUCATION
The issue of PTR is closely related to quality of teaching in schools. Enhancing
the competence of teachers, their motivation and performance is considered crucial for
fostering quality education. There is adequate emphasis in the RTE on the appointment
of appropriately trained teachers, i.e. teachers with the requisite entry and academic
qualifications. The RTE covers both the aspects of (a) maintenance of a relatively low
PTR and (b) the provision of adequately trained and qualified teachers.
40.84
59.67
29.9 27.1130.77
44.43
15.35 14.11
0
10
20
30
40
50
60
70
2011-12 2012-13 2013-14 2014-15
Figure -2 Percentage of Schols with Pupil-Teacher Ratio at Primary Level
(>30) & Upper Primary Level (>35)
Primary Level
Upper Primary Level
-4-
A series of programmes have been implemented by the Central and State/UT
Governments to foster quality education and improve student learning outcomes. The
Sarva Shiksha Abhiyan (SSA) has been investing a substantial proportion of its funds in
recruitment of additional teachers for government schools. This has brought about a
substantial improvement in teachers’ availability.
The XII Five Year Plan also puts emphasis on teachers’ competence and
motivation for improving the quality of education. This would require a number of
initiatives for (i) addressing teacher shortages, particularly through new and rigorous
approaches to imparting teaching certifications, (ii) improving the quality of pre-service
teacher education, (iii) improving the quality of in-service teacher professional
development and options for their upward career mobility with special attention to para-
teachers in many States, (iv) enhancing the status of teaching as a profession and
improving teachers’ motivation to teach well and their accountability for ensuring
learning outcomes, (v) improving the quality of teacher educators.6
TEACHERS' AVAILABILITY AND TRAINING
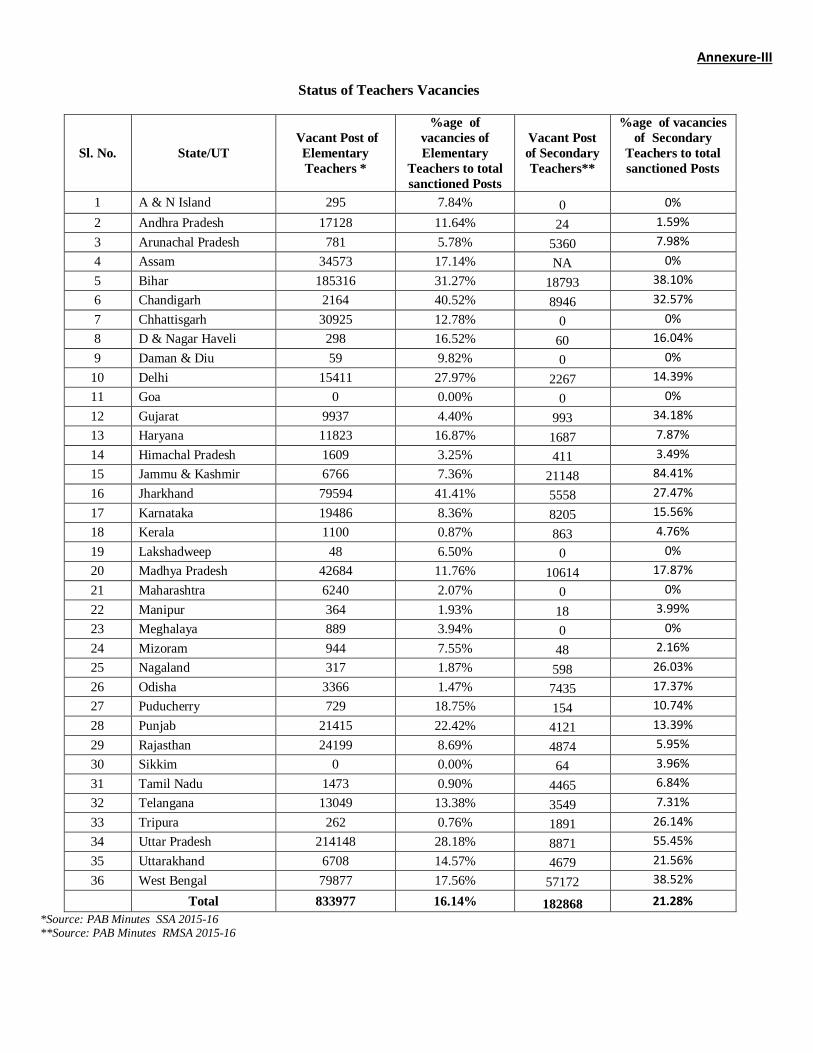
I. Vacancies and Availability of Teachers
The recruitment and service conditions of teachers are primarily in the domain of
State Governments/UT Administrations. The Central Government provides assistance
to State Governments/UTs for additional teachers to maintain appropriate Pupil-Teacher
Ratio as per the requirements of the States/UTs. There are a large number of teacher
vacancies in the school system. Therefore, the Twelfth Plan emphasizes on the pre-
service and in-service training of teachers on a mission mode. State-wise details of
vacancies of teachers are given in Table at Annexure-III7.
Availability of teachers in schools is an important variable for quality education.
6 Twelfth Five Year Plan (2012-2017), Social Sectors, Vol. III, p. 63. 7 Rajya Sabha Unstarred Question No. 2126 dated 12.05.2016.
-5-
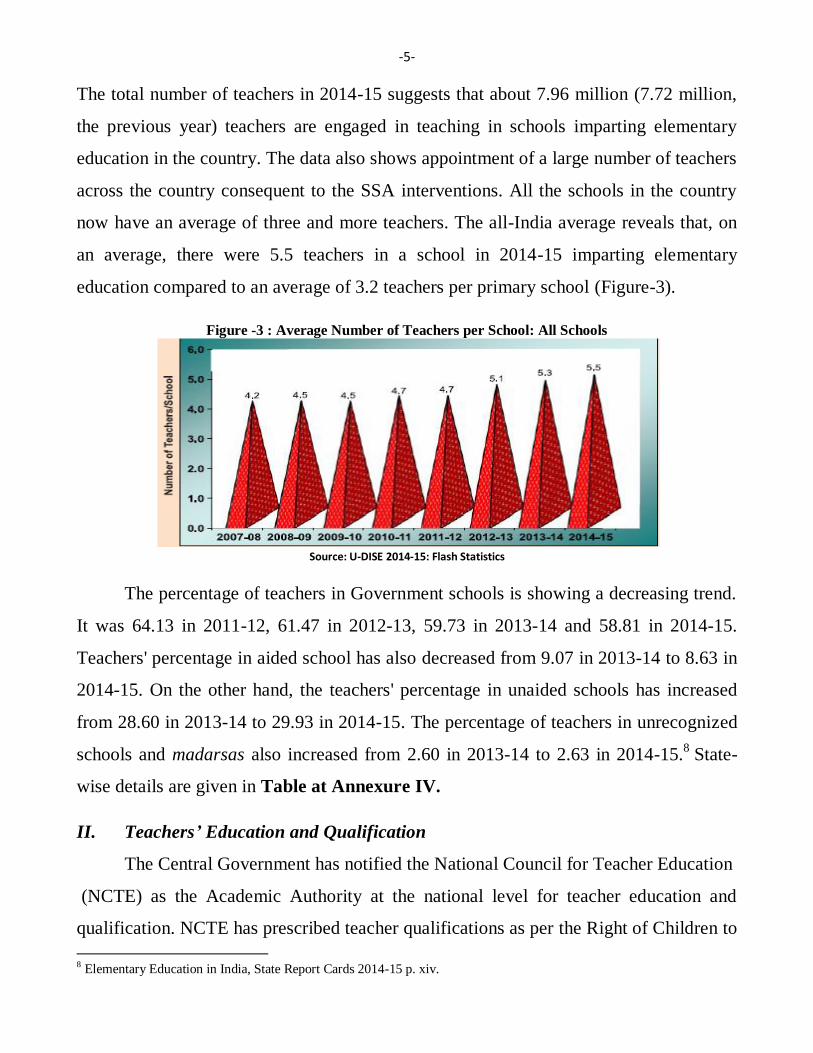
The total number of teachers in 2014-15 suggests that about 7.96 million (7.72 million,
the previous year) teachers are engaged in teaching in schools imparting elementary
education in the country. The data also shows appointment of a large number of teachers
across the country consequent to the SSA interventions. All the schools in the country
now have an average of three and more teachers. The all-India average reveals that, on
an average, there were 5.5 teachers in a school in 2014-15 imparting elementary
education compared to an average of 3.2 teachers per primary school (Figure-3).
Figure -3 : Average Number of Teachers per School: All Schools
Source: U-DISE 2014-15: Flash Statistics
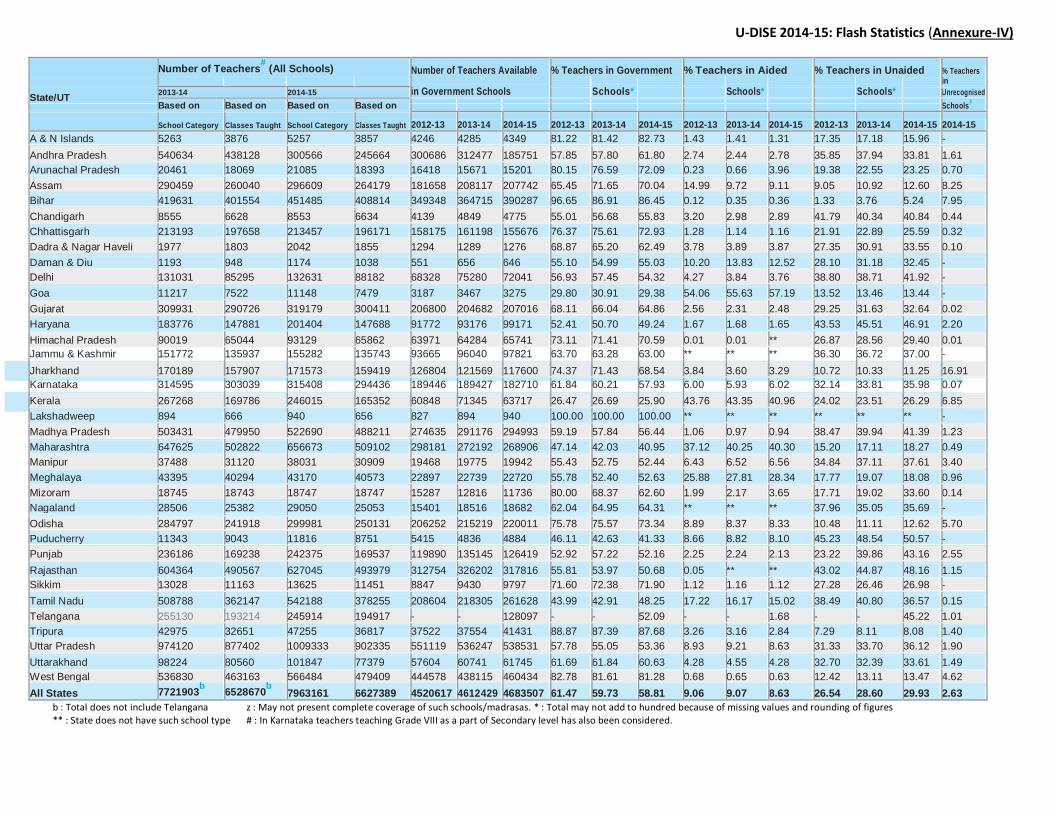
The percentage of teachers in Government schools is showing a decreasing trend.
It was 64.13 in 2011-12, 61.47 in 2012-13, 59.73 in 2013-14 and 58.81 in 2014-15.
Teachers' percentage in aided school has also decreased from 9.07 in 2013-14 to 8.63 in
2014-15. On the other hand, the teachers' percentage in unaided schools has increased
from 28.60 in 2013-14 to 29.93 in 2014-15. The percentage of teachers in unrecognized
schools and madarsas also increased from 2.60 in 2013-14 to 2.63 in 2014-15.8 State-
wise details are given in Table at Annexure IV.
II. Teachers’ Education and Qualification
The Central Government has notified the National Council for Teacher Education
(NCTE) as the Academic Authority at the national level for teacher education and
qualification. NCTE has prescribed teacher qualifications as per the Right of Children to
8 Elementary Education in India, State Report Cards 2014-15 p. xiv.
-6-
Free and Compulsory Education (RTE) Act, 2009. It has also made it mandatory that all
persons holding teacher qualifications as laid down by the NCTE must also pass a
teacher eligibility test (TET). These two steps by NCTE are widely seen as efforts to
improve the standards of teaching to eventually impact quality education.9
The percentage of teachers who received in service training is 18.34 in 2014-15.
The percentage was 40.21 in 2010-11 which decreased to 22.03 in 2013-14. In case of
teachers in government schools, the value decreased from 31.45 in 2013-14 to 27.90 in
2014-15. In aided schools, it stood at 15.55 compared to 24.77 per cent in 2013-14. In
unaided schools, it was 1.82 in 2014-15 compared to 3.32 in 2013-14.
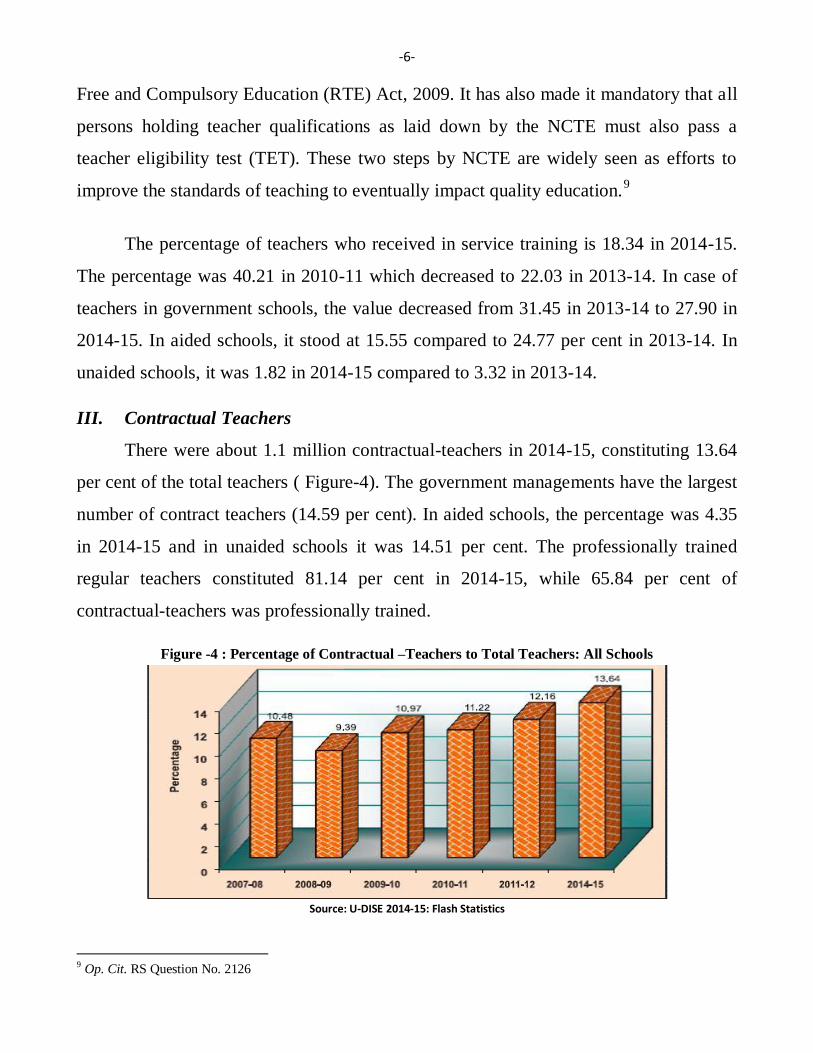
III. Contractual Teachers
There were about 1.1 million contractual-teachers in 2014-15, constituting 13.64
per cent of the total teachers ( Figure-4). The government managements have the largest
number of contract teachers (14.59 per cent). In aided schools, the percentage was 4.35
in 2014-15 and in unaided schools it was 14.51 per cent. The professionally trained
regular teachers constituted 81.14 per cent in 2014-15, while 65.84 per cent of
contractual-teachers was professionally trained.
Figure -4 : Percentage of Contractual –Teachers to Total Teachers: All Schools
Source: U-DISE 2014-15: Flash Statistics
9 Op. Cit. RS Question No. 2126
-7-
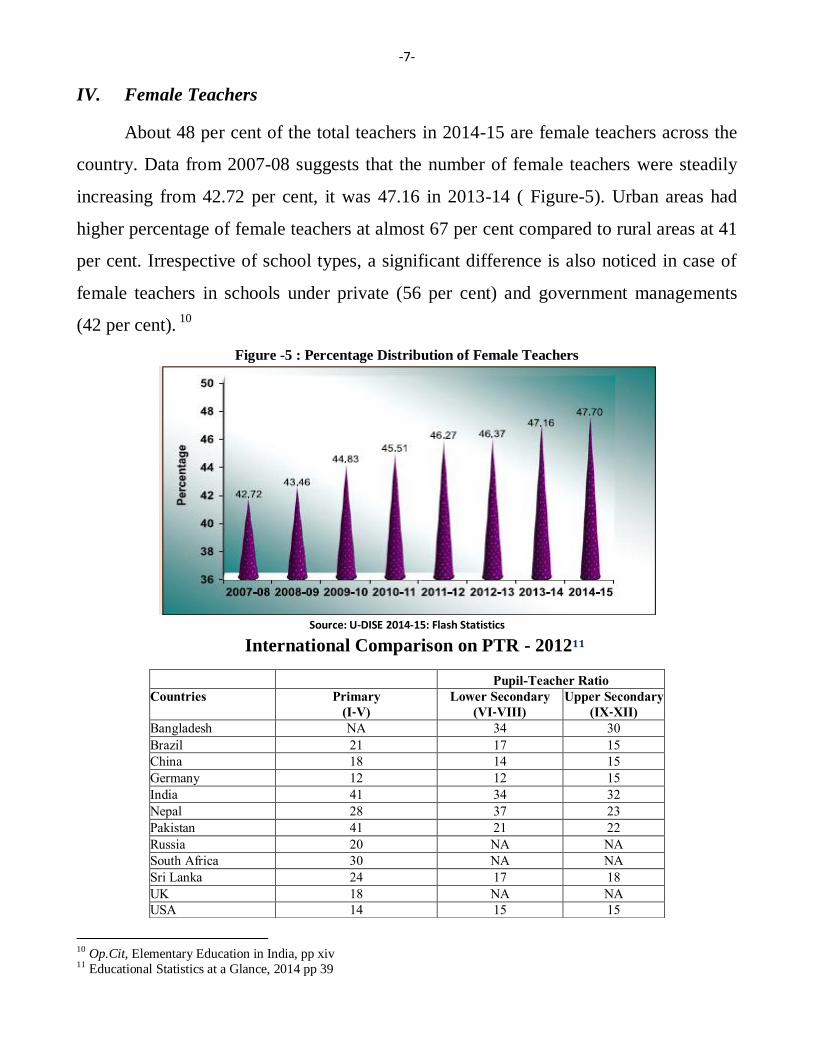
IV. Female Teachers
About 48 per cent of the total teachers in 2014-15 are female teachers across the
country. Data from 2007-08 suggests that the number of female teachers were steadily
increasing from 42.72 per cent, it was 47.16 in 2013-14 ( Figure-5). Urban areas had
higher percentage of female teachers at almost 67 per cent compared to rural areas at 41
per cent. Irrespective of school types, a significant difference is also noticed in case of
female teachers in schools under private (56 per cent) and government managements
(42 per cent). 10
Figure -5 : Percentage Distribution of Female Teachers
Source: U-DISE 2014-15: Flash Statistics
International Comparison on PTR - 201211
10 Op.Cit, Elementary Education in India, pp xiv 11 Educational Statistics at a Glance, 2014 pp 39
Pupil-Teacher Ratio
Countries Primary
(I‐V)
Lower Secondary
(VI‐VIII)
Upper Secondary
(IX‐XII)
Bangladesh NA 34 30
Brazil 21 17 15
China 18 14 15
Germany 12 12 15
India 41 34 32
Nepal 28 37 23
Pakistan 41 21 22
Russia 20 NA NA
South Africa 30 NA NA
Sri Lanka 24 17 18
UK 18 NA NA
USA 14 15 15
-8-
CONCLUSION
It is widely accepted that a low pupil-teacher ratio enables teachers to pay
individual attention to students and therefore, can increase student achievement. It
enables the students to have better absorption and understanding of the subject. Thus, a
low pupil-teacher ratio is an essential for long term and broad based academic
achievement. Therefore, PTR must be improved not at the cost of quality of teachers,
but through the training and appointment of qualified teachers.
REFERENCES
1. The Right of Children to Free and Compulsory Education Act, 2009
2. Educational Statistics at a Glance, 2014
3. National University of Educational Planning and Administration, Elementary Education in
India, State Report Cards 2014-15
4. Twelfth Five Year Plan (2012-17) – Social Sectors, Vol. III
5. National University of Educational Planning and Administration,Universal District Information
System for Education 2014-15 – Flash Statistics
6. Rajya Sabha Unstarred Question No. 2126 dated 12.5.2016
U-DISE 2014-15: Flash Statistics (Annexure-I)
Pupil-Teacher Ratio
State/UT
All Schools
All Government Schools All Aided Schools All Unaided Schools All
Primary Level* Upper Primary Level*
Unrecognised
Schools
2012-13 2013-14 2014-15 2013-14 2014-15 2013-14 2014-15 2013-14 2014-15 2014-15 2013-14 2014-15 2013-14 2014-15
A & N Islands 10 10 10 9 8 15 16 12 14 - 9 9 7 7
Andhra Pradesh 21 21 20 19 18 28 26 22 22 18 23 21 16 15
Arunachal Pradesh 16 16 15 16 15 17 17 15 14 12 13 13 8 8
Assam 21 20 20 22 19 12 12 15 15 15 24 24 14 14
Bihar 53 51 49 54 47 40 39 28 29 31 38 35 23 23
Chandigarh 21 19 19 22 22 11 12 15 15 14 15 15 10 10
Chhattisgarh 23 22 21 22 19 25 25 19 19 21 21 21 19 18
Dadra & Nagar Haveli 31 30 29 34 24 22 22 21 21 13 20 19 17 16
Daman & Diu 27 24 24 23 17 26 28 23 23 - 26 26 16 14
Delhi 24 22 23 23 24 21 21 21 21 - 25 24 19 18
Goa 18 18 18 12 12 20 20 20 20 - 21 21 16 15
Gujarat 30 30 29 30 28 31 28 30 29 1 21 20 13 13
Haryana 22 22 20 22 20 21 19 21 19 16 24 22 14 14
Himachal Pradesh 11 11 10 10 9 27 ** 13 13 10 13 12 10 10
Jammu & Kashmir 13 12 12 11 10 ** ** 14 14 - 9 9 6 6
Jharkhand 39 39 38 41 40 51 52 33 32 28 30 29 20 20
Karnataka 25 26 26 22 19 41 51 26 26 23 18 18 12 13
Kerala 17 15 16 13 13 15 17 19 19 15 17 17 14 14
Lakshadweep 12 9 8 9 8 ** ** ** ** - 9 8 8 8
Madhya Pradesh 32 29 26 33 25 28 22 24 21 25 24 22 20 19
Maharashtra 25 25 25 23 23 23 24 30 30 19 25 25 17 17
Manipur 15 15 13 10 9 17 14 20 18 10 13 12 8 8
Meghalaya 17 17 18 16 16 19 19 17 19 10 21 21 12 13
Mizoram 13 12 11 10 8 11 12 14 15 8 14 14 6 5
Nagaland 17 14 12 11 9 ** ** 21 18 - 14 11 9 7
Odisha 24 22 21 25 24 11 11 17 17 13 20 19 14 14
Puducherry 15 15 15 11 10 23 23 18 17 - 14 14 9 9
Punjab 18 17 17 17 17 25 26 17 16 15 19 19 12 12
Rajasthan 22 20 19 20 18 ** ** 21 20 22 18 17 11 10
Sikkim 10 9 8 9 8 13 13 9 8 - 7 6 6 6
Tamil Nadu 20 18 17 18 16 24 23 17 16 10 19 18 17 15
Telangana - - 20 - 17 - 28 - 22 27 - 23 - 16
Tripura 14 14 12 13 12 12 12 16 15 26 12 10 9 8
Uttar Pradesh 39 38 36 33 32 30 28 47 45 47 41 39 34 33
Uttarakhand 18 17 17 14 13 16 15 24 24 26 20 19 15 17
West Bengal 27 25 23 27 25 20 20 13 12 20 27 25 29 28
All States 27 26 25 26 24 23 23 25 24 23 25 24 17 17
: State does not have such school type. : Excluding teachers teaching in Secondary & Hr. Secondary classes in Composite schools.
U-DISE 2014-15: Flash Statistics (Annexure-II)
Number of Districts % Schools with % Schools with % Government % Government % Distribution of SC Teachers to Total Teachers
where PTR is Above PTR > 30 at PTR > 35 at Upper Schools with PTR > Schools with PTR % Distribution of Female Teachers
2012-13 2013-14 2014-15
State/UT > 35 at Upper (All Schools)
30: All Schools Primary Level Primary Level 30 at Primary Level
Primary Level
Number % To Total
Number % To Total
Number
% To Total
2014-15 2014-15 2014-15 2014-15 2014-15 2012-13 2013-14 2014-15 Teachers Teachers
Teachers
A & N Islands 0 0.77 0.00 0.63 0.00 61.19 61.69 61.35 11 0.21 13 0.25 12 0.23
Andhra Pradesh 0 17.30 9.76 14.44 8.37 47.25 48.20 47.47 71327 13.72 73935 13.68 47539 15.82
Arunachal Pradesh 0 14.73 2.37 16.46 2.91 39.65 40.25 41.39 288 1.41 247 1.21 248 1.18
Assam 0 32.56 7.85 36.13 11.93 33.85 34.29 35.18 16482 5.94 17023 5.86 17761 5.99
Bihar 38 63.64 18.94 68.85 21.96 39.62 39.95 36.70 52852 14.62 55100 13.13 55087 12.20
Chandigarh 0 3.65 0.00 6.31 0.00 82.76 80.88 81.00 549 7.30 660 7.71 683 7.99
Chhattisgarh 0 10.60 11.46 9.99 13.14 39.74 40.71 42.38 25553 12.34 26077 12.23 26185 12.27
Dadra & Nagar Haveli 0 21.38 4.17 23.44 5.08 62.16 62.57 63.47 120 6.39 94 4.75 90 4.41
Daman & Diu 0 22.78 5.00 24.07 4.88 69.70 65.38 69.51 78 7.80 96 8.05 102 8.69
Delhi 0 42.35 12.93 66.09 28.20 71.19 71.26 72.55 11886 9.90 12945 9.88 13384 10.09
Goa 0 8.34 10.41 1.45 9.15 77.69 79.11 79.25 138 1.29 115 1.03 111 1.00
Gujarat 0 10.24 2.74 7.58 0.93 54.45 55.23 55.79 30061 9.90 30357 9.79 31022 9.72
Haryana 0 30.40 8.72 44.80 14.28 51.23 52.18 54.49 18289 10.45 18854 10.26 20689 10.27
Himachal Pradesh 0 3.28 4.90 2.97 6.49 45.39 45.96 46.63 13034 14.90 13239 14.71 13927 14.95
Jammu & Kashmir 0 3.16 0.46 2.83 0.33 44.12 44.48 44.98 6763 4.60 6956 4.58 7113 4.58
Jharkhand 24 45.07 15.76 46.60 16.55 31.73 32.44 33.33 12663 7.43 12427 7.30 12335 7.19
Karnataka 0 12.01 6.38 8.04 2.03 57.91 57.68 59.38 41614 13.58 41343 13.14 40138 12.73
Kerala 0 5.82 2.63 3.45 7.92 72.00 76.04 77.65 8689 3.78 10544 3.95 9698 3.94
Lakshadweep 0 0.00 4.00 0.00 4.00 45.34 42.73 43.40 3 0.36 4 0.45 8 0.85
Madhya Pradesh 0 26.86 29.01 30.23 46.55 41.07 41.89 42.73 59257 12.77 63304 12.57 65743 12.58
Maharashtra 0 15.45 9.76 9.40 1.24 43.77 44.10 44.61 75485 11.93 76363 11.79 76994 11.72
Manipur 0 5.67 1.75 4.11 1.33 47.70 48.54 48.66 1261 3.59 1378 3.68 1425 3.75
Meghalaya 0 19.89 4.47 20.01 2.79 53.34 53.96 54.22 521 1.27 567 1.31 557 1.29
Mizoram 0 9.40 0.26 12.54 0.21 44.04 45.25 46.19 126 0.66 127 0.68 101 0.54
Nagaland 0 4.70 1.30 3.57 1.05 47.77 49.08 49.60 669 2.69 647 2.27 601 2.07
Odisha 0 17.25 5.86 17.77 5.09 40.28 41.04 42.27 34241 12.58 36580 12.84 38379 12.79
Puducherry 0 3.80 1.60 2.96 2.72 68.52 69.63 70.61 1474 12.55 1437 12.67 1571 13.30
Punjab 0 18.78 8.82 25.29 15.07 71.85 72.46 73.04 36978 16.32 37726 15.97 38221 15.77
Rajasthan 0 18.27 3.68 19.95 4.06 31.24 32.56 33.90 79898 14.26 85095 14.08 86387 13.78
Sikkim 0 0.24 0.54 0.35 0.53 51.05 52.07 53.32 442 3.58 478 3.67 503 3.69
Tamil Nadu 0 13.10 11.87 12.65 9.88 73.05 73.71 73.56 69901 14.74 74384 14.62 81576 15.05
Telangana 0 24.13 9.62 20.93 8.16 - - 50.79 - - - - 27965 11.37
Tripura 0 4.35 1.60 2.58 1.55 28.94 28.98 28.91 6345 15.03 6445 15.00 7188 15.21
Uttar Pradesh 75 55.70 32.84 52.96 30.55 37.95 38.02 39.14 134130 14.06 140395 14.41 148016 14.66
Uttarakhand 0 13.40 10.07 10.21 9.31 45.27 45.92 46.61 10409 11.15 11660 11.87 12347 12.12
West Bengal 0 18.71 29.02 20.51 32.62 41.59 41.97 42.23 103510 19.27 104151 19.40 111002 19.59
All States 137 27.11 14.11 27.35 15.12 46.37 47.16 47.70 925047 12.58 960766 12.44 994708 12.49
SC : Scheduled Castes.
Annexure-III
Status of Teachers Vacancies
Sl. No. State/UT
Vacant Post of
Elementary
Teachers *
%age of
vacancies of
Elementary
Teachers to total
sanctioned Posts
Vacant Post
of Secondary
Teachers**
%age of vacancies
of Secondary
Teachers to total
sanctioned Posts
1 A & N Island 295 7.84% 0 0%
2 Andhra Pradesh 17128 11.64% 24 1.59%
3 Arunachal Pradesh 781 5.78% 5360 7.98%
4 Assam 34573 17.14% NA 0%
5 Bihar 185316 31.27% 18793 38.10%
6 Chandigarh 2164 40.52% 8946 32.57%
7 Chhattisgarh 30925 12.78% 0 0%
8 D & Nagar Haveli 298 16.52% 60 16.04%
9 Daman & Diu 59 9.82% 0 0%
10 Delhi 15411 27.97% 2267 14.39%
11 Goa 0 0.00% 0 0%
12 Gujarat 9937 4.40% 993 34.18%
13 Haryana 11823 16.87% 1687 7.87%
14 Himachal Pradesh 1609 3.25% 411 3.49%
15 Jammu & Kashmir 6766 7.36% 21148 84.41%
16 Jharkhand 79594 41.41% 5558 27.47%
17 Karnataka 19486 8.36% 8205 15.56%
18 Kerala 1100 0.87% 863 4.76%
19 Lakshadweep 48 6.50% 0 0%
20 Madhya Pradesh 42684 11.76% 10614 17.87%
21 Maharashtra 6240 2.07% 0 0%
22 Manipur 364 1.93% 18 3.99%
23 Meghalaya 889 3.94% 0 0%
24 Mizoram 944 7.55% 48 2.16%
25 Nagaland 317 1.87% 598 26.03%
26 Odisha 3366 1.47% 7435 17.37%
27 Puducherry 729 18.75% 154 10.74%
28 Punjab 21415 22.42% 4121 13.39%
29 Rajasthan 24199 8.69% 4874 5.95%
30 Sikkim 0 0.00% 64 3.96%
31 Tamil Nadu 1473 0.90% 4465 6.84%
32 Telangana 13049 13.38% 3549 7.31%
33 Tripura 262 0.76% 1891 26.14%
34 Uttar Pradesh 214148 28.18% 8871 55.45%
35 Uttarakhand 6708 14.57% 4679 21.56%
36 West Bengal 79877 17.56% 57172 38.52%
Total 833977 16.14% 182868 21.28%
*Source: PAB Minutes SSA 2015-16 **Source: PAB Minutes RMSA 2015-16
U-DISE 2014-15: Flash Statistics (Annexure-IV)
Number of Teachers# (All Schools) Number of Teachers Available % Teachers in Government % Teachers in Aided % Teachers in Unaided % Teachers
in Government Schools
Schools*
Schools*
Schools* in
State/UT 2013-14 2014-15 Unrecognised
Based on Based on Based on Based on
Schoolsz
School Category Classes Taught School Category Classes Taught 2012-13 2013-14 2014-15 2012-13 2013-14 2014-15 2012-13 2013-14 2014-15 2012-13 2013-14 2014-15 2014-15
A & N Islands 5263 3876 5257 3857 4246 4285 4349 81.22 81.42 82.73 1.43 1.41 1.31 17.35 17.18 15.96 -
Andhra Pradesh 540634 438128 300566 245664 300686 312477 185751 57.85 57.80 61.80 2.74 2.44 2.78 35.85 37.94 33.81 1.61
Arunachal Pradesh 20461 18069 21085 18393 16418 15671 15201 80.15 76.59 72.09 0.23 0.66 3.96 19.38 22.55 23.25 0.70
Assam 290459 260040 296609 264179 181658 208117 207742 65.45 71.65 70.04 14.99 9.72 9.11 9.05 10.92 12.60 8.25
Bihar 419631 401554 451485 408814 349348 364715 390287 96.65 86.91 86.45 0.12 0.35 0.36 1.33 3.76 5.24 7.95
Chandigarh 8555 6628 8553 6634 4139 4849 4775 55.01 56.68 55.83 3.20 2.98 2.89 41.79 40.34 40.84 0.44
Chhattisgarh 213193 197658 213457 196171 158175 161198 155676 76.37 75.61 72.93 1.28 1.14 1.16 21.91 22.89 25.59 0.32
Dadra & Nagar Haveli 1977 1803 2042 1855 1294 1289 1276 68.87 65.20 62.49 3.78 3.89 3.87 27.35 30.91 33.55 0.10
Daman & Diu 1193 948 1174 1038 551 656 646 55.10 54.99 55.03 10.20 13.83 12.52 28.10 31.18 32.45 -
Delhi 131031 85295 132631 88182 68328 75280 72041 56.93 57.45 54.32 4.27 3.84 3.76 38.80 38.71 41.92 -
Goa 11217 7522 11148 7479 3187 3467 3275 29.80 30.91 29.38 54.06 55.63 57.19 13.52 13.46 13.44 -
Gujarat 309931 290726 319179 300411 206800 204682 207016 68.11 66.04 64.86 2.56 2.31 2.48 29.25 31.63 32.64 0.02
Haryana 183776 147881 201404 147688 91772 93176 99171 52.41 50.70 49.24 1.67 1.68 1.65 43.53 45.51 46.91 2.20
Himachal Pradesh 90019 65044 93129 65862 63971 64284 65741 73.11 71.41 70.59 0.01 0.01 ** 26.87 28.56 29.40 0.01
Jammu & Kashmir 151772 135937 155282 135743 93665 96040 97821 63.70 63.28 63.00 ** ** ** 36.30 36.72 37.00 -
Jharkhand 170189 157907 171573 159419 126804 121569 117600 74.37 71.43 68.54 3.84 3.60 3.29 10.72 10.33 11.25 16.91
Karnataka 314595 303039 315408 294436 189446 189427 182710 61.84 60.21 57.93 6.00 5.93 6.02 32.14 33.81 35.98 0.07
Kerala 267268 169786 246015 165352 60848 71345 63717 26.47 26.69 25.90 43.76 43.35 40.96 24.02 23.51 26.29 6.85
Lakshadweep 894 666 940 656 827 894 940 100.00 100.00 100.00 ** ** ** ** ** ** -
Madhya Pradesh 503431 479950 522690 488211 274635 291176 294993 59.19 57.84 56.44 1.06 0.97 0.94 38.47 39.94 41.39 1.23
Maharashtra 647625 502822 656673 509102 298181 272192 268906 47.14 42.03 40.95 37.12 40.25 40.30 15.20 17.11 18.27 0.49
Manipur 37488 31120 38031 30909 19468 19775 19942 55.43 52.75 52.44 6.43 6.52 6.56 34.84 37.11 37.61 3.40
Meghalaya 43395 40294 43170 40573 22897 22739 22720 55.78 52.40 52.63 25.88 27.81 28.34 17.77 19.07 18.08 0.96
Mizoram 18745 18743 18747 18747 15287 12816 11736 80.00 68.37 62.60 1.99 2.17 3.65 17.71 19.02 33.60 0.14
Nagaland 28506 25382 29050 25053 15401 18516 18682 62.04 64.95 64.31 ** ** ** 37.96 35.05 35.69 -
Odisha 284797 241918 299981 250131 206252 215219 220011 75.78 75.57 73.34 8.89 8.37 8.33 10.48 11.11 12.62 5.70
Puducherry 11343 9043 11816 8751 5415 4836 4884 46.11 42.63 41.33 8.66 8.82 8.10 45.23 48.54 50.57 -
Punjab 236186 169238 242375 169537 119890 135145 126419 52.92 57.22 52.16 2.25 2.24 2.13 23.22 39.86 43.16 2.55
Rajasthan 604364 490567 627045 493979 312754 326202 317816 55.81 53.97 50.68 0.05 ** ** 43.02 44.87 48.16 1.15
Sikkim 13028 11163 13625 11451 8847 9430 9797 71.60 72.38 71.90 1.12 1.16 1.12 27.28 26.46 26.98 -
Tamil Nadu 508788 362147 542188 378255 208604 218305 261628 43.99 42.91 48.25 17.22 16.17 15.02 38.49 40.80 36.57 0.15
Telangana 255130 193214 245914 194917 - - 128097 - - 52.09 - - 1.68 - - 45.22 1.01
Tripura 42975 32651 47255 36817 37522 37554 41431 88.87 87.39 87.68 3.26 3.16 2.84 7.29 8.11 8.08 1.40
Uttar Pradesh 974120 877402 1009333 902335 551119 536247 538531 57.78 55.05 53.36 8.93 9.21 8.63 31.33 33.70 36.12 1.90
Uttarakhand 98224 80560 101847 77379 57604 60741 61745 61.69 61.84 60.63 4.28 4.55 4.28 32.70 32.39 33.61 1.49
West Bengal 536830 463163 566484 479409 444578 438115 460434 82.78 81.61 81.28 0.68 0.65 0.63 12.42 13.11 13.47 4.62
All States 7721903b
6528670b
7963161 6627389 4520617 4612429 4683507 61.47 59.73 58.81 9.06 9.07 8.63 26.54 28.60 29.93 2.63
b : Total does not include Telangana z : May not present complete coverage of such schools/madrasas. * : Total may not add to hundred because of missing values and rounding of figures ** : State does not have such school type # : In Karnataka teachers teaching Grade VIII as a part of Secondary level has also been considered.