Seismic noise levels across Antarctica
12
○ E The Seismic Noise Environment of Antarctica by Robert E. Anthony, Richard C. Aster, Douglas Wiens, Andrew Nyblade, Sridhar Anandakrishnan, Audrey Huerta, J. Paul Winberry, Terry Wilson, and Charlotte Rowe Online Material: Table of station parameters; figures of mean acceleration power differences, interpolated noise maps. INTRODUCTION Seismographic coverage of Antarctica prior to 2007 consisted overwhelmingly of a handful of long running and sporadically deployed transient stations, many of which were principally collocated with scientific research stations. Despite very cold temperatures, sunless winters, challenging logistics, and ex- treme storms, recent developments in polar instrumentation driven by new scientific objectives have opened up the entirety of Antarctica to year-round and continuous seismological ob- servation (e.g., Nyblade et al., 2012). Motivations for these recent studies include improved understanding of seismogenic, volcanic, tectonic and glacio- logical processes, heat flow, dynamic glaciological/ocean inter- actions, and mantle viscosity. Such studies contribute generally to improvements in understanding the geophysical, geological, and glaciological history of the continent and how these proc- esses interact with the past and present state of the glaciological and climate system (e.g., Winberry et al., 2009; Hansen et al., 2010; West et al., 2010; Winberry et al., 2011; Heeszel et al., 2013; Lough et al., 2013; Chaput et al., 2014; Accardo et al., 2014), including processes relevant to glacial isostatic adjustment and sea level rise (Intergovernmental Panel on Climate Change [IPCC] Report, 2007). In addition, microseisms arising from ocean wave activity contain useful climate proxy information on the state and variability of the relatively poorly sensed southern oceans (Aster et al., 2008; Stutzmann et al., 2009; Aster et al., 2010), and such observations are sensitive to sea ice concentra- tion and areal coverage in the polar regions (Grob et al., 2011; Tsai and McNamara, 2011; Koch et al., 2013). This characterization of the seismic noise environment of Antarctica, documentation of instrument performance, and comparisons of installation conditions (e.g., ice vaults vs. rock sites) is intended to facilitate optimization of future seismologi- cal deployments in such environments. We analyze data from a range of recent experiments to provide a broad geographical characterization of Antarctica ’s seismic noise environment, which can now include more substantial observations from re- gions that are free from anthropogenic noise contamination. METHODS Data Collection and Analysis The Polar Earth Observing Network (POLENET ANET) and Gamburtsev Antarctic Mountains Seismic Experiment (GAM- SEIS/AGAP; e.g., Heeszel et al., 2013; Lloyd et al., 2013; Wiens et al., 2013; Chaput et al., 2014) deployments of year-round temporary seismic stations have strongly contrib- uted to improving the broadband seismic coverage of Antarc- tica (Fig. 1). Stations in POLENET ANET and GAMSEIS/ AGAP were first deployed in December 2007 and have con- tinued through the present. Although most stations were deployed in snow vaults, some sensors, particularly in the Transantarctic Mountains (TAMs) were installed directly on isolated rock outcrops, permitting some data quality compar- isons to be performed between the two siting environments. All rock- and ice-sited temporary stations analyzed here were equipped with either Nanometrics Trillium 240 or Güralp cold-modified CMG-3T broadband sensors. To characterize and analyze the seismic background of Antarctica, we examined all available 40 and 20 Hz sampling rate seismic data from 77 stations (Ⓔ Table S1, available in the electronic supplement to this article; 9 permanent sites, 38 POLENET, 30 AGAP) between 2007 and 2012 using data retrieved from Incorporated Research Institutions for Seismol- ogy (IRIS) Data Services. The seismic time series were then used to generate acceleration power spectral densities (PSDs; in dB relative to 1m 2 =s 4 =Hz) and PSD probability density func- tions (PDFs) using the methodology of McNamara and Buland (2004) through the software package PQLX (McNamara and Boaz, 2011; Fig. 2). The PSD estimation procedure decon- volves the instrument response from archived continuous time series. One-hour, 50% overlapping time segments are win- dowed into 13 subsegments with 75% overlap. Each subseg- ment is demeaned and detrended, and a 10% cosine taper is applied to reduce spectral leakage. Welch’s section averaging method is utilized to estimate the PSD (e.g., Oppenheim and Schafer, 1975) for each 1 hr segment using the 13 subsegments. Empirical PDFs are constructed by binning periods in 1/8-oc- tave intervals and power in 1 dB intervals, and normalizing by the total number of PSDs. PSD PDFs and other statistics are referenced to the Peterson (1993) global new high- and doi: 10.1785/0220140109 Seismological Research Letters Volume 86, Number 1 January/February 2015 89
Transcript of Seismic noise levels across Antarctica

○E
The Seismic Noise Environment of Antarcticaby Robert E. Anthony, Richard C. Aster, Douglas Wiens, AndrewNyblade, Sridhar Anandakrishnan, Audrey Huerta, J. Paul Winberry,Terry Wilson, and Charlotte Rowe
Online Material: Table of station parameters; figures of meanacceleration power differences, interpolated noise maps.
INTRODUCTION
Seismographic coverage of Antarctica prior to 2007 consistedoverwhelmingly of a handful of long running and sporadicallydeployed transient stations, many of which were principallycollocated with scientific research stations. Despite very coldtemperatures, sunless winters, challenging logistics, and ex-treme storms, recent developments in polar instrumentationdriven by new scientific objectives have opened up the entiretyof Antarctica to year-round and continuous seismological ob-servation (e.g., Nyblade et al., 2012).
Motivations for these recent studies include improvedunderstanding of seismogenic, volcanic, tectonic and glacio-logical processes, heat flow, dynamic glaciological/ocean inter-actions, and mantle viscosity. Such studies contribute generallyto improvements in understanding the geophysical, geological,and glaciological history of the continent and how these proc-esses interact with the past and present state of the glaciologicaland climate system (e.g., Winberry et al., 2009; Hansen et al.,2010; West et al., 2010; Winberry et al., 2011; Heeszel et al.,2013; Lough et al., 2013; Chaput et al., 2014; Accardo et al.,2014), including processes relevant to glacial isostatic adjustmentand sea level rise (Intergovernmental Panel on Climate Change[IPCC] Report, 2007). In addition, microseisms arising fromocean wave activity contain useful climate proxy information onthe state and variability of the relatively poorly sensed southernoceans (Aster et al., 2008; Stutzmann et al., 2009; Aster et al.,2010), and such observations are sensitive to sea ice concentra-tion and areal coverage in the polar regions (Grob et al., 2011;Tsai and McNamara, 2011; Koch et al., 2013).
This characterization of the seismic noise environment ofAntarctica, documentation of instrument performance, andcomparisons of installation conditions (e.g., ice vaults vs. rocksites) is intended to facilitate optimization of future seismologi-cal deployments in such environments. We analyze data from arange of recent experiments to provide a broad geographicalcharacterization of Antarctica’s seismic noise environment,which can now include more substantial observations from re-gions that are free from anthropogenic noise contamination.
METHODS
Data Collection and AnalysisThe Polar Earth Observing Network (POLENET ANET) andGamburtsev Antarctic Mountains Seismic Experiment (GAM-SEIS/AGAP; e.g., Heeszel et al., 2013; Lloyd et al., 2013;Wiens et al., 2013; Chaput et al., 2014) deployments ofyear-round temporary seismic stations have strongly contrib-uted to improving the broadband seismic coverage of Antarc-tica (Fig. 1). Stations in POLENET ANET and GAMSEIS/AGAP were first deployed in December 2007 and have con-tinued through the present. Although most stations weredeployed in snow vaults, some sensors, particularly in theTransantarctic Mountains (TAMs) were installed directly onisolated rock outcrops, permitting some data quality compar-isons to be performed between the two siting environments.All rock- and ice-sited temporary stations analyzed here wereequipped with either Nanometrics Trillium 240 or Güralpcold-modified CMG-3T broadband sensors.
To characterize and analyze the seismic background ofAntarctica, we examined all available 40 and 20 Hz samplingrate seismic data from 77 stations (Ⓔ Table S1, available in theelectronic supplement to this article; 9 permanent sites, 38POLENET, 30 AGAP) between 2007 and 2012 using dataretrieved from Incorporated Research Institutions for Seismol-ogy (IRIS) Data Services. The seismic time series were thenused to generate acceleration power spectral densities (PSDs; indB relative to 1 m2=s4=Hz) and PSD probability density func-tions (PDFs) using the methodology of McNamara and Buland(2004) through the software package PQLX (McNamara andBoaz, 2011; Fig. 2). The PSD estimation procedure decon-volves the instrument response from archived continuous timeseries. One-hour, 50% overlapping time segments are win-dowed into 13 subsegments with 75% overlap. Each subseg-ment is demeaned and detrended, and a 10% cosine taper isapplied to reduce spectral leakage. Welch’s section averagingmethod is utilized to estimate the PSD (e.g., Oppenheim andSchafer, 1975) for each 1 hr segment using the 13 subsegments.Empirical PDFs are constructed by binning periods in 1/8-oc-tave intervals and power in 1 dB intervals, and normalizing bythe total number of PSDs. PSD PDFs and other statistics arereferenced to the Peterson (1993) global new high- and
doi: 10.1785/0220140109 Seismological Research Letters Volume 86, Number 1 January/February 2015 89
low-noise models (NHNM, NLNM) for broader globalcomparison.
PSD PDFs are insightful and compact data representationsfor examining instrumentation and data quality as well as seis-mic signals and noise levels. To identify background noiseconditions, the PSD population was culled of obvious instru-mentation artifacts associated with downtime and malfunc-tions. This was achieved, when necessary, by automaticallyidentifying characteristically anomalous PSDs that containedpower levels within the robust secondary microseism band thatexceeded the 98th percentile statistics in every period bin orthat fell below median NLNM power in at least 50% or theperiod bins. Such PSDs were attributed to common instrumen-tation artifacts such as mass recenters, calibrations (e.g., McNa-mara and Buland, 2004), and to intermittent data dropouts
due to power or other issues. The number of resulting PSDsrelative to the station installation time was then used to assesseach station’s uptime. Stations exhibiting less than 50% uptimeand/or failing to record at least one cycle of a seasonally rep-resentative one month or longer time segment were excludedfrom our noise maps but were included in the analyses of in-strumentation performance. PSDs that were strongly affectedby earthquake signals do not require special consideration be-cause they are sufficiently intermittent that they do not signifi-cantly affect the median or other central PSD PDF metricscalculated here (e.g., Aster et al., 2008, 2010). For the instru-mentation used in this study, the nominal digitizer/seismometer electromechanical noise level is generally substan-tially below the seismic noise field (e.g., Peterson, 1993; Wilsonet al., 2002; Ringler and Hutt, 2010) and thus usually do not
0° –330
°
–210°–1
80°
–150
°
–30° –60°
–60°–60°
–60°
GM04-GM07
N100-N215
P061-P124
GM03GM02
AGO3
GM01
AGO1
QSPA
PMSA
DUFK
PECA
FALLSURP
MILR
LONW
FISHDEVLVNDA
SIPL
MPAT
WILS
HOWD
MECK
THURST01-ST10
KOLRST12-ST14
CLRK
DNTWUPTW
WAIS
WNDY
WHIT
CASY
DRV
MAW
SYO
SNAA
SWEI
ALYS
BEAR
BENN
UNGL
SILY
TAM
BH. Sea
Drake Pas.
–2000–1800–1600–1400–1200–1000–800–600–400–2000200400600800
1000
Bedmap Elevation (m)
–80°
–80°
–70°
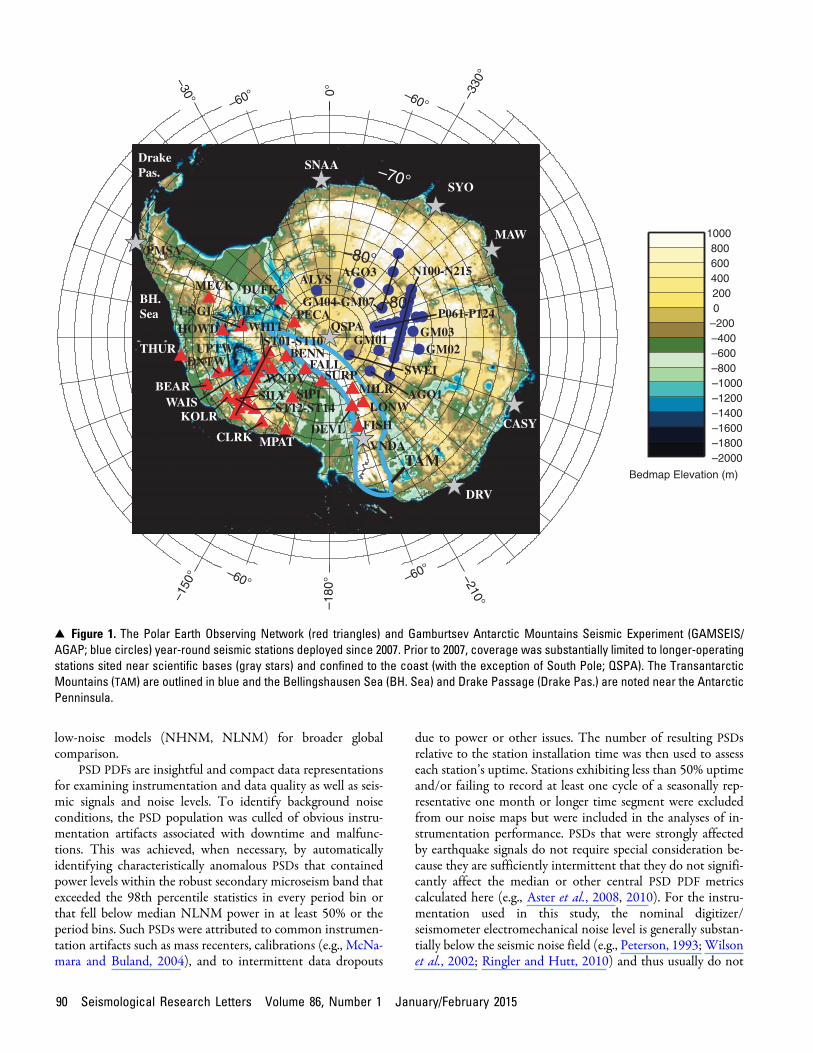
▴ Figure 1. The Polar Earth Observing Network (red triangles) and Gamburtsev Antarctic Mountains Seismic Experiment (GAMSEIS/AGAP; blue circles) year-round seismic stations deployed since 2007. Prior to 2007, coverage was substantially limited to longer-operatingstations sited near scientific bases (gray stars) and confined to the coast (with the exception of South Pole; QSPA). The TransantarcticMountains (TAM) are outlined in blue and the Bellingshausen Sea (BH. Sea) and Drake Passage (Drake Pas.) are noted near the AntarcticPenninsula.
90 Seismological Research Letters Volume 86, Number 1 January/February 2015
affect these metrics (the exception being at extremely quiet sitessuch as ice boreholes at short period [<0:1 s]).
Noise Band CharacterizationTo evaluate the spatial distribution of the seismic noise state atthese stations, we separated the median PSD of each stationcomponent into six period bands (Fig. 2) of interest to sourceand imaging seismology and examined the median powerin each.
The short-period band, 0.15–1.0 s, captures commonsources of anthropogenic noise, seismic coupling due to wind(e.g., Li et al., 1984; Galperin et al., 1986; Peterson, 1993;Withers et al., 1996; Young et al., 1996), as well as signalsranging from local glaciological movements to teleseismicearthquakes.
The 1.0–5.0 s teleseismic body waveband is shared by in-termittently excited local, regional, and teleseismic earthquake-generated body waves, which are key to structural and source-related studies. In addition, several recent studies have attributed
Jan07 Jan08 Jan09 Jan10 Jan11 Jan12 Jan13−165
−160
−155
−150
−145
−140
−135
Acc
eler
atio
n P
ower
(dB
)
Jan07 Jan08 Jan09 Jan10 Jan11 Jan12 Jan13−155
−150
−145
−140
−135
Acc
eler
atio
n P
ower
(dB
)
Period (s)
PS
D, d
B (
rel.
1 m
2 / s4/ H
z)
0.1 0.32 1 3.16 10 31.6 100−200
−180
−160
−140
−120
−100
−80
−60
Log 10
Cou
nts
−0.5
0
0.5
1
1.5
2
2.5
3
3.5
4
NHNM
NLNM
SecondaryMicroseism(5 – 10 s)
Primary Microseism (10 – 20 s)Short Period (0.15 – 1 s)
Long Period (50 – 150 s)
Body Waves (1 – 5 s)
Short Period (0.15 – 1 s)
Primary Microseism(10 – 20 s)
Intermediate Period (20 – 50 s)
(a)
(b) (c)
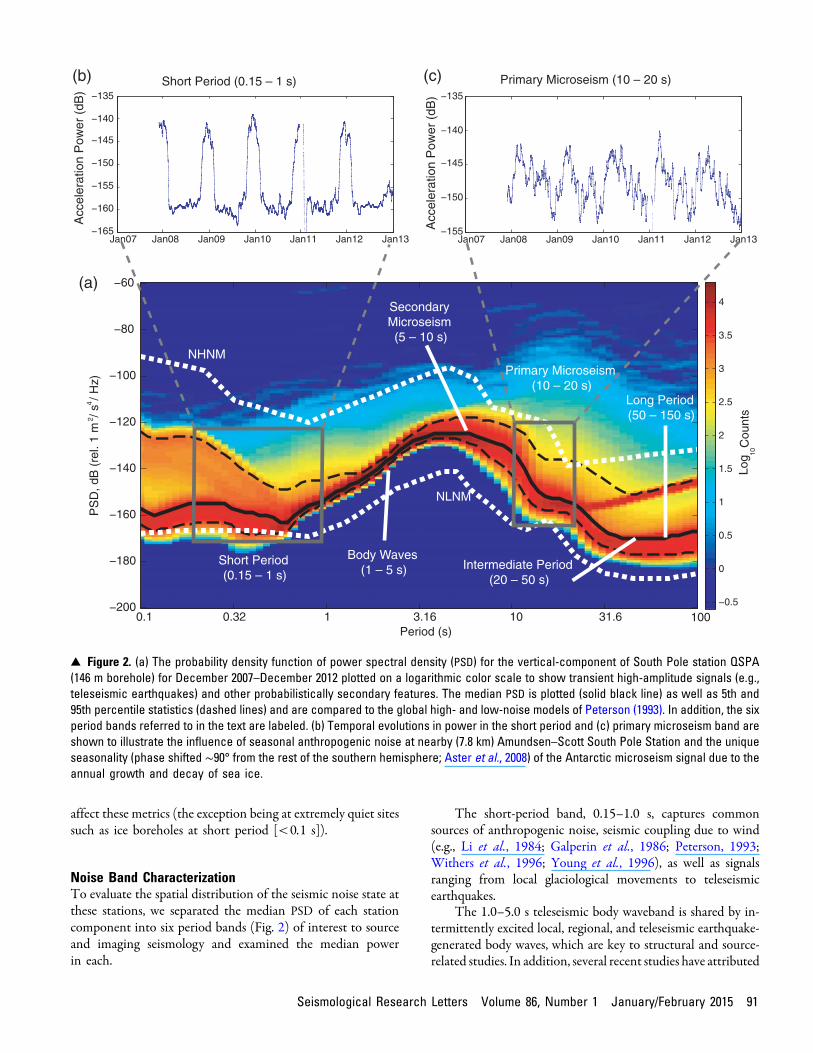
▴ Figure 2. (a) The probability density function of power spectral density (PSD) for the vertical-component of South Pole station QSPA(146 m borehole) for December 2007–December 2012 plotted on a logarithmic color scale to show transient high-amplitude signals (e.g.,teleseismic earthquakes) and other probabilistically secondary features. The median PSD is plotted (solid black line) as well as 5th and95th percentile statistics (dashed lines) and are compared to the global high- and low-noise models of Peterson (1993). In addition, the sixperiod bands referred to in the text are labeled. (b) Temporal evolutions in power in the short period and (c) primary microseism band areshown to illustrate the influence of seasonal anthropogenic noise at nearby (7.8 km) Amundsen–Scott South Pole Station and the uniqueseasonality (phase shifted ∼90° from the rest of the southern hemisphere; Aster et al., 2008) of the Antarctic microseism signal due to theannual growth and decay of sea ice.
Seismological Research Letters Volume 86, Number 1 January/February 2015 91

noise in this band at near-coastal and near-lake stations to localor regional swell activity (Bromirski et al., 2005; Tsai andMcNa-mara, 2011; Aleqabi et al., 2013), which constitutes the shorterperiod portion of the double-frequency (secondary)microseism.
The 5.0–10.0 s and 10.0–20.0 s secondary and primarymicroseism bands, respectively, are dominated, in the absenceof earthquake or other transient source excitation, by ocean-generated Rayleigh waves. The primary microseism originateswhen deep-ocean waves break or shoal on a shallow seafloorand are primarily converted into Rayleigh waves (e.g., Hassel-mann, 1963). The typically much more powerful secondarymicroseism is usually generated by standing-wave componentsof the oceanic wavefield (e.g., coastal reflections, storm–storm,or intrastorm wave interactions; Ardhuin et al., 2011) that gen-erate seafloor forcing at half the period of the constituent trav-eling ocean waves (e.g., Longuet-Higgins, 1950; Tanimoto,2007). Variations in microseism power at specific stations inAntarctica are known to be strongly sensitive to both near-coastal storms and to wave state (e.g., MacAyeal et al., 2006)and are amplitude modulated by the annual formation andbreakup of sea ice (Aster et al., 2008, 2010; Grob et al., 2011).
The 20–50 s intermediate period band contains powerfrom the longest period microseisms and is strongly excitedby intermediate-period surface waves from global earthquakes.
The 50–150 s long period band is controlled by low-amplitude (e.g., ∼300 time smaller in power than double-frequency microseism excitation) oceanic excitation of long-period waves generated through infragravity wave excitationand difference–frequency interaction of opposing ocean wave-trains (Rhie and Romanowicz, 2004; Traer et al., 2012). Acommon source of instrumentally generated noise in this bandis diurnal or other seismometer tilting that strongly couplesinto the horizontal components (e.g., Sorrells, 1971; Peterson,1993; Wilson et al., 2002). This period band is also intermit-tently excited by long-period teleseismic surface waves fromlarge earthquakes.
RESULTS AND DISCUSSION
Polar Instrument Performance for Different SitingMethodologiesTo evaluate the absolute and relative performance of year-round seismographs in Antarctica under different siting con-ditions, we cull the PSD dataset of obvious instrumentationartifacts as described previously and intercompare median PSDmetrics (Fig. 3). Postartifact uptimes for different emplacementtypes were highly variable, with permanent stations (9) record-ing acceptable quality data 89%� 3% of the time, POLENETANET sites (38) at 83%� 5%, and GAMSEIS/AGAP sites(30) at 66%� 4%. The lower data retrieval rate of the AGAPsites reflects the extremely cold temperatures and consequentservice and technical issues of working on the high elevationEast Antarctic Plateau (annual average ambient temperaturesof −50°C to −60°C and much colder temperatures during thewinter). Subdividing the POLENET ANETsites into emplace-ment type shows an uptime advantage of ice sheet (91%� 4%)
−180
−170
−160
−150
−140
−130
−120
Acc
eler
atio
n P
ower
(dB
rel
. 1 m
2 / s4 / H
z)
VNDA (100 m)QSPA (146 m)*QSPA (254 m)**CASYPOLENET Rock site (5)POLENET Ice Sheet (20)POLENET Snow (12)GAMSEIS (ICE Sheet) (30)ANMO (145 m)
0.1 0.32 1 3.16 10 31.6 100
0.1 0.32 1 3.16 10 31.6 100−15
−10
−5
0
5
10
15
20
Diff
eren
ce fr
om m
ean
Acc
eler
atio
n
P
ower
(dB
)
0.1 0.32 1 3.16 10 31.6 100−10
−5
0
5
10
15
20
25
30
Period (s)
Period (s)
Period (s)
H−
V a
ccel
erat
ion
pow
er (
dB)
(a)
(b)
(c)
▴ Figure 3. (a) Median vertical-component PSDs for different sit-ing types, as defined in the text, between 2008 and 2012 with theestimated Global Seismic Network low-noise models (light graydashed line; Peterson, 1993). Borehole sensors are indicated bydashed lines, and the numbers in the legend represent the numberof stations included in the median estimate or borehole depth. Be-cause of intermittent instrumentation issues, we only used datafrom February 2011 to December 2012 for characterizing the146 m QSPA borehole and omitted 2012 data for the 254 m bore-hole. For comparison to a high-quality North American site, wealso show ANMO, which is a long-running GSN rock borehole lo-cated near Albuquerque, New Mexico (U.S.A.). (b) Removing themean value of the PSD estimates in (a) displays relative noise leveldifferences. (c) Subtracting the median horizontal power (attainedfrom averaging the BHE (east–west) and BHN (north–south) PSDs)from vertical power for the different emplacement types showssubstantial amplification of horizontal power at several sites,which are primarily attributable to tilt-coupled horizontal noise.
92 Seismological Research Letters Volume 86, Number 1 January/February 2015

and shallow snow (84%� 8%) siting scenarios compared torock outcrops (72%� 14%).
Median vertical-component PSDs for the limited numberof available long-term stations and installation types reveal sev-eral intriguing differences (Fig. 3a,b). Unsurprisingly, the twoborehole emplacements (VNDA, QSPA) are up to 20 dB qui-eter at high frequencies compared to surface sites, reflecting theeffective mitigation of wind noise (e.g., Withers et al., 1996).Rock and shallow snow POLENET ANET sites comprise the
noisiest temporary seismic installations in the short-periodband, being 5–7 dB noisier than comparable ice sheet sites.This is likely explained as (1) many of these stations are locatedin the TAMs, which is one of the windiest places on the con-tinent (e.g., Mayewski et al., 2009), and (2) these sites arelocated on/near rock outcrop topography that facilitates thecoupling of wind energy into seismic noise. In addition, sta-tions placed directly on rock outcrops show enhanced horizon-tal noise, which we interpret as tilt, at periods of 0.5–3 s, asevidenced by a 5 dB difference between horizontal- andvertical-component noise (Fig. 3c). We hypothesize that thisis also a result of wind forcing on the exposed outcrop andinstrumentation enclosure. It should be noted that even thesenoisy POLENET ANET sites in the TAMs are characteristi-cally 10–15 dB quieter in the short-period band than perma-nent base-sited coastal stations at CASY, PMSA, DRV, whichare affected by persistent circumpolar westerly winds and prob-ably also all have some significant level of anthropogenic noisefor part of the year (Figs. 3 and 5). Between 0.3 and 2 s, thesecoastal, permanent pier and vault stations are the noisiest pop-ulation by 3–15 dB and have a distinct peak in noise at ∼0:5 srelative to other stations, suggestive of the buildings or otherstructures around the station being excited by the wind in thisperiod band (Ⓔ Fig. S1).
The teleseismic body waveband reveals that the noise levelsobserved between rock and ice sites diverges between 1.25 and7 s period, with ice site median levels being ∼9 dB noisier at 3 s(Fig. 3b). The noise in this band is comprised mainly ofRayleigh waves generated by near-coastal primary and secon-dary microseism sources. Using experimentally determined seis-mic velocities in ice sheets beneath the firn-ice transition(VP � 3:8 km=s; e.g., Kohnen, 1974; Albert, 1998) comparedto a fast (6:2 km=s) upper crust for a bedrock site yields a localamplification of ∼2:5 dB. Thus, this phenomenon cannot beentirely attributed to the simple elastic seismic-wave amplitudeeffects of the ice sheet and could be the result of an exception-ally strong contribution from the shallower snow, includingthat above the firn-ice transition (VP � ∼0:5–3 km=s; Albert,1998) and/or to trapped energy in the ice-sheet-atop-bedrockwaveguide near these periods. We additionally note an∼4:5 dB increase in the difference between horizontal- andvertical-component noise (Fig. 3c) throughout this amplifiedsecondary microseism band at ice sites relative to rock sites,which may reflect the influence of a smaller Poisson’s ratio(i.e., σ ∼ 0:2) in the upper ice sheet relative to rock sites.
Noise levels are relatively consistent in the primary andsecondary microseism bands for all installation types withthe exception of the near coastal site CASY. The intermediateperiod band between 20 and 50 s has∼5 dB of elevated noise onthe AGAP stations. Closer examination of these stationsrevealed a newly recognized source of instrument noise thatwas ultimately linked to the formation of convection cellswithin the sensor due to sensor heat dissipation under extremelycold ambient temperature conditions (Anthony et al., 2011;T. Parker (Incorporated Research Institutions for Seismology[IRIS] Program for the Array Seismic Studies of the
0.1 0.32 1 3.16 10 31.6 100−10
−5
0
5
10
15
Period (s)Diff
eren
ce fr
om m
ean
Acc
eler
atio
n P
ower
(dB
) Winter (May−Jul) 2007−2012
QSPA Surface WeekdaysQSPA Surface WeekendsQSPA Borehole (146 m)* WeekdaysQSPA Borehole (146 m)* WeekendsQSPA Borehole (254 m)* WeekdaysQSPA Borehole (254 m)* Weekends
0.1 0.32 1 3.16 10 31.6 100−30
−20
−10
0
10
20
30
Period (s)
Diff
eren
ce fr
om m
ean
Acc
eler
atio
n
P
ower
(dB
)
Field Season (Nov−Jan) 2007−2012
0.1 0.13 0.16 0.2 0.25 0.32 0.4 0.5 0.63 0.79 10
5
10
15
20
25
30
Period (s)
Wee
kday
−W
eeke
nd
Diff
eren
ce (
dB)
(a)
(b)
(c)
▴ Figure 4. Deviations of weekday (solid lines) and weekend(dashed lines) median vertical-component PSDs for the three sen-sor depths at the SPRESO site, incorporated into station QSPA,between 2007 and 2012 during (a) the winter (May–July) and(b) the field season (November–January). (c) Weekday/weekenddifferences for the boxed region in (b) shows the influence ofanthropogenic noise from nearby (7.8 km) Amundsen–Scott SouthPole Station during the field season. The 146 m borehole is theleast effective at mitigating this cultural noise likely because itis located within the near-surface (∼200 m) firn waveguide thattraps high-frequency energy (Albert, 1998).
Seismological Research Letters Volume 86, Number 1 January/February 2015 93

▴ Figure 5. Interpolated noise-map of Antarctica for each of six separate period bands (Fig. 2) using median vertical-component power ineach for 59 seismic stations (QSPA surface station used) located across the continent (triangles). Color scale changes with each periodrange to illustrate contrast and represents acceleration power in decibels. MILR is the red dot in the TAMs in the short-period map andreflects the exceptional wind coupling at this unstable rock site. Long-period sensor tilt at MILR is severe, and the station has beenomitted from the intermediate- and long-period maps. Stations afflicted with the long-period convection noise (HOWD, several GAMSEIS/AGAP sites) were also omitted from these two frequency bands. The large red feature in East Antarctica is controlled by one very noisycoastal station (CASY; Fig. 3).
94 Seismological Research Letters Volume 86, Number 1 January/February 2015

Continental Lithosphere [PASSCAL], personal comm., 2012).This phenomenon produces noise at periods of ∼30–70 s andonly affects the vertical components of a few sensors, mostlythose located on the East Antarctic Plateau (Ⓔ Fig. S2), and isgenerally absent during the warmer summer months.
A Case Study of QSPA (South Pole): Implications forIcecap Borehole SensorsBorehole installations at tens to hundreds of meters substan-tially reduce wind noise as well as some types of anthropogenicnoise (e.g., Young et al., 1996; McNamara and Buland, 2004).QSPA is a unique installation that incorporates borehole sen-sors installed within the nearly 3000 m thick south polar ice-cap. It is the only such station in the Global SeismographicNetwork, which includes a large number of conventional bed-rock borehole sites (Butler et al., 2004). The QSPA site is acomponent of the South Pole Remote Earth Science and Seis-mological Observatory (SPRESO), sited 7.9 km from thePole and the Amundsen–Scott (US) South Pole Station withina designated vibrational Quiet Sector for South Pole scienceoperations. The transition from snow to compact ice as a resultof pressure with increasing depth results in a laterally uniformseismic velocity gradient within the upper 200 m of the icesheet (Gow, 1963, 1975; Patterson, 1994). Modeling of short-period anthropogenic noise within this velocity model indi-cates that surface-generated noise is trapped in the near-surfacefirn layer (Albert, 1998). Two of the three QSPA boreholesensors were installed below 200 m to be located beneath thiswaveguide.
The multiple seismic instruments collocated at QSPA pro-vide an opportunity to compare the noise levels of surface vaultseismometers with borehole instruments in a continentalinterior ice sheet environment. Recording at QSPA began inJanuary of 2003, where three borehole instruments (at 275,254, and 146 m) were supplemented with additional sensorslocated in vaults 4 m below the surface. The station receivednumerous sensor replacements and updates during its develop-ment and testing between 2009 and 2011 (K. Anderson andT. Storm, personal comm., 2013). Here, we analyze data fromlonger contiguous periods of the archive collected at the surfacevault and with borehole Güralp CMG3-T sensors at 146 mafter February 2011 and at 254 m between 2007 and 2011.
Overall, baseline (winter), high-frequency (5–10 Hz)noise power is lower by 15–25 dB in the borehole installationson all components. This advantage diminishes with increasingperiod until∼1 s, beyond which noise levels for the surface andborehole sites are nearly identical (Fig. 4a). The 254 m deepborehole is several dB quieter than the sensor at a depth of146 m at frequencies greater than 1 Hz, with the greatest im-provement of ∼5 dB observed between frequencies of 3–5 Hz.Noise levels during the weekend and during the weekday aresimilar during austral winter months of highly reduced humanactivity (February–October), suggesting that the natural back-ground noise state, free from anthropogenic contamination, isapproached at the SPRESO site during this part of the year.The vertical-component noise is nearly uniform between
the surface and borehole sites at long periods, but the horizon-tal components of the borehole sensors are 35–40 dB quieterthan the surface at 100 s, due to the strongly reduced tilting ofthese clamped sensor packages relative to shallow ice vaults(Fig. 3c). This reduction in long-period, horizontal-componentnoise is 10 dB greater than that noted between rock boreholesand nearby surface vaults in the southwestern United States(Wilson et al., 2002).
During the austral summer (November–January), there isa large difference between the weekday noise and the weekendnoise levels (up to 26 dB), in the high-frequency band (<1 s)showing that anthropogenic noise from the South Pole stationis readily detected at all depths (Fig. 4b). Subtracting weekendfrom weekday power levels (Fig. 4c), we observe that stationactivities at the South Pole during the busiest season at the baseresults in a 15–25 dB increase in high-frequency (0.1–0.2 s)noise that decays approximately exponentially with increasingperiod. A likely significant source of this noise is the frequentgrooming of the snow runways by heavy equipment (Andersonet al., 2008). The 254 m deep borehole sensor, located wellbelow the firn–ice transition (van den Broeke, 2008), is seento be most effective at mitigating anthropogenic noise by up to∼5 dB compared to the surface vault and by up to ∼10 dBcompared to the 146 m borehole, which lies within the (upper∼200 m). These results thus support the Albert (1998) modelprediction that high-frequency seismic energy from surfacesources is substantially trapped in the shallow Antarctic icecap.
The Continent-Scale Seismic Noise Environmentof AntarcticaTo produce estimates of median vertical-component noise levelvariations across the continent (recognizing that the spatialsampling is of course still very sparse), power levels in theabove-defined period bands at each station were geographicallyinterpolated on an equal area, UTM-style, mesh grid (Fig. 5;Ⓔ horizontal-component noise level maps show similar trendssee Figs. S3 and S4). A striking feature on these maps are theanomalously high and broadband (0.15–20 s), (5–20 dB) noiselevels of the Antarctic Peninsula relative to the rest of the con-tinent, with the discrepancy becoming stronger at shorter peri-ods. This is likely primarily due to the high winds associatedwith the circumpolar westerlies and the resulting effects oftempestuous seas in the Drake Passage and BellingshausenSea, accentuated by the narrowness of the peninsula andstation proximities to the coast.
Noise in the short-period band is also relatively high(∼10 dB above the majority of the continental interior) atnon-Peninsular coastal and central TAM sites. This is consis-tent with estimates of higher wind speeds in these areas fromlong-term (e.g., 40-year) weather reanalysis, for the centralTAM and East Antarctic Coast (Mayewski et al., 2009). Awayfrom the Antarctic Peninsula and its exceptionally strong andbroadband oceanic microseism noise, PSD median levels in theteleseismic body waveband (1–5 s) become much more uni-form, varying by just ∼7 dB, with the highest levels recordedat near-coastal stations and for sensors sited atop thick ice
Seismological Research Letters Volume 86, Number 1 January/February 2015 95

sheets (e.g., GAMSEIS/AGAP; POLENET ANET TransectStations; WAIS).
Generally, power in the primary and secondary micro-seism bands are highest at near-coastal stations and decay intothe continental interior by up to 6 dB and 12 dB, respectively.The gradient of decay is period correlated and is most readilyobservable around the Antarctic Peninsula. Compared to mostof the planet, noise levels in the entire microseism band (1–20 s) in Antarctic are strongly affected by the annual growthand decay of sea ice around the continent (Fig. 6; primarymicroseism shown for reference). In both microseism bands,seasonal power varies by at least 10 dB, with annual maximaoccurring across most of the continent during the sea ice mini-mum, which occurs approximately three months prior to peakoceanic storm activity in the southern hemisphere (Aster et al.,2008). Minimum noise in the microseism bands occurs duringthe summer across the continent, with the notable exception ofprimary microseism power at DRV. We suspect that high levelsof local sea-ice loss early in the melt season may drive this phe-nomenon by exposing the Wilkes Land regional coastline andshelf to Southern Ocean waves earlier in the year. Previousanalysis of microseism noise at DRV has shown that the pri-mary microseism source back-azimuth shifts seasonally towardthe closest ice-free ocean (Stutzmann et al., 2009).
Comparing the noise environment of the Antarctic con-tinent to long-running sites in interior North America allowsfor a simple comparison between these Antarctic noise levelsand typical data recorded in the northern hemisphere (e.g., byEarthScope USArray). We compared the median PSD metricscalculated in this study (Fig. 3) to a 145 m rock borehole sensorat GSN station ANMO (Albuquerque, New Mexico, U.S.A.).In general, Antarctic stations are ∼5 dB quieter at short peri-ods (<1 s) than ANMO, likely because of limited anthropo-genic noise contributions, greatly reduced wind profiles, andpotentially poorly characterized short-period response at the145 m ANMO borehole (Adam Ringler [USGS AlbuquerqueSeismic Laboratory], personal comm., 2014). However, evenwithout considering the ice-sheet amplification effect widelyobserved between ∼1:25 and 7 s, West Antarctica is typically2–5 dB noisier than ANMO in the microseism bands (1–20 s)despite being seasonally surrounded by a sea ice buffer. Thislikely reflects the more extreme wave states and storm activitypresent in the Southern Ocean relative to the northern PacificOcean, which dominates the microseism band at ANMO (e.g.,Aster et al., 2008).
CONCLUSIONS
Broadband seismic background noise for Antarctica is charac-terized using recently collected year-round data that havegreatly expanded coverage across the continent. We analyzednoise levels within six discrete bands that encompass diversesources of natural, anthropogenic, and instrument (e.g., tilt-coupled) noise and have broadly characterized the large-scalegeographic distribution of power in each band across the con-tinent and nominal noise level expectations for future Antarc-
tic stations. We conclude the following regarding the varioustypes of installations presently available for analysis.
Ice Borehole StationsDespite detectable short-period-dominated anthropogenicnoise during the busiest part of the year from the 7.8 kmdistant Amundsen–Scott South Pole Station, the borehole seis-mometers at QSPA are the quietest sensors in Antarctica athigh frequencies (>∼2 Hz), occasionally dropping belowthe Peterson (1993) low-noise model, and are thus candidatesfor the quietest stations on earth in this frequency range. Ourobservations confirm that placing the sensor below the near-surface waveguide modeled by Albert (1998) (>∼200 m) re-sults in an ∼5 dB reduction in baseline natural high-frequencynoise and a 10 dB reduction in anthropogenic noise comparedto a sensor located within the waveguide. In addition, theQSPA borehole instruments are the only ice-sited sensors inAntarctica to exhibit extremely low tilt-coupled horizontal-component noise at long periods (i.e., >50 s) and attendantlow general long-period noise levels. QSPA does experience anup to ∼9 dB amplification in background noise at 2–5 s sim-ilar to that observed on all thick ice sites, and that we concludeis a combination lowered seismic impedance and ice-atop-bedrock waveguide effect.
Rock Borehole StationsThe 100 m rock borehole VNDA, located in the McMurdoDry Valleys, does not exhibit the amplified 2–5 s noise levelsof QSPA and other ice sheet sites and is also ∼5 dB quieterthan the QSPA boreholes and POLENET ANET ice vaultsat 50–100 s, making it the quietest long-period instrument inAntarctica. The instrument does appear to exhibit some tilt-coupled noise at>30 s period, as is visible in vertical/horizontalpower ratios, but this discrepancy between components issmaller than for any other sensor on the continent except theQSPA ice borehole sensors. Short-period (<1 s) noise levels atVNDA are better than any other Antarctic station, except forthe QSPA boreholes, despite its location in the windy Dry Val-leys and at the foot of the TAMs. This station is generally∼10 dB quieter than comparable POLENET ANET rock sites;however, 8–30 s microseism power levels are 1–2 dB higher thantypical stations in Antarctica, which we attribute to relativeproximity to coastal microseism sources.
Together, the two borehole stations are the quietest sites inAntarctica between 0.15 and 100 s and are exceptionallyimpervious to wind and tilt-coupled horizontal noise. Becauseof their low long-period noise, establishing additional bore-holes sites in Antarctica would significantly improve the abilityto detect and study long-period signal generated by the cryo-spheric and tectonic processes in Antarctica. For instance, thesetwo sites were the only stations capable of clearly detectingthe 25–83 s slip signal generated by slow cryospheric eventsfrom the Whillans Ice Stream in West Antarctica by Wienset al. (2008).
96 Seismological Research Letters Volume 86, Number 1 January/February 2015

▴ Figure 6. Interpolated map of seasonal median differences from year-round medians in the primary microseism band (10–20 s) overlainon representative sea ice concentration maps from the middle month of each season during 2009 (Fetterer et al., 2002). Red indicatesstation-interpolated regions that are noisier for a particular season than the median, and blue indicates regions that are quieter. Seasonalpower variations in this band are strongly influenced by the annual build up and decay of sea ice, with the entire continent experiencinghighest noise levels during the fall sea ice minimum. Nearly all of West Antarctica experiences above-average noise levels during thewinter, likely in response to Southern Ocean swell interacting with the ice-free northern Antarctic Peninsula (Koch et al., 2013). TheWilkesLand coastal region near Dumont d’Urville (DRV) is one of the earliest sections of Antarctic coastline to be directly exposed to SouthernOcean swell during early summer and consequently is the only area of the continent in this study to show above-average primary micro-seism power during this season.
Seismological Research Letters Volume 86, Number 1 January/February 2015 97

Ice Sheet StationsIn general, POLENET ANET vaults, where sensors were typ-ically deployed 1–2 m below the surface and atop thick icesheets, were 5–7 dB quieter in the short-period band than com-parable rock and near-rock/shallow snow vaults. These lowernoise levels are partially attributable to the stations being de-ployed in less windy areas with flatter topography and accord-ingly lower levels of seismic wind coupling. In addition, manyof these sites become covered drift, resulting in very low windprofiles. These sites are also 5–7 dB quieter at 30–100 s thanrock/shallow snow vaults, reaching vertical noise levels that canapproach the 254 m QSPA borehole in this band. GAMSEIS/AGAP ice vaults deployed on the East Antarctic Plateau expe-rienced greater difficulty operating continuously in the excep-tionally harsh East Antarctic environment. Some of thesestations experienced strong, ∼30–70 s, internal convectionnoise on the vertical components, a newly recognized processof internal seismometer noise generation that is now under-stood and being ameliorated (T. Parker, personal comm.,2012).
Rock and Shallow Snow StationsRock and shallow snow stations are here classified as those sitedon top of and adjacent to isolated Nunataks and/or in closevicinity to TAM outcrops. In these locations, we found thatemplacement in even shallow snow/ice was broadly superiorto direct rock installation, particularly in improving long-period (>10 s) sensor horizontal noise attributed to tilt,and in the near-elimination of shorter period tilt, which wesuspect arises from direct wind forcing on the outcrop and sta-tion. At an especially noisy rock vault from POLENET ANET(MILR, Fig. 6), these wind-driven effects were so severe thatthe microseism peaks were sometimes obscured on PSD PDFsof the horizontal components and the station was renderedunusable for shear-wave splitting studies (Accardo et al.,2014). In addition, we note that station uptimes for rock vaults(72%) are not as good as shallow-snow or ice vaults (84%, vs.91%), primarily because these sites are more susceptible todamage from extreme storm events. In the future, we recom-mend installing stations that are near outcrops on adjacentsnow rather than rock when possible.
Long-Term Stations with Bedrock Piers/VaultsThe longest operational seismographic stations in Antarctica,aside from the heterogeneous installations over the years atSouth Pole are collocated with coastal research stations andare consequently subject to anthropogenic, wind, and micro-seism noise. Between 0.3 and 2 s, these stations as a groupare the noisiest in Antarctica. Compared to remote, temporaryshallow snow vaults, the main seismic noise advantage of theseinstallations, which incorporate larger-scale permanent piers, isconvenience and reduced sensor tilt (i.e., an ∼10 dB smallerdiscrepancy in H/V ratios at 100 s).
Using the long running GSN borehole station ANMO asan example of a long-running, high-quality station for refer-ence, we find that many interior stations in Antarctica are qui-
eter than ANMO at short periods (<1 s) but also show moreenergy in the microseism bands (1–20 s) due to the contentbeing surrounded by the Southern Ocean and despite lowernoise levels arising from annual sea ice growth. Aside fromthe aforementioned ice-sheet-associated amplification between∼1:25 and 7 s, noise levels in Antarctica in the microseism-spanning bands are controlled by proximity to strong micro-seism source generation regions (especially the Antarctic Pen-insula), and to seasonal and longer-term changes in southernocean wave state and sea ice extent. Geographic variations inmicroseism power become less pronounced, but are still resolv-able, at longer periods. Maximum power in these period bandsgenerally occurs across the continent during the Austral fall,when annual ocean wave activity is increasing and sea ice cover-age is at a minimum. The formation of the sea ice buffer duringthe winter slightly reduces yearly variations of microseismpower in Antarctica (∼10–15 dB) compared to nonpolar sta-tions (e.g., 12–18 dB at ANMO).
Recent year-round seismic deployments in the remoteinterior of Antarctica have dramatically increased the qualityand quantity of broadband data from large hitherto unsampledareas of the continent. These data are helping to drive signifi-cant new understanding about solid Earth, and glacial struc-tures and processes (e.g., Lough et al., 2013; Accardo et al.,2014; Chaput et al., 2014; Peng et al., 2014). Uptimes of tem-porary ice-sheet vaults utilized in the POLENET ANET de-ployment rival those of many long-term stations collocatedwith research bases, yet show substantially reduced noise levelsin the period bands of local and teleseismic earthquakes and icequakes. These results indicate that the seismological commu-nity is now capable of both interrogating additional sections ofpolar and other cold regions and able to move toward the es-tablishment of more geographically extensive and long-termAntarctic and Arctic seismographic networks.
ACKNOWLEDGMENTS
We express thanks to Tim Parker (Incorporated ResearchInstitutions for Seismology–Program for the Array SeismicStudies of the Continental Lithosphere [IRIS-PASSCAL]Instrument Center), Kent Anderson (IRIS), Adam Ringler(U.S. Geological Survey [USGS] Albuquerque SeismologicalLaboratory), Dan McNamara (USGS, National EarthquakeInformation Center), and Susan Bilek and David Reusch(New Mexico Tech) for useful exchanges. The facilities ofthe IRIS Data Management System, and specifically the IRISData Management Center, were used for access to waveformand metadata required in this study. Sea ice concentration dataaround Antarctica were obtained from The National Snowand Ice Data Center (NSIDC). The Global SeismographicNetwork (GSN) is a cooperative scientific facility operatedjointly by the IRIS, the USGS, and the National Science Foun-dation (NSF). The facilities of the IRIS Consortium are sup-ported by the NSF under Cooperative Agreement EAR-1063471, NSF Polar Programs, and the Department of EnergyNational Nuclear Security Administration. POLENET-
98 Seismological Research Letters Volume 86, Number 1 January/February 2015

Antarctica phase 1 was supported by NSF Polar ProgramsGrant Numbers 0632230, 0632239, 0652322, 0632335,0632136, 0632209, and 0632185, and POLENET-Antarcticaphase 2 is supported by NSF Polar Programs Grant Numbers1246776, 1246712, and 1419268. Additional funding wasprovided by Los Alamos National Laboratory through the In-stitute of Geophysics, Planetary Physics. Additional informa-tion regarding the POLENET project, data collection sites,and geophysical data is available at polenet.org (last accessedOctober 2014).
REFERENCES
Accardo, N., D. Wiens, S. Hernandez, R. Aster, A. Nyblade, A. Huerta,S. Anandakrishnan, T. Wilson, and D. Heeszel (2014). Upper man-tle seismic anisotropy beneath the West Antarctic Rift System andsurrounding region from shear wave splitting analysis, Geophys. J.Int. 198, 414–429.
Albert, D. G. (1998). Theoretical modeling of seismic noise propagationin firn at the South Pole, Antarctica, Geophys. Res. Lett. 25, doi:10.1029/1998GL900155.
Aleqabi, G., G. Euler, D. Wiens, M. Wysession, S. van der Lee,J. Revenaugh, A. Frederiksen, F. Darbyshire, S. Stein, and D. Jurdy(2013). Array analysis of Lake Superior microseisms, Abstract: 2013EarthScope National Meeting, Raleigh, North Carolina, 13–15 May2013.
Anderson, K., R. Butler, and R. Aster (2008). Comparison of Antarcticseismic station quality performance to aggregate GSN networkpower spectral density probability density functions, Annual Meet-ing of the Seismological Society of America, Santa Fe, New Mexico,Santa Fe, New Mexico, 16–18 April 2008, Seismol. Res. Lett. 79,no. 2.
Anthony, R. E., R. C. Aster, D. A. Wiens, A. Nyblade, and C. A. Rowe(2011). Seismic noise levels across Antarctica, AGU Fall MeetingAbstracts 2204, San Francisco, California, 5–9 December 2011.
Ardhuin, F., E. Stutzmann, M. Schimmel, and A. Mangeney (2011).Ocean wave sources of seismic noise, J. Geophys. Res. 116,C05002, doi: 10.1029/2011JC006952.
Aster, R. C., D. E. McNamara, and P. D. Bromirski (2008). Multidecadalclimate-induced variability in microseisms, Seismol. Res. Lett. 79,194–202.
Aster, R. C., D. E. McNamara, and P. D. Bromirski (2010). Global trendsin extremal microseism intensity, Geophys. Res. Lett. 37, L14303,doi: 10.1029/2010GL043472.
Bromirski, P. D., F. K. Duennebier, and R. A. Stephen (2005). Mid-oceanmicroseisms, Geochem. Geophys. Geosyst. 6, Q04009, doi: 10.1029/2004GC000768.
Butler, R., T. Lay, K. Creager, P. Earl, K. Fischer, J. Gaherty, G. Laske, B.Leith, J. Park, M. Ritzwoller, J. Tromp, and L. Wen (2004). Theglobal seismographic network surpasses its design goal, Eos Trans.AGU 85, no. 23, 225–229, doi: 10.1029/2004EO230001.
Chaput, J., R. Aster, X. Sun, D. Wiens, A. Nyblade, S. Anandakrishnan,A. Huerta, P. Winberry, and T. Wilson (2014). Crustal thicknessacross West Antarctica, J. Geophys. Res. 119, 378–395.
Fetterer, F., K. Knowles,W. Meier, and M. Savoic (2002). Sea Ice Index,Digital media, Natl. Snow and Ice Data Center, Boulder, Colorado.
Galperin, E. I., I. L. Nersesov, and R. M. Galperina (1986). BoreholeSeismology and the Study of the Seismic Regime of Large IndustrialCenters, Reidel, Dordrecht, Netherlands, 315 pp.
Gow, A. J. (1963). Age Hardening of snow at the South Pole, J. Glaciol. 4,no. 35, 521–536.
Gow, A. J. (1975). Time-temperature dependence of sintering in peren-nial isothermal snowpacks, International Association of HydrologicalSciences Publications 114, 25–41.
Grob, M., A. Maggi, and E. Stutzmann (2011). Observations of the sea-sonality of the Antarctic microseismic signal, and its association tosea ice variability, Geophys. Res. Lett. 38, L11302, doi: 10.1029/2011GL047525.
Hansen, S. E., A. Nyblade, D. S. Heezel, D. A. Wiens, P. Shore, andM. Kanao (2010). Crustal structure of the GamburtsevMountains, East Antarctica, from S-wave receiver functions andRayleigh wave phase velocities, Earth Planet. Science Lett. 300,395–401.
Hasselmann, K. (1963). A statistical analysis of the generation ofmicroseisms, Rev. Geophys. 1, no. 2, 177–210.
Heeszel, D. S., D. A. Wiens, A. A. Nyblade, S. E. Hansen, M. Kanao, M.An, and Y. Zhao (2013). Rayleigh wave constraints on the structureand tectonic history of the Gamburtsev Subglacial Mountains, EastAntarctica, J. Geophys. Res. 118, 2138–2153.
Intergovernmental Panel on Climate Change (IPCC) (2007). ClimateChange 2007: The Physical Science Basis. Contributions of the Work-ing Group 1 to the Fourth Assessment Report of the IntergovernmentalPanel on Climate Change, Solomon, S., D. Qin, M. Manning, Z.Chen, M. Marquis, K. B. Averyt, M. Tignor, and H. L. Miller (Edi-tors), Cambridge University Press, Cambridge, United Kingdomand New York, New York, U.S.A.
Koch, F. W., D. A. Wiens, G. G. Euler, A. A. Nyblade, S. Anandak-rishnan, A. Huerta, T. J. Wilson, and R. C. Aster (2013). Trackingthe effect of sea ice cover on microseismic noise using two seismicarrays in Antarctica, Abstract Seismological Society of America An-nual Meeting, Salt Lake City, Utah , 17–19 April 2013.
Kohnen, H. (1974). The temperature dependence of seismic waves in ice,J. Glaciol. 13, 144–147.
Li, T. M. C., J. F. Ferguson, E. Herrin, and H. B. Durham (1984). High-frequency seismic noise at Lajitas, Texas, Bull. Seismol. Soc. Am. 74,2015–2033.
Lloyd, A., A. Nyblade, D. Wiens, S. Hansen, M. Kanao, P. Shore, and D.Zhao (2013). Uppermantle seismic structure beneath the EastAntarctic shield from body wave tomography: Implications forthe origin of the Gamburtsev Subglacial Mountains, Geochem.Geophys. Geosyst. 14, doi: 10.1002/ggge.20098.
Longuet-Higgins, M. S. (1950). A theory of the origin of microseisms,Phil. Trans. Roy. Soc. A 243, 1–35.
Lough, A. C., D. A. Wiens, C. G. Barcheck, S. Anandakrishnan, R. C.Aster, D. D. Blankenship, A. D. Huerta, A. Nyblade, D. A. Young,and T. J. Wilson (2013). Seismic detection of an active subglacialmagmatic complex in Marie Byrd Land, Antarctica, Nat. Geosci. 6,1031–1035.
MacAyeal, D., E. Okal, and R. Aster (2006). Transoceanic wave propa-gation links iceberg calving margins of Antarctica with storms intropics and N. hemisphere, Geophys. Res. Lett. 33, L17502, doi:10.1029/2006GL027235.
McNamara, D., and R. Boaz (2011). PQLX: A seismic data qualitycontrol system description, applications, and users manual, U.S.Geol. Surv. Open-File Rept. 2010-1292.
McNamara, D., and R. Buland (2004). Ambient noise levels in thecontinental United States, Bull. Seismol. Soc. Am. 94, 1517–1527.
Mayewski, P. A., M. P. Meredith, C. P. Summerhayes, J. Turner, A.Worby, P. J. Barrett, G. Casassa, N. A. N. Bertler, T. Bracegirdle,A. C. Naveira Garabato, D. Bromwich, H. Campbell, G. S.Hamilton, W. B. Lyons, K. A. Maasch, S. Aoki, C. Xiao, andTas van Ommen (2009). State of the Antarctic and southernOcean climate system, Rev. Geophys. 47, RG1003, doi: 10.1029/2007RG000231.
Nyblade, A., J. Amundson, S. Hansen, E. Ivins, M. Lazzara, M. Nettles,C. Raymond, and L. Stearns (2012). A facility plan for polarseismic and geodetic science, Joint IRIS/UNAVCO Workshop Re-port, IRIS Consortium, http://www.iris.edu/hq/files/publications/other_workshops/docs/APOS_FINAL.pdf (last accessed March 2014).
Oppenheim, A. V., and R. Schafer (1975). Digital Signal Processing,Prentice-Hall, Englewood Cliffs, New Jersey.
Seismological Research Letters Volume 86, Number 1 January/February 2015 99

Patterson,W. S. B. (1994). The Physics of Glaciers, Third Ed., PergammonPress, New York.
Peng, Z., J. Walter, R. Aster, A. Nyblade, D. Wiens, and S. Anandak-rishnan (2014). Dynamically triggered icequakes in Antarctica,Nat. Geosci. doi: 10.1038/NGEO2212.
Peterson, J. (1993). Observation and modeling of seismic backgroundnoise, U.S. Geol Surv. Technical Rept. 93–322.
Rhie, J., and B. Romanowicz (2004). Excitation of Earth’s continuousfree oscillations by atmosphere-ocean-seafloor coupling, Nature431, 552–556.
Ringler, A. T., and C. R. Hutt (2010). Self-noise models of seismic instru-ments, Seismol. Res. Lett. 81, doi: 10.1785/gssrl.81.6.972.
Sorrells, G. G. (1971). A preliminary investigation into the relation-ship between long-period seismic noise and local fluctuations inthe atmospheric pressure field, Geophys. J. Roy. Astron. Soc. 26,nos. 1/4, 71–82.
Stutzmann, E., M. Schimmel, G. Patau, and A. Maggi (2009). Globalclimate imprint on seismic noise, Geochem. Geophys. Geosyst. 10,Q11004, doi: 10.1029/2009GC002619.
Tanimoto, T. (2007). Excitation of microseisms, J. Geophys. Res. 34,L05308, doi: 10.1029/2006GL029046.
Traer, J., P. Gerstoft, P. D. Bromirski, and P. M. Shearer (2012).Microseisms and hum from ocean surface gravity waves, J. Geophys.Res. 117, B11307, doi: 10.1029/2012JB009550.
Tsai, V. C., and D. E. McNamara (2011). Quantifying the influence ofsea ice on ocean microseism using observations from the BeringSea, Alaska, Geophys. Res. Lett. 38, L22502, doi: 10.1029/2011GL049791.
Van den Broeke, M. (2008). Depth and Density of the Antarctic FirnLayer, Arctic, Antarctic, and Alpine Research 40, 432–438.
West, M. E., C. F. Larsen, M. Truffer, S. O’Neel, and L. LeBlanc (2010).Glacier Microseismicity, Geology 38, 319–322, doi: 10.1130/G30606.1.
Wiens, D. A., S. Anandakrishnan, J. P. Winberry, and M. A. King (2008).Simultaneous teleseismic and geodetic observations of stick-slipmotion of an Antarctic ice stream, Nature 453, 770–775, doi:10.1038/nature06990.
Wiens, D., D. Heeszel, X. Sun, A. Lloyd, A. Nyblade, S. Anandakrishnan,R. Aster, J. Chaput, A. Huerta, S. Hansen, and T. Wilson (2013).Lithospheric structure of Antarctica and implications for Geologicaland Cryospheric evolution, Proc. IASPEI Meeting, Gothenburg,Sweden, July 2013.
Wilson, D., J. Leon, R. Aster, J. Ni, J. Schlue, S. Grand, S. Semken,S. Baldridge, and W. Gao (2002). Broadband seismic backgroundnoise at temporary seismic stations observed on a regional scalein the southwestern United States, Bull. Seismol. Soc. Am. 92,3335–3341.
Winberry, J. P., S. Anandakrishnan, R. B. Alley, R. Bindschadler, andM. King (2009). Basal Mechanics of ice streams: Insights fromstick-slip motion, J. Geophys. Res. Earth Surf. F01016, doi:10.1029/2008JF001035.
Winberry, J. P., S. Anandakrishnan, D. A. Wiens, and R. B. Alley (2011).Dynamics of ice-stream stick-slip motion, Earth Planet. Sci. Lett.305, 283–289.
Withers, M., R. Aster, C. Young, and E. Chael (1996). High-frequency analysis of seismic background noise and signal-to-noiseratio near Datil, New Mexico, Bull. Seismol. Soc. Am. 86, 1507–1515.
Young, C. J., E. P. Chael, M. M. Withers, and R. C. Aster (1996). Acomparison of high frequency (≥1 Hz) surface and subsurface noiseenvironment at three sites in the United States, Bull. Seismol. Soc.Am. 86, 1516–1528.
Robert E. AnthonyRichard C. Aster
Department of GeosciencesColorado State University
Fort Collins, Colorado 80523 [email protected]
Douglas WiensDepartment of Earth and Planetary Sciences
Washington University in St. LouisSt. Louis, Missouri 63130 U.S.A.
Andrew NybladeSridhar Anandakrishnan
Department of GeosciencesPennsylvania State University
University Park, Pennsylvania 16802 U.S.A.
Audrey HuertaJ. Paul Winberry
Department of Geological SciencesCentral Washington University
Ellensburg, Washington 98926-7418 U.S.A.
Terry WilsonDepartment of Geological Sciences
275 Mendenhall Lab125 S. Oval Mall
Ohio State UniversityColumbus, Ohio 43210-1522 U.S.A.
Charlotte RoweEES-17, MS F-665 Seismologist
Geophysics GroupLos Alamos National Laboratory
Los Alamos, New Mexico 87545 U.S.A.
Published Online 26 November 2014
100 Seismological Research Letters Volume 86, Number 1 January/February 2015