Arctic Climate Impact Assessment: Ozone and Ultraviolet Radiation
Upload
independentCategory
view
2download
0
Comparison of ultraviolet spectroradiometers in Antarctica
Germar Bernhard,1 Richard L. McKenzie,2 Michael Kotkamp,2 Stephen Wood,2
Charles R. Booth,1 James C. Ehramjian,1 Paul Johnston,2 and Sylvia E. Nichol3
Received 10 October 2007; revised 30 January 2008; accepted 14 March 2008; published 26 July 2008.
[1] Solar ultraviolet irradiance has been monitored in Antarctica for almost two decadesby a network of spectroradiometers established by the National Science Foundation. Datahave been used for investigating increases in ultraviolet radiation in response to ozonedepletion, validation of satellite observations, and the establishment of ultraviolet radiationclimatologies and trends. To assess the quality of data collected, measurements of themonitoring spectroradiometer installed at Arrival Heights (78�S, 167�E) were comparedwith an independently calibrated, state-of-the art instrument, which was installed nextto the monitoring system for a three-month campaign. Measurements of the twoinstruments differed by 5–7% on average. The discrepancy is quantitatively explained bythe different irradiance scales used by the two systems, a bias in determining the referenceplane of fore-optics, drifts of calibration standards, some temperature-dependence in thetransmission of the entrance optics, and nonlinearity of one of the systems. Thewavelength accuracy of data from both instruments was also tested with two commonlyused correlation methods. Wavelength shifts determined with the two methods agreed towithin 0.003–0.006 nm. Results of the campaign suggest that data collected by themonitoring instrument are of adequate quality for submission to the Network for theDetection of Atmospheric Composition Change.
Citation: Bernhard, G., R. L. McKenzie, M. Kotkamp, S. Wood, C. R. Booth, J. C. Ehramjian, P. Johnston, and S. E. Nichol (2008),
Comparison of ultraviolet spectroradiometers in Antarctica, J. Geophys. Res., 113, D14310, doi:10.1029/2007JD009489.
1. Introduction
[2] The U.S. National Science Foundation’s (NSF) Ultra-violet Spectral Irradiance Monitoring Network (UVSIMN)was established in 1987 for measuring ultraviolet (UV)radiation at high latitudes [Booth et al., 1994]. The networkprimarily employs SUV-100 spectroradiometers, is operatedby Biospherical Instruments Inc (BSI), and currentlyincludes seven sites, three of which are in Antarctica.Network data have been used for studies investigatingincreases in UV in response to ozone depletion [Boothand Madronich, 1994]; research into factors affecting UVirradiance at the Earth’s surface [e.g., Zerefos et al., 2001;Nichol et al., 2003; Bernhard et al., 2007]; validation ofsatellite UVobservations [Kalliskota et al., 2000; Tanskanenet al., 2007]; validation of radiative transfer model calcu-lations [e.g., Kancler et al., 2005; Bernhard et al., 2007];and the establishment of UV climatologies and trends[Bernhard et al., 2004, 2006b, 2007]. Data have furtherbeen used by biologists analyzing the effects of UV irradi-ance on aquatic [e.g., Smith et al., 1992] and terrestrial [Dayet al., 1999] ecosystems. Data accuracy is of crucial
importance for most of these applications. The objectiveof this paper is to quality-assure UVSIMN measurementsagainst data from an independently calibrated and main-tained state-of-the-art instrument, which is part of theNetwork for the Detection of Atmospheric CompositionChange (NDACC).[3] Quality control of network data [Bernhard et al.,
2006a] and the correction of known systematic errors[Bernhard et al., 2004, 2006b] has high priority. Networkinstruments have successfully participated in national andinternational intercomparisons [Seckmeyer et al., 1995;Thompson et al., 1997; Early et al., 1998; Lantz et al.,2002; Wuttke et al., 2006a]. For example, measurements oferythemal irradiance performed by an SUV-100 instrumentat an intercomparison in 1994 agreed to within 7% withresults from four other instruments from Germany, NewZealand, and Australia [Seckmeyer et al., 1995]. Thisintercomparison formed the basis for a study on geograph-ical differences in UV radiation featuring twelve sites fromboth hemispheres. For wavelengths larger than 315 nm,measurements of an SUV-150B spectroradiometer (an ad-vanced version of the SUV-100) operated by BSI at anintercomparison in 2003 agreed to within ±5% with meas-urements performed by the University of Hannover,Germany, and New Zealand’s National Institute of Waterand Atmospheric Research (NIWA) [Wuttke et al., 2006a].The NIWA instrument was largely identical to the UV9spectroradiometer discussed in this paper. Differences in theorder of ±5% may seem large but represent the typical level
JOURNAL OF GEOPHYSICAL RESEARCH, VOL. 113, D14310, doi:10.1029/2007JD009489, 2008ClickHere
for
FullArticle
1Biospherical Instruments Inc., San Diego, California, USA.2National Institute of Water and Atmospheric Research (NIWA),
Lauder, Central Otago, New Zealand.3National Institute of Water and Atmospheric Research, Kilbirnie,
Wellington, New Zealand.
Copyright 2008 by the American Geophysical Union.0148-0227/08/2007JD009489$09.00
D14310 1 of 13

of discrepancy between solar UV measurements performedby state-of-the-art spectroradiometers [Bais et al., 2001].[4] While these campaigns were of great value for assess-
ing the systems’ performance, there is no final proof thatresults can be applied to instruments permanently installedin Antarctica. Operating radiometers on this continentpresents unique challenges, such as low ambient temper-atures (also during calibrations), low humidity, small solarelevations, potentially large changes in collector tempera-ture, high wind speeds, large and highly variable surfacealbedo, snow accumulation, and 24 h of sunlight duringsummer. All these factors can affect data quality.[5] For directly assessing the quality of network instru-
ments operated in Antarctica, an intercomparison wasorganized between November 2006 and January 2007 atArrival Heights, Antarctica. The SUV-100 instrument that ispermanently installed at this location was compared with aspectroradiometer built and operated by NIWA. The NIWAinstrument is part of a larger network, is an establishedsystem of NDACC, and instruments of this type havesuccessfully participated in intercomparisons [Bais et al.,2001; Wuttke et al., 2006a]. An additional goal of thecampaign was to determine whether SUV-100 data meetthe standards of UV spectroradiometry established byNDACC. A positive outcome would encourage submissionof UVSIMN data to the NDACC database. In the future, weare also planning to assess geographical differences of UVradiation using data from both networks. Results of thecampaign will form a solid foundation for this work.
2. Location
[6] The intercomparison took place at Arrival Heights(77�4904600S, 166�3904500E, 183 m above sea level (a.s.l.))between 12 November 2006 and 12 January 2007. ArrivalHeights refers to a hill-top location and is situated approx-imately 3 km north of McMurdo Station, the largestresearch and logistics hub in Antarctica. New Zealand’sScott Base is approximately 4 km south–west of ArrivalHeights. The area of interest is located on the southern tip ofRoss Island and is surrounded by the Ross Sea to the northand the Ross Ice Shelf to the south. The active volcanoMount Erebus (3795 m a.s.l.) is 34 km north of the instru-ment. Most of Ross Island is covered by snow and ice year-round, however, an area with a radius of approximately 1–2 km around the intercomparison site was snow-free, anddark volcanic rocks were exposed. Weather conditionsranged from clear-sky to overcast, and temperatures variedbetween �25�C and +5�C in November and �15�C and+8�C in December and January.
3. Instrumentation
3.1. SUV-100 Spectroradiometer
[7] The instrument operated by BSI is a high-resolutionSUV-100 spectroradiometer, designed and built by BSI, andinstalled at Arrival Heights in March of 1988. Instrumentsof the same type are used at all sites of the NSF UVSIMN,with the exception of Summit, Greenland, where a SUV-150B has been installed. Instruments measure spectra ofglobal solar irradiance between 280 and 600 nm with aspectral resolution of approximately 1.0 nm at a rate of 4
spectra per hour. The instrument has a comparatively largecosine error of �8.5% at 60� and �19% at 75�. Additionalspecifications are provided in Table 1. The instrument iscalibrated every two weeks with 200-Watt standards ofspectral irradiance, which are traceable to the 1990source-based scale of the U.S. National Institute of Standardsand Technology (NIST) [Walker et al., 1987]. Measurementand calibration protocols during the intercomparison were thesame as implemented during normal operation. SUV-100spectroradiometers and their calibration have been describedin detail by Booth et al. [1994] and NSF Network OperationsReports [e.g.,Bernhard et al., 2006a].Measured spectra werecorrected for the cosine error of the instrument, alignedagainst the Fraunhofer structure of a reference solar spectrum(provided at sea level pressure), resampled to a uniformwavelength grid, and normalized to a uniform bandwidth of1 nm. (Normalized spectra appear as if they were measuredwith a spectroradiometer that has a triangular slit function of1.0 nm full width at half maximum (FWHM)). These dataprocessing steps have been described by Bernhard et al.[2004, 2006b], and resulting data are known as ‘‘Version 2NSF Network Data.’’ Additional information is provided atwww.biospherical.com/nsf/Version2/. The expanded stan-dard uncertainty of erythemal irradiance (CIE action spec-trum byMcKinlay and Diffey [1987]) and spectral irradianceat 400 nm varies between 4.2% and 6.8% (coverage factor 2,corresponding to a confidence level of 95.5% or 2s-level)[Bernhard et al., 2006b]. Expanded uncertainties at 600 nmare dominated by uncertainties of the cosine error correction,and can be as high as 16% for low-Sun, scattered-cloudconditions.
3.2. UV9 Spectroradiometer
[8] The instrument operated by NIWA is based on aBentham DTM300 double monochromator and has thedesignation UV9. In normal operation, global spectral irra-diance is measured between 285 and 450 nm in 0.2 nm stepswith a spectral resolution of approximately 0.6 nm and at 5�steps in solar zenith angle (SZA). For the purpose of theintercomparison, the measurement protocol was modified tomatch the sampling scheme of the SUV-100 (section 5). Thecosine error of the instrument is smaller than ±3% for SZAup to 70�. A detailed description of the instrument can befound at www.niwascience.co.nz/rc/fac/instruments/lauder/uvspec. Additional information is provided in Table 1 and inthe work by Wuttke et al. [2006a]. Similar instruments havebeen permanently installed at Lauder, New Zealand; MaunaLoa Observatory, Hawaii; Boulder, Colorado; Alice Springs,Australia; and Tokyo, Japan. They have also operated forextended periods in Melbourne and Darwin, Australia. Thisparticular instrument has operated in Lauder and Thule,Greenland.[9] Calibrations are traceable to NIST via 1000-Watt FEL
quartz-halogen lamps. Instrument stability is tracked withstabilized 45-Watt quartz-halogen lamps. Measurementswith these lamps were performed once per week duringthe campaign, both in a constant current mode of operationand in a feedback mode to provide a constant signal from aUV-A diode. The transfer of calibrations from 1000-Watt to45-Watt lamps includes an uncertainty of ±1%, which wasestimated from the repeatability of scans with the 45-Wattlamp.
D14310 BERNHARD ET AL.: COMPARISON OF UV SPECTRORADIOMETERS
2 of 13
D14310

[10] Standard analysis includes corrections for stray light,dark current, nonlinearities in the wavelength drive using aFraunhofer-line correlation algorithm [McKenzie et al.,1992], and departures from the ideal angular response.For the purpose of this campaign, spectra were normalizedto a bandwidth of 1 nm FWHM with the NSF Version 2algorithm [Bernhard et al., 2004], and resampled to matchthe wavelength grid of the SUV-100 instrument.[11] NIWA instruments meet the NDACC standards
[McKenzie et al., 1997; Wuttke et al., 2006a] and specifi-cations of type S-2 instruments as classified by the WorldMeteorological Organisation (WMO) [Seckmeyer et al.,2001]. Previous measurement intercomparisons [Bais etal., 2001] and comparisons with clear sky models [Badosaet al., 2007] give confidence that the absolute irradiancesmeasured by these systems are generally better than ±5%(±2s).
4. Model Calculations
[12] Measurements of the two instruments were alsocompared with calculations of the radiative transfer modelUVSPEC/libRadtran Version 1.01 [Mayer and Kylling,2005]. These calculations provide a semi-independent dataset for comparison, and also help correcting small differ-ences in the timing of the two instruments (section 5). Bothinstruments are scanning spectroradiometers requiring sev-eral minutes for the completion of a spectrum. Modelcalculations take the change of SZA during the recordingof a spectrum into account. Modeled spectra were con-volved with a triangular function of 1.0 nm FWHM forcomparison with the measurements.[13] Model inputs for the extraterrestrial spectrum, aero-
sol extinction, as well as profiles of air density, ozone andtemperature were identical to those used by Bernhard et al.[2006b]. The model’s pseudospherical disort radiative trans-fer solver with six streams was used. Surface pressure wasadopted from hourly measurements at Arrival Heights.
Effective surface albedo [Lenoble et al., 2004] was calcu-lated from spectra measured by the SUV-100 as describedby Bernhard et al. [2006b] by evaluating the relativeenhancement of irradiance at 330 nm compared to irradi-ance at 400 nm. Errors in the measurement that affect allwavelengths equally do not introduce an error in thecalculation of albedo. Nevertheless, when comparing mea-sured and modeled spectra, it has to be taken into accountthat model calculations are not completely independent ofthe measurements. Calculated effective albedo was 0.82 ±0.02 for the second half of November, 0.81 ± 0.02 forDecember, and 0.77 ± 0.03 for the first half of January.These value agree well with data from this site reportedearlier [Bernhard et al., 2006b]. Values are smaller thanalbedo of fresh snow [Wuttke et al., 2006b] due to snow-freeareas around the measurement site.[14] Total ozone column used for modeling was calculated
from SUV-100 spectra using the method described byBernhard et al. [2003]. The algorithm takes cloud attenu-ation into account. Three ozone values per day (at 01:00,04:00, and 22:00 UT) were typically determined. Retrievalswere intercompared with concurrent measurements of aDobson spectrophotometer located at Arrival Heights andobservations of the Ozone Monitoring Instrument (OMI)onboard the NASA EOS Aura spacecraft. SUV-100 datawere also compared with total ozone from UV9 data thatwere calculated using the method by Bernhard et al. [2003]as well as an adaptation of the algorithm described byStamnes et al. [1991]. The latter algorithm is normally usedby NIWA. Results of the comparison are shown in Figure 1.For the period of the campaign, the ratio of Dobson to SUV-100 total ozone was 0.976 ± 0.021 (±1s). This value isabout 1.5% smaller than historic measurements: for datacollected between 1989 and 2006, the ratio was 0.990 ±0.038. Preliminary analysis indicates that a step-change inDobson measurements after January 2004 is likely respon-sible for the difference. The ratio of OMI to SUV-100 was0.965 ± 0.032 for the period of the campaign. This value
Table 1. Comparison of Instrument Specifications
Specification SUV-100 UV9
Monochromator ISA DH-10UV; double monochromator; additive dispersion;focal length 100 mm; focal ratio f/3.5; equipped with sphericalholographic gratings with 1200 lines/mm
Bentham, DTM300; double monochromator;additive dispersion; focal length 300 mm;focal ratio f/4.2; equipped with plane holographicgratings with 3600 lines/mm
Operationalwavelength range
280–605 nm 285–450 nm
Operationalsampling step
0.2 nm between 280 and 345 nm; 0.5 nm between 335and 405 nm; 1.0 nm between 395 and 605 nma
0.2 nm integrations, with at least 5 samples per integration
Bandwidth(FWHM)
approximately 1.0 nm in UV; 0.8–0.95 nm in visible 0.52–0.58 nm in UV; 0.5 nm in visible
Entrance optics In-house designed diffuser made ofpolytetrafluoroethylene (PTFE)covering a trapezoidally shaped quartz support
In-house designed shaped diffuser made of PTFEb
Cosine error �8.5% at 60�, �14% at 70�, �19% at 75�,and �6% to isotropic illumination
±3% for incidence angles <70�; ±1% to isotropic illumination
Coupling Direct Quartz fiberDetector Photomultiplier R269 from Hamamatsu;
bialkali photocathode; thermoelectrically cooledPhotomultiplier R1527 from Hamamatsu
Dynamic range 6 orders of magnitude, achieved by adjustingPMT high-voltage; limited by digitization scheme
7.5 orders of magnitude, achieved with a 24 bit Delta Sigma Ato D. Constant PMT high-voltage
aFor overlapping intervals, data from the segment with the smaller wavelength step increment were used.bSee: http://www.niwascience.co.nz/rc/fac/instruments/lauder/ptfe.
D14310 BERNHARD ET AL.: COMPARISON OF UV SPECTRORADIOMETERS
3 of 13
D14310

compares well with the ratio of 0.969 ± 0.044 betweenEarth Probe TOMS and SUV-100 measurements from theperiod 1996–2004 reported by Bernhard et al. [2006b]. Thereason for the �3.5% bias between SUV-100 and space-based measurements at this site is currently unknown. Wenote that this bias is larger than typical differences betweenOMI and ground-based total ozone observations reported byBalis et al. [2007]. The bias (OMI lower) was particularlylarge on 18 November, 1 December, and 31 December2006. All 3 days were affected by clouds. Absorption bytropospheric ozone can be increased by clouds due to pathlength enhancement [Mayer et al., 1998]. Ground-basedmeasurements were likely biased high on these days due tothis effect. The ratio of UV9 to SUV-100 was 0.988 ± 0.012using the algorithm by Stamnes et al. [1991] and 0.995 ±0.005 using the method by Bernhard et al. [2003]. Thedifference is likely caused by the different ozone andtemperature profiles used by the two implementations.
5. Intercomparison Protocol and Data Analysis
[15] The intercomparison of the two instruments was‘‘blind;’’ no calibration or solar data were exchanged beforethe end of the campaign. Clear-sky spectra were selectedfrom the data set based on temporal variability of spectralirradiance at 600 nm using a similar method as described byBernhard et al. [2004]. Since the method does not dependon absolute irradiance, it is insensitive to potential calibra-tion errors or the cosine error of the instrument’s irradiancecollector.
5.1. Synchronization
[16] Measurements of the two instruments were synchro-nized between 285 and 340 nm. Synchronization at longerwavelengths was not possible due to the fact that the SUV-100 measures a spectrum in three different, overlappingsegments (Table 1). Different PMT high-voltage and wave-length increments are applied in each of the segments tooptimize signal-to-noise ratio and scan duration [Bernhardet al., 2006a]. Figure 2 shows the relationship betweentime and wavelength for the two instruments. From 340 nmto 450 nm, the UV9 spectroradiometer measured fasterthan the SUV-100. Because of this time difference, meas-urements in the visible by UV9 are expected to be smallerin the morning and larger in the afternoon thancorresponding measurements by the SUV-100. Comparisonof measured spectra confirmed this. To correct for thisartifact, we consider the ratio R(l, t) when comparing thetwo instruments:
R l; tð Þ ¼ MSUV l; tð Þ=C l; tð ÞMUV9 l; t*
� �=C l; t*
� � ;
where MSUV(l, t) is spectral irradiance measured by theSUV-100 at wavelength l and time t, MUV9(l, t*) is spectralirradiance measured by the UV9 at wavelength l and timet*, and C(l, t) and C(l, t*) are the corresponding modelirradiances at time t and t*. For wavelengths below 340 nm,t equals t* and R(l, t) defaults to MSUV(l, t)/MUV9(l, t).
5.2. Analysis of Wavelength Accuracy
[17] The wavelength accuracy of SUV-100 and UV9measurements was assessed with the Fraunhofer-line corre-lation algorithm of the NSF Version 2 data processing suite[Bernhard et al., 2004] and a similar algorithm that is partof the SHICrivm software package, available atwww.rivm.nl/shicrivm [Slaper et al., 1995]. The wave-length reference of both algorithms is based on the ‘‘KittPeak solar flux atlas’’ [Kurucz et al., 1984]. This spectrumwas measured with a high-resolution (approximately0.0001 nm) Fourier Transform Spectroradiometer and refersto mean sea surface pressure of 1013 hPa. Its wavelengthaccuracy was confirmed to be better than 0.001 nm bycomparing the position of its Fraunhofer-lines with thewavelengths of tabulated electronic transitions [Bernhardet al., 2004].[18] The two algorithms use different methods for cor-
recting small errors in the radiometric calibration of the KittPeak spectrum, which are most prominent between 320 and
Figure 1. Comparison of total ozone measured by SUV-100, UV9, Dobson, and OMI. UV spectra of the UV9 wereprocessed with the methods by Stamnes et al. [1991] andBernhard et al. [2003]. (a) Time series of total ozone data.(b) Ratio of total ozone measurements relative to SUV-100data.
Figure 2. Relationship between time and wavelength forthe SUV-100 and UV9 instruments.
D14310 BERNHARD ET AL.: COMPARISON OF UV SPECTRORADIOMETERS
4 of 13
D14310

330 nm. The correction for the Version 2 algorithm (here-inafter referred to as V2 method) is based on the extrater-restrial spectrum proposed by Gueymard [2004]. Theresulting reference spectrum is identical with the spectrum‘‘EGueymard(l)’’ introduced by Bernhard et al. [2004]. Thereference spectrum of the SHICrivm method has beendescribed by Slaper and Koskela [1997].[19] Besides distinctions in the reference spectra, the two
correlation methods differ also in several other ways: the V2method allows for adjustment of the spectroradiometer’s slitfunction as a function of wavelength. This feature is ofvalue for the SUV-100, whose bandwidth changes from1.05 nm FWHM at 300 nm to 0.80 nm at 600 nm. Incontrast, the bandwidth of the SHICrivm algorithm is fixedfor all wavelengths. When using SHICrivm, we chosetriangular slit functions with 1.0 and 0.6 nm FWHM forthe SUV-100 and UV9 instrument, respectively. The corre-lation interval can be specified in both methods. Forprocessing data of the UV9 instrument with the V2 method,the interval was set to ±3 nm at all wavelengths. For the
SUV-100, it was set to ±3 nm in the UV and ±15 nm in thevisible. The larger interval in the visible is necessary sinceSUV-100 data are not oversampled between 404 and 600nm (Table 1). For SHICrivm processing, the interval was setto the default setting of ±8 nm at all wavelengths for bothinstruments. This resolution was chosen because prelimi-nary runs with a finer resolution led to sporadic spikes in theresults.
6. Results
6.1. Wavelength Accuracy
[20] Figure 3 shows the wavelength accuracy of data fromthe SUV-100 and UV9 instruments as determined with theV2 and SHICrivm programs. Additional statistics are pro-vided in Table 2. The average shift for the SUV-100 data setis smaller than ±0.003 nm for both algorithms (Figure 3a).This good agreement was expected as the V2 method wasused for the preparation of SUV-100 data. The standarddeviation of the shifts (illustrated by errors bars in Figure3a), is about 0.025 nm, indicating some variations in thewavelength calibration during the period of the campaign.[21] The wavelength alignment of data from the UV9
instrument was based on the ATLAS-3 solar spectrum [vanHoosier, 1996] as implemented by the TUV radiativetransfer model [Madronich and Flocke, 1998]. However, asubsequent wavelength shift of 0.04 nm had also beenapplied so that the shift matched that from an earliersoftware version for data processing, which had been basedon a filtered version of the Lowtran spectrum [Kneizys etal., 1983]. Analysis of UV9 spectra with the V2 andSHICrivm programs revealed a systematic wavelength shiftof 0.04 nm (Figure 3b). This suggests that the absolutewavelength scale of ATLAS-3 scale was more correct. Wefurther discovered that there is a 0.04 nm error in theLowtran spectrum in the region of the Ca Fraunhoferdoublet near 390 nm, which has a strong influence on thewavelength alignment for the NIWA instruments.[22] To ensure compatibility with the model calculations,
UV9 data was reprocessed by NIWA using theEGueymard(l) reference spectrum, which had also beenimplemented for SUV-100 data. Analysis of the reproc-essed version indicates that the wavelength bias of 0.04 nmwas successfully removed; the residual shift is 0.005 nmon average (Figure 3c). The change in wavelength alignmentalso reduced the measurement bias between the two systemsin the UV-B. For example, erythemal irradiance calculatedfrom the reprocessed data set is 0.5% smaller and in betteragreement with SUV-100 data. In the UV-A, the effect maybe neglected. For the remainder of this paper, the discussion
Figure 3. Wavelength accuracy of data from the SUV-100and UV9 instruments determined with the Version 2 andSHICrivm methods. Symbols indicate average shiftscalculated from all spectra measured during the campaign.Error bars indicate the standard deviation of shifts. (a) SUV-100. (b) Original data of UV9. (c) Reprocessed data ofUV9.
Table 2. Statistics of Wavelength Shift
Data set MethodAverageBiasa , nm
Average Variabilityb,nm
SUV-100 Version 2 �0.001 0.023SUV-100 SHICrivm 0.003 0.029UV9, original Version 2 0.040 0.003UV9, original SHICrivm 0.043 0.002UV9, reprocessed Version 2 0.001 0.003UV9, reprocessed SHICrivm �0.005 0.002
aAverage wavelength shift of all data points of Figure 2.bAverage standard deviation for all data points of Figure 2.
D14310 BERNHARD ET AL.: COMPARISON OF UV SPECTRORADIOMETERS
5 of 13
D14310
of NIWA data will focus on this reprocessed data set. Thewavelength shift variability of UV9 data is about ±0.0025 nm(±1s). This exceptionally low value is a factor of 10 smallerthan the uncertainty of the SUV-100 data set.[23] Data from both spectroradiometers indicate that
wavelength shifts of the V2 and SHICrivm algorithms areon average consistent at the 0.003–0.006 nm level (Table 2).Some discrepancies of the two algorithms can be explainedby the different correlation intervals used. For example,wavelength shifts calculated for the UV9 instrument withthe V2 method reveal oscillations on a 10 nm scale. Thesefluctuations are not apparent in the SHICrivm data setpresumably due to its coarser resolution. When using theV2 method for analyzing spectra of the SUV-150B spec-troradiometer installed at Summit (which has a similar
bandwidth as the UV9), we did not observe oscillationssimilar to those shown in Figures 3b and 3c [Bernhard etal., 2006a]. At this stage, we do not know whether theseoscillations are real or an artifact of the V2 program whenapplied to UV9 spectra.
6.2. Comparison of Spectral Irradiance
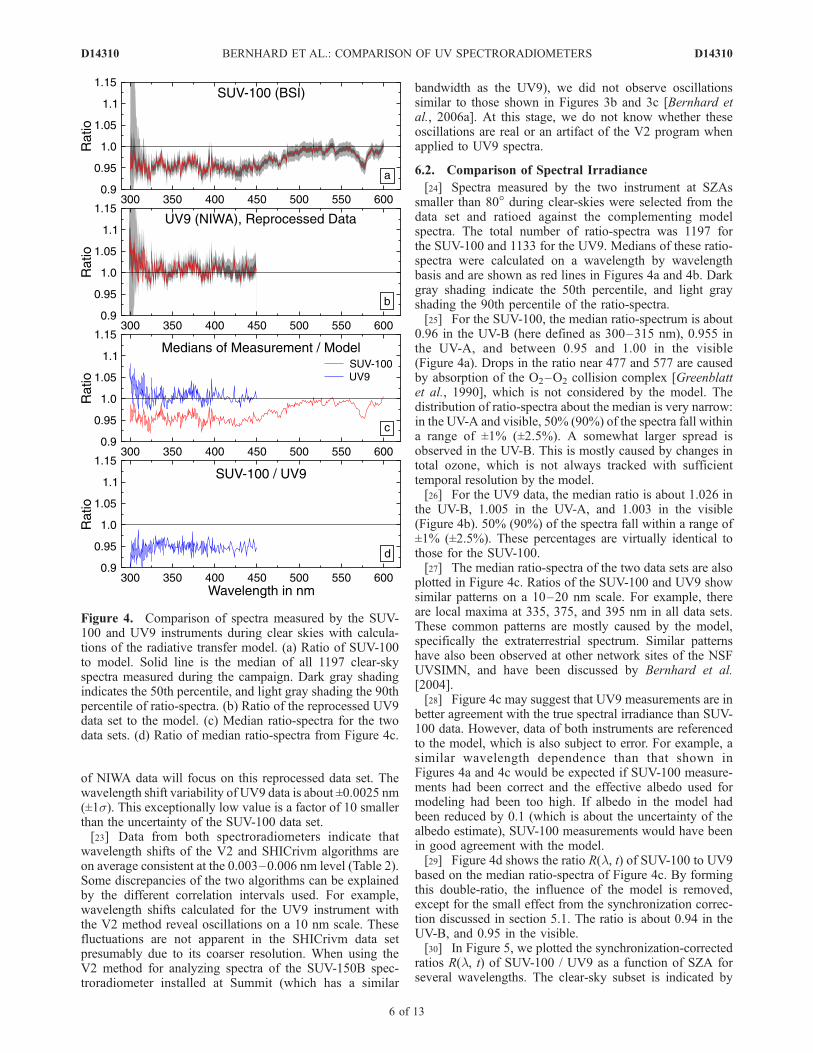
[24] Spectra measured by the two instrument at SZAssmaller than 80� during clear-skies were selected from thedata set and ratioed against the complementing modelspectra. The total number of ratio-spectra was 1197 forthe SUV-100 and 1133 for the UV9. Medians of these ratio-spectra were calculated on a wavelength by wavelengthbasis and are shown as red lines in Figures 4a and 4b. Darkgray shading indicate the 50th percentile, and light grayshading the 90th percentile of the ratio-spectra.[25] For the SUV-100, the median ratio-spectrum is about
0.96 in the UV-B (here defined as 300–315 nm), 0.955 inthe UV-A, and between 0.95 and 1.00 in the visible(Figure 4a). Drops in the ratio near 477 and 577 are causedby absorption of the O2–O2 collision complex [Greenblattet al., 1990], which is not considered by the model. Thedistribution of ratio-spectra about the median is very narrow:in the UV-A and visible, 50% (90%) of the spectra fall withina range of ±1% (±2.5%). A somewhat larger spread isobserved in the UV-B. This is mostly caused by changes intotal ozone, which is not always tracked with sufficienttemporal resolution by the model.[26] For the UV9 data, the median ratio is about 1.026 in
the UV-B, 1.005 in the UV-A, and 1.003 in the visible(Figure 4b). 50% (90%) of the spectra fall within a range of±1% (±2.5%). These percentages are virtually identical tothose for the SUV-100.[27] The median ratio-spectra of the two data sets are also
plotted in Figure 4c. Ratios of the SUV-100 and UV9 showsimilar patterns on a 10–20 nm scale. For example, thereare local maxima at 335, 375, and 395 nm in all data sets.These common patterns are mostly caused by the model,specifically the extraterrestrial spectrum. Similar patternshave also been observed at other network sites of the NSFUVSIMN, and have been discussed by Bernhard et al.[2004].[28] Figure 4c may suggest that UV9 measurements are in
better agreement with the true spectral irradiance than SUV-100 data. However, data of both instruments are referencedto the model, which is also subject to error. For example, asimilar wavelength dependence than that shown inFigures 4a and 4c would be expected if SUV-100 measure-ments had been correct and the effective albedo used formodeling had been too high. If albedo in the model hadbeen reduced by 0.1 (which is about the uncertainty of thealbedo estimate), SUV-100 measurements would have beenin good agreement with the model.[29] Figure 4d shows the ratio R(l, t) of SUV-100 to UV9
based on the median ratio-spectra of Figure 4c. By formingthis double-ratio, the influence of the model is removed,except for the small effect from the synchronization correc-tion discussed in section 5.1. The ratio is about 0.94 in theUV-B, and 0.95 in the visible.[30] In Figure 5, we plotted the synchronization-corrected
ratios R(l, t) of SUV-100 / UV9 as a function of SZA forseveral wavelengths. The clear-sky subset is indicated by
Figure 4. Comparison of spectra measured by the SUV-100 and UV9 instruments during clear skies with calcula-tions of the radiative transfer model. (a) Ratio of SUV-100to model. Solid line is the median of all 1197 clear-skyspectra measured during the campaign. Dark gray shadingindicates the 50th percentile, and light gray shading the 90thpercentile of ratio-spectra. (b) Ratio of the reprocessed UV9data set to the model. (c) Median ratio-spectra for the twodata sets. (d) Ratio of median ratio-spectra from Figure 4c.
D14310 BERNHARD ET AL.: COMPARISON OF UV SPECTRORADIOMETERS
6 of 13
D14310

black dots; data collected during partly cloudy or overcastconditions are marked with gray dots. When the SZA islarger than 75�, spectral irradiance at 300 nm is typicallybelow the detection limit of the SUV-100, limiting the SZA-range of Figure 5a. For wavelengths below 340 nm, theSZA-dependence is virtually identical for clear and cloudysituations (Figures 5a–5d). With the exception of a fewoutliers (which can be explained by collector contaminationdue to snow or shading by the operator), ratios are verycompact and typically fall within a range of ±2.5%. Thesmall number of outliers is attributable to the good (±5 s)synchronization of the two instruments in this wavelengthrange. Close inspection of Figures 5a–5d reveals steps onthe order of 0.5%–1.5% at SZAs of 65�, 75�, and 80�.These steps coincide with the change of high-voltageapplied to the PMT of the SUV-100 instrument and indicatesome nonlinearity in SUV-100 measurements.[31] At 400 and 440 nm (Figures 5e and 5f), scatter
remains small for the clear-sky subset due to the synchro-nization correction. However, this correction only reducesthe effect of differences in SZA, but cannot correct forchanges in irradiance due to moving clouds. The scatter at400 and 440 nm for the cloudy-sky subset is therefore muchlarger than for the smaller wavelengths. Despite the differ-ence in scatter, the average biases of the clear-sky andcloudy-sky subsets are similar: at 440 nm and SZAs lessthan 60�, R(l, t) is 0.95 on average for both subsets. For60� < SZA < 70�, R(l, t) is 0.95 for the clear-sky and 0.96for the cloudy-sky data; for 70� < SZA < 80�, R(l, t) is0.94 for the clear-skies and 0.96 for cloudy-skies. Thedifferences between the two subsets are within the uncer-tainties of the V2 cosine error correction [Bernhard et al.,2006b], indicating that the algorithm is treating both skyconditions appropriately.[32] In Figure 6, R(l, t)-ratios at 440 nm are plotted as a
function of solar azimuth angle to examine whether the biasbetween SUV-100 and UV9 measurements is different inthe morning and afternoon. In the morning, the Sun movesfrom an azimuth angle of 180� to 0�; in the afternoon, itmoves from 360� to 180�. This figure indicates that there isvery little difference between morning and afternoon.[33] Measured spectra were also weighted with the
action spectra for erythema [McKinlay and Diffey,1987], DNA-damage [Setlow, 1974], generalized plantresponse [Caldwell, 1971], and Vitamin D production[Bouillon et al., 2006]. Ratios of SUV-100 to UV9 arevirtually identical to those for spectral irradiance at310 nm, plotted in Figure 5b. For SZAs smaller than80�, the average ratio of SUV-100 and UV9 is between0.948 and 0.955 for all four data products.[34] In Figure 7, various quantities measured between
6 December and 12 December 2006 are plotted versus timeto investigate the effect of clouds on UV and ozonemeasurements in more detail. The period is divided intofour subperiods with different cloud conditions, labeled A,B, C, and D on top of Figure 7. Period A is the clear-skycase. For the UV9, the ratio of measured and modeledspectral irradiance at 440 nm (Figure 7d) is close to 1, butexhibits two small (<4%) bumps at either side of measure-ments with the largest SZA, which are indicative of anincomplete correction of the instrument’s cosine error.Measurements of the SUV-100 show somewhat less vari-
Figure 5. Synchronization-corrected ratios of SUV-100to UV9 as a function of SZA for several wavelengths.Black (gray) dots indicate clear sky (cloudy sky) conditions.(a) 300 nm, (b) 310 nm, (c) 320 nm, (d) 340 nm, (e) 400 nm,and (f) 440 nm.
D14310 BERNHARD ET AL.: COMPARISON OF UV SPECTRORADIOMETERS
7 of 13
D14310

ability but are biased low against the model by 4–7%.Ozone measurements of the UV9 are based on the methodby Stamnes et al. [1991] and show a larger dependence onSZA for SZA > �70� than SUV-100 data, presumably dueto the consideration of the actual ozone profile in themethod by Bernhard et al. [2003] used for the SUV-100data set (Figure 7f). In Period B, thin and variable cloudswere prevailing. R(l, t)-ratios at 310 and 440 nm increaseby about 7% from the start to the center of the period anddecrease by the same amount thereafter (Figure 7e). Thispattern does not correlate with cloud cover and the mostlikely reason is snow covering the UV9 collector, which isnot heated. Persistent cloud cover with an optical depth ofapproximately 35 (Figure 7c) was observed in Period C.The ratio of measurement and model dropped to 0.5 for bothinstruments. R(l, t)-ratios for Periods A and C are veryconsistent, confirming that the cosine error correction of theSUV-100 works well for clear and cloudy conditions.Ozone measurements of both instruments do not changeat the end of Period C when cloud optical depth decreasedto zero, indicating that the effect of clouds on ozoneretrievals is small. Period D is again a period of variablecloudiness when noon-time measurements are reduced byabout 20%. R(l, t)-ratios at 440 nm (but not 310 nm)exhibit considerably scatter. Unlike the earlier periods, thescatter seems to be larger for SUV-100 than UV9 data, butthe average bias is similar to that of Period A.
6.3. Detection Limit
[35] The V2 and SHICrivm programs both include rou-tines to determine the minimum wavelength from whichonward spectra can be trusted. The routines first calculatethe ratio of measurement and model as a function ofwavelength. The minimum wavelength is defined as thewavelength for which ratios of five consecutive wavelengthpairs deviate by less than 25% from each other. The spectralirradiance associated with the minimum wavelength definesthe detection limit. Note that this definition of the detectionlimit is different from that in the NDACC specifications[McKenzie et al., 1997] discussed further below.[36] Figure 8 shows the minimum wavelength and the
associated spectral irradiance for both instruments as afunction of time. For the SUV-100, the minimum wave-length varies between 293 and 302 nm. It is largest duringsolar noon (approximately 01:00 UT), when the SZA issmallest, and smallest at 13:00 UT when the SZA is largest.
Additional variation is introduced by the total ozone col-umn. On 1 December 2006, when total ozone was 185 DU,the minimum wavelength at noon was 293 nm. On5 December 2006, when total ozone was 328 DU, itincreased to 301.5 nm. The minimum wavelength for theUV9 has a similar pattern, but is shifted downward by about2.5 nm and covers the range 290–299.5 nm. Figure 8 alsoshows several data points below 290 nm, which are artifacts.[37] For the SUV-100, the spectral irradiance associated
with the minimum wavelength is between 0.001 mW/(cm2
nm) for large SZA and 0.01 mW/(cm2 nm) for small SZA.Figure 6. Synchronization-corrected ratios of SUV-100 toUV9 as a function of solar azimuth angle at 440 nm. Black(gray) dots indicate clear sky (cloudy sky) conditions.
Figure 7. Time series of various quantities measuredbetween 6-December and 12-December 2006. Four periodsare emphasized by gray-shading and labeled A, B, C, and D.(a) Spectral irradiance at 310 and 340 nm measured bySUV-100. (b) Solar zenith angle, (c) cloud optical depth(COD), determined from SUV-100 measurements at 450 nmbased on the method by Bernhard et al. [2004]. (d) Ratio ofmeasurement to model at 440 nm. (e) R(l, t)-ratios (SUV-100 / UV9) at 310 and 440 nm. (f) Total ozone measured bySUV-100, UV9, OMI, and Dobson.
D14310 BERNHARD ET AL.: COMPARISON OF UV SPECTRORADIOMETERS
8 of 13
D14310

At large SZA, a large high-voltage is applied to the PMT,leading to a better detection limit. The high-voltage isreduced at small SZAs to avoid saturation of the PMT.The trade off is a reduced detection limit when the Sun ishigh. On average, the detection limit is 0.0066 mW/(cm2
nm) for SZA < 65�, 0.0035 mW/(cm2 nm) for 65� < SZA <75�, and 0.0022 mW/(cm2 nm) for SZA > 75�.[38] The detection limit of the UV9, does not depend on
SZA and varies between 0.0001 and 0.001 mW/(cm2 nm).The average value is 0.00033 mW/(cm2 nm). This is aboutone order of magnitude below the detection limit of theSUV-100.[39] All spectra were also scrutinized for spikes, and other
spectral anomalies using the V2 routines. Four spectra ofthe UV9 were found to be distorted, likely due to shadingof the collector by personnel. SUV-100 spectra were free ofconspicuous features.
7. Discussion
[40] The standard deviation of wavelength shifts of theSUV-100 spectroradiometer was 0.025 nm (Figure 3a). Thisvalue is about a factor of 1.8 larger than the standarddeviation for January to March 2006. From 16 September2006 onward, the wavelength mapping of the system’smonochromator started to oscillate with a periodicity ofabout one month and this led to the increased wavelengthuncertainty (NSF Polar Programs UV SpectroradiometerNetwork 2006–2007 Operations Report Volume 16.0, inpreparation, available at www.biospherical.com/NSF). Asimilar oscillation has not been observed with any of theSUV-100 instruments before. The root cause of the problemis still unknown, but inspection of the monochromator inJanuary 2007 pointed to excess friction in one of themonochromator’s bearings. These variations can in theory
be corrected by applying a large number of correctionfunctions, but this approach is impractical for operationaldata processing. Six correction functions were applied forthe period of the campaign when final SUV-100 data wereprepared. This number decreased the wavelength uncertain-ty from initially ±0.05 nm (±1s) to ±0.025 nm. A wave-length uncertainty of ±0.025 nm translates into anuncertainty in measuring erythemal irradiance of about±0.5% [Bernhard and Seckmeyer, 1999].[41] Analysis of UV9 spectra revealed a systematic
wavelength shift of 0.04 nm (Figure 3b), which translatesinto an overestimate of erythemal irradiance of about 0.5%.This shift was not present in archived NIWA data prior to2004, but affects NIWA data that have been archived forthe periods between January 2004 and December 2005,when a different solar reference spectrum was in use. As aresult of this study, NIWA data from all sites will bereprocessed and resubmitted to NDACC.[42] Results of the intercomparison have shown that
measurements of the SUV-100 were on average 5–7%lower than UV9 data. This deviation is within the expecteduncertainty of high quality spectroradiometers [Bernhardand Seckmeyer, 1999; Bais et al., 2001]. Possible reasonsfor this difference are discussed below and summarized inTable 3.[43] The calibration scale for the SUV-100 refers to the
source-based scale NIST scale from 1990 (NIST1990)[Walker et al., 1987]. UV9 data refer to the newer detec-tor-based NIST scale from 2002 [Yoon et al., 2002].Irradiance values assigned to calibration standards usingthe new scale are 1.1–1.5% larger than values based on theNIST1990 scale. The difference in the primary irradiancescale explains about 1.3% of the difference between SUV-100 and UV9 measurements.[44] The UV9 is equipped with a dome-shaped diffuser of
4.5 mm height. By adapting calculations performed forsimilar diffusers [Bernhard and Seckmeyer, 1997; Hovilaet al., 2005], we estimated that the reference plane forirradiance calibrations could be about 2 mm behind thediffuser’s top. Recent experimental evidence conflicts withtheoretical calculations, indicating that the offset for shapeddiffusers may exceed the height of the diffuser [Manninen etal., 2006; Grobner and Blumthaler, 2007]. Preliminary testswith the UV9 diffuser have indicated that its reference planecould be as much as 5 mm behind the diffuser’s top. Thecalibrations of solar data of the UV9 were performed withstandard lamps mounted at 500 mm distance measured from
Figure 8. (a) Start wavelength from which onward spectracan be trusted. SUV-100 (UV9) measurements are high-lighted by black (gray) lines. (b) Spectral irradiance at startwavelength.
Table 3. Breakdown of Differences SUV-100 - UV9
Component Differencea
Irradiance scale NSF–NIWA 1.3 ± 0.3%Diffuser geometry UV9 1.4 ± 0.6%Drift of SUV-100 calibration standards 1.0 ± 1.0%Diffuser temperature dependence UV9 0 ± 1.4%PMT high-voltage dependence SUV-100b 1.5 ± 1.0%Sumc 5.2 ± 2.1%
aDifferences are given as a range, representing maximum explainabledeviations. Systematic parts of all components go in the same direction andincrease the difference between SUV-100 and UV9.
bDifference is largest at small SZA.cThe range of ±2.1% was calculated by the root of sum of squares of the
individual components.
D14310 BERNHARD ET AL.: COMPARISON OF UV SPECTRORADIOMETERS
9 of 13
D14310

the top of the diffuser. Theoretical and experimental evi-dence suggests that the diffuser may have been between 2and 5 mm too far away from the lamp during calibrations.This would lead to an overestimate of solar measurementsby 0.8–2.0%.[45] The diffuser of the SUV-100 diffuser is effectively a
flat membrane of PFTE with a thickness of 0.5 mm. Thedistance is measured from its front surface. The uncertaintyin solar irradiance due to the diffuser thickness and shape istherefore less than 0.2%.[46] The on-site calibrations standard of the SUV-100
spectroradiometer consist of three 200-W tungsten halogenlamps with calibrations provided by Optronic Laboratoriesand BSI (NSF Polar Programs UV Spectroradiometer Net-work 2006–2007 Operations Report Volume 16.0, in prep-aration, available at www.biospherical.com/NSF). Two ofthe three lamps were unstable at the 2–3% level during2006. This was determined by a filtered, temperature-stabilized photodiode that is internal to the SUV-100. Thethird lamp was stable. The three lamps were also comparedwith traveling standard lamps in January 2006 and January2007. In May 2007, these traveling standards were in turncompared with two 200-Watt long-term standard lampsmaintained at BSI, as well as four 1000-W FEL lamps withcalibrations from NOAA’s Central UV Calibration Facility(CUCF). Reanalysis of all available calibration informationled to the conclusion that the calibration applied to SUV-100 solar data of the campaign was low by 1.0 ± 1.0%.[47] The transmission of the UV9’s Polytetrafluorethy-
lene (PTFE) diffuser changes with temperature [McKenzieet al., 2005]. At 10�C (0�C) it is about 2.2% (1.5%) lowerthan at 20�C. Ylianttila and Schreder [2005] have reported asimilar temperature dependence for Schreder J1002 PTFEdiffusers. Their work also included a measurement at �5�C,indicating that diffuser transmissions at �5�C and 20�C aresimilar. Campaign data of the UV9 were corrected upwardsby up to 2%, depending on the logged air temperature.Although the diffuser temperature was also recorded, itsometimes exceeded the air temperature by more than5�C, which is an unrealistically large difference (Figure 9)and may be caused by absorption of radiation by thesensor’s black coating. On the basis of previous studieswith an IR thermometer at Lauder, it was found that forsmall solar zenith angles and with clear skies, these dif-
fusers can only be up to 2�C warmer than ambient airtemperature. A simple algorithm was used to predict thediffuser temperature as a function of air temperature, UVtransmission, and solar zenith angle. For conditions duringthis campaign, the deduced diffuser temperature closelymatches the air temperature, with a positive bias of up to1�C around noon. Calibrations were performed at an instru-ment temperature of about 29�C (Figure 9). Corrections forthe temperature dependence are typically in the range 0 to2% (Figure 9). The uncertainty of the correction is about±1% (±2s) and mostly due to the fact that the temperaturecoefficient has not been measured at temperatures below�5�C.[48] The temperature coefficient of the SUV-100 diffuser
is currently unknown. Since it is also made from PTFE, itstemperature dependence may resemble that of the UV9, butthe absolute value may be different due to its substantiallysmaller thickness. No temperature corrections were appliedto SUV-100 data because both solar measurements andcalibrations were carried out at ambient temperature. Var-iations in air temperatures between the biweekly calibra-tions result in an uncertainty of ±1%. This value wasestimated based on typical variations in temperature be-tween calibrations (Figure 9) and the temperature coefficientof PTFE reported by McKenzie et al. [2005] and Ylianttilaand Schreder [2005].[49] The dependence of SUV-100 measurements on the
high-voltage applied to the PMT discussed earlier canexplain 1.5 ± 1.0% of the difference of SUV-100 andUV9 measurements. The reason of this nonlinearity is stillnot understood.[50] The five factors listed above can explain 5.2 ± 2.1%
of the difference between the two instruments. This numberagrees well with the difference that was actually observed.[51] Figure 4a shows statistics on the ratio of measured
and modeled SUV-100 clear-sky spectra for the period ofthe campaign. Similar ratio-spectra have been presented byBernhard et al. [2006b] for the years 1990–2004 forevaluating the consistency of SUV-100 measurements overthe history of instrument operation at Arrival Heights. Bycomparing ratio-spectra from 2006 with this earlier analysiswe are trying in the following to assess whether SUV-100measurements from the intercomparison period are repre-sentative for measurements of the last 16 years. For thisanalysis, ratios at several wavelengths were extracted from the
Figure 9. Time series of temperatures (instrument,diffuser and ambient air) logged by UV9. The black lineshows the temperature correction factor that was applied toUV9 data. Crosses (stars) indicate times when UV9 (SUV-100) calibrations were performed.
Figure 10. Ratio of SUV-100 measurements and modelcalculations of the years 1990–2006. The data set is basedon median ratios for December.
D14310 BERNHARD ET AL.: COMPARISON OF UV SPECTRORADIOMETERS
10 of 13
D14310

previously calculated median-ratio-spectra for December andare shown in Figure 10. Ratios at all wavelengths rangefrom 0.94 to 1.06. For wavelengths in the UV-A, valuesfrom the years 1990–1999 tend to be larger by about 3.5%than values from the years 2000–2006. This step-change islikely caused by a change of the instrument’s cosine error inFebruary 2000, resulting from a modification of the irradi-ance collector [Bernhard et al., 2006b]. Data indicate thatthe cosine error correction that is part of V2 processing hasnot completely removed the effect of collector change.Ratios for the intercomparison period are at the low endof the range: in the UV-A, ratios for December 2006 wereon average 1.6% smaller than ratios of the years 2000–2005and 5% smaller than ratios of the years 1990–1999.These differences should be considered when estimatingtrends in UV.[52] Some of the variation shown in Figure 10 may have
been caused by the model. For example, effective albedoused for modeling was calculated from the measuredspectra, and potential errors in determining albedo mayhave changed over time. This shows that model calculationshave limitations for quality control. However, in the absenceof other supporting data, models present the only viable toolfor assessing the consistency of measurements over time.[53] A key objective of the campaign was to determine
whether SUV-100 data from Arrival Heights and other sitesof the UVSIMN adhere to the standards established byNDACC [McKenzie et al., 1997]. UV data submitted to theNDACC databases have to meet certain specifications andmust have successfully participated in an intercomparisonwith an already certified instrument. Our analysis showsthat SUV-100 instruments meet the NDACC specificationsfor UV spectroradiometer with the following three excep-tions: (1) NDACC calls for cosine errors of smaller than±5% for zenith angles smaller than 60�; the cosine error ofthe SUV-100 at 60� is �8.5% (Table 1). The ratio of SUV-100 to UV9 showed very little dependence on SZA, both forclear-sky and cloudy conditions (Figure 5). This demon-strates that V2 processing corrects the effect of the cosineerror with adequate accuracy for the conditions observedduring the campaign, which are typical for high-latitudeNSF network sites (e.g., no cumulus clouds). The increasedcosine error of the system is considered acceptablesince NDACC specifications refer to the quality of submit-ted data rather than the characteristics of instrumentation.(2) NDACC calls for a wavelength alignment precision of<±0.03 nm and accuracy of <±0.05 nm (±2s). The wave-length variability of SUV-100 data is on average ±0.05 nmat the 2s-level (Figure 3a). This has less impact in polarregions where long-term changes in UV radiation areexpected to be larger than at midlatitudes. Long-term driftsof the wavelength scale are effectively eliminated by the V2wavelength correction. (3) NDACC calls for a detectionthreshold of smaller than 1 mWm�2 nm�1 for a signal-to-noise ratio of 1. This low value was chosen for detectingsmall changes in UV-B irradiance in response to changes intotal ozone. The detection threshold of the SUV-100 calcu-lated with this definition is 7 mWm�2 nm�1. AlthoughSUV-100 spectroradiometers do not meet all specificationsestablished by the NDACC, the intercomparison has dem-onstrated that data of the UVSIMN are of acceptable qualityand inclusion in the NDACC database should therefore be
justified as long as data limitations are documented incomplementing metafiles.
8. Conclusions
[54] Measurements of global spectral irradiance from aSUV-100 spectroradiometer permanently installed at ArrivalHeights were compared with those of NIWA’s UV9 instru-ment. Measurements by the SUV-100 were on averagelower by 5–7% than data of the UV9. This level ofdiscrepancy compares well with results from earlier inter-comparisons of NSF and NIWA instruments [Seckmeyer etal., 1995; Wuttke et al., 2006a], as well as outcomes of otherintercomparisons of state-of-the-art UV spectroradiometers[Bais et al., 2001]. The difference of measurements of thetwo instruments was very constant over time and showedlittle dependence on wavelength, SZA, and sky condition.This confirms that the V2 method is able to correct thecomparatively large cosine error of the SUV-100 instrumentwith little uncertainty. The discrepancy of the two data setshas been quantitatively explained by different irradiancescales used by NSF and NIWA (difference of 1.3 ± 0.3%);uncertainties in determining the reference plane of the UV9diffuser (1.4 ± 0.6%); drifts of SUV-100 calibration stand-ards (1.0 ± 1.0%); uncertainty due to the temperature-dependent transmission of diffusers (0 ± 1.4%); and non-linearity of the SUV-100 (1.5 ± 1.0%). The analysis alsorevealed a systematic wavelength offset of 0.04 nm in theUV9 data, which will be corrected as a result of this work.Many of the factors affecting data quality would have beendifficult to detect without a second instrument. This high-lights the value of the intercomparison.[55] Measurements were also compared with results of a
radiative transfer model. UV9 measurements are in betteragreement with the calculations, but uncertainties in effec-tive albedo limit the ability of the model in determining theradiometric accuracy of measurements. Wavelength shifts inmeasured spectra calculated with the V2 and SHICrivmmethods were consistent to the 0.005 nm level. Bothmethods uncovered a wavelength bias in the UV9 dataset, which was subsequently reprocessed. The bias of therevised data set was smaller than 0.005 nm on average, andstable to within ±0.0025 nm over the course of the cam-paign. The wavelength registration of the SUV-100 fluctu-ated on the ±0.025 nm level, partly due to excess frictionaffecting its monochromator during the period of the inter-comparison. The SUV-100 does not meet all specificationsfor UV spectroradiometry established by the NDACC,specifically those for the cosine error, short-term wave-length stability, and detection limit. However, results of thecampaign have shown that the V2 method can accuratelycorrect the shortcomings of the instrument. It is thereforejustified to contribute SUV-100 data to the NDACC data-bases. Results of the comparison will be useful when datafrom other sites of the NSF UVSIMN and NIWA networksare combined for investigating geographical differences inultraviolet irradiance. Such a study is planned for the nearfuture.
[56] Acknowledgments. Measurements of the SUV-100 spectroradi-ometer at Arrival Heights were supported by the National Science Founda-tion’s Office of Polar Programs via a subcontract to BiosphericalInstruments Inc. from Raytheon Polar Services Company (RPSC). We
D14310 BERNHARD ET AL.: COMPARISON OF UV SPECTRORADIOMETERS
11 of 13
D14310

particularly wish to express our gratitude to Steve Dobbs and JasonBryenton from RPSC, who operated the SUV-100 instrument during thiscampaign. Further thanks go to Vi Quang from BSI for assisting in dataprocessing. We thank Harry Slaper from the National Institute for PublicHealth and the Environment of The Netherlands for making the SHICrivmprogram available. Ozone sonde measurements used for modeling wereprovided by Terry Deshler from the University of Wyoming. OMI overpassdata were retrieved from the Aura Validation Data Center at http://avdc.gsfc.nasa.gov/phpgdv2/avdc_tablefile.php?id=28. Atmospheric pres-sure data were made available by Matthew Lazzara, University of Wiscon-sin-Madison, and downloaded from ftp://amrc.ssec.wisc.edu/pub/mcmurdo/arrivalheights/. We also acknowledge the support of Antarctica NZ fortransporting and staging the NIWA instrument, and the UV9 operatorsPenny Clendon and Nathan Cross. We thank Gunther Seckmeyer from theUniversity of Hannover, Germany, for valuable comments to the manuscriptand fruitful discussions regarding the NDACC requirements.
ReferencesBadosa, J., R. L. McKenzie, P. V. Johnston, M. Kotkamp, M. O’Neill, andD. J. Anderson (2007), Towards closure between measured and modelledUV under clear skies at four diverse sites, Atmos. Chem. Phys., 7, 2817–2837. Available at www.atmos-chem-phys.net/7/2817/2007/
Bais, A. F., et al. (2001), SUSPEN intercomparison of ultraviolet spectro-radiometers, J. Geophys. Res., 106(D12), 12,509–12,526.
Balis, D., M. Kroon, M. E. Koukouli, E. J. Brinksma, G. Labow, J. P.Veefkind, and R. D. McPeters (2007), Validation of Ozone MonitoringInstrument total ozone column measurements using Brewer and Dobsonspectrophotometer ground-based observations, J. Geophys. Res., 112,D24S46, doi:10.1029/2007JD008796.
Bernhard, G., and G. Seckmeyer (1997), New entrance optics for solarspectral UV measurements, Photochem. Photobiol., 65(6), 923–930.
Bernhard, G., and G. Seckmeyer (1999), Uncertainty of measurements ofspectral solar UV irradiance, J. Geophys. Res., 104(D12), 14,321–14,345.
Bernhard, G., C. R. Booth, and R. D. McPeters (2003), Calculation of totalcolumn ozone from global UV spectra at high latitudes, J. Geophys. Res.,108(D17), 4532, doi:10.1029/2003JD003450.
Bernhard, G., C. R. Booth, and J. C. Ehramjian (2004), Version 2 data ofthe National Science Foundation’s Ultraviolet Radiation Monitoring Net-work: South Pole, J. Geophys. Res., 109, D21207, doi:10.1029/2004JD004937.
Bernhard, G., C. R. Booth, J. C. Ehramjian, and V. V. Quang (2006a), NSFPolar Programs UV Spectroradiometer Network 2004–2005 OperationsReport Volume 14.0, Biospherical Instruments Inc., San Diego. Availableat www.biospherical.com/NSF
Bernhard, G., C. R. Booth, J. C. Ehramjian, and S. E. Nichol (2006b), UVclimatology at McMurdo Station, Antarctica, based on Version 2 data ofthe National Science Foundation’s Ultraviolet Radiation Monitoring Net-work, J. Geophys. Res., 111, D11201, doi:10.1029/2005JD005857.
Bernhard, G., C. R. Booth, J. C. Ehramjian, R. Stone, and E. G. Dutton(2007), Ultraviolet and visible radiation at Barrow, Alaska: Climatologyand influencing factors on the basis of version 2 National Science Foun-dation network data, J. Geophys. Res., 112, D09101, doi:10.1029/2006JD007865.
Booth, C. R., and S. Madronich (1994), Radiation amplification factors:Improved formulation accounts for large increases in ultraviolet radiationassociated with Antarctic ozone depletion, edited by C. S. Weiler andP. A. Penhale, Antarc. Res. Ser., 62, 39–42, AGU, Washington, DC.
Booth, C. R., T. B. Lucas, J. H. Morrow, C. S. Weiler, and P. A. Penhale(1994), The United States National Science Foundation’s polar networkfor Monitoring Ultraviolet Radiation, edited by C. S. Weiler and P. A.Penhale, Antarc. Res. Ser., 62, 17–37, AGU, Washington, DC.
Bouillon, R., J. Eisman, M. Garabedian, M. Holick, J. Kleinschmidt,T. Suda, I. Terenetskaya, and A. Webb (2006), Action spectrum for theproduction of previtamin D3 in human skin, CIE publication 174:2006,Commission Internationale de l’Eclairage (CIE), Vienna, Austria.
Caldwell, M. M. (1971), Solar UV irradiation and the growth and develop-ment of higher plants, in Photophysiology, edited by A. C. Giese, vol. 6,Chapter 4, pp. 131–177, Academic Press, New York.
Day, T. A., C. T. Ruhland, C. W. Grobe, and F. Xiong (1999), Growth andreproduction of Antarctic vascular plants in response to warming and UVradiation reductions in the field, Oecologia, 119, 24–35.
Early, A., et al. (1998), The 1995 North American interagency intercom-parison of ultraviolet monitoring spectroradiometers, J. Res. Natl. Inst.Stand. Technol., 103(1), 15.
Greenblatt, G. D., J. J. Orlando, J. B. Burkholder, and A. R. Ravishankara(1990), Absorption measurements of Oxygen between 330 and 1140 nm,J. Geophys. Res., 95(D11), 18,577–18,582.
Grobner, J., and M. Blumthaler (2007), Experimental determination of thereference plane of shaped diffusers by solar ultraviolet measurements,Opt. Lett., 32(1), 80–82.
Gueymard, C. A. (2004), The sun’s total and spectral irradiance for solarenergy applications and solar radiation models, Sol. Energy, 76(4), 423–453.
Hovila, J., M. Mustonen, P. Karha, and E. Ikonen (2005), Determination ofthe diffuser reference plane for accurate illuminance responsivity calibra-tions, Appl. Opt., 44(28), 5894–5898.
Kalliskota, S., J. Kaurola, P. Taalas, J. Herman, E. Celarier, and N. Krotkov(2000), Comparison of daily UV doses estimated from Nimbus 7/TOMSmeasurements and ground-based spectroradiometric data, J. Geophys.Res., 105(D4), 5059–5067.
Kancler, E., C. Gautier, P. Ricchiazzi, S. Yang, and P. Pilewskie (2005),Spectral observations and modeling of the Arctic surface radiation envir-onment, J. Geophys. Res., 110, D23203, doi:10.1029/2005JD005813.
Kneizys, F. X., E. P. Shettle, W. O. Gallery, J. H. Chetwynd, L. W. Abreu,J. E. A. Selby, S. A. Clough, and R. W. Fenn (1983), Atmospherictransmittance/radiance: Computer code LOWTRAN 6, in AFGL Envir-onmental Research Papers, Air Force Geophysics Laboratory, ReportAFGL-TR-83-0187, Hanscom Air Force Base, MA.
Kurucz, R. L., I. Furenlid, J. Brault, and L. Testerman (1984), Solar fluxatlas from 296 to 1300 nm, National Solar Observatory Atlas No. 1,Harvard Univ. Press, Cambridge, Mass. Available at ftp://ftp.noao.edu/fts/fluxatl/
Lantz, K., et al. (2002), The 1997 North American interagency intercom-parison of ultraviolet spectroradiometers including narrowband filterradiometers, J. Res. Natl. Inst. Stand. Technol., 107, 19–62.
Lenoble, J., A. Kylling, and I. Smolskaia (2004), Impact of snow cover andtopography on ultraviolet irradiance at the Alpine station of Briancon,J. Geophys. Res., 109, D16209, doi:10.1029/2004JD004523.
Madronich, S., and S. Flocke (1998), The role of solar radiation in atmo-spheric chemistry, in Handbook of Environmental Chemistry, edited byP. Boule, pp. 1–26, Springer, Heidelberg.
Manninen, P., J. Hovila, L. Seppala, P. Karha, L. Ylianttila, and E. Ikonen(2006), Determination of distance offsets of diffusers for accurate radio-metric measurements, Metrologia, 43, S120–S124, doi:10.1088/0026-1394/43/2/S24.
Mayer, B., and A. Kylling (2005), Technical note: The libRadtran softwarepackage for radiative transfer calculations – Description and examples ofuse, Atmos. Chem. Phys., 5, 1855–1877. Available at www.atmos-chem-phys.org/acp/5/1855/
Mayer, B., A. Kylling, S. Madronich, and G. Seckmeyer (1998), Enhancedabsorption of UV radiation due to multiple scattering in clouds: Experi-mental evidence and theoretical explanation, J. Geophys. Res., 103(D23),31,241–31,254.
McKenzie, R. L., P. V. Johnston, M. Kotkamp, A. Bittar, and J. D. Hamlin(1992), Solar ultraviolet spectroradiometry in New Zealand: Instrumenta-tion and sample results from 1990, Appl. Opt., 31, 6501–6509.
McKenzie, R. L., P. V. Johnston, and G. Seckmeyer (1997), UV spectro-radiometry in the network for the detection of stratospheric change(NDSC), in Solar Ultraviolet Radiation. Modelling, Measurements andEffects, edited by C. S. Zerefos and A. F. Bais, pp. 279–287, Springer,Berlin.
McKenzie, R., J. Badosa, M. Kotkamp, and P. Johnston (2005), Effects ofthe temperature dependence in PTFE diffusers on observed UV irra-diances, Geophys. Res. Lett., 32, L06808, doi:10.1029/2004GL022268.
McKinlay, A. F., and B. L. Diffey (Eds.) (1987), A reference action spec-trum for ultraviolet induced erythema in human skin, in: CommissionInternational de l’Eclairage (CIE), Research Note, 6 (1), 17–22, Com-mission Internationale de l’Eclairage (CIE), Vienna, Austria.
Nichol, S. E., G. Pfister, G. E. Bodeker, R. L. McKenzie, S. W. Wood, andG. Bernhard (2003), Moderation of cloud reduction of UV in the Ant-arctic due to high surface albedo, J. Appl. Meteorol., 42(8), 1174–1183.
Seckmeyer, G., et al. (1995), Geographical differences in the UV measuredby intercompared spectroradiometers, Geophys. Res. Lett., 22(14), 1889–1892.
Seckmeyer, G., A. Bais, G. Bernhard, M. Blumthaler, C. R. Booth,P. Disterhoft, P. Eriksen, R. L. McKenzie, M. Miyauchi, and C. Roy(2001), Instruments to measure solar ultraviolet radiation. part 1: Spectralinstruments, World Meteorological Organisation, Global AtmosphericWatch Publication No. 125, WMO TD No. 1066, World MeteorologicalOrganization, Geneva, Switzerland.
Setlow, R. B. (1974), The wavelength in sunlight effective in producingskin cancer: A theoretical analysis, Proc. Natl. Acad. Sci. U.S.A., 71(9),3363–3366.
Slaper, H., and T. Koskela (1997), Methodology of intercomparing spectralsky measurements, in The Nordic Intercomparison of Ultraviolet andTotal Ozone Instruments at Izana, October 1996, Final Report, edited
D14310 BERNHARD ET AL.: COMPARISON OF UV SPECTRORADIOMETERS
12 of 13
D14310

by B. Kjeldstad, B. Johnsen, and T. Koskela, Finnish Meteorol. Inst.,Helsinki.
Slaper, H., H. A. J. M. Reinen, M. Blumthaler, M. Huber, and F. Kuik(1995), Comparing ground-level spectrally resolved solar UV measure-ments using various instruments: A technique resolving effects of wave-length shift and slit width, Geophys. Res. Lett., 22(20), 2721–2724.
Smith, R. C., et al. (1992), Ozone depletion: Ultraviolet radiation andphytoplankton biology in Antarctic waters, Science, 256, 952–959.
Stamnes, K., J. Slusser, and M. Bowen (1991), Derivation of total ozoneabundance and cloud effects from spectral irradiance measurements,Appl. Opt., 30, 4418–4426.
Tanskanen, A., et al. (2007), Validation of daily erythemal doses fromOzone Monitoring Instrument with ground-based UV measurement data,J. Geophys. Res., 112, D24S44, doi:10.1029/2007JD008830.
Thompson, A., et al. (1997), The 1994 North American interagency inter-comparison of ultraviolet monitoring spectroradiometers, J. Res. Natl.Inst. Stand. Technol., 102(3), 279–322.
van Hoosier, M. E. (1996), Solar ultraviolet spectral irradiance data withincreased wavelength and irradiance accuracy, in Ultraviolet Atmosphericand Space Remote Sensing: Methods and Instrumentation, edited by R. E.
Huffman and C. G. Stergis, Proc. SPIE Int. Soc. Opt. Eng., 2831, 57–64,SPIE, Bellingham, WA.
Walker, J. H., R. D. Saunders, J. K. Jackson, and D. A. McSparron (1987),Spectral irradiance calibrations, NBS Spec. Publ. U. S., 250–20, Natl.Bureau of Standards, Washington, D. C.
Wuttke, S., G. Seckmeyer, G. Bernhard, J. Ehramjian, R. McKenzie,P. Johnston, and M. O’Neil (2006a), New spectroradiometers complyingwith the NDSC standards, J. Atmos. Oceanic Technol., 23(2), 241–251.
Wuttke, S., G. Seckmeyer, and G. Konig-Langlo (2006b), Measurements ofspectral snow albedo at Neumayer, Antarctica, Ann. Geophys., 24, 7–21.
Ylianttila, L., and J. Schreder (2005), Temperature effects on PTFE diffu-sers, J. Opt. Materials, 27, 1811–1814.
Yoon, H. W., C. E. Gibson, and P. Y. Barnes (2002), Realization of theNational Institute of Standards and Technology detector-based spectralirradiance scale, Appl. Opt., 41(28), 5879–5890.
Zerefos, C., D. Balis, M. Tzortziou, A. Bais, K. Tourpali, C. Meleti, G.Bernhard, and J. Herman (2001), A note on the interannual variations ofUV-B erythemal doses and solar irradiance from ground-based andsatellite observations, Ann. Geophys., 19, 115–120.
�����������������������G. Bernhard, C. R. Booth, and J. C. Ehramjian, Biospherical Instruments
Inc., 5340 Riley Street, San Diego, CA 92110-2621, USA. ([email protected])P. Johnston, M. Kotkamp, R. L. McKenzie, and S. Wood, National
Institute of Water and Atmospheric Research (NIWA), Lauder, Private Bag50061, Omakau 9352, Central Otago, New Zealand.S. E. Nichol, National Institute of Water and Atmospheric Research
(NIWA), Kilbirnie, Private Bag 14901, Wellington 6241, New Zealand.
D14310 BERNHARD ET AL.: COMPARISON OF UV SPECTRORADIOMETERS
13 of 13
D14310
Copyright © 2022 FDOKUMEN