A Comparison of Independent Star Formation Diagnostics for an Ultraviolet-selected Sample of Nearby...
25
arXiv:astro-ph/0104425v1 26 Apr 2001 A Comparison of Independent Star Formation Diagnostics for a UV-Selected Sample of Nearby Galaxies Mark Sullivan 1,2 ,Bahram Mobasher 3,4 , Ben Chan 5 , Lawrence Cram 5 , Richard Ellis 2 , Marie Treyer 6 , Andrew Hopkins 7 ABSTRACT We present results from a decimetric radio survey undertaken with the Very Large Array (VLA) as part of a longer term goal to inter-compare star formation and dust extinction diagnostics, on a galaxy by galaxy basis, for a representative sample of nearby galaxies. For our survey field, Selected Area 57, star forma- tion rates derived from 1.4 GHz luminosities are compared with earlier nebular emission line and ultraviolet (UV) continuum diagnostics. We find broad corre- lations, over several decades in luminosity, between Hα, the UV continuum and 1.4 GHz diagnostics. However, the scatter in these relations is found to be larger than observational errors, with offsets between the observed relations and those expected assuming constant star-formation histories and luminosity-independent extinction models. We investigate the physical origin of the observed relations, and conclude the discrepancies between different star-formation diagnostics can only be partly explained by simple models of dust extinction in galaxies. These models cannot by themselves explain all the observed differences, introducing the need for temporally varying star-formation histories and/or more complex models of extinction, to explain the entire dataset. Subject headings: surveys – galaxies: evolution – galaxies: starburst – cosmol- ogy: observations – ultraviolet: galaxies – radio continuum: galaxies 1 Institute of Astronomy, Madingley Road, Cambridge CB3 OHA, UK 2 California Institute of Technology, E. California Blvd, Pasadena CA 91125, USA 3 Space Telescope Science Institute, 3700 San Martin Drive, Baltimore, MD 21218, USA 4 Affiliated with the Astrophysics Division of the European Space Agency 5 School of Physics, University of Sydney, Sydney NSW 2006, Australia 6 Laboratoire d’Astronomie Spatiale, Traverse du Siphon, 19976 Marseille, France 7 Department of Physics and Astronomy, University of Pittsburgh, 3941 O’Hara Street, Pittsburgh, PA 15260, USA
Transcript of A Comparison of Independent Star Formation Diagnostics for an Ultraviolet-selected Sample of Nearby...

arX
iv:a
stro
-ph/
0104
425v
1 2
6 A
pr 2
001
A Comparison of Independent Star Formation Diagnostics for a
UV-Selected Sample of Nearby Galaxies
Mark Sullivan1,2,Bahram Mobasher3,4, Ben Chan5, Lawrence Cram5, Richard Ellis2,
Marie Treyer6, Andrew Hopkins7
ABSTRACT
We present results from a decimetric radio survey undertaken with the Very
Large Array (VLA) as part of a longer term goal to inter-compare star formation
and dust extinction diagnostics, on a galaxy by galaxy basis, for a representative
sample of nearby galaxies. For our survey field, Selected Area 57, star forma-
tion rates derived from 1.4GHz luminosities are compared with earlier nebular
emission line and ultraviolet (UV) continuum diagnostics. We find broad corre-
lations, over several decades in luminosity, between Hα, the UV continuum and
1.4GHz diagnostics. However, the scatter in these relations is found to be larger
than observational errors, with offsets between the observed relations and those
expected assuming constant star-formation histories and luminosity-independent
extinction models. We investigate the physical origin of the observed relations,
and conclude the discrepancies between different star-formation diagnostics can
only be partly explained by simple models of dust extinction in galaxies. These
models cannot by themselves explain all the observed differences, introducing
the need for temporally varying star-formation histories and/or more complex
models of extinction, to explain the entire dataset.
Subject headings: surveys – galaxies: evolution – galaxies: starburst – cosmol-
ogy: observations – ultraviolet: galaxies – radio continuum: galaxies
1Institute of Astronomy, Madingley Road, Cambridge CB3 OHA, UK
2California Institute of Technology, E. California Blvd, Pasadena CA 91125, USA
3Space Telescope Science Institute, 3700 San Martin Drive, Baltimore, MD 21218, USA
4Affiliated with the Astrophysics Division of the European Space Agency
5School of Physics, University of Sydney, Sydney NSW 2006, Australia
6Laboratoire d’Astronomie Spatiale, Traverse du Siphon, 19976 Marseille, France
7Department of Physics and Astronomy, University of Pittsburgh, 3941 O’Hara Street, Pittsburgh, PA
15260, USA

– 2 –
1. Introduction
Considerable observational progress has been made in tracking the star formation rate
(SFR) per comoving volume element as a function of redshift (see Madau et al. 1996). The
form of this “cosmic star formation history” is important not only in indicating likely eras
of dominant activity but also in securing a self-consistent picture of chemical enrichment for
detailed comparison with intergalactic absorption line diagnostics (Pei, Fall, & Hauser 1999),
as well as with the predictions of popular semi-analytical models of galaxy formation (e.g.
Baugh et al. 1998; Cole et al. 2000). Various observational diagnostics have been employed
to determine the SFR of a galaxy in a particular redshift survey. These include (i) Hydrogen
series (i.e. Balmer or Lyman) or other nebular emission lines, generated in regions ionised
by the most massive (& 10 M⊙) early-type stars (Gallego et al. 1995; Tresse & Maddox
1998; Glazebrook et al. 1999; Moorwood et al. 2000), (ii) the ultraviolet (UV) continuum,
dominated by young (but less massive, & 5 M⊙) stars (Lilly et al. 1996; Madau et al. 1996;
Treyer et al. 1998; Cowie et al. 1999; Steidel et al. 1999; Sullivan et al. 2000), (iii) far infrared
(FIR) luminosities arising from thermal emission from dust absorbed UV radiation from the
more massive stars (Rowan-Robinson et al. 1997; Blain et al. 1999), and (iv) 1.4GHz radio
emission, thought to originate mainly via synchrotron radiation generated by relativistic
electrons accelerated by type II supernovae (SNe) from stars of mass & 7 − 8 M⊙ (Condon
1992; Cram et al. 1998)
Each diagnostic has its own merits, disadvantages and uncertainties (for a review see
Kennicutt 1998) and none can yet be applied uniformly to samples over the full observed
redshift range. Accordingly, it is inevitable that the cosmic star formation history (SFH)
has been pieced together using different diagnostics from independent samples of galaxies.
Therefore, it is crucial to know how well the various diagnostics agree on a galaxy by galaxy
basis. A major source of uncertainty is the likelihood that some diagnostics are affected by
the presence of obscuring dust. Radio continuum diagnostics have the distinct advantage of
being immune from dust extinction. Non-uniformities in the SFH (or a time varying SFR)
are also important, and might, if present, introduce additional biases between the different
SFR diagnostics.
Only limited work has been done inter-comparing different star-formation (SF) diagnos-
tics for galaxies, with studies at low and intermediate redshifts showing significant discrep-
ancies. Cram et al. (1998) compared the SFRs from Hα, FIR and U -band measurements
with those from decimetric radio luminosity (L1.4) for a sample of over 700 local galaxies.
Though the various SFR estimates were in broad agreement, numerous systematic differ-
ences were found, including a significant scatter in all the relationships compared to the
L1.4/FIR relation. They conclude that the scatter may partly be due to sample selection

– 3 –
(i.e. inhomogeneities in the sample selection or possible AGN contamination) or have a
real physical basis (e.g. differential extinction among individual galaxies or time-dependent
initial mass functions). Studies comparing UV continuum and Hα emission fluxes likewise
reveal systematic discrepancies and a large scatter (Glazebrook et al. 1999; Sullivan et al.
2000; Bell & Kennicutt 2001). Although extinction is a likely source of the scatter, Sullivan
et al. (2000, hereafter S2000) argued that the observed trend on the UV-Hα plane is consis-
tent with non-uniform SFHs for some fraction of the population. If starburst activities are a
common occurrence for high redshift galaxies as some models suggest (Somerville, Primack,
& Faber 2001), further corrections may be needed to derive representative SFRs from optical
and UV diagnostics based on luminous sources only.
This paper is motivated by the need for more comprehensive and rigorous investigation
into the inter-relationships between the various SF diagnostics, including those based on
the promising 1.4GHz luminosity. Though the radio emission is generally thought to be
generated as a by-product of the supernovae of massive stars (and therefore a measure of
SFR), the steps relating the supernovae explosion to the arrival of radio emission at the
Earth – for example the electron acceleration in the supernova remnant and the subsequent
cosmic ray propagation, the role of magnetic fields, any possible energy loss mechanisms,
or a significant cosmic-ray escape fraction – are not yet well understood. We are therefore
particularly interested in the quantitative empirical precision with which radio luminosities
can be used to trace SF. The major hurdle is the need for a large, well-controlled sample
with considerable overlap in the various diagnostics. For this study, we choose the UV-
selected sample discussed by Treyer et al. (1998) and S2000, drawn from the FOCA balloon-
borne imaging data of Selected Area 57 (SA57), taken by Milliard et al. (1992). The SA57
survey contains 222 spectroscopically-confirmed star-forming galaxies, forming a statistically-
complete sample selected at 2000 A.
A plan of the paper follows. In §2 we review the SA57 dataset and briefly describe the
1.4GHz observations (a more detailed description will be given by Chan et al., in prepa-
ration). In §3 we discuss the adopted flux-SFR calibrations, the selection effects present
in our sample, and inter-compare the SFRs derived from the different diagnostics. In §4
we discuss the implications and present our conclusions. Throughout we assume ΩM = 1,
H0 = 100 km s−1 Mpc−1, solar metallicity, and, unless otherwise stated, our adopted initial
mass function is Salpeter (1955)-like (Ψ(M) ∼ M−2.35) with mass limits Mlower = 0.1 and
Mupper = 100 M⊙.

– 4 –
2. The Datasets
The UV-selected sample is drawn from the Milliard et al. (1992) FOCA1500 1.55 di-
ameter image of Selected Area 57 centered at RA = 13h03m53s, Dec. = +2920′30′′ (B1950).
The photometric details are presented in Treyer et al. (1998) and S2000. Briefly, the errors
in the UV photometry range from 0.2mag at the bright end to 0.5mag at the fainter end.
Optical fiber spectroscopy has been secured for an unbiased (i.e. randomly selected) subset
of 369 UV sources limited at mUV = 18.5 (equivalent to B ≃ 20 − 21.5 for a late-type
galaxy) using the WIYN observatory1 (λλ = 3500− 6600 A) and the William Herschel Tele-
scope (WHT, λλ = 3500−9000 A). This spectroscopy provides redshifts for 222 UV-selected
galaxies, of which 178 were found to have strong emission line spectra. However, only the
WHT spectra have sufficient wavelength coverage to detect Hα, and only for a subsample of
88 WHT-observed galaxies is the flux calibration sufficient for a reliable conversion of Hα to
SFR (note this does not include all the galaxies with detected Hα emission). The errors in
the Hα fluxes are estimated from the S/N of the spectrum in question. A fiber size of 2.7”
diameter was used for the flux-calibrated optical spectroscopy; no aperture corrections are
applied, hence the Hα flux is underestimated in very nearby objects with a larger apparent
size (see S2000).
The 1.4GHz radio observations were carried out at the NRAO VLA telescope, and cover
the central square degree of the SA57 field. A 4 σ detection limit of 170 µJy was achieved at
the centre of the field dropping to 340 µJy in the outer regions. A detailed discussion of the
VLA radio data and its reduction will be presented in Chan et al. (in prep.). Briefly, the task
is to measure radio flux densities, or to estimate upper flux limits, at the positions of all the
FOCA-UV galaxies. This problem is not the same as deriving a catalogue from the image,
since the search positions, at which the FOCA galaxies are located, are pre-determined.
The position-dependent noise in the image, arising from the primary beam response and
the mosaicing method, complicates this problem. We begin by constructing an image of
the position-dependent noise, using the measured noise near the centers of the pointings in
conjunction with the primary beam attenuation and the overlapping of the mosaic. We then
search near each UV position. For radio sources with flux densities greater than 4σ, we use
the aips task vsad to determine the source properties from a one-component Gaussian fit
in which the amplitude, size and position of the source is allowed to vary. Three of these
fits reveal very extended sources, whose properties were recalculated from the individual
pixel values. For sources fainter than 4σ, a Gaussian fit was made with the position fixed
1The WIYN Observatory is a joint facility of the University of Wisconsin-Madison, Indiana University,
Yale University, and the National Optical Astronomy Observatories.

– 5 –
at the UV source position using the miriad task imfit (as vsad does not allow position-
fixed fitting). If the amplitude of this fit exceeds the local 1σ noise level, it is reported as a
detection, while fainter fits are reported as upper limits using the 1σ level. For all reported
fits, the 1σ error is reported based on the noise image.
A total of 26 out of 191 FOCA galaxies (with a secure redshift) within the central
1.4GHz survey area of SA57 are detected using vsad at a significance level of ≥ 4 σ. Of
these, 22 have single optical counterparts on the Palomar Sky Survey (POSS) plates (see
S2000 for a discussion of FOCA/POSS identification procedures). A further three FOCA
sources were identified with extended radio emission that provided poor fits to a Gaussian
profile; the fluxes for these were consequently calculated by adding together all the pixels
inside the extended emission area as described above. The position fixed fitting identifies a
further 25 galaxies, 18 with unambiguous optical counterparts. Since in the present paper we
only wish to study field galaxies (avoiding contamination by known cluster members which
are likely to reside in different environments), we also exclude 3 galaxies in the redshift range
of the nearby Coma cluster (0.020 < z < 0.027). A summary of the sample numbers is given
in Table 1. Of the final sample, 25 WHT-observed galaxy spectra have detected Hα of which
17 have an adequate flux calibration to derive SFRs.
All observed radio luminosities have been k-corrected to luminosities appropriate to a
rest-frame frequency of 1.4GHz according to L01.4 = Lobs
1.4 × (1 + z)−0.8, where the spectral
index of -0.8 is typical for the non-thermal synchrotron component of decimetric radiation.
3. Inter-comparison of star formation diagnostics
3.1. Diagnostic Relations
To compare the SF diagnostics based on the radio (L1.4), UV (Luv), and Hα (LHα)
luminosities, a self-consistent calibration is required. This is accomplished using the pegase-
ii spectral synthesis code (Fioc & Rocca-Volmerange 1999) which generates galaxy spectra
as a function of time for arbitrary SFHs, from which the Hα and UV luminosities can be
calculated (S2000). In order to estimate 1.4GHz luminosities for a given SF scenario, we add
a simple prescription using the type II supernovae rate given by pegase-ii, using calibrations
from Condon (1992). We calculate the conversion factors for four of the different metallicities
available in pegase-ii; we report solar metallicity conversions below, and the remainder in
Table 2. Assuming a constant SFH, the three SF diagnostics in this study are calibrated as
explained below:
Hα emission: The relevant photons originate via re-processed ionizing radiation at wave-

– 6 –
lengths λ < 912 A produced by the most massive (> 10 M⊙), short-lived (≃ 20 Myr), OB
stars. Accordingly, Hα emission is a virtually instantaneous SF measure – for a burst of star-
formation with a constant SFR, the Hα emission can be considered constant after ≃ 10 Myr.
However, as it depends so strongly on the most massive stars, it is very sensitive to the form
of the initial mass function (IMF) (see Kennicutt 1998, for example). There is much debate
in the literature as to the universality, or otherwise, of the IMF (see Scalo 1998; Gilmore
2001; Eisenhauer 2001, for recent reviews); here we assume the form to be universal, but
discuss variations in the upper mass cut-off in Section 4.3. Most calibrations assume case-B
recombination (a comprehensive treatment of its use can be found in Charlot & Longhetti
2001). Using pegase-ii we derive:
SFR =LHα(erg s−1)
1.22 × 1041M⊙ yr−1. (1)
As a comparison, Kennicutt (1998) derive a conversion value of 1.26×1041, very close to the
value used here.
UV 2000 A continuum: As stars that contribute to radiation at 2000 A span a range of ages
(and hence initial masses), including some post-main sequence contribution, any UV-SFR
calibration is dependent on the past history of SF. This introduces a significant uncertainty
when interpreting the observations of the star-forming galaxies in this sample. As a guide, we
calculate conversion values based on constant burst of SF of durations 10, 100 and 1000Myr
using pegase-ii. This gives:
SFR =LUV (erg s−1 A
−1)
x × 1039M⊙ yr−1. (2)
where x is equal to 3.75, 5.76 and 6.56 for 10, 100 and 1000Myr respectively. Kennicutt
(1998) derive a conversion value of 5.36 × 1039, again in good agreement.
1.4GHz continuum: The integrated radio flux at 1.4GHz is thought to originate via non-
thermal synchrotron emission from electrons accelerated by supernovae (spectral index ≃
−0.8) and thermal Bremsstrahlung from electrons in ionised H ii regions (spectral index
≃ −0.1). Non-thermal emission dominates (around 90%) at the frequency of interest. We
introduce a prescription into pegase-ii to predict the non-thermal 1.4GHz luminosity, L1.4,
based on the radio supernova rate (type II SNe) in the pegase-ii code. For a constant
SFR burst, the SNe II rate is effectively constant after ≃ 80 Myr. Using the relationship
between non-thermal radio luminosity and the radio supernova rate, presented in Condon
& Yin (1990) (see also Condon 1992), the SFR as a function of 1.4GHz luminosity for our
assumed IMF is:

– 7 –
SFR =L1.4(erg s−1 Hz−1)
x × 1027M⊙ yr−1. (3)
where x is equal to 2.39 and 8.85 for 10 and 100Myr respectively. This agrees well with a
conversion factor of 7.36 × 1027 given by Haarsma et al. (2000), which maps non-thermal
luminosity to SFR at 1.4GHz. The small difference arises as pegase-ii calculates a smaller
(metallicity dependent) lower mass cut-off for type II SNe than the 8 M⊙ used in Condon
(1992), as convective overshooting increases the mass of the degenerate core, and the Chan-
drasekhar mass is reached more easily (M. Fioc 2000, private communication), hence the
conversion factor above is slightly metallicity dependent (see Table 2). We neglect the small
amount of thermal emission at 1.4GHz.
There is some evidence to suggest that the calibration of L1.4 – SFR may not be perfectly
linear, particularly in low luminosity (or low SFR) objects where there is the possibility
that a fraction of the SN remnant-accelerated cosmic rays may escape from the galaxy
(Condon, Anderson, & Helou 1991). In such scenarios, the true SFR for a galaxy may be
underestimated when using the linear relationship presented above.
Our ‘standard’ scenario then uses the calibrations listed above, and the following im-
plicit assumptions: i) constant SFHs over recent timescales for the galaxies under study,
ii) a Salpeter IMF, iii) solar metallicity and the stellar libraries/evolutionary tracks used in
pegase-ii (Fioc & Rocca-Volmerange 1999), and iv) a simple, tight and linear relationship
between L1.4 and SFR. We will discuss the validity of some of these assumptions in later
sections.
3.2. The effects of selection bias
Before analysing the present dataset in more detail, it is important to explore possible
selection effects that might operate in any comparison where only a subset of one diagnostic
set is used. In particular, we need to determine that any correlations seen in our data are
not merely products of the potentially complex selection effects in this study. In this section
we attempt to identify which types of galaxies are excluded from our combined survey due
to the different flux limits, and how this might affect any correlations that we see in our
data.
Our sample has two independent flux limits. The first arises from the original selection
at 2000 A, which was limited at muv = 18.5, a flux limit of 1.35 × 10⁻¹⁶ erg s−1 cm−2 A−1
.
The second flux limit is that of the subsequent radio follow-up survey. We find this can
– 8 –
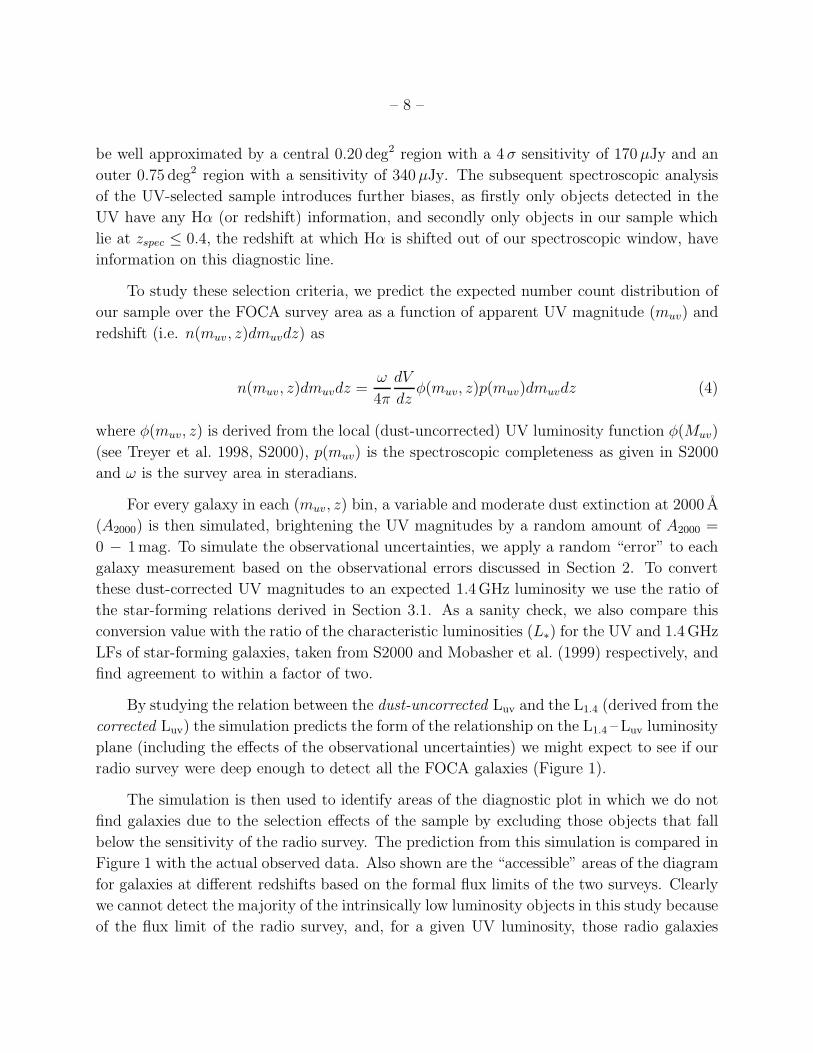
be well approximated by a central 0.20 deg2 region with a 4 σ sensitivity of 170 µJy and an
outer 0.75 deg2 region with a sensitivity of 340 µJy. The subsequent spectroscopic analysis
of the UV-selected sample introduces further biases, as firstly only objects detected in the
UV have any Hα (or redshift) information, and secondly only objects in our sample which
lie at zspec ≤ 0.4, the redshift at which Hα is shifted out of our spectroscopic window, have
information on this diagnostic line.
To study these selection criteria, we predict the expected number count distribution of
our sample over the FOCA survey area as a function of apparent UV magnitude (muv) and
redshift (i.e. n(muv, z)dmuvdz) as
n(muv, z)dmuvdz =ω
4π
dV
dzφ(muv, z)p(muv)dmuvdz (4)
where φ(muv, z) is derived from the local (dust-uncorrected) UV luminosity function φ(Muv)
(see Treyer et al. 1998, S2000), p(muv) is the spectroscopic completeness as given in S2000
and ω is the survey area in steradians.
For every galaxy in each (muv, z) bin, a variable and moderate dust extinction at 2000 A
(A2000) is then simulated, brightening the UV magnitudes by a random amount of A2000 =
0 − 1mag. To simulate the observational uncertainties, we apply a random “error” to each
galaxy measurement based on the observational errors discussed in Section 2. To convert
these dust-corrected UV magnitudes to an expected 1.4GHz luminosity we use the ratio of
the star-forming relations derived in Section 3.1. As a sanity check, we also compare this
conversion value with the ratio of the characteristic luminosities (L∗) for the UV and 1.4GHz
LFs of star-forming galaxies, taken from S2000 and Mobasher et al. (1999) respectively, and
find agreement to within a factor of two.
By studying the relation between the dust-uncorrected Luv and the L1.4 (derived from the
corrected Luv) the simulation predicts the form of the relationship on the L1.4 –Luv luminosity
plane (including the effects of the observational uncertainties) we might expect to see if our
radio survey were deep enough to detect all the FOCA galaxies (Figure 1).
The simulation is then used to identify areas of the diagnostic plot in which we do not
find galaxies due to the selection effects of the sample by excluding those objects that fall
below the sensitivity of the radio survey. The prediction from this simulation is compared in
Figure 1 with the actual observed data. Also shown are the “accessible” areas of the diagram
for galaxies at different redshifts based on the formal flux limits of the two surveys. Clearly
we cannot detect the majority of the intrinsically low luminosity objects in this study because
of the flux limit of the radio survey, and, for a given UV luminosity, those radio galaxies

– 9 –
we do detect in our simulation lie along the bottom of the distribution of model galaxies
(i.e. have brighter 1.4GHz luminosities). We are thus biased against objects at low intrinsic
radio power but which are bright enough to be detected in the UV (i.e. faint star-forming or
post-starburst objects). This can also be seen by examining the limits by redshift, where the
model galaxies lie offset from the line denoting the respective survey limits. Extending the
radio survey to fainter flux limits will shift the vertical lines in Figure 1 to the left, allowing
a greater fraction of the UV galaxies to be detected at given redshift.
There is also a larger scatter in the observed data, compared to the simulation, which
assumes the Luv –L1.4 conversion to be perfectly linear. Scatter in the simulations can be
generated by varying the adopted dust extinction on the UV luminosities over larger ranges.
However, if we increase the range of A2000 in this way, we brighten the predicted radio
luminosities and end up with an excess population c.f. the observations. For example, 14%
of the UV galaxies are detected at ≥ 4σ; with A2000 = 0 the predicted fraction of UV galaxies
detected in the radio is ∼ 4%, for A2000 = 0− 1 the fraction is ∼ 10%, for A2000 = 0− 2 the
fraction is ∼ 20% and for A2000 = 1−2 the fraction is ∼ 45%. Therefore, to generate a large
scatter by varying the dust extinction over larger ranges results in the detection of a larger
fraction of our UV population at 1.4GHz than is actually observed. We will return to this
subject in Section 4.3.
In summary, the simulations in this section reflect the presence of a bias against low
power radio sources with moderate dust extinction, which will not appear in our UV survey.
However, our conclusion from Figure 1 is that this bias will not significantly affect our
results as it does not exclude populations of objects with significantly different properties or
luminosities to those that are detected.
3.3. Observational Results
With the above selection effects in mind, we now consider the UV/Hα/1.4GHz relations.
The UV, Hα, and 1.4GHz luminosities, uncorrected for dust extinction, are compared in
Figure 2 for galaxies which have such available data. FOCA galaxies without a reliable radio
detection are shown as upper limits in radio luminosity. Figure 2 demonstrates apparent
correlations between different SF diagnostics over 3 – 4 orders of magnitude, as predicted
from Section 3.2.
We test the strength of these correlations using various statistical methods. We calculate
the linear correlation coefficient (or “Pearson’s r”), as well as the non-parametric Spearman
rank-order correlation coefficient (see Table 3). In these tests between any two datasets, a
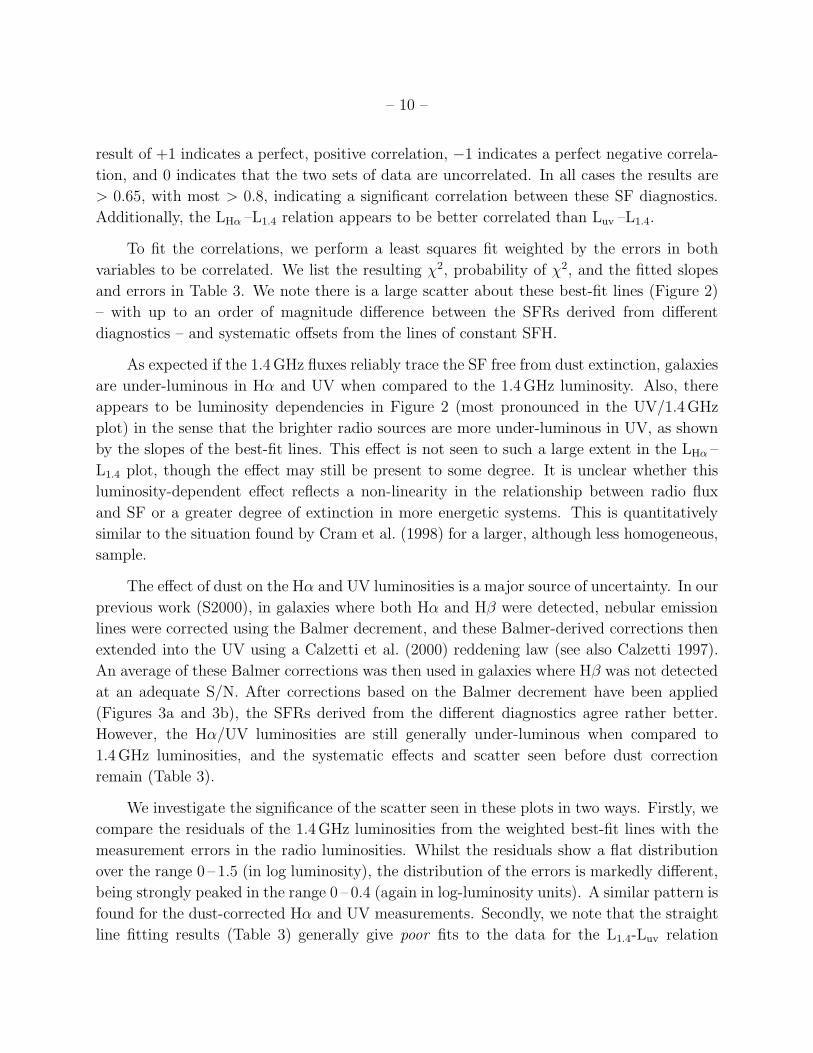
– 10 –
result of +1 indicates a perfect, positive correlation, −1 indicates a perfect negative correla-
tion, and 0 indicates that the two sets of data are uncorrelated. In all cases the results are
> 0.65, with most > 0.8, indicating a significant correlation between these SF diagnostics.
Additionally, the LHα –L1.4 relation appears to be better correlated than Luv –L1.4.
To fit the correlations, we perform a least squares fit weighted by the errors in both
variables to be correlated. We list the resulting χ2, probability of χ2, and the fitted slopes
and errors in Table 3. We note there is a large scatter about these best-fit lines (Figure 2)
– with up to an order of magnitude difference between the SFRs derived from different
diagnostics – and systematic offsets from the lines of constant SFH.
As expected if the 1.4GHz fluxes reliably trace the SF free from dust extinction, galaxies
are under-luminous in Hα and UV when compared to the 1.4GHz luminosity. Also, there
appears to be luminosity dependencies in Figure 2 (most pronounced in the UV/1.4GHz
plot) in the sense that the brighter radio sources are more under-luminous in UV, as shown
by the slopes of the best-fit lines. This effect is not seen to such a large extent in the LHα –
L1.4 plot, though the effect may still be present to some degree. It is unclear whether this
luminosity-dependent effect reflects a non-linearity in the relationship between radio flux
and SF or a greater degree of extinction in more energetic systems. This is quantitatively
similar to the situation found by Cram et al. (1998) for a larger, although less homogeneous,
sample.
The effect of dust on the Hα and UV luminosities is a major source of uncertainty. In our
previous work (S2000), in galaxies where both Hα and Hβ were detected, nebular emission
lines were corrected using the Balmer decrement, and these Balmer-derived corrections then
extended into the UV using a Calzetti et al. (2000) reddening law (see also Calzetti 1997).
An average of these Balmer corrections was then used in galaxies where Hβ was not detected
at an adequate S/N. After corrections based on the Balmer decrement have been applied
(Figures 3a and 3b), the SFRs derived from the different diagnostics agree rather better.
However, the Hα/UV luminosities are still generally under-luminous when compared to
1.4GHz luminosities, and the systematic effects and scatter seen before dust correction
remain (Table 3).
We investigate the significance of the scatter seen in these plots in two ways. Firstly, we
compare the residuals of the 1.4GHz luminosities from the weighted best-fit lines with the
measurement errors in the radio luminosities. Whilst the residuals show a flat distribution
over the range 0 – 1.5 (in log luminosity), the distribution of the errors is markedly different,
being strongly peaked in the range 0 – 0.4 (again in log-luminosity units). A similar pattern is
found for the dust-corrected Hα and UV measurements. Secondly, we note that the straight
line fitting results (Table 3) generally give poor fits to the data for the L1.4-Luv relation

– 11 –
(denoted by the χ2 values), even though the datasets are undoubtedly correlated. This
implies that either the observational errors are underestimated (a scenario we do not believe
to be true) or that the scatter is larger than would be expected for a tight linear correlation.
While the size of this sample is small, making these kinds of tests difficult, we nonetheless
conclude that the scatter we see in these plots cannot arise purely from observational errors
in our data (see also section 3.2).
We conclude that although the SF diagnostics correlate over several orders of magnitude,
there is a large (approximately an order of magnitude) and statistically significant scatter
around these correlations which is not removed after simple dust corrections. This implies
that our best-fit correlations are not consistent with calibrations based on constant SFHs,
a tight, linear L1.4 – SFR relationship, and extinction corrections which are independent of
galaxy luminosity.
4. Discussion
In this section, we will discuss the implications of the results of Section 3.3 and try to
resolve the apparent discrepancies highlighted there. The major features of the dataset are
the offsets (and non-linearities) when compared to our standard scenario, and the scatter
that we see around the best-fit lines of the correlations.
4.1. The Contribution of Active Galactic Nuclei
We start with the hypothesis that the non-linearity observed in Figure 2 is due to the
inclusion of active galaxies, or at least objects where SF is not the dominant emission mech-
anism at radio frequencies (for example AGN, where the radio emission may be dominated
by a nuclear “monster”). To investigate this, we search for evidence of different populations
in the spectra of the galaxies: those with detected narrow-line Hα emission (i.e. known
to be star-forming) and those with weak or non-existent Hα emission. We exclude those
galaxies observed with the WIYN, where the spectral wavelength coverage is insufficient to
detect Hα. Of the remainder, only one galaxy has no detectable Hα emission (formally a
fraction of 4%, compared with ∼ 30% in the FOCA sample as a whole), and it lies away
from the remainder of the galaxies (marked on Figure 2). We see evidence that the 1.4GHz
luminosity varies as a function of (UV − B)0 colour (with higher luminosity systems being
bluer), and note that the object with no Hα is the reddest object in our sample (≃ 6.5 c.f.
a median (UV − B)0 ≃ 0 for this sample). This is consistent with the scenario that objects
– 12 –
with little or no Hα emission are weakly star-forming or early-type galaxies, possibly hosting
AGNs, which are responsible for the observed UV and 1.4GHz luminosities.
No evidence is found for other significant AGN contamination (e.g. broad emission
lines or unusual emission line ratios) in those objects with Hα emission (see S2000 for a
fuller discussion; see also Contini et al. in preparation). We conclude that whilst there are
undoubtedly AGN and non star-forming galaxies present in our sample, we find no evidence
that they are responsible for the scatter and non-linearities in the observed relations.
4.2. Non-linearities in the diagnostics plots
One of most interesting results from this study is the slopes of the best-fit relations,
which are significantly different from those expected, assuming constant SF scenarios (i.e. a
slope of one, see Section 3.2). One possibility is using the Calzetti et al. (2000) extinction
result to apply optical extinction measures (the Balmer ratio) at UV wavelengths is not
appropriate for our sample of galaxies, for example if complex dust geometries ensured a
non-trivial relation between Hα and UV attenuations. Until some independent measure of
the UV extinction is available – for example measures at other UV wavelengths in addition
to 2000 A – such a possibility must be deferred to a later analysis. There appear to be two
other possible explanations for these observed non-linearities (as well as non-uniformities in
the SFH which we discuss in the next section); the related effect of a luminosity-dependent
dust correction, and a non-linearity in the L1.4 – SFR calibration. We discuss each in turn.
Our previous dust corrections take little account of any possible luminosity depen-
dence, as only few galaxies posses Hα, Hβ and 1.4GHz emission. Such luminosity effects
could arise if intensely star-forming galaxies (i.e. those with larger 1.4GHz luminosities),
or the star-forming regions of these galaxies, posses dustier environments. Wang & Heck-
man (1996) investigated such effects in a local sample of galaxies, and demonstrated that
the UV(2000 A)/FIR ratio decreases with increasing FIR luminosity, implying that the dust
opacity may increase in more strongly star-forming environments. If such effects were present
in our sample, then dust corrections which accounted for this would have the effect of ‘ro-
tating’ our best-fit lines in an anti-clockwise direction.
To investigate this in more detail, we follow Hopkins et al. (2001) and attempt to derive
a relation between the intrinsic SFR in a galaxy and the extinction present. Ideally, this
could be done by examining the Hα/Hβ trend with a SF diagnostic unaffected by dust, e.g.
the 1.4GHz luminosity. Unfortunately, the sample size of objects with radio, Hα and Hβ
detections is currently so small that such a comparison is not conclusive.

– 13 –
Instead, to explore the consequence of a luminosity dependence, we appeal to the full
sample of S2000 galaxies (whether or not they have a radio detection in the present survey)
and correlate the Hα/Hβ ratio with both uncorrected and Balmer-corrected Hα luminosity.
We see a clear trend in both cases, with intrinsically brighter Hα luminosity galaxies having a
larger Hα/Hβ ratio, even before dust correction of the Hα. We demonstrate this relationship
in Figure 4. It is important to realize that this relationship has a large scatter (partly due to
the uncertainties in determining the Hα and Hβ fluxes – see S2000), and so such corrections
should only be used in a statistical manner.
By fitting the corrected relationship (weighted by the errors in both the Balmer ratio and
the Hα luminosity), we are able to construct an observed relationship between the intrinsic
SFR in an object (as governed by the corrected Hα emission) and the Balmer decrement,
which can then be used for a subsequent dust correction. This fitted relationship is
Hα
Hβ= 0.82 × log(SFR) + 4.24. (5)
and has a correlation coefficient of 0.65. Hopkins et al. (2001) use this technique, but derive
the SFRs independently from FIR observations. This approach is obviously to be preferred,
as the FIR provides a measure of the intrinsic SFR independently from the Hα measure
used above. They find Hα/Hβ = 0.80 × log(SFR) + 3.83, in remarkably good agreement
with the above estimate despite differences in sample selection and the SF diagnostic used
to determine the dust-corrected SFR. Therefore, for each object detected in our radio survey
– i.e. with an independent measure of (presumed) dust-free SF at 1.4GHz – we can correct
the observed Hα and UV luminosities using equation (6) and a Calzetti et al. (2000) law to
extend to UV wavelengths. Obviously, such an approach can only correct the general trend
seen in our sample, and will not remove the galaxy to galaxy scatter.
The resulting correlations are shown in Figure 5. The slope of the best-fit line is now
closer to unity (predicted in constant SF scenarios and with linear 1.4GHz to SFR conver-
sions), though the UV/1.4GHz relation is still slightly too shallow. Adopting the Hopkins
et al. (2001) correction gives an almost identical result. Larger and deeper samples are clearly
needed with a more comprehensive wavelength coverage, but this first analysis suggests that
empirical, luminosity-dependent extinction corrections can go some way to explaining the
slopes of our best-fit relations.
The second explanation considers the validity of the calibration of the 1.4GHz lumi-
nosities and the conversion into a SFR. This calibration is based on the observed conversion
values of the non-thermal radio luminosity to the supernova rate of our own galaxy. If, in
small (or low-SFR) galaxies, cosmic ray electrons were able to escape more easily than in

– 14 –
larger systems, or at least have a different escape fraction compared to our galaxy, one may
underestimate the radio-derived SFR in low luminosity systems, and possibly overestimate
in high-luminosity systems (see for example Chi & Wolfendale 1990; Condon et al. 1991).
Such an effect could generate a similar ‘luminosity-dependent’ effect to that observed. A full
analysis of this complex issue must await a more complete dataset.
4.3. The physical origin of the scatter
The second major feature in our data is the statistically significant scatter around the
best-fit lines. As we saw in Section 3.2, generating this scatter via an increased range of
dust extinctions in our sample raises difficulties in reconciling the radio-detected fraction of
UV galaxies with those expected in simulations (assuming a Calzetti et al. (2000) law). We
investigate this effect in several ways by examining the variation of the Hα/UV ratio as a
function of 1.4GHz luminosity (Figure 6). This diagnostic diagram is the least sensitive to
dust, affected only by differential extinction between Hα and the UV (assuming the radio
data are dust free). Also included on Figure 6 is the position of each galaxy, using different
extinction corrections, based on the Balmer decrement, the luminosity-dependent corrections
and the range of corrections corresponding to visual extinctions of AV = 0.5, 1.0, 1.5 & 2.0.
Again, we adopt the Calzetti et al. (2000) law to extend the extinction corrections into the
UV.
Figure 6 implies that, for a constant SFR, it is unlikely that dust or IMF variations (i.e.
varying the upper mass cut-off) are sufficient to explain the scatter. Even considering the
full range of dust corrections, some galaxies have Hα/UV ratios that cannot be reproduced.
We conclude that while a significant fraction of the scatter in this diagram is due to different
levels of dust extinction among the galaxies, these dust corrections cannot (in their present
form) explain the entire dataset. Other more complex dust geometries, for example that of
Charlot & Fall (2000) which models the time-varying attenuation of Hα line emission and
UV continuum, will again be deferred to a later paper.
In S2000, a comparison of Hα and UV luminosities for the entire FOCA sample revealed
discrepancies that were difficult to reconcile within the framework of simple dust corrections.
Therefore, S2000 considered the possibility that a fraction of the FOCA galaxies were un-
dergoing bursts of short-term, intensive SF, which were able to explain the observed dataset
to a certain degree. Such scenarios naturally generate a scatter on the Hα/UV/1.4GHz
planes due to differing dependencies on the timescale of SF of these different diagnostics
(see Section 3.1). For example, UV continuum radiation is present after the completion of a
starburst for a longer duration than nebular or radio emission. By applying this hypothesis

– 15 –
to the current dataset, we attempt to explain the likely cause of the observed trends in
Figure 2 and 3. Whilst this dataset is too small for a thorough quantitative analysis, we
can nevertheless test the reliability of such approach. Therefore, we relax the assumption of
a constant SFH and consider a temporally varying SFH for our field galaxies. This is done
by superimposing exponential starbursts of varying strength and duration onto underlying
exponential SFHs, as a function of time, thereby simulating a ‘star-bursting + evolved pop-
ulation’ galaxy, from which we can use pegase-ii to estimate the evolution of the Hα, UV,
and 1.4GHz luminosities over time (see Section 3.1).
The effect of varying the burst parameters is demonstrated in Figure 6 by assuming
different bursts corresponding to over reasonable ranges (5–35% and 10–110Myr duration).
The bursts occur at a galactic age of 6Gyr. For illustrative purposes, each artificial galaxy
has a mass of 1010 M⊙, of course in reality this is unlikely to be true, but we must await
near-IR data to explore this further. It is clear that all of the scatter could be explained
in terms of a temporally varying SFHs using bursts of different parameters, though with
this small sample size it is not possible to constrain the burst parameters in any meaningful
manner.
5. Conclusions
We have presented the first results from a decimetric radio survey of nearby galaxies,
with the ultimate goal of comparing SF diagnostics for a homogeneous sample of star-forming
galaxies. We find broad correlations over several orders of magnitude between the different
SF diagnostics but with a large galaxy-to-galaxy scatter and offsets/non-linearities from
relations predicted using simple dust extinction and SF scenarios. By dividing our sample
into two (those with and without detected Hα emission), we tentatively conclude that the
scatter and offsets that we see are not due to a significant non-starforming population of
galaxies.
We find evidence for luminosity-dependent effects in our dataset, and show that lumi-
nosity dependent dust corrections or a mis-calibration of the 1.4GHz-SFR calibration, or a
combination of both, can go some way to resolving this effect. We also demonstrate that,
over realistic ranges, differential extinction between galaxies cannot be solely responsible for
the scatter in our relations; indeed our dataset argues against significant extinction in our
sample. We conclude the discrepancies between different SF diagnostics can only be partly
explained by simple models of dust extinction in galaxies. These models cannot by them-
selves explain all the observed differences, introducing the need for temporally varying SFHs
and/or more complex models of extinction, to explain the entire dataset.

– 16 –
We thank the anonymous referee for detailed comments which improved this manuscript.
The National Radio Astronomy Observatory is a facility of the National Science Foundation
operated under cooperative agreement by Associated Universities, Inc. The William Herschel
Telescope is operated on the island of La Palma by the Isaac Newton Group in the Spanish
Observatorio del Roque de los Muchachos of the Instituto de Astrofisica de Canarias.
REFERENCES
Baugh, C. M., Cole, S., Frenk, C. S., & Lacey, C. G. 1998, ApJ, 498, 504
Bell, E. F. & Kennicutt, R. C. 2001, ApJ, 548, 681
Blain, A. W., Smail, I., Ivison, R. J., & Kneib, J. 1999, MNRAS, 302, 632
Calzetti, D. 1997, in The Ultraviolet Universe at Low and High Redshift: Probing the
Progress of Galaxy Evolution, 403
Calzetti, D., Armus, L., Bohlin, R. C., Kinney, A. L., Koornneef, J., & Storchi-Bergmann,
T. 2000, ApJ, 533, 682
Charlot, S. & Fall, S. M. 2000, ApJ, 539, 718
Charlot, S. & Longhetti, M. 2001, in press, MNRAS, astroph/0101097
Chi, X. & Wolfendale, A. W. 1990, MNRAS, 245, 101
Cole, S., Lacey, C. G., Baugh, C. M., & Frenk, C. S. 2000, MNRAS, 319, 168
Condon, J. J. 1992, ARA&A, 30, 575
Condon, J. J., Anderson, M. L., & Helou, G. 1991, ApJ, 376, 95
Condon, J. J. & Yin, Q. F. 1990, ApJ, 357, 97
Cowie, L. L., Songaila, A., & Barger, A. J. 1999, AJ, 118, 603
Cram, L., Hopkins, A., Mobasher, B., & Rowan-Robinson, M. 1998, ApJ, 507, 155
Eisenhauer, F. 2001, in ”Starbursts: Near and Far”, ed. L.J. Tacconi and D. Lutz, as-
troph/0101321
Fioc, M. & Rocca-Volmerange, B. 1999, in astro-ph, astro–ph/9912179
Gallego, J., Zamorano, J., Aragon-Salamanca, A., & Rego, M. 1995, ApJ, 455, L1

– 17 –
Gilmore, G. 2001, in ”Starbursts: Near and Far”, ed. L.J. Tacconi and D. Lutz, as-
troph/0102189
Glazebrook, K., Blake, C., Economou, F., Lilly, S., & Colless, M. 1999, MNRAS, 306, 843
Haarsma, D. B., Partridge, R. B., Windhorst, R. A., & Richards, E. A. 2000, ApJ, 544, 641
Hopkins, A. M., Connolly, A. J., Haarsma, D. B., & Cram, L. E. 2001, in press, AJ, as-
troph/0103253
Kennicutt, R. C. 1998, ARA&A, 36, 189
Lilly, S. J., Le Fevre, O., Hammer, F., & Crampton, D. 1996, ApJ, 460, L1
Madau, P., Ferguson, H. C., Dickinson, M. E., Giavalisco, M., Steidel, C. C., & Fruchter, A.
1996, MNRAS, 283, 1388
Milliard, B., Donas, J., Laget, M., Armand, C., & Vuillemin, A. 1992, A&A, 257, 24
Mobasher, B., Cram, L., Georgakakis, A., & Hopkins, A. 1999, MNRAS, 308, 45
Moorwood, A. F. M., van der Werf, P. P., Cuby, J. G., & Oliva, E. 2000, A&A, 362, 9
Pei, Y. C., Fall, S. M., & Hauser, M. G. 1999, ApJ, 522, 604
Rowan-Robinson, M., et al. 1997, MNRAS, 289, 490
Salpeter, E. E. 1955, ApJ, 121, 161
Scalo, J. 1998, in ASP Conf. Ser. 142: The Stellar Initial Mass Function, ed. G. Gilmore &
D.Howell (San Francisco: ASP), 201
Somerville, R. S., Primack, J. R., & Faber, S. M. 2001, MNRAS, 320, 504
Steidel, C. C., Adelberger, K. L., Giavalisco, M., Dickinson, M., & Pettini, M. 1999, ApJ,
519, 1
Sullivan, M., Treyer, M. A., Ellis, R. S., Bridges, T. J., Milliard, B., & Donas, J. . 2000,
MNRAS, 312, 442
Tresse, L. & Maddox, S. J. 1998, ApJ, 495, 691
Treyer, M. A., Ellis, R. S., Milliard, B., Donas, J., & Bridges, T. J. 1998, MNRAS, 300, 303
Wang, B. & Heckman, T. M. 1996, ApJ, 457, 645

– 18 –
This preprint was prepared with the AAS LATEX macros v5.0.
Table 1. The details of the different samples in our combined survey.
Sample Total Total Total Total Total Total
(vsad) (imfit) (pixel-sum) (with Hα)2 (with fluxed Hα)3
Largest sample 26 25 3 54 30 (21)
(minus > 1 POSS counterparts) 23 21 3 47 27 (19)
(minus Coma galaxies)1 22 18 3 43 25 (17)
1Corresponding to the default sample used in the analysis
2Excludes WIYN galaxies with insufficient spectral coverage to detect Hα
3WHT observed galaxies with adequate flux calibration

– 19 –
Fig. 1.— An investigation of the limitations of a joint radio and UV survey of star forming
galaxies. Circles illustrate the likely distribution of a UV-selected sample according to source
count and redshift data obtained for the mUV < 18.5 FOCA sample, a hypothetical L1.4 –Luv
correlation, observational errors and a randomly distributed extinction (see text for details).
Crosses show those UV sources that would be detected to the flux limit of the present VLA
survey. The dashed lines indicate the formal regions (above and to the right), in which
a galaxy at a particular redshift can be found based on the UV and radio survey limits.
Overplotted (solid diamonds) is the actual observational data.

– 20 –
Fig. 2.— The correlations between the different SF tracers. A)The correlation between
radio and Hα luminosities, B) between radio and UV luminosities. In both cases, the two
solid lines denote equality of SFRs for Z = 0.02 and τ = 100 Myr (UPPER LINE) and
Z = 0.004, tau = 10 Myr (LOWER LINE), indicating the range of uncertainties in the
luminosity-SFR conversion. Values are taken from Table 2. Both A and B show observed
values which have not been corrected for dust extinction. In both diagrams, the long-dashed
lines show the least-squares best-fit to the galaxies. The boxed galaxy in B indicates an
extremely red object compared to the other galaxies in the sample.

– 21 –
Fig. 3.— As Fig. 2, but with the Hα and UV luminosities corrected for dust as in S2000
(based on the Balmer decrement), and with error bars removed for clarity.

– 22 –
Fig. 4.— The ratio of Hα to Hβ as a function of SFR derived from dust corrected Hα
luminosities. The points are from the full spectroscopic sample of S2000, regardless of
whether they have a radio detection in this present survey. The solid line indicates the
weighted least-squares best fit to the dataset; the dashed line shows the relationship derived
by Hopkins et al. (2001) for an independent sample of galaxies. The error-bar in the top left
corner demonstrates the median errors in the two parameters correlated.

– 23 –
Fig. 5.— As Fig. 2, but with the Hα and UV luminosities corrected according to a luminosity
dependent extinction prescription, again with error bars removed for clarity.

– 24 –
Fig. 6.— The variation in the Hα/UV ratio with 1.4GHz luminosity for our sample galaxies.
OPEN SQUARES: galaxies with no extinction corrections applied, FILLED SQUARES: Ex-
tinction corrections from S2000, FILLED TRIANGLES: Corrections based on a luminosity-
dependent prescription, OPEN TRIANGLES: Extinctions with AV = 0.5, 1.0, 1.5 & 2.0. The
horizontal dashed lines show the range of values obtained by varying the IMF upper mass
cutoffs from 125M⊙ (top) to 50M⊙ (bottom). We also show predictions based on bursts of
SF superimposed on exponential SFHs. Here, the solid lines represent bursts of duration
110Myr (small loop) and 10Myr (large loop), mass 20% in both cases. The long dashed
lines represent bursts of mass 5% (small loop) and 35% (large loop), duration 30Myr in both
cases. The short dashed lines are areas at the start of the burst where galaxies would spend
an extremely small amount of time, they then move clockwise around the loops over time.

– 25 –
Table 2. Factors derived to convert diagnostic luminosities into SFRs for various
luminosities and timescales, in the sense SFR(M⊙ yr−1)=Luminosity/conversion factor.
Z Hα UV (erg s−1 A−1
) 1.4GHz (erg s−1)
(erg s−1) 10Myr 100Myr 1000Myr 10Myr 100Myr
0.0004 2.02e41 3.24e39 5.87e39 7.68e39 2.03e27 8.84e27
0.004 1.67e41 3.39e39 5.84e39 7.24e39 2.06e27 1.08e28
0.021 1.22e41 3.75e39 5.76e39 6.56e39 2.39e27 8.85e27
0.05 0.87e41 3.86e39 5.49e39 5.95e39 3.28e27 8.78e27
1Corresponding to solar metallicity and the default conversion factors used in the analysis
Table 3. The Diagnostic Correlations
Relation Dust Number of Correlation Spearman χ2 χ2 Slope
Correction Sources Coeff.1 Coeff.1 Probability2
Hα-radio None 17 0.908 0.873 38.9 0.0007 0.73 ± 0.07
UV-radio None 43 0.752 0.745 101.4 < 0.0001 0.58 ± 0.05
Hα-radio Balmer decrement 17 0.927 0.900 20.5 0.155 0.77 ± 0.06
UV-radio Balmer decrement 43 0.711 0.634 136.2 < 0.0001 0.53 ± 0.05
Hα-radio Lum-dependent 17 0.936 0.884 33.4 0.0024 0.93 ± 0.07
UV-radio Lum-dependent 43 0.865 0.877 84.1 < 0.0001 0.85 ± 0.05
1Where 1 equals a perfect positive correlation, 0 indicates no correlation
2Where smaller values indicate poorer fits