Spatiotemporal sequence of Himalayan debris flow from analysis of high-frequency seismic noise
Upload
independentCategory
view
4download
0
Spatiotemporal sequence of Himalayan debris flow
from analysis of high-frequency seismic noise
A. Burtin,1,2 L. Bollinger,2 R. Cattin,3 J. Vergne,4 and J. L. Nabelek5
Received 18 November 2008; revised 22 June 2009; accepted 10 July 2009; published 28 October 2009.
[1] During the 2003 summer monsoon, the Hi-CLIMB seismological stations deployedacross the Himalayan Range detected bursts of high-frequency seismic noise thatlasted several hours to days. On the basis of the cross correlation of seismic envelopesrecorded at 11 stations, we show that the largest transient event on 15 August was locatednearby a village partially destroyed on that day by a devastating debris flow. Thisconsistency in both space and time suggests that high-frequency seismic noise analysis canbe used to monitor debris flow generation as well as the evacuation of the sediment.A systematic study of one year of seismic noise, focusing on the detection of similarevents, provides information on the spatial and temporal occurrence of mass movements atthe front of the Himalayas. With a 50% probability of occurrence of a daily event, atotal of 46 debris flows are seismically detected. Most of them were generated in regionsof steep slopes, large gullies, and loose soils during the 2003 summer monsoon storms.These events are compared to local meteorological data to determine rainfall thresholdsfor slope failures, including the cumulative rainfall needed to bring the soil moisturecontent to failure capacity. The inferred thresholds are consistent with previous estimatesdeduced from soil studies as well as sediment supply investigations in the area. Theseresults point out the potential of using seismic noise as a dedicated tool for monitoring thespatiotemporal occurrence of landslides and debris flows on a regional scale.
Citation: Burtin, A., L. Bollinger, R. Cattin, J. Vergne, and J. L. Nabelek (2009), Spatiotemporal sequence of Himalayan debris flow
from analysis of high-frequency seismic noise, J. Geophys. Res., 114, F04009, doi:10.1029/2008JF001198.
1. Introduction
[2] Inventory maps of regional landslides and debrisflows are a primary source of knowledge of these cata-strophic phenomena. They enable us to investigate correla-tions between lithogeomorphological parameters and massmovements. However, these maps lack the time resolutionneeded to properly estimate event rates and denudationrates. This is principally due to an inadequate imagerydatabase [Brardinoni et al., 2003], possible repeated failuresof a given landslide scar or, even less known, the healing ofmass movements [e.g., Reid, 1998]. Although theory andexperiments help to describe the mechanisms and thehydrologic conditions of debris flows induced by landslides[e.g., Iverson and Reid, 1997], they need to be comparedwith actual observations. Most geotechnical investigations
are therefore complementary, usually constraining the timesequence of slope failure [e.g., Angeli et al., 2000; Malet etal., 2002]. These studies generally capture the principalphysical processes at work, and help to constrain the localmass movement hazard. As they are primarily carried out inregions most strongly affected by landslides, geotechnicalstudies make a highly selected data set for landslide hazardassessment. There is therefore a need to develop in thesehigh risk areas a systematic tool for monitoring the spatio-temporal structure of landsliding and debris flow at regionalscale. In this regard, various landslide monitoring systemsreviewed by Itakura et al. [2005] and Arattano and Marchi[2008] have been developed, including wire sensors, photo-cells, ultrasonic, infrasonic [Zhang et al., 2004], and groundvibration sensors such as geophones, accelerometers, andvelocimeters [e.g., Marchi et al., 2002]. The purpose of thisarticle is to further explore the potential of this last tech-nique, using a nondedicated temporary seismic network tomonitor the spatiotemporal structure of slope failure at aregional scale.[3] The Himalayas are one of the most landslide prone
regions of the world [e.g., Shroder, 1998], with hundreds oflandslides triggered per summer monsoon season. It isa place of great potential for the monitoring of massmovements. In Nepal, slope failures strongly impact theeconomy, regularly affect roads and bridges, and causemore than 200 deaths each year [Upreti and Dhital,1996]. Slope failures are also a dominant process of hill-
JOURNAL OF GEOPHYSICAL RESEARCH, VOL. 114, F04009, doi:10.1029/2008JF001198, 2009ClickHere
for
FullArticle
1Laboratoire de Geologie, Ecole Normale Superieure de Paris, CNRS,Paris, France.
2CEA, DAM, DIF, Arpajon, France.3GeosciencesMontpellier, Universite Montpellier 2, CNRS,Montpellier,
France.4Institut de Physique du Globe de Strasbourg, UMR 7516, CNRS-ULP,
Strasbourg, France.5College of Oceanic and Atmospheric Sciences, Oregon State
University, Corvallis, Oregon, USA.
Copyright 2009 by the American Geophysical Union.0148-0227/09/2008JF001198$09.00
F04009 1 of 15

slope denudation and a major source of sediment for rivers[e.g., Burbank et al., 1996; Attal and Lave, 2006]. Exceptfor a few systematic landslide inventories [e.g., Thouret,1983; Marston et al., 1998] and geotechnical investigationsof highly devastating events, most studies are confinedto regions along major roads [e.g., Dhital et al., 1991;
Hasegawa et al., 2008] or impacted populated areas [e.g.,Paul et al., 2000; Dhital, 2003; Adhikari and Koshimizu,2005].[4] Continuous monitoring by seismic networks in the
afflicted areas presents an opportunity to record landslide-related signals. In 2003, several stations of the Hi-CLIMBnetwork were deployed along the eastern bank of the TrisuliRiver (Figure 1). Ambient seismic noise analyses fromHi-CLIMB stations have already shown periodic features ofhigh-frequency seismic noise [Burtin et al., 2008]. Here, wefocus on large bursts of seismic energy recorded at severalstations along the profile. First, to validate our approach weuse spectral analysis and a location method using crosscorrelation of seismic envelopes to demonstrate that thelargest seismic event recorded on 15 August 2003 isassociated with a large mass movement, the Ramche DebrisFlow (named hereafter RDF). This debris flow claimed thelives of 45 people. We then extend the analysis over the2003 monsoon period to detect the largest mass movementsin the region. We investigate their distribution in time andspace, and further constrain the rainfall threshold for land-sliding in this area.
2. Data, Processing, and Regional Setting
[5] We analyze signals recorded by 11 seismologicalstations deployed during the Hi-CLIMB experiment(Table S1 of the auxiliary material), a passive seismic projectdedicated to imaging lithospheric structures in Nepal andsouthern Tibet [Hetenyi, 2007; Nabelek et al., 2009].1 Thestations cross the Nepalese Himalayas from the foothills to theHigh Range at 3-km spacing. Stations H0330 to H0420, usedfor the study, are located in the Lesser Himalayas series, andconsist of lower-grade metasediments [Shrestha et al., 1985].Farther north, stations H0440 and H0460 are on crystallinerock units of the higher Himalayas, which are mainly com-posed of gneisses and quartzites [Upreti, 1999]. Apart fromtechnical issues, these stations operated continuously duringthe 2003 monsoon season. A multitaper method [Thomson,1982; Percival and Walden, 1993] was used for spectralanalysis of the continuous seismic recordings. Choosing a5-min-long moving window with 50% overlap of the seismicrecords gives a good spectral resolution in the frequencyrange of interest (Figure 2).[6] During the 2003 monsoon season, the H0410 spec-
trogram shows an increase of high-frequency seismic noise(>1 Hz) which is accompanied by the occurrences of suddenbursts of seismic energy over the 2–22 Hz frequency band(Figure 2a). The bursts are characterized by an increase ofseismic energy that lasts less than a couple of hoursfollowed by a gentle decrease. The dissipation of the energycan sometimes last up to several days before it reaches theambient level prior to the burst event. These transient eventsof high-frequency seismic energy are well recorded onstations H0370 to H0410 but a single event is not alwaysobserved at every station. In a previous study [Burtin et al.,2008], we have shown that, along the Trisuli River, human-induced seismic noise is low. North of H0410, we have
Figure 1. (a) Topographic map with the Hi-CLIMBseismological network, the meteorological stations fromthe Department of Hydrology, and Meteorology of Nepalused in this study as well as main cities. MCT refers to MainCentral Thrust. (b) Slope map of the region with valuesgiven in degrees. (bottom right) Location of the study areain central Nepal (red mark in the global map).
1Auxiliary materials are available in the HTML. doi:10.1029/2008JF001198.
F04009 BURTIN ET AL.: SEISMIC NOISE OF HIMALAYAN DEBRIS FLOW
2 of 15
F04009

inferred a 24-h periodicity in the seismic noise which wasprimarily correlated with the river bed load transport, giventhe presence of a hysteresis curve between seismic noiselevel and water level. This conclusion has been recentlysupported by a study depicting a similar hysteresis curvebetween suspended sediment load and the water dischargein western Nepal [Gabet et al., 2008].[7] To highlight the nonperiodic transient events at
H0410, we calculate the mean seismic energy in the2–22 Hz frequency band. We then compare the averagenoise level with the rainfall observed along the Trisuli Riverat three meteorological stations from the Department ofHydrology and Meteorology (DHM) (Figure 2b andAppendix A). At the beginning of the rainy season (Julianday 164 to 181), the rise of seismic energy correlates withdaily precipitation values in time. During the month of July(Julian day 182 to 212), this pattern is reproduced and thefirst transient events are detected and coincide with dailyrainfall greater than 40 mm. Afterward, some discrepanciesbetween both data sets begin to appear. Although episodesof heavy rainfall, >50 mm/day, are generally associated withsharp transient increases of high-frequency seismic noise,some transients also are observed for precipitation of
15 mm/day. Finally, during the waning of the summermonsoon a lower envelope of high-frequency seismicenergy appears systematically larger than daily rainfall.This observation is consistent with ambient seismic noisegenerated by the Trisuli River due to the melting of snowand ice over the summer [Burtin et al., 2008], punctuated bypulses of seismic energy linked to intense rainfall.[8] At H0410, there were 46 bursts of high-frequency
seismic noise with highly variable amplitudes and durationsduring the summer of 2003. Among these high-frequencyseismic episodes, the strongest transient event observed atH0410 started on 15 August (Julian day 227). The eventshowed a peak amplitude equal to an increase of 15 dB thatlasted more than three days at this seismological station.According to the Kathmandu Post [2003] and local inha-bitants, a massive debris flow occurred on that day near thevillage of Ramche, close to H0390 (Figures 1 and 3). Thissuggests a correlation between the 15 August seismic eventand the RDF.
3. Ramche Debris Flow Analyses
[9] Despite all the information concerning the RDF thathas been collected from the inhabitants of Ramche and
Figure 2. (a) Spectrogram at H0410 of the vertical component during the 2003 monsoon season (fromJulian days 152 to 273 corresponding to 1 June 2003 to 30 September 2003). A multitaper method ontime series of 5-min-length with 50% overlap is used for the computation of the spectral energy. Theamplitude is given in decibel, red and blue colors stand for high and low energy, respectively.(b) Comparison of the 1-h smoothed mean seismic noise level (band 2–22 Hz) recorded at H0410 (blackline) with the maximum daily rainfall measured by the meteorological stations from the Department ofHydrology and Meteorology of Nepal (Figure 1). Precipitation is given in mm and seismic energy isscaled on the rainfall and corresponds to a variation of 30 dB.
F04009 BURTIN ET AL.: SEISMIC NOISE OF HIMALAYAN DEBRIS FLOW
3 of 15
F04009

newspapers, the initiation time of the slide is not welldocumented. We do know that destruction caused by thedebris flow occurred around 2000 LT. Among the availableHi-CLIMB stations, H0390 was located only 400 m awayfrom the RDF. Seismic data collected during this timeperiod show important complexities (Figure 4). The signalsrecorded at stations nearest the RDF reveal the existence ofat least three main peaks of amplitude, named hereafter P1,P2, and P3 for the first, second and third event, respec-tively. Each event lasts about 2 min and is separated fromthe others by about 25 min (Figure 4). Although we do nothave any clear evidence, we propose that one or all ofthese peaks represent the seismic signal from the observeddebris flow. To test this hypothesis, we attempt to seismi-cally locate these three events. We use all the Hi-CLIMBstations at a distance <26 km from the RDF all of whichclearly recorded the three events (Figure S1 of the auxiliarymaterial).
3.1. Transient Events Location: Example of the RDF
[10] To locate an event, we extract for each of 3 compo-nents of a station a 2- to 4-min-long recording (dependingon the complexity of the event) and roughly centered on thepeak of amplitude. These time series are then band-passfiltered between 0.6 and 0.9 Hz, and an energy envelope isproduced. At each station, the energy envelopes of the3 components are summed and normalized. An exampleof the energy envelopes for event P3 of RDF is shown inFigure 5a. The chosen frequency band is used to efficientlyisolate a seismic wave phase that can be coherentlyobserved at numerous stations. A station not showing aclearly characteristic envelope and event is discarded. Forexample, stations H0340 and H0390 are discarded for thelocation of events P1 and P2, respectively. For each stationcouple we use a cross-correlation technique to calculate thebest time delay between two energy envelopes. Thesedelays are then processed to calculate the likely locationof the event according to a probability density method.[11] Since we know the occurrence of the RDF from field
observations, we assume a location to produce a prioriprobability density that we define as
rmðx; yÞ ¼ e�ðx�x0 Þ
2þðy�y0Þ2
2s2prior
� �: ð1Þ
In this equation, x0 and y0 are the observed locationcoordinates of the RDF, x and y are the coordinates of a gridpoint and sprior is the error on the assumption, fixed at10 km. For each station delay couple, we calculate theprobability density that is described by this observation,using the following formulation:
rdðx; y;V Þ ¼XN�1i1¼1
XNi2¼i1þ1
e�
dti1 ;i2calc
�dti1 ;i2obsð Þ2
2sdt ðV Þ2
� �; ð2Þ
where i1 and i2 are the index number of stations, N is thenumber of available station time delay couples, and V is thevelocity of envelope propagation in a tabular medium ofconstant velocity. Since this velocity is unknown, we seekthe best solution for velocities ranging from 0.1 km/s to4 km/s. In equation (2), dtobs signifies the observed stationdelay while the calculated delay dtcalc is given as
dti1;i2calcðx; y;V Þ ¼
ffiffiffiffiffiffiffiffiffiffiffiffiffiffiffiffiffiffiffiffiffiffiffiffiffiffiffiffiffiffiffiffiffiffiffiffiffiffiffiffiffiffiffiðx� xi2Þ
2 þ ðy� yi1Þ2
q�
ffiffiffiffiffiffiffiffiffiffiffiffiffiffiffiffiffiffiffiffiffiffiffiffiffiffiffiffiffiffiffiffiffiffiffiffiffiffiffiffiffiffiffiðx� xi2Þ
2 þ ðy� yi1Þ2
qV
:
To apply a constant spatial uncertainty despite differentenvelope velocities, we define in equation (2) the time errorsdt(V), a function of the velocity such that sdt � V = d0,where d0 is fixed at 1 km.[12] The final probability density is given by the relation
rfinalðx; y;V Þ ¼ rmðx; yÞ � rdðx; y;V Þ: ð3Þ
The best coherent localization and seismic wave propaga-tion velocity are thus indicated by the maximum of thestacked envelope amplitudes. The results for the threeevents of RDF are shown in Figure 5.
Figure 3. (a) Photograph of the Ramche Debris Flow(RDF) taken a few days after the event showing itsdeposition zone in the Ramche village. We estimate aminimum volume for the debris flow of 1.5�104 m3 sincea certain amount of debris reached the Trisuli River.(b) Digital Globe Quickbird image of the RDF acquired on28 November 2004, 15 months after the debris flow.
F04009 BURTIN ET AL.: SEISMIC NOISE OF HIMALAYAN DEBRIS FLOW
4 of 15
F04009
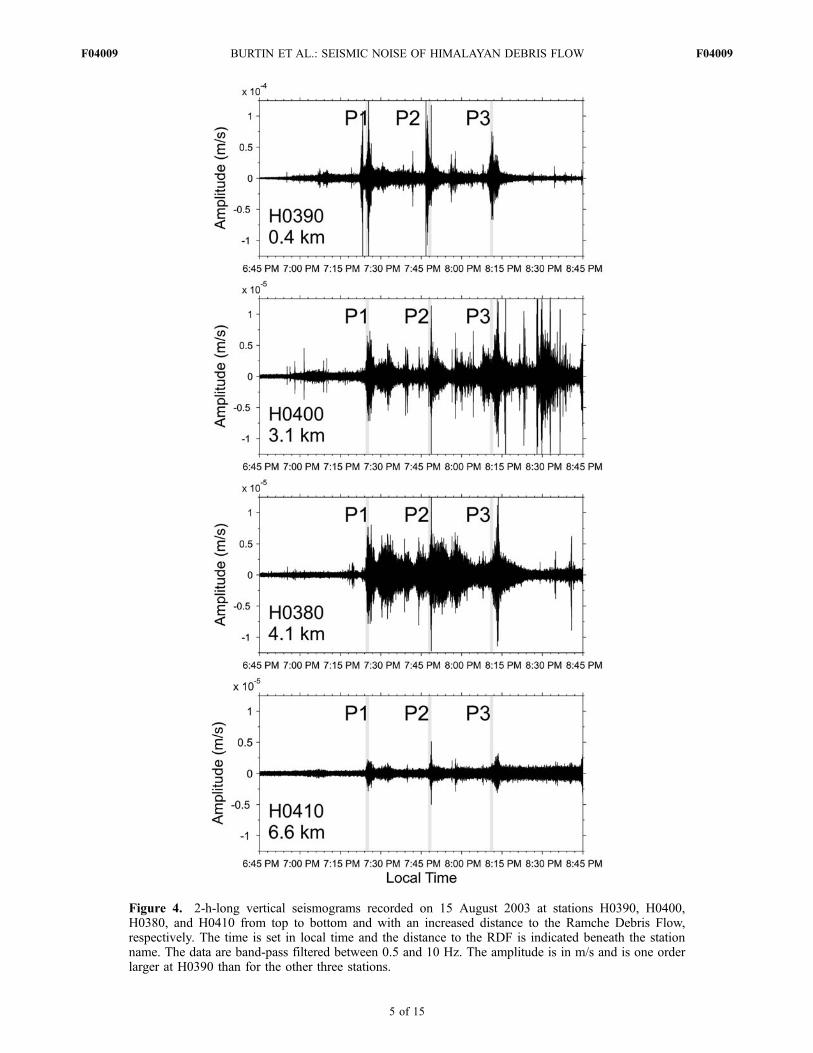
Figure 4. 2-h-long vertical seismograms recorded on 15 August 2003 at stations H0390, H0400,H0380, and H0410 from top to bottom and with an increased distance to the Ramche Debris Flow,respectively. The time is set in local time and the distance to the RDF is indicated beneath the stationname. The data are band-pass filtered between 0.5 and 10 Hz. The amplitude is in m/s and is one orderlarger at H0390 than for the other three stations.
F04009 BURTIN ET AL.: SEISMIC NOISE OF HIMALAYAN DEBRIS FLOW
5 of 15
F04009
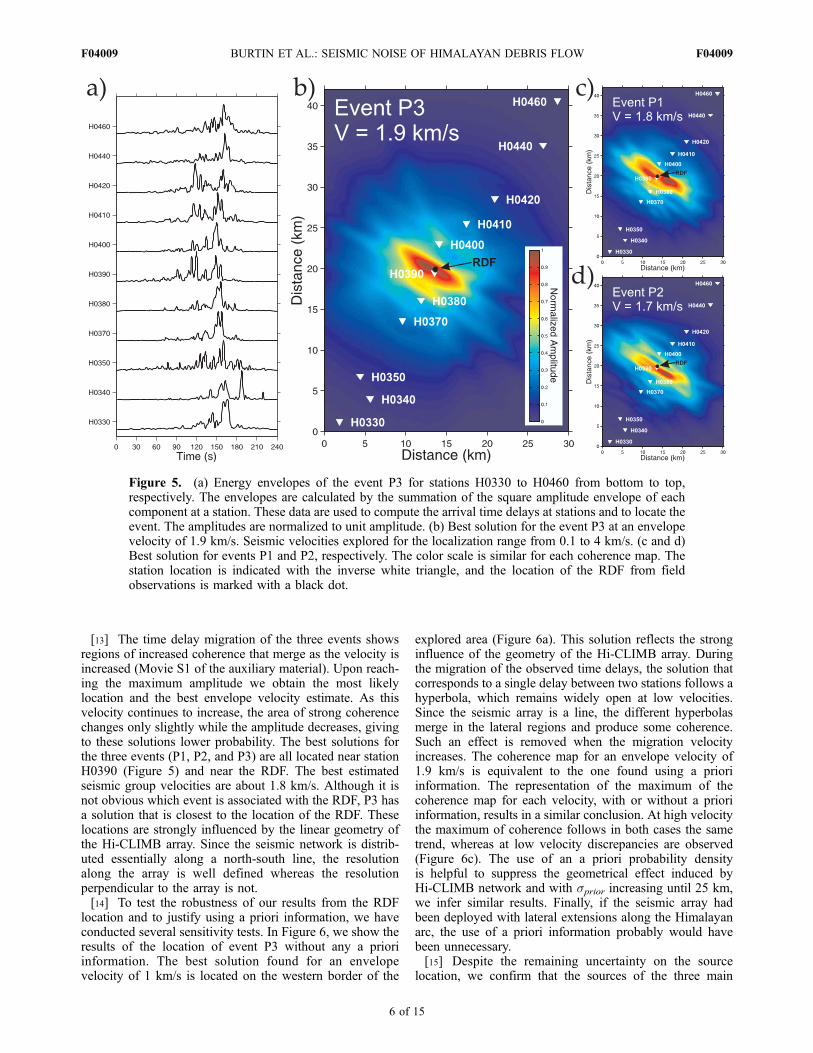
[13] The time delay migration of the three events showsregions of increased coherence that merge as the velocity isincreased (Movie S1 of the auxiliary material). Upon reach-ing the maximum amplitude we obtain the most likelylocation and the best envelope velocity estimate. As thisvelocity continues to increase, the area of strong coherencechanges only slightly while the amplitude decreases, givingto these solutions lower probability. The best solutions forthe three events (P1, P2, and P3) are all located near stationH0390 (Figure 5) and near the RDF. The best estimatedseismic group velocities are about 1.8 km/s. Although it isnot obvious which event is associated with the RDF, P3 hasa solution that is closest to the location of the RDF. Theselocations are strongly influenced by the linear geometry ofthe Hi-CLIMB array. Since the seismic network is distrib-uted essentially along a north-south line, the resolutionalong the array is well defined whereas the resolutionperpendicular to the array is not.[14] To test the robustness of our results from the RDF
location and to justify using a priori information, we haveconducted several sensitivity tests. In Figure 6, we show theresults of the location of event P3 without any a prioriinformation. The best solution found for an envelopevelocity of 1 km/s is located on the western border of the
explored area (Figure 6a). This solution reflects the stronginfluence of the geometry of the Hi-CLIMB array. Duringthe migration of the observed time delays, the solution thatcorresponds to a single delay between two stations follows ahyperbola, which remains widely open at low velocities.Since the seismic array is a line, the different hyperbolasmerge in the lateral regions and produce some coherence.Such an effect is removed when the migration velocityincreases. The coherence map for an envelope velocity of1.9 km/s is equivalent to the one found using a prioriinformation. The representation of the maximum of thecoherence map for each velocity, with or without a prioriinformation, results in a similar conclusion. At high velocitythe maximum of coherence follows in both cases the sametrend, whereas at low velocity discrepancies are observed(Figure 6c). The use of an a priori probability densityis helpful to suppress the geometrical effect induced byHi-CLIMB network and with sprior increasing until 25 km,we infer similar results. Finally, if the seismic array hadbeen deployed with lateral extensions along the Himalayanarc, the use of a priori information probably would havebeen unnecessary.[15] Despite the remaining uncertainty on the source
location, we confirm that the sources of the three main
Figure 5. (a) Energy envelopes of the event P3 for stations H0330 to H0460 from bottom to top,respectively. The envelopes are calculated by the summation of the square amplitude envelope of eachcomponent at a station. These data are used to compute the arrival time delays at stations and to locate theevent. The amplitudes are normalized to unit amplitude. (b) Best solution for the event P3 at an envelopevelocity of 1.9 km/s. Seismic velocities explored for the localization range from 0.1 to 4 km/s. (c and d)Best solution for events P1 and P2, respectively. The color scale is similar for each coherence map. Thestation location is indicated with the inverse white triangle, and the location of the RDF from fieldobservations is marked with a black dot.
F04009 BURTIN ET AL.: SEISMIC NOISE OF HIMALAYAN DEBRIS FLOW
6 of 15
F04009

Figure 6
F04009 BURTIN ET AL.: SEISMIC NOISE OF HIMALAYAN DEBRIS FLOW
7 of 15
F04009

peaks of energy are within the gullies that were affected bythe RDF (Figure 3). Our result also illustrates the potentialof using seismic signals for estimating the location of rapidmass movements.
3.2. Further Analyses of the High-Frequency SeismicNoise Generated by the RDF
[16] The seismic noise level associated with the RDF waswell above its mean monsoon level over the entire high-frequency band during the energy burst generated between1800 and 2000 LT (Figure 7). This burst was related to thethree main events presented above (referred as P1, P2 andP3). Following these events and up to one day later, theambient seismic noise at high frequencies remained largerthan prior to the debris flow. H0390 exhibited a noise level10 dB and 5 dB greater than the initial level 5 and 20 h later,respectively. Furthermore, the higher frequencies involvedin the energy burst took longer time to return to their formerlevel than the lower frequencies (Figure 7b). The seismicnoise spectrum, almost flat in the 2–22 Hz band during theRDF, depicted more high frequencies in the followinghours.[17] The same analysis conducted on H0410 also reveals
a large increase of the high-frequency seismic noise levelwith a significantly different time history compared toH0390 (Figure 8). Although, P1, P2 and P3 are clearlyidentified at H0410 (Figure 4), the main peak of energy atthis station occurs 2 h later. The spectral characteristics ofthis event are similar to those of the one at H0390 andtherefore may indicate a similar source mechanism, sug-gesting another debris flow may have been triggered nearH0410 on the same night. In addition, two other bursts ofhigh-frequency seismic noise are identified two days afterthe RDF (Figure 8b). Such events of long duration high-frequency seismic noise are occasionally detected fromstations H0370 and H0400. Nearby gullies with landslidescars are clearly visible on ASTER satellite imagery acquiredin the region after the 2003 monsoon (Figure 9). Were thesegullies all activated during the 2003 monsoon season? Didthey produce rapid landslides and debris flows? To answer,we systematically applied the methodology described in theRDF study to all other energy bursts of similar characteristicsrecorded by the array in this region.
4. Debris Flow Data Set
[18] Our analysis identifies 46 distinct large events alongthe seismic network, from stations H0370 to H0410, andbetween June and September 2003.
4.1. Spatial Pattern
[19] All sources of the detected transient events appear tocoincide with zones densely affected by landslide scars and
debris flow gullies visible in Figure 9, between H0370 andH0410. This area corresponds to a region of steep slopes atthe front of the Himalayan High Range, within the LesserHimalayan series. Further north, within the High HimalayanCrystalline series, the slope distribution remains similar(Figure 1b). However, no transient event equivalent to thesebursts of high-frequency seismic noise occurred during2003. These results confirm the observations made in thesame region by Thouret [1983] and Marston et al. [1998]showing that the number of slope failures is greater belowthe Main Central Thrust in the Lesser Himalayas thanabove. This behavior might be controlled by lithology,regolith characteristics (controlled, in general, by altitudeand vegetation) and/or rain shadow.[20] Although stations between H0330 and H0350 clearly
recorded the RDF events (in the 0.6–0.9 Hz frequencyband) and in spite of their low ambient seismic noise level(–148 dB in the 2–22 Hz band and only moderate anthro-pogenic perturbations) these stations did not detect any localtransient events south of H0370. Between H0420 andH0460, the mean seismic noise level of �143 dB is largerthan at H0410 with a level of �153 dB but this should notprevent us from detecting RDF-type events since the peakof energy from RDF at 8 km is equal to �140 dB. Thus,with a mean interstation distance of 5 km, we should be ableto detect such events at one or more seismic stations.
4.2. Time Structure of the Mass Movement andRainfall Thresholds
[21] Thouret [1983] worked during two monsoon seasonsalong the Ankhu Khola, in a valley parallel to and encom-passing the same lithogeomorphological features as theTrisuli River instrumented here (Figure 1). He noticed thatmost mass movements coincide with the recrudescent spellsof monsoon rainfall. He further observed that, despite theirlarge volumes, sometimes as large as monsoon storms, thepremonsoon rainfall events were not triggering mass move-ments. He attributed this fact to a threshold of plasticity andthen liquidity of the soils, illustrating this hypothesis withseveral measurements for the degree of moisture of the soilsthrough the rainy season. The soils he collected at severalplaces encompass large moisture variations during themonsoon period, and require variable times to reach thefailure threshold. These observations are well comple-mented by a sediment load study in a small river catchmentlocated at the front of the western Nepal High Himalayas[Gabet et al., 2004]. Their observations demonstrate thattwo different rainfall thresholds, a seasonal accumulationand a daily total, must be overcome before landslides can beinitiated.[22] Despite a limited number of transient events in our
catalogue, 46 over one year, some characteristics of theirtime structure and soil conditions might be drawn and
Figure 6. (a) Best solution for the migration of the time delays from the event P3 with no a priori information. The bestenvelope velocity is found at 1 km/s, and the location of the event is on the western limit of the researched area. (b) Solutionfound for a migration velocity of 1.9 km/s and no a priori information. The coherence map is similar to the one found withthe introduction of a priori information (Figure 5b). (c) Amplitude of the maximum of coherence for each migrationvelocity with no a priori information (gray curve) and with a priori information (black curve). The amplitude of the lattercurve has been normalized to the value obtained for a velocity of 1.9 km/s in the case of no a priori information. Thesimilarity between the curves is significant when the velocity increases and clearly reveals a geometrical effect of the arrayat low velocities.
F04009 BURTIN ET AL.: SEISMIC NOISE OF HIMALAYAN DEBRIS FLOW
8 of 15
F04009

Figure 7. (a) Vertical seismogram recorded at H0390. The seismic signal is band-pass filtered between0.1 and 20 Hz. The recording starts at 1400 LT on the 15 August 2003. (b) Spectrogram calculated fromthe vertical seismic recording at H0390 using a multitaper method with 50% overlap between timesegments of 5 min. Amplitudes are given in decibels (dB); red and blue colors stand for high and lowamplitudes, respectively. (c) The 1-h smoothed mean high-frequency seismic energy at H0390 for thevertical component (Figure 7b) in the 2–22 Hz frequency band. Amplitudes are given in dB.
F04009 BURTIN ET AL.: SEISMIC NOISE OF HIMALAYAN DEBRIS FLOW
9 of 15
F04009

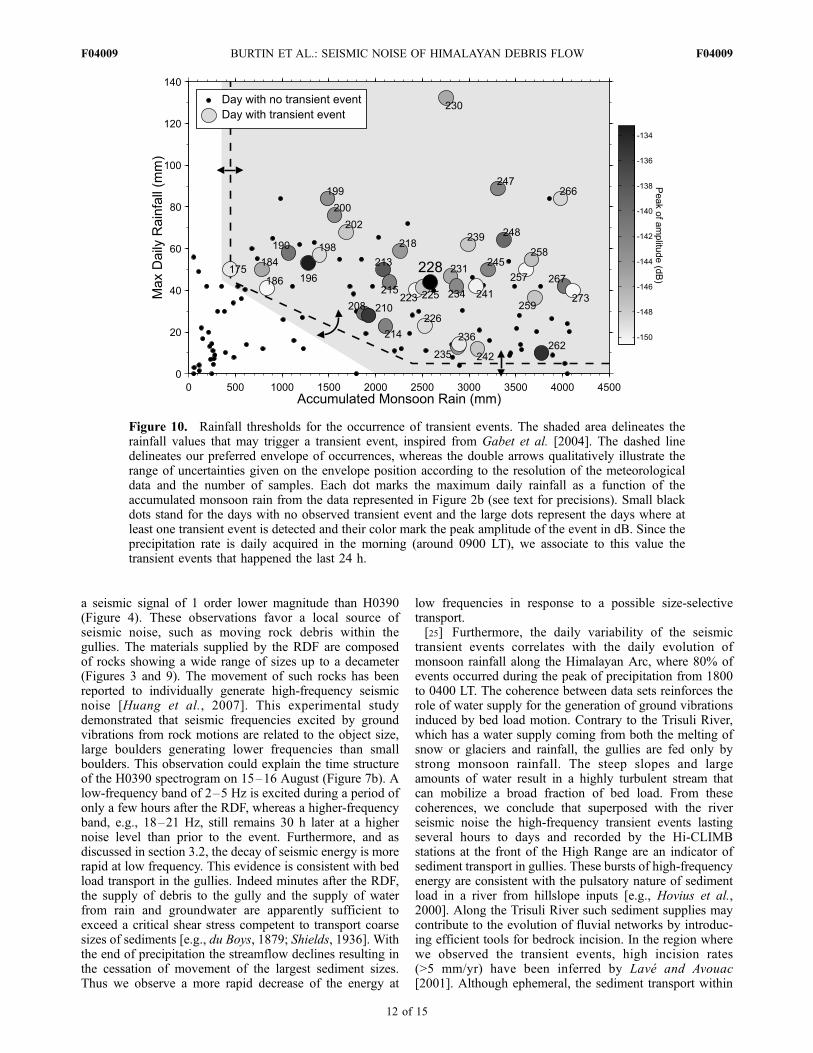
compared to those previous studies. First, most of the eventsoccurred in the late evening or during the night, with 80%of the events detected between 1800 and 0400 LT and onlytwo events between 0400 and 1200 LT (Table 1). Thispattern is consistent with the mean diurnal cycle of rainfallobserved for low and intermediate altitude stations at thefront of the High Range [Barros et al., 2000; Ueno et al.,2001; Bollasina et al., 2002] (Figure S2 of the auxiliarymaterial). Second, all the events detected in 2003 happenedduring the summer monsoon season, between 23 June 2003and 29 September 2003. Finally, the daily rainfall catalogueprovided by the Department of Hydrology and Meteorology(DHM), Nepal at several meteorological stations along theseismic network allows us to estimate rainfall thresholds fordebris flow triggering. Applying the same methodology asin the work of Gabet et al. [2004], Figure 10 shows theconditions under which events were detected at stationH0410. We choose this station because it offers the bestcontinuous data acquisition during the monsoon. It appearsthat the first transient event of seismic noise is observedafter a rainfall accumulation of 450 mm while no event isdetected during the monsoon onset. Afterward, a dailyprecipitation of about 10 mm seems to be required fortriggering an event. The probability of occurrence of oneevent per day is as large as 50% and does not vary
throughout the monsoon season (Figure 11). Our accumu-lated rainfall threshold is significantly different from the oneobserved in the Annapurna region (860 mm). However, thisdifference might be induced by several factors. First, in bothstudies, the origin time of the monsoon rainfall is arbitrary.Second, according to Gabet et al. [2004], this threshold isgoverned by regolith thickness and porosity, which mightdiffer significantly between the two settings. A secondthreshold of about 10 mm, the amount of daily rainfallnecessary to observe a debris flow after the accumulationthreshold has been reached, is similar to the 11 mmestimated by Gabet et al. [2004]. This second threshold ispoorly resolved by our observations since the meteorolog-ical data are sparse and show large spatial discrepancies. Aminimum of accumulated rainfall is necessary to reach soilfailure, whereas steep slopes and numerous rainstorms leadto hydrologic conditions that are probably beyond the dailythreshold during monsoons (Figure 11). Therefore, anteced-ent rainfall seems to have a dominant role in triggeringslope failures in the Himalayas of Nepal [Dahal andHasegawa, 2008].
4.3. Threshold for Transient Event Detection
[23] The occurrence of transient events is correlated withthe daily fluctuation of the seismic noise generated by the
Figure 8. (a) Vertical seismogram recorded at H0410. The seismic signal is band-pass filtered between0.1 and 20 Hz. The beginning of the recording starts at 1400 LT on the 15 August 2003. (b) Comparisonof the 1-h smoothed mean high-frequency seismic energy in the 2–22 Hz frequency band at H0390(gray) and H0410 (black) for the vertical component. Amplitudes are given in dB.
F04009 BURTIN ET AL.: SEISMIC NOISE OF HIMALAYAN DEBRIS FLOW
10 of 15
F04009

Trisuli River [Burtin et al., 2008]. Part of this seismicenergy is produced by ground vibrations from bed loadtransport during increased river discharge. This increase inambient seismic noise may thus prevent detection of smalllandslide events at night since the river reaches its maximumdaily discharge and transport capacity over the monsoonseason between 2000 and 0200 LT, inducing a maximumdaily seismic noise level during this time window [Burtin etal., 2008]. To investigate a possible link between the rainfalland the detection of bursts of high-frequency seismic noise,we determined the cumulative number of transient events asa function of their peak amplitude (Figure 12a). We fit thedata to a relation for the magnitude-frequency distributionof transient events at H0410, where the number of eventsabove a given magnitude is approximately linear. Never-theless, this linear trend fails to explain the observednumber of smaller events. From this analysis, we estimatea seismic noise threshold for the unbiased detection of atransient event to be at �143 dB. Then we recalculate thedaily fluctuation for the occurrence of events using thisthreshold (Figure 12b). The correlation between precipita-
tion and transient event occurrences is reproduced, implyinga robust link between the two phenomena.
5. Generation of High-Frequency Seismic Noiseand Debris Flow Implications
[24] During the RDF, a broad range of high frequencies(from 2 to 22 Hz) was excited at H0390 (Figure 7).Unfortunately, this frequency band corresponds to the bandsometimes excited by bed load transport in the Trisuli River[Burtin et al., 2008]. The seismic energy radiated during theRDF could either be produced by gullies activated by theRDF or mass wasting in the river. Uncertainties onthe seismic location of the RDF do not enable us todiscriminate between these scenarios. However, relative tonearby stations, the very high seismic noise level of�110 dBfor the peak amplitude related to the event at H0390(Figures 4 and 8) suggests that the origin of the seismicnoise is in the near field of the station (few hundreds ofmeters). In addition, H0380 downstream the Trisuli Riverand at a shorter distance from the stream (Figure 1) records
Figure 9. (a) Photograph of the gullies affected by the RDF which are close to station H0390.(b) ASTER color composition (RGB band L3B/2/1) of a scene acquired on 30 March 2001 correspondingto the highest landslide density area. The yellow zones mark the presence of important gully structuresand landslide scars. At the front of the High Range, the Hi-CLIMB stations (orange dots) are located inthe vicinity of these critical hillslopes. The green rectangle shows the region affected by the RDF.
Table 1. Occurrence Number of Transient Events as a Function of the Hour of the Day
Time Occurrence of Transient Event
Hour Gap 0–2 2–4 4–6 6–8 8–10 10–12 12–14 14–16 16–18 18–20 20–22 22–24Occurrences 9 6 1 1 0 0 0 5 2 2 10 10
F04009 BURTIN ET AL.: SEISMIC NOISE OF HIMALAYAN DEBRIS FLOW
11 of 15
F04009
a seismic signal of 1 order lower magnitude than H0390(Figure 4). These observations favor a local source ofseismic noise, such as moving rock debris within thegullies. The materials supplied by the RDF are composedof rocks showing a wide range of sizes up to a decameter(Figures 3 and 9). The movement of such rocks has beenreported to individually generate high-frequency seismicnoise [Huang et al., 2007]. This experimental studydemonstrated that seismic frequencies excited by groundvibrations from rock motions are related to the object size,large boulders generating lower frequencies than smallboulders. This observation could explain the time structureof the H0390 spectrogram on 15–16 August (Figure 7b). Alow-frequency band of 2–5 Hz is excited during a period ofonly a few hours after the RDF, whereas a higher-frequencyband, e.g., 18–21 Hz, still remains 30 h later at a highernoise level than prior to the event. Furthermore, and asdiscussed in section 3.2, the decay of seismic energy is morerapid at low frequency. This evidence is consistent with bedload transport in the gullies. Indeed minutes after the RDF,the supply of debris to the gully and the supply of waterfrom rain and groundwater are apparently sufficient toexceed a critical shear stress competent to transport coarsesizes of sediments [e.g., du Boys, 1879; Shields, 1936]. Withthe end of precipitation the streamflow declines resulting inthe cessation of movement of the largest sediment sizes.Thus we observe a more rapid decrease of the energy at
low frequencies in response to a possible size-selectivetransport.[25] Furthermore, the daily variability of the seismic
transient events correlates with the daily evolution ofmonsoon rainfall along the Himalayan Arc, where 80% ofevents occurred during the peak of precipitation from 1800to 0400 LT. The coherence between data sets reinforces therole of water supply for the generation of ground vibrationsinduced by bed load motion. Contrary to the Trisuli River,which has a water supply coming from both the melting ofsnow or glaciers and rainfall, the gullies are fed only bystrong monsoon rainfall. The steep slopes and largeamounts of water result in a highly turbulent stream thatcan mobilize a broad fraction of bed load. From thesecoherences, we conclude that superposed with the riverseismic noise the high-frequency transient events lastingseveral hours to days and recorded by the Hi-CLIMBstations at the front of the High Range are an indicator ofsediment transport in gullies. These bursts of high-frequencyenergy are consistent with the pulsatory nature of sedimentload in a river from hillslope inputs [e.g., Hovius et al.,2000]. Along the Trisuli River such sediment supplies maycontribute to the evolution of fluvial networks by introduc-ing efficient tools for bedrock incision. In the region wherewe observed the transient events, high incision rates(>5 mm/yr) have been inferred by Lave and Avouac[2001]. Although ephemeral, the sediment transport within
Figure 10. Rainfall thresholds for the occurrence of transient events. The shaded area delineates therainfall values that may trigger a transient event, inspired from Gabet et al. [2004]. The dashed linedelineates our preferred envelope of occurrences, whereas the double arrows qualitatively illustrate therange of uncertainties given on the envelope position according to the resolution of the meteorologicaldata and the number of samples. Each dot marks the maximum daily rainfall as a function of theaccumulated monsoon rain from the data represented in Figure 2b (see text for precisions). Small blackdots stand for the days with no observed transient event and the large dots represent the days where atleast one transient event is detected and their color mark the peak amplitude of the event in dB. Since theprecipitation rate is daily acquired in the morning (around 0900 LT), we associate to this value thetransient events that happened the last 24 h.
F04009 BURTIN ET AL.: SEISMIC NOISE OF HIMALAYAN DEBRIS FLOW
12 of 15
F04009

gullies may be responsible for intensive stream incision andtoe erosion of banks. These processes, which alter thestability of slopes, may trigger debris avalanches that arechannelized into gullies to form debris flows. Such succes-sive events are generally called complex slides [Varnes,1978] and have been reported along the Himalayan Arc[Thouret, 1983; Paul et al., 2000]. Another risk associatedwith bed load transport in gullies is the formation of naturaldams that may evolve into debris flows after their rupture.Hypothetically, such sequences of events may have resultedin the initiation of the Ramche Debris Flow and may havecaused the three main peaks of energy we coherentlyobserved on many seismic recordings (referred as P1, P2,and P3; Figure 4).
6. Conclusions
[26] The spectral analysis of the continuous seismicsignals from the Hi-CLIMB stations located at the front ofthe Himalayan arc shows the occurrences of transient eventsof high-frequency seismic noise during the 2003 monsoonseason. Some of these events were recorded by as many as14 seismic stations over distances of 35 km. Their pulsatorynature lasts several hours to a few days before a totaldissipation of seismic energy and a return back to a regularlevel of seismic noise. The transients of seismic energy over
the 2–22 Hz frequency band are commonly observed in theevening and at night, a temporal feature notably associatedwith Himalayan rainfall during the monsoon season. Thefrequency characteristics observed at seismic stations in thevicinity of large landslide scars and gullies lead us toassociate these transient seismic events with debris flowsand intense bed load transport in the gullies. The amount ofprecipitation at the front of the High Range brings enoughrunoff to create hydrodynamics conditions sufficient totransport a wide range size of materials. This sediment isthen transmitted to major river systems and could explainthe pulses of suspended sediment load inferred in Nepal tobe associated with mass movement activity.[27] The complexity of the RDF slope failure is clearly
seen with a detailed analysis of the seismic signals, whichshows the occurrence of three major debris flows within 1 h.Their relocation using a seismic-based method revealsconsistent results since they are all localized along thegullies close to H0390. However, it is difficult to concludeif the three peaks are all connected to the RDF or if some aredue to other debris flow occurring along these gullies. Inspite of a suboptimal array geometry for detecting thelocation of mass movements, our analysis shows the poten-tial to monitor the occurrences of mass movements in spaceand time. Geotechnical studies coupled with detailedspectral analyses of the high-frequency seismic noise may
Figure 11. Cumulative number of transient events detected at H0410 (black dots) and cumulativemonsoon rain (grey dashed curve) during the 2003 monsoon season. The first observed transient eventseems to coincide with a slope break in the accumulated monsoon rainfall (increased daily rainfall). Afterthis first transient event, their triggering follows a linear trend with a probability of occurrence of oneevent per day of 50%. The constancy of this rate during the monsoon period is coherent with the action ofthe accumulated monsoon rain threshold.
F04009 BURTIN ET AL.: SEISMIC NOISE OF HIMALAYAN DEBRIS FLOW
13 of 15
F04009

help to interpret the dynamics of the often complex slideevents recorded in regions of steep slopes. The use ofdedicated seismic networks may be an important tool fordeveloping detection systems and to alert rescue missions.Furthermore, the continuous recording of transient eventsthat may indicate a debris flow is an interesting applicationfor risk assessments. Constraining these parameters andphenomena will help to improve our knowledge of thetemporal occurrence and time structure of debris flows.[28] Finally, the present study reveals the significant role
played by gully structures as major sources of bed loadtransport when transients of high-frequency seismic noiseare observed. Like major landslides, these events areimportant agents of hillslope denudation and should beconsidered as many sediment inputs in river systems. Futurework coupling actual sediment flux measurements andseismic monitoring of debris flows could allow the emer-gence of a relation between the magnitude of seismicsignals and eroded volumes from debris flows. Thisapproach would lead to seismically measure denudationrates and their short-term variabilities.
Appendix A: Meteorological Data
[29] Here we use the rainfall measurements from threemeteorological stations. These stations, operated by theDepartment of Hydrology and Meteorology of Nepal, areall located along the Trisuli valley, in the frontal part theHimalayas (Figure 1). The recorded daily rainfall exhibits
large variability. The data set shows days with no reportedrainfall at a station when both others record precipitationvalues over 50 mm (Figure S3 of the auxiliary material).Such variability cannot only be explained by a gradient ofprecipitation due to the high topography. Generally, ridgeshave rainfall 10 to 20% greater than the nearby valleys[Craddock et al., 2007]. The high variations may suggestdifficulties in data collection, especially during strongrainfall. Following such an argument, days with regularprecipitation are expected to have a small variabilitywhereas days with large rainfall are likely to be under-estimated. To overcome this bias, we have retained only themaximum value of the daily precipitation reported by thethree stations.
[30] Acknowledgments. The authors would like to thank the entireHi-CLIMB team for the fieldwork and data acquisition, in particularS. Sapkota and his colleagues from the Department of Mines and Geologyof Nepal. We are grateful to the Department of Hydrology and Meteorologyof Nepal for providing the meteorological data. We thank B. McArdell,E. Gabet, and two anonymous reviewers for their valuable comments andsuggestions on the manuscript. Project Hi-CLIMB is supported by the U.S.NSF Continental Dynamics Program, EAR 9909609.
ReferencesAdhikari, D. P., and S. Koshimizu (2005), Debris flow disaster at Larcha,upper Bhotekoshi Valley, central Nepal, Island Arc, 14(4), 410–423,doi:10.1111/j.1440-1738.2005.00495.x.
Angeli, M. G., A. Pasuto, and S. Silvano (2000), A critical review oflandslide monitoring experiences, Bull. Assoc. Eng. Geol., 55(3), 133–147, doi:10.1016/S0013-7952(99)00122-2.
Figure 12. (a) Cumulative number of event as a function of their peak of amplitude. (b) Comparisonbetween the temporal feature of monsoon rainfall from Ueno et al. [2001] and the number of transientevents during the day, detected above a noise threshold of �143 dB determined in Figure 12a.
F04009 BURTIN ET AL.: SEISMIC NOISE OF HIMALAYAN DEBRIS FLOW
14 of 15
F04009

Arattano, M., and L. Marchi (2008), Systems and sensors for debris-flowmonitoring and warning, Sensors, 8, 2436–2452.
Attal, M., and J. Lave (2006), Changes of bedload characteristics along theMarsyandi River (central Nepal): Implications for understanding hillslopesediment supply, sediment load evolution along fluvial networks, anddenudation in active orogenic belts, edited by S. D. Willett et al., Spec.Pap. Geol. Soc. Am., 398, 143–171, doi:10.1130/2006.2398(09).
Barros, A. P., M. Joshi, J. Putkonen, and D. W. Burbank (2000), A study ofthe 1999 monsoon rainfall in a mountainous region in central Nepal usingTRMM products and rain gauge observations, Geophys. Res. Lett.,27(22), 3683–3686.
Bollasina, M., L. Bertolani, and G. Tartari (2002), Meteorologicalobservations at high altitude in the Khumbu Valley, Nepal Himalayas,1994–1999, Bull. Glaciol. Res., 19, 1–11.
Brardinoni, F., O. Slaymaker, and M. A. Hassan (2003), Landslide inven-tory in a rugged forested watershed: A comparison between air-photo andfield survey data, Geomorphology, 54(3–4), 179–196, doi:10.1016/S0169-555X(02)00355-0.
Burbank, D. W., J. Leland, E. Fielding, R. S. Anderson, N. Brozovic, M. R.Reid, and C. Duncan (1996), Bedrock incision, rock uplift and thresholdhillslopes in the northwestern Himalayas, Nature, 379, 505 – 510,doi:10.1038/379505a0.
Burtin, A., L. Bollinger, J. Vergne, R. Cattin, and J. L. Nabelek (2008),Spectral analysis of seismic noise induced by rivers: A new tool tomonitor spatiotemporal changes in stream hydrodynamics, J. Geophys.Res., 113, B05301, doi:10.1029/2007JB005034.
Craddock, W. H., D. W. Burbank, B. Bookhagen, and E. J. Gabet (2007),Bedrock channel geometry along an orographic rainfall gradient in theupper Marsyandi River valley in central Nepal, J. Geophys. Res., 112,F03007, doi:10.1029/2006JF000589.
Dahal, R. K., and S. Hasegawa (2008), Representative rainfall thresholdsfor landslides in the Nepal Himalaya, Geomorphology, 100(3–4), 429–443, doi:10.1016/j.geomorph.2008.01.014.
Dhital, M. R. (2003), Causes and consequences of the 1993 debris flowsand landslides in the Kulekhani watershed, central Nepal, in Debris-FlowHazards Mitigation: Mechanics, Prediction and Assessment, pp. 931–942, Rotterdam Millpress, Davos, Switzerland.
Dhital, M. R., B. N. Upreti, V. Dangol, A. N. Bhandari, and A. Bhattarai(1991), Engineering geological methods applied in mountain roadsurvey: An example from Baitadi-Darchula road project (Nepal), J. NepalGeol. Soc., 7, 49–67.
du Boys, M. P. (1879), Etude du regime du Rhone et de l’action exercee parles eaux sur un lit a fond de graviers indefiniment affouillable, Ann. PontsChaussees, 18(5), 141–195.
Gabet, E. J., D. W. Burbank, J. K. Putkonen, B. A. Pratt-Sitaula, andT. Ojhac (2004), Rainfall thresholds for landsliding in the Himalayas ofNepal, Geomorphology, 63(3 –4), 131–143, doi:10.1016/j.geomorph.2004.03.011.
Gabet, E. J., D. W. Burbank, B. Pratt-Sitaula, J. Putkonen, and B. Bookhagen(2008), Modern erosion rates in the High Himalayas of Nepal, EarthPlanet. Sci. Lett., 267(3–4), 482–494, doi:10.1016/j.epsl.2007.11.059.
Hasegawa, S., R. K. Dahal, M. Yamanaka, N. P. Bhandary, R. Yatabe, andH. Inagaki (2008), Causes of large-scale landslides in the LesserHimalaya of central Nepal, Environ. Geol., 57, 1423 – 1434,doi:10.1007/s00254-008-1420-z.
Hetenyi, G. (2007), Evolution of deformation of the Himalayan prism:From imaging to modelling, Ph.D. thesis, Univ. Paris-Sud XI, 400 pp.
Hovius, N., C. P. Stark, C. Hao-Tsu, and L. Jiun-Chuan (2000), Supply andremoval of sediment in a landslide-dominated mountain belt: CentralRange, Taiwan, J. Geol., 108(1), 73–89, doi:10.1086/314387.
Huang, C.-J., H.-Y. Yin, C.-Y. Chen, C.-H. Yeh, and C.-L. Wang (2007),Ground vibrations produced by rockmotions and debris flows, J. Geophys.Res., 112, F02014, doi:10.1029/2005JF000437.
Itakura, Y., H. Inaba, and T. Sawada (2005), A debris-flow monitoringdevices and methods bibliography, Nat. Hazards Earth Syst. Sci., 5(6),971–977.
Iverson, R. M., M. E. Reid, and L. R. G. (1997), Debris flow mobilizationfrom landslides, Annu. Rev. Earth Planet. Sci., 25, 85–138, doi:10.1146/annurev.earth.25.1.85.
Kathmandu Post (2003), Landslides claim 15 soldiers, one civilian, p. 1,17 August.
Lave, J., and J.-P. Avouac (2001), Fluvial incision and tectonic uplift acrossthe Himalayas of central Nepal, J. Geophys. Res., 106(B11), 26,561–26,592.
Malet, J. P., O. Maquaire, and E. Calais (2002), The use of Global Position-ing System techniques for the continuous monitoring of landslides:Application to the Super-Sauze earthflow (Alpes-de-Haute-Provence,France), Geomorphology, 43(1 – 2), 33 – 54, doi:10.1016/S0169-555X(01)00098-8.
Marchi, L., M. Arattano, and A. M. Deganutti (2002), Ten years of debris-flow monitoring in the Moscardo Torrent (Italian Alps), Geomorphology,46(1–2), 1–17, doi:10.1016/S0169-555X(01)00162-3.
Marston, R. A., M. M. Miller, and L. P. Devkota (1998), Geoecology andmass movement in the Manaslu-Ganesh and Langtang-Jugal Himals,Nepal, Geomorphology, 26(1 – 3), 139 – 150, doi:10.1016/S0169-555X(98)00055-5.
Nabelek, J., G. Hetenyi, J. Vergne, S. Sapkota, B. Kafle, M. Jiang, H. Su,J. Chen, B.-S. Huang, and the Hi-CLIMB Team (2009), Underplating inthe Himalaya-Tibet collision zone revealed by the Hi-CLIMB experi-ment, Science, 325, 1371–1374, 10.1126/science.1167719.
Paul, S. K., S. K. Bartarya, P. Rautela, and A. K. Mahajan (2000), Cata-strophic mass movement of 1998 monsoons at Malpa in Kali Valley,Kumaun Himalaya (India), Geomorphology, 35(3 – 4), 169 – 180,doi:10.1016/S0169-555X(00)00032-5.
Percival, D. B., and A. T. Walden (1993), Spectral Analysis for PhysicalApplications: Multitaper and Conventional Univariate Techniques,Cambridge Univ. Press, Cambridge, U. K.
Reid, L. M. (1998), Calculation of average landslide frequency usingclimatic records, Water Resour. Res., 34(4), 869–877.
Shields, A. (1936), Anwendung der Aehnlichkeitsmechanik und der Tur-bulenzforschung auf die Geschiebebewegung,Mitt. Preuss. Versuchsanst.Wasserbau Schiffbau, 26, 1–26. (Hydrodyn. Lab. Publ., Engl. Transl.,167.)
Shrestha, S. B., J. N. Shrestha, and S. R. Sharma (1985), Geological map ofcentral Nepal, scale 1:250.000, Dep. of Mines and Geol., Kathmandu.
Shroder, J. F. (1998), Slope failure and denudation in the western Himalaya,Geomorphology, 26(1–2), 81–105, doi:10.1016/S0169-555X(98)00052-X.
Thomson, D. J. (1982), Spectrum estimation and harmonic analysis, Proc.IEEE, 70(9), 1055–1096.
Thouret, J. C. (1983), Field research on slopes evolution in the Himalayarange: the example of the Ankhu Khola valley, central Nepal, in Geody-namique des Grands Versants de l’Ankhu Khola, Nepal Central, p. 231,Cent. Natl. de la Rech. Sci., Paris.
Ueno, K., et al. (2001), Meteorological observations during 1994–2000 atthe Automatic Weather Station (GEN-AWS) in Khumbu region, NepalHimalayas, Bull. Glaciol. Res., 18, 23–30.
Upreti, B. N. (1999), An overview of the stratigraphy and tectonics of theNepal Himalaya, J. Asian Earth Sci., 17(5), 577–606, doi:10.1016/S1367-9120(99)00047-4.
Upreti, B. N., and M. R. Dhital (1996), Landslide Studies and Managementin Nepal, 87 pp., Int. Cent. for Integrated Mt. Dev., Kathmandu.
Varnes, D. J. (1978), Slope movements and types and processes, Landslides:Analysis and Control. Special Report 176, Transport Research Board,pp. 11–33, Natl. Acad. of Sci., Washington D. C.
Zhang, S., Y. Hong, and B. Yu (2004), Detecting infrasound emission ofdebris flows for warning purposes, paper presented at 10th Congress,INTERPRAEVENT, Riva del Garda, Trento, Italy, 24–27 May.
�����������������������L. Bollinger, CEA, DAM, DIF, F-91297 Arpajon CEDEX, France.A. Burtin, Laboratoire de Geologie, Ecole Normale Superieure de Paris,
CNRS, 24 rue Lhomond, F-75231 Paris CEDEX 05, France. ([email protected])R. Cattin, Geosciences Montpellier, Universite Montpellier 2, CNRS,
F-34095 Montpellier, France.J. L. Nabelek, College of Oceanic and Atmospheric Sciences, Oregon
State University, Corvallis, OR 97331, USA.J. Vergne, Institut de Physique du Globe de Strasbourg, UMR 7516,
CNRS-ULP, F-67084 Strasbourg, France.
F04009 BURTIN ET AL.: SEISMIC NOISE OF HIMALAYAN DEBRIS FLOW
15 of 15
F04009
Copyright © 2022 FDOKUMEN