Wettability Alteration of Sandstone Cores by Alumina-Based Nanofluids
Upload
independentCategory
view
4download
0
Sedimentary Geology 229 (2010) 268–281
Contents lists available at ScienceDirect
Sedimentary Geology
j ourna l homepage: www.e lsev ie r.com/ locate /sedgeo
Forced regressive shoreface sandstone from Himalayan foreland: Implications toearly Himalayan tectonic evolution
M.K. Bera a, A. Sarkar a,⁎, P.P. Chakraborty b, V. Ravikant c, A.K. Choudhury c
a Department of Geology & Geophysics, Indian Institute of Technology, Kharagpur 721302, Indiab Department of Geology, Delhi University, New Delhi 110017, Indiac Indian Institute of Technology, Roorkee 247667, India
⁎ Corresponding author. Tel.: +91 3222 283393.E-mail address: [email protected] (A. Sarka
0037-0738/$ – see front matter © 2010 Elsevier B.V. Adoi:10.1016/j.sedgeo.2010.06.013
a b s t r a c t
a r t i c l e i n f oArticle history:Received 21 April 2009Received in revised form 19 May 2010Accepted 18 June 2010Available online 25 June 2010
Editor: G.J. Weltje
Keywords:Forced regressionHimalayan forelandIndiaProvenanceTectonics
Sedimentology and sequence stratigraphic analysis of the ∼31 Ma old marker White sandstone unit from theSubathu Sub-basin, NW Himalayan foreland, suggest it to be a forced regressive wedge (FRW) formed duringthe transition from the marine Subathu Formation to the continental Dagshai Formation. The FRW isbounded between the “Surf diastem” below and type 1 unconformity at the top and differs from RSME(regressive surface of marine erosion, occurring below) bounded FRWs described from other classicalcoastal/foreland settings. Correct identification of bounding surfaces of a FRW has an important implicationto the estimation of rate of relative sea-level (RSL) fall. A faster rate of RSL fall, higher than the sedimentationrate, has been postulated for the erosion of the lower shoreface and RSME. Using the logged thickness of theSubathu/Dagshai transition zone including the White sandstone (bounded between the “Surf diastem” andunconformity), available chronology and eustatic sea-level fall (0.023 mm/year at 31 Ma), a higher RSL fallthan the sedimentation rate (0.07 mm/year) has been inferred during the deposition of the White sandstone.Petrography of sandstones and their Sr and Nd isotopic compositions indicate a major provenance switch-over from dominant mafic/ultramafic to metamorphic source from White sandstone (∼31 Ma) onwardsattesting the link between hinterland tectonics, provenance and forced regression. The provenance switch-over at 31 Ma was earlier inferred to be driven by proto-Himalayan thrust propagation in the foreland. Usinga simple isostatic model, on the contrary, a mechanism of accelerated surface uplift (at a rate of N0.10–0.15 mm/year) is suggested for both provenance change and forced regression.
r).
ll rights reserved.
© 2010 Elsevier B.V. All rights reserved.
1. Introduction
Peripheral foreland basins, created during progressive plateconvergence in a collisional tectonic setting, depicts three maindepositional stages i.e., a lower under-filled (early deep marineflysch) phase followed successively by filled (shallow marine) andover-filled (sub aerial alluvial molasse) stages (Allen et al., 1991;Sinclair, 1997). Classically the passage from flysch to molasse inperipheral foreland basins has been explained by progressive thrustpropagation towards the foreland (Dewey, 1982; Allen et al., 1986;Stockmal et al., 1986; Stockmal and Beaumont, 1987; Watts, 1992).Contrary to this classical belief, Sinclair (1997) proposed a slab break-off model for the flysch to molasse transition in Alpine foreland basedon the evidences of increased sediment supply, accelerated hinterlandexhumation, uplift of high-pressure metamorphic rocks, lowerlithospheric melting, and the onset of major back-thrusting. There-fore, the flysch to molasse transition in peripheral foreland basin
holds the key to understand the history of basin-response tohinterland tectonics (Allen et al., 1991; DeCelles and Giles, 1996;Sinclair, 1997). Indeed, the changeover from marine Subathu (flysch)to continental Dagshai Formation (molasse) rocks of the northwestern Himalayan foreland record such a transition and has beenlinked to early Himalayan tectonics and exhumation (Najman et al.,2004; Bera et al., 2008). Critical to this transition is the Whitesandstone unit (∼31 Ma) which occupies the topmost part of Subathusuccession representing the terminal marine sedimentation in theHimalayan foreland and is the topic of present investigation. Thesandstone unit has widely been used for regional correlation of thelithounits in an otherwise high structurally disturbed terrain (Najmanand Garzanti, 2000; Najman et al., 2004; Sangode et al., 2005). Thedepositional environment and stratigraphic status of this unit is,however, debatable. Najman et al. (2004) interpreted it as fluvial inorigin and classified it as basal part of the Dagshai Formation whileBera et al. (2008) proposed a shoreface origin for this greenish whitequartz arenite, and considering its marine origin clubbed it within theSubathu Formation.
Because the White sandstone unit has an age (∼31 Ma) mucholder than that of thrust tectonic activities recorded in the Himalayas
269M.K. Bera et al. / Sedimentary Geology 229 (2010) 268–281
(see Yin, 2006; Najman, 2006 for detail review) and holds a keystratigraphic position for sequence stratigraphic analysis due to itsalong-strike regional persistence, it is felt necessary to study the unitin high resolution. In this paper we report detail sedimentology of the‘White sandstone’ unit and provide a sequence stratigraphic frame-work during the flysch (Subathu) to molasse (Dagsahi) transition.Also, based on new and published Sr–Nd isotope data of sedimentsand inferred change in RSL, timing and rate of surface uplift in NWHimalaya has been estimated for the concerned transition period (42–25 Ma).
2. Geological background
Bounded between the Krol thrust in the north and the Bilaspurthrust in the south, the Cenozoic foreland sediments of NW Himalaya(Subathu Sub-basin of Simla Hill) are exposed as marine SubathuFormation successively overlain by continental molasse of Dagshai,Kasauli and Siwalik Formations (Fig. 1a and b). Numerous splaythrusts repeatedly expose these rocks (Mukhopadhyay and Mishra,1999). Although the type areas for Subathu and Dagshai Formationrocks are described from Subathu and Dagshai towns respectively,best exposures of Subathu–Dagshai transition, including the Whitesandstone, are observed along the Koshalia river section near the Kotiarea on the Kalka–Simla Roadway.
2.1. Subathu Formation
Except for the topmost ∼10 m (maximum) represented by thequartz arenites of the White sandstone, shale with a subordinateamount of centimeter to decimeter thick siliciclastic and carbonateinterbeds constitute the dominant motif of ∼100 m thick Subathusuccession (Bera et al., 2008). Whereas the argillaceous intervals inthe lower Subathu are ubiquitously represented by black/gray shale,their counterparts within the upper Subathu are either red in color oran alternation between red and gray coloured units. The argillaceouscomponents of the Subathu Formation are interpreted as products ofanoxic to dysoxic outer to inner shelf environment, occasionallyreaching near-sabkha condition (gypsum beds; Bera et al., 2008) andthe siliciclastic and carbonate interbeds are interpreted as products ofsediment gravity flows with widely varying rheology (Bera et al.,2008). Presence of volcanic lithic fragments, serpentine schist, chartand Cr-spinel within the coarser clastic interbeds indicate a mixedsource for Subathu sediments. Geochemically, high Ni and Cr content,whole rock εNd values of ∼−9 and 87Sr/86Sr ratios of ∼0.710–0.715suggest significant input from ophiolites of the Indus suture zone(Najman et al., 2000; Najman, 2006).
It may be pertinent to mention here that the first occurrence ofcaliche is recorded only from the top of the White sandstone unit andneither at its bottom nor in underlying sediment package. The fluvialchannel sands of Dagshai Formation erosively overlie the Whitesandstone unit.
2.2. Dagshai Formation
Alternations between red/brown sandstone (thickness not exceed-ing 10 m), shale, mudstone and mature calcrete represent the DagshaiFormation. The fining-upward cycles constituted of sandstone–mudstone couplets are interpreted as of fluvial channel-levee-floodplain origin (meandering river deposits; Najman et al., 2004; Bera et al.,2008). The presence of low-grade metamorphic rock fragments in thebasal part of Dagshai succession and progressive increase in themetamorphic grade of rock fragments in stratigraphically highersections is interpreted as the signal for shedding from more and moredeeper parts of exhumed Himalayan metamorphic core (Najman et al.,1997). This is also supported by whole rock εNd values ranging between∼−12 and −18 and 87Sr/86Sr ratios of ∼0.755–0.775 (Najman et al.,
2000). The Dagshai Formation is overlain by Kasauli and SiwalikFormations (not discussed in the present paper) both being productsof braided river systems (Najman et al., 2004).
3. Depositional age and stratigraphic status of White sandstone
A zircon fission track date of 49.4±2 Ma marks the oldestdepositional age for the upper Subathu rocks exposed in the studyarea (Jain et al., 2009). Based on the occurrence of larger benthicforaminifer Assillina spira abrardii and A. exponens–N. discorbinus–A.papillata assemblage bearing beds (shallow benthic zone or SBZ-13&14)∼44 Ma age was assigned to the terminal marine Subathu rocks(Mathur, 1978; Bhatia and Bhargava, 2005). The ∼44 Ma age, however,is not beyond doubt as the calcirudite beds hosting the foraminiferalassemblage have recently been modeled as of sediment gravity flow inorigin with mixing of allochthonous and autochthonous components(Bera et al., 2008). On the basis of geochemical proxies and fieldevidences, the view of a conformable contact between the Subathu andits overlying Dagshai Formation (Bhatia and Bhargava, 2005) hasalso been challenged recently (Najman, 2006; Bera et al., 2008). Fissiontrack dating of detrital zircons provided an oldest depositional age of∼31±2 Ma for the White sandstone unit (Najman et al., 2004). For thelower Dagshai rocks laser ablation 40Ar/39Ar and fission track dates ofsingle detrital muscovite and zircon grains suggested ages rangingbetween b28 Ma (Najman et al., 1997) and 31.6±3.9 Ma (Jain et al.,2009) respectively.
A wide range of depositional environments have been proposedfor theWhite sandstone e.g. beach (Singh and Khanna, 1980), tidal flat(Srivastava and Kasshyap, 1983), shoreface (Bera et al., 2008) andfluvial (based on the Sm–Nd and Rb–Sr geochemical signatures;Najman et al., 2000, 2004). Recent sequence stratigraphic analysis(Bera et al., 2008) modeled it as a forced regressive wedge (FRW)bounded by RSME below and type 1 sequence boundary above, aproduct of Falling Stage System Tract (FSST; Hunt and Tucker, 1992;Plint and Nummedal, 2000; Catuneanu, 2002). The top of the Whitesandstone was also assigned as the Subathu/Dagshai contactcoinciding with the first subaerial exposure in the Himalayan forelandassociated with type 1 sequence boundary (Catuneanu, 2002). Thiswas contrary to the earlier inference where Subathu/Dagshai contactwas marked at the base of this sandstone unit (Najman et al., 2004).These observations, along with the available dates mentioned above,suggest that the proposition of a major unconformity of N10 Ma(between 44 Ma at terminal Subathu and 31 Ma for White sandstone)is not tenable. The duration of unconformity between marine andcontinental molasse is in fact negligible as both the White sandstoneand lower Dagshai have similar depositional ages (∼31 Ma).
4. Methodology
For the present work mapping was carried out at two stages:∼10 km area of the Subathu Sub-basin was mapped at the first stagearound the Koti area, Himachal Pradesh (Survey of India Toposheetno. 53F/1; Fig. 1c). Investigation was extended in the north up to thePiplaghat area at a later stage to encompass the entire Sub-basin(Fig. 1b). The general strike of the lithounits is NNW–SSE with dipscommonly exceeding 70° towards ENE. Eleven sections spread overthe entire Sub-basin were studied. Depositional processes andenvironments were interpreted from primary sedimentologicalfeatures (bedform geometry, sedimentary structures, grain size,paleoflow indicators) and shifts in paleogeography were interpretedfrom variations in interpreted bathymetry across the stratigraphiccolumn. Facies types in Subathu and Dagshai Formations aredescribed in Bera et al. (2008) and hence, not discussed here. Onlyfacies types within the White sandstones are elaborated anddiscussed. Surfaces across which the depositional succession revealedan abrupt decrease in interpreted bathymetry are identified as “key
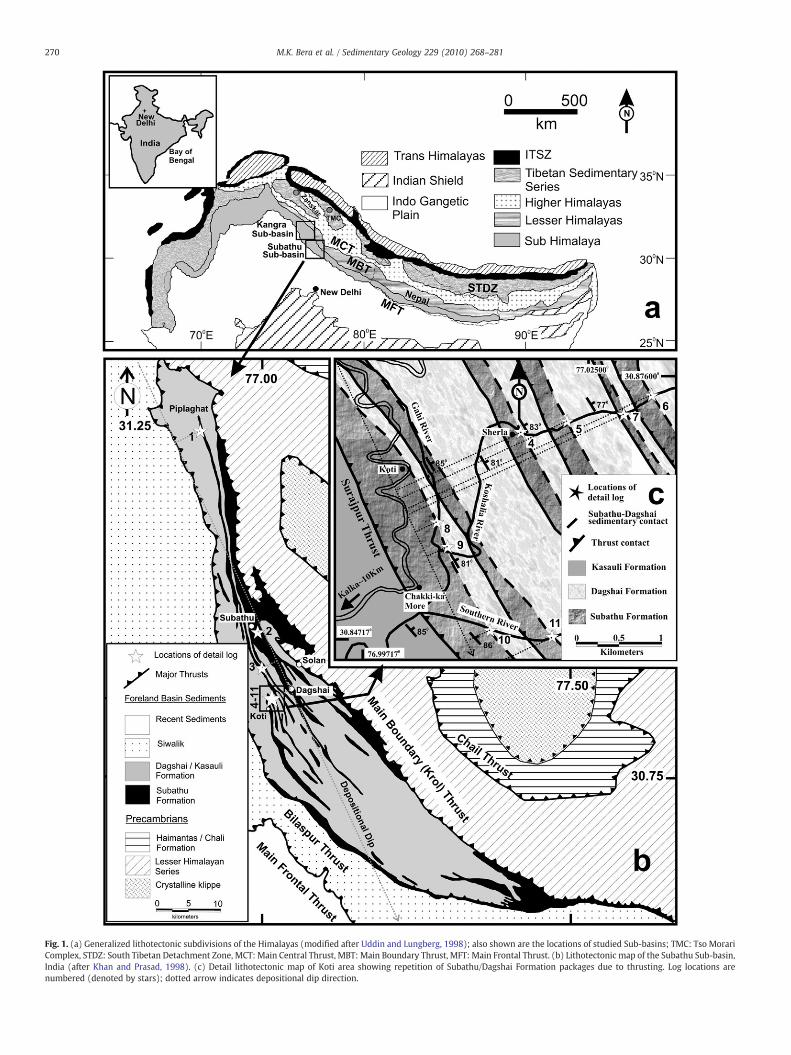
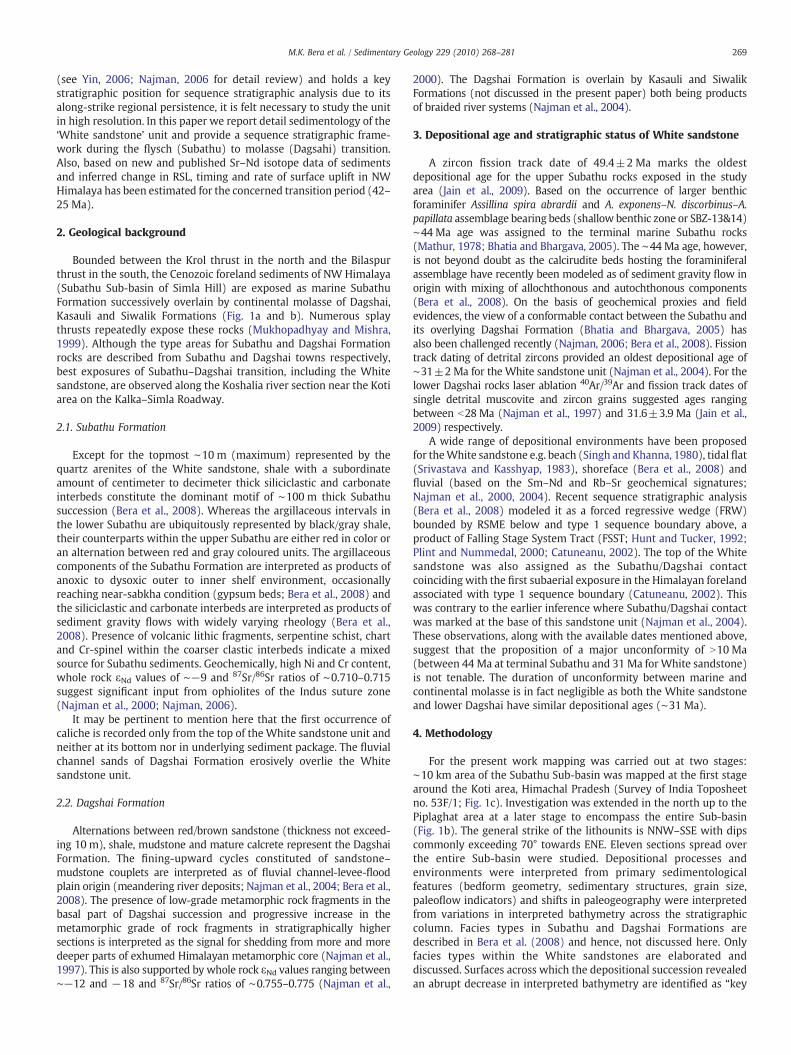
Fig. 1. (a) Generalized lithotectonic subdivisions of the Himalayas (modified after Uddin and Lungberg, 1998); also shown are the locations of studied Sub-basins; TMC: Tso MorariComplex, STDZ: South Tibetan Detachment Zone, MCT: Main Central Thrust, MBT: Main Boundary Thrust, MFT: Main Frontal Thrust. (b) Lithotectonic map of the Subathu Sub-basin,India (after Khan and Prasad, 1998). (c) Detail lithotectonic map of Koti area showing repetition of Subathu/Dagshai Formation packages due to thrusting. Log locations arenumbered (denoted by stars); dotted arrow indicates depositional dip direction.
270 M.K. Bera et al. / Sedimentary Geology 229 (2010) 268–281
271M.K. Bera et al. / Sedimentary Geology 229 (2010) 268–281
surfaces” (RSME, unconformity, Surf diastem etc.) and taken asmarkers for correlating different studied sections as well as to identifymajor paleogeographic shift in the depositional history traced basin-wide.
Sandstone petrography i.e. estimation of quartz (Q), feldspar (F),lithic fragment (L) within selected samples by point (∼600) countmethod and characterization of lithic fragments viz. volcanic (Lv),sedimentary (Ls) and metamorphic (Lm) were carried out.
Sr (87Sr/86Sr) and Nd (εNd) isotope data of fine grainedsedimentary rocks are potential tools for identifying the provenance(Nelson and DePaolo, 1988; Savoy et al., 2000) and have beenanalysed for the White sandstone, black/red Subathu and Dagshaisandstones. About 70–100 mg powdered whole rock samples wereacid-digested. Pure Rb, Sr, Sm and Nd fractions were obtained bystandard ion exchange chromatography (4 ml cation exchange and2 ml secondary columns HDEHP-coated BioRad SX-8 Biobeads re-spectively). 87Sr/86Sr and 144Nd/143Nd ratios were measured inThermo Triton T1 mass spectrometer in static multicollector mode,at the National Facility for Geochronology and Isotope Geology, IndianInstitute of Technology, Roorkee. Internal precision for 87Sr/86Srisotopic ratios was monitored by running NIST SRM 987 standardwhich gave value of 0.71026±0.00008 (2σ, n=21; quoted value0.710245). The internal precision for 143Nd/144Nd ratios was checkedwith GSJ JNdi-1 standard which gave value of 0.512108±0.000020(2σ, n=23; quoted value 0.512106; Tanaka et al. 2000). The totalprocedural blank was b0.7 ng for Sr and b0.5 ng for Nd.
5. Facies associations and depositional environment
Bounded between the marine shelf deposit of Subathu Formationbelow and fluvial Dagshai Formation above, the White sandstoneoccurs as a FRW (Bera et al., 2008) exhibiting all three major faciesassociations viz. lower shoreface, upper shoreface, and Foreshore/beach and are discussed below.
5.1. Facies association I (FA I): Lower shoreface
5.1.1. DescriptionStratigraphically this association represents the lowermost part of
the White sandstone sections. Preserved only at two locations viz.Piplaghat (location 1, Figs. 1b, 2a) and southern river (location 10;Figs. 1c and 3b) with a proximal–distal relationship between the two.Overall, the association (max. recorded thickness ∼2 m) is representedby thickening- and coarsening-up sequence wherein grain size variesbetween clay and fine sand. The constituent facies types include i)laterally persistent (over fewmeters scale) sandbeds (thickness varyingfrom 3 to 5 cm; Figs. 2a and 3b), internally massive to plane laminated,and ii) laterally impersistent shale layers. Low-angle-clay draped-truncation surfaces and indistinctwave rippled bedforms (paleocurrentdirection∼SSW–NNE) are characteristic feature of this facies asso-ciation (Fig. 3b inset). Conspicuously hummocky cross-stratification isabsent or indistinctwherever developed (Najman et al., 2004).Whereasthe association is invariably overlain by the upper shoreface faciesassociation (FA II; discussed later) with erosional contact (Figs. 2aand 3b), its contact with the underlying argillaceous outer shelfsediments of Subathu shale varies laterally between the proximal anddistal part. In contrast to the gradational relationship in the proximalpart (Piplaghat section, location 1; Fig. 2a), the association assumeserosional contact with the underlying Subathu shale in the distal part(the Southern River section, location 10). Upward, the associationreveals increase in sand bed amalgamation with concomitant decreasein intervening discontinuous shale partings (Fig. 2a).
5.1.2. InterpretationLowermost stratigraphic position, very fine grain size, massive to
plane laminated sand beds with low-angle truncation surfaces,
presence of indistinct bed-top wave features and mutual associationwith other facies associations led us to interpret this association aslower shoreface product (Hampson, 2000). Although the associationlacks any definite signature of hummocky cross-stratification, thehigh bed amalgamationwith discontinuous shale parting is suggestiveof possible storm action in lower shoreface facies association (Tamuraet al., 2007). The progradational tendency of the association isreflected in its coarsening- and thickening-upward bed stackingpattern.
5.2. Facies association II (FA II): Upper shoreface
5.2.1. DescriptionErosionallyoverlying theheterolithic lower shoreface (FA I) or black/
gray shale of the Subathu Formation, this association is tracked in mostof the studied sections with thickness varying between 2 m and 4 m.Fine to medium grained sandstones (with minor clay partings) of thisassociation are comprised of intermingling between two different sub-association (I and II); both constituted of lenticular beds, but differ insand:silt ratio, bed thickness and degree of lenticularity. Sub-associationI,with a high sand:silt ratio (∼10:1), is uniformly thick bedded (averagebed thickness∼15 cm)with broad lensoid (width 60–80 cm,maximumlength 150 cm) and amalgamated character. Sub-association I, whendirectly overlies the Subathu shale, show presence of rip-up shale clastsat its basal part (Fig. 2c). In contrast, sub-association II, sandwichedbetween units of sub-association I, reveal a sand:silt ratio ∼10:3 andcomprises of alternation between tabular/wedge shaped thick (thick-ness ∼50 cm) and thin (thickness ∼3 cm) bedded sandstone (Fig. 3a).Thick-bedded units in both the sub-associations are structureless,trough cross-stratified (set thickness ∼20 cm) or low-angle planar-curved cross-stratified (set thickness 15–20 cm) with their bases andtops sharp and undulatory, and show trains of oscillation ripples as thedominant surface bedform. The ripples are symmetrical in profile,mostly straight crested (rarely three-dimensional) and occasionallyhave crest bifurcations (plaeocurrent direction∼SSW–NNE). Wavelength and amplitude of the ripples are ∼25 cm and ∼3 cm respectively(Fig. 3b and c). Thin beds within sub-association II maintain similargrain size to the thick-bedded ones (not measured) but differ in thescale of bedding lenticularity and size of bed-topbedforms. Ripple forms(set thickness ∼2 cm) present on the thinner beds are centimeters inwavelength and are often isolated and starved. Vertical burrows arepresent in profusion at the top of both the sub-associations.
5.2.2. InterpretationCoarser grain size in comparison to that of lower shoreface (FA I)
and frequent occurrence of wave generated bedforms indicatedeposition in a shallow, wave-dominated high-energy environmentabove fair-weather wave base (cf. Seidler and Steel, 2001). Wavelength:amplitude ratio (N8:1) for the wave ripples suggest theirswash origin (Clifton, 1969, 2006; Sarkar et al., 1996) in a shallowwater domain. Presence of vertical burrows also corroborates higherenergy condition. Besides, mutual association with other nearshoreproducts allowed us to interpret this association as products of uppershoreface environment (Walker and Plint, 1992). While the thick,lenticular beds with broad lenticular geometry and overriding waveripples are interpreted as products of bar migration, the thin beddedunits with lower sand:silt ratio and presence of small scale ripplebedforms are possibly of interbar origin (Fig. 3a; Tamura et al., 2007).
5.3. Facies association III (FA III): Foreshore/beach
5.3.1. DescriptionRepresent the topmost part of the studied White sandstone
sections. Gradationally overlying the FA II sandstones the foreshore/beach association is constituted of tabular (in tens of meter scale)beds of medium grained sandstone, often in amalgamation
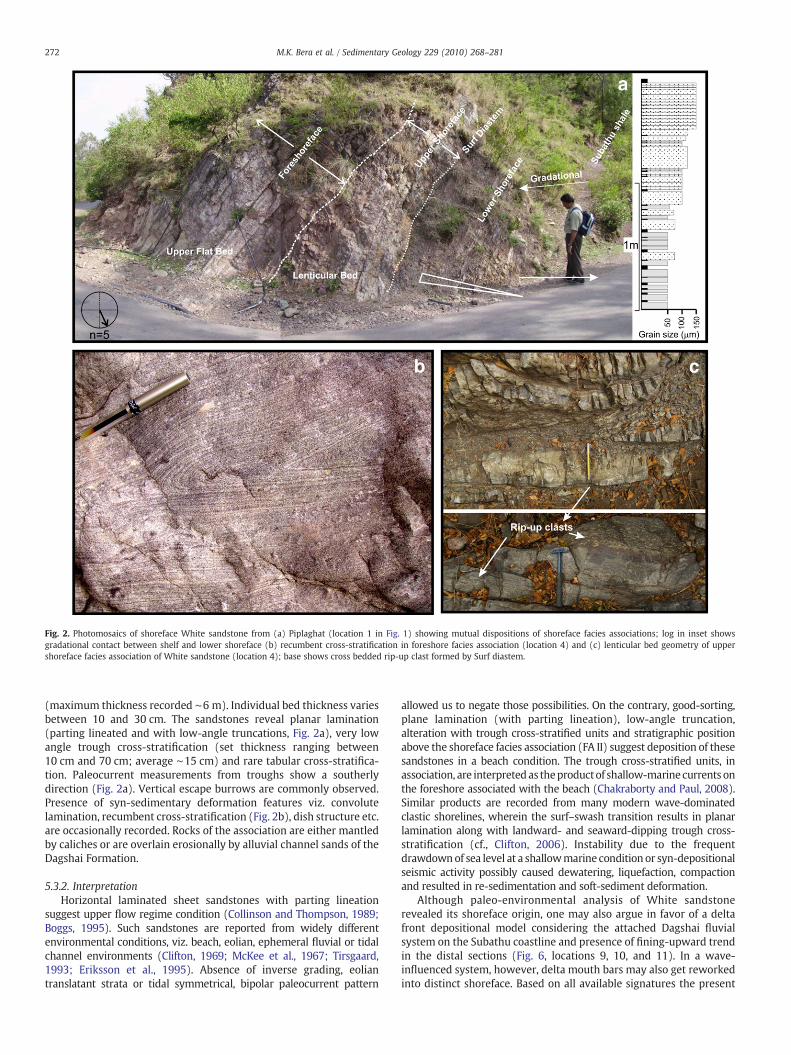
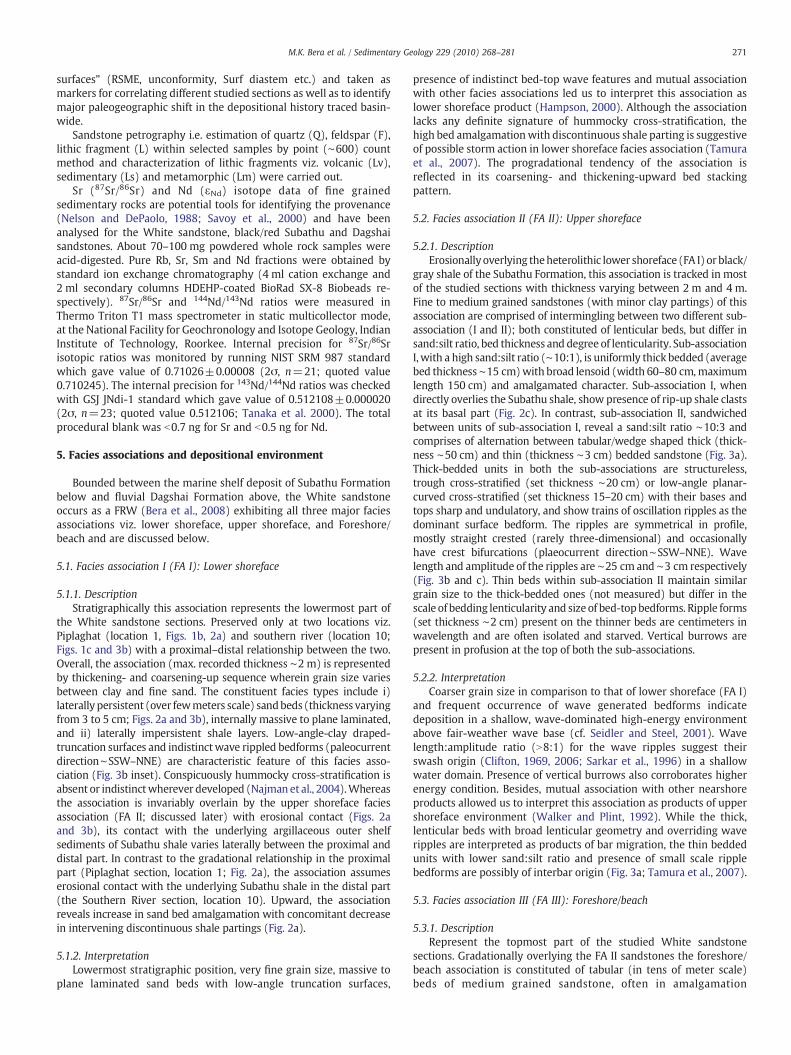
Fig. 2. Photomosaics of shoreface White sandstone from (a) Piplaghat (location 1 in Fig. 1) showing mutual dispositions of shoreface facies associations; log in inset showsgradational contact between shelf and lower shoreface (b) recumbent cross-stratification in foreshore facies association (location 4) and (c) lenticular bed geometry of uppershoreface facies association of White sandstone (location 4); base shows cross bedded rip-up clast formed by Surf diastem.
272 M.K. Bera et al. / Sedimentary Geology 229 (2010) 268–281
(maximum thickness recorded ∼6 m). Individual bed thickness variesbetween 10 and 30 cm. The sandstones reveal planar lamination(parting lineated and with low-angle truncations, Fig. 2a), very lowangle trough cross-stratification (set thickness ranging between10 cm and 70 cm; average ∼15 cm) and rare tabular cross-stratifica-tion. Paleocurrent measurements from troughs show a southerlydirection (Fig. 2a). Vertical escape burrows are commonly observed.Presence of syn-sedimentary deformation features viz. convolutelamination, recumbent cross-stratification (Fig. 2b), dish structure etc.are occasionally recorded. Rocks of the association are either mantledby caliches or are overlain erosionally by alluvial channel sands of theDagshai Formation.
5.3.2. InterpretationHorizontal laminated sheet sandstones with parting lineation
suggest upper flow regime condition (Collinson and Thompson, 1989;Boggs, 1995). Such sandstones are reported from widely differentenvironmental conditions, viz. beach, eolian, ephemeral fluvial or tidalchannel environments (Clifton, 1969; McKee et al., 1967; Tirsgaard,1993; Eriksson et al., 1995). Absence of inverse grading, eoliantranslatant strata or tidal symmetrical, bipolar paleocurrent pattern
allowed us to negate those possibilities. On the contrary, good-sorting,plane lamination (with parting lineation), low-angle truncation,alteration with trough cross-stratified units and stratigraphic positionabove the shoreface facies association (FA II) suggest deposition of thesesandstones in a beach condition. The trough cross-stratified units, inassociation, are interpretedas theproductof shallow-marinecurrents onthe foreshore associated with the beach (Chakraborty and Paul, 2008).Similar products are recorded from many modern wave-dominatedclastic shorelines, wherein the surf–swash transition results in planarlamination along with landward- and seaward-dipping trough cross-stratification (cf., Clifton, 2006). Instability due to the frequentdrawdownof sea level at a shallowmarine condition or syn-depositionalseismic activity possibly caused dewatering, liquefaction, compactionand resulted in re-sedimentation and soft-sediment deformation.
Although paleo-environmental analysis of White sandstonerevealed its shoreface origin, one may also argue in favor of a deltafront depositional model considering the attached Dagshai fluvialsystem on the Subathu coastline and presence of fining-upward trendin the distal sections (Fig. 6, locations 9, 10, and 11). In a wave-influenced system, however, delta mouth bars may also get reworkedinto distinct shoreface. Based on all available signatures the present
Fig. 3. (a) Bar interbar upper shoreface association (location 11); note high angle cross strata within bar bedforms (left panel magnified) and thin ripple laminated bedform ofinterbar origin (right panel magnified), (b) southern river section, Koti (location 10); right panel shows truncation of lower shoreface strata (thin dotted lines) by Surf diastem(magnified; thick dotted line) with low-angle internal truncation surfaces (thin dash–dot lines) and indistinct wave ripple (thin dashed line) and (c) wave rippled bar migrationbedforms in upper shoreface facies association, Koshalia river section (location 9).
273M.K. Bera et al. / Sedimentary Geology 229 (2010) 268–281
work is only in a position to fix the shoreface set-up for the Whitesandstone and unable to retrieve its precursor depositional environ-ment. Fine- to medium sand grain size, lack of large bedform anddominance of planar or gently undulating stratification identifies theWhite sandstone as a fine sandy high-energy non-barred shoreface(Clifton, 2006). Further, as this shoreface is overlain by erosional
Dagshai fluvial system, possibility of getting a complete shorefacesection is limited. Clearly depending on the amount of incision causedby the fluvial system, the preserved thickness of the White sandstonevaries from a minimum ∼2 m (location 8) to maximum 10 m(location 2). Thus we restrain ourselves to propose any definitereason for the observed fining-upward trend found in the distal
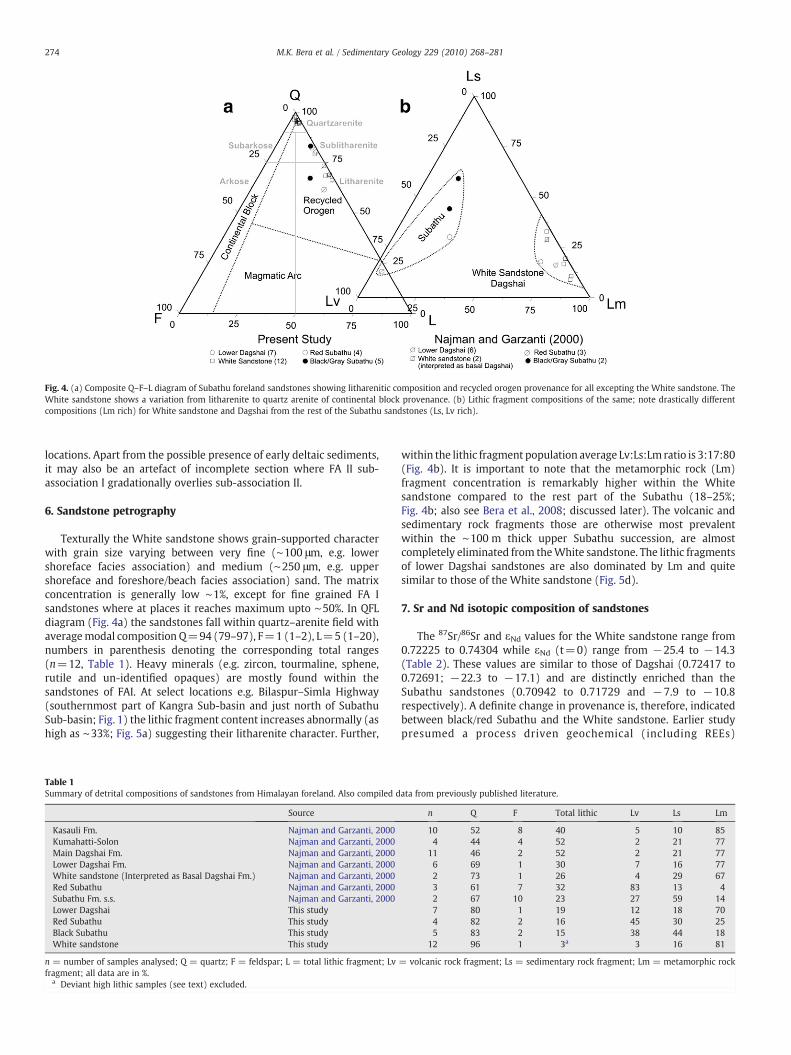
Fig. 4. (a) Composite Q–F–L diagram of Subathu foreland sandstones showing litharenitic composition and recycled orogen provenance for all excepting the White sandstone. TheWhite sandstone shows a variation from litharenite to quartz arenite of continental block provenance. (b) Lithic fragment compositions of the same; note drastically differentcompositions (Lm rich) for White sandstone and Dagshai from the rest of the Subathu sandstones (Ls, Lv rich).
274 M.K. Bera et al. / Sedimentary Geology 229 (2010) 268–281
locations. Apart from the possible presence of early deltaic sediments,it may also be an artefact of incomplete section where FA II sub-association I gradationally overlies sub-association II.
6. Sandstone petrography
Texturally the White sandstone shows grain-supported characterwith grain size varying between very fine (∼100 μm, e.g. lowershoreface facies association) and medium (∼250 μm, e.g. uppershoreface and foreshore/beach facies association) sand. The matrixconcentration is generally low ∼1%, except for fine grained FA Isandstones where at places it reaches maximum upto ∼50%. In QFLdiagram (Fig. 4a) the sandstones fall within quartz–arenite field withaveragemodal composition Q=94 (79–97), F=1 (1–2), L=5 (1–20),numbers in parenthesis denoting the corresponding total ranges(n=12, Table 1). Heavy minerals (e.g. zircon, tourmaline, sphene,rutile and un-identified opaques) are mostly found within thesandstones of FAI. At select locations e.g. Bilaspur–Simla Highway(southernmost part of Kangra Sub-basin and just north of SubathuSub-basin; Fig. 1) the lithic fragment content increases abnormally (ashigh as ∼33%; Fig. 5a) suggesting their litharenite character. Further,
Table 1Summary of detrital compositions of sandstones from Himalayan foreland. Also compiled d
Source
Kasauli Fm. Najman and Garzanti, 2000Kumahatti-Solon Najman and Garzanti, 2000Main Dagshai Fm. Najman and Garzanti, 2000Lower Dagshai Fm. Najman and Garzanti, 2000White sandstone (Interpreted as Basal Dagshai Fm.) Najman and Garzanti, 2000Red Subathu Najman and Garzanti, 2000Subathu Fm. s.s. Najman and Garzanti, 2000Lower Dagshai This studyRed Subathu This studyBlack Subathu This studyWhite sandstone This study
n = number of samples analysed; Q = quartz; F = feldspar; L = total lithic fragment; Lvfragment; all data are in %.
a Deviant high lithic samples (see text) excluded.
within the lithic fragment population average Lv:Ls:Lm ratio is 3:17:80(Fig. 4b). It is important to note that the metamorphic rock (Lm)fragment concentration is remarkably higher within the Whitesandstone compared to the rest part of the Subathu (18–25%;Fig. 4b; also see Bera et al., 2008; discussed later). The volcanic andsedimentary rock fragments those are otherwise most prevalentwithin the ∼100 m thick upper Subathu succession, are almostcompletely eliminated from theWhite sandstone. The lithic fragmentsof lower Dagshai sandstones are also dominated by Lm and quitesimilar to those of the White sandstone (Fig. 5d).
7. Sr and Nd isotopic composition of sandstones
The 87Sr/86Sr and εNd values for the White sandstone range from0.72225 to 0.74304 while εNd (t=0) range from −25.4 to −14.3(Table 2). These values are similar to those of Dagshai (0.72417 to0.72691; −22.3 to −17.1) and are distinctly enriched than theSubathu sandstones (0.70942 to 0.71729 and −7.9 to −10.8respectively). A definite change in provenance is, therefore, indicatedbetween black/red Subathu and the White sandstone. Earlier studypresumed a process driven geochemical (including REEs)
ata from previously published literature.
n Q F Total lithic Lv Ls Lm
10 52 8 40 5 10 854 44 4 52 2 21 77
11 46 2 52 2 21 776 69 1 30 7 16 772 73 1 26 4 29 673 61 7 32 83 13 42 67 10 23 27 59 147 80 1 19 12 18 704 82 2 16 45 30 255 83 2 15 38 44 18
12 96 1 3a 3 16 81
= volcanic rock fragment; Ls = sedimentary rock fragment; Lm = metamorphic rock
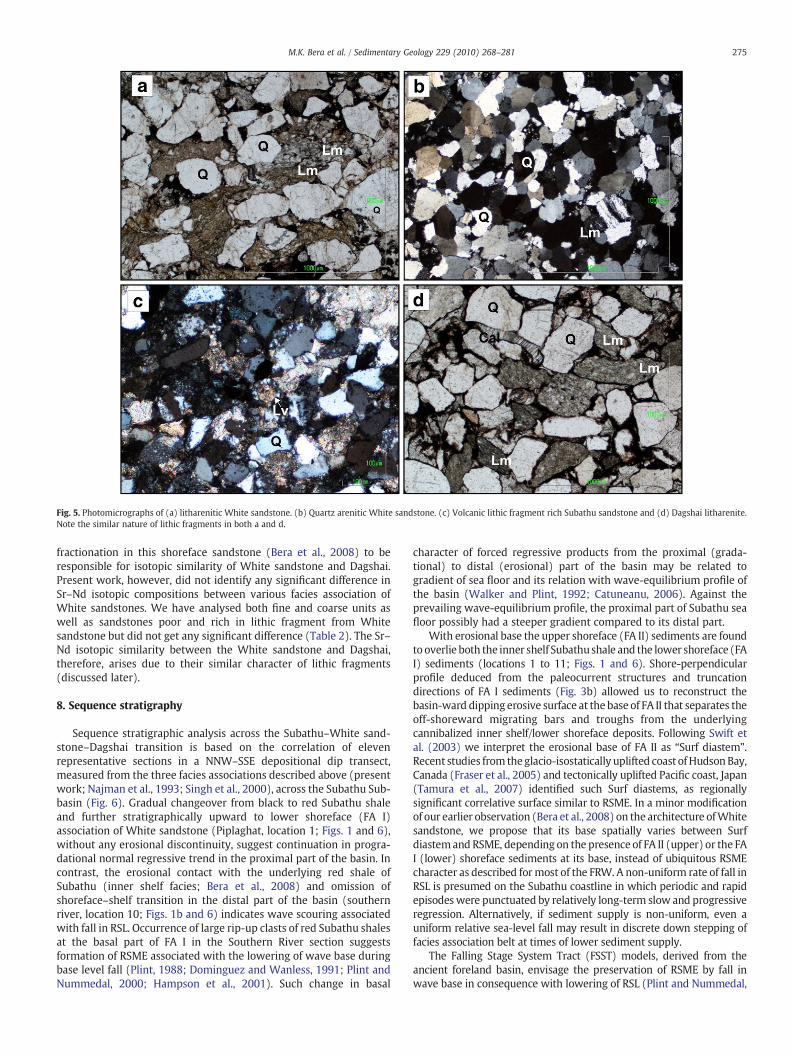
Fig. 5. Photomicrographs of (a) litharenitic White sandstone. (b) Quartz arenitic White sandstone. (c) Volcanic lithic fragment rich Subathu sandstone and (d) Dagshai litharenite.Note the similar nature of lithic fragments in both a and d.
275M.K. Bera et al. / Sedimentary Geology 229 (2010) 268–281
fractionation in this shoreface sandstone (Bera et al., 2008) to beresponsible for isotopic similarity of White sandstone and Dagshai.Present work, however, did not identify any significant difference inSr–Nd isotopic compositions between various facies association ofWhite sandstones. We have analysed both fine and coarse units aswell as sandstones poor and rich in lithic fragment from Whitesandstone but did not get any significant difference (Table 2). The Sr–Nd isotopic similarity between the White sandstone and Dagshai,therefore, arises due to their similar character of lithic fragments(discussed later).
8. Sequence stratigraphy
Sequence stratigraphic analysis across the Subathu–White sand-stone–Dagshai transition is based on the correlation of elevenrepresentative sections in a NNW–SSE depositional dip transect,measured from the three facies associations described above (presentwork; Najman et al., 1993; Singh et al., 2000), across the Subathu Sub-basin (Fig. 6). Gradual changeover from black to red Subathu shaleand further stratigraphically upward to lower shoreface (FA I)association of White sandstone (Piplaghat, location 1; Figs. 1 and 6),without any erosional discontinuity, suggest continuation in progra-dational normal regressive trend in the proximal part of the basin. Incontrast, the erosional contact with the underlying red shale ofSubathu (inner shelf facies; Bera et al., 2008) and omission ofshoreface–shelf transition in the distal part of the basin (southernriver, location 10; Figs. 1b and 6) indicates wave scouring associatedwith fall in RSL. Occurrence of large rip-up clasts of red Subathu shalesat the basal part of FA I in the Southern River section suggestsformation of RSME associated with the lowering of wave base duringbase level fall (Plint, 1988; Dominguez and Wanless, 1991; Plint andNummedal, 2000; Hampson et al., 2001). Such change in basal
character of forced regressive products from the proximal (grada-tional) to distal (erosional) part of the basin may be related togradient of sea floor and its relation with wave-equilibrium profile ofthe basin (Walker and Plint, 1992; Catuneanu, 2006). Against theprevailing wave-equilibrium profile, the proximal part of Subathu seafloor possibly had a steeper gradient compared to its distal part.
With erosional base the upper shoreface (FA II) sediments are foundto overlie both the inner shelf Subathushale and the lower shoreface (FAI) sediments (locations 1 to 11; Figs. 1 and 6). Shore-perpendicularprofile deduced from the paleocurrent structures and truncationdirections of FA I sediments (Fig. 3b) allowed us to reconstruct thebasin-ward dipping erosive surface at the base of FA II that separates theoff-shoreward migrating bars and troughs from the underlyingcannibalized inner shelf/lower shoreface deposits. Following Swift etal. (2003) we interpret the erosional base of FA II as “Surf diastem”.Recent studies from theglacio-isostatically uplifted coast ofHudsonBay,Canada (Fraser et al., 2005) and tectonically uplifted Pacific coast, Japan(Tamura et al., 2007) identified such Surf diastems, as regionallysignificant correlative surface similar to RSME. In a minor modificationof our earlier observation (Bera et al., 2008) on the architecture ofWhitesandstone, we propose that its base spatially varies between Surfdiastemand RSME, depending on the presence of FA II (upper) or the FAI (lower) shoreface sediments at its base, instead of ubiquitous RSMEcharacter as described formost of the FRW. A non-uniform rate of fall inRSL is presumed on the Subathu coastline in which periodic and rapidepisodeswere punctuated by relatively long-term slow and progressiveregression. Alternatively, if sediment supply is non-uniform, even auniform relative sea-level fall may result in discrete down stepping offacies association belt at times of lower sediment supply.
The Falling Stage System Tract (FSST) models, derived from theancient foreland basin, envisage the preservation of RSME by fall inwave base in consequence with lowering of RSL (Plint and Nummedal,
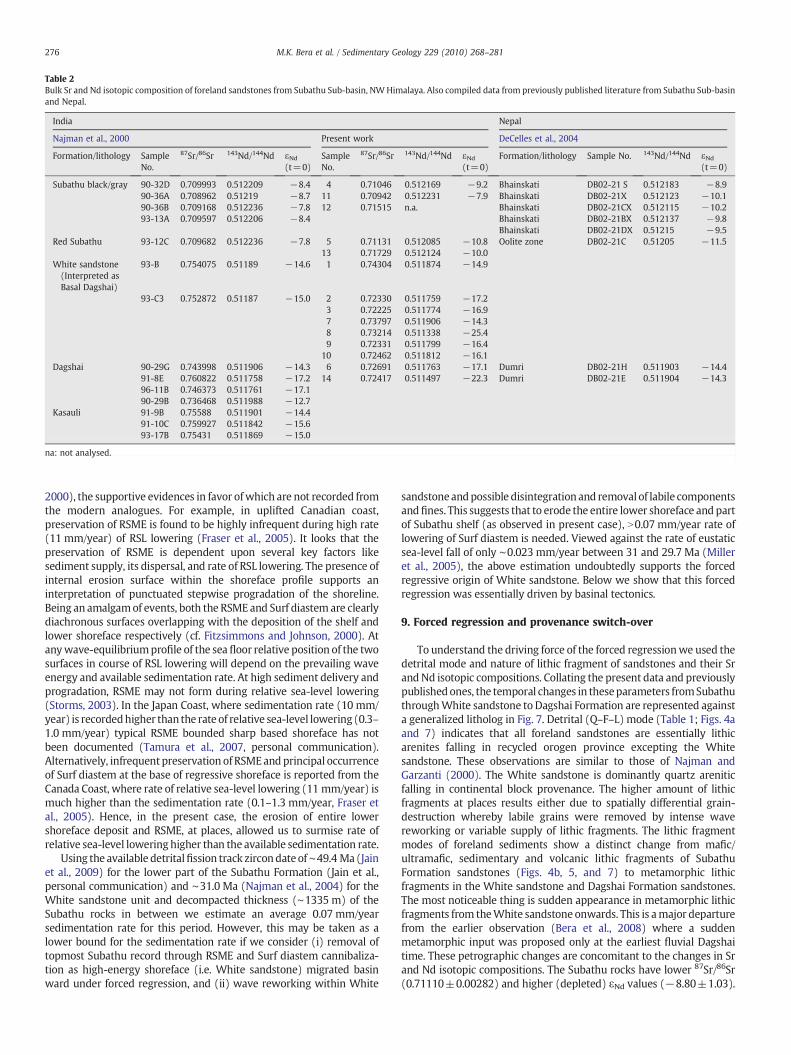
Table 2Bulk Sr and Nd isotopic composition of foreland sandstones from Subathu Sub-basin, NWHimalaya. Also compiled data from previously published literature from Subathu Sub-basinand Nepal.
India Nepal
Najman et al., 2000 Present work DeCelles et al., 2004
Formation/lithology SampleNo.
87Sr/86Sr 143Nd/144Nd εNd(t=0)
SampleNo.
87Sr/86Sr 143Nd/144Nd εNd(t=0)
Formation/lithology Sample No. 143Nd/144Nd εNd(t=0)
Subathu black/gray 90-32D 0.709993 0.512209 −8.4 4 0.71046 0.512169 −9.2 Bhainskati DB02-21 S 0.512183 −8.990-36A 0.708962 0.51219 −8.7 11 0.70942 0.512231 −7.9 Bhainskati DB02-21X 0.512123 −10.190-36B 0.709168 0.512236 −7.8 12 0.71515 n.a. Bhainskati DB02-21CX 0.512115 −10.293-13A 0.709597 0.512206 −8.4 Bhainskati DB02-21BX 0.512137 −9.8
Bhainskati DB02-21DX 0.51215 −9.5Red Subathu 93-12C 0.709682 0.512236 −7.8 5 0.71131 0.512085 −10.8 Oolite zone DB02-21C 0.51205 −11.5
13 0.71729 0.512124 −10.0White sandstone(Interpreted asBasal Dagshai)
93-B 0.754075 0.51189 −14.6 1 0.74304 0.511874 −14.9
93-C3 0.752872 0.51187 −15.0 2 0.72330 0.511759 −17.23 0.72225 0.511774 −16.97 0.73797 0.511906 −14.38 0.73214 0.511338 −25.49 0.72331 0.511799 −16.4
10 0.72462 0.511812 −16.1Dagshai 90-29G 0.743998 0.511906 −14.3 6 0.72691 0.511763 −17.1 Dumri DB02-21H 0.511903 −14.4
91-8E 0.760822 0.511758 −17.2 14 0.72417 0.511497 −22.3 Dumri DB02-21E 0.511904 −14.396-11B 0.746373 0.511761 −17.190-29B 0.736468 0.511988 −12.7
Kasauli 91-9B 0.75588 0.511901 −14.491-10C 0.759927 0.511842 −15.693-17B 0.75431 0.511869 −15.0
na: not analysed.
276 M.K. Bera et al. / Sedimentary Geology 229 (2010) 268–281
2000), the supportive evidences in favor ofwhich are not recorded fromthe modern analogues. For example, in uplifted Canadian coast,preservation of RSME is found to be highly infrequent during high rate(11 mm/year) of RSL lowering (Fraser et al., 2005). It looks that thepreservation of RSME is dependent upon several key factors likesediment supply, its dispersal, and rate of RSL lowering. The presence ofinternal erosion surface within the shoreface profile supports aninterpretation of punctuated stepwise progradation of the shoreline.Being an amalgamof events, both the RSME and Surf diastem are clearlydiachronous surfaces overlapping with the deposition of the shelf andlower shoreface respectively (cf. Fitzsimmons and Johnson, 2000). Atanywave-equilibriumprofile of the sea floor relative position of the twosurfaces in course of RSL lowering will depend on the prevailing waveenergy and available sedimentation rate. At high sediment delivery andprogradation, RSME may not form during relative sea-level lowering(Storms, 2003). In the Japan Coast, where sedimentation rate (10 mm/year) is recordedhigher than the rate of relative sea-level lowering (0.3–1.0 mm/year) typical RSME bounded sharp based shoreface has notbeen documented (Tamura et al., 2007, personal communication).Alternatively, infrequent preservation of RSMEandprincipal occurrenceof Surf diastem at the base of regressive shoreface is reported from theCanada Coast, where rate of relative sea-level lowering (11 mm/year) ismuch higher than the sedimentation rate (0.1–1.3 mm/year, Fraser etal., 2005). Hence, in the present case, the erosion of entire lowershoreface deposit and RSME, at places, allowed us to surmise rate ofrelative sea-level lowering higher than the available sedimentation rate.
Using the available detritalfission track zircondateof∼49.4 Ma (Jainet al., 2009) for the lower part of the Subathu Formation (Jain et al.,personal communication) and ∼31.0 Ma (Najman et al., 2004) for theWhite sandstone unit and decompacted thickness (∼1335 m) of theSubathu rocks in between we estimate an average 0.07 mm/yearsedimentation rate for this period. However, this may be taken as alower bound for the sedimentation rate if we consider (i) removal oftopmost Subathu record through RSME and Surf diastem cannibaliza-tion as high-energy shoreface (i.e. White sandstone) migrated basinward under forced regression, and (ii) wave reworking within White
sandstoneandpossible disintegration and removal of labile componentsandfines. This suggests that to erode the entire lower shoreface and partof Subathu shelf (as observed in present case), N0.07 mm/year rate oflowering of Surf diastem is needed. Viewed against the rate of eustaticsea-level fall of only ∼0.023 mm/year between 31 and 29.7 Ma (Milleret al., 2005), the above estimation undoubtedly supports the forcedregressive origin of White sandstone. Below we show that this forcedregression was essentially driven by basinal tectonics.
9. Forced regression and provenance switch-over
To understand the driving force of the forced regressionwe used thedetrital mode and nature of lithic fragment of sandstones and their Srand Nd isotopic compositions. Collating the present data and previouslypublishedones, the temporal changes in theseparameters fromSubathuthroughWhite sandstone to Dagshai Formation are represented againsta generalized litholog in Fig. 7. Detrital (Q–F–L) mode (Table 1; Figs. 4aand 7) indicates that all foreland sandstones are essentially lithicarenites falling in recycled orogen province excepting the Whitesandstone. These observations are similar to those of Najman andGarzanti (2000). The White sandstone is dominantly quartz areniticfalling in continental block provenance. The higher amount of lithicfragments at places results either due to spatially differential grain-destruction whereby labile grains were removed by intense wavereworking or variable supply of lithic fragments. The lithic fragmentmodes of foreland sediments show a distinct change from mafic/ultramafic, sedimentary and volcanic lithic fragments of SubathuFormation sandstones (Figs. 4b, 5, and 7) to metamorphic lithicfragments in the White sandstone and Dagshai Formation sandstones.The most noticeable thing is sudden appearance in metamorphic lithicfragments from theWhite sandstone onwards. This is amajor departurefrom the earlier observation (Bera et al., 2008) where a suddenmetamorphic input was proposed only at the earliest fluvial Dagshaitime. These petrographic changes are concomitant to the changes in Srand Nd isotopic compositions. The Subathu rocks have lower 87Sr/86Sr(0.71110±0.00282) and higher (depleted) εNd values (−8.80±1.03).
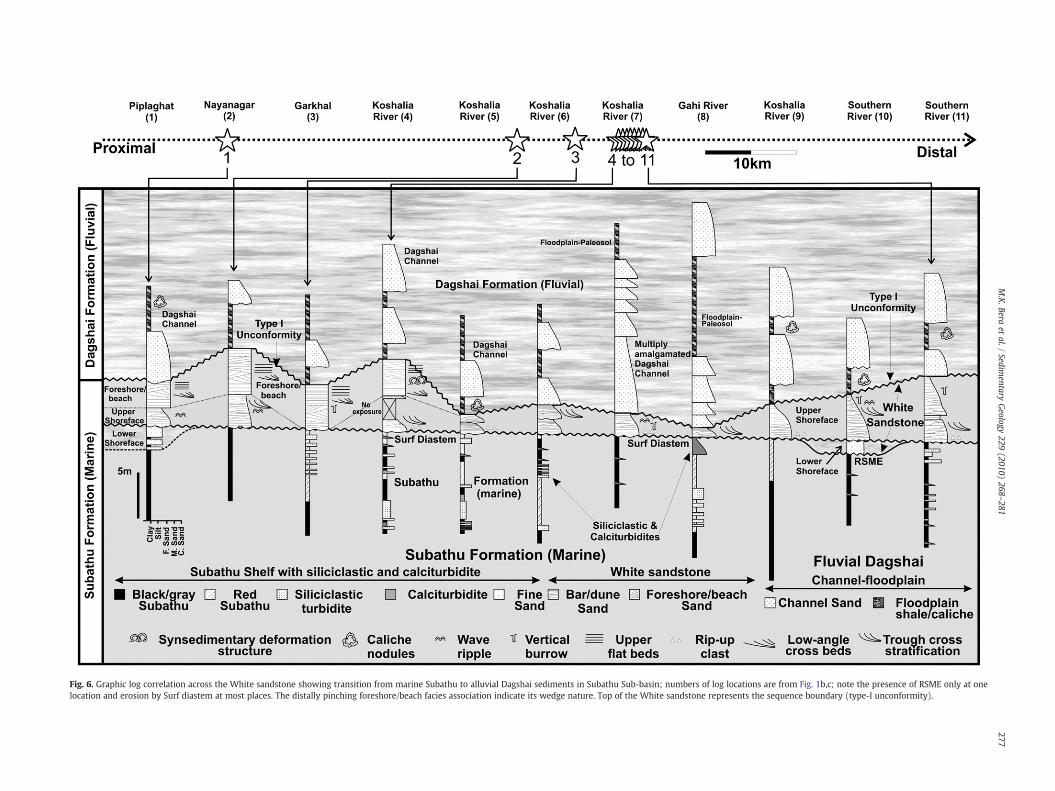
Fig. 6. Graphic log correlation across the White sandstone showing transition from marine Subathu to alluvial Dagshai sediments in Subathu Sub-basin; numbers of log locations are from Fig. 1b,c; note the presence of RSME only at onelocation and erosion by Surf diastem at most places. The distally pinching foreshore/beach facies association indicate its wedge nature. Top of the White sandstone represents the sequence boundary (type-I unconformity).
277M.K.Bera
etal./
Sedimentary
Geology
229(2010)
268–281
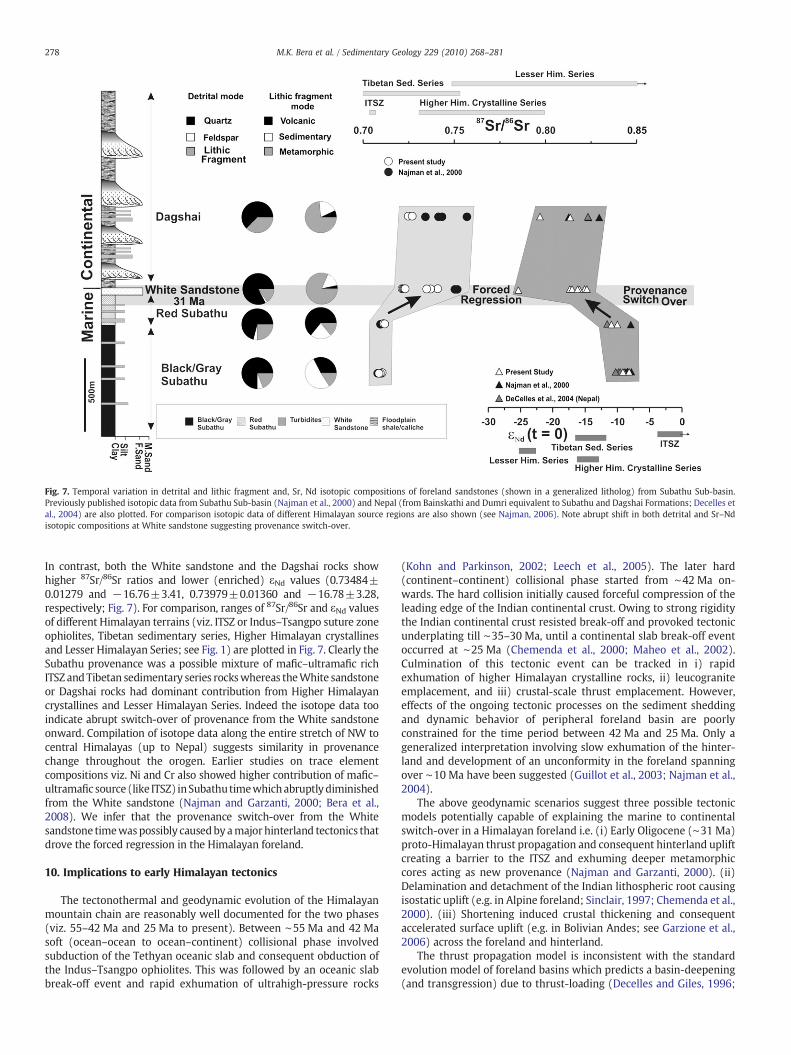
Fig. 7. Temporal variation in detrital and lithic fragment and, Sr, Nd isotopic compositions of foreland sandstones (shown in a generalized litholog) from Subathu Sub-basin.Previously published isotopic data from Subathu Sub-basin (Najman et al., 2000) and Nepal (from Bainskathi and Dumri equivalent to Subathu and Dagshai Formations; Decelles etal., 2004) are also plotted. For comparison isotopic data of different Himalayan source regions are also shown (see Najman, 2006). Note abrupt shift in both detrital and Sr–Ndisotopic compositions at White sandstone suggesting provenance switch-over.
278 M.K. Bera et al. / Sedimentary Geology 229 (2010) 268–281
In contrast, both the White sandstone and the Dagshai rocks showhigher 87Sr/86Sr ratios and lower (enriched) εNd values (0.73484±0.01279 and −16.76±3.41, 0.73979±0.01360 and −16.78±3.28,respectively; Fig. 7). For comparison, ranges of 87Sr/86Sr and εNd valuesof different Himalayan terrains (viz. ITSZ or Indus–Tsangpo suture zoneophiolites, Tibetan sedimentary series, Higher Himalayan crystallinesand Lesser Himalayan Series; see Fig. 1) are plotted in Fig. 7. Clearly theSubathu provenance was a possible mixture of mafic–ultramafic richITSZ andTibetan sedimentary series rockswhereas theWhite sandstoneor Dagshai rocks had dominant contribution from Higher Himalayancrystallines and Lesser Himalayan Series. Indeed the isotope data tooindicate abrupt switch-over of provenance from the White sandstoneonward. Compilation of isotope data along the entire stretch of NW tocentral Himalayas (up to Nepal) suggests similarity in provenancechange throughout the orogen. Earlier studies on trace elementcompositions viz. Ni and Cr also showed higher contribution of mafic–ultramafic source (like ITSZ) inSubathu timewhichabruptlydiminishedfrom the White sandstone (Najman and Garzanti, 2000; Bera et al.,2008). We infer that the provenance switch-over from the Whitesandstone timewaspossibly causedby amajor hinterland tectonics thatdrove the forced regression in the Himalayan foreland.
10. Implications to early Himalayan tectonics
The tectonothermal and geodynamic evolution of the Himalayanmountain chain are reasonably well documented for the two phases(viz. 55–42 Ma and 25 Ma to present). Between ∼55 Ma and 42 Masoft (ocean–ocean to ocean–continent) collisional phase involvedsubduction of the Tethyan oceanic slab and consequent obduction ofthe Indus–Tsangpo ophiolites. This was followed by an oceanic slabbreak-off event and rapid exhumation of ultrahigh-pressure rocks
(Kohn and Parkinson, 2002; Leech et al., 2005). The later hard(continent–continent) collisional phase started from ∼42 Ma on-wards. The hard collision initially caused forceful compression of theleading edge of the Indian continental crust. Owing to strong rigiditythe Indian continental crust resisted break-off and provoked tectonicunderplating till ∼35–30 Ma, until a continental slab break-off eventoccurred at ∼25 Ma (Chemenda et al., 2000; Maheo et al., 2002).Culmination of this tectonic event can be tracked in i) rapidexhumation of higher Himalayan crystalline rocks, ii) leucograniteemplacement, and iii) crustal-scale thrust emplacement. However,effects of the ongoing tectonic processes on the sediment sheddingand dynamic behavior of peripheral foreland basin are poorlyconstrained for the time period between 42 Ma and 25 Ma. Only ageneralized interpretation involving slow exhumation of the hinter-land and development of an unconformity in the foreland spanningover ∼10 Ma have been suggested (Guillot et al., 2003; Najman et al.,2004).
The above geodynamic scenarios suggest three possible tectonicmodels potentially capable of explaining the marine to continentalswitch-over in a Himalayan foreland i.e. (i) Early Oligocene (∼31 Ma)proto-Himalayan thrust propagation and consequent hinterland upliftcreating a barrier to the ITSZ and exhuming deeper metamorphiccores acting as new provenance (Najman and Garzanti, 2000). (ii)Delamination and detachment of the Indian lithospheric root causingisostatic uplift (e.g. in Alpine foreland; Sinclair, 1997; Chemenda et al.,2000). (iii) Shortening induced crustal thickening and consequentaccelerated surface uplift (e.g. in Bolivian Andes; see Garzione et al.,2006) across the foreland and hinterland.
The thrust propagation model is inconsistent with the standardevolution model of foreland basins which predicts a basin-deepening(and transgression) due to thrust-loading (Decelles and Giles, 1996;
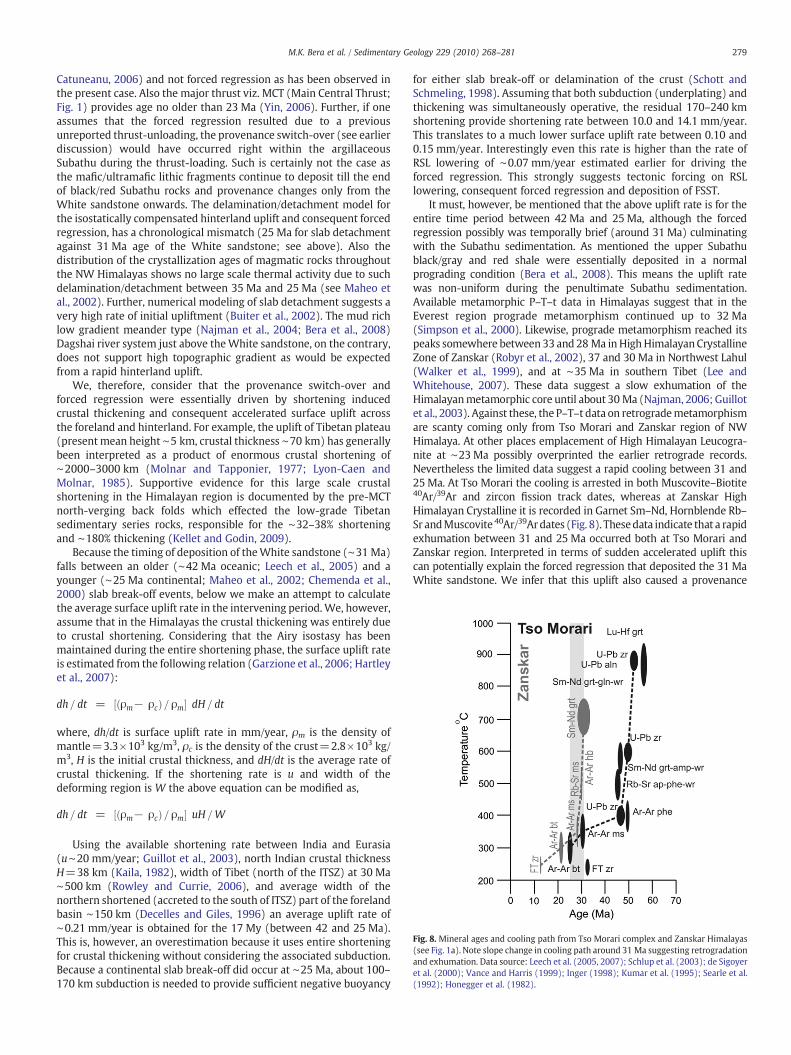
Fig. 8. Mineral ages and cooling path from Tso Morari complex and Zanskar Himalayas(see Fig. 1a). Note slope change in cooling path around 31 Ma suggesting retrogradationand exhumation. Data source: Leech et al. (2005, 2007); Schlup et al. (2003); de Sigoyeret al. (2000); Vance and Harris (1999); Inger (1998); Kumar et al. (1995); Searle et al.(1992); Honegger et al. (1982).
279M.K. Bera et al. / Sedimentary Geology 229 (2010) 268–281
Catuneanu, 2006) and not forced regression as has been observed inthe present case. Also the major thrust viz. MCT (Main Central Thrust;Fig. 1) provides age no older than 23 Ma (Yin, 2006). Further, if oneassumes that the forced regression resulted due to a previousunreported thrust-unloading, the provenance switch-over (see earlierdiscussion) would have occurred right within the argillaceousSubathu during the thrust-loading. Such is certainly not the case asthe mafic/ultramafic lithic fragments continue to deposit till the endof black/red Subathu rocks and provenance changes only from theWhite sandstone onwards. The delamination/detachment model forthe isostatically compensated hinterland uplift and consequent forcedregression, has a chronological mismatch (25 Ma for slab detachmentagainst 31 Ma age of the White sandstone; see above). Also thedistribution of the crystallization ages of magmatic rocks throughoutthe NW Himalayas shows no large scale thermal activity due to suchdelamination/detachment between 35 Ma and 25 Ma (see Maheo etal., 2002). Further, numerical modeling of slab detachment suggests avery high rate of initial upliftment (Buiter et al., 2002). The mud richlow gradient meander type (Najman et al., 2004; Bera et al., 2008)Dagshai river system just above theWhite sandstone, on the contrary,does not support high topographic gradient as would be expectedfrom a rapid hinterland uplift.
We, therefore, consider that the provenance switch-over andforced regression were essentially driven by shortening inducedcrustal thickening and consequent accelerated surface uplift acrossthe foreland and hinterland. For example, the uplift of Tibetan plateau(present mean height ∼5 km, crustal thickness ∼70 km) has generallybeen interpreted as a product of enormous crustal shortening of∼2000–3000 km (Molnar and Tapponier, 1977; Lyon-Caen andMolnar, 1985). Supportive evidence for this large scale crustalshortening in the Himalayan region is documented by the pre-MCTnorth-verging back folds which effected the low-grade Tibetansedimentary series rocks, responsible for the ∼32–38% shorteningand ∼180% thickening (Kellet and Godin, 2009).
Because the timing of deposition of theWhite sandstone (∼31 Ma)falls between an older (∼42 Ma oceanic; Leech et al., 2005) and ayounger (∼25 Ma continental; Maheo et al., 2002; Chemenda et al.,2000) slab break-off events, below we make an attempt to calculatethe average surface uplift rate in the intervening period.We, however,assume that in the Himalayas the crustal thickening was entirely dueto crustal shortening. Considering that the Airy isostasy has beenmaintained during the entire shortening phase, the surface uplift rateis estimated from the following relation (Garzione et al., 2006; Hartleyet al., 2007):
dh= dt = ρm− ρcð Þ= ρm½ � dH = dt
where, dh/dt is surface uplift rate in mm/year, ρm is the density ofmantle=3.3×10³ kg/m3, ρc is the density of the crust=2.8×10³ kg/m3, H is the initial crustal thickness, and dH/dt is the average rate ofcrustal thickening. If the shortening rate is u and width of thedeforming region is W the above equation can be modified as,
dh= dt = ρm− ρcð Þ= ρm½ � uH =W
Using the available shortening rate between India and Eurasia(u∼20 mm/year; Guillot et al., 2003), north Indian crustal thicknessH=38 km (Kaila, 1982), width of Tibet (north of the ITSZ) at 30 Ma∼500 km (Rowley and Currie, 2006), and average width of thenorthern shortened (accreted to the south of ITSZ) part of the forelandbasin ∼150 km (Decelles and Giles, 1996) an average uplift rate of∼0.21 mm/year is obtained for the 17 My (between 42 and 25 Ma).This is, however, an overestimation because it uses entire shorteningfor crustal thickening without considering the associated subduction.Because a continental slab break-off did occur at ∼25 Ma, about 100–170 km subduction is needed to provide sufficient negative buoyancy
for either slab break-off or delamination of the crust (Schott andSchmeling, 1998). Assuming that both subduction (underplating) andthickening was simultaneously operative, the residual 170–240 kmshortening provide shortening rate between 10.0 and 14.1 mm/year.This translates to a much lower surface uplift rate between 0.10 and0.15 mm/year. Interestingly even this rate is higher than the rate ofRSL lowering of ∼0.07 mm/year estimated earlier for driving theforced regression. This strongly suggests tectonic forcing on RSLlowering, consequent forced regression and deposition of FSST.
It must, however, be mentioned that the above uplift rate is for theentire time period between 42 Ma and 25Ma, although the forcedregression possibly was temporally brief (around 31 Ma) culminatingwith the Subathu sedimentation. As mentioned the upper Subathublack/gray and red shale were essentially deposited in a normalprograding condition (Bera et al., 2008). This means the uplift ratewas non-uniform during the penultimate Subathu sedimentation.Available metamorphic P–T–t data in Himalayas suggest that in theEverest region prograde metamorphism continued up to 32 Ma(Simpson et al., 2000). Likewise, prograde metamorphism reached itspeaks somewhere between33 and 28 Ma inHighHimalayanCrystallineZone of Zanskar (Robyr et al., 2002), 37 and 30 Ma in Northwest Lahul(Walker et al., 1999), and at ∼35 Ma in southern Tibet (Lee andWhitehouse, 2007). These data suggest a slow exhumation of theHimalayanmetamorphic core until about 30 Ma (Najman, 2006; Guillotet al., 2003). Against these, the P–T–t data on retrogrademetamorphismare scanty coming only from Tso Morari and Zanskar region of NWHimalaya. At other places emplacement of High Himalayan Leucogra-nite at ∼23Ma possibly overprinted the earlier retrograde records.Nevertheless the limited data suggest a rapid cooling between 31 and25Ma. At Tso Morari the cooling is arrested in both Muscovite–Biotite40Ar/39Ar and zircon fission track dates, whereas at Zanskar HighHimalayan Crystalline it is recorded in Garnet Sm–Nd, Hornblende Rb–Sr andMuscovite 40Ar/39Ardates (Fig. 8). Thesedata indicate that a rapidexhumation between 31 and 25 Ma occurred both at Tso Morari andZanskar region. Interpreted in terms of sudden accelerated uplift thiscan potentially explain the forced regression that deposited the 31 MaWhite sandstone. We infer that this uplift also caused a provenance
280 M.K. Bera et al. / Sedimentary Geology 229 (2010) 268–281
switch-over from mafic–ultramafic source of ITSZ to the exhumedmetamorphics of Tso Morari and Zanskar.
11. Conclusions
(1) Sedimentology and sequence stratigraphic analysis of the∼31 Ma old marker White sandstone unit from the SubathuSub-basin, NW Himalayan foreland, suggests it to be a FRWformed during the transition from marine Subathu Formationto continental Dagshai Formation. The FRW is boundedbetween the “Surf diastem” below and type 1 unconformityat the top and differ from RSME bounded FRWs described fromother classical coastal/foreland settings. Correct identificationof bounding surfaces of a FRW has important implication to theestimation of rate of RSL fall. A fast rate of RSL fall has beenpresumed for the preservation of “Surf diastem” and the uppershoreface but not the RSME and the lower shoreface.
(2) Using the logged thickness of the Subathu/Dagshai transitionzone including theWhite sandstone (bounded between the “Surfdiastem” and unconformity), available chronology and eustaticsea-level fall (0.023 mm/year at 31 Ma), a much higher RSL fallthan the sediment accumulation rate of∼0.07 mm/year has beeninferred during the deposition of the White sandstone.
(3) Petrography of sandstones and their Sr and Nd isotopiccompositions indicate a major provenance switch-over fromdominant mafic/ultramafic to metamorphic source from theWhite sandstone (∼31 Ma) onwards attesting the link betweenhinterland tectonics, provenance and forced regression. Theprovenance switch-over at 31 Ma was earlier inferred to bedriven by proto-Himalayan thrust propagation in the foreland.Using a simple isostatic model, on the contrary, a mechanism ofaccelerated surface uplift (at a rate of 0.1–0.15 mm/year) issuggested for both provenance change and forced regression.
Acknowledgments
This work forms part of the Ph.D. thesis of MKB, who thanks theCouncil of Scientific and Industrial Research (CSIR), New Delhi, for afellowship. AS thanks the Department of Science and Technology(DST), New Delhi, for funding a research project on Paleogenesediments of northwest Himalaya under which the present work wascarried out. PPC thankfully acknowledges the infrastructural facilityextended by the Department of Geology, Delhi University. Wegratefully acknowledge the inspiration provided by S.K. Tandon,Delhi University, for initiating detailed, field-based sedimentologicalstudies in the Subathu Sub-basin.
References
Allen, P.A., Homewood, P.W., Williams, G.D., 1986. Foreland basins: an introduction, In:Allen, P.A., Homewood, P. (Eds.), Foreland basins: International Association ofSedimentologists Special Publication 8, 3–12.
Allen, P.A., Crampton, S.L., Sinclair, H.D., 1991. The inception and early evolution of theNorth Alpine foreland basin, Switzerland. Basin Research 3, 143–163.
Bera, M.K., Sarkar, A., Chakraborty, P.P., Loyal, R.S., Sanyal, P., 2008. Marine tocontinental transition in Himalayan foreland. Geological Society of AmericaBulletin 120, 1214–1232.
Bhatia, S.B., Bhargava, O.N., 2005. Biochronological continuity of the Paleogenesediments of the Himalayan Foreland Basin: paleontological and other evidences.Journal of Asian Earth Science 26, 477–487.
Boggs Jr., S., 1995. Principles of Sedimentology and Stratigraphy, 2nd ed. Prentice-Hall,Inc, New Jersy. 774p.
Buiter, S.J.H., Govers, R., Wortel, M.J.R., 2002. Two-dimensional simulations of surfacedeformation caused by slab detachment. Tectonophysics 354, 195–210.
Catuneanu, O., 2002. Sequence stratigraphy of clastic systems: concepts, merits andpitfalls. Journal of African Earth Science 35, 1–43.
Catuneanu, 2006. Principles of Sequence Stratigraphy. Elsevier. 375p.Chakraborty, P.P., Paul, S., 2008. Forced regressive wedges on a Neoproterozoic
siliciclastic shelf: Chandarpur Group, central India. Precambrian Research 162,227–247.
Chemenda, A.I., Burg, J.P., Mattauer, M., 2000. Evolutionary model of the Himalaya–Tibet system: geopoem based on new modeling, geological and geophysical data.Earth and Planetary Science Letters 174, 397–409.
Clifton, H.E., 1969. Beach lamination: nature and origin. Marine Geology 7, 553–559.Clifton, H.E., 2006. A reexamination of facies models for clastic shorelines. In:
Posamentier, H.W., Walker, R.G. (Eds.), Facies Models Revisited: SEPM SpecialPublication, 84, pp. 293–337.
Collinson, J.D., Thompson, D.B., 1989. Sedimentary Structures, 2nd edition. Chapman &Hall, London. 378p.
de Sigoyer, J., Chavagnac, V., Blichert-Toft, J., Villa, I.M., Luais, B., Guillot, S., Cosca, M.,Mascle, G., 2000. Dating the Indian continental subduction and collisionalthickening in the northwest Himalaya: multichronology of the TsoMorari eclogites.Geology 28, 487–490.
DeCelles, P.G., Giles, K.A., 1996. Foreland basin systems. Basin Research 8, 105–123.DeCelles, P.G., Gehrels, G.E., Najman, Y., Martin, A.J., Garzanti, E., 2004. Detrital
geochronology and geochemistry of Cretaceous–Early Miocene strata of Nepal:implications for timing and diachroneity of initial Himalayan orogenesis. Earth andPlanetary Science Letters 227, 313–330.
Dewey, J.F., 1982. Plate tectonics and the evolution of the British Isles. GeologicalSociety of London Journal 139, 371–414.
Dominguez, J.M.L., Wanless, H.R., 1991. Facies architecture of a falling sea-levelstrandplain, Doce River Coast, Brazil. In: Swift, D.J.P., Oerteal, G.F., Tillman, R.W.,Thorne, J.A. (Eds.), Shelf sand and sandstone bodies: Internal Association ofSedimentologists Special Publication, 14, pp. 259–281.
Eriksson, P.G., Reckzo, B.F.F., Boshoff, A.J., Schrieber, U.M., Van Der Neut, M., Snyman, C.P.,1995. Architectural elements from Lower Proterozoic braid-delta and high energytidal flat deposits in the Magaliesberg Formation, Transvaal Supergroup, South Africa.Sedimentary Geology 97, 99–117.
Fitzsimmons, R., Johnson, S., 2000. Forced regressions: recognition, architecture andgenesis in the Campanian of the Bighorn Basin, Wyoming. In: Hunt, D., Gawthorpe,R.L. (Eds.), Sedimentary Responses to Forced Regressions: Geological Society ofLondon Special Publication, 172, pp. 113–140.
Fraser, C., Hill, P.R., Allard, M., 2005. Morphology and facies architecture of a falling sealevel strandplain, Umiujaq Bay, Canada. Sedimentology 52, 141–160.
Garzione, C.N., Molnar, P., Libarkin, J.C., MacFadden, B.J., 2006. Rapid late Miocene rise ofthe Bolivian Altiplano: evidence for removal of mantle lithosphere. Earth andPlanetary Science Letters 241, 543–556.
Guillot, S., Garzanti, E., Baratoux, D., Marquer, D., Maheo, G., de Sigoyer, J., 2003.Reconstructing the total shortening history of the NW Himalaya. Geochemistry,Geophysics, Geosystems 4, 1064. doi:10.1029/2002GC000484.
Hampson, G.J., 2000. Discontinuity surfaces, clinoforms, and facies architecture in awave-dominated, shoreface–shelf parasequence. Journal of Sedimentary Research70, 325–340.
Hampson, G.J., Burgess, P.M., Howell, J.A., 2001. Shoreface tongue geometry constrainshistory of relative sea-level fall: examples from late Cretaceous strata in the BookCliffs area, Utah. Terra Nova 13, 188–196.
Hartley, A.J., Sempere, T., Wörner, G., 2007. A comment on “Rapid late Miocene rise ofthe Bolivian Altiplano: Evidence for removal of mantle lithosphere” by C.N.Garzione et al. [Earth Planet. Sci. Lett. 241 (2006) 543–556]. Earth and PlanetaryScience Letters 259, 625–629.
Honegger, K., Kietrich, V., Frank, W., Gansser, A., Thoni, M., Trommsdorff, V., 1982.Magmatism and metamorphism in the Ladakh Himalayas (the Indus–Tsangposuture zone). Earth and Planetary Science Letters 60, 253–292.
Hunt, D., Tucker, M.E., 1992. Stranded parasequences and the forced regressive wedgesystems tract: deposition durig base level fall. Sedimentary Geology 81, 1–9.
Inger, S., 1998. Timing of an extensional detachment during convergent orogeny: newRb–Sr geochronological data from the Zanskar shear zone, northwestern Himalaya.Geology 26, 223–226.
Jain, A.K., Lal, Nand, Sulemani, B., Awasthi, A.K., Singh, Sandeep, Kumar, Rajeev, Kumar,Devender, 2009. Detrital-zircon fission-track ages from the Lower Cenozoicsediments, NW Himalayan foreland basin: Clues for exhumation and denudationof the Himalaya during the India–Asia collision. Geological Society of AmericaBulletin 121, 519–535.
Kaila, K.L., 1982. Deep seismic sounding studies in India. Geophysical Research Bulletin20, 309–328.
Kellet, D.A., Godin, L., 2009. Pre-Miocene deformation of the Himalayan superstructure,Hidden valley, central Nepal. Journal of the Geological Society of London 166, 1–14.
Khan, A.U., Prasad, S., 1998. Geological Quadrangle Map 53F. Geological Survey of India.Kohn, M.J., Parkinson, C.D., 2002. Petrologic case for Eocene slab breakoff during the
Indo–Asian collision. Geology 30, 591–594.Kumar, A., Lal, N., Jain, A.K., Sorkhabi, R.B., 1995. Late Cenozoic–Quaternary thermo-
tectonic history of Higher Himalayan Crystalline (HHC) in Kishtwar–Padar–Zanskarregion, NW Himalaya—Evidence from fission-track ages. Journal of the GeologicalSociety of India 45, 375–391.
Lee, J., Whitehouse, M.J., 2007. Onset of mid-crustal extensional flow in southern Tibet:evidence from U/Pb zircon ages. Geology 35, 45–48.
Leech, M., Singh, S., Jain, A.K., Klemperer, S.L., Manickavasagam, R.M., 2005. The onset ofIndia–Asia continental collision: Early, steep subduction required by the timing ofUHP metamorphism in the western Himalaya. Earth and Planetary Science Letters234, 83–97.
Leech, M.L., Singh, S., Jain, A.K., 2007. Continuous metamorphic zircon growth andinterpretation of U–Pb SHRIMP dating: an example from the western Himalaya.International Geology Review 49, 313–328.
Lyon-Caen, H., Molnar, P., 1985. Gravity anomalies, flexure of the Indian plate, and thestructure, support and evolution of the Himalaya and Ganga basin. Tectonics 4,513–538.
281M.K. Bera et al. / Sedimentary Geology 229 (2010) 268–281
Maheo, G., Guillot, S., Blichert-Toft, J., Rolland, Y., Pecher, A., 2002. A slab breakoff modelfor the Neogene thermal evolution of south Karakorum and south Tibet. Earth andPlanetary Science Letters 195, 45–58.
Mathur, N.S., 1978. Biostratigraphical aspect of the Subathu Formation, KumaunHimalaya. Recent Researches in Geology 5, 96–112.
McKee, E.D., Crosby, E.J., Berryhill Jr., H.L., 1967. Flood deposits, Bijou Creek, Colorado,June 1965. Journal of Sedimentary Petrology 34, 829–851.
Miller, K.G., Kominz, M.A., Browning, J.V., Wright, J.D., Mountain, G.S., Katz, M.E.,Sugarman, P.J., Cramer, B.S.N., Christie-Blick, N., Pekar, S.F., 2005. The Phanerozoicrecord of global sea-level change. Science 310, 1293–1298.
Molnar, P., Tapponier, P., 1977. The collision between India and Eurasia. ScientificAmerican 236, 30–42.
Mukhopadhyay, D.K., Mishra, P., 1999. A balanced cross section across the Himalayanforeland belt, the Punjab and Himachal foothills: a reinterpretation of structuralstyles and evolution. Proceedings of the Indian Academy of Sciences (Earth andPlanetary Sciences) 108, 189–205.
Najman, Y., 2006. The detrital record of orogenesis: a review of approaches andtechniques used in the Himalayan sedimentary basins. Earth Science Reviews 74,1–72.
Najman, Y., Garzanti, E., 2000. Reconstructing early Himalayan tectonic evolution andpaleogeography from Tertiary foreland basin sedimentary rocks, northern India.Geological Society of America Bulletin 112, 435–449.
Najman, Y., Clift, P., Johnson, M.R.W., Robertson, A.H.F., 1993. Early stages of forelandbasin evolution in the Lesser Himalaya, N. India. In: Treloar, P.J., Searle, M.P.(Eds.), Himalayan Tectonics: Geological Society of London Special Publication,74, pp. 541–558.
Najman, Y., Pringle, M.S., Johnson, M.R.W., Robertson, A.H.F., Wijbrans, J.R., 1997. LaserAr-40/Ar-39 dating of single detrital muscovite grains from early foreland-basinsedimentary deposits in India: Implications for early Himalayan evolution. Geology25, 535–538.
Najman, Y., Bickle, M., Chapman, H., 2000. Early Himalayan exhumation: isotopicconstraints from the Indian foreland basin. Terra Nova 12, 28–34.
Najman, Y., Johnson, K., White, N., Oliver, G., 2004. Evolution of Himalayan forelandbasin, NW India. Basin Research 16, 1–24.
Nelson, B.K., DePaolo, D.J., 1988. Comparison of isotopic and petrographic provenanceindicators in sediments from Tertiary continental basins of New Mexico. Journal ofSedimentary Petrology 58, 348–357.
Plint, A.G., 1988. Sharp-based shoreface sequences and ‘offshore bars’ in the CardiumFormation of Alberta: their relationship to relative changes in sea level. In: Wilgus,C.K., Hastings, B.S., Kendall, C.G.St.C., Posamentier, H.W., Ross, C.A., Van Wagoner, J.C.(Eds.), Sea Level Changes—An Integrated Approach: SEPM Special Publication,42, pp. 357–370.
Plint, A.G., Nummedal, D., 2000. The falling stage systems tract: recognition andimportance in sequence stratigraphic analysis. In: Hunt, D., Gawthorpe, D.L. (Eds.),Sedimentary Responses to Forced Regressions: Geological Society Special Publica-tion, 172, pp. 1–17.
Robyr, M., Vannay, J.C., Epard, J.L., Steck, A., 2002. Thrusting, extension, and domingduring the polyphase tectonometamorphic evolution of the High HimalayanCrystalline Zone in NW India. Journal of Asian Earth Science 21, 221–239.
Rowley, D.B., Currie, B.S., 2006. Palaeo-altimetry of the late Eocene to Miocene Lunpolabasin, central Tibet. Nature 439, 677–681.
Sangode, S.J., Kumar, R., Siddaiah, N.S., 2005. Magnetic polarity and rock magneticstudies across marine to continental transition (Subathu–Dagshai sequence) in theHimalayan Foreland. Proceedings Asia Oceania Geosciences meeting, p. 284.Singapore.
Sarkar, S., Chakraborty, P.P., Bose, P.K., 1996. Proterozoic Lakheri Limestone, CentralIndia: facies, paleogeography and physiography. In: Bhattacharya, A. (Ed.), RecentAdvances in Vindhyan Geology: Memoir Geological Society India, 36, pp. 5–25.
Savoy, L.E., Stevenson, R.K., Mountjoy, E.W., 2000. Provenance of Upper Devonian–Lower Carboniferous miogeoclinal strata, southeastern Canadian Cordillera: linkbetween tectonics and sedimentation. Journal of Sedimentary Research 70,181–193.
Schlup, M., Carter, A., Cosca, M., Steck, A., 2003. Exhumation history of eastern Ladakhrevealed by Ar-40/Ar-39 and fission-track ages: the Indus River-Tso Moraritransect, NW Himalaya. Journal of the Geological Society 160, 385–399.
Schott, B., Schmeling, H., 1998. Delamination and detachment of a lithospheric root.Tectonophysics 296, 225–247.
Searle, M.P., Waters, D.J., Rex, D.C., Wilson, R.N., 1992. Pressure, temperature and timeconstraints on Himalayan metamorphism from eastern Kashmir and WesternZanskar. Journal of the Geological Society 149, 753–773.
Seidler, L., Steel, R., 2001. Pinch-out style and position of tidally influenced strata in aregressive-transgressivewave dominated deltaic sand body, Twentymile Sand-stone, Mesaverde Group, NW Colorado. Sedimentology 48, 339–414.
Simpson, R.L., Parrish, R.R., Searle, M.P., Waters, D.J., 2000. Two episodes of monazitecrystallization during metamorphism and crustal melting in the Everest region ofthe Nepalese Himalaya. Geology 28, 403–406. doi:10.1130/0091-7613(2000)28b403: TEOMCDN2.0.CO;2.
Sinclair, H.D., 1997. Tectonostratigraphic model for underfilled peripheral forelandbasins: an Alpine perspective. Geological Society of America Bulletin 109, 324–346.
Singh, H.P., Khanna, A.K., 1980. Palynology of the Paleogene marginal sediments ofHimachal Pradesh, India. Proceedings IVth International Palynological Conferance.Lucknow 1, 462–471.
Singh, B.P., Andotra, D.S., Kumar, R., 2000. Provenance of lower Tertiarymudrocks in theJammu Sub-Himalayan Zone, Jammu and Kashmir State (India), NW Himalaya andits tectonic. Geoscience Journal 4, 1–9.
Srivastava, V.K., Kasshyap, S.M., 1983. Evolution of the pre-Siwalik Tertiary basins ofHimachal Himalaya. Journal of the Geological Society of India 24, 134–147.
Stockmal, G., Beaumont, C., Boutilier, R., 1986. Geodynamic models of convergentmargin tectonics: Transition from rifted margin to overthrust belt and con-sequences for foreland basin development. American Association of PetroleumGeologists Bulletin 70, 181–190.
Stockmal, G.S., Beaumont, C., 1987. Geodynamic models of convergent margintectonics: The Southern Canadian cordillera and the Swiss Alps, In: Beaumont, C.,Tankard, A.J. (Eds.), Sedimentary basins and basin–forming mechanisms. CanadianSociety of Petroleum Geologists Memoir 12, 93–411.
Storms, J.E.A., 2003. Event-based stratigraphic simulation of wave-dominated shallow-marine environments. Marine Geology 199, 83–100.
Swift, D.J.P., Parsons, B.S., Foyle, A., Oertel, G.F., 2003. Between beds and sequences:stratigraphic organization at intermediate scales in the Quaternary of the Virginiacoast, USA. Sedimentology 50, 81–111.
Tamura, T., Nanayama, F., Saito, T., Murakami, F., Nakashima, R., Watanabe, K., 2007.Intra-shoreface erosion in response to rapid sea-level fall: depositional record of atectonically uplifted strand plain, Pacific coast of Japan. Sedimentology 54,1149–1162.
Tanaka, T., Togashi, S., Kamioka, H., Amakawa, H., Kagami, H., Hamamoto, T., Yuhara, M.,Oribashi, Y., Yoneda, S., Shimuzu, H., Kuminaru, T., Takahashi, K., Yanagi, T., Nakano,T., Fujimaki, H., Shinjo, R., Asahara, Y., Tanimizu, M., Dragusanu, C., 2000. JNdi-1: aneodymium isotopic reference in consistency with La Jolla neodymium. ChemicalGeology 168, 279–281.
Tirsgaard, H., 1993. The architecture of Precambrian high energy tidal channel deposits:an example from the Lyell Lond Group (Eloomore Bay Supergroup), northeastGreenland. Sedimentary Geology 88, 137–152.
Uddin, A., Lungberg, N., 1998. Cenozoic history of the Himalayan–Bengal system: sandcomposition in the Bengal Basin, Bangladesh. Geological Society of America Bulletin110, 497–511.
Vance, D., Harris, N., 1999. Timing of prograde metamorphism in the Zanskar Himalaya.Geology 27, 395–398.
Walker, R.G., Plint, A.G., 1992. Wave and storm-dominated shallow marine systems. In:Walker, R.G., James, N.P. (Eds.), Facies Models: Response to Sea-Level Change.Geological Association of Canada, St John's, Newfoundland, pp. 219–238.
Walker, J.D., Martin, M.W., Bowring, S.A., Searle, M.P., Waters, D.J., Hodges, K.V., 1999.Metamorphism, melting, and extension: age constraints from the High HimalayanSlab of Southeast Zanskar and Northwest Lahul. Journal of Geology 107, 473–495.
Watts, A.B., 1992. The effective elastic thickness of the lithosphere and the evolution offoreland basins. Basin Research 4, 169–178.
Yin, A., 2006. Cenozoic tectonic evolution of the Himalayan orogen as constrained byalong-strike variation of structural geometry, exhumation history, and forelandsedimentation. Earth Science Reviews v.76, 1–131.
Copyright © 2022 FDOKUMEN