Spatiotemporal Analysis of Drought Characteristics in ...
13
See discussions, stats, and author profiles for this publication at: http://www.researchgate.net/publication/271200072 Spatiotemporal Analysis of Drought Characteristics in Bundelkhand Region of Central India using Standardized Precipitation Index ARTICLE in JOURNAL OF HYDROLOGIC ENGINEERING · MARCH 2015 Impact Factor: 1.58 · DOI: 10.1061/(ASCE)HE.1943-5584.0001189 READS 122 3 AUTHORS, INCLUDING: T. Thomas National Institute of Hydrology 76 PUBLICATIONS 450 CITATIONS SEE PROFILE P. C. Nayak National Institute of Hydrology 28 PUBLICATIONS 795 CITATIONS SEE PROFILE All in-text references underlinedinbluearelinked to publications on ResearchGate, letting you access and read them immediately. Availablefrom: P. C. Nayak Retrieved on: 11 December 2015
-
Upload
khangminh22 -
Category
Documents
-
view
0 -
download
0
Transcript of Spatiotemporal Analysis of Drought Characteristics in ...

Seediscussions,stats,andauthorprofilesforthispublicationat:http://www.researchgate.net/publication/271200072
SpatiotemporalAnalysisofDroughtCharacteristicsinBundelkhandRegionofCentralIndiausingStandardizedPrecipitationIndex
ARTICLEinJOURNALOFHYDROLOGICENGINEERING·MARCH2015ImpactFactor:1.58·DOI:10.1061/(ASCE)HE.1943-5584.0001189
READS
122
3AUTHORS,INCLUDING:
T.Thomas
NationalInstituteofHydrology
76PUBLICATIONS450CITATIONS
SEEPROFILE
P.C.Nayak
NationalInstituteofHydrology
28PUBLICATIONS795CITATIONS
SEEPROFILE
Allin-textreferencesunderlinedinbluearelinkedtopublicationsonResearchGate,
lettingyouaccessandreadthemimmediately.
Availablefrom:P.C.Nayak
Retrievedon:11December2015

Case Study
Spatiotemporal Analysis of Drought Characteristics inthe Bundelkhand Region of Central India using the
Standardized Precipitation IndexT. Thomas1; P. C. Nayak2; and Narayan C. Ghosh3
Abstract: The spatiotemporal variations of the drought scenario over the Bundelkhand region in central India have been studied using thestandardized precipitation index (SPI) for the time scales of 3, 6, and 12 months. The space-time variability of the drought characteristics hasbeen analyzed using the SPI, which is based only on long-term monthly rainfall data. From this analysis, it is determined that the frequencyand severity of droughts have increased over the last decade in the Bundelkhand region and varied between once in 3 years and once in5 years. The nonparametric Mann-Kendall test for trend analysis of climatic variables has been applied to investigate the regular occurrencesof drought during the last few decades. The sign test indicates that there is a falling trend in the seasonal rainfall and number of rainy days in afew blocks. However, statistically significant falling trends at a 95% confidence level have been observed with the 3-month SPI for manyblocks in the region, indicative of the increasing severity of drought during the principal rainy months (July, August, and September). Thespatiotemporal analysis, which included progression and withdrawal of drought over the region, indicates that every drought event has its ownunique characteristics, including its onset, severity, frequency, duration, area of influence and the magnitude of the losses caused by it. Theseverity of recent drought events shows a more widespread aerial extent in the region. It is observed that the area under the influence ofdrought in the Bundelkhand during the year 2007 varied between 79.5% (July) and 100% (August). The comprehensive analysis does notindicate any climate change signal and study recommends that effective use of water resources may be the key to address the drought inBundelkhand region. DOI: 10.1061/(ASCE)HE.1943-5584.0001189. © 2015 American Society of Civil Engineers.
Author keywords: Standardized precipitation index; Trend analysis; Drought characteristics; Time scales; Bundelkhand.
Introduction
It is expected that the projected global temperature rise due to in-creases in greenhouse gas emissions will lead to intensification ofthe global hydrological cycle that may result in hydrological ex-tremes, including droughts and floods (Bates et al. 2008). The cli-mate change implications in arid and semiarid regions will be morepronounced, possibly in terms of increase in droughts. The ex-pected changes in drought characteristics may have enormous im-pacts on water resource management, agricultural production, andsustainability of aquatic ecosystems. Therefore, analysis of droughtand its severity for a river basin that supports agriculture and otherhuman needs and aquatic ecosystems is necessary for better plan-ning and management of water resources. It is difficult to monitoran incoming drought event, and for that reason, planning for aneffective drought mitigation strategy is very challenging. Eventhough drought affects large areas worldwide and has serious im-pacts on society, the environment, and the economy, it remains one
of the least understood of all weather phenomena (Rossi et al. 1992;Obasi 1994).
Droughts cannot be avoided, but they can be predicted andmonitored to alleviate their adverse impacts (Agnew 1990; Agnewand Warren 1996; Le Houerou 1996; Palmer 1965; Smakhtin andHughes 2007). Droughts are classified into meteorological, agricul-tural, hydrological, and socioeconomic droughts. A comprehensiveanalysis of the spatial and temporal extension of droughts can helpdevelop drought-monitoring signals based on relevant droughtindexes (Chiew et al. 1998; Moreira et al. 2006; Rossi 2003;Sivakumar and Wilhite 2002). Various researchers have developedseveral drought indexes, such as the Palmer Drought Severity Index(Palmer 1965), Deciles (Gibbs and Maher 1967), crop moistureindex (Palmer 1968), Food and Agriculture Organization (FAO)water satisfaction index (Frere and Popov 1979), surface watersupply index (Shafer and Dezman 1982), normalized differencevegetation index (Kogan 1990), agro-hydro potential (Petrasovits1990), standardized precipitation index (McKee et al. 1993), andindexes of low flow (Smakhtin 2001). The selection of a particularindex to characterize droughts depends on the purpose of a study,data availability, and the hydrological regime.
The standardized precipitation index (SPI), which is linked tothe probability of occurrence of dry or wet events, has been usedby many investigators effectively for real-time monitoring of theintensity and spatial extension of droughts, at different time scalesof 3, 6, 12, and 24 months. Harsch (1992) suggested that whendeficiency in precipitation results in crop damage, a common timescale for agricultural droughts is 3–6 months, depending on thecrops grown and the climatic conditions. It takes longer for precipi-tation deficits to become apparent in soil moisture, stream flow, andgroundwater and reservoir levels. Hydrological drought, on theother hand, is associated with precipitation shortages on a longer
1Scientist “C,” Ganga Plains South Regional Centre, National Instituteof Hydrology, Walmi Campus Bhopal, Madhya Pradesh 462042, India.E-mail: [email protected]
2Scientist “D,” Deltaic Regional Centre, National Institute ofHydrology, Siddartha Nagar, Kakinada, Andhra Pradesh 533003, India(corresponding author). E-mail: [email protected]; [email protected]
3Scientist “G,” Ground Water Hydrology Division, National Institute ofHydrology, Roorkee, Uttrakhand 247667, India. E-mail: [email protected]
Note. This manuscript was submitted on August 12, 2014; approved onJanuary 20, 2015; published online on March 5, 2015. Discussion periodopen until August 5, 2015; separate discussions must be submitted for in-dividual papers. This paper is part of the Journal of Hydrologic Engineer-ing, © ASCE, ISSN 1084-0699/05015004(12)/$25.00.
© ASCE 05015004-1 J. Hydrol. Eng.
J. Hydrol. Eng.
Dow
nloa
ded
from
asc
elib
rary
.org
by
Nat
iona
l Ins
t of
Hyd
rolo
gy -
Roo
rkee
on
03/1
0/15
. Cop
yrig
ht A
SCE
. For
per
sona
l use
onl
y; a
ll ri
ghts
res
erve
d.
6 months to 2 years, which affects the surface or subsurface wateravailability (Meigh et al. 1999). Therefore, it is necessary to use adrought index for different time scales to assess the meteorologicaland hydrological drought characteristics simultaneously. Hayeset al. (1999) used the SPI to monitor the drought in the UnitedStates and concluded that SPI can be used operationally to detectthe start of a drought, its spatial extension, and temporal progres-sion. SPI has also been applied in Turkey (Komuscu 1999), Argen-tina (Seiler et al. 2002), Canada (Anctil et al. 2002), Spain (Lanaet al. 2001), Hungary (Domonkos 2003), China (Wu et al. 2001),and Europe (Lloyd-Hughes and Saunders 2002) for real-time mon-itoring or retrospective analysis of droughts.
Wenhong et al. (2008) studied the changes in the SPI and itspotential causes and implications to future climate change in theAmazon region and observed that the SPI decreased at a rate of0.32 per decade over the southern Amazon region during 1970–1999. Lacatos et al. (2010) analyzed the long-term SPI time seriesto identify the changes in the drought frequency in Hungary andfound no significant changes. Murat and Hasan (2009) used theSPI and a modified SPI for shaping the drought probabilities overTurkey. Masoudi and Afrough (2011) analyzed the trends of pre-cipitation for humid, normal, and drought classes using SPI for Iranand concluded that humid areas do not experience any trend, nor-mal areas have a decreasing trend, and dry areas show an increasingtrend. Many investigations (Sonmez et al. 2005; Burke and Brown2007; Owrangi et al. 2011; Golian et al. 2015) used the SPI to studythe geographical variations in drought events at multiple time steps.Sigdel and Ikeda (2010) used the 3-month time scale and 12-monthtime scale SPI with the principal component analysis (PCA) forstudy of the spatial and temporal analysis of drought and its rela-tionships with climate indexes [namely, the Southern oscillationindex (SOI) and Indian Ocean dipole mode index (DMI)]. Someresearchers (Vicente-Serrano 2012; Jahangir et al. 2013; Asadiand Vahdat 2013) used the SPI and other indexes to evaluate thespatial and temporal drought characteristics in various regionsacross the globe.
Many parts of India are confronting mild to severe drought. Outof the total geographical area of India, almost one-sixth of it, with12% of the population, is drought prone.
Many studies in India have done drought analyses. For instance,Mishra and Desai (2005) used the ARIMA linear stochastic modeland the multiplicative seasonal autoregressive integrated movingaverage (SARIMA) model to forecast drought in the Purulia districtof West Bengal state in eastern India. Bhuiyan et al. (2006) studieddrought in the hard-rock hilly Aravalli terrain of the Rajasthanprovince using SPI and the standardized water-level index (SWI)to assess the groundwater recharge deficit. Naresh et al. (2009)used the SPI for drought-intensity assessment in Ananthpur andKhammam of Andhra Pradesh, India, and suggested that SPI asa stand-alone indicator should be used with caution to assessdrought intensity. Mishra and Nagarajan (2011) presented a frame-work of methodologies for the assessment of drought occurrences,as well as identifying various drought characteristics for the Telwatershed in Odisha, India. Naresh et al. (2012) used the griddedð1° × 1°Þ daily rainfall data generated by the India MeteorologicalDepartment to study the spatial and temporal patterns of droughtoccurrence in the country using SPI. Kar and Saha (2012) analyzedmeteorological drought scenarios in West Bengal, India, usingSPI. Choudhary et al. (2013) used the normalized deviation (ND),De Martonne’s index (IA), pluvothermic quotient (PQ), negativemoisture index (NMI), and SPI to study the spatial pattern ofmeteorological drought and concluded that extreme and severedrought conditions prevailed during the drought of 2002. Jhaet al. (2013) used the CRU TS3.0 gridded 0.5° × 0.5° monthly
precipitation data set for each of the 14 mainland agro-climaticzones (ACZs) of India for individual months (June, July, August,and September) and summer monsoon season for 56 years (1951–2006); and the results of the Mann Kendall (MK) test for detectingtrends in the representative SPI of the ACZs showed that 6 out of14 mainland ACZs saw a significant trend during the summermonsoon. Based on the SPI analysis for Puruliya district in WestBengal, Palchaudhuri and Biswas (2013) concluded that severe andextreme droughts occurred mostly in the northeast, northwest, andsouthwest parts of the district. Mundeta and Sharma (2014)analyzed the rainfall and floods in Rajasthan state using SPI anddetected a greater tendency of mild drought in the short term, witha noticeable increase in severe drought over longer time scales.Shamsnia (2014) compared the reconnaissance drought index(RDI) to the SPI, and recommended the use of SPI for shorter timescales (1, 3, and 6 months) since the dry and wet periods at shortertime scales depend on both evapotranspiration and precipitation.Jalpa et al. (2014) studied various drought indexes and concludedthat SPI permits comparisons over space and time better than anyother index. Rachchh and Bhatt (2014) monitored the drought inRajkot district in Gujrat using SPI and observed that a severedrought occurred in 1987, and the drought frequency in Rajkotwas 1 every 2 years. Many other researchers (e.g., Niranjan et al.2013; Naresh et al. 2009; Gaikwad and Bhosale 2014; Prabhakaret al. 2011) have applied SPI to analyze the drought characteristicsin various parts of India.
Study Objectives
Over the last decade, the Bundelkhand region has been witnessingfrequent and prolonged multiyear droughts, with tremendoussocietal and economic impacts leading to large-scale migrationof local populations. The problems have been further compoundedby growing population, lack of water resource developmentprojects, neglect of the traditional water harvesting systems, andadoption of water intensive commercial crops, which has led toa regular water-stressed environment in the region. Under suchsituations, the rational management of water resources is possibleonly by analyzing the temporal and spatial characteristics ofdrought and evaluating its potential impact for attaining water secu-rity through adequate drought-proofing mechanisms. Few studieson some of the aspects of the drought in Bundelkhand region atsmaller scales pertaining to a specific basin or area have been car-ried out by various researchers viz., Pandey et al. (2010), Jain et al.(2012), and Alam et al. (2014). In the current investigation, long-term rainfall data pertaining to various blocks (more than 70) of theBundelkhand region, covering an area of about 71; 619 km2, havebeen used to examine spatial and temporal variations of droughtand its impact on surface water, groundwater, and soil moistureavailability, as well as to develop a drought management planfor the region. Therefore, the main objectives of the study include(1) evaluation of the spatiotemporal variations of meteorologicaldrought characteristics; and (2) investigation of climate change sig-nals using the trend analysis of climatic data and SPI time series.
Study Area Details
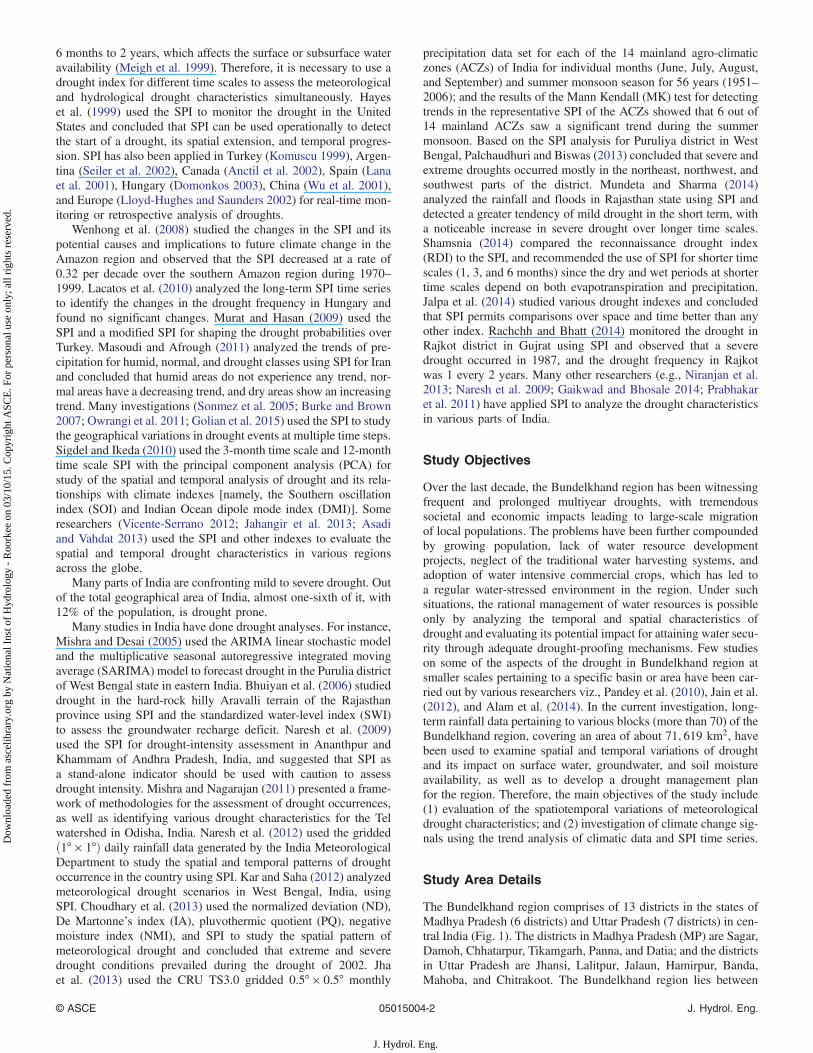
The Bundelkhand region comprises of 13 districts in the states ofMadhya Pradesh (6 districts) and Uttar Pradesh (7 districts) in cen-tral India (Fig. 1). The districts in Madhya Pradesh (MP) are Sagar,Damoh, Chhatarpur, Tikamgarh, Panna, and Datia; and the districtsin Uttar Pradesh are Jhansi, Lalitpur, Jalaun, Hamirpur, Banda,Mahoba, and Chitrakoot. The Bundelkhand region lies between
© ASCE 05015004-2 J. Hydrol. Eng.
J. Hydrol. Eng.
Dow
nloa
ded
from
asc
elib
rary
.org
by
Nat
iona
l Ins
t of
Hyd
rolo
gy -
Roo
rkee
on
03/1
0/15
. Cop
yrig
ht A
SCE
. For
per
sona
l use
onl
y; a
ll ri
ghts
res
erve
d.

23°08′ N and 26°30′ N latitude and 78°11′ E and 81°30′ E longitude,with a total area of 71; 619 km2, and it was once well known for itsvast natural resources and traditional water management systems.About 82% of the total population of 18.3 million (Census of India2011) depends on agriculture, the majority of which is rain-fed.
The major rivers traversing the study area include Sindh, Betwa,Ken, Bagahin, Tons, Pahuj, Dhasan, and Chambal, and they con-stitute part of the Ganga basin. The topography of the region ishighly undulating, with rocky outcrops and boulder-strewn plainsin a rugged landscape. Soybeans and wheat are the principal cropsgrown in kharif and rabi season, respectively. The major soils in-clude alluvial, medium black, and mixed red and black soils. Theaverage annual rainfall varies between 783 mm at Jhansi and1,260 mm at Damoh, with a coefficient of variation of more than30% in most of the blocks in the region. About 90% of the annualrainfall occurs during the southwest monsoon (from mid-June toearly October), and most of the monsoon surface runoff is lostowing to few water resource development projects.
Materials and Methods
Standardized Precipitation Index
The SPI allocates a single numeric value to the precipitationthat ranges between −3 and 3, and it can be compared acrossregions with different climates. In principle, the SPI is the numberof standard deviations that the observed value would deviate fromthe long-term mean for a normally distributed random variable.Since precipitation is not normally distributed, a transformationis first applied so that the transformed precipitation values followa normal distribution. The SPI allows for determining the occur-rence probability of dry and wet events at time scales varying from3 to 24 months, and monthly rainfall data for at least 30 years arerequired (Hayes et al. 1999).
The selection of the correct distribution function that bestdescribes the distribution of the monthly precipitation timeseries can be performed with L-moment ratio diagrams
Fig. 1. Index map of the Bundelkhand region in Madhya Pradesh and Uttar Pradesh
© ASCE 05015004-3 J. Hydrol. Eng.
J. Hydrol. Eng.
Dow
nloa
ded
from
asc
elib
rary
.org
by
Nat
iona
l Ins
t of
Hyd
rolo
gy -
Roo
rkee
on
03/1
0/15
. Cop
yrig
ht A
SCE
. For
per
sona
l use
onl
y; a
ll ri
ghts
res
erve
d.

(Hosking and Wallis 1997). In this study, the Kolmogorov-Smirnov test was used to select the two-parameter gamma prob-ability density function (Sprent and Smeeton 2001; Yevjevich1972). The parameters were estimated using the maximum like-lihood approach (McKee et al. 1993). Data sets pertaining to timescales of 3, 6, and 12 months were used for the estimation of SPI,and the gamma probability density function was fitted to each dataset. With the equal-probability transformation, the gamma cumu-lative distribution function converges to the standardized normalcumulative distribution function with a mean of zero and standarddeviation of unity. This standardization gives the advantage ofhaving consistent values in space and time for the frequencyof extreme dry and wet events. Estimation of the parameters ofthe distribution and their use to find the cumulative probabilityof an observed precipitation event for a given month and requiredtime scale can be found in the standard literature. The cumulativeprobability was then transformed to the standard normal randomvariable Z with a mean of zero and variance of 1, which is thevalue of the SPI.
A drought event occurs during the period when the SPI is con-tinuously negative, with an intensity of −1.0 or less. As the thresh-old alteration from drought to wet conditions is sudden and veryfast in the classification due to the gap between drought andwet being zero (McKee et al. 1993), a modified classificationwas used in the drought analysis, in which SPI values in the rangeof −0.50 to −0.99 represent mild drought, −1.0 to −1.49 representmoderate drought, −1.50 to −1.99 represent severe drought, and>2.0 represent extreme drought.
The SPI had been compared with other indexes (Keyantashand Dracup 2002) and is now integrated into the set of indexesused by the U.S. Drought Monitor (Svoboda et al. 2002). Thedrought characteristics, including frequency, duration, intensity,and magnitude (severity), can be calculated with SPI. The positivesum of the negative SPIs for all the months within a drought eventis the drought magnitude (severity). The division of drought mag-nitude by its duration gives the intensity of that particulardrought event.
Mann-Kendall Test
The nonparametric Mann-Kendall test extensively used by manyresearchers (Taylor and Loftis 1989; Burn 1994; Burn et al.2004) has been applied to identify the trends in the climatic vari-ables and SPI time series. One of the main considerations for thistest is to identify whether the data are serially correlated, and there-fore the data series of various areas were tested for serial correla-tion, before applying the test. If the lag-1 autocorrelation (r1) isfound to be nonsignificant at the 95% confidence level, then theMK test is applied to the original data series (x1; x2; : : : ; xn); oth-erwise, the MK test is applied to the prewhitened series obtained as(x2 − r1 × x1; x3 − r1 × x2; : : : ; xn − r1 × xn−1) (Von Storchandand Navarra 1995; Partal and Kahya 2006). The details of theMann-Kendall test are available in the standard literature, so itis not included here. If the standard normal variate Z > 1.96 or< − 1.96, the null hypothesis (Ho) is rejected at the 95% signifi-cance level.
Data Availability
The daily rainfall data at more than 70 rain gauge stations, locatedat the block headquarters, have been used to analyze the detectionof trends and computation of SPI values. The data availability is notuniform, however, with different data lengths in the different blocksof various districts; Table 1 presents the details.
Table 1. Data Availability for the Bundelkhand Region
District nameSerialnumber
Nameof block Data availability
Sagar district 1 Banda 1981–1982 to 2009–20102 Shahgarh 1992–1993 to 2009–20103 Garhakota 1993–1994 to 2009–20104 Rehli 1976–1977 to 2009–20105 Deori 1976–1977 to 2009–20106 Kesli 1992–1993 to 2008–20097 Sagar 1976–1977 to 2009–20108 Jaisinagar 1987–1988 to 2008–20099 Rahatgarh 1987–1988 to 2009–201010 Bina 1985–1986 to 2008–200911 Khurai 1976–1977 to 2009–201012 Malthone 1976–1977 to 2009–2010
Chhatarpur district 1 Chhatarpur 1966–1967 to 2009–20102 Bijawar 1966–1967 to 2009–20103 Buxwaha 1975–1976 to 2009–20104 Laundi 1966–1967 to 2009–20105 Nowgong 1980–1981 to 2009–20106 Rajnagar 1984–1985 to 2009–20107 Gaurihar 1985–1986 to 2009–20108 Badamalhera 1984–1985 to 2009–2010
Tikamgarh district 1 Tikamgarh 1958–1959 to 2009–20102 Baldevgarh 1981–1982 to 2009–20103 Jatara 1958–1959 to 2009–20104 Palera 1991–1992 to 2009–20105 Niwadi 1958–1959 to 2009–20106 Prithvipur 1984–1985 to 2009–20107 Orcha 1993–1994 to 2009–2010
Panna district 1 Panna 1964–1965 to 2009–20102 Gunera 1984–1985 to 2009–20103 Pawai 1964–1965 to 2009–20104 Shahnagar 1982–1983 to 2009–20105 Ajaygarh 1964–1965 to 2009–2010
Banda district 1 Banda 1950–1951 to 2010–20112 Baberu 1950–1951 to 2010–20113 Badausa 1950–1951 to 1970–19714 Girwan Narni 1950–1951 to 2007–20085 Kamasin 1950–1951 to 1982–19836 Manikpur 1950–1951 to 1973–19747 Pailani 1950–1951 to 1991–19928 Naraini 1950–1951 to 2010–2011
Damoh district 1 Damoh 1950–1951 to 2009–20102 Hardua Morar 1984–1985 to 2009–20103 Hatta 1950–1951 to 2009–20104 Jabera 1950–1951 to 2009–20105 Majghawan Hansraj 1950–1951 to 2009–20106 Mala 1950–1951 to 1972–1973
Datia district 1 Datia 1950–1951 to 2009–20102 Seondha 1950–1951 to 2007–2008
Lalitpur district 1 Lalitpur 1950–1951 to 2009–20102 Mahrauni 1950–1951 to 2007–2008
Mahoba district 1 Mahoba 1966–1967 to 2010–20112 Charkhari 1963–1964 to 2010–20113 Kulpahad 1966–1967 to 2010–2011
Jhansi district 1 Barwasagar 1950–1951 to 1970–19712 Garotha 1963–1964 to 2010–20113 Mau 1950–1951 to 2009–20104 Moth 1950–1951 to 2009–20105 Pachwara 1950–1951 to 1980–1981
Chitrakoot district 1 Karbi 1950–1951 to 2009–20102 Mau 1950–1951 to 2009–2010
© ASCE 05015004-4 J. Hydrol. Eng.
J. Hydrol. Eng.
Dow
nloa
ded
from
asc
elib
rary
.org
by
Nat
iona
l Ins
t of
Hyd
rolo
gy -
Roo
rkee
on
03/1
0/15
. Cop
yrig
ht A
SCE
. For
per
sona
l use
onl
y; a
ll ri
ghts
res
erve
d.

Results and Discussion
SPI-Based Evaluation of Drought Characteristics
In this study, the 3-month SPI is used as a seasonal drought index torepresent short-term drought, the 6-month SPI is used for inter-mediate-term drought, and the 12-month SPI is used for long-termdrought. As the monsoon season is principally three months (July,August, and September), the 3-month SPI is considered to reflectthe deficit and surplus in the soil moisture availability. The 3-, 6-,and 12-month SPIs have been computed for all the blocks inthe 13 districts in Bundelkhand. The temporal variation of the3-month SPI for the Sagar block in Madhya Pradesh is depictedin Fig. 2.
The analysis of the 3-month SPI and its comparison for thevarious blocks in the Sagar district indicate that almost all of themsuffer from drought of varying severities. Note (Fig. 2) that none ofthe blocks experience drought during concurrent periods. In otherwords, the spatial and temporal distribution of drought severity andfrequency varies markedly among the various blocks of a district.The analysis of the 3-month SPI showed that the frequecy of mod-erate to severe droughts has increased in the last decade, while noneof the blocks in Sagar district faced extreme drought conditionsduring 2004–2007, when widespread drought was experiencedin the Bundelkhand region.
In Sagar district between 1976 and 2009, 18 drought eventsoccurred, with 5 of them lasting 3 months or more; whereas17 drought events occurred in the Banda block, with 5 having aduration of 3 months or more. Similarly, 12 drought events, with
only 1 event lasting for 3 months occurred in the Bina block; and 19drought events, with 3 events lasting 3 months or more, took placein the Deori block. A maximum of 25 drought events were ob-served in the Khurai block, with 3 having durations of 3 monthsor more; and during the same period, 12 drought events were ob-served in the Garhakota block, with 2 events lasting 3 months ormore. As compared to the other blocks in the district, Jaisinagar andKesli blocks experienced lesser number of drought events viz., 10and 9 events respectively with 2 events of duration of 3 month andmore at Jaisinagar and 1 event of 3 month duration at Kesli. Thedetails of drought events in the blocks with continuous drought of3 months or more pertaining to the Sagar district are presented inTable 2.
The comparison of the 3-month SPIs reveals that extremedrought was experienced in August 2007 in both the Chhatarpurand Laundi blocks in Chhatarpur district. Extreme drought condi-tions occurred five times in the Chhatarpur block, in 1979, 1993,2001, 2007, and 2009; and three times in the Laundi block, in 1979,2002, and 2007. From 1976 to 2009, 25 drought events occurred; 3events lasting 3 months or more occurred in the Chhatarpur block,and 16 drought events, with 2 lasting 3 months or more, occurred inthe Badamalhera block. Similarly, 14 drought events occurred inthe Bijawar block, with none lasting 3 months or more. Instead11 and 25 drought events occurred in the Buxwaha and Laundiblocks, respectively. Similar characteristics have been observedfor the remaining blocks in all these districts. Detailed analysisof time series of 3-month SPIs has helped to understand the vari-ability in drought severity across various districts in the Bundel-khand region. It was observed that none of the 12 blocks inSagar district faced extreme drought conditions, whereas extremedrought was experienced in the Chhatarpur (on 5 occasions)and Laundi (on 3 occasions) blocks in Chhatarpur district. InTikamgarh district, extreme drought persisted in the Tikamgarh(5 occasions) and Jatara blocks (3 occasions). In general, fewblocks in most of the districts except Sagar experienced severeand extreme drought conditions. Of late, the region has experiencedincreased occurrences of droughts of varying intensity.
Influence of Time Scale on Drought Characteristics
SPI values have been computed for all the blocks in various districtsof Bundelkhand for time scales of 1, 3, 6, 12, and 24 months. It isapparent from the comparison of the 1-, 3-, 6-, and 12-month SPIsthat there are changes in drought frequency and duration as the timescales change. For shorter time scales (such as 1 month), the num-ber of drought events increases, with abrupt shifts between drought
Table 1. (Continued.)
District nameSerialnumber
Nameof block Data availability
Hamirpur district 1 Sarila 1950–1951 to 1970–19712 Rath 1950–1951 to 2009–20103 Maudeha 1950–1951 to 2009–20104 Khanna 1950–1951 to 1975–19765 Hamirpur 1950–1951 to 2009–20106 Belathal 1950–1951 to 1977–19787 Bijanagar 1950–1951 to 1973–1974
Jalaun district 1 Jalaun 1950–1951 to 2007–20082 Kalpi 1950–1951 to 2007–20083 Kunch 1950–1951 to 2007–20084 Orai 1950–1951 to 2007–2008
-3.0
-2.5
-2.0
-1.5
-1.0
-0.5
0.0
0.5
1.0
1.5
2.0
2.5
3.0
Jun
-78
Ap
r-7
9
Fe
b-8
0
De
c-8
0
Oct
-81
Au
g-8
2
Jun
- 83
Ap
r-8
4
Fe
b-8
5
De
c-8
5
Oct
-86
Au
g-8
7
Jun
-88
Ap
r-8
9
Fe
b-9
0
De
c-9
0
Oct
-91
Au
g-9
2
Jun
-93
Ap
r-9
4
Fe
b-9
5
De
c-9
5
Oct
-96
Au
g-9
7
Jun
-98
Ap
r-9
9
Fe
b- 0
0
De
c -0
0
Oct
-01
Au
g-0
2
Jun
-03
Ap
r-0
4
Fe
b-0
5
De
c-0
5
Oct
-06
Au
g- 0
7
Jun
- 08
Ap
r-0
9
Fe
b-1
0
3-m
SP
I
Fig. 2. 3-month SPI in the Sagar block in the Sagar district of Madhya Pradesh
© ASCE 05015004-5 J. Hydrol. Eng.
J. Hydrol. Eng.
Dow
nloa
ded
from
asc
elib
rary
.org
by
Nat
iona
l Ins
t of
Hyd
rolo
gy -
Roo
rkee
on
03/1
0/15
. Cop
yrig
ht A
SCE
. For
per
sona
l use
onl
y; a
ll ri
ghts
res
erve
d.
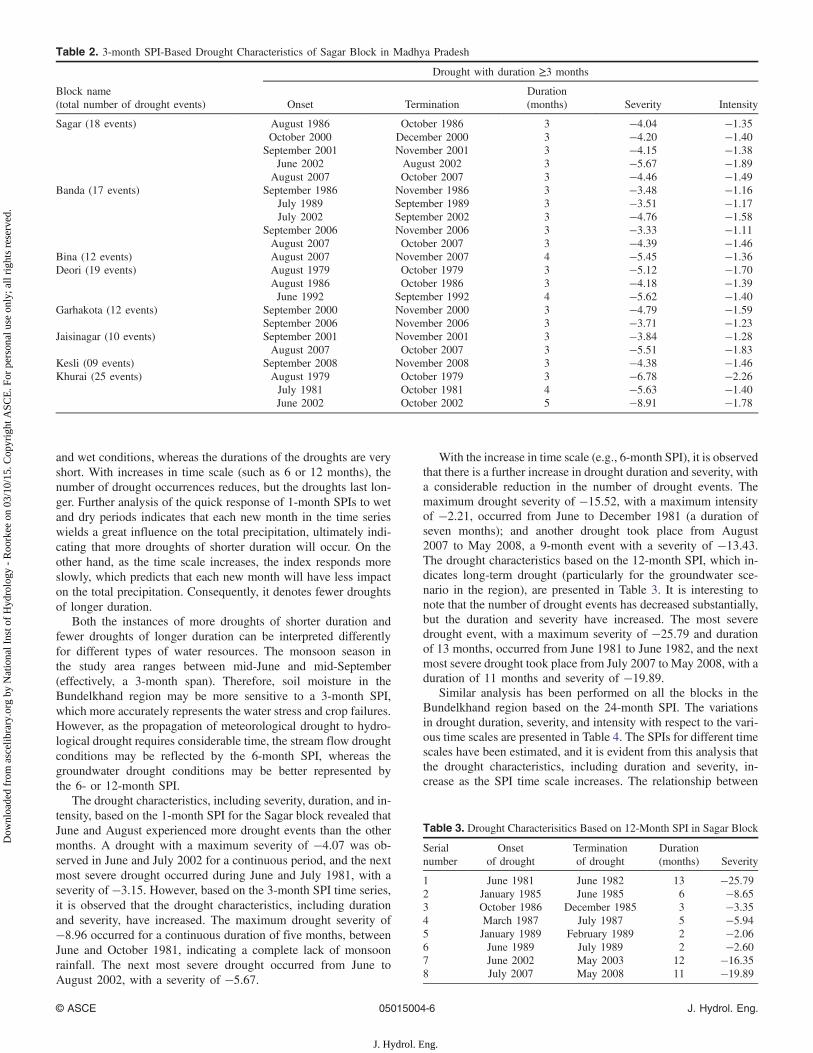
and wet conditions, whereas the durations of the droughts are veryshort. With increases in time scale (such as 6 or 12 months), thenumber of drought occurrences reduces, but the droughts last lon-ger. Further analysis of the quick response of 1-month SPIs to wetand dry periods indicates that each new month in the time serieswields a great influence on the total precipitation, ultimately indi-cating that more droughts of shorter duration will occur. On theother hand, as the time scale increases, the index responds moreslowly, which predicts that each new month will have less impacton the total precipitation. Consequently, it denotes fewer droughtsof longer duration.
Both the instances of more droughts of shorter duration andfewer droughts of longer duration can be interpreted differentlyfor different types of water resources. The monsoon season inthe study area ranges between mid-June and mid-September(effectively, a 3-month span). Therefore, soil moisture in theBundelkhand region may be more sensitive to a 3-month SPI,which more accurately represents the water stress and crop failures.However, as the propagation of meteorological drought to hydro-logical drought requires considerable time, the stream flow droughtconditions may be reflected by the 6-month SPI, whereas thegroundwater drought conditions may be better represented bythe 6- or 12-month SPI.
The drought characteristics, including severity, duration, and in-tensity, based on the 1-month SPI for the Sagar block revealed thatJune and August experienced more drought events than the othermonths. A drought with a maximum severity of −4.07 was ob-served in June and July 2002 for a continuous period, and the nextmost severe drought occurred during June and July 1981, with aseverity of −3.15. However, based on the 3-month SPI time series,it is observed that the drought characteristics, including durationand severity, have increased. The maximum drought severity of−8.96 occurred for a continuous duration of five months, betweenJune and October 1981, indicating a complete lack of monsoonrainfall. The next most severe drought occurred from June toAugust 2002, with a severity of −5.67.
With the increase in time scale (e.g., 6-month SPI), it is observedthat there is a further increase in drought duration and severity, witha considerable reduction in the number of drought events. Themaximum drought severity of −15.52, with a maximum intensityof −2.21, occurred from June to December 1981 (a duration ofseven months); and another drought took place from August2007 to May 2008, a 9-month event with a severity of −13.43.The drought characteristics based on the 12-month SPI, which in-dicates long-term drought (particularly for the groundwater sce-nario in the region), are presented in Table 3. It is interesting tonote that the number of drought events has decreased substantially,but the duration and severity have increased. The most severedrought event, with a maximum severity of −25.79 and durationof 13 months, occurred from June 1981 to June 1982, and the nextmost severe drought took place from July 2007 to May 2008, with aduration of 11 months and severity of −19.89.
Similar analysis has been performed on all the blocks in theBundelkhand region based on the 24-month SPI. The variationsin drought duration, severity, and intensity with respect to the vari-ous time scales are presented in Table 4. The SPIs for different timescales have been estimated, and it is evident from this analysis thatthe drought characteristics, including duration and severity, in-crease as the SPI time scale increases. The relationship between
Table 2. 3-month SPI-Based Drought Characteristics of Sagar Block in Madhya Pradesh
Block name(total number of drought events)
Drought with duration ≥3 months
Onset TerminationDuration(months) Severity Intensity
Sagar (18 events) August 1986 October 1986 3 −4.04 −1.35October 2000 December 2000 3 −4.20 −1.40
September 2001 November 2001 3 −4.15 −1.38June 2002 August 2002 3 −5.67 −1.89
August 2007 October 2007 3 −4.46 −1.49Banda (17 events) September 1986 November 1986 3 −3.48 −1.16
July 1989 September 1989 3 −3.51 −1.17July 2002 September 2002 3 −4.76 −1.58
September 2006 November 2006 3 −3.33 −1.11August 2007 October 2007 3 −4.39 −1.46
Bina (12 events) August 2007 November 2007 4 −5.45 −1.36Deori (19 events) August 1979 October 1979 3 −5.12 −1.70
August 1986 October 1986 3 −4.18 −1.39June 1992 September 1992 4 −5.62 −1.40
Garhakota (12 events) September 2000 November 2000 3 −4.79 −1.59September 2006 November 2006 3 −3.71 −1.23
Jaisinagar (10 events) September 2001 November 2001 3 −3.84 −1.28August 2007 October 2007 3 −5.51 −1.83
Kesli (09 events) September 2008 November 2008 3 −4.38 −1.46Khurai (25 events) August 1979 October 1979 3 −6.78 −2.26
July 1981 October 1981 4 −5.63 −1.40June 2002 October 2002 5 −8.91 −1.78
Table 3. Drought Characterisitics Based on 12-Month SPI in Sagar Block
Serialnumber
Onsetof drought
Terminationof drought
Duration(months) Severity
1 June 1981 June 1982 13 −25.792 January 1985 June 1985 6 −8.653 October 1986 December 1985 3 −3.354 March 1987 July 1987 5 −5.945 January 1989 February 1989 2 −2.066 June 1989 July 1989 2 −2.607 June 2002 May 2003 12 −16.358 July 2007 May 2008 11 −19.89
© ASCE 05015004-6 J. Hydrol. Eng.
J. Hydrol. Eng.
Dow
nloa
ded
from
asc
elib
rary
.org
by
Nat
iona
l Ins
t of
Hyd
rolo
gy -
Roo
rkee
on
03/1
0/15
. Cop
yrig
ht A
SCE
. For
per
sona
l use
onl
y; a
ll ri
ghts
res
erve
d.
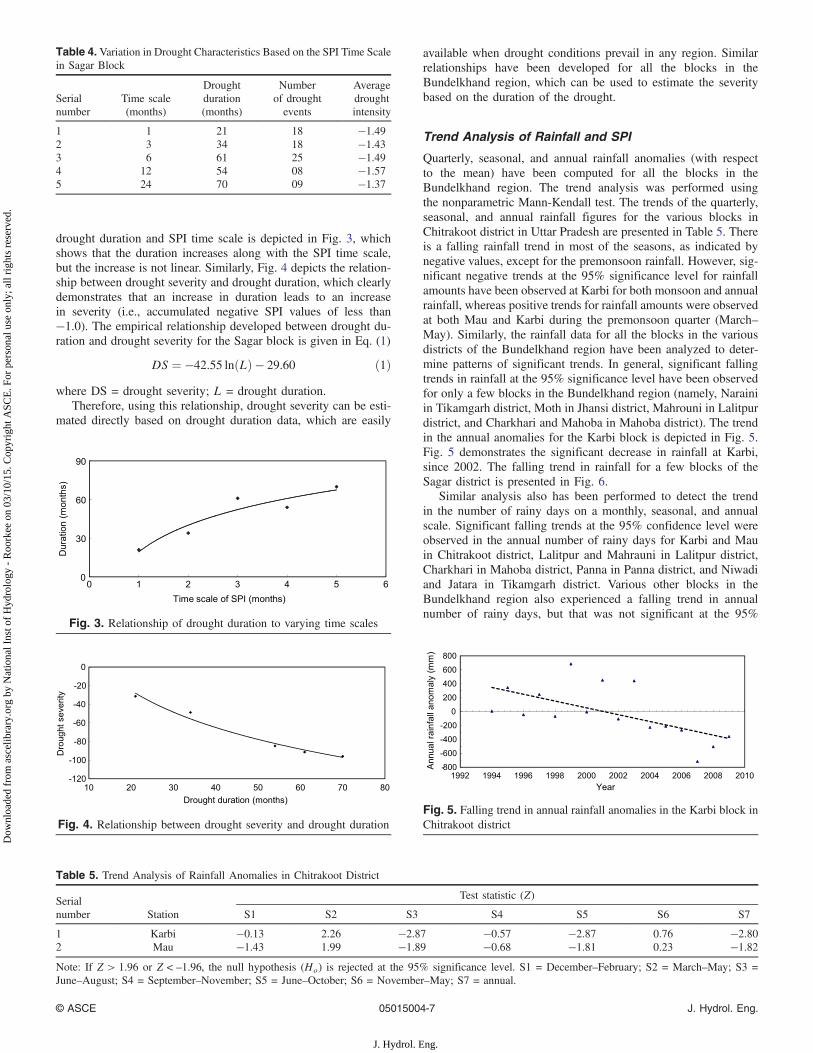
drought duration and SPI time scale is depicted in Fig. 3, whichshows that the duration increases along with the SPI time scale,but the increase is not linear. Similarly, Fig. 4 depicts the relation-ship between drought severity and drought duration, which clearlydemonstrates that an increase in duration leads to an increasein severity (i.e., accumulated negative SPI values of less than−1.0). The empirical relationship developed between drought du-ration and drought severity for the Sagar block is given in Eq. (1)
DS ¼ −42.55 lnðLÞ − 29.60 ð1Þwhere DS = drought severity; L = drought duration.
Therefore, using this relationship, drought severity can be esti-mated directly based on drought duration data, which are easily
available when drought conditions prevail in any region. Similarrelationships have been developed for all the blocks in theBundelkhand region, which can be used to estimate the severitybased on the duration of the drought.
Trend Analysis of Rainfall and SPI
Quarterly, seasonal, and annual rainfall anomalies (with respectto the mean) have been computed for all the blocks in theBundelkhand region. The trend analysis was performed usingthe nonparametric Mann-Kendall test. The trends of the quarterly,seasonal, and annual rainfall figures for the various blocks inChitrakoot district in Uttar Pradesh are presented in Table 5. Thereis a falling rainfall trend in most of the seasons, as indicated bynegative values, except for the premonsoon rainfall. However, sig-nificant negative trends at the 95% significance level for rainfallamounts have been observed at Karbi for both monsoon and annualrainfall, whereas positive trends for rainfall amounts were observedat both Mau and Karbi during the premonsoon quarter (March–May). Similarly, the rainfall data for all the blocks in the variousdistricts of the Bundelkhand region have been analyzed to deter-mine patterns of significant trends. In general, significant fallingtrends in rainfall at the 95% significance level have been observedfor only a few blocks in the Bundelkhand region (namely, Narainiin Tikamgarh district, Moth in Jhansi district, Mahrouni in Lalitpurdistrict, and Charkhari and Mahoba in Mahoba district). The trendin the annual anomalies for the Karbi block is depicted in Fig. 5.Fig. 5 demonstrates the significant decrease in rainfall at Karbi,since 2002. The falling trend in rainfall for a few blocks of theSagar district is presented in Fig. 6.
Similar analysis also has been performed to detect the trendin the number of rainy days on a monthly, seasonal, and annualscale. Significant falling trends at the 95% confidence level wereobserved in the annual number of rainy days for Karbi and Mauin Chitrakoot district, Lalitpur and Mahrauni in Lalitpur district,Charkhari in Mahoba district, Panna in Panna district, and Niwadiand Jatara in Tikamgarh district. Various other blocks in theBundelkhand region also experienced a falling trend in annualnumber of rainy days, but that was not significant at the 95%
Table 4. Variation in Drought Characteristics Based on the SPI Time Scalein Sagar Block
Serialnumber
Time scale(months)
Droughtduration(months)
Numberof droughtevents
Averagedroughtintensity
1 1 21 18 −1.492 3 34 18 −1.433 6 61 25 −1.494 12 54 08 −1.575 24 70 09 −1.37
Fig. 4. Relationship between drought severity and drought duration
Fig. 3. Relationship of drought duration to varying time scales
Table 5. Trend Analysis of Rainfall Anomalies in Chitrakoot District
Serialnumber Station
Test statistic (Z)
S1 S2 S3 S4 S5 S6 S7
1 Karbi −0.13 2.26 −2.87 −0.57 −2.87 0.76 −2.802 Mau −1.43 1.99 −1.89 −0.68 −1.81 0.23 −1.82Note: If Z > 1.96 or Z < –1.96, the null hypothesis (Ho) is rejected at the 95% significance level. S1 = December–February; S2 = March–May; S3 =June–August; S4 = September–November; S5 = June–October; S6 = November–May; S7 = annual.
Fig. 5. Falling trend in annual rainfall anomalies in the Karbi block inChitrakoot district
© ASCE 05015004-7 J. Hydrol. Eng.
J. Hydrol. Eng.
Dow
nloa
ded
from
asc
elib
rary
.org
by
Nat
iona
l Ins
t of
Hyd
rolo
gy -
Roo
rkee
on
03/1
0/15
. Cop
yrig
ht A
SCE
. For
per
sona
l use
onl
y; a
ll ri
ghts
res
erve
d.

confidence level. On the monthly scale, significant falling trends atthe 95% confidence level were observed only during the month ofAugust for Karbi and Mau in Chitrakoot district, Banda and Baberuin Banda district, Bijawar and Buxwaha in Chhatarpur district,Mahrouni in Lalitpur district, Charkhari in Mahoba district, Pannaand Ajaygarh in Panna district, and Tikamgarh, Niwadi, and Jatarain Tikamgarh district. A significant falling trend is also observedfor July at Charkhari in Mahoba district and Jatara in Tikamgarhdistrict. The other blocks in the Bundelkhand region do not depictsignificant trends concerning rainy days.
Trend analysis of the 3-month SPI has been performed usingthe Mann-Kendall test for the various blocks in the 13 districtsof Bundelkhand. No significant trends have been observed formost of the blocks in Bundelkhand. However, only 1 blockshowed a significant falling trend in the 3-month SPI [namely,Shahgarh in Sagar district in September (test statistic of −2.60)].
In Tikamgarh district, significant falling trends in the 3-month SPIat the 95% confidence level were observed at Jatara in June (teststatistic of −2.50) and July (test statistic of −1.97); in Tikamgarhblock in August (test statistic of −2.86) and September (teststatistic of −2.90); Prithvipur block in June (test statistic of−2.09); and September (test statistic of −2.15).
In Damoh district, significant falling trends in 3-month SPI at a95% confidence level were detected at Hardua Morar in June (teststatistic of−2.28), July (test statistic of−4.73), and September (teststatistic of −3.00); and at Mala during August (test statistic of−3.20) and September (test statistic of −3.55). In Datia district,significant falling trends in 3-month SPI were detected at Seondhain August (test statistic of −2.03) and September (test statistic of−2.97); whereas in the Banda block in Uttar Pradesh, significantfalling trends in 3-month SPI at the 95% significance level weredetected for August (test statistic of −2.57) and September (teststatistic of −2.79). In Jalaun district, statistically significant nega-tive trends were observed for both the Jalaun and Kunch blocks inAugust (test statistic of −3.72) and September (test statistic of−4.67); whereas in Kunch, the test statistics during August andSeptember were −2.75 and −3.28, respectively. The blocks withsignificant trends in the 3-month SPI at the 95% significance levelin the various districts of Bundelkhand are presented in Table 6.It is observed that these statistically significant falling trends havebeen observed mostly during August and September, the principalrainy months of the monsoon season. The decreasing trend in SPIvalues also indicates the increasing drought severity in these blocksduring these months, which is a serious concern for which specificplanning for water resources management under drought scenariois essential.
Spatial and Temporal Variation of MeteorologicalDrought in Bundelkhand
The spatial and temporal variation of the drought characteristicsbased on the 3-month SPI has been studied for all the districtsof the Bundelkhand region using the geographic informationsystem (GIS). AGIS layer (point map) was created in the IntegratedLand and Water Information System (ILWIS 3.0) using the3-month SPI values at all the blocks for each monsoon monthand spatially interpolated thereafter. These SPI values at the blockswere interpolated over the Bundelkhand region, and the interpo-lated map was classified on the basis of the modified drought se-verity classification using the slicing operation. The final mapshowing the variation of drought severity was obtained by the raster
Fig. 6. Falling trend in number of rainy days (annual) in a few blocks of Sagar district
Table 6. Mann-Kendall Test Statistic for 3-Month SPI in Various Districtsof Bundelkhand
Serialnumber
Districtname Block
Test statistic (Z)
June July August September
1 Sagar Shahgarh — — — −2.602 Tikamgarh Jatara −2.50 −1.97 — —
Tikamgarh — — −2.86 −2.90Prithvipur −2.09 — — −2.15
3 Damoh Hardua M −2.28 −4.73 — −3.00Mala — — −3.20 −3.55
4 Datia Seondha — — −2.03 −1.975 Banda Baberu — 3.71 — —
Naraini — — −2.57 −2.796 Jalaun Jalaun — — −3.72 −4.67
Kunch — — −2.75 −3.287 Jhansi Jhansi — — −2.25 −2.30
Moth — — −2.68 −2.63Mau — — −2.26 –
8 Chitrakoot Karbi — — −3.38 −4.59Mau — — −2.41 −2.44
9 Lalitpur Lalitpur 2.39 2.70 — —Mahrauni — — — −2.91
10 Mahoba Charkhari — −3.39 −4.62 −4.67Kulpahad 2.82 2.27 — —Mahoba — −2.28 −2.97 −2.96
Note: If Z > 1.96 or Z < –1.96, the null hypothesis (Ho) is rejected at the95% significance level.
© ASCE 05015004-8 J. Hydrol. Eng.
J. Hydrol. Eng.
Dow
nloa
ded
from
asc
elib
rary
.org
by
Nat
iona
l Ins
t of
Hyd
rolo
gy -
Roo
rkee
on
03/1
0/15
. Cop
yrig
ht A
SCE
. For
per
sona
l use
onl
y; a
ll ri
ghts
res
erve
d.

operation cross, during which the classified SPI map was crossedwith the base map of Bundelkhand. The final outputs showing thespatial and temporal variation of drought classes in the variousblocks of Bundelkhand region during June to September 2007 isgiven in Figs. 7 and 8. The percentages in Bundelkhand fallingunder the various drought severity classes during 2007 are givenin Table 7.
These figures specifically reveal the progression and subsequentwithdrawal of the drought phenomena in the region during thedrought of 2007. In June 2007, about 72.5% of Bundelkhandwas experiencing normal conditions, with only 25% under milddrought conditions. In Sagar district, mild drought conditions ex-isted in the blocks of Sagar, Deori, Rehli, Garhakota, Banda, andShahagrah, and similar conditions existed in parts of the blocks of
Malthone and Khurai in June. In Damoh district, mild to moderatedrought prevailed in Damoh block, whereas moderate droughtwas observed in the Jabera, Hatta, and Batiyagarh blocks. Mod-erate drought conations were also seen in various blocks of theTikamgarh, Panna, Chhatarpur, Mahoba, and Panna districts,whereas mild drought conditions prevailed in the majority of theblocks in Jalaun, Hamirpur, Chitakoot, Jhansi, and Datia districts.However, with the slow progression of monsoon, the scenariochanged considerably in July 2007, with 79.5% of the area experi-encing moderate (28.77%) and mild (50.77%) drought conditions.With continuing deficient rainfall in August 2007, the situation fur-ther deteriorated, with almost the entire Bundelkhand region underthe drought spell, with 5.43% of the area under extreme drought,27.26% under severe drought, 49.86% under moderate drought,and 17.2% under mild drought. A few blocks in Panna district
Fig. 7. 3-month SPI variation in June and July 2007
Fig. 8. 3-month SPI variation in August and September 2007
© ASCE 05015004-9 J. Hydrol. Eng.
J. Hydrol. Eng.
Dow
nloa
ded
from
asc
elib
rary
.org
by
Nat
iona
l Ins
t of
Hyd
rolo
gy -
Roo
rkee
on
03/1
0/15
. Cop
yrig
ht A
SCE
. For
per
sona
l use
onl
y; a
ll ri
ghts
res
erve
d.

and Chhatarpur district experienced extreme drought conditions,followed by severe drought in a few blocks of Tikamgarh, Jhansi,and Banda districts. Moderate drought occurred in many blocks inthe Banda, Hamirpur, Jalaun, Datia, Mahoba, Lalitpur, Sagar, andDamoh districts, with the remaining area under mild drought. Theeffect of drought was invariably felt over the whole of Bundelkhandduring August 2007, which is one of the principal monsoon months.
The drought severity further increased in September 2007, withmore than 41% of the area reeling under severe drought and 4%experiencing extreme drought conditions. The area under severedrought further expanded to blocks of the Jhansi, Hamirpur, Jalaun,Datia, Tikamgarh, Chhatarpur, Damoh, and Sagar districts, withmost of the remaining area experiencing moderate drought condi-tions. Similar analysis has been carried out for the remainingdrought years during which extensive droughts were observed inthe region. It is observed that each drought event has its own char-acteristics, including the onset, area affected, duration, and severity,and it is not possible to relate its aerial extent of influence to thedrought characteristics. Therefore, each drought phenomenon hasits own unique characteristics, and it is imperative to demarcate theareas vulnerable to drought in the Bundelkhand region for focuseddrought relief and mitigation activities. This analysis helps to iden-tify the onset of drought conditions since the beginning of themonsoon and the areas and regions where drought is predominantand expanding in the subsequent months. Based on this infor-mation, proper mitigation measures can be planned and droughtwarning levels can be initiated for different regions of Bundelkhand,depending on the gravity of the situation on the basis of droughtseverity classes as defined by SPI.
Summary and Conclusions
The inherent complexity of the Indian summer monsoon rainfall(ISMR) regime virtually makes it difficult to plan for droughtmitigation measures well in advance. The spatiotemporal variationsof the drought analysis can help increase understanding of droughtsignature and characteristics, including severity, duration, aerialextent, progression, and withdrawal, which can encourage thedevelopment of a mechanism to address drought-related issueseffectively.
The study presents an analysis of drought characteristics of theBundelkhand region in India. The drought characteristics werestudied by employing the 3-month SPI, as the area has a monsoonseason limited to three months and has predominantly rain-fedagriculture. The application of the SPI-based drought analysispertaining to various time scales of 3, 6, 12, and 24 months usedfor understanding the soil-moisture drought, stream flow drought,and groundwater drought in the region has been found usefulfor developing effective drought warning systems. The influenceof time scale on drought analysis indicates that as the timescale increases, the SPI responds more slowly, which predicts thateach new month will have less impact on the total precipitation;
consequently, it denotes fewer droughts of longer duration. Statis-tical trend analysis using the nonparametric Mann-Kendall test re-vealed that few blocks see a significant falling trend in rainfall andnumber of rainy days. The analysis of historical data indicated thatthe climate change phenomenon is not visible at present. The large-scale exploitation of natural resources, in the form of deforestationand groundwater exploitation, has changed the water availabilityscenario for most of the rivers, which used to be perennial andnow flow for only a few days during monsoon season. The fre-quency of drought in the Bundelkhand region has increasedmanyfold in recent times, particularly over the last decade, whichhas seen greater drought severity.
The spatiotemporal variation of drought was studied on thebasis of spatial variation of drought during different months ofthe monsoon season. The analysis can be extended further by relat-ing the 3-month SPI to crop production for various drought years,so that the economic impact of the drought also can be quantifiedeasily. In addition, it can be concluded that the progression andwithdrawal of drought can be easily understood with the applica-tion of GIS techniques and the SPI, which will definitely helpdecision makers focus their efforts toward the more problematicareas during an ongoing drought. It is obvious that the drought phe-nomenon, coupled with impending climate change in the future,will create a more vulnerable environment, particularly for thewater resources and agricultural sector in Bundelkhand. Therefore,early warning systems need to be developed for the region based onthe real-time monitoring of indicators based on rainfall, soil mois-ture, surface water, and groundwater, so as to make the regiondrought-proof and improve the sustainability of agriculture inBundelkhand.
References
Agnew, C. T. (1990). “Spatial aspects of drought in Sahel.”J. AridEnviron., 18, 279–293.
Agnew, C., and Warren, A. (1996). “A framework for tackling droughtand land degradation.” J. Arid Environ., 33(3), 309–320.
Alam, N. M., Mishra, P. K., Jana, C., and Adhikary, P. P. (2014).“Stochastic model for drought forecasting for Bundelkhand region incentral India.” Indian J. Agric. Sci., 82(2), 79–84.
Anctil, F., Larouche, W., and Viau, A. A. (2002). “Exploration of thestan-dardized precipitation index with regional analysis.” Can. J. Soil Sci.,82(1), 115–125.
Asadi, A., and Vahdat, S. F. (2013). “The efficiency of meteoro-logical drought indices for drought monitoring and evaluating inKohgilouye and Boyerahmad Province, Iran.” Int. J. Mod. Eng. Res.,3(4), 2407–2411.
Bates, B. C., Kundzewicz, Z. W., Wu, S., and Palutikof, J. P. (2008). “Cli-mate change and water.” Technical Paper of the IntergovernmentalPanel on Climate Change, IPCC Secretariat, Geneva, 210.
Bhuiyan, C., Singh, R. P., and Kogan, F. N. (2006). “Monitoring droughtdynamics in the Aravalli region (India) using different indices based onground and remote sensing data.” Int. J. Appl. Earth Obs. Geoinf., 8(4),289–302.
Table 7. Spatial and Temporal Variation of Drought during 2007 Based on 3-Month SPI
Serialnumber
Droughtseverity
Area under various severity classes (%)
June 2007 July 2007 August 2007 September 2007 October 2007 November 2007 December 2007
1 Extreme 0.00 00.05 5.43 3.99 0.40 0.00 0.002 Severe 0.00 01.56 27.26 41.60 15.68 5.37 0.003 Moderate 2.38 28.77 49.86 48.63 61.74 33.03 0.004 Mild 24.82 50.77 17.20 10.55 21.56 49.88 40.265 Normal 72.29 18.85 0.26 0.04 0.61 11.73 59.74
© ASCE 05015004-10 J. Hydrol. Eng.
J. Hydrol. Eng.
Dow
nloa
ded
from
asc
elib
rary
.org
by
Nat
iona
l Ins
t of
Hyd
rolo
gy -
Roo
rkee
on
03/1
0/15
. Cop
yrig
ht A
SCE
. For
per
sona
l use
onl
y; a
ll ri
ghts
res
erve
d.

Burke, E. J., and Brown, S. J. (2007). “Evaluating uncertainties in theprojection of future drought.” J. Hydrometeorol., 9(2), 292–299.
Burn, D. H. (1994). “Hydrologic effects of climatic change in west centralCanada.” J. Hydrol., 160(1–4), 53–70.
Burn, D. H., Cunderlik, J. M., and Pietroniro, A. (2004). “Hydrologicaltrends and variability in the Liard River basin.” Hydrol. Sci. J.,49(1), 53–67.
Census of India. (2011). “Population census.” The Registrar General &Census Commissioner, Ministry of Home Affairs, Government of India,New Delhi, India.
Chiew, F. H. S., Piechota, T. C., Dracup, J. A., and McMahon, T. A. (1998).“El Nino/southern oscillation and Australian rainfall, stream flowand drought: Links and potential for forecasting.” J. Hydrol., 204(1–4),38–149.
Choudhary, S. S., Garg, P. K., and Ghosh, S. K. (2013). “Drought analysisusing digital image processing and meteorological data.” Int. J. Adv.Remote Sens. GIS, 2(1), 280–302.
Domonkos, P. (2003). “Recent precipitation trends in Hungary in the con-text of larger-scale climatic changes.” Nat. Hazards, 29(2), 255–271.
Frere, M., and Popov, G. F. (1979). “Agro-meteorological crop monitoringand forecasting.” Plant Production and Protection Paper 17, FAO,Rome.
Gaikwad, Y., and Bhosale, R. (2014). “Survey on predictive analysisof drought in India using AVHRR-NOAA remote sensing data.” Int.J. Adv. Found. Res. Comput., 1(8), 1–8.
Gibbs, W. J., and Maher, J., V. (1967). “Rainfall deciles as drought indica-tors.” Bureau of Meteorology Bulletin No. 48, Commonwealth ofAustralia, Melbourne, Australia.
Golian, S., Mazdiyasni, O., and Kouchak, A. A. (2015). “Trends inmeteorological and agricultural droughts in Iran.” Theor. Appl. Clima-tol., 119(3–4), 679–688.
Harsch, E. (1992). “Drought devastates southern Africa.” Drought NetworkNews, 4(2), 17–19.
Hayes, M. J., Svoboda, M. D., Wilhite, D. A., and Vanyarkho, O. V. (1999).“Monitoring the 1996 drought using the standardized precipitationindex.” Bull. Am. Meteorol. Soc., 80(3), 429–438.
Hosking, J. R. M., and Wallis, J. R. (1997). Regional frequency analysis:An approach based on L-moments, Cambridge University Press,Cambridge, U.K.
Jahangir, A. A. T. M., Rahman, S. M., and Saadat, A. H. M. (2013).“Monitoring meteorological and agricultural drought dynamics inBarind region Bangladesh using standard precipitation index andMarkov chain model.” Int. J. Geomatics Geosci., 3(3), 511–524.
Jain, M. K., Jain, V., and Pandey, R. P. (2012). “Impact of climate changeon extreme drought events in Ken River basin, India.”American Societyof Agricultural and Biological Engineers (ASABE), St. Joseph, MI.
Jalpa, K. S., and Parekh, F. (2014). “Drought assessment using standard-ized precipitation index.” Int. J. Sci. Res., 3(7), 1073–1076.
Jha, S., Sehgal, V. K., Raghava, R., and Sinha, M. (2013). “Trend of stand-ardized precipitation index during Indian summer monsoon season inagroclimatic zones of India.” Earth Syst. Dyn. Discuss., 4(1), 429–449.
Kar, B., and Saha, J. (2012). “Analysis of meteorological drought: Thescenario of West Bengal.” Indian J. Spatial Sci., 3(2), 1–11.
Keyantash, J., and Dracup, J. A. (2002). “The quantification of drought:An evaluation of drought indices.” Bull. Am. Meteorol. Soc., 83(8),1167–1180.
Kogan, F. N. (1990). “Remote sensing of weather impacts on vegetation innon-homogeneous areas.” Int. J. Remote Sens., 11(8), 1405–1419.
Komuscu, A. U. (1999). “Using the SPI to analyze spatial and temporalpattern of drought in Turkey.” Drought Network News, 11(1), 7–13.
Lacatos, M., Bihari, Z., and Szentimrey, T. (2010). “Analysis of long-timestandardized precipitation index series to detect the drought frequencychanges in Hungary.” 8th European Conf. on Applied Climatology,Zurich, Switzerland.
Lana, X., Serra, C., and Burgueno, A. (2001). “Patterns of monthly rainfallshortage and excess in terms of the standardized precipitation index forCatalonia (NE Spain).” Int. J. Climatol., 21(13), 1669–1691.
Le Houerou, H. N. (1996). “Climate change, drought, and desertification.”J. Arid Environ., 34(2), 133–185.
Lloyd-Hughes, B., and Saunders, M. A. (2002). “A drought climatology forEurope.” Int. J. Climatol., 22(13), 1571–1592.
Masoudi, M., and Afrough, E. (2011). “Analyzing trends of precipitationfor humid, normal, and drought classes using standardized precipitationindex (SPI), a case study: Fars Province, Iran.” Int. J. Agric. Sci., 1(2),85–96.
McKee, T. B., Doesken, N. J., and Kleist, J. (1993). “The relationship ofdrought frequency and duration to time scales.” 8th Conf. on AppliedClimatalogy, Anaheim, CA, 179–184.
Meigh, J. R., McKenzie, A. A., and Sene, K. J. (1999). “A grid-based ap-proach to water scarcity estimates for eastern and southern Africa.”Water Resour. Manage., 13(2), 85–115.
Mishra, A. K., and Desai, V. R. (2005). “Drought forecasting using stochas-tic models.” Stoch. Environ. Res. Risk Assess., 19(5), 326–339.
Mishra, S. S., and Nagarajan, R. (2011). “Drought assessment in Telwatershed: An integrated approach using run analysis and SPI.” IEEE,Earthzine, 1/8–8/8.
Moreira, E. E., Paulo, A. A., Pereira, L. S., and Mexia, J. T. (2006). “Analy-sis of SPI drought class transitions using log-linear models.” J. Hydrol.,331(1–2), 349–359.
Mundeta, N., and Sharma, D. (2014). “Analysis of rainfall and floods inRajasthan state, India.” Global NEST J., 16(9), 1–10.
Murat, T., and Hasan, T. (2009). “Use of the standardised precipitationindex (SPI) and a modified SPI for shaping drought probabilities overTurkey.” Int. J. Climatol., 29(15), 2270–2282.
Naresh, K. M., Murthy, C. S., Sai, S. M. V. R., and Roy, P. S. (2012).“Spatiotemporal analysis of meteorological drought variability in theIndian region using standardized precipitation index.” Meteorol. Appl.,19(2), 256–264.
Naresh, K. M., Murthy, C. S., Sesha Saib, M. V. R., and Roy, P. S. (2009).“On the use of Standardized Precipitation Index (SPI) for drought in-tensity assessment.” Meteorol. Appl., 16(3), 381–389.
Niranjan, K. K., Rajeevan, M., Pai, D. S., Srivastava, A. K., and Preethi, B.(2013). “On the observed variability of monsoon droughts over India.”Weather Clim. Extremes, 1, 42–50.
Obasi, G. O. P. (1994). “WMO’s role in the international decade for naturaldisaster reduction.” Bull. Am. Meteorol. Soc., 75(9), 1655–1661.
Owrangi, M. A., Adamowski, J., Rahnemaei, M., Mohammadzadeh, A.,and Sharifan, R. A. (2011). “Drought monitoring methodology basedon AVHRR images and SPOT vegetation maps.” J. Water Resour.Prot., 3(5), 325–334.
Palchaudhuri, M., and Biswas, S. (2013). “Analysis of meteorologicaldrought using standardized precipitation index—A case study ofPuruliya district, West Bengal, India.” Int. J. Environ. Ecol. Geol.Min. Eng., 7(3), 119–126.
Palmer, W. C. (1965). “Meteorological drought.” Weather Bureau,Washington, DC.
Palmer, W. C. (1968). “Keeping track of index.” Weatherwise, 21(4),156–161.
Pandey, R. P., Pandey, A., Galkate, R. V., Byun, H., and Mal, B. C. (2010).“Integrating hydro-meteorological and physiographic factors for assess-ment of vulnerability to drought.” Water Resour. Manage., 24(15),4199–4217.
Partal, T., and Kahya, E. (2006). “Trend analysis in Turkish precipitationdata.” Hydrol. Process., 20(9), 2011–2026.
Petrasovits, I. (1990). “General review on drought strategies.” Transactionsof the 14th Congress on Irrigation and Drainage, Rio de Janeiro, Brazil1-C, International Commission on Irrigation and Drainage, 1–12.
Prabhakar, S. V. R. K., Svoboda, M., Shaw, R., Sano, D., and Tsurita, I.(2011). “Defining and monitoring drought using the standardizedprecipitation index (SPI) in India: An opportunity for climate changeadaptation.” Int. Symp. Promoting Synergies among AdaptationNetworks in the Asia-Pacific Region, Ibaraki Univ., Mito, Japan.
Rachchh, R., and Bhatt, N. (2014). “Monitoring of drought event by stand-ardized precipitation index (SPI) in Rajkot district, Gujarat, India.” Int.J. Eng. Dev. Res., 2(1), 917–921.
Rossi, G. (2003). “Requisites for a drought watch system.” Tools fordrought mitigation in Mediterranean regions, G. Rossi, A. Cancellieri,L. Pereira, S. Oweis, T. Shatanawi, and A. Zairi, eds., Kluwer,Dordrecht, Netherlands, 147–157.
© ASCE 05015004-11 J. Hydrol. Eng.
J. Hydrol. Eng.
Dow
nloa
ded
from
asc
elib
rary
.org
by
Nat
iona
l Ins
t of
Hyd
rolo
gy -
Roo
rkee
on
03/1
0/15
. Cop
yrig
ht A
SCE
. For
per
sona
l use
onl
y; a
ll ri
ghts
res
erve
d.
Rossi, G., Benedini, M., Tsakiris, G., and Giakoumakis, S. (1992).“On regional drought estimation and analysis.”Water Resour. Manage.,6(4), 249–277.
Seiler, R. A., Hayes, M., and Bressnan, L. (2002). “Using the standardizedprecipitation index for flood risk monitoring.” Int. J. Climatol., 22(11),1365–1376.
Shafer, B. A., and Dezman, L. E. (1982). “Development of a surface watersupply index (SWSI) to assess the severity of drought conditions insnowpack runoff areas.” Proc., Western Snow Conf., Colorado StateUniv., Fort Collins, CO, 164–175.
Shamsnia, S. A. (2014). “Comparison of reconnaissance drought index(RDI) and standardized precipitation index (SPI) for drought monitor-ing in arid and semi-arid regions.” Indian J. Fundam. Appl. Life Sci.,4(3), 39–44.
Sigdel, M., and Ikeda, M. (2010). “Spatial and temporal analysis of droughtin Nepal using standardized precipitation index and its relationship withclimate indices.” J. Hydrol. Meteorol., 7(1), 60–74.
Sivakumar, M. V. K., and Wilhite, D. A. (2002). “Drought preparednessand drought management.” Drought mitigation and prevention of landdesertification (Proc., Int. Conf., Bled, Slovenia), UNESCO, Slovenia.
Smakhtin, V. U. (2001). “Low-flow hydrology: A review.” J. Hydrol.,240(3–4), 147–186.
Smakhtin, V. U., and Hughes, D. A. (2007). “Automated estimation andanalyses of meteorological drought characteristics from monthly rain-fall data.” Environ. Modell. Softw., 22(6), 880–890.
Sonmez, F. K., Komuscu, A. U., Erkan, A., and Turgu, E. (2005). “Ananalysis of spatial and temporal dimension of drought vulnerabilityin Turkey using the standardized precipitation index.” Nat. Hazards,35(2), 243–264.
Sprent, P., and Smeeton, N. C. (2001). Applied nonparametric statisticalmethods, 3rd Ed., Chapman & Hall/CRC, London, England.
Svoboda, M., et al. (2002). “The drought monitor.” Bull. Am. Meteorol.Soc., 83(8), 1181–1190.
Taylor, C. H., and Loftis, J. C. (1989). “Testing for trend in lakeand groundwater quality time series.” Water Resour. Bull., 25(4),715–726.
Vicente-Serrano, S. M., et al. (2012). “Performance of drought indices forecological, agricultural, and hydrological applications.” Earth Interact.,16(10), 1–27.
Von Storch, H., and Navarra, A. (1995). Analysis of climate variability-applications of statistical techniques, Springer, New York.
Wenhong, L., Rong, F., Robinson, I. N. J., and Fernandez, K. (2008).“Observed change of standardized precipitation index, its potentialcause, and implications to future climate change in the Amazon region.”Philos. Trans. R. Soc. B, 363(1498), 1767–1772.
Wu, H., Hayes, M. J, Weiss, A., and Hu, Q. (2001). “An evaluation of thestandardized precipitation index, the China-Z index, and the statisticalZ-score.” Int. J. Climatol., 21(6), 745–758.
Yevjevich, V. (1972). Probability and statistics in hydrology, WaterResources Publications, Littleton, CO.
© ASCE 05015004-12 J. Hydrol. Eng.
J. Hydrol. Eng.
Dow
nloa
ded
from
asc
elib
rary
.org
by
Nat
iona
l Ins
t of
Hyd
rolo
gy -
Roo
rkee
on
03/1
0/15
. Cop
yrig
ht A
SCE
. For
per
sona
l use
onl
y; a
ll ri
ghts
res
erve
d.