Visual transformation for interactive spatiotemporal data mining
Upload
khangminh22Category
view
2download
0
RESEARCH PAPER
Spatiotemporal variation in wetland fish assemblages in theWestern Ghats region of India
Archis R. Grubh* and Kirk O. WinemillerDepartment of Wildlife and Fisheries Sciences, Texas A&M University, College Station, TX, 77843-2258, USA
Abstract – The Western Ghats region of peninsular India contains high diversity of freshwater fishes thatsupport artisanal fisheries, but no studies to date have investigated fish assemblages of the region's extensivewetlands. This study examined fish population densities and the structure of local species assemblages inpools of the Periyakulam wetland of the Western Ghats. From 2000 to 2001, fishes and local abioticenvironmental parameters were surveyed during three periods with contrasting rainfall (dry, major wet,minor wet). We hypothesized that fish density would be higher during the dry season when aquatic habitat isreduced, and that local assemblage structure would be strongly associated with habitat conditions. Total fishdensities were higher during the dry season, but themagnitude of seasonal change was relatively low, and thisapparently was because changes in water depth were minimal due to operation of sluice gates that controlwetland hydrology. Chanda nama, Pseudetroplus maculatus, Rasbora daniconius, andDanio aequipinnatuswere dominant species in most habitats during all three seasons. Multivariate ordinations revealed strongassociations between assemblage structure and habitats based on vegetation cover. Local assemblages inshallow-vegetated habitats varied seasonally in association with gradients of rainfall and water qualityparameters. Spatial variation of local fish assemblages in the Periyakulam wetland appears to be maintainedby species-specific habitat selection. Although hydrologic regulation probably has reduced seasonal variationin the structure of local assemblages, seasonal differences still occur and appear to be caused by speciesdifferences with regard to periods of reproduction, recruitment, dispersal and habitat selection.
Keywords: Aquatic habitat / assemblage structure / community ecology / hydrology / multivariate analysis /ordination / species richness
Résumé – Variation spatio-temporelle des assemblages de poissons des zones humides dans larégion des Ghâts occidentaux de l'Inde. La région des Ghâts occidentaux de l'Inde péninsulaire contientune grande diversité de poissons d'eau douce qui soutiennent la pêche artisanale, mais aucune étude à ce journ'a examiné les assemblages de poissons des vastes zones humides de la région. Cette étude a examiné lesdensités de populations de poissons et la structure des assemblages d'espèces locales dans les mares de lazone humide de Periyakulam des Ghâts occidentaux. Depuis 2000–2001, les poissons et les paramètresenvironnementaux abiotiques locaux ont été étudiés pendant trois périodes avec des précipitationscontrastées (sèche, grandes pluies humides, petites pluies). Nous avons émis l'hypothèse que la densité depoissons serait plus élevée pendant la saison sèche, lorsque l'habitat aquatique est réduit, et que la structured'assemblage locale serait fortement associée aux conditions de l'habitat. Les densités totales de poissonsétaient plus élevées pendant la saison sèche, mais l'ampleur des changements saisonniers était relativementfaible, apparemment parce que les changements dans la profondeur de l'eau étaient minimes en raison del'exploitation de vannes d'écluse qui contrôlent l'hydrologie des terres humides. Chanda nama,Pseudetroplus maculatus, Rasbora daniconius et Danio aequipinnatus étaient des espèces dominantesdans la plupart des habitats pendant les trois saisons. Les ordinations multivariées ont révélé de fortesassociations entre la structure d'assemblage et les habitats basés sur le couvert végétal. Les assemblageslocaux dans les habitats à faible végétation variaient selon les saisons en fonction des gradients desprécipitations et des paramètres de qualité de l'eau. La variation spatiale des assemblages locaux de poissonsdans la zone humide de Periyakulam semble être maintenue par la sélection d'habitats spécifiques à chaqueespèce. Bien que la régulation hydrologique ait probablement réduit les variations saisonnières dans la
*Corresponding author: [email protected]
Knowl. Manag. Aquat. Ecosyst. 2018, 419, 35© A.R. Grubh and K.O. Winemiller, Published by EDP Sciences 2018https://doi.org/10.1051/kmae/2018023
Knowledge &Management ofAquaticEcosystems
www.kmae-journal.org Journal fully supported by Onema
This is an Open Access article distributed under the terms of the Creative Commons Attribution License CC-BY-ND (http://creativecommons.org/licenses/by-nd/4.0/), which permits unrestricted use,distribution, and reproduction in any medium, provided the original work is properly cited. If you remix, transform, or build upon the material, you may not distribute the modified material.

structure des assemblages locaux, des différences saisonnières continuent de se produire et semblent êtrecausées par les différences entre les espèces en ce qui concerne les périodes de reproduction, de recrutement,de dispersion et de sélection de l'habitat.
Mots-clés: : Habitat aquatique / structure d'assemblage / écologie des communautés / hydrologie / analysemultivariable / ordination / richesse spécifique
1 Introduction
We investigated the influence of seasonal hydrology onfish assemblage structure in wetland habitats of a floodplain inthe Western Ghats region of India. Floodplain ecosystems aretemporally and spatially heterogeneous with high biodiversityfeatures that make them particularly useful for studyingcommunity ecology (Winemiller, 1990; Jardine et al., 2015;Röpke et al., 2017). Hydrology affects abiotic environmentalconditions as well as habitat connectivity that influences meta-population dynamics of aquatic organisms (Winemiller et al.,2000; Jackson et al., 2013). Stochastic influences onassemblage structure often are strong during high-waterperiods when there is extensive spatial reshuffling of aquaticorganisms (Lowe-McConnell, 1975, 1987; Welcomme, 1985;Thomaz et al., 2007). During low-water periods, hightemperatures, hypoxia, desiccation, and/or predation mayreduce fish survival in floodplain habitats (Lowe-McConnell,1975; Junk et al., 1983). In addition, water turbidity has beenshown to influence the structure of fish assemblages in tropicalfloodplain lakes, apparently via effects on foraging efficiencyof diurnal predators (Rodríguez and Lewis, 1997).
In wetlands, aquatic vegetation provides prey with refugefrom predators that actively pursue them, but can also provideforaging opportunities for fish that probe interstitial spaces forcryptic and slow-moving prey (Downing, 1991; Heck andCrowder, 1991; Chick and McIvor, 1994). Aquatic vegetationcreates habitat structural complexity that affords opportunitiesfor spatial niche partitioning (Meals and Miranda, 1991).Predator-prey interactions may differ among macrophyte types(Savino and Stein, 1982; Ryder, 1988; Dionne and Folt, 1991;Lillie and Budd, 1992). Hydrology has a major influence onboth the dynamics of aquatic vegetation growth and food websin floodplain wetlands (Junk et al., 1989; Winemiller, 1996,2004; Roach and Winemiller, 2015), with patterns of resourceexploitation and niche partitioning often changing in responseto fluctuations in habitat and resource availability (Winemiller,1989a; Correa and Winemiller, 2014).
The present study analyzed relationships among seasonallyvarying environmental variables and fish assemblage structurein the Periyakulam wetland. Prior research on freshwater fishesof the Western Ghats region has revealed patterns of speciesdistribution and abundance at broad spatial scales (Johnsonand Arunachalam, 2009; Dahanukar et al., 2011), includingstudies of fishes inhabiting hill streams (Arunachalam, 2000)and large rivers (Arunachalam et al., 1997a). Little researchhas been conducted on fish ecology within the region’sextensive wetlands (Grubh, 1995; Arunachalam et al., 1997b).We hypothesized that fish abundance and species richness inthe Periyakulam wetland would be greater during the annualdry season when aquatic habitats are reduced. We alsohypothesized that assemblage structure would differ between
habitat categories defined by water depth, substrate and aquaticvegetation, and temporal variation in assemblage structurewould correlate with abiotic environmental factors.
2 Methods2.1 Study area
TheWestern Ghats mountain range extends 1600 km alongthe west coast of peninsular India and is drained by numerousrivers (Godavari, Chalakudi, Aliyar, Periyar, Chittar, Tamir-aparani) (Arunachalam, 2000). The lowland plains ofKanyakumari district (Tamil Nadu state) contain more than2000 lakes and wetlands, and occur in the drainage basins ofthe Western Ghats mountains. Annual rainfall in this region is1.2–1.5m, with a period of relatively low rainfall fromDecember through March (mean monthly rainfall 35 cm) andhigh rainfall from April through November (mean rainfall134 cm). The wet season is influenced by weather frontsarriving from two regions: a southwest monsoon (major wetseason, from April to July) and a northeast monsoon (minorwet season, from August to November). The Kanyakumariwetlands are exploited for irrigation, non-intensive aquacul-ture, and lotus (Nelumbium speciosum) cultivation (Grubh,1995). Agriculture mainly consists of rice and bananas. Ponds>2 ha are generally stocked with carps native to northern India(e.g., Catla catla, Cirrhinus mrigala, Labeo rohita).
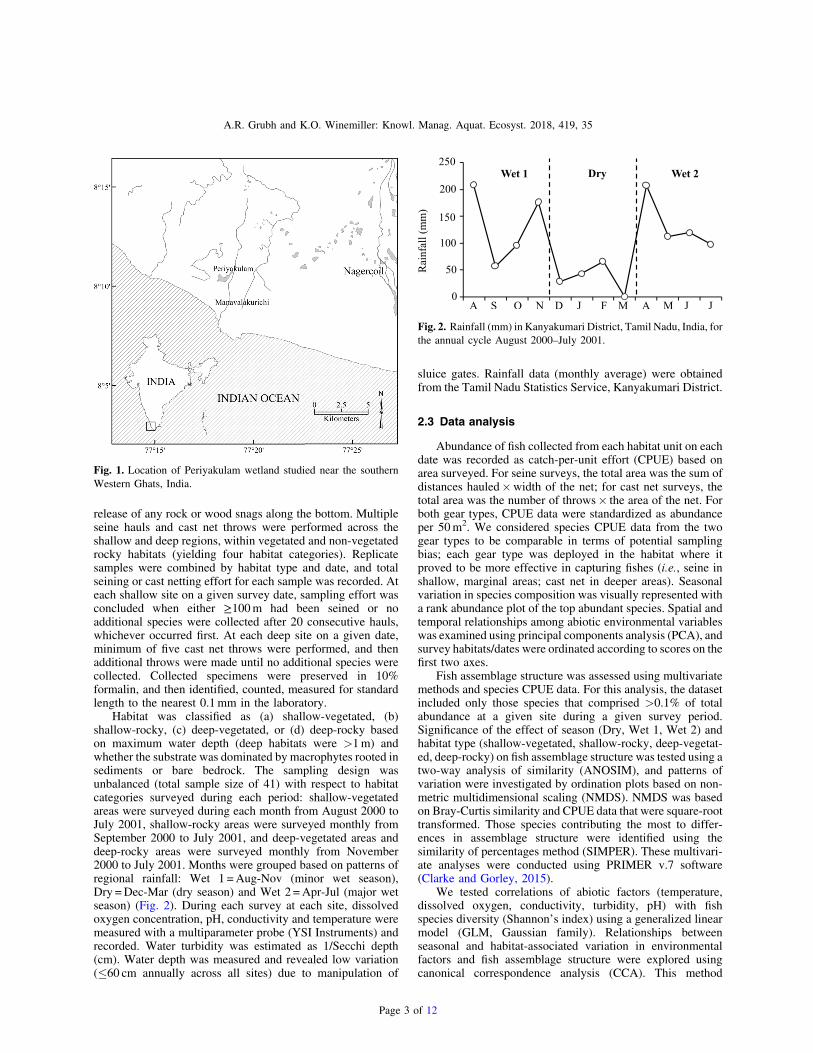
The study system was the Periyakulam wetland nearthe town of Manavalakurichi in Kanyakumari district (8° 1001900 N, 77° 180 3000 E, Fig. 1). This wetland is one of the largestwetlands in the area (ca. 58 ha) and had not been stocked withcarps for over 10 years at the time of our field surveys (Grubh,2003). Fishing intensity is low and tightly regulated by localauthorities. The wetland receives water from reservoirs throughcanals regulated by sluice gates. Most ponds within the wetlandretain water throughout the dry season. Water current wasimperceptible in the ponds; substrate was clayey soil to sandyloam, with flat bedrock in some areas. Aquatic macrophytesobserved were mostly lotus and lilies (Nymphea sp.) in deeperareas, and diverse submerged, emergent and floating macro-phytes in shallow areas (at least 36 species, including Azollasp., Ceratophyllum dimersum, Eichhornea crassipes, Hibiscusvitifolius, Ipomea aquatic, Jussiaea repens, Kirganeliareticulata, Lantana camara, Limnanthemum indicum, Ludwi-gia sp., Mimosa pudica, and Paspalum sp.).
2.2 Field surveys
Fishes were surveyed in areas near the wetland marginusing a seine (6! 1.6m, 2-mm mesh) in shallow areas ("1mdepth) and a cast net (6-m diameter, 10-mm mesh) in deeperareas. Two people pulled the seine, and two assisted with
Page 2 of 12
A.R. Grubh and K.O. Winemiller: Knowl. Manag. Aquat. Ecosyst. 2018, 419, 35
release of any rock or wood snags along the bottom. Multipleseine hauls and cast net throws were performed across theshallow and deep regions, within vegetated and non-vegetatedrocky habitats (yielding four habitat categories). Replicatesamples were combined by habitat type and date, and totalseining or cast netting effort for each sample was recorded. Ateach shallow site on a given survey date, sampling effort wasconcluded when either ≥100m had been seined or noadditional species were collected after 20 consecutive hauls,whichever occurred first. At each deep site on a given date,minimum of five cast net throws were performed, and thenadditional throws were made until no additional species werecollected. Collected specimens were preserved in 10%formalin, and then identified, counted, measured for standardlength to the nearest 0.1mm in the laboratory.
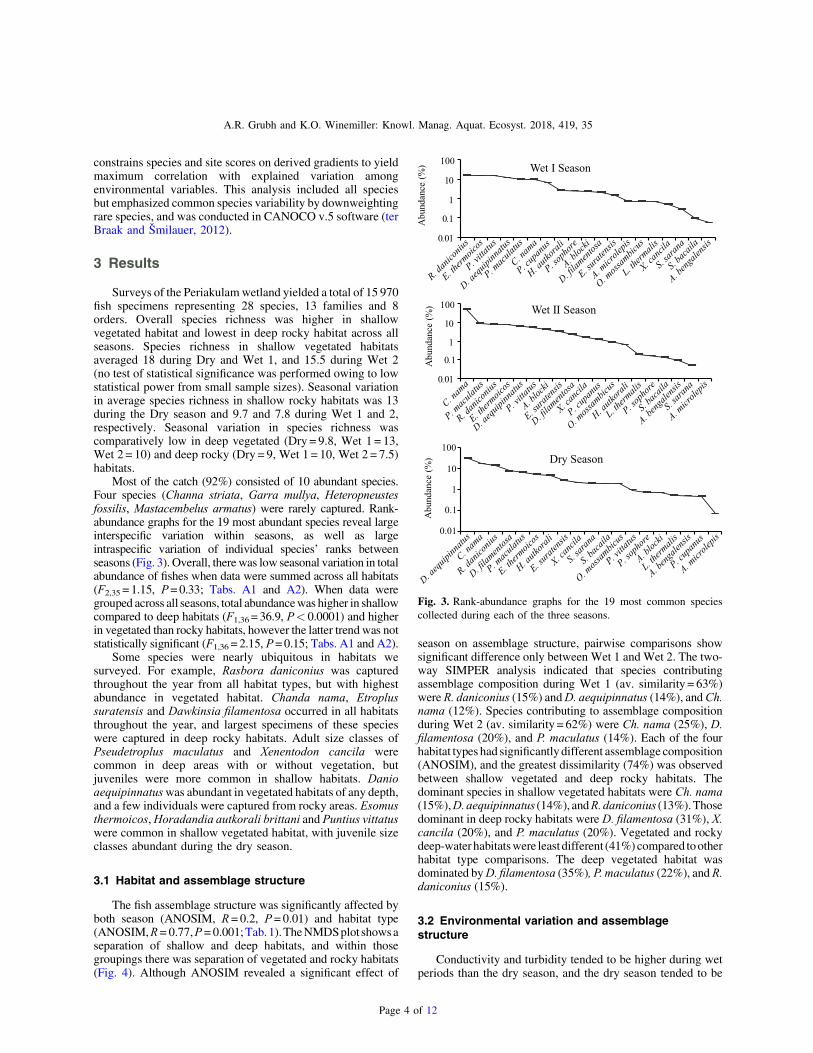
Habitat was classified as (a) shallow-vegetated, (b)shallow-rocky, (c) deep-vegetated, or (d) deep-rocky basedon maximum water depth (deep habitats were >1m) andwhether the substrate was dominated by macrophytes rooted insediments or bare bedrock. The sampling design wasunbalanced (total sample size of 41) with respect to habitatcategories surveyed during each period: shallow-vegetatedareas were surveyed during each month from August 2000 toJuly 2001, shallow-rocky areas were surveyed monthly fromSeptember 2000 to July 2001, and deep-vegetated areas anddeep-rocky areas were surveyed monthly from November2000 to July 2001. Months were grouped based on patterns ofregional rainfall: Wet 1 =Aug-Nov (minor wet season),Dry =Dec-Mar (dry season) and Wet 2 =Apr-Jul (major wetseason) (Fig. 2). During each survey at each site, dissolvedoxygen concentration, pH, conductivity and temperature weremeasured with a multiparameter probe (YSI Instruments) andrecorded. Water turbidity was estimated as 1/Secchi depth(cm). Water depth was measured and revealed low variation("60 cm annually across all sites) due to manipulation of
sluice gates. Rainfall data (monthly average) were obtainedfrom the Tamil Nadu Statistics Service, Kanyakumari District.
2.3 Data analysis
Abundance of fish collected from each habitat unit on eachdate was recorded as catch-per-unit effort (CPUE) based onarea surveyed. For seine surveys, the total area was the sum ofdistances hauled!width of the net; for cast net surveys, thetotal area was the number of throws! the area of the net. Forboth gear types, CPUE data were standardized as abundanceper 50m2. We considered species CPUE data from the twogear types to be comparable in terms of potential samplingbias; each gear type was deployed in the habitat where itproved to be more effective in capturing fishes (i.e., seine inshallow, marginal areas; cast net in deeper areas). Seasonalvariation in species composition was visually represented witha rank abundance plot of the top abundant species. Spatial andtemporal relationships among abiotic environmental variableswas examined using principal components analysis (PCA), andsurvey habitats/dates were ordinated according to scores on thefirst two axes.
Fish assemblage structure was assessed using multivariatemethods and species CPUE data. For this analysis, the datasetincluded only those species that comprised >0.1% of totalabundance at a given site during a given survey period.Significance of the effect of season (Dry, Wet 1, Wet 2) andhabitat type (shallow-vegetated, shallow-rocky, deep-vegetat-ed, deep-rocky) on fish assemblage structure was tested using atwo-way analysis of similarity (ANOSIM), and patterns ofvariation were investigated by ordination plots based on non-metric multidimensional scaling (NMDS). NMDS was basedon Bray-Curtis similarity and CPUE data that were square-roottransformed. Those species contributing the most to differ-ences in assemblage structure were identified using thesimilarity of percentages method (SIMPER). These multivari-ate analyses were conducted using PRIMER v.7 software(Clarke and Gorley, 2015).
We tested correlations of abiotic factors (temperature,dissolved oxygen, conductivity, turbidity, pH) with fishspecies diversity (Shannon’s index) using a generalized linearmodel (GLM, Gaussian family). Relationships betweenseasonal and habitat-associated variation in environmentalfactors and fish assemblage structure were explored usingcanonical correspondence analysis (CCA). This method
Fig. 1. Location of Periyakulam wetland studied near the southernWestern Ghats, India.
Fig. 2. Rainfall (mm) in Kanyakumari District, Tamil Nadu, India, forthe annual cycle August 2000–July 2001.
Page 3 of 12
A.R. Grubh and K.O. Winemiller: Knowl. Manag. Aquat. Ecosyst. 2018, 419, 35
constrains species and site scores on derived gradients to yieldmaximum correlation with explained variation amongenvironmental variables. This analysis included all speciesbut emphasized common species variability by downweightingrare species, and was conducted in CANOCO v.5 software (terBraak and Šmilauer, 2012).
3 Results
Surveys of the Periakulamwetland yielded a total of 15 970fish specimens representing 28 species, 13 families and 8orders. Overall species richness was higher in shallowvegetated habitat and lowest in deep rocky habitat across allseasons. Species richness in shallow vegetated habitatsaveraged 18 during Dry and Wet 1, and 15.5 during Wet 2(no test of statistical significance was performed owing to lowstatistical power from small sample sizes). Seasonal variationin average species richness in shallow rocky habitats was 13during the Dry season and 9.7 and 7.8 during Wet 1 and 2,respectively. Seasonal variation in species richness wascomparatively low in deep vegetated (Dry = 9.8, Wet 1 = 13,Wet 2 = 10) and deep rocky (Dry = 9, Wet 1 = 10, Wet 2 = 7.5)habitats.
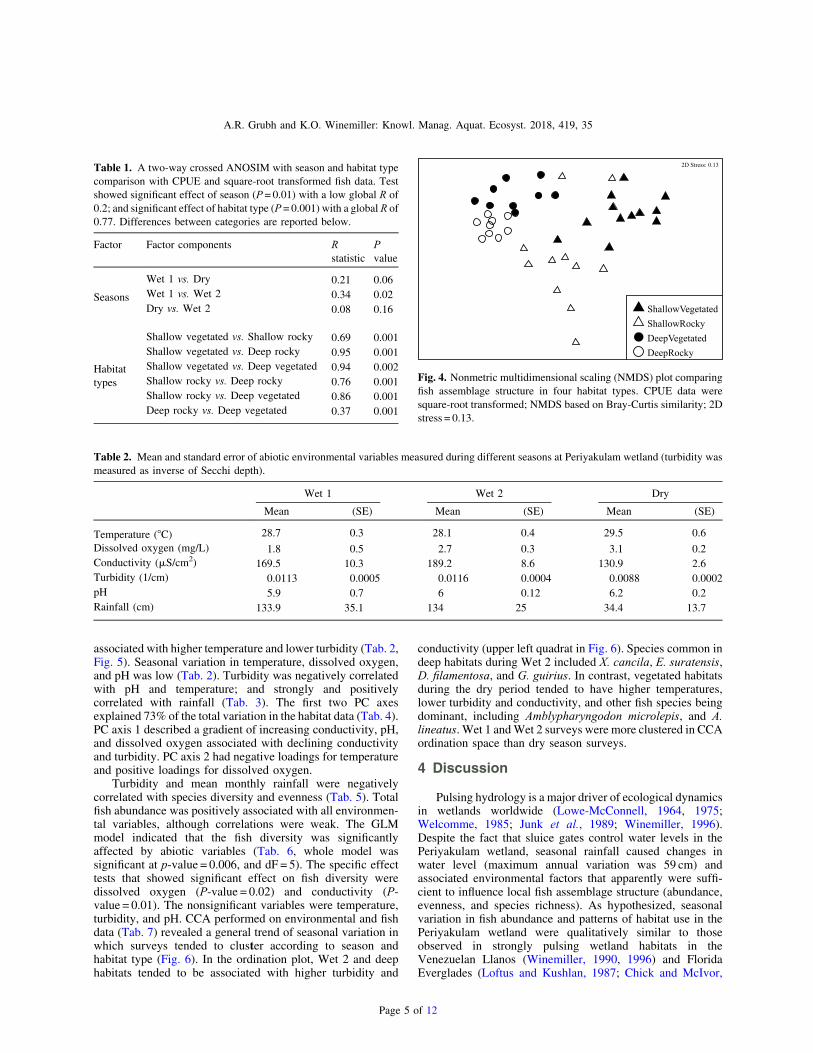
Most of the catch (92%) consisted of 10 abundant species.Four species (Channa striata, Garra mullya, Heteropneustesfossilis, Mastacembelus armatus) were rarely captured. Rank-abundance graphs for the 19 most abundant species reveal largeinterspecific variation within seasons, as well as largeintraspecific variation of individual species’ ranks betweenseasons (Fig. 3). Overall, there was low seasonal variation in totalabundance of fishes when data were summed across all habitats(F2,35 = 1.15, P=0.33; Tabs. A1 and A2). When data weregrouped across all seasons, total abundancewas higher in shallowcompared to deep habitats (F1,36 = 36.9, P< 0.0001) and higherin vegetated than rocky habitats, however the latter trendwas notstatistically significant (F1,36 = 2.15, P=0.15; Tabs. A1 and A2).
Some species were nearly ubiquitous in habitats wesurveyed. For example, Rasbora daniconius was capturedthroughout the year from all habitat types, but with highestabundance in vegetated habitat. Chanda nama, Etroplussuratensis and Dawkinsia filamentosa occurred in all habitatsthroughout the year, and largest specimens of these specieswere captured in deep rocky habitats. Adult size classes ofPseudetroplus maculatus and Xenentodon cancila werecommon in deep areas with or without vegetation, butjuveniles were more common in shallow habitats. Danioaequipinnatuswas abundant in vegetated habitats of any depth,and a few individuals were captured from rocky areas. Esomusthermoicos,Horadandia autkorali brittani and Puntius vittatuswere common in shallow vegetated habitat, with juvenile sizeclasses abundant during the dry season.
3.1 Habitat and assemblage structure
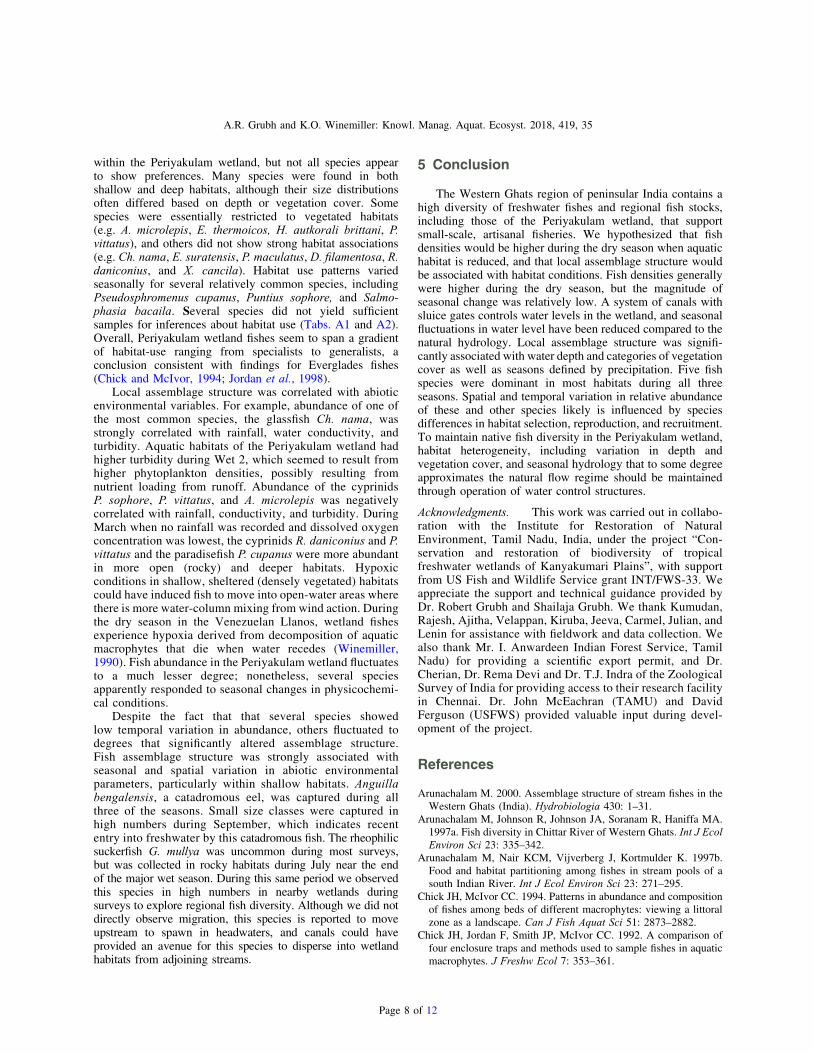
The fish assemblage structure was significantly affected byboth season (ANOSIM, R= 0.2, P= 0.01) and habitat type(ANOSIM,R= 0.77,P= 0.001;Tab. 1).TheNMDSplot showsaseparation of shallow and deep habitats, and within thosegroupings there was separation of vegetated and rocky habitats(Fig. 4). Although ANOSIM revealed a significant effect of
season on assemblage structure, pairwise comparisons showsignificant difference only between Wet 1 and Wet 2. The two-way SIMPER analysis indicated that species contributingassemblage composition during Wet 1 (av. similarity = 63%)were R. daniconius (15%) andD. aequipinnatus (14%), andCh.nama (12%). Species contributing to assemblage compositionduring Wet 2 (av. similarity = 62%) were Ch. nama (25%), D.filamentosa (20%), and P. maculatus (14%). Each of the fourhabitat types had significantly different assemblage composition(ANOSIM), and the greatest dissimilarity (74%) was observedbetween shallow vegetated and deep rocky habitats. Thedominant species in shallow vegetated habitats were Ch. nama(15%),D.aequipinnatus (14%), andR.daniconius (13%).Thosedominant in deep rocky habitats were D. filamentosa (31%), X.cancila (20%), and P. maculatus (20%). Vegetated and rockydeep-waterhabitatswere leastdifferent (41%)compared tootherhabitat type comparisons. The deep vegetated habitat wasdominated byD. filamentosa (35%), P. maculatus (22%), andR.daniconius (15%).
3.2 Environmental variation and assemblagestructure
Conductivity and turbidity tended to be higher during wetperiods than the dry season, and the dry season tended to be
Fig. 3. Rank-abundance graphs for the 19 most common speciescollected during each of the three seasons.
Page 4 of 12
A.R. Grubh and K.O. Winemiller: Knowl. Manag. Aquat. Ecosyst. 2018, 419, 35
associated with higher temperature and lower turbidity (Tab. 2,Fig. 5). Seasonal variation in temperature, dissolved oxygen,and pH was low (Tab. 2). Turbidity was negatively correlatedwith pH and temperature; and strongly and positivelycorrelated with rainfall (Tab. 3). The first two PC axesexplained 73% of the total variation in the habitat data (Tab. 4).PC axis 1 described a gradient of increasing conductivity, pH,and dissolved oxygen associated with declining conductivityand turbidity. PC axis 2 had negative loadings for temperatureand positive loadings for dissolved oxygen.
Turbidity and mean monthly rainfall were negativelycorrelated with species diversity and evenness (Tab. 5). Totalfish abundance was positively associated with all environmen-tal variables, although correlations were weak. The GLMmodel indicated that the fish diversity was significantlyaffected by abiotic variables (Tab. 6, whole model wassignificant at p-value = 0.006, and dF = 5). The specific effecttests that showed significant effect on fish diversity weredissolved oxygen (P-value = 0.02) and conductivity (P-value = 0.01). The nonsignificant variables were temperature,turbidity, and pH. CCA performed on environmental and fishdata (Tab. 7) revealed a general trend of seasonal variation inwhich surveys tended to cluster according to season andhabitat type (Fig. 6). In the ordination plot, Wet 2 and deephabitats tended to be associated with higher turbidity and
conductivity (upper left quadrat in Fig. 6). Species common indeep habitats during Wet 2 included X. cancila, E. suratensis,D. filamentosa, and G. guirius. In contrast, vegetated habitatsduring the dry period tended to have higher temperatures,lower turbidity and conductivity, and other fish species beingdominant, including Amblypharyngodon microlepis, and A.lineatus. Wet 1 andWet 2 surveys were more clustered in CCAordination space than dry season surveys.
4 Discussion
Pulsing hydrology is a major driver of ecological dynamicsin wetlands worldwide (Lowe-McConnell, 1964, 1975;Welcomme, 1985; Junk et al., 1989; Winemiller, 1996).Despite the fact that sluice gates control water levels in thePeriyakulam wetland, seasonal rainfall caused changes inwater level (maximum annual variation was 59 cm) andassociated environmental factors that apparently were suffi-cient to influence local fish assemblage structure (abundance,evenness, and species richness). As hypothesized, seasonalvariation in fish abundance and patterns of habitat use in thePeriyakulam wetland were qualitatively similar to thoseobserved in strongly pulsing wetland habitats in theVenezuelan Llanos (Winemiller, 1990, 1996) and FloridaEverglades (Loftus and Kushlan, 1987; Chick and McIvor,
Table 1. A two-way crossed ANOSIM with season and habitat typecomparison with CPUE and square-root transformed fish data. Testshowed significant effect of season (P= 0.01) with a low global R of0.2; and significant effect of habitat type (P= 0.001) with a global R of0.77. Differences between categories are reported below.
Factor Factor components Rstatistic
Pvalue
Seasons
Wet 1 vs. Dry 0.21 0.06Wet 1 vs. Wet 2 0.34 0.02Dry vs. Wet 2 0.08 0.16
Habitattypes
Shallow vegetated vs. Shallow rocky 0.69 0.001Shallow vegetated vs. Deep rocky 0.95 0.001Shallow vegetated vs. Deep vegetated 0.94 0.002Shallow rocky vs. Deep rocky 0.76 0.001Shallow rocky vs. Deep vegetated 0.86 0.001Deep rocky vs. Deep vegetated 0.37 0.001
Fig. 4. Nonmetric multidimensional scaling (NMDS) plot comparingfish assemblage structure in four habitat types. CPUE data weresquare-root transformed; NMDS based on Bray-Curtis similarity; 2Dstress = 0.13.
Table 2. Mean and standard error of abiotic environmental variables measured during different seasons at Periyakulam wetland (turbidity wasmeasured as inverse of Secchi depth).
Wet 1 Wet 2 Dry
Mean (SE) Mean (SE) Mean (SE)
Temperature (°C) 28.7 0.3 28.1 0.4 29.5 0.6Dissolved oxygen (mg/L) 1.8 0.5 2.7 0.3 3.1 0.2Conductivity (mS/cm2) 169.5 10.3 189.2 8.6 130.9 2.6Turbidity (1/cm) 0.0113 0.0005 0.0116 0.0004 0.0088 0.0002pH 5.9 0.7 6 0.12 6.2 0.2Rainfall (cm) 133.9 35.1 134 25 34.4 13.7
Page 5 of 12
A.R. Grubh and K.O. Winemiller: Knowl. Manag. Aquat. Ecosyst. 2018, 419, 35

1994; Loftus and Eklund, 1994; Jordan et al., 1998), but themagnitude of density change was lower at Periyakulam. In theLlanos and Everglades, fish densities often are very highwithin isolated water bodies during the dry season; during thewet season, aquatic habitat expands and most fish have greaterforaging opportunities and grow faster. Everglades fishesrevealed species-specific responses to variation in factors suchas risk of predation and food availability (Chick et al., 1992;Jordan et al., 1998). In the Periyakulam wetland, Ch. nama, P.maculatus, R. daniconius, E. thermoicos, andD. aequipinnatuswere the five most abundant species. Their dominance wasmaintained throughout all three seasons.
Although we did not analyze fish size distribution data, itwas apparent that juveniles of many species were mostabundant within shallow habitats. Small juveniles of severalspecies, including the cichlid P. maculatus, were capturedthroughout the year in shallow habitats. In a study conducted inSri Lanka, individuals of this species were observed brooding
young throughout the year (Ward and Wyman, 1977). Intropical and subtropical habitats with stable or unpredictablehydrology, fish reproduction may be largely aseasonal (Loftusand Kushlan, 1987; Winemiller, 1989b; Jordan et al., 1998). Inour study, small fishes with opportunistic life history strategies(sensu Winemiller, 1989b; Winemiller and Rose, 1992), suchas P. vittatus and Ch. nama, apparently spawned throughoutthe year; however, two spawning peaks were observed duringDecember and May following periods of high rainfall. Otherspecies had greater abundance of juvenile size classes duringthe major wet season (Wet 2), suggesting greater reproductiveactivity. Although water depth fluctuated relatively little in thePeriyakulam wetland, seasonal rainfall could have affectedallochthonus nutrient inputs, thereby influencing fish habitatuse, food resource availability and reproductive effort. Manytropical fishes have seasonal reproduction that appears to beadaptive in systems with pulsing hydrology (Winemiller,1989b). For these seasonal spawners, the timing of reproduc-tion may be influenced by subtle environmental cues, such asshifts in day length or water conductivity. Though we did notestimate primary production, flood pulses may releaseinorganic nutrients from sediments that subsequently supportgreater production of aquatic macrophytes and algae (Junket al., 1989). In oligotrophic systems, floodwaters can dilutedissolved inorganic nutrients causing a reduction in net aquaticprimary production (Cotner et al., 2006).
In tropical ecosystems with seasonal flood pulses, risingwater levels during the wet season induce fishes to leave dry-season refugia and move either laterally onto floodplains orlongitudinally upstream to spawn and feed (Lowe-McConnell,1964; Junk et al., 1989; Winemiller and Jepsen, 1998). Thispattern of seasonal movement was not observed in thePeriyakulam wetland. We hypothesized that species richness
Fig. 5. PCA ordination of survey dates based on analysis of abioticenvironmental variables. The first two axes account for 73% of theexplained variation. Length and angle of vectors indicate the strengthof the correlation between a given variable and PC axis 1 and 2.
Table 3. Environmental factors correlation matrix (Spearman’s r).
Temperature Dissolved oxygen Conductivity Turbidity pH
Dissolvedoxygen
0.08
Conductivity #0.83** #0.26Turbidity #0.77** #0.43 0.83**
pH 0.54 0.66* #0.77** #0.6*
Rainfall #0.84** #0.36 0.96** 0.96** #0.72**
* Correlation values in bold are significant at P< 0.05.** Correlation values in bold are significant at P< 0.01.
Table 4. PCA eigenvalues and major axis loadings of abioticenvironmental variables. Total variation explained by both PC axeswas 72.91%.
Habitat variables PC 1 PC 2
Temperature 0.53 #0.54Dissolved oxygen 0.62 0.72Conductivity #0.8 0.07Turbidity #0.6 0.68pH 0.73 0.41Eigenvalue 0.44 0.28
Page 6 of 12
A.R. Grubh and K.O. Winemiller: Knowl. Manag. Aquat. Ecosyst. 2018, 419, 35

would be greatest during the dry season when fishes arerestricted to smaller volumes of aquatic habitat. Speciesrichness tended to be higher during our dry-season surveys inshallow habitats dominated by vegetation or rocky substrate,
but no seasonal trend in species richness was observed for deephabitats.
As predicted, the structure of local species assemblageswithin the Periyakulam wetland was strongly associatedwith both habitat and season, with the habitat relationshipbeing stronger. Generally, vegetation, substrate composition,and water depth are expected to affect fish habitat use. Ourfour habitat categories were widely separated in multivariateordination space. Species-specific patterns of habitat useprobably influence spatial variation in assemblage structure
Table 5. Correlations (Spearman’s r) between assemblage and abiotic environmental variables.
Temperature Dissolved oxygen Conductivity Turbidity pH Rainfall
Species richness 0.38 #0.03 #0.49 #0.11 0.48 #0.31Total abundance 0.04 0.1 0.03 0.14 0.07 0.1Species diversity 0.47 0.27 #0.57 #0.62* 0.5 #0.62Species evenness 0.57 0.14 #0.72* #0.47 0.65* #0.61
Correlation values in bold are significant at P< 0.05. Shannon’s species diversity, and Pielou’s evenness index were used.
Table 6. Results of a GLM relating fish diversity (Shannon’sdiversity index) to abiotic environmental factors.
Species diversity dF Chi square P-value
Whole model 5 16.47 0.006
Effect testsTemperature 1 0.11 0.74Dissolved oxygen 1 5.80 0.02Conductivity 1 6.49 0.01Turbidity 1 0.78 0.38pH 1 2.52 0.11
P-values in bold are significant.
Table 7. Axis eigenvalues and species axis scores for CCA based onspecies abundance and environmental data in shallow vegetatedhabitat. The fitted variation explained by first two CCA axes was75.24%.
Species Axis 1 Axis 2
Amblypharyngodon microlepis 1.69 #1.99Anguilla bengalensis 1.40 4.94Aplocheilus blocki 0.01 #0.28Aplocheilus lineatus 2.61 #3.67Chanda nama #0.87 1.00Channa sp. 5.17 #2.77Danio aequipinnatus 1.79 0.46Dawkinsia filamentosa #0.60 #0.55Esomus thermoicos 1.63 #0.18Etroplus suratensis #1.02 #0.50Garra mullya #0.40 14.83Glossogobius guiris #0.05 1.40Heteropneustes fossilis 0.94 2.11Horadandia autukorali 0.62 0.31Lepidocephalus thermalis 0.77 1.50Mastacembelus armatus #1.41 7.09Mystus armatus 0.14 #2.22Oreochromis mossambicus #0.87 #0.73Pseudetroplus maculatus #0.51 0.21Pseudosphromenus cupanus #0.07 #3.11Puntius dorsalis 0.89 0.90Puntius sophore 1.82 #0.42Puntius vittatus 0.00 #0.82Rasbora daniconius 0.42 #0.47Salmophasia bacaila #0.01 #1.14Systomus sarana 2.89 2.69Xenentodon cancila #1.39 1.10
Eigenvalue 0.06 0.03Fig. 6. Ordination of dates for surveys from vegetated habitats basedon CCA environmental axes constrained by species CPUE data. Thefirst two axes account for 75% of the explained fitted variation. Vectorlength and position indicates the relative influence of the abioticenvironmental variable on each axis. Ellipses encompass surveysaccording to season. Species scores on CCA axes for assemblagestructure are given in Table 7.
Page 7 of 12
A.R. Grubh and K.O. Winemiller: Knowl. Manag. Aquat. Ecosyst. 2018, 419, 35
within the Periyakulam wetland, but not all species appearto show preferences. Many species were found in bothshallow and deep habitats, although their size distributionsoften differed based on depth or vegetation cover. Somespecies were essentially restricted to vegetated habitats(e.g. A. microlepis, E. thermoicos, H. autkorali brittani, P.vittatus), and others did not show strong habitat associations(e.g. Ch. nama, E. suratensis, P. maculatus, D. filamentosa, R.daniconius, and X. cancila). Habitat use patterns variedseasonally for several relatively common species, includingPseudosphromenus cupanus, Puntius sophore, and Salmo-phasia bacaila. Several species did not yield sufficientsamples for inferences about habitat use (Tabs. A1 and A2).Overall, Periyakulam wetland fishes seem to span a gradientof habitat-use ranging from specialists to generalists, aconclusion consistent with findings for Everglades fishes(Chick and McIvor, 1994; Jordan et al., 1998).
Local assemblage structure was correlated with abioticenvironmental variables. For example, abundance of one ofthe most common species, the glassfish Ch. nama, wasstrongly correlated with rainfall, water conductivity, andturbidity. Aquatic habitats of the Periyakulam wetland hadhigher turbidity during Wet 2, which seemed to result fromhigher phytoplankton densities, possibly resulting fromnutrient loading from runoff. Abundance of the cyprinidsP. sophore, P. vittatus, and A. microlepis was negativelycorrelated with rainfall, conductivity, and turbidity. DuringMarch when no rainfall was recorded and dissolved oxygenconcentration was lowest, the cyprinids R. daniconius and P.vittatus and the paradisefish P. cupanus were more abundantin more open (rocky) and deeper habitats. Hypoxicconditions in shallow, sheltered (densely vegetated) habitatscould have induced fish to move into open-water areas wherethere is more water-column mixing from wind action. Duringthe dry season in the Venezuelan Llanos, wetland fishesexperience hypoxia derived from decomposition of aquaticmacrophytes that die when water recedes (Winemiller,1990). Fish abundance in the Periyakulam wetland fluctuatesto a much lesser degree; nonetheless, several speciesapparently responded to seasonal changes in physicochemi-cal conditions.
Despite the fact that that several species showedlow temporal variation in abundance, others fluctuated todegrees that significantly altered assemblage structure.Fish assemblage structure was strongly associated withseasonal and spatial variation in abiotic environmentalparameters, particularly within shallow habitats. Anguillabengalensis, a catadromous eel, was captured during allthree of the seasons. Small size classes were captured inhigh numbers during September, which indicates recententry into freshwater by this catadromous fish. The rheophilicsuckerfish G. mullya was uncommon during most surveys,but was collected in rocky habitats during July near the endof the major wet season. During this same period we observedthis species in high numbers in nearby wetlands duringsurveys to explore regional fish diversity. Although we did notdirectly observe migration, this species is reported to moveupstream to spawn in headwaters, and canals could haveprovided an avenue for this species to disperse into wetlandhabitats from adjoining streams.
5 Conclusion
The Western Ghats region of peninsular India contains ahigh diversity of freshwater fishes and regional fish stocks,including those of the Periyakulam wetland, that supportsmall-scale, artisanal fisheries. We hypothesized that fishdensities would be higher during the dry season when aquatichabitat is reduced, and that local assemblage structure wouldbe associated with habitat conditions. Fish densities generallywere higher during the dry season, but the magnitude ofseasonal change was relatively low. A system of canals withsluice gates controls water levels in the wetland, and seasonalfluctuations in water level have been reduced compared to thenatural hydrology. Local assemblage structure was signifi-cantly associated with water depth and categories of vegetationcover as well as seasons defined by precipitation. Five fishspecies were dominant in most habitats during all threeseasons. Spatial and temporal variation in relative abundanceof these and other species likely is influenced by speciesdifferences in habitat selection, reproduction, and recruitment.To maintain native fish diversity in the Periyakulam wetland,habitat heterogeneity, including variation in depth andvegetation cover, and seasonal hydrology that to some degreeapproximates the natural flow regime should be maintainedthrough operation of water control structures.
Acknowledgments. This work was carried out in collabo-ration with the Institute for Restoration of NaturalEnvironment, Tamil Nadu, India, under the project “Con-servation and restoration of biodiversity of tropicalfreshwater wetlands of Kanyakumari Plains”, with supportfrom US Fish and Wildlife Service grant INT/FWS-33. Weappreciate the support and technical guidance provided byDr. Robert Grubh and Shailaja Grubh. We thank Kumudan,Rajesh, Ajitha, Velappan, Kiruba, Jeeva, Carmel, Julian, andLenin for assistance with fieldwork and data collection. Wealso thank Mr. I. Anwardeen Indian Forest Service, TamilNadu) for providing a scientific export permit, and Dr.Cherian, Dr. Rema Devi and Dr. T.J. Indra of the ZoologicalSurvey of India for providing access to their research facilityin Chennai. Dr. John McEachran (TAMU) and DavidFerguson (USFWS) provided valuable input during devel-opment of the project.
References
Arunachalam M. 2000. Assemblage structure of stream fishes in theWestern Ghats (India). Hydrobiologia 430: 1–31.
Arunachalam M, Johnson R, Johnson JA, Soranam R, Haniffa MA.1997a. Fish diversity in Chittar River of Western Ghats. Int J EcolEnviron Sci 23: 335–342.
Arunachalam M, Nair KCM, Vijverberg J, Kortmulder K. 1997b.Food and habitat partitioning among fishes in stream pools of asouth Indian River. Int J Ecol Environ Sci 23: 271–295.
Chick JH, McIvor CC. 1994. Patterns in abundance and compositionof fishes among beds of different macrophytes: viewing a littoralzone as a landscape. Can J Fish Aquat Sci 51: 2873–2882.
Chick JH, Jordan F, Smith JP, McIvor CC. 1992. A comparison offour enclosure traps and methods used to sample fishes in aquaticmacrophytes. J Freshw Ecol 7: 353–361.
Page 8 of 12
A.R. Grubh and K.O. Winemiller: Knowl. Manag. Aquat. Ecosyst. 2018, 419, 35

Clarke KR, Gorley RN. 2015. PRIMER v.7: user manual/tutorial.Plymouth: PRIMER-E, 296 p.
Correa SB, Winemiller KO. 2014. Niche partitioning amongfrugivorous fishes in response to fluctuating resources in theAmazonian floodplain forest. Ecology 95: 210–224.
Cotner JB, Montoya JV, Roelke DL, Winemiller KO. 2006. Seasonalvariability in benthic and water column productivity in aVenezuelan llanos river. J N Am Benthol Soc 25: 171–184.
Dahanukar N, Raghavan R, Ali A, Abraham R, Shaji CP. The statusand distribution of freshwater fishes of the Western Ghats. In:Molur S, Smith KG, Daniel BA, Darwall, WRT, eds. The status anddistribution of freshwater biodiversity in the Western Ghats, India.Coimbatore (India): IUCN, Cambridge, UK and Gland,Switzerland, and Zoo Outreach Organisation, 2011, pp. 21–48.
Dionne M, Folt CL. 1991. An experimental analysis of macrophytegrowth forms as fish foraging habitat. Can J Fish Aquat Sci 48:123–131.
Downing JA. The effect of habitat structure on the spatialdistribution of freshwater invertebrate populations. In: Bell SS,McCoy ED, Munshinsky HR, eds. Habitat structure: the physicalarrangement of objects in space. New York: Chapman and Hall,1991.
Grubh RB. 1995. Conservation and management of Suchindramkulam wetland in southern India for promotion of agriculture,fishing and ecotourism. Final Technical Report for the BiodiversitySupport Program. Nagercoil (India): Institute for Restoration ofNatural Environment.
Grubh RB. 2003. Project conservation and restoration ofbiodiversity of the tropical freshwater Wetlands of KanyakumariPlains in Peninsular India. Consolidated Technical Report 2000–2002. Nagercoil (India): Institute for Restoration of NaturalEnvironment.
Heck KL, Crowder LB. Habitat structure and predator-preyinteractions in vegetated aquatic systems. In: Bell SS, McCoyED, Mushinsky HR, eds. Habitat structure: the physical arrange-ment of objects in space. London: Chapman and Hall, 1991, pp.281–299.
Jackson AT, Adite KA, Roach KA, Winemiller KO. 2013. Fishassemblages of an African river floodplain a test of alternativemodels of community structure. Ecol Freshw Fish 22: 295–306.
Jardine TD, Bond NR, Burford MA, et al. 2015. Does flood rhythmdrive ecosystem responses in tropical riverscapes? Ecology 96:684–692.
Johnson JA, Arunachalam M. 2009. Diversity, distribution andassemblage structures of fishes in streams of southern WesternGhats, India. J Threat Taxa 1: 507–513.
Jordan F, Babbitt KJ, McIvor CC. 1998. Seasonal variation in habitatuse by marsh fishes. Ecol Freshw Fish 7: 159–166.
Junk WJ, Bayley PB, Sparks RE. 1989. The flood pulse conceptin river-floodplain systems. Can Spec Publ Fish Aquat Sci 106:110–127.
Junk WJ, Soares MGM, Carvalho FM. 1983. Distribution on fishspecies in a lake of the Amazon River floodplain near Manaus(Lago Camaleão), with special reference to extreme oxygenconditions. Amazoniana 7: 397–431.
Lillie RA, Budd J. 1992. Habitat architecture of Myriophyllumspicatum L. as an index to habitat quality for fish andmacroinvertebrates. J Freshw Ecol 7: 113–125.
Loftus WF, Eklund AM. 1994. Long-term dynamics of an Evergladessmall-fish assemblage. In: Davis SM, Ogden JC, eds. Everglades:the ecosystem and its restoration. Delray Beach (FL): St. LuciePress, pp. 461–483.
Loftus WF, Kushlan JA. 1987. Freshwater fishes of southern Florida.Bull Fla State Mus, Biol Sci 31: 147–344.
Lowe-McConnell RH. 1964. The fishes of the Rupununi savannadistrict of British Guiana, Pt. 1. Groupings of fish speciesand effects of the seasonal cycles on the fish. Zool J Linn Soc 45:103–144.
Lowe-McConnell RH. 1975. Fish communities in tropical fresh-waters: their distribution, ecology, and evolution. London:Longman.
Lowe-McConnell RH. 1987. Ecological studies in tropical fishcommunities. Cambridge University Press, Cambridge.
Meals KO, Miranda LE. 1991. Variability in abundance of age-0centrarchids among littoral habitats of flood control reservoirs inMississippi. N Am J Fish Manag 11: 298–304.
Roach KA, Winemiller KO. 2015. Hydrologic regime and turbidityinfluence entrance of terrestrial material into river food webs.Can JFish Aquat Sci 72: 1099–1112.
Rodríguez MA, Lewis -Jr. WM. 1997. Structure of fish assemblagesalong environmental gradients in floodplains lakes of the OrinocoRiver. Ecol Monogr 67: 109–128.
Röpke CP, Amadio J, Zuanon E, Ferreira C, Pereira de Deus C,Winemiller KO. 2017. Simultaneous abrupt shifts in hydrology andfish assemblage structure in a floodplain lake in the centralAmazon. Sci Rep 7: 40170.
Ryder CH. 1988. Pipefish foraging: effects of fish size, preysize and altered habitat complexity. Mar Ecol Prog Ser 48:37–45.
Savino JF, Stein RA. 1982. Predator-prey interaction betweenlargemouth bass and bluegills as influenced by simulated,submersed vegetation. Trans Am Fish Soc 111: 255–266.
ter Braak CJF, Šmilauer P. 2012. CANOCO reference manual anduser’s guide software for ordination (version 5.0). Ithaca (NY):Microcomputer Power, 496 p.
Thomaz SM, Bini LM, Bozelli RL. 2007. Floods increase similarityamong aquatic habitats in river-floodplain systems. Hydrobiologia579: 1–13.
Ward JA,Wyman RL. 1977. Ethology and ecology of cichlid fishes ofthe genus Etroplus in Sri Lanka: preliminary findings. Environ BiolFishes 2: 137–145.
Welcomme RL. 1985. River Fisheries. Fisheries Technical Paper 262,FAO, Rome.
Winemiller KO. 1989a. Ontogenetic diet shifts and resourcepartitioning among piscivorous fishes in the Venezuelan llanos.Environ Biol Fishes 26: 177–199.
Winemiller KO. 1989b. Patterns of variation in life history amongSouth American fishes in seasonal environments. Oecologia 81:225–241.
Winemiller KO. 1990. Spatial and temporal variation in tropical fishtrophic networks. Ecol Monogr 60: 331–367.
Winemiller KO. Factors driving spatial and temporal variation inaquatic floodplain food webs. In: Polis GA, Winemiller KO, eds.Food webs: integration of patterns and dynamics. New York:Chapman and Hall, 1996, pp. 298–312.
Winemiller KO. 2004. Floodplain river food webs: generalizationsand implications for fisheries management. In: Welcomme RL,Petr T, eds. Proceedings of the Second International Sympo-sium on the Management of Large Rivers for Fisheries VolumeII. Bangkok (Thailand): RAP Publication 2004/16, RegionalOffice for Asia and the Pacific, pp. 285–309.
Winemiller KO, Jepsen DB. 1998. Effects of seasonality and fishmovement on tropical river food webs. J Fish Biol (Suppl A)267–296.
Page 9 of 12
A.R. Grubh and K.O. Winemiller: Knowl. Manag. Aquat. Ecosyst. 2018, 419, 35

Winemiller KO, Rose KA. 1992. Patterns of life-history diversifica-tion in North-American Fishes-implications for populationregulation. Can J Fish Aquat Sci 49: 2196–2218.
Winemiller KO, Tarim S, Shormann D, Cotner JB. 2000. Fishassemblage structure in relation to environmental variation amongBrazos River oxbow lakes. Trans Am Fish Soc 129: 451–468.
Cite this article as: Grubh AR, Winemiller KO. 2018. Spatiotemporal variation in wetland fish assemblages in the Western Ghats region ofIndia. Knowl. Manag. Aquat. Ecosyst., 419, 35.
Page 10 of 12
A.R. Grubh and K.O. Winemiller: Knowl. Manag. Aquat. Ecosyst. 2018, 419, 35
Appendix A
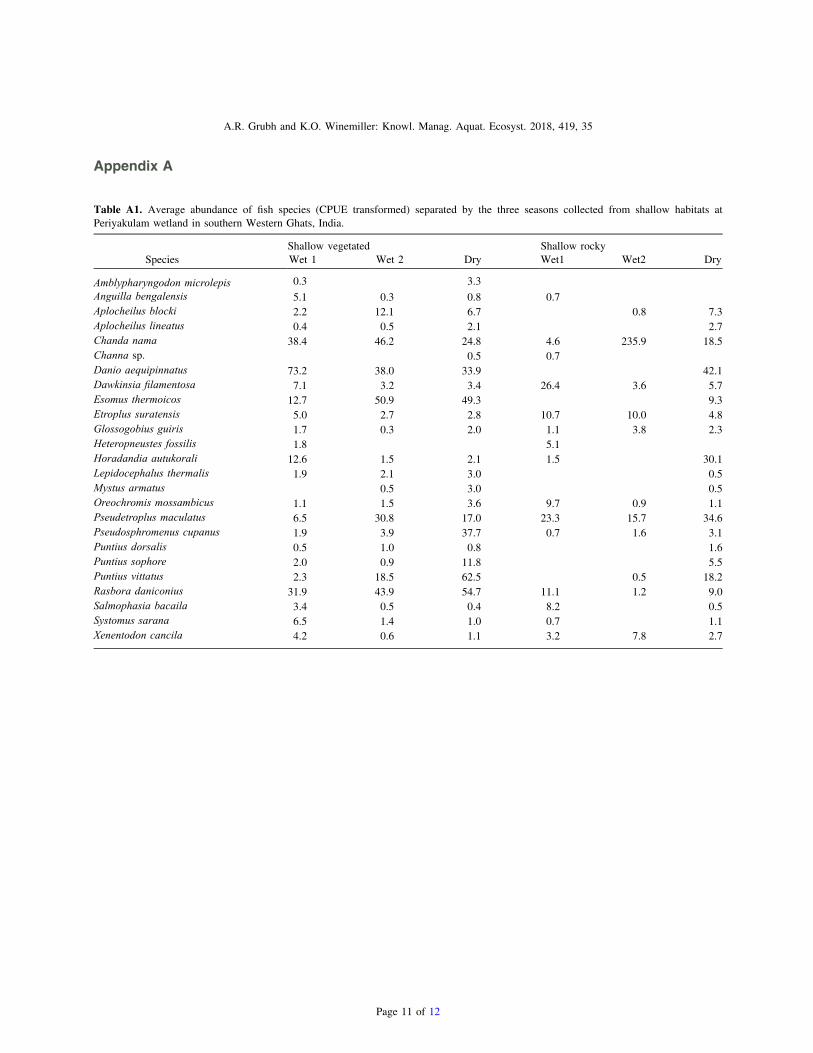
Table A1. Average abundance of fish species (CPUE transformed) separated by the three seasons collected from shallow habitats atPeriyakulam wetland in southern Western Ghats, India.
Shallow vegetated Shallow rockySpecies Wet 1 Wet 2 Dry Wet1 Wet2 Dry
Amblypharyngodon microlepis 0.3 3.3Anguilla bengalensis 5.1 0.3 0.8 0.7Aplocheilus blocki 2.2 12.1 6.7 0.8 7.3Aplocheilus lineatus 0.4 0.5 2.1 2.7Chanda nama 38.4 46.2 24.8 4.6 235.9 18.5Channa sp. 0.5 0.7Danio aequipinnatus 73.2 38.0 33.9 42.1Dawkinsia filamentosa 7.1 3.2 3.4 26.4 3.6 5.7Esomus thermoicos 12.7 50.9 49.3 9.3Etroplus suratensis 5.0 2.7 2.8 10.7 10.0 4.8Glossogobius guiris 1.7 0.3 2.0 1.1 3.8 2.3Heteropneustes fossilis 1.8 5.1Horadandia autukorali 12.6 1.5 2.1 1.5 30.1Lepidocephalus thermalis 1.9 2.1 3.0 0.5Mystus armatus 0.5 3.0 0.5Oreochromis mossambicus 1.1 1.5 3.6 9.7 0.9 1.1Pseudetroplus maculatus 6.5 30.8 17.0 23.3 15.7 34.6Pseudosphromenus cupanus 1.9 3.9 37.7 0.7 1.6 3.1Puntius dorsalis 0.5 1.0 0.8 1.6Puntius sophore 2.0 0.9 11.8 5.5Puntius vittatus 2.3 18.5 62.5 0.5 18.2Rasbora daniconius 31.9 43.9 54.7 11.1 1.2 9.0Salmophasia bacaila 3.4 0.5 0.4 8.2 0.5Systomus sarana 6.5 1.4 1.0 0.7 1.1Xenentodon cancila 4.2 0.6 1.1 3.2 7.8 2.7
Page 11 of 12
A.R. Grubh and K.O. Winemiller: Knowl. Manag. Aquat. Ecosyst. 2018, 419, 35
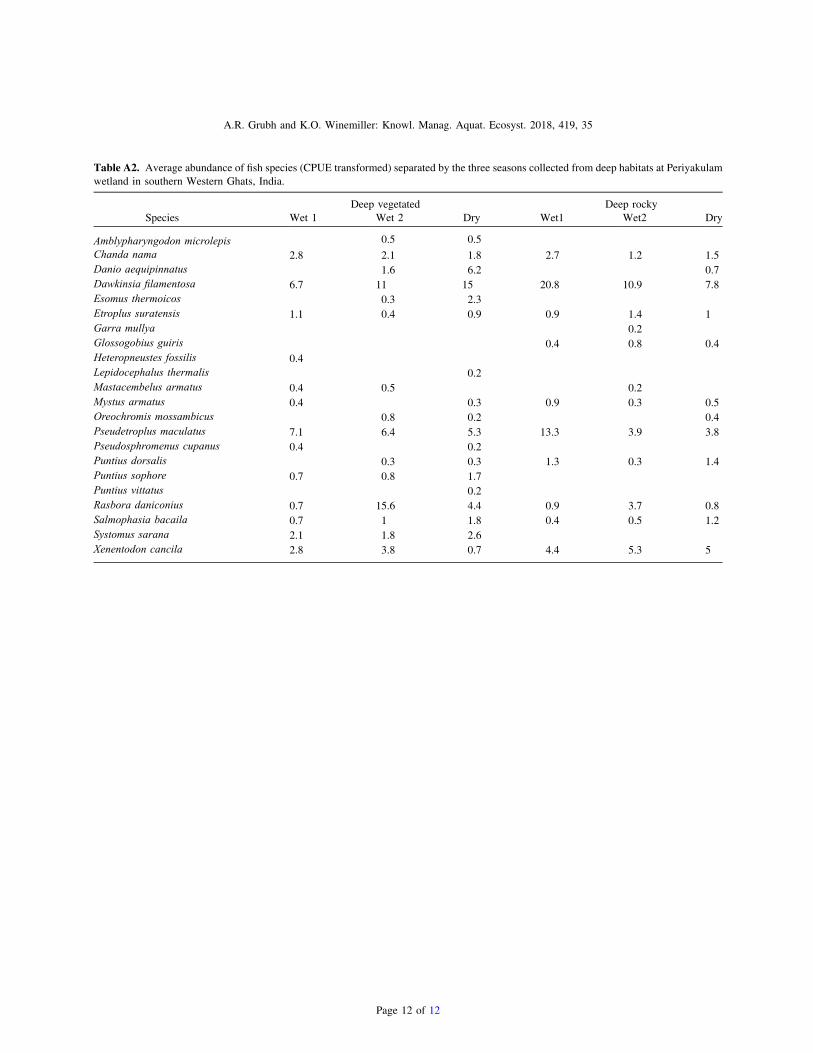
Table A2. Average abundance of fish species (CPUE transformed) separated by the three seasons collected from deep habitats at Periyakulamwetland in southern Western Ghats, India.
Deep vegetated Deep rockySpecies Wet 1 Wet 2 Dry Wet1 Wet2 Dry
Amblypharyngodon microlepis 0.5 0.5Chanda nama 2.8 2.1 1.8 2.7 1.2 1.5Danio aequipinnatus 1.6 6.2 0.7Dawkinsia filamentosa 6.7 11 15 20.8 10.9 7.8Esomus thermoicos 0.3 2.3Etroplus suratensis 1.1 0.4 0.9 0.9 1.4 1Garra mullya 0.2Glossogobius guiris 0.4 0.8 0.4Heteropneustes fossilis 0.4Lepidocephalus thermalis 0.2Mastacembelus armatus 0.4 0.5 0.2Mystus armatus 0.4 0.3 0.9 0.3 0.5Oreochromis mossambicus 0.8 0.2 0.4Pseudetroplus maculatus 7.1 6.4 5.3 13.3 3.9 3.8Pseudosphromenus cupanus 0.4 0.2Puntius dorsalis 0.3 0.3 1.3 0.3 1.4Puntius sophore 0.7 0.8 1.7Puntius vittatus 0.2Rasbora daniconius 0.7 15.6 4.4 0.9 3.7 0.8Salmophasia bacaila 0.7 1 1.8 0.4 0.5 1.2Systomus sarana 2.1 1.8 2.6Xenentodon cancila 2.8 3.8 0.7 4.4 5.3 5
Page 12 of 12
A.R. Grubh and K.O. Winemiller: Knowl. Manag. Aquat. Ecosyst. 2018, 419, 35
Copyright © 2022 FDOKUMEN