Spatiotemporal diversity, structure and trophic guilds of insect assemblages in a semi-arid Sabkha...
26
Submitted 20 December 2014 Accepted 6 March 2015 Published 24 March 2015 Corresponding author Haroun Chenchouni, [email protected] Academic editor Isabelle Larocque-Tobler Additional Information and Declarations can be found on page 21 DOI 10.7717/peerj.860 Copyright 2015 Chenchouni et al. Distributed under Creative Commons CC-BY 4.0 OPEN ACCESS Spatiotemporal diversity, structure and trophic guilds of insect assemblages in a semi-arid Sabkha ecosystem Haroun Chenchouni 1 , Taha Menasria 2 , Souad Neffar 1 , Smail Chafaa 3 , Ly` es Bradai 4 , Rachid Chaibi 5 , Mohamed Nacer Mekahlia 1 , Djamel Bendjoudi 6 and Abdelkrim Si Bachir 3 1 Department of Natural and Life Sciences, Faculty of Exact Sciences and Natural and Life Sciences, University of Tebessa, Tebessa, Algeria 2 Department of Applied Biology, Faculty of Exact Sciences and Natural and Life Sciences, University of Tebessa, Tebessa, Algeria 3 Department of Natural and Life Sciences, Faculty of Sciences, University of El Hadj Lakhdar, Batna, Algeria 4 Department of Biology, Faculty of Natural and Life Sciences, University of Kasdi Merbah, Ouargla, Algeria 5 Department of Biology, Faculty of Sciences, University of Amar Telidji, Laghouat, Algeria 6 Department of Biology of Populations and Organisms, Faculty of Agro-veterinary and Biology, University of Saad Dahlab, Blida, Algeria ABSTRACT The current study highlights some knowledge on the diversity and structure of in- sect communities and trophic groups living in Sabkha Djendli (semi-arid area of Northeastern Algeria). The entomofauna was monthly sampled from March to November 2006 using pitfall traps at eight sites located at the vicinity of the Sabkha. Structural and diversity parameters (species richness, Shannon index, evenness) were measured for both insect orders and trophic guilds. The canonical correspondence analysis (CCA) was applied to determine how vegetation parameters (species rich- ness and cover) influence spatial and seasonal fluctuations of insect assemblages. The catches totalled 434 insect individuals classified into 75 species, 62 genera, 31 families and 7 orders, of which Coleoptera and Hymenoptera were the most abun- dant and constant over seasons and study stations. Spring and autumn presented the highest values of diversity parameters. Individual-based Chao-1 species richness estimator indicated 126 species for the total individuals captured in the Sabkha. Based on catch abundances, the structure of functional trophic groups was preda- tors (37.3%), saprophages (26.7%), phytophages (20.5%), polyphages (10.8%), coprophages (4.6%); whereas in terms of numbers of species, they can be classified as phytophages (40%), predators (25.3%), polyphages (13.3%), saprophages (12%), coprophages (9.3%). The CCA demonstrated that phytophages and saprophages as well as Coleoptera and Orthoptera were positively correlated with the two parameters of vegetation, especially in spring and summer. While the abundance of coprophages was positively correlated with species richness of plants, polyphage density was positively associated with vegetation cover. The insect community showed high taxonomic and functional diversity that is closely related to diversity and vegetation cover in different stations of the wetland and seasons. How to cite this article Chenchouni et al. (2015), Spatiotemporal diversity, structure and trophic guilds of insect assemblages in a semi-arid Sabkha ecosystem. PeerJ 3:e860; DOI 10.7717/peerj.860
-
Upload
independent -
Category
Documents
-
view
1 -
download
0
Transcript of Spatiotemporal diversity, structure and trophic guilds of insect assemblages in a semi-arid Sabkha...
Submitted 20 December 2014Accepted 6 March 2015Published 24 March 2015
Corresponding authorHaroun Chenchounichenchounigmailcom
Academic editorIsabelle Larocque-Tobler
Additional Information andDeclarations can be found onpage 21
DOI 107717peerj860
Copyright2015 Chenchouni et al
Distributed underCreative Commons CC-BY 40
OPEN ACCESS
Spatiotemporal diversity structure andtrophic guilds of insect assemblages in asemi-arid Sabkha ecosystemHaroun Chenchouni1 Taha Menasria2 Souad Neffar1 Smail Chafaa3Lyes Bradai4 Rachid Chaibi5 Mohamed Nacer Mekahlia1Djamel Bendjoudi6 and Abdelkrim Si Bachir3
1 Department of Natural and Life Sciences Faculty of Exact Sciences and Natural and LifeSciences University of Tebessa Tebessa Algeria
2 Department of Applied Biology Faculty of Exact Sciences and Natural and Life SciencesUniversity of Tebessa Tebessa Algeria
3 Department of Natural and Life Sciences Faculty of Sciences University of El Hadj LakhdarBatna Algeria
4 Department of Biology Faculty of Natural and Life Sciences University of Kasdi MerbahOuargla Algeria
5 Department of Biology Faculty of Sciences University of Amar Telidji Laghouat Algeria6 Department of Biology of Populations and Organisms Faculty of Agro-veterinary and Biology
University of Saad Dahlab Blida Algeria
ABSTRACTThe current study highlights some knowledge on the diversity and structure of in-sect communities and trophic groups living in Sabkha Djendli (semi-arid area ofNortheastern Algeria) The entomofauna was monthly sampled from March toNovember 2006 using pitfall traps at eight sites located at the vicinity of the SabkhaStructural and diversity parameters (species richness Shannon index evenness) weremeasured for both insect orders and trophic guilds The canonical correspondenceanalysis (CCA) was applied to determine how vegetation parameters (species rich-ness and cover) influence spatial and seasonal fluctuations of insect assemblagesThe catches totalled 434 insect individuals classified into 75 species 62 genera 31families and 7 orders of which Coleoptera and Hymenoptera were the most abun-dant and constant over seasons and study stations Spring and autumn presentedthe highest values of diversity parameters Individual-based Chao-1 species richnessestimator indicated 126 species for the total individuals captured in the SabkhaBased on catch abundances the structure of functional trophic groups was preda-tors (373) saprophages (267) phytophages (205) polyphages (108)coprophages (46) whereas in terms of numbers of species they can be classifiedas phytophages (40) predators (253) polyphages (133) saprophages (12)coprophages (93) The CCA demonstrated that phytophages and saprophages aswell as Coleoptera and Orthoptera were positively correlated with the two parametersof vegetation especially in spring and summer While the abundance of coprophageswas positively correlated with species richness of plants polyphage density waspositively associated with vegetation cover The insect community showed hightaxonomic and functional diversity that is closely related to diversity and vegetationcover in different stations of the wetland and seasons
How to cite this article Chenchouni et al (2015) Spatiotemporal diversity structure and trophic guilds of insect assemblages in asemi-arid Sabkha ecosystem PeerJ 3e860 DOI 107717peerj860
Subjects Biodiversity Ecology Ecosystem Science Entomology ZoologyKeywords Entomological biodiversity Sabkha Djendli Insect community ecology Pitfalltrapping Algeria Ecological niche Functional groups Conservation biology Inland wetlandsSemi-arid lands
INTRODUCTIONWetlands are recognized as important ecosystems in terms of biodiversity and functional
role These ecosystems include a remarkable range of habitats that are ecologically
considered among the most productive ecosystems worldwide with large socio-economic
importance and high heritage values for humanity They play crucial and major ecological
functions including trapping absorbing and eliminating of potential toxic chemicals and
pollutants storage of natural carbon recycling of nutrients as well as they contribute
to groundwater recharge in arid and semi-arid regions Unfortunately wetlands are
experiencing rapid degradation due to severe transformations related to intensive human
activities (Bobbink et al 2006 Mitsch et al 2009)
More than 2000 wetlands are listed in Algeria including 50 sites classified on the Ramsar
list of wetlands of international importance (Balla 2012) Most of large inland saline
depressions and backwaters ldquoSabkhas Chotts and Oasesrdquo are located in arid and semi-arid
regions with a unique agglomeration of this type of sites in northeastern of the country
(Chenchouni amp Si Bachir 2010) The most characteristic type of the Algerian wetlands
is seasonalintermittent endorheic type that consists of Sabkha ecosystems ldquosaline lakesrdquo
with typical alternation of drought phase in summer and flooding in winter (Khaznadar
Vogiatzakis amp Griffiths 2009 Balla 2012)
Large-scale conservation programs focused on wetlands because these habitats support
both terrestrial and aquatic biota where biodiversity therein is remarkably high (De
Roeck et al 2007) This biodiversity is the key factor maintaining the structure stability
and functioning of these ecosystems (Ivask et al 2008) What makes its conservation
at different organizational levels (individual population community ecosystem) has
become an issue that deserves national and international attention (Bobbink et al 2006
Montagna et al 2012) Moreover regional contributions have also proven their impact in
improving the knowledge and conservation of these habitats (Pinero et al 2011 Chaibi et
al 2012 Guezoul et al 2013)
As a biological model invertebrates embrace a large species richness ranging over
several taxa with large magnitude of sizes They colonise various microhabitats and
perform an extraordinary diverse functional roles constituting thus key organisms at
different trophic levels inside food webs of wetland ecosystems (Koricheva et al 2000
Finke amp Denno 2002 Haddad et al 2009 Pinero et al 2011) Although they are of relevant
importance in the ecosystem functioning of wetlands invertebrates were slightly used
as criteria in conservation programs of wetlands compared to specific criteria based
on waterbirds and fishes since only recently these organisms as well as other taxa were
included in the ninth criterion used by Ramsar Convention for considering wetlands
internationally important (Mitsch et al 2009 Chenchouni amp Si Bachir 2010)
Chenchouni et al (2015) PeerJ DOI 107717peerj860 226
Furthermore it is well known that biodiversity and structure of invertebrates
particularly insects in saline inland temporary wetlands are governed by two main abiotic
factors hydroperiod ldquowater regimesrdquo and salinity (Bilton Freeland amp Okamura 2001
Brock Nielsen amp Crossle 2005 Gascon et al 2005 Waterkeyn et al 2008) whereas the
involved biotic factors are dealing with vegetation traits and various biotic interactions
of food webs (Koricheva et al 2000 Carver et al 2009 Haddad et al 2009) However
although species diversity is a good parameter for valuing structure of invertebrate
communities and defining conservation strategies scarcity of species should also be taken
into account (Nijboer amp Verdonschot 2004)
The multi-scale ecological surveys that investigated animal biodiversity of the Algerian
wetlands specifically at the northeast of the country they focused on waterbirds (eg
Samraoui amp Samraoui 2008) fishes (eg Chaibi et al 2012) and some other taxa like
dragonflies (eg Samraoui et al 2011) whereas the ecology of terrestrial arthropods of
Sabkha ecosystems remain very little studied in these saline environments (Hogarth amp
Tigar 2002)
Located in high plains of Northeast Algeria the Sabkha Djendli is a seasonal salt
lake whose flora was thoroughly surveyed throughout the waterbody vicinity (Neffar
Chenchouni amp Si Bachir in press) However there had been very little investigation
of faunal communities including insects inhabiting the Sabkha and its environs in
connection with their biotope except for some ornithological surveys of wintering
waterbirds (eg Samraoui amp Samraoui 2008 Bensizerara et al 2013)
The study of relationships between spatiotemporal variation of invertebrate com-
munities and ecological parameters provides valuable information for conservation
assessment and restoration planning and may efficiently guide the implementation
of future management program (Comin amp Comin 1992 Fischer amp Lindenmayer 2007
Montagna et al 2012) Furthermore the assessment of functional trophic groups is crucial
to outlining the structure of food webs and accordingly identifying any perturbation
in the ecosystem functioning (Chesson amp Huntly 1997 Gascon et al 2005) particularly
under changing environmental conditions Indeed some insect groups such as dragonflies
hoverflies and some ground beetles (particularly Carabidae) represent good indicators of
biodiversity assessment and monitoring in wetlands and mesic environments (Rainio amp
Niemela 2003 Sanchez-Fernandez et al 2006 Hepp amp Melo 2013) In fact the core aim
of the current study is placed within the perspective of insect biodiversity assessment for
conservation purpose as outlined here above
Thereby the objectives of this pioneer study are dealing with the framework of
understanding the entomofauna composition of Sabkha Djendli This treatise aims to
(i) provide accurate information on the spatiotemporal variation of the composition
structure and diversity indices of the insect community inhabiting the vicinity of the
Sabkha (ii) evaluate ecological status and diversity of the functional trophic groups in
relation to seasons and site orientations of the salt lake (iii) understand the structural
and functional similarities of insect communities living around the Sabkha (iv) assess the
effect of seasons and site orientations on the spatiotemporal abundance variations of both
Chenchouni et al (2015) PeerJ DOI 107717peerj860 326
insect orders and functional trophic groups and (v) determine how climate and vegetation
parameters influence spatial and seasonal fluctuations of insect assemblages
MATERIALS AND METHODSStudy areaSabkha Djendli (3542prime56primeprimeN 631prime46primeprimeE) belongs to the eco-complex of wetlands located
in the High Plains ldquoHauts Plateauxrdquo region in eastern Algeria (Fig 1) The site is a
temporary lake with brackishsalt water that highly depends on rainfall amounts and
water regime Sabkha Djendli covers about 3700 ha with an average altitude of 833 m
in an area where inhabitants are mainly involved in agricultural activities like cereal and
fruit cultivation and livestock of sheep and cattle The adjacent land use types of this area
includes scattered and low intensity urban use within extended rainfed cereal crops of
barley durum and bread wheat The nearby mountains are covered by open shrub-forest
vegetation where the main tree species are Juniperus phoenicea Quercus ilex and Olea
oleaster (Bensizerara et al 2013)
Based on meteorological data provided by the meteorological station of Batna (WMO
Id 60468) of the period 1974ndash2014 the climate of the study area is typically semi-arid
Mediterranean characterised by cold-wet winters and hot-dry summers The dry period
extends over four months from June to September Precipitation is erratic and there are
large temporal variations The coldest month is January with an average temperature of
53 C and the hottest month is July with an average temperature of 25 C The relative
humidity of the air fluctuates between 40 and 75 and the winds are generally low in
dominance west to south-west with the passage of Sirocco in summer during JulyndashAugust
The natural vegetation is represented by halophytes such as Atriplex halimus Suaeda
fructicosa Suaeda vermiculata and Sarcocornia fructicosa but also other spontaneous
vegetation like Tamarix gallica Artemisia herba-alba and Juncus maritimus (Neffar
Chenchouni amp Si Bachir in press) The current entomological survey was carried on the
belt of halophytic vegetation surrounding the Sabkha (Fig 1)
Sampling designAt eight cardinal and inter-cardinal points of the site border of Sabkha Djendli the insect
fauna was monthly sampled during the period March to November 2006 Halophytic
vegetation dominated in the entire sampled area At each sampling points insects were
trapped using nine pitfall traps (Spence amp Niemela 1994) which were set up inside a square
plot of 400 m2 (20 m times 20 m) These uncovered traps are aligned 3ndash3 along three rows and
spaced from each other with 5 m (Fig 1) Each trap was filled to 34 of water containing a
wetting agent and its catches were monthly recovered after one week trapping since first
setting day The caught specimens were identified by genus and species The nomenclature
and taxonomy of species were based on up-to dated references (Bouchard et al 2011 de
Jong 2013 Ligeiro amp Smetana 2013 Anichtchenko et al 2014 AntWeb 2014 Eades et al
2014)
Chenchouni et al (2015) PeerJ DOI 107717peerj860 426
Figure 1 Location and sampling design Location of the sampled station and sites at Sabkha Djendli (Batna Northeast Algeria) and samplingdesign of pitfall traps
Data miningData of insect catches from the nine uncovered traps were pooled to form one sample
per sampling station per month Data were presented by taxonomic orders and trophic
groups and were expressed for orientation points and seasons (Table S1) to facilitate
spatiotemporal comparisons for all the following parameters The relative abundance
(RA) was determined as the ratio of number of individuals rounded to the total number
of individuals recorded (Ni) Occurrence frequency (Occ) was calculated for each species
by the number of stations wherein the species was found the total number of sampled
stations (Magurran 2004) Four species groups are distinguished by Bigot amp Bodot
(1973) according to their frequencies of occurrence Very accidental species (Vac) an
occurrence of less than 10 Accidental species (Acc) occurrence varies between 10 and
24 Common species (Cmt) are present in 25ndash49 Constant species (Cst) are present in
50 or more of the samples
Chenchouni et al (2015) PeerJ DOI 107717peerj860 526
Species richness estimationBiodiversity of insects was assessed by species richness observed ldquoSobsrdquo which corresponds
to the total number of identified insect species at each station or season In addition
Shannonrsquos index (Hprime= minus
pi times log2pi) and evenness (Evenness = Hprimelog2Sobs) were
applied for measuring insect diversity in each sampled station and season period based on
the relative density pi of the i th species (Magurran 2004)
Estimated species richness was calculated with the program EstimateS 910 (Colwell
2013) Sest was extrapolated by the selection of the least biased and most precise estimator
(Brose amp Martinez 2004) We applied the following nonparametric species richness
estimators (i) Sest (analytical) with lower and upper bounds of 95 Confidence Interval
lsquoCIrsquo which gives the expected number of species represented among a given number of
individuals (Colwell et al 2012) (ii) Chao 1 richness estimator with log-linear 95
confidence interval lower and upper bounds (Chao 1984) These two estimators were
selected because of the involved assumptions about the underlying species abundance
distribution remain fewer However instead of using the bias-corrected form of the Chao-1
estimator we chose the larger of Chao-1 Classic and ACE lsquoAbundance-base Coverage
Estimatorrsquo because the coefficient of variation (CV) of the abundance in our dataset was
high (ie CV gt05) Number of singletons (species with only one individual among total
individuals) and doubletons (species with only two individuals among total individuals)
were given as mean (plusmnstandard deviation lsquoSDrsquo) among 100 runs of randomizations
Detailed descriptions of these estimators and procedures can be found in Colwell (2013) In
order to assess the diversity of the entomofauna of Sabkha Djendli as a whole interpolated
species accumulation curves ldquoindividual-based rarefactionrdquo (Magurran 2004 Colwell et al
2012) of the total data were computed with both previous estimators (Sest and Chao-1 with
95 CI) Model of total raw data is multiple individual-based abundance samples (batch
input including stations and seasons Table S2) applied for species richness estimation
using EstimateS 9 (Colwell 2013) Rarefaction curves were made by repeatedly sampling
the collected species with 100 randomisations of individual orders without replacement
With the plot of individual-based rarefaction curves we incorporated the means of
singletons and doubletons (plusmnSD) in order to allow comparison of species richness
Using the Bray-Curtis index (= Soslashrensen quantitative index) similarity indices
were computed between stations taken in pairs The obtained proximity matrix allows
comparing species richness while the Bray-Curtis index takes observed abundances into
account (Magurran 2004) For the estimated data Chaorsquos abundance-based Jaccard index
(Chao et al 2005) was used to compare insect species richness between study stations
taken in pairs We computed the raw Chao Abundance-based Jaccard index (not corrected
for undersampling bias) as well as the estimators of their true values so the effect of the bias
correction on the index can be assessed between stations The model of raw data used for
the analysis using EstimateS 910 was Format 1 of sample-based abundance data ldquoFiletype
1rdquo (Table S3) The free software EstimateS (Colwell 2013) was used in computation of all
species richness and diversity indices
Chenchouni et al (2015) PeerJ DOI 107717peerj860 626
Statistical analysesAgglomerative hierarchical clustering (AHC) was applied to cluster sampled stations
according to their species abundances based on the proximity matrix including values of
Bray-Curtis index The agglomeration method we used was the unweighting pair-group
average
Moreover Pearsonrsquos Chi-squared test (χ2) was applied to look for dependencies
between the distributions of structural traits values (Ni Sobs NiSobs Hprime Evenness) of
the functional trophic groups among both study stations and seasons
Generalized linear models (GLMs) were applied to test spatiotemporal variations
of abundances of both taxonomic orders and trophic groups following the effects of
lsquoOrientationrsquo lsquoSeasonrsquo and their interaction lsquoOrientation times Seasonrsquo As all abundances
were count data GLMs were fitted using a Poisson distribution error and log link function
(Myers et al 2012) Computations were carried out with the help of R (R Core Team 2015)
using the lsquoglmrsquo function and lsquoAICrsquo function to calculate the Akaikersquos information criterion
(AIC) as model simplification Likelihood-ratio tests ldquoLRrdquo were performed for each GLM
to assess the effects of explicative factors (Orientation Season and Orientation times Season)
Each ldquoLRrdquo was tested using sequential ldquoType-Irdquo under the lsquoAnovarsquo function that computes
the deviance (χ2) and the corresponding P-value (Fox 2008)
The spatiotemporal gradients of insect assemblages were analyzed in relation with
vegetation traits using a canonical correspondence analysis (CCA) The data used were
the abundances of both taxonomic orders and trophic groups on the study seasons and
orientations where they were counted For the spontaneous vegetation two parameters
were assessed at each orientation and season the vegetation cover () and total species
richness (number of plant species) These data were generated from Neffar Chenchouni
amp Si Bachir (in press) Since the CCA has the ability to combine ordination and gradient
analysis functions in a readily interpretable manner it was applied to relate spatiotemporal
insect abundances to vegetation variables in order to highlight relationships between
spatiotemporal variations of insects and vegetation traits as explanatory variables
(Jongman Ter Braak amp Tongeren 1995) At the end of overcoming the disadvantage effect
of scale differences in data insect densities as well as vegetation variables were normalized
using normal distribution transformation based on the average and standard deviation of
each input
Finally Pearsonrsquos correlation was used to test the significance of relationships
between densities of insect assemblages (of both taxonomic orders and trophic groups)
and vegetation parameters (vegetation cover and species richness) and some climate
parameters originated from Batna weather station of the year 2006 (Table S4) These
parameters are mean temperature (C) precipitation amount (mm) mean humidity
() mean wind speed (Kmh) and number of rain days The climatic parameters
considered were computed for each season as averagesum of the daily data of 45 days
prior the trapping period This period duration is estimated to be appropriate for
affection both the biological cycle and population dynamics of most insects of the region
Chenchouni et al (2015) PeerJ DOI 107717peerj860 726
(Chafaa et al 2013 Idder-Ighili et al in press) All correlations were carried out as pairwise
two-sided tests using the function lsquorcorradjustrsquo in R (R Core Team 2015)
RESULTSTaxonomic composition of insect communityPitfall sampling of entomofauna at Sabkha Djendli revealed an insect community
composed of 75 species from 434 individuals caught This entomofauna can be classified
into 7 orders 31 families and 62 genera (Table 1) Coleoptera was the best represented
with 238 (548) individuals caught belonging to 39 species and 15 families followed
by Hymenoptera with 149 (343) individuals of 18 species and 8 families then came
Orthoptera with 22 individuals (10 species and 2 families) The orders Dermaptera
Heteroptera Homoptera and Diptera were poorly represented by either species or catch
abundance Furthermore the identified entomofauna included five functional trophic
groups phytophages with 30 species predators with 19 species polyphages with 10 insects
saprophages with 9 species and coprophages with 7 species
Relative abundance and occurrenceThe main species with high relative abundance (RA) of catch were Calathus circumseptus
(219) Cataglyphis biskrense (154) Tetramorium biskrensis (6) Zabrus sp (39)
Anomala dubia (39) Scarites laevigatus (37) and Carabus sp (3) respectively
Furthermore families that dominated in terms of catches belonged to Coleoptera and
Hymenoptera including Formicidae with a total of 111 individuals (256) Callistidae
with 95 individuals (219) Carabidae with 53 individuals (122) and Scarabeidae with
40 individuals (92) and Apidae with 29 individuals the equivalent of 60 of total
caches (Table 1)
Regarding spatial occurrence of insect species at the eight sampled stations almost
all species (66 species) were accidental and very accidental Nevertheless three species
were constant (Occ ge 50) during the study period Chlaenius circumseptus (Callistidae)
Cataglyphis bicolor (Formicidae) and Tetramorium biskrensis (Formicidae) Common
species (Occ = 25ndash50) were characterized by six species Scolia sp (Scoliidae) Apis
mellifera (Apidae) Zabrus sp (Carabidae) Carabus sp (Carabidae) Scarites laevigatus
(Carabidae) Forficula auricularia (Forficulidae) (Table 1)
Spatiotemporal composition and diversityThe sampled station located southern Sabkha Djendli possessed the highest values of
catch seize (93 individuals RA = 214) species richness (27 species) and the ratio
NiSobs(34) whereas the highest values of Shannon index and evenness were respectively
recorded at station of West Southeast South and East However this later station (East)
had the lowest values of insect composition (Ni = 43 RA = 99 Sobs = 19)
As for seasons values of diversity parameters of insect assemblages were higher during
spring and autumn with a slight leaning to spring values However the summer scored
the lowest values Overall sampling insects using pitfall traps at Sabkha Djendli revealed a
diversity equals to 47 according to Shannon index with an evenness of 076 (Table 2)
Chenchouni et al (2015) PeerJ DOI 107717peerj860 826
Table 1 Insect listing Systematic list trophic status abundances and occurrences of insect speciescaptured using pitfall traps at edges of Sabkha Djendli Northeast Algeria
Classification (RA in ) Species FTG Ni RA Occ Scale
O DERMAPTERA (32)
F Forficulidae (32) Anisolabis mauritanicus Pol 4 092 167 Acc
Forficula auricularia Pol 10 230 250 Cmt
O ORTHOPTERA (51)
F Gryllidae (21) Acheta domesticus Phy 3 069 125 Acc
Gryllus bimaculatus Phy 2 046 83 Vac
Gryllus campestris Phy 2 046 83 Vac
Gryllus sp Phy 2 046 83 Vac
F Acrididae (30) Acrotylus patruelis Phy 3 069 125 Acc
Calliptamus barbarus Phy 4 092 125 Acc
Ephippiger sp Phy 1 023 42 Vac
Oedipoda fuscocincta Phy 3 069 125 Acc
Sphingonotus rubescens Phy 1 023 42 Vac
Sphingonotus sp Phy 1 023 42 Vac
O HETEROPTERA (02)
F Lygaeidae (02) Lygaeus sexatilis Phy 1 023 42 Vac
O HOMOPTERA (02)
F Cicadellidae (02) Cicadela variabilis Phy 1 023 42 Vac
O COLEOPTERA (548)
F Cicindelidae (07) Calomera littoralis Pre 1 023 42 Vac
Cassolaia maura Pre 2 046 83 Vac
F Callistidae (219) Calathus circumseptus Sap 95 2189 875 Cst
F Carabidae (122) Calathus sp Pre 1 023 42 Vac
Macrothorax morbillosus Pre 1 023 42 Vac
Carabus sp Pre 13 300 375 Cmt
Scarites laevigatus Pre 16 369 417 Cmt
Scarites sp Pre 5 115 167 Acc
Zabrus sp Phy 17 392 333 Cmt
F Geotrupidae (09) Geotrupessp Sap 4 092 167 Acc
F Scarabaeidae (92) Geotrogus sp Sap 7 161 167 Acc
Anomala dubia Pol 17 392 208 Acc
Bubas bison Cop 4 092 167 Acc
Gymnopleurus flagellatus Cop 4 092 167 Acc
Onthophagus taurus Cop 5 115 208 Acc
Oxythyrea funesta Phy 1 023 42 Vac
Scarabaeus sacer Cop 1 023 42 Vac
Scarabaeus sp Cop 1 023 42 Vac
F Silphidae (02) Silpha opaca Pre 1 023 42 Vac
F Staphylinidae (07) Staphylinus olens Pol 3 069 125 Acc
F Cetonidae (05) Cetonia ablonga Phy 1 023 42 Vac
Cetonia funeraria Phy 1 023 42 Vac
F Cantharidae (02) Cantharis sp Phy 1 023 42 Vac(continued on next page)
Chenchouni et al (2015) PeerJ DOI 107717peerj860 926
Table 1 (continued)Classification (RA in ) Species FTG Ni RA Occ Scale
F Meloidae (14) Mylabris crocata Phy 1 023 42 Vac
Mylabris quadripunctata Phy 2 046 83 Vac
Mylabris variabilis Phy 3 069 125 Acc
F Tenebrionidae (23) Adesmia microcephala Sap 1 023 42 Vac
Blaps mortisaga Sap 1 023 42 Vac
Blaps nitens Sap 1 023 42 Vac
Opatrum sp Sap 2 046 83 Vac
Tentyria bipunctata Sap 1 023 42 Vac
Tentyria sp Sap 4 092 125 Acc
F Dermestidae (12) Dermestes sp Cop 1 023 42 Vac
Trogoderma sp Cop 4 092 167 Acc
F Cucujidae (07) Canthartus sp Pol 3 069 83 Vac
F Curculionidae (05) Coniocleonus excoriatus Phy 1 023 42 Vac
Lixus punctiventris Phy 1 023 42 Vac
F Chrysomelidae (23) Chrysomela sp Phy 9 207 167 Acc
Entomoscelis sp Phy 1 023 42 Vac
O HYMENOPTERA (343)
F Formicidae (256) Camponotus sp Pre 1 023 42 Vac
Cataglyphis bicolor Pre 67 1544 583 Cst
Messor barbarous Pre 7 161 125 Acc
Pheidole pallidula Pol 1 023 42 Vac
Tapinoma nigerrimum Pre 9 207 208 Acc
Tetramorium biskrense Pre 26 599 500 Cst
F Vespidae (02) Polistes gallicus Pre 1 023 42 Vac
F Apidae (49) Apis mellifera Phy 10 230 292 Cmt
Apis sp Phy 5 115 167 Acc
Bombus pascuorum Phy 2 046 42 Vac
FMegachilidae (12) Megachile sp Phy 5 115 167 Acc
FHalictidae (09) Sphecodes sp Phy 1 023 42 Vac
Halictus sp Phy 3 069 125 Acc
F Scoliidae (16) Scolia sp Pre 7 161 250 Cmt
F Sphecidae (07) Ammophila hirsute Pre 1 023 42 Vac
Ammophila sabulosa Pre 1 023 42 Vac
Sphex funerarius Pre 1 023 42 Vac
F Mutillidae (02) Mutilla sp Pre 1 023 42 Vac
O DIPTERA (21)
F Tabanidae (05) Tabanus sp Pol 2 046 83 Vac
F Muscidae (07) Musca domestica Pol 1 023 42 Vac
Musca sp Pol 2 046 83 Vac
F Sarcophagidae (09) Sarcophaga sp Pol 4 092 167 Acc
NotesRA relative abundance () FTG functional trophic groups Ni total number of caught individuals Occ occurrencefrequency Cop coprophages Phy phytophages Pol polyphages Pre predators Sap Saprophages Vac very accidentalspecies Acc accidental species Cmt common species Cst constant species
Chenchouni et al (2015) PeerJ DOI 107717peerj860 1026
Table 2 Spatiotemporal diversity Spatial and seasonal variation of the diversity parameters of insect assemblages in Sabkha Djendli NortheastAlgeria
Parameters Orientation Season Total
S SW W NW N NE E SE Spring Summer Fall
Abundances (Ni) 93 48 60 44 52 50 43 45 163 116 155 434
RA () 214 110 138 101 118 115 99 103 375 267 356 100
Species richness (Sobs) 27 24 27 19 17 22 19 22 46 38 51 75
Ratio NiSobs 34 20 22 23 31 23 23 20 35 31 30 58
Shannon index (Hprime) 39 36 41 35 31 38 37 39 45 40 46 47
Evenness 081 079 086 083 077 084 086 087 082 076 082 076
Table 3 Abundances of insect orders GLMs testing the effects of lsquoStation orientationrsquo lsquoSeasonrsquo and theirinteraction on the variation of insect orders abundances in Sabkha Djendli Northeast Algeria
Variation Df χ2 P χ2 P
Dermaptera (AIC = 368) Orthoptera (AIC = 880)
Orientation 7 1429 0046 418 0759
Season 2 055 0760 252 0283
Orientation times Season 14 1689 0262 2140 0092
Heteroptera (AIC = 550) Homoptera (AIC = 650)
Orientation 7 416 0761 416 0761
Season 2 220 0333 220 0333
Orientation times Season 14 000 1000 000 1000
Coleoptera (AIC = 1144) Hymenoptera (AIC = 7118)
Orientation 7 2042 0005 4965 lt0001
Season 2 296 0227 1885 lt0001
Orientation times Season 14 3093 0006 7715 lt0001
Diptera (AIC = 463) All orders (AIC = 13160)
Orientation 7 724 0404 2972 lt0001
Season 2 291 0233 905 0011
Orientation times Season 14 1304 0523 2058 0113
The generalized linear models revealed different effects of the two factors lsquostation
orientationrsquo and lsquoSeasonrsquo among abundances of insect taxonomic orders (Table 3) In
general the number of individuals of all orders combined significantly differed between
stations (P lt 0001) and seasons (P = 0011) The orientation of stations showed
a significant effect on the variation of abundances of Dermaptera Coleoptera and
Hymenoptera Only Hymenoptera varied significantly between seasons (P lt 0001)
whereas the effect of the interaction lsquoOrientation times Seasonrsquo was deemed significant for
both Coleoptera (P = 0006) and Hymenoptera (P lt 0001) The Akaikersquos information
criterion indicated that the GLM applied for Dermaptera abundances was the best-fitted
model (AIC = 368)
Chenchouni et al (2015) PeerJ DOI 107717peerj860 1126
Figure 2 Estimated species richness Species richness estimates (with 95 confidence intervals) for theestimators Sest (analytical) and Chao 1 Classic (dashed line) based on 100 randomized samples (Colwell2013) for the total data of entomofauna sampled in Sabkha Djendli Northeast Algeria Rarefaction curveswere represented by means of singletons and doubletons (plusmnstandard deviations only every 8th data pointis shown)
Estimates of species richnessFor the whole Sabkha Djendli the rarefaction curves kept increasing with the increase
of number of individuals (Fig 2) Expected species richness curves computed using
the first-order Chao richness estimator proved to highly increase with the number of
individuals captured all over the Sabkha This estimator indicated that at a total of 434
individuals Sabkha Djendli had 128 species (lower 95 CI 96 species upper 95
CI 204 species) Chao-1 estimated species richness was significantly greater than the
analytical estimated richness that indicated 75 species (upper 95 CI 86 species) The
individual-based rarefaction curve of singletons was higher than that of doubletons but
both kept increasing to reach a plateau in all stations considered suggesting that the
expected species richness estimated with both previous estimators (Sest and Chao-1)
increased with the increase of singletons rather than doubletons At a total of 433
individuals the mean of singletons was 3297 plusmn 039 species whereas doubletons provided
an estimate of 9 plusmn 035 species (see Table S5 for all diversity statistics including other
species richness estimators and species diversity indices computed for the total captures of
insects at Sabkha Djendli)
Spatial similarities of the entomofaunaThe assessment of similarities of insect assemblages between the sampled stations revealed
low similarities ranging between 0161 and 0581 based on Bray-Curtis index that involved
insect abundances in comparisons The highest values of that index were observed between
Chenchouni et al (2015) PeerJ DOI 107717peerj860 1226
Table 4 Spatial abundance-based similarities Similarity matrix of observed (above the diagonal) andestimated (under the diagonal) insect assemblages in the studied sites at Sabkha Djendli NortheastAlgeria Values of observed data (above the diagonal) are referred to Bray-Curtis index (and numberof shared Species) The values of raw Chaorsquos abundance-based Jaccard index and the estimators of theirtrue values (Chao et al 2005) in brackets are given under the diagonal Station locations lsquoorientationsrsquoof the first row are associated with values of observed species richness (Sobs) whereas orientations inthe first column are followed by means of Chao-1 richness estimator and 95 CI indicated in squarebrackets
Orientations S (27) SW (24) W (27) NW (19) N (17) NE (22) E (19) SE (22)
S (560) 0414 0355 0412 0472 0479 0415 0409
[341ndash1373] (9) (13) (10) (7) (11) (9) (11)
SW (659) 0446 0167 0478 0260 0429 0352 0366
[369ndash1598] (0700) (8) (8) (5) (8) (7) (7)
W (646) 0603 0331 0269 0161 0255 0369 0248
[384ndash1512] (0999) (0841) (9) (5) (10) (12) (9)
NW (405) 0506 0415 0337 0292 0447 0391 0360
[245ndash1038] (0999) (0766) (0929) (7) (8) (7) (6)
N (440) 0536 0402 0236 0428 0490 0463 0474
[235ndash1284] (0666) (0501) (0363) (0945) (6) (6) (8)
NE (477) 0531 0493 0337 0490 0470 0581 0505
[293ndash1128] (0999) (0645) (0995) (0815) (0547) (10) (8)
E (571) 0513 0418 0400 0381 0440 0591 0455
[289ndash1663] (0697) (0623) (0971) (0723) (0517) (0919) (6)
SE (425) 0555 0357 0299 0347 0508 0432 0379
[279ndash931] (0931) (0620) (0568) (0594) (0774) (0659) (0533)
North and East stations (Table 4) Most of the similarities did not exceed 0500 except for
the NE station with East (Bray-Curtis = 0581) and SE (Bray-Curtis = 0505) stations
The raw Chaorsquos abundance-based Jaccard index indicated similarities between rest of the
stations ranged from 0236 to 0603 The high values of that index (gt05) were recorded
between south station and all the rest of the stations except SW As for the estimated Chaorsquos
abundance-based Jaccard index all estimated similarities between stations were higher
than 0500 excluding the similarity between NW and West stations where it was 0363 The
program EstimateS provided other shared species statistics (Table S6)
According to values of Bray-Curtisrsquos index the eight sampled stations were clustered
using AHC into four different groups (i) the first group gathered all stations located at
North and East of the Sabkha including N NE E and SE stations (ii) the South station
was distinguished alone (iii) the third cluster included SW and NW stations and (iv) the
fourth group was represented by West station (Fig 3)
Structure and diversity of functional trophic groupsPredators and saprophages held the highest catch rates with 373 and 267 of the total
respectively Predators were more pronounced in south stations (42 ind) especially in
autumn (74 ind) and spring (62 ind) while saprophages are concentrated in southwest
(24 ind) and south (22 ind) stations during the summer (46 ind)
Chenchouni et al (2015) PeerJ DOI 107717peerj860 1326
Figure 3 Spatial similarity clustering Dendrogram of the agglomerative hierarchical clustering (AHC)illustrating species abundance similarity (Bray-Curtis index) among insects captured from eight stationsaround Sabkha Djendli (linkage rule unweighting pair-group average)
In terms of numbers of species phytophages were the most abundant with 30 species
distributed almost equally along seasons and sampled stations As for NiSobs ratio it
varied between 1 and 11 with an average of 32 in study stations and seasons ie that each
species of a given trophic group comprises an average of 32 individuals This ratio is higher
in saprophages with 129 chiefly in stations of south (11) northwest (85) southwest
(8) during the summer (92) and spring (9) Predators came in second place with 85
individuals per species
The Shannonrsquos index showed high diversity among phytophages (Hprime= 43) in both
seasons and sampled stations The values of this index were lower among predators and less
important in polyphages Regarding saprophages their diversity values were the lowest
Similarly evenness in coprophages (091) phytophages (087) and polyphages (083)
showed higher values compared to values of predators (068) and saprophages (036) It
is noteworthy that apart from evenness the coprophages indicated the lowest values of
ecological indices calculated for different trophic groups of insects
The Chi-square test revealed a significant dependence for the distribution of the number
of individuals of trophic groups along the orientations (χ2= 8062 P lt 0001) and
seasons (χ2= 2457 P = 0002) (Table 5) However no significant dependence was
observed for the rest of the features (Species richness NiSobs ratio Shannon index
evenness) of trophic groups according to stations orientations and seasons
Chenchouni et al (2015) PeerJ DOI 107717peerj860 1426
Table 5 Spatiotemporal structure and diversity of trophic groups Spatial and seasonal variations of insect trophic guilds living in Sabkha DjendliNortheast Algeria
Parameter Orientations Seasons Total
S SW W NW N NE E SE Spring Summer Fall
Individual numbers (χ228 = 8062 P lt 000) (χ2
8 = 2457 P = 0002)
Coprophages 4 1 4 1 0 3 3 4 8 5 7 20 (46)
Phytophages 20 10 13 7 8 6 11 14 35 26 28 89 (205)
Polyphages 4 3 19 7 5 4 2 3 22 13 12 47 (108)
Predators 42 10 21 12 28 21 15 13 62 26 74 162 (373)
Saprophages 22 24 3 17 11 16 12 11 36 46 34 116 (267)
Species richness (Sobs) (χ228 = 1565 P = 0971) (χ2
8 = 481 P = 0777)
Coprophages 4 1 3 1 0 2 3 3 4 4 5 7 (93)
Phytophages 8 9 8 7 6 6 6 9 19 14 15 30 (40)
Polyphages 4 3 5 4 3 2 2 2 9 5 8 10 (133)
Predators 8 8 8 5 5 8 4 6 10 9 15 19 (253)
Saprophages 2 3 3 2 3 4 4 2 4 5 8 9 (12)
Ratio NiSobs (χ228 = 2209 P = 0779) (χ2
8 = 335 P = 0911)
Coprophages 10 10 13 10 00 15 10 13 20 13 14 29
Phytophages 25 11 16 10 13 10 18 16 18 19 19 30
Polyphages 10 10 38 18 17 20 10 15 24 26 15 47
Predators 53 13 26 24 56 26 38 22 62 29 49 85
Saprophages 110 80 10 85 37 40 30 55 90 92 43 129
Shannonrsquos index (χ228 = 1318 P = 0992) (χ2
8 = 058 P = 0999)
Coprophages 20 00 15 00 00 09 16 15 19 19 22 25
Phytophages 25 31 27 28 24 26 22 28 38 35 37 43
Polyphages 20 16 12 18 14 08 10 09 26 20 29 27
Predators 25 29 28 21 13 24 17 20 25 24 29 29
Saprophages 03 09 16 05 11 12 12 04 09 07 16 12
Evenness (χ228 = 1771 P = 0999) (χ2
8 = 385 P = 0999)
Coprophages 100 000 095 000 000 092 100 095 095 096 096 091
Phytophages 085 098 088 100 093 100 086 089 090 092 093 087
Polyphages 100 100 050 092 086 081 100 092 080 088 095 083
Predators 083 097 092 092 056 080 084 079 076 075 075 068
Saprophages 027 056 100 052 069 059 060 044 047 030 052 036
While the Chi-square test revealed a significant dependence for abundances of trophic
groups among site directions and seasons (Table 5) The GLMs showed different effects
of the two factors on the abundance of each trophic group While abundances of
predator species varied significantly between station orientations seasons and their
interaction (P lt 0001) polyphages only varied significantly between orientations whereas
saprophages varied between orientations and the interaction Orientation times Season
Coprophages followed by polyphages were the insect groups less affected by seasonal
and spatial variations (AIC = 278 and AIC = 1095 respectively) (Table 6)
Chenchouni et al (2015) PeerJ DOI 107717peerj860 1526
Table 6 Generalized linear models GLMs testing the variation of abundance of insect trophic guildsbetween seasons and station orientations in Sabkha Djendli Northeast Algeria
Trophic groups Variation Df χ2 P
Coprophages Orientation 7 980 0200
(AIC = 278) Season 2 072 0697
Orientation times Season 14 1722 0245
Phytophages Orientation 7 1240 0088
(AIC = 9120) Season 2 147 0478
Orientation times Season 14 1772 0220
Polyphages Orientation 7 2692 lt0001
(AIC = 1095) Season 2 369 0158
Orientation times Season 14 2141 0092
Predators Orientation 7 3529 lt0001
(AIC = 11129) Season 2 2576 lt0001
Orientation times Season 14 4273 lt0001
Saprophages Orientation 7 2494 lt0001
(AIC = 12124) Season 2 209 0352
Orientation times Season 14 2736 0017
Relationship between insect communities and vegetationThe Eigenvalues of CCA applied for insect assemblages and vegetation parameters in
canonical axis 1 and 2 were high and explained 6555 and 3445 of constrained inertia
respectively According to CCA the density of polyphages was positively associated with
vegetation cover but this parameter had a negative influence on the number of individuals
of predators Hymenoptera and Dermaptera especially in autumn at northeast southeast
north and east stations In addition coprophage abundance was positively related with
species richness of plants however Diptera and Homoptera were located on the negative
side of the axis representing species richness of plants and this in northwest west
southwest and west stations The phytophages and saprophages as well as Coleoptera
and Orthoptera were also positively correlated with both axes of vegetation parameters
particularly in spring and summer seasons Conversely the two parameters of vegetation
negatively influenced Heteroptera densities in north and east stations (Fig 4)
All the significant correlations we obtained were positive with both vegetation
parameters These concerned the abundances of Dermaptera in relation with species
richness of plants and Orthoptera and Coleoptera with vegetation cover and richness of
plants As for the trophic groups of the entomofauna the correlation test was significant
for the numbers of polyphages phytophages and saprophages vs vegetation cover on
the one hand and coprophages phytophages and saprophages vs plant species richness
on the other hand Moreover the correlation tests revealed a significant decrease in the
abundances of Hymenoptera with the increase of precipitation (r = minus0080 P lt 005)
but a positive relationship was observed between predator abundances and wind speed
Chenchouni et al (2015) PeerJ DOI 107717peerj860 1626
Figure 4 Insects-vegetation relationships Diagram of the canonical correspondence analysis (CCA)relating spatial and seasonal densities of insect assemblages of both taxonomic orders and trophic groupswith vegetation cover and species richness (Cop coprophages Phy phytophages Pol polyphages Prepredators Sap saprophages)
(r = 0206 P lt 005) The rest of climates parameters were not significantly linked to
taxonomic orders and trophic groups (Table 7)
DISCUSSION AND CONCLUSIONSalt lakes offer exceptional conditions for ecological studies of aquatic ecosystems due
to the frequency and intensity of changes in the biological communities compared to
freshwater ecosystems (Comin amp Comin 1992) This feature is most notable in arid regions
so that these habitats are home to many original and well-adapted life forms (Chenchouni
2012a)
Out of all the conducted samples the Sabkha of Djendli houses 75 insect species
related to 31 families and 7 orders In terms of individual numbers caught the orders
of Coleoptera and Hymenoptera dominate other insect orders while Dermaptera
Heteroptera Homoptera and Diptera are slightly present with very similar densities in
different study stations This distribution of the composition could be attributed to the low
dispersal ability of these insects as well as the scarcity of these categories (Cobos 1987) but
mostly to the ineffectiveness of pitfall traps to capture flying insects since this type of trap
is specifically designed for ground arthropods (Spence amp Niemela 1994) The interpolated
Chenchouni et al (2015) PeerJ DOI 107717peerj860 1726
Table 7 Insects-ecosystem correlations Pearson correlation tests between abundance of orders andtrophic guilds of insects and climate parameters (T average of mean temperatures PP total of precipita-tion HM average of mean humidity WS mean wind speed RA number of rain days) and spontaneousvegetation characteristics (cover and species richness) of Sabkha Djendli Northeast Algeria
Variables Climate parameters Vegetationparameters
T(C)
PP(mm)
HM()
WS(Kmh)
RA(days)
Vegetationcover
Speciesrichness
Taxonomic orders
Dermaptera 0076 0089 minus0090 0021 0086 0214 0613
Orthoptera minus0007 0027 minus0062 0093 0018 0717 0796
Heteroptera 0022 minus0082 0188 minus0283 minus0056 minus0030 0109
Homoptera minus0266 minus0205 0103 0214 minus0223 0591 0295
Coleoptera minus0026 minus0020 0010 0021 minus0022 0656 0742
Hymenoptera minus0056 minus0080 0095 minus0052 minus0075 0215 0505
Diptera minus0076 minus0126 0164 minus0121 minus0115 0308 0257
Trophic groups
Coprophages 0038 0087 minus0128 0122 0075 0429 0786
Phytophages 0054 0070 minus0078 0034 0067 0586 0748
Polyphages 0123 0140 minus0137 0020 0137 0604 0571
Predators minus0065 0008 minus0090 0206minus0011 0262 0488
Saprophages 0020 minus0011 0044 minus0085 minus0003 0591 0717
Notes Significant correlations for P lt 005
Significant correlations for P lt 001
species accumulation curves based individual-rarefaction highlighted the key contribution
of rare species lsquosingletonsrsquo and secondary doubletons for estimating the number expected
species
Since saline environments in hot arid regions are characterized by large spatial and
temporal fluctuation of water level and salinity community of inland insects can be
modelled either by the synergistic effect of several factors (abiotic and biotic) that are
related to these two parameters or by the predominance of one factor over others
(eg vegetation parameters) (Vidal-Abarca Gomez amp Suarez 2004 Velasco et al 2006)
Moreover the state of the composition of insect assemblage in inland saline environments
can be explained by the morphological and physiological adaptations necessary to cope
with the extreme and unpredictable conditions of these habitats on one hand and their life
cycle phenological adaptations and behaviour on the other hand (Cloudsley-Thompson
1975 Louw amp Seely 1982)
The study of variations in the frequency of abundance and occurrence of different insect
orders shows that the beetles represent the most abundant order that appears regularly in
different sampling stations of Sabkha Djendli and during the study period This frequency
is reflected by the presence of three constant species (Coleoptera and Hymenoptera) six
common species (Coleoptera Hymenoptera and Dermaptera) and 66 accidental species
This finding is in contrast to the observation made by Boix et al (2008) where it has been
Chenchouni et al (2015) PeerJ DOI 107717peerj860 1826
found that beetles are the most affected group within insects of saline environments while
our results are similar to those of Vidal-Abarca Gomez amp Suarez (2004) who argue that
in the salt wetlands of arid and semi-arid areas Coleoptera and Diptera were the most
abundant groups because of their large adaptation to critical and extreme conditions It is
well known that the beetles are the most abundant and occurring insect group in nature
(Bouchard et al 2011) In addition to their dominance in the animal kingdom they are an
important food resource for consumers at different levels in the food web their number of
species represents a good biological indicator of habitat quality (Rainio amp Niemela 2003
Sanchez-Fernandez et al 2006) Moreover because of their sensitivity to environmental
modifications they constitute a model of choice for assessing the diversity of habitats
(Haddad et al 2009)
Regarding insect species richness the highest value is recorded in the west and
south stations with 27 species According to Neffar Chenchouni amp Si Bachir (in press)
these stations are characterized by certain homogeneity in their floristic composition
These areas are grazed and fertilized by dung they receive and therefore stimulate the
development of certain flowering herbaceous and thus attract more pollinators While
cattle dung favor the abundance of coprophages mostly Scarabaeidae in our case These
observations were confirmed by the CCA where we found that coprophages density was
positively correlated with plant diversity which was negatively associated with west and
south stations The vegetation significantly affects the different trophic groups (herbivores
parasitoids and predators) of the insect fauna living at the herbaceous layer through its
floristic composition and functional diversity (Koricheva et al 2000) but also through the
density of vegetation cover that creates a microclimate for soil-dwelling species (Siemann
1998) According to Haddad et al (2009) species richness of predators and herbivores
is positively related to species richness and plant biomass without being affected by
its composition However in lentic ecosystems high electrical conductivity causes a
significant decline in the abundance and taxonomic richness of macroinvertebrate fauna
(Waterkeyn et al 2008 Carver et al 2009)
Based on the values of the Shannon index and evenness insect diversification is well
marked in the different stations and seasons indicating a balance between the number
of sampled invertebrate populations although it may be that the constituent species of
assemblages are generalists adapting to most environmental conditions as suggested by
Rainio amp Niemela (2003) and Montagna et al (2012)
Furthermore the dominance of accidental species (6675) may be connected to the
sparse structure of vegetation of the Sabkha Because the presence of dense vegetation
reduces predation against herbivores that therein also find abundant food but also reduces
the antagonistic effect between predators (Finke amp Denno 2002) this is not the case
with the open vegetation of Sabkha Djendli which is characterized by a medium to low
coverage (Neffar Chenchouni amp Si Bachir in press) Otherwise the same type of structure
and composition of vegetation cover are almost noted in arid and semi-arid wetlands of
Algeria and North Africa (Khaznadar Vogiatzakis amp Griffiths 2009 Chenchouni 2012b)
This particular pattern of species occurrences in Sabkha Djendli may also be explained
Chenchouni et al (2015) PeerJ DOI 107717peerj860 1926
by the unpredictable environmental changes inciting species to the coexistence and
consequently the increase of diversity (Chesson amp Huntly 1997 Pinero et al 2011) But
generally seasonality remains the primary determinant factor of invertebrate diversity in
any ecosystem (Wolda 1988) The metabolism of poikilotherms requires low investment
in energy making these invertebrates highly effective organisms for the survival in extreme
environments (Heatwole 1996) This explains the significant variation in predator
numbers between the studied seasons and stations This may be related to climate
factors mainly precipitations and wind speed which both showed significant correlations
with numbers of predators and hymenoptera As most of hymenopteran species being
predators (except species belonging to Apidae Megachilidae and Halictidae) and have their
populations increase in late spring and during the hot season lsquosummerrsquo the precipitation
revealed negative correlation because it occurs mostly in autumn and moderately in the
spring
The study of trophic status of insect species reveals their affiliation to dif-
ferent ranks of consumers and thus these species virtually occupy differ-
ent levels in the food web Species richness decreases in the following order
herbivoresgt predatorsgt polyphagesgt saprophagesgt coprophages with 40 253
133 120 and 93 respectively According Pinero et al (2011) seasonal variations
have profound effects not only on the number of species abundance and biomass of
invertebrates during different times of the year but also on the trophic and functional
structures of communities For his part Siemann (1998) suggested that the diversity
quality andor composition of plant species can in their turn influence the diversity of
higher trophic levels not only by changing the diversity of herbivores parasites and
predators but also by affecting the quality of the food of herbivores and the ease with
which they can be captured Therefore the spatiotemporal variation in traits of vegetation
(composition and cover) between the eight stations and seasons (Neffar Chenchouni amp
Si Bachir in press) is the cause of the significantly uneven spatiotemporal distribution
(according to Chi-square test) of insect group densities Indeed the CCA has allowed the
characterization of insect assemblage responses to vegetation parameters
The comparison of specific composition between different stations of Sabkha Djendli
using the Jaccard index shows low similarity values commonly not exceeding 35 This
similarity would find its explanation in the heterogeneity of ecological conditions for this
fauna in particular the composition and structure of the sparse vegetation which is chiefly
composed of halophytes including Suaeda spp Atriplex spp and Salicornia spp (Neffar
Chenchouni amp Si Bachir in press) reflecting thus the degraded conditions prevailing on the
physicochemical properties of soil in which they grow (Khaznadar Vogiatzakis amp Griffiths
2009) According to Baguette (1992) the inter- and intra-specific competitions predation
and parasitism regulate the spatial and temporal distribution of species and structure of
communities Also the distribution of a given species is a dynamic phenomenon that
involves a set of extinction and recolonisation stages of local populations following changes
in environmental conditions Even more so several studies have shown that changes in
communities across habitats are influenced by environmental variables in particular
Chenchouni et al (2015) PeerJ DOI 107717peerj860 2026
the type of substrate (Ligeiro Melo amp Callisto 2010) and even the coarse organic matter
(Hepp amp Melo 2013)
Furthermore we speculate that the land use around each station has an important
influence on the variation of insect abundance and composition in that station The AHC
grouped together N SE NE and E stations and these are furthest to the urban area and
cropping lands while other groups of stations (S SW W NW) are the closest from urban
and crop areas Similarly N and NW stations are clustered together because both are closest
to montane forests and furthest from urban areas The land use is an important factor that
helps to identify spatiotemporal variation in insect communities (Schweiger et al 2005)
Human activities in general and the agricultural ones in particular including grazing and
animal farming may induce several changes to structural and organisational features of
insect populations and communities (Rand Tylianakis amp Tscharntke 2006)
The spatial variability of the insect fauna of Sabkha Djendli is related to the combination
of several factors among others the climate is critical to the distribution of arid arthropods
(Langlands Brenna amp Pearson 2006) the reproductive potential and dispersal capabilities
(Thompson amp Townsend 2006) and environmental heterogeneity may be a contributing
factor to their low dispersion
The halophytic belt of Sabkha Djendli have a high richness of insects especially in spring
and autumn coinciding in part with their breeding period As the recorded species are
mostly phytophages their number naturally increases in the spring with the increase
of plant diversity and vegetation cover whereas the predators generally depend on the
availability of prey (Koricheva et al 2000 Haddad et al 2009) This statement is supported
by findings of the CCA where the abundant insect groups (Coleoptera phytophages) were
found linked to vegetation parameters mainly in spring and summer
Following this study the use of pitfall traps in Sabkha Djendli revealed some knowledge
about the entomofauna The insect community shows high taxonomic richness and
diversity in different stations and seasons The composition of functional trophic
groups are closely related to diversity and vegetation cover The conservation of this
biological heritage so rich but little known non-invested and generally underestimated
by managers can only be possible by improving and deepening our knowledge about
biodiversity including the functional communities in relation with threatening factors and
disturbances that affect their vital activities
ADDITIONAL INFORMATION AND DECLARATIONS
FundingThe authors declare there was no funding for this work
Competing InterestsThe authors declare there are no competing interests
Chenchouni et al (2015) PeerJ DOI 107717peerj860 2126
Author Contributionsbull Haroun Chenchouni conceived and designed the experiments performed the exper-
iments analyzed the data wrote the paper prepared figures andor tables reviewed
drafts of the paper
bull Taha Menasria Souad Neffar and Smail Chafaa contributed reagentsmaterialsanalysis
tools wrote the paper reviewed drafts of the paper
bull Lyes Bradai Rachid Chaibi Mohamed Nacer Mekahlia and Djamel Bendjoudi wrote the
paper reviewed drafts of the paper
bull Abdelkrim Si Bachir conceived and designed the experiments contributed
reagentsmaterialsanalysis tools wrote the paper reviewed drafts of the paper
Supplemental InformationSupplemental information for this article can be found online at httpdxdoiorg
107717peerj860supplemental-information
REFERENCESAnichtchenko AV Barsevskis A Gebert J Hejkal J Panin R Toribio M Wiesner J Will
KW (eds) 2014 Carabidae of the world Available at httpwwwcarabidaeorg
AntWeb 2014 Available at httpwwwantweborg (accessed 18 December 2014)
Baguette M 1992 Selection de lrsquohabitat des Carabidae en milieu forestier PhD Thesis Universityof Louvain Belgium
Balla A 2012 Synthese ecologique sur les zones humides algeriennes drsquoimportance internationaleldquoSites Ramsarrdquo Engineer Dissertation University of Batna Algeria
Bensizerara D Chenchouni H Si Bachir A Houhamdi M 2013 Ecological status interactionsfor assessing bird diversity in relation to a heterogeneous landscape structure Avian BiologyResearch 667ndash77 DOI 103184175815513X13577344603957
Bigot L Bodot P 1973 Contribution a lrsquoetude biocenotique de la garrigue a Quercuscoccifera ndashComposition biotique du peuplement des invertebres Vie et Milieu 23229ndash249
Bilton DT Freeland JR Okamura B 2001 Dispersal in freshwater invertebrates Annual Reviewof Ecology and Systematics 32159ndash181 DOI 101146annurevecolsys32081501114016
Bobbink R Beltman B Verhoeven JTA Whigham DF 2006 Wetlands functioning biodiversityconservation and restoration Heidelberg Berlin Springer-Verlag DOI 101007978-3-540-33189-6
Boix D Gascon S Badosa A Brucet S Lopez-Flores R Martinoy M Gifre J Quintana XD2008 Patterns of composition and species richness of crustaceans and aquatic insects alongenvironmental gradients in Mediterranean water bodies Hydrobiologia 59753ndash69DOI 101007s10750-007-9221-z
Bouchard P Bousquet Y Davies AE Alonso-Zarazaga MA Lawrence JF Lyal CHC Newton AFReid CAM Schmitt M Slipinski SA Smith ABT 2011 Family-group names in Coleoptera(Insecta) ZooKeys 881ndash972 DOI 103897zookeys88807
Brock MA Nielsen DL Crossle K 2005 Changes in biotic communities developing fromfreshwater wetland sediments under experimental salinity and water regimes Freshwater Biology501376ndash1390 DOI 101111j1365-2427200501408x
Chenchouni et al (2015) PeerJ DOI 107717peerj860 2226
Brose U Martinez ND 2004 Estimating the richness of species with variable mobility Oikos105292ndash300 DOI 101111j0030-1299200412884x
Carver S Storey A Spafford H Lynas J Chandler L Weinstein P 2009 Salinity as a driver ofaquatic invertebrate colonization behavior and distribution in the wheat belt of WesternAustralia Hydrobiology 61775ndash90 DOI 101007s10750-008-9527-5
Chafaa S Biche M Chenchouni H Sellami M Si Bachir A 2013 Effet du climat et de lrsquoexpositionsur la dynamique des populations de la cochenille violette Parlatoria oleae Colvee (HemipteraDiaspididae) en conditions arides Annales de la Societe entomologique de France 49291ndash297DOI 101080003792712013856203
Chaibi R Si Bachir A Chenchouni H Bouletreau S Cereghino R Santoul F 2012 Effect oflarge-scale environmental variables and human pressure on distribution patterns of exoticcontinental fish in east Algeria Zoology and Ecology 22166ndash171DOI 101080216580052012736687
Chao A Chazdon RL Colwell RK Shen T-J 2005 A new statistical approach for assessingcompositional similarity based on incidence and abundance data Ecology Letters 8148ndash159DOI 101111j1461-0248200400707x
Chao A 1984 Non-parametric estimation of the number of classes in a population ScandinavianJournal of Statistics 11265ndash270
Chenchouni H Si Bachir A 2010 Zones humides et biodiversites ndash Classification et typologie deszones humides du Bas-Sahara algerien et caracterisation de la biocenose du Lac Ayata (ValleedrsquoOued Righ) Sarrebruck Editions Universitaires Europeennes DOI 10131402129577287
Chenchouni H 2012a Diversity assessment of vertebrate fauna in a wetland of hot hyperaridlands Arid Ecosystems 2253ndash263 DOI 101134S2079096113010022
Chenchouni H 2012b Diversite floristique drsquoun lac du Bas-Sahara algerien Acta BotanicaMalacitana 3733ndash44
Chesson P Huntly N 1997 The roles of harsh and fluctuating conditions in the dynamics ofecological communities American Naturalist 150519ndash553 DOI 101086286080
Cloudsley-Thompson JL 1975 Adaptations of arthropoda to arid environments Annual Reviewof Entomology 20261ndash283 DOI 101146annureven20010175001401
Cobos A 1987 La Coleopterofauna endemica almeriense Graellsia 433ndash17
Colwell RK Chao A Gotelli NJ Lin S-Y Mao CX Chazdon RL Longino JT 2012 Modelsand estimators linking individual-based and sample-based rarefaction extrapolation andcomparison of assemblages Journal of Plant Ecology 53ndash21 DOI 101093jpertr044
Colwell RK 2013 EstimateS statistical estimation of species richness and shared species fromsamples Version 9 Available at httppurloclcorgestimates
Comin FA Comin RX 1992 Lake Gallocanta (Aragon NESpain) a paradigm of fluctuations atdifferent scales of time Limnetica 879ndash86
de Jong YSDM (ed) 2013 Fauna Europaea Version 26 Web Service Available at httpwwwfaunaeurorg (accessed 18 December 2014)
De Roeck ER Vanschoenwinkel BJ Day JA Xu Y Raitt L Brendonck L 2007 Conservationstatus of large branchiopods in the Western Cape South Africa Wetlands 27162ndash173DOI 1016720277-5212(2007)27[162CSOLBI]20CO2
Eades DC Otte D Cigliano MM Braun H 2014 Orthoptera species file Version 5050 Availableat httporthopteraspeciesfileorg (accessed 18 December 2014)
Chenchouni et al (2015) PeerJ DOI 107717peerj860 2326
Finke DL Denno RF 2002 Intraguild predation diminished in complex-structured vegetationimplications for prey suppression Ecology 83643ndash652DOI 1018900012-9658(2002)083[0643IPDICS]20CO2
Fischer J Lindenmayer DB 2007 Landscape modification and habitat fragmentation a synthesisGlobal Ecology and Biogeography 16265ndash280 DOI 101111j1466-8238200700287x
Fox J 2008 Applied regression analysis and generalized linear models Second Edition ThousandOaks Sage Publications
Gascon S Boix D Sala J Quintana XD 2005 Variability of benthic assemblages in relation to thehydrological pattern in Mediterranean salt marshes (Emporda wetlands NE Iberian Peninsula)Archiv fur Hydrobiologie 163163ndash181 DOI 1011270003-913620050163-0163
Guezoul O Chenchouni H Sekour M Ababsa L Souttou K Doumandji S 2013 An avifaunalsurvey of mesic manmade ecosystems ldquoOasesrdquo in Algerian hot-hyperarid lands Saudi Journal ofBiological Sciences 2037ndash43 DOI 101016jsjbs201210001
Haddad NM Crutsinger GM Gross K Haarstad J Knops JM Tilman D 2009 Plant speciesloss decreases arthropod diversity and shifts trophic structure Ecology Letters 121029ndash1039DOI 101111j1461-0248200901356x
Heatwole H 1996 Energetics of desert invertebrates Heidelberg Berlin Springer-Verlag
Hepp LU Melo AS 2013 Dissimilarity of stream insect assemblages effects of multiple scales andspatial distances Hydrobiologia 703239ndash246 DOI 101007s10750-012-1367-7
Hogarth PJ Tigar BJ 2002 Ecology of sabkha arthropods In Barth H-J Boer B eds Sabkhaecosystems volume I the arabian peninsula and adjacent countries Amsterdam Springer267ndash282
Idder-Ighili H Idder MA Doumandji-Mitiche B Chenchouni H 2015 Modeling the effectsof climate on date palm scale (Parlatoria blanchardi) population dynamics during differentphenological stages of life history under hot arid conditions International Journal ofBiometeorology In Press DOI 101007s00484-014-0952-z
Ivask M Kuu A Meriste M Truu J Truu M Vaater V 2008 Invertebrate communities (Annelidaand epigeic fauna) in three types of Estonian cultivated soils European Journal of Soil Biology44532ndash540 DOI 101016jejsobi200809005
Jongman RH Ter Braak CJF Tongeren OFR (eds) 1995 Data analysis in community andlandscape ecology 2nd edition Cambridge Cambridge University Press
Khaznadar M Vogiatzakis IN Griffiths GH 2009 Land degradation and vegetationdistribution in Chott El Beida wetland Algeria Journal of Arid Environments 73369ndash377DOI 101016jjaridenv200809026
Koricheva J Mulder CP Schmid B Joshi J Huss-Danell K 2000 Numerical responses ofdifferent trophic groups of invertebrates to manipulations of plant diversity in grasslandsOecologia 125271ndash282 DOI 101007s004420000450
Langlands PR Brenna KEC Pearson DJ 2006 Spiders spinifex rainfall and fire long termchanges in an arid spider assemblage Journal of Arid Environments 6736ndash59DOI 101016jjaridenv200601018
Ligeiro R Melo AS Callisto M 2010 Spatial scale and the diversity of macroinvertebrates in aNeotropical catchment Freshwater Biology 55424ndash435 DOI 101111j1365-2427200902291x
Lobl I Smetana A (eds) 2013 Catalogue of palaearctic coleoptera vol 8 Denmark StenstrupApollo Books
Louw GN Seely MK 1982 Ecology of desert organisms New York Longman
Chenchouni et al (2015) PeerJ DOI 107717peerj860 2426
Magurran AE 2004 Ecological diversity and its measurement Princeton Princeton UniversityPress
Mitsch WJ Gosselink JG Anderson CJ Zhang L 2009 Wetland ecosystems Hoboken John Wileyamp Sons
Montagna M Lozzia CG Giorgi A Baumgartner J 2012 Insect community structure andinsect biodiversity conservation in an Alpine wetland subjected to an intermediate diversifiedmanagement regime Ecological Engineering 47242ndash246 DOI 101016jecoleng201206025
Myers RH Montgomery DC Vining GG Robinson TJ 2012 Generalized linear models withapplications in engineering and the sciences vol 791 Hoboken John Wiley amp Sons
Neffar S Chenchouni H Si Bachir A 2015 Floristic composition and analysis of spontaneousvegetation of Sabkha Djendli in North-east Algeria Plant Biosystems 149 In PressDOI 101080112635042013810181
Nijboer RC Verdonschot PF 2004 Rare and common macroinvertebrates definition ofdistribution classes and their boundaries Archiv fur Hydrobiologie 16145ndash64DOI 1011270003-913620040161-0045
Pinero FS Tinaut A Aguirre-Segura A Minano J Lencina JL Ortiz-Sanchez FJ Perez-Lopez FJ2011 Terrestrial arthropod fauna of arid areas of SE Spain diversity biogeography andconservation Journal of Arid Environments 751321ndash1332 DOI 101016jjaridenv201106014
R Core Team 2015 R a language and environment for statistical computing Vienna R Foundationfor Statistical Computing Available at httpwwwr-projectorg
Rainio J Niemela J 2003 Ground beetles (Coleoptera Carabidae) as bioindicators Biodiversity ampConservation 12487ndash506 DOI 101023A1022412617568
Rand TA Tylianakis JM Tscharntke T 2006 Spillover edge effects the dispersal of agriculturallysubsidized insect natural enemies into adjacent natural habitats Ecology Letters 9603ndash614DOI 101111j1461-0248200600911x
Samraoui B Boudot J-P Ferreira S Riservato E Jovic M Kalkman VJ Schneider W 2011 Thestatus and distribution of dragonflies In Garcia N Cuttelod A Abdul Malak D eds The statusand distribution of freshwater biodiversity in Northern Africa Gland IUCN 51ndash70
Samraoui B Samraoui F 2008 An ornithological survey of the wetlands of Algeria importantBird Areas Ramsar sites and threatened species Wildfowl 5871ndash98
Sanchez-Fernandez D Abellan P Mellado A Velasco J Millan A 2006 Are water beetles goodindicators of biodiversity in Mediterranean aquatic ecosystems The case of the Segura riverbasin (SE Spain) Biodiversity amp Conservation 154507ndash4520 DOI 101007s10531-005-5101-x
Schweiger O Maelfait JP Wingerden VW Hendrickx F Billeter R Speelmans M Augenstein IAukema B Aviron S Bailey D Bukacek R Burel F Diekotter T Dirksen J Frenzel MHerzog F Liira J Roubalova M Bugter R 2005 Quantifying the impact of environmentalfactors on arthropod communities in agricultural landscapes across organizational levels andspatial scales Journal of Applied Ecology 421129ndash1139 DOI 101111j1365-2664200501085x
Siemann E 1998 Experimental tests of effects of plant productivity and diversity on grasslandarthropod diversity Ecology 792057ndash2070DOI 1018900012-9658(1998)079[2057ETOEOP]20CO2
Spence JR Niemela JK 1994 Sampling carabid assemblages with pitfall traps the madness andthe method The Canadian Entomologist 126881ndash894 DOI 104039Ent126881-3
Chenchouni et al (2015) PeerJ DOI 107717peerj860 2526
Thompson R Townsend C 2006 A truce with neutral theory local deterministic factors speciestraits and dispersal limitation together determine patterns of diversity in stream invertebratesJournal of Animal Ecology 75476ndash484 DOI 101111j1365-2656200601068x
Velasco J Millan A Hernandez J Gutierrez C Abellan P Sanchez D Ruiz M 2006 Response ofbiotic communities to salinity changes in a Mediterranean hypersaline stream Saline Systems21ndash15 DOI 1011861746-1448-2-12
Vidal-Abarca MR Gomez R Suarez ML 2004 Los rıos de las regiones semiaridas RevistaEcosistemas 1316ndash28
Waterkeyn A Grillas P Vanschoenwinkel B Brendonck L 2008 Invertebrate communitypatterns in Mediterranean temporary wetlands along hydroperiod and salinity gradientsFreshwater Biology 531808ndash1822 DOI 101111j1365-2427200802005x
Wolda H 1988 Insect seasonality why Annual Review of Ecology Evolution and Systematics191ndash18 DOI 101146annureves19110188000245
Chenchouni et al (2015) PeerJ DOI 107717peerj860 2626
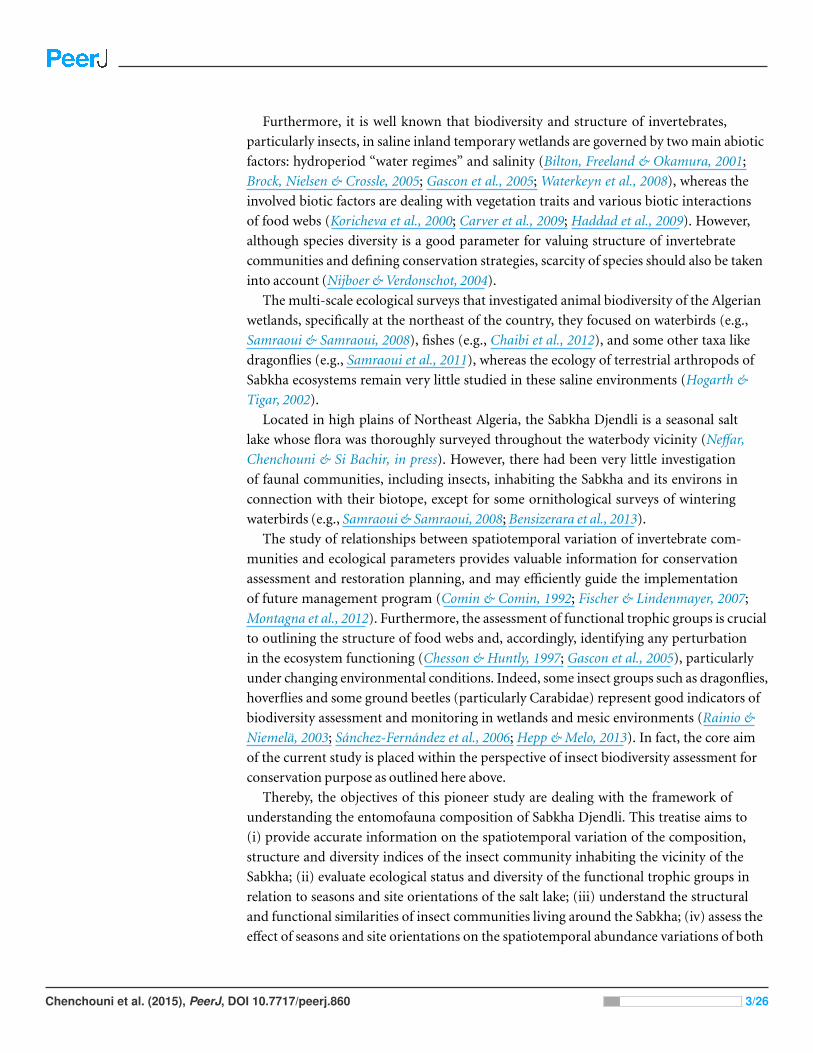
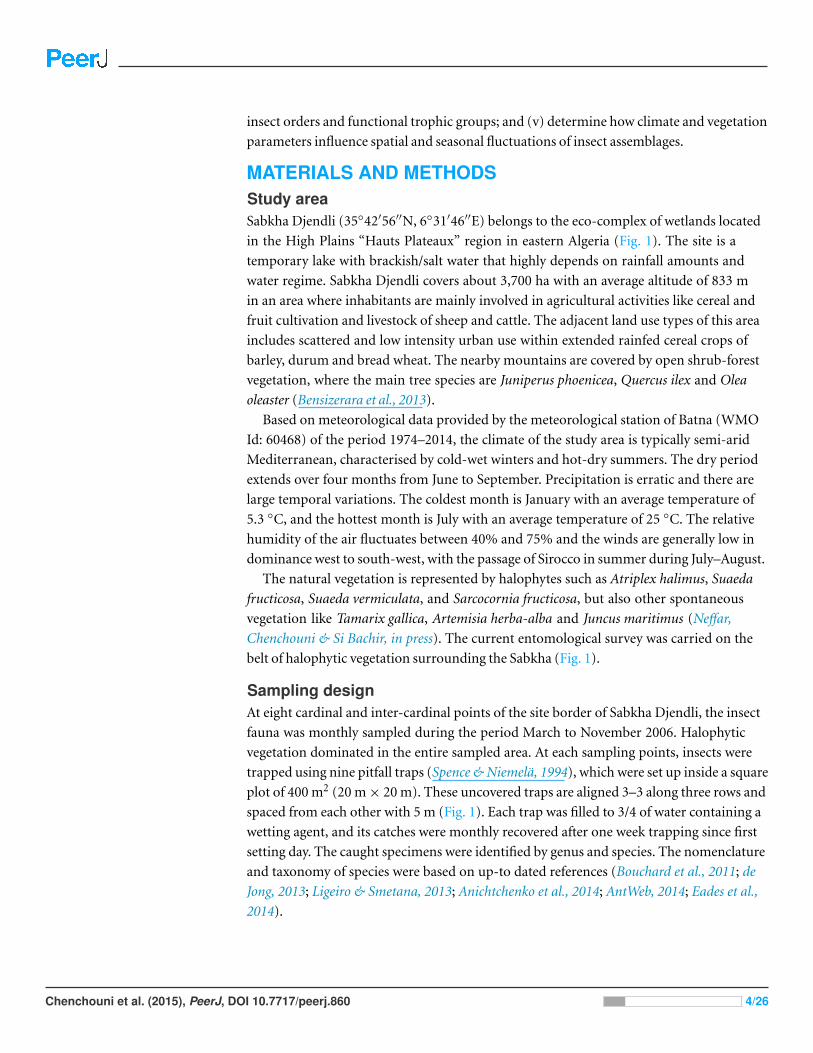
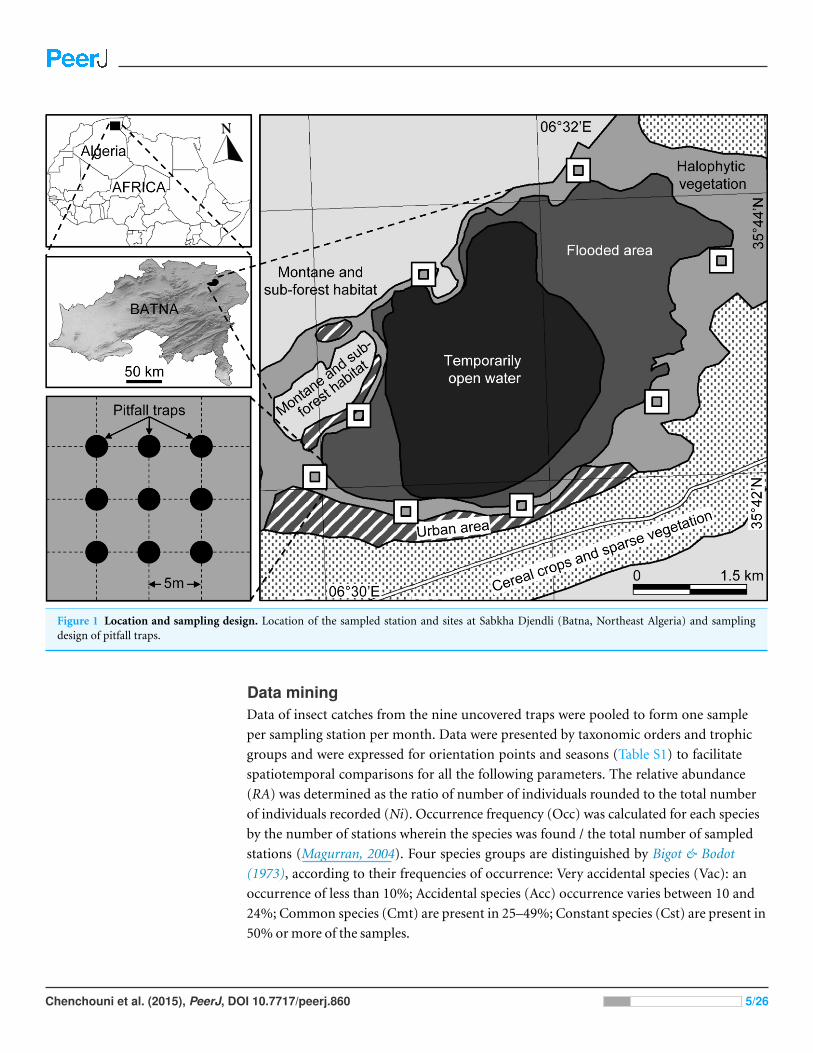
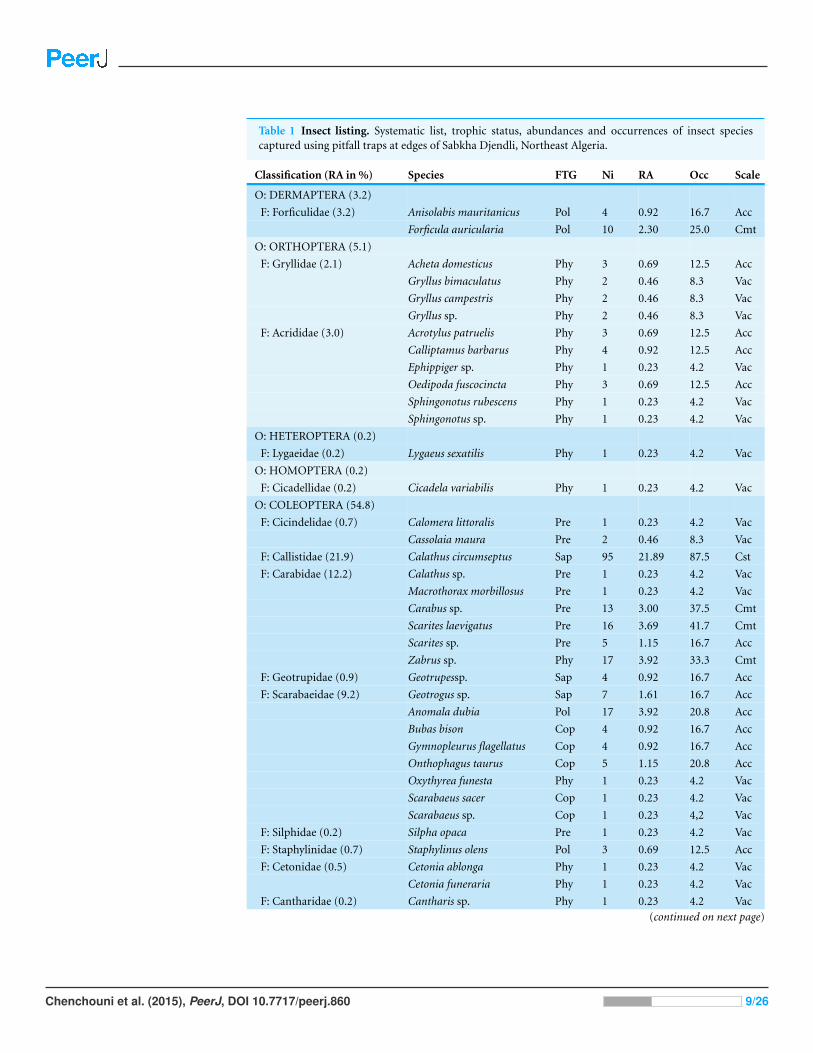
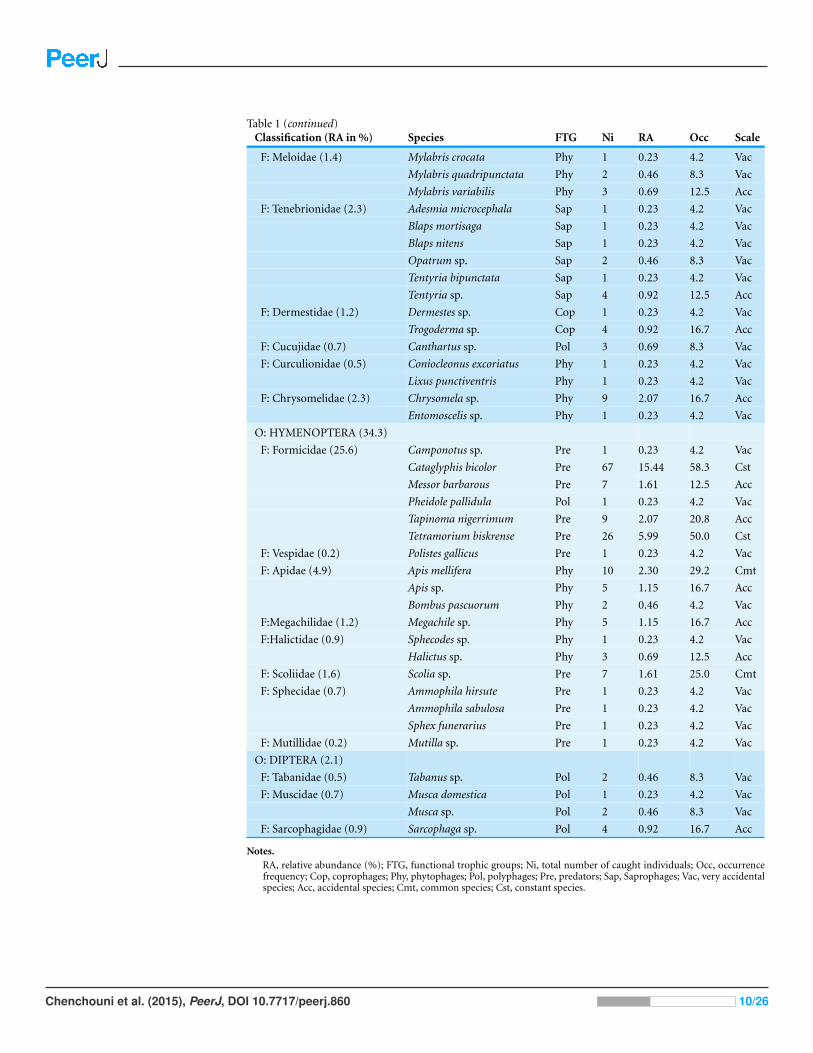
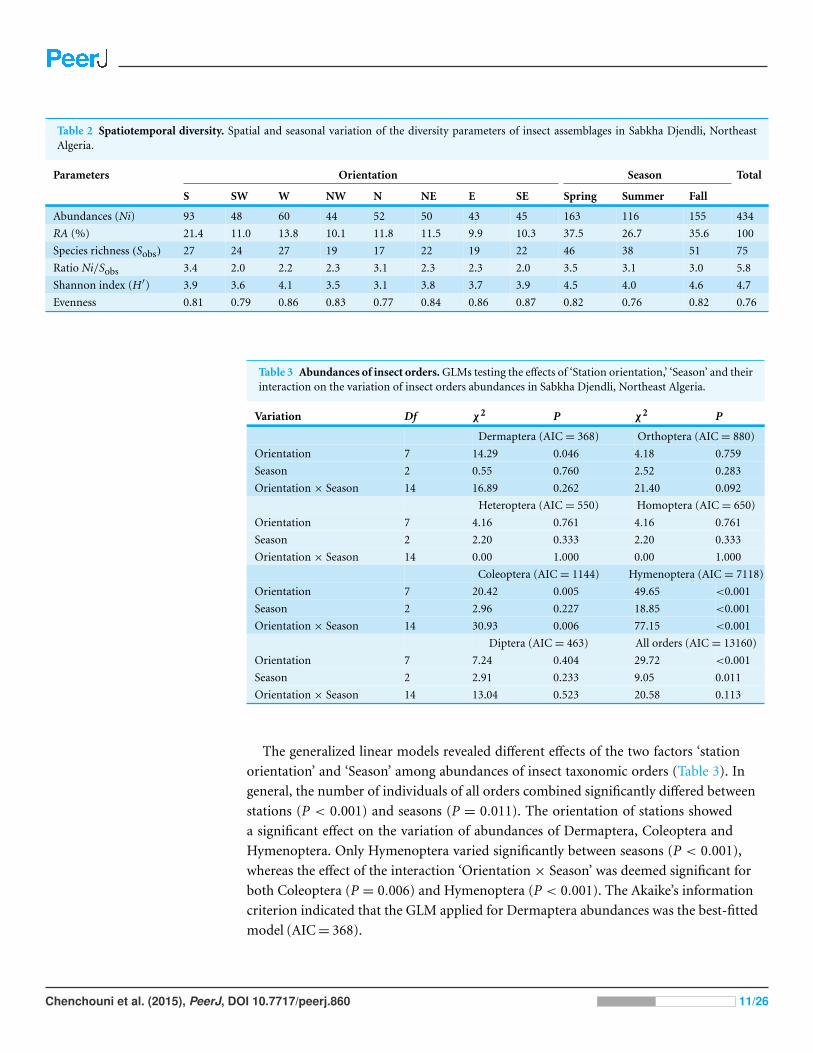
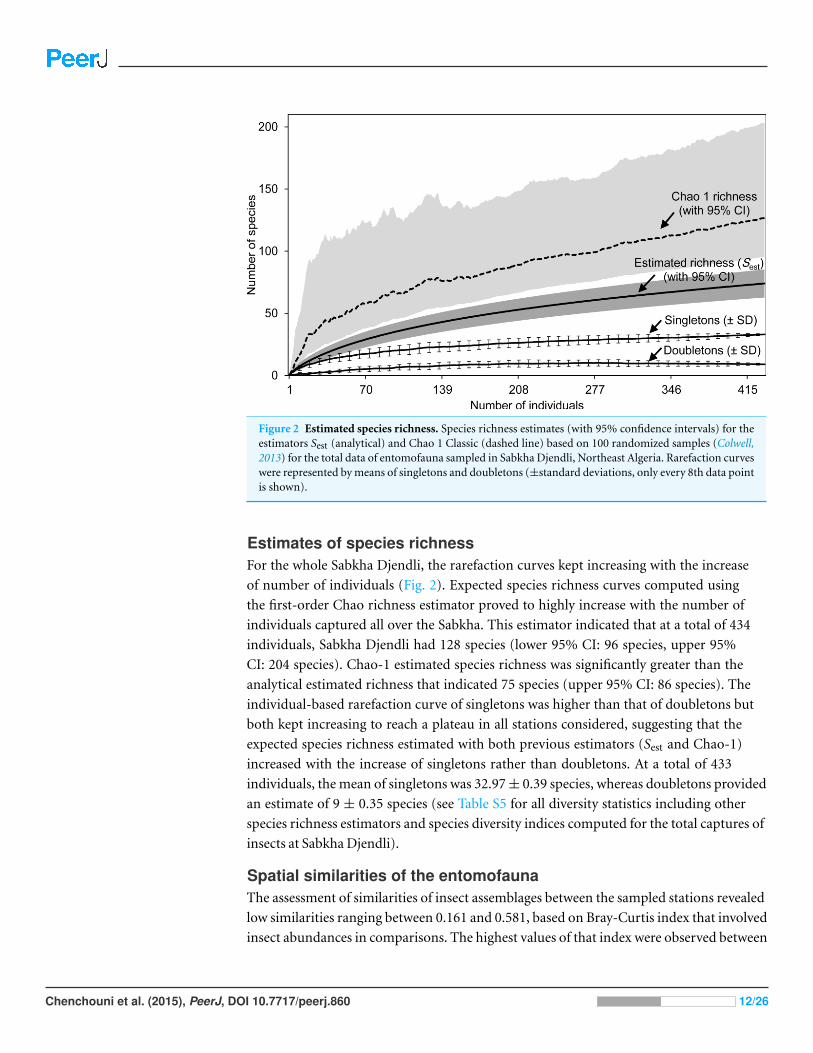
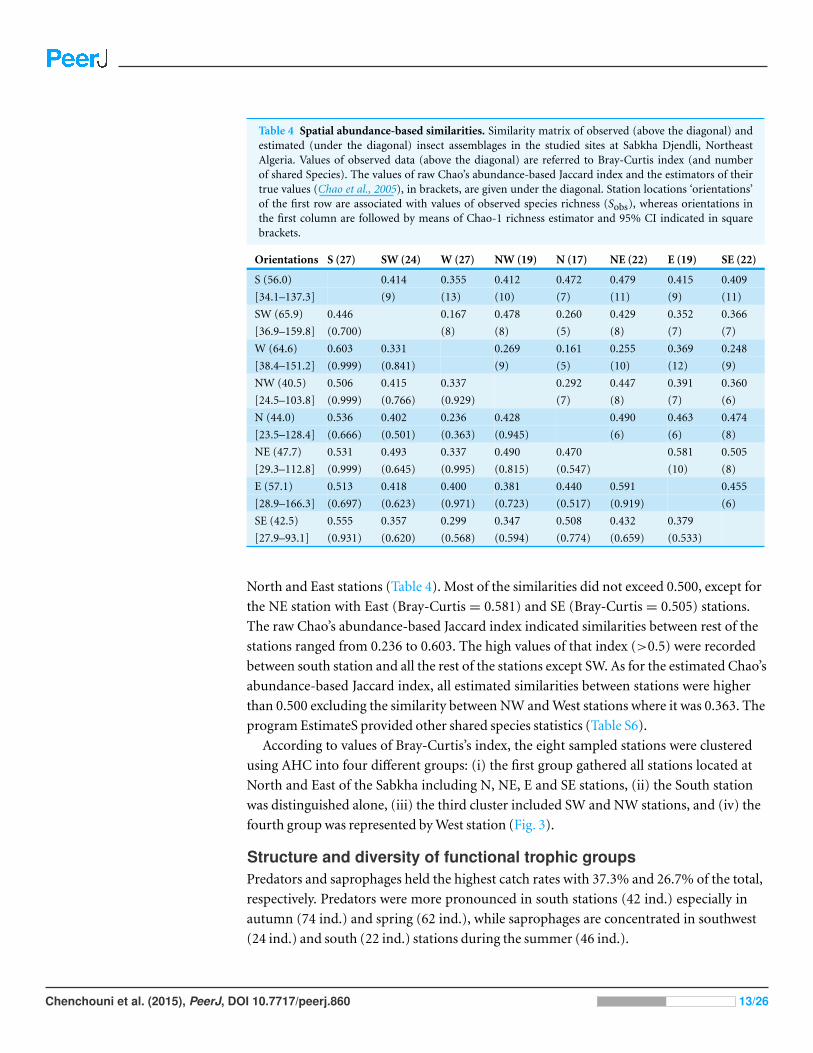
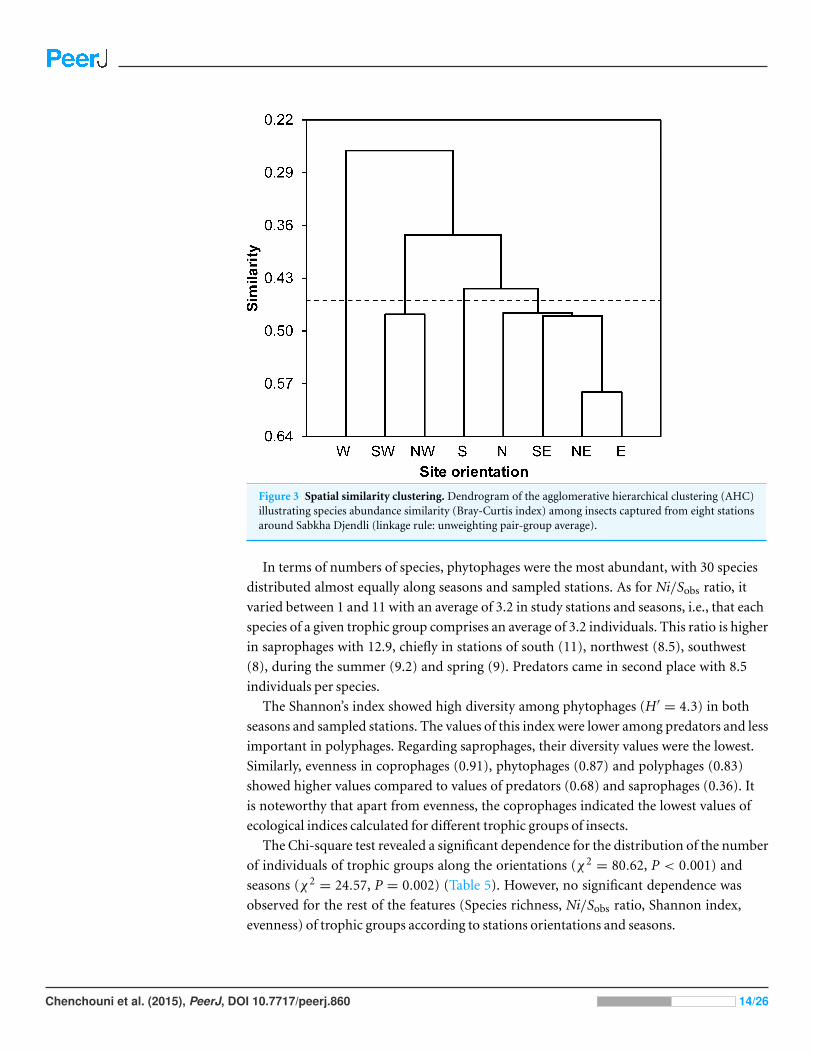
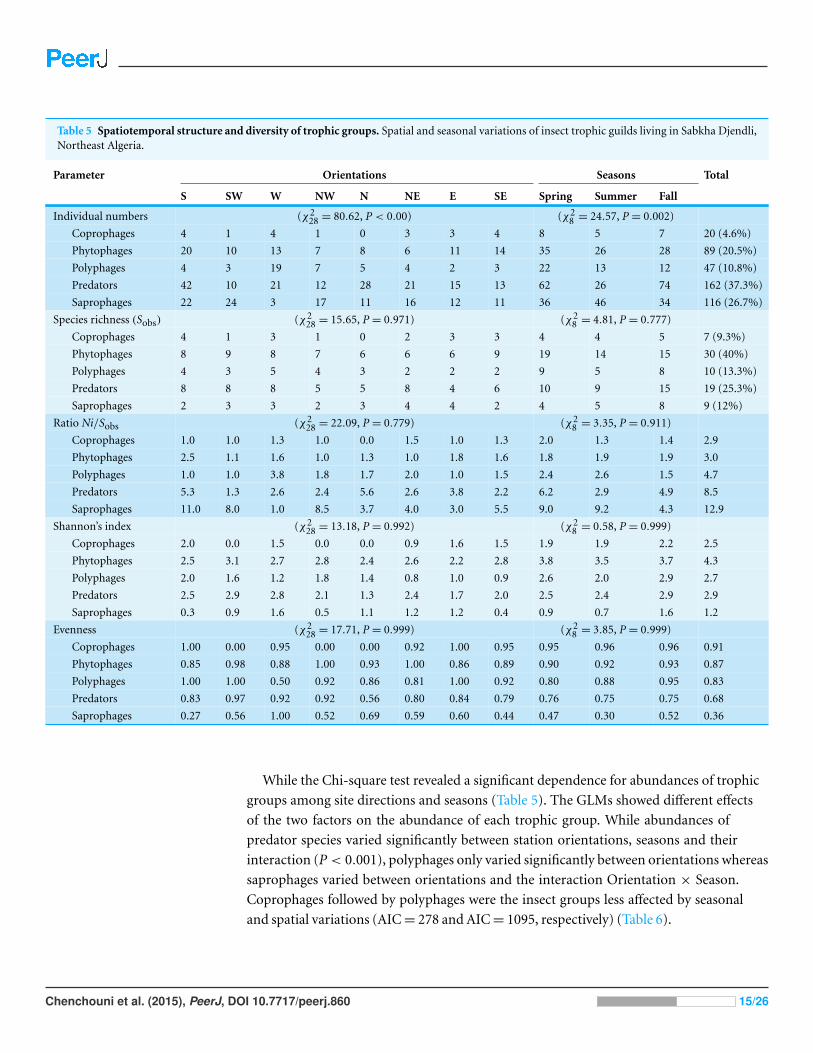
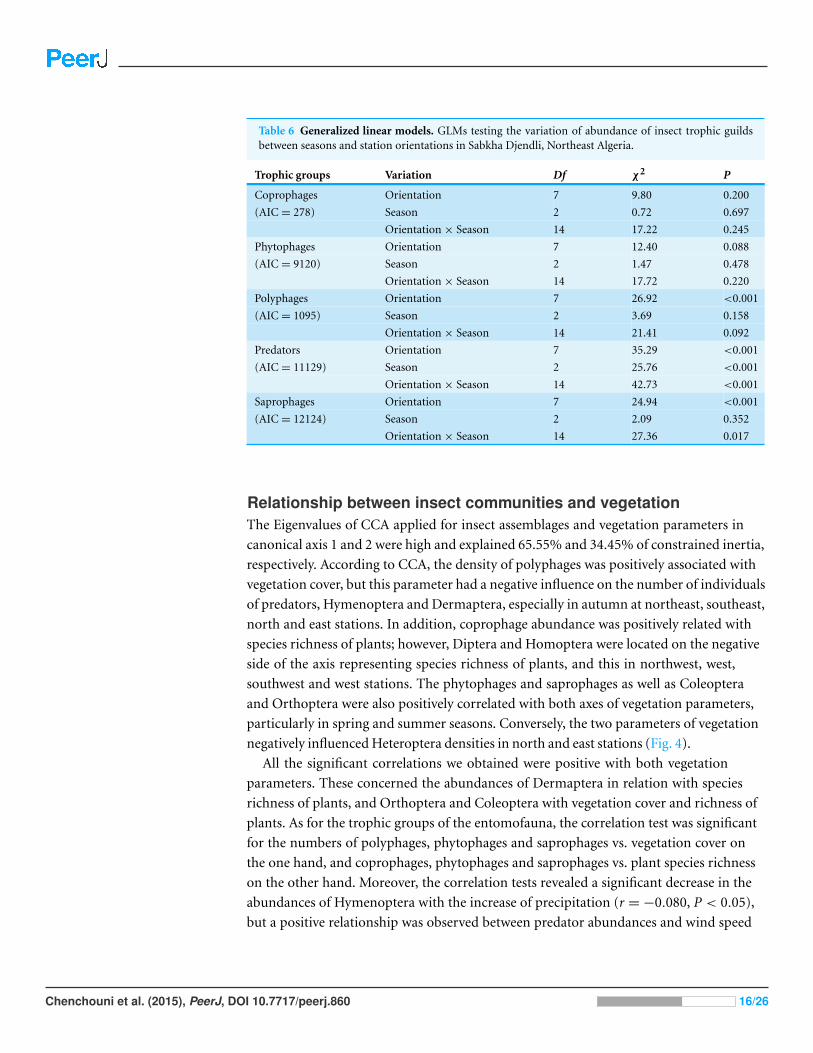
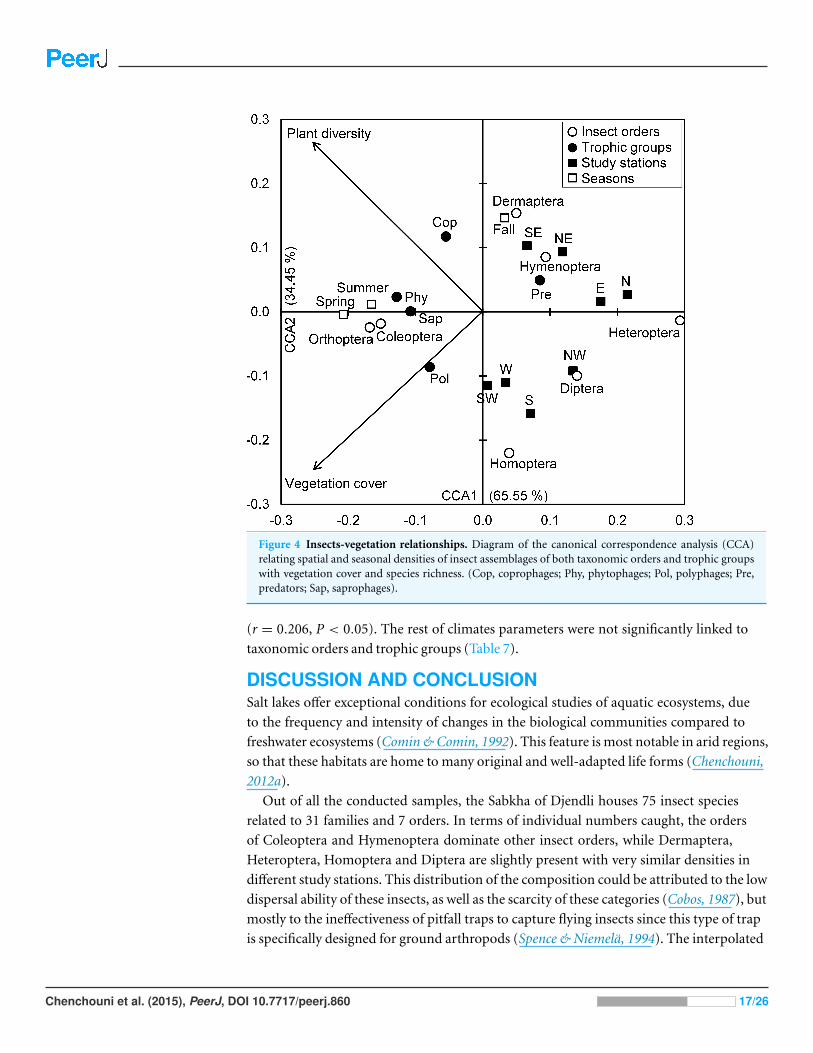
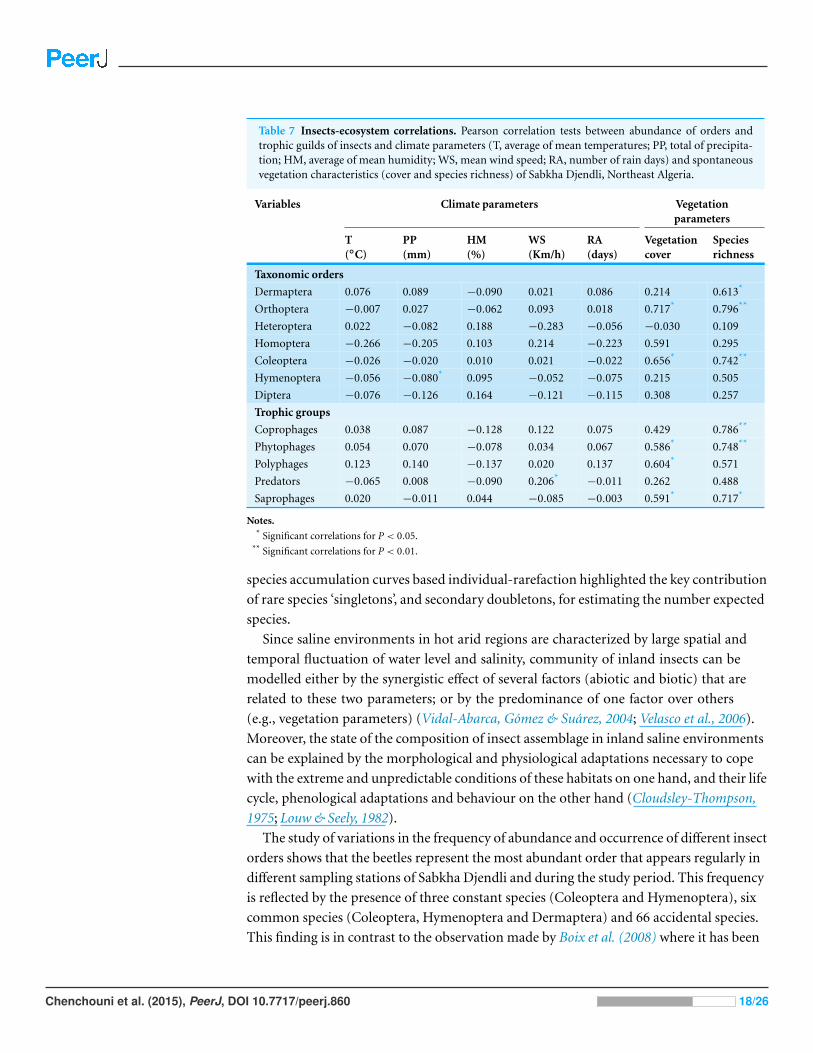