Visual transformation for interactive spatiotemporal data mining
Upload
khangminh22Category
view
3download
0
*For correspondence:
Competing interests: The
authors declare that no
competing interests exist.
Funding: See page 30
Received: 28 September 2020
Accepted: 31 March 2021
Published: 09 April 2021
Reviewing editor: Derek
Applewhite, Reed College,
United States
Copyright Sharma and Rikhy.
This article is distributed under
the terms of the Creative
Commons Attribution License,
which permits unrestricted use
and redistribution provided that
the original author and source are
credited.
Spatiotemporal recruitment ofRhoGTPase protein GRAF inhibitsactomyosin ring constriction in DrosophilacellularizationSwati Sharma, Richa Rikhy*
Biology, Indian Institute of Science Education and Research, Pune, India
Abstract Actomyosin contractility is regulated by Rho-GTP in cell migration, cytokinesis and
morphogenesis in embryo development. Whereas Rho activation by Rho-GTP exchange factor
(GEF), RhoGEF2, is well known in actomyosin contractility during cytokinesis at the base of
invaginating membranes in Drosophila cellularization, Rho inhibition by RhoGTPase-activating
proteins (GAPs) remains to be studied. We have found that the RhoGAP, GRAF, inhibits
actomyosin contractility during cellularization. GRAF is enriched at the cleavage furrow tip during
actomyosin assembly and initiation of ring constriction. Graf depletion shows increased Rho-GTP,
increased Myosin II and ring hyper constriction dependent upon the loss of the RhoGTPase
domain. GRAF and RhoGEF2 are present in a balance for appropriate activation of actomyosin ring
constriction. RhoGEF2 depletion and abrogation of Myosin II activation in Rho kinase mutants
suppress the Graf hyper constriction defect. Therefore, GRAF recruitment restricts Rho-GTP levels
in a spatiotemporal manner for inhibiting actomyosin contractility during cellularization.
IntroductionMetazoan embryogenesis involves a variety of cell shape changes during cytokinesis, cell migration
and tissue morphogenesis (Agarwal and Zaidel-Bar, 2019; Heer and Martin, 2017; Kumar et al.,
2015; Lecuit and Lenne, 2007; Levayer and Lecuit, 2012; St Johnston and Ahringer, 2010;
Yam et al., 2007). The cortical actomyosin activity is orchestrated with plasma membrane shape
remodeling to generate localized forces to drive cell shape dynamics (Heer and Martin, 2017;
Jodoin et al., 2015; Martin et al., 2009; Mason et al., 2013; Munjal et al., 2015; Murrell et al.,
2015). The intensity and directionality of force generated are dependent on spatiotemporal regula-
tion of Myosin II activity (Heisenberg and Bellaıche, 2013; Rauzi et al., 2010). Myosin II activation
by phosphorylation is achieved by Rho kinase (Amano et al., 2010; Kasza et al., 2014; Levayer and
Lecuit, 2012; Vasquez et al., 2014). Rho-GTP, a member of the small GTPases belonging to the
Ras superfamily, activates Rho kinase (Prudnikova et al., 2015). These molecular switches undergo
cycling between GDP-bound-inactive and GTP-bound-active states (Agarwal and Zaidel-Bar, 2019).
This Rho-GTP and Rho-GDP cycling is catalyzed by guanine nucleotide exchange factors (GEFs) and
GTPases-activating proteins (GAPs) (Bos et al., 2007; Van Aelst and D’Souza-Schorey, 1997). Rho-
GEFs lead to the production of Rho-GTP, whereas RhoGAPs promote hydrolysis of the GTP to gen-
erate Rho-GDP (Jacobs and Hall, 2005). The relative expression and spatiotemporal distribution of
RhoGEFs and RhoGAPs are critical in fine-tuning the levels of Rho-GTP and extent of Myosin II acti-
vation in different cellular processes (Agarwal and Zaidel-Bar, 2019; Chircop, 2014; Mulinari and
Hacker, 2010; Wu and Priya, 2019).
Drosophila embryogenesis is an excellent model system to study the molecular mechanisms regu-
lating actomyosin-driven contraction in a spatiotemporal manner. The Drosophila embryo begins
Sharma and Rikhy. eLife 2021;10:e63535. DOI: https://doi.org/10.7554/eLife.63535 1 of 34
RESEARCH ARTICLE
development as a syncytium (Foe et al., 2000; Foe and Alberts, 1983; Schejter and Wieschaus,
1993a). Transition from the syncytial to cellular blastoderm occurs at the embryo cortex in the inter-
phase of cycle 14 by cleavage to separate each nucleus by plasma membrane boundaries in a pro-
cess called cellularization (Mazumdar and Mazumdar, 2002; Schejter and Wieschaus, 1993a;
Sullivan and Theurkauf, 1995). The leading edge of the invaginating plasma membrane between
adjacent nuclei occurs as an infolding termed as furrow canal. The actomyosin network assembles at
the base of the furrow canal and forms a polygonal network in early cellularization. This transforms
into a contractile ring in mid cellularization. Finally, ring constriction partially closes the base of the
cell during late cellularization (Kiehart, 1990; Krueger et al., 2019; Young et al., 1993;
Royou et al., 2004; Schejter and Wieschaus, 1993a; Xue and Sokac, 2016). The actomyosin ring
organization and constriction in cellularization are similar to conventional cytokinesis in somatic cells
(Tram et al., 2002).
The GTPase exchange factor, RhoGEF2, localizes at the furrow tip in cellularization, and its deple-
tion results in inhibition of ring constriction in cellularization (Padash Barmchi et al., 2005;
Grosshans et al., 2005; Wenzl et al., 2010). Optogenetic activation of the catalytic domain of Rho-
GEF2 in the assembly phase of Myosin II leads to increased Myosin II recruitment, resulting in prema-
ture and enhanced constriction (Krueger et al., 2019). Moreover, overexpression of RhoGEF2 and
activated Rho1 mutant Rho1V14 results in contracted S2 cell morphology (Rogers et al., 2004). On
the other hand, microinjection of Rho1 inhibitor, C3 exoenzyme, and dominant negative N19Rho
alters the actin cytoskeleton and disrupts cellularization (Crawford et al., 1998). Rho-GTP activates
the kinases Drok and Drak that in turn activate Myosin II via phosphorylation. Further, Rok and Drak
mutant embryos and addition of a pharmacological inhibitor of Rok, Y-27632, show impaired acto-
myosin contractility due to reduced Myosin II phosphorylation (Chougule et al., 2016;
Krajcovic and Minden, 2012; Xue and Sokac, 2016). Phospho-deficient mutants of the light chain
of Myosin II, Squash, also show loss of contractility during cellularization (Xue and Sokac, 2016).
In contrast to RhoGEF2 function, RhoGAP domain-containing proteins are likely to play a key role
in inhibiting the activation of Myosin II. The function of RhoGAPs during tissue morphogenesis has
been generally less studied as compared to RhoGEFs. Depletion of RhoGAPs, RGA3 and RGA4 in
the Caenorhabditis elegans embryo leads to enhanced contractility of the anterior cortex due to
increased recruitment of Myosin II (Regev et al., 2017; Schmutz et al., 2007). CGAP, a RhoGAP
identified in Drosophila embryos, plays a role in inhibiting apical constriction in gastrulation
(Mason et al., 2016). CGAP mutant embryos also show increased constriction of actomyosin rings in
cellularization (Mason et al., 2016). The hexagonal phase of actomyosin organization has been
shown to be resilient to activation by Myosin II recruitment, and RhoGAPs may function at this stage
to inhibit ring constriction (Krueger et al., 2019). However, analysis of RhoGAP function in a spatio-
temporal manner in regulating actomyosin ring contractility has not been studied in cellularization.
Here, we report the characterization of a RhoGAP called GTPase regulator associated with focal
adhesion kinase (GRAF) in regulating contractile ring formation in cellularization in Drosophila
embryogenesis.
GRAF is a multidomain protein containing a BAR, PH, RhoGAP and SH3 domain
(Lundmark et al., 2008). GRAF was originally identified as a binding partner of the C-terminal
domain of focal adhesion kinase (Hildebrand et al., 1996; Taylor et al., 1998). The BAR and PH
domains are important for the recruitment of GRAF to the membrane, and RhoGAP domain specifi-
cally regulates the GTPase activity of RhoA (Doherty and Lundmark, 2009; Doherty et al., 2011;
Eberth et al., 2009; Holst et al., 2017; Lundmark et al., 2008). GRAF-deficient smooth muscle cells
in mice and Xenopus embryo extracts have increased Rho-GTP levels (Bai et al., 2013;
Doherty et al., 2011). GRAF loss leads to depletion of epithelial markers and transition to mesen-
chymal markers, giving rise to enhanced migratory ability (Regev et al., 2017). We assessed the role
of GRAF in contractile ring formation in Drosophila cellularization. We found that GRAF loss showed
a distinct hyper constriction phenotype dependent upon its RhoGTPase activity during cellulariza-
tion. GRAF was present at the furrow tip in early stages of cellularization during Myosin II assembly,
enriched in mid cellularization and depleted from the ring in late stages. Graf depletion led to
increased Myosin II recruitment at the contractile ring. Loss of RhoGEF2 and Myosin II activation sup-
pressed the hyper constriction phenotype of GRAF. Our studies show a crucial role for GRAF in
inhibiting actomyosin contractility in cellularization.
Sharma and Rikhy. eLife 2021;10:e63535. DOI: https://doi.org/10.7554/eLife.63535 2 of 34
Research article Developmental Biology

Results
GRAF depletion leads to premature constriction in early cellularizationand hyper constriction in mid and late cellularizationThe GRAF protein from Drosophila is a multidomain protein containing a BAR, PH, RhoGAP and
SH3 domain (Figure 1A) from the N terminus to the C terminus. This domain organization is con-
served across the multicellular organisms, C. elegans, Drosophila, Xenopus, chick, zebrafish and
humans (Figure 1—figure supplement 1A, B; Contrino et al., 2012). The closest homologue from
Saccharomyces cerevisiae, RGA2, contains only a RhoGAP domain. Schizosaccharomyces pombe
contains a similar protein at the rga2 locus containing a RhoGAP and PH domain, whereas the gacJJ
locus in Dictyostelium contains a PH, RhoGAP and SH3 domain.
Drosophila cellularization occurs by plasma membrane furrow extension between adjacent nuclei
from 3 mm to 40 mm in approximately 45 min at 25˚C (He et al., 2016). The nuclei are spherical in
early stages and elongate during mid cellularization. Contractile ring assembly initiates at the base
of the furrow tip with Myosin II recruitment in foci in a polygonal network in early stages of cellulari-
zation (Figure 1B). Constriction of the actomyosin-based contractile ring occurs during mid and late
cellularization at the base of elongated nuclei. To assess the function of the GRAF, RNAi knockdown
and Crispr Cas-9 strategy were used to generate embryos depleted of GRAF protein.
Graf shRNA1 (Grafi) (Figure 1C) and Graf shRNA2 (Graf2i) (Figure 1—figure supplement 2A)
were crossed to maternal-Gal4 lines to express the shRNA during oogenesis and embryogenesis. F1
females containing the Gal4 and shRNA gave embryos that were lethal at 24 hr (Grafi 94% were
lethal, n = 532 embryos, and Graf2i 98% were lethal, n = 540 embryos). Control and mutant embryos
were stained with fluorescently coupled phalloidin, which marks cortical F-actin (Figure 1C, D). Dur-
ing early stages of cellularization (furrow length 3–6 mm), the F-actin network at the basal part of fur-
row was organized as a polygonal array (white arrowheads, Figure 1C; He et al., 2016; Xue and
Sokac, 2016). The polygonal architecture transitioned to a circular shape on constriction at the fur-
row tip in mid cellularization (furrow length 6–16 mm) and constricted further in late cellularization
(furrow length 16–40 mm) (Figure 1B; Xue and Sokac, 2016). Grafi and Graf2i expressing embryos
did not show the polygonal F-actin organization in early stages (Figure 1C, Figure 1—figure supple-
ment 2A). In Grafi embryos, the furrow tips contained wavy edges with a loss of contact between
adjacent furrow tips (white arrowheads, Figure 1C). There was enhanced constriction in mid and late
stages of cellularization (Figure 1C). The nuclei had a bottleneck appearance in Grafi embryos possi-
bly due to premature constriction and squeezing of nuclei in mid cellularization (Figure 1D). Quanti-
fication of the area of the contractile rings showed a significant decrease in Grafi as compared to
controls in early, mid and late cellularization (Figure 1E).
In addition, loss-of-function mutants at the Graf locus were generated by the Crispr-Cas9 strat-
egy. The transgenic fly stock containing a guide RNA (gRNA) against exon 1 (at 2751 residue from
transcription start site) of Graf was crossed to maternally expressing Cas9 (nanos-Cas9) (Ren et al.,
2013; Zirin et al., 2020). A single gRNA against exon 1 of Graf was used to avoid perturbing
another putative gene CG8960 present in the intronic region of Graf in the reverse direction.
Embryos obtained from F1 females expressing the gRNA and Cas9 labeled with fluorescently cou-
pled phalloidin gave ring hyper constriction similar to Grafi and Graf2i (Figure 1—figure supplement
2A). 155 independent lines from this cross were propagated and screened for crosses that yielded
reduced progeny of putative homozygous mutant flies (Figure 1—figure supplement 2B, Materials
and methods). PCR amplification of exon 1 followed by DNA sequencing was carried out from
homozygous flies from 18 lines, which gave reduced progeny, and 3 lines that were similar to con-
trols. The 18 lines with reduced progeny numbers showed small insertions or deletions, leading to a
frameshift, thereby causing a premature stop codon in the Graf exon 1 region. The three fly lines
that served as healthy controls also showed small insertions or deletions but the coding frame was
intact (Figure 1—figure supplement 2C). The fly line CR57, named GrafCR57 henceforth, contained
a stop codon at the 27th amino acid and was chosen for further analysis (Figure 1A). GrafCR57/
GrafCR57 homozygous adult females gave embryos with 71% lethality at 24 hr (n = 336). Like the
Grafi expressing embryos, GrafCR57 embryos obtained from homozygous GrafCR57/GrafCR57 parents
did not show polygonal F-actin architecture in early cellularization. They showed premature ring for-
mation in early cellularization and enhanced ring constriction in mid and late cellularization (white
arrowheads, Figure 1C). Quantification of ring area of GrafCR57 embryos in cellularization showed a
Sharma and Rikhy. eLife 2021;10:e63535. DOI: https://doi.org/10.7554/eLife.63535 3 of 34
Research article Developmental Biology

Figure 1. GRAF depletion leads to hyper constriction of contractile rings during cellularization. (A) GRAF genomic locus is shown with UTR, introns and
exons. Grafi, GrafgRNA target the exon 1 region, and Graf2i targets the exon 10 region. GRAF protein (1025aa) contains a BAR, PH, RhoGAP and SH3
domain. GrafCR57 has a stop codon at amino acid 28 and is predicted to form a 27aa peptide. (B) Schematic depiction of cellularization in the
Drosophila embryo with plasma membrane (black), nuclei (gray) and contractile ring (red) organization at the base of the furrow. The base of the furrow
Figure 1 continued on next page
Sharma and Rikhy. eLife 2021;10:e63535. DOI: https://doi.org/10.7554/eLife.63535 4 of 34
Research article Developmental Biology

significant decrease in early, mid and late stages as compared to controls. The ring constriction
defects were enhanced in GrafCR57 as compared to Grafi embryos (Figure 1E). GrafCR57 embryos
also had bottleneck-shaped nuclei in cellularization (Figure 1D). Loss of polygonal F-actin organiza-
tion and premature ring constriction at the furrow tip is also seen in embryos depleted of Bottleneck,
a phospholipid-binding and actin-organizing protein, in cellularization (Krueger et al., 2019;
Reversi et al., 2014; Schejter and Wieschaus, 1993b). Taken together, GRAF-depleted embryos
showed premature and untimely constriction of the F-actin network at the furrow tip in cellulariza-
tion, thereby giving rise to bottleneck-shaped nuclei. GRAF function is therefore likely to be involved
in inhibiting ring constriction in cellularization (Figure 1B).
GRAF is enriched at the contractile ring during mid cellularization alongwith Myosin IIIn order to visualize the distribution of GRAF in Drosophila embryos during cellularization, we gener-
ated an antibody against full-length GRAF protein (see Materials and methods). Control embryos
were co-stained with GRAF and the polarity protein Dlg to mark lateral membranes. GRAF antibody
stained the furrow tip basal to Dlg throughout cellularization (yellow arrowhead, sagittal section,
Figure 2A). The grazing section across the furrow tip showed an enrichment of GRAF recruitment at
edges (white arrowhead, Figure 2A) and a reduction at vertices in early cellularization (yellow arrow-
head, Figure 2A). GRAF antibody staining increased at regions corresponding to tight edges in the
Dlg staining during mid cellularization and was occasionally absent from curved regions (yellow
arrowhead, Figure 2A). GRAF antibody staining was weakly present in rings in late cellularization
(Figure 2A, B). The GRAF staining was lost in 100% GrafCR57 embryos as compared to controls
(Figure 2A). Quantification of the cortex to cytosol fluorescence showed a significant reduction in
intensity as compared to controls (Figure 2C). Grafi expressing embryos showed a depletion in
GRAF antibody staining in 64% of the embryos, and the cortex to cytosol intensity was significantly
decreased as compared to controls (Figure 2—figure supplement 1A, B). The greater loss of GRAF
in GrafCR57 also correlated with more severe defects in ring constriction seen in GrafCR57 as com-
pared to Grafi (Figure 1E). GrafCR57 therefore led to a complete loss of function, and Grafi led to a
partial loss-of-function phenotype for Graf.
To visualize GRAF recruitment dynamics in cellularization in living embryos, we generated a C ter-
minally tagged GRAF-GFP in the UASp vector. We expressed the GRAF-GFP transgene with mater-
nal-Gal4 along with fluorescently labeled Myosin II light chain, Squash (Sqh), sqh; Sqh-mCherry (Sqh-
mCherry) (Videos 1 and 2). The GRAF-GFP and Sqh-mCherry fluorescence was visualized in cellulari-
zation, and relative intensities in a single optical plane were quantified with a line segment passing
through edges across adjacent furrow tips (yellow line, Figure 2D, E). GRAF-GFP was already pres-
ent at edges in early cellularization during the Myosin II assembly phase when Sqh-mCherry was
seen in foci. GRAF-GFP increased further along with Sqh-mCherry at the start of mid cellularization.
Figure 1 continued
where the contractile ring assembles is hexagonal at the early stage, circular at the mid stage and constricted at the late stage. GrafCR57 mutant
embryos show premature ring formation in the early stage and hyper constriction in mid and late stages with nuclei getting squeezed to show a
bottleneck phenotype. (C–E) GRAF depletion leads to hyper constricted contractile rings in cellularization. (C) Phalloidin (gray)-labeled furrow tip
sections show polygonal organization (white arrowhead) in control embryos, nanos-Gal4; Graf i shows circular organization, and GrafCR57 shows ring
constriction (white arrowhead) in the early cellularization. Control embryos show circular rings, and Graf i and Graf CR57 embryos show constricted rings
in mid cellularization. Control embryos show constricted rings, and Graf i and GrafCR57 embryos show hyper constricted rings in late cellularization (C).
Graf i, 95.7% (n = 70 embryos), and GrafCR57, 96.8% (n = 31 embryos), show enhanced constriction as compared to controls (n = 54 embryos) in different
stages of cellularization. (D) DNA labeled by Hoechst shows the bottleneck appearance during mid cellularization in Graf i (48.1% show bottleneck
nuclei, n = 27 embryos in different stages of cellularization) and GrafCR57 (52.94% show bottleneck nuclei, n = 34 embryos in different stages of
cellularization) (yellow line marks nuclei morphology). (E) Scatter plot shows area of the ring in the control, Graf i and Graf CR57 during early (3–6 mm
furrow length), mid (6–16 mm) and late (16–40 mm) stages of cellularization (n = 60 rings, 10 per embryo, 6 embryos each). Data is represented as
mean ± s.d. **p<0.01, ***p<0.001, two-tailed Mann–Whitney test. Scale bars: 5 mm.
The online version of this article includes the following source data and figure supplement(s) for figure 1:
Source data 1. Plotted values for ring area analysis.
Figure supplement 1. Phylogenetic tree of GRAF across various species.
Figure supplement 2. GRAF knockdown phenotypes and the Crispr-Cas9 strategy for generating a GRAF null mutant.
Sharma and Rikhy. eLife 2021;10:e63535. DOI: https://doi.org/10.7554/eLife.63535 5 of 34
Research article Developmental Biology
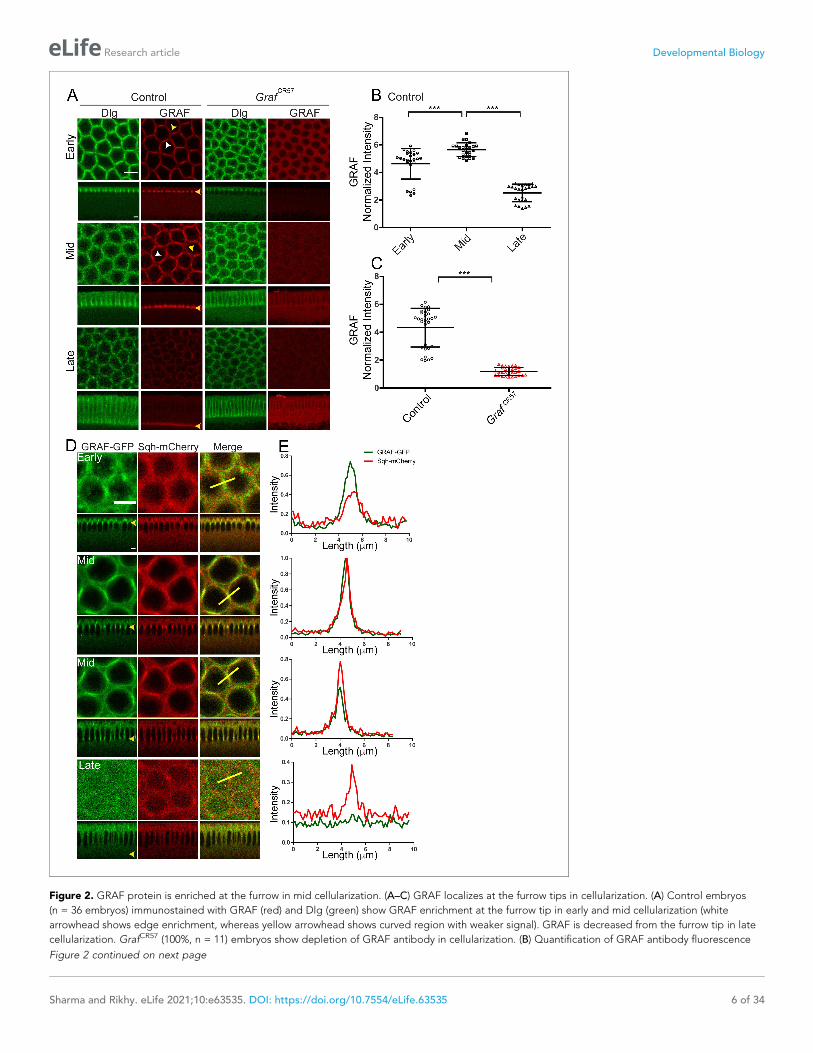
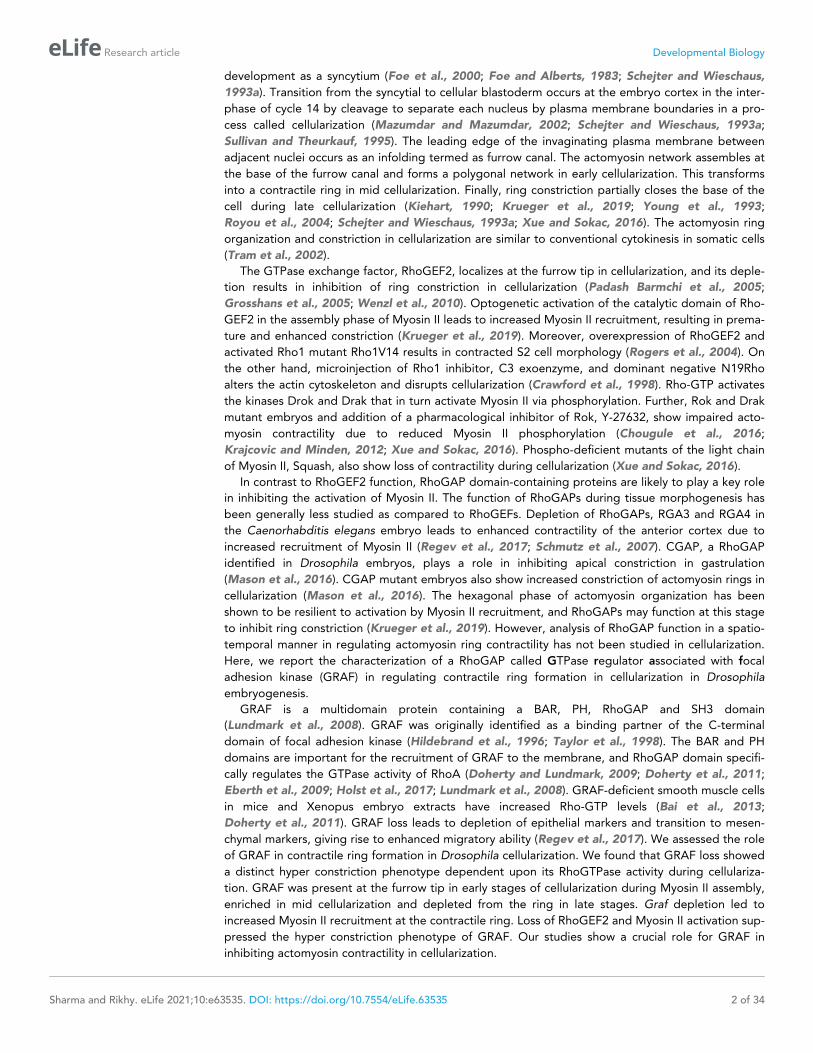
Figure 2. GRAF protein is enriched at the furrow in mid cellularization. (A–C) GRAF localizes at the furrow tips in cellularization. (A) Control embryos
(n = 36 embryos) immunostained with GRAF (red) and Dlg (green) show GRAF enrichment at the furrow tip in early and mid cellularization (white
arrowhead shows edge enrichment, whereas yellow arrowhead shows curved region with weaker signal). GRAF is decreased from the furrow tip in late
cellularization. GrafCR57 (100%, n = 11) embryos show depletion of GRAF antibody in cellularization. (B) Quantification of GRAF antibody fluorescence
Figure 2 continued on next page
Sharma and Rikhy. eLife 2021;10:e63535. DOI: https://doi.org/10.7554/eLife.63535 6 of 34
Research article Developmental Biology
GRAF-GFP was lost from the furrow in late cellularization when Sqh-mCherry was present in the con-
stricted ring (Figure 2D, E, Videos 1 and 2).
In summary, GRAF is present at edges in the furrow tip in early cellularization when Rho-GTP
along with Myosin II are beginning to assemble and are present in a polygon. Bottleneck, a develop-
mentally regulated protein present in the Drosophila blastoderm embryo, has been previously shown
to have a similar distribution with enrichment at
the furrow tip during the polygonal phase along
with a role in inhibition of constriction
(Schejter and Wieschaus, 1993a; Schejter and
Wieschaus, 1993b). The spatial and temporal
changes in distribution of GRAF correlate with
the dynamic restructuring of the actomyosin net-
work in cellularization.
GRAF depletion leads to enhancedcontractility of the basalactomyosin networkWe performed laser ablations to assess contrac-
tility of the basal actomyosin network in
GrafCR57. Sqh-mCherry was used to mark the fur-
row tip for laser ablations in controls and
GrafCR57. Laser ablations were performed in a
line cutting across contractile rings at the furrow
tip in early and mid stages of cellularization (yel-
low dashed line, Figure 3A, E, Video 3). The
ablation across the ring caused a break in the
actomyosin network and led to movement of the
ablated edges. The rate of displacement of
these ablated edges is dependent upon the ten-
sion in the actomyosin network. The rate of
movement and the final displacement of the
ablated edges at approximately 70 s
were calculated for controls and GrafCR57. We
found a significant increase in rate of displace-
ment of the edges of the contractile rings in
GrafCR57 embryos as compared to controls in
early and late stages (Figure 3B, F). GrafCR57
embryos showed an approximately fourfold
increase in maximum displacement at 70 s as
compared to controls in both early and mid cel-
lularization (Figure 3C, G). Similarly, initial recoil
velocities of the edges after ablations were
Figure 2 continued
intensity as cortex to cytosol ratio shows increased staining in mid cellularization as compared to early and late cellularization (n = 25 rings, 5 per
embryo, 5 embryos per stage, 25 embryos) (furrow length used for early = 4–6 mm, mid = 7–11 mm, late = 17–31 mm). (C) GrafCR57 (furrow length range:
3–24 mm) shows loss of GRAF antibody staining intensity compared to controls (furrow length range: 5–25 mm) (n = 30 rings, 5 per embryo, 6 embryos).
Data is represented as mean ± s.d. ***p<0.001, two-tailed Mann–Whitney test. (D, E) GRAF-GFP (D, green) colocalizes with Sqh-mCherry (D, red) in
early and mid cellularization, whereas GRAF-GFP is cytosolic in late cellularization. Yellow arrowhead in sagittal images shows furrow tip enrichment in
mid cellularization, whereas it reduces at the tip in late cellularization. These are representative images from one of n = 3 embryos. (E) The yellow bar
depicted in the merged image is used for quantification shown in the plots. Scale bars: 5 mm.
The online version of this article includes the following source data and figure supplement(s) for figure 2:
Source data 1. Plotted values for fluorescence intensity analysis.
Figure supplement 1. GRAF knockdown shows reduction in GRAF antibody staining in cellularization.
Figure supplement 1—source data 1. Plotted values for fluorescence intensity analysis.
Video 1. GRAF-GFP and Sqh-mCherry distribution
during ring constriction in cellularization. The video
shows living embryos expressing GRAF-GFP (green,
above) and Sqh-mCherry (red, below) during
cellularization. There is enrichment of GRAF-GFP and
Sqh-mCherry at the furrow in mid cellularization. GRAF-
GFP becomes cytoplasmic, and Sqh-mCherry remains
during late cellularization. Sum projections of five
stacks are shown at each time frame of the video. Scale
bar = 5 mm.
https://elifesciences.org/articles/63535#video1
Sharma and Rikhy. eLife 2021;10:e63535. DOI: https://doi.org/10.7554/eLife.63535 7 of 34
Research article Developmental Biology

increased by approximately twofold in GrafCR57
embryos in early and mid stages of cellulariza-
tion as compared to controls (Figure 3D, H).
This increased displacement and recoil velocity
of the ring edges suggest that the actomyosin
network in GrafCR57 has increased contractility.
The increased contractility in Graf mutants in
early and mid stages, along with the distinct
recruitment of GRAF in early and mid stages
(Figure 2), shows that GRAF plays a crucial role
in resisting Myosin II-dependent contractility dur-
ing early and mid stages of cellularization.
GRAF RhoGAP domain restrictscontractile ring constriction duringcellularizationSince GRAF has a RhoGAP domain, we assessed
the recruitment dynamics of Rho-GTP at the con-
tractile rings in the furrow tip in GrafCR57. Rho-
GTP was visualized by GFP-tagged Rho-GTP-
binding domain (RBD) of Anillin (AnillinRBD-GFP)
expressed under the control of ubiquitin pro-
moter (Mason et al., 2016; Munjal et al., 2015)
along with Sqh-mCherry. AnillinRBD-GFP was
present as foci that colocalized with Sqh-
mCherry in early cellularization during the
assembly of the actomyosin complex at the fur-
row tip. AnillinRBD-GFP was present along with
Sqh-mCherry at the contractile ring in mid and
late cellularization in images (Figure 4A,
Video 4). Line scans across the edges of adja-
cent rings in furrow tips were used from single
optical planes to estimate the fluorescence
intensity relative to the maximum seen in cellula-
rization in each fluorescent tag (yellow line,
Figure 4B). Anillin-RBD fluorescence increased from early to mid stages and decreased in late stages
of cellularization in control embryos (Figure 4B). Even though the fluorescence was reduced in late
stages, AnillinRBD-GFP was present at the furrow tip along with Sqh-mCherry (Figure 4A, B) when
GRAF-GFP was lost in late cellularization (Figure 2). AnillinRBD-GFP and Sqh-mCherry signal was
more spread during early and mid stages of cellularization in GrafCR57 embryos compared to sharp
colocalization peaks in control (Figure 4C, D, Video 4). This increase in Rho-GTP in early and mid
stages of cellularization correlated with hyper contractility in GrafCR57 embryos.
We further analyzed the role of the RhoGTPase domain of GRAF in regulating ring constriction
during cellularization. We generated a fluorescently tagged Graf transgene containing a deletion of
the Rho-GAP domain, UASp-GRAFDRhoGAP-GFP (Figure 4E). We expressed GRAFDRhoGAP-GFP
and GRAF-GFP maternally in the GrafCR57 mutant background to assess the effect of the Rho-GAP
deletion on actomyosin ring constriction in cellularization. Live imaging of embryos of the GrafCR57;
GRAF-GFP and GrafCR57; GRAFDRhoGAP-GFP genotypes was carried out with Sqh-mCherry
(Figure 4F). Similar to GRAF-GFP, GRAFDRhoGAP-GFP recruited to the furrow until mid cellulariza-
tion and was lost from the furrow in late cellularization similar to GRAF-GFP (Figure 4—figure sup-
plement 1A, B). However, GRAFDRhoGAP-GFP appeared in punctae in early cellularization, leading
to higher relative fluorescence as compared to GRAF-GFP in early cellularization (Figure 4—figure
supplement 1A, B). The ring area in GrafCR57 embryos was significantly lower than controls during
cellularization (Figure 4F, G). This hyper constriction phenotype in GrafCR57 was suppressed in
GrafCR57; GRAF-GFP embryos. GrafCR57; GRAFDRhoGAP-GFP embryos, on the other hand, showed
hyper constriction of rings similar to GrafCR57 (Figure 4F, G, Videos 5 and 6). Thus, the full-length
Video 2. GRAF-GFP and Sqh-mCherry distribution on
the furrow in sagittal sections. Sagittal sections were
extracted to show distribution of GRAF-GFP (green,
above) and Sqh-mCherry (red, below) during
cellularization. Note the loss of GRAF-GFP in late
cellularization, whereas Sqh-mCherry is still visible at
the furrow tip (white arrows at the 42.26 min time
point). GRAF-GFP also labels tube-like structures
beneath the furrow in early and mid cellularization.
Scale bar = 5 mm.
https://elifesciences.org/articles/63535#video2
Sharma and Rikhy. eLife 2021;10:e63535. DOI: https://doi.org/10.7554/eLife.63535 8 of 34
Research article Developmental Biology

Figure 3. Graf mutant embryos show hyper contractility during early and mid cellularization. Laser ablation was performed using line at the furrow tip
during early and mid cellularization. (A, E) Representative images show control and GrafCR57 mutant embryos with the region before, at 0 s (marked
with yellow dotted line) and 70 s after ablations (recoil region marked with yellow dotted line) in early and mid cellularization, respectively. (B, F)
Quantifications of ring displacement after laser ablation during early and mid phase (control:black line, n = 5 embryos; GrafCR57 mutant:red line, n = 5
embryos each). (C,D,G,H) Scatter plot showing maximum displacement (C, G) of ring and initial recoil velocity (D, H) after laser ablation during early
and mid phase (n = 5 embryos each). Data is represented as mean ± s.d.**p<0.01, ***p<0.001, two-tailed Mann–Whitney test.
The online version of this article includes the following source data for figure 3:
Source data 1. Plotted values for displacement and initial recoil velocity.
Sharma and Rikhy. eLife 2021;10:e63535. DOI: https://doi.org/10.7554/eLife.63535 9 of 34
Research article Developmental Biology

GRAF-GFP suppressed the constriction defect of
GrafCR57. The RhoGAP domain in GRAF protein
was necessary for restricting ring constriction dur-
ing cellularization.
GRAF overexpression leads todecrease in contractile ringconstriction during cellularizationOverexpression of GRAF was achieved by cross-
ing GrafEP09461 to mat-Gal4 (GRAF-OE). Gra-
fEP09461 contains a gypsy transposon tagged line
with a UASp element inserted in the 50UTR region
of GRAF in the same orientation of native gene
(Figure 5A). GRAF-OE embryos showed a signifi-
cant increase in GRAF antibody staining as com-
pared to controls (Figure 5B, C).
Graf depletion led to hyper constriction of
ring area in cellularization (Figure 4G). We fur-
ther assessed if GRAF overexpression led to inhi-
bition of ring constriction in cellularization.
GRAF-OE embryos were imaged live in cellulari-
zation with Sqh-mCherry (Video 7). We found
that the ring area was significantly larger in
GRAF-OE as compared to controls from early
stages of cellularization (Figure 5D, E). These data show that GRAF overexpression leads to inhibi-
tion of ring constriction during cellularization consistent with increased RhoGTPase activity.
GRAF depletion and overexpression leads to changes in Myosin IIdistribution at the contractile ring during cellularizationWe assessed the distribution of Myosin II heavy chain, Zipper, in control and GrafCR57 fixed embryos
in early, mid and late cellularization by immunostaining. We found that the Zipper fluorescence at
the furrow tip relative to the cytoplasm was significantly increased in GrafCR57 throughout cellulariza-
tion as compared to control embryos (Figure 6A, B). Zipper foci in GrafCR57 appeared larger than
controls in early cellularization, and Zipper was also enriched in between adjacent rings in mid cellu-
larization (white arrowheads, Figure 6A).
We also analyzed embryos containing depletion or overexpression of GRAF for Myosin II light
chain, Sqh-mCherry distribution and furrow extension dynamics from movies obtained from living
embryos. Since Sqh-mCherry marked the furrow tip, it was also used to estimate furrow lengths dur-
ing cellularization. The dynamics of furrow length increase in the slow and fast phase in GRAF-OE
were similar to controls during cellularization (Figure 6—figure supplement 1A; Figard et al.,
2013; He et al., 2016; Lecuit and Wieschaus, 2000; Merrill et al., 1988; Royou et al., 2004;
Warn and Magrath, 1983). In contrast, the slow phase in GrafCR57 was extended and the fast phase
started at a later time point (Figure 6—figure supplement 1A). The fluorescence at the ring in the
furrow tip was estimated per pixel as a ratio to maximum intensity across cellularization (Figure 6—
figure supplement 1B; see Materials and methods). The levels of Sqh-mCherry increased from early
to mid cellularization and then decreased during late cellularization in controls. GRAF-OE embryos
showed a delay in Sqh-mCherry peak as compared to controls (Figure 6—figure supplement 1B).
GrafCR57, on the other hand, showed a sustained Sqh-mCherry fluorescence throughout cellulariza-
tion, and it remained significantly higher at later stages of cellularization (Figure 6C, Figure 6—fig-
ure supplement 1B, Videos 5 and 7). GRAF-OE and control embryos showed a similar distribution
of Sqh-mCherry in foci in early cellularization followed by a more uniform distribution in mid cellulari-
zation. GRAF-OE did not affect the steps of transition of Myosin II assembly from foci to uniform dis-
tribution even though there was an overall delay in the peak of Sqh-mCherry fluorescence in
cellularization (yellow arrowheads, Figure 6C).
Video 3. GrafCR57 embryos show contractile ring recoil
upon ablations during cellularization. Live imaging of
Sqh-mCherry control (left) and GrafCR57 (right)
containing Sqh-mCherry (gray) subjected to laser
ablations (time = 0 s) at the regions marked in a yellow
line during early (above) and mid (below)
cellularization. GrafCR57 shows higher ring recoil as
compared to controls. Scale bar = 5 mm.
https://elifesciences.org/articles/63535#video3
Sharma and Rikhy. eLife 2021;10:e63535. DOI: https://doi.org/10.7554/eLife.63535 10 of 34
Research article Developmental Biology

Figure 4. RhoGAP domain of GRAF is essential for ring constriction in cellularization. (A–D) AnillinRBD-GFP (A, C, green) colocalizes with Sqh-mCherry
(red) in early, mid and late cellularization in controls. In GrafCR57; AnillinRBD-GFP, the signal is more spread as compared to in between adjacent rings.
Representative images from one of n = 3 embryos of controls and GrafCR57 are shown. (B, D) A yellow bar depicted in the Sqh-mCherry image is used
for the estimation of the intensity line profile. (E) Schematic showing full-length GRAF protein with GFP and GRAFDRhoGAP-GFP proteins. (F) GrafCR57
Figure 4 continued on next page
Sharma and Rikhy. eLife 2021;10:e63535. DOI: https://doi.org/10.7554/eLife.63535 11 of 34
Research article Developmental Biology

GrafCR57 showed Sqh-mCherry in foci that were somewhat more spread as compared to controls
in early cellularization. GrafCR57 showed enhanced Sqh-mCherry fluorescence in between adjacent
rings in mid cellularization (yellow arrowheads, Figure 6C). GrafCR57 embryos contained a sustained
presence of Sqh-mCherry in rings in late cellularization (yellow region in the graph in Figure 6—fig-
ure supplement 1B). The Sqh-mCherry intensity per pixel was further estimated from rings relative
to the inter ring region from five time points in the yellow region (Figure 6—figure supplement 1B)
in GRAF-OE, GrafCR57, GrafCR57; GRAFDRhoGAP-GFP and GrafCR57; GRAF-GFP as a readout of
change in Myosin II recruitment (Figure 6D). The Sqh-mCherry intensity was indeed increased in
GrafCR57 and GrafCR57; GRAFDRhoGAP-GFP and reduced in GRAF-OE (Figure 6D). The phenotype
of increased Sqh-mCherry in GrafCR57 embryos was suppressed in GrafCR57; GRAF-GFP (Figure 6D).
Increased Zipper and Sqh-mCherry levels at the furrow on Graf depletion and decreased Sqh-
mCherry levels on GRAF-OE during cellularization showed that Myosin II recruitment at the furrow
tip is inhibited by GRAF, and this was dependent upon its RhoGAP domain.
GRAF overexpression-driven decrease in contractile ring constriction issuppressed by overexpression of RhoGEF2The RhoGTPase domain of GRAF was essential for regulating ring constriction during cellularization.
GRAF overexpression showed loss of constriction and delayed enrichment of Myosin II. GRAF over-
expression is therefore likely to decrease Rho-
GTP and phenocopy loss of RhoGEF2. Optoge-
netic activation of RhoGEF2 leads to increased
constriction in the assembly phase in cellulariza-
tion (Krueger et al., 2019) and phenocopies the
GrafCR57 mutant (Figures 1 and 3). Our previous
analysis has shown that RhoGEF2-OE leads to
increase in Myosin II at the cortex in syncytial
division cycle (Dey and Rikhy, 2020). We over-
expressed RhoGEF2 maternally in embryos and
imaged them live with Sqh-mCherry in cellulari-
zation. We found that similar to GrafCR57 overex-
pression of RhoGEF2 (RhoGEF2-OE) caused ring
hyper constriction as compared to controls in
cellularization (Figure 7A, C). Sqh-mCherry was
found in foci that were more spread in Rho-
GEF2-OE embryos as compared to controls and
similar to GrafCR57 mutant embryos (white arrow,
Figure 6C and Figure 7A).
Since relative levels of GAP and GEF are likely
to regulate the rate of contractility
(Mason et al., 2016) and overexpression of Rho-
GEF2 and GRAF will have opposing effects on
levels of Rho-GTP, we tested if phenotypes of
RhoGEF2 overexpression could be inhibited by
Figure 4 continued
and GrafCR57;GRAFDRhoGAP-GFP embryos expressing Sqh-mCherry show hyper constriction compared to controls and Graf CR57; GRAF-GFP (yellow
arrowhead highlights furrow tip at all stages). (G) Quantification shows a significantly lower ring area for Graf CR57, Graf CR57;GRAFDRhoGAP-GFP as
compared to controls and Graf CR57; GRAF-GFP expressing Sqh-mCherry (n = 15 rings, 5 rings per embryo, 3 embryos). Data is represented as
mean ± s.d. ***p<0.001, one-way ANOVA, repeated measure with Dunnett’s multiple comparison test, the Graf CR57 and GrafCR57;GRAFDRhoGAP-GFP
mutant curves are statistically different when compared to the controls and GrafCR57;GRAF-GFP. Scale bars: 5 mm.
The online version of this article includes the following source data and figure supplement(s) for figure 4:
Source data 1. Plotted values for fluorescence intensity and ring area analysis.
Figure supplement 1. GrafCR57;GRAFDRhoGAP-GFP recruitment dynamics.
Figure supplement 1—source data 1. Plotted values for fluorescence intensity analysis.
Video 4. GrafCR57 embryos show enrichment of
AnillinRBD-GFP and Sqh-mCherry distribution during
ring constriction in cellularization. The video shows
colocalization of AnillinRBD-GFP (green, above, left)
and Sqh-mCherry (red, below, left) throughout
cellularization. GrafCR57 embryos show enrichment of
AnillinRBD-GFP (above, right) and Sqh-mCherry (below,
right) between neighboring rings from mid
cellularization to late cellularization. Sum projections of
five stacks at the furrow tip are used to show each time
frame in the video. Scale bar = 5 mm.
https://elifesciences.org/articles/63535#video4
Sharma and Rikhy. eLife 2021;10:e63535. DOI: https://doi.org/10.7554/eLife.63535 12 of 34
Research article Developmental Biology

GRAF overexpression. We found that the ring
constriction dynamics in GRAF-OE; RhoGEF2-OE
were similar to controls (Figure 7A, C). GRAF
was recruited to contractile rings in RhoGEF-OE embryos in cellularization (Figure 7—figure supple-
ment 1A). However, RhoGEF2-OE embryos showed a decrease in furrow length in cellularization
and the rate of furrow extension was lower than controls (Figure 7—figure supplement 1B). Late-
stage embryos with shorter furrow length as compared controls also showed the presence of GRAF
at the furrow tip (Figure 7—figure supplement 1A). This implied that the phenotype of enhanced
constriction in RhoGEF2-OE was not due to the removal of GRAF. The phenotypes of hyper constric-
tion in RhoGEF2-OE and ring inhibition in GRAF-OE were suppressed in GRAF-OE; RhoGEF2-OE
embryos (Figure 7A, C; Video 8). This suppression was also seen in fixed GRAF-OE; RhoGEF2-OE
embryos stained with phalloidin (Figure 7B). RhoGEF2-OE embryos showed an increase in Sqh-
mCherry at the ring relative to the inter ring in late cellularization as compared to controls. This
increase was suppressed in GRAF-OE; RhoGEF2-OE combination (Figure 7D). It is possible that the
increase in Rho-GTP-Rho-GDP cycling in GRAF-OE; RhoGEF2-OE embryos leads to Rho-GTP levels
similar to controls, thereby restoring the rate of constriction.
GRAF depletion-induced contractile ring hyper constriction incellularization is suppressed by additional depletion of RhoGEF2RhoGEF2 depletion inhibits ring constriction during cellularization by decreasing the levels of Rho-
GTP (Padash Barmchi et al., 2005; Grosshans et al., 2005; Wenzl et al., 2010). We depleted
Video 5. GrafCR57 embryos expressing Sqh-mCherry
show increased ring constriction during cellularization.
Live imaging of Sqh-mCherry control (above) and
GrafCR57 (below) containing Sqh-mCherry (gray) at the
furrow during cellularization. GrafCR57 shows enhanced
constriction as compared to controls. Sum projections
of five stacks at the furrow tip are shown at each time
frame of the video. Scale bar = 5 mm.
https://elifesciences.org/articles/63535#video5
Video 6. GrafCR57; GRAFDRhoGAP-GFP embryos
expressing Sqh-mCherry show enhanced ring
constriction during cellularization. Live embryos
expressing GrafCR57; GRAFDRhoGAP-GFP (green,
above) and Sqh-mCherry (red, below) are shown during
cellularization. GrafCR57; GRAFDRhoGAP-GFP shows
enhanced constricted ring compared to controls
(Video 1). Sum projections of five stacks at the furrow
tip are shown at each time frame of the video. Scale
bar = 5 mm.
https://elifesciences.org/articles/63535#video6
Sharma and Rikhy. eLife 2021;10:e63535. DOI: https://doi.org/10.7554/eLife.63535 13 of 34
Research article Developmental Biology

Figure 5. GRAF overexpression shows inhibition of ring constriction in cellularization. (A–C) Schematic (A) shows Graf gene and the Graf
overexpression line, GrafEP09461 containing a P-element (with a UAS site) insertion in 50UTR in an orientation to drive the downstream Graf gene. (B)
GRAF-OE crossed to mat-Gal4 shows an increase in GRAF (100%, n = 19) when stained with GRAF (red) and Dlg (green) (control n = 24 embryos). (C)
Quantification shows an increased GRAF antibody fluorescence in GRAF-OE (furrow length range: 7–19 mm) embryos compared to controls (furrow
Figure 5 continued on next page
Sharma and Rikhy. eLife 2021;10:e63535. DOI: https://doi.org/10.7554/eLife.63535 14 of 34
Research article Developmental Biology

RhoGEF2 by driving maternal expression of RNAi against RhoGEF2 (RhoGEF2i) and visualized furrow
length and ring dynamics with Sqh-mCherry in cellularization (Kerridge et al., 2016; Sherlekar and
Rikhy, 2016). Sqh-mCherry and Zipper were found to be reduced at the furrow in syncytial division
cycles in RhoGEF2i expressing embryos (Dey and Rikhy, 2020). RhoGEF2i expressing embryos
showed polygonal furrow tip organization in mid cellularization (Figure 8A, B, Video 9), and this
phenotype was similar to GRAF overexpression (Figure 7A, B). Immunostaining of RhoGEF2i
embryos with GRAF and Dlg antibodies showed that GRAF recruitment occurred at the furrow in
early and mid stages of cellularization and was lost in the late stage similar to controls (Figure 8—
figure supplement 1B). GRAF recruitment therefore did not depend upon RhoGEF2 in cellulariza-
tion. The furrow extension dynamics in RhoGEF2-depleted embryos were similar to controls with the
slow and fast phase of cellularization occurring at the same rate (Figure 7—figure supplement 1B).
As seen previously for RhoGEF2 mutants, RhoGEF2i expressing embryos showed loss of constriction
in cellularization (Figure 8A; Padash Barmchi
et al., 2005; Wenzl et al., 2010). Sqh-mCherry
fluorescence appeared diffuse at the furrow tip
and was present in a polygonal shape in cellulari-
zation in RhoGEF2i expressing embryos. The
GrafCR57; RhoGEF2i combination, on the other
hand, showed recruitment of Sqh-mCherry and
ring constriction similar to control embryos in
early and mid cellularization
(Figure 8A, C, Video 9). GrafCR57; RhoGEF2i
also rescued the hyper constriction defect of
GrafCR57 in late cellularization (35–45 min,
Figure 8C) even though this was not reversed
similar to controls. RhoGEF2i embryos showed
reduced Sqh-mCherry fluorescence in the ring
relative to the inter ring region as compared to
controls in late cellularization. GrafCR57; Rho-
GEF2i embryos showed a decrease in Sqh-
mCherry levels as compared to GrafCR57 even
though it remained higher than controls
(Figure 8D). This increased Sqh-mCherry level
also correlated with increased area in late stages
(Figure 8C). This suppression of hyper constric-
tion of GrafCR57 and lack of constriction in Rho-
GEF2i was seen in fixed Grafi; RhoGEF2i
embryos in cellularization with phalloidin staining
(Figure 8B). The suppression is likely to occur
due to the presence of Rho-GTP levels that give
constriction at the same rate as control embryos.
This suggested that Rho-GTP was indeed pres-
ent in RhoGEF2-depleted embryos. It is also pos-
sible that RhoGEF2 inhibition was incomplete in
RhoGEF2i embryos or another RhoGEF function
took over constriction in the absence of
RhoGEF2.
Figure 5 continued
length range: 7–20 mm) (n = 25 rings, 5 per embryo, 5 embryos each). (D) Sqh-mCherry images and (E) area quantification show a significantly higher
ring area in GRAF-OE as compared to controls (yellow arrowhead marks the furrow tip) (n = 15 rings, 5 per embryo, 3 embryos)(control values were
repeated from Figure 3 for comparison). Data is represented as mean ± s.d. **p<0.01, ***p<0.001, two-tailed Mann–Whitney test. Scale bars: 5 mm.
The online version of this article includes the following source data for figure 5:
Source data 1. Plotted values for fluorescence intensity and ring area analysis.
Video 7. GRAF-OE embryos expressing Sqh-mCherry
show inhibition of ring constriction during
cellularization. Live imaging of Sqh-mCherry control
(above) and Graf-OE (below) embryo expressing Sqh-
mCherry (gray) at the furrow is shown. Graf-OE leads to
inhibition of ring constriction when compared to
controls. Sum projections of five stacks at the furrow tip
are shown at each time frame of the video. Scale
bar = 5 mm.
https://elifesciences.org/articles/63535#video7
Sharma and Rikhy. eLife 2021;10:e63535. DOI: https://doi.org/10.7554/eLife.63535 15 of 34
Research article Developmental Biology

Figure 6. Graf-depleted embryos show increased Myosin II in cellularization, whereas GRAF overexpression shows reduced Myosin II. (A–D) Fixed
images (A) of control and GrafCR57 embryos (100%, n = 31 embryos) stained with Dlg (green) and Zipper (red) showing higher Zipper intensity in early
(white arrowhead shows Zipper foci), mid (white arrowhead shows Zipper enrichment in control and spreading in GrafCR57 mutant) and late
cellularization (control n = 16 embryos). (B) Cortex to cytosol ratio of Zipper antibody fluorescence shows a significant increase in GrafCR57 as compared
Figure 6 continued on next page
Sharma and Rikhy. eLife 2021;10:e63535. DOI: https://doi.org/10.7554/eLife.63535 16 of 34
Research article Developmental Biology

GRAF depletion-induced contractile ring hyper constriction incellularization is lost by additional depletion of ROKMyosin II levels were increased at the furrow tip in GrafCR57 mutant embryos (Figure 5). Rho kinase
(dRok) activates Myosin II by phosphorylation in a Rho-GTP-dependent manner (Chougule et al.,
2016; Xue and Sokac, 2016). In order to test if activated Myosin II was responsible for hyper con-
striction, we depleted Rho kinase in GrafCR57 embryos. Rho kinase was depleted by maternal expres-
sion of RNAi against Rok (roki) (Dey and Rikhy, 2020; Zhang et al., 2018) in control and GrafCR57
embryos expressing Sqh-mCherry. As expected, roki expressing embryos showed diffuse distribution
of Sqh-mCherry, loss of ring constriction and significantly larger ring area as compared to control
embryos throughout cellularization (Figure 9A, B, Video 10). roki expression in the background of
GrafCR57 led to decrease in Sqh-mCherry recruitment and suppression of the constriction phenotype
seen in GrafCR57 embryos (Figure 9A, B, Video 10). Rho-GTP was likely to be unaffected in roki
mutant embryos. Due to the absence of active Myosin II in the GrafCR57; roki, these embryos showed
a significantly higher ring area as compared to controls (Figure 9A, B). The Sqh-mCherry intensity in
the ring compared to the inter ring in both roki and GrafCR57; roki was decreased as compared to
controls (Figure 9C).
Rho kinase also phosphorylates and deactivates Myosin II phosphatase (Amano et al., 2010;
Kimura et al., 1996; Mizuno et al., 1999). Myosin II deactivation is defective in the mutants of Myo-
sin II binding subunit (MBS) of Myosin II phosphatase (Mizuno et al., 2002; Tan et al., 2003). We
expressed RNAi against MBS (mbsi) (Dey and Rikhy, 2020; Zhang et al., 2018) maternally and
stained embryos with fluorescently labeled phalloidin. As expected, mbsi expression showed hyper
constriction of the ring throughout cellularization. This hyper constriction phenotype in mbsi
embryos was suppressed by GRAF overexpression in maternally driven GRAF-OE embryos (Fig-
ure 9—figure supplement 1).
The suppression of Graf mutant phenotype of hyper constriction with Rok depletion shows that
Myosin II activation is a necessary step to execute the ring constriction in cellularization (Figure 9D).
In summary, our findings show that GRAF regulates the rate of contractile ring constriction by fine-
tuning Rho-GTP levels at the furrow tip during mid cellularization.
DiscussionIn this study, we show that the function of the RhoGTPase domain containing protein GRAF is imper-
ative in causing a delay in the onset of contraction during cellularization to ensure appropriate clo-
sure of cells at the base of nuclei after membrane extension. The spatial pattern of GRAF
recruitment varies with the dynamics of the actomyosin network. GRAF localizes precisely to the fur-
row tip in early cellularization, increases in mid cellularization and finally becomes cytoplasmic at late
stages (Figure 9D). Graf null mutant embryos show premature constriction in early cellularization
and hyper constriction in mid and late stages. Depletion of Graf increases contractility and Myosin II
levels, thereby leading to detachment of adjacent contractile units (Figure 9D). Graf loss leads to
the tendency of the actomyosin network to attain a ring-like architecture prematurely and constric-
tion is no longer restricted. The RhoGTPase domain deletion phenocopies the hyper constriction
phenotype seen in Graf null mutant embryos. The spatial and temporal pattern of GRAF recruitment
at the cleavage furrow along with its enzymatic activity make it a key protein in maintaining adhesion
Figure 6 continued
to controls (n = 30 rings, 10 per embryo, 3 embryos each). (C) Control, GRAF-OE and GrafCR57 embryos expressing Sqh-mCherry (gray) are shown in
early (yellow arrowhead marks Sqh-mCherry foci), mid (yellow arrowhead marks Sqh-mCherry enrichment) and late cellularization (yellow arrowhead in
sagittal sections marks the furrow tip). (D) Quantification of Sqh-mCherry in late cellularization (yellow region marked in Figure 6—figure supplement
1B) in GRAF-OE shows reduction in intensity, whereas Graf CR57 and Graf CR57;GRAFDRhoGAP-GFP shows higher intensity as compared to controls.
Graf CR57; GRAF-GFP shows a rescue in Sqh-mCherry as compared Graf CR57 (n = 75 rings, 5 rings per time point, 5 time points, 3 embryos each). Data
is represented as mean ± s.d. *p<0.05, **p<0.01, ***p<0.001, two-tailed Mann–Whitney test. Scale bars: 5 mm.
The online version of this article includes the following source data and figure supplement(s) for figure 6:
Source data 1. Plotted values for fluorescence intensity analysis.
Figure supplement 1. Sqh-mCherry recruitment and furrow length analysis in GrafCR57 and GRAF-OE.
Figure supplement 1—source data 1. Plotted values for furrow length and fluorescence intensity analysis.
Sharma and Rikhy. eLife 2021;10:e63535. DOI: https://doi.org/10.7554/eLife.63535 17 of 34
Research article Developmental Biology

Figure 7. GRAF overexpression-driven loss of ring constriction is suppressed by RhoGEF2 overexpression in cellularization. (A–B) (A) The increased
constriction seen in RhoGEF2-OE embryos is suppressed in GRAF-OE similar to controls when imaged live with Sqh-mCherry (gray) (yellow arrowhead
marks furrow tip in sagittal sections, white arrowhead marks Sqh-mCherry foci in RhoGEF2-OE) and (B) when stained with phalloidin (B, GRAF-OE 100%
shows loss of constriction, n = 50 embryos, RhoGEF2-OE 96.15% shows enhanced constriction, n = 52 embryos, GRAF-OE; RhoGEF2-OE 57.69% shows
Figure 7 continued on next page
Sharma and Rikhy. eLife 2021;10:e63535. DOI: https://doi.org/10.7554/eLife.63535 18 of 34
Research article Developmental Biology

and inhibiting the contraction process in cellularization. Here, we discuss (1) the function of GRAF in
spatiotemporal regulation of rate of constriction during cellularization, (2) coregulation of actomyo-
sin assembly by actin remodeling or endocytic proteins along with GRAF and (3) redundancy of Rho-
GAPs in morphogenesis in cellularization and
gastrulation.
Spatiotemporal recruitment ofGRAF regulates the rate ofconstriction in cellularizationGRAF is present uniformly at the furrow tip when
Myosin II is beginning to assemble in early
stages of cellularization and a complete overlap
between GRAF and Myosin II occurs during mid
cellularization. Rho-GTP and Myosin II are pres-
ent at the furrow tip in late cellularization,
whereas GRAF is lost from the furrow tip in late
stages. Constriction of the cleavage furrow in
cellularization occurs in successive steps by the
action of Myosin II and F-actin polymerization
(Xue and Sokac, 2016). Myosin II assembles and
forms a polygonal network in early cellulariza-
tion. This polygonal network is resilient to con-
striction on activation of Myosin II, and
RhoGTPase activities are predicted to be impor-
tant at this step in restricting ring constriction
(Krueger et al., 2019). Myosin II recruits during
its assembly in phase I and initiates constriction
at the ring in phase II in cellularization
(Krueger et al., 2019; Xue and Sokac, 2016).
The F-actin-severing protein, Cofilin, F-actin
crosslinker fimbrin and F-actin-stabilizing pro-
teins Anillin and septin, Peanut, affect ring con-
striction to a greater extent as compared to
Myosin II in late cellularization (Krueger et al.,
2019; Mavrakis et al., 2014; Xue and Sokac,
2016). The spatial recruitment of GRAF in early
and mid cellularization at the furrow allows for
its RhoGTPase activity to control levels of Rho-
GTP in these stages. Sustained Rho-GTP levels
due to absence of Rho-GTP hydrolysis in Graf
Figure 7 continued
constriction comparable to controls, n = 52 embryos). (C) Quantification of contractile ring area from Sqh-mCherry shows decreased area in RhoGEF2-
OE, increased area in GRAF-OE and normal area in GRAF-OE; RhoGEF2-OE as compared to controls (n = 15 rings, 5 rings per embryo, 3 embryos)
(control values were repeated from Figure 3 and GRAF-OE values were repeated from Figure 4 for comparison). Data is represented as mean ± s.d.
***p<0.001, one-way ANOVA, repeated measure with Dunnett’s multiple comparison test, the GRAF-OE, RhoGEF2-OE is statistically different from
controls and GRAF-OE; RhoGEF2-OE. (D) Quantification of Sqh-mCherry in late cellularization in RhoGEF2-OE shows increased intensity as compared
to controls, and GRAF-OE; RhoGEF2-OE shows Sqh-mCherry intensity a reduced intensity as compared to RhoGEF2-OE and is similar to controls
(control and GRAF-OE values were repeated from Figure 6 for comparison) (n = 75 rings, 5 rings per time point, 5 time points, 3 embryos each). Data is
represented as mean ± s.d. ns: non-significant. ***p<0.001, two-tailed Mann–Whitney test. Scale bars: 5 mm.
The online version of this article includes the following source data and figure supplement(s) for figure 7:
Source data 1. Plotted values for ring area and fluorescence intensity analysis.
Figure supplement 1. RhoGEF2 overexpression retains GRAF recruitment and membrane furrow length analysis of RhoGEF2 depletion andoverexpression.
Figure supplement 1—source data 1. Plotted values for furrow length analysis.
Video 8. The hyper constricted ring phenotype in
RhoGEF2-OE expressing embryos is suppressed in
GRAF-OE; RhoGEF2-OE. Constriction at the furrow was
imaged during cellularization in RhoGEF2-OE (above)
and GRAF-OE; RhoGEF2-OE (below) containing Sqh-
mCherry (gray). RhoGEF2-OE shows hyper constriction
in late cellularization, which is suppressed in the GRAF-
OE;RhoGEF2-OE combination. Sum projections of five
stacks at the furrow tip are shown at each time frame of
the video. Scale bar = 5 mm.
https://elifesciences.org/articles/63535#video8
Sharma and Rikhy. eLife 2021;10:e63535. DOI: https://doi.org/10.7554/eLife.63535 19 of 34
Research article Developmental Biology
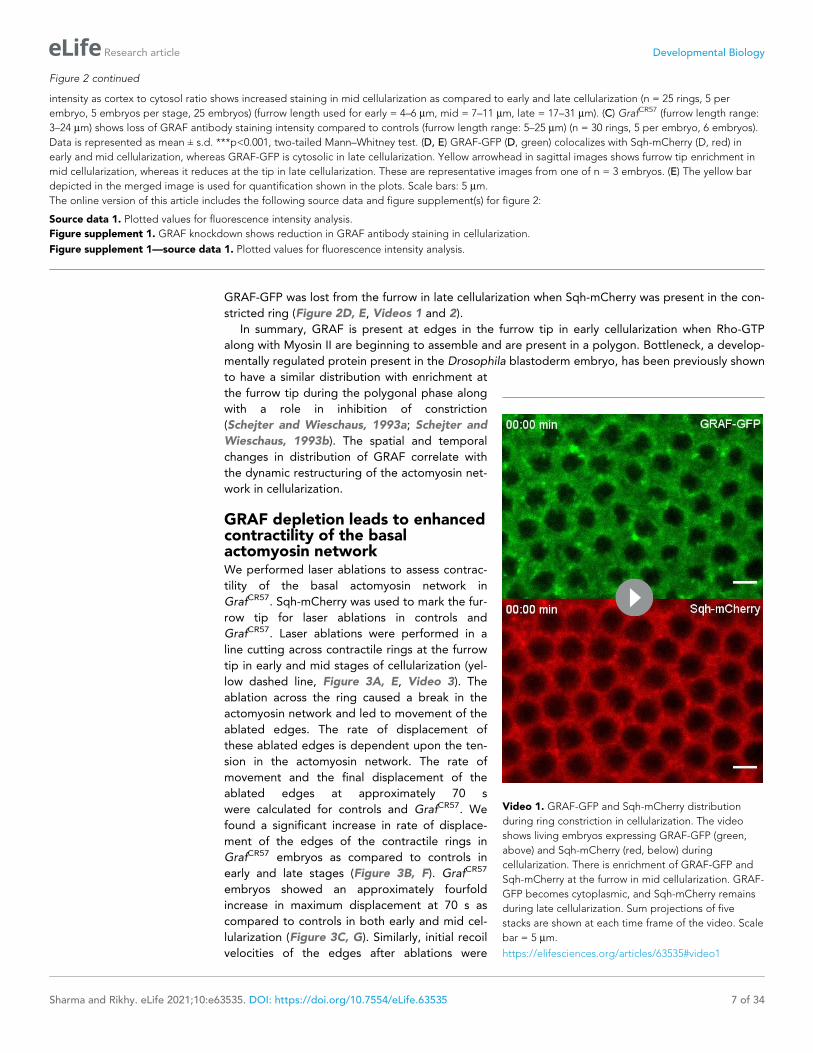
Figure 8. GrafCR57 hyper constriction phenotype is suppressed by RhoGEF2 depletion. (A–B) GrafCR57 (A) shows hyper constriction, RhoGEF2i shows
loss of constriction and GrafCR57; RhoGEF2i combination shows ring sizes comparable to control embryos when imaged live with Sqh-mCherry (gray)
(yellow arrowhead denotes furrow tip). (B) Grafi shows hyper constriction, RhoGEF2i shows loss of constriction and Grafi; RhoGEF2i combination shows
ring sizes comparable to control embryos when stained with fluorescent phalloidin (B, Grafi 95.71% shows enhanced ring constriction, n = 70,
Figure 8 continued on next page
Sharma and Rikhy. eLife 2021;10:e63535. DOI: https://doi.org/10.7554/eLife.63535 20 of 34
Research article Developmental Biology

mutant embryos lead to increased Myosin II recruitment and, along with the F-actin remodeling
activities of Anillin and Peanut, results in enhanced ring constriction in cellularization. Taken
together, our study shows that spatiotemporal recruitment of GRAF to the contractile ring is
required for fine-tuning of Rho activity for regulated constriction during cellularization.
Role of actin regulatory andendocytic proteins in restriction ofcontractility in cellularizationWhereas Anillin and Peanut lead to constriction
of the contractile ring in cellularization, Cheerio
and Bottleneck are actin crosslinkers that inhibit
contractility similar to GRAF. Bottleneck and
Cheerio organize a basal polygonal non-contrac-
tile actin network in mid cellularization
(Krueger et al., 2019; Reversi et al., 2014;
Schejter and Wieschaus, 1993b; Thomas and
Wieschaus, 2004). GRAF localization to this net-
work plays a crucial role in limiting actomyosin
contractility via its RhoGTPase activity. This is
consistent with the previously characterized
localization of GRAF on actin stress fibers and
focal adhesions in mammalian cells
(Taylor et al., 1999; Taylor et al., 1998). It is
possible that Bottleneck and Cheerio mutants
regulate actin polymerization downstream of
Rho activation in cellularization. Bottleneck has
also been shown to bind preferentially to phos-
phatidylinositol 3,4,5 trisphosphate (PIP3). It is
interesting to note that an increase in phosphati-
dylinositol 4,5 bisphosphate (PIP2) causes hyper
constriction during cellularization (Reversi et al.,
2014). The PH and BAR domains of GRAF inter-
act strongly with PIP2-containing liposomes
(Lundmark et al., 2008). It is therefore possible
that GRAF depletion leads to stabilization of
PIP2 and loss of Bottleneck at furrow tips. Future
studies on the analysis of Rho-GTP levels in Bot-
tleneck and Cheerio mutants along with recruit-
ment of Bottleneck and Cheerio in Graf mutants
will reveal their interaction during actomyosin
network stabilization in cellularization.
Figure 8 continued
RhoGEF2i 78.5% shows loss of constriction, n = 14, Grafi; RhoGEF2i 57.14%, rings comparable to controls, n = 21). (C) Quantification of contractile ring
area from Sqh-mCherry expressing embryos shows decreased area in GrafCR57, increased area in RhoGEF2i and rescued area in GrafCR57; RhoGEF2i
(n = 15 rings, 5 rings per embryo, 3 embryos) (control values were repeated from Figure 3 and GrafCR57 values were repeated from Figure 3 for
comparison). Data is represented as mean ± s.d. ***p<0.001, one-way ANOVA, repeated measure with Dunnett’s multiple comparison test, the GrafCR57
and RhoGEF2i statistically different from controls and GrafCR57; RhoGEF2i. (D) Sqh-mCherry intensity in late cellularization in RhoGEF2i is decreased as
compared to controls. GrafCR57; RhoGEF2i shows a decrease in Sqh-mCherry intensity as compared to Graf CR57 and rescue in comparison with
RhoGEF2i (control and GrafCR57 values were repeated from Figure 6 for comparison) (n = 75 rings, 5 rings per time point, 5 time points, 3 embryos
each). Data is represented as mean ± s.d. ***p<0.001, two-tailed Mann–Whitney test. Scale bars: 5 mm.
The online version of this article includes the following source data and figure supplement(s) for figure 8:
Source data 1. Plotted values for ring area and fluorescence intensity analysis.
Figure supplement 1. RhoGEF2 depletion retains GRAF recruitment.
Video 9. Inhibition of ring constriction in RhoGEF2i
expressing embryos is suppressed in GrafCR57;
RhoGEF2i. Constriction at the furrow was imaged
during cellularization in RhoGEF2i (above) and GrafCR57;
RhoGEF2i (below) embryos expressing Sqh-mCherry
(gray). RhoGEF2i knockdown embryos showed
inhibition of ring constriction, and this phenotype is
suppressed by GrafCR57; RhoGEF2i. Sum projections of
five stacks at the furrow tip are shown at each time
frame of the video. Scale bar = 5 mm.
https://elifesciences.org/articles/63535#video9
Sharma and Rikhy. eLife 2021;10:e63535. DOI: https://doi.org/10.7554/eLife.63535 21 of 34
Research article Developmental Biology

Figure 9. The hyper constriction phenotype of GrafCR57 embryos is suppressed by additional depletion of Rok. (A) GrafCR57 shows hyper constricted
contractile rings, roki shows loss of ring constriction and the GrafCR57; roki combination suppression of the hyper constriction phenotype seen in
GrafCR57 when imaged live with Sqh-mCherry (gray) (yellow arrowhead denotes furrow tip). (B) Quantification of contractile ring area from Sqh-mCherry
embryos shows decreased area in GrafCR57, increased area in roki and increased area in GrafCR57;roki compared to controls (n = 15 rings, 5 per embryo,
Figure 9 continued on next page
Sharma and Rikhy. eLife 2021;10:e63535. DOI: https://doi.org/10.7554/eLife.63535 22 of 34
Research article Developmental Biology
GRAF functions in clathrin-independent endocytosis of the EGFR receptor in hematopoiesis in
Drosophila (Kim et al., 2017). The small GTPase Arf1 recruits the human homologue of GRAF, Arh-
GAP10, in clathrin-independent endocytosis of
GPI-anchored proteins (Kumari and Mayor,
2008). Interestingly depletion of Drosophila Arf-
GEF, steppke, leads to decreased endocytosis at
the furrow and enhanced Rho1-induced hyper
constriction in cellularization (Lee and Harris,
2013). Even though GRAF has been found to
play a role in endocytosis in other systems,
GRAF did not show vesicular staining during cel-
lularization in our study. However, GRAF and
ArfGEF may work either in similar or parallel
pathways to regulate endocytosis at the cleav-
age furrow and in turn inhibit Rho1 activity dur-
ing constriction.
RhoGAP redundancy duringcellularization and gastrulationGRAF null mutant embryos give escaper adults
during development. This suggests that there
are other RhoGAPs that regulate Rho-GTP levels
in the absence of GRAF in cellularization. Rho-
GAP92B is another uncharacterized BAR, Rho-
GAP and SH3 domain containing protein
expressed in early embryogenesis
(Contrino et al., 2012). CGAP is required for
Rho-GTP cycling to produce Myosin II pulses for
apical constriction during gastrulation in Dro-
sophila. CGAP mutant embryos also show pre-
mature and hyper constriction during
cellularization (Mason et al., 2016). In addition,
RhoGAP68F is also required for coordinated api-
cal constriction during gastrulation (Sanny et al.,
2006). It is likely that GRAF, RhoGAP92B, CGAP
and RhoGAP68F together regulate ring constric-
tion during cellularization and apical constriction
during gastrulation. CGAP depletion in Graf
mutant embryos may enhance the hyper con-
striction phenotype seen in cellularization. This
redundancy of function in the RhoGAPs appears
Figure 9 continued
3 embryos) (control values were repeated from Figure 3 and GrafCR57 values were repeated from Figure 3 for comparison). Data is represented as
mean ± s.d. ***p<0.001, one-way ANOVA, repeated measure with Dunnett’s multiple comparison test, the GrafCR57, roki and GrafCR57;roki ring area are
statistically different from controls. (C) Quantification of Sqh-mCherry intensity in late cellularization in roki and GrafCR57;roki shows decreased intensity
in comparison to controls (control and GrafCR57 values were repeated from Figure 6 for comparison) (n = 75 rings, 5 rings per time point, 5 time points,
3 embryos each) (C). Data is represented as mean ± s.d. ns: non-significant. ***p<0.001, two-tailed Mann–Whitney test. Scale bars: 5 mm. (D) Schematic
shows that GRAF plays a role in regulating Rho-GTP levels as a RhoGAP. GRAF is uniformly present at the contractile ring during mid stage and
becomes cytosolic in late stages to drive the contraction process. Graf depletion shows a hyper constriction phenotype, and Rok depletion suppresses
the hyper constriction phenotype seen in Graf mutant embryos. Graf mutant embryos show Myosin II accumulation at the ring in mid and late
cellularization and in the inter ring region in mid cellularization.
The online version of this article includes the following source data and figure supplement(s) for figure 9:
Source data 1. Plotted values for ring area and fluorescence intensity analysis.
Figure supplement 1. GRAF overexpression suppresses the hyper constriction phenotype in Myosin II binding subunit (MBS)-depleted embryos.
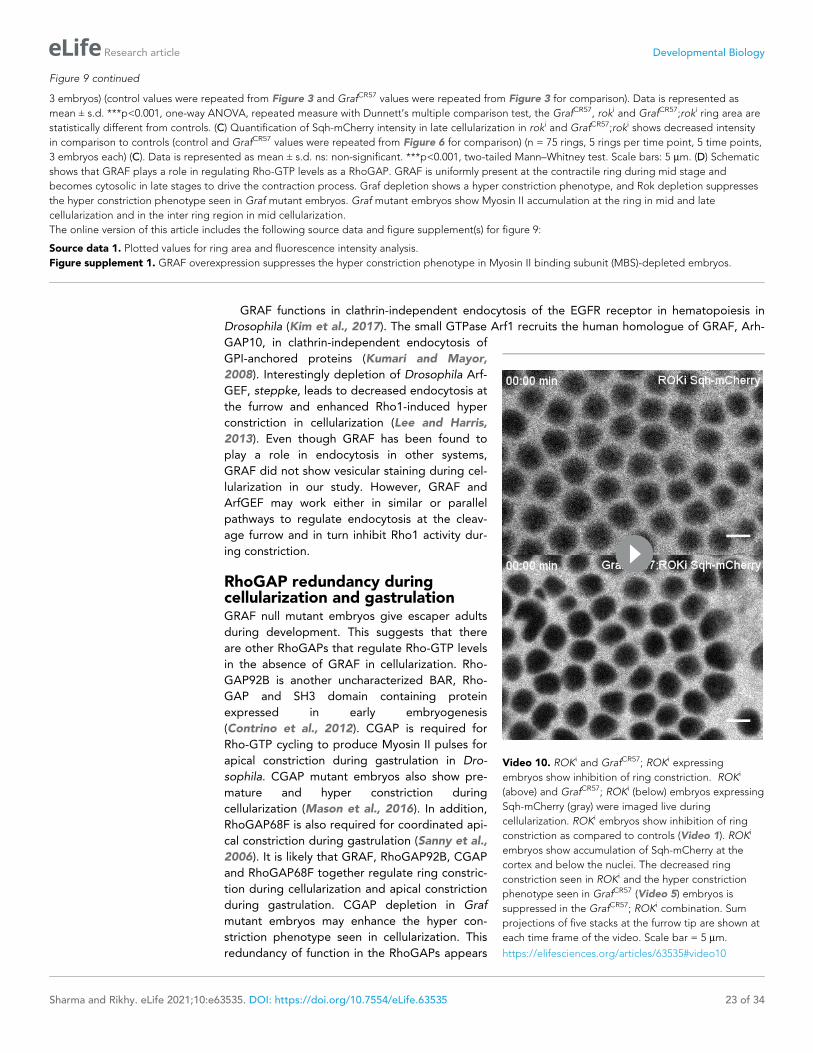
Video 10. ROKi and GrafCR57; ROKi expressing
embryos show inhibition of ring constriction. ROKi
(above) and GrafCR57; ROKi (below) embryos expressing
Sqh-mCherry (gray) were imaged live during
cellularization. ROKi embryos show inhibition of ring
constriction as compared to controls (Video 1). ROKi
embryos show accumulation of Sqh-mCherry at the
cortex and below the nuclei. The decreased ring
constriction seen in ROKi and the hyper constriction
phenotype seen in GrafCR57 (Video 5) embryos is
suppressed in the GrafCR57; ROKi combination. Sum
projections of five stacks at the furrow tip are shown at
each time frame of the video. Scale bar = 5 mm.
https://elifesciences.org/articles/63535#video10
Sharma and Rikhy. eLife 2021;10:e63535. DOI: https://doi.org/10.7554/eLife.63535 23 of 34
Research article Developmental Biology

as a general feature and is seen in many organisms. RGA3 and RGA4 are examples of two RhoGAPs
that regulate RhoA activity in early embryogenesis in C. elegans (Schmutz et al., 2007).
Multidomain proteins like GRAF containing membrane binding and RhoGAP domains are poised
to regulate Rho-GTP levels in a highly regulated manner spatially and temporally during actomyosin
contractility in different systems during cell migration and morphogenesis. Their presence in multi-
cellular organisms and localization at focal adhesions and polarized epithelia suggests that they will
regulate morphogenetic transitions occurring due to a change in adhesion and contractility.
Materials and methods
Key resources table
Reagent type(species) or resource Designation Source or reference Identifiers Additional information
Genetic reagent(Drosophilamelanogaster)
Canton-S Bloomington DrosophilaStock Center
BDSC:1RRID:BDSC_1
Genetic reagent(Drosophilamelanogaster)
nanos-Gal4 Lab stock(Mavrakis et al., 2009;Mavrakis et al., 2008)
Genetic reagent(Drosophilamelanogaster)
w; mat67-Gal4; mat15-Gal4 Girish Ratnaparkhi, IISER,Pune, India
Genetic reagent(Drosophilamelanogaster)
w; P{Sqh-mCherry.M}3 Bloomington DrosophilaStock Center
BDSC:59024RRID:BDSC_59024
Genetic reagent(Drosophilamelanogaster)
y[1] v[1];P{TRiP.HMC03427}attP40 (GRAFshRNA1)
Bloomington DrosophilaStock Center
BDSC:51853RRID:BDSC_51853
Genetic reagent(Drosophilamelanogaster)
y[1] v[1]; P{TRiP.GL01207}attP40 (myosin binding subunit,MBS shRNA)
Bloomington DrosophilaStock Center
BDSC:41625RRID:BDSC_41625
Genetic reagent(Drosophilamelanogaster)
y[1] sc[*] v[1] sev[21];P{TRiP.HMS01118}a ttP2(RhoGEF2 shRNA)
Bloomington DrosophilaStock Center
BDSC:34643RRID:BDSC_34643
Genetic reagent(Drosophilamelanogaster)
y[1] w[*];P{UASpT7.RhoGEF2}5(RhoGEF2 overexpression)
Bloomington DrosophilaStock Center
BDSC:9386RRID:BDSC_9386
Genetic reagent(Drosophilamelanogaster)
ubi-GFP::AnillinRBD/TM3 Thomas Lecuit, IBDM,France, Munjal et al., 2015
Genetic reagent(Drosophilamelanogaster)
UASp-rok-shRNA (roki) Tony Harris, University of Toronto,Canada, Zhang et al., 2018
Genetic reagent(Drosophilamelanogaster)
y[1] w[67]c[23] P{EPgy2}Graf[EY094 61](GRAF overexpression)
Bloomington DrosophilaStock Center
BDSC:17571RRID:BDSC_17571
Genetic reagent(Drosophilamelanogaster)
w;mat67 Spider-GFP-Sqh-mcherry/TM3ser
Eric F. Wieschaus, PrincetonUniversity, USA,Martin et al., 2009
Genetic reagent(Drosophilamelanogaster)
y[1] sc[*] v[1] Graf[CR57]/FM7a (GrafCR57)
This study (Richa RIkhy,IISER, Pune, India)
Genetic reagent(Drosophilamelanogaster)
y[1] sc[*] v[1]sev[21]; P{TKO.GS00762}att P40
Bloomington DrosophilaStock Center
BDSC:76993RRID:BDSC_76993
Genetic reagent(Drosophilamelanogaster)
P{KK102763}VIE-260B(GRAF shRNA2, Graf2i)
Vienna Drosophila StockCenter, Vienna, Austria
v110812
Continued on next page
Sharma and Rikhy. eLife 2021;10:e63535. DOI: https://doi.org/10.7554/eLife.63535 24 of 34
Research article Developmental Biology

Continued
Reagent type(species) or resource Designation Source or reference Identifiers Additional information
Genetic reagent(Drosophilamelanogaster)
y[1] sc[*] v[1] sev[21];P{y[+t7.7] v[+t1.8]=nosCas9.R}attP40
Bloomington DrosophilaStock Center
BDSC:78781RRID:BDSC_78781
Genetic reagent(Drosophilamelanogaster)
[w]*;p[UASp-GRAF-EGFPG1]attp40/cyo
This paper (Richa Rikhy,IISER, Pune, India)
Genetic reagent(Drosophilamelanogaster)
[w]*;p[UASp-GRAFDRhoGAP-GFP] attp40/cyo
This paper (Richa Rikhy,IISER, Pune, India)
Sequence-basedreagent
GRAF_pUASp_Homo_Kpn1_GRAF(start)_FP (1)
This paper (Sigma-Aldrich) PCR primers CCGCATAGGCCACTAGTGGATCTGGTACCATGGGCGGCGGCAAAAATGTACG
Sequence-basedreagent
GRAF(end)_serinelinker_GFP(start)_FP (2)
This paper (Sigma-Aldrich) PCR primers ACTATGTGGAACATTTGAAGCCGCACCATTCCTCGAGCTCCAGCATGGTGAGCAAGGGCGAGGAGCT
Sequence-basedreagent
GRAF(end)_serinelinker_GFP(start)_RP (3)
This paper (Sigma-Aldrich) PCR primers AGCTCCTCGCCCTTGCTCACCATGCTGGAGCTCGAGGAATGGTGCGGCTTCAAATGTTCCACATAGT
Sequence-basedreagent
GFP_pUASp_Homo_RP (4) This paper (Sigma-Aldrich) PCR primers AACGTTCGAGGTCGACTCTAGAGGATCCTTACTTGTACAGCTCGTCCATGCCGAGAGTGAT
Sequence-basedreagent
RhoGAP_del_RP (5) This paper (Sigma-Aldrich) PCR primers CCTTCGTGGCGTCCGGCAACTTTGCCTCGCTGACTTTGATTTTGCCG
Sequence-basedreagent
RhoGAP_del_FP (6) This paper (Sigma-Aldrich) PCR primers CGGCAAAATCAAAGTCAGCGAGGCAAAGTTGCCGGACGCCACGAAGG
Sequence-basedreagent
GRAF FL AB vecOH FP (7) This paper (Sigma-Aldrich) PCR primers ACGAAAATCTGTATTTCCAAGGCATGGGCGGCGGCAAAAATGT
Sequence-basedreagent
Vect GRAF FL ABOH RP (8) This paper (Sigma-Aldrich) PCR primers ACATTTTTGCCGCCGCCCATGCCTTGGAAATACAGATTTTCGT
Sequence-basedreagent
Vect GRAF FL ABOH FP (9) This paper (Sigma-Aldrich) PCR primers AACATTTGAAGCCGCACCATTGGTCTCATCCTCAGTTCGA
Sequence-basedreagent
GRAF FL AB vecOH RP (10) This paper (Sigma-Aldrich) PCR primers TCGAACTGAGGATGAGACCAATGGTGCGGCTTCAAATGTTCCAC
Sequence-basedreagent
GRAF mutant scr1 FP (11) This paper (Sigma-Aldrich) PCR primers GTAAATGTTGCAAACACCGCAGTTTTCTCGAAACTCAACC
Sequence-basedreagent
GRAF mutant scr RP (12) This paper (Sigma-Aldrich) PCR primers TACTACTTACTCTTTGCCGCACTCATAAGATCTTTGACCT
Sequence-basedreagent
Pot2 212 CtoT FP (13) This paper (Sigma-Aldrich) PCR primers CAATTGGCCATTTTACTTAACGATTTT
Sequence-basedreagent
Pot2 212 CtoT RP (14) This paper (Sigma-Aldrich) PCR primers AAAATCGTTAAGTAAAATGGCCAATTG
Sequence-basedreagent
Pot2 420 AtoG FP (15) This paper (Sigma-Aldrich) PCR primers AAGAAAACAAAAAGAAATTTGATAAAA
Sequence-basedreagent
Pot2 420 AtoG RP (16) This paper (Sigma-Aldrich) PCR primers TTTTATCAAATTTCTTTTTGTTTTCTT
Sequence-basedreagent
Pot2 468 delT FP (17) This paper (Sigma-Aldrich) PCR primers GCAGGAGCGTTTCCTCAATATGTC
Sequence-basedreagent
Pot2 468 delT RP (18) This paper (Sigma-Aldrich) PCR primers GACATATTGAGGAAACGCTCCTGC
Antibody Anti-GRAF(rabbit polyclonal)
Bioklone This study 1:500; pre-absorbed usingGrafCR57 null mutant embryos
Antibody Anti-Dlg(mouse monoclonal)
DSHB 4F3,RRID:AB_528203
IF (1:100)
Antibody Anti-Zipper(rabbit polyclonal)
Thomas Jeffrey, TexasTech University, TX, USA,Chougule et al., 2016
IF (1:200)
Continued on next page
Sharma and Rikhy. eLife 2021;10:e63535. DOI: https://doi.org/10.7554/eLife.63535 25 of 34
Research article Developmental Biology

Continued
Reagent type(species) or resource Designation Source or reference Identifiers Additional information
Antibody Goat anti-mouseIgG Alexa 488
Molecular Probes A-1100,RRID:AB_2534069
IF (1:1000)
Antibody Goat anti-rabbitIgG Alexa 488
Molecular Probes A-11008,RRID:AB_143165
IF (1:1000)
Antibody Goat anti-mouseIgG Alexa 568
Molecular Probes A-11004,RRID:AB_141371
IF (1:1000)
Antibody Goat anti-rabbitIgG Alexa 568
Molecular Probes A-1101,RRID:AB_143157
IF (1:1000)
Antibody Hoechst 33258 Molecular Probes H-3569 IF (1:1000)
Antibody Slow Fade Gold Molecular Probes S-36937
Antibody Phalloidin Alexa 488 Molecular Probes A-12379,RRID:AB_2315147
IF (1:100)
Antibody Phalloidin Alexa 568 Molecular Probes A-12380,RRID:AB_2759224
IF (1:100)
Antibody Phalloidin Alexa 647 Molecular Probes A-22287,RRID:AB_2620155
IF (1:100)
Software, algorithm ImageJ and Fiji National Institutes of Health,(Rueden et al., 2017;Schindelin et al., 2012;Schneider et al., 2012)
Software, algorithm GraphPad Prism 5 Prism
Drosophila stocks and geneticsFly stocks and crosses were maintained in regular cornmeal agar. The detailed genotypes, stock
numbers, source of stocks and temperature of crosses are a part of the Key resources table and
Supplementary file 1.
Generation of GRAF null mutant using the Crispr-Cas9 methodFlies containing nos-Cas9 were crossed to ubiquitous expressing gRNA against the first exon of
GRAF to obtain F1 males containing nos-Cas9/GRAF gRNA (Ren et al., 2013; Zirin et al., 2020). In
the germline of F1 males, the Cas9 enzyme cleaved the first exon of GRAF, leading to non-homolo-
gous end joining (NHEJ) repair and the occurrence of different mutations (Figure 1—figure supple-
ment 2B, C). These males were crossed with FM7a virgin females. 155 F2 female progeny
containing the mutant chromosome and the FM7a balancer were crossed individually to FM7a
males. The crosses were checked for male lethality, and non-lethal stocks were tested for reduced
progeny. One line was male lethal, several lines contained reduced progeny and several lines did
not carry any remarkable phenotype. Genomic DNA was extracted from homozygous flies in lines
having optimum progeny and those containing reduced progeny compared to control. Exon 1 of
Graf was amplified from genomic DNA using the primers (Key resources table). The PCR product
was detected by agarose gel electrophoresis and purified before sending it for sequencing to assess
the presence of mutations in exon 1. Homozygous flies from 21 lines were sequenced, of which 18
lines contained reduced progeny and 3 lines did not show any phenotype (Figure 1—figure supple-
ment 2C). 100% of the lines sequenced gave mutations in exon 1 of the Graf gene. Homozygous
flies from lines with reduced progeny showed mutations in the Graf gene that led to a premature
stop codon. Homozygous flies from lines that did not give any phenotype also gave mutations in
exon, which did not alter the reading frame of the gene and were presumably not crucial for GRAF
function. GrafCR57 homozygous flies were maintained as a stock, and embryos from these flies were
used for analysis of ring area, Myosin II and GRAF levels.
Generation of GRAF-GFP and GRAFDRhoGAP-GFP transgeneThe Graf cDNA sequence was extracted from the LD28528 pOT2 vector (BDGP, USA) using primers
1 and 3 (Key resources table). The cDNA in LD28528 contained three mutations causing premature
Sharma and Rikhy. eLife 2021;10:e63535. DOI: https://doi.org/10.7554/eLife.63535 26 of 34
Research article Developmental Biology

stop codon when compared to the gene sequence available at FLYBASE:FBgn0030685. These muta-
tions were rectified by site-directed mutagenesis as follows: C212T, A420G and deletion of T468 res-
idue using primers 13–18 (Key resources table). The modified residues were confirmed using
sequencing. This intact Graf cDNA sequence was used to generate a fluorescently tagged GRAF-
GFP construct with GFP at the C-terminus. PCR amplification was performed on the GRAF and GFP
gene using primers 1, 3 and 2, 4, respectively (Key resources table). Overlap PCR was performed to
give rise to GRAF with a serine linker followed by GFP tagged at C-terminal of the Graf cDNA-ampli-
fied products using primers 1 and 4 (Key resources table). The PCR product at the end has a
sequence homologous to BamH1 digested pUASp vector ends. The purified product from the over-
lap PCR was digested with BamH1. The pUASp vector was used in a 10:1 ratio for transformation in
DH10B-derived Escherichia coli strain PPY (Zhang et al., 2014; Zhang et al., 2012). This strain
recombines the pUASp vector and insert using the in-bacto homologous recombination strategy.
PCR was performed to confirm the gene in the vector, and further the DNA sequence was confirmed
by sequencing using primers 1 and 4 (Key resources table).
The deletion of the RhoGAP domain of GRAF that spans the residues 1177–1764 in the ORF was
achieved using overlap PCR. PCR amplification was performed on pUASp GRAF-GFP vectors using
primers 1,5 and 6,4. The overlap PCR was performed to give rise to GRAFDRhoGAP with a serine
linker followed by GFP tagged at C-terminal region of Graf cDNA-amplified products using primers
1 and 4 (Key resources table). This purified product had an end homologous region to BamH1, and
both the PCR product and the pUASp vector were individually digested with BamH1. The purified
product and vector were used in a 10:1 ratio to transform in E. coli strain PPY. Finally, primers
1 and 4 (Key resources table) were used for confirming the product with PCR, and the DNA
sequence was confirmed by sequencing.
Generation of anti-GRAF antibodyThe pUASP GRAF-GFP vector was used to amplify GRAF full-length sequence using primers 7 and
10 (Key resources table), and pET-15b expression vector amplification was carried out by primers 8
and 9 (Key resources table). The GRAF full-length amplified product and vector were transformed
into E. coli strain PPY in 10:1 ratio. PCR and sequencing were performed to confirm the presence of
the GRAF insert using primers 7 and 10 (Key resources table). The N-terminal region of the GRAF
gene had 6X His tag, which was used for protein purification.
Polyclonal antibodies were developed against full-length GRAF protein in New Zealand White
rabbit at Bioklone, India, by the following procedure. Immunizations were given subcutaneously.
After primary immunization of the rabbit with 200 g of GRAF in Freund’s adjuvant (Sigma), boosters
were administered with 150 g of GRAF at 21-day intervals. Production bleeds were collected from
the immunized rabbit on the 14th day after each booster. The antibody titers in rabbit sera were
measured in indirect ELISA. 100 ml of purified GRAF protein was coated in the wells of microtiter
plates or strips (Nunc maxisorp) at a concentration of 3 g/ml, overnight at 4˚C. After blocking with
5% skimmed milk in PBS for 1 hr at 37˚C, the wells were washed twice with PBS. Varying dilutions of
rabbit sera were added to the wells and incubated overnight at 4˚C. After washes with PBS-Tween
20 (PBST) followed by PBS, the wells were incubated with goat anti-rabbit IgG-HRP (Merck, India),
1:2000, for 45 min at room temperature. Following washes with PBST and PBS, wells were incubated
with TMB (Invitrosense ultra blue) at room temperature for 20 min in dark. After the addition of the
stop solution (2N H2SO4), optical density (OD) values were measured at 450 nm using 800 TS absor-
bance reader (BioTek, Winooski, VT). Antibodies from the sixth bleed were purified on Protein A
agarose beads (Sigma).
GRAF antibody staining on Drosophila embryos was standardized using various fixation protocols
involving paraformaldehyde and heptane fixation along with methanol devitellinization and heat fixa-
tion. It was found that GRAF antibody staining was the best on heat fixation, and all experiments for
GRAF staining were therefore performed with heat fixation.
Immunostaining0–3.5 hr embryos were collected on sucrose agar plates, washed, dechorionated with 100% bleach
and washed again. To visualize GRAF, Zipper and Dlg immunostained embryos, dechorionated
embryos were heat fixed with boiled 1X Triton salt solution (10x-0.5%Triton X-100% and 7% NaCl in
Sharma and Rikhy. eLife 2021;10:e63535. DOI: https://doi.org/10.7554/eLife.63535 27 of 34
Research article Developmental Biology

water) for 1 min and instantly adding ice-cold 1X washing buffer. After cooling on ice, embryos were
devitelinized in 1:1 mix of MeOH and heptane followed by three washes in 1X PBST (1X PBS with
0.3% Triton X-100) for 5 min each. After washing, embryos were blocked in 2% BSA in 1X PBST for 1
hr and then incubated in the primary antibody (Key resources table) overnight at 4˚C. This was fol-
lowed by three 1X PBST washes and incubated in fluorescently coupled secondary antibodies
(Molecular Probes) at 1:1000 dilution for 1 hr at room temperature. Embryos were washed three
times in 1X PBST for 5 min each. DNA was labeled with Hoechst 33258 (1:1000, Molecular Probes)
for 5 min in the second 1X PBST wash. Finally, embryos were mounted in Slow fade Gold antifade
(Molecular Probes).
To visualize F-actin, embryos were fixed using 1:1 mix of 8% PFA in 1X PBS:heptane for 20 min
and followed by hand devitellinization. Fluorescently coupled phalloidin (Molecular Probes) was used
to label F-actin in embryos in cellularization for 1 hr at room temperature followed by washes and
DNA labeling.
Live imaging of Drosophila embryosFor live imaging, 2–2.5 hr embryos were collected on sucrose agar plates and dechorionated with
100% bleach for 1 min, and mounted on two-well coverslip bottom Labtek chambers. Mounted
embryos were filled with 1X PBS (Mavrakis et al., 2008) and imaged using 40X/1.4NA oil objective
on Zeiss or Leica SP8 microscope with a frame rate of 1.74 s/frame and 2 s/frame, respectively.
MicroscopyZeiss laser scanning confocal microscope LSM710, LSM780 and Leica laser scanning microscope SP8
containing laser lines at 488, 561 and 633 nm were used to image immunostained fixed or live
embryos. The 40X objective having NA 1.4 of these microscopes was used for imaging. The laser
power, scan speed and gain were adjusted with the range indicator mode such that 8-bit image
acquisition was in 0–255 range. For both fixed or live imaging, an averaging of 2 was used during
image acquisition. Optical sectioning of 1.08 mm and 0.68 mm was used to acquire images at Zeiss
and Leica confocal microscopes, respectively.
Laser ablationControl and GrafCR57 embryos expressing Sqh-mCherry were used for visualizing contractile rings for
laser ablation experiments using the Zeiss LSM780 microscope. Laser ablation was achieved by using
800 nm multiphoton femtosecond pulsed Mai Tai laser. The region of interest used for ablations was
set to a line of 510 pixel length (42.51 mm) and captured with a speed of 1.58 ms per pixel and 20
iterations. The Sqh-mCherry was imaged using a 561 nm laser excitation with a time interval of 1.27
s. A sagittal section was taken before ablations to estimate furrow length for early (less than 6 mm)
and mid stages (6–16 mm) of cellularization. Three sections were taken before the ablations in
approximately 3 s, the time taken for ablations is approximately 3.22 s and imaging was carried out
for approximately 70 s after ablations.
Image quantification and analysisQuantification of mean fluorescence intensity of GRAF and Zipper fromimmunostainingThe imaging of fixed control and mutant embryos immunostained with antibodies against GRAF
along with Dlg (Figure 2B, C, Figure 2—figure supplement 1B, C) and Zipper along with Dlg
(Figure 6B) was carried out on the Leica SP8 confocal microscope at the same laser power and gain
settings. To estimate the mean fluorescence intensity per pixel of GRAF and Zipper from immunos-
taining, a single optical section from the Z-stack containing the brightest intensity at the furrow tip
was chosen. Fluorescence intensity was obtained in this section by drawing ROIs (regions of interest)
using the segmented line tool on the ring to get the mean intensity per pixel using Fiji software
(http://fiji.sc/wiki/index.php/Fiji) (Rueden et al., 2017). The ring intensity obtained was divided by
the mean cytosol intensity per pixel obtained from a large square ROI in the apical-most region
above the nuclei from the same image. This cortex to cytosol ratio for GRAF antibody fluorescence
in control embryos (Figure 2B), GrafCR57 (Figure 2C), GRAF-OE (Figure 5C) and Zipper antibody
fluorescence in control and GrafCR57 (Figure 6B) was plotted for different stages of cellularization.
Sharma and Rikhy. eLife 2021;10:e63535. DOI: https://doi.org/10.7554/eLife.63535 28 of 34
Research article Developmental Biology
Quantification of mean fluorescence intensity of GRAF, Sqh-mCherry andAnillinRBD-GFP from live imagingMovies from live imaging of embryos containing GRAF-GFP,GRAFDRhoGAP-GFP, Sqh-mCherry in
GRAF-OE and GrafCR57 (Figure 4—figure supplement 1, Figure 6—figure supplement 1B) were
used to quantify the fluorescence intensity change with respect to time. Images with Z projection of
sum intensity per pixel were obtained from two stacks above and two stacks below of the brightest
section at the furrow tip (total five stacks) covering depth of 4 mm. ROIs across the furrow tip from 5
or 10 rings were drawn in these images for each time point to obtain the mean signal intensity per
pixel. The mean intensity obtained at each time point was represented as a ratio to the maximum
mean fluorescence value per pixel obtained across cellularization within each embryo and finally
plotted as a ‘normalized intensity versus time.’
A line ROI passing through the ring for a single optical plane was used to obtain an intensity pro-
file of Sqh-mCherry, GRAF-GFP and AnillinRBD-GFP in embryos across different stages of cellulariza-
tion (Figure 2E, Figure 4B,D). The intensity at the documented time points was represented as a
ratio to the maximum intensity usually across cellularization for each of these embryos.
Live imaging of Sqh-mCherry expressing embryos in various genotypes was used to quantify fluo-
rescence intensity change during the last five time points in late cellularization. Sqh-mCherry showed
an increased accumulation at rings in late cellularization in GrafCR57 as compared to controls. To esti-
mate these changes quantitatively across all genotypes, images were obtained with sum intensity
per pixel across the Z axis from a total of five stacks: two stacks above and two stacks below of the
brightest section at the furrow tip covering depth of 4 mm in late cellularization. The mean ring inten-
sity per pixel was extracted by drawing a segmented ROI on the ring. The inter ring intensity per
pixel was extracted by drawing an ROI in between adjacent rings that had reduced Sqh-mCherry
intensity. The ring intensity per pixel was expressed as a ratio to inter ring intensity per pixel. Finally,
the normalized intensity of the ring was shown as a scatter plot (Figure 6D, Figure 7D, Figure 8D,
Figure 9C).
Quantification of contractile ring areaPhalloidin-stained embryos marking contractile rings at the basal-most region were extracted for
quantification of contractile ring area from control, Grafi and GrafCR57 (Figure 1E). These images
were converted to 8-bit and transformed to binary images. The binary images were inverted and
segmented to identify individual rings, and the area inside the rings was quantified for different
stages of cellularization. The area was plotted in groups of early (furrow length less than 6 mm), mid
(furrow length 6–16 mm) and late (furrow length more than 16 mm) stages of cellularization based on
furrow length to compare between control and mutant embryos.
Live movies from embryos expressing Sqh-mCherry of different genotypes were used to quantify
contractile ring area in Figure 4G, Figure 5E, Figure 7C, Figure 8C and Figure 9B. Sqh-mCherry
fluorescence images containing sum intensity were obtained across five optical sections at the base
of the furrow with the brightest section in the middle. Five rings per embryo were marked manually
using a polygon tool in these images, and the area inside the ring was computed in ImageJ. The
mean ± s.d. for the area was computed and plotted with time using GraphPad Prism 5.0.
Quantification of furrow membrane lengthSqh-mCherry fluorescence was used to identify furrow tips during cellularization. Membrane length
was measured using the ImageJ line tool after every 2 min in Figure 6—figure supplement 1A
and Figure 7—figure supplement 1B (five furrow lengths per time point were recorded in each
embryo). These lengths were plotted against time as a scatter plot using GraphPad Prism 5.0.
Quantification of displacement and initial recoil velocity after laserablationThe manual tracking plugin of Fiji software was used to extract xy coordinates from control and
ablated regions. These xy coordinates were used to get distance between the two points with the
following formula:
D¼
ffiffiffiffiffiffiffiffiffiffiffiffiffiffiffiffiffiffiffiffiffiffiffiffiffiffiffiffiffiffiffiffiffiffiffiffiffiffiffiffiffiffiffiffi
y2� y1ð Þ2þ x2� x1ð Þ2q
Sharma and Rikhy. eLife 2021;10:e63535. DOI: https://doi.org/10.7554/eLife.63535 29 of 34
Research article Developmental Biology

where (x1,y1) and (x2,y2) are the coordinates of the contractile ring edge seen below and above
ablation region, respectively.
The ring displacement was estimated for each time point after ablations. The displacement of
edges measured before ablations was subtracted from all the time points after ablations. The dis-
placement was calculated from five independent embryos. The mean displacement and s.d. with
respect to time was plotted for control and GrafCR57 mutant embryos across the early and mid
stages (Figure 3B, F). The displacement at the last time point at approximately 70 s was used to
plot maximum displacement (Figure 3C, G). The initial recoil velocity was calculated by fitting a lin-
ear function on points between 0 and 23 s on the plot of displacement versus time in each embryo
(Figure 3D, H).
N values and statistical analysisFor area quantification, the mean ± s.d. was computed from a total of 60 rings from six embryos of
each genotype in fixed and 15 rings from three embryos each genotype in live embryos. For inten-
sity quantification, the n-value for each experiment is mentioned in their respective figure legends.
The statistical significance was determined using non-parametric Mann–Whitney test, two-tailed Stu-
dent’s t-test to compare two means (Figure 1E, Figure 2B, Figure 3C, D, G, H, Figure 5C,E,
Figure 6B,D, Figure 7D, Figure 8D, Figure 9C, Figure 2—figure supplement 1B, Figure 4—figure
supplement 1B). One-way ANOVA, repeated measures was used to compare the area curves to
check for statistical significance between various genotypes followed by Dunnett’s multiple compari-
son test (Figure 4G, Figure 7C, Figure 8C, Figure 9B). Two-way ANOVA was also used to compare
the statistical difference at each time point between genotypes in Figure 6—figure supplement 1B.
Graphs for area versus time (Figure 4G, Figure 5E, Figure 7C, Figure 8C, Figure 9B) and intensity
versus time (Figure 4—figure supplement 1B, Figure 6—figure supplement 1B) were represented
with smoothing using the second-order, seven-neighbors ‘Savistsky-Golay’ smoothing algorithm.
AcknowledgementsWe thank RR lab members for continuous discussions on the data in this work. We thank the Dro-
sophila and Microscopy facility at IISER, Pune, India. Stocks from the Bloomington Drosophila Stock
Center were used for this study. We thank Vimlesh Kumar from IISER, Bhopal, India, for providing
Graf cDNA for cloning. We thank K Rajeshwari from Bioklone for GRAF antibody generation. We
thank NCBS Drosophila injection facility for embryo injections to generate transgenics. We thank
ImageJ, Fiji and Flybase for image analysis and genetic analysis used in the paper. We thank Thomas
Jeffrey (Texas Tech University, TX, USA) for the anti-Zipper antibody. RR thanks the Department of
Biotechnology, India, and IISER, Pune, India, for funding for this project. SS thanks Council of Scien-
tific and Industrial Research, India, for graduate fellowship.
Additional information
Funding
Funder Grant reference number Author
Department of Biotechnology BT/PR26071/GET/119/108/2017
Richa Rikhy
Council of Scientific and In-dustrial Research, India
Graduate fellowship Swati Sharma
The funders had no role in study design, data collection and interpretation, or the
decision to submit the work for publication.
Author contributions
Swati Sharma, Conceptualization, Resources, Formal analysis, Validation, Investigation, Visualization,
Methodology, Writing - original draft, Writing - review and editing; Richa Rikhy, Conceptualization,
Resources, Formal analysis, Supervision, Funding acquisition, Validation, Investigation, Visualization,
Methodology, Writing - original draft, Project administration, Writing - review and editing
Sharma and Rikhy. eLife 2021;10:e63535. DOI: https://doi.org/10.7554/eLife.63535 30 of 34
Research article Developmental Biology

Author ORCIDs
Richa Rikhy https://orcid.org/0000-0002-4262-0238
Decision letter and Author response
Decision letter https://doi.org/10.7554/eLife.63535.sa1
Author response https://doi.org/10.7554/eLife.63535.sa2
Additional filesSupplementary files. Supplementary file 1. Drosophila recombinants and crosses. The stocks and recombinants used in
this study are numbered in Table 1. The crosses carried out with the stocks for each figure for live
imaging and fixed imaging of embryos along with the temperature at which each cross is carried out
are detailed in Table 2.
. Transparent reporting form
Data availability
The data generated and analysed during this study are included in the source data files.
ReferencesAgarwal P, Zaidel-Bar R. 2019. Principles of actomyosin regulation in vivo. Trends in Cell BiologyIn 29:150–163.DOI: https://doi.org/10.1016/j.tcb.2018.09.006, PMID: 30385150
Amano M, Nakayama M, Kaibuchi K. 2010. Rho-kinase/ROCK: a key regulator of the cytoskeleton and cellpolarity. Cytoskeleton 67:545–554. DOI: https://doi.org/10.1002/cm.20472, PMID: 20803696
Bai X, Lenhart KC, Bird KE, Suen AA, Rojas M, Kakoki M, Li F, Smithies O, Mack CP, Taylor JM. 2013. Thesmooth muscle-selective RhoGAP GRAF3 is a critical regulator of vascular tone and hypertension. NatureCommunications 4:2910. DOI: https://doi.org/10.1038/ncomms3910, PMID: 24335996
Bos JL, Rehmann H, Wittinghofer A. 2007. GEFs and GAPs: critical elements in the control of small G proteins.Cell 129:865–877. DOI: https://doi.org/10.1016/j.cell.2007.05.018, PMID: 17540168
Chircop M. 2014. Rho GTPases as regulators of mitosis and cytokinesis in mammalian cells. Small GTPases 5:e29770. DOI: https://doi.org/10.4161/sgtp.29770, PMID: 24988197
Chougule AB, Hastert MC, Thomas JH. 2016. Drak is required for actomyosin organization during Drosophilacellularization. G3: Genes, Genomes, Genetics 6:819–828. DOI: https://doi.org/10.1534/g3.115.026401
Contrino S, Smith RN, Butano D, Carr A, Hu F, Lyne R, Rutherford K, Kalderimis A, Sullivan J, Carbon S, KephartET, Lloyd P, Stinson EO, Washington NL, Perry MD, Ruzanov P, Zha Z, Lewis SE, Stein LD, Micklem G. 2012.modMine: flexible access to modENCODE data. Nucleic Acids Research 40:D1082–D1088. DOI: https://doi.org/10.1093/nar/gkr921, PMID: 22080565
Crawford JM, Harden N, Leung T, Lim L, Kiehart DP. 1998. Cellularization in Drosophila melanogaster isdisrupted by the inhibition of rho activity and the activation of Cdc42 function. Developmental Biology 204:151–164. DOI: https://doi.org/10.1006/dbio.1998.9061, PMID: 9851849
Dey B, Rikhy R. 2020. DE-cadherin and myosin II balance regulates furrow length for onset of polygon shape insyncytial Drosophila embryos. Journal of Cell Science 133:jcs240168. DOI: https://doi.org/10.1242/jcs.240168,PMID: 32265269
Doherty JT, Lenhart KC, Cameron MV, Mack CP, Conlon FL, Taylor JM. 2011. Skeletal muscle differentiation andfusion are regulated by the BAR-containing Rho-GTPase-activating protein (Rho-GAP), GRAF1. Journal ofBiological Chemistry 286:25903–25921. DOI: https://doi.org/10.1074/jbc.M111.243030, PMID: 21622574
Doherty GJ, Lundmark R. 2009. GRAF1-dependent endocytosis. Biochemical Society Transactions 37:1061–1065. DOI: https://doi.org/10.1042/BST0371061, PMID: 19754452
Eberth A, Lundmark R, Gremer L, Dvorsky R, Koessmeier KT, McMahon HT, Ahmadian MR. 2009. A BARdomain-mediated autoinhibitory mechanism for RhoGAPs of the GRAF family. Biochemical Journal 417:371–379. DOI: https://doi.org/10.1042/BJ20081535, PMID: 18954304
Figard L, Xu H, Garcia HG, Golding I, Sokac AM. 2013. The plasma membrane flattens out to fuel cell-surfacegrowth during Drosophila cellularization. Developmental Cell 27:648–655. DOI: https://doi.org/10.1016/j.devcel.2013.11.006, PMID: 24316147
Foe VE, Field CM, Odell GM. 2000. Microtubules and mitotic cycle phase modulate spatiotemporal distributionsof F-actin and myosin II in Drosophila syncy tial blastoderm embryos. Development 127:1767–1787.PMID: 10751167
Sharma and Rikhy. eLife 2021;10:e63535. DOI: https://doi.org/10.7554/eLife.63535 31 of 34
Research article Developmental Biology
Foe VE, Alberts BM. 1983. Studies of nuclear and cytoplasmic behaviour during the five mitotic cycles thatprecede gastrulation in Drosophila embryo genesis. Journal of Cell Science 61:31–70. PMID: 6411748
Grosshans J, Wenzl C, Herz HM, Bartoszewski S, Schnorrer F, Vogt N, Schwarz H, Muller HA. 2005. RhoGEF2and the formin dia control the formation of the furrow canal by directed actin assembly during Drosophilacellularisation. Development 132:1009–1020. DOI: https://doi.org/10.1242/dev.01669, PMID: 15689371
He B, Martin A, Wieschaus E. 2016. Flow-dependent myosin recruitment during Drosophila cellularizationrequires zygotic dunk activity. Development 143:2417–2430. DOI: https://doi.org/10.1242/dev.131334,PMID: 27226317
Heer NC, Martin AC. 2017. Tension, contraction and tissue morphogenesis. Development 144:4249–4260.DOI: https://doi.org/10.1242/dev.151282, PMID: 29183938
Heisenberg CP, Bellaıche Y. 2013. Forces in tissue morphogenesis and patterning. Cell 153:948–962.DOI: https://doi.org/10.1016/j.cell.2013.05.008, PMID: 23706734
Hildebrand JD, Taylor JM, Parsons JT. 1996. An SH3 domain-containing GTPase-activating protein for rho andCdc42 associates with focal adhesion kinase. Molecular and Cellular Biology 16:3169–3178. DOI: https://doi.org/10.1128/MCB.16.6.3169, PMID: 8649427
Holst MR, Vidal-Quadras M, Larsson E, Song J, Hubert M, Blomberg J, Lundborg M, Landstrom M, Lundmark R.2017. Clathrin-Independent endocytosis suppresses Cancer cell blebbing and invasion. Cell Reports 20:1893–1905. DOI: https://doi.org/10.1016/j.celrep.2017.08.006, PMID: 28834752
Jacobs T, Hall C. 2005. Rho GAPs — Regulators of Rho GTPases and More. In: Ridley A. J, Frampton J (Eds).Proteins and Cell Regulation. Berlin, Germany: Springer. p. 93–112.
Jodoin JN, Coravos JS, Chanet S, Vasquez CG, Tworoger M, Kingston ER, Perkins LA, Perrimon N, Martin AC.2015. Stable force balance between epithelial cells arises from F-Actin turnover. Developmental Cell 35:685–697. DOI: https://doi.org/10.1016/j.devcel.2015.11.018, PMID: 26688336
Kasza KE, Farrell DL, Zallen JA. 2014. Spatiotemporal control of epithelial remodeling by regulated myosinphosphorylation. PNAS 111:11732–11737. DOI: https://doi.org/10.1073/pnas.1400520111
Kerridge S, Munjal A, Philippe JM, Jha A, de las Bayonas AG, Saurin AJ, Lecuit T. 2016. Modular activation ofRho1 by GPCR signalling imparts polarized myosin II activation during morphogenesis. Nature Cell Biology 18:261–270. DOI: https://doi.org/10.1038/ncb3302, PMID: 26780298
Kiehart DP. 1990. The actin membrane skeleton in Drosophila development. Seminars in Cell Biology 1:325–339.PMID: 2129340
Kim S, Nahm M, Kim N, Kwon Y, Kim J, Choi S, Choi EY, Shim J, Lee C, Lee S. 2017. Graf regulateshematopoiesis through GEEC endocytosis of EGFR. Development 144:4159–4172. DOI: https://doi.org/10.1242/dev.153288, PMID: 28993397
Kimura K, Ito M, Amano M, Chihara K, Fukata Y, Nakafuku M, Yamamori B, Feng J, Nakano T, Okawa K,Iwamatsu A, Kaibuchi K. 1996. Regulation of myosin phosphatase by rho and Rho-associated kinase (Rho-kinase). Science 273:245–248. DOI: https://doi.org/10.1126/science.273.5272.245, PMID: 8662509
Krajcovic MM, Minden JS. 2012. Assessing the critical period for rho kinase activity during Drosophila ventralfurrow formation. Developmental Dynamics 241:1729–1743. DOI: https://doi.org/10.1002/dvdy.23859,PMID: 22972587
Krueger D, Quinkler T, Mortensen SA, Sachse C, De Renzis S. 2019. Cross-linker-mediated regulation of actinnetwork organization controls tissue morphogenesis. Journal of Cell Biology 218:2743–2761. DOI: https://doi.org/10.1083/jcb.201811127, PMID: 31253650
Kumar M, Pushpa K, Mylavarapu SV. 2015. Splitting the cell, building the organism: mechanisms of cell divisionin metazoan embryos. IUBMB Life 67:575–587. DOI: https://doi.org/10.1002/iub.1404, PMID: 26173082
Kumari S, Mayor S. 2008. ARF1 is directly involved in dynamin-independent endocytosis. Nature Cell Biology 10:30–41. DOI: https://doi.org/10.1038/ncb1666, PMID: 18084285
Lecuit T, Lenne PF. 2007. Cell surface mechanics and the control of cell shape, tissue patterns andmorphogenesis. Nature Reviews Molecular Cell Biology 8:633–644. DOI: https://doi.org/10.1038/nrm2222,PMID: 17643125
Lecuit T, Wieschaus E. 2000. Polarized insertion of new membrane from a cytoplasmic reservoir during cleavageof the Drosophila embryo. Journal of Cell Biology 150:849–860. DOI: https://doi.org/10.1083/jcb.150.4.849,PMID: 10953008
Lee DM, Harris TJ. 2013. An Arf-GEF regulates antagonism between endocytosis and the cytoskeleton forDrosophila blastoderm development. Current Biology 23:2110–2120. DOI: https://doi.org/10.1016/j.cub.2013.08.058, PMID: 24120639
Levayer R, Lecuit T. 2012. Biomechanical regulation of contractility: spatial control and dynamics. Trends in CellBiology 22:61–81. DOI: https://doi.org/10.1016/j.tcb.2011.10.001, PMID: 22119497
Lundmark R, Doherty GJ, Howes MT, Cortese K, Vallis Y, Parton RG, McMahon HT. 2008. The GTPase-activatingprotein GRAF1 regulates the CLIC/GEEC endocytic pathway. Current Biology 18:1802–1808. DOI: https://doi.org/10.1016/j.cub.2008.10.044, PMID: 19036340
Martin AC, Kaschube M, Wieschaus EF. 2009. Pulsed contractions of an actin-myosin network drive apicalconstriction. Nature 457:495–499. DOI: https://doi.org/10.1038/nature07522, PMID: 19029882
Mason FM, Tworoger M, Martin AC. 2013. Apical domain polarization localizes actin-myosin activity to driveratchet-like apical constriction. Nature Cell Biology 15:926–936. DOI: https://doi.org/10.1038/ncb2796,PMID: 23831726
Sharma and Rikhy. eLife 2021;10:e63535. DOI: https://doi.org/10.7554/eLife.63535 32 of 34
Research article Developmental Biology

Mason FM, Xie S, Vasquez CG, Tworoger M, Martin AC. 2016. RhoA GTPase inhibition organizes contractionduring epithelial morphogenesis. Journal of Cell Biology 214:603–617. DOI: https://doi.org/10.1083/jcb.201603077, PMID: 27551058
Mavrakis M, Rikhy R, Lilly M, Lippincott-Schwartz J. 2008. Fluorescence imaging techniques for studyingDrosophila embryo development. Current Protocols in Cell Biology Chapter 4:Unit 4.18. DOI: https://doi.org/10.1002/0471143030.cb0418s39, PMID: 18551421
Mavrakis M, Rikhy R, Lippincott-Schwartz J. 2009. Plasma membrane polarity and compartmentalization areestablished before cellularization in the fly embryo. Developmental Cell 16:93–104. DOI: https://doi.org/10.1016/j.devcel.2008.11.003, PMID: 19154721
Mavrakis M, Azou-Gros Y, Tsai FC, Alvarado J, Bertin A, Iv F, Kress A, Brasselet S, Koenderink GH, Lecuit T.2014. Septins promote F-actin ring formation by crosslinking actin filaments into curved bundles. Nature CellBiology 16:322–334. DOI: https://doi.org/10.1038/ncb2921, PMID: 24633326
Mazumdar A, Mazumdar M. 2002. How one becomes many: blastoderm cellularization in Drosophilamelanogaster. BioEssays 24:1012–1022. DOI: https://doi.org/10.1002/bies.10184, PMID: 12386932
Merrill PT, Sweeton D, Wieschaus E. 1988. Requirements for autosomal gene activity during precellular stagessof Drosophila melanogaster. Development 104:495–509. PMID: 3151484
Mizuno T, Amano M, Kaibuchi K, Nishida Y. 1999. Identification and characterization of Drosophila homolog ofRho-kinase. Gene 238:437–444. DOI: https://doi.org/10.1016/S0378-1119(99)00351-0, PMID: 10570971
Mizuno T, Tsutsui K, Nishida Y. 2002. Drosophila myosin phosphatase and its role in dorsal closure. Development129:1215–1223. PMID: 11874917
Mulinari S, Hacker U. 2010. Rho-guanine nucleotide exchange factors during development: force is nothingwithout control. Small GTPases 1:28–43. DOI: https://doi.org/10.4161/sgtp.1.1.12672, PMID: 21686118
Munjal A, Philippe JM, Munro E, Lecuit T. 2015. A self-organized biomechanical network drives shape changesduring tissue morphogenesis. Nature 524:351–355. DOI: https://doi.org/10.1038/nature14603,PMID: 26214737
Murrell M, Oakes PW, Lenz M, Gardel ML. 2015. Forcing cells into shape: the mechanics of actomyosincontractility. Nature Reviews Molecular Cell Biology 16:486–498. DOI: https://doi.org/10.1038/nrm4012,PMID: 26130009
Padash Barmchi M, Rogers S, Ha€cker U. 2005. DRhoGEF2 regulates actin organization and contractility in theDrosophila blastoderm embryo. Journal of Cell Biology 168:575–585. DOI: https://doi.org/10.1083/jcb.200407124
Prudnikova TY, Rawat SJ, Chernoff J. 2015. Molecular pathways: targeting the kinase effectors of RHO-familyGTPases. Clinical Cancer Research 21:24–29. DOI: https://doi.org/10.1158/1078-0432.CCR-14-0827,PMID: 25336694
Rauzi M, Lenne PF, Lecuit T. 2010. Planar polarized actomyosin contractile flows control epithelial junctionremodelling. Nature 468:1110–1114. DOI: https://doi.org/10.1038/nature09566, PMID: 21068726
Regev M, Sabanay H, Kartvelishvily E, Kam Z, Bershadsky AD. 2017. Involvement of rho GAP GRAF1 inmaintenance of epithelial phenotype. Cell Adhesion & Migration 11:367–383. DOI: https://doi.org/10.1080/19336918.2016.1227910, PMID: 27588930
Ren X, Sun J, Housden BE, Hu Y, Roesel C, Lin S, Liu LP, Yang Z, Mao D, Sun L, Wu Q, Ji JY, Xi J, Mohr SE, Xu J,Perrimon N, Ni JQ. 2013. Optimized gene ed Drosophila melanogaster using germ line-specific Cas9. PNAS110:19012–19017. DOI: https://doi.org/10.1073/pnas.1318481110, PMID: 24191015
Reversi A, Loeser E, Subramanian D, Schultz C, De Renzis S. 2014. Plasma membrane phosphoinositide balanceregulates cell shape during Drosophila embryo morphogenesis. Journal of Cell Biology 205:395–408.DOI: https://doi.org/10.1083/jcb.201309079, PMID: 24798734
Rogers SL, Wiedemann U, Hacker U, Turck C, Vale RD. 2004. Drosophila RhoGEF2 associates with microtubuleplus ends in an EB1-dependent manner. Current Biology 14:1827–1833. DOI: https://doi.org/10.1016/j.cub.2004.09.078, PMID: 15498490
Royou A, Field C, Sisson JC, Sullivan W, Karess R. 2004. Reassessing the role and dynamics of nonmuscle myosinII during furrow formation in early Drosophila embryos. Molecular Biology of the Cell 15:838–850. DOI: https://doi.org/10.1091/mbc.e03-06-0440, PMID: 14657248
Rueden CT, Schindelin J, Hiner MC, DeZonia BE, Walter AE, Arena ET, Eliceiri KW. 2017. ImageJ2: imagej for thenext generation of scientific image data. BMC Bioinformatics 18:529. DOI: https://doi.org/10.1186/s12859-017-1934-z, PMID: 29187165
Sanny J, Chui V, Langmann C, Pereira C, Zahedi B, Harden N. 2006. Drosophila RhoGAP68F is a putative GTPaseactivating protein for RhoA participating in gastrulation. Development Genes and Evolution 216:543–550.DOI: https://doi.org/10.1007/s00427-006-0067-6, PMID: 16609869
Schejter ED, Wieschaus E. 1993a. Functional elements of the cytoskeleton in the early Drosophila embryo.Annual Review of Cell Biology 9:67–99. DOI: https://doi.org/10.1146/annurev.cb.09.110193.000435, PMID: 8280474
Schejter ED, Wieschaus E. 1993b. Bottleneck acts as a regulator of the microfilament network governingcellularization of the Drosophila embryo. Cell 75:373–385. DOI: https://doi.org/10.1016/0092-8674(93)80078-S,PMID: 8402919
Schindelin J, Arganda-Carreras I, Frise E, Kaynig V, Longair M, Pietzsch T, Preibisch S, Rueden C, Saalfeld S,Schmid B, Tinevez JY, White DJ, Hartenstein V, Eliceiri K, Tomancak P, Cardona A. 2012. Fiji: an open-sourceplatform for biological-image analysis. Nature Methods 9:676–682. DOI: https://doi.org/10.1038/nmeth.2019,PMID: 22743772
Sharma and Rikhy. eLife 2021;10:e63535. DOI: https://doi.org/10.7554/eLife.63535 33 of 34
Research article Developmental Biology

Schmutz C, Stevens J, Spang A. 2007. Functions of the novel RhoGAP proteins RGA-3 and RGA-4 in the germline and in the early embryo of C. elegans. Development 134:3495–3505. DOI: https://doi.org/10.1242/dev.000802, PMID: 17728351
Schneider CA, Rasband WS, Eliceiri KW. 2012. NIH image to ImageJ: 25 years of image analysis. NatureMethods 9:671–675. DOI: https://doi.org/10.1038/nmeth.2089, PMID: 22930834
Sherlekar A, Rikhy R. 2016. Syndapin promotes pseudocleavage furrow formation by actin organization in thesyncytial Drosophila embryo. Molecular Biology of the Cell 27:2064–2079. DOI: https://doi.org/10.1091/mbc.E15-09-0656, PMID: 27146115
St Johnston D, Ahringer J. 2010. Cell polarity in eggs and epithelia: parallels and diversity. Cell 141:757–774.DOI: https://doi.org/10.1016/j.cell.2010.05.011, PMID: 20510924
Sullivan W, Theurkauf WE. 1995. The cytoskeleton and morphogenesis of the early Drosophila embryo. CurrentOpinion in Cell Biology 7:18–22. DOI: https://doi.org/10.1016/0955-0674(95)80040-9, PMID: 7755985
Tan C, Stronach B, Perrimon N. 2003. Roles of myosin phosphatase during Drosophila development.Development 130:671–681. DOI: https://doi.org/10.1242/dev.00298, PMID: 12505998
Taylor JM, Hildebrand JD, Mack CP, Cox ME, Parsons JT. 1998. Characterization of graf, the GTPase-activatingprotein for rho associated with focal adhesion kinase. Journal of Biological Chemistry 273:8063–8070.DOI: https://doi.org/10.1074/jbc.273.14.8063
Taylor JM, Macklem MM, Parsons JT. 1999. Cytoskeletal changes induced by GRAF, the GTPase regulatorassociated with focal adhesion kinase, are mediated by rho. Journal of Cell Science 112:231–242. PMID: 9858476
Thomas JH, Wieschaus E. 2004. src64 and tec29 are required for microfilament contraction during Drosophilacellularization. Development 131:863–871. DOI: https://doi.org/10.1242/dev.00989, PMID: 14736750
Tram U, Riggs B, Sullivan W. 2002. Cleavage and gastrulation in Drosophila mbryos. Encyclopedia of LifeSciences 10:e0001071. DOI: https://doi.org/10.1038/npg.els.0001071
Van Aelst L, D’Souza-Schorey C. 1997. Rho GTPases and signaling networks. Genes & Development 11:2295–2322. DOI: https://doi.org/10.1101/gad.11.18.2295, PMID: 9308960
Vasquez CG, Tworoger M, Martin AC. 2014. Dynamic myosin phosphorylation regulates contractile pulses andtissue integrity during epithelial morphogenesis. Journal of Cell Biology 206:435–450. DOI: https://doi.org/10.1083/jcb.201402004
Warn RM, Magrath R. 1983. F-actin distribution during the cellularization of the Drosophila embryo visualizedwith FL-phalloidin. Experimental Cell Research 143:103–114. DOI: https://doi.org/10.1016/0014-4827(83)90113-1, PMID: 6825714
Wenzl C, Yan S, Laupsien P, Grosshans J. 2010. Localization of RhoGEF2 during Drosophila cellularization isdevelopmentally controlled by slam. Mechanisms of Development 127:371–384. DOI: https://doi.org/10.1016/j.mod.2010.01.001, PMID: 20060902
Wu SK, Priya R. 2019. Spatio-Temporal regulation of RhoGTPases signaling by myosin II. Frontiers in Cell andDevelopmental Biology 7:90. DOI: https://doi.org/10.3389/fcell.2019.00090, PMID: 31192208
Xue Z, Sokac AM. 2016. Back-to-back mechanisms drive actomyosin ring closure during Drosophila embryocleavage. Journal of Cell Biology 215:335–344. DOI: https://doi.org/10.1083/jcb.201608025
Yam PT, Wilson CA, Ji L, Hebert B, Barnhart EL, Dye NA, Wiseman PW, Danuser G, Theriot JA. 2007. Actin–myosin network reorganization breaks symmetry at the cell rear to spontaneously initiate polarized cell motility.Journal of Cell Biology 178:1207–1221. DOI: https://doi.org/10.1083/jcb.200706012
Young PE, Richman AM, Ketchum AS, Kiehart DP. 1993. Morphogenesis in Drosophila requires nonmusclemyosin heavy chain function. Genes & Development 7:29–41. DOI: https://doi.org/10.1101/gad.7.1.29, PMID:8422986
Zhang Y, Werling U, Edelmann W. 2012. SLiCE: a novel bacterial cell extract-based DNA cloning method.Nucleic Acids Research 40:e55. DOI: https://doi.org/10.1093/nar/gkr1288, PMID: 22241772
Zhang Y, Werling U, Edelmann W. 2014. Seamless ligation Cloning extract (SLiCE) cloning method. Methods inMolecular Biology 1116:235–244. DOI: https://doi.org/10.1007/978-1-62703-764-8_16, PMID: 24395368
Zhang Y, Yu JC, Jiang T, Fernandez-Gonzalez R, Harris TJC. 2018. Collision of expanding actin caps withactomyosin borders for cortical bending and mitotic rounding in a syncytium. Developmental Cell 45:551–564.DOI: https://doi.org/10.1016/j.devcel.2018.04.024, PMID: 29804877
Zirin J, Hu Y, Liu L, Yang-Zhou D, Colbeth R, Yan D, Ewen-Campen B, Tao R, Vogt E, VanNest S, Cavers C,Villalta C, Comjean A, Sun J, Wang X, Jia Y, Zhu R, Peng P, Yu J, Shen D, et al. 2020. Large-Scale transgenicDrosophila resource collections for loss- and Gain-of-Function studies. Genetics 214:755–767. DOI: https://doi.org/10.1534/genetics.119.302964, PMID: 32071193
Sharma and Rikhy. eLife 2021;10:e63535. DOI: https://doi.org/10.7554/eLife.63535 34 of 34
Research article Developmental Biology
Copyright © 2022 FDOKUMEN