Sedimentological characteristics of continental sabkha, south Western Desert, Egypt
19
ORIGINAL PAPER Sedimentological characteristics of continental sabkha, south Western Desert, Egypt Osama E. A. Attia & Hussien K. Hussien Received: 29 September 2014 /Accepted: 9 February 2015 /Published online: 5 March 2015 # Saudi Society for Geosciences 2015 Abstract Continental sabkha is recorded in the extreme mid- dle part of the south Western Desert of Egypt representing one of the most promising areas for sustainable development, es- pecially for agriculture. The geomorphologic units of the area are formed under the influence of structural, lithological, and/ or climatic controls. These units include pediplain, depres- sions, mass-wasted blocks, residual hills, drainage lines, and aeolian landforms. The effective deflation process is rein- forced by the lack of protective vegetation cover and the sus- ceptibility of weakly consolidated rocks to wind removal. Dif- ferent rock units covering the area range in age from Early Cretaceous to Quaternary. Quaternary deposits include playa/ sabkha deposits where the continental sabkha is divided into four zones A, B, C, and D. Underground waters coming from the north and east were progressively enriched in solute by interaction with the surrounding sedimentary and igneous rocks. Most of the evaporite minerals grow displacively as a result of evaporative pumping. Mineralogically, the continen- tal sabkha salt complex includes gypsum, natroalunite, tamarugite, bloedite, eugsterite, nitratine, halite, and D’ansite. Some of the major and trace elements (SiO 2 , Al 2 O 3 , Fe 2 O 3 , MgO, CaO, Na 2 O, K 2 O,as well as Rb, Ba, Zr, Sr, Y, V, and Zn) were measured. The correlation and enrichment of these major and trace elements indicate the origin of the salt com- plex in the sabkha. Keywords Continental sabkha . Evaporites . Sedimentology . Geochemistry Introduction The studied continental sabkha covers an area of about 2, 500 km 2 between long. 29° 30′ and 29° 50′ E and lat. 22° 10′ and 22° 30′ N (Fig. 1). It locates at the extremely middle part of the south Western Desert of Egypt and to the north of the Egyptian-Sudanese Boundary, SE of Bir Kuryum, and east of Bir Safsaf and G. Nusab El Balgoum (Fig. 1). The studied area characterized by many desert beauty sight seen of palm and dome trees and many scattered oases where the supply of underground water (spring or Bir) close to the surface (0.5 to 2 m in depth). The studied area represents one of the most promising areas for sustainable development especially for agriculture, where water is found in few places at Bir Nakhlai, Bir El-Shab, Bir Kuryum, Bir Kiseiba, Bir Abu El-Hussein, and Bir Murr. With the exception of Bir Murr, which is very brackish, most of the Birs (wells) are fresh and of good taste. The area is accessible through three main asphaltic roads (Fig. 1). The first road is that previously known as the Camel track Darb El Arbain (Caravan Road) extending from Kharga Oasis at north and runs in an approximately south direction to Salema Oasis in Sudan. The second road starts from Aswan, branched westerly at a point 50 km of Abu Simbel City cross- ing to the north of Gebel El Nabta. This desert road continues further west passing through Bir Nakhlai and joins Darb El Arbain at Bir El-Shab. The third road is parallel to Darb El Arbain track starting from Dakhla Oasis through Bir Tarfawi to the east of El Uweinat farms. In addition, there is a O. E. A. Attia Department of Geology and Geophysics, College of Science, King Saud University, Riyadh, Saudi Arabia O. E. A. Attia (*) Department of Geology, Faculty of Science, Cairo University, Giza, Egypt e-mail: [email protected] H. K. Hussien Egyptian Nuclear Materials Authority (ENMA), Cairo, Egypt Arab J Geosci (2015) 8:7973–7991 DOI 10.1007/s12517-015-1845-0
-
Upload
independent -
Category
Documents
-
view
2 -
download
0
Transcript of Sedimentological characteristics of continental sabkha, south Western Desert, Egypt
ORIGINAL PAPER
Sedimentological characteristics of continental sabkha, southWestern Desert, Egypt
Osama E. A. Attia & Hussien K. Hussien
Received: 29 September 2014 /Accepted: 9 February 2015 /Published online: 5 March 2015# Saudi Society for Geosciences 2015
Abstract Continental sabkha is recorded in the extreme mid-dle part of the southWestern Desert of Egypt representing oneof the most promising areas for sustainable development, es-pecially for agriculture. The geomorphologic units of the areaare formed under the influence of structural, lithological, and/or climatic controls. These units include pediplain, depres-sions, mass-wasted blocks, residual hills, drainage lines, andaeolian landforms. The effective deflation process is rein-forced by the lack of protective vegetation cover and the sus-ceptibility of weakly consolidated rocks to wind removal. Dif-ferent rock units covering the area range in age from EarlyCretaceous to Quaternary. Quaternary deposits include playa/sabkha deposits where the continental sabkha is divided intofour zones A, B, C, and D. Underground waters coming fromthe north and east were progressively enriched in solute byinteraction with the surrounding sedimentary and igneousrocks. Most of the evaporite minerals grow displacively as aresult of evaporative pumping. Mineralogically, the continen-tal sabkha salt complex includes gypsum, natroalunite,tamarugite, bloedite, eugsterite, nitratine, halite, and D’ansite.Some of the major and trace elements (SiO2, Al2O3, Fe2O3,MgO, CaO, Na2O, K2O, as well as Rb, Ba, Zr, Sr, Y, V, andZn) were measured. The correlation and enrichment of these
major and trace elements indicate the origin of the salt com-plex in the sabkha.
Keywords Continental sabkha . Evaporites .
Sedimentology . Geochemistry
Introduction
The studied continental sabkha covers an area of about 2,500 km2 between long. 29° 30′ and 29° 50′ E and lat. 22°10′ and 22° 30′ N (Fig. 1). It locates at the extremely middlepart of the south Western Desert of Egypt and to the north ofthe Egyptian-Sudanese Boundary, SE of Bir Kuryum, and eastof Bir Safsaf and G. Nusab El Balgoum (Fig. 1). The studiedarea characterized by many desert beauty sight seen of palmand dome trees and many scattered oases where the supply ofunderground water (spring or Bir) close to the surface (0.5 to2 m in depth). The studied area represents one of the mostpromising areas for sustainable development especially foragriculture, where water is found in few places at Bir Nakhlai,Bir El-Shab, Bir Kuryum, Bir Kiseiba, Bir Abu El-Hussein,and Bir Murr. With the exception of Bir Murr, which is verybrackish, most of the Birs (wells) are fresh and of good taste.The area is accessible through three main asphaltic roads(Fig. 1). The first road is that previously known as the Cameltrack Darb El Arbain (Caravan Road) extending from KhargaOasis at north and runs in an approximately south direction toSalema Oasis in Sudan. The second road starts from Aswan,branched westerly at a point 50 km of Abu Simbel City cross-ing to the north of Gebel El Nabta. This desert road continuesfurther west passing through Bir Nakhlai and joins Darb ElArbain at Bir El-Shab. The third road is parallel to Darb ElArbain track starting from Dakhla Oasis through Bir Tarfawito the east of El Uweinat farms. In addition, there is a
O. E. A. AttiaDepartment of Geology and Geophysics, College of Science, KingSaud University, Riyadh, Saudi Arabia
O. E. A. Attia (*)Department of Geology, Faculty of Science, Cairo University,Giza, Egypte-mail: [email protected]
H. K. HussienEgyptian Nuclear Materials Authority (ENMA), Cairo, Egypt
Arab J Geosci (2015) 8:7973–7991DOI 10.1007/s12517-015-1845-0

subsidiary asphaltic road connecting Bir Tarfawi with theCamel road at Bir Abu El-Hussein. Desert tracks cross thesouth Western Desert joining the studied area with the famousBir Nakhlai, Dungul, and Kurkur Oases.
The studied area represents one of the most promising areafor sustainable development, especially for agriculture, wherewater is found in few places at Bir Nakhlai, Bir El-Shab, BirKurayim, Bir Kiseiba, Bir Abu El-Hussein, and Bir Murr(Fig. 1). With the exception of Bir Murr, which is very brack-ish, most of the wells (Birs) are fresh and of good taste.
The present work aims to study the geological, geomor-phologic, and sedimentological characteristics of sabkha inBir El-Shab area and their effects on the deposition of saltdeposits. Also, it aims to study the mineralogical and geo-chemical characteristics of salt deposits in the studied area.
Methods of study
Aerial photographs (scale of 1:100,000 and field works) wereused to construct the geomorphic and drainage maps for thestudied area. The collected sediments were examined underbinocular microscope for primary categorization of the
sediments as well as the preliminary determination of theirmineralogical components. Then, thin sections were preparedfor detailed petrographic.
Evaporite thin sections for petrographic study were madeunder dry and cool conditions using epoxy cement. All sam-ples are studied by transmitted polarized light microscope andsupplemented by scanning electronmicroscope (SEM) and X-ray diffraction (XRD) studies for some evaporite salts to iden-tify their mineralogical composition, especially those of com-plicated composition (Bir El-Shabsabkha samples).
SEM (Philips® XL30) was used to examine some individ-ual mineral grains with resolution of 3.5 nm at 30 kV. Inaddition, semi-quantitative microchemical analysis was per-formed on the examined mineral grains using the energy-dispersive X-ray (EDAX) system of the SEM. More preciseresults were obtained by the basic EDAX automatic peakidentification and the true standard less quantification usingZAF matrix correction routines.
XRD analyses were carried out for bulk powder samples.An XRD unit (PW3710/31), with generator (PW 1830), scin-tillation counter (PW 3020), and nickel-filtered Cu target tube(PW 2233/20) at 40 kVand 30 mAwas used. The scans werelimited to the range from 5° to 64° scanning rate of 2° 2θ/
Qena
Idfu
Aswan
32º
30º
28º
26º
24º
22ºBir Dibis
El Qara
Bir Kuryim
29º 30´ 29º 40´ 29º 50´ 30º 00´22º 30´
22º 20´
22º 10´
22º 00´
29º 30´ 29º 40´ 29º 50´ 30º 00´
22º 30º
22º 20´
22º 10´
22º 00´
To Aswan
Bir El Shab
225
250
225250
265
250
225
300
250
250
To Oweinat
225
250
225
285
250
250
To
Sale
ma
280
204Playa
Hill
Salt crust (sabkha)
Depression
Well Fault
Asphaltic road
Drainage line
Slope
Sand dunesSub-plateau204m
Plateau
Legend:
Sub-plateau208m
Hamada desert
Road
Study area0 15 km
28° 30° 32° 34° 36°
Fig. 1 Location and geomorphic maps of Bir El-Shab area and its surroundings, south Western Desert, Egypt
7974 Arab J Geosci (2015) 8:7973–7991

menthe resulting d-spacing values of the analyzed sampleswere compared with the data of Powder Diffraction File(PDF)®, 1982, for mineral identification (γ-Ray Scintillome-ter (model GR 101 A)). The radioactivity is expressed incounts per second (CPS).
Geochemically, about 32 representative samples from dif-ferent zones of the sabkha were subjected to complete chem-ical analysis to determine their major oxides content and sometrace elements. The major oxides (SiO2, Al2O3, Fe2O3, FeO,MnO, MgO, CaO, Na2O, K2O, P2O5, and SO3) and loss ofignition (LOI) were determined according to the procedures ofShapiro and Brannock (1962). The precision of determinationis within ±5 %. The determination of trace elements (Sr, Cu,Pb, and Zn) were carried by the X-ray fluorescence technique(XRF) model Philips® (PW1410) X-ray spectrometer in theNuclear Materials Authority lab, Egypt, adopting the tech-niques of Norrish and Chappell (1966).
Geomorphology
Western Desert is a huge platform with a mean elevation of500 m above sea level, consisting of thick layers of sedimen-tary rocks (Said 1962). The present morphology of the West-ern Desert is inherited from ancient, contrastedmorphogeneticsystems, and it responses to climatic changes (Kröpelin 1993).Aridity has been the dominating factor in the Quaternary cli-mate in the Western Sahara around the tropic of Cancer wherethis hyper-arid area receives less than 2-mm average annualrainfall (Kröpelin 1993). The southern part of the WesternDesert of Egypt occupies the center of the largest hyper-aridregion on the earth. It has the features of lithology-controlledscarp landforms with ridges separated from each other byseveral kilometers. Sandstone with a slight northward regionalslope and dip makes up the largest part of the exposed andsubsurface strata. The incident solar energy is capable of evap-orating more than 200 times the amount of received precipi-tation (Henning and Flohn 1977; Kehl and Bornkamm 1993).Exogenetic drainage lines are absent, and internal drainagesare restricted to the depressions. Devoid of strong relief, bar-ren rocky surface with remnant hills are the main geomorphol-ogic units (Fig. 1) and most of the area can be considered as ahamada desert (Fig. 2).
The studied area can be differentiated geomorphologicallyinto the following: (1) southern Nakhlai-Shab pediplain, (2)depressions, (3) residual hills, (4) aeolian landforms, (5) saltcrust, and 6) playa deposits which mainly created by structur-al, lithological, and/or climatic controls.
Southern Nakhlai-Shab pediplain
This pediplain covers the southern part of the studied area.The pediplain surface is covered with Nubia sandstone beds
and occasionally covered with loose sands or ripple marks(Fig. 3) with the occurrence of some exceptions (few igneousand volcanic outcrops and also relatively small patches ofQuaternary deposits). This pediplain extends further southand west toward the great African Sahara. In most of its parts,the pediplain surface is nearly flat, sloping gently to the northand dissected by faults (Fig. 1). The relief of the pediplain isrelatively high toward south, near the Sudan borders, where itdecreases gradually to the north. At lat. 22° 00′, elevations of340 m were recorded, whereas south of lat. 22° 30′, the ele-vation of the ground surface varies from 200 to 280 m to thefar west with an average 250 m. The area is characterized byits internal drainage patterns. The streams are none flowingowing to the extreme dryness of this part of the Western De-sert. Denderitic drainage pattern is the main pattern on thispediplain surface.
Depressions
The depressions are mainly represented by Kiseiba depressionto the north and small scattered depression to the south (Fig. 1)(Hussein 2002). Kiseiba depression has a triangular shapewith its apex pointing to the NE direction. This depressionextends to the north direction for about 15 kmwith an averagewidth of about 5 km. Southern depression includes the mostmapped area (Fig. 1). It has a triangular shape with its apexpointing NE covering an area of about 460 km2. The floor ofthe depression is undulated and generally slopped to the northand northwest, while other local inward slopes are also record-ed. The surface of the depression is generally made up of
Fig. 2 Hamada desert with remnant hills in the studied area
Fig. 3 Part from Nakhlai-Shab pediplain covered with sand sheet
Arab J Geosci (2015) 8:7973–7991 7975
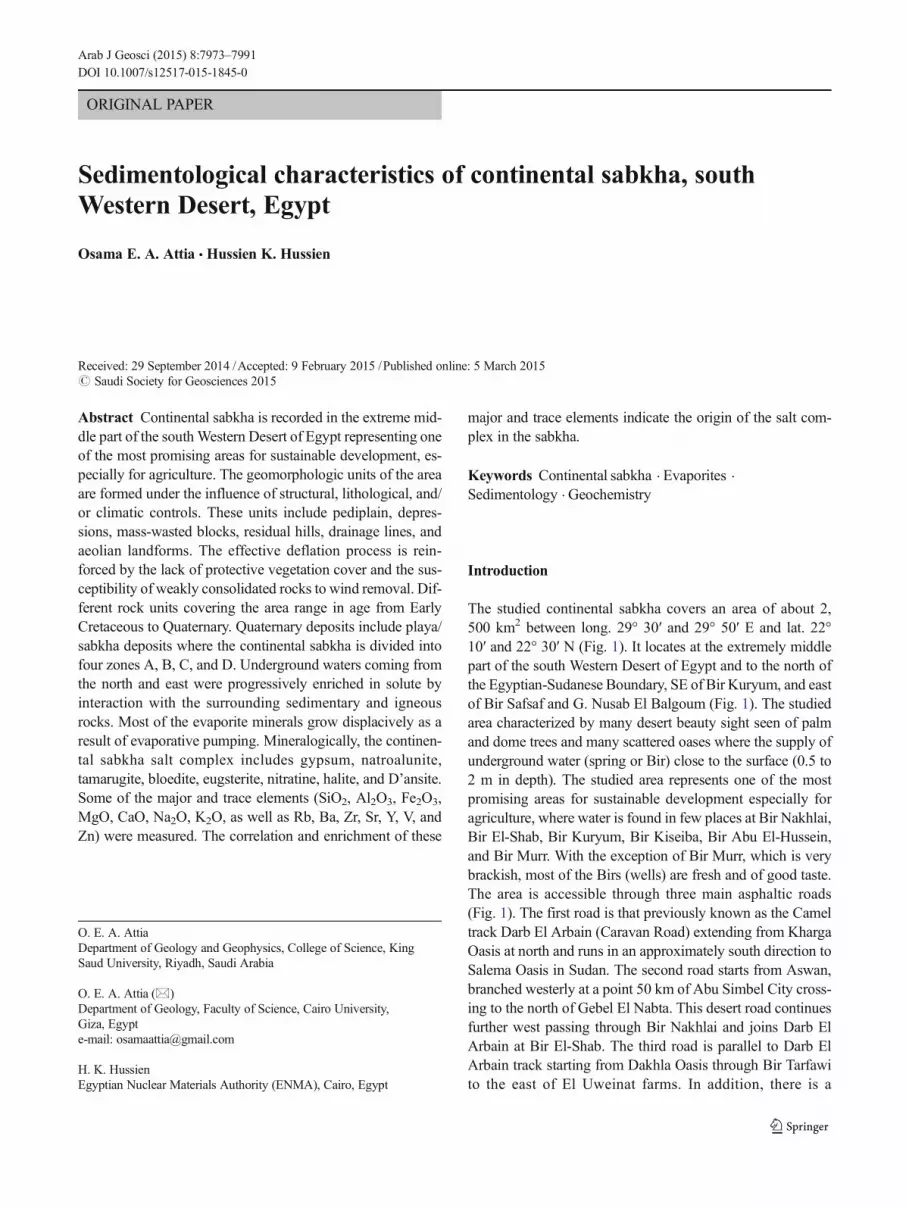
Cretaceous sandstone which latter covered with Quaternarysand sheet with the development of sand dunes, sabkha, andplaya (Fig. 4).
The origin of these depressions is still controversial(Walther 1912; Abu Al-Izz 1971). The proposed hypothesisof wind, as a powerful agent of excavation of large closeddepressions of the Western Desert of Egypt, has been widelyaccepted (Glennie 1970; Haynes 1980, 1982). Also, the fluvi-al action on semi-enclosed Dakhla and Kharga depressions bya Pliocene river system formerly draining in a southwesterlydirection was proposed by Said (1983), or by the MioceneFluvial action in the Qattara depression, which draining fromthe south, near the Gilf El-Kebir (Albritton et al. 1990). Afifi(2001) in his study of Nusab El-Balgoum and its surroundingssuggested that a great NNW paleo-river (channel) located atthe boundaries of the Nusab El-Balgoum and Bir Abu El-Hussein areas. The delta of this river was located at AtmoutEl-Kebiesh area. He also concluded that the wind action islimited to remove materials from the depression.
In the present work, the effective deflation process in thestudied depressions is reinforced by the lack of a protectivevegetation cover and the susceptibility of weakly consolidatedrocks to wind removal (Fig. 5). This is similar to that describedby Haynes (1982). The following evidences indicate the roleof deflation in the origin of the studied depressions:
1. They have an elongated kidney-like shape, transverse tothe prevailing winds.
2. The presence of a relatively steep cliff on the upwind sideand a gentler slope on the downwind side.
3. The occurrence of crescentic sand dunes (lunettes) andother sand dunes on the downwind side.
4. Grain composition of the dunes is closely similar to that ofthe nearby bedrocks.
Residual hills
The most prominent topographic features within the studieddepression are the large number of residual hills. These hillsare usually isolated, conical, and/or have flat-topped surfaces
(Fig. 6). Several hills of low relief composed of sandstone,siltstone, and claystone are laid down on the western side ofthe depression.
Aeolian landforms
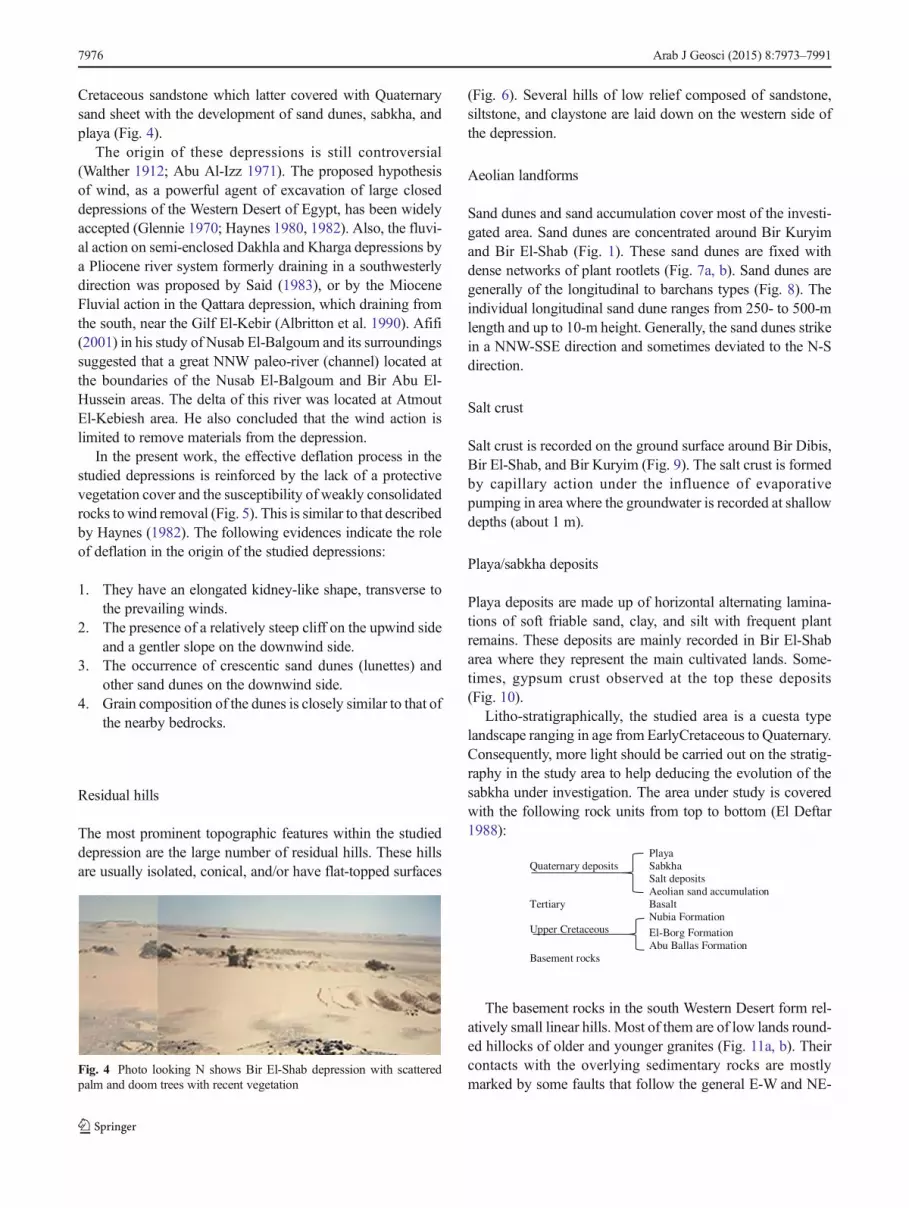
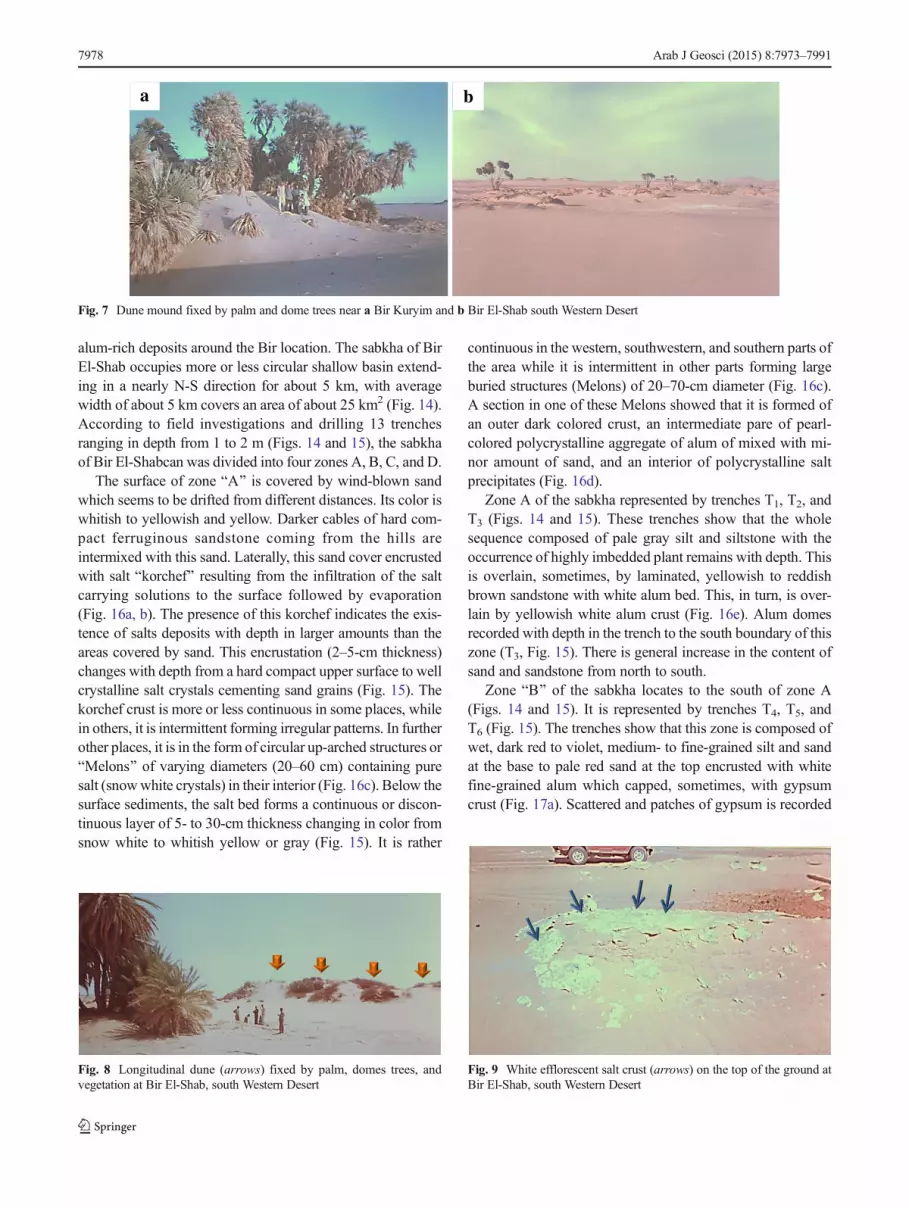
Sand dunes and sand accumulation cover most of the investi-gated area. Sand dunes are concentrated around Bir Kuryimand Bir El-Shab (Fig. 1). These sand dunes are fixed withdense networks of plant rootlets (Fig. 7a, b). Sand dunes aregenerally of the longitudinal to barchans types (Fig. 8). Theindividual longitudinal sand dune ranges from 250- to 500-mlength and up to 10-m height. Generally, the sand dunes strikein a NNW-SSE direction and sometimes deviated to the N-Sdirection.
Salt crust
Salt crust is recorded on the ground surface around Bir Dibis,Bir El-Shab, and Bir Kuryim (Fig. 9). The salt crust is formedby capillary action under the influence of evaporativepumping in area where the groundwater is recorded at shallowdepths (about 1 m).
Playa/sabkha deposits
Playa deposits are made up of horizontal alternating lamina-tions of soft friable sand, clay, and silt with frequent plantremains. These deposits are mainly recorded in Bir El-Shabarea where they represent the main cultivated lands. Some-times, gypsum crust observed at the top these deposits(Fig. 10).
Litho-stratigraphically, the studied area is a cuesta typelandscape ranging in age from EarlyCretaceous to Quaternary.Consequently, more light should be carried out on the stratig-raphy in the study area to help deducing the evolution of thesabkha under investigation. The area under study is coveredwith the following rock units from top to bottom (El Deftar1988):
PlayaQuaternary deposits Sabkha
Salt depositsAeolian sand accumulation
Tertiary BasaltNubia Formation
Upper Cretaceous El-Borg FormationAbu Ballas Formation
Basement rocks
The basement rocks in the south Western Desert form rel-atively small linear hills. Most of them are of low lands round-ed hillocks of older and younger granites (Fig. 11a, b). Theircontacts with the overlying sedimentary rocks are mostlymarked by some faults that follow the general E-W and NE-
Fig. 4 Photo looking N shows Bir El-Shab depression with scatteredpalm and doom trees with recent vegetation
7976 Arab J Geosci (2015) 8:7973–7991

SW trends (Issawi 1971). The basement rocks outcrop to theNE of Bir El-Shabin the form of small elongated patches ofmedium to very coarse-grained weathered biotite granite andsyenites with pink color. The area intersected with severaldikes including quartz porphyry dikes, aptites, and pegmatitedikes (Fig. 11c, d). Some basaltic dykes trending NE-SW cutthe granitic rocks. These basaltic dykes are mainly of Tertiaryage. Due to the undulation character of the basement rockssurface in the studied area, many rock types of different de-positional environments are observed ranging from fluvial,land/shore and even restricted very shallow sedimentarysections.
Abu Ballas Formation (Barthel and Boettcher 1978) is welldeveloped in Bir Kurayim area consisting of sandy clay, clay,and silt with fine-grained sandstone intercalation. In Dibisarea, this formation overlained unconformable by medium tocoarse grained, moderately compact thick bedded sandstoneof Nubia Formation with the presence of thin band of paleosol(Fig. 12a) with the occurrence of plant remains at the basalpart.
El-Borg Formation is well developed in the studied area,especially, to the south of Bir El-Shab area at G. El Qara(Fig. 1). Its sequence from base to top is as follows:
1. White kaolinitic sandstone2. Thick dark yellow, fine-grained, moderately hard, lami-
nated sandstone with rootlets fossils3. Dark gray gypseous claystone with small dark yellow
rootlets (Fig. 4b)4. Moderately hard, thinly laminated, variegated sandstone
5. Very fine-grained, slightly hard, thinly laminated,gypseouskaolinitic sandstone
6. Very fine-grained, soft grading upward to thinly laminatedclayey sandstone, grayish white sandstone with plantroots
7. Yellowish to brownish gray, moderately hard, fine- to me-dium-grained, cracked, jointed, contains leaf prints sand-stone (Fig. 4c)
8. Dark gray, large blocks of conglomerates (Fig. 12d)
In the western part of the studied area, El-Borg Formationis well developed, especially in Bir Dibis area, overlying un-conformable Abu Ballas Formation. It is composed mainly ofbrick red, medium to coarse-grained, moderately hard sand-stone, capped by a huge boulder of dark grey, massive, veryhard, ill-sorted conglomerates, and cemented by ferruginoussandstones. Early Cretaceous age is assigned to this formationas deduced from comparison with other literatures (Klitzschand Lejal-Nicol 1984), the stratigraphic position of this for-mation and the presence of plant remains.
Nubia Formation in the studied area is well developed tothe east and southeast of Bir El-Shab. It consists of three units(47.73-m thick) from base to top as follows:
1. Clayey sandstone and silty clay which grading upward togypseous claystone lower unit
2. Sandy clay middle unit with plant trace3. Laminated sandstone capped by a huge boulder of con-
glomerates upper unit (Fig. 13)
The Quaternary period is distinguished by its severe climat-ic changes (Klitzsch 1984; Haynes 1982). These changes arealternatives from wet to dry episodes that were expressed onthe surface of the studied area by different kinds of featuresand deposits such as aeolian deposits (sand dunes, sand sheets,sand shadows, etc), playa deposits, and salt crust (sabkha sed-iments). The present study will focus on the Quaternary saltcrust.
Quaternary salt crust
The term Shab means in Arabic Balum-rich deposit.^ There-fore, the Bedouin assign the term BBir El-Shab^ to indicate
Fig. 5 Weakly consolidated rock removal by wind, it is used in vegetation in Bir El-Shab
p
Fig. 6 Isolated hills with conical and flat-topped surface (arrows). Playasediment (p) in the low land is partially covered with sand sheet near BirEl-Shab, South Western Desert
Arab J Geosci (2015) 8:7973–7991 7977
alum-rich deposits around the Bir location. The sabkha of BirEl-Shab occupies more or less circular shallow basin extend-ing in a nearly N-S direction for about 5 km, with averagewidth of about 5 km covers an area of about 25 km2 (Fig. 14).According to field investigations and drilling 13 trenchesranging in depth from 1 to 2 m (Figs. 14 and 15), the sabkhaof Bir El-Shabcan was divided into four zones A, B, C, and D.
The surface of zone BA^ is covered by wind-blown sandwhich seems to be drifted from different distances. Its color iswhitish to yellowish and yellow. Darker cables of hard com-pact ferruginous sandstone coming from the hills areintermixed with this sand. Laterally, this sand cover encrustedwith salt Bkorchef^ resulting from the infiltration of the saltcarrying solutions to the surface followed by evaporation(Fig. 16a, b). The presence of this korchef indicates the exis-tence of salts deposits with depth in larger amounts than theareas covered by sand. This encrustation (2–5-cm thickness)changes with depth from a hard compact upper surface to wellcrystalline salt crystals cementing sand grains (Fig. 15). Thekorchef crust is more or less continuous in some places, whilein others, it is intermittent forming irregular patterns. In furtherother places, it is in the form of circular up-arched structures orBMelons^ of varying diameters (20–60 cm) containing puresalt (snowwhite crystals) in their interior (Fig. 16c). Below thesurface sediments, the salt bed forms a continuous or discon-tinuous layer of 5- to 30-cm thickness changing in color fromsnow white to whitish yellow or gray (Fig. 15). It is rather
continuous in the western, southwestern, and southern parts ofthe area while it is intermittent in other parts forming largeburied structures (Melons) of 20–70-cm diameter (Fig. 16c).A section in one of these Melons showed that it is formed ofan outer dark colored crust, an intermediate pare of pearl-colored polycrystalline aggregate of alum of mixed with mi-nor amount of sand, and an interior of polycrystalline saltprecipitates (Fig. 16d).
Zone A of the sabkha represented by trenches T1, T2, andT3 (Figs. 14 and 15). These trenches show that the wholesequence composed of pale gray silt and siltstone with theoccurrence of highly imbedded plant remains with depth. Thisis overlain, sometimes, by laminated, yellowish to reddishbrown sandstone with white alum bed. This, in turn, is over-lain by yellowish white alum crust (Fig. 16e). Alum domesrecorded with depth in the trench to the south boundary of thiszone (T3, Fig. 15). There is general increase in the content ofsand and sandstone from north to south.
Zone BB^ of the sabkha locates to the south of zone A(Figs. 14 and 15). It is represented by trenches T4, T5, andT6 (Fig. 15). The trenches show that this zone is composed ofwet, dark red to violet, medium- to fine-grained silt and sandat the base to pale red sand at the top encrusted with whitefine-grained alum which capped, sometimes, with gypsumcrust (Fig. 17a). Scattered and patches of gypsum is recorded
a b
Fig. 7 Dune mound fixed by palm and dome trees near a Bir Kuryim and b Bir El-Shab south Western Desert
Fig. 8 Longitudinal dune (arrows) fixed by palm, domes trees, andvegetation at Bir El-Shab, south Western Desert
Fig. 9 White efflorescent salt crust (arrows) on the top of the ground atBir El-Shab, south Western Desert
7978 Arab J Geosci (2015) 8:7973–7991

with depth. In the middle part of this zone, the top sandstone isinterlaminated with black organic material which overlain
alayer of yellowish sandstone with the occurrence of scatteredwhite alum crystals (Fig. 17a).
Zone BC^ of the sabkha is to the east of zone B (Figs. 14and 15). It is represented by trenches T7, T8, and T9 (Figs. 15and 17b). This zone consists of gray to yellowish brown mud-stone intercalated with iron oxides (Fig. 17b). This is cappedwith yellowish to yellow silt and sand with intercalated withfine-grained alum and gypsum to the top (Fig. 17c). Blackcrenulated microbial layer is recorded at the top of the sedi-ments to the west of this zone (T7, Fig. 15) which overlainacicular gypsum crystals in sandy layer.
Zone BD^ of the sabkha is to the east of zone A and to thenorth of zoneC (Fig. 14). The gypsum crust is white, from 5 upto 20 cm thick, and it is usually display polygonal fracture and/or ridges (tepee structure). These tepee structures result fromvolume expansion and contraction. This zone is represented bytrenches T10, T11, T12, and T13 (Figs. 14 and 15). It is com-posed of gray to yellow silt and sand in the lower part (Fig. 10)overlain by black lamination with evaporites in the form ofnodules, acicular crystals or forming crust at the top (Fig. 17d).
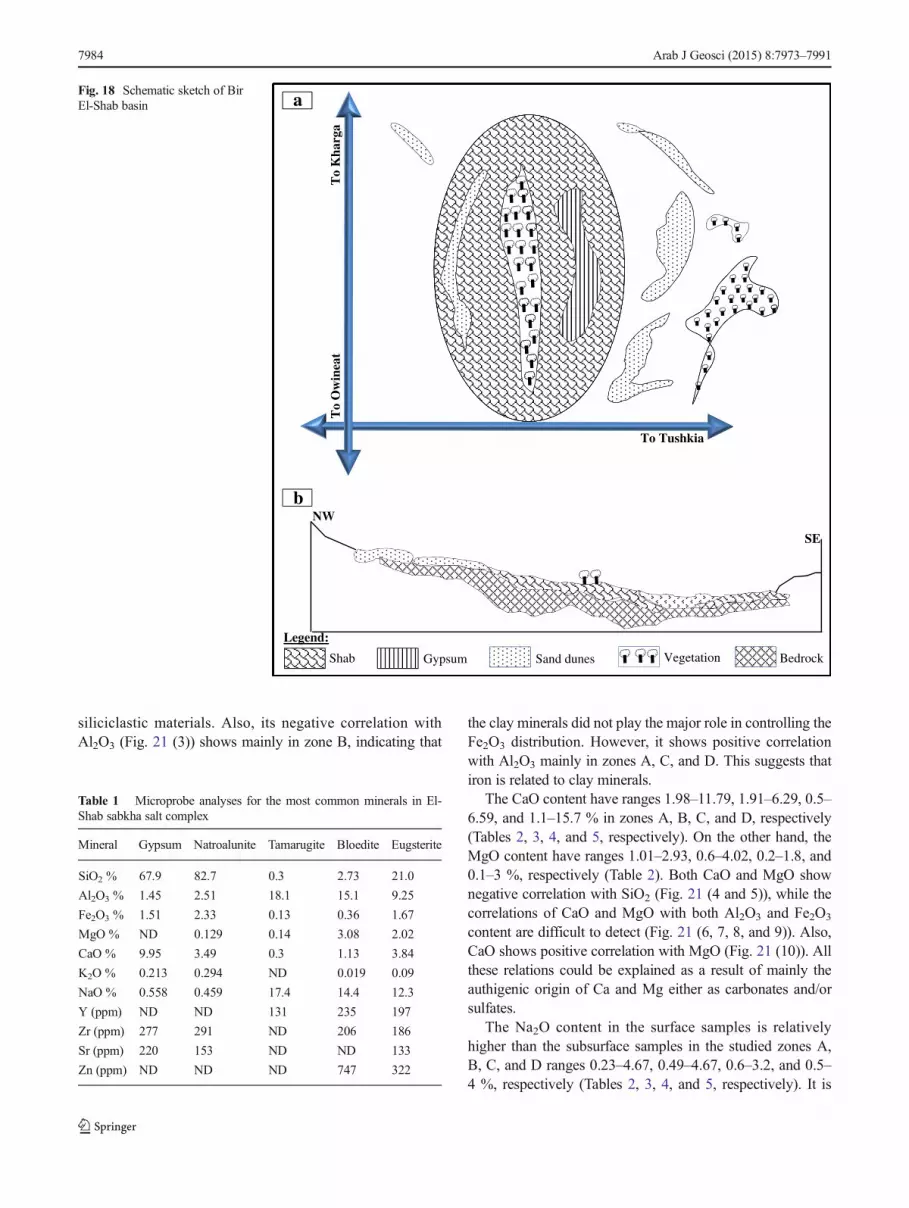
Consequently, from the above description, Bir El-Shab ba-sin can be subdivided into two main parts, alum-rich part tothe west represented by zones A and B (Fig. 14) and gypsum-rich part to the east represented by zones C and D (Fig. 14).Sabkha zones A and B of Bir El-Shab separated by sand dunesas deduces from the top view and cross section of Bir El-Shabbasin (Fig. 18).
Fig. 10 Trench shows horizontal lamination yellow to brown silt andsand with gypsum crust at top (arrows). Playa sediments filling adeflation hollows at Bir El-Shab, south Western Desert
c
a b
d
Fig. 11 Field photos taken NE of Bir El-Shab area, south Western Desert show a large exposure of low elevated weathered granite hillocks, b close-upview of a with the surrounding sand sheet, c dike (arrows) of quartz porphyry trending NE-SW, and d weathered apatite and pegmatite dykes
Arab J Geosci (2015) 8:7973–7991 7979

Mineralogical characteristics of Bir El-Shab sabkha saltcomplex
The identification of the constituting minerals of El-Shabsabkha sediments complex by using the techniques mentionedabove revealed that the sabkha salt complex includes gypsum,natroalunite, tamarugite, bloedite, eugsterite, nitratine, halite,and D’ansite (Table 1).
Gypsum {CaSO4·2H2O} occurs as tabular crystals ofmonoclinic crystal and characterized by yellowish white colorwith relief higher than the canda balsam and weak birefrin-gence. Gypsum crystals occur as scattered rosette crystals inthe beds and as cements (Fig. 19a) that grow between detritalquartz grains. Also, gypsum occurs as continuous crust cov-ering the recent sediments (Fig. 17d), composed of acicularcrystals arranged in aggregates (Fig. 19b). It is also character-ized by vitreous luster. It could be identified by XRD givingits characteristic peaks (Fig. 20a).
Natroalunite {(Na,K)Al3(SO4)·2(OH)6} occurs as rhomb-like, trigonal, and hexagonal crystals of yellowish white andgrayish white colors (Fig. 19c, d). It is characterized by con-choidal fractures and high brittleness which is responsible forits occurrence as small conchoidal fragments. It exhibits acharacteristic pearly luster which distinguishes nautroalunitefrom the other minerals. It is found associating gypsum(Fig. 20a).
Tamarugite {Na2Al(SO4)2·OH·3H2O} is a hydrous sulfateof sodium and aluminum occurring as tabular or short pris-matic colorless of monoclinic crystal system (Fig. 19e, f).XRD analysis confirmed the existence of this mineral compo-sition (Fig. 20b).
a b
c d
Fig. 12 a Basal part of Abu Balls Formation shows paleosol beds, northBir Dibis, south Western Desert. b Surface weathering of ferruginoussilicified rootlets (arrow) in the clay stone of El-Borg Formation, at Bir
Kurayim locality. c Stem leaf print (arrow) in the clay stone of El-BorgFormation, at Bir Kuryum locality. d Dark gray conglomerates at the toppart of El-Borg Formation, south Western Desert
Fig. 13 Upper unite of Nubia Formation, showing white moderatelyhard laminated sandstone, west Bir El-Shab, south Western Desert
7980 Arab J Geosci (2015) 8:7973–7991

Bloedite {Na2Mg (SO4) 4H2O} occurs asmonoclinic crys-tals displaying several colors such as white, gray, or colorlesswith white streak. It is characterized by conchoidal fracturesand vitreous luster (Fig. 19g). Its composition is confirmed byXRD analysis (Fig. 20c).
Eugsterite {Na4Ca (SO4)3·2H2O} occurs as acicular crys-tals of rhombic forms and could be fairly distinguished byXRD analysis (Fig. 20d).
Nitratine {NaNO3} identified only in XRD analysis by itscharacteristic peaks (Fig. 20e).
Halite {NaCl} forms coarse crystals of isometric system. Itdisplays several colors such as white, colorless, and pink withglassy luster and white streak. It is characterized by perfectcleavage in the three directions of the cubic form. XRD anal-ysis shows its characteristic peaks (Fig. 20f).
D’ansite {Na21Mg(SO4)10Cl3} is very difficult to beidentified microscopically, but the XRD analysis coulddistinguish it and showed its characteristic peak(Fig. 20g).
Geochemistry of Sabkha salt complex
Some of the major and trace elements (SiO2, Al2O3, Fe2O3,MgO, CaO, Na2O, K2O, as well as Rb, Ba, Zr, Sr, Y, V, andZn) were measured in 33 representative samples to throwmore light on the geochemistry of the studied sabkha saltcomplex. These samples represent the different facies types(surface and subsurface) of the studied sabkha salt complex ofBir El-Shab. Zone A is represented by ten samples (Table 2),zone B by nine (Table 3), zone C by six samples (Table 4), andzone D by seven samples (Table 5) from about 13 trenchesdrilled in the sabkha. The analytical results of are shown inTables 2, 3, 4, and 5.
Major element geochemistry:
The total SiO2 content have ranges 40.68–62, 55.04–70.15,58.8–73.6, and 50.57–85.58 % of zones A, B, C, and D of BirEl-Shab sabkha sediments, respectively (Tables 2, 3, 4, and 5,
22° 20´ 00˝
22° 19´ 30˝
22° 19´ 00˝
22° 18´ 30˝
To
Kha
rga
29° 45´ 30˝ 29° 46´ 00˝ 29° 46´ 30˝ 29° 47´ 00˝
LEGEND:
To
east
Ow
eina
t
Sand sheet
Zone A
Sand dunes
Zone B
Zone B
Zone A
Hills
Zone C
Farms
Zone D
Road
T1 Trench # 1
Zone D
T10
T9
T8
T7T6
T5
T4
T2
T3
T1
T13
T12
T11
Zone C
1
Fig. 14 Detailed map of Bir El-Shab playa/sabkha zonation and trench locations
Arab J Geosci (2015) 8:7973–7991 7981

respectively). This indicates that zones C and D are character-ized by much more siliciclastic component mainly in the formof detrital quartz grains (Tables 4 and 5). The total Al2O3
content in the four zones have ranges 12.41–16.30, 11.40–17.04, 10.8–15.60, and 2.81–16.06 %, respectively(Tables 2, 3, 4, and 5, respectively) which consistent with thatof SiO2. There is a negative correlation between SiO2 and
Al2O3 (Fig. 21 (1)) indicating that these elements are relatedto the siliciclastic materials.
The total iron content in the form of Fe2O3 ranges 2.4–9.71, 3.1–11.89, 2.4–8.3, and 1.2–4.24 % in zones A, B, C,and D, respectively (Tables 2, 3, 4, and 5, respectively). Itshows negative correlation with SiO2 for all zones (Fig. 21(2)), indicating that the depositional environment poorly in
Fig. 15 Lithologic logs represent the dug trenches in the different zones of Bir El-Shab sabkha
7982 Arab J Geosci (2015) 8:7973–7991

a
Gyp
S
b
m
d
c
Fig. 17 a Trench in zone “B” showing horizontal layering of wetyellowish, dark red silt, and sand at the base to pale red sand at the top(S) intercalated with white fine-grained alum (Alu) and capped withgypsum crust (Gyp). Notice the appearance of water at the baserepresenting water table in the area. b Trench in zone “C” showsintercalation of iron oxides with mudstone (m) at the base and
horizontal laminations of yellowish silt and sand intercalated with whitefine-grained alum and capped with gypsum crust. c Close-up view of bshowing gypsum and fine-grained alum crust at the top (arrow). d Trenchin zone “D” showing fibrous gypsum crystals forming crust at the top(arrows)
a
d
b
e
c
Fig. 16 Incrustation of wind-blown sands with salts in zone A of Bir El-Shab sabkha, southWestern Desert, Egypt. a Polygonal tepee structure. bHard compacted surface of sabkha due to salt encrustation. c Outer dark-colored part of circular up-arched structures or “Melons” (arrows) ofsalts. d Section in one of circular up-arched structures or Melons
showing the inner part of pure salt (snow white crystals ofpolycrystalline aggregate of alum) with minor contamination of sand. eTrench in zoneA showing a horizontal sequence fromwet yellowish sandlayers with dark thin organic matter laminations capped by 15 cm fromalum deposits in Bir El-Shab, south Western Desert, Egypt
Arab J Geosci (2015) 8:7973–7991 7983
siliciclastic materials. Also, its negative correlation withAl2O3 (Fig. 21 (3)) shows mainly in zone B, indicating that
the clay minerals did not play the major role in controlling theFe2O3 distribution. However, it shows positive correlationwith Al2O3 mainly in zones A, C, and D. This suggests thatiron is related to clay minerals.
The CaO content have ranges 1.98–11.79, 1.91–6.29, 0.5–6.59, and 1.1–15.7 % in zones A, B, C, and D, respectively(Tables 2, 3, 4, and 5, respectively). On the other hand, theMgO content have ranges 1.01–2.93, 0.6–4.02, 0.2–1.8, and0.1–3 %, respectively (Table 2). Both CaO and MgO shownegative correlation with SiO2 (Fig. 21 (4 and 5)), while thecorrelations of CaO and MgO with both Al2O3 and Fe2O3
content are difficult to detect (Fig. 21 (6, 7, 8, and 9)). Also,CaO shows positive correlation with MgO (Fig. 21 (10)). Allthese relations could be explained as a result of mainly theauthigenic origin of Ca and Mg either as carbonates and/orsulfates.
The Na2O content in the surface samples is relativelyhigher than the subsurface samples in the studied zones A,B, C, and D ranges 0.23–4.67, 0.49–4.67, 0.6–3.2, and 0.5–4 %, respectively (Tables 2, 3, 4, and 5, respectively). It is
To
Kha
rga
To
Ow
inea
t
a
NWb
Legend:
Shab Gypsum Sand dunes
To Tushkia
Vegetation
SE
Bedrock
Fig. 18 Schematic sketch of BirEl-Shab basin
Table 1 Microprobe analyses for the most common minerals in El-Shab sabkha salt complex
Mineral Gypsum Natroalunite Tamarugite Bloedite Eugsterite
SiO2 % 67.9 82.7 0.3 2.73 21.0
Al2O3 % 1.45 2.51 18.1 15.1 9.25
Fe2O3 % 1.51 2.33 0.13 0.36 1.67
MgO % ND 0.129 0.14 3.08 2.02
CaO % 9.95 3.49 0.3 1.13 3.84
K2O % 0.213 0.294 ND 0.019 0.09
NaO % 0.558 0.459 17.4 14.4 12.3
Y (ppm) ND ND 131 235 197
Zr (ppm) 277 291 ND 206 186
Sr (ppm) 220 153 ND ND 133
Zn (ppm) ND ND ND 747 322
7984 Arab J Geosci (2015) 8:7973–7991

Gy
Qz
Nat
Tam
Qz
Qz
Q
3 µm
200 µm
Qz
200 µm
Ta
Nat
am
30 µm
5 µm
2 µm
m
m
g
a
c
e
b
d
f
400 µm
Fig. 19 a Microphotograph showing gypsum crystals (Gy) cementingquartz grains (Qz), nicols crossed. b SEM image of tabular gypsumcrystals. c Microphotograph showing rhomb-like natroalunite crystals(Nat), plane polarized light. d SEM image of trigonal natroalunite
crystal (Nat). e Tabular or short prismatic tamarugite crystal (Tam),plane polarized light. f SEM image of prismatic tamarugite crystals. gSEM image of bloedite crystals (arrows)
Arab J Geosci (2015) 8:7973–7991 7985

found that there is a positive correlation between Na2O + K2Oand Al2O3 (Fig. 21 (11)), but there is also a poor or negativecorrelation between Na2O and K2O (Fig. 21 (12)). This sug-gesting that these elements are not only sequestered in differ-ent types of clay minerals but also precipitated from thesabkha brines.
Trace element geochemistry
Trace element contents are variable in the different zones(Tables 2, 3, 4, and 5). This is illustrated by the variation
diagrams plotted between the different trace elements versusthe major oxides and versus each other (Fig. 21).
The Rb content of the surface samples in different studiedzones ranges 7–36, 10–33, 11–35, and 11–22 ppm (Tables 2,3, 4, and 5, respectively). It is found that Rb has positivecorrelation with Al2O3 and K2O in the sediments of zone D(Fig. 21 (13 and 14)) and positive correlation with Ba and Srin the sediments of zones A and D (Fig. 21 (15 and 16)). Rbshows negative correlation Ba and K2O especially in zones A,B, and C, also between Ba and SiO2, but the negative corre-lation between Rb and Sr show in zones B and C. The
a
b
c
g
d
e
f
Fig. 20 Representative XRD chart of Bir El-Shab sabkha salt complex
7986 Arab J Geosci (2015) 8:7973–7991

difference in correlation between these elements related tosabkha brines which formed sabkha salt complex.
The Sr content in different studied zones ranges 19–105, 2–78,14–47, and 29–140 ppm, respectively (Tables 2, 3, 4, and5, respectively). Sr and CaO show negative correlation inzones A and D (Fig. 21 (17)) suggested that the CaO
disappeared in both zones. However, in zones B and C, thisrelation shows positive correlation (Fig. 21 (17)), indicatingthe authigenic nature and direct coprecipitation of Sr withCaO from sabkha brines.
The Ba content show more or less similar distribution tothat of SiO2, Fe2O3, and Rb, where it ranges 77–2,589, 78–1,
Table 2 Major oxides (wt%) andtrace elements (ppm) of recent saltcomplex in zone BA^ of Bir El-Shab sabkha
Zone BA^
Sample no. T1.1 T1.2 T1.3 T2.1 T3.3 T3.4 T3.5 T3.6 T3.7 T3.8
Major oxides (wt%)
SiO2 40.68 52.17 56.74 56.3 62 60.07 60.28 48.56 53.3 55.05
Al2O3 15.16 14.8 16.24 16.3 14.87 14.92 14.52 13.22 13.94 12.41
Fe2O3 4.21 2.7 4.4 4.75 8.13 9.63 9.71 3.41 2.4 2.86
MgO 2.93 2.4 2.58 2.88 0.95 1.05 1.01 1.95 0.72 2.2
CaO 11.79 7.3 6.81 6.84 2.02 1.98 2 8.96 4.6 7.42
Na2O 4.67 3.4 4.14 4.11 0.51 0.56 0.61 0.63 2.3 0.48
K2O 2.93 4.7 2.42 2.28 3.21 3.03 3.02 2.86 4.3 3.17
LOI 2.68 2.9 3.61 3.33 5.94 6.25 6.21 2.86 3.1 3.05
Trace elements (ppm)
Ba 330 1929 2589 1688 1084 78.00 604 83 77 78
Rb 12 28 34 9 11 7 18 36 14 7
Sr 19 64 80 47 105 69 40 28 94 69
Y 77 59 11 2 9 2 11 53 2 2
Zr 71 255 199 175 192 96 112 23 188 96
Zn 7 52 22 11 4 21 3 298 32 21
V 34 156 227 147 35 5 38 5 6 5
Table 3 Major oxides (wt%) andtrace elements (ppm) of recent saltcomplex in zone BB^ of Bir El-Shab sabkha
Zone BB^
Sample no. T4.2 T5.2 T6.3 T6.4 T6.5 T6.6 T6.7 T6.8 T6.9
Major oxides (wt%)
SiO2 55.04 58.3 59.76 62.51 60.81 58.46 60.49 60.05 70.15
Al2O3 17.04 12.34 13.84 14.99 14.27 13.23 14.91 15.45 11.4
Fe2O3 3.9 11.89 10.73 6.92 9.2 8.5 7.94 7.86 3.1
MgO 4.02 1.04 1.11 1.02 1.13 3.61 1.04 1.17 0.6
CaO 6.29 2.63 2.12 2.24 1.91 2.35 2.84 2.55 0.84
Na2O 4.67 0.7 0.49 0.62 0.49 3.21 0.51 0.46 0.8
K2O 2.93 3.24 3.09 3.11 3.13 2.1 3.2 3.17 4.4
LOI 3.7 6.28 5.81 5.89 6.11 5.12 5.75 6.08 2.5
Trace elements (ppm)
Ba 735 118 1256 918 84.00 83.00 114.00 87 78
Rb 12 10 16 18 12 33 29 20 13
Sr 54 78 73 23 2 17 18 18 11
Y 5 2 2 2 2 2 2 2 2
Zr 73 245 172 411 191 243 337 333 96
Zn 6 24 4 3 15 20 20 16 24
V 28 9 64 56 4 5 5 6 3
Arab J Geosci (2015) 8:7973–7991 7987

256, 65–2,109, and 38–1,830 ppm in zones A, B, C, and D,respectively (Tables 2, 3, 4, and 5, respectively). The positivecorrelation between the Ba and Rb contents (Fig. 21 (15))indicates the multi-genetic nature of Ba in these deposits. Inaddition, its higher enrichments in zones A and D deposits can
be related to higher biogenic activity similar to iron enrich-ments (Tables 2 and 5). Ba and Sr show positive correlation(Fig. 21 (18)) whereas there is negative correlation betweenBa and K2O (Fig. 21 (19)). However, there is positive corre-lation in some zones and negative correlation in other zonesbetween Ba and SiO2 contents (Fig. 21 (20)) as well as theenrichment of Ba in zones A and D than the other zones. Thiscould be related to the presence of detrital barite derived frombedrocks.
The Zr content ranges 23–255, 73–411, 76–407, and 83–729 ppm in zones A, B, C, and D, respectively (Tables 2, 3, 4,and 5, respectively). Zr and SiO2 show positive correlation(Fig. 21 (21)).
The Y content ranges 2–77, 2–5, 2–109, and 2–62 ppm inzones A, B, C, and D, respectively (Tables 2, 3, 4, and 5,respectively). Y content shows negative correlation with bothSiO2 and Zr contents (Fig. 21 (22 and 23)). The distribution ofthese elements is related to the siliciclastic deposits in thesezones.
The V content ranges 5–227, 3–64, 6–223, and 2–206 ppmin zones A, B, C, and D, respectively (Tables 2, 3, 4, and 5,respectively). V content shows positive correlations with bothSiO2 and Fe2O3 contents (Fig. 21 (24 and 25)). This suggeststheir detrital nature. However, the significant enrichment of Vin most zone deposits can be related to different source rocks.
The Zn contents ranges 3–298, 3–24, 4–260, and 3–342 ppm in zones A, B, C, and D, respectively (Tables 2, 3,4, and 5, respectively). Zn shows negative correlation withboth Fe2O3 and Ba (Fig. 21 (26 and 27)). These elementsare carried to the depositional sites adsorbed on clay minerals.
Summary and conclusions
Bir El Shab area occupies the depression between the elevatedlands in the southern Nakhlai-Shab pediplain, souh WesternDesert, Egypt. The area is characterized by a large number ofresidual hills which are usually isolated, conical, and/or flat-topped surfaces (Fig. 6). Several hills of low relief composedof sandstone, siltstone, and claystone are laid down on thewestern side of the depression. Sand dunes and sand accumu-lations cover most of the studied area (Fig. 1). The area iscovered with different rock units ranging in age from EarlyCretaceous to Quaternary. These rock units are classifiedstratigraphically into the following rock units from top to bot-tom: Quaternary deposits (playa, sabkha, salt deposits, andaeolian sand accumulations), Tertiary (basalt), Upper Creta-ceous (Nubia Formation), Lower Cretaceous (El-Borg Forma-tion and Abu Ballas Formation), and the basement rocks(granites). The area is intersected by several dikes includesquartz porphyry dikes (Fig. 11). Apatites and pegmatite dikeshave been observed.
Table 4 Major oxides (wt%) and trace elements (ppm) of recent saltcomplex in zone BC^ of Bir El-Shab sabkha
Zone BC^
Sample no. T7.1 T8.1 T8.2 T8.3 T9.1 T9.3
Major oxides (wt%)
SiO2 64.0 66.3 72.8 73.6 60.0 58.8
Al2O3 15.6 11.5 10.8 11.1 14.76 15
Fe2O3 2.4 4.7 3.3 3 3 8.3
MgO 1.8 1.2 0.5 0.2 1.7 0.5
CaO 2.2 4.2 0.5 1.9 6.59 1.3
Na2O 3.1 2.2 0.8 0.6 1.6 3.2
K2O 6.4 5.4 4.2 4.6 2.53 3.3
LOI 3.2 2.7 3 2.9 5.52 3.8
Trace elements (ppm)
Ba 853 65 80 76 1006 2109
Rb 11 35 11 17 19 21
Sr 47 32 14 17 39 33
Y 29 109 2 2 2 2
Zr 76 407 348 199 355 392
28 260 13 12 4 5
V 54 6 8 7 119 223
Table 5 Major oxides (wt%) and trace elements (ppm) of recent saltcomplex in zone BD^ of Bir El-Shab sabkha
Zone BD^
T10.1 T10.5 T11.2 T12.1 T12.2 T13.1 T13.4
55.08 58.75 85.58 60.5 73.2 50.57 55.5
16.06 14.61 2.81 14.11 10.2 12.81 12.4
4.24 3.05 1.2 3.02 2.9 3.2 2.4
3 1.63 1.05 1.64 0.1 1.05 1.4
7.71 7.02 2.7 6.05 1.1 15.7 5.1
4 3.23 0.56 3.01 0.5 0.55 2.9
2.2 2.46 1.86 2.1 4.4 1.81 3.9
3.72 5.01 1.66 5.92 3.50 1.61 3.4
1830 488 464 1181 218 38 228
13 11 13 15 20 22 22
98 29 29 56 140 50 91
2 2 11 2 2 62 6
452 83 144 148 576 187 729
3 4 3 5 37 342 129
206 27 32 45 15 3 17
7988 Arab J Geosci (2015) 8:7973–7991

El-Borg Formation is well developed to the south of Bir El-Shab area at G. El Qara composing of kaolinitic sandstone,white in color at the base and very fine sandy size. NubiaFormation is well developed to the east and southeast of Bir
El-Shab. In the present work, Quaternary deposits includingplaya/sabkha deposits are distributed in many parts of thestudied areas where Bir El-Shab sabkha is divided into fourzones: A, B, C, and D (Fig. 14).
-800 -400 0 400 80040
60
80
100
Zr (ppm)
SiO
2%
-200 -100 0 100 20040
60
80
100
Y( ppm)
SiO
2%
-200 -100 0 100 200-800
-400
0
400
800
Zr
(ppm
)
Y (ppm)
-300 -150 0 150 30040
60
80
100
V (ppm)
SiO
2%
V (ppm)-300 -100 100 3000
10
20
Fe 2
O3
%
0 300 600 9000
10
20
Zn (ppm)
Fe 2
O3
%
0 200 400 600 8000
1000
2000
3000
Zn (ppm)
Ba
(ppm
)
Legend:
= area "A" = area "B" = area "C" = area "D"
30 50 70 900
2
4
SiO2 %
MgO
%
40 50 60 70 80 900
4
8
12
16
20
SiO2%
Al 2O
3%
SiO2%30 60 90 120
0
6
12
18
Fe 2
O3
(%)
020100
10
20
Al2O3 %
Fe 2
O3%
30 50 70 900
6
12
18
SiO2%
CaO
%
1 2 3 4 5
0 4 8 12 160
2
4
CaO %
MgO
%
0 5 10 15 20 250
2
4
Al2O3 %
MgO
%
0 5 10 150
10
20
Fe2O3 %
CaO
%
020100
10
20
Al2O3 %
CaO
%
0 5 10 150
2
4
Fe2O3 %
MgO
%
6 7 8 9 10
0 5 10 15 20 252
6
10
14
18
Al2O3 %
Na 2
O+K
2O%
0 2 4 60
2
4
6
8
Na2O %
K2O
%
5 15 25 35 452
6
10
14
18
Al 2O
3%
Rb( ppm)0 10 20 30 40
0
2
4
6
8
Rb (ppm)
K2O
%
5 15 25 35 45
0
1000
2000
3000
Ba
(ppm
)
Rb (ppm)
11 12 13 14 15
0 1000 2000 30000
2
4
6
8
Ba (ppm)
K2O
%
5 15 25 35 450
50
100
150
200
Rb( ppm)
Sr(p
pm)
00200100
10
20
Sr (ppm)
CaO
%
0 1000 2000 30000
50
100
150
200
Ba( ppm)
Sr(p
pm)
0 1000 2000 300040
60
80
100
SiO
2%
Ba (ppm)
16 17 18 19 20
21 22 23 24 25
26 27 28 29 30
Fig. 21 Variation diagrams for major and trace elements of the surface samples in different zones of Bir El-Shab sabkha deposits
Arab J Geosci (2015) 8:7973–7991 7989

Zone A of the sabkha characterized by the prevailing ofsandstone, silt and siltstone with the occurrence of plant re-mains with depth (Figs. 14 and 15). This zone characterizedby the occurrence of alum crust (Fig. 16e) which underlain byalum beds. Alum domes recorded with depth in the trench tothe southern boundary of this zone (T3, Fig. 15). In this zone,there is generally an increase in the content of sands and sand-stone from north to south.
Zone B of the sabkha located to the south of zone A(Figs. 14 and 15). This zone includes wet silt and sands atthe base to encrusted sand at the top with alum and the lattersometimes capped with gypsum crust (Fig. 17a). In this zone,scattered and patches of gypsum is recorded with depth. In themiddle part of this zone, the top sandstone is interlaminatedwith black organic material which overlain a layer of yellow-ish sandstone with the occurrence of scattered white alumcrystals (Fig. 17a).
Zone C of the sabkha is to the east of zone B (Figs. 14 and15) including mudstone intercalated with iron oxides(Fig. 17a). This is capped with alum and gypsum to the top(Fig. 17a). Black crenulated microbial layer is recorded at thetop of the sediments to the west of this zone which overlainacicular gypsum crystals in sandy layer.
Zone D of the sabkha is to the east of zone A and to thenorth of zone C (Fig. 14). This zone includes gypsum crustwhich usually displays polygonal fracture and/or ridges (tepeestructure). These tepee structures result from volume expan-sion and contraction.
Mineralogically, Bir El-Shab salt complex includesqypsum, natroalunite, tamarugite, bloedite, eugsterite,nitratine, halite, and D’ansite. The existence of eugsterite inthe surface horizon could be aided by high Na/Ca ratios (morethan 4) and increased Cl levels (Vergouwen 1981). Also,eugsterite is a very common salt mineral which forms duringevaporation of nonalkaline water at 60 °C (Vergouwen 1981;Fitzpatrick et al. 2010). The presence of tamarugite indicatessufficiently strong acid conditions (Topper et al. 2014).
The geochemical characteristics of Quaternary salt com-plex in Bir El-Shab are studied. The geochemistry of majorand trace elements of sabkha deposits indicates that SiO2 andAl2O3 elements are related to the siliciclastic component. Theclay minerals did not play the major role in controlling theFe2O3 distribution in zone B of the sabkha. However, at zonesA, C, and D, the iron is related to clay minerals. The Ca andMg elements are mainly of authigenic origin either as carbon-ates and/or sulfates. The Na2O and K2O elements are not onlyincorporated in different types of clay minerals but also pre-cipitated from the sabkha brines. The difference in correlationbetween Rb and Sr elements is related to sabkha brines whichformed sabkha salt complex. The Sr element in zone A andzone D indicates that the Ca content disappears in both areas.However, in zones B and C, it indicates its authigenic originand direct coprecipitation with Ca from sabkha brines. The
correlation between Ba and Rb contents is indicative of themultigenetic origin of Ba in these deposits. Enrichment of Bain both zones A and D than the other areas could be related topresence of detrital barite derived from bedrocks. The Zr andY elements are related to the siliciclastic component in thesedeposits. The V content can be related to derivation fromdifferent source rocks. The Zn is carried to the depositionalsites and then adsorbed on clay minerals.
Acknowledgments The authors would like to express their grateful toall the stuff members and employee of Nuclear Materials Authority(NMA) of Egypt for kind assistance and great help during the progressof this work.
References
Abu Al-Izz MS (1971) Landforms of Egypt. Amer Univ, Cairo press, p281
Afifi NM (2001) Geology and uranium potentiality of radioactive anom-alies in Nusab El-Balgoum area, Western Desert, Egypt. M Sc the-sis, FacSci, El Mansoura Univ, Egypt, p 170
Albritton CC, Brooks JE, Issawi B, Swedan A (1990) Origin of theQattara depression, Egypt. Geol Soc Amer Bull 102:952–960
Barthel KW, Boettcher R (1978) Abu Ballas formation: a significantlithostratigrahpic unit of the former BNubian Series^. Mitt BayerStaats Palaontol Hist Geol 18:153–166
El Deftar T (ed) (1988) Internal report on south Western Desert. GeolSurv Auth, Egypt, p 29
Fitzpatrick R, Paul Shand P, RavenM,McClure S (2010) Occurrence andenvironmental significance of sideronatrite and other mineral pre-cipitates in Acid Sulfate Soils. 19th World Cong Soil Sci, SoilSolutions for a Changing World, Brisbane, Australia, 80–83
Glennie KW (1970) Desert sedimentary environments. Developments inSedimentology, 14, El Sevier Publ Co, p 222
Haynes CV (1980) Geological evidence of pluvial climates in the Nabtaarea of the Western Desert, Egypt. In: Wendrof F, Schild R (eds)Prehistory of the Eastern Sahara. Academic, NewYork, pp p. 353–p.371
Haynes CV (1982) Great sand sea and Selima sand sheet, Eastern Sahara:geochronology and desertification. Science 217:627–633
Henning D, Flohn H (1977) Climate aridity index map. MN ConfDesertification, Nairobi, UNEP, UN Foc AlConf74/31
Hussein HK (2002) Geology and radioactivity of Bir Abu El Husseinarea, south Western Desert, Egypt. MSc thesis, Geol Dept, FacSci, Cairo Univ, Egypt, p 87
Issawi B (1971) Geology of Darb El Arbain, Western Desert. AnnalsGeol Surv Egypt 1:53–92
Kehl H, Bornkamm R (1993) Landscape ecology and vegetation units ofthe Western Desert of Egypt. Catena Supp 26:155–178
Klitzsch E (1984) Northwestern Sudan and bordering areas: geologicaldevelopment since Cambrian time. Berliner Geowiss Abh A 50:23–45
Klitzsch E, Lejal-Nicol A (1984) Flora and fauna from strata in southernEgypt and northern Sudan. Berlin Geowissenschaft Abhand LungenA 50:47–79
Kröpelin S (1993) Geomorphology, landscape evolution and paleo-climates of south West Desert, Egypt. In: Meissner B, Wycisk P(eds) Geopotential and ecology (analysis of a desert region),Catena Supplement 26, p 199
7990 Arab J Geosci (2015) 8:7973–7991

Norrish K, Chappell BW (1966) X-ray fluorescence spectrography. In:Zussman J (ed) Physical methods of determinative mineralogy.Academic, New York, pp 161–214
Said R (1962) The geology of Egypt. Elsevier, p 377Said R (1983) Remarks on the origin of the landscape of the Eastern
Sahara. J Afr Earth Sci 1:153–158Shapiro L, Brannock WW (1962) Rapid analysis of silicates, carbonates
and phosphate rocks. US Geol Surv Bull :1144-A, p 56
Topper RPM, Lugli S, Manzi V, Roveri M, Meijer PT (2014)Precessional control of Sr ratios in marginal basins during theMessinian Salinity Crisis? Geochem Geophys Geosys. doi:10.1002/2013GC005192
Vergouwen L (1981) Eugsterite, a new salt mineral. Amer Mineralog 66:632–636
Walther J (1912) Das gesetz der wüstenbildung in Gegenwart undVorzeit. Quele and Meyer, Leipzig, 342 p
Arab J Geosci (2015) 8:7973–7991 7991