Relations between variability in the Mediterranean region and mid-latitude variability
48
Chapter 3 Relations between Variability in the Mediterranean Region and Mid-latitude Variability Ricardo Trigo, 1 Elena Xoplaki, 2 Eduardo Zorita, 3 Ju¨rg Luterbacher, 2 Simon O. Krichak, 4 Pinhas Alpert, 4 Jucundus Jacobeit, 5 Jon Sa´enz, 6 Jesu´s Ferna´ndez, 3 Fidel Gonza´lez-Rouco, 7 Ricardo Garcia-Herrera, 7 Xavier Rodo, 8 Michele Brunetti, 9 Teresa Nanni, 9 Maurizio Maugeri, 10 Murat Tu¨rkes° , 11 Luis Gimeno, 12 Pedro Ribera, 13 Manola Brunet, 14 Isabel F. Trigo, 15 Michel Crepon 16 and Annarita Mariotti 17 1 CGUL at University of Lisbon and Universidade Luso ´fona, Portugal ([email protected]) 2 Institute of Geography and NCCR Climate, University of Bern, Bern, Switzerland ([email protected], [email protected]) 3 GKSS Research Centre, Germany ([email protected], [email protected]) 4 Tel Aviv University, Israel ([email protected], [email protected]) 5 Institute of Geography, University of Augsburg, Germany ([email protected]) 6 Department of Applied Physics II, University of the Basque Country, Spain ([email protected]) 7 Dto Fı´sica de la Tierra II, Universidad Complutense, Madrid, Spain ([email protected], [email protected]) 8 ICREA and Climate Research Laboratory, PCB-University of Barcelona, Spain ([email protected]) 9 Institute of Atmospheric Sciences and Climate, National Research Council, Bologna, Italy ([email protected], [email protected]) 10 Istituto di Fisica Generale Applicata, University of Milan, Milan, Italy ([email protected]) 11 Department of Geography, Faculty of Sciences and Arts, C ¸ anakkale Onsekiz Mart University, C ¸ anakkale, Turkey ([email protected]) 12 Facultad de Ciencias de Ourense, Universidad de Vigo, Ourense, Spain ([email protected]) 13 Departamento de Ciencias Ambientales, Universidad Pablo de Olavide de Sevilla, Ctra Utrera, Km 1, Spain ([email protected])
-
Upload
independent -
Category
Documents
-
view
3 -
download
0
Transcript of Relations between variability in the Mediterranean region and mid-latitude variability

Chapter 3
Relations between Variability in
the Mediterranean Region and
Mid-latitude Variability
Ricardo Trigo,1 Elena Xoplaki,2 Eduardo Zorita,3 Jurg Luterbacher,2
Simon O. Krichak,4 Pinhas Alpert,4 Jucundus Jacobeit,5 Jon Saenz,6
Jesus Fernandez,3 Fidel Gonzalez-Rouco,7 Ricardo Garcia-Herrera,7
Xavier Rodo,8 Michele Brunetti,9 Teresa Nanni,9 Maurizio Maugeri,10
Murat Turkes� ,11 Luis Gimeno,12 Pedro Ribera,13 Manola Brunet,14
Isabel F. Trigo,15 Michel Crepon16 and Annarita Mariotti17
1CGUL at University of Lisbon and Universidade Lusofona, Portugal([email protected])2Institute of Geography and NCCR Climate, University of Bern, Bern, Switzerland([email protected], [email protected])3GKSS Research Centre, Germany([email protected], [email protected])4Tel Aviv University, Israel ([email protected], [email protected])5Institute of Geography, University of Augsburg, Germany([email protected])6Department of Applied Physics II, University of the Basque Country, Spain([email protected])7Dto Fısica de la Tierra II, Universidad Complutense, Madrid, Spain([email protected], [email protected])8ICREA and Climate Research Laboratory, PCB-University of Barcelona, Spain([email protected])9Institute of Atmospheric Sciences and Climate, National Research Council,Bologna, Italy([email protected], [email protected])10Istituto di Fisica Generale Applicata, University of Milan, Milan, Italy([email protected])11Department of Geography, Faculty of Sciences and Arts, Canakkale OnsekizMart University, Canakkale, Turkey ([email protected])12Facultad de Ciencias de Ourense, Universidad de Vigo, Ourense, Spain([email protected])13Departamento de Ciencias Ambientales, Universidad Pablo de Olavide de Sevilla,Ctra Utrera, Km 1, Spain ([email protected])

14Climate Change Research Group, University Rovira i Virgili, Tarragona, Spain([email protected])15Instituto de Meteorologia and CGUL at University of Lisbon([email protected])16LODYC BC 100, Universite P.-et-M.-Curie, Paris, France([email protected])17Earth System Science Interdisciplinary Center, USA and ENEA, Italy([email protected])
3.1. Introduction
The Mediterranean climate is under the influence of both tropical and mid-
latitude climate dynamics, being directly affected by continental and maritime air
masses with significant origin differences (Barry and Chorley, 2003). In this
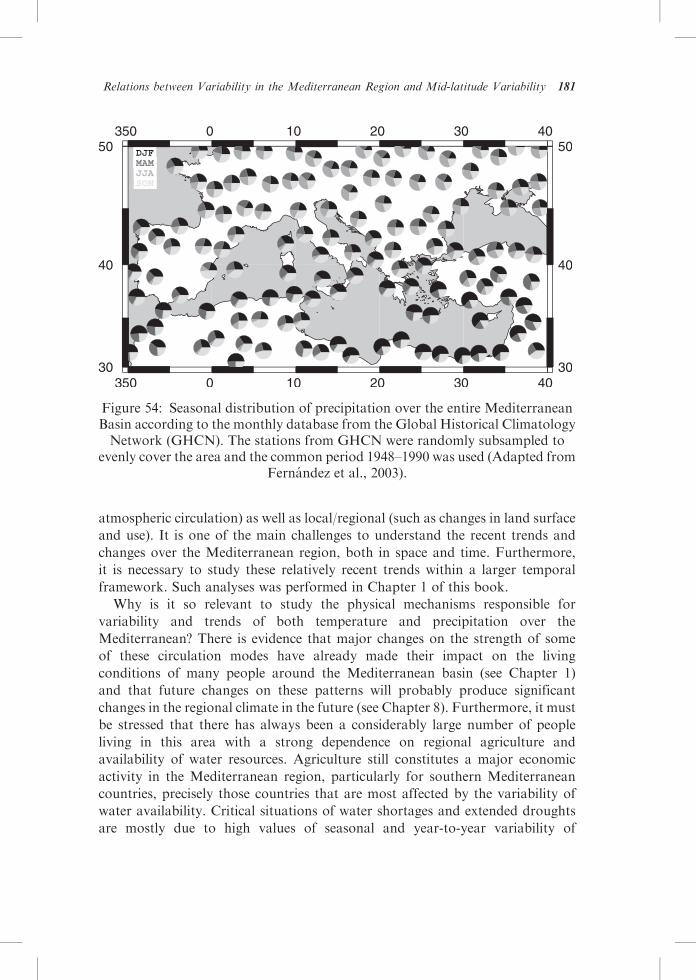
region, most of the precipitation occurs from October to March (Xoplaki, 2002).
The peak of the winter season occurs between December and February, when
the mid-latitude cyclone belt has usually reached its southernmost position
(e.g. HMSO, 1962). However, spring and autumn also contribute to a signifi-
cant amount of precipitation (Fig. 54).
Being located at the southern limit of the North Atlantic storm tracks, the
Mediterranean region is particularly sensitive to interannual shifts in the
trajectories of mid-latitude cyclones that can lead to remarkable anomalies of
precipitation and, to a lesser extent, of temperature. Given the seasonal
characteristics of the Atlantic storm-tracks, this is particularly true in winter
when the influence of mid-latitude variability is at its greatest. In the transition
seasons, and especially in summer, this influence needs to be considered along
with other factors including that of tropical climate. Storm-track variability
impacts primarily the western Mediterranean, but it has also a signature clearly
detected in the eastern Mediterranean as well. The complex orography that
characterizes most regions surrounding the Mediterranean basin can modulate
and even distort climate anomaly patterns that otherwise would be geographi-
cally much more homogenous. For instance, the interplay between orography
and thermal contrast between advected Atlantic air masses and Mediterranean
temperatures has a huge impact on the development of Mediterranean storms
(Trigo et al., 2002a), which can produce violent precipitation extremes at the
end of the summer season.
Observational studies indicate significant climate trends on different time
scales in the Atlantic–European area, including the larger Mediterranean area.
The physical processes responsible for these trends and changes seem to be
hemispheric to global (such as external forcings and changes in the large-scale
180 Mediterranean Climate Variability
atmospheric circulation) as well as local/regional (such as changes in land surface
and use). It is one of the main challenges to understand the recent trends and
changes over the Mediterranean region, both in space and time. Furthermore,
it is necessary to study these relatively recent trends within a larger temporal
framework. Such analyses was performed in Chapter 1 of this book.
Why is it so relevant to study the physical mechanisms responsible for
variability and trends of both temperature and precipitation over the
Mediterranean? There is evidence that major changes on the strength of some
of these circulation modes have already made their impact on the living
conditions of many people around the Mediterranean basin (see Chapter 1)
and that future changes on these patterns will probably produce significant
changes in the regional climate in the future (see Chapter 8). Furthermore, it must
be stressed that there has always been a considerably large number of people
living in this area with a strong dependence on regional agriculture and
availability of water resources. Agriculture still constitutes a major economic
activity in the Mediterranean region, particularly for southern Mediterranean
countries, precisely those countries that are most affected by the variability of
water availability. Critical situations of water shortages and extended droughts
are mostly due to high values of seasonal and year-to-year variability of
Figure 54: Seasonal distribution of precipitation over the entire MediterraneanBasin according to the monthly database from the Global Historical ClimatologyNetwork (GHCN). The stations from GHCN were randomly subsampled to
evenly cover the area and the common period 1948–1990 was used (Adapted fromFernandez et al., 2003).
Relations between Variability in the Mediterranean Region and Mid-latitude Variability 181

precipitation. The impact of temperature and precipitation on most crop yields is
mostly dependent on changes in the seasonal cycle of these parameters, rather
than on fluctuation of their annual average value (Rotter and van de Geijn,
1999). In this temperate climate, the most important variable is related to the
presence or lack of water. Lack of water in winter and spring will be reflected in
the crop yield. However, too much water in winter can be harmful by drowning
the seeds and retarding root development (Xoplaki et al., 2001). The variability of
precipitation plays a crucial role in the management of regional agriculture, in
environment, in water resources and ecosystems as well as social development
and behaviour (Xoplaki, 2002).
3.2. Mid-latitude Modes of Atmospheric Variability
and their Impact
It is now widely accepted that most large-scale modes of atmospheric circulation
in the Northern Hemisphere have been described previously in literature (Wallace
and Gutzler, 1981; Barnston and Livezey, 1987). It should be stressed that the
relevance of these modes is seasonally dependent, i.e. they have a signature only
during part of the year (Barnston and Livezey, 1987). Different approaches have
been developed over the last decade to assess the impact of the most relevant
modes on the Mediterranean climate, mostly in terms of precipitation and
temperature fields. Generally speaking, these studies can be clustered within two
different approaches (Yarnal, 1993):
(a) Studies based on atmospheric circulation indices independently from surface
climate parameters. These include the pioneering work on blocking episodes
by Rex (1950a,b, 1951) and, more recently on the North Atlantic Oscillation
pattern (Hurrell, 1995). At shorter spatio-temporal scales, there are various
regional classification schemes such as the Lamb Weather Types for the UK
(Lamb, 1972) and the Grosswetterlagen catalogues (Hess and Brezowski,
1977) for central Europe.
(b) Methods that incorporate both atmospheric circulation and surface climatic
fields, often based on eigenvalue techniques (e.g. CCA, SVD). Some of these
works have focused on the Mediterranean basin (e.g. Corte-Real et al., 1995;
Dunkeloh and Jacobeit, 2003; Xoplaki et al., 2000, 2003a,b, 2004; Valero
et al., 2004).
Despite their different methodologies, these studies tend to agree that the most
important mid-latitude modes for the Mediterranean climate at the monthly
time-scale are: (a) the North Atlantic Oscillation (NAO), (b) the Eastern Atlantic
182 Mediterranean Climate Variability
(EA) pattern and Eastern Atlantic/Western Russia pattern (EA/WR; EU2
of Barnston and Livezey, 1987), and (c) the Scandinavian pattern (SCAND;
EU1 of Barnston and Livezey, 1987). Naturally we will focus our analysis on the
impact of these modes that affect most significantly the Mediterranean Basin.
It is worth noticing that the impact of the most important circulation patterns
on the Mediterranean climate in historical times was addressed in Chapter 1 of
this book.
Traditionally, studies on large-scale patterns and climate trends have been
carried out by slightly different research communities, with the former being
mostly developed by dynamical meteorologists and the latter mainly by clima-
tologists and geographers. This framework has changed considerably in the last
two decades, but it is still reflected in the way this chapter was organized, with
some issues analysed from more than one viewpoint. Section 3.2 describes the
most important large-scale modes that have been recognized to impact signifi-
cantly the climate of the Mediterranean region. Sections 3.3 and 3.4 analyse
the influence of these circulation modes in the variability throughout the
twentieth century of the temperature and precipitation fields. Section 3.5
addresses again the impact of these patterns to account for the observed trends
of climatic variables within the Mediterranean basin. Despite our best efforts,
we acknowledge that with this sequential approach, some repetitions of issues
have become inevitable.
3.2.1. The North Atlantic Oscillation Pattern
The North Atlantic Oscillation has been identified for more than 70 years as one
of the major patterns of atmospheric variability in the Northern Hemisphere
(Walker, 1924). However, it has only become the subject of a wider interest
in recent years (e.g. van Loon and Rogers, 1978; Rogers, 1984; Barnston and
Livezey, 1987; Lamb and Peppler, 1987; Hurrell, 1995; Hurrell and van Loon,
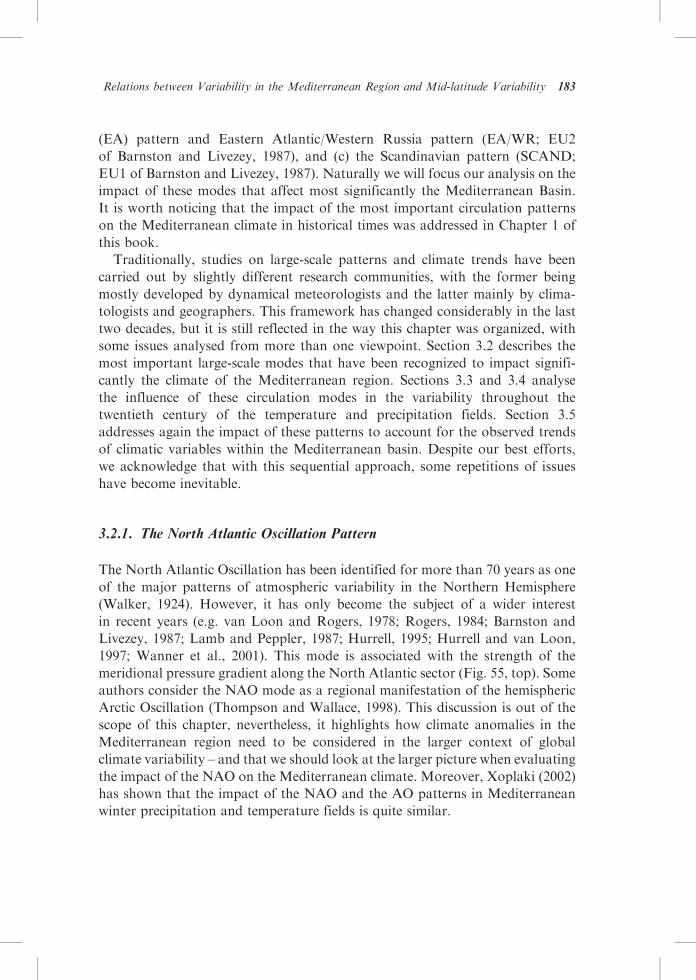
1997; Wanner et al., 2001). This mode is associated with the strength of the
meridional pressure gradient along the North Atlantic sector (Fig. 55, top). Some
authors consider the NAO mode as a regional manifestation of the hemispheric
Arctic Oscillation (Thompson and Wallace, 1998). This discussion is out of the
scope of this chapter, nevertheless, it highlights how climate anomalies in the
Mediterranean region need to be considered in the larger context of global
climate variability – and that we should look at the larger picture when evaluating
the impact of the NAO on the Mediterranean climate. Moreover, Xoplaki (2002)
has shown that the impact of the NAO and the AO patterns in Mediterranean
winter precipitation and temperature fields is quite similar.
Relations between Variability in the Mediterranean Region and Mid-latitude Variability 183
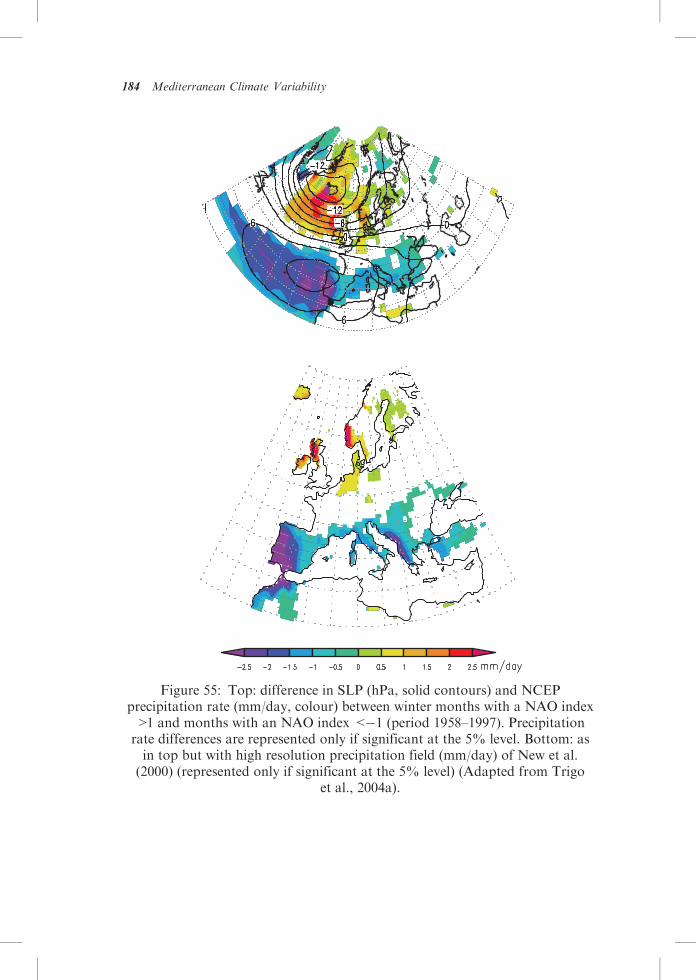
Figure 55: Top: difference in SLP (hPa, solid contours) and NCEPprecipitation rate (mm/day, colour) between winter months with a NAO index>1 and months with an NAO index <�1 (period 1958–1997). Precipitationrate differences are represented only if significant at the 5% level. Bottom: asin top but with high resolution precipitation field (mm/day) of New et al.(2000) (represented only if significant at the 5% level) (Adapted from Trigo
et al., 2004a).
184 Mediterranean Climate Variability

Since the pioneering work by Lamb and Peppler (1987), most works for the
Mediterranean area have been focused on the impact of the NAO during the
winter season (December to March) when its impact is greatest, particularly for
precipitation (Rodrıguez-Fonseca and Castro, 2002). This control exerted by
NAO on the precipitation field is related to corresponding changes in the
associated activity of North-Atlantic storm tracks that affect most of western
Europe (Osborn et al., 1999; Ulbrich et al., 1999; Goodess and Jones, 2002; Trigo
et al., 2002b) and the Eastern Mediterranean such as in Turkey (Turkes� andErlat, 2003, 2005). Using high and (low) NAO index composites, Trigo et al.
(2002b, 2004a) have shown anomaly fields of climate variables and their
associated physical mechanisms for the entire Europe (Figs. 55 and 56). While
Figure 56: Top: difference in maximum temperature (�C) between wintermonths with an NAO index >1 and months with an NAO index <�1
(period 1958–1997). Differences are represented only if significant at the 5%level. Bottom: as in top but with minimum temperature. Data from
NCEP/NCAR reanalyses.
Relations between Variability in the Mediterranean Region and Mid-latitude Variability 185
the impact of the NAO on precipitation shows a decreasing influence in the
eastern and southern sector of the Mediterranean basin (Mariotti et al., 2002b),
it can still impact significantly on precipitation variability and water resources
over Turkey (Cullen and de Menocal, 2000; Struglia et al., 2004; Turkes� andErlat, 2003, 2005). The influence of the NAO on the variability of the whole
Mediterranean sea–fresh water cycle is linked to the precipitation anomalies
since no significant correlation is found with evaporation (Mariotti et al., 2002b).
This NAO-precipitation control is associated with the steering of storm-track
paths over the entire North-Atlantic sector, but also influences cyclogenesis
in the Mediterranean (Trigo et al., 2000). This issue is further developed in
Chapter 6 in this book.
It has been shown that the NAO does not play a relevant role in terms of
western Mediterranean winter temperature variability (Saenz et al., 2001b; Pozo-
Vazquez et al., 2001a; Castro-Dıez et al., 2002) and a minor, but discernible,
one for the eastern Mediterranean temperature field (Cullen and de Menocal,
2000; Ben Gai et al., 2001; Xoplaki, 2002). Generally, the influence of the positive
(negative) winter NAO on the Mediterranean is warmer (cooler) conditions over
the northern part and cooler (warmer) over the southern part (Hurrell, 1995;
Trigo et al., 2002b; Xoplaki, 2002). Interestingly, the impact of the NAO in daily
extreme temperatures is unequal, with large asymmetries between minimum and
maximum temperatures (Fig. 56), and more significantly, between positive and
negative phases of NAO (Trigo et al., 2002b). The differences in maximum
and minimum temperatures between months of high and low NAO index are
shown in Fig. 56. The amplitude of the differences over Europe is larger for
minimum than for maximum temperatures. However, the spatial extension
of statistically significant differences for Iberia and southern Europe in general
is larger for maximum than for minimum temperature. It is worth noting
that maximum temperature values are usually recorded during daylight while
minimum temperature values are usually observed towards the end of the
night. Thus, during daytime, enhanced solar short wave radiation is capable
of partially offsetting the advection of cold polar air to yield small maximum
temperature anomalies, while during the night, the strong clear sky emission of
long wave radiation further cools the lower troposphere (Trigo et al., 2002b). The
large-scale mean temperature anomalies can be mostly explained by heat
transport by the corresponding anomalous mean atmospheric flow, modified
and partially offset by the heat transported by transient eddies. However, there
is a third process: the modulation by anomalous cloud cover (associated with
anomalous atmospheric circulation) of the radiative transfer of heat to and
from the Earth’s surface. These radiative and cloud cover influences modulate
the response to NAO mainly in terms of generating different day and night-time
temperature anomalies (Trigo et al., 2002b, 2004b).
186 Mediterranean Climate Variability

3.2.2. The Eastern Atlantic and Eastern Atlantic/Western Russia Patterns
Several authors have shown that modes other than NAO play an important role
in shaping the European precipitation variability, including sectors of the
Mediterranean Basin (Zorita et al., 1992; von Storch et al., 1993; Qian et al.,
2000; Quadrelli et al., 2001; Krichak et al., 2002; Xoplaki, 2002). However the
NAO pattern is sufficiently well established and has been derived through
different methods for every month of the year. The remaining modes of
atmospheric circulation over Europe present a less clear picture, because they
are of a more regional nature, their index may not be so unambiguous and finally,
because some of these modes have a signature only during part of the year
(Barnston and Livezey, 1987). In particular, the Eastern Atlantic (EA) pattern
depends crucially on the procedure used to derive it. Still, the kind of variability
associated with this pattern seems important and physically real, as it is also
detected in studies using alternative techniques, like cluster analysis (Kimoto and
Ghil, 1993). According to Wallace and Gutzler (1981), the EA corresponds to
an index, defined in terms of the geopotential height anomalies of the 500 hPa
surface at three different points. Other definitions of the same index and
‘‘similar’’ patterns have been provided through the years, including the indices
from rotated EOF analysis (Barnston and Livezey, 1987). These authors
(Barnston and Livezey, 1987) have identified two patterns, the Eastern Atlantic
and the Eastern Atlantic/Western Russia (EA/WRUS). The East Atlantic/
Western Russia pattern is one of the two prominent patterns that affect
Eurasia during most of the year presenting its east Atlantic anomaly centre
located further east than the EA (over western Europe) and an opposite centre
located north of the Caspian region. This pattern is prominent in all months
except June–August, and has been referred to as the Eurasia-2 pattern by
Barnston and Livezey (1987). Correlation coefficients obtained between monthly
time series of the EAWG (defined by Wallace and Gutzler, 1981) and EABL or
EA/WRUS (as defined by Barnston and Livezey, 1987) are statistically signifi-
cant but relatively low. For instance, the correlation value between monthly
winter (D,J,F) of EAWG and EABL is �0.54 (significant at the 95% level) and
between EAWG and EA/WRUS is �0.46. Therefore, results of impact studies
that use slightly different indices are bound to obtain different correlation. Here,
we decided to adopt a broad perspective on this issue, making an effort to include
results obtained by authors that have used both EA as well as the EA/WRUS
indices. The subscripts from EAWG and EABL are dropped in the following,
because different studies adopt one of the definitions for the EA index they use.
Recent works have shown that the EA and EA/WRUS patterns represent
a significant contribution for the precipitation over northern Iberia (Saenz et al.,
2001a) as well as parts of the eastern Mediterranean areas (Quadrelli et al., 2001;
Relations between Variability in the Mediterranean Region and Mid-latitude Variability 187

Xoplaki et al., 2000, 2004; Krichak et al., 2002). Using station data, Xoplaki
(2002) shows the spatial correlation between the EA/WRUS and winter (NDJF)
precipitation in the Mediterranean basin (Fig. 57, top). Significant positive
correlation is visible between EA/WRUS and winter precipitation over north-
eastern Africa, the Near East, eastern Turkey and the Black Sea region.
Significant negative correlations are found generally north of 40�N with a
maximum over France. Anomalous positive pressure over northwestern Europe
and the central and western Mediterranean area lead to subsidence and stability
conditions and reduced precipitation over continental Europe and the northern
coast of the Mediterranean (Xoplaki, 2002). The advection of humid and
warm air by EA/WRUS to certain Mediterranean regions is associated with
Figure 57: Spatial Spearman correlation between the patterns EA/WRUS andSCAND patterns and winter (NDJF) Mediterranean station precipitation for theperiod 1950–1999. Correlations |r|�0.14 indicate significance at the 95% level,|r|�0.18 at the 99% level and |r|� 0.23 at the 99.9% level (n¼ 4� 50¼ 200
months), respectively (Adapted from Xoplaki, 2002).
188 Mediterranean Climate Variability
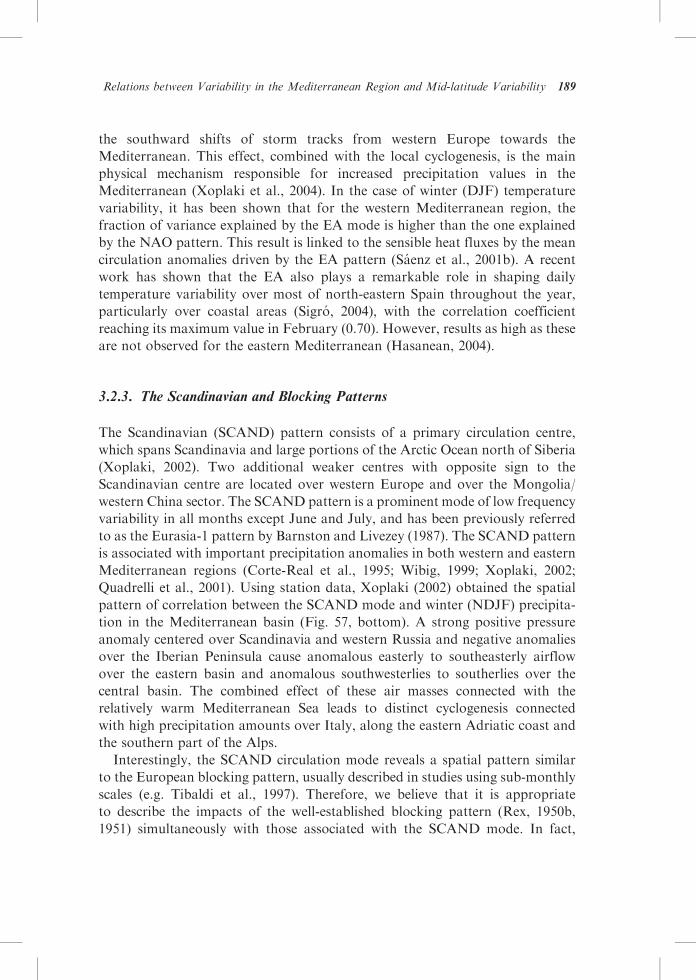
the southward shifts of storm tracks from western Europe towards the
Mediterranean. This effect, combined with the local cyclogenesis, is the main
physical mechanism responsible for increased precipitation values in the
Mediterranean (Xoplaki et al., 2004). In the case of winter (DJF) temperature
variability, it has been shown that for the western Mediterranean region, the
fraction of variance explained by the EA mode is higher than the one explained
by the NAO pattern. This result is linked to the sensible heat fluxes by the mean
circulation anomalies driven by the EA pattern (Saenz et al., 2001b). A recent
work has shown that the EA also plays a remarkable role in shaping daily
temperature variability over most of north-eastern Spain throughout the year,
particularly over coastal areas (Sigro, 2004), with the correlation coefficient
reaching its maximum value in February (0.70). However, results as high as these
are not observed for the eastern Mediterranean (Hasanean, 2004).
3.2.3. The Scandinavian and Blocking Patterns
The Scandinavian (SCAND) pattern consists of a primary circulation centre,
which spans Scandinavia and large portions of the Arctic Ocean north of Siberia
(Xoplaki, 2002). Two additional weaker centres with opposite sign to the
Scandinavian centre are located over western Europe and over the Mongolia/
western China sector. The SCAND pattern is a prominent mode of low frequency
variability in all months except June and July, and has been previously referred
to as the Eurasia-1 pattern by Barnston and Livezey (1987). The SCAND pattern
is associated with important precipitation anomalies in both western and eastern
Mediterranean regions (Corte-Real et al., 1995; Wibig, 1999; Xoplaki, 2002;
Quadrelli et al., 2001). Using station data, Xoplaki (2002) obtained the spatial
pattern of correlation between the SCAND mode and winter (NDJF) precipita-
tion in the Mediterranean basin (Fig. 57, bottom). A strong positive pressure
anomaly centered over Scandinavia and western Russia and negative anomalies
over the Iberian Peninsula cause anomalous easterly to southeasterly airflow
over the eastern basin and anomalous southwesterlies to southerlies over the
central basin. The combined effect of these air masses connected with the
relatively warm Mediterranean Sea leads to distinct cyclogenesis connected
with high precipitation amounts over Italy, along the eastern Adriatic coast and
the southern part of the Alps.
Interestingly, the SCAND circulation mode reveals a spatial pattern similar
to the European blocking pattern, usually described in studies using sub-monthly
scales (e.g. Tibaldi et al., 1997). Therefore, we believe that it is appropriate
to describe the impacts of the well-established blocking pattern (Rex, 1950b,
1951) simultaneously with those associated with the SCAND mode. In fact,
Relations between Variability in the Mediterranean Region and Mid-latitude Variability 189
a recent study has quantified the impact of the SCAND pattern winter blocking
variability over the European sector (Barriopedro et al., 2005).
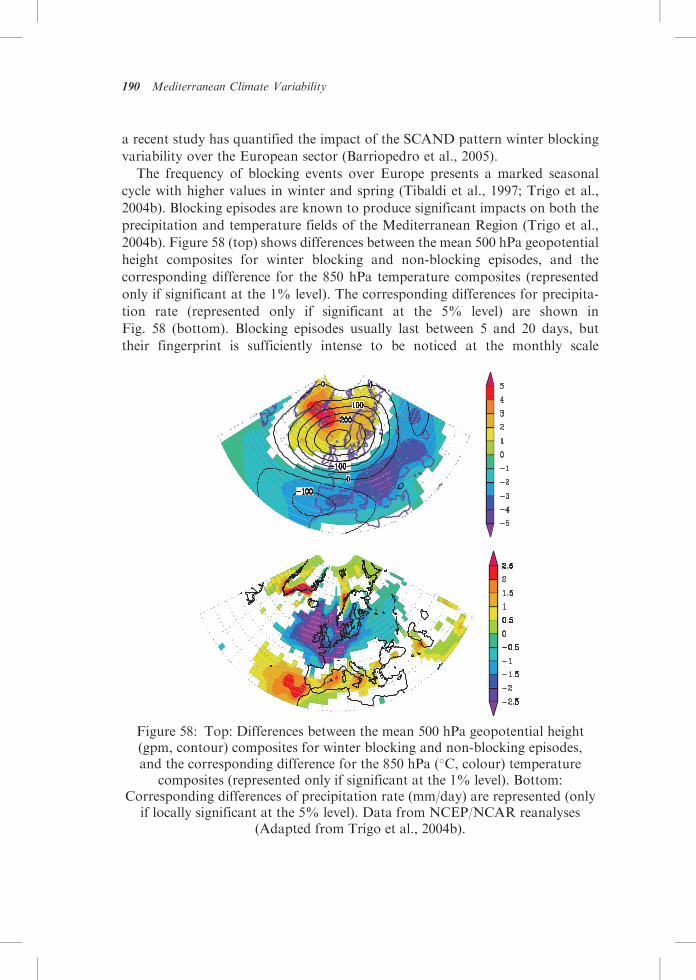
The frequency of blocking events over Europe presents a marked seasonal
cycle with higher values in winter and spring (Tibaldi et al., 1997; Trigo et al.,
2004b). Blocking episodes are known to produce significant impacts on both the
precipitation and temperature fields of the Mediterranean Region (Trigo et al.,
2004b). Figure 58 (top) shows differences between the mean 500 hPa geopotential
height composites for winter blocking and non-blocking episodes, and the
corresponding difference for the 850 hPa temperature composites (represented
only if significant at the 1% level). The corresponding differences for precipita-
tion rate (represented only if significant at the 5% level) are shown in
Fig. 58 (bottom). Blocking episodes usually last between 5 and 20 days, but
their fingerprint is sufficiently intense to be noticed at the monthly scale
Figure 58: Top: Differences between the mean 500 hPa geopotential height(gpm, contour) composites for winter blocking and non-blocking episodes,and the corresponding difference for the 850 hPa (�C, colour) temperature
composites (represented only if significant at the 1% level). Bottom:Corresponding differences of precipitation rate (mm/day) are represented (only
if locally significant at the 5% level). Data from NCEP/NCAR reanalyses(Adapted from Trigo et al., 2004b).
190 Mediterranean Climate Variability
(Quadrelli et al., 2001). The most important feature corresponds to the
intensification of the meridional component of the mid-troposphere circulation
that is perfectly visible during blocked situations, up and downstream of the
British Isles. This configuration is usually associated with the split of the jet
stream in two distinct branches, a feature that is widely accepted as a trademark
of European blocking episodes (Rex, 1950a). The impact of these events for the
low tropospheric temperature field at 850 hPa extends from Iberia to the Black
Sea with the most intense values being observed over the Balkans (Fig. 58, top).
On the other hand, the significant impact of these blocking episodes on the
Mediterranean precipitation is confined to the western sector (Fig. 58, bottom).
3.2.4. Other Modes
A regional manifestation of the NAO is given by the Mediterranean Oscillation
(Conte et al., 1989) implying opposite pressure (especially at upper levels) and
surface climate conditions between the western to central and the southeastern
Mediterranean basin. Thus, the most important canonical correlation pattern
between the large-scale circulation and Mediterranean precipitation in winter
being significantly correlated (r¼ 0.72) with the NAO during the October–March
period is strongly related with various indices of the Mediterranean Oscillation
(Dunkeloh and Jacobeit, 2003). A similar result arises even for the case of a non-
seasonalwhole-year analysis atmonthly scales (Corte-Real et al., 1995). Therefore,
such a high correlation coefficient between NAO and the Mediterranean
Oscillation seems to imply that these two phenomena are not independent.
Another dominant circulation mode (present at 1000 and 500 hPa) coupled
with Mediterranean climate variability is the Mediterranean Meridional
Circulation (MMC) pattern consisting of two opposite anomaly centres west of
the Bay of Biscay and in the central Mediterranean implying preferred meridional
flows around this area (Dunkeloh and Jacobeit, 2003). It shows some relation
with the hemispheric-scale EA pattern at the 500 hPa level (NOAA-CPC, 2005a)
and often recurs in dynamical studies linked to the Mediterranean area, e.g. as
second mode of the non-seasonal analysis by Corte-Real et al. (1995) or as first
mode of the Greek winter rainfall analysis by Xoplaki et al. (2000).
Another mode of low-frequency variability affecting the Mediterranean area is
the East Atlantic Jet pattern (EA-JET, see NOAA-CPC, 2005a). It is among the
ten leading teleconnection patterns from April to August (NOAA-CPC, 2005b)
revealing a N–S dipole of anomaly centres with one centre over the northeastern
North Atlantic and western Scandinavia, the other centre over Northwest
Africa and large parts of the Mediterranean region. Thus, its positive mode
reflects intensified mid-latitude westerlies, whereas its negative mode represents
Relations between Variability in the Mediterranean Region and Mid-latitude Variability 191
particular blocking configurations. During spring, there is a moderate correlation
(r¼ 0.44) with a canonical correlation pattern (CCP) whose rainfall part explains
some 16% of Mediterranean precipitation variability, however, during summer
the EA-JET pattern is strongly related (r¼�0.66) to the most important
CCP including nearly 30% of explained summer precipitation variability in the
northern and western Mediterranean regions (Dunkeloh and Jacobeit, 2003).
Thus, blocking configurations of an EA-JET type in its negative mode are
especially important for above-average summer rainfall in these areas. Touchan
et al. (2005) recently have also found a significant positive correlation between
the EA-Jet and May–August precipitation over the southeastern Mediterranean
area for the 1948–2000 period. However, they also report on instationarities
in those relationships using reconstructed precipitation several centuries back
in time.
A last mode, the Polar Eurasian pattern (NOAA-CPC, 2005a), is particularly
important during the winter season (NOAA-CPC, 2005b). It reflects variations in
the strength of the circumpolar vortex and affects the Mediterranean region by its
European anomaly centre which extends up to the northern and western parts of
the Mediterranean area. Increased anticyclonicity in these regions represents an
enhanced polar vortex and vice versa. This pattern has been found being
moderate negatively correlated (�0.42) with the second CCP of wet season
Mediterranean precipitation connected with below normal precipitation over the
western Mediterranean and above normal precipitation over the eastern part of
the basin (Xoplaki et al., 2004).
3.3. Temperature Variability
It is widely accepted that the frequency of large-scale circulation patterns has
a major impact on monthly/seasonal surface climate characteristics. In fact this
link was explored in Chapter 1 of this book to evaluate the evolution of
Mediterranean winter climate since the early sixteenth century. However, until
the mid-twentieth century, virtually all large-scale circulation data is referent
to sea level pressure, limiting the extent of those historical circulation-climate
studies (except for Schmutz et al., 2000, Luterbacher et al., 2002 and Bronnimann
and Luterbacher, 2004, who provide mid and upper tropospheric fields further
back in time). Nowadays, the generalized use of multi-variable and multi-level
reanalyses datasets has allowed the use of more appropriate variables (e.g.
300 hPa or 500 hPa geopotential height) to establish those relationships.
Xoplaki et al. (2003b) using a multi-component CCA in the EOF space,
investigated the relationships between the large-scale atmospheric circulation and
the Mediterranean summer (June to September) temperature. The authors
192 Mediterranean Climate Variability

show that 56% of the summer Mediterranean temperature variability during the
second half of the twentieth century can be explained by making use of the first
two canonical modes. The most important of the canonical modes (Fig. 59)
reveals a dipole configuration in the North Atlantic. In the positive phase of the
dipole, a deep centre with positive 300 hPa geopotential height anomalies is
located over central Europe; an area of negative anomalies presents higher values
south of Iceland and surrounding northward, the positive anomalies extends up
to the western Ural mountains and the northern Caspian Sea. SSTs and surface
temperatures reveal higher values in the northwestern part of the Mediterranean
under the high pressure region. This dynamic configuration strengthens the
zonal flow over northern Europe and easterly–northeasterly flow over the
Mediterranean. The increased stability leads to clear sky conditions and maxi-
mum insolation in the area.
The CCA mode described above agrees well with the second mode in the
study of Xoplaki et al. (2003a) on summer temperatures over Greece. Thus, it
seems plausible to extend the reasoning in their work to the entire Mediterranean
area. From this perspective, the variability of summer temperatures in the
Mediterranean would be well described with a parsimonious conceptual model
invoking two modes, the ‘‘high-index’’ type and the ‘‘low-index’’ type, which
picture transitions from the zonal to the meridional flow.
3.4. Precipitation Variability
Most Mediterranean countries experience frequent drought episodes, which
may cause water shortages and disrupt agricultural and industrial activities, such
as hydroelectric power generation. Koppen’s (1936) definition of Mediterranean
climate is, in simple terms, one in which winter rainfall is more than three
times the summer rainfall. Summer in many regions located in the southern
Mediterranean coast is characterized by lack of rain, long periods of drought
and high temperatures that lead to a marked summer aridity. The strong
summer–winter rainfall contrast that characterizes the Mediterranean climate is
associated with pronounced seasonal cycles in most climatic variables. During
a typical year, rain occurs most frequently during the winter half-year over
most of the land area surrounding the Mediterranean, mainly in the southern
and eastern parts. In addition, the winter half-year precipitation accounts for
between 30% (western and northern Mediterranean lands) and 80% (eastern-
southeastern parts) of the annual total amounts (Xoplaki et al., 2004). In general,
there exists a clear deficit of water during the summer half-year, when only sparse
storms and convective systems produce rainfall (Trigo et al., 1999).
Relations between Variability in the Mediterranean Region and Mid-latitude Variability 193
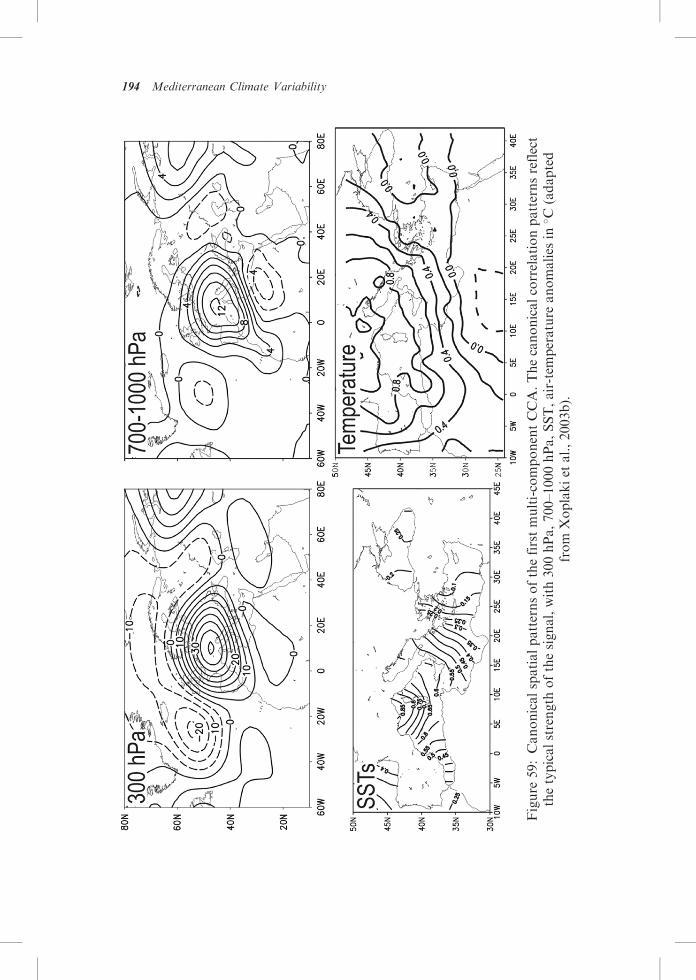
Figure
59:Canonicalspatialpatternsofthefirstmulti-componentCCA.Thecanonicalcorrelationpatternsreflect
thetypicalstrength
ofthesignal,with300hPa,700–1000hPa,SST,air-tem
perature
anomalies
in�C(adapted
from
Xoplakiet
al.,2003b).
194 Mediterranean Climate Variability

Therefore, it is necessary to use appropriate statistical tools to assess the
spatio-temporal variability of the precipitation field throughout the yearly cycle,
but particularly during the winter season. Figure 60 shows the approach
developed for the Mediterranean basin by Fernandez et al. (2003) in which
PCA was applied to the linearly detrended monthly precipitation over the area
given by the high resolution (0.5� � 0.5�) gridded data from New et al. (2000) for
the period 1948–1996. The 3 leading EOFs are represented as the correlation of
the corresponding PC with the precipitation series at each gridpoint. These three
patterns explain around 50% of the total detrended field. It is worth mentioning
that the first EOF (22% of variance) shows the typical precipitation fingerprint
-0.4
-0.2 -0.2
-0.2
0.00.0 0.0
0.0
0.0
0.20.2
0.20.2
0.20.20.20.40.4
0.40.4
0.40.4
0.4
0.6
0.6
.6
0.60.6
0.6
0.8
10 W 0 10 E 20 E 30 E 40 30 N
40 N
50 N
-0.2
-0.2
0.00.0
0.00.00.0
0.0
0.2
0.2
0.2
0.2
0.2
0.4
0.4
0.4
0.4
0.4
0.6
0.6
0.6
0.6
10 W 0 10 E 20 E 30 E 40 30 N
40 N
50 N
-0.4-0.4
-0.4
-0.2
-0.2
-0.2-0.2
-0.2-0.2
-0.2
-0.2
0.0
0.00.00.0
0.2
0.2
0.2
0.40.4
0.60.6
10 W 0 10 E 20 E 30 E 40 30 N
40 N
50 N
0.2 0.2
0.20.2
0.20.2
0.2
0.4
0.4
0.4
0.4
0.6
10 W 0 10 E 20 E 30 E 40 30 N
40 N
50 N
0.2
0.2
0.2
0.2
0.2
0.2
0.4
0.4
0.6
10 W 0 10 E 20 E 30 E 40 30 N
40 N
50 N
0.20.2
0.4
0.4
10 W 0 10 E 20 E 30 E 40 30 N
40 N
50 N
Figure 60: Left: From top to bottom: The 3 leading EOFs from the New et al.(2000) precipitation field expressed as correlation of the corresponding PC withthe precipitation series at each grid point. Right: From top to bottom: Thevariance fraction of the precipitation series explained by the 3 leading PCs.
(Adapted from Fernandez et al., 2003).
Relations between Variability in the Mediterranean Region and Mid-latitude Variability 195

of the NAO, controlling the rainfall variability in western Mediterranean sector
(see Fig. 55). The second EOF (16% of variance) shows high loading values
over the eastern Mediterranean sector while the third EOF (11% of variance)
shows a north–south dipole with particularly high loadings over France. The
spatial pattern of the third EOF is related with the patterns of precipitation
impact of the EA or the EA/WRUS already mentioned (Fig. 57, left).
The average flux of atmospheric water vapour through the boundary is
shown in Fig. 61. Since the outflow is selected as positive flux, the negative values
along the western boundary represent the inflow of humidity coming from the
Atlantic Ocean. An average inflow of 494 Pg mo�1 crosses this boundary while
the main outflow from the basin takes place through the eastern boundary
(Fernandez et al., 2003). The precipitation variability is closely related to the
structure of the vertically integrated moisture transport fluxes, inside the domain
and at the borders. As an example, the principal components of precipitation
are regressed over the moisture transport at each NCEP/NCAR Reanalysis
grid point over the area in Fig. 61B–D. The leading model (Fig. 61B) shows
for positive phases an intensification of the transports of moisture arriving to the
area from the Atlantic through the lateral western boundary. The second model
Figure 61: (A) Average moisture flux through the boundaries according toNCEPdata (in Pg mo�1). (B–D) Regression of the precipitation PCs (1st–3rd PC,respectively) over the vertically integrated moisture transport derived from
NCEP/NCAR Reanalysis in kgm�1 s�1. (Adapted from Fernandez et al., 2003).
196 Mediterranean Climate Variability

(Fig. 61C) shows an important contribution of moisture to the atmosphere
from the western Mediterranean sub-basin and its transport to the eastern
areas. Finally, the third EOF (Fig. 61D) is closely linked to the barrier effect
of orography (mainly over the Alps) over the vertically integrated moisture
transports.
Xoplaki et al. (2004) used a multi-component Canonical Correlation Analysis
(CCA) in the Empirical Orthogonal Function (EOF) space to identify the most
important circulation patterns, at the sea level as well as at mid- and upper
atmospheric levels, associated with the wet season (October to May; 1949–1999)
Mediterranean station precipitation. Standard CCA technique relates one large-
scale pattern with one regional precipitation pattern (e.g. Corte-Real et al., 1995).
However, Xoplaki et al. (2004) have shown that a combination of large-scale
fields of predictors can achieve better results than the use of a single predictor.
Four large-scale circulation modes accounted for 30% of the overall precipitation
variability. It should be stressed that the CCA method maximizes the explained
variance that links patterns of precipitation and large scale fields previously
considered. Of course, there is a part of the variability linked to local factors
and not related to these large-scale fields and, thus, the variance explained by
these patterns (constrained to be related to the pre-defined large scale circulation
patterns) is lower than the one associated with the first 3 EOFs by Fernandez
et al. (2003). The first canonical pair (Fig. 62) is connected with the NAO and
Figure 62: Canonical spatial patterns of the first CCA between the wet seasonMediterranean station precipitation (predictand) and 300 hPa, 500 hPa andSLP (predictors); wet season precipitation anomalies in mm (Adapted from
Xoplaki et al., 2004).
Relations between Variability in the Mediterranean Region and Mid-latitude Variability 197
the EA/WRUS (correlates at �0.66 and �0.50, respectively). These patterns
are connected with above normal precipitation over the western, central and
northern Mediterranean area and drier conditions over the remaining region.
These results are quite well in agreement with Dunkeloh and Jacobeit (2003) for
a similar analysis using gridded precipitation data over the Mediterranean coast.
A regional study focused on the eastern Mediterranean supports that stronger
westerlies over the eastern North Atlantic and the rising 500 hPa height (and
the sea level pressure) over continental Europe during the last few decades were
connected with enhanced atmospheric stabilization and anomalous advection
of cold dry air from northerly directions. This led to the winter dryness over the
eastern Mediterranean (Xoplaki et al., 2000).
3.5. Trends
A comprehensive analysis of Mediterranean climate trends over the last 500 years
has been presented in Chapter 1 of this book. Here, we focus on trends observed
over shorter time scales (decadal) during the twentieth century. After describing
the most important characteristics of temperature and precipitation trends for
different parts of the Mediterranean region, we describe the most important
physical mechanisms associated with them and driven by the large-scale atmo-
spheric patterns described in the previous sections.
3.5.1. Temperature Trends
Giorgi (2002) analysed the surface air temperature variability and trends over
the larger Mediterranean land-area for the twentieth century based on gridded
data of New et al. (2000). He found a significant warming trend of 0.75�C,
mostly from contributions during the early and late decades of the century.
Slightly stronger warming was observed for winter and summer. Spring reveals
important trends over the last half century, mainly in the northern part of the
Mediterranean while Autumn presents a warming trend in the western basin
and a slight decrease in the eastern sector.
The structure of climate series can differ considerably across regions showing
variability at a range of scales in response to changes in the direct radiative
forcing and variations in internal modes of the climate system (New et al., 2001;
Hansen et al., 2001; Giorgi, 2002). Therefore, it is of no surprise, that based on the
same data as Giorgi, Jacobeit (2000) found a distinct summer warming between
1969 and 1998 (a short period), being more distinct in the western than in the
eastern part; seasonal cooling trends exist in some eastern areas, mainly in spring,
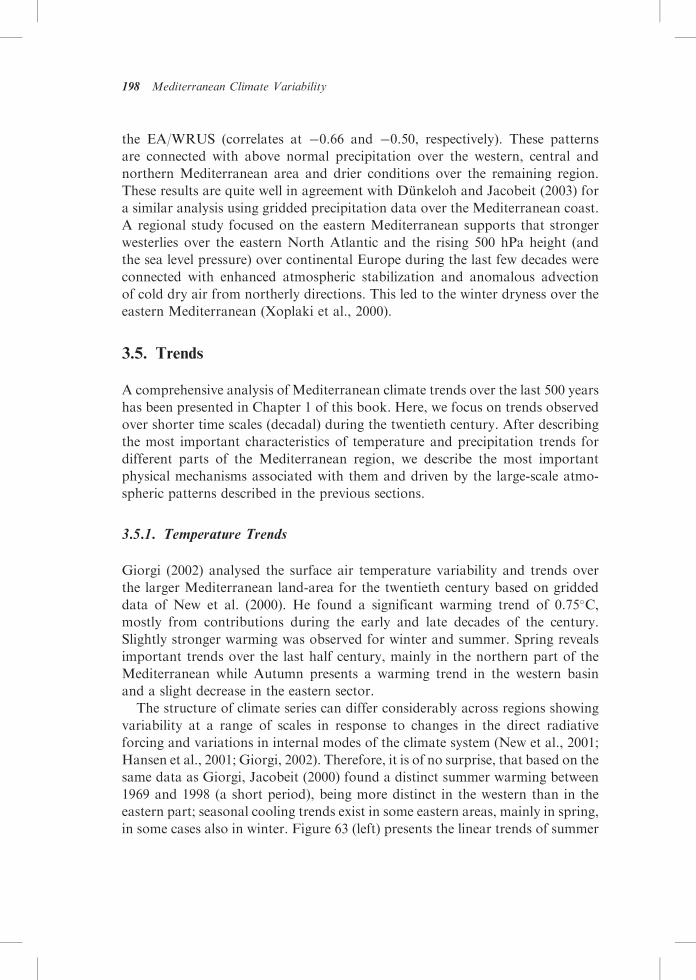
in some cases also in winter. Figure 63 (left) presents the linear trends of summer
198 Mediterranean Climate Variability
Figure
63:Right:Lineartrendsofwinter(N
DJF
)stationprecipitation(m
m/50year).Left:Summer
(JJA
S)stationair
temperatures(�C/50year)fortheperiod1950–1999.S
tationswithasignificanttrend(90%
confidence
level,b
asedonthe
Mann–Kendalltest)are
encircled(from
Xoplaki,2002).
Relations between Variability in the Mediterranean Region and Mid-latitude Variability 199
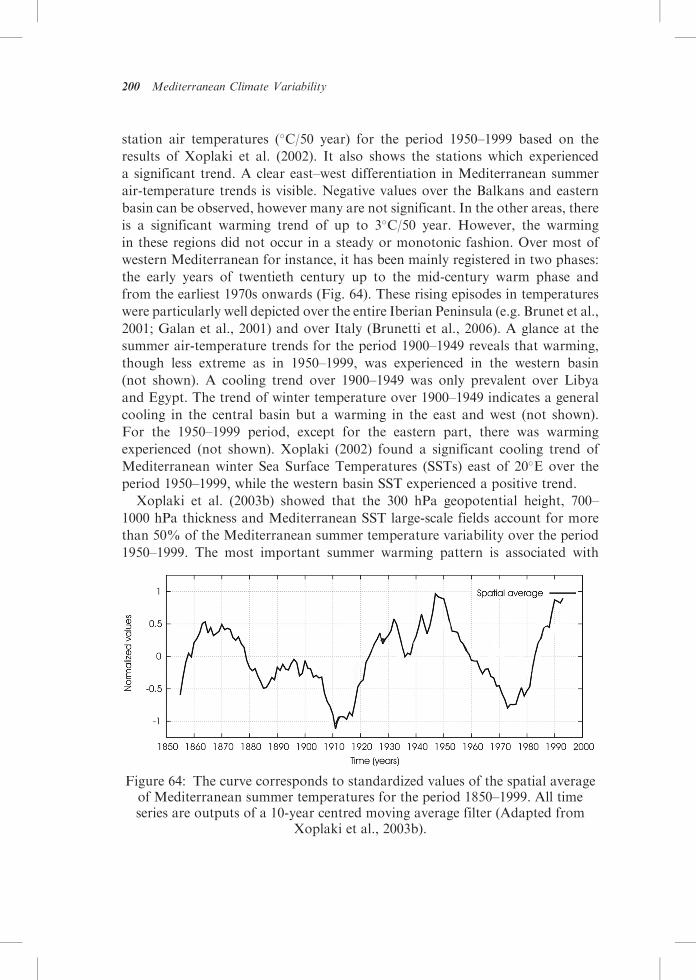
station air temperatures (�C/50 year) for the period 1950–1999 based on the
results of Xoplaki et al. (2002). It also shows the stations which experienced
a significant trend. A clear east–west differentiation in Mediterranean summer
air-temperature trends is visible. Negative values over the Balkans and eastern
basin can be observed, however many are not significant. In the other areas, there
is a significant warming trend of up to 3�C/50 year. However, the warming
in these regions did not occur in a steady or monotonic fashion. Over most of
western Mediterranean for instance, it has been mainly registered in two phases:
the early years of twentieth century up to the mid-century warm phase and
from the earliest 1970s onwards (Fig. 64). These rising episodes in temperatures
were particularly well depicted over the entire Iberian Peninsula (e.g. Brunet et al.,
2001; Galan et al., 2001) and over Italy (Brunetti et al., 2006). A glance at the
summer air-temperature trends for the period 1900–1949 reveals that warming,
though less extreme as in 1950–1999, was experienced in the western basin
(not shown). A cooling trend over 1900–1949 was only prevalent over Libya
and Egypt. The trend of winter temperature over 1900–1949 indicates a general
cooling in the central basin but a warming in the east and west (not shown).
For the 1950–1999 period, except for the eastern part, there was warming
experienced (not shown). Xoplaki (2002) found a significant cooling trend of
Mediterranean winter Sea Surface Temperatures (SSTs) east of 20�E over the
period 1950–1999, while the western basin SST experienced a positive trend.
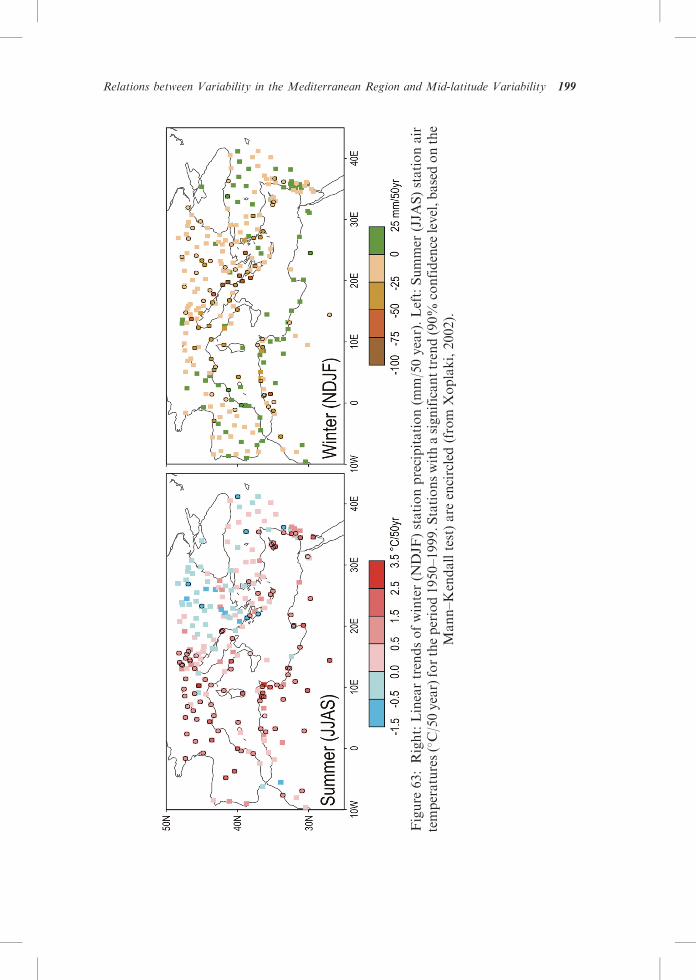
Xoplaki et al. (2003b) showed that the 300 hPa geopotential height, 700–
1000 hPa thickness and Mediterranean SST large-scale fields account for more
than 50% of the Mediterranean summer temperature variability over the period
1950–1999. The most important summer warming pattern is associated with
Figure 64: The curve corresponds to standardized values of the spatial averageof Mediterranean summer temperatures for the period 1850–1999. All timeseries are outputs of a 10-year centred moving average filter (Adapted from
Xoplaki et al., 2003b).
200 Mediterranean Climate Variability
blocking conditions, subsidence and stability. This mode is responsible for the
0.4�C (0.5�C) warming during the period 1950–1999 (1900–1999). The spatial
average for summer (June to September) Mediterranean station temperatures
(Fig. 64) shows high values during the 1860s, comparable to those during the
1950s and 1990s. For the period 1850 to 1999, a trend of 0.018�C/decade is found
(significant at the 95% level). For the period 1900 to 1999, a change of 0.05�C/
decade is found. This fact points to an increase in temperature of about 0.27�C in
the 1850–1999 period, and of 0.5�C in the twentieth century (Xoplaki et al.,
2003b).
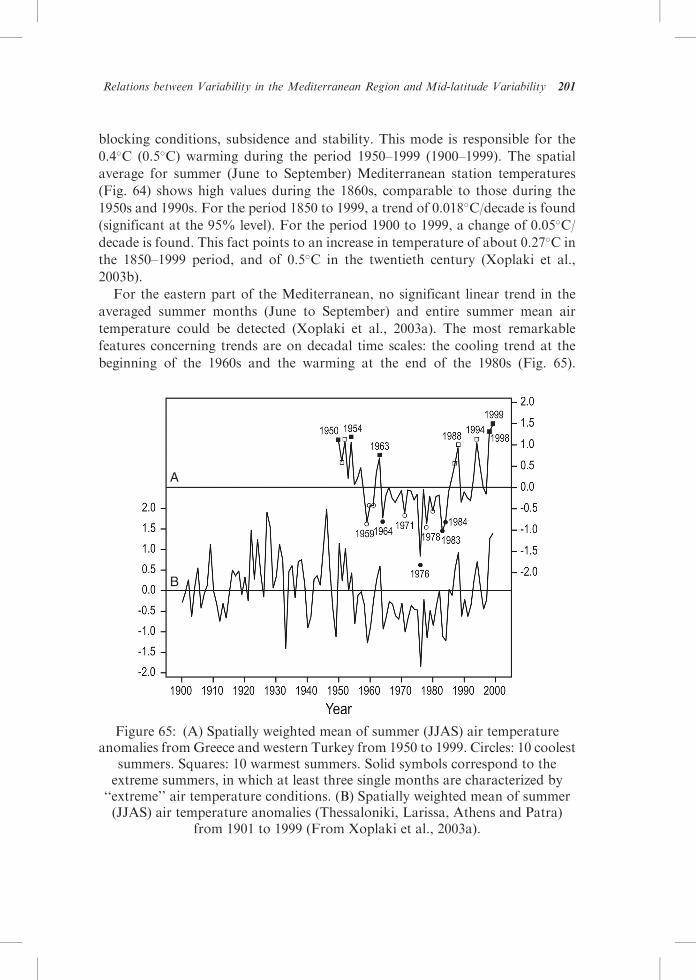
For the eastern part of the Mediterranean, no significant linear trend in the
averaged summer months (June to September) and entire summer mean air
temperature could be detected (Xoplaki et al., 2003a). The most remarkable
features concerning trends are on decadal time scales: the cooling trend at the
beginning of the 1960s and the warming at the end of the 1980s (Fig. 65).
A
B
Figure 65: (A) Spatially weighted mean of summer (JJAS) air temperatureanomalies fromGreece and western Turkey from 1950 to 1999. Circles: 10 coolest
summers. Squares: 10 warmest summers. Solid symbols correspond to theextreme summers, in which at least three single months are characterized by
‘‘extreme’’ air temperature conditions. (B) Spatially weighted mean of summer(JJAS) air temperature anomalies (Thessaloniki, Larissa, Athens and Patra)
from 1901 to 1999 (From Xoplaki et al., 2003a).
Relations between Variability in the Mediterranean Region and Mid-latitude Variability 201

Turkes� et al. (2002) found general increasing trends in annual, winter and spring
mean temperatures particularly over the southern regions of Turkey, for the
period 1929–1999. On the other hand, these authors found decreasing trends
for summer and autumn mean temperatures over the inner continental and
northern regions. In general, summer night-time warming, temperature rates
were found to be larger than corresponding night-time rates for spring and
autumn. Furthermore, during spring and summer night-time warming, tempera-
ture rates were generally stronger than daytime temperature rates. Recently,
Turkes� and Sumer (2004) showed that the diurnal temperature ranges signifi-
cantly decreased for most urban stations of Turkey throughout the year, but less
explicitly in winter.
3.5.2. Precipitation Trends
It is a well-known fact that precipitation throughout the Mediterranean basin
is highly concentrated in time between late autumn and spring (i.e. between
October and April). Therefore, the relatively vast amount of literature on the
subject is bound to reflect this imbalance, with very few studies focusing the
drier half of the year. Recent studies revealed that the twentieth century was
characterized by significant precipitation trends at different time and space
scales (e.g. Folland et al., 2001; New et al., 2001). Giorgi (2002) found negative
(positive) winter precipitation trends over the eastern (western) Mediterranean
land-area for the twentieth century. The two other important seasons for
precipitation present a different picture, with negative trends concentrated over
Iberia and central Mediterranean areas (Schonwise et al., 1993). This is confirmed
with more regionalized studies, such as the one undertaken by Gonzalez-Rouco
et al. (2001) for the Iberian Peninsula, showing positive seasonal trend for this
time interval in winter and negative trends in spring and autumn. In Italy, the
significant negative trend observed in total annual precipitation amount is
mainly due to the spring season, even if negative but not significant trends were
observed also for winter, summer and autumn (Brunetti et al., 2006). Studies on
precipitation trends must be analysed carefully as they crucially depend on the
length of time-series analysed. Using the same data as Giorgi, Jacobeit (2000)
showed for the last three decades some rainfall increases in autumn (western
Iberia and southern Turkey), but dominating decreases in winter and spring.
For the period 1951–2000, opposite to the prevailing decreasing trend, there is
some increase in winter precipitation from southern Israel to northern Libya
in accordance with increased positive modes of the Mediterranean Oscillation
(Jacobeit et al., 2004). Nevertheless, the prevailing trends for the second half
of the twentieth century are negative in winter and spring, although areas
202 Mediterranean Climate Variability

with significance are relatively restricted, depending on the month (Norrant and
Douguedroit, 2005). A glance at the Mediterranean regional winter precipitation
trends reveals a more detailed picture of the general findings. Sub-regional
variability is high, particularly in areas with contrasted topography near
coastland where also significant trend in precipitation variability and totals
have been observed (e.g. Turkes� , 1996, 1998). The evaluation of regional data
series (Fig. 63, right) indicate that the trend towards reduced winter precipitation
trends in many regions are not statistically significant in view of the large
variability (Xoplaki, 2002; Norrant and Douguedroit, 2005). However, signifi-
cant decreases are prevalent in western and central Mediterranean.
For the Mediterranean Sea, precipitation variability and water budget have
been investigated using gauge-satellite merged products and atmospheric
re-analyses (Mariotti et al., 2002b). NCEP re-analyses show that during the
last 50 years of the twentieth century Mediterranean averaged winter precipita-
tion has decreased by about 20%, with the decrease mostly occurring during
the period late 1970s to early 1990s. This implies a similar increase in the
Mediterranean atmospheric water deficit with potentially important impacts
on the Mediterranean Sea circulation as stressed in other chapters of this book.
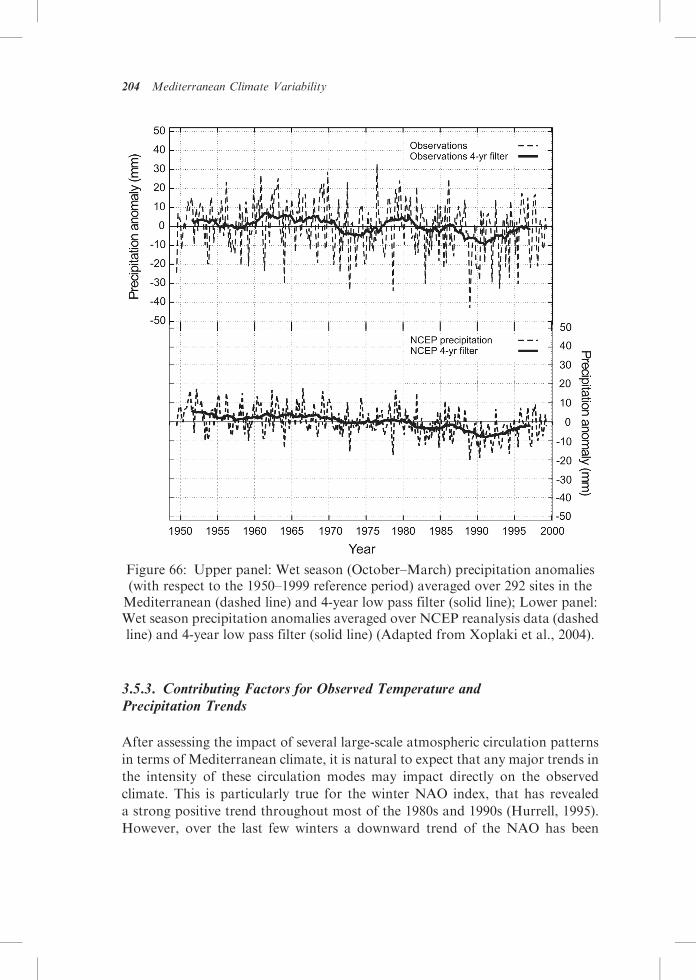
Xoplaki et al. (2004) in Fig. 66 show the monthly time evolution of the
spatially averaged precipitation anomalies both for the instrumental data (�300
stations equally distributed around the Mediterranean; upper panel) and the
NCEP/NCAR re-analysis data (lower panel); their 4-year moving average low
pass filtered time series are also shown to aid comparison at longer time
scales. There is good agreement between the NCEP and station data (correlation
0.78). The plot highlights the underestimation of variability by the NCEP/
NCAR reanalysis data: the ratio of variance of observations vs. NCEP is 3.11.
Decadal changes show good agreement between both datasets in depicting
relatively wet and dry periods (see filtered data): relative maxima take place in the
early 1950s, 1960s, late 1970s to early 1980s and late 1990s while relative minima
occur in the late 1950s, early 1970s and early 1990s. The decadal changes
are superimposed upon a long-term negative trend of 2.18 mm �month�1 �
decade�1 (station data; 1.5 mm �month�1 � decade�1 for the reanalysis), signifi-
cant at the 0.05 level.
Naturally, negative trends of winter precipitation over western and central
Mediterranean are probably linked with trends in cloud cover. In fact, recent
studies for Portugal (Santos et al., 2002) and Italy (Maugeri et al., 2001), both
using station-based data, have detected negative trends of winter cloud cover for
the second part of the twentieth century. The results show that there is a highly
significant negative trend in total cloud amount all over Italy. It is evident in all
seasons and is particularly steep in winter where both in northern and southern
Italy, the decrease exceeds 1 okta in 50 years (Maugeri et al., 2001).
Relations between Variability in the Mediterranean Region and Mid-latitude Variability 203
3.5.3. Contributing Factors for Observed Temperature andPrecipitation Trends
After assessing the impact of several large-scale atmospheric circulation patterns
in terms of Mediterranean climate, it is natural to expect that any major trends in
the intensity of these circulation modes may impact directly on the observed
climate. This is particularly true for the winter NAO index, that has revealed
a strong positive trend throughout most of the 1980s and 1990s (Hurrell, 1995).
However, over the last few winters a downward trend of the NAO has been
Figure 66: Upper panel: Wet season (October–March) precipitation anomalies(with respect to the 1950–1999 reference period) averaged over 292 sites in theMediterranean (dashed line) and 4-year low pass filter (solid line); Lower panel:Wet season precipitation anomalies averaged over NCEP reanalysis data (dashedline) and 4-year low pass filter (solid line) (Adapted from Xoplaki et al., 2004).
204 Mediterranean Climate Variability

observed (Overland and Wang, 2005). The observed decreasing precipitation in
northern Mediterranean and increasing Mediterranean fresh water deficit has
been linked to trends of the NAO index in winter (Quadrelli et al., 2001; Mariotti
et al., 2002b) influenced by corresponding trends in Atlantic storm-track paths
and Mediterranean cyclogenesis (Trigo et al., 2000). On a monthly scale,
probably the most significant precipitation trend can be found over the entire
Iberian Peninsula for the month of March with a continuous monotonic decrease
of up to 70% between the late 1950s and the 1990s (Trigo and DaCamara, 2000;
Paredes et al., 2005). The spatial extent of those regions with significant trends
(Fig. 67, top) is particularly coincident with the NAO impact region shown in
Fig. 55. Moreover, the associated trend of cyclone densities for March shows a
remarkable decrease near the Iberian Peninsula while northern Europe presents
significant increase of cyclones and precipitation (Paredes et al., 2005). Recent
studies have shown that throughout the latest two decades, the northern centre of
the NAO dipole (the Icelandic low) has moved closer to Scandinavia (Jung and
Hilmer, 2001). This shift has major implications for the Northern Hemisphere
climate, in general, (Lu and Greatbatch, 2002) and for the precipitation field over
Iberia, in particular (Rodo et al., 1997; Goodess and Jones, 2002). This observed
trend in storm-track paths (Fig. 65, right) has been reinforced with observational
studies showing a simultaneous coherent trend in blocking activity over the
Atlantic sector (Barriopedro et al., 2005). It is not obvious if this variability is
natural or induced itself by climate change.
Recent works have shown that the significant winter precipitation decline that
took place over the Mediterranean region during the last decades of the twentieth
century results from the combined effect of trends of the NAO and the EA/
WRUS patterns (Krichak and Alpert, 2005a,b). These authors separated the
Mediterranean basin in three target areas in order to identify the different trend
effects of the NAO and EA/WRUS patterns. The area 7�E–10�E; 44�N–46�Nwas
selected to represent the northwestern Mediterranean region. The target area for
the northeastern Mediterranean region is located between 37�E–40�E; 35�N–
37�N, while that for the southeastern part of the basin is defined by 35�E–37�E;
31�N–34�N. Krichak and Alpert (2005a,b) based their analysis on a determina-
tion of the typical for winter months (DJF) circulation patterns over the
northwestern, northeastern and southeastern Mediterranean area during the
15-year periods that are characterized by high and low NAO and EA/WRUS
indices (1958–1972 and 1979–1993, respectively). The circulation patterns in the
Figs. 68–70 illustrate the differences between the two 15-year periods. During the
high phase period the typical for the northwestern part composite vortex is to
be found positioned much further to the southeast (inland) than in the low phase
case (Fig. 68). The difference explains the observed precipitation decrease during
the last several decades of the past century by a decrease in the moisture content
Relations between Variability in the Mediterranean Region and Mid-latitude Variability 205

Figure 67: Top: Decreasing Precipitation (DP) trends in March for the period1941–1997. The different sizes of black dots depict the relative change in
precipitation for the complete period after fitting March time series to a linearmodel. ‘‘Crosses’’ correspond to non-significant or positive trends, while thedots represent stations with declining precipitation at less than the 10% level(Mann–Kendall test). Bottom: Decadal trends (% relative to the mean over
the study period) of the average number of cyclones detected in Marchfor the period 1960–2000, computed on cell boxes with 10� longitude by
10� latitude and normalized for a standard latitude of 50�N. The solid lineindicates the grid cells with significant trends at least at the 10% level
(from Paredes et al., 2005).

A
B
Figure 68: Correlations between precipitation index over the northwesternMediterranean target area and the u,v wind components at 850 hPa isobaric
surface, duringDJFmonths for (A) low six-year meanNAO-EA/WRUS; (B) highsix-year mean NAO-EA/WRUS. The wind vectors represent the magnitudes ofthe wind-precipitation correlations obtained. The isolines and shaded areas in thefigures represent the correlations and statistical significances (above 0.90) of thedependencies between relative vorticity and precipitation respectively (From
Krichak and Alpert, 2005b).

Figure 69: Same as in Fig. 68 but for the northeastern Mediterranean target area(From Krichak and Alpert, 2005b).
208 Mediterranean Climate Variability

B
A
Figure 70: Same as in Fig. 68 but for the southeastern Mediterranean target area.(From Krichak and Alpert, 2005b).
Relations between Variability in the Mediterranean Region and Mid-latitude Variability 209
of the air masses due to the stronger westerlies which characterize the high NAO
months. Another physical mechanism appears to be linking the positive NAO-
EA/WRUS trend with the precipitation decline over the northeastern and
southeastern Mediterranean regions (Figs. 69 and 70). The low-phase wet DJF
months in the eastern Mediterranean (both northeastern and southeastern parts)
are characterized by the circulation patterns with the northwesterly airflow
(i.e. from the Atlantics towards the eastern Mediterranean) in the lower
troposphere. One may expect that the moisture plays an important role in the
intensification of the low troposphere northerly flows as well as stratospheric air
intrusions and potential vorticity (PV) streamer systems over the southern
Europe (Massacand et al., 1998). These processes significantly contribute to the
cyclogenetic activity in the region. Additional analyses are required however for
a better understanding of the physical mechanisms involved. On the contrary, the
high phase years are characterized by a northeasterly airflow in the vicinity of the
eastern Mediterranean. The increase in the role of the relatively dry continental
air masses during the eastern Mediterranean wet months explains the precipita-
tion decline over the eastern Mediterranean during the positive phase periods.
Due to an evident relationship of the eastern Mediterranean synoptic processes
with those associated with the development and consequent decay of the
Asian–African monsoon (Webster et al., 1998) most of the precipitation of the
southeastern Mediterranean region takes place during the cool season. The fact
contributes to a noticeable focusing of the analyses on the winter-time processes.
Figure 71 adapted from Xoplaki et al. (2004) presents standardized values of
October–March precipitation anomalies over 110 Mediterranean stations for the
1900–1999 (RR 1900) period and the Gibraltar–Iceland NAO (Jones et al., 1997)
with reversed sign. For the first half of the twentieth century, RR 1900 indicates
the relatively dry early 1900s, early 1920s and 1940s and the wet periods 1910s
and 1930s. RR 1900 suggests that the decreasing trend highlighted in Fig. 63 is
not part of a centenial trend but a feature of the second half of the twentieth
century and that the 1960s and late 1970s were actually the wettest intervals since
the 1850s. This reasoning can be supported by the evolution of the large-scale
circulation during the twentieth century shown in Fig. 71. The time series labelled
as Cs1 (Fig. 71) shows the regressed time series (4-year moving average filter)
between the NCAR SLP dataset (Trenberth and Paolino, 1980; 1900 to 1999)
and the first canonical pair SLP pattern (presented in Fig. 62). Cs1 and RR 1900
show similar decadal changes since the beginning of the twentieth century
(correlation 0.76). The correlation of NAO time series with Cs1 is 0.70, suggesting
that the North Atlantic climate variability plays a crucial role in driving long-
term trends in the Mediterranean. After (before) 1960, both Cs1 and -NAO show
negative (positive) trends supporting the idea that the negative precipitation
trends after the 1950s are dynamically induced and a feature of the second half
210 Mediterranean Climate Variability

of the twentieth century. These results suggest that wet season Mediterranean
precipitation increased since the second half of the nineteenth century and
experienced a downward trend through the second half of the twentieth century
(Xoplaki et al., 2004; see also Fig. 62). Further, the NAO index correlates
at 0.72 with a large-scale Mediterranean Oscillation pattern during October–
March (Dunkeloh and Jacobeit, 2003).
The recently observed trend towards drier Mediterranean winter conditions
is linked to particular circulation pattern changes including increased pressure
south of 45�N–50�N since the 1970s, a weakening of the central Mediterranean
trough since the late 1980s, and a long-term rising trend in the Mediterranean
Oscillation pattern (higher pressure in western and central Mediterranean) being
connected to the NAO (Dunkeloh and Jacobeit, 2003). Though the NAO mode
plays an important role in driving temperature and precipitation trends in the
Mediterranean, its influence varies through different time periods. Thus, there are
other modes which are of relevance for explaining seasonal sub-Mediterranean
climate variability (e.g. Kutiel and Benaroch, 2002; Kutiel et al., 2002; Dunkeloh
and Jacobeit, 2003; Xoplaki et al., 2003a,b, 2004; Valero et al., 2004) or indirectly
through the effect over sea level pressure patterns (Ribera et al., 2000).
The nature of different rates of rainfall decrease in the east coast of Iberian
Peninsula and parts of Italy (Brunetti et al., 2001, 2004) might be related to the
observed increasing precipitation intensity, owing to a general enhancement of
the hydrological cycle (caused by an increase in surface temperature), and the
Figure 71: NAO: Gibraltar–Iceland NAO index (Jones et al., 1997) withreversed sign. RR 1900: spatial average over all Mediterranean sites withavailable data for the period 1900–1999. Cs1: regressed time series (4-yearsmoving average filter) between the NCAR SLP dataset (Trenberth and
Paolino, 1980) and the first canonical pair SLP pattern in Fig. 62 (Adaptedfrom Xoplaki et al., 2004).
Relations between Variability in the Mediterranean Region and Mid-latitude Variability 211
reduction of the number of wet days which are consistent with the variation of the
atmospheric circulation (Brunetti et al., 2002, 2004). Minimum winter extreme
temperatures across Peninsular Spain for the period 1955–1998 indicate that most
of the extremes occurred under six synoptic patterns. A generalized decreasing
trend in the annual frequency of extreme events is detected for most of the studied
observatories. Prieto et al. (2004) showed that it is due to a non-linear shift in the
annual mean minimum temperatures associated with a generalized warming in
the area. An explanatory hypothesis of the differential diurnal warming observed
over the western Mediterranean can be found in Fernandez-Garcia and Rasilla
(2001). They showed an increase of the geopotential height over the region,
particularly intense during the second half of the twentieth century. This was
associated with increasing solar radiation, higher maximum temperatures and an
intensified radiative loss at night, which have smoothed rising in daily minimum
temperatures.
3.6. Other Important Forcing Factors
3.6.1. Tropical and Extratropical SST
The direct influence of tropical climate variability on the Mediterranean region
has long been debated and is discussed in Chapter 2 of this book. Here, the focus
is on the link between mid-latitude circulation anomalies and tropical climate
variability. In recent years, there has been a healthy and unclosed debate on the
influence of the indirect effect, via extratropical modes, of El-Nino-Southern
Oscillation (ENSO) on climate patterns and precipitation in the Mediterranean
region. A number of studies report that ENSO-related winter circulation
anomalies in the Atlantic/European sector have a pattern similar to that of the
NAO (Ribera et al., 2000; Pozo-Vazquez et al., 2001b; Mathieu et al., 2004). In
particular, Pozo-Vazquez et al. (2001b) find that this is true but only for la Nina
events. There is still no general agreement on the extent of the ENSO influence in
seasonal Mediterranean climate. Some studies suggest that the ENSO influences
on the Mediterranean spring and autumn precipitation regime (Mariotti et al.,
2002a), while others state that this influence is confined to the eastern
Mediterranean in winter (Price et al., 1998). Rodo et al. (1997) instead find the
ENSO signature over parts of southern Europe but only in areas where the
NAO influence is weaker. However, others find no influence of ENSO on winter
rainfall (Quadrelli et al., 2001).
Some studies pointed to the large-scale changes induced by tropical processes
and the role they might play in the modulation of either oceanic/atmospheric
responses in certain mid-latitude areas. Of particular relevance appear to be
the changes induced by the modulation of the local Hadley cell over the
212 Mediterranean Climate Variability

Atlantic and the alteration of the ascending branch of this circulation, which
affects the Mediterranean sea and in particular, the southern part. These
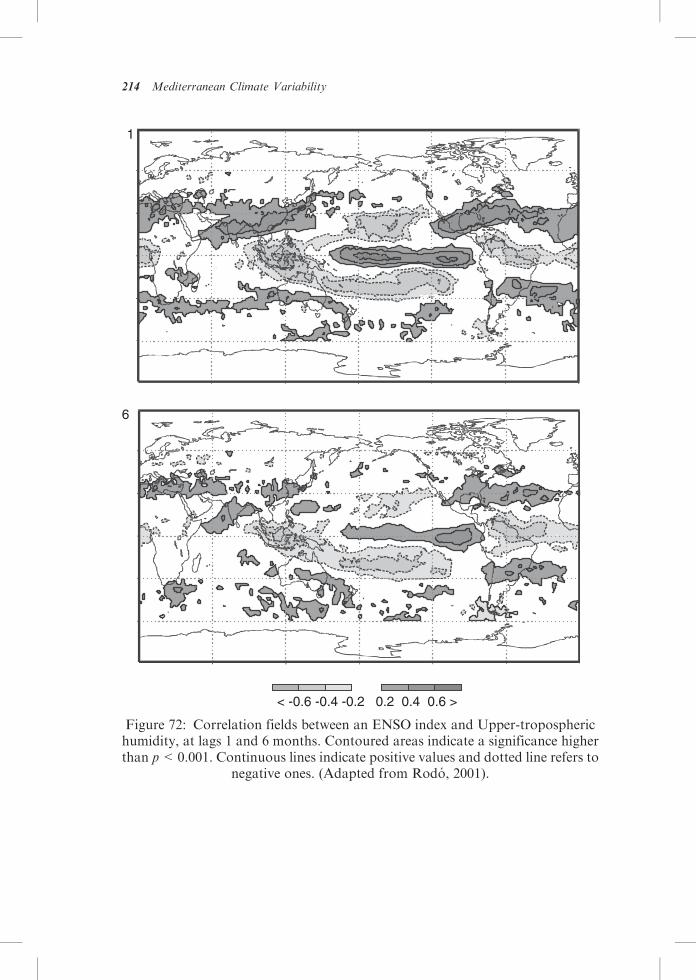
dynamics have been traced by means of upper tropospheric humidity changes
and varying heat fluxes (Fig. 72), as inferred from both cloud cover changes and
absorbed solar radiation (Rodo, 2001). Mariotti et al. (2002a, 2005) show an
anomalously weaker (stronger) Azores anticyclone in connection with autumn
(spring) rainfall anomalies in the Western Mediterranean. How these changes
alter the net heat fluxes both in the tropical north Atlantic and the Mediterranean
sea (particularly the western basin) and which might be their ultimate effects
on Mediterranean climate is the subject of active research and current debate.
A cooling of the western Mediterranean Sea appears to take place linked to
a sequence of atmosphere–ocean couplings that initiate in the warm tropical
Pacific during an El Nino event (Klein et al., 1999; Rodo, 2001).
Several authors have suggested the role played by ocean dynamics (Sutton and
Allen, 1997; Rodwell et al., 1999) as potential sources of variability affecting the
North Atlantic climate with impacts on the Mediterranean regions. Hoerling
et al. (2001) found that observed long-term changes in the NAO during winter
since 1950 are recoverable from tropical SST forcing alone. Latif (2001) show
some skill in predicting long-term changes in the NAO based on tropical SSTs.
Recent numerical experiments by Hoerling et al. (2004) and Hurrell et al. (2004)
indicate that tropical SST variations, particularly in tropical Indian and western
Pacific Ocean, have significantly controlled recent North Atlantic circulation
anomalies.
While the underlying mechanisms behind these tropical–extratropical connec-
tion remain to be explained, these studies suggest a potential for predicting
changes such as the dryness observed in the Mediterranean region in connection
to the trend in the NAO based on tropical SST anomalies. Effects of other
tropical systems like, Asian (Indian) Monsoon, African Monsoon, Hurricanes
and Saharan dust on the Mediterranean climate were also reported in many
studies and are summarized in Chapter 2 of this book.
3.6.2. Solar Variability
Solar variability and troposphere–stratosphere interaction (Perlwitz and Graf,
1995, 2001; Shindell et al., 1999) have been recognized to impact the North
Atlantic climate. Solar influence on the Earth’s climate is a long-discussed topic
and it has produced controversial scientific opinions. In general terms the solar
cycle relationship is viewed as just a statistical fluctuation, however the solar–
climate relationship could be strongly nonlinear. An example of this nonlinearity
is the problem of the spatial structure of the NAO according to the solar cycle.
Relations between Variability in the Mediterranean Region and Mid-latitude Variability 213
6
1
< -0.6 -0.4 -0.2 0.2 0.4 0.6 >
Figure 72: Correlation fields between an ENSO index and Upper-tropospherichumidity, at lags 1 and 6 months. Contoured areas indicate a significance higherthan p<0.001. Continuous lines indicate positive values and dotted line refers to
negative ones. (Adapted from Rodo, 2001).
214 Mediterranean Climate Variability
Kodera (2002, 2003) demonstrated that the spatial structure of the NAO
during the winter is very different during low solar activity (NAO confined in
the Atlantic sector) than during high solar activity (hemispherical structure
extending into the stratosphere). This difference has important consequences as
the modulation of the winter and summer circulation linkage (Ogi et al., 2003) or
the modulation of the relationship between NAO and the northern hemisphere
surface air temperature (Gimeno et al., 2003). Very recently, Kodera and Kuroda
(2005) have proposed a possible mechanism to explain the solar modulation of
the spatial structure of the NAO. They suggest that the solar activity influence
originates in the stratopause region from a change in the seasonal march of
the jet. The leading mode of the interannual variation of the zonal–mean zonal
wind in the stratopause region has a meridional dipole-type anomaly structure in
high solar activity winters. This structure extends into the troposphere by changes
in the meridional propagation of planetary waves giving a hemispherical
structure to the NAO. During low solar activity, the downward extension of
the zonal–mean zonal wind anomalies is weak, so regional scale variations
are dominant in the troposphere and NAO is confined in the Atlantic sector.
It has been shown that when the long-term solar activity is high, then the
smoothed NAO index is low and vice-versa (Kirov and Georgieva, 2002). Is
the strength of the NAO–solar connection sufficiently strong to impact directly
the Mediterranean climate? We believe that it is. A recent study on the frequency
and magnitude of flood episodes in Iberian rivers over the last millennium shows
that periods of high frequency in floods are well associated with periods of high
solar activity (Vaquero, 2004).
3.7. Future Outlook
In the twentieth century the Mediterranean was characterized by positive trends
of temperature in every season but particularly in winter and summer. However,
if one restricts the analysis to the last three or four decades, the positive trend is
prominent in the summer (particularly in the west), while areas of negative trend
can be observed in spring. On the other hand, the twentieth century precipitation
regime was characterized by negative (positive) winter precipitation trends over
the eastern (western) Mediterranean regions, while autumn and spring reveal
mostly negative trends in Iberia and central Mediterranean regions. Over the last
50 years, there has been a significant decrease of precipitation in winter and
spring, with a conspicuous decline of March precipitation throughout the western
Mediterranean sector.
The physical processes responsible for these trends and changes seem to be
partially of a hemispheric nature (such as external forcings and changes in the
Relations between Variability in the Mediterranean Region and Mid-latitude Variability 215
large-scale atmospheric circulation) as well as local/regional (such as changes
in earth surface and land use). In fact, temperature and precipitation trends over
the Mediterranean, during the twentieth century, are shown to be directly linked
to changes in phase of some of the major large-scale circulation modes previously
mentioned, particularly for NAO and EA/WRUS patterns during the winter
season.
It should be stressed that most studies on variability and trends of precipitation
over the Mediterranean region and associated atmospheric circulation patterns
focus on the winter part of the year. Some of these studies use the standard winter
3 months (DJF), others also incorporate the months of March (e.g. Trigo et al.,
2002b, 2004a), some even use the wet season concept between October and
March (e.g. Xoplaki et al., 2004). In any case, the highly seasonal behaviour of
the precipitation regime is reflected in a bias towards winter on the number of
scientific works published. We acknowledge that such bias is also present in
this chapter. Studies on trends of temperature cover more evenly the various
seasons of the year, with slightly more focus on the two extreme seasons, i.e.
summer and winter.
As we have shown in this chapter, considerable research has been carried
out produced in recent years linking the most relevant large-scale atmospheric
circulation modes with Mediterranean climate variables. In particular, it is now
clear that twentieth century trends of precipitation, temperature, cloud cover can
be attributed, at least partially, to corresponding trends of well-established
circulation patterns. Nevertheless, there are still grey areas, and different issues
require further analysis in the near future. Here we provide a list of issues that
in our view should be dealt explicitly during the next decade:
(1) There are large gaps between datasets for the northern and southern margins
of the Mediterranean basin. Therefore, it is necessary to assemble more
reliable and consistent climate datasets (both at the daily and monthly scale)
over the entire Mediterranean basin. Among other initiatives, it would be
particularly helpful to contribute to the production of a high resolution
regional reanalyses dataset.
(2) Despite the large amount of work already done on climate trends, we
acknowledge that there is still scope for further work. Therefore, it is
necessary to confirm the role played by important large-scale modes to
explain regional temperature and precipitation variability and trends for
different periods and seasons within the instrumental period using sophisti-
cated statistical methods. It is necessary to characterize the climatic impact
imposed by these atmospheric circulation modes on a month-by-month basis
and to assess precisely where these impacts are significant. Furthermore,
216 Mediterranean Climate Variability

especial attention should be devoted to characterize changes of the annual
cycle in Mediterranean temperature and precipitation through the instru-
mental period.
(3) Climate change scenarios obtained with different General CirculationModels
(GCMs) reveal that there is a general agreement towards a significant
decrease of precipitation for this region among most GCMs (Folland et al.,
2001). In fact, this is the region of the planet that shows a more consistent
signal towards a dry future as shown by the analysis of climate model
simulations regarding the reproducibility of the main characteristics of the
extra tropical modes, including its impact on the precipitation field and
cyclonic activity (Osborn et al., 1999; Ulbrich and Christoph, 1999; Trigo and
Palutikof, 2001). However, present climate models are still unable to replicate
the observed amplitude of the interannual variability and of the multidecadal
trends of some modes, e.g. the NAO (Osborn, 2004). Therefore, this work
should be continued and intensified with the aim of determining to what
extent climate models yield a realistic picture of the variability in the present
climate and quantifying, if possible, the amount of expected regional climate
change that can be ascribed to future trends in extra tropical modes, since
these modes will probably be responsible for regional differences in the
future climate.
(4) Trends in the large-scale driving patterns are especially relevant since they
may enhance or dampen the warming caused by increasing greenhouse gas
concentrations. However, to our knowledge, work has just begun in this
direction. Relevant questions in this context are the possible changes of
these extra tropical modes under global climate change. The results to
date seem to indicate that the so-called Annular Modes – the Arctic
Oscillation and the Antarctic Oscillation – to which the NAO is linked
will tend to become more intense in the future (Guillet et al., 2000),
although the signal-to-noise ratio may be not very large (Zorita and
Gonzalez-Rouco, 2000). In a more regional basis, some work has been
reported for the Western Mediterranean (Gonzalez-Rouco et al., 2000)
and the Balkans (Busuioc et al., 1999). These issues are further stressed in
Chapter 8 of this book.
(5) Many studies have underlined the role of several teleconnection patterns
(NAO, EA/WRUS, EA, EA-Jet, SCAND) over different parts of the
Mediterranean basin. However, in general it is not clear whether there are
significant differences in the physical mechanisms for the generation and
dissipation of these planetary regimes, or whether the only difference lies
simply in the geographical location of their centres of action. Furthermore,
the underlying physical mechanisms (moisture and enthalpy advection,
Relations between Variability in the Mediterranean Region and Mid-latitude Variability 217

cyclogenesis and storm tracks, vertical stability, radiation and cloud cover,
oceanic processes etc.) that give rise to these statistical connections are not
always completely understood.
This question is three-fold relevant:
� in the context of changes in the intensity of these circulation patterns under
global climate change. Only with a sufficient understanding of the physical
mechanisms will it be possible to estimate the effect of changes of extra tropical
modes on the Mediterranean climate.
� For understanding the variability at decadal time scales (where persistent
deviations of atmospheric indices have been observed), and estimate their
influence on low-frequency changes in temperature and precipitation, in the
frame of other possibly competing effects, such as land use changes.
� Seasonal climate prediction would greatly benefit from research in this direc-
tion. A substantial fraction of the climate variability of the Mediterranean
basin may be explained in terms of a few planetary flow regimes. Their
predictability, though, is not well quantified, and their origin and possible
relationship with oceanic process is very uncertain. Possibly, in order to
make accurate predictions of variables like precipitation, some kind of down-
scaling method would be necessary to fill the gap between the large and the
regional scales.
Acknowledgements
The authors are indebted to Dr. Clare Goodess for her comments and
suggestions that helped to improve the clarity of this chapter. Ricardo Trigo
and Isabel Trigo (CGUL) were supported by the Portuguese Science
Foundation (FCT) through project VAST (Variability of Atlantic Storms
and their impact on land climate) Contract POCTI/CTA/46573/2002, co-
financed by the European Union under program FEDER. Jurg Luterbacher
and Elena Xoplaki are supported by the Swiss National Science Foundation
(NCCR). Elena Xoplaki was financially supported through the European
Environment and Sustainable Development programme, projects SOAP
(EVK2-CT-2002-00160) and EMULATE (EVK2-CT-2002-00161). Maurizio
Maugeri (Milan University) was supported by the project CLIMAGRI (Italian
Ministry for agriculture and forests). Michele Brunetti and Teresa Nanni
(ISAC-CNR) were supported by the ALP-IMP project (EU-FP5) and U.S.–
ITALY bilateral Agreement on Cooperation in Climate Change Research and
Technology (Italian Ministry for the environment). Jucundus Jacobeit was
supported by the EU project EMULATE (European and North Atlantic daily
218 Mediterranean Climate Variability

to multidecadal climate variability), EVK2-CT-2002-00161. Jesus Fernandez
was funded by the Basque Regional Government through grant BFI04.52.
References
Barnston, A. G., & Livezey, R. E. (1987). Classification, seasonality and persistence oflow-frequency atmospheric circulation patterns. Mon. Wea. Rev., 115(1–2), 1083–1127.
Barriopedro, D., Garcıa-Herrera, R., Lupo, A. R., & Hernandez, E. (2005). Aclimatology of Northern Hemisphere blocking, J. Climate, (accepted).
Barry, R. G., & Chorley, R. J. (2003). Atmosphere, weather and climate. Routledge,London).
Ben-Gai, T., Bitan, A., Manes, A., Alpert, P., & Kushnir, Y. (2001). Temperatureand surface pressure anomalies in Israel and the North Atlantic Oscillation. Theor.Appl. Climatol., 69(3–4), 171–177.
Bronnimann, S., & Luterbacher, J. (2004). Reconstructing Northern Hemisphere upper-level fields during World War II. Clim. Dyn., 22, 499–510.
Brunet, M., Aguilar, E., Saladıe, O., Sigro, J., & Lopez, D. (2001). The variationsand trends of the surface air temperature in the Northeastern Spain from middlenineteenth century onwards. In: M. Brunet, and D. Lopez, (Eds), Detecting andModelling Regional Climate change, (Berlin, Springer).
Brunetti, M., Colacino, M., Maugeri, M., & Nanni, T. (2001). Trends in the dailyintensity of precipitation in Italy from 1951 to 1996. Int. J. Climatol., 21(D18), 299–316.
Brunetti, M., Maugeri, M., & Nanni, T. (2002). Atmospheric circulation andprecipitation in Italy for the last 50 years. Int. J. Climatol., 22, 1455–1471.
Brunetti, M., Maugeri, M., Monti, F., & Nanni, T. (2004). Changes in daily precipitationfrequency and distribution in Italy over the last 120 years. J. Geophys. Res. Atmosph.,109, D05, doi:10.1029/2003JD004296.
Brunetti, M., Maugeri, M., Monti, F., & Nanni, T. (2006). Temperature andprecipitation variability in Italy in the last two centuries from homogenizedinstrumental time series. Int. J. Climatol., in press.
Busuioc, A., von Storch, H., & Schnur, R. (1999). Verification of GCM generatedregional precipitation and of statistical downscaling estimates. J. Climate, 12, 258–272.
Castro-Dıez, Y., Pozo-Vazquez, D., Rodrigo, F. S., & Esteban-Parra, M. J. (2002). NAOand winter temperature variability in southern Europe,. Geophys. Res. Lett., 29, 8, doi:10.1029/2001GL014042.
Conte, M., Giuffrida, S., & Tedesco, S. (1989). The Mediterranean oscillation: impacton precipitation and hydrology in Italy. Proceedings of the conference on climate andwater, Publications of the Academy of Finland, Helsinki, 1, 121–137.
Corte-Real, J., Zhang, X., & Wang, X. (1995). Large-scale circulation regimes andsurface climatic anomalies over the Mediterranean. Int. J. Climatol., 15, 1135–1150.
Cullen, H. M., & de Menocal, P. B. (2000). North Atlantic influence on Tigris–Euphratesstreamflow. Int. J. Climatol., 20, 853–863.
Dunkeloh, A., & Jacobeit, J. (2003). Circulation dynamics of MediterraneanPrecipitation Variability 1948–1998. Int. J. Climatol., 23, 1843–1866.
Fernandez, F., & Rasilla, D. (2001). Secular variations of the synoptic circulation overthe Iberian Peninsula. In: M. Brunet, and D. Lopez, (Eds), Detecting and ModellingRegional Climate Change, (Berlin, Springer).
Relations between Variability in the Mediterranean Region and Mid-latitude Variability 219
Fernandez, J., Saenz, J., & Zorita, E. (2003). Analysis of wintertime atmosphericmoisture transport and its variability over southern Europe in the NCEP-Reanalyses.Clim. Res., 23, 195–215.
Folland, C. K., et al. (2001). Observed climate variability and change, in Chapter 2 ofclimate change 2001; Houghton, J. T. et al. (Eds), the scientific basis, contributionof working group I to the third assessment report of the Intergovernmental Panelon Climate Change, Cambridge University Press, Cambridge, UK and New York,NY, USA.
Galan, E., Canada, R., Fernandez, F., & Cervera, B. (2001). Annual temperatureevolution in the southern plateau of Spain from the construction of regional climatictime series. In: M. Brunet, and S. Lopez (Eds), Detecting and Modelling RegionalClimate Change, (Springer-Verlag, Berlin, pp. 119–131).
Gimeno, L., de la Torre, L., Nieto, R., Garcıa, R., Hernandez, E., & Ribera, P. (2003).Changes in the relationship NAO-Northern Hemisphere temperature due to solaractivity. Earth Planet. Sci. Lett., 206, 15–20.
Giorgi, F. (2002). Variability and trends of sub-continental scale surface climate inthe twentieth century. Part I: observations. Clim. Dyn., 18, 675–791.
Gonzalez-Rouco, J. F., Heyen, H., Zorita, E., & Valero, F. (2000). Agreement betweenobserved rainfall trends and climate change simulations in the southwest of Europe.J. Climate, 13, 976–985.
Gonzalez-Rouco, J. F., Jimenez, J. L., Quesada, V., & Valero, F. (2001). Quality controland homogenization of monthly precipitation data in the southwest of Europe.J. Climate, 14, 964–978.
Goodess, C. M., & Jones, P. D. (2002). Links between circulation and changes in thecharacteristics of Iberian rainfall. Int. J. Climatol., 22, 1593–1615.
Guillet, N., Hegerl, G. C., Allen, M. R., & Scott, P. A. (2000). Implications of changesin the Northern Hemisphere circulation for the detection of anthropogenic climatechange. Geophys. Res. Lett., 27, 993–996.
Hansen, J. E., Ruedy, R., Sato, M. K., Imhoff, M., Lawrence, W., Easterling, D.,Peterson, T., & Karl, T. (2001). A closer look at United States and global surfacetemperature change. J. Geophys. Res., 106, 23947–23963.
Hasanean, H. M. (2004). Wintertime surface temperature in Egypt in relation to theassociated atmospheric circulation. Int. J. Climatol., 24, 985–999.
Hess, P., & Brezowski, H. (1977). Katalog der Grosswetterlagen Europas (1881–1976).Berichte des Deutschen Wetterdienstes 113(15), Selbstverlag des DeutschenWetterdienstes, Offenbach am Main, Germany.
H. M. S. O. (1962). Weather in the Mediterranean I: general meteorology. 2nd ed.,London, 362 p.
Hoerling, M. P., Hurrell, J. W., & Xu, T. (2001). Tropical origins for recent NorthAtlantic climate change. Science, 292, 90–92.
Hoerling, M. P., Hurrell, J. W., Xu, T., Bates, G. T., & Phillips, A. S. (2004). TwentiethCentury North Atlantic Climate change. Part II: understanding the effect of IndianOcean warming. Clim. Dyn., 23, 391–405.
Hurrell, J. W. (1995). Decadal trends in the North Atlantic Oscillation: regionaltemperatures and precipitation. Science, 269, 676–679.
Hurrell, J. W., & van Loon, H. (1997). Decadal variations in climate associated withthe North Atlantic Oscillation. Clim. Change, 36, 301–326.
220 Mediterranean Climate Variability

Hurrell, J. W., Hoerling, M. P., Phillips, A. S., & Xu, T. (2004). Twentieth CenturyNorth Atlantic Climate change. Part I: assessing determinism. Climate dynamics.Clim. Dyn., 23, 371–389.
Jacobeit, J. (2000). Rezente Klimaentwicklung im Mittelmeerraum. PetermannsGeographische Mitteilungen, 144, 22–33.
Jacobeit, J., Dunkeloh, A., & Hertig, E. (2004). Die Niederschlagsentwicklung immediterranen Raum und ihre Ursachen. In: J. L. Lozan, H. Grassl, P. Hupfer,L. Menzel, & C. D. Schonwiese, (Eds), Warnsignal Klima: Genug Wasser fur alle?,(Hamburg, pp. 192–196).
Jones, P. D., Jonsson, T., & Wheeler, D. (1997). Extension to the North AtlanticOscillation using instrumental pressure observations from Gibraltar and south-westIceland. Int. J. Climatol., 17, 1433–1450.
Jung, T., & Hilmer, M. (2001). On the link between the North Atlantic Oscillationand Arctic sea ice export through Fram Strait. J. Climate, 14, 3932–3943.
Kimoto, M., & Ghil, M. (1993). Multiple flow regimes in the Northern Hemispherewinter. Part II: sectorial regimes and preferred transitions. J. Atmos. Sci., 50,2645–2673.
Kirov, B., & Georgieva, K. (2002). Long term variations and interrelations of ENSO,NAO & Solar Activity. Phys. Chem. Earth., 27, 441–448.
Klein, S. A., Soden, B. J., & N.-Lau, C. (1999). Remote sea surface temperaturevariations during ENSO: evidence for a tropical atmospheric bridge. J. Clim., 12,917–932.
Kodera, K. (2002). Solar cycle modulation of the North Atlantic Oscillation: Implicationin the spatial structure of the NAO. Geophys. Res. Lett., 29, 1218, doi: 10.1029/2001GL014557.
Kodera, K. (2003). Solar influence on the spatial structure of the NAO during the winter1900–1999. Geophys. Res. Lett., 30, 1175, doi: 10.1029/2002GL016584.
Kodera, K., & Kuroda, Y. (2005). A possible mechanism of solar modulation of thespatial structure of the North Atlantic Oscillation. J. Geophys. Res., 110, D02111, doi:10.1029/2004JD005258.
Koppen, W. (1936). In: Das geographische System der Klimate: Handbuch derKlimatologie. W. Koppen, and R. Geiger, (Eds), Vol. 3, (Gebruder Borntrager,Berlin, p. 46).
Krichak, S. O., Kishcha, P., & Alpert, P. (2002). Decadal trends of main Eurasianoscillations and the Eastern Mediterranean precipitation. Theor. Appl. Climatol., 72,209–220.
Krichak, S. O., & Alpert, P. (2005a). Decadal trends in the east Atlantic/West Russiapattern and the Mediterranean precipitation. Int. J. Climatol., 25, 183–192.
Krichak, S. O., & Alpert, P. (2005b). Signatures of the NAO in the atmosphericcirculation during wet winter months over the Mediterranean region. Theor. Appl.Climatol., (In press).
Kutiel, H., & Benaroch, Y. (2002). North Sea-Caspian Pattern (NCP) – an upper levelatmospheric teleconnection affecting the eastern mediterranean: Identification anddefinition. Theor. Appl. Climatol., 71, 17–28.
Kutiel, H., Maheras, P., Turkes� , M., & Paz, S. (2002). North Sea – Caspian Pattern(NCP) – an upper level atmospheric teleconnection affecting the easternMediterranean –implications on the regional climate. Theor. Appl. Climatol., 72, 173–192.
Relations between Variability in the Mediterranean Region and Mid-latitude Variability 221
Lamb, P. (1972). British Isles weather types and a register of daily sequence of circulationpatterns, 1861–1971, Geophysical Memoir 116, HMSO, London, 85 pp.
Lamb, P., & Peppler, R. (1987). The North Atlantic Oscillation: concept and anapplication. Bull. Amer. Meteor. Soc., 68, 1218–1225.
Latif, M. (2001). Tropical Pacific/Atlantic Ocean interactions at multi-decadal timescales. Geophys. Res. Lett., 28, 535–542.
Lu, J., & Greatbatch, R. J. (2002). The changing relationship between the NAO andthe Northern Hemisphere Climate Variability. Geophys. Res. Lett., 29, 10, doi:1029/2001GLO14052.
Luterbacher, J., Xoplaki, E., Dietrich, D., Rickli, R., Jacobeit, J., Beck, C.,Gyalistras, D., Schmutz, C., & Wanner, H. (2002). Reconstruction of sea-level pressurefields over the Eastern North Atlantic and Europe back to 1500. Clim. Dyn., 18,545–561.
Mariotti, A., Zeng, N., & Lau, K. M. (2002a). Euro-Mediterranean rainfall andENSO – a seasonally varying relationship. Geophys. Res. Lett., 29, 12, doi:10.1029/2001GL014248.
Mariotti, A., Struglia, M. V., Zeng, N., & K.-Lau, M. (2002b). The hydrological cycle inthe Mediterranean region and implications for the water budget of the MediterraneanSea. J. Climate, 15, 1674–1690.
Mariotti, A., Ballabrera-Poy, J., & Zeng, N. (2005). Tropical influence on Euro-Asian autumn rainfall. Clim. Dyn., 24(5), 10.1007/s00382-004-0498-6: 511–521.
Massacand, A. C., Wernly, H., & Davies, H. C. (1998). Heavy precipitation onthe Alpine south-side: an upper-level precursor. Geophys. Res. Lett., 25,1435–1438.
Mathieu, P., Sutton, R. T., Dong, B., & Collins, M. (2004). Predictability of winterclimate over the North Atlantic European region during ENSO events. J. Climate, 17,1953–1974.
Maugeri, M., Bagnati, Z., Brunetti, M., & Nanni, T. (2001). Trends in Italian totalcloud amount, 1951–1996. Geophys. Res. Lett., 28, 4551–4554.
New, M. G., Hulme, M., & Jones, P. D. (2000). Representing twentieth-centuryspace-time climate variability. Part II: development of 1901–96 monthly grids ofterrestrial surface climate. J. Climate, 13, 2217–2238.
New, M., Todd, M., Hulme, M., & Jones, P. D. (2001). Precipitation measurementsand trends in the twentieth century. Int. J. Climatol., 21, 1899–1922.
NOAA-CPC (2005a). Northern Hemisphere Teleconnection Patterns. http://www.cpc.ncep.noaa.gov/data/teledoc/telecontents.html.050405.
NOAA-CPC (2005b). Calendar months when specific teleconnection patterns areimportant. http://www.cpc.ncep.noaa.gov/data/teledoc/teletab.gif.
Norrant, C., & Douguedroit (2005). Monthly and daily precipitation trends in theMediterranean (1950–2000). Theor. Appl. Climatol., (in press).
Ogi, M., Yamazaki, K., & Tachibana, Y. (2003). Solar cycle modulation of the seasonallinkage of the North Atlantic Oscillation (NAO). Geophys. Res. Lett., 30, 2170,doi:10.1029/2003GL018545.
Osborn, T. J., Briffa, K. R., Tett, S. F. B., Jones, P. D., & Trigo, R. M. (1999).Evaluation of the North Atlantic Oscillation as simulated by a climate model.Clim. Dyn., 15, 685–702.
Osborn, T. J. (2004). Simulating the winter North Atlantic Oscillation: the roles ofinternal variability and greenhouse gas forcing. Clim. Dyn., 22, 605–623.
222 Mediterranean Climate Variability

Overland, J. E., & Wang, M. (2005). The Artic climate paradox: the recentdecrease of the Artic Oscillation. Geophys. Res. Lett., 32, L06701, doi:10.1029/2004GL021752.
Paredes, D., Trigo, R. M., Garcia-Herrera, R., & Trigo, I. F. (2005). Understandingprecipitation changes in Iberia in early Spring: weather typing and storm-trackingapproaches, J. Hydrometeor., (accepted).
Perlwitz, J., & Graf, H. F. (1995). The statistical conection between tropospheric andstratospheric circulation of the Northern Hemisphere in winter. J. Clim., 8, 2281–2295.
Perlwitz, J., & Graf, H. F. (2001). Troposphere-stratosphere dynamic coupling understrong and weak polar vortex condition. Geophys. Res. Lett., 28, 271–274.
Pozo-Vazquez, D., Esteban-Parra, M. J., Rodrigo, F. S., & Castro-Diez, Y. (2001a). Theassociation between ENSO and winter atmospheric circulation and temperature inthe North Atlantic region. J. Climate, 14, 3408–3420.
Pozo-Vazquez, D., Esteban-Parra, M. J., Rodrigo, F., & Castro-Dıez, Y. (2001b). Astudy of NAO variability and its possible non-linear influences on European surfacetemperature. Clim. Dyn., 17, 701–715.
Price, C., Stone, L., Rajagopalan, B., & Alpert, P. (1998). A possible link betweenEl Nino and precipitation in Israel. Geophys. Res. Lett., 25, 3963–3966.
Prieto, L., Garcıa-Herrera, R., Dıaz, J., Hernandez, E., & del Teso, M. T. (2004).Minimum Extreme Temperatures over Peninsular Spain. Global and Planetary Change,44, 59–71, doi:10.1016/j.gloplacha.2004.06.005.
Qian, B., Corte-Real, J., & Xu, H. (2000). Is the North Atlantic Oscillation themost important atmospheric pattern for precipitation in Europe? J. Geophys. Res., 105,11901–11910.
Quadrelli, R., Pavan, V., & Molteni, F. (2001). Wintertime variability of Mediterraneanprecipitation and its links with large-scale circulation anomalies. Clim. Dyn., 17, 5–6,457–466.
Rex, D. F. (1950a). Blocking action in the middle troposphere and its effect uponregional climate. Part I.: An aerological study of blocking action. Tellus, 2, 196–211.
Rex, D. F. (1950b). Blocking action in the middle troposphere and its effect uponregional climate. Part II: The climatology of blocking action. Tellus, 2, 275–301.
Rex, D. F (1951). The effect of Atlantic blocking action upon European climate. Tellus,3, 1–16.
Ribera, P., Garcia, R., Diaz, H. F., Gimeno, L., & Hernandez, E. (2000). Trendsand interannual oscillations in the main sea-level surface pressure. patterns over theMediterranean, 1955–1990. Geophys. Res. Lett., 27, 1143–1146.
Rodo, X., Baert, E., & Comin, F. A. (1997). Variations in seasonal rainfall in SouthernEurope during the present century: relationships with the North Atlantic Oscillationand the El Nino-Southern oscillation. Clim. Dyn., 13, 275–284.
Rodo, X. (2001). Reversal of three global atmospheric fields linking changes in SSTanomalies in the Pacific, Atlantic and Indian oceans at tropical latitudes andmidlatitudes. Clim. Dyn., 18, 203–217.
Rodrıguez-Fonseca, B., & de Castro, M. (2002). On the connection between winteranomalous precipitation in the Iberian Peninsula and North West Africa and thesummer subtropical atlantic sea surface temperature. Geophys. Res. Lett., 29, 10.1029/2001GL014421.
Rodwell, M. J., Rowell, D. P., & Folland, C. K. (1999). Oceanic forcing of the wintertimeNorth Atlantic Oscillation and European Climate. Nature, 398, 320–323.
Relations between Variability in the Mediterranean Region and Mid-latitude Variability 223
Rogers, J. C. (1984). The association between the North Atlantic Oscillation and theSouthern Oscillation in the Northern Hemisphere. Mon. Wea. Rev., 112, 1999–2015.
Rotter, R., & van de Geijn, S. C. (1999). Climate change effects on plant growth, cropyield and livestock. Clim. Change, 43, 651–681.
Saenz, J., Zubillaga, J., & Rodriguez-Puebla, C. (2001a). Interannual variability of winterprecipitation in northern Iberian Peninsula. Int. J. Climatol., 21, 1503–1513.
Saenz, J., Rodrıguez-Puebla, C., Fernandez, J., & Zubillaga, J. (2001b). Interpretation ofinteranual winter temperature variations over southwestern Europe. J. Geophys. Res.,106, 20641–20652.
Santos, F. D., Forbes, K., & Moita, R. (2002). Climate change in Portugal. Scenarios,impacts and adaptation measures – SIAM Project, Gradiva, Lisbon.
Schmutz, C., Luterbacher, J., Gyalistras, D., Xoplaki, E., & Wanner, H. (2000). Canwe trust proxy-based NAO index reconstructions? Geophys. Res. Lett., 27, 1135–1138.
Schonwiese, C. D. (1993). Klimatrend-Atlas Europa 1891–1990 (Atlas of climatetrends for Europe 1891–1990). Verlag, Zentrum fur Umweltforschung, Frankfurt.218 pp.
Shindell, D. T., Miller, R. L., Schmidt, G., & Pandolfo, L. (1999). Simulation of theArctic oscillation trend by greenhouse forcing of a stratospheric model. Nature, 399,453–455.
Sigro, J., (2004). Variabilidad espacio-temporal de la temperatura del aire en Cataluna,Ph.D, University of Rovira i Virgili, Tarragona.
Struglia, M. V., Mariotti, A., & Filograsso, A. (2004). River discharge into theMediterranean Sea: climatology and aspects of the observed variability. J. Climate, 17,4740–4751.
Sutton, R. T., & Allen, M. R. (1997). Decadal predictability of North Atlantic sea surfacetemperature and climate. Nature, 388, 563–567.
Thompson, D. W. J., & Wallace, J. M. (1998). The Arctic Oscillation signature inthe wintertime geopotential height and temperature fields. Geophys. Res. Lett., 25,1297–1300.
Tibaldi, S., D’Andrea, F., Tosi, E., & Roeckner, E. (1997). Climatology of NorthernHemisphere blocking in the ECHAM model. Clim. Dyn., 13, 649–666.
Touchan, R., Xoplaki, E., Funkhouser, G., Luterbacher, J., Hughes, M. K., Erkan, N.,Akkemik, U., & Stephan, J. (2005). Reconstructions of Spring/Summer precipitationfor the Eastern Mediterranean from tree-ring widths and its connection to large-scaleatmospheric circulation. Clim. Dyn., DOI:10.1007/s00382s-005–0016-5.
Trenberth, K., & Paolino, D. A. (1980). The Northern Hemisphere sea level pressuredata set: trends, errors and discontinuities. Mon. Weather Rev., 108, 855–872.
Trigo, I. F., Davies, T. D., & Bigg, G. R. (1999). Objective climatology of cyclones inthe Mediterranean region. J. Climate, 12, 1685–1696.
Trigo, I. F., Davies, T. D., & Bigg, G. R. (2000). Decline in Mediterranean rainfall causedby weakening of Mediterranean cyclones. Geophys. Res. Lett., 27, 2913–2916.
Trigo, I. F., Bigg, G. R., & Davies, T. D. (2002a). Climatology of cyclogenesismechanisms in the Mediterranean. Mon. Wea. Rev., 130, 549–569.
Trigo, R. M., & DaCamara, C. C. (2000). Circulation weather types and their impacton the precipitation regime in Portugal. Int. J. of Climatol., 20, 1559–1581.
Trigo, R. M., & Palutikof, J. P. (2001). Precipitation scenarios over Iberia: a comparisonbetween direct GCM output and different downscaling techniques. J. Climate, 14,4422–4446.
224 Mediterranean Climate Variability
Trigo, R. M., Osborn, T. J., & Corte-Real, J. (2002b). The North Atlantic Oscillationinfluence on Europe: climate impacts and associated physical mechanisms. Clim. Res.,20, 9–17.
Trigo, R. M., Pozo-Vazquez, D., Osborn, T. J., Castro-Dıez, Y., Gamiz-Fortis, S., &Esteban-Parra, M. J. (2004a). North Atlantic Oscillation influence on precipitation,river flow and water resources in the Iberian Peninsula. Int. J. Climatol., 24, 925–944.
Trigo, R. M., Trigo, I. F., DaCamara, C. C., & Osborn, T. J. (2004b). Climate impact ofthe European winter blocking episodes from the NCEP/NCAR reanalyses. Clim. Dyn.,23, 17–28.
Turkes� , M. (1996). Spatial and temporal analysis of annual rainfall variations in Turkey.Int. J. Climatol., 16, 1057–1076.
Turkes� , M. (1998). Influence of geopotential heights, cyclone frequency and southernoscillation on rainfall variations in Turkey. Int. J. Climatol., 18, 649–680.
Turkes� , M., & Erlat, E. (2003). Precipitation changes and variability in Turkey linkedto the North Atlantic Oscillation during the period 1930–2000. Int. J. Climatol., 23,1771–1796.
Turkes� , M., & Erlat, E. (2005). Climatological responses of winter precipitationin Turkey to variability of the North Atlantic Oscillation during the period 1930–2001.Theor. Appl. Climatol., Online paper: ISSN: 0177–798, 1434–4483.
Turkes� , M., Sumer, U. M., & Demir, _I. (2002). Re-evaluation of trends and changesin mean, maximum and minimum temperatures of Turkey for the period 1929–1999.Int. J. Climatol., 22, 947–977.
Turkes� , M., & Sumer, U. M. (2004). Spatial and temporal patterns of trends and vari-ability in diurnal temperature ranges of Turkey. Theor. Appl. Climatol., 77, 195–227.
Ulbrich, U., & Christoph, M. (1999). A shift in the NAO and increasing stormtrack activity over Europe due to anthropogenic greenhouse gas. Clim. Dyn., 15,551–559.
Ulbrich, U., Christoph, M., Pinto, J. G., & Corte-Real, J. (1999). Dependence of winterprecipitation over Portugal on NAO and baroclinic wave activity. Int. J. Climatol., 19,379–390.
van Loon, H., & Rogers, J. C. (1978). The seesaw in winter temperatures betweenGreenland and Northern Europe, Part 1: general description. Mon. Wea. Rev., 106,296–310.
Valero, F., Luna, M. Y., Martin, M. L., Morata, A., & Gonzalez-Rouco, J. F. (2004).Coupled modes of large scale climate variables and regional precipitation in theWestern Mediterranean in autumn. Clim. Dyn., 22, 307–323.
Vaquero, J. (2004). Solar signal in the number of floods recorded for the Tagus riverbasin over the last millennium. Climatic Change, 66, 23–26.
von Storch, H., Zorita, E., & Cubasch, U. (1993). Downscaling of global climate changeestimates to regional scales: an application to Iberian rainfall in wintertime. J. Climate,6, 1161–1171.
Walker, G. T. (1924). Correlations in seasonal variations of weather, IX Mem.Ind. Meteorol. Dept., 24, 275–332.
Wallace, J. M., & Gutzler, D. S. (1981). Teleconnections in the geopotential height fieldduring the Northern Hemisphere winter. Mon. Wea. Rev., 109, 784–812.
Wanner, H., Bronnimann, S., Casty, C., Gyalistras, D., Luterbacher, J., Schmutz, C.,Stephenson, D. B., & Xoplaki, E. (2001). North Atlantic Oscillation – concepts andstudies. Survey in Geophys., 22, 321–381.
Relations between Variability in the Mediterranean Region and Mid-latitude Variability 225
Webster, P. J., Magana, V. O., Palmer, T. N., Shukla, J., Tomas, R. A., Yanai, M., &Yasunari, T. (1998). Monsoons: processes, predictability, and the prospects forprediction. J. Geophys. Res., 103, 14451–14510.
Wibig, J. (1999). Precipitation in Europe in relation to circulation patterns at the 500 hPalevel. Int. J. Climatol., 19, 253–269.
Xoplaki, E. (2002), Climate variability over the Mediterranean, PhD thesis, University ofBern, Switzerland, Available through: http://sinus.unibe.ch/ klimet/docs/phd_xopla-ki.pdf.
Xoplaki, E., Gonzalez-Rouco, J. F., Gyalistras, D., Luterbacher, J., Rickli, R., &Wanner, H. (2003a). Interannual summer air temperature variability over Greeceand its connection to the large-scale atmospheric circulation and MediterraneanSSTs 1950–1999. Clim. Dyn., 20, 537–554, doi:10.1007/s00382-002-0291-3.
Xoplaki, E., Gonzalez-Rouco, J. F., Luterbacher, J., & Wanner, H. (2003b).Mediterranean summer air temperature variability and its connection to the large-scale atmospheric circulation and SSTs. Clim. Dyn., 20, 723–739.
Xoplaki, E., Gonzalez-Rouco, J. F., Luterbacher, J., & Wanner, H. (2004). Wet seasonmediterranean precipitation variability: influence of large-scale dynamics. Clim. Dyn.,23, 63–78.
Xoplaki, E., Luterbacher, J., Burkard, R., Patrikas, I., & Maheras, P. (2000). Connectionbetween the large-scale 500 hPa geopotential height fields and precipitation overGreece during wintertime. Clim. Res., 14, 129–146.
Xoplaki, E., Maheras, P., & Luterbacher, J. (2001). Variability of climate in meridionalbalkans during the periods 1675–1715 and 1780–1830 and its impact on human life.Clim. Change, 48, 581–615.
Yarnal, B. (1993). Synoptic Climatology in Environmental Analysis. A primer, studies inclimatology series. Belhaven Press, London).
Zorita, E., Kharin, V., & von Storch, H. (1992). The atmospheric circulation and seasurface temperature in the North Atlantic in winter. their interaction and relevancefor Iberian rainfall. J. Climate, 5, 1097–1108.
Zorita, E., & Gonzalez-Rouco, J. F. (2000). Disagreement in North Atlantic Oscillationpredictions and implications for global warming. Geophys. Res. Lett., 27, 1755–1758.
226 Mediterranean Climate Variability