
Ocean-atmosphere interactions in low-latitude Australasia
34
INTERNATIONAL JOURNAL OF CLIMATOLOGY, VOL. 10, 145-178 (1990) 551.465.7:551.526.6551.513.7 (93) OCEAN-ATMOSPHERE INTERACTIONS IN LOW-LATITUDE AUSTRALASIA ROBERT J. ALLAN Flinders lnstitute for Atmospheric and Marine Sciences, Flinders University, S.A.. Australia AND JOHN I. PARIWONO Division of Oceanography. Faculty of Fisheries-IPB. Kampus Darmaga. Bogor. Indonesia Received 12 August 1988 Revised I February 1989 ABSTRACT An analysis of ocean-atmosphere interactions in low-latitude Australasia is undertaken using simultaneous and lagged cross correlations and with reference to specific El Nifio/Southern Oscillation (ENSO) and anti-ENS0 episodes during the period 19641983. Major emphasis is placed on the relative importance of wind-stress-sea-surface-temperature (SST) mechanisms and cloudiness-radiation mechanisms, and the possible influence of SST advection, oceanic mixing, Indonesian throughflow, and low-frequency forcings on ocean-atmosphere couplings in the region. The evolution of ENSO events in Australasia is usually marked by a distinct alternation from anti-ENS0 to ENSO conditions. Ocean-atmosphere dynamics, involving primarily wind and radiative forcings, have been seen to be linked to such developments. However, SST advection and oceanic mixing are also found to play integral roles in forcing and feedback processes. Thus anti-ENS0 (ENSO) events are marked by easterly (westerly) wind-stress anomalies in the western equatorial Pacific, southerly (northerly) wind-stress anomalies in eastern Indonesian and eastern Coral Sea regions, + ( -)SST anomalies and weak (strong) SST advection in northern Australian waters, positive (negative) cloudiness anomalies over Australasia and high (low)sea-level anomalies at southern Philippine and northern Australian stations. There are also indications that ENSO-like conditions can develop in Australasia with no apparent events in the wider Pacific basin. However, there seems to be no conclusive evidence for the influence of oceanic throughflow on ocean-atmosphere interactions, and thus ENSO or anti-ENS0 phases. Nevertheless, there are indications that Indonesian throughflow is modulated by remote low-frequency forcings that are also apparent in SST anomalies in northern Australian waters. The potential for precursors of ENSO and anti-ENS0 events in the Australasian region is high. All of the parameters examined in this study show significant leadflag correlations, with the strongest persistence generally centering on the Southern Hemisphere winter-spring period. However, further investigation of potential and suggested links with coherent precipitation patterns over the region is still required. Moreover, any future developments in our understanding of ocean-atmosphere interactions in Australasia will need to address the general problem of establishing and maintaining extensive data networks. KEY WORDS Ocean-atmosphere coupling ENSO Indo-Pacific INTRODUCTION Large-scale ocean-atmosphere interactions are regarded as a fundamental component of the El Niiio/Southern Oscillation (ENSO) phenomenon in the Pacific Ocean basin (Philander, 1983, 1985; Gill and Rasmusson, 1983; Lau, 1985; Cane et al., 1986; Zebiak and Cane, 1987). However, until the recent investigations of Nicholls (1979, 1981, 1983, 1984a, b), Streten (1981, 1983) Wright (1984a), and Hackert and Hastenrath (1986), such aspects had received minimal attention in the Australasian region. Sea-surface temperatures in northern Australian waters have been correlated with the ENSO phenomenon and eastern Australian rainfall by Nicholls (1984c), Streten (1981, 1983) and W. J. Wright (1987). However, it 0899-841 8/90/020145-34$17.00 0 1990 by the Royal Meteorological Society
-
Upload
bogoragriculturaluniversity -
Category
Documents
-
view
1 -
download
0
Transcript of Ocean-atmosphere interactions in low-latitude Australasia
INTERNATIONAL JOURNAL OF CLIMATOLOGY, VOL. 10, 145-178 (1990) 551.465.7:551.526.6551.513.7 (93)
OCEAN-ATMOSPHERE INTERACTIONS IN LOW-LATITUDE AUSTRALASIA
ROBERT J. ALLAN
Flinders lnstitute for Atmospheric and Marine Sciences, Flinders University, S.A. . Australia AND
JOHN I. PARIWONO Division of Oceanography. Faculty of Fisheries-IPB. Kampus Darmaga. Bogor. Indonesia
Received 12 August 1988 Revised I February 1989
ABSTRACT
An analysis of ocean-atmosphere interactions in low-latitude Australasia is undertaken using simultaneous and lagged cross correlations and with reference to specific El Nifio/Southern Oscillation (ENSO) and anti-ENS0 episodes during the period 19641983. Major emphasis is placed on the relative importance of wind-stress-sea-surface-temperature (SST) mechanisms and cloudiness-radiation mechanisms, and the possible influence of SST advection, oceanic mixing, Indonesian throughflow, and low-frequency forcings on ocean-atmosphere couplings in the region.
The evolution of ENSO events in Australasia is usually marked by a distinct alternation from anti-ENS0 to ENSO conditions. Ocean-atmosphere dynamics, involving primarily wind and radiative forcings, have been seen to be linked to such developments. However, SST advection and oceanic mixing are also found to play integral roles in forcing and feedback processes. Thus anti-ENS0 (ENSO) events are marked by easterly (westerly) wind-stress anomalies in the western equatorial Pacific, southerly (northerly) wind-stress anomalies in eastern Indonesian and eastern Coral Sea regions, + ( -)SST anomalies and weak (strong) SST advection in northern Australian waters, positive (negative) cloudiness anomalies over Australasia and high (low) sea-level anomalies at southern Philippine and northern Australian stations. There are also indications that ENSO-like conditions can develop in Australasia with no apparent events in the wider Pacific basin. However, there seems to be no conclusive evidence for the influence of oceanic throughflow on ocean-atmosphere interactions, and thus ENSO or anti-ENS0 phases. Nevertheless, there are indications that Indonesian throughflow is modulated by remote low-frequency forcings that are also apparent in SST anomalies in northern Australian waters.
The potential for precursors of ENSO and anti-ENS0 events in the Australasian region is high. All of the parameters examined in this study show significant leadflag correlations, with the strongest persistence generally centering on the Southern Hemisphere winter-spring period.
However, further investigation of potential and suggested links with coherent precipitation patterns over the region is still required. Moreover, any future developments in our understanding of ocean-atmosphere interactions in Australasia will need to address the general problem of establishing and maintaining extensive data networks.
KEY WORDS Ocean-atmosphere coupling ENSO Indo-Pacific
INTRODUCTION
Large-scale ocean-atmosphere interactions are regarded as a fundamental component of the El Niiio/Southern Oscillation (ENSO) phenomenon in the Pacific Ocean basin (Philander, 1983, 1985; Gill and Rasmusson, 1983; Lau, 1985; Cane et al., 1986; Zebiak and Cane, 1987). However, until the recent investigations of Nicholls (1979, 1981, 1983, 1984a, b), Streten (1981, 1983) Wright (1984a), and Hackert and Hastenrath (1986), such aspects had received minimal attention in the Australasian region.
Sea-surface temperatures in northern Australian waters have been correlated with the ENSO phenomenon and eastern Australian rainfall by Nicholls (1984c), Streten (1981, 1983) and W. J. Wright (1987). However, it
0899-841 8/90/020145-34$17.00 0 1990 by the Royal Meteorological Society

146 R. J . ALLAN A N D J . 1. PARIWONO
has been the studies of Nicholls (1984a, b), Hastenrath and Wu (1982), and Hackert and Hastenrath (1986) that have suggested interrelated mechanisms which are responsible for seasonally varying ocean-atmosphere couplings in low-latitude Australasia. These mechanisms include the type of ocean-atmosphere interactions documented and numerically modelled by Gill ( 1 980, 1982, 1985), Keshavamurty (1 982), Gill and Rasmusson (19831, and Heckley and Gill (1984) for the equatorial zone and applied particularly to the ‘warm pool’ in the western equatorial Pacific.
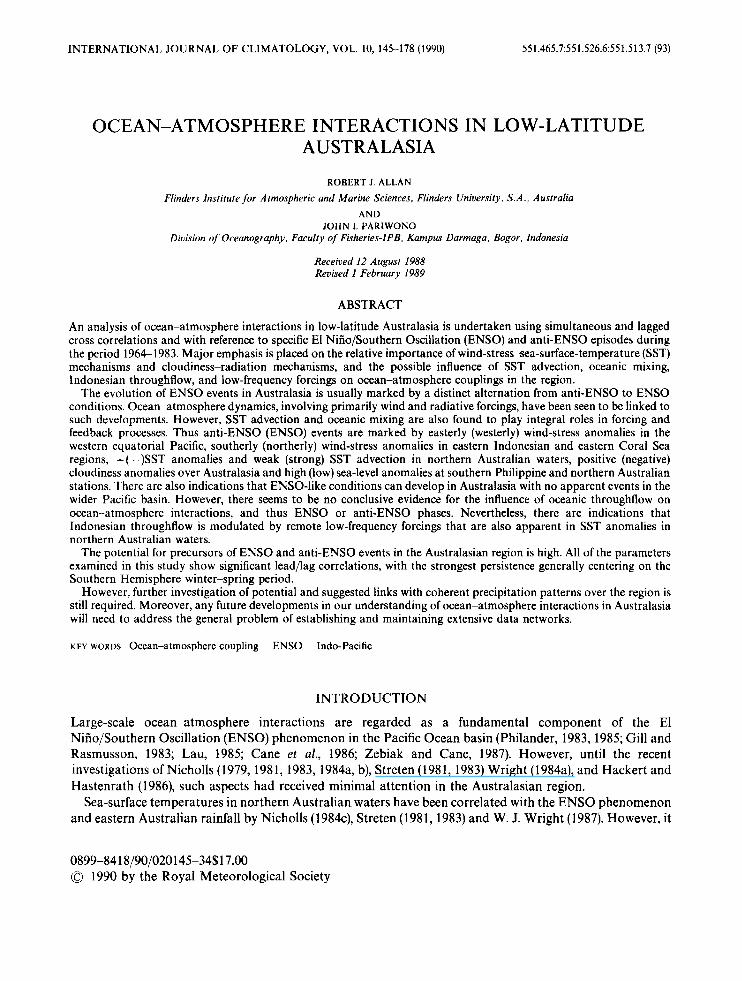
Using a stochastically forced ad hoc model linking ocean and atmosphere, Nicholls (1984b) has suggested that many aspects of the ENSO phenomenon may have their genesis in Indonesian waters. He details a mechanism to explain seasonally varying ocean-atmosphere interactions in the Indonesian region in terms of feedbacks between sea-surface temperature (SST) anomalies and the wind field. in this scenario, interactions between westerly wind anomalies, generated by low-level convergence associated with an initial warm SST anomaly, and the prevailing north-westerly monsoonal (south-easterly trade) winds (Figure 1 a, top schematic) would cause the warm SST anomaly to be destroyed (maintained) in summer (winter) due to a net strengthening (reduction) of the wind field over the SST anomaly (Figure la, top schematic).
Earlier works by Hastenrath and Wu (1982,1983) suggested that the dominant interaction influencing SST fluctuations in Indonesian waters involved the often marked changes in cloudiness, atmospheric pressure, and convective activity observed between ENSO and anti-ENS0 episodes in this region. They proposed a simple mechanism for the establishment of SST anomalies, in which major cloudiness changes enhanced or reduced the incoming radiation (RAD) at the sea surface (Figure lb). Most recently, Hackert and Hastenrath (1986) have proposed that the dominant processes in western Indonesia are a combination of the above. These wind- stress-SST anomaly feedbacks and cloudiness-radiative mechanisms are seen to vary seasonally between the wetter Southern Hemisphere summer and drier Southern Hemisphere winter monsoon regimes. They suggest that during anti-ENS0 conditions in the Southern Hemisphere summer (winter), low-pressure anomalies with north-westerly flow reinforce (oppose) the prevailing north-westerly (south-easterly) winds over the Indonesian region leading to an increase (decrease) in wind stress and evaporation and a deepening (shallowing) of the oceanic wind-mixed layer. Together with a reduction in surface net radiation, as a result of anomalous convective activity and cloudiness, warm SST anomalies would tend to be cooled (maintained) during the Southern Hemisphere summer (winter). During ENSO conditions, with a cool SST anomaly and associated high-pressure anomaly, the reverse of the above causal relationships is suggested. In such scenarios, seasonal transitions are seen to be accompanied by a change in coupling mechanisms. The summer to winter transition is particularly important for the development of ENSO or anti-ENS0 events (Figure lc).
Over the last 10 years, oceanographical studies have begun to focus on oceanic water mass transport ‘throughflow’ from the Pacific into the Indian Ocean via the Indonesian archipelago (Thompson and Cresswell, 1983; Piola and Gordon, 1984; Fine, 1985; Godfrey and Ridgway, 1985; Holloway and Nye, 1985) and its implications for ENSO and anti-ENS0 episodes (Bye and Gordon, 1982; Pariwono et al., 1986; Pariwono, 1987, Wyrtki, 1987). However, the question of possible connections between the throughflow, oceanic advection and heat storage in northern Australian-Indonesian waters and the ENSO phenomenon has yet to be resolved.
Both Pariwono et ai. (1986) and Pariwono (1987) indicate that sea-level fluctuations on the northern, western and southern coasts of Australia are closely related to ENSO and anti-ENS0 events. Global and regional oceanic modelling studies in Pariwono (1987) suggest that although the seasonally varying regional wind fields influence oceanic mass transport in the Indonesian region, it is the remote forcings, involving the Southern Ocean and the equatorial Indo-Pacific trade wind fields, that ultimately dictate that the throughflow is directed from the Pacific to the Indian Ocean throughout the year. This mass transport appears to reach a maximum in the Southern Hemisphere winter and is at a minimum in the Southern Hemisphere summer.
Using the sea-level difference between stations at Davao in the Philippines and Darwin in Australia from 1966 to 1985 to represent the oceanic pressure gradient from the Pacific to the Indian Oceans, Wyrtki (1987) suggests that the throughflow also contains a marked low-frequency signal not related to ENSO events. Complicating further resolution of throughflow influences in this region is the observation that the warm, coastally trapped Leeuwin Current on the continental shelf margins of Western Australia is first observed in late sumrner-autumn and reaches a peak in late autumn<arly winter (Godfrey and Ridgway, 1985). This
OCEAN-ATMOSPHERE INTERACTIONS 147
W
COOL, s ST
+ + + + + + + * W A R Y SST
c. WIND STRESS + CLOUDINESS - RADIATION(HACKERT& HASTEN R A T H , s urn -ME .F! W!-NTER 1088)
I R A D / a CLOUD
coo i, 8 0 1
/ R A D I
U 4w + + + t i
+ + + + W A R Y
SST
f--J U- c L ’ 3 4 F-u + + + + + + + + +
W A R Y SST
SST‘
Figure 1. Schematic representations of various ocean-atmosphere mechanisms proposed for the Indonesian-northern Australian region: (a) wind stress (Nicholls, 1984a, b), (b) cloudiness-radiation (Hastenrath and Wu, 1982; Hackert and Hastenrath, 1986), and (c) wind stress plus cloudiness-radiation (Hackert and Hastenrath, 1986). In (a), the top schematics show the separate parameters involved in each section with the bottom schematics showing the result of such interactions. In (b) and (c). the schematics show only the parameters and results of their interactions. Symbols used are L‘ =local low-pressure anomalies, H’ =local high-pressure anomalies, RAD =incoming solar radiation, U and - U =prevailing regional westerly and easterly wind regimes, u’ and - u’=local, warm SST-induced,
westerly and easterly wind anomalies

148 R. J. ALLAN AND J. 1. PARIWONO
current is thought to be generated by the dynamic height gradient between the North-West Shelf-Timor Sea region and the near coastal margins further south. However, its timing is at odds with the later winter maximum of the throughflow further north, suggesting that the North-West Shelf-Timor Sea dynamic height field is controlled by the Australasian monsoon system and that throughflow influences may be transmitted westward into the Indian Ocean (Kundu and McCreary, 1986). Attempts to resolve such problems have been thwarted by the sparcity of physical oceanographical measurements in the Indonesian region. Consequently, estimates of throughflow have ranged from 1 to 20 Sv (1 Sv= lo6 m3 s-') (Pariwono, 1987).
Other research suggests that 'cold outbreaks', which follow vigorous frontal activity in the eastern Australian region and may penetrate into equatorial latitudes in the south western Pacific (Keen, 1982, 1983), and trade wind fluctuations in the Coral Sea-Tasman Sea region resulting in southerly wind anomalies (Harrison, 1984a, b; Meyers et al., 1986; Mitchum, 1987; Gao and Wang, 1987a, b), can have ramifications for the onset of ENSO events through the enhancement of low-level convergence in the western equatorial Pacific. Compounding such evidence is the indication by Pazan et al. (1986) that off-equatorial Rossby waves propagating towards the western boundary of the Pacific trigger coastally trapped Kelvin-Munk waves that carry a signal equatorward and are an important factor in ENSO generation through the development of equatorial Kelvin waves. On larger spatial-temporal scales, the findings of Barnett (1984a, b, 1985a, b) and Krishnamurti et al. (1986) have indicated a role for low-frequency sea-level pressure features, propagating into the Australasian region from either Indo-Asian or Antarctic source regions, in the development of climatic anomalies.
In this paper, we seek to improve our understanding of ocean-atmosphere couplings in low-latitude Australasia through an examination of interactions between wind stress (z), cloudiness or outgoing longwave radiation (OLR), SST, and sea level (SLV) during the period 1964-1983. Particular emphasis is placed on the response of Australasian SSTs, cloudiness-OLR, and SLV to changes in z over the western equatorial Pacific during ENSO and anti-ENS0 events; on the coherency between wind anomalies over the Coral Sea region and those in the western equatorial Pacific; and on responses to low-frequency atmospheric forcings, SST advection, lateral heat divergence, and oceanic throughflow in the Indonesian region.
DATA AND METHODS
The spatial distribution of the data stations and regions used in this study are shown in Figure 2. Gridded 2" latitude by 2" longitude monthly mean 'pseudo' wind-stress anomaly fields for the western equatorial Pacific (WEP) and the eastern Coral Sea (ECS) were deduced from the Florida State University, Mesoscale Air-Sea Interaction Group's analyses for the Pacific Ocean over the period January 1961 to December 1983 (30 "N-30 "S, 124 "E-70 OW) (Clarke, pers. comm., 1988). These data were then averaged for the regions encompassing the WEP (11 ON-1 "S, 124"E-162 'E) and the ECS (1 "S-29"S, 154"E-17ODE) (see Figure 2). Gridded 5" latitude by 5" longitude monthly mean wind fields for the Pacific Ocean basin, obtained from the United Kingdom Meteorological Office, were the source of eastern Indonesian (INDO) meridional winds (Equator-10°S, 125"E-l35"E) from 1966 to 1983 (see Figure 2). These wind data were used to calculate meridional 'pseudo' wind-stress anomaly fields following the method detailed in Legler and OBrien (1986). (Individual monthly mean 'pseudo' wind-stress vectors were calculated by multiplying each of the wind components by the wind magnitude, with monthly anomalies then deduced from the long-term mean.)
Monthly mean SST anomalies (SST') for the Northern Australian region (5 "S-15 "S, 120 "E-160"E) from 1964 to 1982 were obtained from Nicholls (pers. comm., 1984). As noted in Nicholls (1984b), these SST' were determined from all available data back to 1946, and thus include values which may be somewhat suspect owing to changes in measurement techniques over this period. The data for the 1964-1982 period were the least affected. Monthly SST' for the eastern equatorial Pacific were extracted from Wright (1984b) and used as an indication of wider ENSO events across the Pacific.
Monthly mean SLV (SLV') at the Australian coastal stations of Darwin and Port Hedland were deduced from the tide gauge records held in the Tidal Laboratory at the Flinders Institute for Atmospheric and Marine Sciences (FIAMS) in Adelaide. Monthly mean SLV for the Philippine stations of Davao and Sulu were obtained from the sea-level records held at the Hawaii Institute of Geophysics, University of Hawaii.

OCEAN ATMOSPHERE INTERACTIONS 149
Figure 2. Distribution of data regions and stations. Wind-stress anomalies in the WEP (T&J ( 1 I "N-1 "S, 124OE-162"E); wind-stress anomalies in the ECS (rkcs) ( I 3 - 2 9 5 , 1S4"E-17OoE); wind-stress anomalies in eastern Indonesia ( T ; ~ ~ ) (0"s-Ions, 125 "E-135 "E); SST anomalies in northern Australian waters(SST',,) (5 "S-15 "S, 120 "E-l GO "E); sea level anomalies ( S L V ' ) for the Philippine stations of
Davao and Sulu (solid dots) and northern Australian stations of Darwin and Port Hedland (solid dots ringed)
Collectively, these are the only stations providing a comprehensive long-term record of sea-level fluctuations in the data-sparse Indonesian region.
Monthly mean cloudiness distributions for the Australasian region from 1966 to 1978 were obtained from the atlases of Sadler et al. (1976) and Shideler and Sadler (1979), and from the atlas of Garcia (1985) for the period 1971-1983. Monthly mean OLR fields from satellite data for the period 1979-1985 were obtained from the Climate Analysis Center (1984-1985) and Arkin (pers. comm., 1985).
Anomalies from long-term monthly means were calculated from 1961 to 1983 data for wind stress, from 1964 to 1982 data for Davao and Sulu SLV, from 1966 to 1983 data for Darwin SLV, from 1966 to 1982 data for Port Hedland SLV, and from 1966 to 1978 for Indonesian cloudiness. Area-averaged wind-stress anomalies ( T ' ) for the WEP, INDO, and ECS were then decomposed into their zonal (t:) and meridional (7:) components:
r l = -r'sinO (1)
t:= -t 'cosO (2)
where 0 is the wind-stress direction in degrees.
150 R. J. ALLAN AND J. I. PARIWONO
Simultaneous and lagged cross correlation analyses were performed between each of the variables on a seasonal basis (summer = DJF, autumn = MAM, winter = JJA, spring = ASO). As responses to forcings at each of the pair of SLV stations in the same hemisphere were similar, SLV’ for Davao and Sulu were averaged to provide a value for Northern Hemisphere SLV’ ( S L Q , while SLV‘ for Darwin and Port Hedland were averaged to produce a value for Southern Hemisphere SLV’ (SLV;). In later sections, individual ENS0 episodes were also examined on a seasonal basis. For this study, all seasons shown in the following subsections are for the Southern Hemisphere. Apart from ECS and WEP correlations in Figure 19, where 22 years of records (1961-1982) were available, all correlations were calculated with 17 years of data ( 1 966-1 982), and no significant autocorrelations were found at a lag of one year. The 95 per cent significance level in Figures 4-7, 16, 17 and 19 is with respect to the largest absolute value of the correlation coefficients.
In addition to the dynamical and modelling results of Wyrtki (1961, 1987) and Pariwono (1987), crude estimates of the seasonal magnitudes of oceanic throughflow and advection in the Indonesian-Northern Australian region were made using a combination of data in the atlases of Esbensen and Kushnir (1981), Levitus (1982), and Sadler et al. (1987). Vertically integrated seasonal oceanic mass transports, indicative of the throughflow, were deduced under the assumption that the flow between the Pacific and Indian Oceans occurs via one large channel oriented north to south, 2500 km in length, and 800 km in width. No bottom depth was prescribed because, following Wyrtki (1987), the bulk of the mass transport was deemed to occur in the upper 250 m of the channel with a level of no motion at 500 m.
According to Wyrtki (1961), net oceanic mass transports in this region are the result of interactions between wind and sea-level gradient-induced flows in the presence of frictional forces. These parameters were related by Wyrtki (1961) in a simple momentum balance equation. For a homogeneous channel where seasonal wind and sea-level gradient effects are of uniform influence in the direction of its long axis (y plane), this equation becomes:
p r T = bt, - pgDbh, (3) where p is the density of sea water, r is a frictional coefficient, T i s the mass transport, b is the channel width, ty is the meridional wind stress, g is the acceleration due to gravity, D is the depth of wind influence and h, is the north-south sea-level gradient in the channel. In his study of the region, Wyrtki (1961) used values of r between 10 and 6 x s- ’. For this analysis, we have adopted the intermediate value of 8 x l op6 s - ’ for the frictional coefficient r . Seasonally varying values of D for the channel were approximated by the monthly mean mixed-layer depths derived from data on the eastern section (127-135 ‘E) of the Commonwealth Scientific and Industrial Research Organization (CSIRO), Division of Oceanography’s expendable bathy- thermograph (XBT) route from Singapore to Torres Strait (Godfrey, pers. comm., 1987) and from the oceanic temperatures with depth given in Levitus (1982). The sea-level gradient (h,) was equated with the seasonal sea- level and dynamic height differences, relative to the 500 m surface, between Davao and Darwin given by Wyrtki ( 1 987). Seasonal wind-stress values were deduced from the atlases of Esbensen and Kushnir (198 1) and Sadler et al. (1987), using the seasonal mean values of the meridional component of the wind stress (t,) to describe the major wind forcings acting along the channel.
In Wyrtki (1961), Equation (3) was used with constant values of zy and h, over the depth of wind influence D. In our study, we have reduced Equation (3) to provide two equations to describe the seasonal mean current velocities due to wind (V,) and sea-level gradient ( Vsl) forcings:
where Cis the surface drag coefficient ( m s-’) and Vow is the surface current velocity. Ekman’s equations were then used with Vow values in Equation ( 5 ) to approximate the decrease of the wind-induced current with depth (V,).
Vertically integrated seasonal mean oceanic mass transports due to wind (T,) and sea-level gradient ( Ts1) effects were then calculated by:
(6) T, = boS D p V , dz

OCEAN ATMOSPHERE INTERACTIONS 151
T,, = boS 250p V,, dz (7)
where p was assumed to be constant with depth z. The results of Equations (6) and (7) are compared with the more detailed analyses of transports in the region reported in Wyrtki (1961,1987) and Pariwono (1987).
Advective influences in the region are indicated by the oceanic temperature fields in Esbensen and Kushnir (1 98 I), Levitus (1 982), and Sadler et al. (1987). Seasonal mean values of surface advection were estimated by the meridional SST gradients in the above and the net surface current velocities for the channel, using Equation (5) plus or minus the current due to the sea-level gradient (Equation (4)):
A D v= UassTlay (8)
where A D V is the meridional sea-surface temperature advection, S S T is the sea-surface temperature, o is the net meridional surface current and y is the distance in the y-plane (the length of the channel).
Lateral heat export/import in the eastern Indonesian region on seasonal and monthly time-scales was found by a comparison of the heat storage change rate (Q,) deduced from Levitus ( 1 982) and XBT data, and the rate of net surface heat gain (Qsrc) determined from the climatologically based surface energy balance equation. These parameters are shown in the following equations:
Q, = C,phaT/at (9)
where Q, is the rate of oceanic heat storage in a column, C, is the specific heat of sea water, h is the mean depth of the mixed layer, dT/at is the rate of oceanic temperature change with time t , S W is the net shortwave radiation, L Wis the net longwave radiation, Q, is the sensible heat flux and Q, is the latent heat flux. As noted in Lamb (1981), the difference between Equations (9) and (10) provides a measure of the rate of lateral heat import or export (QJ:
EQUATORIAL INTERACTIONS: INDO-PACIFIC AND AUSTRALASIA
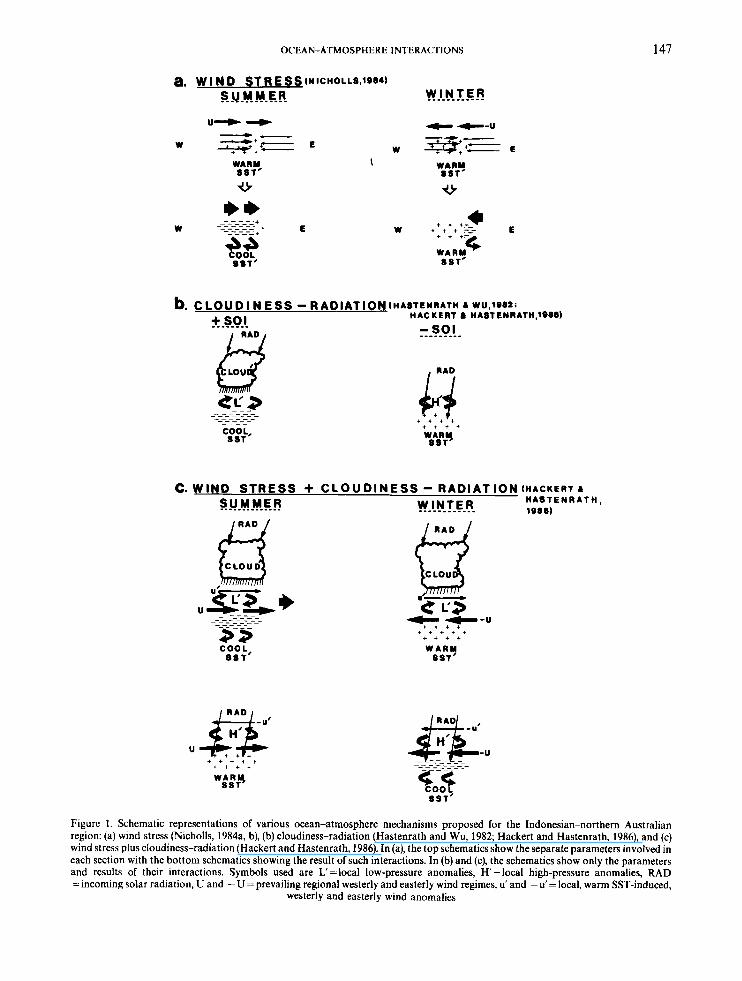
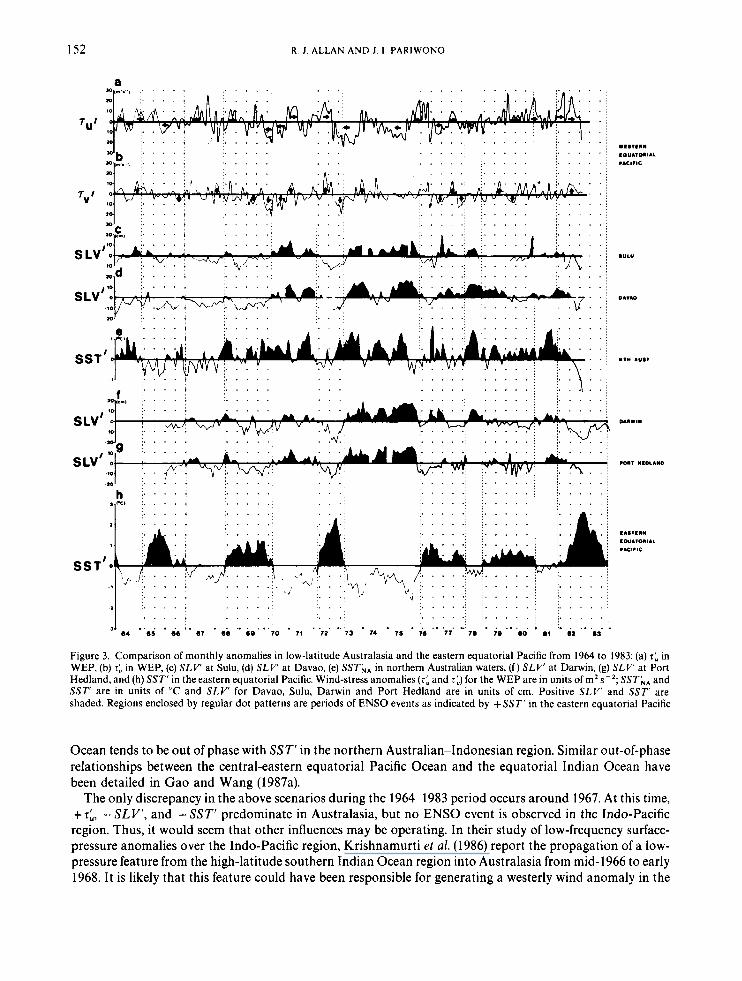
Long-term monthly anomalies ofzonal and meridional wind stress (t; and 7:) in the WEP, SLV at Davao and Sulu, SST in northern Australian waters, SLV at Darwin and Port Hedland and SST in the eastern equatorial Pacific from 1966 to 1983 are shown in Figure 3. This period includes six ENSO events of varying magnitude (Donguy et al., 1982; Rasmusson, 1984), which are synonymous with periods of anomalous westerly winds in the WEP (Philander, 1983, 1985; Gill and Rasmusson, 1983). Such wind anomalies are seen in Figure 3 in the prominent + 7: signal, which also appears to be related to + 7: values. Periods representative of anti-ENS0 conditions show the opposite configuration (-7; and -rk), and are most strongly manifest from mid-1973 to early 1976. In a number of cases, where the magnitude of wind-stress deviations is large, in either + or - sense, they are seen to develop early in ENSO and anti-ENS0 events, suggesting some possible precursor potential. Certainly, r: tends to be large and persistent during pronounced ENSO or anti-ENS0 episodes, This is most evident during the strong 1972 and 1982-1983 ENSO events and the protracted 1973-1975 anti- ENSO phase.
During ENSO (anti-ENSO) periods, Pariwono et ul. (1986) indicate that sea levels along northern, western, and southern Australian coasts are anomalously low (high). In Figure 3, such responses can be seen in SL V in low-latitude Australasia. In fact, SL V' at all four stations tends to respond in phase, particularly during events of large magnitude, but generally display a lag of about a season with respect to wind-stress changes. Thus -( +)7; and, to a lesser degree, 51 appear to be responsible for a rise (fall) in SLV not just in the WEP but also throughout eastern Indonesia-northern Australia.
Such interactions also appear to influence SSTs, as +( -)SST' in northern Australia is closely allied with -( +)7: and 7: in the WEP. Given the relative locations of the WEP and northern Australian-Indonesian study regions, it would seem that fluctuations in SST in the latter area are a direct response to z:, and perhaps 7;;, in the WEP. Further east, as noted in Nicholls (1984a, b), SST' in the central-eastern equatorial Pacific
152 R. J . ALLAN AND J . 1. PARIWONO
a
7u'
Jb . . . . . . . . . . . . Y'' . . . . . . . . . . . I.
. . . . . . . . . . . . . . . . . . . . . . . . . . . . . . . . . . . . . . . . .
1 . . . . . . . . . . . . . . . . . . . . . . . . . . . , , . . . . . . . . . . . . . . . . . . . . . . . , , , ,
.: . . . . . . . . . . . . . . . . . . .
. . . . . . , . . . . . . . . . . . . . . .: . . . . . . . . . . . .
,+?- r*v&. . . [ p & & L
=or . . . . , . . . . . . . . . . . . . . . . . . . . . . .
. . . . . . . . . . . . . . . . . . . . . . . . . . . . . : :. . . \ . .
, , ' . . . . ,
, . . . . . . . . : :. . . . . , . . . . . . .
. . . . .
, , . . . . . . . . . . . . . . . . . . . . . . . . : : . . . . . : h {
)R I , . . . . I
, I . . . . . . . . . . . . . . . . . . . . . . . . . . . . . . . : , , . . . . . . . . . . . . . . . . . . . . . . . . . . . . . .
, , . . . . . . . . . . . . . . . . . . . 1 . . . . . . . . . . .
. . . . .
. . . . . . . . . . 'I . . . . . . . . . . . : ~ . . . . . , I . . . . . . . . . . . . . . . . . . . . . . . . . . . . . . . . . t , . . .
. _ . . , . . . . . . . . . . . . . . : . . . . . . . . . . , ,
a- ..6j . .. . .. e o . ..7a . . .71. .. 7J . 74 . . 7.a .. .7,. - .78 . .. i .( :. il .. . o ~ . 64 71 75
Figure 3. Comparison of monthly anomalies in low-latitude Australasia and the eastern equatorial Pacific from 1964 to 1983: (a) T: in WEP, (b) T: in WEP, (c) SLY' at Sulu, (d) SLV' at Davao, (e) SSTL, in northern Australian waters, (f) SLV' at Darwin, (g) SLV' at Port Hedland, and (h) SST' in the eastern equatorial Pacific. Wind-stress anomalies (T: and T'J for the WEP are in units of m2 C2; SSTL, and S S T are in units of "C and SLV' for Davao, Sulu, Darwin and Port Hedland are in units of cm. Positive SLV' and S S T are shaded. Regions enclosed by regular dot patterns are periods of ENSO events as indicated by +SST' in the eastern equatorial Pacific
Ocean tends to be out of phase with SST' in the northern Australian-Indonesian region. Similar out-of-phase relationships between the central-eastern equatorial Pacific Ocean and the equatorial Indian Ocean have been detailed in Gao and Wang (1987a).
The only discrepancy in the above scenarios during the 1964-1983 period occurs around 1967. At this time, +t:, -SLV' , and -SST' predominate in Australasia, but no ENSO event is observed in the Indo-Pacific region. Thus, it would seem that other influences may be operating. In their study of low-frequency surface- pressure anomalies over the Indo-Pacific region, Krishnamurti et al. (1986) report the propagation of a low- pressure feature from the high-latitude southern Indian Ocean region into Australasia from mid- 1966 to early 1968. It is likely that this feature could have been responsible for generating a westerly wind anomaly in the

OCEAN ATMOSPHERE INTERACTIONS 153
WEP and the subsequent causal chain that led to an ENSO-like response in SST' and SLV' that was confined to Australasia. The occurrence and influence of similar features prior to 1964 is unknown to the authors. Interestingly, Mitchum (1987) suggests that the 1979-1980 ENSO event was confined to the WEP and did not have basin-wide manifestations. This is somewhat at odds with the SST evidence in Figure 3 from the central- eastern equatorial Pacific, which shows an ENSO signal. The general thrust of such matters is also found in Trenberth and Shea (1987).
To evaluate these associations further, particularly with regard to wind-stress-SST mechanisms, a series of simultaneous and lagged cross correlations between variables were performed. The results of these analyses are shown in Figures 4-7.
Cross correlations of T: and T: with SLVk, SLV;, and SST' Figures 4 and 5 show seasonal cross correlation relationships between T; and T: in each season indicated, and SLVN, SLY&,, and SST' in earlier and later seasons. In general, the most significant correlations occur between variables in autumn to spring seasons. Both SLVL and SLVs in Figure 4 show very similar responses in each season, with significant negative correlations at lags 0 and 1 over the winter to summer seasons, suggesting that SLV is raised (lowered) under strong easterlies (westerlies) in the WEP. For the Northern Hemisphere SLV stations, significant negative correlations are found at lag 1, with peak values of -0.76 and -0.71 in spring and summer following maximum zonal wind-forcing influences in the previous winter and spring. In
WE P 7"' s u M M L R A U T U M N
-1 * - 1 - . . . . . . . . . . . .
- 4 -3 - 2 -1 6 i i j i - 4 -3 -2 -1 0 1 2 3 i
W I N T E R
1 .
r
S P R I N G
1 .
r
-1 * -1 *
. . . . . . . . - 4 -3 -2 -1 i ; i j i - 4 -3 - 2 -1 6 i i i i
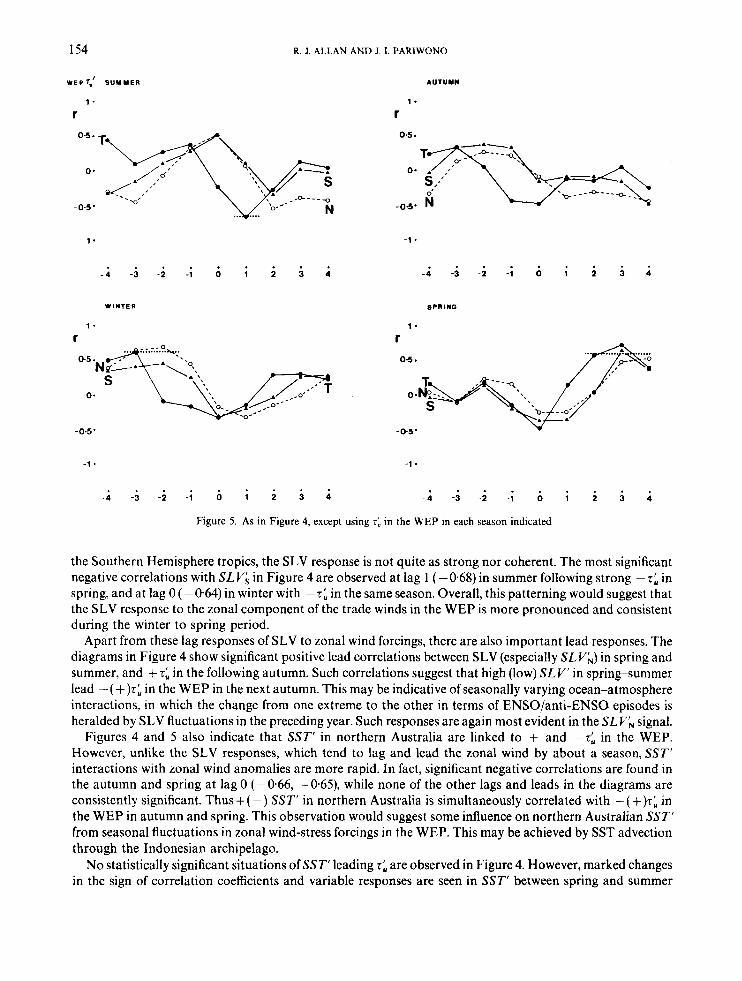
Figure 4. Seasonal cross correlations between r: in the WEP in each season indicated and SLVL (N), SLYg (S) and SST; , (T) in earlier and later Seasons for the period 1966 to 1982. Significant correlations are shown with respect to the 95 per cent confidence limit for multiple tests (dotted horizontal line in diagrams). Seasonal lags are shown on the horizontal axis and correlation coefficient values on the
vertical axis
154 R. J . ALLAN AND J. I. PARIWONO
WEPT: S U Y Y E R AUTUYN
1
r 1 .
r
-1 * -1 - . . . . . . . . .i -j -i -; 6 1 2 j i -4 -3 -2 -1 6 1 2 j, i
SPRING WINTER
1 . 1 .
r r 0.5.
0 .
-0.5' -0.5'
-1 * -1 *
. . . . . . . . . . - 4 -3 -2 -1 6 1 2 i i - 4 -3 -2 -1 6 i i i i
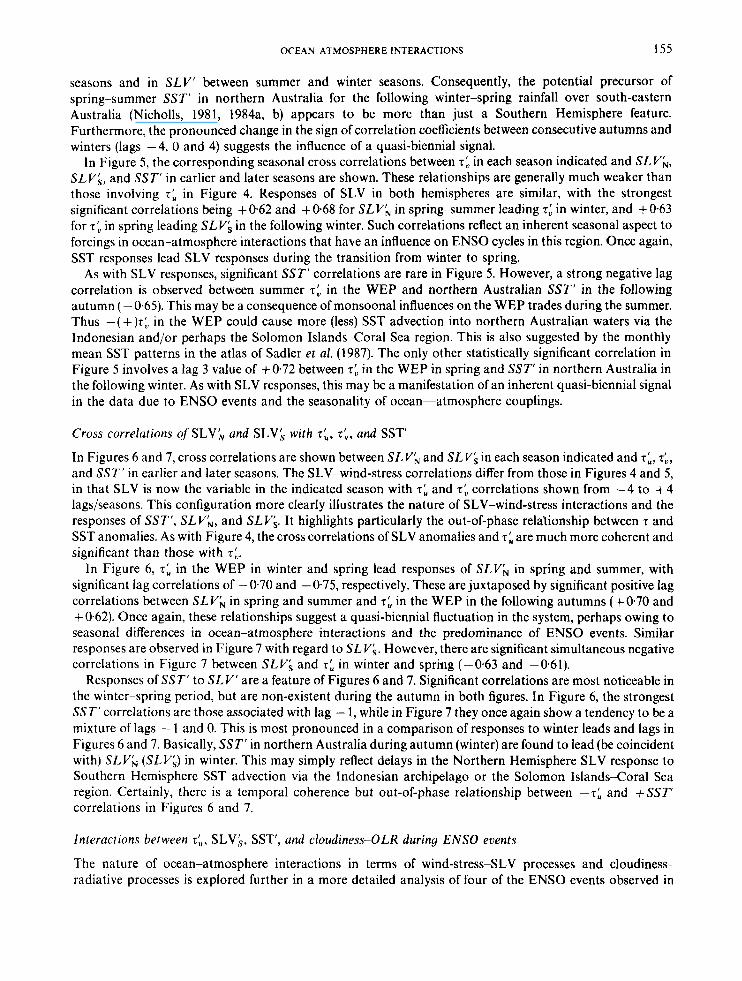
Figure 5. As in Figure 4, except using 5: in the WEP in each season indicated
the Southern Hemisphere tropics, the SLV response is not quite as strong nor coherent. The most significant negative correlations with SLV$ in Figure 4 are observed at lag 1 (-0.68) in summer following strong - t; in spring, and at lag 0 (-0.64) in winter with -t: in the same season. Overall, this patterning would suggest that the SLV response to the zonal component of the trade winds in the WEP is more pronounced and consistent during the winter to spring period.
Apart from these lag responses of SLV to zonal wind forcings, there are also important lead responses. The diagrams in Figure 4 show significant positive lead correlations between SLV (especially SLVN) in spring and summer, and + t: in the following autumn. Such correlations suggest that high (low) SLV' in spring-summer lead -( +)z: in the WEP in the next autumn. This may be indicative of seasonally varying ocean-atmosphere interactions, in which the change from one extreme to the other in terms of ENSO/anti-ENSO. episodes is heralded by SLV fluctuations in the preceding year. Such responses are again most evident in the SL VN signal.
Figures 4 and 5 also indicate that SST' in northern Australia are linked to + and -r: in the WEP. However, unlike the SLV responses, which tend to lag and lead the zonal wind by about a season, SST' interactions with zonal wind anomalies are more rapid. In fact, significant negative correlations are found in the autumn and spring at lag 0 (- 0.66, - 0.65), while none of the other lags and leads in the diagrams are consistently significant. Thus +( -) SST' in northern Australia is simultaneously correlated with -( +)T: in the WEP in autumn and spring. This observation would suggest some influence on northern Australian SST' from seasonal fluctuations in zonal wind-stress forcings in the WEP. This may be achieved by SST advection through the Indonesian archipelago.
No statistically significant situations of S S T ' leading t: are observed in Figure 4. However, marked changes in the sign of correlation coefficients and variable responses are seen in SST' between spring and summer
OCEAN ATMOSPHERE INTERACTIONS 155
seasons and in SLV' between summer and winter seasons. Consequently, the potential precursor of spring-summer SST' in northern Australia for the following winter-spring rainfall over south-eastern Australia (Nicholls, 1981, 1984a, b) appears to be more than just a Southern Hemisphere feature. Furthermore, the pronounced change in the sign of correlation coefficients between consecutive autumns and winters (lags -4, 0 and 4) suggests the influence of a quasi-biennial signal.
In Figure 5, the corresponding seasonal cross correlations between t: in each season indicated and SLVE,, SLV;, and SST' in earlier and later seasons are shown. These relationships are generally much weaker than those involving r ; in Figure 4. Responses of SLV in both hemispheres are similar, with the strongest significant correlations being +0-62 and +068 for SLVE, in spring-summer leading t: in winter, and +0.63 for r : in spring leading SLVs in the following winter. Such correlations reflect an inherent seasonal aspect to forcings in ocean-atmosphere interactions that have an influence on ENSO cycles in this region. Once again, SST responses lead SLV responses during the transition from winter to spring.
As with SLV responses, significant SST' correlations are rare in Figure 5. However, a strong negative lag correlation is observed between summer t: in the WEP and northern Australian SST' in the following autumn ( - 0.65). This may be a consequence of monsoonal influences on the WEP trades during the summer. Thus -(+)ti, in the WEP could cause more (less) SST advection into northern Australian waters via the Indonesian and/or perhaps the Solomon Islands-Coral Sea region. This is also suggested by the monthly mean SST patterns in the atlas of Sadler et al. (1987). The only other statistically significant correlation in Figure 5 involves a lag 3 value of +0.72 between t i in the WEP in spring and SST' in northern Australia in the following winter. As with SLV responses, this may be a manifestation of an inherent quasi-biennial signal in the data due to ENSO events and the seasonality of ocean-atmosphere couplings.
Cross correlations of SLV', and SLV$ with tk, t:, and SST'
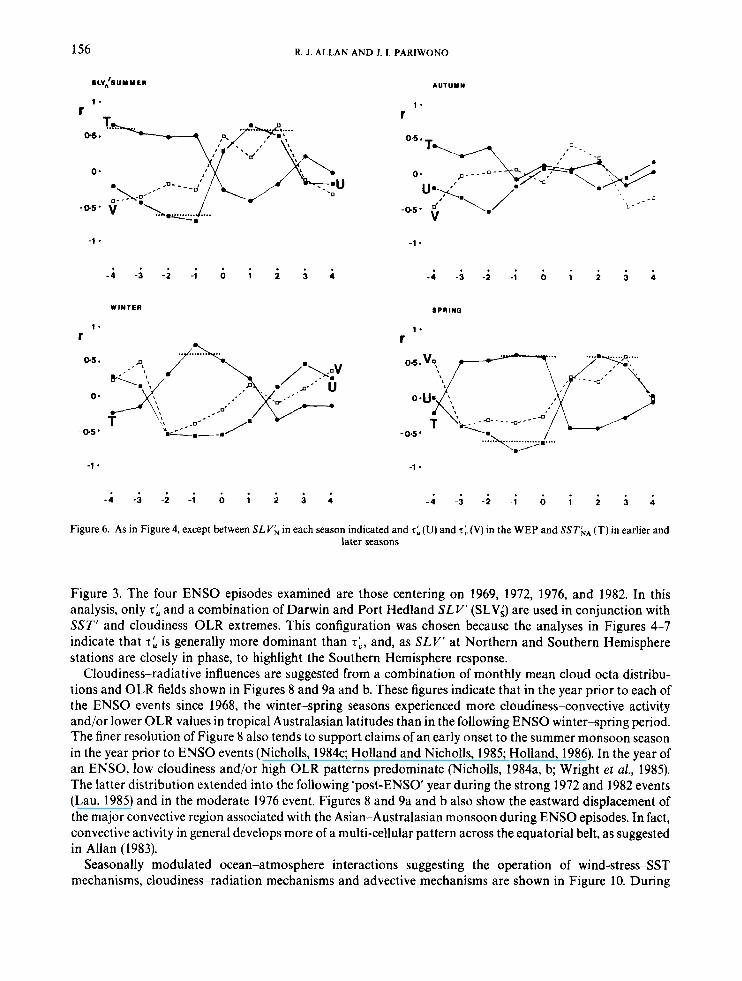
In Figures 6 and 7, cross correlations are shown between SLV, and SLV; in each season indicated and T;, t:, and SST' in earlier and later seasons. The SLV-wind-stress correlations differ from those in Figures 4 and 5, in that SLV is now the variable in the indicated season with t: and z: correlations shown from - 4 to + 4 lags/seasons. This configuration more clearly illustrates the nature of SLV-wind-stress interactions and the responses of SST', SLV;,, and SLVs. It highlights particularly the out-of-phase relationship between T and SST anomalies. As with Figure 4, the cross correlations of SLV anomalies and t; are much more coherent and significant than those with 7:.
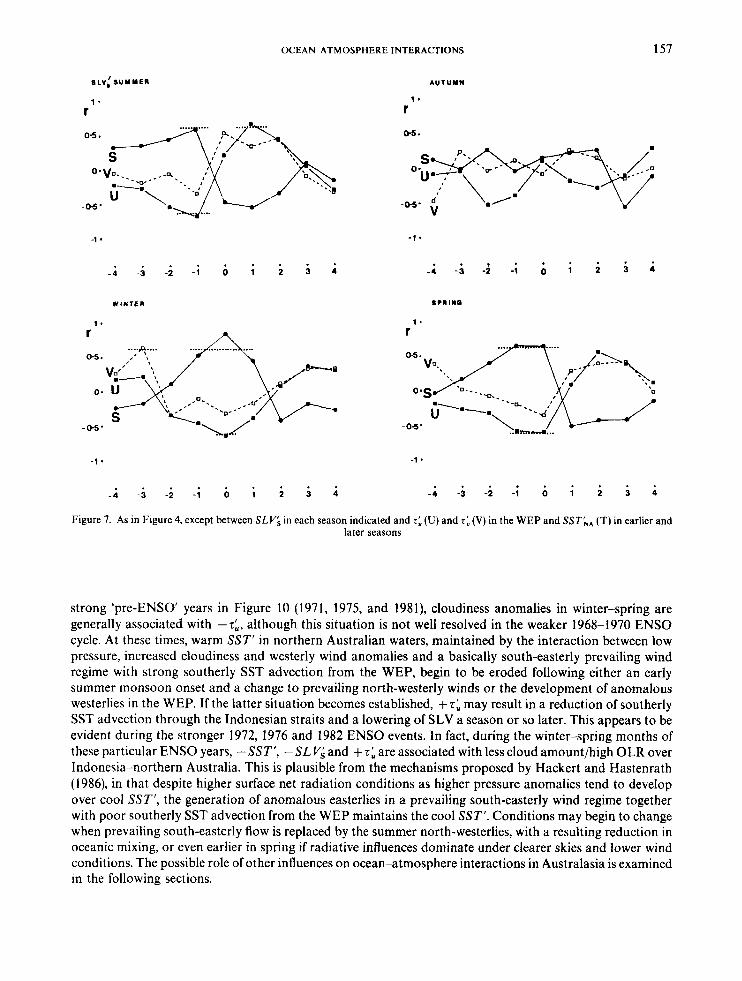
In Figure 6, 7: in the WEP in winter and spring lead responses of SLVN in spring and summer, with significant lag correlations of - 0.70 and -0.75, respectively. These are juxtaposed by significant positive lag correlations between SLV;, in spring and summer and t; in the WEP in the following autumns (+070 and + 0.62). Once again, these relationships suggest a quasi-biennial fluctuation in the system, perhaps owing to seasonal differences in ocean-atmosphere interactions and the predominance of ENSO events. Similar responses are observed in Figure 7 with regard to SL Vs. However, there are significant simultaneous negative correlations in Figure 7 between SLVs and t: in winter and spring (-0.63 and -061).
Responses of SST' to SLV' are a feature of Figures 6 and 7. Significant correlations are most noticeable in the winter-spring period, but are non-existent during the autumn in both figures. In Figure 6, the strongest SST' correlations are those associated with lag - 1, while in Figure 7 they once again show a tendency to be a mixture of lags - 1 and 0. This is most pronounced in a comparison of responses to winter leads and lags in Figures 6 and 7. Basically, SST' in northern Australia during autumn (winter) are found to lead (be coincident with) SLVE, (SLV;) in winter. This may simply reflect delays in the Northern Hemisphere SLV response to Southern Hemisphere SST advection via the Indonesian archipelago or the Solomon Islands-Coral Sea region. Certainly, there is a temporal coherence but out-of-phase relationship between -7; and +SST' correlations in Figures 6 and 7.
Interactions between tk, SLV$, SST', and cloudiness-0LR during ENSO events
The nature of ocean-atmosphere interactions in terms of wind-stress-SLV processes and cloudiness- radiative processes is explored further in a more detailed analysis of four of the ENSO events observed in
156 R. J. ALLAN AND J. 1. PARIWONO
0.5.
0 .
-0.5'
-1 - -1 - . . . . . . . .
- 4 -3 -2 -1 6 i i j i -4 -3 -2 -1 0 i i j i
. . . . - 4 -3 -2 -1 0 i i i ; . . . .
- 4 -3 - 2 -1 0 ; i j i
Figure 6. As in Figure 4, except between SLVE, in each season indicated and 7: (U) and 7: (V) in the WEP and SSTL, (T) in earlier and later seasons
Figure 3. The four ENSO episodes examined are those centering on 1969, 1972, 1976, and 1982. In this analysis, only 5; and a combination of Darwin and Port Hedland SLV' (SLV;) are used in conjunction with SST' and cloudiness-OLR extremes. This configuration was chosen because the analyses in Figures 4-7 indicate that T: is generally more dominant than T:, and, as SLV' at Northern and Southern Hemisphere stations are closely in phase, to highlight the Southern Hemisphere response.
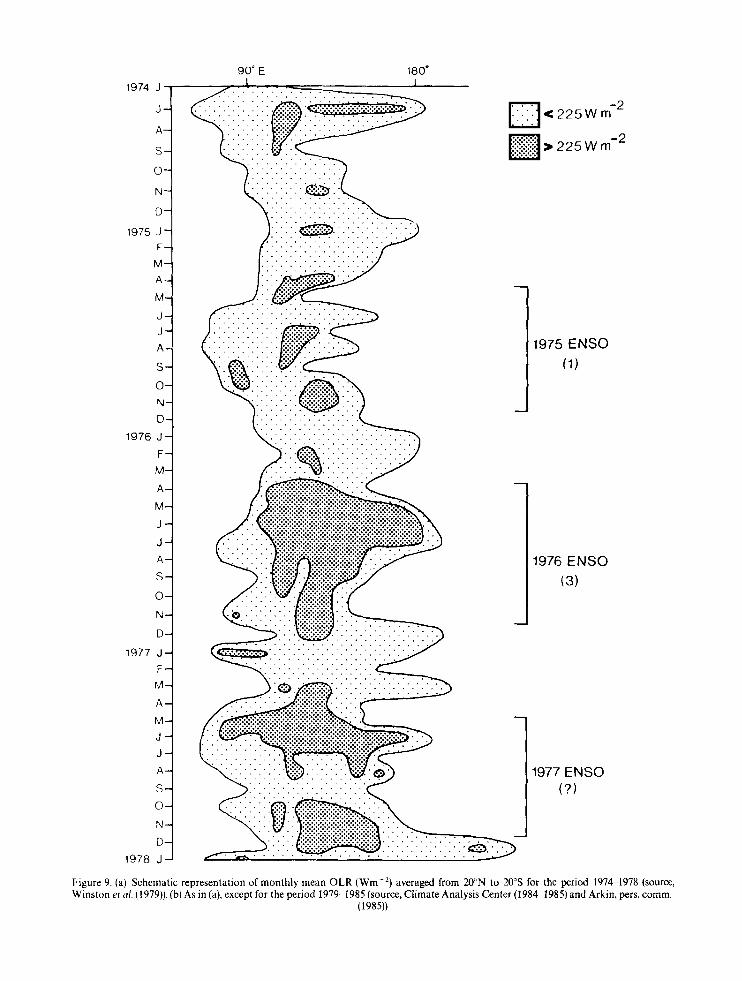
Cloudiness-radiative influences are suggested from a combination of monthly mean cloud octa distribu- tions and OLR fields shown in Figures 8 and 9a and b. These figures indicate that in the year prior to each of the ENSO events since 1968, the winter-spring seasons experienced more cloudiness-convective activity and/or lower OLR values in tropical Australasian latitudes than in the following ENSO winter-spring period. The finer resolution of Figure 8 also tends to support claims of an early onset to the summer monsoon season in the year prior to ENSO events (Nicholls, 1984c; Holland and Nicholls, 1985; Holland, 1986). In the year of an ENSO, low cloudiness and/or high OLR patterns predominate (Nicholls, 1984a, b; Wright et al., 1985). The latter distribution extended into the following 'post-ENS0 year during the strong 1972 and 1982 events (Lau, 1985) and in the moderate 1976 event. Figures 8 and 9a and b also show the eastward displacement of the major convective region associated with the Asian-Australasian monsoon during ENSO episodes. In fact, convective activity in general develops more of a multi-cellular pattern across the equatorial belt, as suggested in Allan (1983).
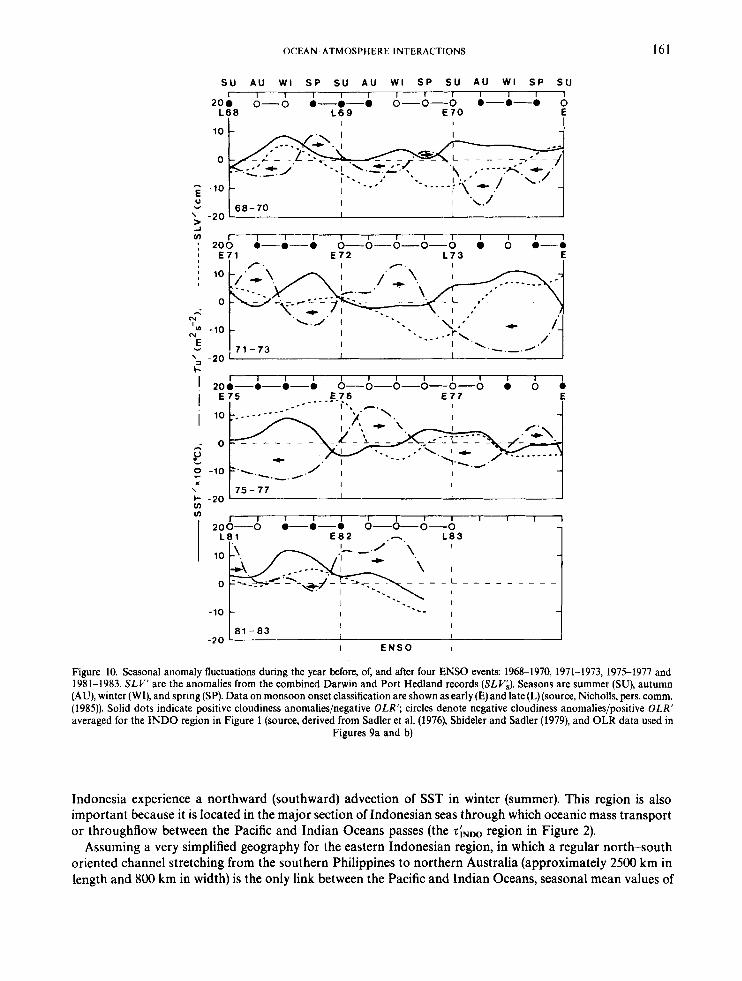
Seasonally modulated ocean-atmosphere interactions suggesting the operation of wind-stress-SST mechanisms, cloudiness-radiation mechanisms and advective mechanisms are shown in Figure 10. During
OCEAN ATMOSPHERE INTERACTIONS 157
s ,v; SUM YER
1. r
AUTUMN
1. r
-1 * -1 *
. . . . - 4 -3 -2 -1 6 ; i 5 i
W I N T E R SCR1N0
- * . -1 '
. . . . . . . . . . . - 4 -3 -2 -1 6 i i i i - 4 -3 -2 -1 6 1 2 3 i
Figure 7. As in Figure 4, except between SLV; in each season indicated and r l (U) and r: (V) in the WEP and SST',, (T) in earlier and later seasons
strong 'pre-ENS0 years in Figure 10 (1971, 1975, and 1981), cloudiness anomalies in winter-spring are generally associated with -T;, although this situation is not well resolved in the weaker 1968-1970 ENSO cycle. At these times, warm SST' in northern Australian waters, maintained by the interaction between low pressure, increased cloudiness and westerly wind anomalies and a basically south-easterly prevailing wind regime with strong southerly SST advection from the WEP, begin to be eroded following either an early summer monsoon onset and a change to prevailing north-westerly winds or the development of anomalous westerlies in the WEP. If the latter situation becomes established, + T; may result in a reduction of southerly SST advection through the Indonesian straits and a lowering of SLV a season or so later. This appears to be evident during the stronger 1972, 1976 and 1982 ENSO events. In fact, during the winter-spring months of these particular ENSO years, -SST', -SLVi and + T; are associated with less cloud amount/high OLR over Indonesia-northern Australia. This is plausible from the mechanisms proposed by Hackert and Hastenrath (1986), in that despite higher surface net radiation conditions as higher pressure anomalies tend to develop over cool SST ' , the generation of anomalous easterlies in a prevailing south-easterly wind regime together with poor southerly SST advection from the WEP maintains the cool S S T ' . Conditions may begin to change when prevailing south-easterly flow is replaced by the summer north-westerlies, with a resulting reduction in oceanic mixing, or even earlier in spring if radiative influences dominate under clearer skies and lower wind conditions. The possible role of other influences on ocean-atmosphere interactions in Australasia is examined in the following sections.
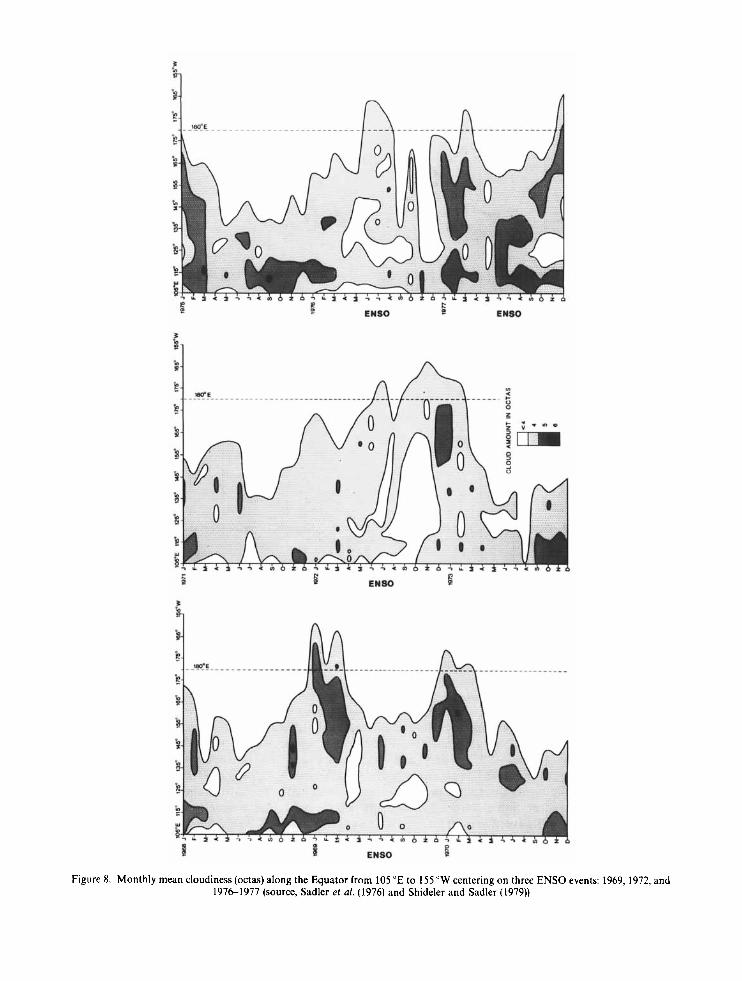
Figure 8. Monthly mean cloudiness (octas) along the Equator from 105 "E to 155 "W centering on three ENS0 events: 1969, 1972, and 1976-1977 (source, Sadler et a/. (1976) and Shideler and Sadler (1979))
90" E 180"
J-
A-
S-
0-
N- D-
1975 .I- F-
M- A -
M-
J- J - A-
S-
0- N- D-
1976 J - F- M- A-
M-
J -
J - A -
S -
0-
N- D-
1977 J- F- M-
A -
M- J - J - A-
S - 0- N- D-
1978 J -
1974 J
4 225 w m-2
...... ..... ...... ..... -2 ...... ,225 w m ...........
1975 ENSO (1) 1
1976 ENSO (3)
1977 ENSO (? )
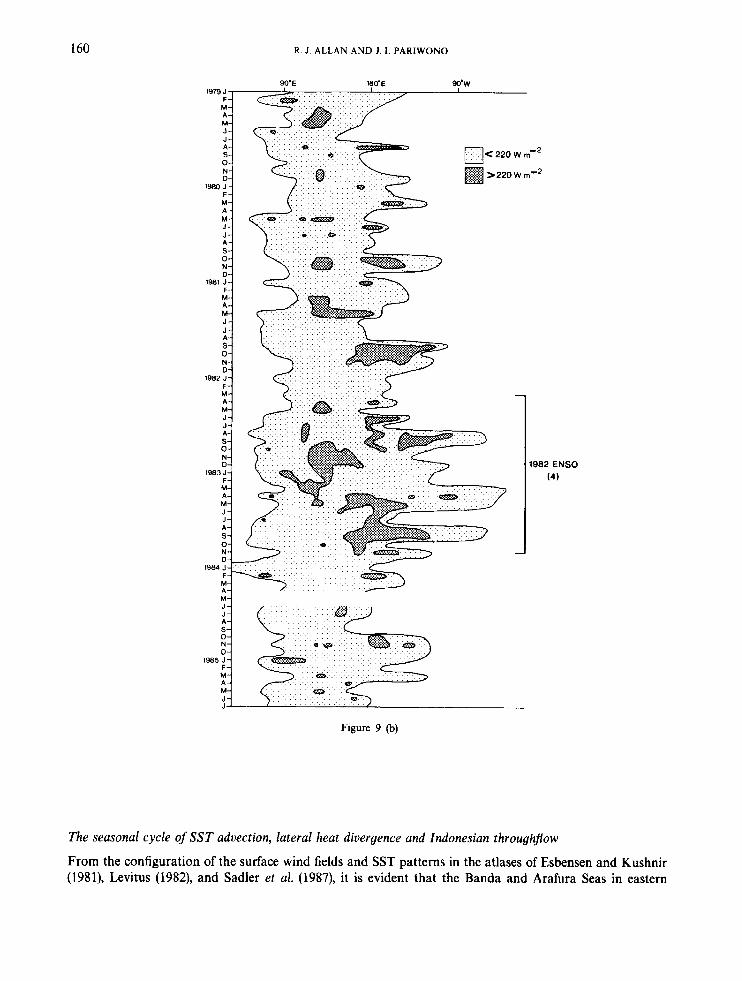
Figure 9. (a) Schematic representation of monthly mean OLR (Wm-2) averaged from 20"N to 20"s for the period 197&1978 (source, Winston et al. (1979)). (b) As in (a), except for the period 1979-1985 (source, Climate Analysis Center (19841985) and Arkin, pen. comm.
(1985))
ONOMIlVd ‘I ‘I (INV NVWV ‘1 ‘a 09 I
160 R. J. ALLAN AND 1 .1 . PARIWONO
Figure 9 (b)
The seasonal cycle of S S T aduection, lateral heat divergence and Indonesian throughflow
From the configuration of the surface wind fields and SST patterns in the atlases of Esbensen and Kushnir (1981), Levitus (1982), and Sadler et al. (1987), it is evident that the Banda and Arafura Seas in eastern
OCEAN ATMOSPHERE INTERACTIONS 161
SU AU W I S P SU AU W I S P S U AU W I S P S U I I I I I I I 1 I I I I I
20. 0-0 e--.-o 0-0-0 @-@-O 0 L 6 8 L 6 9 E 7 0 E
10
0
- -10 5 \> -20 "
I I I I
168-70 I
2 r--l---l---l I I I 1 I I I I 1 : 2 0 0 0--.-• 0-0-0-0-0 0 0 @-a
' € 7 1 € 7 2 L 7 3 E
: 10
0 - N
N * -10 E "
\= -20 b
1 2 0 ; - - : - L A 6-b--b--&--b--t, A 6 A E 7 6 E 77 E
-
I X I I \ 75 - 77 b- -20 1 I m
I
I I
I I
- _ -10 - I
- 2 0 81 - 8 3
I E N S O I
Figure 10. Seasonal anomaly fluctuations during the year before, of, and after four ENSO events: 1968-1970, 1971-1973, 1975-1977 and 1981-1983. SLY' are the anomalies from the combined Darwin and Port Hedland records (SLV;). Seasons are summer (SU), autumn (AU), winter (WI), and spring (SP). Data on monsoon onset classification are shown as early (E) and late (L) (source, Nicholls, pers. comm. (1985)). Solid dots indicate positive cloudiness anomalies/negative OLR'; circles denote negative cloudiness anomalies/positive OLR' averaged for the INDO region in Figure 1 (source, derived from Sadler et al. (1976), Shideler and Sadler (1979), and OLR data used in
Figures 9a and b)
Indonesia experience a northward (southward) advection of SST in winter (summer). This region is also important because it is located in the major section of Indonesian seas through which oceanic mass transport or throughflow between the Pacific and Indian Oceans passes (the
Assuming a very simplified geography for the eastern Indonesian region, in which a regular north-south oriented channel stretching from the southern Philippines to northern Australia (approximately 2500 km in length and 800 km in width) is the only link between the Pacific and Indian Oceans, seasonal mean values of
region in Figure 2).
162 R. J. ALLAN AND J. 1. PARIWONO
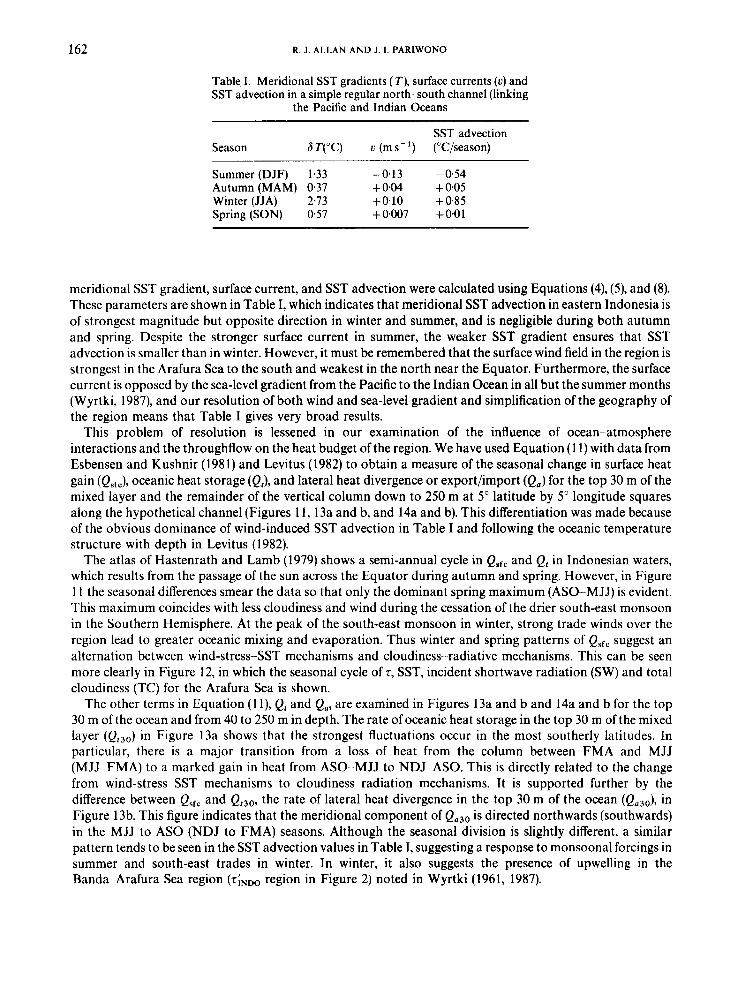
Table I. Meridional SST gradients ( T ) , surface currents ( u ) and SST advection in a simple regular north-south channel (linking
the Pacific and Indian Oceans
SST advection Season 6 T("C) u (m s- ') ('Cjseason)
Summer (DJF) 1.33 -0.13 -0.54 Autumn (MAM) 0.37 +0.04 +0.05 Winter (JJA) 2.73 +0.10 +0.85 Spring (SON) 0.57 +0.007 +001
~
meridional SST gradient, surface current, and SST advection were calculated using Equations (4), (9, and (8). These parameters are shown in Table I, which indicates that meridional SST advection in eastern Indonesia is of strongest magnitude but opposite direction in winter and summer, and is negligible during both autumn and spring. Despite the stronger surface current in summer, the weaker SST gradient ensures that SST advection is smaller than in winter. However, it must be remembered that the surface wind field in the region is strongest in the Arafura Sea to the south and weakest in the north near the Equator. Furthermore, the surface current is opposed by the sea-level gradient from the Pacific to the Indian Ocean in all but the summer months (Wyrtki, 1987), and our resolution of both wind and sea-level gradient and simplification of the geography of the region means that Table I gives very broad results.
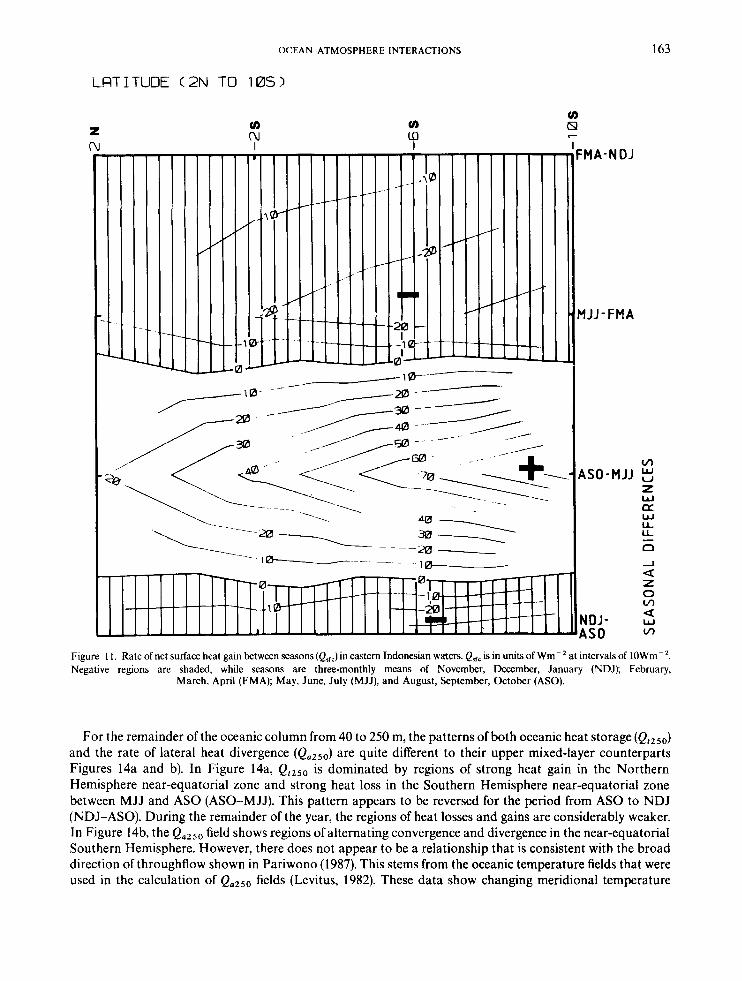
This problem of resolution is lessened in our examination of the influence of ocean-atmosphere interactions and the throughflow on the heat budget of the region. We have used Equation (1 1) with data from Esbensen and Kushnir (1981) and Levitus (1982) to obtain a measure of the seasonal change in surface heat gain (Qsfc), oceanic heat storage (Q,), and lateral heat divergence or export/import (Q,) for the top 30 m of the mixed layer and the remainder of the vertical column down to 250 m at 5" latitude by 5" longitude squares along the hypothetical channel (Figures 11, 13a and b, and 14a and b). This differentiation was made because of the obvious dominance of wind-induced SST advection in Table I and following the oceanic temperature structure with depth in Levitus (1982).
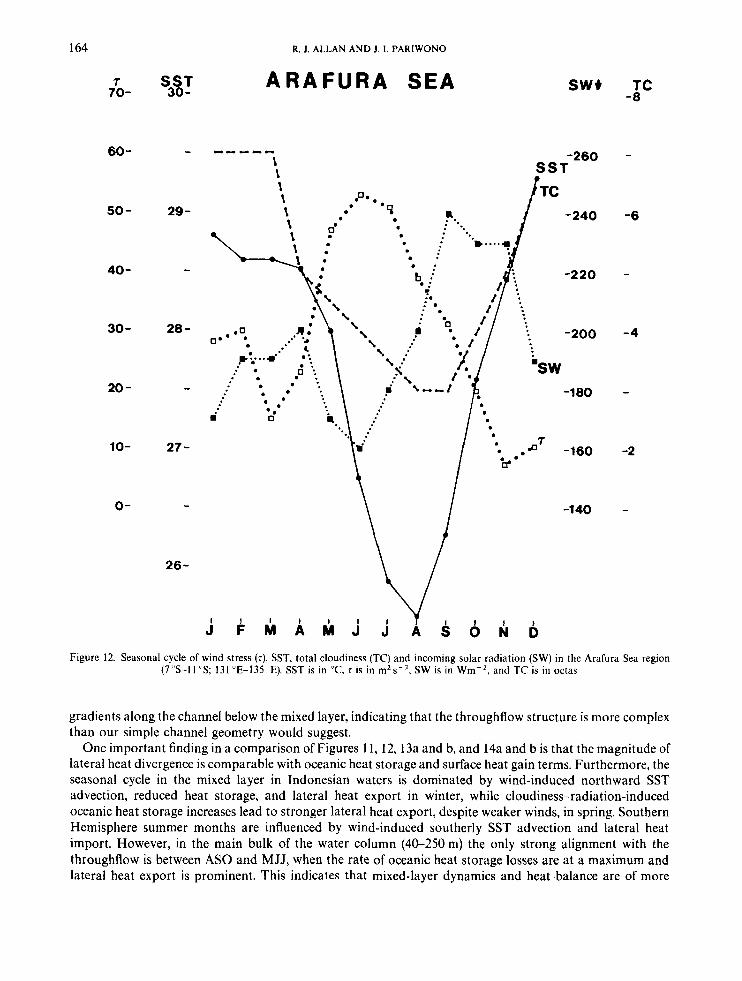
The atlas of Hastenrath and Lamb (1979) shows a semi-annual cycle in Qsfc and Q, in Indonesian waters, which results from the passage of the sun across the Equator during autumn and spring. However, in Figure 11 the seasonal differences smear the data so that only the dominant spring maximum (ASO-MJJ) is evident. This maximum coincides with less cloudiness and wind during the cessation of the drier south-east monsoon in the Southern Hemisphere. At the peak of the south-east monsoon in winter, strong trade winds over the region lead to greater oceanic mixing and evaporation. Thus winter and spring patterns of Qsfc suggest an alternation between wind-stress-SST mechanisms and cloudiness-radiative mechanisms. This can be seen more clearly in Figure 12, in which the seasonal cycle of T, SST, incident shortwave radiation (SW) and total cloudiness (TC) for the Arafura Sea is shown.
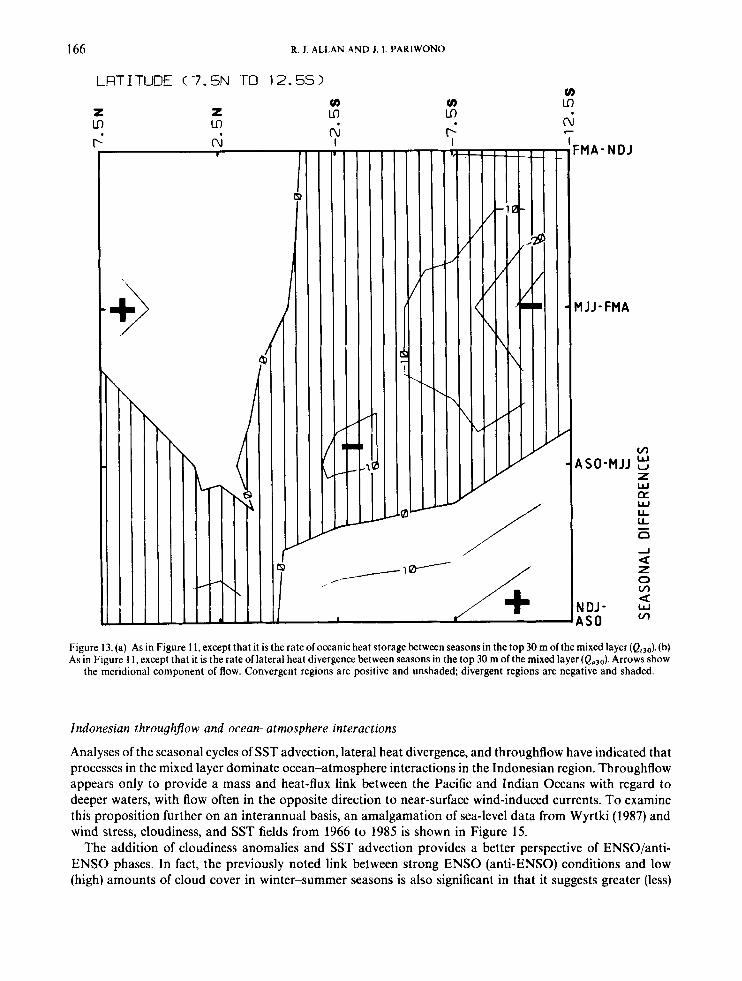
The other terms in Equation (1 l), Q, and Q,, are examined in Figures 13a and b and 14a and b for the top 30 m of the ocean and from 40 to 250 m in depth. The rate of oceanic heat storage in the top 30 m of the mixed layer (Qt3J in Figure 13a shows that the strongest fluctuations occur in the most southerly latitudes. In particular, there is a major transition from a loss of heat from the column between FMA and MJJ (MJJ FMA) to a marked gain in heat from ASO-MJJ to NDJ-ASO. This is directly related to the change from wind-stress-SST mechanisms to cloudiness-radiation mechanisms. It is supported further by the difference between Qsfc and Qt30r the rate of lateral heat divergence in the top 30 m of the ocean (Qa3J, in Figure 13b. This figure indicates that the meridional component of Qa30 is directed northwards (southwards) in the MJJ to AS0 (NDJ to FMA) seasons. Although the seasonal division is slightly different, a similar pattern tends to be seen in the SST advection values in Table I, suggesting a response to monsoonal forcings in summer and south-east trades in winter. In winter, it also suggests the presence of upwelling in the Banda-Arafura Sea region (tiNDO region in Figure 2) noted in Wyrtki (1961, 1987).
OCEAN -ATMOSPHERE INTERACTIONS
LRTITUDE (2N TO 10s)
2 v) hl
163
MA-NDJ
IJJ-FMA
v,
z w [r. W L u- 0 -I
z 0 v)
W m
4SO-MJJ
- a
a ‘JDJ- is0
Figure 1 I . Rate of net surface heat gain between seasons (Qlrc) in eastern Indonesian waters. Qsfs is in units of WrK2 at intervals of IOWm-’. Negative regions are shaded, while seasons are three-monthly means of November, December, January (NDJ); February,
March, April (FMA); May, June, July (MJJ), and August, September, October (ASO).
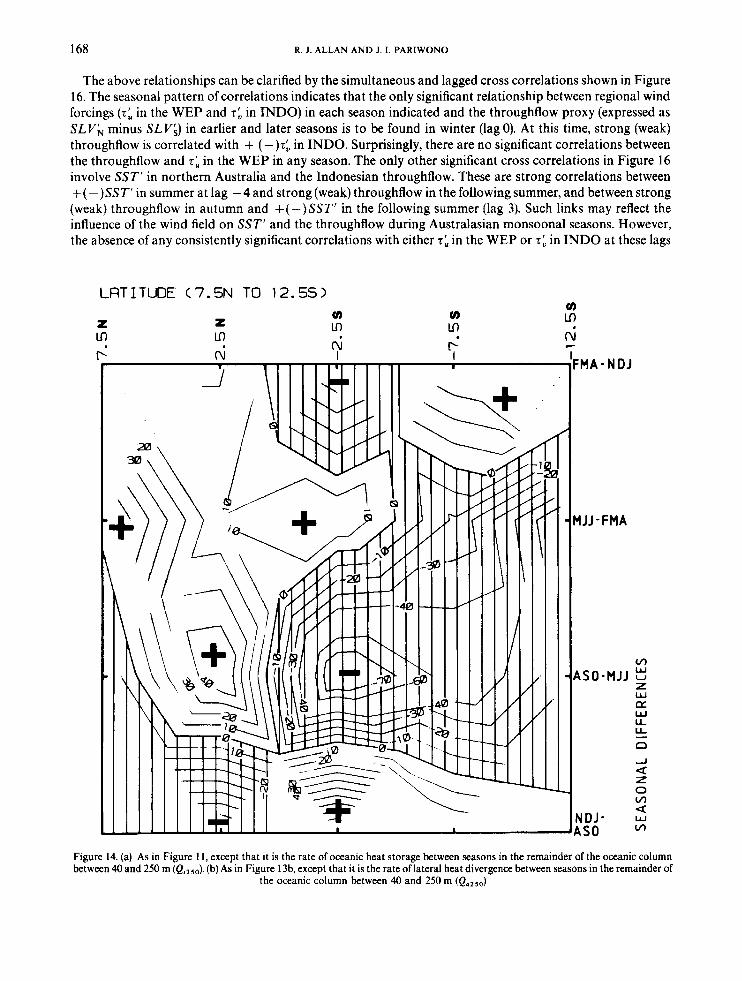
For the remainder of the oceanic column from 40 to 250 m, the patterns of both oceanic heat storage (Q,zso) and the rate of lateral heat divergence (Qazso) are quite different to their upper mixed-layer counterparts Figures 14a and b). In Figure 14a, Q t Z s 0 is dominated by regions of strong heat gain in the Northern Hemisphere near-equatorial zone and strong heat loss in the Southern Hemisphere near-equatorial zone between MJJ and AS0 (ASO-MJJ). This pattern appears to be reversed for the period from AS0 to NDJ (NDJ-ASO). During the remainder of the year, the regions of heat losses and gains are considerably weaker. In Figure 14b, the Qa250 field shows regions of alternating convergence and divergence in the near-equatorial Southern Hemisphere. However, there does not appear to be a relationship that is consistent with the broad direction of throughflow shown in Pariwono (1987). This stems from the oceanic temperature fields that were used in the calculation of QoZs0 fields (Levitus, 1982). These data show changing meridional temperature
164
7 70-
60 -
50 -
40 -
30 -
20 -
10-
0-
SST 30 -
-
29 -
-
28 -
-
27 -
-
26-
R. J . ALLAN AND J. I. PARIWONO
A R A F U R A SEA sw+ TC -8
Figure 12. Seasonal cycle of wind stress (t), SST, total cloudiness (TC) and incoming solar radiation (SW) in the Arafura Sea region (7"s-ll "S; 131 "E-135"E). SST is in "C. t is in rn's-', SW is in Wm-', and TC is in octas
gradients along the channel below the mixed layer, indicating that the throughflow structure is more complex than our simple channel geometry would suggest.
One important finding in a comparison of Figures 11,12,13a and b, and 14a and b is that the magnitude of lateral heat divergence is comparable with oceanic heat storage and surface heat gain terms. Furthermore, the seasonal cycle in the mixed layer in Indonesian waters is dominated by wind-induced northward SST advection, reduced heat storage, and lateral heat export in winter, while cloudiness-.radiation-induced oceanic heat storage increases lead to stronger lateral heat export, despite weaker winds, in spring. Southern Hemisphere summer months are influenced by wind-induced southerly SST advection and lateral heat import. However, in the main bulk of the water column (4C250m) the only strong alignment with the throughflow is between A S 0 and MJJ, when the rate of oceanic heat storage losses are at a maximum and lateral heat export is prominent. This indicates that mixed-layer dynamics and heat balance are of more
OCEAN -ATMOSPHERE INTERACTIONS 165
consequence to ocean-atmosphere interactions in low-latitude Australasia than deeper water heat and mass fluxes associated with the throughflow.
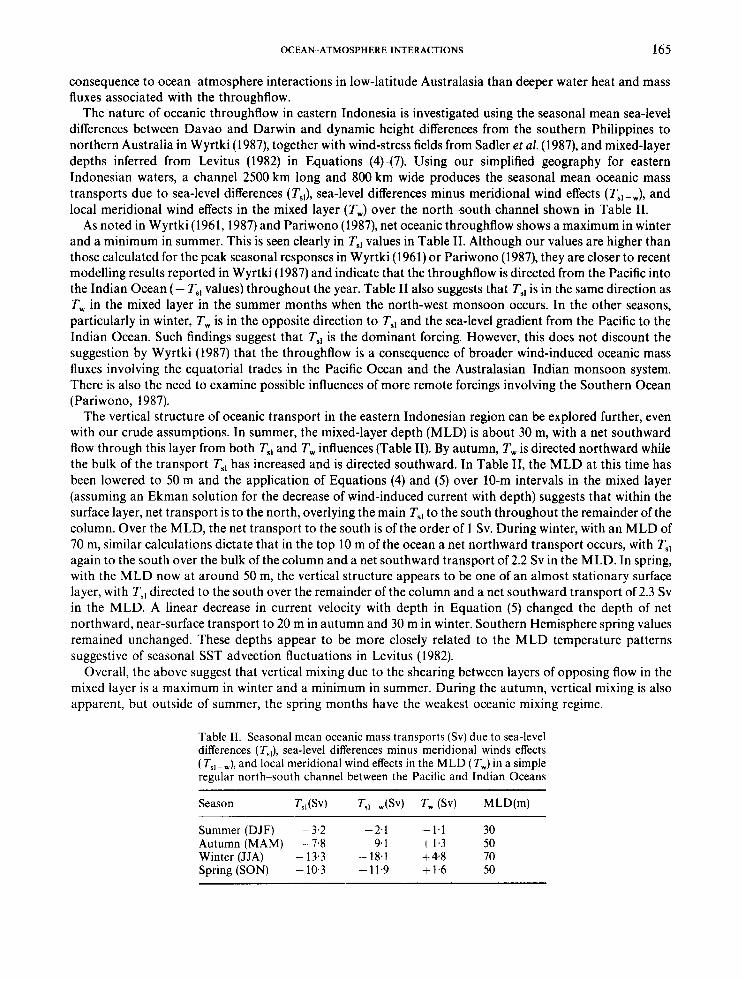
The nature of oceanic throughflow in eastern Indonesia is investigated using the seasonal mean sea-level differences between Davao and Darwin and dynamic height differences from the southern Philippines to northern Australia in Wyrtki (1987), together with wind-stress fields from Sadler et al. (1987), and mixed-layer depths inferred from Levitus (1982) in Equations (4H7). Using our simplified geography for eastern Indonesian waters, a channel 2500 km long and 800 km wide produces the seasonal mean oceanic mass transports due to sea-level differences (T,,), sea-level differences minus meridional wind effects (Ts, - ,), and local meridional wind effects in the mixed layer (T,) over the north-south channel shown in Table 11.
As noted in Wyrtki (1961,1987) and Pariwono (1987), net oceanic throughflow shows a maximum in winter and a minimum in summer. This is seen clearly in T,, values in Table 11. Although our values are higher than those calculated for the peak seasonal responses in Wyrtki (1961) or Pariwono (1987), they are closer to recent modelling results reported in Wyrtki (1987) and indicate that the throughflow is directed from the Pacific into the Indian Ocean ( - T,, values) throughout the year. Table I1 also suggests that T,, is in the same direction as T, in the mixed layer in the summer months when the north-west monsoon occurs. In the other seasons, particularly in winter, T, is in the opposite direction to T,, and the sea-level gradient from the Pacific to the Indian Ocean. Such findings suggest that T,, is the dominant forcing. However, this does not discount the suggestion by Wyrtki (1987) that the throughflow is a consequence of broader wind-induced oceanic mass fluxes involving the equatorial trades in the Pacific Ocean and the Australasian-Indian monsoon system. There is also the need to examine possible influences of more remote forcings involving the Southern Ocean (Pariwono, 1987).
The vertical structure of oceanic transport in the eastern Indonesian region can be explored further, even with our crude assumptions. In summer, the mixed-layer depth (MLD) is about 30 m, with a net southward flow through this layer from both T,, and T, influences (Table 11). By autumn, T, is directed northward while the bulk of the transport T,, has increased and is directed southward. In Table 11, the MLD at this time has been lowered to 50 m and the application of Equations (4) and ( 5 ) over 10-m intervals in the mixed layer (assuming an Ekman solution for the decrease of wind-induced current with depth) suggests that within the surface layer, net transport is to the north, overlying the main T,, to the south throughout the remainder of the column. Over the MLD, the net transport to the south is of the order of 1 Sv. During winter, with an MLD of 70 m, similar calculations dictate that in the top 10 m of the ocean a net northward transport occurs, with T,, again to the south over the bulk of the column and a net southward transport of 2.2 Sv in the MLD. In spring, with the MLD now at around 50 m, the vertical structure appears to be one of an almost stationary surface layer, with T,, directed to the south over the remainder of the column and a net southward transport of 2.3 Sv in the MLD. A linear decrease in current velocity with depth in Equation (5) changed the depth of net northward, near-surface transport to 20 m in autumn and 30 m in winter. Southern Hemisphere spring values remained unchanged. These depths appear to be more closely related to the MLD temperature patterns suggestive of seasonal SST advection fluctuations in Levitus (1982).
Overall, the above suggest that vertical mixing due to the shearing between layers of opposing flow in the mixed layer is a maximum in winter and a minimum in summer. During the autumn, vertical mixing is also apparent, but outside of summer, the spring months have the weakest oceanic mixing regime.
Table 11. Seasonal mean oceanic mass transports (Sv) due to sea-level differences (T,,), sea-level differences minus meridional winds effects (T,, -,), and local meridional wind effects in the MLD (T,) in a simple regular north-south channel between the Pacific and Indian Oceans
Season T,,(SV) Ts,-,(SV) T w (SV) MLD(m)
Summer (DJF) - 3.2 -2.1 - 1.1 30 Autumn (MAM) -7.8 -9.1 + 1.3 50 Winter (JJA) - 13.3 - 18.1 + 4.8 70 Spring (SON) - 10.3 -11.9 + 1.6 50
166 R. J. ALLAN AND J. 1. PARIWONO
LATITUDE ( 7 . 5 N TO 12.5s)
2 m
z Ln
u) ..
Ln v) Lo
r I
/'
/+
v) Ln
ni c - I F M A - N D J
- MJJ-FMA
c
m
z W Q: W L LL
- ASO-MJJ E
I 0
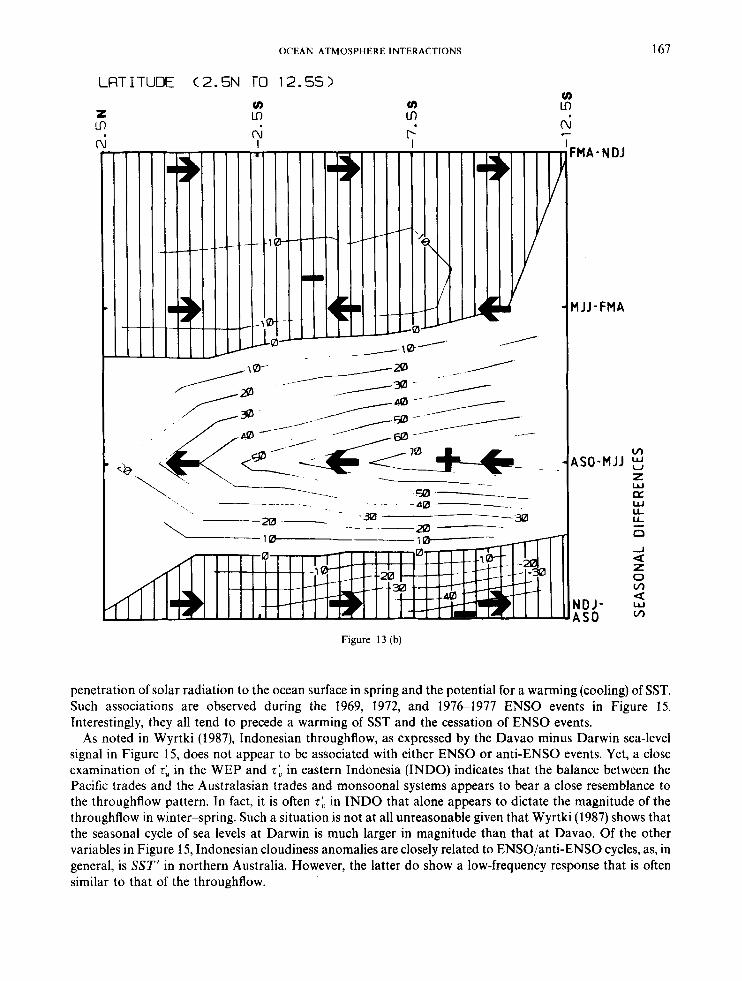
Figure 13. (a) As in Figure 1 I , except that it is the rate of oceanic heat storage between seasons in the top 30 m of the mixed layer (Q,30). (b) As in Figure 11, except that it is the rate of lateral heat divergence between seasons in the top 30 m of the mixed layer (Qo30). Arrows show
the meridional component of flow. Convergent regions are positive and unshaded; divergent regions are negative and shaded.
Indonesian throughjlow and ocean-atmosphere interactions
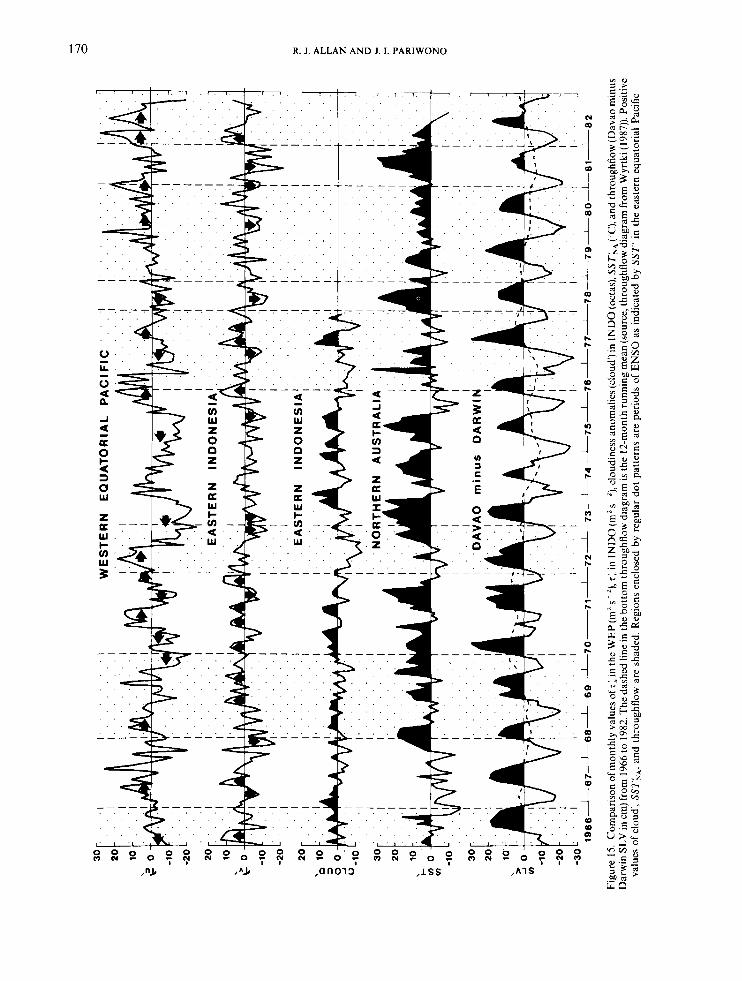
Analyses of the seasonal cycles of SST advection, lateral heat divergence, and throughflow have indicated that processes in the mixed layer dominate ocean-atmosphere interactions in the Indonesian region. Throughflow appears only to provide a mass and heat-flux link between the Pacific and Indian Oceans with regard to deeper waters, with flow often in the opposite direction to near-surface wind-induced currents. To examine this proposition further on an interannual basis, an amalgamation of sea-level data from Wyrtki (1987) and wind stress, cloudiness, and SST fields from 1966 to 1985 is shown in Figure 15.
The addition of cloudiness anomalies and SST advection provides a better perspective of ENSO/anti- ENSO phases. In fact, the previously noted link between strong ENSO (anti-ENSO) conditions and low (high) amounts of cloud cover in winter-summer seasons is also significant in that it suggests greater (less)
OCEAN ATMOSPHERE INTERACTIONS 167
2 Lo
m
Figure 13 (b)
:MA-NDJ
I JJ-FMA
\SO-MJJ z W
W u-
c3
a
u-
* a NDJ- w
450 *
penetration of solar radiation to the ocean surface in spring and the potential for a warming (cooling) of SST. Such associations are observed during the 1969, 1972, and 19761977 ENSO events in Figure 15. Interestingly, they all tend to precede a warming of SST and the cessation of ENSO events.
As noted in Wyrtki (1987), Indonesian throughflow, as expressed by the Davao minus Darwin sea-level signal in Figure 15, does not appear to be associated with either ENSO or anti-ENS0 events. Yet, a close examination of s: in the WEP and z: in eastern Indonesia (INDO) indicates that the balance between the Pacific trades and the Australasian trades and monsoonal systems appears to bear a close resemblance to the throughflow pattern. In fact, it is often r : in INDO that alone appears to dictate the magnitude of the throughflow in winter-spring. Such a situation is not at all unreasonable given that Wyrtki (1987) shows that the seasonal cycle of sea levels at Darwin is much larger in magnitude than that at Davao. Of the other variables in Figure 15, Indonesian cloudiness anomalies are closely related to ENSO/anti-ENS0 cycles, as, in general, is SST' in northern Australia. However, the latter do show a low-frequency response that is often similar to that of the throughflow.
168 R. J. ALLAN AND J. I. PARIWONO
The above relationships can be clarified by the simultaneous and lagged cross correlations shown in Figure 16. The seasonal pattern of correlations indicates that the only significant relationship between regional wind forcings (t: in the WEP and 7: in INDO) in each season indicated and the throughflow proxy (expressed as SLVX minus SLV;) in earlier and later seasons is to be found in winter (lag 0). At this time, strong (weak) throughflow is correlated with + ( - )z l in INDO. Surprisingly, there are no significant correlations between the throughflow and 7; in the WEP in any season. The only other significant cross correlations in Figure 16 involve SST' in northern Australia and the Indonesian throughflow. These are strong correlations between +( -)SST' in summer at lag - 4 and strong (weak) throughflow in the following summer, and between strong (weak) throughflow in autumn and +( -)SST' in the following summer (lag 3). Such links may reflect the influence of the wind field on SST' and the throughflow during Australasian monsoonal seasons. However, the absence of any consistently significant correlations with either TI in the WEP or 7: in INDO at these lags
LRTITUDE <7.5N TO 12.5s)
z m
2 m
E
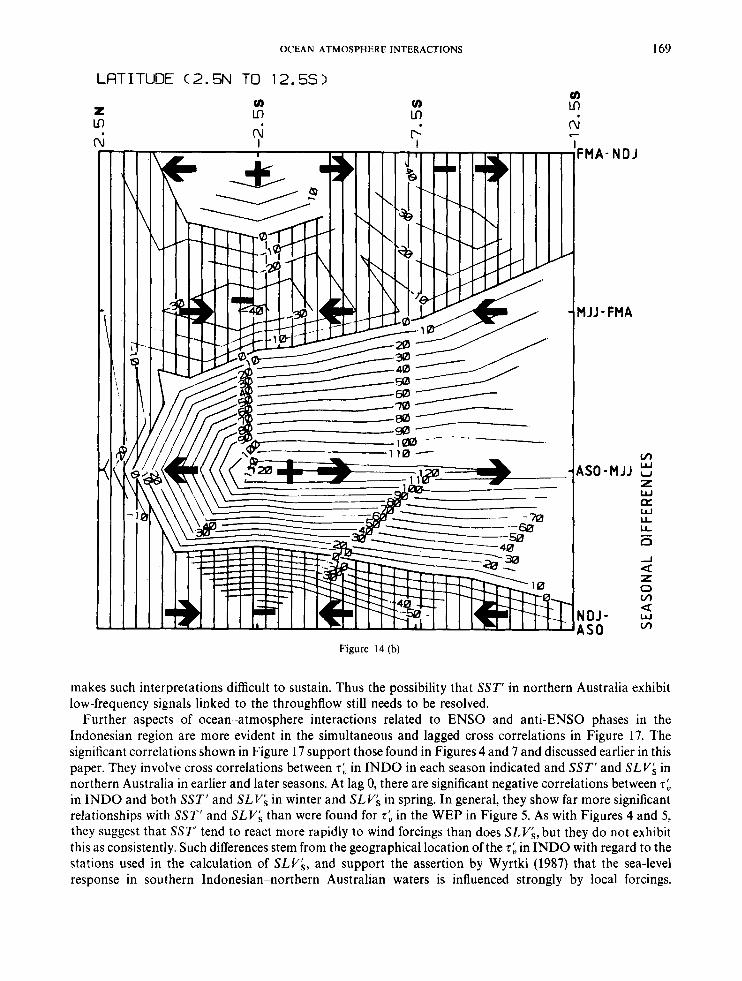
Figure 14. (a) As in Figure 11, except that it is the rate of oceanic heat storage between seasons in the remainder of the oceanic column between 40 and 250 m (Q,2s0). (b) As in Figure 13b, except that it is the rate of lateral heat divergence between seasons in the remainder of
the oceanic column between 40 and 250 m (QaZs0)
OCEAN-ATMOSPHERE INTERACTIONS 169
LATITUDE (2.5N TO 12.5s)
z Lo
&
u) Lo
u) Ln
:MA- ND J
c1JJ - FMA
Y,
z W oz W LL L
\SO-MJJ 2
ii
a
a
--I
z 0 cn W cn I D J -
IS0 Figure 14 (b)
makes such interpretations difficult to sustain. Thus the possibility that SST' in northern Australia exhibit low-frequency signals linked to the throughflow still needs to be resolved.
Further aspects of ocean-atmosphere interactions related to ENS0 and anti-ENS0 phases in the Indonesian region are more evident in the simultaneous and lagged cross correlations in Figure 17. The significant correlations shown in Figure 17 support those found in Figures 4 and 7 and discussed earlier in this paper. They involve cross correlations between z: in INDO in each season indicated and SST' and SLV; in northern Australia in earlier and later seasons. At lag 0, there are significant negative correlations between z: in INDO and both SST' and SLVs in winter and SLVs in spring. In general, they show far more significant relationships with SST' and SLV$ than were found for t: in the WEP in Figure 5. As with Figures 4 and 5, they suggest that S S T tend to react more rapidly to wind forcings than does SLVs, but they do not exhibit this as consistently. Such differences stem from the geographical location of the T: in INDO with regard to the stations used in the calculation of SLY$, and support the assertion by Wyrtki (1987) that the sea-level response in southern Indonesian-northern Australian waters is influenced strongly by local forcings.
170 R. J . ALLAN AND J. I. PARIWONO
. . . .
. . . . P
- ---;.;:+ . . . . . .
. . . . . . . a
~- - . .
. .
3:; . . . .
' . " I
' I ' ' . . . . . .
. . . .
' I " ' . .
I- - . .
. . L
OCEAN ATMOSPHERE INTERACTIONS 171
-1 . -1 9
. . . . . . . . . i - 3 - 2 - 1 i i i i ' i - 4 -3 -2 -1 0 1 i i 'i
1 - r
W I N T E R S P R I N G
1 . r
- 1 * -1 - . . . . . . . .
- 4 -3 -2 -1 i i i 5 i - 4 -3 -2 -I 6 i i i i
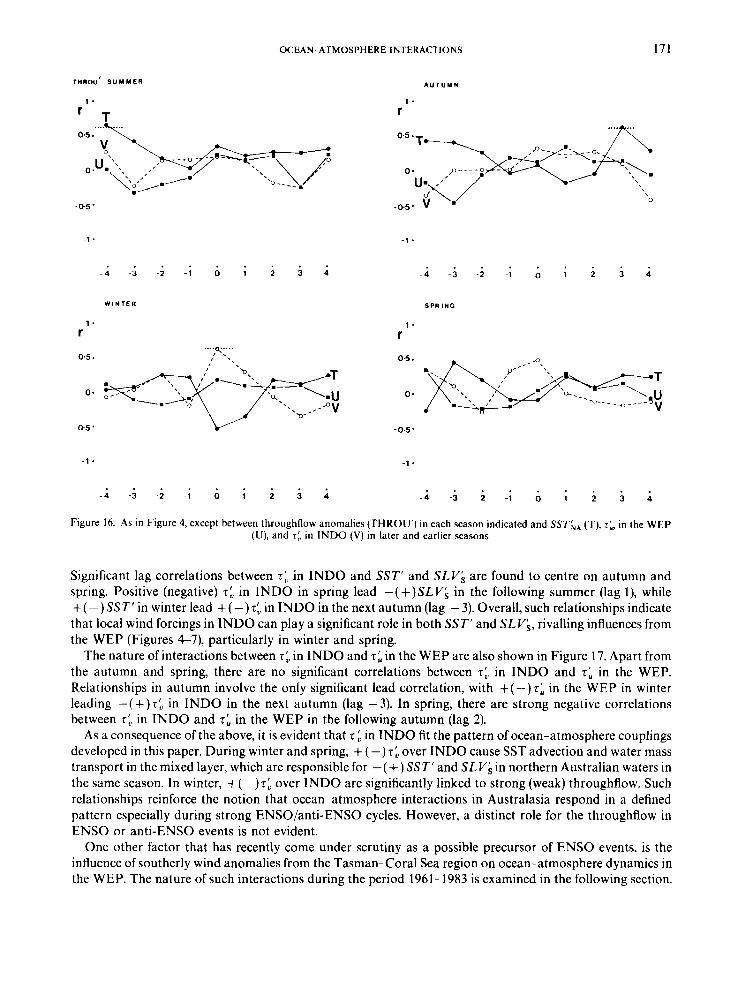
Figure 16. As in Figure 4, except between throughflow anomalies (THROU') in each season indicated and SST',, (T), tl, in the WEP (U), and T:. in INDO (V) in later and earlier seasons
Significant lag correlations between T: in INDO and SST' and SLV$ are found to centre on autumn and spring. Positive (negative) T: in INDO in spring lead - (+)SLV$ in the following summer (lag l), while + (-) SST' in winter lead + (-) T: in INDO in the next autumn (lag - 3). Overall, such relationships indicate that local wind forcings in INDO can play a significant role in both SST' and SLV$, rivalling influences from the WEP (Figures 4-7), particularly in winter and spring.
The nature of interactions between t: in INDO and r: in the WEP are also shown in Figure 17. Apart from the autumn and spring, there are no significant correlations between T: in INDO and T: in the WEP. Relationships in autumn involve the only significant lead correlation, with +(-)t: in the WEP in winter leading -(+)t: in INDO in the next autumn (lag -3). In spring, there are strong negative correlations between 7; in INDO and T: in the WEP in the following autumn (lag 2).
As a consequence of the above, i t is evident that r in INDO fit the pattern of ocean-atmosphere couplings developed in this paper. During winter and spring, + (-) T: over INDO cause SST advection and water mass transport in the mixed layer, which are responsible for -( +) SST' and SLV; in northern Australian waters in the same season. In winter, +(-)TI over INDO are significantly linked to strong (weak) throughflow. Such relationships reinforce the notion that ocean-atmosphere interactions in Australasia respond in a defined pattern especially during strong ENSO/anti-ENS0 cycles. However, a distinct role for the throughflow in ENSO or anti-ENS0 events is not evident.
One other factor that has recently come under scrutiny as a possible precursor of ENSO events, is the influence of southerly wind anomalies from the Tasman-Coral Sea region on ocean-atmosphere dynamics in the WEP. The nature of such interactions during the period 1961-1983 is examined in the following section.

172 R. J. ALLAN AND J. I. PARIWONO
INDOT: S U Y Y E R
1 .
r 1 .
r
AUTUMN
-1 * -1 *
. . . . . . . -4 - 3 - 2 -I 6 i i i i - 4 -3 -2 - I 6 i i i i
W I N T E R
1 -
r 1 .
r
SPRING
-1 * -1 *
. . . . . . . -i -3 -2 -1 b ; i i i - 4 -3 - 2 -1 6 ; i i ;
Figure 17. As in Figure 4, except between 7: in INDO in each season indicated and SSTL, (T), S L Y ; (S), and T: in the WEP (U) in later and earlier seasons
Cross correlations between 7; and 7: in the WEP and ECS
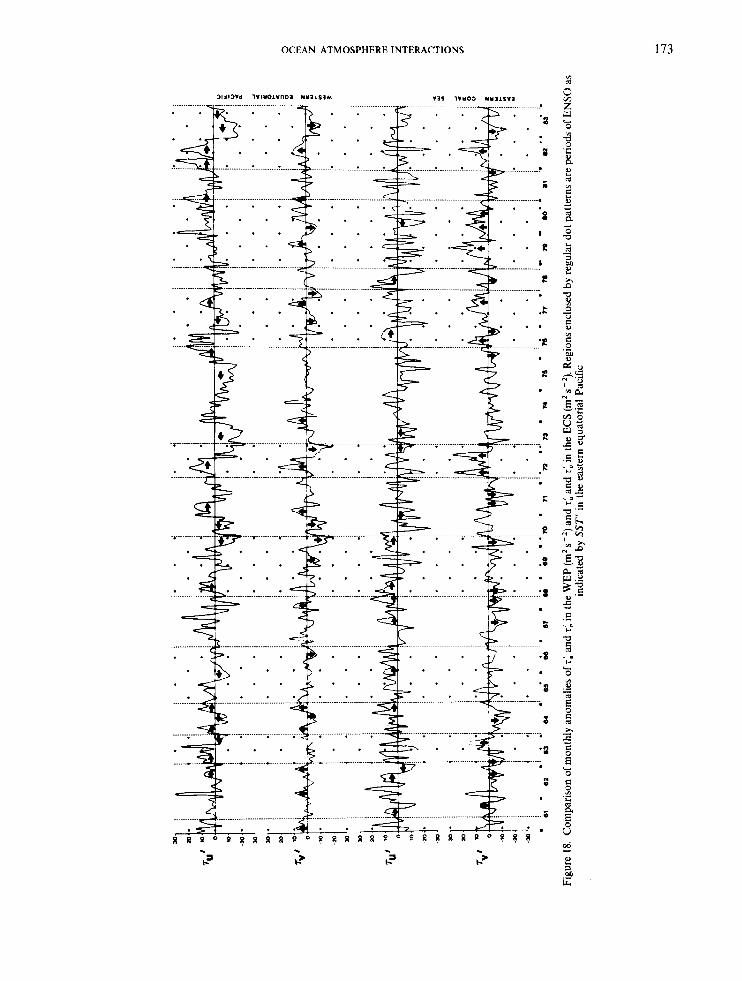
Relationships between t: and 7: in the WEP and r : and 7; in the ECS are shown in Figure 18. As noted earlier in this paper, periods of pronounced +(-)T: and +(-)T; in the WEP are often in phase, with alternations from -7: and - 5 : to +r: and +(, often heralding the development of ENSO events. Links with these fluctuations and wind ‘bursts’ moving equatorward through the ECS can be seen in Figure 18, with strong + r: over the ECS linked with + T: and +z: in the WEP during the 1963,1972,1976-1977, 1979-1980, and 1982 ENSO events. However, there is no clear indication that + t: in the ECS either precedes or is a precursor of + 7; or + r: in the WEP, and thus ‘triggers’ ENSO episodes. It would seem that wind-stress anomalies in these regions are either concurrent or that +z: and +r: in the WEP occur slightly before +T: in the ECS. Nevertheless, this does not diminish the possible role that + r : from the ECS could play in ocean-atmosphere interactions in the WEP during ENSO events. The most notable exception to the above is the extensive period of +r: in the ECS during the 1979-1980 ENSO. No consistent relationships between 7: in the ECS and either T: or 5: in the WEP are evident.
Further understanding of the above relationships can be drawn from the simultaneous and lagged cross correlations shown in Figure 19. The most notable feature of these seasonal correlations is that consistent and significant correlations are observed between t: in the ECS and WEP. In both winter and spring, positive simultaneous correlations (lag 0) occur between 7: from the two regions, while in summer and autumn they become negative (lago), but not significant. This distinct alternation may reflect the seasonal change in
OCEAN ATMOSPHERE INTERACTIONS 173
........................... . . . . . .
. . . .............................
............................. . . . . . . ..........................
...................... ......................... ..........................
................................
.... .......... ~ ........
. . . . . .
................................ ......................... * . .
......................... ........................... .... _
_* ..........-.........
- . . . ti= ti’ t-= t-p
174 R. I. ALLAN AND J . 1. PARIWONO
ECS 1"' SUMMER
1 -
r
AUTUMN
1.
r 0.5 -
-05'
-1 . -1 *
. . . . -4 -3 -2 -1 i i i i i
'"6
. . . . -4 -3 -2 -1 ti ; 4 i i
-1 * -1.
. . . . . . -4 -3 -2 -1 0 ; i i i -i -5 -2 -I 0 4 i i i
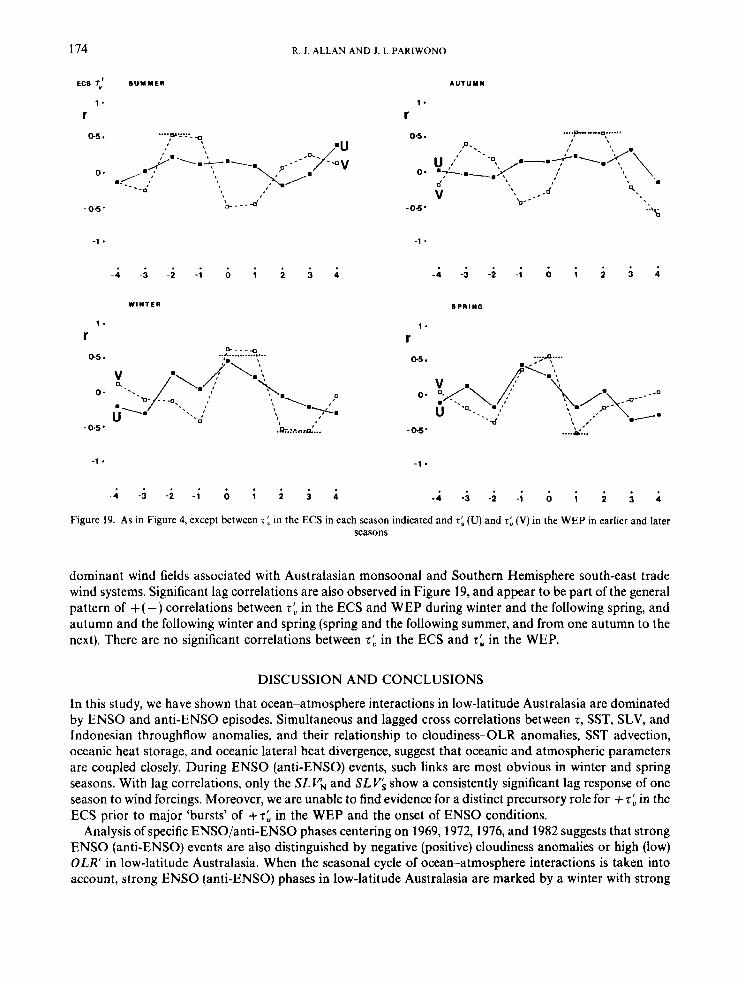
Figure 19. As in Figure 4, except between 7 in the ECS in each season indicated and 7; (U) and 7: (V) in the WEP in earlier and later seasons
dominant wind fields associated with Australasian monsoonal and Southern Hemisphere south-east trade wind systems. Significant lag correlations are also observed in Figure 19, and appear to be part of the general pattern of +( -) correlations between T: in the ECS and WEP during winter and the following spring, and autumn and the following winter and spring (spring and the following summer, and from one autumn to the next). There are no significant correlations between T: in the ECS and T; in the WEP.
DISCUSSION AND CONCLUSIONS
In this study, we have shown that ocean-atmosphere interactions in low-latitude Australasia are dominated by ENSO and anti-ENS0 episodes. Simultaneous and lagged cross correlations between T, SST, SLV, and Indonesian throughflow anomalies, and their relationship to cloudiness-OLR anomalies, SST advection, oceanic heat storage, and oceanic lateral heat divergence, suggest that oceanic and atmospheric parameters are coupled closely. During ENSO (anti-ENSO) events, such links are most obvious in winter and spring seasons. With lag correlations, only the SLV, and SLVs show a consistently significant lag response of one season to wind forcings. Moreover, we are unable to find evidence for a distinct precursory role for + 7: in the ECS prior to major 'bursts' of +T; in the WEP and the onset of ENSO conditions.
Analysis of specific ENSO/anti-ENS0 phases centering on 1969,1972,1976, and 1982 suggests that strong ENSO (anti-ENSO) events are also distinguished by negative (positive) cloudiness anomalies or high (low) OLR' in low-latitude Australasia. When the seasonal cycle of ocean-atmosphere interactions is taken into account, strong ENSO (anti-ENSO) phases in low-latitude Australasia are marked by a winter with strong
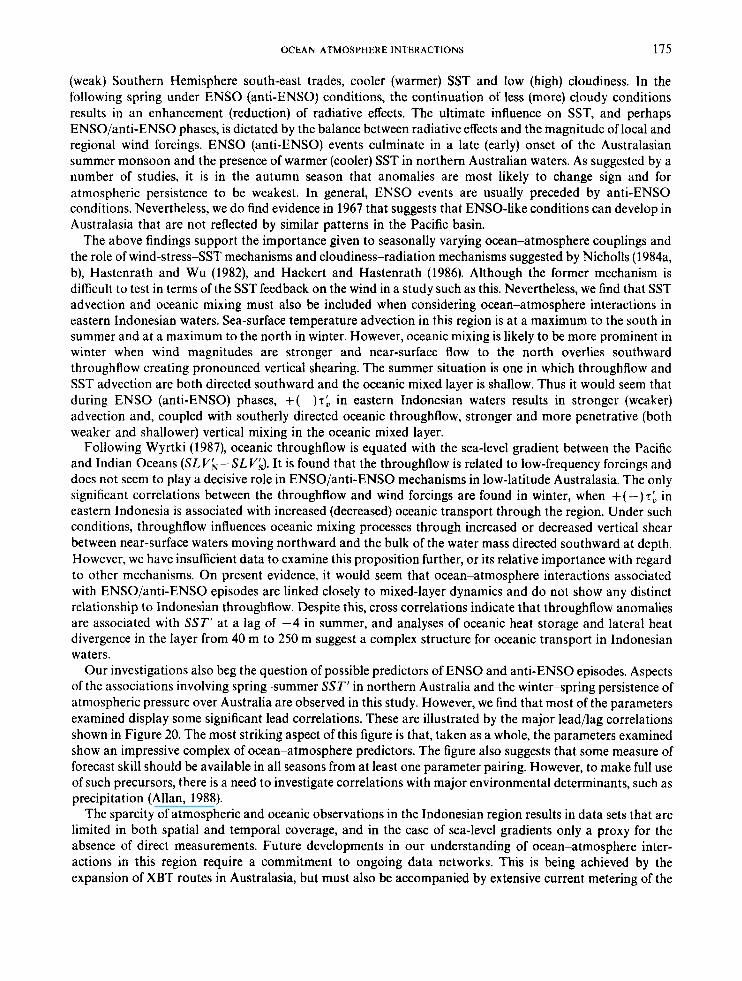
OCEAN ATMOSPHERE INTERACTIONS 175
(weak) Southern Hemisphere south-east trades, cooler (warmer) SST and low (high) cloudiness. In the following spring under ENSO (anti-ENSO) conditions, the continuation of less (more) cloudy conditions results in an enhancement (reduction) of radiative effects. The ultimate influence on SST, and perhaps ENSO/anti-ENS0 phases, is dictated by the balance between radiative effects and the magnitude of local and regional wind forcings. ENSO (anti-ENSO) events culminate in a late (early) onset of the Australasian summer monsoon and the presence of warmer (cooler) SST in northern Australian waters. As suggested by a number of studies, it is in the autumn season that anomalies are most likely to change sign and for atmospheric persistence to be weakest. In general, ENSO events are usually preceded by anti-ENS0 conditions. Nevertheless, we do find evidence in 1967 that suggests that ENSO-like conditions can develop in Australasia that are not reflected by similar patterns in the Pacific basin.
The above findings support the importance given to seasonally varying ocean-atmosphere couplings and the role of wind-stress-SST mechanisms and cloudiness-radiation mechanisms suggested by Nicholls (1984a, b), Hastenrath and Wu (1982), and Hackert and Hastenrath (1986). Although the former mechanism is difficult to test in terms of the SST feedback on the wind in a study such as this. Nevertheless, we find that SST advection and oceanic mixing must also be included when considering ocean-atmosphere interactions in eastern Indonesian waters. Sea-surface temperature advection in this region is at a maximum to the south in summer and at a maximum to the north in winter. However, oceanic mixing is likely to be more prominent in winter when wind magnitudes are stronger and near-surface flow to the north overlies southward throughflow creating pronounced vertical shearing. The summer situation is one in which throughflow and SST advection are both directed southward and the oceanic mixed layer is shallow. Thus it would seem that during ENSO (anti-ENSO) phases, +( -) t: in eastern Indonesian waters results in stronger (weaker) advection and, coupled with southerly directed oceanic throughflow, stronger and more penetrative (both weaker and shallower) vertical mixing in the oceanic mixed layer.
Following Wyrtki (1987), oceanic throughflow is equated with the sea-level gradient between the Pacific and Indian Oceans (SLVf,-SLV$). It is found that the throughflow is related to low-frequency forcings and does not seem to play a decisive role in ENSO/anti-ENS0 mechanisms in low-latitude Australasia. The only significant correlations between the throughflow and wind forcings are found in winter, when +(-)t; in eastern Indonesia is associated with increased (decreased) oceanic transport through the region. Under such conditions, throughflow influences oceanic mixing processes through increased or decreased vertical shear between near-surface waters moving northward and the bulk of the water mass directed southward at depth. However, we have insufficient data to examine this proposition further, or its relative importance with regard to other mechanisms. On present evidence, it would seem that ocean-atmosphere interactions associated with ENSO/anti-ENS0 episodes are linked closely to mixed-layer dynamics and do not show any distinct relationship to Indonesian throughflow. Despite this, cross correlations indicate that throughflow anomalies are associated with SST' at a lag of - 4 in summer, and analyses of oceanic heat storage and lateral heat divergence in the layer from 40 m to 250 m suggest a complex structure for oceanic transport in Indonesian waters.
Our investigations also beg the question of possible predictors of ENSO and anti-ENS0 episodes. Aspects of the associations involving spring-summer SST' in northern Australia and the winter-spring persistence of atmospheric pressure over Australia are observed in this study. However, we find that most of the parameters examined display some significant lead correlations. These are illustrated by the major lead/lag correlations shown in Figure 20. The most striking aspect of this figure is that, taken as a whole, the parameters examined show an impressive complex of ocean-atmosphere predictors. The figure also suggests that some measure of forecast skill should be available in all seasons from at least one parameter pairing. However, to make full use of such precursors, there is a need to investigate correlations with major environmental determinants, such as precipitation (Allan, 1988).
The sparcity of atmospheric and oceanic observations in the Indonesian region results in data sets that are limited in both spatial and temporal coverage, and in the case of sea-level gradients only a proxy for the absence of direct measurements. Future developments in our understanding of ocean-atmosphere inter- actions in this region require a commitment to ongoing data networks. This is being achieved by the expansion of XBT routes in Australasia, but must also be accompanied by extensive current metering of the
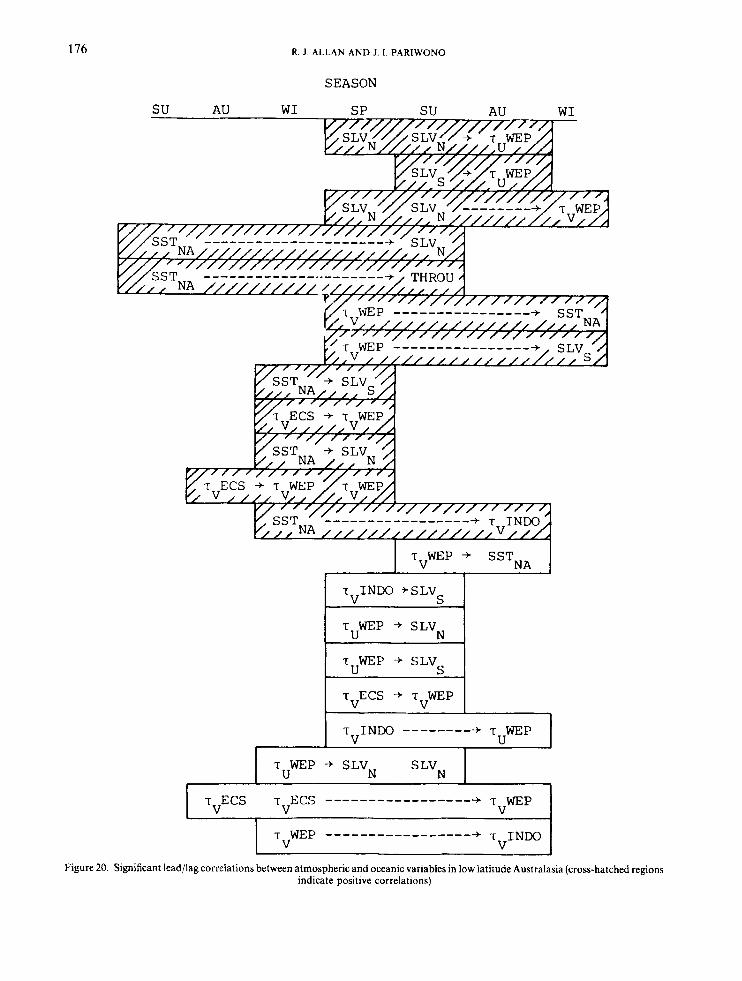
176
-+ T WEP T I N D O -------- V U
R. J . ALLAN AND J. I. PARIWONO
S E A S O N
Figure 20.
T WEP -+ V
r 1 T INDO +SLv u
N T WEP -+ S L V
U
OCEAN ATMOSPHERE INTERACTIONS 177
throughflow and the upgrading of existing, and the establishment of new, tide gauge networks in Indonesian waters.
ACKNOWLEDGEMENTS
We would like to thank Dr A. B. Pittock and an anonymous reviewer for their comments on this paper. One of us (RJA) was supported by an Australian Marine Sciences and Technologies Grant.
REFERENCES
Allan, R. J. 1983. ‘Monsoon and teleconnection variability over Australasia during the Southern Hemisphere summers of 1973-77, Mon.
Allan, R. J. 1988. ‘El Nino Southern Oscillation influences in the Australasian region’, Prog. Phys. Geogr., 12, 4-40. Barnett, T. P. 1984a. ‘Interaction of the monsoon and Pacific trade wind system at interannual time scales. Part 11. The tropical band’,
Barnett, T. P. 1984b. ‘Interaction of the monsoon and Pacific trade wind system at interannual time scales. Part 111. A partial anatomy of
Barnett, T. P. 1985a. ‘Variations in near-global sea level pressure’, J. Atmos. Sci., 42,478-501. Barnett, T. P. 1985b. ‘Three-dimensional structure of low-frequency pressure variations in the tropical atmosphere. J. Atmos. Sci., 42,
Bye, J. A. T. and Gordon, A. H. 1982. ‘Speculated cause of interhemispheric oceanic circulation’, Nature, 2%, 52-54. Cane, M. A., Zebiak, S. E. and Dolan, S. C. 1986. ‘Experimental forecasts of El Nino’, Nature, 321, 827-832. Climate Analysis Center 19841985. Climate Diagnostics Bulletin, Nos 84/1 85/12, NWS, NOAA, Washington, DC. Donguy, J-R, Henin, C., Morliere. A. and Rebert, J. P. 1982. ‘Appearances in the western Pacific of phenomena induced by El Nino in 1979-80: Trop. Ocean Atmos. Newsl., 10, 1-2. Co-operative Institute for marine and Atmospheric studies, University of Miami, Florida.
Esbensen, S. K. and Kushnir, V. 1981. The Heat Budget of the Global Ocean: an Atlas based on Estirnatesfrom Marine Surface Observations, Climatic Research Institute, Oregon State University, Corvallis, OR, Rep. No. 29, 27 pp.
Fine, R. A. 1985. ‘Direct evidence using tritium data for throughflow from the Pacific into the Indian Ocean’, Nature, 315,478480, Gao, S . and Wang, J. 1987a. ‘El Nino and the SO (Southern Oscillation)’, Trop. Ocean Atmos. Newsl., 39,4-6. Co-operative Institute for
Gao, S. and Wang, J. 1987b. ‘Variability of the meridional winds in the west equatorial Pacific and El Nino’, Trop. Ocean Atmos. Newsl.
Garcia, 0. 1985. Atlas of Highly Rejective Clouds for the Global Tropics: 1971 4983. US Department of Commerce, NOAA, ERL. Gill, A. E. 1980. ‘Some simple solutions for heat-induced tropical circulation’, Q. J. R. Meteorol. Soc., 106, 447462. Gill, A. E. 1982. Atmosphere-Ocean Dynamics. New York, Academic Press. Gill, A. E. 1985. ‘Elements of coupled ocean-atmosphere models for the tropics’, in Nihoul, J. C. J. (ed.) Coupled Ocean-Atmosphere
Gill, A. E. and Rasmusson, A. E. 1983. ‘The 1982-83 climate anomaly in the equatorial Pacific. Nature, 306, 229-234. Godfrey, J. S. and Ridgway, K. R. 1985. ‘The large-scale environment of the poleward flowing Leeuwin Current, Western Australia:
Hackert E. C. and Hastenrath, S. 1986. ‘Mechanisms of Java rainfall anomalies’, Mon. Wea. Rev., 114, 745-757. Harrison, D. E. 1984a. ‘Where did the strong equatorial westerlies of the 1982 warm event begin?’, Trop. Ocean Atmos. Newsl., 24,17-18.
Harrison, D. E. 1984b. ‘The appearance of sustained equatorial surface westerlies during the 1982 Pacific warm event’, Science, 224,
Hastenrath, S. and Lamb, P. J. 1979.‘Climatie Atlas of the Indian Ocean. Part 1: Surface Circulation and Climate. Part 2: The Oceanic Heat
Hastenrath, S. and Wu, M. C. 1982. ‘Oscillations of upper-air circulation and anomalies in the surface climate of the tropics’, Arch.
Hastenrath, S. and Wu, M. C. 1983. ‘On upper-air mechanisms of the Southern Oscillation’, Trop. Ocean Atmos. News/. , 17, 24. Co-
Heckley, W. A. and Gill, A. E. 1984. ‘Some simple analytical solutions to the problem of forced equatorial long waves’, Q. J. R . Meteorol.
Holland, G. J. 1986. ‘Interannual variability of the Australian Summer Monsoon at Darwin 1952-82’, Mon. Wea. Rev., 114, 594-604. Holland, G. J. and Nicholls, N. 1985. ‘A simple predictor of El Nino’, Trop. Ocean Atmos. News/. , 30, 8-9. Co-operative Institute for
Holloway, P. E. and Nye, H. C. 1985. ‘Leeuwin Current and wind distributions on the southern part of the Australian North-West Shelf
Keen, R. A. 1982. ‘The role of cross-equatorial tropical cyclone pairs in the Southern Oscillation’, Mon. Wea. Rev., 110, 1405-1416. Keen, R. A. 1983. ‘Tropical cyclone pairs: their interactions with the equatorial ocean and the Southern Oscillation’, Trop. Ocean Atmos.
Keshavamurty, R. N. 1982. ‘Response of the atmosphere to sea surface temperature anomalies over the equatorial Pacific and the
Wea. Rev., 111, 113-142.
Mon. Wea. Rev., 112, 2380-2387.
the Southern Oscillation’, Mon. Wea. Rev. 112,2388-2400.
2798-2803.
marine and Atmospheric studies, University of Miami, Florida.
40, 5-8. Co-operative Institute for marine and Atmospheric studies, University of Miami, Florida.
Models, Elsevier, Amsterdam, Oceanography Series, 40, 303-327.
longshore steric height gradients, wind stresses and geostrophic flow’, J. Phys. Oceanogr., 15, 481-508.
Co-operative Institute for marine and Atmospheric studies, University of Miami, Florida.
1099-2002.
Budget, University of Wisconsin Press, 109 and 104 pp.
Meteorol. Geophys. Bioklimatol., Ser. B., 31, 1-37.
operative Institute for marine and Atmospheric studies, University of Miami, Florida.
SOC., 110,203-21 7.
marine and Atmospheric studies, University of Miami, Florida.
between January 1982 and June 1983’, Aust. J. Mar. Freshw. Res., 36, 123-137.
Newsl., 15, 8-10, Co-operative Institute for marine and Atmospheric studies, University of Miami, Florida.
teleconnections of the Southern Oscillation’, J. Atmos. Sci., 39, 1241-1259.
178 R. J. ALLAN AND 1. I. PARIWONO
Krishnamurti, T. N., Chu, S. H. and Iglesias, W. 1986. ‘On the sea level pressure of the Southern Oscillation’, Arch. Meteorol. Geophys.
Kundu, P. K. and McCreary, Jr, J. P. 1986. ‘On the dynamics of the throughflow from the Pacific into the Indian Ocean’, J. Phys.
Lamb, P. J. 1981. ‘Estimate of annual variation of Atlantic Ocean heat transport’, Nature, 290, 766768. Lau, K-M. 1985. ‘Elements of a stochastic-dynamical theory of the long-term variability of the El Nino/Southern Oscillation’, J . Atmos.
Bioklimatol., Ser. A , 34, 385425.
Oceanogr., 16, 2191-2198.
- Sci., 42, 1552-1558.
Leeler. D. M. and OBrien. J. J. 1986. ‘Analvsis ofnear real-time wind-stress data from the troDical Pacific’. Troo. Ocean Atmos. Newsl.. 34. . . , ,
?-3.’Co-operative Institute for marine ind Atmospheric studies, University of Miami, Florida.
173 pp.
Nature, 323, 523-526.
9464-9468.
Levitus, S. 1982. Climatological Atlas ofthe World Ocean, US Department of Commerce, Rockville, MA, NOAA Professional Paper 13,
Meyers, G., Donguy, J-R. and Reed, R. K. 1986. ‘Evaporative cooling of the western equatorial Pacific Ocean by anomalous winds’,
Mitchum, G. T. 1987. ‘Trade wind fluctuations associated with El Nino-Southern Oscillation events’, J. Geophys. Res., 92 (C9),
Nicholls, N. 1979. ‘A simple air-sea interaction model’, Q. J. R. Meteorol. Soc., 105, 93-105. Nicholls, N. 1981. ‘Air-sea interaction and the possibility of long-range weather prediction in the Indonesian Archipelago’, Mon. Wea.
Nicholls, N. 1983. ‘Predictability of the 1982 Australian drought’, Search, 14, 154-155. Nicholls, N. 1984a. ‘El Nino Southern Oscillation and North Australian sea surface temperature’, Trop. Ocean Amos. Newsl., 24, 11-12.
Nicholls, N. 1984b. ‘The Southern Oscillation and Indonesian sea surface temperature’, Mon. Wea. Rev., 112, 424-432. Nicholls, N. 1984c. ‘A system for predicting the onset of the north Australian wet-season’, J. Climatol., 4, 425435. Pariwono, J. 1. 1987. ‘Wind stress, mean sea level and inter-ocean transport in the Australasian region. Flinders Inst. Atmos. Mar. Sci. Res.
Rep., 43, 196 pp. Pariwono, J. I., Bye, J. A. T. and Lennon, G. W. 1986. ‘Long period variations of sea level in Australasia’, Geophys. J. R. Astron. Soc., 87,
43-54. Pazan, S. E., White, W. B., Inoue, M. and OBrien, J. J. 1986. ‘Off-equatorial influence upon Pacific equatorial dynamic height variability
during the 1982-83 El Nino/Southern Oscillation’, J. Geophys. Res., 91, (C7), 8437-8449. Philander, S. G. H. 1983. ‘El Nino Southern Oscillation phenomena’, Nature, 302,295-301. Philander, S . G. H. 1985. ‘El Nino and La Nina’, J . Atmos. Sci., 42, 2652-2662. Piola, A. R. and Gordon, A. L. 1984. ‘Pacific and Indian Ocean upper-layer salinity budget’, J. Phys. Oceanogr., 14, 747-753. Rasmusson, E. M. 1984. ‘El Nino: the ocean/atmosphere connection’, Oceanus, 27, 36-39. Sadler, J . C., Oda, L. and Kilonsky, B. J. 1976. Pacific Ocean Cloudiness from Satellite Observations. Department of Meteorology,
Sadler, J. C., Lander, M. A.; Hori, A. M. and Oda, L. K. 1987. Tropical Marine Climatic Atlas, Vol. If; Pacific Ocean, Department of
Shideler, D. H. and Sadler, J. C. 1979. Pacific Ocean Cloudiness from Satellite Observations, Part 11, Department of Meteorology,
Streten, N. A. 1981. ‘Southern Hemisphere sea surface temperature variability and apparent associations with Australian rainfall’, J .
Streten, N. A. 1983. ‘Extreme distributions of Australian annual rainfall in relation to sea surface temperature’, J. CZimatol., 3, 143-153. Thompson, R. 0. R. Y. and Cresswell, G. R. 1983. ‘The Leeuwin Current and undercurrent’, Trop. Ocean Atmos. Newsl., 19, 1&1 I . Co-
Trenberth, K. E. and Shea, D. J. 1987. ‘On the evolution of the Southern Oscillation’, Mon. Wea. Rev., 115, 3078-3096. Winston, J. S., Gruber, A., Gray Jr T. I., Varnadore, M. S., Earnest, C. L. and Mannello, L. P. 1979. Earth-Atmosphere Radiation Budget
Analyses Deriued From N O A A Satellite Data June 1974 Februury 1978: Vol. I , Meteorological Satellite Service, US Department of Commerce, Washington, DC., 8 pp.
Wright, P. B. 1984a. ‘Relationship of SST near northern Australia to the Southern Oscillation’, Trap. Ocean Atrnos. Newsl., 27,17-18. Co- operative Institute for marine and Atmospheric studies, University of Miami, Florida.
Wright, P. B. 1984b. ‘Relationships between indices of the Southern Oscillation’, Mon. Wea. Rev., 112, 1913-1919. Wright, P. B., Mitchell, T. P. and Wallace, J. M. 1985. Relationships between Surface Observations over the Global Oceans and the Southern
Wright, W. J. 1987. ‘Synoptic and climatological factors influencing winter rainfall variability in Victoria’, University of Melbourne,
Wyrtki, K. 1961. ‘Physical oceanography of the Southeast Asian waters’, NAGA Report Vol. 2, University of California, La Jolle,
Wyrtki, K. 1987. ‘Indonesian throughflow and the associated pressure gradient’, J . Geophys. Res., 92 (C12), 12,941-12,946. Zebiak, S. E. and Cane, M. A. 1987. ‘A model El Nino-Southern Oscillation’, Mon. Wea. Rev., 115, 2262-2278.
Rev., 109, 2435-2443.
Co-operative Institute for marine and Atmospheric studies, University of Miami, Florida.
University of Hawaii, Manoa, UHMET 76-01., 137 pp.
Meteorology, University of Hawaii, Manoa, UHMET 8742, 27 pp.
University of Hawaii., Manoa, UHMET 79-13., 56 pp.
Geophys. Res., 86,485497.
operative Institute for marine and Atmospheric studies, University of Miami, Florida.
Oscillation, NOAA, Seattle, WA, Data Report ERL PMEL-I2., 61 pp.
unpublished thesis.
CA, 195 pp.