FEASIBILITY STUDY FINANCIAL PROJECTIONS - Lockport, NY
359
FEASIBILITY STUDY with FINANCIAL PROJECTIONS for the proposed The Inn at the Locks a Member of the Ascend Collection affiliated with Choice Hotels International Lockport, New York for the City of Lockport, New York
-
Upload
khangminh22 -
Category
Documents
-
view
1 -
download
0
Transcript of FEASIBILITY STUDY FINANCIAL PROJECTIONS - Lockport, NY

FEASIBILITY STUDY
with
FINANCIAL PROJECTIONS
for the proposed The Inn at the Locks
a Member of the Ascend Collection
affiliated with Choice Hotels International
Lockport, New York
for the
City of Lockport, New York

4145 Yardley Circle
Tallahassee, Florida 32308-2942 Telephone: 850/893-6010 • Fax: 850/893-8345 • Cell: 850/443-5010
www.interimhospitality.com • [email protected] Member, International Association of Hospitality Advisors
Member, Extended-Stay Hotel Council, AHLA

Listed in the Top 20 Hotel Consulting Firms by Hotel/Motel Management since 2006 Member, International Association of Hospitality Advisors
Member, Extended-Stay Council, AHLA
December 22, 2014 Mr. Chuck Bell, Director of Planning and Development City of Lockport One Locks Plaza Lockport, New York 14094
Via Federal Express Dear Mr. Bell: This report, entitled “Feasibility Study with Financial Projections for the development of the proposed Inn at the Locks Hotel of the Ascend Collection of Choice Hotels International” at 57 Richmond Avenue in Lockport, New York, has been prepared pursuant to our agreement of October 10, 2014. The report consists of a survey of the site and surrounding areas regarding the suitability for hotel development; a market study of the Lockport, New York area pertaining to transient lodging facilities; and based on these studies, estimates and assumptions, discussed in this report, the Financial Projections for the proposed hotel. The scope of our work is described in the attached report and includes, among other things, the following steps: We discuss the demand for the facilities with representatives of government, commerce, and industry. We revisited economic and demographic data and industrial growth statistics of the area. Existing and planned travel patterns, area approaches, hotels, restaurants, and lounges were surveyed and analyzed as they pertain to the site. In accordance with our engagement letter, we did not ascertain the legal and regulatory requirements applicable to this project, including zoning, permits, licenses, and other state and local government regulations. No effort has been made to determine the possible effect on this project of present or future federal, state, and local legislation, including any regarding environmental or ecological matters, nor an analysis of the potential impact of possible energy shortages. Our study is based on information developed from research of the market, knowledge of the industry, and conversations with you during which we were provided certain information. The sources of information and bases of our estimates and assumptions are stated in the body of this report. We have no responsibility to update this report for events and circumstances occurring after the date of this report.

Mr. Chuck Bell December 22, 2014 Page 2 The accompanying projections are based on estimates and assumptions developed in connection with the Feasibility Study. However, certain assumptions may not materialize, and unanticipated events and circumstances may occur; therefore, actual results achieved during the projection period may vary from the forecasts, and the variations may be material. The Author and Interim Hospitality Consultants will not be liable for errors and omissions in judgment, negligence, or other fault in connection with this Feasibility Study, except for acts of gross negligence, willful malfeasance, and fraud. We acknowledge that the hotel will be financed through one or more loans with financial institutions, and said financial institutions may rely on the Feasibility Study when determining whether to extend financial credit and the terms thereof. In addition, we understand that you plan to offer ownership interests in the hotel to accredited investors in a private placement under various rules and regulations of the Securities Acts (Offering), and that investors may rely on the Feasibility Study as part of their investment analysis. Further, we acknowledge that you and others may utilize the Feasibility Study to evaluate the market potential for the proposed hotel, planning the composition of the hotel, projecting levels of market penetration, occupancy, and average room rate, preparing cash flow and financial projections, and other purposes. In your multiple capacities as developer of the hotel, you and your agents and assigns, are hereby authorized to utilize the Feasibility Study for its intended purposes and in pursuance of the matters described herein. As such, you and your agents and assigns, are authorized to disclose the Feasibility Study to any and all third parties and their attorneys, accountants, and employees who need access in order to analyze aspects of the hotel. These authorizations may not and will not be revoked. Neither you nor third parties to which you disclose the Feasibility Study have a duty to maintain the confidentiality of the Feasibility Study. We acknowledge that the Feasibility Study is owned by you, and you may utilize it as your sole property. Thank you for allowing Interim Hospitality Consultants to be of service to you. Regards,
Edward L. Xanders, CHA Its Manager
i
TABLE OF CONTENTS INTRODUCTION .......................................................................................................... A-1 Objectives of Study ......................................................................................................... A-1 Scope of Study ................................................................................................................ A-2 CONCLUSIONS ............................................................................................................B-1 Market Area Analysis ......................................................................................................B-1 Site and Area Evaluation .................................................................................................B-2 Supply and Demand Analysis ..........................................................................................B-2 Proposed Facilities and Services ......................................................................................B-3 Projected Utilization of the Proposed Hotel ....................................................................B-6 Financial Analysis ............................................................................................................B-7 Choice Hotels International .............................................................................................B-7 Ascend Hotel Collection ..................................................................................................B-8 MARKET AREA ANALYSIS .............................................................................C-1 Overview ..........................................................................................................................C-1 History..............................................................................................................................C-2 Geography ........................................................................................................................C-2 Demographics ..................................................................................................................C-4 Government......................................................................................................................C-4 Economy ..........................................................................................................................C-4 Niagara County, New York Overview...........................................................................C-21 Geography ......................................................................................................................C-24 Demographics ................................................................................................................C-24 Education .......................................................................................................................C-25 Healthcare ......................................................................................................................C-26 Economy ........................................................................................................................C-29 Workforce ......................................................................................................................C-34 Transportation ................................................................................................................C-40 Shopping ........................................................................................................................C-41 Media .............................................................................................................................C-41 Tourist Attractions .........................................................................................................C-41 Summary ........................................................................................................................C-45

ii
SITE AND AREA EVALUATION .............................................................................. D-1 The Site ........................................................................................................................... D-1 Highways ........................................................................................................................ D-1 Maps and Site Pictures .................................................................................................... D-6 State Map ................................................................................................................... D-7 Area Map ................................................................................................................... D-8 City Map .................................................................................................................... D-9 Site Pictures ............................................................................................................. D-10 Additional Hotel Development Sites ............................................................................ D-13 Hotel Signage ................................................................................................................ D-16 Utilities .......................................................................................................................... D-16 Summary ....................................................................................................................... D-16 SUPPLY AND DEMAND ANALYSIS ................................................................ E-1 Competitive Market Survey ............................................................................................. E-2 Hotels Under Construction, Planned or Rumored ........................................................... E-2 Competitive Hotels Map .................................................................................................. E-3 Pictures of Competition ................................................................................................... E-4 Smith Travel Research, Inc. ............................................................................................. E-5 Hotel Operational Data – Competitive Market Set .......................................................... E-8 Hotel Occupancy ....................................................................................................... E-11 Average Daily Rate ................................................................................................... E-12 Revenue Per Available Room ................................................................................... E-13 Trend Report ............................................................................................................. E-14 Smith Travel Research Comparative Trend Report ....................................................... E-15 Demand Analysis ........................................................................................................... E-34 Commercial Guest Demand ........................................................................................... E-34 Leisure Demand ............................................................................................................. E-34 Proposed Hotel Base Year ............................................................................................. E-35 Base Year and Projected Market Demand, Available Rooms and Occupancy ............. E-35 Summary ........................................................................................................................ E-36 PROPOSED FACILITIES AND SERVICES ...................................................... F-1 Site Plan ........................................................................................................................... F-2 Hotel Features .................................................................................................................. F-2 Room Mix ........................................................................................................................ F-3 Ascend Collection Hotel Membership ............................................................................. F-3 Summary .......................................................................................................................... F-4 Ascent Collection Hotel Membership .............................................................................. F-6 Inn at the Locks by the Ascend Collection Hotel Information ........................................ F-7 “The Soft Sell” of Soft Brands ...................................................................................... F-28 Environmental Concerns ................................................................................................ F-34

iii
PROJECTED UTILIZATION OF THE PROPOSED HOTEL ................................ G-1 Projected Market Penetration and Occupancy ................................................................ G-1 Market Penetration .......................................................................................................... G-5 Projected Average Room Rate ........................................................................................ G-6 Summary ......................................................................................................................... G-7 FINANCIAL PROFORMA ................................................................................. H-1 Proforma Year One ........................................................................................................ H-2 Rooms Department ......................................................................................................... H-3 Minor Departments ......................................................................................................... H-4 Total Hotel Payroll .......................................................................................................... H-4 Food & Beverage Department ........................................................................................ H-5 Administrative and General ............................................................................................ H-6 Food & Beverage Complimentary Services ................................................................... H-7 Sales and Marketing ........................................................................................................ H-8 National Fees .................................................................................................................. H-8 Utilities ............................................................................................................................ H-9 Repairs and Maintenance ................................................................................................ H-9 Five-Year Proforma ..................................................................................................... H-10 Upscale, Full-Service Hotels ........................................................................................ H-11 Trends in the Hotel Industry, USA Edition - 2014 ........................................................ H-12 Financial Assistance for Industry ................................................................................ H-111 Potential Financing Sources ........................................................................................ H-123 Lodging Guide to Management Companies ............................................................... H-138 INTERIM HOSPITALITY CONSULTANTS ........................................................ I-1 2008 Top Hotel Consultants Survey ................................................................................. I-3 Interim Hospitality Consultants Map ................................................................................ I-4 Selected Completed Projects ............................................................................................. I-5 Feasibility Study Client List ........................................................................................... I-15 Hotel Properties Assisted ................................................................................................ I-23 Brochure .......................................................................................................................... I-26 Letter of Agreement ....................................................................................................... I-27 APPENDIX Niagara USA – 2014 Travel Guide, Niagara Tourism and Convention Corporation...................................................................................................................... J-1

Lockport, New York, Feasibility Study Page A-1
INTRODUCTION Interim Hospitality Consultants was engaged to conduct a Feasibility Study with Financial Projections for a proposed Inn at the Locks Hotel to be located at 57 Richmond Avenue in Lockport, New York. The proposed hotel is to have all the amenities commensurate with an upscale, boutique hotel.
Objectives of Study
The basic objectives of the study were to:
1. Evaluate the market potential for the proposed hotel based on an analysis of the market support for a lodging facility on the subject site.
2. Comment on the appropriate number, types, and sizes of guest rooms and other
amenities which would best serve the needs of the market.
3. Project levels of market penetration, occupancy, and average room rate for the proposed hotel for the first five years of operations.
4. Prepare detailed projections of Cash Flow from operations before fixed charges for
the hotel for the first five years of operations.
5. Provide a written report containing the conclusions of the Feasibility Study and present Financial Projections for the proposed hotel.

Lockport, New York, Feasibility Study Page A-2
Scope of Study
The Feasibility Study included a variety of work steps which enabled us to evaluate historic trends and project the future competitive supply of and demand for lodging accommodations in the area. The scope of the work included, but was not necessarily limited to, the following:
1. An analysis and economic evaluation of the Lockport, New York, market area based on interviews with area businessmen and government officials, compilation of pertinent market data, and a review of those economic indices which would be most relevant to the success of the proposed project.
2. An inspection of the site and surrounding area to determine their suitability for the
proposed hotel, taking into consideration such factors as accessibility, visibility, and proximity to demand generators.
3. An inspection and analysis of the hotels in Lockport, New York, that would provide
the primary competition to the proposed hotel. Our census of the competitive facilities included existing hotels as well as those under construction, planned, or rumored.
4. A determination of the current overall market demand and rooms in the subject area
and the share of market demand that is generated by tourists, commercial travelers, and group meetings/ convention delegates.
5. A projection of growth rates for the various market segments based on the factors that
should impact the future demand for hotel rooms.
6. An evaluation of the projected hotel supply and demand relationship in the market area to reach conclusions regarding the market support for the proposed hotel.
7. Comment on the proposed facilities in terms of number, mix, and type of guest
rooms, and recreational amenities.
8. Comment on the proposed facilities in terms of style and size.
9. Projections of occupancy and average room rate for the proposed hotel, including projected market mix of guests.
10. Projections of cash flow from operations before fixed charges for the first five years
of operations.

Lockport, New York, Feasibility Study Page B-1
CONCLUSIONS The Market research and analysis, as described in this report, indicate that the composition, strength, and projected demand for lodging accommodations in Lockport, New York, are sufficient to support the proposed upscale boutique hotel, Inn at the Locks by the Ascend Collection Hotel of Choice Hotels International. Market Area Analysis (Section C) Lockport, New York in Niagara County is the county seat and the location of a number of historical and operational locks of the Erie Canal. The Erie Canal was the major transportation waterway for nearly one hundred years. Now it is a pleasure craft route across northern New York State. The new ice arena with two national Hockey league-size rinks opened in late 2014. The year-round facility will serve as an economic catalyst in its downtown location.

Lockport, New York, Feasibility Study Page B-2
The Business First Book of Lists of 2014, by American City Business Journal lists 23 industries in Lockport as leaders in various businesses. These firms provide the solid base of employment and economic growth for Lockport. Site and Area Evaluation (Section D) The growing year-round recreational visitor market and the stable business travel market have created a significant demand for new hotel rooms in the City of Lockport. There are viable and appealing sites for hotel developments in the 100-150 total room range in the City. Specifically, the vacant Dussault site lends itself well to a conference-type hotel adjacent to the new Cornerstone CFCU Hockey Arena. A total of three locations for Hotel Development were identified in the central business district of Lockport. See map on Page D-14: Site A: Adjacent to the new Ice Arena and the Erie Canal. Site B: Along the Erie Canal and Transit Street, Southwest Quadrant
Site C: At 57 Richmond Avenue in the conversion of an existing office building adjacent to the multi-lock system of the Erie Canal.
Due to the results of the findings of the Market Field Research, Site C has been identified as the initial location for Hotel Development. This historic and picturesque location is adjacent to a city park with a gazebo. A first-class boutique hotel will be successful at this unique location as the findings of this Feasibility Study come to fruition. Supply and Demand Analysis (Section E) As the City of Lockport does not have a first class hotel, the following hotels were combined to report their historical Occupancy and Average Daily Rate from January 2008 through October 2014.

Lockport, New York, Feasibility Study Page B-3
Hotel
City
Franchise Date
Date Opened
Number of Rooms
Comfort Inn Buffalo Lockport, NY Oct 1989 Oct 1989 50 Best Western Plus Lockport Hotel Lockport, NY Jul 2013 Jun 1971 95 Hampton Inn Buffalo Wiliamsville Williamsville, NY Jul 2002 Jul 2002 80 DoubleTree Buffalo Amherst Amherst, NY Jun 2012 May 1987 187 Comfort Inn University Amherst Amherst, NY Mar 2005 Jan 1986 102 Candlewood Suites Buffalo Amherst Amherst, NY Jun 2009 Jun 2009 76 Staybridge Suites Buffalo Amherst Amherst, NY Nov 2013 Nov 2013 102 Holiday Inn Buffalo Amherst Amherst, NY Apr 1967 Apr 1967 199 Total 891
Source: Smith Travel Research, Hendersonville, Tennessee
Market Trend Lockport, New York
Competitive Market Set
Year Occupancy Average Daily Rate
2008 59.3% $103.95 2009 55.5% $ 95.90 2010 60.7% $ 90.12 2011 64.2% $ 94.17 2012 69.3% $ 94.08 2013 66.5% $100.12 2014* 64.0% $100.00
Source: Smith Travel Research, Hendersonville, Tennessee *By factoring the 2013 November and December actual data, an occupancy of 64% for 2014 is projected at an Average Daily Rate of $100.00. This represents the past three years’ Average Occupancy of 66.7% at $98.67 ADR for the Lockport hotel market. The uniqueness of the upscale boutique hotel will have a marketing draw from Toronto, Canada to Syracuse, New York, to Pittsburgh, Pennsylvania to Cleveland, Ohio and all points within. Proposed Facilities and Services (Section F) The Market Research for this Feasibility Study has revealed that there is sufficient demand for a 40-room upscale, full-service hotel. The Market Research has selected the Inn

Lockport, New York, Feasibility Study Page B-4
at the Locks by the Ascend Collection, of Choice Hotels International. Other “soft” franchise firms include: • Autograph by Marriott • Premier Collection by Best Western • Curio by Hilton • RL Hotels by Red Lion Site Plan The 40-room Inn at the Locks to be located at 57 Richmond Avenue in Lockport, New York, will be oriented to provide ease of guest usage and feature a 40-person Meeting Room, an indoor swimming pool along with a Sun Deck, and an evening fire pit. The existing building is a three story structure, with a partial basement. Plans call for utilization of the basement and the addition of two stories to present five-story boutique hotel. The west side of the building will provide a motor entrance with a one-lane porte-co-chère. The east side of the building, adjacent to a city park with a gazebo will have a street level dining patio designed to provide access to the park. The north side of the property is the parking lot. The south side is the Erie Canal locks. Hotel Features • Elevator. A new elevator from the basement to the fifth floor is required. • Basement on lower level. The basement is under the oldest part of the
structure on the west side. Adjacent space seems to be available for the hotel housekeeping department, laundry drop from each floor, and building maintenance shop.
• Ground Floor. The ground floor will feature: 1. Hotel Lobby 2. Guest Registration at two office desks 3. Lobby Bar 4. Hotel Restaurant, open to the east side park 5. 40-person Meeting Room 6. Administrative offices 7. Hotel kitchen 8. The hotel “back door” is to the north parking lot

Lockport, New York, Feasibility Study Page B-5
• Second, Third and Fourth Floors Architectural Resources of Buffalo, New York, has proposed twelve rooms on
each floor, of adequate size for: 6 Queen bedrooms 1 Queen/Queen Bedroom 5 King bedrooms The guest room layout of a typical transient hotel. Possible consideration
should be given to update the design to eliminate the bathtub/shower in lieu of walk-in dual showers for two, added bath vanity counter space, hospitality center of refrigerator/freezer, microwave and coffee maker. In essence, design the guest rooms to emulate Curio by Hilton, Even by IHG, or Edition by Marriott.
A guest lobby is illustrated on each floor, which is an excellent space for a
Guest Library, Billiards Room, or Business Center on the three floors. • Fifth Floor, Roof Top The top floor will feature four king bedrooms/sofa parlor Executive Suites. An Aquatic Center of indoor pool, fitness center and sauna, all open to a
rooftop sun deck and evening fire pit facing to the southwest to feature the sunset.
Room Mix The Market Research for this Study revealed that 50% of the market is the commercial guest and 50% is leisure, as discussed in the Supply and Demand Section of this study.
Inn at the Locks by the Ascend Collection Lockport, New York
Proposed Room Mix 18 Queen Room
3 Queen/Queen Room 15 King Room
4 King Sofa Suite 40 Total Rooms
Source: Interim Hospitality Consultants Ascend Collection Hotel Membership The Ascend Collection program, as with all “soft” hotel brands, is not a traditional franchise concept. Ascend Collection is an upscale membership program that

Lockport, New York, Feasibility Study Page B-6
enables the individual hotel to retain its own name and signage, while utilizing the specific Choice Hotels resources which work best for the Inn at The Locks in Lockport, New York. The Ascend Collection Unique product class is a collection of properties which are as diverse as the collection itself. These upscale niche hotels are found in all markets from urban centers to small towns, and resort locations. They offer themed experiences (i.e., water park, log cabins, and ski lodge) that permeate through the entire property and includes themed-styled amenities with energetic guest service. The guest room FF&E packages are styled consistently with the themed experience with case goods and complete décor. The common area spaces reflect the local area and property’s identity, which includes design elements that are representative of this local feel. In addition to existing properties with significant local brand equity, there can be new construction properties in this class. These properties must have created their own brand identity and local marketing plans, such as the Inn at the Locks in Lockport, New York. Projected Utilization of the Proposed Hotel (Section G) Based upon the occupancy of the Inn at the Locks Hotel, the proposed hotel’s Total Market Penetration and underlying assumptions are summarized as follows: 1. Leisure: Due to the hotel being marketed as the number one quality product in the
upscale, full-service boutique hotel classification, the hotel’s projected penetration of fair market share will be at 100.0% over the five-year projection period.
2. Commercial: The fair market share of commercial business is projected to be at
100.0%. This can be achieved with a professional sales marketing effort. If for any reason the tourist business declines through seasonality or energy shortages, state and local commercial solicitation must be made to offset the decline.
3. Occupancy: The projected occupancy should be attainable if the property is built
as described, professionally operated in all facets, and business of the area continues to be positive. In years 3 to 5, additional competition may materialize to substantially reduce the projections.
These projections are based on estimates and assumptions developed in connection with the Feasibility Study. However, certain assumptions may not materialize, and unanticipated events and circumstances may occur; therefore, actual results achieved during the projection period may vary from the forecasts, and the variations may be material.

Lockport, New York, Feasibility Study Page B-7
Proposed
Inn at the Locks by the Ascend Collection Lockport, New York
Year
Occupancy
Average Daily Rate
Room Revenue
2017 60.0% $175.00 $1,537,200 2018 63.0% $180.00 $1,655,640 2019 65.0% $185.00 $1,755,650 2020 68.0% $191.00 $1,901,440 2021 70.0% $197.00 $2,013,340
Source: Interim Hospitality Consultants Financial Analysis (Section H) Projections of annual operating returns for the Inn at the Locks Hotel were prepared for five years, 2017 through 2021. The projections are based on the results of operations of comparable facilities and our conclusions regarding the environment in which the hotel would operate.
Proposed Inn at the Locks by Ascend Collection
Lockport, New York
Year Total
Revenue Net Operating Income Before Debt Service
2017 $2,572,880 $ 902,420 35.1% 2018 $2,740,130 $ 995,930 36.3% 2019 $2,874,570 $1,078,550 37.5% 2020 $3,073,820 $1,175,060 38.2% 2021 $3,218,340 $1,249,750 38.8%
Source: Interim Hospitality Consultants Choice Hotels International
Information on the Choice Hotels International brand is presented on the following pages.


Our brands.
Our resourc,*s.
Oun suppernt,
f ivmnything we d*
{t '* al l about ys{,{
m. m. m. @. @. m. M.@_ m. @1. I W_C H O I C E H O T E L S I N T E R N A T I O N A L @

"Strong brands
make for strong
investments and
being associated
with Choice Hotels
strengthens our
investment
portfolio."
A1 Pai.elBaywoocl HoteL,(
Choice Hotels International@ recognizes a great hotel franchise needs...
A Strong Brand
Choice Hotels@ has 10 popular brands, ranging from select-service upscale to economy, to a hotel membership program.
All value-engineered to make your investment as cost efficient as possible. All well positioned to maximize your return.
New Bui ld
Upsca le
4IttliiflIretrs--- - vffi,jmiW
Midsca le
Conversion
Extended Stay
Full Servlce Midscale Economy
@ffiffilMembership

Reservations Delivered
Our worldwide reservations system uses every available distribution channel to make it easy for guests to find your
hotel and make reservations. In 2008, our central reservations system provided more than $2 bil l ion system-wide in
gross room revenue."
Collaborative Support
Resources, services, systems, technology, training, operational and field iupport - all
designed to help you run your hotel franchise smoothly and efficiently, so you can create a(positive guest experience.
Powerful Marketing
We cover national marketing channels in the industry with a bold, coordinated effort that
includes aggressive sales programs, strategic partnerships, an award-winning guest loyalty
program and promotions backed by national advertising. All designed to drive reservations to your hotel.
An Experienced Franchisor, Focused on Your Interests
We are one of the largest franchise organizations in the world, with over 6,800 hotels open and under development. We
have over 65 years experience developing a franchise system that is dedicated entirely to you, your hotel... your bottom
line.
our management team, our suppori. staff at corporate, our fietd personnel, every person you call and everyone who
visits your property,.. our job is to l isten to you, respond to your needs, develop new and better ways to assist you.
We work together with your performance in mind.
' Figure is based on our accouni ing
records and has been compi led in
a manner consistent with general ly
acceptable account ing pr inciples.
It reflects the revenues delivered
through our Central Reservat ions
System in 2008, See appl icable
FDD dated Apri l 1,2009.

"Cho ice Hote ls
has power fu l ,
recogn ized
brands tha t
d e l i v e r g o o d
re se rva t ion s . "
Bruce Haase, Executive Vice President, Glotral Brand 0perations, Cholce Hotets lnternational
*eser.yat.iCIms
Choice Hote ls cent ra l reserva t ion sys tem (CRS) is des igned to make i t easy fo r any ind iv idua l , bus iness or g roup to f ind
in fo rmat ion , ge t ass is tance and to make book ings a t a l l our ho te ls . Rates , ava i lab i l i t y and ho te l spec i f i cs a re
automat ica l l y updated to a l l d is t r ibu t ion sys tems on a rea l t ime bas is th rough our p roper ty opera t ions sys tem,
ChoiceADVANTAGE.,.
, : , " l , ' I r , r : : i ' , . - , r i - O u r c o m p r e h e n s i v e ,
m u l t i l i n g u a l w e b s i t e a l l o w s g u e s t s t o m a k e
reserva t ions a t any Cho ice brand ho te l and prov ides
ins tan t access to searchab le in fo rmat ion about your
hote l , po in ts o f in te res t , address , amen i t ies , rou te
p lann ing and more . Cons idered one o f the bes t lodg ing s i tes in the U.S. , r t a lso o f fe rs a Bes t ln te rne t Rate Guarantee to
encour age on l ine book ing ,
' * # ' * ' ' d
E0fl.4Ci ' t0{Cfi" - We have proprietary cal l centers located around the world.rt l i rhr24/7
t rans la t ion serv ices fo r more than 100 languages, they are s ta f fed w i th t ra ined sa les agents
who de l i ver so l id convers ion ra tes .
! r t l e i i l l l e i i ) : l . ; i i r ' t : ! t j i , , : r i r r - C h o i c e H o t e l s h a s n e g o t i a t e d a g r e e m e n t s W i t h l e a d i n g t h i r d -
par ty In te rne t t rave l webs i tes . Th is p rov ides expanded reach and pr io r i t y pos i t ion ing fo r our
ho te ls on lead ing webs i tes such as Exped ia .com, Hote ls .com, Trave loc i ty .com,0rb i tz .com, Pr ice l ine .com and more .
' r , , , , , , , , 1 : i : , . , ' i l r , l l - , t : , , . - : ) - W e a l s o o f f e r s u p e r i o r c o n n e c t i v i t y w i t h
t rad i t i ' r r ra l d is tn l ru t ion channe ls , inc lud ing the major GDSs: SABREo, Wor ldspan ' , Amadeus 'and
Gal i l r :o " , v / l r l , :h ena l ) l t l s t rave l agents a round the wor ld to f ind and book your ho te l .0ur vas t
GDS re la t io r rsh i l l s and techno logy enab le us to max imize de l i very , m in imize complex i ty and reduce cos ts .
u
' F i g u r e i s b a s e d o n o u r
a c c o u n i j n g r e c o r d s a n d h a s b e e n
compiled in a manner consistent
with general ly acceptable
a c c o u n t i n g p r i n c i p l e s . I t r e t l e c t s
t h e r e v c n u e s d e l i v e r e d t h r o u q h
ra Central Reservat ions System in
2008. See appl icable FDD
d a t e d A p r i l 1 , 2 0 0 9 ." Source: Hitwise, February 2008
The leading of, l ine competi t ivej n t e l l i g e n c e s e r v i c e , H i t w i s e
rptures the usage and behavior ol

Operations Support
ChoiceADVANTAGE@ - Our property system combines our over 65 years experience in developing intell igentoperations with state-of-the-art technology to provide you with the resources you need to run an efficient hotel.Our system automates and improves everything from reservations to accounting. ChoiceCentral.com is our intranet sitethat enables you to access Choice systems and resources 24/7.
Procurement ServiceS - Choice Hotels created Procurement Services to help franchisees perform by providingpurchasing services that enhance brand consistency, help hotel owners navigate the complex purchasing process, andstrive to improve owner performance. Procurement Services helps Choice Hotels franchisees simplify their decisions byselecting qualif ied vendors who guarantee their products and services. We also provide field support of procurement
managers that guide franchisees through large projects such as renovations and new construction.
Iiaining
Bottom line, your management and staff need to know how to effectively run your hotel, maximize bookings, ensureguest satisfaction and enhance return. We offer these exceptional training options at our corporate trainingfacil i ty as well as training in your market or at your hotel:
. Hospitality 0perations Success Training (HOST)
. Choice Training Days - we provide professional trainers who focus on a variety of subjects, from sales toservice recovery and more within your region.
. ResCoach - a self-paced online program that trains your staff in reservation sales.
. Drivers Ed - a hotel training system designed to put managers in the drivers seat. Program focuses on the keydrivers 0f guest satisfaction and likelihood to recommend.
. Choiceuniversity.net featuring online classes for Choice Systems and other hotel related content.
. Training Hotline Number - 888.540.6345
For tht !ast 4 years, f*oite Hotel.-r Look hone a lrairing tnaqazine Toy 12S llr:sJ Prari:r:e Ar,rarC for if*s sa1e.$
training pro{ltarfi, wh.ich gues lieyanrl rcc}rdinq gties! ,ti4srs ta t:tderstatttiini.j eJttl r'espanding trt tfuejr ;rt,eds"'
Field Support
Choice Hotels provides support through Brand Performance Consultants (BPCs), who can assist your property in understandingbrand requirements and deliver advice for improving hotel performance. These skil led professionals offer purpose drivenconsuitations customized to your hotel needs, with a focus on raising guest service levels; strengthening revenues; andhelping you take full advantage of the many programs and init iatives Choice Hotels provides to increase the value ofvour franchise
"A call to my BPC
(Brand Performance
Consultant) and my
problem is solved...
the support
is there."
Davi(r Ai l t ler : ienV i cc P ros i c l c r r iDOnttr t iOn LOiJ! i i [ ! j : ] | .
' Awarded in 2006, 2007, 2008
and 2009. Training maqazine is
a development magazine that
advocates trainino and workforce

Bill Carlson, Senior Vice President, Marketing, Choice Hotels lnternational
l r " l , i " , ' l
r ' W e u s e a n a t i o n a l ,
m u l i i - b r a n d c a m p a i g n t h a t m a k e s t h e m o s t o f o u r a d v e r t i s i n g b u d g e t
to re in fo rce our imaqe and increase reserva t ions . 0ur mu l t i -b randed
promot iona l e f fo r ts focus on b ig impact na t iona l TV, rad io and consLrmer
magaz ines to reach the most peop le and make the grea tes t impress ion , as we l l as na t iona l banner and keyword buys on
m / i o r l n l p r n e t q i t c s l i r n e i e d i n n n l p n l i a l n r r p < l c
We a lso p lan a number o f e f fec t i ve na t iona l p romot ions each year , o f ten around our popu lar rewards program-
C h o i c e P r i v i l e g e s t o d r i v e i n c r e m e n t a l b u s i n e s s t o o u r h o t e l s .
, ' : - - lVe dr ive awareness and reserva t ions th rouqh
co op ad proqrams, emai l and d i rec t ma i l p rograms, wor ldwide d i rec to r ies ,
ra te p rograms ta rge t ing spec ia l marke t segments .
a n u m b e r o f c a m p a i g n s , i n c l u d i n g r e g i o n a l
g i f t cards , Ye l low Page d iscounts and spec ia l
Cho ice Hote ls
t h a t h i g h l i g h t
' - , j r l . t i i t t . - ' r ' i , r l r ' l r r i : : - 0 u r a w a r d - w i n n i n g g u e s t l o y a l t y p r o g r a m i s d e s i g n e d t o g e n e r a t e r e p e a t b u s i n e s s :
cHoicE pffiv[leges'REWABDS PROGRAI\I
l n add i t ion , a i r i ine rewards fo r 15 a i r l ine par tners a re ava i lab le a t Cho ice Hote l p roper t ies
0ur wor ldv . l ide sa les d iv is ion focuses on h igh-vo lume accoun is such as tour opera tors , t rave l
agents , meet ing p lanners and corpora te accounts .
h i g h p r o f i l e m u l t i b r a n d p r o m o t i o n a l a c t i v i t y i s b a l a n c e d w i t h c r e a t i v e s i n g l e b r a n d n a t i o n a l p r o m o t i o n s
the un ique benef i t s and key t rave l occas ions tha t each brand de l i vers .
' F i q u r c i s b a s e d o n o u r
accouf t inq records dndh : < h p p n . n m n l p , i l n :
manner cons is ten t wr th
generaL ly acceptab le
accouf t inE pr inc ip les . I t
re i lec ts the Sys tem Fee
in 2008. See app l icab le
F D D d a t e s A o r i l 1 , 2 0 0 9
" Cho ice ho te ls in U.S. ,
Canada, Europe, fy 'ex ico ,
Aus t ra las ia anr l the
Car ibbean par t i c ipa te
in these pro ! l rams.

C h o i c e H o t e l s I r r t e r n a t i o n a l , I r r c
F r a n c h i s e S a l e s & D e v e l o p n r e n t
1 0 7 5 0 C o l u m b i a P i k e
S i l v e r S p r i n g . M D 2 0 9 0 1
800 .5 47 ,0007
c ho i ceh o te l s f r a r r c h i se .con r
f rar tch ise, . . sa les @ c hoiceho te ls"cr . rnr
m. m* m, ffi, Gil. m. M.@- Eilm. Em, I w-C H O I C E H O T E L S I N T E R N A T I O N A L @
A copy of the Franchlse Disclosore Document may be obtained th.oogh contacting Choice Hotels International at 10750 Columbia Pike, Silver Spring, MD 20901.
CHI FADARO

@
CHOICE HOTELS'NEW BUILD BRANDSU-p,s--c-,aleCambria Suites'. : ,1 : . . : t :1 ' : - ;a . . : : : : : . . t . : .a . : : : ' . . . : . l . ] . . - l - , : : : t ' ; : : , : , , - : , ' , r1 , ' t , : :
Cambria Suites is the 100% new-construction, upscale, al l-suites hotel brand from
Choice Hotels' . With one of ihe best designed prototypes in the segment at a competit ive costper key, the Cambria Suites brand's unique blend of effortless sophistication and smart design
meets the expectations of a wide array of guests. Cambria Suites hotels offer the right mix of
amenit ies such as f lat panel TVs, state-of-the-art f i tness ceniers and healthy F&B options-al l
within a styl ish and contemporary atmosphere.
Midsca le
Comfort Suites': : l ' . . . ] : . . . . . ' ' : : : | : . . ' . . ' : . . ' . :
Comfort Suites is one of the leading performers in lodging today. The value-engineeredprototype offers an al l-suites product with attract ive investment and operating costs.
Comfort Suites hotels offer an rnvit ing design and modern amenit ies al l designed to enhance
returns, including 100% non-smoking suites. The strong name recognit ion and track record ol
high guest satisfact ion makes for an attract ive, new construction development opportunity.
Comfort Inn'. : : : , 1 : 1 1 ,
- 1 : 1 : . :
Comfor t Inn is the la rges t Cho ice Hote ls b rand and is one o f the indus t ry 's most va lued
brands . I t o f fe rs our owners and deve lopers a s t rong po ten t ia l re tu rn on inves tment
and cont inued growth th rough the endur ing equ i ty o f our f lagsh ip b rand and the low
deve lopment and opera t ing cos t mode ls . Comfor t lnn is des igned to make the most o fyour inves tment .
Sleep Inn'
Sleep Inn represents a strong return on investment proposit ion for owners and developers
looking for a new construction opportunity. I ts fresh product and aitract ive value are whatguests are looking for but what our competitors aren't developing. Sleep lnn is a simply
styl ish, unique brand that sets i tself apart from competit ive brands, attract ing valued
ouests and owners a l i ke .
Extende(,_SJey
MainStay Su i tes '
MainStay Suites is one of the industry's f i rst franchised midscale, extended stay hotel with
resideni ial amenit ies. I t provides a residential atmosphere and value-added amenit ies for
the special needs of long term guests at a reasonable cost. Mainstay Suites is posit ioned
to he lp max imize the re tu rn on inves tment due to the occupancy premiums. In add i t ion , the
value-engineered prototype is designed to help del iver a competit ive per room cost.
Suburban Extended Stay Hotel ', . ' , , ,
t , . . t . t - , : : . : . ' : , : :
Suburban Extended Siay Hotel is well posit ioned to lead the expansion of the upper economy
extended stay hotel segment.Offering the essentials of home at attract ive long-term rates.
This creates an appealing value designed to help keep occupancy rates high and operating
costs low.
t

CHOICE HOTELS CONVERSION BUILD BRANDSMidsca le
Clarion'
Clarion is a ful l-service conversion hotel chain that offers travelers a variety of hotel
s ty les and loca t ions , inc lud ing major c i t y cen ters . Deve lopers earn a sense o f d is t inc t ionthrough the fu l l spec t rum o f super io r fac i l i t i es , serv ices and ameni t ies a t an a f fo rdab lepr ice to bus iness and le isure t rave le rs .
Qual i t y '
Qual i t y i s one o f the most recogn ized brands in the lodg ing indus t ry . I t represents acos t e f fec t i ve convers ion oppor tun i ty fo r owners look ing to s t rengthen the i r pos i t ion
in the i r marke ts and dr ive re tu rns on ex is t ing assets by becoming a par t o f an endur ing
and respec ted brand. Known fo r i t s we l l -es tab l i shed proper t ies tha t p rov ide every th ingguests expec t , i t appea ls to bo th le isure and bus iness t rave ie rs .
Economy
E c o n o L o d g e '
Econo Lodge is our p remier economy brand and one o f the na t ion 's la rges t economy
hote l cha ins . I t de l i vers a g rea t convers ion oppor tun i ty w i th reasonab le f lex ib i l i t y .
I t o f fe rs gues ts comfor tab le , f resh , and a f fo rdab le lodg ing and prov ides deve lopers w i th
a we l l es tab l i shed, h igh va lue brand.
Rodeway Inn '
Rodeway Inn is our p remier budget b rand. I t p rov ides owners /deve lopers w i th a g rea t
en t ry convers ion oppor tun i ty in to the Cho ice Ho ie ls sys tem. l t s fee s t ruc tu re has
been des igned to a l low fo r the grea tes t f lex ib i l i t y fo r our f ranch isees o f fe r ing annua l
ear ly te rmina t ion r igh ts and s t ra igh t fo rward fees . F i rs t - t ime and exper ienced owners
apprec ia te ease o f ownersh ip w i th Rodeway Inn ho te ls .
A Network of Historic,Boutique and Unique Hotels
ffi. m. M. @. Eil. m. EWl.@_ ffi. @1. I W.,C H O I C E H O T E L S I N T E R N A T I O N A L @
#F.2691;cambr ia#F-4986;SuburbanEXtendedStay#F.5274;Ascendco| |ec t ion#F5980.Forca l i fo rn ia :THESEFRANcH|SESHAVEBEENREG|sTEREDUNDERTHEFRAOF THE STATE OF CALIFORNIA. SUCH REGISTMTION DOES NOT CONSTITUTE APPBOVAL, RECOMMENDATION OR ENDORSEMENT BY THE COMMISSIONER OF CORPORATIONS NOR A FINDINGBY THE COI\,4IVlISSIChoice Hotels International at 1 0750 Columbia Pike, Silver Spring, lvlD 20901 .O 2OOg Choice Hotels International. Inc. AII riqhts reserved. O9-7r9l09/Og ur- | | bhr
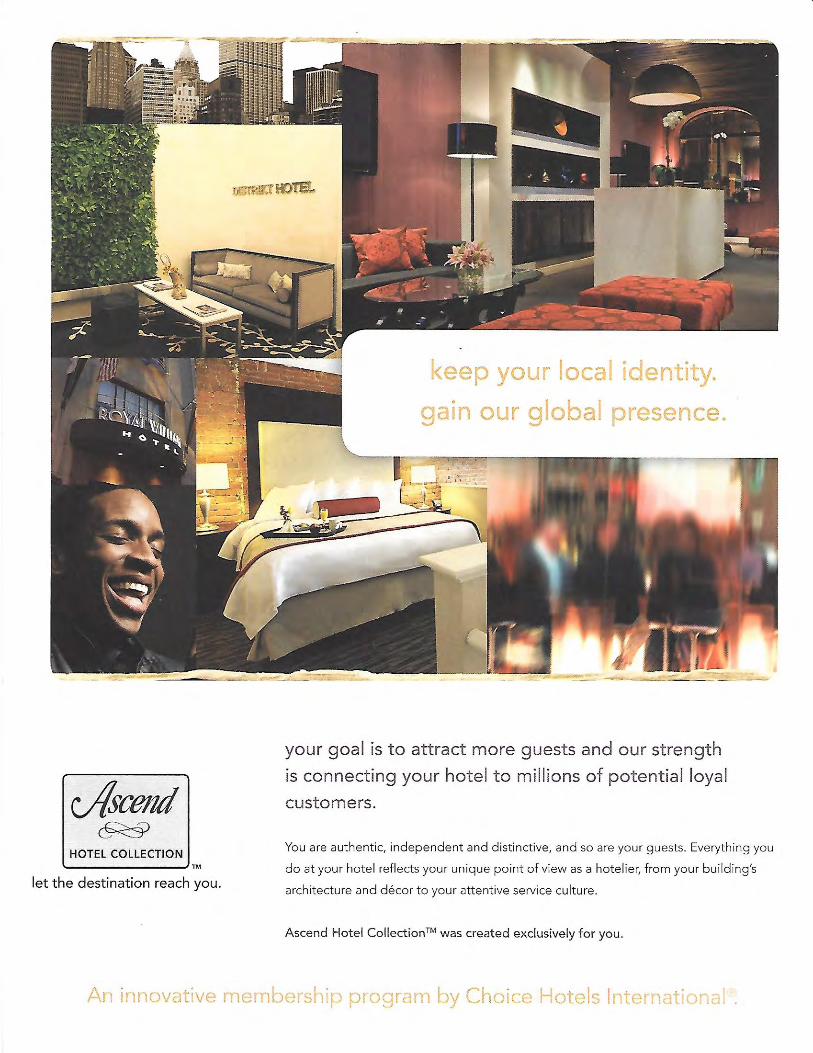
HOTEL MEMBERSHIPAscend Col lect ion'
The Ascend Co l lec t ion ho te l membersh ip p rogram by Cho ice Hote ls represents a d is t inc t
ownersh ip oppor tun i ty fo r independent ho ie l ie rs . Un l ike t rad i t iona l f ranch ise concepts ,
the Ascend Co l lec t ion members are ab le to re ta in the i r loca l iden t i t y , ind iv idua l i t y ands ignage wh i le benef i t inq f rom Cho ice Hote ls s t rong g loba l d is t r ibu t ion sys tem. Member
hote ls must embody one o f the th ree d is t inc t ca tegor ies - H is to r ic , Bout ique or Un ique.

AN INSIDE LOOK AT HOSPITALITY
CHOICE'S MARKETING POWERLike most brand company conventions
in this era of slow growth, Choice Hotelsconference in Las Vegas last month was short ona lot of hard news. Howeveq fascinating presentations byChoice executives Alexandra )aritz and Pat Pacious pulledback the curtain on the companys multi-layered, all-encompassing distribution and marketing efforts
Pacious, Choice's executive vice president of globalstrate€ty and operations, shared with the audience offi'anchisees the technologyand strategies behind the com-pany's distlibution platform that processed more tharlone billion shopping and booking transactions in April,up 49o/o over the previous April
Using the conference theme, Paclous showed howChoice is "all id' when it comes to developing andpromoting its online booking presence. In particular,the company is betting heavily on mobile transactions.Choice, which was the first hotel chain to introduce aniPhone app, released its app for the iPad last rnonth.
Senior Vice President Alexandra Jailh detaih (hoice's multi-layeredmarketing program.
mobile technology are paying dividends: more than onemillion smartphone owners have download the Choiceapp, and revenues through mobile platforms increasedby 250o/o last year. Of course, the system backbone isChoiceHotels.com, which hosted 100 million visitors lastyear and generated $1 billion in revenues.
Pacious also outlined plans for investment in new tech-nologies and programs. In April, the chain joined IHG asthe two hotel companies with best Internet rate guaran-tees, and last month it launched a pay-for-perforrnancesearch marketing program.
While Pacious outlined the ways Choice customersinteract with its brands, Iaritz shared the rationale andeconomic case for the company's marketing programsthat produce a billion marketing irnpressions each year.
"The porver of marketing isn t just in the eyes it reaches;it's in the nurnber behind the eyes," saidlaiq senior vicepresident of brand sftategy and marketing, in explaininghow Choice takes a statistics-based approach to market-ing. "lt doesnt work to get in front of as many people aspossible.You need to get the right product in front ofasmany of the right people at the right time through theright device at the right price, all with a limited budget."
The companytaps into the psychographics of its tmgetaudience to craft its marketing messages and vehicles.Ald while each of Choice's brand appeals to a slighdydifferent audience, there exists a target psychographicthe cornpany seeks to influence. According to )aritz, theChoice target guest is "the practical traveler." They rangein age from 35 to 60; they're middle incorne vnth 47o/oof them college graduates and most are rnarried. Notsurprisingly, theyre budget and value conscious, whichis why Choice nrarketing messages stress value-addedamenities like fiee breakfast and Internet access.
"Choice target guests are more likely than average hotelguesls to be 'do it yourseHers' and tlrey shop at HorneDepot and Lowes more than the average hotel guest]'said
|aritz, revealing why Choice buys TV time on DIY showslike "Sell This House" and "I Flate My Kitchen."
She said the cornpany uses a statistical tool calledMedia Mix Modeling to determine the best retum oninvestment for its spend in five mediums: TV print, radio,search and digital banner ads.
The marketing plan is built in layers: multi-brand TVads create the base, which combined with paid search anddigital balner ads produce the highest retum on invest-ment for the company. In addition, each hotel contrib-utes its own marketing effofts, and the guest experienceproperlies provide each customer helps bring them back.
TV is no longer the all-power{rl brand marketing toolit once was. AsJaitz erplained, today there are even twokinds of TV: the TV we all grew up with and TV online,which is growing explosively. - Ed Watkins
According to Pacious, those moves and others in
14 Lodging Hospital i ty / June 15,2012 LHon l ine .com

Lockport, New York, Feasibility Study Page C-1
MARKET AREA ANALYSIS* Overview Lockport is a city in Niagara County, New York. The name is derived from a set of Erie Canal locks within the city. Lockport is the county seat of Niagara County and is surrounded by the town of Lockport. It is part of the Buffalo-Niagara Falls Metropolitan Statistical Area. _________________ *The majority of the material contained in this section was obtained from:
1. Wikipedia Encyclopedia 2. City of Lockport, New York 3. Buffalo Business First, Western New York’s Business Newspaper

Lockport, New York, Feasibility Study Page C-2
History The construction of the Erie Canal was authorized by the New York State Legislature in April 1816. The route proposed by surveyors was to traverse an area in central Niagara County, New York, which was then “uncivilized” and free of White settlers. At the time, the nearest settlers were located in nearby Cold Springs, New York. As it became known where the proposed canal was to be built, land speculators began to buy large plots along and near the proposed route of the canal. By December 1820, when the exaction location of the stop locks had been determined, the whole area of what would eventually become Lockport was owned by only fifteen men, many of who were Quakers. The canal reached Lockport in 1824, but the locks were not completed until 1825. By 1829, Lockport had become an established village. The community was centered on the locks, and consisted mainly of immigrant Scottish and Irish canal workers, brought in as labor. The workers remained in Lockport after the completion of the locks, giving the city a heavy Celtic influence still discernible today, especially in the neighborhoods of Lowertown and North Lockport. The city of Lockport was officially incorporated in 1865. The Erie Canal was supplanted by the larger New York State Barge Canal in 1918, and the famous five “flight of five” locks was replaced by two much larger locks E34 and E35. The north “flight of five” lock chambers still remain as a spillway. In recent years public officials and private business have made an effort to incorporate Lockport history into regional if not a national tourist attraction. This includes the completion of the Canal Discovery Center. The Lockport Cave and Underground Boat Ride tour, and The Lockport Locks and Erie Canal Cruises. Currently, local officials are seeking state grants to reconstruct the historic “flight of five” and make it a living history site complete with boat rides and re-enactors. Published reports state that a living history site in Lockport marketed as a day trip from Niagara Falls could draw thousands to Lockport yearly. The city has a number of properties on the National Register of Historic Places. Geography According to the United States Census Bureau, the city has a total area of 8.6 square miles, of which, 8.5 square miles of it is land and 0.1 square miles of it is water. The Erie Canal passes through the center of the city, turning south toward Tonawanda Creek. It climbs the Niagara Escarpment through a series of two modern locks. Originally, a double set of five combined smaller locks were used.

Lockport, New York, Feasibility Study Page C-3

Lockport, New York, Feasibility Study Page C-4
Lockport is at the junction of several major truck roads, including NY Route 78 (Transit Road), NY Route 31, NY Route 77 and NY Route 93. It is 17 miles north of Interstate 90 via NY Route 78. Demographics At the census of 2010, there were 21,165 people, 9.153 households, and 5,172 families residing in the city. There were 10,092 housing units. The racial makeup of the city was 87.5% White, 7.2% Black or African American, 0.5% Native American, 0.5% Asian, 0.02% Pacific Islander, 0.8% from other races, and 3.5% from two or more races. Hispanic or Latino of any race were 3.2% of the population. Government The city is governed by a Mayor and a City Council. The Mayor is elected to a four-year term, the Aldermen to two-year terms. There are five wards in the city, resulting in five alderman plus one alderman-at-large, who is elected by the entire city. Economy Lockport’s largest employer is General Motors Components, the former Harrison Radiator Corporation, which was founded locally in 1912 and which became a division of General Motors Corporation in 1918. Following 10 years of ownership by Delphi Corporation as Delphi Thermal Systems, it returned to General Motors in October 2009. First Niagara Bank, founded in 1870 as Farmers & Mechanics Savings Bank, has grown to include branches throughout New York and Pennsylvania, and with the acquisition of New Alliance Bank based in New Haven, Connecticut in April 2011 became one of the largest regional banks in the country. Economic Development Lockport, New York is a dynamic community, with a progressive outlook and a business-friendly approach that makes locating your business or developing your project in the community a rewarding experience. Within a 10-mile radius of Lockport, there are: - 130,612 residents - 50,872 households - $80,211 average household income

Lockport, New York, Feasibility Study Page C-5
The residential market in the Lockport marketplace has continued to be strong. Anchored by quality public and private school systems, Lockport’s diverse housing market offers affordable, quality housing, which is becoming increasingly attractive to Erie County households. Among the most active subdivisions is the 127-unit Heather Woods Subdivision, located in the southern section of Lockport. Proposed for construction is the 70-unit Clarkview Estates, with another 38 units planned for Woods Hollow. Lockport’s manufacturing base has its roots in its Erie Canal heritage. As the long-time home of General Motors, the Lockport Industrial Development Agency established the Lockport Industrial Park in 1984 primarily as a means of attracting General Motors suppliers to locate closer to their customer, General Motors, as part of a just-in-time management philosophy. Today, the Town of Lockport Industrial Park consists of 400 acres. Of the 203 fully improved acres, approximately 52 acres are currently available for sale. The Lockport Industrial Park is owned by the Town of Lockport Industrial Development Agency, which is able to facilitate the site plan approval process as well as the sale of reasonably priced industrial-zoned land. The Industrial Park is a certified “Build Now – New York” site, and houses 16 small and medium size employers, which account for approximately 400 jobs including the new Yahoo! Datacenter project. Anchored by strong industrial and residential sectors, Lockport seeks to expand its retail sector. Lockport’s retail sector is in transition; the former 400,000 SF Lockport Mall is being replaced by a new WalMart Supercenter, located on Transit Road. Other major retail centers include the Home Depot Plaza, Big Lots Plaza, Tops Plaza and Office Max Plaza. The vision for the future of Lockport’s retail sector can be summed up in two words: Transit North. Transit North is a multi-community, architecturally-themed historic shopping district, which embraces the entire Transit Road Corridor, from the Erie County line north to Main Street in the City of Lockport.


Lockport, New York, Feasibility Study Page C-8
Lockport Cave and Underground Boat Ride The Lockport Cave and Underground Boat Ride will take you on one of the most unique tours in all America. Visitors will walk through a 1,700+ water power tunnel blasted out of solid rock and see artifacts left by miners on the Erie Canal over a century ago. The Hydraulic Race Company’s tunnel provided water power to three industries:
• Lockport Pulp Mill • Richmond Company • Holly Co.
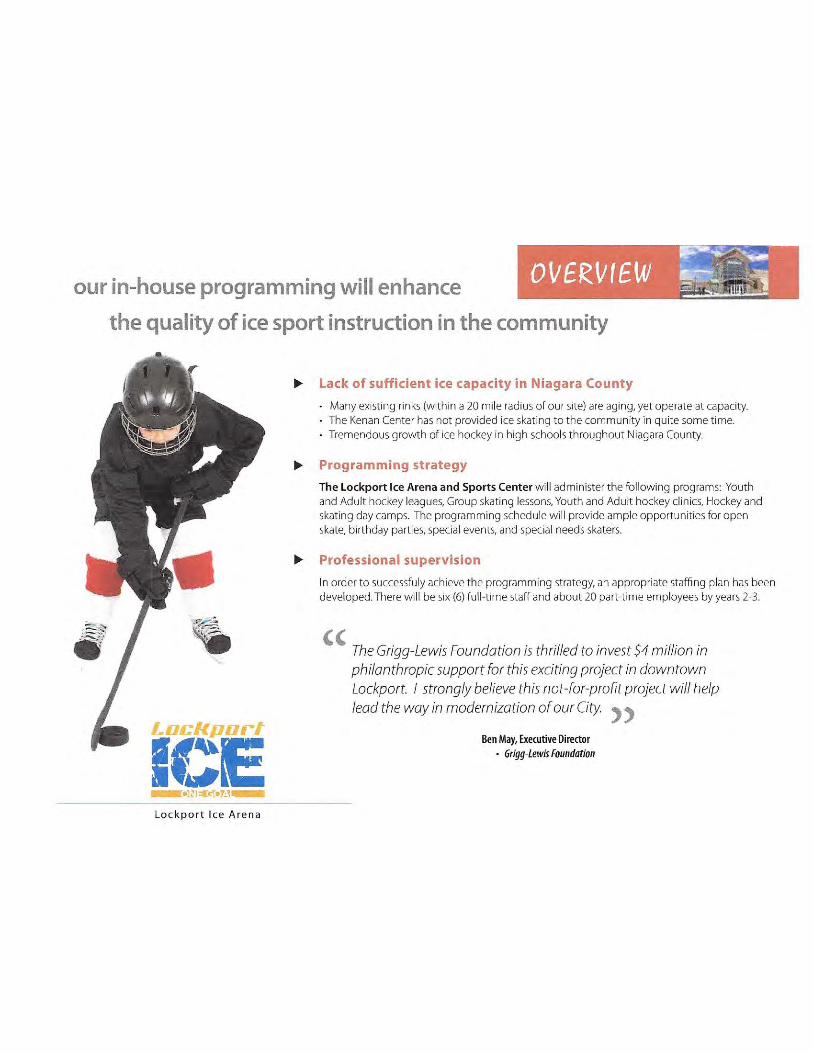
The tunnel was the invention of Birdsill Holly, a mechanical genius, whose inventions were manufactured using the water power from the tunnel. Holly’s many inventions include the life-saving fire hydrant, central steam heat, and the rotary pump. Holly held over 150 patents. Lockport Erie Canal Museum The Lockport Erie Canal Museum is located in an old lock control structure between the modern Locks 34 and 35, and the remaining original “Flight of Five” Locks spillway and contains historic photographs, maps, engineering drawings, and antique machinery. Canal Discovery Center The Canal Discovery Center is housed in an old church about 100 yards to the west of the locks. Lockport Ice Arena The Lockport Ice Area opened in November 2014. The arena features: Two National Hockey League-sized ice rinks Seating for 630 fans Performance Training Center Lockport Community Room The excellent facility is positioned for year-round use and is only three blocks from the hotel site. The arena development flyer is printed on the following pages.


Lockport, New York, Feasibility Study Page C-20

Lockport, New York, Feasibility Study Page C-21
Niagara County, New York Overview Niagara County is a county located in the State of New York. As of the 2010 census, the population was 216,469. The county seat is Lockport. The county name is from the Iroquois work Onguiaahra; meaning the strait or thunder of waters. It is the location of Niagara Falls and Fort Niagara, and has many parks and lake shore recreation communities. Niagara County is part of the Buffalo-Cheektowaga-Niagara Falls Metropolitan Statistical Area. Its Canadian border is the province of Ontario. History When counties were established in the New York colony in 1683, the present Niagara County was part of Albany County. This was an enormous county, including the northern part of New York State as well as all of the present State of Vermont and, in theory, extending westward to the Pacific Ocean. This county was reduced in size on July 3, 1766 by the creation of Cumberland County, and further on March 16, 1770 by the creation of Gloucester County, both containing territory now in Vermont. On March 12, 1772, what was left of Albany County was split into three parts, one remaining under the name Albany County. One of the other pieces, Tryon County, contained the western portion (and thus, since no western boundary was specified, theoretically still extended west to the Pacific). The eastern boundary of Tryon County was approximately five miles west of the present city of Schenectady, and the county included the western part of the Adirondack Mountains and the area west of the West Branch of the Delaware River. The area then designated as Tryon County now includes 37 counties of New York State. The county was named for William Tryon, colonial governor of New York. In the years prior to 1776, most of the Loyalists in Tryon County fled to Canada. In 1784, following the peace treaty that ended the American Revolutionary War, the name of Tryon County was changed to honor the general, Richard Montgomery, who had captured several places in Canada and died attempting to capture the city of Quebec, replacing the name of the hated British governor. In 1789, Ontario County was split off from Montgomery. In turn, Genesee County was created from Ontario County in 1802. Niagara County was created from Genesee County in 1808. It was, however, larger than the present Niagara County even though it consisted of only the Town of Cambria. From 1814 to 1817, records of Cattaraugus County were divided between Belmont (the seat of Allegany County) and Buffalo (then in Niagara County). In 1821, Erie County was created from Niagara County.

Lockport, New York, Feasibility Study Page C-22
Tuscarora Reservation The Tuscarora Reservation (Nyučirhéʼę in Tuscarora) is an Indian reservation in Niagara County, New York. The population was 1,152 at the 2010 census. The Tuscarora are a federally recognized tribe and the Sixth Nation of the Haudenosaunee or Iroquois Confederacy active before the American Revolutionary War. The Tuscarora tribe had migrated in ancient times from the New York area to the South, where they were based in the Carolinas. After extended conflict with European settlers and other Native Americans at the beginning of the 18th century and defeat in the Tuscarora War, most of the tribe migrated North, beginning in 1722. They first located in the territory of the Oneida tribe in central New York. By the early 1800s, they declared their tribe fully relocated and said that remnant Tuscarora who stayed in the South would no longer be considered part of the tribe. The Tuscarora and Oneida became allies of the American Continental cause during the American Revolution, and of the United States during the War of 1812. During both wars, they suffered attacks by British armed forces and their First Nations allies in central New York. The Tuscarora were given land from the Seneca tribe (territory which they had taken from the Neutral Nation) in 1797). In 1803, the US government granted the Tuscarora a reservation in Niagara County. In 1960, through the efforts of the powerful appointed official, Robert Moses of New York City, New York State seized 550 acres of the Tuscarora reservation to form a reservoir for the Robert Moses Niagara Power Plant operated by the New York Power Authority. New York needed 1,350 acres but only received 550 acres and had to pay $1,500 per acre per a United States Supreme Court Decision. This led to a displacement of tribal members and a serious disruption to their economy. After a lengthy court case and appeals, in 2003, the Power Authority agreed to compensate the tribe financially and return some unused land. The reservation is a composite holding derived from (1) land given to the tribe by the Seneca tribe, land donated by the Holland Land Company, and (3) Trust territory held by the federal government. Former University at Buffalo head football coach Frank Mount Pleasant was born on the reservation. Tonawanda Indian Reservation The Tonawanda Indian Reservation is an Indian reservation of the Tonawanda Band of Seneca Indians located in western New York State. The band is a federally recognized tribe and, in the 2010 census, had 693 people living on the reservation. Although most of the reservation lies in Genesee County, portions are within the boundaries of Erie and Niagara counties. It is bordered by the Towns of Alabama, Pembroke, Newstead, and Royalton.

Lockport, New York, Feasibility Study Page C-23
The Tonawanda Reservation is also known as the Tonawanda Creek Reservation. Currently, it has more than a half dozen businesses located on Bloomingdale Road within the reservation. Several sell untaxed, low-price cigarettes and gasoline. Other businesses sell Seneca craft goods, groceries, and prepared food. After various cultures of indigenous peoples succeeded each other in the Great Lakes area, in historic times, the five nations of the Iroquois coalesced. Before the mid-17th century, they had formed the Iroquois Confederacy. The Seneca were one of the Five Nations of the Haudenosaunee. The current location of the Tonawanda Reservation is believed to be close to the likely poorly-defined border between the historic Seneca homeland and its rivals, the Neutral Nation that occupied the Niagara Region at the time of French missionary Joseph de La Roche Daillon's arrival in the area in 1627. During the Beaver Wars of the 17th century, the Seneca invaded what is now Western New York, wiping out the Neutrals and other tribes in the region. The Iroquois pledged allegiance to the British Crown in the Nanfan Treaty. During the French and Indian War, the Iroquois and British defeated New France; the Iroquois and other native territory was placed in a massive Indian Reserve. During the American Revolutionary War, most of the Iroquois sided with the British Crown, as they hoped to end colonial encroachment; to this effect, the Iroquois led several massacres on colonial settlements, which provoked the Continental Army to respond with the scorched-earth Sullivan Expedition, wiping out much of the Senecas' already destitute homelands. After the Crown's defeat, some of the Seneca, along with other Iroquois, migrated with Joseph Brant to the Grand River reservation in the still British-controlled territory of upper Canada (now known as the province of Ontario). The majority of the Seneca People remained in what is now western New York, subsequently ceding lands through the Canandaigua Treaty of 1794 and the Treaty of Big Tree in 1797 which led to the reservations in western New York. In 1848, the Seneca Nation of Indians was formed to represent the Seneca as a federally recognized tribe. Due to a dispute over one of the Treaties of Buffalo Creek, in which the Seneca Nation had attempted to sell the Tonawanda land to the Ogden Land Company without the residents' permission, the Tonawanda Band of Seneca Indians was formed in 1857 to represent the Tonawanda territory. In contrast to the Seneca Nation of Indians, which uses an American-style republican form of government, the Tonawanda Band of Seneca Indians preserves the traditional Seneca practices, including selection of life chiefs by heritage. The Seneca of this reservation worked with self-taught anthropologist Lewis H. Morgan in mid-century to teach him about the Iroquois kinship and social structures. He published the results of his work in 1851 as The League of the Ho-de-no-sau-nee or Iroquois. His insights about the significance and details of kinship structure in Native American societies influenced much following anthropological and ethnological research. Much of the
Lockport, New York, Feasibility Study Page C-24
information was provided by his colleague and friend Ely S. Parker, a Seneca born on the reservation in 1828. Morgan dedicated his book to Parker and credited him with their joint research. Over the years, the size of the reservation has been reduced by sales of land to surrounding communities. Geography Niagara County is in the extreme western part of New York State, just north of Buffalo and adjacent to Lake Ontario on its northern border and the Niagara River and Canada on its western border. The primary geographic feature of the county is Niagara Falls, the riverbed of which has eroded seven miles south over the past 12,000 years since the last Ice Age. The Niagara River and Niagara Falls, are in effect, the drainage ditch for four of the Great Lakes which constitute the largest supply of fresh water in the world. The water flows north from Lake Erie, then through the Niagara River, goes over Niagara Falls, and then on to Lake Ontario and the St. Lawrence River, eventually emptying into the North Atlantic Ocean. Today, tourists and visitors to the Falls see a diminished flow of water over the Falls, since a portion of the flow has been diverted for hydroelectric power purposes. Both the American and Canadian side of the Niagara River have massive electrical power plants. The spectacular Niagara Gorge is the path Niagara Falls has taken over thousands of years as it continues to erode. Niagara Falls started at the Niagara Escarpment which cuts Niagara County in half in an East-West direction. North of the Escarpment lies the Lake Ontario plain, which is a fertile flatland that is used to grow grapes, apples, peaches and other fruits and vegetables. The grape variety Niagara, source of most American white grape juice but not esteemed for wine, was first grown in the county, in 1868. Viticulture, or wine culture has begun to take place, with several wineries below the escarpment. This has helped to improve the depressed economy of the region. To further capitalize on economic development, the state has created the Niagara Wine Trail. According to the U.S. Census Bureau, the county has a total area of 1,140 square miles, of which 523 square miles is land and 617 square miles (54.12%) is water.
Demographics As of the census of 2010, there were 216,469 people, 87,846 households, and 58,593 families residing in the county. The population density was 420 people per square mile. There were 95,715 housing units at an average density of 183 per square mile. The racial makeup of the county was 90.70% White, 6.15% Black or African American, 0.94% Native American, 0.58% Asian, 0.02% Pacific Islander, 0.40% from other races, and 1.21% from

Lockport, New York, Feasibility Study Page C-25
two or more races. 1.33% of the population were Hispanic or Latino of any race. 23.6% were of German, 18.1% Italian, 11.3% Irish, 11.2% Polish and 8.3% English ancestry. 94.5% spoke English, 1.6% Spanish and 1.0% Italian as their first language. There were 87,846 households out of which 30.90% had children under the age of 18 living with them, 50.30% were married couples living together, 12.30% had a female householder with no husband present, and 33.30% were non-families. 28.60% of all households were made up of individuals and 12.00% had someone living alone who was 65 years of age or older. The average household size was 2.45 and the average family size was 3.03. In the county the population was spread out with 24.70% under the age of 18, 8.50% from 18 to 24, 28.40% from 25 to 44, 23.10% from 45 to 64, and 15.40% who were 65 years of age or older. The median age was 38 years. For every 100 females there were 93.30 males. For every 100 females age 18 and over, there were 89.50 males. The median income for a household in the county was $38,136, and the median income for a family was $47,817. Males had a median income of $37,468 versus $24,668 for females. The per capita income for the county was $19,219. About 8.20% of families and 10.60% of the population were below the poverty line, including 15.00% of those under age 18 and 7.30% of those aged 65 or over. Education Educational resources in Niagara County include ten public school districts, Niagara University, Niagara County Community College (NCCC), the NIOGA Public Library system, the Board of Cooperative Educational Services (BOCES) system, and 19 private schools, most of which are affiliated with religious institutions. Many schools are located in the historically developed urban areas of the County in and around the cities of Niagara Falls, North Tonawanda and Lockport. Fewer schools are located in the rural towns, but as the County population continues to shift northward, the potential need for additional schools and related educational facilities in suburban and rural areas exists as well. As a result of shifting populations, urban school districts like those in Niagara Falls have accommodated the reuse of school facilities that are no longer needed due to decreases in local population and enrollment. Niagara County provides financial support to Niagara County Community College and the NIOGA Library System, and operates several job training programs, the County Youth Bureau, education programs in public schools for children with disabilities, and recreation programs.

Lockport, New York, Feasibility Study Page C-26
Higher Education Niagara University Niagara University is a Catholic university in the Vincentian tradition, located in Lewiston, New York. Niagara has 3,300 undergraduate students in 50 academic programs. Approximately half of the students are residents, while the other half commutes from the surrounding area. The college is known as a liberal arts school, but offers programs in technical and pre-professional disciplines as well. Niagara County Community College Niagara County Community College (NCCC) is located in Sanborn, New York. NCCC offers associate’s degrees in many programs. Dual admissions programs facilitate transfer to four-year colleges upon completion of the two-year degree programs. Many Niagara County residents also attend Erie and other Western New York County Schools. In the Buffalo Metro area there more than 20 public and private colleges and universities in Buffalo and its environs offer programs in technical and vocational training, graduate, and professional studies. Healthcare DeGraff Memorial Hospital DeGraff Memorial Hospital was established in 1914 to serve the healthcare needs of Buffalo’s Northtown Communities. Conveniently located in North Tonawanda on the border of Erie and Niagara Counties – and just five minutes from the city of Buffalo – the hospital has a team of skilled health care professionals dedicated to providing quality, compassionate, personalized care for patients with a broad range of inpatient and outpatient health needs. DeGraff is dedicated to excellence through state of the art technology, exceptional physicians and staff, ranking the hospital among the best in the delivery of overall patient satisfaction. From critical to long term care, from orthopedics to rehabilitation, DeGraff provides a full spectrum of Services. Surgical specialities include retina, gastroenterology, orthopaedics, and urology. All part of the Kaleida Health System, the largest health care provider in western New York State, DeGraff has established an identify with a difference.


Lockport, New York, Feasibility Study Page C-29
Economy Power
Hydroelectric power dam at the
Robert Moses Generating facility, Lewiston, New York
The enormous energy of Niagara Falls has long been recognized as a potential source of power. The first known effort to harness the waters was in 1759, when Daniel Joncaire built a small canal above the falls to power his sawmill. Augustus and Peter Porter purchased this area and all of American Falls in 1805 from the New York state government, and enlarged the original canal to provide hydraulic power for their gristmill and tannery. In 1853, the Niagara Falls Hydraulic Power and Mining Company was chartered, which eventually constructed the canals that would be used to generate electricity. In 1881, under the leadership of Jacob Schoellkopf, Niagara River's first hydroelectric generating station was built. The water fell 86 feet and generated direct current electricity, which ran the machinery of local mills and lit up some of the village streets. The Niagara Falls Power Company, a descendant of Schoellkopf's firm, formed the Cataract Company headed by Edward Dean Adams, with the intent of expanding Niagara Falls power capacity. In 1890, a five-member International Niagara Commission headed by Sir William Thomson among other distinguished scientists deliberated on the expansion of Niagara hydroelectric capacity based on seventeen proposals, but could not select any as the best combined project for hydraulic development and distribution. In 1893, Westinghouse Electric (who had built the smaller scale Ames Hydroelectric Generating Plant near Ophir, Colorado two years earlier) was hired to design a system to generate alternating current on Niagara Falls, and three years after that this large scale AC power system was created (activated on August 26, 1895). The Adams Power Plant Transformer House remains as a landmark of the original system. By 1896, with financing from moguls like J.P. Morgan, John Jacob Astor IV, and the Vanderbilts, they had constructed giant underground conduits leading to turbines generating upwards of 100,000 horsepower, and were sending power as far as Buffalo, 20 miles away. Some of the original designs for the power transmission plants were created by the Swiss firm Faesch & Piccard, which also constructed the original 5,000 HP waterwheels.

Lockport, New York, Feasibility Study Page C-30
Private companies on the Canadian side also began to harness the energy of the falls. The Government of the province of Ontario, Canada eventually brought power transmission operations under public control in 1906, distributing Niagara's energy to various parts of the Canadian province. Other hydropower plants were also being built along the Niagara River. But in 1956, disaster struck when the region's largest hydropower station was partially destroyed in a landslide. The landslide drastically reduced power production and tens of thousands of manufacturing jobs were at stake. In 1957, Congress passed the Niagara Redevelopment Act, which granted the New York Power Authority the right to fully develop the United States' share of the Niagara River's hydroelectric potential. In 1961, when the Niagara Falls hydroelectric project first went on line, it was the largest hydropower facility in the Western world. Today, Niagara is still the largest electricity producer in New York State, with a generating capacity of 2.4 gigawatts (million kilowatts). Up to 375,000 U.S. gallons of water a second is diverted from the Niagara River through conduits under the City of Niagara Falls to the Lewiston and Robert Moses power plants. Currently between 50% and 75% of the Niagara River's flow is diverted via four huge tunnels that arise far upstream from the waterfalls. The water then passes through hydroelectric turbines that supply power to nearby areas of Canada and the United States before returning to the river well past the falls. This water spins turbines that power generators, converting mechanical energy into electrical energy. When electricity demand is low, the Lewiston units can operate as pumps to transport water from the lower bay back up to the plant's reservoir, allowing this water to be used again during the daytime when electricity use peaks. During peak electrical demand, the same Lewiston pumps are reversed and actually become generators, similar to those at the Moses plant. To preserve Niagara Falls' natural beauty, a 1950 treaty signed by the U.S. and Canada limited water usage by the power plants. The treaty allows higher summertime diversion at night when tourists are fewer and during the winter months when there are even fewer tourists. This treaty, designed to ensure an "unbroken curtain of water" is flowing over the falls, states that during daylight time during the tourist season (April 1 to October 31) there must be 100,000 cubic feet per second of water flowing over the falls, and during the night and off-tourist season there must be 50,000 cubic feet per second of water flowing over the falls. This Treaty is monitored by the International Niagara Control Board. During winter the Power Authority of New York works with Ontario Power Generation, to prevent ice on the Niagara River from interfering with power production or causing flooding of shoreline property. One of their joint efforts is an 8,800-foot long ice boom, which prevents the buildup of ice, yet allows water to continue flowing downstream. The most powerful hydroelectric stations on the Niagara River are the Sir Adam Beck 1 and 2 on the Canadian side and the Robert Moses Niagara Power Plant and the Lewiston Pump Generating Plant on the American side. Together, Niagara's generating stations can produce about 4.4 gigawatts of power.

Lockport, New York, Feasibility Study Page C-31
In August 2005 Ontario Power Generation, which is responsible for the Sir Adam Beck stations, started a major civil engineering project, called the Niagara Tunnel Project, to increase power production by building a new 42-foot diameter, 6.3 mile-long water diversion tunnel. It was officially placed into service in March 2013, helping to increase the generating complex's nameplate capacity by 150 megawatts. It did so by tapping water from farther up the Niagara River than was possible with the preexisting arrangement. The tunnel provided new hydroelectricity for approximately 160,000 homes. Preservation of the Falls Niagara Falls has long been a source of inspiration for explorers, travelers, artists, authors, filmmakers, residents and visitors, few of whom realize that the falls were nearly to be solely devoted to industrial and commercial use. In the 1870s, sightseers had limited access to Niagara Falls and often had to pay merely for a glimpse, and industrialization threatened to carve up Goat Island in an effort to further expand commercial development. Other industrial encroachments and lack of public access led to a conservation movement in the U.S. known as Free Niagara, led by such notables as Hudson River school artist Frederic Edwin Church, landscape designer Frederick Law Olmsted, and architect Henry Hobson Richardson. Mr Church approached Lord Dufferin, governor-general of Canada, with a proposal for international discussions on the establishment of a public park.
Niagara Fälle. Les chûtes du Niagara. Niagara Falls (circa 1832):
aquatint by Karl Bodmer from the book "Maximilian, Prince of Wied’s Travels in the Interior of North America,
during the years 1832–1834"

Lockport, New York, Feasibility Study Page C-32
Albert Bierstadt's (1830–1902)
oil painting of Niagara Falls Goat Island was one of the inspirations for the American side of the effort. William Dorsheimer, moved by the scene from the island, brought Olmsted to Buffalo in 1868 to design a city park system and helped promote Olmsted's career. Later, in 1879, the New York state legislature commissioned Olmsted and James T. Gardner to survey the falls and to create the single most important document in the Niagara preservation movement, a Special Report on the preservation of Niagara Falls. The report advocated for State purchase, restoration and preservation through public ownership of the scenic lands surrounding Niagara Falls. Restoring the former beauty of the falls was described in the report as a "sacred obligation to mankind." In 1883, Governor Grover Cleveland drafted legislation authorizing acquisition of lands for a state reservation at Niagara and The Niagara Falls Association, a private citizens group founded in 1882, mounted a great letter writing campaign and petition drive in support of the park. Professor Charles Eliot Norton and Olmsted were among the leaders of the public campaign, while New York Governor Alonzo Cornell opposed. Preservationists' efforts were rewarded on April 30, 1885, when Governor David B. Hill signed legislation creating the Niagara Reservation, New York's first state park. New York State began to purchase land from developers, under the charter of the Niagara Reservation State Park. In the same year, the province of Ontario established the Queen Victoria Niagara Falls Park for the same purpose. On the Canadian side, the Niagara Parks Commission governs land usage along the entire course of the Niagara River, from Lake Erie to Lake Ontario. In 1887, Olmsted and Calvert Vaux issued a supplemental report detailing plans to restore the falls. Their intent was "to restore and conserve the natural surroundings of the Falls of Niagara, rather than to attempt to add anything thereto", and the report anticipated fundamental questions. How would preservationists provide access without destroying the

Lockport, New York, Feasibility Study Page C-33
beauty of the falls? How would they restore natural landscapes damaged by man? They planned a park with scenic roadways, paths and a few shelters designed to protect the landscape while allowing large numbers of visitors to enjoy the falls. Commemorative statues, shops, restaurants, and a 1959 glass and metal observation tower were added later. Preservationists continue to strive to strike a balance between Olmsted's idyllic vision, and the realities of administering a popular scenic attraction. Preservation efforts continued well into the 20th century. J. Horace McFarland, the Sierra Club, and the Appalachian Mountain Club persuaded the United States Congress in 1906 to enact legislation to preserve the falls by regulating the waters of Niagara River. The act sought, in cooperation with the Canadian government, to restrict diversion of water, and a treaty resulted in 1909 that limited the total amount of water diverted from the falls by both nations to approximately 56,000 cubic feet per second. That limitation remained in effect until 1950. Erosion control efforts have always been of extreme importance. Underwater weirs redirect the most damaging currents, and the top of the falls have also been strengthened. In June 1969, the Niagara River was completely diverted away from the American Falls for several months through construction of a temporary rock and earth dam While the Horseshoe Falls absorbed the extra flow, the U.S. Army Corps of Engineers studied the riverbed and mechanically bolted and strengthened any faults they found; faults that would, if left untreated, have hastened the retreat of the American Falls. A plan to remove the huge mound of talus deposited in 1954 was abandoned owing to cost, and in November 1969, the temporary dam was dynamited, restoring flow to the American Falls. Even after these undertakings, Luna Island, the small piece of land between the main waterfall and the Bridal Veil, remained off limits to the public for years owing to fears that it was unstable and could collapse into the gorge at any time. Commercial interests have continued to encroach on the land surrounding the state park, including the construction of several tall buildings (most of them hotels) on the Canadian side. The result is a significant alteration and urbanization of the landscape. One study indicated it has caused the airflow near the falls to change direction. Students at the University of Guelph demonstrated, using scale models that as air passes over the top of the new hotels it causes a breeze to roll down the south sides of the buildings and spill into the gorge below the falls, where it feeds into a whirlpool of moisture and air. The inference was that a documented rise in the number of "mist days" was a result of these breezes, where mist days refers to the mist plume of the falls reaching landside. In 1996 there were 29 mist days recorded, but by 2003 that number had risen to 68. Another study has discounted this opinion and linked mist production primarily to the difference in air and water temperature at the falls. However, this study does not offer opinion as to why mist days have been increasing, just that the hotel breezes are an unlikely cause. In 2013 New York State initiated an effort to renovate The Sisters Islands located on Goat Island. New York State used funds secured from the re-licensing of the New York Power Authority hydro electric plant down river in Lewiston New York to re-do walking

Lockport, New York, Feasibility Study Page C-34
paths on the Three Sisters Islands and plant native vegetation on the islands. The State also renovated the area around Prospect Point at the brink of the American Falls in the State Park. Workforce Buffalo Niagara Enterprise as an organization is responsible for attracting companies to the eight counties comprising Western New York, including Niagara County. By focusing on key industries that complement the region’s strengths the organization is able to translate its business development and marketing efforts into real jobs and investments. The following companies form an integral part of this organization and contribute to the economic development of Niagara County and the county seat of Lockport. Advertising Agencies: Name Employees Primary Clientele or Products J. Fitzgerald Group 12 W. Main Street Lockport, NY 14094 $1.51 million 2012 gross income
12 full-time UB Orthopaedics, Eastern Niagara Health System, Crosby’s Stores
Web Design Firms J. Fitzgerald Group 12 W. Main Street Lockport, NY 14094
UB Orthopaedics and Sports Medicine Volvo Construction Equipment Delta Air Lines
Printers Gooding Co., Inc. 5568 Davison Road Lockport, NY 14094
36 full-time GMP/FDA compliant inserts, outserts, instruction sheets and manuals for pharmaceutical, medical devices
The Zenger Group, Inc. 777 East Park Drive Tonawanda, NY 14150
110 full-time 9 part-time
Direct mail, catalogs, brochures, publications, packaging, secure variable-data direct mail
Trucking and Logistics Firms Productive Transportation, In. 530 Grand Island Boulevard Tonawanda, NY 14150
45 full-time Complete transportation and logistics services, freight brokerage, trucking, warehousing, LTL, flatbed, truckload
Double Down Transport NY, Inc. 701 Ensimger Road Tonawanda, NY 14150
24 full-time Reefer, van, flatbed transportation company
Energy Companies NOCO Energy Corp. 2440 Sheridan Drive Tonawanda, NY 14150
625 Natural gas, electricity, heating oil, propane, gasoline, diesel, motor oils and lubricants, heating and cooling
NRG Energy, Inc. 3500 River Road Tonawanda, NY 14150
160
Electricity
Building Controls & Services, Inc. 4 Peuquet Parkway Tonawanda, NY 14150
90 Electricity, natural gas, solar, wind, energy conservation services, performance contracting, smart/green building solutions and building commissioning

Lockport, New York, Feasibility Study Page C-35
Environmental Services Companies The Environmental Service Group 177 Wales Avenue Tonawanda, NY 14150
35 Hazardous waste, specialty material recycling, construction remediation
Rubberform Recycled Products, LLC 75 Michigan Street Lockport, NY 14094
22 Manufacturer of green products made from recycled scrap-tire rubber and recycled plastic
Manufacturers GM Components Holdings, LLC 200 Upper Mountain Road Lockport, NY 14094
1,411 Climate control and powertrain cooling systems and components
Praxair, Inc. 175 East Park Drive Tonawanda, NY 14150
1,125 Supplies atmospheric, process and speciality gases and high-performance coatings
Goodyear Dunlop Tires/North America Ltd 10 Sheridan Road Tonawanda, NY 14150
1,100 Original equipment and replacement tires
Staffing Agencies Remedy Intelligent Staffing 2309 Eggert Road Tonawanda, NY 14150
44 Manufacturing, logists/distribution, administrative, call center, customer service
Mortgage Bankers and Brokers Cornerstone Community FCU 6485 S. Transit Road Lockport, NY 14094
232
Credit Unions Cornerstone Community FCU 6485 S. Transit Road Lockport, NY 14094
232
Life Science Companies IMA Life North America, Inc. 2175 Military Road Tonawanda, NY 14150
136 Liquid powder, aseptic and non-aseptic processing machinery
SR Instruments, Inc. 600 Young Street Tonawanda, NY 14150
60 OEM manufacturer of patient weighing systems; manufacturer of scales for hospitals, clinics, vet practices, zoos, aquariums and water parks
Multi-generation Family Businesses William C. Rott & Son, Inc. 454 Young Street Tonawanda, NY 14150
35-45 Roofing, roof cleaning, siding, replacement and storm windows and doors, gutters, and gutter cleaning
Finger Lakes Technologies Group, Inc. 908 Niagara Falls Boulevard North Tonawanda, NY 14120
105 Voice services, fiber internet services, Cisco solutions, networking, video, paper record storage, data center solutions, disaster recovery services
Scapelliti’s Super Store 7084 Chestnut Ridge Road Lockport, NY 14094
11 Fresh meats, cold cuts, pastries, pizza, wings, subs, fish fry, beer, soda, lottery and gas
Hospitals Eastern Niagara Hospital 521 East Avenue Lockport, NY 14094

Lockport, New York, Feasibility Study Page C-36
Hospital Emergency Departments DeGraff Memorial Hospital 445 Tremont Street North Tonawanda, NY 14120
Nursing Homes Northgate Health Care Facility 7264 Nash Road North Tonawanda, NY 14120
Sheridan Manor Nursing Home, LLC 2799 Sheridan Drive Tonawanda, NY 14150
Briody Health Care Facility 909 Lincoln Avenue Lockport, NY 14094
Retirement Communities Woodlands Residential Village 3959 Forest Parkway North Tonawanda, NY 14120
Independent Living
People, Inc. Senior Living Pine Apartments 6231 Tonawanda Creek North Lockport, NY 14094
Pinegrove Estates 5726 Bowmiller Road Lockport, NY 14094
Independent Adult Living Villas
Physical Therapy Facilities DeGraff Memorial Hospital 445 Tremont Street North Tonawanda, NY 14120
Eastern Niagara Health System 521 East Avenue Lockport, NY 14094
Odd Fellow & Rebekah Rehabilitation Center 104 Old Niagara Road Lockport, NY 14094
Public Companies First Niagara Financial Group, Inc. 6940 S. Transit Road Lockport, NY 14095
5,927
Taylor Devices, Inc. 90 Taylor Drive N. Tonawanda, NY 14120
106
Ronco Communications 595 Sheridan Drive Tonawanda, NY 14150
145 Communication Specialists
Superior Lubricants Co., Inc. 32 Ward Road North Tonawanda, NY 14120
98 Distribution of motor oil, lubricants, automotive parts and washer solvents
Intertech Digital Entertainment, Inc. 6523 S. Transit Road Lockport, NY 14094
295 Satellite sales, real estate development
Safespan Platform Systems, Inc. 252 Fillmore Avenue Tonawanda, NY 14150
82 Sale and rental of bridge platforms and scaffolding

Lockport, New York, Feasibility Study Page C-37
Aero Instruments & Avionics, Inc. 7290 Nash Road North Tonawanda, NY 14120
107 Repair and certification of avionics componenets
Audubon Machinery Corp. 814 Wurlitzer Drive North Tonawanda, NY 14120
48 Manufacturer of oxygen systems and industrial washing equipment
Largest Employers The County of Niagara 175 Hawley Street Lockport, NY 14094
1,554 County government
GM Components Holdings, LLC 300 Upper Mountain Road Lockport, NY 14094
1,411 Manufactures climate control and powertrain cooling systems and components
Praxair, Inc. 174 E. Park Drive Tonawanda, NY 14150
1,125 Atmospheric process and specialty gases and high-performance coatings
Goodyear Dunlap Tires North America LTD 10 Sheridan Road Tonawanda, NY 14150
1,110 Original equipment and replacement tires
NOCO Energy Corp. 2440 Sheridan Drive Tonawanda, NY 14150
650 Family-owned and locally operated energy supplier and distributor
North Tonawanda City School District 175 Humphrey Street North Tonawanda, NY 14120
565 Public school district
John W. Danforth Co. 300 Colvin Woods Parkway Tonawanda, NY 14150
550 General contractor for mechanical systems
Women-Owned Businesses Weydman Electric, Inc. 747 Young Street Tonawanda, NY 14150
196 Electrical and communications contractor
Innovative Mechanical Systems, Inc. 633 Young Street Tonawanda, NY 14150
26 Mechanical contractor, sheet metal fabrication, design, build, HVAC service, temperature controls
Productive Transportation, Inc. 530 Grand Island Boulevard Tonawanda, NY 14150
25 Freight brokerage specializing in truckload, LTL, flatbed, refrigerated freight, and warehousing
Botanicus, Inc. 523 Fillmore Avenue Tonawanda, NY 14150
12 Interior landscaping
Grandview Construction, Inc. 167 Young Street Tonawanda, NY 14151
12 General contractor
Wheatfield Family Dentistry 3349 Niagara Falls Boulevard North Tonawanda, NY 14120
12 Family dental practice
BXI Consultants 33 Peuquet Parkway Tonawanda, NY 14150
10 Sales and service of printers/scanners/copiers, managed print services
Fast Track Companies Jameson Electric Heating & Air 525 Wheatfield Street North Tonawanda, NY 14120
12

Lockport, New York, Feasibility Study Page C-38
John W. Danforth Co. 300 Colvin Woods Parkway Tonawanda, NY 14150
450
Audubon Machinery Corp. 814 Wurlitzer Drive North Tonawanda, NY 14120
48
Million-Dollar Nonprofits New Directions Youth & Family Services, Inc. 6395 Old Niagara Road Lockport, NY 14094
519 Social welfare
Large Commercial Space Young Street Commons 555-740 Young Street Tonawanda, NY 14150
Warehouse/industrial
Weinheimers 1888 Niagara Falls Boulevard Tonawanda, NY 14150
Warehouse distribution center
Top Contractors D.R. Chamberlain Corp. 50 Simonds Street Lockport, NY 14094
30 Towne Mini dealership; Trek, Inc.
Grandview Construction, Inc. 167 Young Street Tonawanda, NY 14150
12
Economic Development Agencies Lumber City Development Corp. 500 Wheatfield Street North Tonawanda, NY 14120
25
City of Niagara Falls Economic Development 745 Main Street Niagara Falls, NY 14305
Greater Lockport Development Corp. One Locks Plaza Lockport, NY 14094
112
Commercial Developers TM Montante Development, LLC 2760 Kenmore Avenue Tonawanda, NY 14150
Architectural Firms DesignSynergies Architecture PC 7 Danbury Lane Tonawanda, NY 14217
1 Interiors consulting
Office Parks Colvin Woods Business Park Colvin Boulevard @ I-290 Tonawanda, NY 14150
Riverview Solar Technology 5201 River Road Tonawanda, NY 14150
LEED-Certified Buildings South Lockport Medical Campus 5842 Snyder Drive Lockport, NY 14095
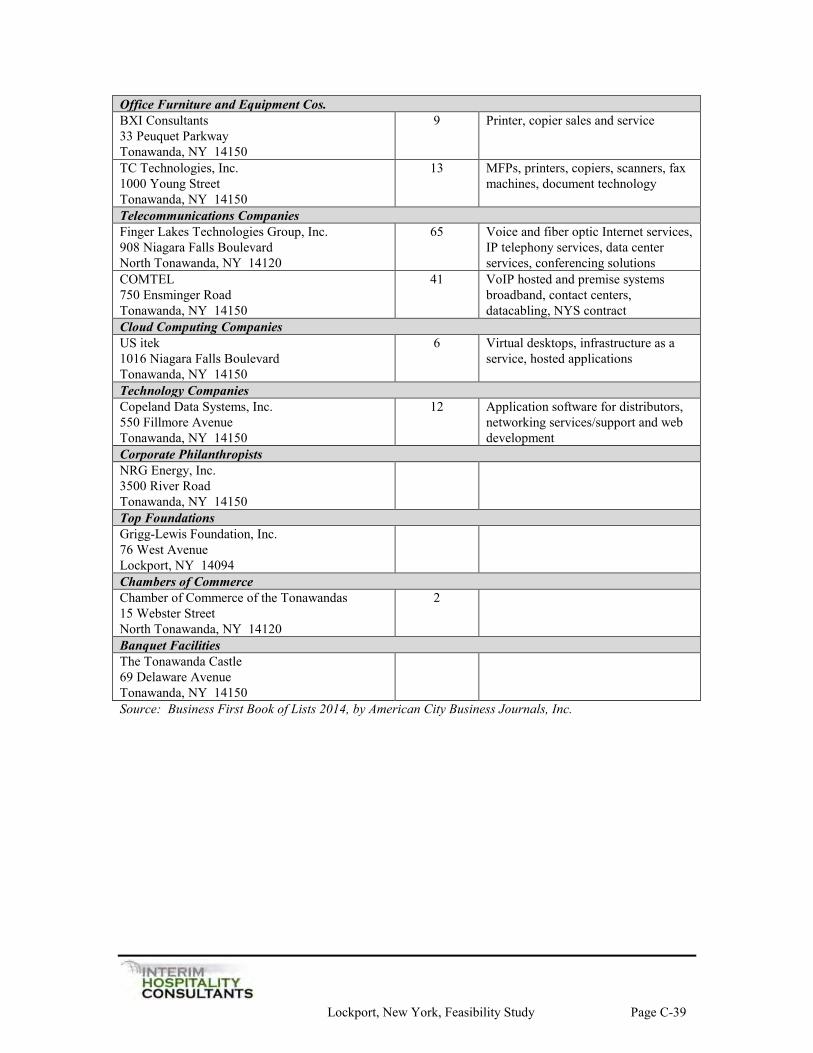
Lockport, New York, Feasibility Study Page C-39
Office Furniture and Equipment Cos. BXI Consultants 33 Peuquet Parkway Tonawanda, NY 14150
9 Printer, copier sales and service
TC Technologies, Inc. 1000 Young Street Tonawanda, NY 14150
13 MFPs, printers, copiers, scanners, fax machines, document technology
Telecommunications Companies Finger Lakes Technologies Group, Inc. 908 Niagara Falls Boulevard North Tonawanda, NY 14120
65 Voice and fiber optic Internet services, IP telephony services, data center services, conferencing solutions
COMTEL 750 Ensminger Road Tonawanda, NY 14150
41 VoIP hosted and premise systems broadband, contact centers, datacabling, NYS contract
Cloud Computing Companies US itek 1016 Niagara Falls Boulevard Tonawanda, NY 14150
6 Virtual desktops, infrastructure as a service, hosted applications
Technology Companies Copeland Data Systems, Inc. 550 Fillmore Avenue Tonawanda, NY 14150
12 Application software for distributors, networking services/support and web development
Corporate Philanthropists NRG Energy, Inc. 3500 River Road Tonawanda, NY 14150
Top Foundations Grigg-Lewis Foundation, Inc. 76 West Avenue Lockport, NY 14094
Chambers of Commerce Chamber of Commerce of the Tonawandas 15 Webster Street North Tonawanda, NY 14120
2
Banquet Facilities The Tonawanda Castle 69 Delaware Avenue Tonawanda, NY 14150
Source: Business First Book of Lists 2014, by American City Business Journals, Inc.

Lockport, New York, Feasibility Study Page C-40
Transportation Airports Niagara Falls International Airport (IATA: IAG, ICAO: KIAG, FAA LID: IAG) is four miles east of downtown Niagara Falls, in Niagara County, New York. Owned and operated by the Niagara Frontier Transportation Authority, the airport shares its runways with the Niagara Falls Air Reserve Station. A new terminal building opened in 2009. The airport is in Class D airspace and has a FAA control tower. The airport covers 1,067 acres and has three paved runways: In 2011 Niagara Falls International served an estimated 200,000 passengers. In the first 11 months of 2011, 87,942 outbound passengers boarded flights, a 190 percent increase from the same period in 2010. As per Federal Aviation Administration records, the airport had 23,849 passenger boardings (enplanements) in calendar year 2010. In the year ending May 31, 2011 the airport had 29,816 aircraft operations, average 82 per day: 65% general aviation, 26% military, 7% air taxi and 3% airline. The FAA's National Plan of Integrated Airport Systems for 2011–2015 classified Niagara Falls International as a reliever airport. An estimated 80% of the passenger traffic at the airport comes from Canadians.
Busiest domestic routes from Niagara Falls International Airport
(July 2013 – June 2014)[14] Rank Airport Passengers Carriers
1 Fort Lauderdale, Florida 33,000 Spirit 2 Orlando, Florida 20,000 Allegiant 3 St. Petersburg, Florida 17,000 Allegiant 4 Myrtle Beach, South Carolina 17,000 Spirit 5 Punta Gorda, Florida 15,000 Allegiant
Other Nearby airports
0G0 – North Buffalo Suburban Airport (11 nm E)
KBUF – Buffalo Niagara International Airport (14 nm SE)
9G0 – Buffalo Airfield (18 nm SE)
9G3 – Akron Airport (21 nm E)
9G6 – Pine Hill Airport (30 nm E)

Lockport, New York, Feasibility Study Page C-41
Shopping
Niagara County offers many shopping venues from small boutiques, a designer outlet mall and farmers markets. Whether you are just browsing or looking for great deals, shopping in Niagara County is an absolute must. One of the top ten rated outlet malls in the country, the Fashion Outlets of Niagara has over 150 stores to suit everyone's shopping needs and is situated only 10 minutes away from one of the world’s natural wonders. Discover local boutiques and antique shops and their one-of-a-kind finds. Check out the privately owned shops and boutiques that feature unique items including clothing, decorative items, housewares, art or shoes.
Media Newspapers
Niagara Falls Gazette From its inception in 1854, the Niagara Falls Gazette has been the record of local news and events in and around Niagara Falls. The Gazette's early editions, as they do today, reach across international borders and reported news of the early daredevils and Falls-related stories, stories of heroic rescues and tragic mishaps, stories of romantic dalliances, honeymoon excursions and lovers leaps of despair. Those reports appeared in newspapers across the country and in Europe. Today, daily editions of the Niagara Gazette are mailed from Vermont to California and Alaska to Florida, reaching into 25 of our nation’s 50 states. Tourist Attractions Niagara Wine Trail Located along the lower river below the roaring waters of the Falls, is the Niagara Wine Trail. These delightful Niagara wineries offer selections for all tastes. The fertile soil and adequate rainfall of the Niagara region contribute to the excellent growing conditions on the vineyards. The Niagara USA region has a unique microclimate for the production of world class wines, along with a beautiful countryside situated on the Niagara Escarpment.

Lockport, New York, Feasibility Study Page C-42
Niagara wine tours, events and festivals are held year-round to offer the wine tasting experience to all visitors of Niagara Falls. Limos and bus tour packages are also available to make experiencing the Niagara wine trail and Niagara wine tours more enjoyable. Niagara Falls State Park Niagara Falls State Park is home to over 400 acres of lush landscape and wildlife, the beautiful Falls themselves, and many famous attractions. Niagara USA offers a breathtaking view of one of nature’s marvels and an experience that will last a lifetime. First discovered in 1678, by French explorer Father Louis Hennepin, Niagara Falls was one of America's first icons, luring explorers, daredevils and millions of visitors with its untamed beauty, thundering roar and tremendous power. World-class attractions such as the Maid of the Mist and Cave of the Winds, offer the eight million visitors each year an opportunity to feel, see and experience the rush of Niagara's waters. At the Frederick Law Olmsted designed park, the oldest state park in the nation, a natural splendor allows the park to be seen as nature intended it to be seen. Each year, millions of people don sandals and ponchos to take part in a close up view of the American and Bridal Veil Falls on the Cave of the Winds. What most people don’t know is that the very decks they stand on are torn down and re-built each and every year. Due to frigid waters in the spring, teams of park employees work for only 20 minutes at a time re-building the famous decks. The State Park is open 365 days a year, 24-hours a day. You can walk through the park or take the Niagara Scenic Trolley ride. Niagara Falls (/naɪˈæɡrə/, Cayuga: Gahnawehta or Tgahnawęhta) is the collective name for three waterfalls that straddle the international border between Canada and the United States; more specifically, between the province of Ontario and the state of New York. They form the southern end of the Niagara Gorge. From largest to smallest, the three waterfalls are the Horseshoe Falls, the American Falls and the Bridal Veil Falls. The Horseshoe Falls lie mostly on the Canadian side and the American Falls entirely on the American side, separated by Goat Island. The smaller Bridal Veil Falls are also located on the American side, separated from the other waterfalls by Luna Island. The international boundary line was originally drawn through Horseshoe Falls in 1819, but the boundary has long been in dispute due to natural erosion and construction. Located on the Niagara River, which drains Lake Erie into Lake Ontario, the combined falls form the highest flow rate of any waterfall in the world, with a vertical drop of more than 165 feet. Horseshoe Falls is the most powerful waterfall in North America, as measured by vertical height and also by flow rate. The falls are located 17 miles north-

Lockport, New York, Feasibility Study Page C-43
northwest of Buffalo, New York and 75 miles south-southeast of Toronto, between the twin cities of Niagara Falls, Ontario, and Niagara Falls, New York. Niagara Falls were formed when glaciers receded at the end of the Wisconsin glaciation (the last ice age), and water from the newly formed Great Lakes carved a path through the Niagara Escarpment en-route to the Atlantic Ocean. While not exceptionally high, the Niagara Falls are very wide. More than six million cubic feet of water falls over the crest line every minute in high flow, and almost four million cubic feet on average. The Niagara Falls are renowned both for their beauty and as a valuable source of hydroelectric power. Managing the balance between recreational, commercial, and industrial uses has been a challenge for the stewards of the falls since the 19th century.
Niagara Falls
Lockport Locks and Erie Canal Cruises The Lockport Locks and Erie Canal Cruises is a relaxing and informative ride on the 19th-century engineering marvel which opened the American Frontier. Boat rides are offered on the Erie Canal, with one proceeding upward through the modern locks for a short cruise, and returning to pass downstream under two lift bridges and then returning to the docks.

Lockport, New York, Feasibility Study Page C-44

Lockport, New York, Feasibility Study Page C-45
Summary
Lockport, New York in Niagara County is the county seat and the location of a number of historical and operational locks of the Erie Canal. The Erie Canal was the major transportation waterway for nearly one hundred years. Now it is a pleasure craft route across northern New York State. The new ice arena with two national Hockey league-size rinks opened in late 2014. The year-round facility will serve as an economic catalyst in its downtown location. The Business First Book of Lists of 2014, by American City Business Journal lists 23 industries in Lockport as leaders in various businesses. These firms provide the solid base of employment and economic growth for Lockport.


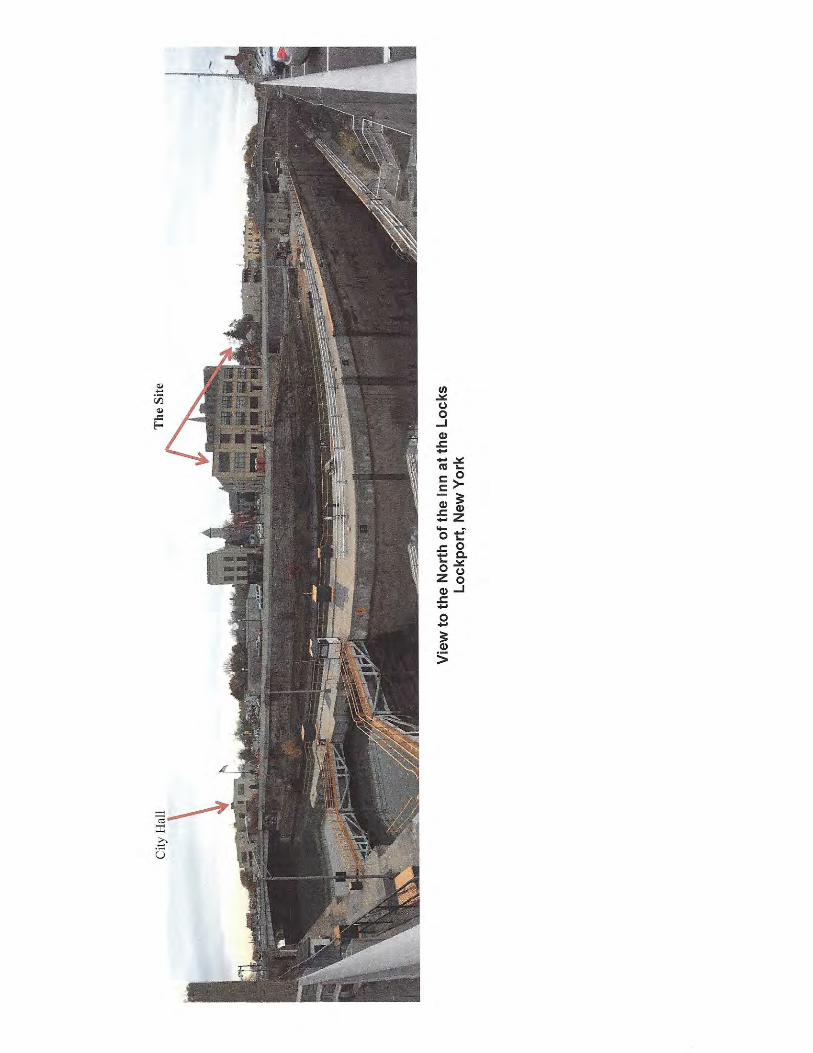


Lockport, New York, Feasibility Study Page D-16
Hotel Signage As the subject site is located inside the city limits of Lockport, various sign ordinances must be reviewed concurrently with the development of a signage program. It is recommended that the development obtain the following signs: 1. A monument sign at the drive entrance; 2. A large logo sign mounted on the front of the hotel; Utilities With the site being inside the City of Lockport, all public utilities of water, sewer, electricity, natural gas, telephone, and cable television systems are available to the subject hotel. The site will require an on-site sanitary waste processing facility. Satellite television and propane gas will be provided by the hotel. Summary The growing year-round recreational visitor market and the stable business travel market have created a significant demand for new hotel rooms in the City of Lockport. There are viable and appealing sites for hotel developments in the 100-150 total room range in the City. Specifically, the vacant Dussault site lends itself well to a conference-type hotel adjacent to the new Cornerstone CFCU Hockey Arena. A total of three locations for Hotel Development were identified in the central business district of Lockport. See map on Page D-14: Site A: Adjacent to the new Ice Arena and the Erie Canal. Site B: Along the Erie Canal and Transit Street, Southwest Quadrant
Site C: At 57 Richmond Avenue in the conversion of an existing office building adjacent to the multi-lock system of the Erie Canal.
Due to the results of the findings of the Market Field Research, Site C has been identified as the initial location for Hotel Development. This historic and picturesque location is adjacent to a city park with a gazebo. A first-class boutique hotel will be successful at this unique location as the findings of this Feasibility Study come to fruition.

Lockport, New York, Feasibility Study Page E-1
SUPPLY AND DEMAND ANALYSIS The objectives of the supply and demand analysis are to: 1. Identify those hotels that constitute direct competition to the proposed hotel. 2. Estimate the occupancy levels, average room rates, and market mixes of the
competitive hotels. 3. Project growth rates for each identifiable market segment. 4. Determine the existing relationship of supply to demand for the competitive
hotels and to project these relationships for the first five years of operation. In addition, this section represents a review of both existing and proposed lodging facilities in the competitive market area.

Lockport, New York, Feasibility Study Page E-2
Competitive Market Survey
There are two hotels in Lockport reporting their hotel data to Smith Travel Research. Interim Hospitality Consultants selected these hotels as an indication of Potential Market Demand for Lockport all based on the excellent demand generator of Niagara County, New York.
City/State Year Built # of Rooms Room Rate Dec 2014
Comfort Inn, Lockport, NY 10/1989 50 $90 Best Western Plus Lockport, NY 06/1971 95 $90
Source: Data compiled by Interim Hospitality Consultants Hotels Under Construction, Announced or Rumored The Field Research for this project did not reveal any hotels under construction, announced, or rumored within the Competitive Market Set that would compete with the proposed hotel.

Copyright © and (P) 1988–2012 Microsoft Corporation and/or its suppliers. All rights reserved. http://www.microsoft.com/streets/Certain mapping and direction data © 2012 NAVTEQ. All rights reserved. The Data for areas of Canada includes information taken with permission from Canadian authorities, including: © Her Majesty the Queen in Right of Canada, © Queen's Printer for Ontario. NAVTEQ and NAVTEQ ON BOARD are trademarks of NAVTEQ. © 2012 Tele Atlas North America, Inc. All rights reserved. Tele Atlas and Tele Atlas North America are trademarks of Tele Atlas, Inc. © 2012 by Applied Geographic Solutions. All rights reserved. Portions © Copyright 2012 by Woodall Publications Corp. All rights reserved.
Competing Hotels
0 mi 0.2 0.4 0.6

Lockport, New York, Feasibility Study Page E-4
Competing Hotels

Lockport, New York, Feasibility Study Page E-5
Smith Travel Research, Inc. Smith Travel Research, Inc. (STR) is an American company based in Hendersonville, Tennessee, that tracks supply and demand data for the hotel industry and provides market share analysis for all major hotel chains and brands in the United States, Canada, Mexico and the Caribbean. STR is associated with STR Global. RRC Associates. STR Analytics and HotelNewsNow.com. The hotel markets served are worldwide with more than 150 employees. Offices are located in: • Hendersonville (Nashville), Tennessee • Rocky River (Cleveland), Ohio • Boulder, Colorado History STR was founded in 1985 by Randy and Carolyn Smith in Lancaster, Pennsylvania. The Smiths built the company with a focus on providing overall performance data and trends to the hotel industry. In the beginning, they developed a database with names, addresses and phone numbers of established hotel companies in the United States to create the Census Database. Randy Smith was contacted by Holiday Inn multiple times and urged to create a market share report. By 1988, the company launched the first Smith Travel Accommodations Report (STAR), a monthly report that includes data from hotels and measures each property's market share performance against a self-selected competitive set. STAR currently tracks nearly 40,000 properties. STR Family of Companies STR Global In 2008, STR combined its operations outside North America with Deloitte to form STR Global. STR continues serving the North American markets, while STR Global caters to a global audience. STR Global has its main office in London, with regional offices in Italy, Singapore, Tokyo, Jakarta, Sydney and Beijing.
Lockport, New York, Feasibility Study Page E-6
HotelNewsNow.com STR launched HotelNewsNow.com in 2008. HotelNewsNow.com provides the global hotel industry with news coverage and hotel analysis that leverages its first access to data from the STR family of companies. This division comprises a multimedia website and collection of e-newsletters, including the Daily Update, Hotel Investment Barometer and Product Showcase. HotelNewsNow.com also hosts The Baird/STR Hotel Stock Index, a co-branded index created by Robert W. Baird & Co. and STR. The Index tracks the stock price movements associated with U.S. focused and domestically-based hotel companies. HotelNewsNow.com is based in Rocky River, Ohio. RRC Associates STR acquired RRC Associates in 2008. RRC is a consulting firm that provides market research, strategic analysis, community and land use planning services. RRC specializes in the collection and analysis of customer feedback via web, internet, mail or phone surveys. In addition, RRC operates the Boulder Focus Center, a qualitative research facility designed for state of the art research including surveys and focus groups. RRC Associates is based in Boulder, Colorado. STR Analytics STR Analytics utilizes the STR database and cross-references it with other data to provide objective trend-based analysis and empirical data about the lodging industry. STR Analytics is based in Boulder, Colorado. Trend Report One of the more requested reports by hotel developers, investors and the financial community of the Hotel Industry is the STR Trend Report. This is because it is pure uncorrupted data. Example: The night desk clerk at a hotel posts the room rate and appropriate taxes to each guest room folio. The total of the room revenue and number of occupied rooms is transmitted each day at 4:00 A.M. to the appropriate franchise corporate office, such as: • Hilton Hotels to Memphis, Tennessee • Holiday Inn to Atlanta Georgia, etc. Each morning the franchise company knows how many hotel rooms were rented (occupancy) and the total of room revenue of each of their hotels – worldwide.

Lockport, New York, Feasibility Study Page E-7
Every franchise hotel company, and many independent hotels, provide their room data to STR each day of the week, STR then produces Occupancy and Daily Average Rates data of various hotel segments and locations worldwide. Developers, consultants, financial executives and the general public can order a STR Trend Report of a specific set of hotels in specific locations. A report for the Competitive Market Set of Hotels ordered by Interim Hospitality Consultants follows. Glossary Terms used in the various Smith Travel Research reports of importance in this Study are defined as follows.
• Occ (Occupancy) Rooms sold divided by rooms available. Occupancy is always displayed as a percentage of rooms occupied.
• ADR (Average Daily Rate) Room revenue divided by rooms sold, displayed as the average rental rate for a single room.
• RevPAR (Revenue Per Available Room) Room revenue divided by rooms available.
See Tab 10 of the STR Report for additional definitions.

Lockport, New York, Feasibility Study Page E-8
Smith Travel Research — Competitive Market Set The following hotels were combined to report their historical Occupancy and Average Daily Rate from January 2008 through October 2014.
Hotel
City
Franchise Date
Date Opened
Number of Rooms
Comfort Inn Buffalo Lockport, NY Oct 1989 Oct 1989 50 Best Western Plus Lockport Hotel Lockport, NY Jul 2013 Jun 1971 95 Hampton Inn Buffalo Wiliamsville Williamsville, NY Jul 2002 Jul 2002 80 DoubleTree Buffalo Amherst Amherst, NY Jun 2012 May 1987 187 Comfort Inn University Amherst Amherst, NY Mar 2005 Jan 1986 102 Candlewood Suites Buffalo Amherst Amherst, NY Jun 2009 Jun 2009 76 Staybridge Suites Buffalo Amherst Amherst, NY Nov 2013 Nov 2013 102 Holiday Inn Buffalo Amherst Amherst, NY Apr 1967 Apr 1967 199 Total 891
Source: Smith Travel Research, Hendersonville, Tennessee Note: Room counts in the Smith Travel Research Occupancy Data may vary from the room count reported
by individual hotels due to usage of the rooms by the hotel management.
Competitive Market Set North Tonawanda, New York
2008 2009
Month Occupancy ADR RevPAR Month Occupancy ADR RevPAR
Jan 40.7 92.22 37.55 Jan 34.2 93.42 31.94
Feb 44.9 92.66 41.57 Feb 52.5 101.83 53.47
Mar 48.4 97.00 46.91 Mar 43.7 95.89 41.89
Apr 54.6 99.55 54.35 Apr 48.5 92.71 44.96
May 60.3 105.51 63.63 May 57.1 98.17 56.06
Jun 71.0 102.75 72.95 Jun 55.5 97.44 54.12
Jul 82.9 117.20 97.19 Jul 72.9 102.82 74.99
Aug 83.8 118.65 99.40 Aug 71.0 100.47 71.31
Sep 62.7 101.76 63.85 Sep 65.0 92.47 60.13
Oct 63.8 101.39 64.67 Oct 69.2 91.11 63.08
Nov 58.6 99.01 57.98 Nov 54.5 91.74 49.99
Dec 38.6 97.15 37.49 Dec 37.6 87.74 32.99 Source: Smith Travel Research, Hendersonville, Tennessee

Lockport, New York, Feasibility Study Page E-9
Competitive Market Set North Tonawanda, New York
2010 2011
Month Occupancy ADR RevPAR Month Occupancy ADR RevPAR
Jan 31.9 87.85 28.06 Jan 41.7 81.97 34.22
Feb 38.4 88.67 34.04 Feb 49.2 81.93 40.32
Mar 47.8 90.22 43.14 Mar 57.3 86.75 49.72
Apr 50.4 90.40 45.59 Apr 62.4 86.04 53.68
May 64.9 94.50 61.32 May 69.3 93.70 64.91
Jun 70.3 88.44 62.19 Jun 70.9 96.38 68.35
Jul 84.5 97.41 82.31 Jul 84.7 106.48 90.21
Aug 84.9 94.41 80.17 Aug 81.6 106.74 87.13
Sep 73.3 86.25 63.20 Sep 71.7 99.15 71.11
Oct 67.3 88.10 59.27 Oct 69.1 94.72 65.45
Nov 64.5 85.46 55.13 Nov 61.8 91.54 56.58
Dec 48.5 83.02 40.24 Dec 50.0 85.25 42.66 Source: Smith Travel Research, Hendersonville, Tennessee
Competitive Market Set North Tonawanda, New York
2012 2013
Month Occupancy ADR RevPAR Month Occupancy ADR RevPAR
Jan 46.5 85.01 38.55 Jan 46.6 88.40 41.15
Feb 52.7 87.18 45.92 Feb 55.4 90.16 49.98
Mar 62.9 91.31 57.47 Mar 60.4 94.34 57.00
Apr 62.2 88.82 55.22 Apr 62.9 90.90 57.17
May 73.4 95.60 70.16 May 73.2 100.08 73.26
Jun 83.8 95.25 79.86 Jun 77.6 103.39 80.19
Jul 88.4 101.06 89.36 Jul 86.1 111.45 95.95
Aug 91.2 105.08 95.85 Aug 87.8 113.86 99.99
Sep 77.6 94.56 73.40 Sep 76.4 98.31 75.15
Oct 73.2 93.19 68.19 Oct 69.6 101.20 70.47
Nov 66.4 90.94 60.38 Nov 62.0 99.76 61.84
Dec 51.4 87.11 44.82 Dec 43.3 92.20 39.88 Source: Smith Travel Research, Hendersonville, Tennessee

Lockport, New York, Feasibility Study Page E-10
Standard Historical Trends
North Tonawanda, New York Competitive Market Set
2014*
Month Occ ADR RevPAR
January 41.6 93.36 38.88 February 44.8 92.37 41.40 March 56.4 98.18 55.35 April 59.1 95.53 56.42 May 68.8 101.76 70.05 June 76.1 101.53 77.27 July 86.7 115.83 100.37 August 88.9 114.65 101.96 September 70.7 103.50 73.21 October 69.3 101.95 70.63 November December
January through October, 2014 Source: Smith Travel Research, Hendersonville, Tennessee
Market Trend North Tonawanda, New York
Competitive Market Set
Year Occupancy Average
Daily Rate RevPAR
2008 59.3 103.95 61.62 2009 55.5 95.90 53.22 2010 60.7 90.12 54.70 2011 64.2 94.17 60.50 2012 69.3 94.08 65.15 2013 66.5 100.12 66.61
Source: Smith Travel Research, Hendersonville, Tennessee

Source: Smith Travel Research, Hendersonville, Tennessee

Source: Smith Travel Research, Hendersonville, Tennessee

Source: Smith Travel Research, Hendersonville, Tennessee

Year Occupancy ADR RevPAR2008 59.3 103.95 61.622009 55.5 95.90 53.222010 60.7 90.12 54.702011 64.2 94.17 60.502012 69.3 94.08 65.152013 66.5 100.12 66.61
Trend Report
Lockport, New York Market Set
Source: Smith Travel Research, Hendersonville, Tennessee
0
20
40
60
80
100
120
2008 2009 2010 2011 2012 2013

United Kingdom United StatesBlue Fin Building 735 East Main Street
110 Southwark Street HendersonvilleLondon SE1 0TA TN 37075
Phone: +44 (0)20 7922 1930 Phone: +1 (615) 824 8664Fax: +44 (0)20 7922 1931 Fax: +1 (615) 824 3848
www.strglobal.com www.str.com
Amherst, NY Area Selected Properties
Job Number: 637011_SADIM Staff: MB Created: November 26, 2014Currency: USD - US Dollar
TabTable of Contents 1
Data by Measure 2
Percent Change by Measure 3
Percent Change by Year 4
Twelve Month Moving Average 5
Twelve Month Moving Average with Percent Change 6
Day of Week Analysis 7
Raw Data 8
Classic 9
Response Report 10
Help 11
Terms and Conditions 12
January 2008 to October 2014

Tab 2 - Data by MeasureAmherst, NY Area Selected Properties
Job Number: 637011_SADIM Staff: MB Created: November 26, 2014
Occupancy (%)January February March April May June July August September October November December Total Year Oct YTD
2008 40.7 44.9 48.4 54.6 60.3 71.0 82.9 83.8 62.7 63.8 58.6 38.6 59.3 61.52009 34.2 52.5 43.7 48.5 57.1 55.5 72.9 71.0 65.0 69.2 54.5 37.6 55.5 57.52010 31.9 38.4 47.8 50.4 64.9 70.3 84.5 84.9 73.3 67.3 64.5 48.5 60.7 61.62011 41.7 49.2 57.3 62.4 69.3 70.9 84.7 81.6 71.7 69.1 61.8 50.0 64.2 65.92012 46.5 52.7 62.9 62.2 73.4 83.8 88.4 91.2 77.6 73.2 66.4 51.4 69.3 71.32013 46.6 55.4 60.4 62.9 73.2 77.6 86.1 87.8 76.4 69.6 62.0 43.3 66.5 69.72014 41.6 44.8 56.4 59.1 68.8 76.1 86.7 88.9 70.7 69.3 66.4Avg 40.6 48.2 54.1 57.3 67.0 72.3 83.8 84.3 71.2 68.9 61.4 45.0 62.7 65.0
ADR ($)January February March April May June July August September October November December Total Year Oct YTD
2008 92.22 92.66 97.00 99.55 105.51 102.75 117.20 118.65 101.76 101.39 99.01 97.15 103.95 104.852009 93.42 101.83 95.89 92.71 98.17 97.44 102.82 100.47 92.47 91.11 91.74 87.74 95.90 96.882010 87.85 88.67 90.22 90.40 94.50 88.44 97.41 94.41 86.25 88.10 85.46 83.02 90.12 91.172011 81.97 81.93 86.75 86.04 93.70 96.38 106.48 106.74 99.15 94.72 91.54 85.25 94.17 95.102012 85.01 87.18 91.31 88.82 95.60 95.25 101.06 105.08 94.56 93.19 90.94 87.11 94.08 94.882013 88.40 90.16 94.34 90.90 100.08 103.39 111.45 113.86 98.31 101.20 99.76 92.20 100.12 100.722014 93.36 92.37 98.18 95.53 101.76 101.53 115.83 114.65 103.50 101.95 103.59Avg 88.70 90.60 93.27 91.80 98.35 97.96 107.56 107.88 96.55 95.95 93.03 88.33 96.25 98.21
RevPAR ($)January February March April May June July August September October November December Total Year Oct YTD
2008 37.55 41.57 46.91 54.35 63.63 72.95 97.19 99.40 63.85 64.67 57.98 37.49 61.62 64.442009 31.94 53.47 41.89 44.96 56.06 54.12 74.99 71.31 60.13 63.08 49.99 32.99 53.22 55.722010 28.06 34.04 43.14 45.59 61.32 62.19 82.31 80.17 63.20 59.27 55.13 40.24 54.70 56.132011 34.22 40.32 49.72 53.68 64.91 68.35 90.21 87.13 71.11 65.45 56.58 42.66 60.50 62.712012 39.55 45.92 57.47 55.22 70.16 79.86 89.36 95.85 73.40 68.19 60.38 44.82 65.15 67.692013 41.15 49.98 57.00 57.17 73.26 80.19 95.95 99.99 75.15 70.47 61.84 39.88 66.61 70.222014 38.88 41.40 55.35 56.42 70.05 77.27 100.37 101.96 73.21 70.63 68.82Avg 35.99 43.67 50.47 52.64 65.87 70.80 90.15 90.92 68.73 66.07 57.07 39.72 60.35 63.82
SupplyJanuary February March April May June July August September October November December Total Year Oct YTD
2008 22,103 19,964 22,103 21,390 22,103 21,390 22,103 22,103 21,390 22,103 21,390 22,103 260,245 216,7522009 22,103 19,964 22,103 21,390 22,103 23,670 24,459 24,459 23,670 24,459 23,670 24,459 276,509 228,3802010 24,459 22,092 24,459 23,670 24,459 23,670 24,459 24,459 23,670 24,459 23,670 24,459 287,985 239,8562011 24,459 22,092 24,459 23,670 24,459 23,670 24,459 24,459 23,670 24,459 23,670 24,459 287,985 239,8562012 24,459 22,092 24,459 23,670 24,459 23,670 24,459 24,459 23,670 24,459 23,670 24,459 287,985 239,8562013 24,459 22,092 24,459 23,670 24,459 23,670 24,459 24,459 23,670 24,459 26,730 27,621 294,207 239,8562014 27,621 24,948 27,621 26,730 27,621 26,730 27,621 27,621 26,730 27,621 270,864Avg 24,238 21,892 24,238 23,456 24,238 23,781 24,574 24,574 23,781 24,574 23,800 24,593 282,486 239,346
DemandJanuary February March April May June July August September October November December Total Year Oct YTD
2008 9,000 8,956 10,690 11,678 13,329 15,187 18,328 18,517 13,422 14,098 12,526 8,531 154,262 133,2052009 7,556 10,483 9,655 10,374 12,621 13,147 17,837 17,360 15,390 16,934 12,898 9,195 153,450 131,3572010 7,812 8,482 11,696 11,937 15,872 16,644 20,668 20,771 17,344 16,454 15,269 11,854 174,803 147,6802011 10,211 10,872 14,019 14,768 16,943 16,786 20,722 19,965 16,975 16,899 14,631 12,239 185,030 158,1602012 11,378 11,637 15,394 14,715 17,952 19,846 21,628 22,312 18,373 17,897 15,716 12,584 199,432 171,1322013 11,387 12,248 14,777 14,887 17,906 18,358 21,057 21,478 18,094 17,033 16,568 11,947 195,740 167,2252014 11,501 11,182 15,572 15,785 19,013 20,344 23,935 24,562 18,908 19,136 179,938Avg 9,835 10,551 13,115 13,449 16,234 17,187 20,596 20,709 16,929 16,922 14,601 11,058 177,120 155,528

Revenue ($)January February March April May June July August September October November December Total Year Oct YTD
2008 829,989 829,879 1,036,907 1,162,545 1,406,395 1,560,503 2,148,102 2,197,132 1,365,758 1,429,439 1,240,256 828,750 16,035,655 13,966,6492009 705,917 1,067,441 925,846 961,790 1,239,009 1,281,047 1,834,081 1,744,079 1,423,166 1,542,848 1,183,229 806,813 14,715,266 12,725,2242010 686,257 752,088 1,055,236 1,079,057 1,499,874 1,472,066 2,013,209 1,960,967 1,495,923 1,449,622 1,304,912 984,141 15,753,352 13,464,2992011 836,998 890,728 1,216,179 1,270,597 1,587,641 1,617,839 2,206,449 2,131,045 1,683,124 1,600,744 1,339,257 1,043,420 17,424,021 15,041,3442012 967,297 1,014,465 1,405,633 1,307,003 1,716,132 1,890,400 2,185,688 2,344,475 1,737,422 1,667,764 1,429,236 1,096,236 18,761,751 16,236,2792013 1,006,606 1,104,256 1,394,127 1,353,231 1,791,981 1,898,076 2,346,887 2,445,577 1,778,889 1,723,746 1,652,869 1,101,543 19,597,788 16,843,3762014 1,073,774 1,032,841 1,528,820 1,507,994 1,934,809 2,065,471 2,772,354 2,816,104 1,956,953 1,950,832 18,639,952Avg 872,405 955,957 1,223,250 1,234,602 1,596,549 1,683,629 2,215,253 2,234,197 1,634,462 1,623,571 1,358,293 976,817 17,047,972 15,273,875
STR’s Trend Report is a publication of STR, Inc. and is intended solely for use by paid subscribers. Reproduction or distribution of the Trend Report, in whole or part, without written permission of STR is prohibited and subject to legal action. Site licenses are available. Ownership, distribution and use of the Trend Report and its contents are subject to the terms set forth in the contract you have entered into with STR. Source 2014 STR, Inc.

Tab 3 - Percent Change from Previous Year - Detail by MeasureAmherst, NY Area Selected Properties
Job Number: 637011_SADIM Staff: MB Created: November 26, 2014
OccupancyJanuary February March April May June July August September October November December Total Year Oct YTD
2009 -16.0 17.1 -9.7 -11.2 -5.3 -21.8 -12.1 -15.3 3.6 8.5 -6.9 -2.6 -6.4 -6.42010 -6.6 -26.9 9.5 4.0 13.6 26.6 15.9 19.6 12.7 -2.8 18.4 28.9 9.4 7.02011 30.7 28.2 19.9 23.7 6.7 0.9 0.3 -3.9 -2.1 2.7 -4.2 3.2 5.9 7.12012 11.4 7.0 9.8 -0.4 6.0 18.2 4.4 11.8 8.2 5.9 7.4 2.8 7.8 8.22013 0.1 5.3 -4.0 1.2 -0.3 -7.5 -2.6 -3.7 -1.5 -4.8 -6.6 -15.9 -3.9 -2.32014 -10.6 -19.2 -6.7 -6.1 -6.0 -1.9 0.7 1.3 -7.5 -0.5 -4.7Avg 1.5 1.9 3.1 1.9 2.5 2.4 1.1 1.6 2.2 1.5 1.6 3.3 2.5 1.5
ADRJanuary February March April May June July August September October November December Total Year Oct YTD
2009 1.3 9.9 -1.1 -6.9 -7.0 -5.2 -12.3 -15.3 -9.1 -10.1 -7.3 -9.7 -7.7 -7.62010 -6.0 -12.9 -5.9 -2.5 -3.7 -9.2 -5.3 -6.0 -6.7 -3.3 -6.8 -5.4 -6.0 -5.92011 -6.7 -7.6 -3.8 -4.8 -0.8 9.0 9.3 13.1 15.0 7.5 7.1 2.7 4.5 4.32012 3.7 6.4 5.3 3.2 2.0 -1.2 -5.1 -1.6 -4.6 -1.6 -0.6 2.2 -0.1 -0.22013 4.0 3.4 3.3 2.3 4.7 8.5 10.3 8.4 4.0 8.6 9.7 5.8 6.4 6.22014 5.6 2.4 4.1 5.1 1.7 -1.8 3.9 0.7 5.3 0.7 2.8Avg 0.3 0.3 0.3 -0.6 -0.5 0.0 0.1 -0.1 0.6 0.3 0.4 -0.9 -0.6 -0.1
RevPARJanuary February March April May June July August September October November December Total Year Oct YTD
2009 -14.9 28.6 -10.7 -17.3 -11.9 -25.8 -22.8 -28.3 -5.8 -2.5 -13.8 -12.0 -13.6 -13.52010 -12.1 -36.3 3.0 1.4 9.4 14.9 9.8 12.4 5.1 -6.0 10.3 22.0 2.8 0.72011 22.0 18.4 15.3 17.8 5.9 9.9 9.6 8.7 12.5 10.4 2.6 6.0 10.6 11.72012 15.6 13.9 15.6 2.9 8.1 16.8 -0.9 10.0 3.2 4.2 6.7 5.1 7.7 7.92013 4.1 8.9 -0.8 3.5 4.4 0.4 7.4 4.3 2.4 3.4 2.4 -11.0 2.2 3.72014 -5.5 -17.2 -2.9 -1.3 -4.4 -3.6 4.6 2.0 -2.6 0.2 -2.0Avg 1.5 2.7 3.2 1.2 1.9 2.1 1.3 1.5 2.5 1.6 1.7 2.0 1.9 1.4
SupplyJanuary February March April May June July August September October November December Total Year Oct YTD
2009 0.0 0.0 0.0 0.0 0.0 10.7 10.7 10.7 10.7 10.7 10.7 10.7 6.2 5.42010 10.7 10.7 10.7 10.7 10.7 0.0 0.0 0.0 0.0 0.0 0.0 0.0 4.2 5.02011 0.0 0.0 0.0 0.0 0.0 0.0 0.0 0.0 0.0 0.0 0.0 0.0 0.0 0.02012 0.0 0.0 0.0 0.0 0.0 0.0 0.0 0.0 0.0 0.0 0.0 0.0 0.0 0.02013 0.0 0.0 0.0 0.0 0.0 0.0 0.0 0.0 0.0 0.0 12.9 12.9 2.2 0.02014 12.9 12.9 12.9 12.9 12.9 12.9 12.9 12.9 12.9 12.9 12.9Avg 3.9 3.9 3.9 3.9 3.9 3.9 3.9 3.9 3.9 3.9 4.7 4.7 2.5 3.9
DemandJanuary February March April May June July August September October November December Total Year Oct YTD
2009 -16.0 17.1 -9.7 -11.2 -5.3 -13.4 -2.7 -6.2 14.7 20.1 3.0 7.8 -0.5 -1.42010 3.4 -19.1 21.1 15.1 25.8 26.6 15.9 19.6 12.7 -2.8 18.4 28.9 13.9 12.42011 30.7 28.2 19.9 23.7 6.7 0.9 0.3 -3.9 -2.1 2.7 -4.2 3.2 5.9 7.12012 11.4 7.0 9.8 -0.4 6.0 18.2 4.4 11.8 8.2 5.9 7.4 2.8 7.8 8.22013 0.1 5.3 -4.0 1.2 -0.3 -7.5 -2.6 -3.7 -1.5 -4.8 5.4 -5.1 -1.9 -2.32014 1.0 -8.7 5.4 6.0 6.2 10.8 13.7 14.4 4.5 12.3 7.6Avg 5.1 5.0 7.1 5.7 6.5 5.9 4.8 5.3 6.1 5.6 6.0 7.5 5.0 5.3

RevenueJanuary February March April May June July August September October November December Total Year Oct YTD
2009 -14.9 28.6 -10.7 -17.3 -11.9 -17.9 -14.6 -20.6 4.2 7.9 -4.6 -2.6 -8.2 -8.92010 -2.8 -29.5 14.0 12.2 21.1 14.9 9.8 12.4 5.1 -6.0 10.3 22.0 7.1 5.82011 22.0 18.4 15.3 17.8 5.9 9.9 9.6 8.7 12.5 10.4 2.6 6.0 10.6 11.72012 15.6 13.9 15.6 2.9 8.1 16.8 -0.9 10.0 3.2 4.2 6.7 5.1 7.7 7.92013 4.1 8.9 -0.8 3.5 4.4 0.4 7.4 4.3 2.4 3.4 15.6 0.5 4.5 3.72014 6.7 -6.5 9.7 11.4 8.0 8.8 18.1 15.2 10.0 13.2 10.7Avg 5.1 5.6 7.2 5.1 5.9 5.5 4.9 5.0 6.2 5.5 6.1 6.2 4.3 5.2
STR’s Trend Report is a publication of STR, Inc. and is intended solely for use by paid subscribers. Reproduction or distribution of the Trend Report, in whole or part, without written permission of STR is prohibited and subject to legal action. Site licenses are available. Ownership, distribution and use of the Trend Report and its contents are subject to the terms set forth in the contract you have entered into with STR. Source 2014 STR, Inc.

Tab 4 - Percent Change from Previous Year - Detail by YearAmherst, NY Area Selected PropertiesJob Number: 637011_SADIM Staff: MB Created: November 26, 2014
Jan 09 Feb 09 Mar 09 Apr 09 May 09 Jun 09 Jul 09 Aug 09 Sep 09 Oct 09 Nov 09 Dec 09 Total Year Oct YTDOcc -16.0 17.1 -9.7 -11.2 -5.3 -21.8 -12.1 -15.3 3.6 8.5 -6.9 -2.6 -6.4 -6.4ADR 1.3 9.9 -1.1 -6.9 -7.0 -5.2 -12.3 -15.3 -9.1 -10.1 -7.3 -9.7 -7.7 -7.6
RevPAR -14.9 28.6 -10.7 -17.3 -11.9 -25.8 -22.8 -28.3 -5.8 -2.5 -13.8 -12.0 -13.6 -13.5Supply 0.0 0.0 0.0 0.0 0.0 10.7 10.7 10.7 10.7 10.7 10.7 10.7 6.2 5.4
Demand -16.0 17.1 -9.7 -11.2 -5.3 -13.4 -2.7 -6.2 14.7 20.1 3.0 7.8 -0.5 -1.4Revenue -14.9 28.6 -10.7 -17.3 -11.9 -17.9 -14.6 -20.6 4.2 7.9 -4.6 -2.6 -8.2 -8.9
Jan 10 Feb 10 Mar 10 Apr 10 May 10 Jun 10 Jul 10 Aug 10 Sep 10 Oct 10 Nov 10 Dec 10 Total Year Oct YTDOcc -6.6 -26.9 9.5 4.0 13.6 26.6 15.9 19.6 12.7 -2.8 18.4 28.9 9.4 7.0ADR -6.0 -12.9 -5.9 -2.5 -3.7 -9.2 -5.3 -6.0 -6.7 -3.3 -6.8 -5.4 -6.0 -5.9
RevPAR -12.1 -36.3 3.0 1.4 9.4 14.9 9.8 12.4 5.1 -6.0 10.3 22.0 2.8 0.7Supply 10.7 10.7 10.7 10.7 10.7 0.0 0.0 0.0 0.0 0.0 0.0 0.0 4.2 5.0
Demand 3.4 -19.1 21.1 15.1 25.8 26.6 15.9 19.6 12.7 -2.8 18.4 28.9 13.9 12.4Revenue -2.8 -29.5 14.0 12.2 21.1 14.9 9.8 12.4 5.1 -6.0 10.3 22.0 7.1 5.8
Jan 11 Feb 11 Mar 11 Apr 11 May 11 Jun 11 Jul 11 Aug 11 Sep 11 Oct 11 Nov 11 Dec 11 Total Year Oct YTDOcc 30.7 28.2 19.9 23.7 6.7 0.9 0.3 -3.9 -2.1 2.7 -4.2 3.2 5.9 7.1ADR -6.7 -7.6 -3.8 -4.8 -0.8 9.0 9.3 13.1 15.0 7.5 7.1 2.7 4.5 4.3
RevPAR 22.0 18.4 15.3 17.8 5.9 9.9 9.6 8.7 12.5 10.4 2.6 6.0 10.6 11.7Supply 0.0 0.0 0.0 0.0 0.0 0.0 0.0 0.0 0.0 0.0 0.0 0.0 0.0 0.0
Demand 30.7 28.2 19.9 23.7 6.7 0.9 0.3 -3.9 -2.1 2.7 -4.2 3.2 5.9 7.1Revenue 22.0 18.4 15.3 17.8 5.9 9.9 9.6 8.7 12.5 10.4 2.6 6.0 10.6 11.7
Jan 12 Feb 12 Mar 12 Apr 12 May 12 Jun 12 Jul 12 Aug 12 Sep 12 Oct 12 Nov 12 Dec 12 Total Year Oct YTDOcc 11.4 7.0 9.8 -0.4 6.0 18.2 4.4 11.8 8.2 5.9 7.4 2.8 7.8 8.2ADR 3.7 6.4 5.3 3.2 2.0 -1.2 -5.1 -1.6 -4.6 -1.6 -0.6 2.2 -0.1 -0.2
RevPAR 15.6 13.9 15.6 2.9 8.1 16.8 -0.9 10.0 3.2 4.2 6.7 5.1 7.7 7.9Supply 0.0 0.0 0.0 0.0 0.0 0.0 0.0 0.0 0.0 0.0 0.0 0.0 0.0 0.0
Demand 11.4 7.0 9.8 -0.4 6.0 18.2 4.4 11.8 8.2 5.9 7.4 2.8 7.8 8.2Revenue 15.6 13.9 15.6 2.9 8.1 16.8 -0.9 10.0 3.2 4.2 6.7 5.1 7.7 7.9
Jan 13 Feb 13 Mar 13 Apr 13 May 13 Jun 13 Jul 13 Aug 13 Sep 13 Oct 13 Nov 13 Dec 13 Total Year Oct YTDOcc 0.1 5.3 -4.0 1.2 -0.3 -7.5 -2.6 -3.7 -1.5 -4.8 -6.6 -15.9 -3.9 -2.3ADR 4.0 3.4 3.3 2.3 4.7 8.5 10.3 8.4 4.0 8.6 9.7 5.8 6.4 6.2
RevPAR 4.1 8.9 -0.8 3.5 4.4 0.4 7.4 4.3 2.4 3.4 2.4 -11.0 2.2 3.7Supply 0.0 0.0 0.0 0.0 0.0 0.0 0.0 0.0 0.0 0.0 12.9 12.9 2.2 0.0
Demand 0.1 5.3 -4.0 1.2 -0.3 -7.5 -2.6 -3.7 -1.5 -4.8 5.4 -5.1 -1.9 -2.3Revenue 4.1 8.9 -0.8 3.5 4.4 0.4 7.4 4.3 2.4 3.4 15.6 0.5 4.5 3.7
Jan 14 Feb 14 Mar 14 Apr 14 May 14 Jun 14 Jul 14 Aug 14 Sep 14 Oct 14 Nov 14 Dec 14 Total Year Oct YTDOcc -10.6 -19.2 -6.7 -6.1 -6.0 -1.9 0.7 1.3 -7.5 -0.5 -4.7ADR 5.6 2.4 4.1 5.1 1.7 -1.8 3.9 0.7 5.3 0.7 2.8
RevPAR -5.5 -17.2 -2.9 -1.3 -4.4 -3.6 4.6 2.0 -2.6 0.2 -2.0Supply 12.9 12.9 12.9 12.9 12.9 12.9 12.9 12.9 12.9 12.9 12.9
Demand 1.0 -8.7 5.4 6.0 6.2 10.8 13.7 14.4 4.5 12.3 7.6Revenue 6.7 -6.5 9.7 11.4 8.0 8.8 18.1 15.2 10.0 13.2 10.7
STR’s Trend Report is a publication of STR, Inc. and is intended solely for use by paid subscribers. Reproduction or distribution of the Trend Report, in whole or part, without written permission of STR is prohibited and subject to legal action. Site licenses are available. Ownership, distribution and use of the Trend Report and its contents are subject to the terms set forth in the contract you have entered into with STR. Source 2014 STR, Inc.

Tab 5 - Twelve Month Moving AverageAmherst, NY Area Selected PropertiesJob Number: 637011_SADIM Staff: MB Created: November 26, 2014
Occupancy (%)January February March April May June July August September October November December
2009 58.7 59.3 58.9 58.4 58.1 56.9 56.2 55.2 55.5 56.1 55.7 55.52010 55.1 54.0 54.3 54.4 55.1 56.3 57.3 58.4 59.1 59.0 59.8 60.72011 61.5 62.4 63.2 64.2 64.5 64.6 64.6 64.3 64.2 64.3 64.1 64.22012 64.7 64.9 65.4 65.4 65.7 66.8 67.1 67.9 68.4 68.8 69.1 69.32013 69.3 69.5 69.3 69.3 69.3 68.8 68.6 68.3 68.2 67.9 67.5 66.52014 65.9 64.9 64.5 64.1 63.8 63.8 64.1 64.4 64.1 64.1
ADR ($)January February March April May June July August September October November December
2009 104.12 104.63 104.61 104.19 103.57 103.11 101.34 99.07 98.15 97.07 96.46 95.902010 95.61 94.79 94.37 94.18 93.89 93.05 92.54 91.95 91.32 91.03 90.48 90.122011 89.75 89.33 89.07 88.74 88.71 89.42 90.43 91.75 92.94 93.53 94.04 94.172012 94.28 94.55 94.87 95.09 95.26 95.16 94.61 94.57 94.17 94.03 93.97 94.082013 94.27 94.43 94.66 94.81 95.22 95.97 97.06 97.99 98.34 99.06 99.77 100.122014 100.41 100.59 100.87 101.20 101.35 101.18 101.84 102.12 102.58 102.63
RevPAR ($)January February March April May June July August September October November December
2009 61.14 62.05 61.63 60.86 60.21 58.62 56.92 54.72 54.47 54.42 53.76 53.222010 52.70 51.18 51.21 51.21 51.70 52.36 52.98 53.73 53.99 53.66 54.09 54.702011 55.23 55.71 56.27 56.93 57.24 57.74 58.41 59.00 59.65 60.18 60.30 60.502012 60.96 61.39 62.04 62.17 62.62 63.56 63.49 64.23 64.42 64.65 64.96 65.152013 65.28 65.60 65.56 65.72 65.98 66.01 66.57 66.92 67.06 67.26 67.32 66.612014 66.13 65.26 65.03 64.88 64.68 64.58 65.28 65.80 65.73 65.79
SupplyJanuary February March April May June July August September October November December
2009 260,245 260,245 260,245 260,245 260,245 262,525 264,881 267,237 269,517 271,873 274,153 276,5092010 278,865 280,993 283,349 285,629 287,985 287,985 287,985 287,985 287,985 287,985 287,985 287,9852011 287,985 287,985 287,985 287,985 287,985 287,985 287,985 287,985 287,985 287,985 287,985 287,9852012 287,985 287,985 287,985 287,985 287,985 287,985 287,985 287,985 287,985 287,985 287,985 287,9852013 287,985 287,985 287,985 287,985 287,985 287,985 287,985 287,985 287,985 287,985 291,045 294,2072014 297,369 300,225 303,387 306,447 309,609 312,669 315,831 318,993 322,053 325,215
DemandJanuary February March April May June July August September October November December
2009 152,818 154,345 153,310 152,006 151,298 149,258 148,767 147,610 149,578 152,414 152,786 153,4502010 153,706 151,705 153,746 155,309 158,560 162,057 164,888 168,299 170,253 169,773 172,144 174,8032011 177,202 179,592 181,915 184,746 185,817 185,959 186,013 185,207 184,838 185,283 184,645 185,0302012 186,197 186,962 188,337 188,284 189,293 192,353 193,259 195,606 197,004 198,002 199,087 199,4322013 199,441 200,052 199,435 199,607 199,561 198,073 197,502 196,668 196,389 195,525 196,377 195,7402014 195,854 194,788 195,583 196,481 197,588 199,574 202,452 205,536 206,350 208,453
Revenue ($)January February March April May June July August September October November December
2009 15,911,583 16,149,145 16,038,084 15,837,329 15,669,943 15,390,487 15,076,466 14,623,413 14,680,821 14,794,230 14,737,203 14,715,2662010 14,695,606 14,380,253 14,509,643 14,626,910 14,887,775 15,078,794 15,257,922 15,474,810 15,547,567 15,454,341 15,576,024 15,753,3522011 15,904,093 16,042,733 16,203,676 16,395,216 16,482,983 16,628,756 16,821,996 16,992,074 17,179,275 17,330,397 17,364,742 17,424,0212012 17,554,320 17,678,057 17,867,511 17,903,917 18,032,408 18,304,969 18,284,208 18,497,638 18,551,936 18,618,956 18,708,935 18,761,7512013 18,801,060 18,890,851 18,879,345 18,925,573 19,001,422 19,009,098 19,170,297 19,271,399 19,312,866 19,368,848 19,592,481 19,597,7882014 19,664,956 19,593,541 19,728,234 19,882,997 20,025,825 20,193,220 20,618,687 20,989,214 21,167,278 21,394,364
High value is boxed. Low value is boxed and italicized.

Tab 6 - Twelve Month Moving Average with Percent Change
Amherst, NY Area Selected PropertiesJob Number: 637011_SADIM Staff: MB Created: November 26, 2014
Date Occupancy ADR RevPar Supply Demand Revenue
This Year % Chg This Year % Chg This Year % Chg This Year % Chg This Year % Chg This Year % ChgJan 09 58.7 104.12 61.14 260,245 152,818 15,911,583Feb 09 59.3 104.63 62.05 260,245 154,345 16,149,145Mar 09 58.9 104.61 61.63 260,245 153,310 16,038,084Apr 09 58.4 104.19 60.86 260,245 152,006 15,837,329May 09 58.1 103.57 60.21 260,245 151,298 15,669,943Jun 09 56.9 103.11 58.62 262,525 149,258 15,390,487Jul 09 56.2 101.34 56.92 264,881 148,767 15,076,466
Aug 09 55.2 99.07 54.72 267,237 147,610 14,623,413Sep 09 55.5 98.15 54.47 269,517 149,578 14,680,821Oct 09 56.1 97.07 54.42 271,873 152,414 14,794,230Nov 09 55.7 96.46 53.76 274,153 152,786 14,737,203Dec 09 55.5 -6.4 95.90 -7.7 53.22 -13.6 276,509 6.2 153,450 -0.5 14,715,266 -8.2Jan 10 55.1 -6.1 95.61 -8.2 52.70 -13.8 278,865 7.2 153,706 0.6 14,695,606 -7.6Feb 10 54.0 -9.0 94.79 -9.4 51.18 -17.5 280,993 8.0 151,705 -1.7 14,380,253 -11.0Mar 10 54.3 -7.9 94.37 -9.8 51.21 -16.9 283,349 8.9 153,746 0.3 14,509,643 -9.5Apr 10 54.4 -6.9 94.18 -9.6 51.21 -15.9 285,629 9.8 155,309 2.2 14,626,910 -7.6May 10 55.1 -5.3 93.89 -9.3 51.70 -14.1 287,985 10.7 158,560 4.8 14,887,775 -5.0Jun 10 56.3 -1.0 93.05 -9.8 52.36 -10.7 287,985 9.7 162,057 8.6 15,078,794 -2.0Jul 10 57.3 1.9 92.54 -8.7 52.98 -6.9 287,985 8.7 164,888 10.8 15,257,922 1.2
Aug 10 58.4 5.8 91.95 -7.2 53.73 -1.8 287,985 7.8 168,299 14.0 15,474,810 5.8Sep 10 59.1 6.5 91.32 -7.0 53.99 -0.9 287,985 6.9 170,253 13.8 15,547,567 5.9Oct 10 59.0 5.2 91.03 -6.2 53.66 -1.4 287,985 5.9 169,773 11.4 15,454,341 4.5Nov 10 59.8 7.3 90.48 -6.2 54.09 0.6 287,985 5.0 172,144 12.7 15,576,024 5.7Dec 10 60.7 9.4 90.12 -6.0 54.70 2.8 287,985 4.2 174,803 13.9 15,753,352 7.1Jan 11 61.5 11.6 89.75 -6.1 55.23 4.8 287,985 3.3 177,202 15.3 15,904,093 8.2Feb 11 62.4 15.5 89.33 -5.8 55.71 8.9 287,985 2.5 179,592 18.4 16,042,733 11.6Mar 11 63.2 16.4 89.07 -5.6 56.27 9.9 287,985 1.6 181,915 18.3 16,203,676 11.7Apr 11 64.2 18.0 88.74 -5.8 56.93 11.2 287,985 0.8 184,746 19.0 16,395,216 12.1May 11 64.5 17.2 88.71 -5.5 57.24 10.7 287,985 0.0 185,817 17.2 16,482,983 10.7Jun 11 64.6 14.7 89.42 -3.9 57.74 10.3 287,985 0.0 185,959 14.7 16,628,756 10.3Jul 11 64.6 12.8 90.43 -2.3 58.41 10.3 287,985 0.0 186,013 12.8 16,821,996 10.3
Aug 11 64.3 10.0 91.75 -0.2 59.00 9.8 287,985 0.0 185,207 10.0 16,992,074 9.8Sep 11 64.2 8.6 92.94 1.8 59.65 10.5 287,985 0.0 184,838 8.6 17,179,275 10.5Oct 11 64.3 9.1 93.53 2.8 60.18 12.1 287,985 0.0 185,283 9.1 17,330,397 12.1Nov 11 64.1 7.3 94.04 3.9 60.30 11.5 287,985 0.0 184,645 7.3 17,364,742 11.5Dec 11 64.2 5.9 94.17 4.5 60.50 10.6 287,985 0.0 185,030 5.9 17,424,021 10.6

Tab 6 - Twelve Month Moving Average with Percent Change
Amherst, NY Area Selected PropertiesJob Number: 637011_SADIM Staff: MB Created: November 26, 2014
Date Occupancy ADR RevPar Supply Demand Revenue
This Year % Chg This Year % Chg This Year % Chg This Year % Chg This Year % Chg This Year % ChgJan 12 64.7 5.1 94.28 5.0 60.96 10.4 287,985 0.0 186,197 5.1 17,554,320 10.4Feb 12 64.9 4.1 94.55 5.8 61.39 10.2 287,985 0.0 186,962 4.1 17,678,057 10.2Mar 12 65.4 3.5 94.87 6.5 62.04 10.3 287,985 0.0 188,337 3.5 17,867,511 10.3Apr 12 65.4 1.9 95.09 7.2 62.17 9.2 287,985 0.0 188,284 1.9 17,903,917 9.2May 12 65.7 1.9 95.26 7.4 62.62 9.4 287,985 0.0 189,293 1.9 18,032,408 9.4Jun 12 66.8 3.4 95.16 6.4 63.56 10.1 287,985 0.0 192,353 3.4 18,304,969 10.1Jul 12 67.1 3.9 94.61 4.6 63.49 8.7 287,985 0.0 193,259 3.9 18,284,208 8.7
Aug 12 67.9 5.6 94.57 3.1 64.23 8.9 287,985 0.0 195,606 5.6 18,497,638 8.9Sep 12 68.4 6.6 94.17 1.3 64.42 8.0 287,985 0.0 197,004 6.6 18,551,936 8.0Oct 12 68.8 6.9 94.03 0.5 64.65 7.4 287,985 0.0 198,002 6.9 18,618,956 7.4Nov 12 69.1 7.8 93.97 -0.1 64.96 7.7 287,985 0.0 199,087 7.8 18,708,935 7.7Dec 12 69.3 7.8 94.08 -0.1 65.15 7.7 287,985 0.0 199,432 7.8 18,761,751 7.7Jan 13 69.3 7.1 94.27 -0.0 65.28 7.1 287,985 0.0 199,441 7.1 18,801,060 7.1Feb 13 69.5 7.0 94.43 -0.1 65.60 6.9 287,985 0.0 200,052 7.0 18,890,851 6.9Mar 13 69.3 5.9 94.66 -0.2 65.56 5.7 287,985 0.0 199,435 5.9 18,879,345 5.7Apr 13 69.3 6.0 94.81 -0.3 65.72 5.7 287,985 0.0 199,607 6.0 18,925,573 5.7May 13 69.3 5.4 95.22 -0.0 65.98 5.4 287,985 0.0 199,561 5.4 19,001,422 5.4Jun 13 68.8 3.0 95.97 0.8 66.01 3.8 287,985 0.0 198,073 3.0 19,009,098 3.8Jul 13 68.6 2.2 97.06 2.6 66.57 4.8 287,985 0.0 197,502 2.2 19,170,297 4.8
Aug 13 68.3 0.5 97.99 3.6 66.92 4.2 287,985 0.0 196,668 0.5 19,271,399 4.2Sep 13 68.2 -0.3 98.34 4.4 67.06 4.1 287,985 0.0 196,389 -0.3 19,312,866 4.1Oct 13 67.9 -1.3 99.06 5.3 67.26 4.0 287,985 0.0 195,525 -1.3 19,368,848 4.0Nov 13 67.5 -2.4 99.77 6.2 67.32 3.6 291,045 1.1 196,377 -1.4 19,592,481 4.7Dec 13 66.5 -3.9 100.12 6.4 66.61 2.2 294,207 2.2 195,740 -1.9 19,597,788 4.5Jan 14 65.9 -4.9 100.41 6.5 66.13 1.3 297,369 3.3 195,854 -1.8 19,664,956 4.6Feb 14 64.9 -6.6 100.59 6.5 65.26 -0.5 300,225 4.3 194,788 -2.6 19,593,541 3.7Mar 14 64.5 -6.9 100.87 6.6 65.03 -0.8 303,387 5.3 195,583 -1.9 19,728,234 4.5Apr 14 64.1 -7.5 101.20 6.7 64.88 -1.3 306,447 6.4 196,481 -1.6 19,882,997 5.1May 14 63.8 -7.9 101.35 6.4 64.68 -2.0 309,609 7.5 197,588 -1.0 20,025,825 5.4Jun 14 63.8 -7.2 101.18 5.4 64.58 -2.2 312,669 8.6 199,574 0.8 20,193,220 6.2Jul 14 64.1 -6.5 101.84 4.9 65.28 -1.9 315,831 9.7 202,452 2.5 20,618,687 7.6
Aug 14 64.4 -5.6 102.12 4.2 65.80 -1.7 318,993 10.8 205,536 4.5 20,989,214 8.9Sep 14 64.1 -6.0 102.58 4.3 65.73 -2.0 322,053 11.8 206,350 5.1 21,167,278 9.6Oct 14 64.1 -5.6 102.63 3.6 65.79 -2.2 325,215 12.9 208,453 6.6 21,394,364 10.5
STR’s Trend Report is a publication of STR, Inc. and is intended solely for use by paid subscribers. Reproduction or distribution of the Trend Report, in whole or part, without written permission of STR is prohibited and subject to legal action. Site licenses are available. Ownership, distribution and use of the Trend Report and its contents are subject to the terms set forth in the contract you have entered into with STR. Source 2014 STR, Inc.
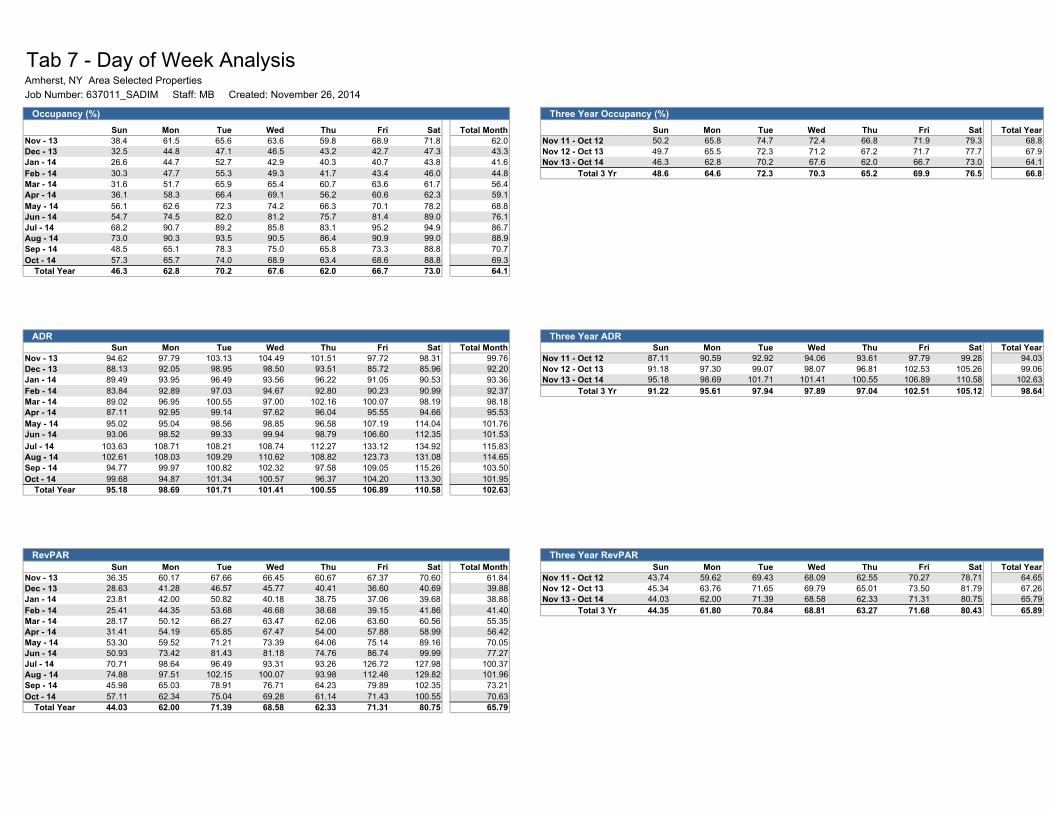
Tab 7 - Day of Week AnalysisAmherst, NY Area Selected PropertiesJob Number: 637011_SADIM Staff: MB Created: November 26, 2014
Occupancy (%) Three Year Occupancy (%)
Sun Mon Tue Wed Thu Fri Sat Total Month Sun Mon Tue Wed Thu Fri Sat Total YearNov - 13 38.4 61.5 65.6 63.6 59.8 68.9 71.8 62.0 Nov 11 - Oct 12 50.2 65.8 74.7 72.4 66.8 71.9 79.3 68.8Dec - 13 32.5 44.8 47.1 46.5 43.2 42.7 47.3 43.3 Nov 12 - Oct 13 49.7 65.5 72.3 71.2 67.2 71.7 77.7 67.9Jan - 14 26.6 44.7 52.7 42.9 40.3 40.7 43.8 41.6 Nov 13 - Oct 14 46.3 62.8 70.2 67.6 62.0 66.7 73.0 64.1Feb - 14 30.3 47.7 55.3 49.3 41.7 43.4 46.0 44.8 Total 3 Yr 48.6 64.6 72.3 70.3 65.2 69.9 76.5 66.8Mar - 14 31.6 51.7 65.9 65.4 60.7 63.6 61.7 56.4Apr - 14 36.1 58.3 66.4 69.1 56.2 60.6 62.3 59.1May - 14 56.1 62.6 72.3 74.2 66.3 70.1 78.2 68.8Jun - 14 54.7 74.5 82.0 81.2 75.7 81.4 89.0 76.1Jul - 14 68.2 90.7 89.2 85.8 83.1 95.2 94.9 86.7Aug - 14 73.0 90.3 93.5 90.5 86.4 90.9 99.0 88.9Sep - 14 48.5 65.1 78.3 75.0 65.8 73.3 88.8 70.7Oct - 14 57.3 65.7 74.0 68.9 63.4 68.6 88.8 69.3
Total Year 46.3 62.8 70.2 67.6 62.0 66.7 73.0 64.1
ADR Three Year ADRSun Mon Tue Wed Thu Fri Sat Total Month Sun Mon Tue Wed Thu Fri Sat Total Year
Nov - 13 94.62 97.79 103.13 104.49 101.51 97.72 98.31 99.76 Nov 11 - Oct 12 87.11 90.59 92.92 94.06 93.61 97.79 99.28 94.03Dec - 13 88.13 92.05 98.95 98.50 93.51 85.72 85.96 92.20 Nov 12 - Oct 13 91.18 97.30 99.07 98.07 96.81 102.53 105.26 99.06Jan - 14 89.49 93.95 96.49 93.56 96.22 91.05 90.53 93.36 Nov 13 - Oct 14 95.18 98.69 101.71 101.41 100.55 106.89 110.58 102.63Feb - 14 83.84 92.89 97.03 94.67 92.80 90.23 90.99 92.37 Total 3 Yr 91.22 95.61 97.94 97.89 97.04 102.51 105.12 98.64Mar - 14 89.02 96.95 100.55 97.00 102.16 100.07 98.19 98.18Apr - 14 87.11 92.95 99.14 97.62 96.04 95.55 94.66 95.53May - 14 95.02 95.04 98.56 98.85 96.58 107.19 114.04 101.76Jun - 14 93.06 98.52 99.33 99.94 98.79 106.60 112.35 101.53
Jul - 14 103.63 108.71 108.21 108.74 112.27 133.12 134.92 115.83Aug - 14 102.61 108.03 109.29 110.62 108.82 123.73 131.08 114.65Sep - 14 94.77 99.97 100.82 102.32 97.58 109.05 115.26 103.50Oct - 14 99.68 94.87 101.34 100.57 96.37 104.20 113.30 101.95
Total Year 95.18 98.69 101.71 101.41 100.55 106.89 110.58 102.63
RevPAR Three Year RevPARSun Mon Tue Wed Thu Fri Sat Total Month Sun Mon Tue Wed Thu Fri Sat Total Year
Nov - 13 36.35 60.17 67.66 66.45 60.67 67.37 70.60 61.84 Nov 11 - Oct 12 43.74 59.62 69.43 68.09 62.55 70.27 78.71 64.65Dec - 13 28.63 41.28 46.57 45.77 40.41 36.60 40.69 39.88 Nov 12 - Oct 13 45.34 63.76 71.65 69.79 65.01 73.50 81.79 67.26Jan - 14 23.81 42.00 50.82 40.18 38.75 37.06 39.68 38.88 Nov 13 - Oct 14 44.03 62.00 71.39 68.58 62.33 71.31 80.75 65.79Feb - 14 25.41 44.35 53.68 46.68 38.68 39.15 41.86 41.40 Total 3 Yr 44.35 61.80 70.84 68.81 63.27 71.68 80.43 65.89Mar - 14 28.17 50.12 66.27 63.47 62.06 63.60 60.56 55.35Apr - 14 31.41 54.19 65.85 67.47 54.00 57.88 58.99 56.42May - 14 53.30 59.52 71.21 73.39 64.06 75.14 89.16 70.05Jun - 14 50.93 73.42 81.43 81.18 74.76 86.74 99.99 77.27Jul - 14 70.71 98.64 96.49 93.31 93.26 126.72 127.98 100.37Aug - 14 74.88 97.51 102.15 100.07 93.98 112.46 129.82 101.96Sep - 14 45.98 65.03 78.91 76.71 64.23 79.89 102.35 73.21Oct - 14 57.11 62.34 75.04 69.28 61.14 71.43 100.55 70.63
Total Year 44.03 62.00 71.39 68.58 62.33 71.31 80.75 65.79

Tab 8 - Raw Data
Amherst, NY Area Selected PropertiesJob Number: 637011_SADIM Staff: MB Created: November 26, 2014
Date Occupancy ADR RevPar Supply Demand Revenue Census & Sample %
This Year % Chg
This Year % Chg
This Year % Chg This Year % Chg This Year % Chg This Year % Chg Census Props Census Rooms
% Rooms STAR Participants
Jan 08 40.7 92.22 37.55 22,103 9,000 829,989 6 713 100.0Feb 08 44.9 92.66 41.57 19,964 8,956 829,879 6 713 100.0Mar 08 48.4 97.00 46.91 22,103 10,690 1,036,907 6 713 100.0Apr 08 54.6 99.55 54.35 21,390 11,678 1,162,545 6 713 100.0May 08 60.3 105.51 63.63 22,103 13,329 1,406,395 6 713 100.0Jun 08 71.0 102.75 72.95 21,390 15,187 1,560,503 6 713 100.0Jul 08 82.9 117.20 97.19 22,103 18,328 2,148,102 6 713 100.0
Aug 08 83.8 118.65 99.40 22,103 18,517 2,197,132 6 713 100.0Sep 08 62.7 101.76 63.85 21,390 13,422 1,365,758 6 713 100.0Oct 08 63.8 101.39 64.67 22,103 14,098 1,429,439 6 713 100.0Nov 08 58.6 99.01 57.98 21,390 12,526 1,240,256 6 713 100.0Dec 08 38.6 97.15 37.49 22,103 8,531 828,750 6 713 100.0Jan 09 34.2 -16.0 93.42 1.3 31.94 -14.9 22,103 0.0 7,556 -16.0 705,917 -14.9 6 713 100.0Feb 09 52.5 17.1 101.83 9.9 53.47 28.6 19,964 0.0 10,483 17.1 1,067,441 28.6 6 713 100.0Mar 09 43.7 -9.7 95.89 -1.1 41.89 -10.7 22,103 0.0 9,655 -9.7 925,846 -10.7 6 713 100.0Apr 09 48.5 -11.2 92.71 -6.9 44.96 -17.3 21,390 0.0 10,374 -11.2 961,790 -17.3 6 713 100.0May 09 57.1 -5.3 98.17 -7.0 56.06 -11.9 22,103 0.0 12,621 -5.3 1,239,009 -11.9 6 713 100.0Jun 09 55.5 -21.8 97.44 -5.2 54.12 -25.8 23,670 10.7 13,147 -13.4 1,281,047 -17.9 7 789 100.0Jul 09 72.9 -12.1 102.82 -12.3 74.99 -22.8 24,459 10.7 17,837 -2.7 1,834,081 -14.6 7 789 100.0
Aug 09 71.0 -15.3 100.47 -15.3 71.31 -28.3 24,459 10.7 17,360 -6.2 1,744,079 -20.6 7 789 100.0Sep 09 65.0 3.6 92.47 -9.1 60.13 -5.8 23,670 10.7 15,390 14.7 1,423,166 4.2 7 789 100.0Oct 09 69.2 8.5 91.11 -10.1 63.08 -2.5 24,459 10.7 16,934 20.1 1,542,848 7.9 7 789 100.0Nov 09 54.5 -6.9 91.74 -7.3 49.99 -13.8 23,670 10.7 12,898 3.0 1,183,229 -4.6 7 789 100.0Dec 09 37.6 -2.6 87.74 -9.7 32.99 -12.0 24,459 10.7 9,195 7.8 806,813 -2.6 7 789 100.0Jan 10 31.9 -6.6 87.85 -6.0 28.06 -12.1 24,459 10.7 7,812 3.4 686,257 -2.8 7 789 100.0Feb 10 38.4 -26.9 88.67 -12.9 34.04 -36.3 22,092 10.7 8,482 -19.1 752,088 -29.5 7 789 100.0Mar 10 47.8 9.5 90.22 -5.9 43.14 3.0 24,459 10.7 11,696 21.1 1,055,236 14.0 7 789 100.0Apr 10 50.4 4.0 90.40 -2.5 45.59 1.4 23,670 10.7 11,937 15.1 1,079,057 12.2 7 789 100.0May 10 64.9 13.6 94.50 -3.7 61.32 9.4 24,459 10.7 15,872 25.8 1,499,874 21.1 7 789 100.0Jun 10 70.3 26.6 88.44 -9.2 62.19 14.9 23,670 0.0 16,644 26.6 1,472,066 14.9 7 789 100.0Jul 10 84.5 15.9 97.41 -5.3 82.31 9.8 24,459 0.0 20,668 15.9 2,013,209 9.8 7 789 100.0
Aug 10 84.9 19.6 94.41 -6.0 80.17 12.4 24,459 0.0 20,771 19.6 1,960,967 12.4 7 789 100.0Sep 10 73.3 12.7 86.25 -6.7 63.20 5.1 23,670 0.0 17,344 12.7 1,495,923 5.1 7 789 100.0Oct 10 67.3 -2.8 88.10 -3.3 59.27 -6.0 24,459 0.0 16,454 -2.8 1,449,622 -6.0 7 789 100.0Nov 10 64.5 18.4 85.46 -6.8 55.13 10.3 23,670 0.0 15,269 18.4 1,304,912 10.3 7 789 100.0Dec 10 48.5 28.9 83.02 -5.4 40.24 22.0 24,459 0.0 11,854 28.9 984,141 22.0 7 789 100.0

Tab 8 - Raw Data
Amherst, NY Area Selected PropertiesJob Number: 637011_SADIM Staff: MB Created: November 26, 2014
Date Occupancy ADR RevPar Supply Demand Revenue Census & Sample %
This Year % Chg
This Year % Chg
This Year % Chg This Year % Chg This Year % Chg This Year % Chg Census Props Census Rooms
% Rooms STAR Participants
Jan 11 41.7 30.7 81.97 -6.7 34.22 22.0 24,459 0.0 10,211 30.7 836,998 22.0 7 789 100.0Feb 11 49.2 28.2 81.93 -7.6 40.32 18.4 22,092 0.0 10,872 28.2 890,728 18.4 7 789 100.0Mar 11 57.3 19.9 86.75 -3.8 49.72 15.3 24,459 0.0 14,019 19.9 1,216,179 15.3 7 789 100.0Apr 11 62.4 23.7 86.04 -4.8 53.68 17.8 23,670 0.0 14,768 23.7 1,270,597 17.8 7 789 100.0May 11 69.3 6.7 93.70 -0.8 64.91 5.9 24,459 0.0 16,943 6.7 1,587,641 5.9 7 789 100.0Jun 11 70.9 0.9 96.38 9.0 68.35 9.9 23,670 0.0 16,786 0.9 1,617,839 9.9 7 789 100.0Jul 11 84.7 0.3 106.48 9.3 90.21 9.6 24,459 0.0 20,722 0.3 2,206,449 9.6 7 789 100.0
Aug 11 81.6 -3.9 106.74 13.1 87.13 8.7 24,459 0.0 19,965 -3.9 2,131,045 8.7 7 789 100.0Sep 11 71.7 -2.1 99.15 15.0 71.11 12.5 23,670 0.0 16,975 -2.1 1,683,124 12.5 7 789 100.0Oct 11 69.1 2.7 94.72 7.5 65.45 10.4 24,459 0.0 16,899 2.7 1,600,744 10.4 7 789 100.0Nov 11 61.8 -4.2 91.54 7.1 56.58 2.6 23,670 0.0 14,631 -4.2 1,339,257 2.6 7 789 100.0Dec 11 50.0 3.2 85.25 2.7 42.66 6.0 24,459 0.0 12,239 3.2 1,043,420 6.0 7 789 100.0Jan 12 46.5 11.4 85.01 3.7 39.55 15.6 24,459 0.0 11,378 11.4 967,297 15.6 7 789 100.0Feb 12 52.7 7.0 87.18 6.4 45.92 13.9 22,092 0.0 11,637 7.0 1,014,465 13.9 7 789 100.0Mar 12 62.9 9.8 91.31 5.3 57.47 15.6 24,459 0.0 15,394 9.8 1,405,633 15.6 7 789 100.0Apr 12 62.2 -0.4 88.82 3.2 55.22 2.9 23,670 0.0 14,715 -0.4 1,307,003 2.9 7 789 100.0May 12 73.4 6.0 95.60 2.0 70.16 8.1 24,459 0.0 17,952 6.0 1,716,132 8.1 7 789 100.0Jun 12 83.8 18.2 95.25 -1.2 79.86 16.8 23,670 0.0 19,846 18.2 1,890,400 16.8 7 789 100.0Jul 12 88.4 4.4 101.06 -5.1 89.36 -0.9 24,459 0.0 21,628 4.4 2,185,688 -0.9 7 789 100.0
Aug 12 91.2 11.8 105.08 -1.6 95.85 10.0 24,459 0.0 22,312 11.8 2,344,475 10.0 7 789 100.0Sep 12 77.6 8.2 94.56 -4.6 73.40 3.2 23,670 0.0 18,373 8.2 1,737,422 3.2 7 789 100.0Oct 12 73.2 5.9 93.19 -1.6 68.19 4.2 24,459 0.0 17,897 5.9 1,667,764 4.2 7 789 100.0Nov 12 66.4 7.4 90.94 -0.6 60.38 6.7 23,670 0.0 15,716 7.4 1,429,236 6.7 7 789 100.0Dec 12 51.4 2.8 87.11 2.2 44.82 5.1 24,459 0.0 12,584 2.8 1,096,236 5.1 7 789 100.0Jan 13 46.6 0.1 88.40 4.0 41.15 4.1 24,459 0.0 11,387 0.1 1,006,606 4.1 7 789 100.0Feb 13 55.4 5.3 90.16 3.4 49.98 8.9 22,092 0.0 12,248 5.3 1,104,256 8.9 7 789 100.0Mar 13 60.4 -4.0 94.34 3.3 57.00 -0.8 24,459 0.0 14,777 -4.0 1,394,127 -0.8 7 789 100.0Apr 13 62.9 1.2 90.90 2.3 57.17 3.5 23,670 0.0 14,887 1.2 1,353,231 3.5 7 789 100.0May 13 73.2 -0.3 100.08 4.7 73.26 4.4 24,459 0.0 17,906 -0.3 1,791,981 4.4 7 789 100.0Jun 13 77.6 -7.5 103.39 8.5 80.19 0.4 23,670 0.0 18,358 -7.5 1,898,076 0.4 7 789 100.0Jul 13 86.1 -2.6 111.45 10.3 95.95 7.4 24,459 0.0 21,057 -2.6 2,346,887 7.4 7 789 100.0
Aug 13 87.8 -3.7 113.86 8.4 99.99 4.3 24,459 0.0 21,478 -3.7 2,445,577 4.3 7 789 100.0Sep 13 76.4 -1.5 98.31 4.0 75.15 2.4 23,670 0.0 18,094 -1.5 1,778,889 2.4 7 789 100.0Oct 13 69.6 -4.8 101.20 8.6 70.47 3.4 24,459 0.0 17,033 -4.8 1,723,746 3.4 7 789 100.0Nov 13 62.0 -6.6 99.76 9.7 61.84 2.4 26,730 12.9 16,568 5.4 1,652,869 15.6 8 891 88.6Dec 13 43.3 -15.9 92.20 5.8 39.88 -11.0 27,621 12.9 11,947 -5.1 1,101,543 0.5 8 891 100.0

Tab 8 - Raw Data
Amherst, NY Area Selected PropertiesJob Number: 637011_SADIM Staff: MB Created: November 26, 2014
Date Occupancy ADR RevPar Supply Demand Revenue Census & Sample %
This Year % Chg
This Year % Chg
This Year % Chg This Year % Chg This Year % Chg This Year % Chg Census Props Census Rooms
% Rooms STAR Participants
Jan 14 41.6 -10.6 93.36 5.6 38.88 -5.5 27,621 12.9 11,501 1.0 1,073,774 6.7 8 891 100.0Feb 14 44.8 -19.2 92.37 2.4 41.40 -17.2 24,948 12.9 11,182 -8.7 1,032,841 -6.5 8 891 100.0Mar 14 56.4 -6.7 98.18 4.1 55.35 -2.9 27,621 12.9 15,572 5.4 1,528,820 9.7 8 891 100.0Apr 14 59.1 -6.1 95.53 5.1 56.42 -1.3 26,730 12.9 15,785 6.0 1,507,994 11.4 8 891 100.0May 14 68.8 -6.0 101.76 1.7 70.05 -4.4 27,621 12.9 19,013 6.2 1,934,809 8.0 8 891 100.0Jun 14 76.1 -1.9 101.53 -1.8 77.27 -3.6 26,730 12.9 20,344 10.8 2,065,471 8.8 8 891 100.0Jul 14 86.7 0.7 115.83 3.9 100.37 4.6 27,621 12.9 23,935 13.7 2,772,354 18.1 8 891 100.0
Aug 14 88.9 1.3 114.65 0.7 101.96 2.0 27,621 12.9 24,562 14.4 2,816,104 15.2 8 891 100.0Sep 14 70.7 -7.5 103.50 5.3 73.21 -2.6 26,730 12.9 18,908 4.5 1,956,953 10.0 8 891 100.0Oct 14 69.3 -0.5 101.95 0.7 70.63 0.2 27,621 12.9 19,136 12.3 1,950,832 13.2 8 891 100.0
STR’s Trend Report is a publication of STR, Inc. and is intended solely for use by paid subscribers. Reproduction or distribution of the Trend Report, in whole or part, without written permission of STR is prohibited and subject to legal action. Site licenses are available. Ownership, distribution and use of the Trend Report and its contents are subject to the terms set forth in the contract you have entered into with STR. Source 2014 STR, Inc.

Tab 9 - Classic
Amherst, NY Area Selected PropertiesJob Number: 637011_SADIM Staff: MB Created: November 26, 2014
Date Occupancy ADR RevPar Supply Demand Revenue Census & Sample %
This Year % Chg This Year % Chg This Year % Chg This Year % Chg This Year % Chg This Year % Chg Census Props Census Rooms% Rooms STAR
ParticipantsJan 08 40.7 92.22 37.55 22,103 9,000 829,989 6 713 100.0Feb 08 44.9 92.66 41.57 19,964 8,956 829,879 6 713 100.0Mar 08 48.4 97.00 46.91 22,103 10,690 1,036,907 6 713 100.0Apr 08 54.6 99.55 54.35 21,390 11,678 1,162,545 6 713 100.0May 08 60.3 105.51 63.63 22,103 13,329 1,406,395 6 713 100.0Jun 08 71.0 102.75 72.95 21,390 15,187 1,560,503 6 713 100.0Jul 08 82.9 117.20 97.19 22,103 18,328 2,148,102 6 713 100.0
Aug 08 83.8 118.65 99.40 22,103 18,517 2,197,132 6 713 100.0Sep 08 62.7 101.76 63.85 21,390 13,422 1,365,758 6 713 100.0Oct 08 63.8 101.39 64.67 22,103 14,098 1,429,439 6 713 100.0Nov 08 58.6 99.01 57.98 21,390 12,526 1,240,256 6 713 100.0Dec 08 38.6 97.15 37.49 22,103 8,531 828,750 6 713 100.0
Oct YTD 2008 61.5 104.85 64.44 216,752 133,205 13,966,649Total 2008 59.3 103.95 61.62 260,245 154,262 16,035,655
Jan 09 34.2 -16.0 93.42 1.3 31.94 -14.9 22,103 0.0 7,556 -16.0 705,917 -14.9 6 713 100.0Feb 09 52.5 17.1 101.83 9.9 53.47 28.6 19,964 0.0 10,483 17.1 1,067,441 28.6 6 713 100.0Mar 09 43.7 -9.7 95.89 -1.1 41.89 -10.7 22,103 0.0 9,655 -9.7 925,846 -10.7 6 713 100.0Apr 09 48.5 -11.2 92.71 -6.9 44.96 -17.3 21,390 0.0 10,374 -11.2 961,790 -17.3 6 713 100.0May 09 57.1 -5.3 98.17 -7.0 56.06 -11.9 22,103 0.0 12,621 -5.3 1,239,009 -11.9 6 713 100.0Jun 09 55.5 -21.8 97.44 -5.2 54.12 -25.8 23,670 10.7 13,147 -13.4 1,281,047 -17.9 7 789 100.0Jul 09 72.9 -12.1 102.82 -12.3 74.99 -22.8 24,459 10.7 17,837 -2.7 1,834,081 -14.6 7 789 100.0
Aug 09 71.0 -15.3 100.47 -15.3 71.31 -28.3 24,459 10.7 17,360 -6.2 1,744,079 -20.6 7 789 100.0Sep 09 65.0 3.6 92.47 -9.1 60.13 -5.8 23,670 10.7 15,390 14.7 1,423,166 4.2 7 789 100.0Oct 09 69.2 8.5 91.11 -10.1 63.08 -2.5 24,459 10.7 16,934 20.1 1,542,848 7.9 7 789 100.0Nov 09 54.5 -6.9 91.74 -7.3 49.99 -13.8 23,670 10.7 12,898 3.0 1,183,229 -4.6 7 789 100.0Dec 09 37.6 -2.6 87.74 -9.7 32.99 -12.0 24,459 10.7 9,195 7.8 806,813 -2.6 7 789 100.0
Oct YTD 2009 57.5 -6.4 96.88 -7.6 55.72 -13.5 228,380 5.4 131,357 -1.4 12,725,224 -8.9Total 2009 55.5 -6.4 95.90 -7.7 53.22 -13.6 276,509 6.2 153,450 -0.5 14,715,266 -8.2
Jan 10 31.9 -6.6 87.85 -6.0 28.06 -12.1 24,459 10.7 7,812 3.4 686,257 -2.8 7 789 100.0Feb 10 38.4 -26.9 88.67 -12.9 34.04 -36.3 22,092 10.7 8,482 -19.1 752,088 -29.5 7 789 100.0Mar 10 47.8 9.5 90.22 -5.9 43.14 3.0 24,459 10.7 11,696 21.1 1,055,236 14.0 7 789 100.0Apr 10 50.4 4.0 90.40 -2.5 45.59 1.4 23,670 10.7 11,937 15.1 1,079,057 12.2 7 789 100.0May 10 64.9 13.6 94.50 -3.7 61.32 9.4 24,459 10.7 15,872 25.8 1,499,874 21.1 7 789 100.0Jun 10 70.3 26.6 88.44 -9.2 62.19 14.9 23,670 0.0 16,644 26.6 1,472,066 14.9 7 789 100.0Jul 10 84.5 15.9 97.41 -5.3 82.31 9.8 24,459 0.0 20,668 15.9 2,013,209 9.8 7 789 100.0
Aug 10 84.9 19.6 94.41 -6.0 80.17 12.4 24,459 0.0 20,771 19.6 1,960,967 12.4 7 789 100.0Sep 10 73.3 12.7 86.25 -6.7 63.20 5.1 23,670 0.0 17,344 12.7 1,495,923 5.1 7 789 100.0Oct 10 67.3 -2.8 88.10 -3.3 59.27 -6.0 24,459 0.0 16,454 -2.8 1,449,622 -6.0 7 789 100.0Nov 10 64.5 18.4 85.46 -6.8 55.13 10.3 23,670 0.0 15,269 18.4 1,304,912 10.3 7 789 100.0Dec 10 48.5 28.9 83.02 -5.4 40.24 22.0 24,459 0.0 11,854 28.9 984,141 22.0 7 789 100.0
Oct YTD 2010 61.6 7.0 91.17 -5.9 56.13 0.7 239,856 5.0 147,680 12.4 13,464,299 5.8Total 2010 60.7 9.4 90.12 -6.0 54.70 2.8 287,985 4.2 174,803 13.9 15,753,352 7.1

Tab 9 - Classic
Amherst, NY Area Selected PropertiesJob Number: 637011_SADIM Staff: MB Created: November 26, 2014
Date Occupancy ADR RevPar Supply Demand Revenue Census & Sample %
This Year % Chg This Year % Chg This Year % Chg This Year % Chg This Year % Chg This Year % Chg Census Props Census Rooms% Rooms STAR
ParticipantsJan 11 41.7 30.7 81.97 -6.7 34.22 22.0 24,459 0.0 10,211 30.7 836,998 22.0 7 789 100.0Feb 11 49.2 28.2 81.93 -7.6 40.32 18.4 22,092 0.0 10,872 28.2 890,728 18.4 7 789 100.0Mar 11 57.3 19.9 86.75 -3.8 49.72 15.3 24,459 0.0 14,019 19.9 1,216,179 15.3 7 789 100.0Apr 11 62.4 23.7 86.04 -4.8 53.68 17.8 23,670 0.0 14,768 23.7 1,270,597 17.8 7 789 100.0May 11 69.3 6.7 93.70 -0.8 64.91 5.9 24,459 0.0 16,943 6.7 1,587,641 5.9 7 789 100.0Jun 11 70.9 0.9 96.38 9.0 68.35 9.9 23,670 0.0 16,786 0.9 1,617,839 9.9 7 789 100.0Jul 11 84.7 0.3 106.48 9.3 90.21 9.6 24,459 0.0 20,722 0.3 2,206,449 9.6 7 789 100.0
Aug 11 81.6 -3.9 106.74 13.1 87.13 8.7 24,459 0.0 19,965 -3.9 2,131,045 8.7 7 789 100.0Sep 11 71.7 -2.1 99.15 15.0 71.11 12.5 23,670 0.0 16,975 -2.1 1,683,124 12.5 7 789 100.0Oct 11 69.1 2.7 94.72 7.5 65.45 10.4 24,459 0.0 16,899 2.7 1,600,744 10.4 7 789 100.0Nov 11 61.8 -4.2 91.54 7.1 56.58 2.6 23,670 0.0 14,631 -4.2 1,339,257 2.6 7 789 100.0Dec 11 50.0 3.2 85.25 2.7 42.66 6.0 24,459 0.0 12,239 3.2 1,043,420 6.0 7 789 100.0
Oct YTD 2011 65.9 7.1 95.10 4.3 62.71 11.7 239,856 0.0 158,160 7.1 15,041,344 11.7Total 2011 64.2 5.9 94.17 4.5 60.50 10.6 287,985 0.0 185,030 5.9 17,424,021 10.6
Jan 12 46.5 11.4 85.01 3.7 39.55 15.6 24,459 0.0 11,378 11.4 967,297 15.6 7 789 100.0Feb 12 52.7 7.0 87.18 6.4 45.92 13.9 22,092 0.0 11,637 7.0 1,014,465 13.9 7 789 100.0Mar 12 62.9 9.8 91.31 5.3 57.47 15.6 24,459 0.0 15,394 9.8 1,405,633 15.6 7 789 100.0Apr 12 62.2 -0.4 88.82 3.2 55.22 2.9 23,670 0.0 14,715 -0.4 1,307,003 2.9 7 789 100.0May 12 73.4 6.0 95.60 2.0 70.16 8.1 24,459 0.0 17,952 6.0 1,716,132 8.1 7 789 100.0Jun 12 83.8 18.2 95.25 -1.2 79.86 16.8 23,670 0.0 19,846 18.2 1,890,400 16.8 7 789 100.0Jul 12 88.4 4.4 101.06 -5.1 89.36 -0.9 24,459 0.0 21,628 4.4 2,185,688 -0.9 7 789 100.0
Aug 12 91.2 11.8 105.08 -1.6 95.85 10.0 24,459 0.0 22,312 11.8 2,344,475 10.0 7 789 100.0Sep 12 77.6 8.2 94.56 -4.6 73.40 3.2 23,670 0.0 18,373 8.2 1,737,422 3.2 7 789 100.0Oct 12 73.2 5.9 93.19 -1.6 68.19 4.2 24,459 0.0 17,897 5.9 1,667,764 4.2 7 789 100.0Nov 12 66.4 7.4 90.94 -0.6 60.38 6.7 23,670 0.0 15,716 7.4 1,429,236 6.7 7 789 100.0Dec 12 51.4 2.8 87.11 2.2 44.82 5.1 24,459 0.0 12,584 2.8 1,096,236 5.1 7 789 100.0
Oct YTD 2012 71.3 8.2 94.88 -0.2 67.69 7.9 239,856 0.0 171,132 8.2 16,236,279 7.9Total 2012 69.3 7.8 94.08 -0.1 65.15 7.7 287,985 0.0 199,432 7.8 18,761,751 7.7
Jan 13 46.6 0.1 88.40 4.0 41.15 4.1 24,459 0.0 11,387 0.1 1,006,606 4.1 7 789 100.0Feb 13 55.4 5.3 90.16 3.4 49.98 8.9 22,092 0.0 12,248 5.3 1,104,256 8.9 7 789 100.0Mar 13 60.4 -4.0 94.34 3.3 57.00 -0.8 24,459 0.0 14,777 -4.0 1,394,127 -0.8 7 789 100.0Apr 13 62.9 1.2 90.90 2.3 57.17 3.5 23,670 0.0 14,887 1.2 1,353,231 3.5 7 789 100.0May 13 73.2 -0.3 100.08 4.7 73.26 4.4 24,459 0.0 17,906 -0.3 1,791,981 4.4 7 789 100.0Jun 13 77.6 -7.5 103.39 8.5 80.19 0.4 23,670 0.0 18,358 -7.5 1,898,076 0.4 7 789 100.0Jul 13 86.1 -2.6 111.45 10.3 95.95 7.4 24,459 0.0 21,057 -2.6 2,346,887 7.4 7 789 100.0
Aug 13 87.8 -3.7 113.86 8.4 99.99 4.3 24,459 0.0 21,478 -3.7 2,445,577 4.3 7 789 100.0Sep 13 76.4 -1.5 98.31 4.0 75.15 2.4 23,670 0.0 18,094 -1.5 1,778,889 2.4 7 789 100.0Oct 13 69.6 -4.8 101.20 8.6 70.47 3.4 24,459 0.0 17,033 -4.8 1,723,746 3.4 7 789 100.0Nov 13 62.0 -6.6 99.76 9.7 61.84 2.4 26,730 12.9 16,568 5.4 1,652,869 15.6 8 891 88.6Dec 13 43.3 -15.9 92.20 5.8 39.88 -11.0 27,621 12.9 11,947 -5.1 1,101,543 0.5 8 891 100.0
Oct YTD 2013 69.7 -2.3 100.72 6.2 70.22 3.7 239,856 0.0 167,225 -2.3 16,843,376 3.7Total 2013 66.5 -3.9 100.12 6.4 66.61 2.2 294,207 2.2 195,740 -1.9 19,597,788 4.5

Tab 9 - Classic
Amherst, NY Area Selected PropertiesJob Number: 637011_SADIM Staff: MB Created: November 26, 2014
Date Occupancy ADR RevPar Supply Demand Revenue Census & Sample %
This Year % Chg This Year % Chg This Year % Chg This Year % Chg This Year % Chg This Year % Chg Census Props Census Rooms% Rooms STAR
ParticipantsJan 14 41.6 -10.6 93.36 5.6 38.88 -5.5 27,621 12.9 11,501 1.0 1,073,774 6.7 8 891 100.0Feb 14 44.8 -19.2 92.37 2.4 41.40 -17.2 24,948 12.9 11,182 -8.7 1,032,841 -6.5 8 891 100.0Mar 14 56.4 -6.7 98.18 4.1 55.35 -2.9 27,621 12.9 15,572 5.4 1,528,820 9.7 8 891 100.0Apr 14 59.1 -6.1 95.53 5.1 56.42 -1.3 26,730 12.9 15,785 6.0 1,507,994 11.4 8 891 100.0May 14 68.8 -6.0 101.76 1.7 70.05 -4.4 27,621 12.9 19,013 6.2 1,934,809 8.0 8 891 100.0Jun 14 76.1 -1.9 101.53 -1.8 77.27 -3.6 26,730 12.9 20,344 10.8 2,065,471 8.8 8 891 100.0Jul 14 86.7 0.7 115.83 3.9 100.37 4.6 27,621 12.9 23,935 13.7 2,772,354 18.1 8 891 100.0
Aug 14 88.9 1.3 114.65 0.7 101.96 2.0 27,621 12.9 24,562 14.4 2,816,104 15.2 8 891 100.0Sep 14 70.7 -7.5 103.50 5.3 73.21 -2.6 26,730 12.9 18,908 4.5 1,956,953 10.0 8 891 100.0Oct 14 69.3 -0.5 101.95 0.7 70.63 0.2 27,621 12.9 19,136 12.3 1,950,832 13.2 8 891 100.0
Oct YTD 2014 66.4 -4.7 103.59 2.8 68.82 -2.0 270,864 12.9 179,938 7.6 18,639,952 10.7
STR’s Trend Report is a publication of STR, Inc. and is intended solely for use by paid subscribers. Reproduction or distribution of the Trend Report, in whole or part, without written permission of STR is prohibited and subject to legal action. Site licenses are available. Ownership, distribution and use of the Trend Report and its contents are subject to the terms set forth in the contract you have entered into with STR. Source 2014 STR, Inc.

Tab 10 - Response ReportAmherst, NY Area Selected PropertiesJob Number: 637011_SADIM Staff: MB Created: November 26, 2014
STR Code Name of Establishment City & State Zip Code Class Aff Date
Open Date Rooms
Chg in Rms J F M A M J J A S O N D J F M A M J J A S O N D J F M A M J J A S O N D
18684 Comfort Inn Buffalo Lockport, NY 14094 Upper Midscale Class Oct 1989 Oct 1989 50 ● ● ● ● ● ● ● ● ● ● ● ● ● ● ● ● ● ● ● ● ● ● ● ● ● ● ● ● ● ● ● ● ● ●3226 Best Western Plus Lockport Hotel Lockport, NY 14094 Upper Midscale Class Jul 2013 Jun 1971 95 ● ● ● ● ● ● ● ● ● ● ● ● ● ● ● ● ● ● ● ● ● ● ● ● ● ● ● ● ● ● ● ● ● ●44425 Hampton Inn Buffalo Wiliamsville Williamsville, NY 14221 Upper Midscale Class Jul 2002 Jul 2002 80 ● ● ● ● ● ● ● ● ● ● ● ● ● ● ● ● ● ● ● ● ● ● ● ● ● ● ● ● ● ● ● ● ● ●24173 DoubleTree Buffalo Amherst Amherst, NY 14226 Upscale Class Jun 2012 May 1987 187 ● ● ● ● ● ● ● ● ● ● ● ● ● ● ● ● ● ● ● ● ● ● ● ● ● ● ● ● ● ● ● ● ● ●23447 Comfort Inn University Amherst Amherst, NY 14226 Upper Midscale Class Mar 2005 Jan 1986 102 ● ● ● ● ● ● ● ● ● ● ● ● ● ● ● ● ● ● ● ● ● ● ● ● ● ● ● ● ● ● ● ● ● ●58630 Candlewood Suites Buffalo Amherst Amherst, NY 14226 Midscale Class Jun 2009 Jun 2009 76 Y ● ● ● ● ● ● ● ● ● ● ● ● ● ● ● ● ● ● ● ● ● ● ● ● ● ● ● ● ● ● ● ● ● ●62768 Staybridge Suites Buffalo Amherst Amherst, NY 14228 Upscale Class Nov 2013 Nov 2013 102 Y ● ● ● ● ● ● ● ● ● ● ●
58 Holiday Inn Buffalo Amherst Amherst, NY 14228 Upper Midscale Class Apr 1967 Apr 1967 199 ● ● ● ● ● ● ● ● ● ● ● ● ● ● ● ● ● ● ● ● ● ● ● ● ● ● ● ● ● ● ● ● ● ●Total Properties: 8 891 ○ - Monthly data received by STR
● - Monthly and daily data received by STRBlank - No data received by STRY - (Chg in Rms) Property has experienced a room addition or drop during the time period of the report.
20132012 2014
STR’s Trend Report is a publication of STR, Inc. and is intended solely for use by paid subscribers. Reproduction or distribution of the Trend Report, in whole or part, without written permission of STR is prohibited and subject to legal action. Site licenses are available. Ownership, distribution and use of the Trend Report and its contents are subject to the terms set forth in the contract you have entered into with STR. Source 2014 STR, Inc.


Lockport, New York, Feasibility Study Page E-34
Demand Analysis The management of the various competitive hotels revealed that room-night demand within the competitive supply is currently generated by two major market segments: commercial segment, 50%, and leisure travelers, 50%, on an annual basis. Commercial Guest Demand Commercial travelers, who are 50% of the market, generally have strong demand for rooms from mid-January to mid-June, and again from mid-September to mid-December. The summer time of mid-June to mid-September has moderate demand, with the mid-December to mid-January period very low. In the more commercially-oriented properties, the weekday market is strongest. This is due to the strength of the commercial market during Monday through Thursday. When extended-stay amenities are added to the guest rooms, the annual guest occupancy increases, as various companies cut travel costs of their personnel. The commercial room demand in the Lockport area is increasing, and hotels are changing their guestroom mix and adding facilities and amenities to cater to this business. Commercial travelers are comprised of corporate business, military and sales personnel. However, government employees are also included in this group. The government business is primarily that of the State of New York with a contribution by national government interests.
Projected Growth Rates Commercial Room Night Demand
Year Weekday Weekend Annual
2017, 2018 1% 0 1% 2019-2021 1% 0 1%
Source: Interim Hospitality Consultants Leisure Demand Leisure travelers represent 50% of demand for lodging accommodations in the competitive market area. This segment is made up of vacationing families, followed by individual senior citizens, amateur athletes, and motor coach tours. The average length of stay was 1.1 days according to information supplied by interviews with local hotels. The following are the projected growth rates for leisure room-night demand for the years 2017 to 2021.

Lockport, New York, Feasibility Study Page E-35
Projected Growth Rates Leisure Room Night Demand
Year Weekday Weekend Annual
2017, 2018 0% 1% 1% 2019-2021 0% 1% 1%
Source: Interim Hospitality Consultants Proposed Hotel Base Year As of the date of this Study, December, 2014, it is understood that the property will open in 2016 at the earliest. Therefore, the first full base year of the hotel will be 2017.
Base Year and Projected Market Demand, Available Rooms and Occupancy
Year
Leisure 50%
Commercial 50%
Total Guestroom
Nights Occupied
100%
Annual
Available Rooms-A
Market Set Occupancy-B
2017 4,380 4,380 8,760 14,600 60.0% 2018 4,599 4,599 9,198 14,600 63.0% 2019 4,745 4,745 9,490 14,600 65.0% 2020 4,978 4,978 9,955 14,640 68.0% 2021 5,110 5,110 10,220 14,600 70.0%
Source: Interim Hospitality Consultants Annual Available Rooms Comfort Inn 50 Best Western Plus 95 Subtotal Rooms: 145
Subject: The Inn at the Locks Ascend Collection 40 Total Rooms 185
Projected Annual Growth Rate 2017-2018 2019-2021
Commercial Room Demand 1.0% 1.0% Leisure Room Demand 1.0% 1.0% Annual Total Projected Growth Rate 2.0% 2.0%

Lockport, New York, Feasibility Study Page E-36
Summary As the City of Lockport does not have a first class hotel, the following hotels were combined to report their historical Occupancy and Average Daily Rate from January 2008 through October 2014.
Hotel
City
Franchise Date
Date Opened
Number of Rooms
Comfort Inn Buffalo Lockport, NY Oct 1989 Oct 1989 50 Best Western Plus Lockport Hotel Lockport, NY Jul 2013 Jun 1971 95 Hampton Inn Buffalo Wiliamsville Williamsville, NY Jul 2002 Jul 2002 80 DoubleTree Buffalo Amherst Amherst, NY Jun 2012 May 1987 187 Comfort Inn University Amherst Amherst, NY Mar 2005 Jan 1986 102 Candlewood Suites Buffalo Amherst Amherst, NY Jun 2009 Jun 2009 76 Staybridge Suites Buffalo Amherst Amherst, NY Nov 2013 Nov 2013 102 Holiday Inn Buffalo Amherst Amherst, NY Apr 1967 Apr 1967 199 Total 891
Source: Smith Travel Research, Hendersonville, Tennessee
Market Trend Lockport, New York
Competitive Market Set
Year Occupancy Average Daily Rate
2008 59.3% $103.95 2009 55.5% $ 95.90 2010 60.7% $ 90.12 2011 64.2% $ 94.17 2012 69.3% $ 94.08 2013 66.5% $100.12 2014* 64.0% $100.00
Source: Smith Travel Research, Hendersonville, Tennessee *By factoring the 2013 November and December actual data, an occupancy of 64% for 2014 is projected at an Average Daily Rate of $100.00. This represents the past three years’ Average Occupancy of 66.7% at $98.67 ADR for the Lockport hotel market. The uniqueness of the upscale boutique hotel will have a marketing draw from Toronto, Canada to Syracuse, New York, to Pittsburgh, Pennsylvania to Cleveland, Ohio and all points within.

Lockport, New York, Feasibility Study Page F-1
PROPOSED FACILITIES AND SERVICES
Based on the demand for lodging accommodations in the competitive market area of the proposed hotel, and the review of the pertinent characteristics of area visitors, the following general comments regarding the nature and scope of the facilities and services to be provided by the proposed hotel are presented.
Site Plan The Market Research for this Feasibility Study has revealed that there is sufficient demand for a 40-room upscale, full-service hotel. The Market Research has selected the Inn at the Locks by the Ascend Collection, of Choice Hotels International. Other “soft” franchise firms include: • Autograph by Marriott • Premier Collection by Best Western • Curio by Hilton • RL Hotels by Red Lion

Lockport, New York, Feasibility Study Page F-2
Site Plan The 40-room Inn at the Locks to be located at 57 Richmond Avenue in Lockport, New York, will be oriented to provide ease of guest usage and feature a 40-person Meeting Room, an indoor swimming pool along with a Sun Deck, and an evening fire pit. The existing building is a three story structure, with a partial basement. Plans call for utilization of the basement and the addition of two stories to present five-story boutique hotel. The west side of the building will provide a motor entrance with a one-lane porte-co-chère. The east side of the building, adjacent to a city park with a gazebo will have a street level dining patio designed to provide access to the park. The north side of the property is the parking lot. The south side is the Erie Canal locks. Hotel Features • Elevator. A new elevator from the basement to the fifth floor is required. • Basement on lower level. The basement is under the oldest part of the
structure on the west side. Adjacent space seems to be available for the hotel housekeeping department, laundry drop from each floor, and building maintenance shop.
• Ground Floor. The ground floor will feature: 1. Hotel Lobby 2. Guest Registration at two office desks 3. Lobby Bar 4. Hotel Restaurant, open to the east side park 5. 40-person Meeting Room 6. Administrative offices 7. Hotel kitchen 8. The hotel “back door” is to the north parking lot • Second, Third and Fourth Floors Architectural Resources of Buffalo, New York, has proposed twelve rooms
on each floor, of adequate size for: 6 Queen bedrooms 1 Queen/Queen Bedroom 5 King bedrooms

Lockport, New York, Feasibility Study Page F-3
The guest room layout of a typical transient hotel. Possible consideration should be given to update the design to eliminate the bathtub/shower in lieu of walk-in dual showers for two, added bath vanity counter space, hospitality center of refrigerator/freezer, microwave and coffee maker. In essence, design the guest rooms to emulate Curio by Hilton, Even by IHG, or Edition by Marriott.
A guest lobby is illustrated on each floor, which is an excellent space for a
Guest Library, Billiards Room, or Business Center on the three floors. • Fifth Floor, Roof Top The top floor will feature four king bedrooms/sofa parlor Executive Suites. An Aquatic Center of indoor pool, fitness center and sauna, all open to a
rooftop sun deck and evening fire pit facing to the southwest to feature the sunset.
Room Mix The Market Research for this Study revealed that 50% of the market is the commercial guest and 50% is leisure, as discussed in the Supply and Demand Section of this study.
Inn at the Locks by the Ascend Collection Lockport, New York
Proposed Room Mix 18 Queen Room
3 Queen/Queen Room 15 King Room
4 King Sofa Suite 40 Total Rooms
Source: Interim Hospitality Consultants Ascend Collection Hotel Membership The Ascend Collection program, as with all “soft” hotel brands, is not a traditional franchise concept. Ascend Collection is an upscale membership program that enables the individual hotel to retain its own name and signage, while utilizing the specific Choice Hotels resources which work best for the Inn at The Locks in Lockport, New York. The Ascend Collection Unique product class is a collection of properties which are as diverse as the collection itself. These upscale niche hotels are found in all markets from

Lockport, New York, Feasibility Study Page F-4
urban centers to small towns, and resort locations. They offer themed experiences (i.e., water park, log cabins, and ski lodge) that permeate through the entire property and includes themed-styled amenities with energetic guest service. The guest room FF&E packages are styled consistently with the themed experience with case goods and complete décor. The common area spaces reflect the local area and property’s identity, which includes design elements that are representative of this local feel. In addition to existing properties with significant local brand equity, there can be new construction properties in this class. These properties must have created their own brand identity and local marketing plans, such as the Inn at the Locks in Lockport, New York. Summary The Market Research for this Feasibility Study has revealed that there is sufficient demand for a 40-room upscale, full-service hotel. The Market Research has selected the Inn at the Locks by the Ascend Collection, of Choice Hotels International. Other “soft” franchise firms include: • Autograph by Marriott • Premier Collection by Best Western • Curio by Hilton • RL Hotels by Red Lion Site Plan The 40-room Inn at the Locks to be located at 57 Richmond Avenue in Lockport, New York, will be oriented to provide ease of guest usage and feature a 40-person Meeting Room, an indoor swimming pool along with a Sun Deck, and an evening fire pit. The existing building is a three story structure, with a partial basement. Plans call for utilization of the basement and the addition of two stories to present five-story boutique hotel. The west side of the building will provide a motor entrance with a one-lane porte-co-chère. The east side of the building, adjacent to a city park with a gazebo will have a street level dining patio designed to provide access to the park. The north side of the property is the parking lot. The south side is the Erie Canal locks.

Lockport, New York, Feasibility Study Page F-5
Hotel Features • Elevator. A new elevator from the basement to the fifth floor is required. • Basement on lower level. The basement is under the oldest part of the
structure on the west side. Adjacent space seems to be available for the hotel housekeeping department, laundry drop from each floor, and building maintenance shop.
• Ground Floor. The ground floor will feature: 1. Hotel Lobby 2. Guest Registration at two office desks 3. Lobby Bar 4. Hotel Restaurant, open to the east side park 5. 40-person Meeting Room 6. Administrative offices 7. Hotel kitchen 8. The hotel “back door” is to the north parking lot • Second, Third and Fourth Floors Architectural Resources of Buffalo, New York, has proposed twelve rooms
on each floor, of adequate size for: 6 Queen bedrooms 1 Queen/Queen Bedroom 5 King bedrooms The guest room layout of a typical transient hotel. Possible consideration
should be given to update the design to eliminate the bathtub/shower in lieu of walk-in dual showers for two, added bath vanity counter space, hospitality center of refrigerator/freezer, microwave and coffee maker. In essence, design the guest rooms to emulate Curio by Hilton, Even by IHG, or Edition by Marriott.
A guest lobby is illustrated on each floor, which is an excellent space for a
Guest Library, Billiards Room, or Business Center on the three floors. • Fifth Floor, Roof Top The top floor will feature four king bedrooms/sofa parlor Executive Suites. An Aquatic Center of indoor pool, fitness center and sauna, all open to a
rooftop sun deck and evening fire pit facing to the southwest to feature the sunset.

Lockport, New York, Feasibility Study Page F-6
Room Mix The Market Research for this Study revealed that 50% of the market is the commercial guest and 50% is leisure, as discussed in the Supply and Demand Section of this study.
Inn at the Locks by the Ascend Collection Lockport, New York
Proposed Room Mix 18 Queen Room
3 Queen/Queen Room 15 King Room
4 King Sofa Suite 40 Total Rooms
Source: Interim Hospitality Consultants
Ascend Collection Hotel Membership The Ascend Collection program is not a traditional franchise concept. Ascend Collection is an upscale membership program that enables the individual hotel to retain its own name and signage, while utilizing the specific Choice Hotels resources which work best for the Inn at the Locks. The Ascend Collection Unique product class is a collection of properties which are as diverse as the collection itself. These upscale niche hotels are found in all markets from urban centers to small towns, and resort locations. They offer themed experiences (i.e., water park, log cabins, and ski lodge) that permeate through the entire property and includes themed-styled amenities with energetic guest service. The guest room FF&E packages are styled consistently with the themed experience with case goods and complete décor. The common area spaces reflect the local area and property’s identity, which includes design elements that are representative of this local feel. In addition to existing properties with significant local brand equity, there can be new construction properties in this class. These properties must have created their own brand identity and local marketing plans, such as the Inn at the Locks in Lockport, New York.

Lockport, New York, Feasibility Study Page F-7
Inn at the Locks by the Ascend Collection Hotel Information
The following pages illustrate the hotel prototype of lobby, administration, housekeeping, guest rooms, meeting room, and amenities in the proposed hotel as well as information about the Inn at the Locks by the Ascend Collection Hotel. Additional information from the franchisor is presented in their literature found in the Conclusions Section of this Study.


Lockport, New York, Feasibility Study Page F-34
Environmental Concerns Information from the U.S. Green Building Council (USGBC) is presented at the end of this Section F. The information is provided as a base to assist in the development of a “Green” development/building project.
Leadership in Energy and Environmental Design (LEED®®) Green Building Rating System
Welcome to USGBC The U.S. Green Building Council is a 501(c)(3) nonprofit community of leaders working to make Green Buildings available to everyone within a generation. The U.S. Green Building Council (USGBC) is a Washington, D.C. –based 501(c)(3) nonprofit organization committed to a prosperous and sustainable future for our nation through cost-efficient and energy-saving Green Buildings. USGBC works toward its mission of market transformation through its LEED® Green Building certification program, robust educational offerings, a nationwide network of chapters and affiliates, the annual Greenbuild International Conference & Expo, and advocacy in support of public policy that encourages and enables Green Buildings and communities. The LEED® Green Building certification program is a voluntary, consensus-based national rating system for buildings designed, constructed and operated for improved environmental and human health performance. LEED® addresses all building types and emphasizes state-of-the-art strategies in five areas sustainable site development, water savings, energy efficiency, materials and resources selection, and indoor environmental quality. LEED® Rating Systems What is LEED®? The Leadership in Energy and Environmental Design (LEED®) Green Building Rating System™ encourages and accelerates global adoption of sustainable Green Building and development practices through the creation and implementation of universally understood and accepted tools and performance criteria. LEED® is a third-party certification program and the nationally accepted benchmark for the design, construction and operation of high performance Green Buildings. LEED® gives building owners and operators the tools they need to have an immediate and

Lockport, New York, Feasibility Study Page F-35
measurable impact on their buildings’ performance. LEED® promotes a whole-building approach to sustainability by recognizing performance in five key areas of human and environmental health: sustainable site development, water savings, energy efficiency, materials selection and indoor environmental quality. Who uses LEED®? Architects, real estate professionals, facility managers, engineers, interior designers, landscape architects, construction managers, lenders and government officials all use LEED® to help transform the built environment to sustainability. State and local governments across the country are adopting LEED® for public-owned and public-funded buildings; there are LEED® initiatives in federal agencies, including the Departments of Defense, Agriculture, Energy, and State; and LEED® projects are in progress in 41 different countries, including Canada, Brazil, Mexico and India. How is LEED® Developed? LEED® Rating Systems area developed through an open, consensus-based process led by LEED® communities. Each volunteer committee is composed of a diverse group of practitioners and experts representing a cross-section of the building and construction industry. The key elements of USGBC’s consensus process include a balanced and transparent committee structure, technical advisory groups that ensure scientific consistency and rigor, opportunities for stake holder comment and review, member ballot of new rating systems, and a fair and open appeals process. LEED® Version 3 The LEED® Green Building certification program’s greatest strength lies in its consensus-based, transparent, ongoing development cycle. The next version of LEED® is here! On April 27, 2009, USGBC launched LEED® v3. The ability to be flexible allows LEED® to evolve, taking advantage of new technologies and advances in building science while prioritizing energy efficiency and CO2 emissions reductions. Project Certification As part of the newly launched LEED® v3, the Green Building Certification Institute (GBCI) has assumed administration of LEED® certification for all commercial and institutional projects registered under any LEED® Rating System. LEED® certification provides independent, third-party verification that a building project meets the highest Green building and performance measures. Sustainable building strategies should be considered early in the development cycle. An integrated project team will include the major stakeholders of the project such as the developer/owner, architect, engineer, landscape architect, contractor, and asset and property management staff. Implementing an integrated, systems-oriented approach to Green project design,

Lockport, New York, Feasibility Study Page F-36
development and operations can yield synergies and improve the overall performance of a building. Initial LEED® assessment will bring the project team together to evaluate and articulate the project’s goals and the certification level sought. There are both environmental and financial benefits to earning LEED® certification. LEED®-certified buildings are designed to: Lower operating costs and increase asset value. Reduce waste sent to landfills. Conserve energy and water. Be more healthful and safer for occupants. Reduce harmful greenhouse gas emissions. Qualify for tax rebates, zoning allowances and other incentives in hundreds of
cities. Demonstrate an owner’s commitment to environmental stewardship and social
responsibility. Eligibility Commercial buildings as defined by standard building codes are eligible for certification under the LEED® for New Construction, LEED® for Existing Buildings, LEED® for Commercial Interiors, LEED® for Retail, LEED® for Schools, and LEED® for Core & Shell rating systems. Building types include – but are not limited to – offices, retail and service establishments, institutional buildings (e.g., libraries, museums and religious institutions), hotels and residential buildings of four or more habitable stories. Green Building Research The built environment has a profound impact on our natural environment, economy, health, and productivity. In the United States alone, buildings account for: 72% of electricity consumption, 39% of energy use, 38% of all carbon dioxide (CO2) emissions, 40% of raw materials use, 30% of waste output (136 million tons annually), and 14% of potable water consumption.

Lockport, New York, Feasibility Study Page F-37
Benefits of Green Building Environmental benefits: Enhance and protect ecosystems and biodiversity. Improve air and water quality. Reduce solid waste. Conserve natural resources. Economic Benefits: Reduce operating costs. Enhance asset value and profits. Improve employee productivity and satisfaction. Optimize life-cycle economic performance. Health and community benefits: Improve air, thermal, and acoustic environments. Enhance occupant comfort and health. Minimize strain on local infrastructure. Contribute to overall quality of life. Rankings of Completed Projects Under LEED® there are 100 possible Base Points distributed across six credit categories: Sustainable Sites. Water Efficiency. Energy and Atmosphere. Materials and Resources. Indoor Environmental Quality. Innovation in Design. An additional four points may be received for Regional Priority Credits and six points for Innovation in Design. Total points buildings can qualify for four levels of certification: A. LEED® Platinum 80 and above B. LEED® Gold 60 and above C. LEED® Silver 50 and above D. LEED® Certified 40 and above

Lockport, New York, Feasibility Study Page G-1
PROJECTED UTILIZATION OF THE PROPOSED HOTEL
The supply and demand analysis included general overviews of the Lockport, New York, market area, a detailed analysis of the properties projected to provide competition to the proposed hotel, a discussion of the characteristics of room-night demand, and projections of future room supply and demand within the competitive environment. In this section, the information which has been presented in the preceding chapters is synthesized to project the utilization of the proposed hotel. Projected Market Penetration and Occupancy Market Penetration.
The potential occupancy of the proposed hotel has been evaluated in terms of its “Fair Share” of market demand. Fair share is the number of rooms in the proposed hotel as a percentage of the total market area supply. There are presently no hotels which would compete with the proposed hotel. The number of units in the proposed hotel, the projected market area available rooms per day, and the resulting fair share percentage for the period 2017 through 2021 are listed below:

Lockport, New York, Feasibility Study Page G-2
Fair Share of the Proposed
Inn at the Locks by the Ascend Collection 2017 – 2021
Year
Number of Rooms in Proposed Hotel
Projected Market Area Supply of
Rooms
Projected Fair Share
of Proposed Hotel 2017 40 40 100.0% 2018 40 40 100.0% 2019 40 40 100.0% 2020 40 40 100.0% 2021 40 40 100.0%
Source: Interim Hospitality Consultants
Induced Room Demand represents hotel guests who are attracted to the Market Area due to new attractions or the specific hotel new amenities not found in the competitive hotels in Lockport, New York.
Assuming that each competitive property, including the proposed hotel, were to receive only its fair share of the market demand from 2017 through 2021, each would achieve projected occupancies ranging from 60.0% in 2017 to 70.0% in 2021, the projected market set occupancy, during the projection period.
To further refine the analysis and to take into account the qualitative factors affecting the occupancy of a lodging facility, the proposed hotel’s competitive position was evaluated by an analysis that relates the most important factors which influence a potential guest’s choice of lodging facilities. Such a comparison of the hotel’s advantages and disadvantages indicates the degree to which a hotel could penetrate a given market relative to its fair share. Market penetration (percent of fair share) is the percentage of demand actually accruing to a hotel, calculated as the ratio between the number of rooms occupied in the property and the fair share of occupied rooms attributable to that property. The proposed hotel must capture a portion of both (1) current room-night demand, and (2) growth in demand for overnight accommodations, to obtain the projected occupancy levels.
In this instance, the proposed property should have a number of competitive advantages. Its competitors may be considered less desirable by potential market users due to the lack of certain characteristics which will be unique to the proposed facility. The following factors and assumptions are major considerations in determining the penetration potential of the proposed hotel relative to its competitors:
1. Location: At 57 Richmond Avenue, Lockport, New York.

Lockport, New York, Feasibility Study Page G-3
2. Accessibility and Visibility: Extremely good accessibility coupled with excellent street corner visibility.
3. Market Orientation: The proposed hotel would be directly positioned to the
commercial guest in addition to the leisure market segment.
4. Room Mix:
Inn at the Locks by the Ascend Collection Lockport, New York
Proposed Room Mix 18 Queen Room
3 Queen/Queen Room 15 King Room
4 King Sofa Suite 40 Total Rooms
Source: Interim Hospitality Consultants Included in the room mix will be an appropriate number of rooms with full access for the physically challenged.
5. Room Amenities: Oversized beds with plush duvet covers and triple sheets,
spacious work desk, ergonomic chair, two telephones with voice mail and data port, complimentary wireless and wired Internet access, plus hospitality center with a microwave oven, refrigerator/freezer, coffee maker with complimentary coffee and tea refreshed daily.
6. Hotel Amenities: Meeting space to accommodate small to mid-sized groups,
a complimentary 24-hour business center, 24-hour fitness room, roof top Aquatic Center with swimming pool, whirlpool, dry sauna, and sun deck with fire pit.
7. Full service Restaurant, Lounge, and 40-person Meeting Room.
8. Newness: The project will be the newest hotel in the competitive supply,
thereby offering more appeal to the proposed property.
9. National Franchise: The facility will gain instant name recognition and set itself apart from other competitive hotels when it positions itself in the upscale, full-service boutique hotel market.
10. Hotel Management: The facility will be professionally managed and
aggressively marketed.

Lockport, New York, Feasibility Study Page G-4
While the foregoing is primarily a qualitative analysis, it represents a fair approximation of the projected market situation based on the fieldwork.
The proposed hotel’s market penetration and underlying assumptions are summarized as follows:
1. Leisure: Due to the hotel being marketed as the number-one quality product
in the upscale, full service boutique hotel classification, the hotel’s projected penetration of fair market share will be 100.0% over the five-year projection period.
2. Commercial: The fair market share of commercial business is projected to be
100.0%. This can be achieved with a professional sales marketing effort. If for any reason the tourist business declines through seasonality or energy shortages, state and local commercial solicitation must be made to offset the decline.
3. Occupancy: The projected occupancy should be attainable if the property is
built as described, professionally operated in all facets, and business of the area continues to be positive. In years 3 to 5, additional competition may materialize to substantially reduce the projections.
Market Penetration is the percentage of demand for rooms projected for the
proposed Inn at the Locks by the Ascend Collection. It is calculated as the ratio between the number of rooms projected to be occupied at the proposed hotel against the Fair Share of occupied rooms attributed to the hotel’s Market Set.
To calculate Market Penetration, information from the Supply and Demand Analysis Section of this Study indicates: Step One: a. Total of year round Hotel Market Set of Rooms 40 b. Times estimated average occupancy 60.0% c. Times days in year 365 d. Equals total Guest Room Nights 8,784 e. Times Inn at the Locks by the Ascend Collection Fair Share 100.0% f. Equals the Goal of Guest Room Nights the Inn at the Locks by the Ascend Collection must achieve 8,784

Lockport, New York, Feasibility Study Page G-5
Step Two: a. Convert the projected Inn at the Locks by the Ascend
Collection 2017 occupancy of 60% into Occupied Guest Room Nights 8,784 b. Divided by the Goal of 8,784 c. Equals the Inn at the Locks by the Ascend Collection Market Penetration 100.0% Market Penetration must be at least 100% to be equal with the hotel’s Market Set of competitors. The higher the total is over 100, the stronger the leadership of the hotel. If the Market Penetration is under 100, then something is wrong in the hotel’s image, features, or marketing, and must be corrected.
Future Years Market Penetration 2018 2019 2020 2021
100.0% 100.0% 100.0% 100.0%
Consecutive Market Penetration for future years with no addition to the Market
Set and prior to operations success.
Projected 40-Room Inn at the Locks by the Ascend Collection Projected Market
Penetration, Room-Night Demand and Occupancy 2017 2018 2019 2020 2021 Projected Room Demand Leisure 50.0% 4,380 4,599 4,745 4,978 5,110 Commercial 50.0% 4,380 4,599 4,745 4,978 5,110 Total Demand 100.0% 8,760 9,198 9,490 9,955 10,220 Fair Share Ratio 100.0% 100.0% 100.0% 100.0% 100.0% Projected Penetration as a Percentage of Fair Market Share 100.0% 100.0% 100.0% 100.0% 100.0% Projected Market Penetration Leisure 50.0% 4,392 4,599 4,745 4,978 5,110 Commercial 50.0% 4,392 4,599 4,745 4,978 5,110 Total Market Penetration 100.0% 8,784 9,198 9,490 9,955 10,220 Available Rooms at the Proposed Hotel 40 14,640 14,600 14,500 14,640 14,600 Projected Occupancy 60.0% 63.0% 65.0% 68.0% 70.0% Source: Interim Hospitality Consultants Note: Totals may not foot due to rounding.

Lockport, New York, Feasibility Study Page G-6
Inn at the Locks by the Ascend Collection Lockport, New York
Optimum Proforma Year One
Summer
Peak Shoulder
Balance of
Year 2017 Months Days
6,7,8 92
5,9 61
3,4,10 92
1,2,11,12 213
458
Room Mix # Rooms Queen Room 18 200.00 150.00 125.00 100.00 Queen/Queen Room 3 225.00 175.00 150.00 125.00 King Room 15 250.00 200.00 175.00 150.00 King Sofa Suite 4 275.00 250.00 225.00 200.00 Total Rooms: 40 Optimum Revenue Queen Room 18 331,200 164,700 207,000 383,400 1,086,300 Queen/Queen Room 3 62,100 32,025 41,400 79,875 215,400 King Room 15 345,000 183,000 241,500 479,250 1,248,750 King Sofa Suite 4 101,200 61,000 82,800 170,400 415,400 Total Optimum Revenue 40 839,500 440,725 572,700 1,112,925 2,965,850 Seasonal Occupancy 90.0% 80.0% 65.0% 40.0% 60.4% Optimum Guest Room Nights 3,680 2,440 3,680 8,520 18,320 Seasonal Guest Room Nights 3,312 1,952 2,392 3,408 11,064 Seasonal Revenue 755,550 352,580 372,255 445,170 1,925,555 Seasonal Average Daily Rate 228.13 180.63 155.63 130.63 174.04
Average Daily Rate Use 175.00 Occupancy Use 60.0%
Projected Average Room Rate
The projections of average room rate for the proposed hotel are based on the following factors:
1. The competitive market position of the proposed hotel as one of the newest projects in the area.
2. The assumption that the proposed hotel will be professionally managed and
aggressively marketed.
3. The assumption that the proposed hotel will be affiliated with a national franchise chain.
4. The assumption that the proposed upscale, full-service boutique hotel will
command a rate, somewhat commensurate with competition of higher room rates.

Lockport, New York, Feasibility Study Page G-7
A detailed review of recent trends in room rate increases to estimate the impact of inflation was conducted along with the consideration of the specific experience of the hotels in the competitive market.
Based on the above assumptions and details, the proposed Inn at the Locks by the Ascend Collection Hotel should achieve an initial average rate $175.00 in the first stabilized year of operations, 2017.
An inflation rate of 5% per year was assumed. The following table summaries the current year (inflated) dollar room rates projected for the proposed hotel.
Projected Average Room Rate
(Current Year Dollars) Year Average Room Rate 2017 $175.00 2018 $180.00 2019 $185.00 2020 $191.00 2021 $197.00
Source: Interim Hospitality Consultants The projected average room rates could be materially different if significantly
higher or lower rates of inflation are actually experienced. Since the actual rates of inflation cannot be predicted with any degree of certainty, no assurance is given that the actual average room rates achieved will not vary materially from those projected in this Study.
Summary Based upon the occupancy of the Inn at the Locks by the Ascend Collection, the proposed hotel’s Total Market Penetration and underlying assumptions are summarized as follows:
1. Leisure: Due to the hotel being marketed as the number-one quality product
in the upscale, full-service boutique hotel classification, the hotel’s projected penetration of fair market share will be 100.0% over the five-year projection period.
2. Commercial: The fair market share of commercial business is projected to be
100.0%. This can be achieved with a professional sales marketing effort. If for any reason the tourist business declines through seasonality or energy

Lockport, New York, Feasibility Study Page G-8
shortages, state and local commercial solicitation must be made to offset the decline.
3. Occupancy: The projected occupancy should be attainable if the property is built as described, professionally operated in all facets, and business of the area continues to be positive. In years 3 to 5, additional competition may materialize to substantially reduce the projections. These projections are based on estimates and assumptions developed in connection with the Feasibility Study. However, certain assumptions may not materialize, and unanticipated events and circumstances may occur; therefore, actual results achieved during the projection period may vary from the forecasts, and the variations may be material.
Proposed Inn at the Locks by the Ascend Collection
Lockport, New York
Year
Occupancy
Average Daily Rate
Room Revenue
2017 60.0% $175.00 $1,537,200 2018 63.0% $180.00 $1,655,640 2019 65.0% $185.00 $1,755,650 2030 68.0% $191.00 $1,901,440 2021 70.0% $197.00 $2,013,340
Source: Interim Hospitality Consultants

Lockport, New York, Feasibility Study Page H-1
FINANCIAL PROFORMA
Projections of the annual operating results for the proposed Inn at the Locks by the Ascend Collection were prepared for five years, 2017 through 2021 and presented in U.S. Dollars. The projections are based on the results of operations in comparable facilities and our calculations regarding the environment in which the proposed hotel would operate. The bases found on the following pages were prepared in constant dollars, December 2014, with slight inflation increases noted in the Proforma Schedules.
The PKF Hospitality Research Trends in the Hotel Industry- USA Edition-2014 Report for Upscale Full Service Hotels, is positioned as a benchmark for the Proforma of the proposed hotel. The hotel is scheduled to open during 2016, thus the first full year will be 2017. The Proforma for 2017 was calculated by line-item classifications of all types of Revenues, Payroll and Other Expenses in each Department. These Schedules have been prepared according to the guidelines set forth in the “Uniform System of Accounts for the Lodging Industry, Eleventh Revision Edition.” Subsequent years of the Proforma were adjusted to inflation and normal usage factors of an upscale boutique hotel.
The accompanying projections are based on estimates and assumptions developed in connection with the Feasibility Study. However, some assumptions inevitably will not materialize, and unanticipated events and circumstances may occur, therefore, actual results achieved during the projection period will vary from the projections and the variations may be material.

Lockport, New York, Feasibility Study Page H-2
Inn at the Locks by the Ascend Collection Lockport, New York Proforma Year One
40 Rooms Schedule 1 of 10 Full Year Ratio % Full Year Available Suite Nights 14,640 Dollars Occupancy 60% Per Occupied Suite Nights 8,784 Available Average Daily Rate 175.00 Room RevPar 105.00 Revenues
Rooms 1,537,200 59.7% 105.00 Food 623,080 24.2% 42.56 Beverage 187,400 7.35 12.80 Other F&B 181,280 7.0% 12.38 Retail Center 26,350 2.1% 1.80 Other Hotel 17,570 0.7% 1.20 Total Revenue 2,572,880 100.0% 175.74 Departmental Profit Rooms 1,212,670 78.9% 82.83 Telecommunications (8,340) 0.0% (0.57) Food & Beverage Department 287,920 29.0% 19.67 Retail Center 15,370 58.3% 0.58 Other 8,790 50.0% 0.60 Total Departmental (House) Profit 1,516,410 58.9% 103.11 Deductions From Income Administrative & General 142,840 5.6% 9.76 Sales & Marketing 107,000 4.2% 7.31 Complimentary Guest Services 4,990 0.2% 0.34 Marketing Fee Room Revenue x 2.5% 38,430 1.5% 2.63 Franchise Fee Room Revenue x 4.0% 61,490 2.4% 4.20 Repairs & Maintenance 64,800 2.5% 4.43 Utilities 46,520 1.8% 3.18 Total Deductions From Income 466,070 18.1% 31.84 Gross Operating Profit 1,050,340 40.8% 71.28 Fixed Costs Management Fee 77,190 3.0% 5.27 Real Estate Taxes – Allowance 30,000 1.2% 2.05 Insurance – Allowance 15,000 0.6% 1.02 Replacement Reserves 25,730 1.0% 1.76 Total Fixed Costs 147,920 5.7% 10.10 Net Operating Income Before Debt Service 902,420 35.1% 61.17 Debt Service Cash Flow
0.0% 0.0%
0.0% 0.0%
Source: Interim Hospitality Consultants

Lockport, New York, Feasibility Study Page H-3
Inn at the Locks by the Ascend Collection Lockport, New York Proforma Year One
Rooms Department Schedule 2 of 10 Rooms Revenue 1,537,200 Payroll F P Per Unit of Factor
Front Office
Front Office Manager Annual Salary Front Desk Clerks/Reserv. 2 1 Hourly Rate $10.00 52,000 Concierge Bell Staff/Doorman 1 1 Daily x 8 hr x $9.00 28,080 Night Auditor Staff 1 1 Daily x 8 hr x $12.00 37,440 Subtotal Front Office Wages 4 3
117,520
Housekeeping Executive Housekeeper 1 Salary $30,000 30,000 Inspectress Staff Daily x 8 hr x Houseman Staff 2 Daily x 8 hr x $9.00 18,720 Laundry Staff 2 Daily x 8 hr x $9.00 18,720 Housekeepers 1 1 Occupied Suites/year 8,784 Suites Cleaned/Maid/day 16.0 Housekeeping Days/year 549 Housekeeping Hours/year 4,392 Wage/Hour $9.00 Housekeeper’s Wages 39,530 Subtotal Housekeeping Wages 2 5
106,970
Total Rooms Department Wage 224,490 Taxes and Benefits 33,670 Total Room Department Payroll 258,160 As Percentage of Room Revenue
16.8%
Other Expenses Cable Television Month 400.00 4,800 Carpet Cleaning Suite/6 mo. 2.00 160 China/Glass/Silver Month 200.00 2,400 Cleaning Supplies Occupied Suite 0.50 4,390 Drapery Month 20.00 240 Frequent Guest Program Room Revenue 0.50% 7,690 Guest Supplies Occupied Suite 1.00 8,780 Laundry Supplies Occupied Suite 0.35 3,070 Linen Occupied Suite 2.00 17,570 Miscellaneous Month 500.00 6,000 Printing Occupied Suite 0.35 3,070 Travel Agent Commission Occupied Suite 0.25 2,200 Uniforms Month 500.00 6,000 Total Other Expenses
66,370
As Percentage of Room Revenue 4.3% Rooms Department Profit 1,212,670 As Percentage of Room Revenue 78.9% Per Occupied Room
138.05

Lockport, New York, Feasibility Study Page H-4
Inn at the Locks by the Ascend Collection
Lockport, New York Proforma Year One Minor Departments
Schedule 3 of 10 Departments FT PT Rate Revenue per
Occupied Suite Ratio
Telecommunications* 0.00 Expense 0.95 100.0% Profit -0.95 (8,340) Retail Center** Revenue 3.00 26,350 100.0% Expense of Goods -1.25 -10,980 41.7% Wages Front Desk Taxes and Benefits Profit 1.74 15,370 58.3% Other* Revenue 2.00 17,570 100.0% Expense 1.00 8,780 50.0% Profit 1.00 8,790 50.0% * Expenses of Telephone, Internet and Cell Phone Charges ** Revenue of Valet Cleaning, Meeting Room, FAX, ATM, Vending, etc.
Schedule 4 of 10
Total Hotel Payroll Employees
FT PT
Wages Taxes and Benefits
Total Payroll
Rooms Front Office 4 3 117,520 17,628 135,150 5.35 Housekeeping 2 5 106,970 16,046 123,020 4.8% Subtotal Rooms Department 6 8 224,490 33,670 258,160 10.0% Food and Beverage Department 6 12 311,400 113,960 425,360 42.9% Retail Department 0 0 Administrative and General Administrative Wages 1 1 70,000 10,500 80,500 3.1% Security Payroll 0 0 Subtotal A&G Department 1 1 70,000 10,500 80,500 3.1% Food and Beverage Comp Services Sales & Marketing 1 0 40,000 6,000 46,000 1.8% Repair & Maintenance 1 0 40,000 6,000 46,000 1.8% Grand Total Hotel Payroll 15 21 685,890 170,130 856,020 16.7% Note: Totals may not foot due to rounding

Lockport, New York, Feasibility Study Page H-5
Inn at the Locks by the Ascend Collection Lockport, New York Proforma Year One
Food & Beverage Department
40 Rooms Schedule 5 of 10 PKF
Factor Total
Annual % of
Revenue Food Department Food Revenue 15,577 623,080 100.0% Cost of Food Consumed 4,183 167,320 26.9% Less Cost of Employee Meals 262 10,480 1.7% Net Cost of Food Sales 3,921 156,840 25.2% Food Gross Profit 11,655 466,200 74.8% Beverage Department Beverage Net Revenue 4,685 187,400 100.0% Cost of Beverage Sales 1,005 40,200 21.5% Beverage Gross Profit 3,680 147,200 78.5% Food and Beverage Department Total Food and Beverage Revenue 20,262 810,480 100.0% Net Cost of Food and Beverage Sales 4,926 197,040 19.9% Gross Profit on Combined Sales 15,336 613,440 61.9% Public Room Retails 946 37,840 3.8% Other Income 3,586 143,440 14.5% Other F&B Revenue 4,532 181,280 100.0% Gross Profit and Other Income 19,868 794,720 80.1% Departmental Expenses Salaries and Wages 7,785 311,400 31.4% Payroll Burden 2,849 113,960 11.5% Subtotal Payroll 10,634 425,360 42.9% Laundry and Dry Cleaning 141 5,640 0.6% China, Glassware, Silver, Linen 197 7,880 0.8% Contract Cleaning 268 10,720 1.1% Other 1,430 57,200 5.8% Subtotal Other Expenses Food & Beverage Departmental Expenses 12,670 506,800 100.0% Total Food & Beverage Department Income 7,198 287,920 29.0% Source: Parnell Kerr Foster

Lockport, New York, Feasibility Study Page H-6
Inn at the Locks by the Ascend Collection
Lockport, New York Proforma Year One
Administrative and General Schedule 6 of 10
Per Unit of Factor
Payroll F P Manager 1 Annual Salary $50,000 50,000 Assistant Manager Secretary/Accounting 1 Annual Salary $40,000 20,000 70,000 Subtotal Admin. Payroll 1 1 Taxes & Benefits 15.0% 10,500 10,500 Subtotal Office Payroll Security Staff Daily x 8 hr x Taxes & Benefits Subtotal:Security Payroll Total Admin. & Gen. Payroll
80,500
Other Expenses Accounting Fees Month 500.00 6,000 Audit Fees Unbudgeted Bank Charges Month 30.00 360 Computer Expense Month 200.00 2,400 Credit Card Commission Room Revenue 2.0% 30,740 Legal Fees Unbudgeted Licenses Annual 1,000 Miscellaneous Month 500.00 6,000 Office Expenses Occupied Suite 0.35 3,070 Printing Occupied Suite 0.35 3,070 Radios, 2-Way Month 75.00 900 Telephone Expenses Occupied Suite 0.50 4,400 Trade Association Dues Annual 2,000 Travel Expenses Month 200.00 2,400 Total Other Expenses
62,340
Total Administrative and General 142,840 As Percentage of Total Revenue 5.6% Per Occupied Room 16.26

Lockport, New York, Feasibility Study Page H-7
Inn at the Locks by the Ascend Collection
Lockport, New York Proforma Year One
Food & Beverage Complimentary Services Schedule 7 of 10
F P Per Unit of Factor
Breakfast Restaurant Operations 6 am - 10 am, M-F 7 am - 11 am, S, S Hostess Daily x 3 hr x 7 days Social Hour Lounge Operations 5 pm - 7 pm, M-Th Desk Clerk Daily x 2 hr x 4 days Total Wages Taxes & Benefits Total Payroll
Other Expenses Per Food – Breakfast Occupied Suite Food - Social Hour Occupied Suite Liquor/Beer/Wine Occupied Suite Paper Products Occupied Suite 0.50 4,390 Newspapers Occupied Suite 50.00 600 Seasonal Items Month Total Other Expenses
4,990
Total Food & Beverage Complimentary Service 4,990 Per Occupied Room 0.57

Lockport, New York, Feasibility Study Page H-8
Inn at the Locks by the Ascend Collection
Lockport, New York Proforma Year One Sales and Marketing
Schedule 8 of 10
Per Unit of Factor Payroll F P Director of Sales 1 Salary $40,000 40,000 Sales Manager Salary Secretary Staff Salary Total Wages 40,000 Tax and Benefits 15.0% 6,000 Total Payroll 1 46,000 Advertising Billboards Month Print—Magazine Month 3,000 36,000 Print—Newspaper Month Radio/Television Month Airport Month Internet Month 1,000 12,000 Production Annual 1,000 1,000 Yellow Pages Month Total Advertising 49,000 Public Relations Contributions Month 200 2,400 Travel Month 400 4,800 Trade Shows One (1) per year Guest Relations Month 200 2,400 Total Public Relations 9,600 Promotions Brochures Pre-Opening Expense Direct Mail Month Merchandise Month 200 2,400 Total Promotions 2,400 Total Sales and Marketing 107,000 As a percentage of Total Revenue 4.2% Per Occupied Room 12.18
Inn at the Locks by the Ascend Collection National Fees
Marketing Fee 2.5% of Room Revenue Year 1 $38,430 2.5%
of Room Revenue Year 2 $41,390
2.5% of Room Revenue Year 3 $43,890
2.5% of Room Revenue Year 4 $47,540
2.5% of Room Revenue Year 5 $50,330
Franchise Fee 4.0% of Room Revenue Year 1 $61,490 4.0% of Room Revenue Year 2 $66,230 4.0% of Room Revenue Year 3 $70,230 4.0% of Room Revenue Year 4 $76,060 4.0% of Room Revenue Year 5 $80,530

Lockport, New York, Feasibility Study Page H-9
Inn at the Locks by the Ascend Collection
Lockport, New York Proforma Year One
Utilities Schedule 9 of 10
Per Unit of Factor
Electric Occupied Suite 1.75 15,372 Gas Occupied Suite 1.50 13,176 Water/Sewer Occupied Suite 1.50 13,176 Refuse
Month 400.00 4,800
Total Utilities 46,520 As a percentage of Total Revenue 1.8% Per Occupied Room 5.30
Repairs and Maintenance Schedule10 of 10
Payroll F P Chief Engineer 1 Salary 40,000 Part-Time Worker Daily x 8 hr x Subtotal Wages 40,000 Taxes & Benefits 15.0% 6,000 Total Repair & Maint Payroll
46,000
Other Expenses Electrical Month 50.00 600 Plumbing Month 50.00 600 HVAC Month 50.00 600 Building Month 50.00 600 Suites - Bedrooms Month 50.00 600 Suites – Micro-Fridge Month 50.00 600 Grounds Month 50.00 600 Parking Lot Annual 5,000 Pest Control Month 50.00 600 Light Bulbs Month 50.00 600 Television/VCP Month 50.00 600 Uniforms Month 50.00 600 Pool/Spa Month 100.00 1,200 Hotel Vehicles Month Miscellaneous Month 500.00 6,000 Total Other Expenses
18,800
Total Repair & Maintenance Expenses 64,800 As a percentage to Total Revenues 2.5% Per Occupied Room 7.38

North Tonawanda, New York, Feasibility Study Page H-10
Five-Year Proforma Inn at the Locks by the Ascend Collection, Lockport, New York
40 Rooms 2017 2018 2019 2020 2021 Occupancy 60.0% 63.0% 65.0% 68.0% 70.0% Average Daily Rate 175.00 180.00 185.00 191.00 197.00 RevPar 105.00 113.40 120.25 129.88 137.90 Revenue Rooms 1,537,200 59.7% 1,655,640 60.4% 1,755,650 61.1% 1,901,440 61.9% 2,013,340 62.6% Food 623,080 24.2% 652,450 23.8% 673,160 23.4% 706,160 23.0% 724,940 22.5% Beverage 187,400 7.3% 196,230 7.2% 202,460 7.0% 212,390 6.9% 218,040 6.8% Other F&B 181,280 7.0% 189,820 6.9% 195,850 6.8% 205,450 6.7% 210,920 6.6% Retail Center 26,350 2.1% 27,590 1.0% 28,470 1.0% 28,470 0.9% 30,660 1.0% Other 17,570 0.7% 18,400 0.7% 18,980 0.7% 19,910 0.6% 20,440 0.6% Total Revenues 2,577,880 100.0% 2,740,130 100.0% 2,874,570 100.0% 3,073,820 100.0% 3,218,340 100.0% Departmental Profit Rooms 1,212,670 78.9% 1,324,510 80.0% 1,422,080 81.0% 1,540,170 81.0% 1,630,810 81.0% Telecommuications (8,340) (8,740) (9,000) (9,270) (9,550) Food & B Department 287,920 29.0% 301,490 29.0% 311,060 29.0% 326,310 29.0% 334,990 29.0% Retail Center 15,370 58.3% 16,090 58.3% 16,610 58.3% 17,420 61.2% 17,880 58.3% Other 8,790 50.0% 9,200 50.0% 9,490 50.0% 9,960 50.0% 10,220 50.0% Total Departmental Profit 1,516,410 58.9% 1,642,550 59.9% 1,750,240 60.9% 1,884,590 61.3% 1,984,350 61.7% Deductions from Income Administrative & General 142,840 5.6% 149,570 5.5% 154,320 5.4% 161,890 5.3% 166,190 5.2% Telecommunications Sales & Marketing 107,000 4.2% 112,040 4.1% 115,600 4.0% 121,270 3.9% 124,490 3.9% Complimentary Guests Services 4,990 0.2% 5,230 0.2% 5,390 0.2% 5,660 0.2% 5,810 0.2% Marketing Fee Rm Rev x 2.5% 38,430 1.5% 41,390 1.5% 43,890 1.5% 47,540 1.5% 50,330 1.6% Franchise Fee Rm Rev x 4.0% 61,490 2.4% 66,230 2.4% 70,230 2.4% 76,060 2.5% 80,530 2.5% Repair & Maintenance 64,800 2.5% 67,850 2.5% 70,010 2.4% 73,440 2.4% 75,390 2.3% Utilities 46,520 1.8% 48,710 1.8% 50,260 1.7% 52,720 1.7% 54,130 1.7% Total Deductions from Income 466,070 18.1% 491,020 17.9% 509,700 17.7% 538,580 17.5% 556,870 17.3% Gross Operating Profit 1,050,340 40.8% 1,151,530 42.0% 1,240,540 43.2% 1,346,010 43.8% 1,427,480 44.4% Fixed Costs Real Estate Taxes - Allowance 30,000 1.2% 30,500 1.1% 31,000 1.1% 31,500 1.0% 32,000 1.0% Management Fee 77,190 3.0% 82,200 3.0% 86,240 3.0% 92,210 3.0% 96,550 3.0% Insurance – Allowance 15,000 0.6% 15,500 0.6% 16,000 0.6% 16,500 0.4% 17,000 0.5% Replacement Reserves 25,730 1.0% 27,400 1.0% 28,750 1.0% 30,740 1.0% 32,180 1.0% Total Fixed Costs 147,920 5.7% 155,600 5.7% 161,990 5.6% 170,950 5.6% 177,730 5.5% Net Operating Income Before Debt Service
902,420
35.1%
995,930
36.3%
1,078,550
37.5%
1,175,060
38.2%
1,249,750
38.8%
Debt Service Cash Flow
Source: Interim Hospitality Consultants, 850/893-6010 – December 12, 2014

North Tonawanda, New York, Feasibility Study Page H-11
UPSCALE, FULL-SERVICE HOTELS Performance in 2014 Each year PKF Consulting of San Francisco, California, the Research Department of Parnell Kerr Foster, the International Hospitality Industry Accounting firm, publishes Trends in the Hotel Industry, USA Edition – 2014. The data reported are the benchmark against which hotel companies and individual proprietors measure their operating picture against the overall results in their segment of the industry. Hotel tables from the report are presented: 1. Ratios to Total Revenues 2. Ratios to Departmental Revenues 3. Summary – Dollars per Available Room 4. Dollars per Available Room The following information is provided as a background to illustrate the segment as it relates to a 40-room Inn at the Locks by the Ascend Collection Hotel in Lockport, New York:
1. Trends in the Hotel Industry, USA Edition - 2014 2. Tax Incentives for Hotels 3. Potential Sources of Hotel Financing 4. Lodging Guide to Management Companies
6. Interim Hospitality Consultants 7. Letter of Agreement


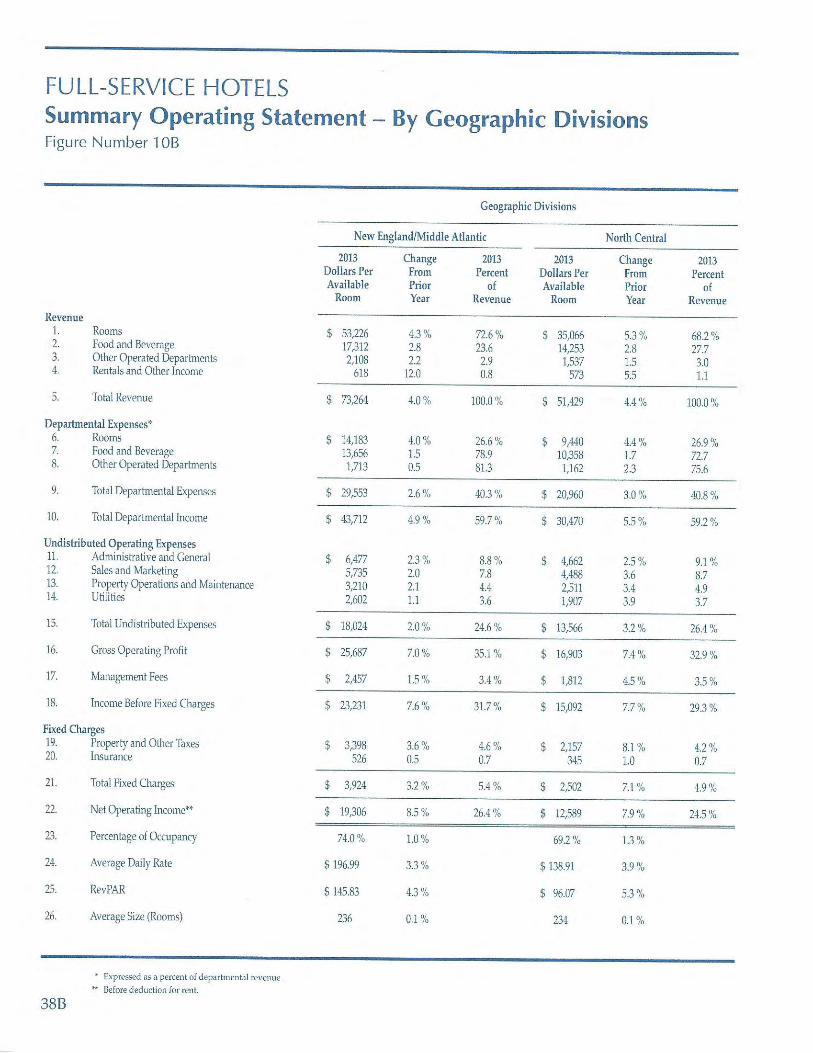


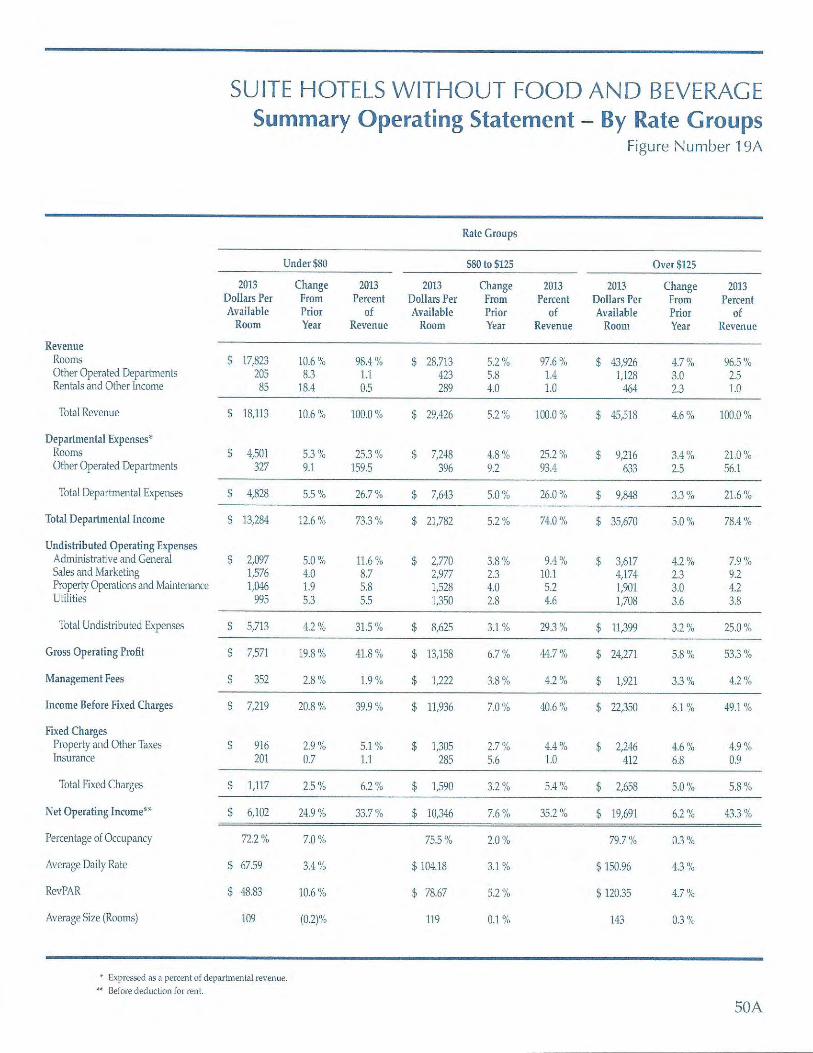


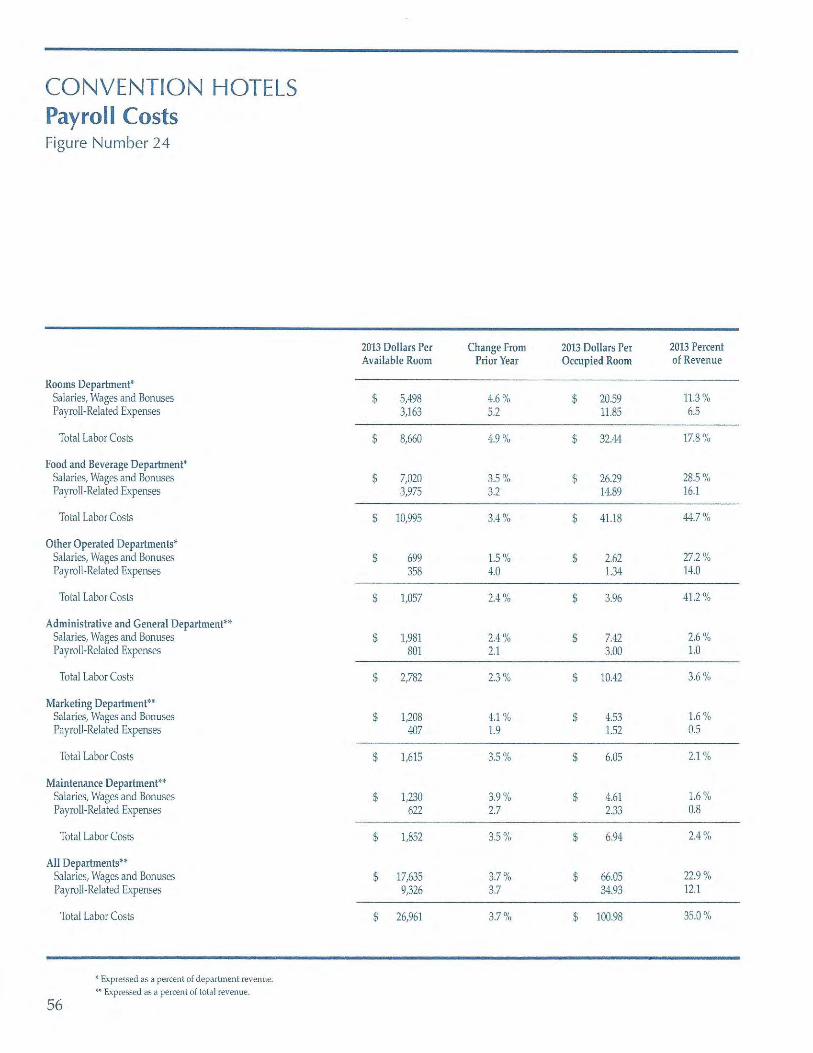


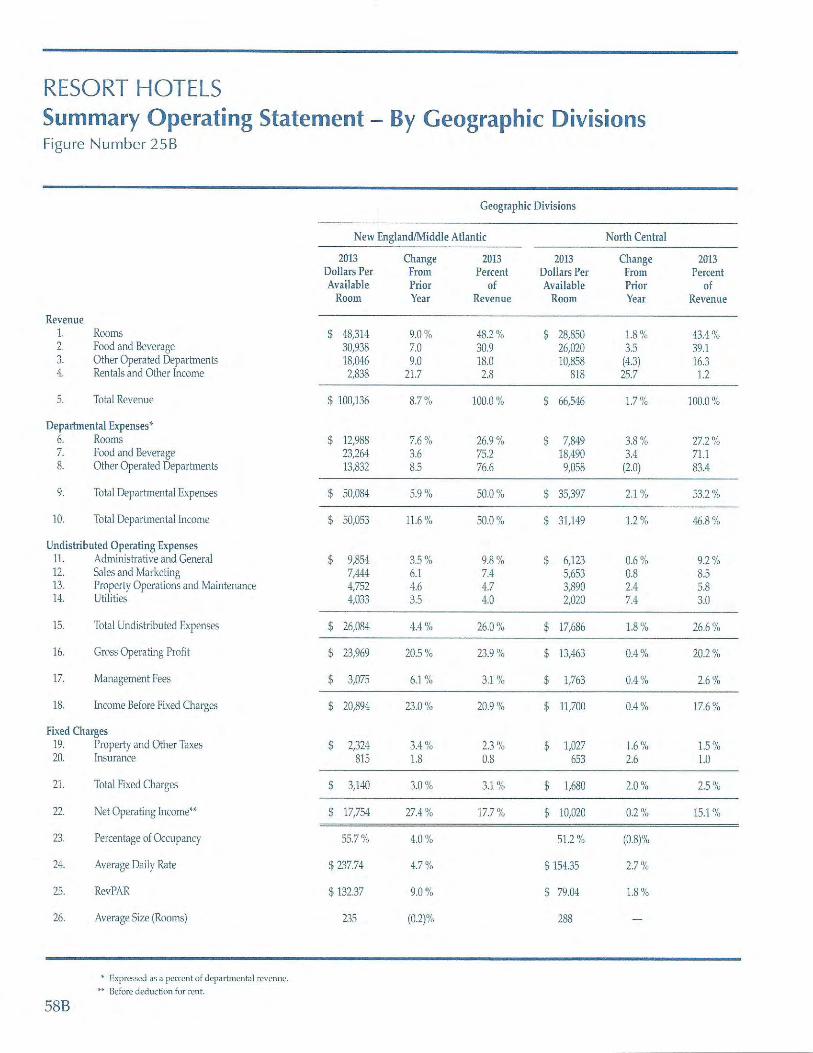


6 rsrneLrsHED LEADERS
INTERSTATE HOTETS AND RESORTSAwholly-owned subsidiary of a jointventure
between Thayer Lodging Group and Jin JiangHotels, 5O-year-old Interstate Hotels andResorts seeks to deliver consistently impressiveresults for real estate investors, ownershipgroups, publicly traded REITs, privately heldcompanies, and private equity funds. Thecompany has developed an operating strategythat combines economies of scale with agilityin deploying resources, all intended to realizeowners' investment goals.
O Total number of rooms managed:58,656
O Total number of properties managed: 309
O Number of third-party rooms managed: 56,711
O Number of third-party properties managed: 303
O Regional footprint: 37 states and Washington,
D.C., across every region
O Total gross revenue: $2.6 billion
a contact name: Leslie Ng
O Contact email: [email protected]
AIMBRIDGE HOSPITATITYAimbridge Hospitalityt objective is to drivehotel operating performance to a level thatexceeds industry averages. Aimbridge's teamofoperating executives strives to combineindustry best practices with rigorous hands-on management. In the hospitality business,performance results are driven by revenuegeneration and operating controls. Property-based teams are held accountable for generatingsales in their backyard as opposed to waiting forthe brands to deliver opportunities.
O Total number of rooms managed:25,935
O Total number of properties managed: 189
O Number of third-party rooms managed: 25,935
O Number of third-party properties managed: I89
O Regional footprint: 29 states across every region
O Total gross revenue: Not disclosed
O Contact name: David Capps
O Contact email: David.capps@aimhosp com
GFMANAGEMENTSince 1988, Philadelphia-based GFManagement, a fu ll -service hospitalityownership and management company, hasworked on behalf of a variety of individualowners, real estate funds, and institutionallenders. GF closely partners with HiltonWorldwide, Marriott International, StarwoodHotels and Resorts Worldwide. IHG. CarlsonRezidor Hotel Group, Wyndham Hotel Group,and Choice Hotels International, among others.GF specialties include property management,flnancial turnarounds, and asset and third-partymanagement.
a Total number of rooms managed:191682
O Total number of properties managed: Il7
O Number of third-partv rooms managed:16,764
O Number of third-party properties managed: 103
O Regional footprint: 28 states across every region
O Total gross revenue: $52O million
O Contact name: Jefftey Kolessar
a contact email: kolessarj@gflrotels com
NOTE: NUMBERS ARE FOR JAN, 1, 2013, THROUGH JUNE 30, 2013,U.S, ONLY COIVPANIES ARE SORTED BY NUIVBER OF ROOI\4S.
r O O e t U e V n O n Z t r u E C O t t t 3

CRESCENT HOTETS AND RESORTS
fr\ttma--t
@f-
@Imor-momna
An independent, third-parly operator forinstitutional-grade properties and clients,Crescent Hotels and Resorts manages upper-upscale full-service convention and resortproperties as well as premium-branded,select-service properties. The company hasbeen approved to operate brands within theMarriott International, Hilton Worldwide,Starwood Hotels and Resorts Worldwide, HyattHotels Corp., IHG, Wyndham Hotel Group andCarlson Rezidor Hotel Group brand families.Crescent also has a long history operatingindeoendent hotels.
O Total number of rooms managed: 18,652
O Total number of properties rnanaged'.74
O Number of third-party rooms managed: 18,652
O Number of third-party properties managed: 74
a Regional footprint: 25 states and Washington,
D.C., across every region
O Total gross revenue: $72O million
i cont".t n".": Ariel Sanett
O Contact email: [email protected]
TPG HOSPITATITYTPG Hospitality, an independent managementaffiliate of The Procaccianti Group founded in1964, has a national portfolio with propertiesin 24 states. TPG is a fully accredited operatorof Hilton Worldwide, Hyatt Hotels Corp., IHG,Marriott International, Wyndham Hotel Group,and Starwood Hotels and Resorts Worldwide.It works with numerous private, public,and institutional-grade partners, deliveringcomprehensive hospitality management, assetmanagement, and development services.
O Total number of rooms managed: l7r88l
O Total number of properties managed: 63
O Number of third-partv rooms managed: I7,88I
a Number of thlrd-party properties managed: 63
O Regional footprint: 24 states across every region
O Total gross revenue: $700 million+
a Contact name: Ralph V Izzi Jr.
a Contact email: [email protected]
HHMHHM provides furnkey hotel management, assetmanagement, and receivership for propertieswith leading brand affiliations through MarriottInternational, Hilton Worldwide, HyattHotels Corp., Starwood Hotels and ResortsWorldwide, and IHG. The companyalso operatesindependenthotels. HHM seeks to leadbyexample to ensure fiscal discipline and resultsaccountability. Its goal is to exceed owners'expectations, while giving back to the localcommunities in which the hotels operate.
O Total number of rooms managed: l7r8OO
O Total number of propertles managed: I5O
O Number of third-party rooms managed: 17,800
O Number of third-partv properties managed: I50
O Regional footprlnt: 19 states and WashinAton,
D.C., across every region
O Total gross revenue: Not disclosed
O Contact name: Naveen P. Kakarla, President
and CEO
a Contact emall: [email protected]
NOTE: NUMBERS ARE FOR JAN 1, 2013, THROUGH JUNE 30. 2013,U.S, ONLY COMPANIES ARE SORTED BY NUMBER OF ROOIVS.
Looe t rueune l zn r cou 7

MANAGEMENT COMPANIES
PYRAMID HOTEL GROUPA privately owned, Boston-based hotel andresort management companywith more than 35years of experience, the Pyramid Hotel Groupprovides hotel management, asset management,and project management services to a varietyofhotel assets, ranging from a 9O-room select-service property to a I,000-room conventionhotel. Pyramid is a franchisee of numerousmajor hotel brand companies and an operatorofindependent four-star and five-star hotelsand resorts.
O Total number of rooms managed:17,486
O Total number of propertl€s managed: 53O Number of third-party rooms managed: 17,486
O Number of thlrd-party propertl€s managed: 53a Regional footprint: 22 states and Washington"
D.C., across every region
O Totaf gross revenue: $768167,651
O Contact name: John Hamilton
O Contact omall: jhamilton@
pyramidhotelgroup.com
REMINGTONBased in Dallas, Remington has a range ofproperty and project management assignmentscoast to coast and a workforce of more than6,000 associates. The company's expertisespans a variety oflodging types, segments,and locations. Remington has partnered withmost of the industry's leading brands, workingto implement each brand's operational andquality standards.
a Total number of rooms m6neg6d: 15168l
O Total numbar of propertl€s maneged: 79
O Number of thlrd-party rooms managed 15,483
O Number of thlrd-party propertles managed: 78
O Reglonal footprlnt: 2l states and Washington,
D.C., across everyregion
o Total gross revenue: $34I million
a Contact nam€: Robert Haiman
a Contact email: roberthaiman@
remingtonhotels.com
NOTE: NUMBERS ARE FOR JAN 1, 2013, THROUGH JUNE 30, 2013,U.S, ONLY COIVIPANIES ARE SORTED BY NUMBER OF ROON/S
DGINGMAGAZINE COM

DAVIDSON HOTETS AND RESORTS
/!\(tmU)--l
Ff-
aImc]r-momna
Davidson Hotels and Resorts'goal has beenconsistent fbr the morc than 4O years it hasbeen in operation: to create and maximize assetvalue for its property owners. The privatelyheld company focuses on the upper-upscale andnear-luxury industry segments as well as high-density select-service hotels and is an approvedoperator of Hyatt Hotcls Corp., Starwood Hotelsand Resorts Worldwide, Hilton Worldwide, andMarriott International full-service brands.
O Total number of rooms managed:12,97O
O Total number of properties managed: 45
O Number of third-party rooms managed:12,970
O Number of third-party properties managed: 45
O Regional footprint: 23 states and Washington,
D.C , across evcry region
O Total gross revenue: Not disclosed
O Contact name: Steve Margol
a Contact email: [email protected]
RIMHOSPITALITYFounded in 1983 and hcadquartered in NewportBeach, Calif., Rim Hospitality representsconvention center, lull-sewice, select-service,and indeper.rdent hotels and restaurants suchas the Hotel Erwin in Venice Beach. Calif..and Hotel Angeleno in Los Angeles. Rim is apref'erred managemcnt company fbr MarriottInternational, Starwood Hotels and ResortsWorldwide, Hilton Worldwide, and Hyatt FlotelsCorp. In addition, Rim has directed constructionof more thar-r a dozen hotels and managed majorrenovations in scores ofothers.
O Total number of rooms managed:12,O29
a Total number of properties managed: 8l
a Number of third-party rooms managed'.12p29
O Number of third-party properties managed: 8l
a Regional footprint: l2 statcs across every region
O Total gross revenue: $37O rnil l ion
O Contact name: Mark LcBlanc
O contact email: rnlcblanc@)rimhospital ity.com
and please cc: [email protected]
I I II It lI TI II II II II I
IIIIIIIII
rIIIIIIIII
CONCORD HOSPITALITY ENTERPRISESSpecializing in operating upscale select-serviccand full-service hotels, Concord FlospitalityEnterprises has earned pl'eferred managementstatus with brands that are part of MarriottInternational, Hilton Worldwide, Hyatt HotelsCorp., Starwood Hotels and Resorts Worldwide,IHG, and Choice Hotels International and beennamed developer of the year by Marriott, Hyatt,and Choice. Concord manages hotels for high-net-worth individuals, REITs, private equityfirms, and joint-venture partners. Concord'sgoal is to deliver consistent, above-market sharepremiums and operational performance.
O Total number of rooms managed: 1O,866
O Total number of properties managed'.76
O Number of third-partv rooms managed:7,O27
O Number of third-partv properties managed: 46
a Regional footprint: 19 states across every rcgion
O Total gross revenue: $178 million
O Contact name: Grant Sabroff
a Contact email : [email protected]
I{OTE: NUMBERS ARE FOR JAN, 1, 2013, THROUGH JUNE 30, 2013,U S ONLY, COI/PANIES ARE SORTED BY NUIVBER OF ROOIMS
rooornol ' , taenznt cour 9

MANAGEMENT COMPANIES
@ esrneLrsHED LEADERS
ISTAND HOSPITATITYIsland Hospitality provides turnkeymanagement solutions designed to maximizeprofi tability by increasing revenues, reducingcosts, and improving efficiency. The company'sobjective is to focus on quality and responsibilityin order to achieve the desired performanceresults for each ofthe brands in its portfolio.By using a balanced scorecard approach, thecompany seeks to align each of a hotel's teammembers toward a common goal.
a Total number of rooms managed: l0,5l9
O Total number of properties managed: 76
O Number of third-party rooms managed: 563
O Number of third-party properties managed; 5
O Totel gross revenue: $I92 rnil l ion
O Regional footprint: 20 states and Washington,
D.C., across every region
O Contact name: JeffWaldt
a Contact email: jwaldt(@ih-corp.com
PRISM HOTETS AND RESORTSA full-service management, investment, andadvisory services company, Dallas-based PrismHotels and Resorts seeks to improve hotelperformance by delivering measurable results.With 3O years of experience, Prism currentlymanages urban, suburban, and resort hotels formultiple institutional and private owners. Thecompany has experience managing major brandsas well as independent hotels.
O Total number of rooms managed: 9,3OO
O Total number of properties managed: 59
O Number of third-party rooms managed: 9,300
O Number of third-party properties managed: 59
O Regional footprint: 18 states across every region
O Total gross revenue: 980.1 million
O Contact name: Kevin Gallagher, SVP ofBusiness
Devclopment
O Contact email: [email protected]
DESTINATION HOTELS AND RESORTSCelebrating its 40th anniversary in 2013,Destination Hotels and Resorts continues togrow its portfolio in major North Americanmarkets. The company provides acquisition,third-party management, and developmentexpertise to its clients. The focus in all cases ison driving top-line revenue, investor profit, andasset value by creating individualized customerexperiences at each property.
O Total number of rooms managed: 9,198
a Total number of properties managed: 39
a Number of third-party rooms managed: 9,198
O Number of third-party propertles managed: 39
O Regional footprint: l6 states and Washington,
D.C. across every region
O Total gross revenue: $42I,f68,OOO
O Contact name: Russell Urban
O Contect email [email protected]
IIIOTE: NUMBERS ARE FOR JAN 1, 2013, THROUGH JUNE 30, 2013,U S ONLY COIV]PANIES ARE SORTED BY NUN/BER OF ROOMS,
lO l ooeneu lonzne cou

HOSTMARK HOSPITATITY GROUP
l.tr(tm@
@t--
0Imof-momTa
An independent hospitality company thatdevelops and manages lodging assets, theHostmark Hospitality Group seeks to encourageinnovation, while improving performance.The company's growth strategy encompassesglound-up development and strategic portfoliomanagement in established markets as wellas emerging markets like Williston, N.D., andAustin, Texas.
O Total number of rooms managed: 8,78O
O Total number of properties managed'.42
a Number of third-party rooms managed: 8,78O
O Number of third-party properties managed: 42
a Regional footprint: 35 statcs across every region
O Total gross revenue: $305 million
a Contact name: Jerry Cataldo, President
and CEO
a contact email: [email protected]
Y
F
t!(.!
aorf
otr
o
NOTE: NUMBERS ARE FOR JAN 1, 2013, THROUGH JUNE 30, 2013,U S ONLY COMPANIES ARE SORTED BY NUMBER OF ROON/S
rooerrueurcrzrrue cou 11

@ rsrnar-rsHED LEADERS
DRIFTWO OD HOSPITALITY MANAGEMENTFocused on strategic acquisitions, development,third-party management, asset management,and receivership, Driftwood HospitalityManagement LLC has relationships in placewith most of the major brands. Based in NorthPalm Beach, FIa., the company manages full-service upscale and upper-upscale hotels inaddition to mid-size extended-stay and select-service properties. Driftwood describes its corecharacteristics as flexibility, diversity, integrity,accessibility, and originality.
I Total number of rooms managed:8,22L
O Total number of properties managed: 38
O Number of third-party rooms managed: 4,139
O Number of third-party propertios managed: 24
O Regional footprint: l4 states across every region
with several properties in Florida
O Total gross revenue: Not disclosed
O Contact name: David Buddemeyer
a Cont€ct email: [email protected]
KINSETH HOSPITATITY COMPANIESKinseth Hospitality Companies providesconsulting, asset management, FF&Epurchasing, and installation services, as wellas on-site property sales, marketing, andoperational services. Kinseth's portfolio includesfull-service and select-service properties inmajor metropolitan markets as well as tertiarymarkets. In the full-service arena, Kinsethspecializes in F&B management, includingcatering sales and banquets.
a Totsl numb€r of rooms managed: 2758a Total number of propenies managed: 77
O Number of thir*party rooms managed: 5,363
I Number of third-party properties managed: 6I
O Reelonel footprint: 13 states with a heavy Midwest
concentration
O Total gross revenue: Not disclosed
O Contact name: JeffSchrader, Director of
New Business Development
a Cont€ct email: [email protected]
DIMENSION DEVETOPMENT COMPANYDimension Development Company managesfu Il-service, select-service, and extended-stayproperties as both an owner and operator. Thecompany is an equity participant in many of thehotels it manages. Based in Natchitoches, La.,Dimension has developed more than 40 hotelsand today manages hotels carrying both HiltonWorldwide and Marriott International brandflags.
O Totaf number of rooms managed:7r6i24
O Total number of propertles managed: 48
O Number of thlrd-party rooms manaEed:7,624
O Number of third-perty propertles managed: 48
O Reglonal footprlnt: II states across every region
O Total gross revenue: $141,74+,404
O Contact name: Ken Thompson
a contect email: [email protected]
12 ro oe r e u le lzru r co l , r NOTE: NUN/BERS ARE FOR JAN. 1, 2013, THROUGH JUNE 30, 2013.U S ONLY COIV1PANIES ARE SORTED BY NUMBER OF ROOMS

J3\\tt
ma--l
CRESTTINE HOTETS AND RESORTS
mt-aImEr-
OTotal nurnbe.of.ooms managed; Z46l ISince its inception in 2OOO Crestline Hotels andResorts has assembled a portfolio that includesnumerous upscale branded and independenthotels, conference centers, and resorts in lIstates and the District of Columbia with anespecially healy representation in Virginia.Based in Fairfax, Va., Crestline aims to deliverintelligence, foresight, and insight into what itsees as an ever-evolving business environment.
O Total number of properties managed:43 O
a Number ofthird-party rooms managed:7,461 TO Numberofthird-party properties managed 43 A
O Regional footprint: ll states and Washington,
D.C., with hear,y concentration in Virginia
a Total gross revenue: $350 million
a Contact name: Edward Hoganson
O Contact email: [email protected]
INTERMOUNTAIN MANAGEMENTInterMountain Management, a family-ownedconcern in the hotel business for 30 years, hasa portfolio focused on the select-service andextended-stay industry tiers. InterMountain'sgrowth strategy entails building relationshipswith select owners for the long-term. In addition,the company owns hotels as well as manages. Assuch, InterMountain can offerboth an ownerperspective and a management perspective.
a Totel number of rooms managed: 71230
O Total number of prcperties managed: 75
O Number of third-perty rooms managed:7,290
O Number of thlrd-perty propertles managed: 75
a Regional footprint: 23 states across every region
O Totalgross revenue: $193,793,064
O Contact name: Stan Jones
a Contact emall: stanj@intermountain
hotels.com
HVMGHospitality Ventures Management Group offersa fully integrated platform of hotel solutions.It strives to offer flexibility, innovation, andresponsiveness. The company is prepared to actas third-party manager, joint-venture partner, orsimply in an advisory role. In all cases, the focusis on maximizingvalue. Strategies, action plans,and performance metrics are aligned to deliverimproved results and an appropriate return oninvestment.
O Total number of rooms managed 71122
a Totel number of properties managed: 40
O Number of third-party rooms ma naged: 7,122
a Number of third-party properties managed: 40
a Regional footprint: | 6 states across every region
a Total gross rev€nue: $97,079,152
O Contact name: Mary Beth Cutshall
a Contact email: [email protected]
I{OTE: NUMBERS ARE FOR JAN 1, 2013, THROUGH JUNE 30, 2013,U S ONLY COI\,IPANIES ARE SORTED BY NUMBER OF ROOIMS,
rooonroulelzne cou 13

MANAGEMENT COMPANIES
STRAND DEVETOPMENT COMPANYStrand Development Company LLC operateshotels primarily along the East Coast. For morethan 4O years, the company has provided clientswith hotel management selices, specializingin the economy, select- service, extended-stay,and full-service industry tiers. The range ofmanagement services available includes revenuemanagement, centralized accounting, audit,sales and marketing, and food and beverage. Inaddition, Strand Development has extensiveexperiencc in consulting for and operatingdistressed hotels.
O Total number of rooms managed: 6,72O
O Total number of properties manaced'.64
I Number of third-party rooms managed'. 6,720
O Number of third-party properties managed: 64
O Regional footprint: Il states in the Northeast,
Southeast, and Midwest
O Total gross revenue: $50,235,000
a Contact name: John Pharr
O Contact email: [email protected]
BEN CHMARK HO SPITALITY INTERNATIONATBenchmark Hospitality International operatesportfblios of properties under the Bencl.rmarkResorts and Hotels and Personal LuxuryResorts and Hotcls banners. The company isalso a founding member of the InternationalAssociation ofConference Centers. As such, itsBenchmark Conference Centers unit adheresto the organization's strict standards forcertification in the meetings field. Launched in1980 as an independent company, BenchmarkHospitality operates from The Woodlands,Texas, near Houston.
O Total number of rooms managed: 6rO32
O Total number of properties managed: 33
O Number of third-party rooms managed: 6,O32
O Number of third-party properties managed: 33
O Regional footprint: 16 states across cvery rcgion
O Total gross revenue: $482136,288
O Contact name: Alex Cabanas
O Contact email: [email protected]
MARSHALL HOTELS AND RESORTSBased in Salisbury, Md., and operating since1980, Marshall Hotels and Resorts is focused onproducing positive results for its institutionallender, investment group, and individualowner clients. As a management company, itconcentrates on delivering high quality guestexperiences and maximum returns for itsclients with an eye on financial perforrnanceand asset value.
a Total number of rooms managed: 6rO3O
O Total number of properties managed: 48
O Number of third-party rooms managed: 6,030
O Number of third-party properties managed: 48
I Regional footprlnt: IO states in the Northeast
and Southeast
O Total gross revenue: $73 million
a Contact name: Mike Marshall
a Contact email: [email protected]
W =,i #S
NOTE: NUMBERS ARE FOR JAN 1, 2013, THROUGH JUNE 30, 2013,U,S, ONLY COIV]PANIES ARE SORTED BY NUIVBER OF ROOI\,4S
l f r ooe rneuaoaz r rue cou
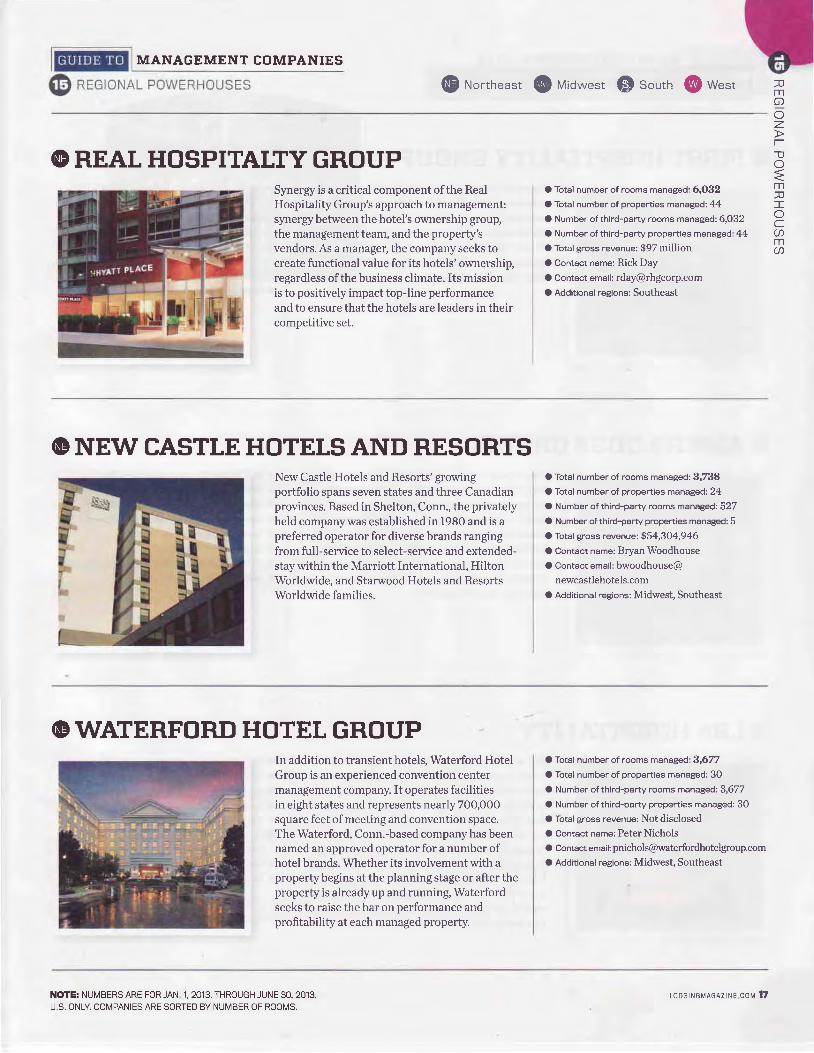
MANAGEMENT COMPANIES
@ Northeast @ vio*""t $ soutr, @ w""t
@ REAL HOSPITAITY GROUP
T
mU /a-\
zt-!
€mT
I
CU)m
Synergy is a critical component of the RealHospitality Group's approach to management:slmergy between the hotel's ownership group,the management team, and the properly'svendors. As a manager, the company seeks tocreate functional value for its hotels'ownership,regardless of the business climate. Its missionis to positively impact top-line performance
and to ensure that the hotels are leaders in theircompetitive set.
O Total number of rooms managed: 6rO32
O Total number of properties managed: 44
O Number of third-party rooms managed: 6,032
a Number of third-partv properties managed: 44
a Total gross revenue: $97 million
O contact name: Rick Day
a contact email: [email protected]
O Additional regions: Southeast
@ NEW CASTTE HOTETS AND RESORTSNew Castle Hotels and Resorts'growingportfolio spans seven states and three Canadianprovinces. Based in Shelton, Conn., the privatelyheld companywas established in 1980 and is apreferred operator for diverse brands rangingfrom full-service to select-service and extended-stay within the Marriott International, HiltonWorldwide. and Starwood Hotels and ResortsWorldwide families.
a Total number of rooms managed: 31738
O Total number of propenies managed: 24
O Number of thlrd-party rooms managed:527
O Number ofthirdparty properties manaEed: 5
O Total gross revenue: $54,304,946
a Contact nam€: Bryan Woodhouse
a Contect email: bwoodhouse@
newcastlehotels.com
a Additional regions: Midwest, Southeast
@WATERFORD HOTEL GROUPIn addition to transient hotels, Waterford HotelGroup is an experienced convention centermanagement company. It operates facilitiesin eight states and represents nearly 70O,OOOsquare feet ofmeeting and convention space.The Waterford, Conn.-based company has beennamed an approved operator for a number ofhotel brands. Whether its involvementwith aproperty begins at the planning stage or after theproperty is already up and running, Waterfordseeks to raise the bar on performance andprofitability at each managed property.
O Total number of rooms managed:31677
O Total number of properties managed: 3O
O Number of third-party rooms nanaged:3,677
O Number of third-partv properties managed: 30
O Total gross revenue; Not disclosed
O Contact name: Peter Nichols
o Contact email: [email protected]
O Additional regions: Midwest, Southeast
IIOTE: NUMBERS ARE FOR JAN 1, 2013. THROUGH JUNE 30. 2013.U S. ONLY COI\4PANIES ARE SORTED BY NUMBER OF ROOIVIS,
rooerruouloezne cou t7

l@l unrecrurnr coupawrrs
@ nreror.rAL PowERHousES
O FIRST HOSPITATITY GROUPAn established management and developmentcompany, First Hospitality Group Inc. hasnurtured long-term relationships with boththe investment and real estate communities.Since 1985, FHG has developed, marketed, andmanaged more than 5O hotels that fly the flag ofmore than 16 brands.
O Total number of rooms managed: 71815
O Total number of properti€s manegBd:52
a Number of third-party rooms managed: 6,O53
O Number of thlrd-party properties managed: 4O
O Total gross revenue: $250 million
a Contact nam€: Katie Kijowski
a Contact emall: [email protected]
a Addltlonal regions: Southwest
@AMERILODGE GROUPAmerilodge Group, a privately held companythat owns and manages hotels, prides itselfon its core values ofdelivering best-in-classguest service and employee satisfaction. It seesthese values as the foundation for its positiveperformance track record. The majority ofAmerilodge's hotels are in Michigan, particularlysouthern Michigan, a market where the companyhas substantial experience.
O Total number of rooms managed: lro65
a Total number of propeftles maneged: 13
O Number of thlrd-party rooms menaged: I48
O Number of thlrdparty prop€rtles m€naged: 2
a Total gross revenue: $1Q368,000
O contact neme: Asad Malik
a epntsct €mail: [email protected]
a Addltlonal reglons: None
g tBA HOSPITATITYFor 4O years, LBA Hospitality has providedhotel development and management servicesfrom its corporate office in Dothan, Ala. Itsportfolio is comprised of Marriott Internationaland Hilton Worldwide brands. Mid-price hotelsare its specialty. With the support of morethan 2,OOO associates, LBA's goal is to manageproperties so they have the tools to achieve theirhighest potential. The company's core principlesare to practice ethical, responsible managementguided by disciplined systems, grounded in best-in-class service.
O j b t i : i r t r r r r r e r l i i . ; : , , , r r , r r r r l , ' - - s r { l Q
a T ' t t i r , nu f r t l ) r ) o l ' f ra i i , f r i i { r : , r : , , r , ,1 . - , i r 7O
O I : ir l rrr,t o{ I hlir l^ir:,f 1'/ roorrs,nr:nageci ; 6,410
O I' iL rr r! lr:r of | | r ir d-ytrar ry nroperties rnnnngc.cj: 7O
O lr:: ir l gross rqlv{rnue: $84,878,OOO
O acnlact nrrrner Robert Goldsmith. Director of
CommunityAffairstD i,trrr.atx nrrrr:il: [email protected] Additio[;] l r.:gior:s: None
i lOTE: NUIV1BERS ARE FOR JAN. 1, 2013, THROUGH JUNE 30, 2013,U.S. ONLY COMPANIES ARE SORTED BY NUMBER OF ROOMS.
NGMAGAZINE COM

| @ | vreluec uvruwr co vrpexrus
@nreronAL PowERHousES
S CHARLESTOWNE HOTELSFor more than 3O years, Charlestowne Hotelshas created a niche for itselfas a manager ofindependentboutique hotels, conference resorts,and condo hotels as well as branded properties.
Charlestowne has inventory in destinations asdiverse as the Florida Keys and Jackson Hole,Wyo. The company's overall strategy calls forimproving asset value by growing profits as aresult of operating excellent hotels.
. 3,195o 3 0. 2,781a 2 5. $10,5s6,126a Michael Tal la mtallf4char'lcstou'nchotels.comO West
H GIBSON HOTET MANAGEMENTBased in Knoxville, Tenn., Gibson HotelManagement and Development Inc. is a third-party manager approved by a number oftheindustry's premier brands. The company believesin investing in its associates as a way of ensuringthat the vision of its original senior managementteam is perpetuated. Core values include a focuson results, sound business practices, and activecommunity involvement.
a) r 2,259a 2 2o 3.toa 4a Not disclosedO ' :, ,, ii Chetan Jala "CJ", Vice President
of Development and AcquisitionsO (l :nirr- ' - , :r , , r ,r [email protected] A . r r . t r , r . , , . . . M i d w e s t
6 VISION HOSPITALITY GROUPChattanoog4 Tenn.-based Vision HospitalityGroup Inc. develops, owns, and operatespremium select-service and full-service hotelsaffiliatedwith the Hilton Worldwide. MarriottInternational, IHG, and Hyatt Hotels Corp.brand families. Family-owned and operated,the company sees its core values as quality andintegrity. Add to that a culture of empowermentand respect for its associates.
o 2,135a 2 2o 2,135a 2 2a $30.7 r-nilliono Ericalllrdocko ehudock@vhghotels comO Midwt 's l
IIOTE: NUMBERS ARE FOR JAN. 1. 2013. THROUGH JUNE 30, 2013,U.S. ONLY COMPANIES ARE SORTED BY NUNIBER OF ROOMS.
I N G M A G A Z I N E C O M

3H GROUP HOTETS
nmG)
ozf-
To€muIa^)Cama
While remaining true to its family roots, 3HGroup Hotels'portfolio has grown to havinginventory in flve states. Recruiting dedicatedand caring associates has been the key to thecompany's growth over the years. Chattanooga,Tenn.-based 3H Group has two properties underconstruction and several more in the pipeline.
1,99420
r,99120
'Ierri Wilkcyhvi lkey(gl!hgppuphotels con.r
Nonc
ooO
oooa
ffiO IMIC HOTETSFounded in f98I, IMIC Hotels has designed,developed, and managedboth full-service andselect-service hotels. The company maintains in-house expertise in operations, sales, marketing,advertising, payroll, IT, accounting, andcommunications, among other disciplines. IMIChas hotels under construction in South Carolinaand Tennessee.
a 1 4O
ooooo
l , 3 l l
l , 3 l l
t4Not disclosed
Kathy Rabune
None
NOTE: NUMBERS ARE FOR JAN, 1, 2013, THROUGH JUNE 30, 2013,U S ONLY COMPANIES ARE SORTED BY NUIVBER OF ROOIVS.
rooenov leaz tn r cou 21

MANAGEMENT COMPANIES
@ THE HOTET GROUPThe Hotel Group views its mission as creatingmaximum investment value for its clients, whileproviding personal and p rofessionai growthopportunities for its hundreds ofassociates.Fueled by this mission, the company makes ita practice to assess not for what it is, but ratherfor what it can be. In working to realize thispotential, Edmonds, Wash.-based THG seeks tomaximize the owner's return on investment.
O Total number of rooms managed: 4,14O
O Total number of propenies managed'.27
a Number of thlrd-party rooms managed: 2,463
a Number of third-party properties managed; 21
O Totel gross revenue: $67,79O,909
a Contact name: Douglas Dreher
a contact €mail: [email protected]
O Additlonal regions: Southwest, Midwest,
Southeast
@ STONEBRIDGE COMPANIESSince Stonebridge Companies' launch in1991, it has developed, acquired, renovated,and repositioned more than 70 hotels. Asowner, developer, and operator, Stonebridge isinterested in pursuing both new acquisitionsand ground-up development. Senior companyexecutives feel they have the foundation andinfrastructure in place to enable them to reactquicldy to today's ever-changing lodging andeconomic landscape.
O Total number of rooms managed: 6,634
O Total number of properties managed:44
O Number of third-p€rty rooms managed: I,643
O Number of third-party properties managed: l3
O Total gross revenue: Not disclosed
a Contact name: Kevin Mahoney
O Contact 6mail: [email protected]
a Additional reglons: Southeast
@ PACIFIC PLAZAHOTETSExperienced as a manager of mid-size businesshotels for more than 35 years, Pacific PlazaHotels Inc. cites three characteristics as amongits chief attributes: its track record operatingfurnaround situations, its experience overseeingproperty-wide renovations, and its recordmarketing campaigns that result in an overallhigh Ievel ofreturn.
O Total number of rooms managed: 1,517
O Total number of properties managed: I5
O Number of third-party rooms managed: I,293
O Number of third-party properties managed: l1
a Total gross revenue: $fq969000
a contact name: Carl Doughty, President
O contact emall: [email protected]
a Additional regions: None
ilOTE: NUMBERS ARE FOR JAN 1. 2013. THROUGH JUNE 30, 2013,U.S. ONLY COMPANIES ARE SORTED BY NUIVBER OF ROOMS.


For Your Review
• Assistance in Management, Ownership and Development
• Project Map
• Consulting Team
• Hotel Franchises
• Industry Participation
• Completed Projects
• Client List
• Lodging Management Services
• Tools, Availability, Timetable and Fees

Interim Hospitality Consultants Offers aWide Array of Hospitality Assistance to Your Firm.
MANAGEMENT ASSISTANCE1. Lodging Management Services, LLC, for total Hotel Operations.2. Quality Assurance Programs of independent evaluation.3. Yield Management to maximize room revenues from an hourly to a seasonal basis.4. Front Office/Reservation Systems Training from the first customer greeting to night audit
operations.5. Marketing Studies: Personnel training and formal studies to expose primary and secondary
markets.6. Human Resource Programs: Task training, position description, employee guides, wage and
benefit reviews.
OWNERSHIP ASSISTANCE1. Financial Operations Analysis by department to maximize profits.2. Operations Manuals Consolidation of your policies and procedures in compliance with
state/federal laws and franchisee requirements.3. Litigation Support with expert witness testimony.4. Anonymous Audits of service and management standards.5. Lodging Realty Services, LLC, brokering hotels from Bed and Breakfast Inns to Major Resorts.6. Appraisal Services through members of the Appraisal Institute of America.7. Mortgage Broker for real estate financing.
DEVELOPMENT ASSISTANCE1. Feasibility Studies: Interim Hospitality Consultants has authored over 100 chain-approved
studies.2. Impact Studies to determine from a third-party standpoint the effect of new hotel development.3. Architectural Reviews from a Hotel Operations perspective to eliminate errors and increase
productivity.4. Remodeling Coordination from project review to oversight management, including design,
purchasing and installation. Interim Hospitality Consultants has completed over 20 projects.5. Construction Coordination: Leading the efforts of the Architect, General Contractor, Franchisee
and ownership from a daily or project review perspective. Xanders has completed over ten ofthese projects.
6. Pre-Opening Management Functions of permits/licensing, FF&E installation, punch lists,staffing/training and marketing. Lodging Management Services has opened over 30 hotels.

Interim Hospitality Consultants
North America, Central America and the Caribbean Sea

INTERIM HOSPITALITY CONSULTANTS, LLC
Interim Hospitality Consultants is pleased to have been listed in the Top 20 Hotel Consulting Firms in the
United States since 2006 by Hotel Management Magazine.
Edward L. Xanders, CHA, CAM, GRI, IAHAPresident
Edward L. Xanders has over 30 years of hotel management experience,
with over 12 years in hotel management companies.
As President/Owner of Interim Hospitality Consultants, Tallahassee,
Florida, which was formed in 1994, Xanders provides Operations,
Feasibility/Market Analyses, Yield Management, Food & Beverage Controls,
Human Resource Search/Training, Pre-Opening and Renovation Coordination,
along with expert testimony to the hospitality industry across North America.
Xanders heads two associated companies: Lodging Realty Services
provides hotel brokerage on a national basis, and Lodging Management Services,
LLC, assists on the development and operation of hotels nationwide.
His prior company was Cambridge Management Corporation,
Tallahassee, Florida, from 1984 to 1993. He directed the operations of over ten
hotels and condominiums. Two of the annual management contracts were
extended five times until the properties were sold. Xanders has authored over 800 Feasibility Studies and Market
Analyses. He has also developed numerous projects for investors that included the Feasibility Study, engagement
of Architect, General Contractor, Franchise (Holiday Inn, Comfort Suites, Staybridge Suites, Suburban Extended Stay
Hotel), construction and FF&E coordination, Pre-Opening Staffing and Operations Management.
From 1972 to 1984, Ed was Vice President and Regional Manager for Management Resources, Tallahassee,
Florida, along with assignments at Hospitality Management Corporation, Metro Inns Management, and Westbrook
Inn Management, all of Dallas, Texas. During this tenure, he served as General Manager of the Tallahassee Hilton
(246 rooms) from 1979 to 1984. Additional Hilton Hotel Management assignments included Hiltons in Macon, GA;
Amarillo, Ft. Worth, Midland, and Abilene, TX; Wichita, KA; and Albuquerque and Santa Fe, NM.
Ed has a Bachelor of Arts in Hotel and Restaurant Management from Michigan State University; was
designated a Certified Hotel Administrator in 1980 by the American Hotel Lodging Association; and is a 1990
Graduate of the Realtor Institute of the National Association of Realtors. He has guest-lectured at major universities
and hotel schools while also teaching AHLA Educational Institute classes.
Ed holds three professional Florida licenses: Community (Condominium) Association Management, Real
Estate Broker, and Mortgage Broker Business. Lodging Realty Services, which provides Hotel Industry Real Estate
Services, and Lodging Management Services, LLC, providing hotel management to all types of hotels and
condominium associations, are both owned by Ed. He has published Management Case Studies in the Florida Hotel
Motel Association Journal and the Asian American Hotel Owners Association Hospitality monthly magazine. Interim
Hospitality Consultants has marketed its services in the national publications of Hotel and Motel Management and
Hotel Business.
Ed is a past president of the Tallahassee Lodging and Restaurant Association, and Past Board Member of the
Florida Hotel and Motel Association, Leon County United Way, and cofounder of the Tallahassee Area Convention
and Visitors Bureau.

Ed has served various committee chairmanships and as a delegate to the American Hotel Lodging Association
and is currently a member of the Extended-Stay Hotel Council, Tallahassee Chamber of Commerce, Florida State
University Boosters, Springtime Tallahassee Festival, and Good Shepherd Catholic Church, along with membership
in the Florida Bed and Breakfast Innkeepers Association, Asian American Hotel Owners Association, the National
Association of Black Hotel Owners, Operators and Developers, the Latino Hotel Association, National Association
of Condo Hotel Owners, and Superior Small Lodging of the United States. In 1999, he formed the International
Association of Hospitality Advisors.
Ed and Judy have been married for over 30 years and have three grown sons.
Kim PedersenSenior Research Analyst
Kim Pedersen’s diverse experience in hotel management extends from a 4-Star bed and
breakfast hotel to the Florida 5-Star Boca Raton Resort and Club, as well as private club
management and numerous hotel franchise properties. She comes from a long line of hotel
and restaurant owners and grew up at her family’s New Hampshire summer resort. Kim
graduated from Florida State University with a bachelor’s degree from the School of
Hospitality Administration.
Kim may be reached at 317-832-8515 or [email protected].
George C. BanksSenior Research Analyst
George Banks' diverse experience includes several hotel feasibility study projects;
Participation at InterContinental Hotels Group (IHG) Americas Investors &
Leadership Conferences in Washington, DC, Austin, TX, Las Vegas, NV, and Atlanta,
GA; Past Membership in the IHG Owners Association and a past member of the IHG
Technology Committee; Background in attending hotel investment and marketing
conferences in Phoenix, AZ, Chicago, IL, and Atlanta, GA. Previous Vice President of
Summit Group Commercial Properties LLC, (Development Representative and Real
Estate Broker specializing in Class "A" office buildings, retail life style centers,
restaurants and hospitality). Hospitality Consultant with Structure Commercial Real
Estate and Senior Research Analyst with Interim Hospitality Consultants, LLC. George
graduated from the University of Central Florida with a bachelor's degree in Business
Administration and graduated from Florida State University with an MPA.
George may be reached at 850-980-0008 or [email protected].
4145 Yardley Circle, Tallahassee, FL 32309-2942Phone: (850) 893-6010 • Cell: (850) 443-5010 • Fax: (850) 893-8345
www.interimhospitality.com • [email protected] in the Top 20 Hotel Consulting Firms by Hotel/Motel Management since 2006
Member, International Association of Hospitality AdvisorsMember, Extended-Stay Hotel Council, AHLA

Hotel Feasibility Studies and Operations Analysis
Selected List
New York, (Queens), NY
Greenville, MI Edgemont, SD
Vernal, UT
Cumberland, MD Brooklyn, NY Ridgeway, PA Wytheville, VADickinson, ND Jim Thorpe, PA Midland, TX Manitowish Waters, WI
Tallahassee, FL Biloxi, MS Houston (Katy), TX Osa, Costa Rica
Celebration, FL Kissimmee, FL Slidell, LA
Ft. Myers, FL Gainesville, FL Orlando, FL
Luverne, AL Plant City, FL Marietta, GA Mount Morris, NYAuburndale, FL Okeechobee, FL Chicago (Calumet Park), IL Geneseo, NYPensacola, FL Jackson, GA S. Fulton, KY Myrtle Beach, SC
Plus Enterprise, AL Kenner, LA Hammondsport, NY Ardmore, OK
Premier Jackson Township, NJ St. Maartin, FWI
Lauderhill, FL Greensboro, NC Las Vegas, NV Bluffton, SCPerdido Key, FL Raleigh, NC Washington Hgts, NY Dallas, TX
Vero Beach, FL

Brandon, FL Tallahassee, FL Marietta, GA Edmond, OKNiceville, FL Atlanta (Airport), GA Grand Rapids, MI Anderson, SC
Atlanta (East Point), GA New York (Brooklyn), NY
Boonesboro, MD Lusby, MD Tanneytown, MD Buena Vista, VABerlin, MD Oakland, MD Medina, NY Marion, VAFederalsburg, MD Ocean Pines, MD Allendale, SC Purcellville, VAFrostburg, MD Pocomoke City, MD Amherst, VA Stuart, VACumberland, MD Snow Hill, MD Appamattox,VA Verona, VA
Blakely, GA Hastings, MI Raleigh, NC Hammondsport, NYCairo, GA Leland, MS
Crawfordville, FL N. Miami Beach, FL Largo, MD Valley Stream, NYEastpoint, FL West Park, FL Bronx, NY Suffolk, VALloyd, FL Largo, MD
Eutaw, AL Hastings, MI Leland, MS Winfield, AL
/Cadiz, OH
Pelham, AL Yulee, FL Greenville, MS Troutman, NCCrestview, FL Jasper, GA Jackson, MS Cortland, NYDavie, FL Baton Rouge, LA Natchez, MS Rossford, OHDeLand, FL Taunton (Boston), MA Starkville, MS Sandusky, OHFt. Myers, FL Raynham (Boston), MA Greensboro, NC Mansfield, PALady Lake, FL Grand Haven, MI (2) Magnolia, NC Fort Mill, SCPensacola, FL Hastings, MI Rose Hill, NC Marinette, WI
Memphis, TN
Ft. Myers, FL Sanford, FL Jacksonville, NC Allentown, PA

Rochester, NY Memphis (Collierville), TN
Quincy, FL Kenner, LA New Orleans, LA Allendale, SCBainbridge, GA
South Amboy, NJ Willow Valley, PA Youngstown, PA
Ocala, FL Quincy, FL
Norfolk, VA
Jackson, MS
Pittsburgh, PA
Aguascalientes, Mexico Léon, Mexico Poza Rica, Mexico San Luis Potosi, MexicoCiudad del Carmen, Mexico Monterrey, Mexico Querétaro, Mexico
Madison, AL Ft. Walton Beach, FL Plattsburgh, NY
Indianapolis, IN Lancaster, PA
Birmingham, AL
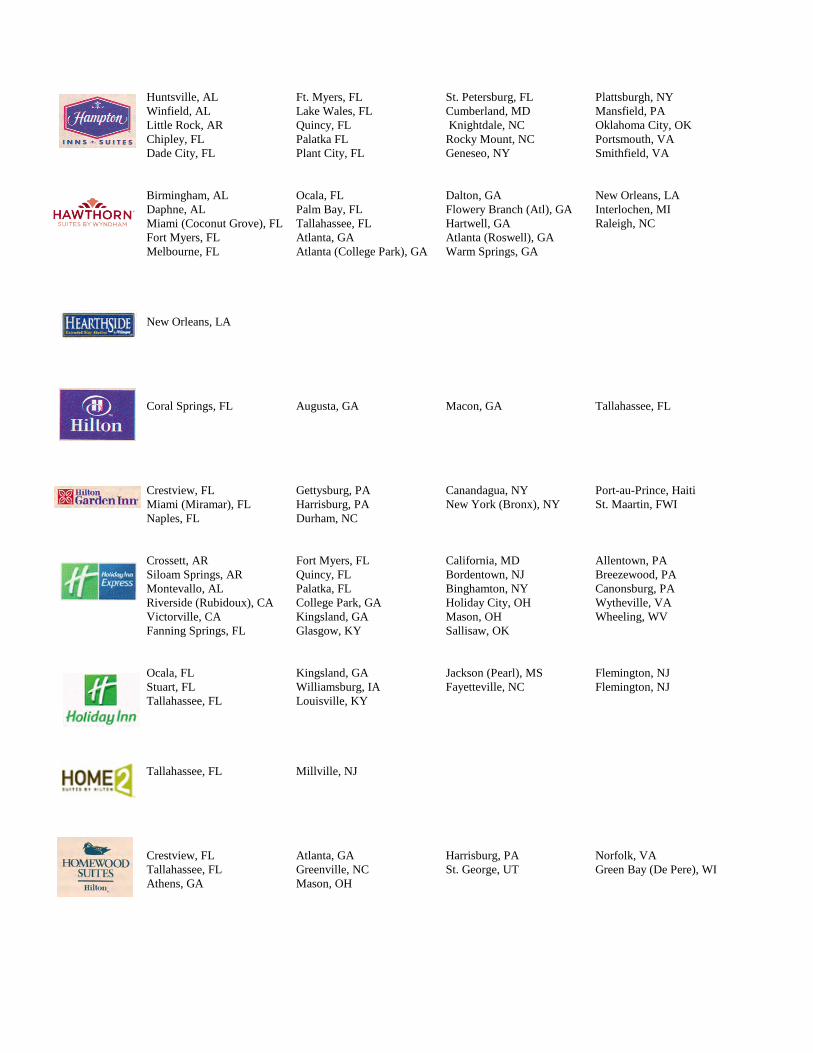
Huntsville, AL Ft. Myers, FL St. Petersburg, FL Plattsburgh, NYWinfield, AL Lake Wales, FL Cumberland, MD Mansfield, PALittle Rock, AR Quincy, FL Knightdale, NC Oklahoma City, OKChipley, FL Palatka FL Rocky Mount, NC Portsmouth, VADade City, FL Plant City, FL Geneseo, NY Smithfield, VA
Birmingham, AL Ocala, FL Dalton, GA New Orleans, LADaphne, AL Palm Bay, FL Flowery Branch (Atl), GA Interlochen, MIMiami (Coconut Grove), FL Tallahassee, FL Hartwell, GA Raleigh, NCFort Myers, FL Atlanta, GA Atlanta (Roswell), GAMelbourne, FL Atlanta (College Park), GA Warm Springs, GA
New Orleans, LA
Coral Springs, FL Augusta, GA Macon, GA Tallahassee, FL
Crestview, FL Gettysburg, PA Canandagua, NY Port-au-Prince, HaitiMiami (Miramar), FL Harrisburg, PA New York (Bronx), NY St. Maartin, FWINaples, FL Durham, NC
Crossett, AR Fort Myers, FL California, MD Allentown, PASiloam Springs, AR Quincy, FL Bordentown, NJ Breezewood, PAMontevallo, AL Palatka, FL Binghamton, NY Canonsburg, PARiverside (Rubidoux), CA College Park, GA Holiday City, OH Wytheville, VAVictorville, CA Kingsland, GA Mason, OH Wheeling, WVFanning Springs, FL Glasgow, KY Sallisaw, OK
Ocala, FL Kingsland, GA Jackson (Pearl), MS Flemington, NJStuart, FL Williamsburg, IA Fayetteville, NC Flemington, NJTallahassee, FL Louisville, KY
Tallahassee, FL Millville, NJ
Crestview, FL Atlanta, GA Harrisburg, PA Norfolk, VATallahassee, FL Greenville, NC St. George, UT Green Bay (De Pere), WIAthens, GA Mason, OH

Stuart, FL Dania Beach, FL North Miami Beach, FL New Orleans, LA
Norfolk, VA
Montgomery, AL Delray Beach, FL Lexington, KY Suffolk, VAAugusta, GA North Miami Beach, FL Bluffton, SC
Norfolk, VA
Greensboro, NC
Columbiana, AL St. James Island, FL
Daphne, AL Pensacola, FL Southaven, MS Verona, NYMalbis, AL Olive Branch, MS Lincoln, NE Wichita Falls, TX
Coral Springs, FL Branson, MO Long Island City, NY Palmyra, VAFt. Lauderdale, FL Chelsea, Manhattan, NY Middletown, NY Trinidad
Montgomery, AL Port St. Joe, FL Baltimore, MD Dickinson, NDOcala, FL Tallahassee, FL Hattiesburg, MS Newark, NJPinellas Park, FL Springfield, MA Horn Lake, MS Canton, OHPort Charlotte, FL Great Mills, MD Meridian, MS Richmond, VA
Birmingham, AL East Point, FL Slidell, LA Wilkes-Barre, PADaphne, AL Lake Wales, FL Detroit (Lincoln Park), MI Mount Pleasant, SCDecatur, AL Ocala, FL Leland, MS Summerville, SCTalladega, AL Franklin, KY Meridian, MS Pasadena, TXBushnell, FL Thibodaux, LA N. Bergen, NJ Williamsburg, VABrooksville, FL St. Rose (New Orleans), LA Salamanca, NYCarrabelle, FL Shreveport, LA Toledo (Maumee), OH

Tallahassee, FL
Vicksburg, MS
Geneseo, NY Bedford, PA Clarksville, TN
Gladstone, MO Memphis, TN Porto-au-Prince, Haiti Williston, ND
Poconos, PA
Silver Spring, MD
Morrilton, AR
Headland, AL Jacksonville, FL Wyndham, ME Houston (Stafford), TXMarion, AL Port St. Joe, FL Marlton, NJ Woodbridge, VAUnion Springs, AL Augusta, GA Niagara Falls, NYMena, AR Shreveport, LA Columbia, SC
/Windham, ME Marlton, NJ Kennedale, TX
Charleroi, PA Portsmouth, VA Richmond, VA Wheeling, WVKnoxville, TN
Dothan, AL Denver, NC Memphis (Collierville), TN Wheeling, WVTallahassee, FL Union City, NJ Knoxville, TN

Ocala, FL Tallahassee, FL Washington, PA Traidelphia, WVPerry, FL Meridian, MS Morgantown, WV
Gulfport, MS
Atlanta (Six Flags), GA
Pensacola, FL Vidalia, LA0
Macon, GA Clarksville, TN
Bakersfield, CA Pennsauken, NJ
Ramsey, NJ
Lynn Haven, FL Macon, GA Clarksville, TN
Greensboro, NC
Sarasota, FL Oxford, MS
Indianapolis, IN
Delray Beach, FL

INDEPENDENT LODGING
Gulf Shores, AL Resort Hotel & ResidencesCape Coral, FL Market-Driven Hotel Villa Ridge, MO Diamond InnCrawfordville, FL Wakulla Springs, FL Black Mountain, NC Independent ResortDaytona Beach, FL Desert Isle Inn Chama, NM Chama Inn & SuitesDaytona Beach, FL Maple Leaf Condo Endicott, NY Independent LivingImmokalee, FL Market-driven hotel Mt. Morris, NY Performing Arts TheatreJacksonville, FL Edward Waters Hotel Saratoga Springs, NY Roosevelt Inn & SuitesMiami Beach, FL Boutique Hotel Bluffton, SC Hamilton InnPanama City Beach, FL Pineapple Beach Resort Columbia, SC Eagles Nest ResortPort St. Joe, FL Port InnColumbia, SC N. Myrtle Beach, SC North Shore Inn & SuitesSt. James Island, FL Condo Hotel Chattanooga, TN Hamilton InnTallahassee, FL Hamilton Inn Copperhill, TN Independent HotelTallahassee, FL Southgate Campus Center Fort Worth, TX Park Central InnDallas, GA Villager Lodge Springdale, UT Desert Pearl InnKingsland, GA Assisted Living Home Norfolk, VA Tides InnCopper Harbor, MI Keweenaw Mtn. Lodge Petersburg, VA Dozier HotelBiloxi, MS Barq Boutique Hotel Richland, WA Guest House at PNNLOxford, MS Ava Hotel and Spa Black River Falls, WI Majestic Pines CasinoVicksburg, MS Delta Court Hotel Costa Rica Osa Resort Club
CONDOMINIUM HOTEL FEASABILITY STUDIES
Fort Morgan, AL The Sanctuary at Fort Morgan Miami, FL Ocean 4Gulf Shores, AL Zydeco Hotel and Spa Sarasota, FL Condo Hotel and TheaterCoral Springs, FL Golf Resort Palmyra, VA Rivanna Resort
Lodging Management Services assisted in the development of Staybridge Suites, Candlewood Suites and Suburban Extended Stay Hotel, Tallahassee, FL,Wingate Inn, Lynn Haven, FL and Comfort Suites, Suffolk, VA.
Tallahassee, FL Tallahassee, FL Tallahassee, FL Lynn Haven, FL Suffoll. VA
SOLD
Pensacola, FL Donalsonville, GA Valdosta, GA

INDUSTRY PARTICIPATION
Attend Exhibit SpeakerAmerican Hotel Lodging Association U (Extended-Stay Council, since 1998)Asian-American Hotel Owners Association Conference U U UAmerican Lodging Investment Summit Conference U UAtlanta (Hunter) Hotel Investment Conference U UBest Western Hotel Conference U U UBoutique Hotel Conference UCobblestone Hotels Conference U UChoice Hotels International Conference U UCaribbean Hotel & Resort Investment Summit Conference UCondo Hotel Conference U U UFlorida State University, Hotel School UFlorida Bed & Breakfast Conference U U UHilton Hotels Worldwide Conference UHotel Brokers International Conference U UHotel Opportunities Latin America Conference UInterContinental Hotel Group Conference U ULatino Hotel Restaurant Association U U UMichigan State University, Hotel School U UMidwest Hotel Lodging Conference U UNational Association of Black Hotel Owners, Operators and Developers Conference U U UNew York Investment Conference USuperior Small Lodging Conference U U UThe Lodging Conference U U UVantage Hotel Conference U U
Interviewed on CNBC Cable News U
Listed in the Top 20 Hotel Consulting Firms by Hotel/Motel Management since 2006Member: Extended-Stay Hotel Council, AHLA
Follow us on Facebook and Twitter

Courtyard by Marriott Holiday Inn Express
Hampton Inn and Suites
Holiday Inn
Country Inn and Suites Wingate Inn

Interim Hospitality Consultants Offers a Wide Array of Hospitality Assistance to Your Firm
Selected Completed ProjectsManagement Assistance:
Hotel Operations Analysis:1. Hamilton Inn Chattanooga, TN 6. Holiday Express Inn & Sts Russellville, AL2. Desert Pearl Inn Springdale, UT 7. Pineapple Beach Resort Panama City Beach, FL3. Clarion Hotel Atlanta (East Point), GA 8. Holiday Inn Hotel Louisville, KY4. Holiday Inn Express Marianna, FL 9. Four Points Sheraton Cincinnati, OH5. Tides Inn Norfolk, VA 10. Diamond Inn Villa Ridge, MO
Quality Assurance Reviews: 8. Hampton Inn & Suites Boynton Beach, FL1. Tahitian Inn Ft. Myers, FL 9. Hampton Inn & Suites Boca Raton, FL2. Villager Lodge Riviera Beach, FL 10. Hampton Inn & Suites Palm Beach Gardens, FL3. Villager Lodge Homestead, FL 11. Majestic Pines Casino/Htl Black River Falls, WI
4. Travelodge Altamonte Springs, FL 12. Microtel Inn Meridian, MS5. Holiday Inn Orlando (Florida Mall), FL 13. Tides Inn Norfolk, VA6. Villager Premier Tucker, GA 14. User Housing Facility Dept Energy, Richland, WA7. Villager Lodge Marietta, GA 15. Days Inn Minneapolis, MN
Hotel Operations Management Contract: 7. Holiday Inn Statesboro, GA1. North Shore Inn & Suites N. Myrtle Beach, SC 8. Holiday Inn Express Bainbridge, GA2. Comfort Inn & Suites Cairo, GA 9. Suburban Extended Stay Tallahassee, FL3. Days Inn Glen Burnie, MD 10. Holiday Inn Exp H & S Crawfordville, FL4. Desert Isle Daytona Beach, FL 11. Holiday Inn Exp H & S Grand Rapids, MI5. Quality Inn Tallahassee, FL 12. Howard Johnson Exp H/S Grand Rapids, MI6. Maple Leaf Condo Hotel Daytona Beach, FL 13. Wingate Inn Lynn Haven (Panama City), FL
Market Research Studies:1. Comfort Suites Nashville, TN 9. Independent Living Endicott, NY2. Super 8 Motel Atlanta (Six Flags), GA 10. Comfort Inn Fern Park, FL3. Guest House Inn Thomasville, GA 11. Comfort Suites Naples, FL4. Microtel Suites Brunswick, GA 12. Keweenaw Mtn Lodge Copper Harbor, MI5. Hawthorn Suites Richmond Hills, GA 13. Sun Suites Gulfport, MS6. Ramada Inn SE Nashville, TN 14. Comfort Inn & Suites St. Louis Airport, MO7. Hawthorn Suites Alpharetta (Atlanta), GA 15. Diamond Inn Villa Ridge (St. Louis), MO8. Microtel Suites Freehold, NJ 16. Tides Inn Norfolk, VA
Human Resources, Employee Guides, Employment Placement: 5. Hilton Hotel Macon, GA1. Holiday Inn Express Bainbridge, GA 6. Park Central Inn Ft. Worth, TX
2. Holiday Inn & Suites Russellville, AL 7. Suburban Extended Stay Tallahassee, FL3. Ramada Limited Gainesville, FL 8. Holiday Inn Exp H & S Crawfordville, FL4. Desert Pearl Inn Springdale, UT 9. Wingate Inn Lynn Haven (Panama City), FL
Pre-Opening Contracts 5. Holiday Inn Express Russellville, AL1. Comfort Inn & Suites Cairo, GA 6. Suburban Extended Stay Tallahassee, FL2. Hilton Hotel Macon, GA 7. Holiday Inn Exp H & S Crawfordville, FL3. Southgate Campus Center Tallahassee, FL 8. Holiday Inn Exp H & S Grand Rapids, MI4. Holiday Inn Express Bainbridge, GA 9. Wingate Hotel Lynn Haven (Panama City), FL
Asset Management1. Staybridge Suites Tallahassee, FL 2. Comfort Suites Suffolk, VA
Member, International Association of Hospitality AdvisorsMember, Extended-Stay Hotel Council, AHLA

Selected Completed Projects
Ownership Assistance:
Economic Impact::
1. Hampton Inn Dade City, FL 2. Holiday Inn Express H&S Grand Rapids, MI
Internal Audit
1. Best Western Calumet Park, IL 2. Super 8 Calumet Park, IL
Litigation Support — Expert Witness Testimony:
1. MainStay Suites Atlanta, GA 3. Comfort Suites Decatur, AL
2. Desert Isle Daytona Beach, FL 4. Holiday Inn Express Cahokia, IL
Anonymous Audits:
1. Microtel Inn & Suites Meridian, MS 3. Days Inn Minneapolis, MN
2. Hamilton Inn Chattanooga, TN 4. Port Inn Port St. Joe, FL
Real Estate Services:The Real Estate arm of Interim Hospitality Consultants, Lodging Realty Services has the following listings
Hotels
1. Wingate by Wyndham Mobile, AL 4. Howard Johnson Pensacola, FL
2. Microtel Inn and Suites Daphne, AL 5. Days Inn Pensacola, FL
3. Future Hotel Site Quincy, FL 6. Pensacola Inn Pensacola, FL
Bed and Breakfasts
1. Calhoun St Inn Tallahassee, FL 7. G. V. Tillman House Lake Wales, FL
2. 1872 John Denham House Monticello, FL 8. Dickens Inn Mims, FL. . . . . . . . . . . . . SOLD
3. Suwanee River Inn Old Town, FL 9. Sweet Magnolia St. Marks, FL
4. Heritage Country Inn Ocala, FL. . . . . . . . . . . . . . . SOLD 10. 12 Oaks Resort Monticello, FL
5. Noble Manor Pensacola, FL. . . . . . . . . . . . SOLD 11. Lake Hampton B&B Starke, FL
6. The Footed Tub Fort Green, FL
Site Reviews: 21. Staybridge Suites Orlando (I-Drive), FL
1. Sleep Inn Elkhart, IN 22. Hawthorn Suites Tallahassee, FL
2. Microtel Inn & Suites Pulaski, TN 23. Wellesley Inn Ramsey, NJ
3. Country Inn & Suites Virginia Beach, VA 24. Holiday Inn Express Tallahassee, FL
4. Comfort Inn Stuart, FL 25. Baymont Inn Shreveport (Greenwood), LA
5. Eagles Nest Resort Columbia, SC 26. Hawthorn Suites Atlanta (East Point), GA
6. Hamilton Inn Tallahassee, FL 27. Days Inn Gainesville, FL
7. Hawthorn Suites Tampa (Airport), FL 28. Microtel Suites New Orleans (Gretna), LA
8. Hawthorn Suites Bonita Springs, FL 29. Microtel Inn & Suites Ft. Myers, FL
9. AmericInn Ft. Myers, FL 30. Wingate Inn Ft. Lauderdale, FL
10. Microtel Inn & Suites West Palm Beach (I-95), FL 31. Microtel Inn & Suites Spanish Fort, AL
11. Hawthorn Suites West Palm Beach (Airport), FL 32. La Quinta Inn Orange Beach, AL
12. Country Inns & Suites West Palm Beach, FL 33. Country Inn & Suites Tampa, FL
13. Hawthorn Suites W. Palm Beach (Gardens Mall), FL 34. Microtel Inn Wyoming, MN
14. Hawthorn Suites Fort Myers, FL 35. Hawthorn Suites Blaine, MN
15. Wingate Inn Lakeland, FL 36. Hampton Inn Destin, FL
16. La Quinta Inn & Suites Columbia, LA 37. Microtel Inn San Antonio, Texas
17. Microtel Inn Richmond Hills (Savannah), GA 38. Sleep Inn Quincy, FL
18. Hamilton Inn Bluffton, SC 39. Residence Inn Savannah, GA
19. Hawthorn Suites Atlanta (Cumming), GA 40. Westin Hotel Greensboro, NC
20. Best Western Inn Havana, FL 41. Market-driven Tupelo, MS
Page 2

Selected Completed ProjectsDevelopment Assistance:
Feasibility Studies: 58. Comfort Suites Crawfordville, FL1. Microtel Inn & Suites Decatur, AL 59. Microtel Inn & Suites Ocala, FL2. Travelodge to Quality Inn Clarksville, TN 60. Hampton Inn Chipley, FL3. Microtel Inn (Update) Franklin, KY 61. MainStay Suites Tallahassee, FL4. Country Inn & Suites Sandusky, OH 62. Holiday Inn Express Luverne, AL5. Hawthorn Inn & Suites Fort Myers, FL 63. Suburban Extended Stay Tallahassee, FL6. Best Western Inn Calumet Park (Chicago), IL 64. Holiday Inn Hotel & Suites Ocala, FL7. Country Inn & Suites Taunton (Boston), MA 65. Homewood by Hilton Tallahassee, FL8. Country Inn & Suites Raynham (Boston), MA 66. Holiday Inn Express Holiday City, OH9. Guest House Inn (Update) Birmingham, AL 67. Candlewood Suites Niceville, FL
10. Hawthorn Suites (Update) Dalton, GA 68. Country Inn & Suites Yulee, FL11. Hampton Inn & Suites Ft. Myers, FL 68. Best Western Luverne, AL12. Hawthorn Suites Atlanta (Airport), GA 69. Hampton Inn Quincy, FL13. Hawthorn Suites Palm Bay, FL 70. Best Western Inn Auburndale, FL14. Candlewood Suites Atlanta (Airport), GA 71. Microtel Inn & Suites Williamsburg, VA15. Hawthorn Suites Birmingham, AL 72. Holiday Inn Express H&S Quincy, FL
16. Microtel Suites Birmingham, AL 73. Candlewood Suites Grand Rapids, MI17. Hawthorn Condo Resort Warm Springs, GA 74. Holiday Inn Express H&S Wheeling, WV18. Microtel Inn & Suites Lincoln Park (Detroit), MI 75. Edward Waters Hotel Jacksonville, FL19. Hawthorn Suites Coconut Grove (Miami), FL 76. Staybridge Suites Tallahassee, FL20. Country Inn & Suites DeLand, FL 77. Microtel Inn & Suites Talladega, AL21. Wingate Hotel Beaufort, SC 78. Sleep Inn Port St. Joe, FL22. Hawthorn Suites Roswell (Atlanta), GA 79. Holiday Inn Express Crossett, AR23. Hawthorn Suites Ocala, FL 80. Four Points Sheraton Indianapolis, IN24. Hawthorn Suites Dalton, GA 81. Country Inn & Suites Jackson, MS25. Shoney’s Inn & Suites Morrilton, AR 82. Performing Arts Theatre Mt. Morris, NY26. Hawthorn Suites Flowery Branch (Atl), GA 83. Keweenaw Mtn. Lodge Copper Harbor, MI27. Sleep Inn Augusta, GA 84. MainStay Suites Ocala, FL28. Holiday Inn Express Binghamton, NY 85. Cambria Suites Lauderhill, FL29. Hilton Garden Inn Miramar (Miami), FL 86. Hilton Garden Inn Naples, FL30. Best Western Jackson, GA 87. Holiday Inn Express H&S Fort Myers, FL31. Hawthorn Suites College Park (Atlanta), GA 88. Sleep Inn and Suites Jacksonville, FL32. Hawthorn Suites Hartwell, GA 89. Candlewood Suites Brandon, FL33. Hawthorn Suites Melbourne, FL 90. Hilton Garden Inn Harrisburg, PA34. Microtel Suites Meridian, MS 91. Microtel Inn and Suites Lake Wales, FL35. Microtel Inn & Suites Shreveport, LA 92. Hampton Inn and Suites Lake Wales, FL36. Microtel Inn & Suites Pasadena, TX 93. Holiday Inn Express H&S Rubidoux (Riverside), CA37. Microtel Inn & Suites Slidell, LA 94. Best Western Exec Inn Okeechobee, FL38. Country Inn & Suites Ft. Myers, FL 95. Country Inn and Suites Crestview, FL39. Hawthorn Suites Raleigh (Airport), NC 96. Hilton Garden Inn Crestview, FL40. Hampton Inn St. Petersburg, FL 97. Cambria Suites Vero Beach, FL
41. Port Inn Port St. Joe, FL 98. Hilton Homewood Suites De Pere (Green Bay), WI42. Microtel Inn & Suites Daphne, AL 99. Candlewood Suites Tallahassee, FL43. Hawthorn Suites Tallahassee, FL 100. Hampton Inn and Suites Huntsville, AL44. Villager Lodge Dallas, GA 101. Microtel Inn & Suites Leland, MS45. Hawthorn Suites New Orleans, LA 102. Comfort Suites Suffolk, VA46. Chama Inn & Suites Chama, NM 103. AmericInn Greenville, MI47. Microtel Inn & Suites Bushnell, FL 104. Best Western Pensacola, FL48. Homewood Suites Harrisburg, PA 105. Roosevelt Inn & Suites Saratoga Springs, NY49. Suburban Lodge Meridian, MS 106. Hilton Homewood Suites Norfolk, VA50. MainStay Suites Meridian, MS 107. Country Inn & Suites Natchez, MS51. Hilton Garden Inn Gettysburg, PA 108. Holiday Inn Hotel Pearl (Jackson), MS52. Microtel Inn & Suites Leland, MS 109. Country Inn & Suites Lady Lake, FL53. Hampton Inn Dade City, FL 110. MainStay Suites Richmond, VA54. Holiday Inn Express Wheeling, WV 111. Hilton Homewood Suites Mason, OH55. Guest House at PNNL Richland, WA 112. Holiday Inn Express H&S Mason, OH56. Hearthside Inn New Orleans, LA 113. Hampton Inn Rocky Mount, NC57. Country Inn and Suites Cortland, NY 114. Microtel Inn and Suites East Point, FL
Page 3

Selected Completed Projects
Feasibility Studies continued 174. Lexington Hotel Coral Springs, FL115. La Quinta Inn & Suites Malbis, AL 175. Independent Hotel Copperhill, TN116. Microtel Inn & Suites Carrabelle, FL 176. Hampton Inn and Suites Knightdale, NC117. Holiday Inn Hotel Fayetteville, NC 177. Sheraton Four Points Hotel Lancaster, PA118. Country Inn & Suites Grand Haven, MI 178. Sleep Inn Shreveport, LA119. Microtel Inn & Suites St. Rose (New Orleans), LA 179. Comfort Inn Raleigh, NC120. Courtyard by Marriott Ft. Myers, FL 180. Country Inn and Suites Rose Hill, NC121. TownePlace Suites Pensacola, FL 181. Golf Resort Hotel Coral Springs, FL122. Microtel Inn & Suites Mount Pleasant, SC 182. Wyndham Garden Inn Indianapolis, IN123. Microtel Inn & Suites Summerville, SC 183. Cambria Suites Perdido Key, FL124. Element Extended Stay Norfolk, VA 184. Country Inn and Suites Jasper, GA125. Hilton Garden Inn Durham, NC 185. Hotel Cape Coral, FL126. La Quinta Inn & Suites Pensacola, FL 186. Comfort Inn & Suites Eutaw, AL127. Radisson Hotel Memphis, TN 187. Country Inn & Suites (2) Greensboro, NC128. Microtel Inn & Suites Brooksville, FL 188. Cambria Suites Greensboro, NC129. Hotel Indigo Stuart, FL 189. Comfort Inn and Suites Hastings, MI130. Microtel Inn & Suites Maumee (Toledo), OH 190. Hawthorn Suites Daphne, AL131. Hyatt Summerfield Norfolk, VA 191. Microtel Inn & Suites Daphne, AL132. Boutique Hotel Miami Beach, FL 192. Aloft Jamaica, Queens, NY133. MainStay Suites Horn Lake, MS 193. Country Inn & Suites Grand Haven, MI134. Golf Resort Hotel & Spa Palmyra, VA 194. Suburban Extended Stay Ocala, FL
135. SpringHill Suites Richmond, VA 195. Country Inn & Suites Mansfield, PA136. Zydeco Hotel & Spa Gulf Shores, AL 196. MainStay Suites Newark, NJ137. MainStay Suites Montgomery, AL 197. Staybridge Suites Dothan, AL138. Candlewood Suites Anderson, SC 198. Country Inn & Suites Greenville, MS139. Embassy Suites Jackson, MS 199. Crowne Plaza Rochester, NY140. Country Inn & Suites Magnolia, NC 200. Courtyard by Marriott Jacksonville, NC141. Resort Hotel & Residences Gulf Shores, AL 201. Delta Court Hotel Vicksburg, MS143. Microtel Inn &Suites Thibodaux, LA 202. Residence Inn Silver Spring, MD144. La Quinta Inn & Suites Southaven, MS 203. Best Western Inn/W.P. Mount Morris, NY145. Hampton Inn & Suites Plattsburgh, NY 204. Hyatt Place Augusta, GA146. Doubletree Hotel South Amboy, NJ 205. Hyatt Place Montgomery, AL147. AmericInn Edgemont, SD 206. Hyatt Place Bluffton, SC148. Holiday Inn Express Perry, FL 207. Hyatt Place Lexington, KY149. Suburban Extended-Stay Perry, FL 208. Country Inn & Suites Fort Mill, SC150. Condo Hotel St. James Island, FL 209. Comfort Inn & Suites Winfield, AL151. Holiday Inn Hotel Portsmouth, VA 210. Hilton Coral Springs, FL152. Microtel Inn Salamanca, NY 211. Lexington Hotel Palmyra, VA153. Boutique Hotel Oxford, MS 212. Cambria Suites Dallas, TX154. Lexington Hotel Chelsea, Manhattan, NY 213. Comfort Inn & Suites Leland, MS155. Key West Inn Columbiana, AL 214. Sleep Inn & Suites Columbia, SC156. Sleep Inn & Suites Headland, AL 215. Country Inn & Suites Davie, FL157. Condo Hotel Sarasota, FL 216. Best Western Plant City, FL158. Country Inn & Suites Marinette, WI 217. Hampton Inn & Suites Geneseo, NY159. Days Inn Allendale, SC 218. Hyatt Place Suffolk, VA160. MainStay Suites Springfield, MA 219. Holiday Inn Express Palatka, FL
161. MainStay Suites Pinellas Park, FL 220. Hawthorn Suites Interlochen, MI162. Homewood Suites Greenville, NC 221. Hilton Home2 Suites Millville, NJ163. La Quinta Inn & Suites Lincoln, NE 222. Holiday Inn Hotel Stuart, FL164. Hyatt Place North Miami Beach, FL 223. DoubleTree Hotel Willow Valley, PA165. Comfort Suites Eastpoint, FL 224. La Quinta Inn & Suites Verona, NY166. Country Inn & Suites Troutman, NC 225. Microtel Inn & Suites N. Bergen, NJ167. Hotel Indigo North Miami Beach, FL 226. Quality Inn Geneseo, NY168. Cambria Suites Bluffton, SC 227. Country Inn & Suites Pensacola, FL169. Lexington Hotel Long Island City, NY 228. Microtel Inn & Suites Carrabelle, FL170. Cambria Suites Washington Hgts, NY 229. Hampton Inn & Suites Smithfield, VA171. Days Inn Kenner, LA 230. Comfort Suites N. Miami Beach, FL172. Hawthorn Suites New Orleans, LA 231. Dozier Hotel Petersburg, VA173. Baymont Inn & Suites Slidell, LA 232. Best Western & Water Pk. Geneseo, NY
Page 4

Selected Completed Projects
Feasibility Studies continued233. Lexington Middletown, NY 288. Fairfield Inn Ft Walton Beach, FL234. Ascend Hotel Manitowish Waters, WI 289. Market-driven hotel Immokalee, FL235. Staybridge Suites Memphis (Collierville), TN 290. Hotel Indigo Dania Beach, FL236. Crowne Plaza Memphis (Collierville), TN 291. Sleep Inn Woodbridge, VA236. InterContinental Hotel Greensboro, NC 292. Holiday Inn Express Allentown, PA237. Ascend Collection Hotel Brooklyn, NY 293. Holiday Inn Express Breezewood, PA238. Clarion Hotel Brooklyn, NY 294. Suburban E/S Hotel Traidelphia, WV239. Extended Stay Hotel Monterrey, Mexico 295. Candlewood Suites Edmond, OK240. SpringHill Inn & Suites Portsmouth, VA 296. Barq Boutique Hotel Biloxi, MS241. Country Inn & Suites Rossford, OH 297. Quality Inn Bedford, PA242. MainStay Suites Port Charlotte, FL 298. Sleep Inn Mena, AR243. Extended Stay Hotel San Luis Potosi, Mexico 299. Sleep Inn Union Springs, AL244. Hampton Inn & Suites Mansfield, PA 300. Sleep Inn/MainStay Suites Kennedale, TX245. Best Western Suites Marietta, GA 301. Sleep Inn/MainStay Suites Windham, ME
246. Candlewood Suites Marietta, GA 302. Radisson Hotel Williston, ND247. Holiday Inn Express College Park, GA 303. Best Western Plus Enterprise, AL248. Hotel Indigo Dania Beach, FL 304. Comfort Inn Blakely, GA249. Comfort Suites West Park, FL 305. MainStay Suites Dickinson, ND250. Radisson Hotel Gladstone, MO 306. Homewood Suites St. George, UT251. Comfort Suites Bronx, NY 307. Hampton Inn & Suites Huntsville, AL252. Holiday Inn Express Victorville, CA 308. Holiday Inn Louisville, KY253. Country Inn & Suites Pelham, AL 309. Ascent Collection Midland, TX254. Conrad Hotel Memphis, TN 310. Hilton Garden Inn St. Maartin, FWI255. Country Inn & Suites Washington, GA 311. Sleep Inn/MainStay Suites Marlton, NJ256. Hotel Indigo New Orleans, LA 312. Best Western Premier Jackson Twnp, NJ
257. Holiday Inn Williamsburg, IA 313. Holiday Inn Flemington, NJ258. Cambria Suites Las Vegas, NV 314. Holiday Inn Express Glasgow, KY259. La Quinta Inn & Suites Malbis, AL 315. Fairfield Inn & Suies Plattsburgh, NY260. Extended Suites Monterrey, Mexico 316. MainStay Suites Baltimore, MD261. Country Inn & Suites Starkville, MS 317. Best Western Plus Ardmore, OK262. Holiday Inn Express Wytheville, VA 318. La Quinta Suites Wichita Falls, TX263. Hyatt Place Delray Beach, FL 319. Holiday Inn E xpress California, MD264. Wyndham Garden Hotel Delray Beach, FL 320. Staybridge Suites Knoxville, TN265. Fairfield by Marriott Plattsburgh, NY 321. Lexington Inn Ft. Lauderdale, FL266. Lexington Hotel Branson, MO 322. Ascend Collection Ridgeway, PA267. Comfort Inn & Suites Hastings, MI 323. Comfort Suites Valley Stream, NY268. Autograph Collection Houston, TX 324. Hampton Inn Oklahoma City, OK269. MainStay Suites Great Mills, MD 325. Comfort Inn Hammondsport, NY270. Holiday Inn Kingsland, GA 326. Home2 Tallahassee, FL271. Sleep Inn & Suites Marion, AL 327. Best Western Plus Kenner, LA272. Ramada Inn Poconos, PA 328. MainStay Suites Canton, OH273. Independent Resort Black Mountain, NC 329. Sleep Inn & Suites Niagara Falls, NY274. TownePlace Suites Vidalia, LA 330. Comf Inn/MainStay Sutes Cadiz, OH275. Homewood Suites Atlanta, GA 331. La Quinta Inn Olive Branch, MS276. Baymont Inn & Suites Kissimmee, FL 332. Holiday Inn Express Montevallo, AL277. Microtel Inn & Suites Wilkes-Barre, PA 333. Holiday Inn Express Fanning Springs, FL278. Holiday Inn Express Duncan, OK 334. Montevallo, AL Holiday Inn Express279. Osa Resort Club Costa Rica 335. Sanford, FL Marriott Courtyard280. Holiday Inn Express & S. Canonsburg, PA 336. Celebration, FL Baymont Inn281. Holiday Inn Express Bordentown, NJ 337. Ocean Pines, MD Cobbllestone Inn
282. EconoLodge Ocala, FL 338. Berlin, MD Cobbllestone Inn283. Radisson Hotel Porto-au-Prince, Haiti 339. Snow Hill, MD Cobblestone Inn284. Wakulla Springs Lodge Wakulla Springs, FL 340. Bonesboro, MD Cobbllestone Inn285. Staybridge Suites Union City, NJ 341. Federalsburg, MD Cobbllestone Inn286. Suburban Hotel Morgantown, WV 342. Coral Springs, FL Lexington Hotel287. Ascend Collection Wytheville, VA 343. Pocomoke City, MD Cobblesltnoe Inn
Page 5

Selected Completed Projects
Feasibility Studies continued
334. Best Western S. Fulton, KY 350 Hampton Inn Cumberland, MD
335. Cobbllestone Inn Allendale, SC 351 Ascend Collection Jim Thorpe, PA
336. Staybridge Suites Denver, NC 352 Cobblestone Inn Lusby, MD337. Suburban Suites Washington, PA 353 Cobblestone Inn Verona, VA338. BestWestern Plus Ardmore, OK 354 Cobblestone Inn Medina, NY339. SpringHill Suites Charleroi, PA 355 Holiday Inn Express Kingsland, GA340. Cobblestone Inn Frostburg, MD 356 Best Western Plus Hammondsport, NY341. Lexington Trinidad 357 Best Western E/S Myrtle Beach, SC342. Comfort Suites Largo, MD 358 Ascend Collection Cumberland, MD343. Cobblestone Inn Marian, VA 359 Cobblestone Inn Marion, VA344. Cobblestone Inn Stuart, VA 360 MainStay Suites Hattiesburg, MS345. Cobblestone Inn Appamattox,VA 361 Hampton Inn Plant City, FL346. Cobblestone Inn Amherst, VA 362 EVEN Hotel Pittsburgh, PA347. Cobblestone Inn Buena Vista, VA 363 Cobblestone Inn Berlin, MD348. Comfort Suites Lloyd, FL 364 Holiday Inn Hotel Tallahassee, FL349. Cobblestone Inn Oakland, MD 365 Country Inn and Suites Baton Rouge, LA
Architectural Reviews: 6. Moorings Marina Carrabelle, FL1. Comfort Suites Nashville, TN 7. Econo Lodge Cairo, GA2. Hampton Inn & Suites Toledo, OH 8. Travel Lodge Macon, GA3. Hampton Inn & Suites Augusta, GA 9. Holiday Inn Express Marianna, FL4. Holiday Inn Express Binghamton, NY 10. Comfort Inn Cairo, GA5. Hawthorn Suites Tallahassee, FL 11. Microtel Inn & Suites Marianna, FL
Page 6

Member, International Association of Hospitality AdvisorsMember, Extended-Stay Hotel Council, AHLA Page 1
FEASIBILITY STUDIESAuthored by Edward L. Xanders, CHA
Partial Client List
Scott ShawKissimmee, FL364-6925-6506
Baymont InnKissimmee, FL
Jake WhitfieldLloyd Land Holdings2910 Kerry Forest Pkwy, #D-352Tallahassee, FL 32309850-933-7303
Country Inn and SuitesLloyd, FL
Ms. Amanda N. Glover, DirEconomic DevelopmentAugusta County18 Government Center LaneVerona, VA 24482540-245-5619
Cobblestone HotelVerona, VA
John Genakos, Asso DirMaryland Economic Develop-mentCorporation300 E Lombard St, Suite 1000410-625-3983
Hotel/InnLusby, MD
Priyesh PatelCrowne Hotels LLC13400 Sutton Park Dr S, #1604Jacksonville, FL 32224904-493-9393
Holiday Inn ExpressKingsland, GA
Mark R. Nesselroad. CEOGlenmark Holdings6 Canyon Road, #300Morgantown, WV 26508304-599-3369, x 107
Suburban Ex-Stay HotelWashington, PA
Suburban Ex-Stay HotelSt. Clairsville, OH

Member, International Association of Hospitality AdvisorsMember, Extended-Stay Hotel Council, AHLA Page 2
Morris StarkmanStarkman Properties, LLC1939 Route 70 East, Suite 210Cherry Hill, NJ 08003856-424-0497
Sleep Inn/MainStay SuitesMarlton, NJ
Brian Harris8805 State Route 415Campbell, KY 14821215-292-7252
Comfort InnHammondsport, NY
Laura Aftosmis, PartnerRevest Properties985 Towne Square DrGreensburg, PA 15601724-838-0260
Holiday Inn Express and SuitesCanonsburg, PA
Andrea A. White, PresThe Stokely Company620 Campbell Station Rd, Suite 27Knoxville, TN 37934865.966.4878
Staybridge SuitesKnoxville, TN
Bernie MoyleVantage Hospitality3300 North University Dr, Suite 500Coral Springs, FL 33065954-593-3844
Lexington InnFt. Lauderdale, FL
Don Rogers. SVPCompass Bank321 Belleaire Blvd, 2nd FloorMobile, AL 36606251-470-7467
132-room Hotel IndigoNew Orleans, LA
David WarnerTapper & Company208 Monument AvePort St. Joe, FL 32457850-227-1111
Wakulla Springs LodgeWakulla, FL
Robert W. Bittner16563 Lincoln HighwayBreezewood, PA 15533814-285-2275
Holiday Inn ExpressBreezewood, PA

Member, International Association of Hospitality Advisors
Member, Extended-Stay Hotel Council, AHLA Page 3
Francisco HernandezTana HoldingsPresidente Masoryk #29 Piso 2Col. Chapultepec de MoralesMexico D.F. 115701 (305) 433.5672
Extended SuitesAguascalientes, Mexico
Extended SuitesCoatzacoalcos, Mexico
Dominique F. Carvonis, PresidentMAC, S.A.Visa LodgeRue des NimesRoute de l’AérportPort-au-Prince, Haiti305-283-6919
Hilton Garden InnPort-au-Prince, Haiti
Marlon PhoenixPhoenix and Associates384 E. Goodman Rd, Suite 136Southhaven, MS 38671662-404-4990
1. Conrad HotelMemphis, TN2. Staybridge Suites3. Crowne PlazaCollierville, TN
Bill BrantleyBunn-Brantley Enterprises, Inc.389 Instrument DriveRocky Mount, NC 27804252-977-9111
Hampton InnRocky Mount, NC
Hank Thomas1793 Kanawaha TrailStone Mountain, GA 30087770-331-3270
Courtyard by MarriottJacksonville, NC
Hotel IndigoDania Beach, FL
Shirley WaringHotel Delta Court, LLC2613 Confederate AvenueVicksburg, MS 39180301-634-0113
Delta Court HotelVicksburg, MS
David Henderson302 S. Mass. Ave., Suite 223Landland, FL 33801863-682-2000
Country Inn & SuitesPlant City, FL
Sam Agee, ChairmanGateway Hospitality111 Stonemark Lane, Suite 202Columbia, SC 29210803-795-7979
Home2 SuitesTallahassee, FL

Member, International Association of Hospitality Advisors
Member, Extended-Stay Hotel Council, AHLA Page 4
Ahmad Siddiqui1000 Veterans Memorial BlvdKenner, LA 70119504-463-5612
Best Western PlusKenner, LA
Ashish Shah7804 Niagra Falls BlvdNiagra Falls, NY 14304716-748-9400
Sleep Inn and SuitesNiagara Falls, NJ
Edward Littlejohn356 Main StreetWintersville, OH 43953740-632-1196
Comfort Inn/MainStay SuitesCadiz, OH
Donny Singh3085 Church RoadSouthhaven, MS 38672901-331-9742
La Quinta Inn Olive Branch, MS
Mitesh V. Patel2432 Veterans Boulevard Ardmore, OK 405-388-7728
La Quinta SuitesWichita Falls, TX
Herman LehmanCity of Montevallo545 Main StMontevallo, AL 35115
Holiday Inn ExpressMontevallo, AL
David Padot7272 Cardinal TrailFanning Springs, FL 32693352-222-6656
Holiday Inn ExpressFanning Springs, FL
Nilesh Patel601 N. 1st StreetMadill, OK 73446580-795-4876
Best Western PlusArdmore OK
B. F. Patel200 Rainbow BoulevardNiagara Falls, NY 14303716-998-2623
Courtyard SuitesNiagara Falls, NY
Member, International Association of Hospitality Advisors
Member, Extended-Stay Hotel Council, AHLA Page 5
Neil Patel1520 Gulf Blvd, # 406Clearwater, FL 33767727-871-5876
Quality InnLeesburg, FL.
Bhadresh Patel1555 Bear Creek PikeColumbia, TN 38401931-505-0550
70-room Best WesternColumbia, TN
Julian Cope, Exec. SecBullock County Econ. Devel.106 Conecuh Avenue EastUnion Springs, AL 36089C: 334-381-0821
Sleep InnUnion Springs, AL
Sam PatelBest Western Plus715 Bollweevil CircleEnterprise, AL 36330334-475-0306
Best Western PlusEnterprise, AL
Bob Hart, Exec DirKennedale Econo Devel Corp405 Municipal DrKennedale, TX 76060817-532-6291
Sleep Inn/MainStay SuitesKennedale, TX
Derek RowleySunRiver St. George1404 W. SunRiver Pky, Ste 200St. George, UT 84790435-673-4300
Homewood SuitesHyatt HouseResidence InnSt. George, Utah
Kiran Patel1010 West Chester RoadMadison, AL 35758256-374-9021
Hampton Inn and SuitesHuntsville, AL
Jillian-Marie NargiMona Shah & Associates299 roadway, Suite 1005New York, NY 10007212-233-7473
Holiday Inn HotelLouisville, KY

Member, International Association of Hospitality Advisors
Member, Extended-Stay Hotel Council, AHLA Page 6
Hervé DorvilChambre Consulaire Interprofessionelle10 Rue Jean-Jacques FayelConcordia, St. Maarten05-90-87-8442
Hilton Garden InnSt. Marten, FWI
Claude Kemp24 Parliament DriveMount Holly, NJ 08060829-438-8598
Best Western Premier Jackson Township, NJ
Suresh Patel350 Parsippany BlvdBoonton, NJ 07005973-334-5499
Holiday Inn Hotel Flemington, NJ
Vic Patel1564 Stillwater CourtBowling Green, KY 42103270-991-2997
Holiday Inn Express Glasgow, KY
Kalpesh Patel YUG CORP.820 Hwy 59 NorthHeavener, OK 74937918-721-3530
Sleep InnMena, AR
Muhittin Arda KandiraliProposal CoordinatorSerka Services, LLC8230 Leesburg Park, Suite 7000Vienna, VA 22122703 288 1555
Radisson HotelWilliston, ND
MainStay SuitesDickinson, ND
Ascend Collection HotelMidland, TX
Erik HeylandHeyland Development194 Central StreetSaugus, MA 019006781-231-1349
Sleep Inn and MainStay Suites combinationhotel Windham, ME
Jeffery CalhounSAC Incorporated4588 Business 220Bedford, PA 15522814-623-8114
Comfort SuitesBedford, PA

Member, International Association of Hospitality Advisors
Member, Extended-Stay Hotel Council, AHLA Page 7
Calvin Glover300 Greystone Court, #401Fredericksburg, VA 22401803-479-4053
Sleep InnWoodbridge, VA
Rob Brooks34203 Singletary DriveMyakka City, FL 34251941-322-2820
Holiday Inn ExpressAllentown, PA
John O'Donnell, PresidentMainstream Construction Group, Inc.725 Sunshine LaneAltamonte Springs, FL 32714407-862-6445
Osa Resort ClubPuerto Jimenez, Costa Rica
Dinkerrao TaylorJames Taylor2001 Hamilton Street, No. 326Philadelphia, PA 19130609-208-2345
Holiday Inn Express hotelBordentown, NJ
Vince Bruner110 Eglin Parkway SEFort Walton Beach, FL 32548850-243-4227
87-room Fairfield InnFort Walton Beach, FL
Kim MehtaCandlewood Suites279 Secaucus RoadSecaucus, NJ 07094732-644-6921
Staybridge SuitesUnion City, NJ
Marie Capita, ManagerImmokalee Business Development Center310 Alachua StreetImmokalee, FL 34142239-269-9629
market-driven hotelImmokalee, FL
Mark R. NesselroadGlenmark Holding6 Canyon Road, #300Morgantown, WV 20508304-599-3369
Suburban E/S HotelTridelphia, WV
Scott Patel5725 SW 5th StreetOklahoma City, OK 73128405-819-7343
Candlewood SuitesEdmond, OK

Member, International Association of Hospitality Advisors
Member, Extended-Stay Hotel Council, AHLA Page 8
Josh Caillavet508 Natchez StreetNew Orleans, LA 70130504-810-6207
Barq Boutique HotelBiloxi, MS
Bill Smith395 Chapman RoadWytheville, VA 26382276-620-6202
George Wythe HotelAscend CollectionWytheville, VA
Mitesh Patel2432 Veterans Blvd.Ardmore, OK 73401405-388-7728
Holiday Inn ExpressDuncan, OK
Richard Zentner388 State Route 487Bloomsburg, PA 17815570-784-0111
Microtel Inn and SuitesWilkes-Barre, PA
Sachin PatelDiplomat Companies2100 Parklake Dr NE, Suite AAtlanta, GA. 30345770-938-2060
116-rm Homewood SuitesAtlanta, GA
Anil PatelAsutosh Group220 Ponte Vedra Park Dr., Suite 140Ponte Vedra Beach, FL 32082904-493-9393
Holiday InnKingsland, GA
Guy Curley, PresidentHickory Hills Lodge LLC22501 Iverson DriveGreat Mills, MD 20634301-862-5246
MainStay SuitesGreat Mills, MD
Anup ShahAlpha Hotel Group52 Riley Road, #421Celebration, FL 34747407-301-8165
Stadium Inn & SuitesKissimmee, FL
Dr. Seth Lartey, PastorAME Zion Church630 N. Patterson AveWinston-Salem, NC 27101(336) 918-4994
Independent ResortBlack Mountain, NC

Member, International Association of Hospitality Advisors
Member, Extended-Stay Hotel Council, AHLA Page 9
Louis CarboneCoastal Design Development Group90 SE 4 Ave, #1Delray Beach, FL 33483561-272-3419
Wyndham Garden InnDelray Beach, FL
Nick Patel820 Lithia RoadWytheville, VA 24382276-620-9393
Holiday Inn ExpressWytheville, VA
Bridget ChisholmBWC Consulting802 Walker Ave, Suite 5Memphis, TN 38126901-435-1667
InterContinental HotelGreensboro, NC
Richard Zentner388 State Route 487Bloomsburg, PA 17815570-784-0111
Country Inn and SuitesMansfield, PA
Hon. L. Louise Lucas1214 County StreetPost Office Box 700Portsmouth, VA 23705757-328-2966
Hampton Inn & SuitesPortsmouth, VA
Sanjay PatelDiplomat Companies2100 Parklake Dr. NE, Ste AAtlanta, GA. 30345770-938-2060
Best Western SuitesCandlewood SuitesMarietta, GA
Holiday Inn ExpressCollege Park, GA
Jeremy Earle, Exec DirComm Redev Agency100 W Dania Beach BlvdDania Beach, FL 33004954-924-6800
Hotel IndigoDania Beach, FL
Joseph Alexander1175 Boston RoadBronx, NY 10456917-567-1798
Comfort SuitesBronx, NY
207-room Hilton Garden InnBronx, NY
Sam Patel12175 Mariposa RoadVictorville, CA 92395760-963-2820
71-room Holiday Inn ExpressVictorville, CA
Member, International Association of Hospitality Advisors
Member, Extended-Stay Hotel Council, AHLA Page 10
Al HillHillcrest Development1315 Franklin Grove Rd, #110Dixon, IL 61021815-288-4672
Country Inn and SuitesPelham (Birmingham), AL
Asrar Khan, PresidentKhan Hospitality Inc.411 E. Huntington Dr., Suite 215Arcadia, CA 91006626-254-9500
Radisson HotelGladstone, MO
Dr. Keith Newby, M.D.Newby Enterprises LLC400 Gresham Drive, Suite 507Norfolk, VA 23507757-719-0060
Hyatt PlaceSuffolk, VA
Jas Ahluwalia1922 South Breeze DriveOrlando, FL 32836407-363-4496
Holiday Inn ExpressPalatka, FL
Don Rodgers, SVPCompass Bank321 Belleaire Blvd, 2nd FloorMobile, AL 36606251-470-7467
60-room La Quinta Inn and SuitesMalbis, AL
Jeff Moyle, Vice-PresidentMoyle Construction and Development, Inc.46702 Highway M-26Houghton, MI 49931906-482-3000
Country Inn and SuitesGrand Haven, MI
Blaise HolzbauerWillow Valley Resort2416 Willow Street PikeLancaster, PA 176021-800-444-1714
DoubleTree HotelLancaster, PA
Matthew Bedosky581 Harry L DriveJohnson City, NY 13790607-770-9333
La Quinta InnVerona, NY

Member, International Association of Hospitality Advisors
Member, Extended-Stay Hotel Council, AHLA Page 11
Tom BauerBauer and Company625 St. Charles Ave., #1ANew Orleans, LA 70130225-939-2680
1. Country Inn and SuitesNatchez, MS2. Indigo HotelNew Orleans, LA
Dinesh Patel5226 Kingsford CourtWest Chester, OH 45069513-259-7040
1. Hilton Homewood SuitesMason, Ohio2. Holiday Inn Express Hotel & SuitesMason, Ohio
John McGraw37 Deer Park RoadManitowish Waters, WS 54545715-904-0020
Condominium HotelManitowish Waters, WS
Maurice Snipes395 Franklin StreetBloomfield, NJ 07003973-445-1933
MainStay SuitesNewark, NJ
Steve Benjamin700 Gervais Street, #300Columbia, SC 29201803-227-2236
Sleep Inn and SuitesColumbia, SC
Jay Patel1130 Motel DriveChipley, FL 32428850-258-3302
Staybridge SuitesDothan, AL
David HausemanHauseman Group1231 Collier Road, NW, #CAtlanta, GA 30318404-231-5900
1. Comfort Inn & SuitesWinfield, AL2. Comfort Inn & SuitesLeland, MS3. Country Inn & SuitesGreenville, MS

Interim Hospitality Consultants Offers a Wide Array of Hospitality Services for Your Firm.
MANAGEMENT ASSISTANCE1. Hotel Operations: General Manager of any size property/development at any location.2. Quality Assurance Programs: Independent evaluation.3. Yield Management: Maximize room revenues from an hourly to a seasonal basis.4. Front Office/Reservation Systems Training: From the first customer greeting to night audit operations.5. Marketing Studies: Formal studies to expose primary and secondary markets; personnel training.6. Human Resource Programs: Position description, employee guides, wage and benefit reviews, task training.
OWNERSHIP ASSISTANCE1. Financial Operations Analysis by department to maximize profits.2. Operations Manuals Consolidation of your policies and procedures in compliance with state/federal laws
and franchisee requirements.3. Litigation Support with expert witness testimony.4. Anonymous Audits of service and management standards.5. Lodging Realty Services through Lodging Realty Services, LLC.6. Appraisal Services through members of the Appraisal Institute of America.7. Mortgage Brokerage Services for real estate financing.
DEVELOPMENT ASSISTANCE1. Feasibility Studies: Authored over 600 franchisor and lender approved studies for over 60 brands.2. Impact Studies to determine from a third-party standpoint the effect of new hotel development.3. Architectural Reviews from a Hotel Operations perspective to eliminate errors and increase productivity.4. Remodeling Coordination from project review to oversight management, including design, purchasing and
installation. 5. Construction Coordination: Coordinating the efforts of the architect, general contractor, franchisee and
ownership from a daily or project review perspective. 6. Pre-Opening Management Functions Includes permits/licensing, FF&E installation, punch lists, staffing,
training and marketing.
Edward L. Xanders, CHA, President, BrokerKim Pedersen, Senior Research Analyst
George C. Banks, Senior Research Analyst
American Hotel Lodging AssociationExtended-Stay Hotel Council, AHLA
International Association of Hospitality AdvisorsNational Association of Black Hotel Owners, Operators and Developers
Asian American Hotel Owners Association, authored articles for AAHOA publicationsNational Association of Condo Hotel Owners
Latino Hotel AssociationSuperior Small Lodging of America
Florida Bed and Breakfast AssociationHotel Brokers Internatinoal

Member, International Association of Hospitality Advisors
Member, Extended-Stay Hotel Council, AHLA
4145 Yardley CircleTallahassee, FL 32309-2942
Phone: 850-893-6010Fax:850-893-8345
Cell: 850-443-5010
Hotel Properties Assisted byEdward L. Xanders, CHA
Selected List
1. Candlewood Suites, Tallahassee, Florida.Asset Management and Pre-Opening Management of the development of a 113-room extended-stay hotel.
2. Country Inn and Suites, Rose Hill, North CarolinaAsset Management and co-ordinate the development of a Country Inn and Suites.
3. Comfort Suites, Suffolk, VirginiaAsset Management in assisting the ownership (Temple Beth-El) in final negotiation of franchiseand management company contracts.
4. Wingate Inn, Lynn Haven, FloridaPre-Opening and Management ContractsIn 2005 Lodging Management Services was awarded the Pre-Opening and Hotel ManagementContracts for the Wingate Inn, Lynn Haven (Panama City), Florida. Market Research dictatedthat the 68-room hotel be positioned as a Boutique Hotel with upgraded bedding, amenities andan Aquatic Center to meet the local competition. Within 65 days of opening, the property hadobtained parity within its Competitive Set at 98.6% RevPAR.
5. Staybridge Suites, Tallahassee, FloridaAsset Management ContractAssisting the Project Developer as the Asset Manager in all phases of Pre-Opening,Architectural, Interior Design; Furniture, Fixtures and Equipment purchasing of the 104-unitStaybridge Suites Hotel. Total development cost estimated at $17 million.
6. Suburban Extended Stay HotelPre-Opening and Management ContractsConversion of the 120-room exterior-corridor, two-story transient hotel into an Extended-StayHotel with an appraised value of $6 million. Through innovative design, a standard 12'x23'room was adjusted to include a sleep/sofa, desk with ergomonic chair and armoire with a 27-inch television living area. Queen-sized bed with double night stands, sleeping space, Kitchenarea of two-seat dining table with wall sconce, 12-cubic-foot, 2-door refrigerator with icemaker, full-size dishwasher, 19"x17" sink with disposal, two-burner cook top, full-size

Hotel Properties Assisted page 2
Member, International Association of Hospitality Advisors
Member, Extended-Stay Hotel Council, AHLA
microwave hood and cabinets; dressing area of double rack closet shelves, vanity with framedmirror. Annual Occupancy of 80% was achieved within seven months of opening.
7. Holiday Inn and Suites, Russellville, AlabamaComplete direction of all pre-opening activities for a six-week period. Expert Witness for Comfort Suites, Decatur, Alabama.
8. Desert Pearl Inn, Springdale, Utah, at Zion National ParkRecruitment of a new General Manager. Perform a Quality Assurance Review. Review FrontOffice Procedures to effect maximum Yield Management and Internal Controls. Review allReservation Procedures; all Marketing Programs; all Human Resource Programs. Analyze priorFinancial Reports to maximize profitability. Review all Operations Manuals, Policies, andProcedures for compliance with state/federal statutes and industry standards. Perform anAnonymous Audit of Reservations, and Management Operations.
9. Proposed Comfort Suites, Naples, FloridaPerformed all Market Research with Franchise and Design recommendations on the proposedhotel development.
10. Park Central Inn, Ft. Worth, TexasHotel Market Analysis, Quality Assurance, Evaluation, Recruitment of a General Manager toreposition an independent hotel in downtown Ft. Worth, Texas.
11. The Tides Inn, Norfolk, VirginiaQuality Assurance Evaluation to reposition the property in the market place.
12. Ramada Limited, Gainesville, FloridaAssisted the first-time hotel owner with final remodeling requirements of converting a 100-room independent motel. Purchased and directed the installation of FF&E. Held TrainingClasses for all employees on the new Franchise programs. Revisited the property on fouroccasions to assist management to successfully complete a Quality Assurance Evaluation andPrograms to pass a Franchise Inspection.
13. Days Inn, Baltimore (Glen Burnie), MarylandWas Interim General Manager and coordinated the changing of a 130-room Holiday Inn intoa Days Inn during the first 6 weeks under new ownership.
14. Holiday Inn, Statesboro, GeorgiaAs Interim General Manager, had complete authority in implementing a $300,000 PropertyImprovement Program over a 4- month period to successfully pass a Holiday Inn CorporateInspection in the 129-room hotel.

Hotel Properties Assisted page 3
Member, International Association of Hospitality Advisors
Member, Extended-Stay Hotel Council, AHLA
15. Holiday Inn Express, Bainbridge, GeorgiaAuthored the Feasibility Study, presentation before lenders, assisted with the architecturaldesign, specifications, bidding and installation of furniture, fixtures, and equipment for the 50-room motel. Interim General Manager on two occasions to re-market position the motel to passFranchise inspections.
16. Ramada Inn Southeast, Nashville, TennesseeOn two separate occasions, conducted Hotel Market Analyses, Sales Training of new Marketingstaff, Quality Assurance Evaluation, Developed new Market Sales leads of potential room salesof over $750,000 per year.
17. Sleep Inn, Nashville, Tennessee andComfort Inn and Suites, Goodlettsville, TennesseeInnovative Preconstruction Design Recommendations
18. Comfort Inn, Cairo, GeorgiaSuccessfully petitioned city council for revision to city ordinance regulating sale of liquor bythe drink. Authored Feasibility Study, selected Franchise, architectural design input of 75% ofthe project, reviewed general contractor bids and purchased all operational supplies.Coordinated all FF&E installations. Completed final punch lists. Selected, hired, and trainedall management and staff. Directed all Pre-Opening Marketing for the 50-room, 80-seatrestaurant, 60-seat lounge.
19. Best Western, Nashville, TennesseeInnovative Preconstruction Design Recommendations
20. Howard Johnson, Windsor, Ontario, CanadaMarketing and Site Review prior to purchase decision.
21. SouthGate Campus Centre, Tallahassee, FloridaThe upscale luxury student residence of 268 rooms also had a cafeteria, ballroom, food court(6 national franchises), convenience store, bookstore, copy center, hair salon, dry cleaner, sportslounge, fitness center, and a computer lab. Developed all pre-opening brochures, video tapesand collateral materials. Directed all public relations, direct mail campaign, and salessolicitations as the Marketing Director.
22. Weatherspoon Guest House, Apalachicola, Florida.Directed the total redesign of 70-year-old antebellum house into a 4-room bed and breakfast inn.Specified bids and purchased all FF&E.
23. Shoneys Inn, Thomasville, GeorgiaDesigned lobby, front office, and housekeeping facilities for the 100-room motel.

Hotel Properties Assisted page 4
Member, International Association of Hospitality Advisors
Member, Extended-Stay Hotel Council, AHLA
24. Hilton Hotel and Convention Center, Macon, GeorgiaProject coordination on the $9 million property rebuilding. Coordinated the efforts of the owner(life insurance company), franchisor, management company, general contractor, architect, andinterior designer while keeping the 306-room, full-service hotel open over a 15-month period.
25. Hilton Hotel, TallahasseeAs General Manager, directed a multimillion-dollar renovation program to the Coffee Shop,Front Desk, Lobby Bar, Show Lounge, and all Guest Rooms of the 246-room, full-service hotel.
26. Hilton Hotel, Augusta, GeorgiaCoordinated the design and construction of an indoor pool/health facility and guest roomrenovation for the 210-room, full-service hotel.
27. Powdermill Inn, Bessemer, MichiganAs General Manager, provided design input into guest rooms, food and beverage, lobby, andfront desk for the 55-unit condominium ski resort.
28. Hilton Hotel, Sioux City, IowaCoordinated all FF&E installations, hired and trained the management and staff of the 200-room, full-service hotel.
29. Sheraton Inn, Dallas, TexasSix months prior to opening, named restaurant and lounge, purchased interior decor,coordinated all FF&E installations, hired and trained management and staff for the 150-room,full-service hotel.
30. Registry Hotel, Dallas, TexasResponsible for obtaining all occupancy permits and licenses four months prior to the openingof the 250-room, full-service hotel.
31. North Shore Inn and Suites, North Myrtle Beach, South CarolinaHotel Operations Contract of the 80-room reflaged Wingate Inn.

TOOLS:Hospitality industry courses and programs of the Educational Institute of the American Hotel
Lodging Association are used as needed if franchisee materials are unavailable. The UniformSystem of Accounts is utilized in all accounting, along with programs from the National RestaurantAssociation in Food and Beverage operations. Our personnel are trained and screened in leadinghotel computer systems.
AVAILABILITY:The availability of short-term management, by the very nature of the work, involves short notice.
However, all engagements are scheduled to insure that all tasks are 100% completed in a timelymanner.
TIMETABLE:All engagements have a predetermined and approved duration ranging from two weeks to six
months, depending on the scope of the work.
FEES:All fees are negotiated according to the scope of the engagement and include rate, expenses, and
payment schedule.
NOTES:
Top 20 Hotel Consulting FirmsSince 2006

Edward L. Xanders, CHA, President4145 Yardley Circle
Tallahassee, Florida 32309-2942Telephone: (850) 893-6010
Fax: (850 893-8345Cellular: (850) 443-5010


Lockport, New York, Feasibility Study Page J-1
APPENDIX Niagara USA, 2014 Travel Guide, “See Niagara Up Close and Powerful” published by Niagara Tourism and Convention Corporation.