AN EMPIRICAL ANALYSIS OF DELISTED FIRMS IN VIET NAM
13
THE IMPACT OF CAPITAL STRUCTURE CHOICE ON FIRM’S FINANCIAL PERFORMANCE: AN EMPIRICAL ANALYSIS OF DELISTED FIRMS IN VIET NAM NGUYEN VINH KHUONG Nguyen Tat Thanh University, Vietnam – Email: [email protected] DINH THI THU THAO Nguyen Tat Thanh University, Vietnam – Email: [email protected] (Received: September 20, 2016; Revised: October 4, 2016; Accepted: October 10, 2016) ABSTRACT The purpose of this study is to examine the impact of capital structure choice on firm’s financial performance of delisted companies on the stock market. Based on the data collected from 80 companies delisted from Vietnam stock markets (HNX and HOSE) in the period from 2012 to 2015, using quantitative research methods, we find a correlation between the capital structure and the financial performance of the firms. The study results have some implications for investors and managers in making decisions to optimize their financial performance. Keywords: Capital Structure; financial performance; delisted firms; stock market; Vietnam. 1. Introduction Capital structure decision is the mix of debt and equity that the firms used in its operation (Akhtar & Javed, 2012). It is the combination of long term debt, short term debt and equity maintained by a firm. Firms often have to make decisions on how to get the most out of the proportion they are using for their capital. How to structure capital is the very first question that financial managers ask themselves before getting into any financial activity. The strength of financial position of an organization is its financial performance. Financial analysis is the process of identifying the firm’s financial strengths and weaknesses by properly establishing the relationship between balance sheet items and the Profit and Loss accounts. In financial analysis, a ratio is often used to evaluate the firm’s financial position and performance. A ratio is defined as “the indicated quotient of two mathematical expressions” or “the relationship between two or more things”. Ratios help to summarize a large number of financial data and to make judgment about the firm’s financial performance (Leon, 2013). Capital structure refers to the proportion of finances provided to the firm through different sources which may include internal and external financiers. Capital structure of a company may include equity - funds contributed company’s owners or shareholders (internal financiers) or debt or hybrid securities provided by creditors (external financiers) to finance the assets of the company. The ratio of total debt to total capital employed is the firm's leverage. In reality, capital structure may be highly complex and include several sources of funds. Much research has been conducted to investigate different aspects of capital structure. Modigliani and Miller (1958) wrote a paper about the irrelevance of the capital structure that enthused researchers to debate on this topic. They proposed that capital structure does not influence the value of the firm in perfect markets. The reasons may include bankruptcy costs, agency costs, taxes and information asymmetry, etc. The trade- 42 Ho Chi Minh City Open University Journal of Science–VOL. 6(2) 2016–October/2016
-
Upload
khangminh22 -
Category
Documents
-
view
2 -
download
0
Transcript of AN EMPIRICAL ANALYSIS OF DELISTED FIRMS IN VIET NAM
THE IMPACT OF CAPITAL STRUCTURE CHOICE ON FIRM’S
FINANCIAL PERFORMANCE: AN EMPIRICAL ANALYSIS OF
DELISTED FIRMS IN VIET NAM
NGUYEN VINH KHUONG
Nguyen Tat Thanh University, Vietnam – Email: [email protected]
DINH THI THU THAO
Nguyen Tat Thanh University, Vietnam – Email: [email protected]
(Received: September 20, 2016; Revised: October 4, 2016; Accepted: October 10, 2016)
ABSTRACT
The purpose of this study is to examine the impact of capital structure choice on firm’s financial performance
of delisted companies on the stock market. Based on the data collected from 80 companies delisted from Vietnam
stock markets (HNX and HOSE) in the period from 2012 to 2015, using quantitative research methods, we find a
correlation between the capital structure and the financial performance of the firms. The study results have some
implications for investors and managers in making decisions to optimize their financial performance.
Keywords: Capital Structure; financial performance; delisted firms; stock market; Vietnam.
1. Introduction
Capital structure decision is the mix of
debt and equity that the firms used in its
operation (Akhtar & Javed, 2012). It is the
combination of long term debt, short term
debt and equity maintained by a firm. Firms
often have to make decisions on how to get
the most out of the proportion they are using
for their capital. How to structure capital is
the very first question that financial managers
ask themselves before getting into any
financial activity.
The strength of financial position of an
organization is its financial performance.
Financial analysis is the process of identifying
the firm’s financial strengths and weaknesses
by properly establishing the relationship
between balance sheet items and the Profit
and Loss accounts. In financial analysis, a
ratio is often used to evaluate the firm’s
financial position and performance. A ratio is
defined as “the indicated quotient of two
mathematical expressions” or “the
relationship between two or more things”.
Ratios help to summarize a large number of
financial data and to make judgment about the
firm’s financial performance (Leon, 2013).
Capital structure refers to the proportion
of finances provided to the firm through
different sources which may include internal
and external financiers. Capital structure of a
company may include equity - funds
contributed company’s owners or
shareholders (internal financiers) or debt or
hybrid securities provided by creditors
(external financiers) to finance the assets of
the company. The ratio of total debt to total
capital employed is the firm's leverage. In
reality, capital structure may be highly
complex and include several sources of funds.
Much research has been conducted to
investigate different aspects of capital
structure. Modigliani and Miller (1958) wrote
a paper about the irrelevance of the capital
structure that enthused researchers to debate
on this topic. They proposed that capital
structure does not influence the value of the
firm in perfect markets. The reasons may
include bankruptcy costs, agency costs, taxes
and information asymmetry, etc. The trade-
42 Ho Chi Minh City Open University Journal of Science–VOL. 6(2) 2016–October/2016

43
off theory of capital structure states that a
company should choose how much debt and
equity financing while creating a balance
between costs and benefits. Kraus and
Litzenberger (1973) observed a balance
between costs of bankruptcy and the tax
shield provided by debt. Sometimes the costs
of the agency are also considered. The theory
may illustrate the differences in debt to equity
ratios between different industries but no
explanation is provided for the same industry.
However, today, capital structure is one of the
most important financial decisions for any
business organization. This is for two
following reasons: (1) the organization needs
to maximize returns to various stakeholders;
and (2) such decision has a great effect on the
firm’s value.
Myers (2001) stated that companies with
high growth opportunities will have a smaller
amount of debt compared to companies with
lower growth opportunities. Companies find it
too costly to finance projects by using debt
(Chen & Jiang, 2001). Higher growth
opportunities increase the likelihood of
investing in risky projects or suboptimal. In
such a case, debt collection becomes more
difficult because debt providers are less likely
to get their money back. Therefore, debt
suppliers are not willing to lend money to
companies that overinvested (Deesomak et al,
2004).
Besides, the impact of the decision will
help the firm able to deal with its competitive
environment. As defined above, capital
structure is a combination of debt and equity
that a firm uses to enhance its operation.
Thus, firms should build up an appropriate
mix of debt and equity to finance their assets.
Due to the lack of a consensus about an
optimal capital structure, it is pertinent to
examine the effect of debt utilization on firms'
performance. Several similar studies were
conducted in European countries and the
United States. They found contradictory
results when Gleason (2000) supported a
negative impact of leverage on the
profitability of the firm while Roden and
Lewellen (1995), in their study on leveraged
buyouts, found a significant positive
association between profitability and total
debt as a percentage of the total buyout-
financing package. Accordingly, there is no
universal theory about debt-equity choices
and different views on financing option are
something quite understandable.
The relationship between capital structure
and corporate financial performance has been
an important issue for both academics and 20
experts in the business world (San, O. T. and
Heng, T. B., 2011). While there is a scarcity
of statically evidence about the impact of
capital structure on corporate financial
performance in advanced and developing
economics, most of past research on capital
structure has always been from the
determinants on corporate leverage.
Recently, there have been several studies
in Vietnam regarding the determinants of
Vietnamese corporate capital structure. The
search for factors affecting the capital
structure of Vietnam’s enterprises has been a
hot topic for many authors. For example, Tran
Dinh Khoi Nguyen and Ramachandran (2006)
studied the capital structure of small and
medium enterprises in Vietnam whereas
Biger, Nam V. Nguyen, and Quyen X. Hoang
(2008) examined the determinants of capital
structure of companies in Vietnam. However,
no study is conducted for delisted companies
on Vietnam stock markets. Delisting means
the remove of a listed company from a stock
exchange. The number of delisted companies
which suffered financial losses and reduced
public confidence has increased in recent
years.
This study aimed to help company
managers make good decisions on the
proportions of their capital structure. Taking
too much debt for company’s operation can
put the company's future at risk, and thus can
make the company go bankrupt. This study,
therefore, seeks to provide and update
corporate managers with new knowledge to
make proper decisions on the company's
performance.
Ho Chi Minh City Open University Journal of Science–VOL. 6(2) 2016–October/2016

Most famous studies of financial
exhaustion were conducted in the US and
European countries. In Viet Nam, this is still a
new topic and was conducted by some
Vietnamese researchers. However, no
research on delisted companies was
implemented. The number of delisted
companies has increased in recent years and
consequently, led to financial losses and
reduced public confidence. Therefore, the
authors carried out this study to assess the
impact of the capital structure on the
performance of companies delisted from the
Vietnam Stock Exchange.
To the author's knowledge, there was
little research on similar topic about the
lagged values towards the performance of
Vietnamese firms. Hence, this research will
explore to what extent debt will influence a
firm’s performance. In addition, it is
interesting to differentiate short- term debt,
long- term debt and total debt effects since
they have different risk and return profiles.
2. Literature Review and Hypotheses
The relationship between capital structure
and firm value has been the main subject of
many debates both theoretically and
empirically. Much research has been done
about the impact of capital structure choice on
firms’ financial performance. Strong debates
regarding capital structure and firm
performance have been started since Miller
and Modigliani (1958) introduced their
influential work. They argued that firm value
was independent of firm capital structure and
that using debt or equity had no material
effect on firm value. In the paper, they relaxed
their assumption by incorporating corporate
tax benefits as determinants of the firm’s
capital structure. They proposed that firms
should employ as much debt capital as
possible to achieve optimal capital structure
Static trade off-theory states that the
firm's capital structure decisions involve a
tradeoff between the tax benefits of debts and
the cost of financial distress. Thus, firms
should choose an optimal capital structure that
trades off the marginal benefits and the costs
of debt (Myers, 1984). Agency cost theory
initiated by Jensen and Meckling (1976).
Agency costs rise from the separation of
ownership and the control and conflicts of
interest among agents (managers),
shareholders, and debt holders. According to
this theory, an optimal capital structure can be
obtained by trading off the agency cost of
debt against the benefit of debt. Agency costs
are costs arising due to conflicts of interest.
The pecking order theory developed by Myers
and Majluf (1984) stated that capital structure
is determined by the firm's desire to finance
new investments, first internally generated
funds, then with low-risk debt, and finally if
all fails, with equity finance.
Some assumptions put a ceiling on
Modigliani and Miller's theorem of debt
peripheral nature, which do not exist in reality.
When these assumptions are not taken into
account, then the choice of the capital structure
becomes very indispensable. Fischer et al.
(1989) argued that with the passage of time
corporations are inclined towards their
preferred leverage range by issuing new
securities and equity.
Return on assets (ROA): ROA is an
indicator assessing the profitability of the
business assets. It is calculated by the formula
ROA = Profit after tax / Total Assets. The
index shows a property contract could create
as many profitable contracts. Profit is the
ultimate goal of all companies and serves as a
basis for investors to assess the performance
of a business. However, to assess the
profitability of each business, and to compare
between businesses, we need to compare
profit with other indicators such as total
assets, equity or revenue. Maybe benefit
higher profit this year than last year does not
mean it is a good sign for further
consideration must also increase profits are
commensurate with the increase in total assets
of the enterprise has invested or not. ROA is
an important financial indicator to assess this
aspect. A low ROA will affect the firm’s
solvency and increase its risk of going
bankrupt. Thus, ROA is referred to as a
44 Ho Chi Minh City Open University Journal of Science–VOL. 6(2) 2016–October/2016
45
dependent variable in the study.
Total debts to assets ratio (TDTA):
TDTA is calculated by dividing total debt by
total assets. By this way, (Holz, 2002) found
that capital structure (debt ratio) positively
correlated with the firm’s performance, the
result is ascribed to the managers’ willing to
finance a project by borrowing money and
using them effectively to optimize the firm’s
performance.
H1: Total debt to assets ratio has a
negative (-) correlation with the financial
performance
Short-term debt to total assets ratio
(SDTA): SDTA is short-term debt divided by
total assets. This indicator provides
information about a firm’s ability to meet
short-term financial obligations. It shows how
a company uses its short-term debts to make
profits. Dessi R.and Donald R., 2003 found
that financial leverage positively affects the
expected performance. The results show that
low growth firms tend to borrow money to
utilize their expected growth targets and then
invest the money on profitable projects; thus,
increase the firms’ performance. (Margaritis,
D. and Psillaki, M., 2010). The findings also
proved that financial leverage (debt ratio)
positively and significantly correlated with the
firm’s performance (added value, labor, and
capital).
H2: Short term debt to total assets ratio
has a negative (-) correlation with the
financial performance
Long-term debt to total assets ratio
(LDTA): LDTA is an indicator of financial
leverage. It shows a company’s ability to pay
off its liabilities with its assets. This enables
comparisons of leverage to be made across
different companies. LDTA is calculated by
dividing long debt by total assets. The study
used debt to equity ratio as financial leverage
indicator and earnings to the market value of
common stock as a performance indicator.
Results revealed that leverage has positively
effects on firm’s value and proved the
traditional assumption that shareholders
wealth can be enhanced by using outside
financing.
H3: Long-term debt to total assets ratio
has a negative (-) correlation with the
financial performance
Business risks (RISK): Many theoretical
studies have shown that business risk or
earnings volatility is one of the factors that
affect the capital structure of the business.
According to the tradeoff theory of capital
structure and the pecking order theory, firms
with high volatility in income face greater
risk in the payment of debts. This implies
that firms with high earnings volatility will
borrow less and prefer the internal funds.
Thus, a negative relationship between
business risk or earnings volatility and
financial performance is expected. The
empirical studies supporting this view
include Booth et al. (2001), Fama and French
(2002), Jong et al. (2008), Sharif et al.
(2012). The author suggests the following
hypothesis:
H4: Business risks has a negative (-)
correlation with the financial performance
Asset tangibility (TANG): TANG is an
asset that has a physical form. Asset
tangibility changes over time for reasons
beyond the control of firms and financiers.
When asset tangibility is high, managers have
heightened incentives to perform because the
firm’s liquidation/reorganization becomes a
more credible threat. The effect of asset
tangibility on investment performance under
external financing is magnified when firms
are near distress (Murillo Campello, 2007).
H5: Asset tangibility has a positive (+)
correlation with the financial performance
Firm size (SIZE): According to the trade-
off theory of capital structure, large-scale
enterprises usually are able to get more loans
than small-scale ones. Specifically, it costs
more for small businesses to mobilize
external capital compared to big ones due to
asymmetric information. In other words, big
enterprises prevail over small ones when
accessing the capital markets. This shows a
positive correlation between financial
performance and company size. This view is
Ho Chi Minh City Open University Journal of Science–VOL. 6(2) 2016–October/2016
supported by many empirical studies in
various countries, including studies
conducted by Booth et al. (2001), Faris
(2010), and Bambang et al. (2013). Based on
the tradeoff theory of capital structure and
empirical studies' results obtained by national
and international researchers, the authors
suggest the following hypothesis:
H6: Firm size has a positive (+)
correlation with the financial performance
Liquidity (LIQ): LIQ is calculated by
current ratio. Liquidity’s relevance is better
explained by using free cash flow theory,
agency cost of debt and trade off theory.
According to pecking order theory, in search
for capital fund, companies prefer internal
financing from retained earnings to external
financing. As a result, the demand for
external capital will not be crucial for
companies with high ability of generating
retained earnings if their current assets
suffice for financing the investment. This
indicates a negative correlation between
liquidity and financial performance.
Empirical research supporting this view
includes studies done by Eriotis et al. (2007),
Singhania et al. (2010). However, the trade-
off theory of capital structure states that firms
with high liquidity generally maintain a
higher debt ratio, indicating a positive
correlation between liquidity and capital
structure. Based on the pecking order theory
and empirical results of previous research,
the authors make the following hypothesis:
LiquidityH7: has a (negative -)
correlation with financial performance
(GROWTH):opportunitiesGrowth
GROWTH variable is calculated by the ratio
of sales growth to total assets growth.
Relevant theoretical support is provided by
signaling theory, trade-off theory and pecking
order theory and expected correlation with
leverage is negative in literature. The
theoretical study agreed that growth
opportunities are associated with financial
performance. The trade-off theory of capital
structure suggests that firms with higher
growth opportunities typically maintain a low
debt ratio, which indicates a negative
correlation between growth opportunities and
financial performance. Empirical studies
supporting this view include ones done by
Eriotis et al (2007), Gurcharan (2010). On the
other hand, the pecking order theory believes
that firms with high growth opportunities are
expected to demand more debt financing in
the future.
H8: Growth opportunities has a positive
(+) correlation with financial performance
3. Data and Variables
3.1. Sample Description
In this study, the data was collected
from 80 delisted companies on Vietnam stock
markets (HNX and HOSE) in the period from
2012 to 2015. For some enterprises, collected
data consists of the balance sheet and annual P
&L statements. In the sample selection
process, 192 observations were collected.
3.2. Variables
Our dependent variable is the return on
assets. This is the key variable to assess
financial performance, which is defined as the
ratio of profit after tax divided by the firm’s
total assets.
ROA= Profit after tax /Total Assets
Based on previous studies, we use eight
independent variables for this research. They
are: total debt to total assets, short-term debt
to total assets, long-term debt to total assets,
business risks, firm performance, asset
tangibility, firm size, liquidity, and growth
opportunities. As far as independent variables
are concerned, we have selected several
proxies that appear in the empirical literature.
TDTA = Total debt/ Total assets
STDTA = Short-term debt/ Total assets
LTDTA = Long-term debt/ Total assets
RISK = Interest Payments/ Earnings
before Interest and Tax
TANG = Natural logarithm of Asset
tangibility
SIZE = Natural logarithm of total assets
LIQ = Current Assets/ Current
Liabilities
GROWTH= Ratio of sales growth to
total assets growth
46 Ho Chi Minh City Open University Journal of Science–VOL. 6(2) 2016–October/2016

4. Research Methodologies
Since the sample contains data across
firms and at different time, the cross-sectional
method is employed. The analysis process
includes two stages. In the first stage, we
conduct regressions of all determinants
related to a capital structure (total debt to
total assets, short-term debt to total assets,
and long-term debt to total assets) about firm
performance. In the second stage, we add a
dummy variable (DUM) to evaluate the
differences in capital structure and its
determinants between (TDTA<0.5739) and
(TDTA>0.5739).
This regression model can be specified as
follows:
Research model:
Model 1 is applicable to delisted companies on Viet Nam market stock:
ROAi,t = α + β1 SDTAi,t + β2 LDTAi,t + β3RISKi,t + β4TANGi,t + β5SIZEi,t + β6LIQi,t +
β7GROWTHi,t + εi,t
Model 2 is applicable to companies delisted from VN market stock:
ROAi,t = α + β1 TDTAi,t + β2RISKi,t + β3TANGi,t + β4SIZEi,t + β5LIQi,t + β6GROWTHi,t + εi,t
Model 3 is applicable to evaluate the differences in the financial performance (TDTA<0.5739):
ROAi,t = α + β1 TDTAi,t + β2RISKi,t + β3TANGi,t + β4SIZEi,t + β5LIQi,t + β6GROWTHi,t + DUM1 + εi,t
Model 4 is applicable to evaluate the differences in the financial performance (TDTA>0.5739):
ROAi,t = α + β1 TDTAi,t + β2RISKi,t + β3TANGi,t + β4SIZEi,t + β5LIQi,t + β6GROWTHi,t + DUM2 + εi,t
No. Independent variables
Hypothesis Theories Name Sign
1 Total debt to total assets TDTA (-) Bankruptcy cost, trade off theory,
pecking order theory
2 Short term debt to total
assets SDTA (-)
Bankruptcy cost, trade off theory,
pecking order theory
3 Long term debt to total
assets LDTA (-)
Bankruptcy cost, trade off theory,
pecking order theory
4 Business risks RISK (-) Agency theory, bankruptcy cost
5 Asset tangibility TANG (+) Bankruptcy cost
6 Firm size SIZE (+) Agency cost of debt
7 Liquidity LIQ (-) Free cash flow theory, agency cost
of debt, trade off theory
8 Growth opportunities GROWTH (+) Agency theory
5. Research results
5.1. The reality of the delisted companies
on Vietnam stock markets
The number of delisted companies has
increased in recent years. Specifically, from
2012 to June 30, 2015, the number of delisted
companies is 120, of which 78 companies
delisted from the HNX and 42 companies
from the HOSE for various reasons (follow on
the websites: www.hnx.vn, and www.hsx.vn).
Table 1
Statistics of the delisted company annually
Year 2012 2013 2014 Total
Number of companies delisted 18 46 32 96
47 Ho Chi Minh City Open University Journal of Science–VOL. 6(2) 2016–October/2016
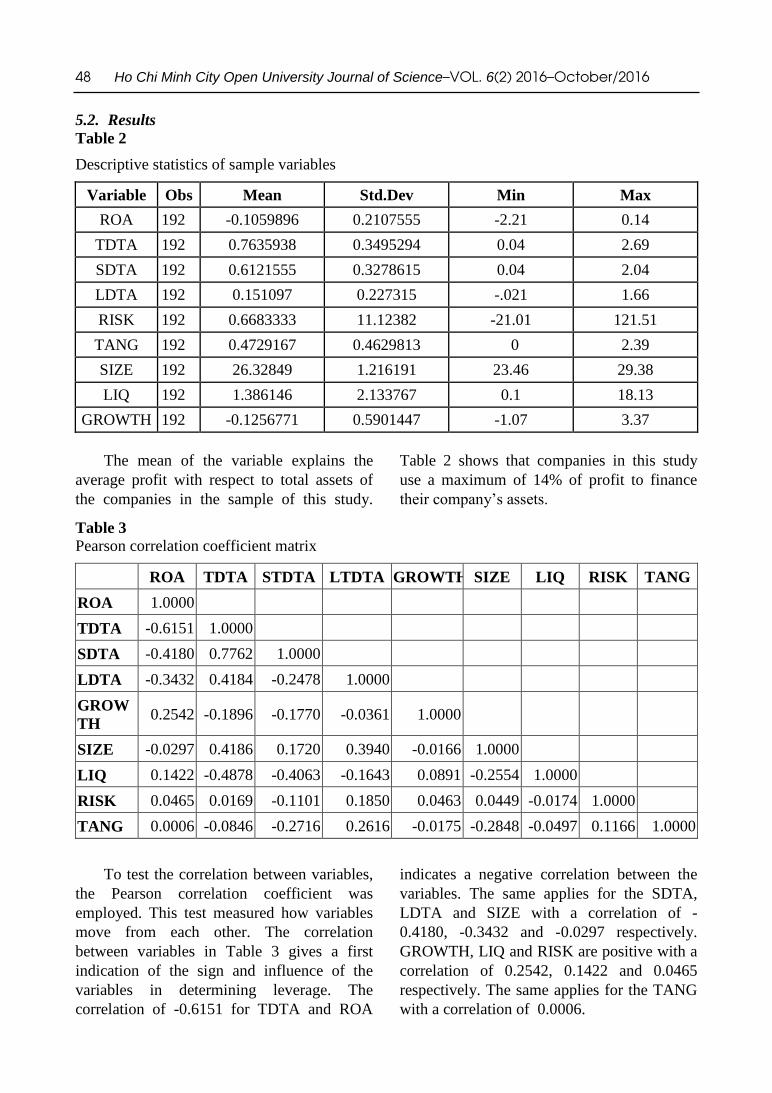
5.2. Results
Table 2
Descriptive statistics of sample variables
Variable Obs Mean Std.Dev Min Max
ROA 192 -0.1059896 0.2107555 -2.21 0.14
TDTA 192 0.7635938 0.3495294 0.04 2.69
SDTA 192 0.6121555 0.3278615 0.04 2.04
LDTA 192 0.151097 0.227315 -.021 1.66
RISK 192 0.6683333 11.12382 -21.01 121.51
TANG 192 0.4729167 0.4629813 0 2.39
SIZE 192 26.32849 1.216191 23.46 29.38
LIQ 192 1.386146 2.133767 0.1 18.13
GROWTH 192 -0.1256771 0.5901447 -1.07 3.37
The mean of the variable explains the
average profit with respect to total assets of
the companies in the sample of this study.
Table 2 shows that companies in this study
use a maximum of 14% of profit to finance
their company’s assets.
Table 3
Pearson correlation coefficient matrix
ROA TDTA STDTA LTDTA HGROWT SIZE LIQ RISK TANG
ROA 1.0000
TDTA -0.6151 1.0000
SDTA -0.4180 0.7762 1.0000
LDTA -0.3432 0.4184 -0.2478 1.0000
GROW
TH 0.2542 -0.1896 -0.1770 -0.0361 1.0000
SIZE -0.0297 0.4186 0.1720 0.3940 -0.0166 1.0000
LIQ 0.1422 -0.4878 -0.4063 -0.1643 0.0891 -0.2554 1.0000
RISK 0.0465 0.0169 -0.1101 0.1850 0.0463 0.0449 -0.0174 1.0000
TANG 0.0006 -0.0846 -0.2716 0.2616 -0.0175 -0.2848 -0.0497 0.1166 1.0000
To test the correlation between variables,
the Pearson correlation coefficient was
employed. This test measured how variables
move from each other. The correlation
between variables in Table 3 gives a first
indication of the sign and influence of the
variables in determining leverage. The
correlation of -0.6151 for TDTA and ROA
indicates a negative correlation between the
variables. The same applies for the SDTA,
LDTA and SIZE with a correlation of -
0.4180, -0.3432 and -0.0297 respectively.
GROWTH, LIQ and RISK are positive with a
correlation of 0.2542, 0.1422 and 0.0465
respectively. The same applies for the TANG
with a correlation of 0.0006.
48 Ho Chi Minh City Open University Journal of Science–VOL. 6(2) 2016–October/2016
49
Table 4
The regression results of model 1 (Pooled OLS)
Regression Model 1 Regression Model 2
Variables Coef. P>| t | Coef P>| t |
SDTA ***-0.4247214 0.000
DTA **-0.6477301 0.014
TDTA ***-0.476747 0.002
GROWTH **0.0465444 0.015 **0.0440634 0.019
SIZE ***0.05929 0.009 ***0.0434308 0.001
LIQ **-0.0157777 0.032 *-0.0187783 0.071
RISK **0.0013019 0.018 ***0.0007675 0.006
TANG **0.0393713 0.426 -0.0036955 0.853
CONS **-1.300911 0.016 ***-0.852614 0.001
Observations 192 192
R-squared 51.93% 48.51%
P_Value > X2= 0.0000 ***
ROAi,t = α - 0.4247SDTAi,t - 0.6477LDTA,t + 0.0465GROWTHi,t + 0.0593SIZEi,t -0.0158LIQi,t +
0.0013RISKi,t + 0.0394TANGi,t -1.3009+ εi,t
ROAi,t = α - 0.4767TDTAi,t + 0.0441GROWTHi,t + 0.0434SIZEi,t - 0.0188LIQi,t + 0.0008RISKi,t -
0.8526+ εi,t
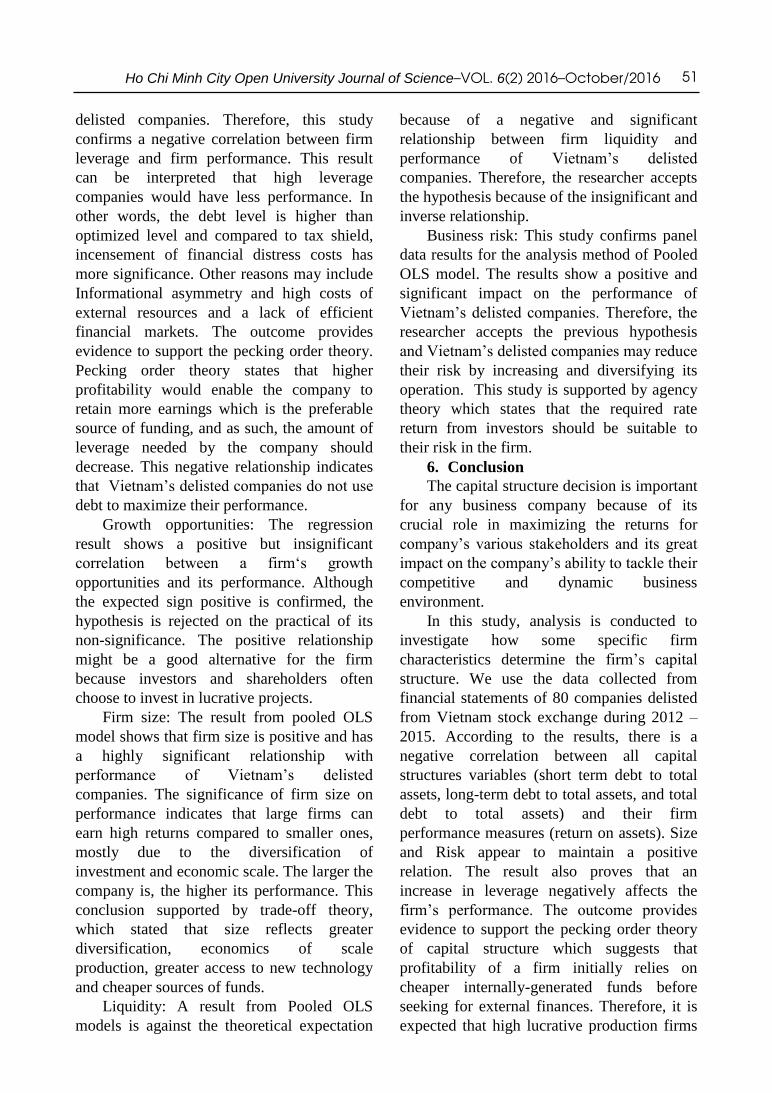
Table 5
The regression results of model 3 (TDTA < 0.5739)
Independent variables Coef. P>| t |
TDTA ***-0.6479297 0.001
GROWTH **0.0440464 0.014
SIZE ***0.0315508 0.002
LIQ **-0.0161191 0.038
RISK 0.0004242 0.246
TANG 0.0061172 0.755
DUM1 ***-0.2131848 0.008
CONS **-0.3561492 0.014
Observations 192
R-squared 58.18%
P_Value > X2= 0.0000 ***
Ho Chi Minh City Open University Journal of Science–VOL. 6(2) 2016–October/2016

Table 6
The regression results of model 4 (TDTA > 0.5739)
Independent variables Coef. P>| t |
TDTA ***-0.6479297 0.001
GROWTH **0.0440464 0.014
SIZE ***0.0315508 0.002
LIQ **-0.0161191 0.038
RISK 0.0004242 0.246
TANG 0.0061172 0.755
DUM2 ***0.2131848 0.008
CONS **-0.569334 0.014
Observations 192
R-squared 58.18%
P_Value > X2= 0.0000 ***
ROAi,t = α - 0.4247SDTAi,t - 0.6477LDTA,t + 0.0465GROWTHi,t + 0.0593SIZEi,t -0.0158LIQi,t +
0.0013RISKi,t + 0.0394TANGi,t -1.3009+ εi,t
ROAi,t = α - 0.4767TDTAi,t + 0.0441GROWTHi,t + 0.0434SIZEi,t - 0.0188LIQi,t + 0.0008RISKi,t -
0.8526+ εi,t
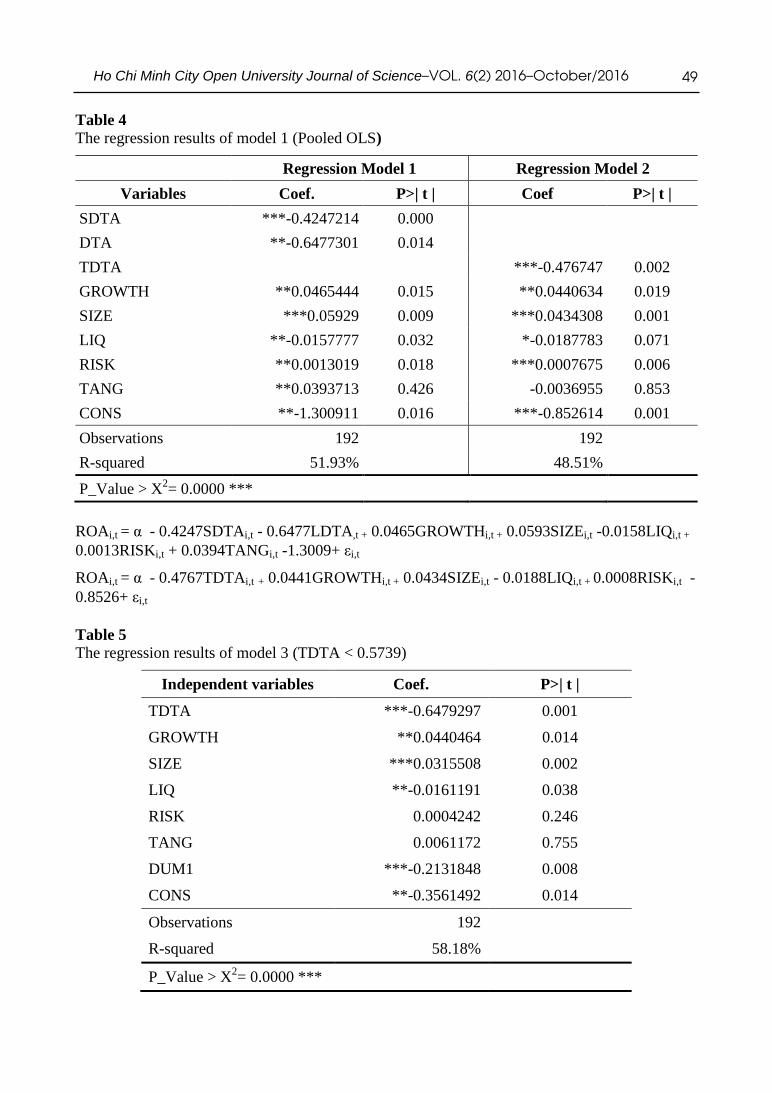
Table 4 above presents the results of the
Pooled Regression Models (Model 1and
Model 2) estimated to examine the impact of
capital structure on financial performance
(ROA) of selected companies controlling the
effect of firm-specific variables.
Regression model 1 tests the relationship
between capital structure measured by ratios
of STD to total assets and LTD to total assets
and firms' financial performance measured by
return on assets (ROA). On the other hand,
regression model 2 estimated the relationship
between capital structure measured by total
debt to total assets ratio (TDTA) and firms'
financial performance measured by return on
assets (ROA). The overall explanatory powers
of the two regression models (Model 1 and
Model 2) are 51.93%t and 48.51%
respectively. This implies that volatility of the
variables used in Model 1 and Model 2 causes
54.25%t and 54.83% changes in dependent
variables respectively. The P- values for
model 1 and for model 2 prove the validity of
the estimated models. Also, the coefficients
are statistically significant at 1% level of
significance.
As revealed in Table 4 above, the result
of regression model 1, model 2 indicates a
significant negative correlation between
capital structure and financial performance
measured, which implies that an increase in
debt is associated with a decrease in financial
performance (ROA). This is because long-
term debts are relatively more expensive, and
therefore using more long-term debts could
lead to low profitability. This result is
consistent with the findings of previous
studies such as research by (Abor, 2007;
Gansuwan & Onel; Zeitun & Tian, 2007).
However, the negative and significant
relationship of SDTA does not support Abor's
(2005) argument that short-term debt
increases a firm's performance because it
could be due to relative lower cost and low-
interest rate.
Firm leverage for the sample study effects
negatively and statistically significant at 1%
on firm performance (ROA) of Vietnam’s
50 Ho Chi Minh City Open University Journal of Science–VOL. 6(2) 2016–October/2016
delisted companies. Therefore, this study
confirms a negative correlation between firm
leverage and firm performance. This result
can be interpreted that high leverage
companies would have less performance. In
other words, the debt level is higher than
optimized level and compared to tax shield,
incensement of financial distress costs has
more significance. Other reasons may include
Informational asymmetry and high costs of
external resources and a lack of efficient
financial markets. The outcome provides
evidence to support the pecking order theory.
Pecking order theory states that higher
profitability would enable the company to
retain more earnings which is the preferable
source of funding, and as such, the amount of
leverage needed by the company should
decrease. This negative relationship indicates
that Vietnam’s delisted companies do not use
debt to maximize their performance.
Growth opportunities: The regression
result shows a positive but insignificant
correlation between a firm‘s growth
opportunities and its performance. Although
the expected sign positive is confirmed, the
hypothesis is rejected on the practical of its
non-significance. The positive relationship
might be a good alternative for the firm
because investors and shareholders often
choose to invest in lucrative projects.
Firm size: The result from pooled OLS
model shows that firm size is positive and has
a highly significant relationship with
performance of Vietnam’s delisted
companies. The significance of firm size on
performance indicates that large firms can
earn high returns compared to smaller ones,
mostly due to the diversification of
investment and economic scale. The larger the
company is, the higher its performance. This
conclusion supported by trade-off theory,
which stated that size reflects greater
diversification, economics of scale
production, greater access to new technology
and cheaper sources of funds.
Liquidity: A result from Pooled OLS
models is against the theoretical expectation
because of a negative and significant
relationship between firm liquidity and
performance of Vietnam’s delisted
companies. Therefore, the researcher accepts
the hypothesis because of the insignificant and
inverse relationship.
Business risk: This study confirms panel
data results for the analysis method of Pooled
OLS model. The results show a positive and
significant impact on the performance of
Vietnam’s delisted companies. Therefore, the
researcher accepts the previous hypothesis
and Vietnam’s delisted companies may reduce
their risk by increasing and diversifying its
operation. This study is supported by agency
theory which states that the required rate
return from investors should be suitable to
their risk in the firm.
6. Conclusion
The capital structure decision is important
for any business company because of its
crucial role in maximizing the returns for
company’s various stakeholders and its great
impact on the company’s ability to tackle their
competitive and dynamic business
environment.
In this study, analysis is conducted to
investigate how some specific firm
characteristics determine the firm’s capital
structure. We use the data collected from
financial statements of 80 companies delisted
from Vietnam stock exchange during 2012 –
2015. According to the results, there is a
negative correlation between all capital
structures variables (short term debt to total
assets, long-term debt to total assets, and total
debt to total assets) and their firm
performance measures (return on assets). Size
and Risk appear to maintain a positive
relation. The result also proves that an
increase in leverage negatively affects the
firm’s performance. The outcome provides
evidence to support the pecking order theory
of capital structure which suggests that
profitability of a firm initially relies on
cheaper internally-generated funds before
seeking for external finances. Therefore, it is
expected that high lucrative production firms
51 Ho Chi Minh City Open University Journal of Science–VOL. 6(2) 2016–October/2016
require less debt finance. Moreover, it also
supports for the proposition that owing to
agency conflicts; companies use more
leverage, and thus negatively affect their
performance.
The research findings assisted the pecking
order theory, trade-off theory, and agency cost
theory. The study shows that sign for
expected value is confirmed by actual relation
of the model under the study of the firm
performance (ROA) measures in regression
model result.
This study paves the way for upcoming
studies to investigate capital structure theories
on valuable companies listed on Vietnam stock
markets and valuable sectors of Viet Nam.
7. Limitations
Apart from some contributions, this
research also has some limitations. Within the
research framework, we did not mention some
other theories concerning the capital structure
which also have influence on the choice for
debt or equity. During the data collection
process, we have used some external database
whose reliability is not definitely confirmed.
The last limitation may be the generalizability
of the results to specific companies. Articles
by Antoniou et al. (2002) and Deesomak et al.
(2004) indicate that the differences in capital
structure among companies do not only cause
by firm’s specific factors but also by the
environment in which the company operates.
Therefore, companies would find it is hard to
apply these research findings to their specific
situation if they are not established in
Vietnam. This is because the choices of
companies for capital structure vary from
country to country and region to region.
8. Suggestions for future research
The research findings and limitations may
be useful for further research to examine the
effect of a financial crisis. The data of this
study is updated until sometime after the 2008
financial crisis and compares the results
concluded by studies before and after the
crisis. The data, therefore, could be utilized to
help address changes in the capital structure
during crisis. Another suggestion would be an
emphasis on the use of different data
necessary for good proxies of the variables.
For future research, it might be meaningful to
use market value instead of book value.
Previous research in Dutch companies done
by Chen et al. (1999) showed a difference in
the results due to using book value and market
value. It is also interesting if future research
investigates how a higher dilution percentage
of preferred shares might affect the leverage.
By using a higher percentage of dilution for
preferred shares, companies enhance the
ability to protect themselves against loss of
corporate control. By adding specific
variables to countries, we can address the
factors that influence the capital structure in
different countries. The results are of more
concern for specific companies. For example,
future research could investigate the
differences between Laos and Cambodia.
Additionally, future studies may also increase
panel size of companies delisted from
Vietnam stock markets by using more
companies with longer period data
_____________________________________________________________________________
References
Abor, J. (2005). The effect of capital structure on profitability: an empirical analysis of listed firms in Ghana. The
journal of risk finance, 6(5), 438-445.
Ahmad, Z., Abdullah, N. M. H., & Roslan, S. (2012). Capital structure effect on firms performance: Focusing on
consumers and industrials sectors on Malaysian firms. International review of business research papers, 8(5),
137-155.
Akhtar S., & Javed B., 2012. Interrelationships between capital structure and financial performance, firm size and
growth: comparison of industrial sector in KSE. European Journal of Business and Management, 4(15),
2222-1905.
52 Ho Chi Minh City Open University Journal of Science–VOL.6(2) 2016–October/2016
53
Booth, L., Aivazian, V., Demirguc‐Kunt, A., & Maksimovic, V. (2001). Capital structures in developing
countries. The journal of finance, 56(1), 87-130.
Campello, M. (2007). Asset tangibility and firm performance under external financing: evidence from product
markets. Available at SSRN 971170.
Chen, L. H., & Jiang, G. J. (2001). The determinants of dutch capital structure choice (pp. 1-25). University of
Groningen.
Chen, L. H., Lensink, B. W., & Sterken, E. (1999). The determinants of capital structure: Evidence from Dutch
panel data. University of Groningen.
De Jong, A., Kabir, R., & Nguyen, T. T. (2008). Capital structure around the world: The roles of firm-and country-
specific determinants. Journal of Banking & Finance, 32(9), 1954-1969.
Deesomsak, R., Paudyal, K., & Pescetto, G. (2004). The determinants of capital structure: evidence from the Asia
Pacific region. Journal of multinational financial management, 14(4), 387-405.
Dessí, R., & Robertson, D. (2003). Debt, incentives and performance: Evidence from UK panel data. The Economic
Journal, 113(490), 903-919.
Eriotis, N., Vasiliou, D., & Ventoura-Neokosmidi, Z. (2007). How firm characteristics affect capital structure: an
empirical study. Managerial Finance, 33(5), 321-331.
Fama, E. F., & French, K. R. (2002). Testing trade-off and pecking order predictions about dividends and
debt. Review of financial studies, 15(1), 1-33.
Faris, A. S. (2010). Determinants of capital structure choice: A case study of Jordanian Industrial Companies. An-
Najah University Journal for Research, 24(8), 2457-2494.
Fischer, E. O., Heinkel, R., & Zechner, J. (1989). Dynamic capital structure choice: Theory and tests. The Journal of
Finance, 44(1), 19-40.
Gleason, K. C., Mathur, L. K., & Mathur, I. (2000). The interrelationship between culture, capital structure, and
performance: evidence from European retailers. Journal of Business Research, 50(2), 185-191.
Gurcharan, S. (2010). A review of optimal capital structure determinant of selected asean countries. International
Research Journal of Finance and Economics, 47, 30-41.
Holz, C. A. (2002). The impact of the liability-asset ratio on profitability in China's industrial state-owned
enterprises. China Economic Review, 13(1), 1-26.
Jensen, M. C. (1986). Agency cost of free cash flow, corporate finance, and takeovers. Corporate Finance, and
Takeovers. American Economic Review, 76(2), 323-329.
Jensen, M. C., & Meckling, W. H. (1976). Theory of the firm: Managerial behavior, agency costs and ownership
structure. Journal of financial economics, 3(4), 305-360.
Kraus, A., & Litzenberger, R. H. (1973). A state‐preference model of optimal financial leverage. The journal of
finance, 28(4), 911-922.
Leon, S. A. J. (2013). The impact of Capital Structure on Financial Performance of the listed manufacturing firms in
Sri Lanka. Global Institute for Research & Education, 2(5), 56-62.
Margaritis, D., & Psillaki, M. (2010). Capital structure, equity ownership and firm performance. Journal of Banking
& Finance, 34(3), 621-632.
Modigliani, F., & Miller, M. H. (1958). The cost of capital, corporation finance and the theory of investment. The
American economic review, 48(3), 261-297.
Myers, S. 2001. Capital Structure. Journal of Economics Perspectives, 15(2), 297-355.
Myers, S. C. 1984. Capital structure puzzle. The Journal of Finance, 39(3), 575-592.
Myers, S. C., & Majluf, N. S. (1984). Corporate financing and investment decisions when firms have information
that investors do not have. Journal of financial economics, 13(2), 187-221.
Ho Chi Minh City Open University Journal of Science–VOL.6(2) 2016–October/2016

Nahum, B., Nam, N. V. & Quyen, H. X. (2008). The determinants of capital structure:evidence from Vietnam, Asia-
Pacific Financial Markets: Integration, Innovation and ChallengesInternational Finance Review, 8, 307-326.
Nguyen, T. D. K., & Ramachandran, N. (2006). Capital structure in small and medium-sized enterprises: the case of
Vietnam. ASEAN Economic bulletin, 23(2), 192-211.
Önel, Y. C., & Gansuwan, P. (2012). The Influence of Capital Structure on Firm Performance: A quantitative study
of Swedish listed firms.
Paudyal, K., Guney, Y., & Antonious, A. (2002). Determinants of Corporate Capital Structure: Evidence from
European Countries. Center for Empirical Research in Finance, Department of Economics and.
Roden, D. M., & Lewellen, W. G. (1995). Corporate capital structure decisions: evidence from leveraged
buyouts. Financial Management, 76-87.
San, O. T., & Heng, T. B. (2011). Capital structure and corporate performance of Malaysian construction
sector. International Journal of Humanities and Social Science, 1(2), 28-36.
Sharif, B., Naeem, M. A., & Khan, A. J. (2012). Firm's characteristics and capital structure: A panel data analysis of
Pakistan's insurance sector. African Journal of Business Management, 6(14), 4939.
Singhania, M., & Seth, A. (2010). Financial leverage and investment opportunities in India: An empirical
study. International research Journal of finance and economics, 40(2), 215-226.
Sudiyatno, B. and Sari, S.M. (2013). Determinants of debt policy: An empirical studying Indonesia stock exchange,
International Research Journal, 4(1), 98-108.
Zeitun, R., & Tian, G. G. (2007). Capital structure and corporate performance: evidence from Jordan. Australasian
Accounting, Business and Finance Journal, 1(4), 3.
54 Ho Chi Minh City Open University Journal of Science–VOL.6(2) 2016–October/2016