EIA: Viet Nam: O Mon IV Thermal Power Project (as of Board ...
Upload
khangminh22Category
view
1download
0
Electricity Viet Nam Can Tho Thermal Power Company
DRAFT Environmental Assessment Report
Socialist Republic of Viet Nam: O Mon IV Thermal Power Project September 2010 Prepared by Electricity Viet Nam for the Asian Development Bank (ADB)
The environmental impact assessment is a document of the borrower. The views expressed herein do not necessarily represent those of ADB’s Board of Directors, management or staff.

ii
This page has been deliberately left blank to allow for double sided printing.

iii
CURRENCY EQUIVALENTS (inter-bank average exchange rate as of 01 September 2010,
according to State Bank of Viet Nam)
Currency Unit - dong (VND)
VND 1.00 = USD 0.0000528
USD 1.00 = VND 18,932
ABBREVIATIONS
ADB Asian Development Bank AFFF Aqueous Film Forming Foam APs Affected Peoples BOT Build-Operate-Transfer CAP Corrective Action Plan CBP Capacity Building Plan CC1 Construction Corporation No.1 CCGT Combined Cycle Gas Turbine CDM Clean Development Mechanism CEMS Continuous Emissions Monitoring Systems CER Certified Emission Reduction CHSP Community Health and Safety Plan CO Carbon Monoxide CO2 Carbon Dioxide CO2e Carbon Dioxide Equivalent CPP Central Processing Platform CTTP Can Tho Thermal Power Company DARD Department of Agriculture and Rural Department DCS Dedicated Control System DEMT Department of Environmental Management and Technology DFO Distillate Fuel Oil DHI Danish Hydraulics Institute DLN Dry Low NOx DM Demineralized Water EA Executing Agency EHS Guidelines World Bank Group’s Environment, Health and Safety Guidelines EHS Environment, Health and Safety EIA Environmental Impact Assessment EMD Environmental Management Department, CTTP EMF Electric and Magnetic Fields EMoP Environmental Monitoring Plan EMP Environmental Management Plan EPC Engineering, Procurement and Construction EPC-VESDEC Environmental Protection Center, also commonly referred to as
VESDEC a Branch of the Viet Nam Environment and Sustainable Development Institute
ERAV Electricity Regulatory Authority of Viet Nam ERCP Erosion and Runoff Control Plan EVN Electricity Viet Nam FCDI Financial Charge During Implementation GDC Gas Distribution Center GDP Gross Domestic Product GHG Greenhouse Gas GOV Government of Viet Nam

iv
GRM Grievance Redress Mechanism H2S Hydrogen Sulfide HPP Hydro Power Producer HRSG Heat Recovery Steam Generator HVAC Heat, Ventilation and Air-Conditioning system IPB Isolate Phase Bus IPP Independent Power Producer ISC3 Industrial Source Complex Short Term dispersion model ITB Institute of Tropical Biology IUCN International Union for Conservation of Nature and Natural Resources IVA Ieder Voor Allen JBIC Japan Bank for International Cooperation KfW KfW Bankengruppe
LEP Law on Environmental Protection MOECO Mitsui Oil Exploration Co. Limited, Japan MoF Ministry of Finance MOIT Ministry of Industry and Trade MONRE Viet Nam Ministry of Natural Resources and Environment N2O Nitrous Oxide NH3 Ammonia NO2 Nitrogen Oxide NOAA US National Oceanic and Atmospheric Administration NOx Nitrogen Oxides O3 Ozone OHSP Occupational Health and Safety Plan OIC Officer-in-Charge OLM Ozone Limiting Method PAHs Polycyclic aromatic hydrocarbons PCB Polychlorinated biphenyl PCR Project Completion Report PDMD5 Fifth Power Development Master Plan PDMP6 Sixth Power Development Master Plan PDMP7 Seventh Power Development Master Plan PECC2 Power Engineering Consulting Company No. 2 PECC3 Power Engineering Consulting Company No. 3 PPC Provincial People’s Committee PPE Personal Protective Equipment PPTA 4845-VIE Project Preparatory Assistance 4845-VIE: Preparing the Support for
Public-Private Development of the O Mon Thermal Power Complex Project
PTTEP PTT Exploration and Production Public Co. Limited, Thailand PV Gas Petrovietnam Gas Corporation PVN Petrovietnam Power Company SCADA Supervisory Control and Data Acquisition SCGT Simple Cycle Gas Turbine SEA Strategic Environmental Assessment SO2 Sulfur Dioxide SPC Spill Control Plan SPS Safeguard Policy Statement, ADB SR1 Environmental Safeguard Requirements 1, ADB SPS THC Total Hydrocarbons ToR Terms of Reference TPPMU3 Thermal Power Project Management Unit No 3 of EVN UXO Unexploded Ordinance Vinacomin Viet Nam National Coal and Mineral Industries Group VPC Vattenfall Power Consultant

v
WEIGHTS AND MEASURES
BOD5 Five-day Biochemical Oxygen Demand BTU/SCF British Thermal Units/Standard Cubic Foot COD Chemical Oxygen Demand dBA A-weighted sound pressure level in decibels DO Dissolved Oxygen DW Dry Weight GW Gigawatts GWh Gigawatt Hour HHV Higher Heating Value kg/m3 Kilograms per Cubic Meter km Kilometer kV Kilovolt m Meter m/s Meters per Second m³ Cubic Meters m³/h Cubic Meters per Hour m³/s Cubic Meters per Second mg/kg Milligrams per Kilogram mg/l Milligrams per Liter mg/m3 Milligrams per Cubic Meter mg/Nm3 Milligrams per Standard Cubic Meter MJ Megajoule MJ/kg Megajoules per Kilogram MPN Most Probable Number Mps Meters per Second MVA Million Volt Amperes MW Megawatt NTU Nephelometric Turbidity Units o
C Degrees Celsius pH A measure of the acidity or alkalinity of a solution PM Particulate Matter PM10 Particulate Matter (up to 10 microns in diameter) PPM Parts per Million T/h Tonnes per Hour TS Total Solids TSP Total Suspended Particulates TSS Total Suspended Solids µg/Nm3 Micrograms per Normal Standard Cubic Meter µm Micrometer µS/m Microsiemens Per Meter

vi
This page has been deliberately left blank to allow for double sided printing.
vii
CONTENTS
Page
EXECUTIVE SUMMARY ......................................................................................XVIII
I. INTRODUCTION................................................................................................. 1
A. Purpose of the Report................................................................................................. 1
B. Structure of EIA........................................................................................................... 1
C. Approach to EIA Preparation...................................................................................... 2
1. Background ............................................................................................................... 2
2. EIA Methodology ....................................................................................................... 3
3. Project Area Definition............................................................................................... 5
II. POLICY, LEGAL AND INSTITUTIONAL FRAMEWORK................................... 7
A. Power Sector ............................................................................................................... 7
1. Legal and Policy Framework ..................................................................................... 7
2. Power Development Master Plans............................................................................. 8
3. Power Demand.......................................................................................................... 8
4. Power Production .................................................................................................... 10
5. O Mon IV ................................................................................................................. 11
B. Environmental Impact Assessment ......................................................................... 12
1. Viet Nam’s Legal Framework................................................................................... 12
2. EIA and Thermal Power Production in Viet Nam ..................................................... 14
3. ADB’s Environmental Assessment Requirements.................................................... 14
4. Environmental Standards ........................................................................................ 14
a. Vietnamese Environmental Standards................................................................. 14
b. ADB Policy on Environmental Standards............................................................. 16
c. Key Guidelines and Standards Utilized in the O Mon IV Environmental Assessment................................................................................................................. 16
i. Ambient Air Quality .......................................................................................... 16
ii. Air Emissions................................................................................................... 16
iii. Noise and Vibration ......................................................................................... 18
iv. Water and Wastewater .................................................................................... 19
5. Occupational Health and Safety Standards ............................................................. 21
III. DESCRIPTION OF THE PROJECT .............................................................. 25
A. Type of Project .......................................................................................................... 25
B. Need for the Project .................................................................................................. 25
C. Responsible Agencies .............................................................................................. 26
D. Location and Access................................................................................................. 27
E. Detailed Description.................................................................................................. 29
1. O Mon Power Complex Overview............................................................................ 29
2. O Mon IV Layout ..................................................................................................... 31
3. O Mon IV Main Design Features and Systems ........................................................ 32
a. Power Plant Configuration and Buildings............................................................. 32
b. Fuel System and Source ..................................................................................... 36
c. Stack Emissions .................................................................................................. 38
d. Cooling System ................................................................................................... 38
e. Water Supply and Treatment ............................................................................... 39

viii
f. Wastewater Treatment ........................................................................................ 40
i. Domestic Wastewater Treatment..................................................................... 40
ii. Oily Water Collection and Treatment ............................................................... 40
iii. Central Wastewater Treatment ........................................................................ 43
g. Surface Water Drainage System.......................................................................... 43
h. Switchyard and Grid Connection.......................................................................... 47
i. Fire Protection System ........................................................................................ 47
i. Fire Detection and Alarm System..................................................................... 47
ii. Pumping Station and Storage .......................................................................... 48
iii. Outdoor Hydrants System................................................................................ 48
iv. Indoor Hydrant System .................................................................................... 48
v. Sprinkler System.............................................................................................. 48
vi. Water-Foam System........................................................................................ 48
vii. Inert Gas Extinguishing System ................................................................... 48
viii. Portable Extinguishers ................................................................................. 48
ix. Emergency Lighting System ............................................................................ 48
j. Emergency Power and Black Start ...................................................................... 49
k. Ventilation and Air Condition System................................................................... 49
l. Control and Communication Systems.................................................................. 49
m. Access Roads.................................................................................................. 49
n. Common Infrastructure ........................................................................................ 50
4. Power Plant Construction ........................................................................................ 50
a. Contractual Arrangements................................................................................... 50
b. Construction Stages ............................................................................................ 50
c. Water and Power Supply ..................................................................................... 50
d. Construction Materials ......................................................................................... 51
F. Land Acquisition and Resettlement......................................................................... 52
G. Budget and Financing............................................................................................... 53
H. Implementation Schedule ......................................................................................... 53
IV. DESCRIPTION OF THE ENVIRONMENT..................................................... 55
A. Ecological Resources ............................................................................................... 55
1. Terrestrial Resources .............................................................................................. 55
a. Methodology........................................................................................................ 55
b. Flora .................................................................................................................... 55
c. Fauna .................................................................................................................. 55
d. Rare or Endangered Species............................................................................... 55
e. Parks and Protected Areas.................................................................................. 56
2. Aquatic Resources .................................................................................................. 56
a. Methodology........................................................................................................ 56
i. Phytoplankton.................................................................................................. 59
ii. Zooplankton..................................................................................................... 59
iii. Benthic Macrofauna......................................................................................... 59
iv. Fish Species, Fisheries and Aquaculture ......................................................... 59
b. Inventory of Aquatic Organisms........................................................................... 59
i. Phytoplankton.................................................................................................. 59
ii. Zooplankton..................................................................................................... 61
iii. Benthic Macrofauna......................................................................................... 62
iv. Fish and Shellfish Fauna ................................................................................. 65
v. Red Listed Fish Species .................................................................................. 67
vi. Fisheries.......................................................................................................... 68
vii. Aquaculture.................................................................................................. 69
B. Natural and Physical Conditions.............................................................................. 70
1. Topography and Geology ........................................................................................ 70
ix
2. Soils and Soil Quality............................................................................................... 70
3. Mineral Resources................................................................................................... 72
4. Geohazards............................................................................................................. 73
5. Water Resources..................................................................................................... 73
a. Ground Water Resources .................................................................................... 73
b. Ground Water Quality .......................................................................................... 74
c. Surface Water – Hydrology.................................................................................. 75
d. Surface Water - Quality ....................................................................................... 76
e. Temperature and River Flow ............................................................................... 80
6. Sediment Quality ..................................................................................................... 81
7. Climate .................................................................................................................... 81
a. Data Sources....................................................................................................... 81
b. Temperature and Rainfall .................................................................................... 81
c. Winds .................................................................................................................. 82
8. Air Quality................................................................................................................ 84
a. Sources of Data and Basis of Assessing Data Quality ......................................... 84
b. Baseline Data from the PECC3 EIA..................................................................... 86
c. Baseline Data from the Vattenfall EIA.................................................................. 86
d. Air Quality at the Project Site ............................................................................... 87
9. Noise....................................................................................................................... 88
C. Socioeconomic and Cultural Profile ........................................................................ 88
1. Methodology............................................................................................................ 88
2. Population and Labor .............................................................................................. 88
3. Health and Education .............................................................................................. 89
4. Land Use................................................................................................................. 89
5. Economy, Industry and Agriculture .......................................................................... 90
6. Infrastructure and Transportation............................................................................. 91
7. Power and Water Sources....................................................................................... 91
8. Physical Cultural Resources.................................................................................... 92
V. ASSESSMENT OF ALTERNATIVES ............................................................... 93
A. No Project .................................................................................................................. 93
B. Alternative Technologies.......................................................................................... 93
C. Alternative CCGT Configurations............................................................................. 96
D. Alternative Fuel Sources .......................................................................................... 97
E. Alternative Cooling Options ..................................................................................... 98
F. Alternative NOx Removal .......................................................................................... 98
G. Alternative Site Locations ........................................................................................ 98
VI. ANTICIPATED ENVIRONMENTAL IMPACTS AND MITIGATION MEASURES........................................................................................................... 101
A. Project Siting ........................................................................................................... 101
1. Resettlement and Compensation........................................................................... 101
B. Construction Phase ................................................................................................ 101
1. Surface Water Quality ........................................................................................... 101
2. Groundwater Quality.............................................................................................. 103
3. Soil Quality ............................................................................................................ 103
4. Air Quality.............................................................................................................. 103
5. Noise..................................................................................................................... 105
6. Transportation ....................................................................................................... 106
7. Occupational Health and Safety ............................................................................ 106
8. Community Health and Safety ............................................................................... 107

x
9. Terrestrial Ecosystems .......................................................................................... 108
10. Aquatic Ecosystems .......................................................................................... 108
11. Physical Cultural Resources.............................................................................. 109
C. Operational Phase................................................................................................... 110
1. Surface Water and Aquatic Ecology ...................................................................... 110
a. Water Quality..................................................................................................... 110
b. Intake of Cooling Water ..................................................................................... 111
c. Thermal Plume Impacts..................................................................................... 112
i. Thermal Plume Modeling ............................................................................... 113
ii. Modeling Results ........................................................................................... 113
iii. Ecological Impacts......................................................................................... 118
2. Groundwater Quality.............................................................................................. 120
3. Air Quality.............................................................................................................. 120
a. Methodology – Review of Previous Studies ....................................................... 120
b. The CALPUFF Modeling System....................................................................... 121
c. Emissions and Scenarios .................................................................................. 121
d. NOx to NO2 Conversion ..................................................................................... 122
e. Results .............................................................................................................. 124
i. Case 1 – O Mon I Running on DFO ............................................................... 124
ii. Case 2 – O Mon I Running on Natural Gas.................................................... 124
iii. Case 3 – O Mon IV impact............................................................................. 124
iv. Case 4 – Cumulative Impact from O Mon I to V ............................................. 125
4. Noise..................................................................................................................... 140
5. Solid and Hazardous Wastes ................................................................................ 140
6. Climate Change..................................................................................................... 141
a. Greenhouse Gas Production ............................................................................. 141
b. Clean Development Mechanism ........................................................................ 141
c. Flood Risks........................................................................................................ 142
7. Seismic Instability.................................................................................................. 142
8. Traffic and Transportation...................................................................................... 142
9. Health and Safety.................................................................................................. 142
10. Physical Cultural Resources.............................................................................. 143
VII. INFORMATION DISCLOSURE, CONSULTATION, AND PARTICIPATION 145
A. Public Consultation, July 2005............................................................................... 145
B. Public Consultation, December 2005..................................................................... 145
C. Disclosure of MONRE-Approved EIA Report, December 2007............................. 146
D. PPTA 4845 Public Consultations and Stakeholder Workshop, 2007 ................... 146
1. Public Consultations, July 2007............................................................................. 146
2. Stakeholder Workshop, O Mon Power Complex, 14 September 2007................... 147
E. Future Consultation and Disclosure Activities ..................................................... 148
VIII. GRIEVANCE REDRESS MECHANISM...................................................... 149
A. Legal Basis .............................................................................................................. 149
B. Grievance Redress Mechanism.............................................................................. 149
C. Publicizing the Grievance Redress Mechanism.................................................... 150
IX. ENVIRONMENTAL MANAGEMENT PLAN................................................ 153
A. Mitigation Measures................................................................................................ 153
B. Environmental Monitoring, Reporting and Corrective Actions............................ 153
1. Environmental Monitoring...................................................................................... 153

xi
a. Construction Phase Environmental Monitoring .................................................. 153
b. Operation Phase Environmental Monitoring....................................................... 154
c. Independent Monitoring Verification................................................................... 155
2. Reporting and Corrective Action Plans .................................................................. 155
a. Construction Phase ........................................................................................... 155
b. Operation Phase................................................................................................ 155
C. Implementation Roles and Responsibilities.......................................................... 177
1. Government of Viet Nam ....................................................................................... 177
2. EVN....................................................................................................................... 177
3. Can Tho Thermal Power Company ....................................................................... 177
4. EPC Consultant..................................................................................................... 178
5. EPC Contractor ..................................................................................................... 179
6. 3rd Party Environmental Consultant ....................................................................... 180
7. External Environmental Monitoring Verification...................................................... 180
8. DONRE ................................................................................................................. 180
9. Training Consultants.............................................................................................. 181
10. ADB................................................................................................................... 181
D. Capacity Building Plan............................................................................................ 183
1. Environmental Monitoring and Reporting............................................................... 183
a. Construction Phase ........................................................................................... 183
b. Operation Phase................................................................................................ 183
2. OHS and CHS....................................................................................................... 184
a. Construction Phase ........................................................................................... 184
b. Operational Phase............................................................................................. 184
E. Budget...................................................................................................................... 185
X. CONCLUSION AND RECOMMENDATION ................................................... 187
APPENDICES........................................................................................................ 189
Appendix 1: References
Appendix 2: Unofficial Translation of MONRE Approval Letter for O Mon IV Environmental Impact Assessment
Appendix 3: O Mon IV Detailed Design Features and Systems
Appendix 4: Analytical Certificate - Phytoplankton
Appendix 5: Analytical Certificate - Zooplankton
Appendix 6: Analytical Certificate - Benthic Macrofauna
Appendix 7: Hau River Fish Species
Appendix 8: Analytical Certificate – Soil Quality
Appendix 9: Analytical Certificate – Groundwater Quality
Appendix 10: Analytical Certificate – Surface Water Quality
Appendix 11: Analytical Certificate – Sediment Quality
Appendix 12: Supplementary Air Quality Modeling Results
Appendix 13: Public Consultation and Disclosure
Appendix 14: Organization Chart, Environmental Management Department, CTTP
Appendix 15: EPC Contractor’s EHS Team Terms of Reference

xii
List of Tables Table 1: Relevant Vietnamese and EHS ambient air pollution standards and guidelines ....17
Table 2: Relevant Vietnamese and EHS thermal power plant emission standards and guidelines............................................................................................................................18
Table 3: Relevant Vietnamese and EHS noise standards and guidelines............................19
Table 4: Vietnamese vibration standards ............................................................................19
Table 5: Relevant Vietnamese standards (QCVN 24/2009/TNMT) and EHS guidelines for discharge of industrial wastewater to the aquatic environment.......................................23
Table 6: Vietnamese surface water standards (QCVN08:2008/BTNMT). ............................24
Table 7: Main design parameters, O Mon IV Thermal Power Project ..................................34
Table 8: Summary of O Mon IV main systems, auxiliary systems, and main buildings and infrastructure.......................................................................................................................35
Table 9: Characteristics and composition of natural gas at Block B&52, Gulf of Thailand....37
Table 10: Distillate fuel oil composition and characteristics .................................................38
Table 11: Main construction materials.................................................................................52
Table 12: Project cost estimates by expenditure category...................................................53
Table 13: Project financing plan ..........................................................................................53
Table 14: Water depth, location, weather, sediment structure and tide during sampling of surface water quality, sediment and aquatic organisms in the Hau River (C1-C4), Chanh Creek (C5) and O Mon River (C6), May 2007 .....................................................................58
Table 15: Percentage of total abundance (cells/m3), of the dominant species of phytoplankton Microcystis aeruginosa in the Hau River (C1-C4), Chanh Creek (C5) and O Mon River (C6), May 2007 ..............................................................................................61
Table 16: Percentage of total abundance (individuals/m3) of the dominant species of zooplankton in the Hau River (C1-C4), Chanh Creek (C5) and O Mon River (C6), May 2007....................................................................................................................................63
Table 17: Percentage of total abundance (individuals/m2) of the dominating species of benthic macrofauna in the Hau River (C1-C4), Chanh Creek (C5) and O Mon River (C6), May 2007............................................................................................................................65
Table 18: Number of stationary, migratory, Vietnamese Red listed high economic value species in the Hau River, Chanh Creek and O Mon River in the vicinity of the O Mon Thermal Complex. Based on interviews and samples from fishermen and fish markets in May and July 2007..............................................................................................................66
Table 19: Fish species listed in categories in the Vietnamese Red List and occurring in the vicinity of the O Mon Thermal Power Complex. Documentation was carried out from interviews and samples from fishermen and fish markets in May and July 2007. VU=Vulnerable, T=Threatened ...........................................................................................67
Table 20: Percentage of fishery catch and selling price per kg (VND) of different species in the vicinity of the O Mon Thermal Power Complex ..........................................................68
Table 21: Percentage use of fishing equipment in the vicinity of the O Mon Thermal Power Complex...................................................................................................................69
Table 22: Stratigraphy at O Mon IV Project Site ..................................................................70
Table 23: Description of soil samples..................................................................................71
Table 24: Soil samples analytical results.............................................................................72

xiii
Table 25: Groundwater samples analytical results ..............................................................76
Table 26: Monthly and annual flow along the Hau River (from 2007 PECC3 EIA) ...............76
Table 27: Results of surface water monitoring around the O Mon Power Plant Complex ....78
Table 28: Zinc (Zn), cadmium (Cd), chromium (Cr), manganese (Mn), arsenic (As) and mercury (Hg) (mg/kg DW) in sediment from the Hau River (C1-C4), Chanh Creek (C5) and O Mon River (C6) May 2007.........................................................................................81
Table 29: Mean meteorological conditions, Can Tho Meteorological Station, 1978-2005....82
Table 30: Results of air quality monitoring at O Mon (from 2007 PECC3 EIA).....................86
Table 31: Results of air quality monitoring at O Mon (from 2008 Vattenfall EIA)..................87
Table 32: Results of noise monitoring .................................................................................88
Table 33: Source of income among the Project affected people..........................................89
Table 34: Existing land use in O Mon district, and Phuoc Thoi and Thoi An wards..............90
Table 35: Expropriated land in Phuoc Thoi ward .................................................................90
Table 36: Comparison of power generation technologies....................................................95
Table 37: Analysis of power output and efficiency for CCGT configuration options .............97
Table 38: Analysis of power output, efficiency and investment rate 2-2-1 and 3-3-1 configurations......................................................................................................................97
Table 39: Analysis of efficiency CO2 emissions, oil and gas-fired thermal power plants ......98
Table 40: Predicted impacts from erosion, accidental leakage of fuels and chemicals, and wastewater from human activities, during construction of the O Mon IV and the O Mon Thermal Power Plant Complex on surface water quality, aquatic organisms, fishery and aquaculture (with mitigations applied) ........................................................................109
Table 41: Summary of anticipated impact of intake of cooling water for the O Mon IV Project and for the full power complex (O Mon I to V) on surface water quality, aquatic organisms, fisheries and aquaculture................................................................................112
Table 42: Impact of cooling water discharge from the O Mon IV and cumulative impacts from the O Mon Power Complex (I to V) on surface water quality, aquatic organisms, fisheries and aquaculture ..................................................................................................120
Table 43: Scenarios modeled, air quality impact assessment ...........................................122
Table 44: Emission parameters for the O Mon Power Plant Complex ...............................122
Table 45: Summary of air quality dispersion modeling results ...........................................126
Table 46: Estimated greenhouse gas emissions from the O Mon IV Power Plant and the O Mon Power Complex.....................................................................................................141
Table 47: Summary of key articles from Decision No. 4066/QĐ-UBND.............................145
Table 48: Dates and venues of disclosure and participation activities during PPTA 4845 .146
Table 49: Summary of environmental topics raised in group discussions at PPTA 4845 public consultation meetings, Thoi An 21/7/2007 and Phuoc Thoi 22/7-2007....................147
Table 50: O Mon IV environmental management plan: environmental impacts, mitigation measures, implementation responsibility, and cost source, construction and operation phases ..............................................................................................................................157
Table 51: Construction and operation environmental monitoring program.........................170
Table 52: Environmental management plan budget ..........................................................186
xiv
List of Figures
Figure 1: Annual power consumption growth rate against power generation, 2001-2009 ......9
Figure 2: PDMP7 forecasted power demand in GWh for the 2011-2030 period ....................9
Figure 3: Power generation by source, 2001-2009.............................................................10
Figure 4: Location of the O Mon IV Power Project, Can Tho City, Viet Nam........................27
Figure 5: Satellite image showing O Mon Power Complex location, O Mon District, Can Tho City, and the Project study area, defined as a 16 by 16 km grid with the complex at its center .............................................................................................................................28
Figure 6: Satellite image showing approximate footprints of O Mon Power Complex, access road, and discharge channels .................................................................................28
Figure 7: Aerial picture looking southwest, showing the O Mon I Power Plant. O Mon II, III and IV will be constructed to the right of O Mon I. Note cooling water discharge channel no. 1 on the left. Photo taken March, 2009.............................................................29
Figure 8: O Mon Power Complex layout. Note existing O Mon I Power Plant, 110, 220 and 500 kV switch yards, and cooling water discharge channel no. 1; and planned O Mon II to IV sites, cooling water discharge channel no. 2 and gas distribution complex. .....30
Figure 9: Detailed layout of the O Mon IV Thermal Power Project site ................................33
Figure 10: O Mon IV production process conceptual diagram .............................................36
Figure 11: Schematic of water supply treatment system .....................................................41
Figure 12: Schematic of process water demineralization treatment system.........................42
Figure 13: Schematic of O Mon IV domestic wastewater treatment system ........................44
Figure 14: Schematic of O Mon IV oil-water separator and central wastewater treatment plant....................................................................................................................................45
Figure 15: Schematic of O Mon IV surface water drainage system .....................................46
Figure 16: Existing outdoor 500 kV switching yard. Picture taken from O Mon I turbine building. ..............................................................................................................................47
Figure 17: O Mon IV site, August 2010. Site has been backfilled and roughly leveled, but not yet compacted...............................................................................................................51
Figure 18: O Mon IV overall implementation schedule (construction phase) .......................54
Figure 19: Location of closest protected area to O Mon IV Project site ...............................57
Figure 20: Sampling stations for sediment and aquatic organisms in the Hau River (C1-C4), Chanh Creek (C5) and O Mon River (C6) surveyed in May 2007. The existing O Mon I cooling water discharge channel is marked in red, and the proposed O Mon IV cooling water discharge channel is marked in blue. ............................................................58
Figure 21: Percentage distribution of number of phytoplankton species in taxonomic groups during dry season in the O Mon area (Hau River, Chanh Creek and O Mon River) and Can Tho (Hau River), May 2007. n= number of species...............................................60
Figure 22: Number of species of phytoplankton in taxonomic groups in the Hau River (C1-C4), Chanh Creek (C5) and O Mon River (C6), May 2007 ...........................................61
Figure 23: Percentage distribution of number of zooplankton species in taxonomic groups during dry season in the O Mon area (Hau River, Chanh Creek and O Mon River) and Can Tho (Hau River). n= number of species. ...............................................................62

xv
Figure 24: Number of species of zooplankton in taxonomic groups in the Hau River (C1-C4), Chanh Creek (C5) and O Mon River (C6), May 2007 ..................................................63
Figure 25: Percentage distribution of number of benthic macrofauna species in taxonomic groups during dry season in the O Mon area (Hau River, Chanh Creek and O Mon River) and Can Tho (Hau River). n= number of species. .............................................64
Figure 26: Number of species of benthic fauna in taxonomic groups in the Hau River (C1-C4), Chanh Creek (C5) and O Mon River (C6) May 2007 ............................................64
Figure 27: Shallow area along the riverside of the Hau River covered with water hyacinth..66
Figure 28: Upstream and downstream migration of taxonomic groups of fish species in the Mekong River during dry and wet season (after Mekong River Commission 2006) .......67
Figure 29: Ganges river sprat (Corica sorbona) on the left, and the Yellow rasbora (Rasbora laterristritata) on the right.....................................................................................68
Figure 30: Fishermen using seine net (Luoi Rung) in the Hau River....................................69
Figure 31: Soil (S01-S06) and groundwater (W02-W06) sampling locations, 2007 survey .71
Figure 32: Maximum credible earthquake zones in Viet Nam (Ngo et. al., 2008). Can Tho is in the lowest risk category for Viet Nam...........................................................................74
Figure 33: Bathymetry of the Hau River near the O Mon Power Complex (from the 2008 Vattenfall EIA). Note that axis values are in grid distance units of 50 m. .............................77
Figure 34: Dry and wet season sampling stations used in the PECC3 (2007) and Vattenfall (2008) surface water quality sampling .................................................................79
Figure 35: Mean monthly flow and temperature along the Hau River (data from Can Tho Station of the NHMS, as used in the 2007 PECC3 EIA) ......................................................80
Figure 36: Annual (2006) wind rose for Can Tho (from 2008 Vattenfall EIA) .......................83
Figure 37: Annual wind rose at O Mon based on 2006 CALMET extract .............................84
Figure 38: Monthly wind roses at O Mon based on 2006 CALMET extract..........................85
Figure 39: Near-surface temperatures arising from O Mon IV cooling water discharge (adapted from 2008 Vattenfall EIA). Axes coordinates are in meters.................................115
Figure 40: Near-surface temperatures arising from the cumulative discharges of O Mon I to V (adapted from 2008 Vattenfall EIA). Axes coordinates are in meters. ........................116
Figure 41: Predicted extent of cumulative 3-C° warming and proposed mixing zone limits117
Figure 42: Vertical temperature profile across the Hau River at the two outfall locations when all units are in operation (from 2008 Vattenfall EIA). Note: horizontal scale not equal to vertical scale........................................................................................................118
Figure 43: Plot of 98th percentile hourly ozone concentrations (µg/m³) from the Batangas City (Philippines) station (2004 to 2005)............................................................................123
Figure 44: Contour map of maximum predicted 1-hour NO2 concentrations (µg/m³) for Case 1 emissions (O Mon I running on DFO)....................................................................127
Figure 45: Contour map of maximum 1-hour SO2 concentrations (µg/m³) for Case 1 emissions (O Mon I running on DFO)................................................................................127
Figure 46: Contour map of maximum predicted 1-hour NO2 concentrations (µg/m³) for Case 2 emissions (O Mon I running on natural gas)..........................................................128
Figure 47: Contour map of maximum predicted 1-hour SO2 concentrations (µg/m³) for Case 2 emissions (O Mon I running on natural gas)..........................................................128
xvi
Figure 48: Contour map of maximum predicted 1-hour NO2 concentrations (µg/m³) for Case 3 emissions (O Mon IV) ...........................................................................................129
Figure 49: Contour map of maximum predicted 24-hour NO2 concentrations (µg/m³) for Case 3 emissions (O Mon IV) ...........................................................................................129
Figure 50: Contour map of annual average predicted NO2 concentrations (µg/m³) for Case 3 emissions (O Mon IV) ...........................................................................................130
Figure 51: Contour map of maximum predicted 1-hour SO2 concentrations (µg/m³) for Case 3 emissions (O Mon IV) ...........................................................................................130
Figure 52: Contour map of maximum predicted 24-hour SO2 concentrations (µg/m³) for Case 3 emissions (O Mon IV) ...........................................................................................131
Figure 53: Contour map of predicted annual average SO2 concentrations (µg/m³) for Case 3 emissions (O Mon IV) ...........................................................................................131
Figure 54: Contour map of maximum predicted 1-hour CO concentrations (µg/m³) for Case 3 emissions (O Mon IV) ...........................................................................................132
Figure 55: Contour map of maximum predicted 8-hour CO concentrations (µg/m³) for Case 3 emissions (O Mon IV) ...........................................................................................132
Figure 56: Contour map of maximum predicted 24-hour CO concentrations (µg/m³) for Case 3 emissions (O Mon IV) ...........................................................................................133
Figure 57: Contour map of maximum predicted 24-hour PM10 concentrations (µg/m³) for Case 3 emissions (O Mon IV) ...........................................................................................133
Figure 58: Contour map of predicted annual average PM10 concentrations (µg/m³) for Case 3 emissions (O Mon IV) ...........................................................................................134
Figure 59: Contour map of maximum predicted 1-hour NO2 concentrations (µg/m³) for Case 4 emissions (Cumulative O Mon I to V)....................................................................134
Figure 60: Contour map of maximum predicted 24-hour NO2 concentrations (µg/m³) for Case 4 emissions (Cumulative O Mon I to V)....................................................................135
Figure 61: Contour map of annual average predicted NO2 concentrations (µg/m³) for Case 4 emissions (Cumulative O Mon I to V)....................................................................135
Figure 62: Contour map of maximum predicted 1-hour SO2 concentrations (µg/m³) for Case 4 emissions (Cumulative O Mon I to V)....................................................................136
Figure 63: Contour map of maximum predicted 24-hour SO2 concentrations (µg/m³) for Case 4 emissions (Cumulative O Mon I to V)....................................................................136
Figure 64: Contour map of predicted annual average SO2 concentrations (µg/m³) for Case 4 emissions (Cumulative O Mon I to V)....................................................................137
Figure 65: Contour map of maximum predicted 1-hour CO concentrations (µg/m³) for Case 4 emissions (Cumulative O Mon I to V)....................................................................137
Figure 66: Contour map of maximum predicted 8-hour CO concentrations (µg/m³) for Case 4 emissions (Cumulative O Mon I to V)....................................................................138
Figure 67: Contour map of maximum predicted 24-hour CO concentrations (µg/m³) for Case 4 emissions (Cumulative O Mon I to V)....................................................................138
Figure 68: Contour map of maximum predicted 24-hour PM10 concentrations (µg/m³) for Case 4 emissions (Cumulative O Mon I to V)....................................................................139
Figure 69: Contour map of predicted annual average PM10 concentrations (µg/m³) for Case 4 emissions (Cumulative O Mon I to V)....................................................................139
Figure 70: Grievance Redress Mechanism .......................................................................151

xvii
Figure 71: Proposed locations for groundwater, surface water, soil and sediment monitoring and/or sampling and monitoring station locations, construction and operation phases. (At six of the surface water stations samples will be collected for more detailed laboratory analysis). ..........................................................................................................176
Figure 72: Proposed locations for meteorological, noise, and ambient air quality sampling and monitoring station locations, construction and operation phases.................176
Figure 73: Project organization chart emphasizing environmental management and reporting responsibilities during construction and operation ..............................................182

xviii
EXECUTIVE SUMMARY
Introduction i. The Asian Development Bank (ADB) has received a request to support the development of the O Mon IV Thermal Power Project (the Project) in Can Tho, Viet Nam. KfW Bankengruppe (KfW) and the Japan Bank for International Cooperation (JBIC) are considering co-financing the Project. Environmental Assessment Process ii. The Project has been classified by ADB as environment category A, requiring the preparation of a full environmental impact assessment (EIA); this document constitutes the Project EIA report. It has been prepared based on a review of existing preparatory studies and reports undertaken in 2007 by the Power Engineering Consulting Company No. 3 (PECC3) of Electricity Viet Nam (EVN) and in 2008 by Vattenfall Power Consultant, supported by site visits, stakeholder consultations and additional air quality dispersion modeling undertaken in 2010 (preparatory work on the Project was suspended during the 2008-2010 period due to delays in securing a guaranteed gas supply). The EIA report has been developed to comply with ADB’s environmental assessment requirements as reflected in the 2010 Safeguards Policy Statement (SPS), international good practice as reflected in the World Bank Group’s Environmental, Health, and Safety Guidelines (EHS Guidelines), and relevant Vietnamese environmental standards. In cases of conflict between the EHS Guidelines and Vietnamese standards, whichever is the more stringent has been adopted. Need for the Project iii. The Project is required to meet the rapid growth in power demand associated with Viet Nam’s socioeconomic development; from 1995 to 2005 power demand increased at an average annual rate of 15%, and maximum power demand increased over 300% from 3,200 MW to 10,500 MW. Demand for electricity is forecast to grow between 13.4% and 16.1% per year during the 2011- 2015 period. Viet Nam is heavily reliant on hydropower, and during the dry season, low rainfall levels reduce power outputs dramatically leading to rotating power shortages. The construction and operation of the O Mon IV power plant will have an important role in meeting the demand for power in the south of Viet Nam, and will improve overall reliability and stability of the national power system. Project Description and Implementation Arrangements iv. The Project consists of a 750 megawatt (MW) combined cycle gas turbine (CCGT) power unit utilizing F class gas turbines, dry low NOx (DLN) combustors, a 2-2-1 configuration, natural gas from the B&52 offshore gas field, and flow-through cooling from the Hau River with a maximum temperature increase at the condenser outlet of 6 oC. The Project will be one of four (and possibly five) power plants constructed at the O Mon Thermal Power Complex (e.g. O Mon I to V), located on the right bank of the Hau River in the O Mon District of Can Tho City, 130 km straight-line distance southwest of Ho Chi Minh City. v. The Government of Viet Nam (GOV) will be the Project borrower, and will then on-lend the loan proceeds to Electricity Viet Nam (EVN). EVN will be the executing agency, and have tasked the Can Tho Thermal Power Company (CTTP) to be the implementing agency and to manage the Project construction and operation. The power plant will be constructed through a single engineering, procurement and construction (EPC) package delivered by an EPC contractor recruited by CTTP. CTTP will also contract an international EPC consultant to support CTTP with the tendering procedure for, and supervision of, the EPC package during the three year construction period. Once construction is completed CTTP will assume

xix
responsibility for plant operation, with the EPC contractor providing warranty, maintenance and technical support during a two year warranty period. Environmental Setting vi. Vegetation in the area consists mainly of cultivated species. One IUCN Red Listed plant, a dipterocarp, is found in the Project area but only under cultivation and it has limited ecological value. Fauna in the Project area is similar to other rural areas in the Mekong Delta, including amphibians, reptiles and birds. There are no protected areas or special use forests in the Project area or in O Mon district. vii. The aquatic ecology of the Project area is also similar to the rest of the Hau River. Several species in the area are in the Vietnamese Red List as a result of overfishing. The north side of the river, which is shallower than the south side where the O Mon Power Plant Complex is located, is preferred by fish for spawning and as nursery areas particularly where water hyacinths are present. Aquaculture is also much more common on the north bank; however, none were found within 4 km of the outfall channels along the south bank. viii. The superficial soil in the area is soft, clayey and weathered, and often covered with a layer of alluvial sand arising from inundation from the Hau River. The southeastern area has clay suitable for brick making. The Project is in a low risk area for earthquake hazards. Sand mining is intensive and may pose risk of erosion and failure along the banks. There are two groundwater layers in the area. The shallow layer is polluted and is no longer widely used; households rely on the deeper groundwater for domestic use. Analysis shows that the groundwater is of fairly good quality. ix. The Hau River, which will be used as a source and receiver of cooling water by the power plant, is a downstream distributary of the Mekong River. Its flow peaks to three times its annual mean during the rainy season, and falls to a minimum in April. Its depth is predominantly semi-diurnal with amplitudes strongly affected by the season. Tides also impart a reversal in river currents that are most pronounced also in the dry season. During periods of drought the reduced discharge allows the intrusion of saline water from the South China Sea and maintains the depth of the river. Near the power plant the mean depth is about 15 m, with a maximum of 22 m near the intakes. The quality of the river water was found to comply with Viet Nam guidelines except for high counts of coliform. Levels of some pollutants were found to be higher in the wet season, possibly as a result of increased non-project related runoff and coliform/pollutant sources. x. Mean monthly river temperatures mirror monthly air temperatures, which are higher in the dry season. The highest mean monthly temperature is 32.2°C in May. Weaker river discharge can cause the river to be warmer than usual, while ample rainfall and strong flow will bring about cooler river temperatures. Monthly winds exhibit variability in direction, although the most common is from the west-southwest. xi. There is little data on air quality in the area. The available data show general compliance with Viet Nam one-hour guidelines except for particulates. Vehicular emissions and bare soil near the sampling sites explain the exceedances. Ample wet season rainfall and the dominance of agricultural land use are likely to offset poor air quality along the roads and bring the area to general compliance with guidelines. xii. The population of O Mon district was 128,075 persons in 2004, made up of three ethnic groups: Kinh, Hoa and Khmer. Socioeconomic surveys found day labor to be the main source of income in the households. Only 21% are dependent on agriculture, which will decrease as rapid industrial and commercial development continues in the Can Tho area. Agriculture and aquaculture have also been moving towards the production of high value products.
xx
xiii. There are no known structures or sites that are of historical, archaeological, paleontological, or architectural significance in the Project area, and there are no known current use of lands and resources for traditional purposes by Indigenous Peoples. Alternative Assessment xiv. An assessment of alternatives to the Project was undertaken, including alternatives to power generation technologies, CCGT configurations, fuel sources, cooling options, NOx removal, and location. The assessment concluded that the proposed Project design and location are the most efficient and appropriate to meet Viet Nam’s power needs while minimizing negative environmental impacts and greenhouse gas emissions. Anticipated Impacts and Mitigation Measures Resettlement and Compensation xv. The acquisition of 17.1 ha of land for the power plant affected 158 households, 66 of which required resettlement. A total of 94 billion VND was paid in compensation. An additional 14.9 billion VND was paid to compensate the 78 households affected by the access road development. The resettlement and compensation processes were conducted in accordance with Vietnamese requirements. The resettlement process has undergone a separate due diligence review which confirmed that it largely complies with ADB requirements; a corrective action plan has been developed to address any deficiencies identified in the due diligence review. Construction Phase xvi. Construction has the potential to contaminate the surrounding waters through erosion and sedimentation from excavation, oil spills, pollution from temporary worker camps, spills and discharge of ballast water from transport ships, and dredging for fill sand. To mitigate these impacts, specific environmental management plans for each activity have been developed. xvii. Construction activities can generate significant localized levels of dust, particularly during dry weather periods and during intense activity. Noise levels may exceed Vietnamese standards and disturb residents. Impacts during this stage are expected to be short to medium-term, localized and manageable through appropriate mitigations. xviii. The construction of a major civil works project such as a thermal power plant poses an inherent risk of injury to workers from accidents, fires and hazardous working environments. Prior to the commencement of civil works the EPC contractor will be required to develop an Occupational Health and Safety Plan (OHSP) consistent with good international practice. Risks to the community will also be managed through the development of a Community Health and Safety Plan (CHSP). Occupational and community health and safety will be undertaken by the EPC contractor during construction, and by CTTP’s Environmental Management Division (EMD) during operation. xix. The permanent conversion of the Project site’s land use to an industrial area constitutes significant environmental impact. However, the affected ecosystems and environment contain no protected areas, natural forests, or habitats of rare and endangered species. No physical cultural resources have been documented within the Project area. Operation Phase

xxi
xx. Plant operations have the potential to contaminate the surrounding waters through spills, wastewater, and runoff. To mitigate these risks an operations phase spill control plan for the facility and ships will be in place. Oily water runoff will be collected and treated in a gravity-type oil-water separator with the capacity to remove 99% of oil wastes. All other plant effluents (process and domestic) will be treated to relevant EHS Guidelines and Vietnamese standards prior to release.
xxi. The O Mon IV and other power plants will be releasing warm water to the Hau River. Vietnamese guidelines limit the temperature of the discharge water to ≤ 40°C at the outlet. Calculations show that the possibility of exceeding this standard is very low. xxii. EHS guidelines also include a provision that wastewater should not result in an increase greater than 3°C of ambient temperature at the edge of a scientifically established mixing zone. Based on EHS Guidelines and international good practice a mixing zone has been proposed, the horizontal extent of which is defined as the area within a radius from the two discharge channels of one-third the width of the Hau River (as the width of the river is 900 m, the radius is 300 m), and the vertical extent of which is defined as the area covering 25% of the cross section of the river. xxiii. Updated results of the MIKE 3 modeling conducted in the 2008 Vattenfall EIA showed that the 3°C warming from both the O Mon IV thermal effluent alone and the cumulative effects from all five units at the Power Complex are entirely within the boundaries of the proposed mixing zone. The 3°C warming from the Project thermal effluent alone is confined to the immediate vicinity of the outfall (e.g. less than 50 m). When the full Power Complex is running (I to V) during the worst-case scenario of a slack current during the dry
season, the horizontal dispersion of heated surface water with a temperature increase of 3°C or more will extend in a plume about 280 m offshore and 240 m to the southwest from the second discharge channel. During the flood tide the plume retreats to the shoreline and bends back towards the O Mon IV facility. This zone does not contain areas of critical importance such as spawning grounds. During the wet season when fish migrate, distance dispersion and area affected is significantly reduced because of the higher water flow. Overall the thermal plume is not expected to have a significant impact on aquatic ecology. Nonetheless, it is important that a monitoring program which includes monitoring of intake and discharge temperatures, river water temperatures, and aquatic ecology and fisheries, be implemented to further understand the extent of the warming, and to alert CTTP if conditions arise where additional mitigations are required to address thermal discharge impacts. In addition, during detailed design it is recommended that options for further reducing discharge temperature, either at the condenser or over the length of the discharge channel, be examined. xxiv. A new air quality dispersion modeling study was undertaken using a meteorological database and the CALPUFF modeling system following standard international modeling practice. Results of the modeling show that no exceedances of the Vietnamese or EHS guidelines are expected from O Mon IV even if background concentrations are added to its impact. When all five units are operating, the addition of background concentrations can result in potential exceedances of the 1-hour NO2 guideline. However, these exceedances are predicted to occur a maximum of 2 hours per year on 2 separate days at a single receptor, and all other exceedances at other receptors occur only one hour per year. The predicted maximum likelihood of exceedance is about 0.02 % of total hours per year and 0.55 % of total days in this worst-affected receptor. xxv. This air quality risk is not considered significant for several reasons. First, the maximum concentrations from all five units operating is lower than those from O Mon I running on distillate fuel oil (DFO) and results in a net improvement over the baseline. Second, the risk is only about two hours per year. Third, the affected areas are within 500 m of the facility where no large population centers or sensitive ecological receptors are found.

xxii
Fourth, highly conservative modeling assumptions guarantee that these results overestimate actual impact. However, the finding of potential exceedance reiterates the need for a continuous ambient monitoring program to identify periods of adverse air quality and determine whether additional management measures will be necessary. xxvi. For noise, the design of the power plant and noise calculations indicate that levels will fall to background levels before reaching the nearest residence. xxvii. The combustion of natural gas produces CO2, a greenhouse gas (GHG). Calculations based on natural gas characteristics and consumption rate show that O Mon IV will generate 1.77 million tons of CO2 per year, while all five units will emit 8.18 million tons per year. The O Mon IV Project has the potential to reduce overall GHG emissions in Viet Nam by replacing more carbon intensive thermal power fuel sources such as coal or DFO. Public Consultation, Disclosure and Grievance Redress xxviii. Extensive public consultation and disclosure related to the O Mon Thermal Power Complex in general and to the Project specifically has been undertaken over a prolonged period. Public involvement in the planning and design of the O Mon Thermal Power Complex initially started in 2000 with the compensation and resettlement processes for O Mon I and II. Consultation for the remaining Power Complex plants, including O Mon IV, was undertaken in July and December 2005, and additional consultations were undertaken in July and September 2007. A Project grievance redress mechanism (GRM) has been developed to provide a systematic, transparent and timely process for receiving, evaluating and addressing affected peoples (APs) Project-related complaints and grievances. The GRM will be open to all Project APs, regardless of the nature of their complaint. When construction starts a sign will be erected at the site providing the public with updated Project information and summarizing the GRM process. In addition, this EIA report will be submitted to the ADB for disclosure on the ADB website (www.adb.org). Environmental Management Plan xxix. A comprehensive EMP has been developed which includes: i) construction and operation phase mitigation measures; ii) a rigorous environmental monitoring and reporting plan; iii) independent verification of the monitoring results; and iv) environment, health and safety (EHS) experts of the EPC contractor who will oversee mitigation implementation and monitoring and reporting during the construction stage, and EHS experts from CTTP’s EMD who will assume this responsibility during the operation phase. With a 15% contingency the total EMP budget is $693,939. It should be noted that cost for many of the EMP mitigation measures, such as the use of DLN burners and the treatment of all wastewater, are included in the EPC package cost estimate and/or operating costs estimates, and are thus not included in the EMP budget. xxx. During the construction phase the EPC contractor will have overall responsibility for environmental management and occupational and community health and safety. The EPC contractor will recruit an appropriately qualified EHS Team who will assume day-to-day responsibility for EMP implementation, including ensuring mitigations are implemented appropriately, and coordinating the delivery of training programs. The EPC contractor’s EHS Team will consist of an International and a National EHS Officer. CTTP will recruit a 3rd party environmental consultant to undertake construction phase environmental monitoring. xxxi. Once plant operations begin, CTTP will assume responsibility for EMP implementation and will allocate EHS staff to the Project from its EMD. A training program will be provided to support the EMD in delivering their EHS responsibilities, and the EPC contractor will provide technical support to CTTP as the EPC contractors’ warranty responsibility during the initial two years of operation. CTTP will also have overall

xxiii
responsibility for undertaking operation phase environmental monitoring. CTTP will continue to use the services of a 3rd party environmental consultant to undertake the environmental monitoring on their behalf. xxxii. As required by ADB’s SPS, CTTP will recruit qualified and experienced external experts to verify information collected through the environmental monitoring programs. It is anticipated that the external monitors will conduct annual verification missions beginning in year two of the construction phase. Conclusion and Recommendations xxxiii. Based on the analysis conducted in this assessment it is concluded that overall the Project will result in significant positive socioeconomic benefits, and those negative environmental impacts that have been identified are small-scale, localized and can be minimized adequately through good design and the appropriate application of mitigation measures. It is therefore recommended that the Project be supported by ADB, KfW and JBIC, subject to the implementation of the commitments contained in the EMP and allocation of appropriate technical, financial and human resources by stakeholders to ensure these commitments are effectively and expediently implemented.

xxiv
This page has been deliberately left blank to allow for double sided printing.

1
I. INTRODUCTION
A. Purpose of the Report
1. The Asian Development Bank (ADB) has received a request to support the development of the O Mon IV Thermal Power Project (the Project) in Can Tho, Viet Nam. The Project will develop a 750 megawatt (MW) combined cycle gas turbine (CCGT) power plant, and will be one of four (and possibly five) power plants constructed at the O Mon Thermal Power Complex (e.g. O Mon I to V). KfW Bankengruppe (KfW) and the Japan Bank for International Cooperation (JBIC) are considering co-financing the Project. 2. The Project has been classified by both the Viet Nam Ministry of Natural Resources and Environment (MONRE) and ADB as environment category A, requiring the preparation of a full environmental impact assessment (EIA). This document has been developed to comply with ADB’s environmental assessment requirements, and constitutes the Project EIA report. ADB and KfW have made efforts to align and co-ordinate their respective environmental safeguards requirements and procedures, and should KfW decide to co-finance the Project it is understood that this EIA will be assessed by both agencies to ensure appropriate safeguards compliance. It is also anticipated that JBIC will conduct a due diligence review of this EIA report to ensure its compliance with their environmental guidelines. B. Structure of EIA
3. This report is structured as follows:
Executive Summary Summarizes critical facts, significant findings, and recommended actions. I Introduction Introduces Project and report purpose. II Policy, Legal, and Administrative Framework Discusses Viet Nam’s energy and environmental assessment legal and institutional frameworks. III Description of the Project Describes the Project type, location and justification, and presents a detailed Project description, budget and implementation schedule. IV Description of the Environment Describes relevant physical, biological, and socioeconomic conditions within the Project area of influence. V Anticipated Environmental Impacts and Mitigation Measures Describes Project-specific and cumulative environmental impacts predicted to occur as a result of the Project, and identifies suitable mitigation measures. VI Analysis of Alternatives Presents an analysis of alternatives of various Project aspects. VII Information Disclosure, Consultation, and Participation Describes the process undertaken during Project design and preparation for engaging stakeholders; summarizes concerns raised and actions taken to address concerns; and describes planned information measures for carrying out consultation with affected people during Project implementation.

2
VIII Grievance Redress Mechanism Describes the Project grievance redress framework for resolving complaints. IX Environmental Management Plan Presents the Environmental Management Plan (EMP), including required construction and operation phase environmental mitigation measures, an environmental monitoring plan, occupational and community health and safety plans, and an environmental monitoring and reporting and health and safety capacity building plan (CBP). X Conclusion and Recommendation Presents conclusions drawn from the assessment and recommendations. Appendices Provides references and supporting documentation and information.
C. Approach to EIA Preparation
1. Background
4. This report has been prepared based on a review of existing studies and reports (e.g. the 2007 MONRE-approved EIA, and the 2008 EIA prepared by Vattenfall Power Consultant, both described below), supported by site visits, stakeholder consultations and additional air quality dispersion modeling undertaken in 2010. Data sources and references are presented in Appendix I. 5. In 2007 the Power Engineering Consulting Company No. 3 (PECC3) of Electricity Viet Nam (EVN) prepared an EIA report for the O Mon IV Project.1 The report, hereafter referred to as the “PECC3 EIA”, was reviewed by the Ministry of Natural Resources and Environment (MONRE) and was found to comply satisfactorily with Vietnamese environmental requirements; the EIA report was approved by MONRE on December 20th, 2007 (see Appendix 2). At that time the implementing agency for the Project was the Thermal Power Project Management Unit No 3 (TPPMU3) of EVN. 6. ADB’s safeguard policy requires the borrower to prepare an environmental assessment of projects that complies with ADB’s standards. In 2008 the ADB financed PPTA 4845-VIE: Preparing the Support for Public-Private Development of the O Mon Thermal Power Complex Project (PPTA 4845), undertaken by Vattenfall Power Consultant (VPC), assisted EVN and TPPMU3 in developing a draft EIA of the Project suitable for submission to the ADB.2 However, the EIA report, hereafter referred to as the “Vattenfall EIA” was never officially submitted by EVN to ADB, and due to delays in ensuring a supply of natural gas, additional preparatory work on the Project was delayed until the second quarter of 2010. During this time the implementing agency for the O Mon IV Project was changed by EVN from TPPMU3 to the Can Tho Thermal Power Company (CTTP), and as a result there is no substantive ownership by CTTP of the Vattenfall EIA or other preparatory documents produced by PPTA 4845.
1 O Mon IV Thermal Power Plant Environmental Impact Assessment. Electricity Viet Nam and Thermal Power
Project Management Unit No 3. Prepared by Power Engineering Consulting Company No. 3. May 2007. 2 Socialist Republic of Viet Nam. Draft Environmental Impact Assessment: O Mon Thermal Power Complex
Project. Prepared by Viet Nam Electricity for the Asian Development Bank (ADB). July 2008.

3
7. On January 20th of 2010 the ADB’s new Safeguard Policy Statement (SPS) became effective.3 The SPS aims to avoid, minimize or mitigate harmful environmental and social impacts, and to help the borrower/client strengthen their safeguard systems. Appendix I of the SPS (referred to as Safeguards Requirement 1 or SR1) outlines the requirements that borrowers/clients must meet when delivering environmental safeguards for projects supported by the ADB. As noted in Chapter 1, these requirements include assessing impacts, planning and managing impact mitigations, preparing environmental assessment reports, disclosing information and undertaking consultation, establishing a grievance mechanism, and monitoring and reporting. SR1 also includes specific environmental safeguard requirements pertaining to biodiversity conservation and sustainable management of natural resources, pollution prevention and abatement, occupational and community health and safety, and conservation of physical cultural resources. 8. In May 2010 ADB undertook an O Mon IV fact finding mission which included a review of the O Mon IV PECC3 EIA in light of the SPS requirements. The Mission found that some environmental aspects needed to be further detailed in order to meet ADB’s requirements. These included topics that were already being conducted by CTTP but needed to be further explained in the EIA (e.g. grievance redress mechanism, physical cultural resources, and health and safety of workers and the community), as well as SPS requirements that had not been addressed in the PECC3 EIA, such as the requirement for the proponent to calculate annual estimated greenhouse gas (GHG) emissions for projects likely to produce over 100,000 tonnes of carbon dioxide equivalent (CO2e)4 per year or greater for the project’s aggregate direct and indirect emissions. The Mission also raised concerns about several areas in the EIA report, including NOx dispersion modeling and associated impacts, and cooling water thermal plume modeling and associated impacts. 9. During the Mission it was agreed by both ADB and EVN that ADB would field an international consultant who would assist PECC3 to prepare a revised EIA report that would comply with ADB standards. As part of this process it was also agreed that ADB would engage an additional international expert to conduct an independent review of air quality and thermal plume modeling and respective results, and calculate key greenhouse gas emissions. On the basis of these inputs, the final EIA (this report), including a detailed EMP, was prepared jointly by PECC3, CTTP and the ADB consultants.
2. EIA Methodology
10. As noted above, this report has been prepared based on a review of existing studies and reports, including those undertaken for the O Mon IV EIA produced by PECC3 in 2007 and reports prepared under PPTA 4845 in 2008 (including but not limited to the Vattenfall EIA), supported by site visits, stakeholder consultations and additional air quality dispersion modeling undertaken in 2010. Specifically, key data sources are as follows:
O Mon Project Description - O Mon IV Power Plant – 750 MW – Construction Investment Report. Provided
by Can Tho Thermal Power Company, 05 2010 (based on Construction Investment Report prepared by PECC3, 2007). Can Tho City, Viet Nam.
- O Mon IV Thermal Power Plant Environmental Impact Assessment Report. Prepared for EVN by PECC3, 2007. Ho Chi Minh City, Viet Nam.
- O Mon IV Summary Report (PowerPoint Presentation). Prepared by Can Tho Thermal Power Company, 05 2010. Can Tho City, Viet Nam.
3 ADB. 2009. Safeguard Policy Statement. Available at:
www.adb.org/Documents/Policies/Safeguards/default.asp. 4 Carbon dioxide equivalent (CO2e) is a universal standard of measurement against which the impacts of
releasing (or avoiding the release of) different greenhouse gases can be evaluated over a time horizon.

4
Terrestrial Ecological Resources
- Ecological survey conducted in 1998 by the Environmental Protection Center (EPC-VESDEC)5 for the O Mon I and II EIA.
- Ecological survey conducted in 2005 by the EPC-VESDEC for the O Mon IV PECC3 EIA.
Aquatic Resources
- Aquatic resource study (phytoplankton, zooplankton, zoobenthos, aquatic products) undertaken in 2005 by the EPC-VESDEC for the PECC3 EIA.
- Baseline aquatic resource study (including phytoplankton, zooplankton, sediment, benthic fauna, fisheries and aquaculture) carried out in May and July 2007 during preparation of the Vattenfall EIA.
Topography, Geology, Soil and Soil Quality
- Site survey at 1:20,000 scale conducted in 2005 for the PECC3 EIA. - Test drilling program conducted in 2005 for the PECC3 EIA. - Soil sampling and analysis survey carried out in 2007 during preparation of
the Vattenfall EIA.
Water Resources - Test drilling program conducted in 2005 for the PECC3 EIA. - Groundwater sampling and analysis program conducted in 2005 for the
PECC3 EIA. - Groundwater sampling and analysis program carried out in 2007 during
preparation of the Vattenfall EIA. - Mean monthly flow and temperature data for 1977 to 2005 along the Hau
River from the Can Tho station of the National Hydro-meteorological Service of Viet Nam.
- River water samples collected for the Vattenfall EIA at 12 points along four transect lines crossing the Hau River in May 2007.
Climate
- Mean monthly meteorological data for 1978 to 2005 from the Can Tho station of the National Hydro-meteorological Service of Viet Nam.
- Six-hourly wind and temperature data at the Can Tho station for 2006 (used in the 2008 Vattenfall EIA).
- Processed three-dimensional hourly meteorological MM5 data for 2006 the Can Tho region from TRC.
Air Quality
- One-hour samples of dust (TSP), SO2, NO2, CO and total hydrocarbons (THC) at 10 stations within 3 km from O Mon IV in 2005 collected by EPC-VESDEC.
- One-hour samples of NO2, SO2, TSP, PM10, CO and hydrocarbons collected at four stations at two-month intervals between February to August 2004 gathered by the Institute of Environmental Science and Technology in Ho Chi Minh City.
- Continuous hourly concentrations of SO2, NO2, O3, and PM10 taken in 2004 to 2005 at the Batangas City station (representative of background air quality at a site with similar land use and climate as O Mon).
5 The Environmental Protection Center (EPC), also commonly referred to as VESDEC, is a Branch of the Viet
Nam Environment and Sustainable Development Institute (VESDI), a NGO within the Viet Nam Association of Conservation and Environmental Protection (VACNE).

5
Background Noise - Noise study undertaken in 2005 by VESDEC for the PECC3 EIA.
Air Quality Modeling
- Dispersion modeling using the CALPUFF modeling system with the 2006 MM5 data.
Cooling Water Thermal Plume Modeling
- Thermal plume modeling undertaken by the Application Mechanics Institute for PECC3 (2007), utilizing the SW-FAST2D two dimensional numerical model.
- Thermal plume modeling undertaken in the Vattenfall EIA utilizing the MIKE 3 three-dimension hydrodynamic and transport model developed by the Danish Hydraulics Institute (DHI).
Socioeconomic Status
- Socioeconomic surveys and data collected for the PECC3 EIA. - Socioeconomic surveys and data collected in 2007 during preparation of the
Vattenfall EIA.
Public Consultation and Information Disclosure - Public consultations undertaken by the Thermal Power Project Management
Unit No 3 (TPPMU3) of EVN in July and December 2005. - O Mon IV EIA disclosure, Can Tho People’s Committee, December 2007. - PPTA 4845 public consultation meeting, July 2007. - PPTA 4845 public consultation meeting and draft report disclosure,
December 2007.
11. Other data sources and references are presented in Appendix I. 12. In this report key potential impacts are assessed both in terms of those attributable to the Project (e.g. the O Mon IV Thermal Power Project), and cumulative impacts (e.g. those attributable to the operation of all five power plants (O Mon I to V) that are planned or might conceivably be constructed at the O Mon Power Complex.
3. Project Area Definition
13. In terms of the geographic distribution of potential Project impacts, stack emissions are arguably the most widespread. Emission dispersion modeling (described in detail in Chapter VI) utilized a 16 by 16 km grid. The highest predicted emission concentrations are all found within 3 km of the power complex, and at the boundaries of the grid predicted emission concentrations approach background concentrations. Thus, for the purposes of this assessment, the Project area is defined as a 16 by 16 km zone with the O Mon Power Complex at its center (see Figure 5, Chapter III). This has not precluded, however, the assessment of any impacts which have been identified to occur outside of this zone.

6
This page has been deliberately left blank to allow for double sided printing.

7
II. POLICY, LEGAL AND INSTITUTIONAL FRAMEWORK
A. Power Sector
1. Legal and Policy Framework 14. The Strategy for Electricity Development (Decision 176 of the Prime Minister, dated 5 October 2004) sets forth measures to create a competitive market and diversify forms of investment in the electricity sector of Viet Nam. In accordance with the Strategy, the National Assembly passed the first law governing the electricity sector, the Electricity Law, on 10 November 2004 (the law came into effect on July 1, 2005). The Electricity Law governs all entities involved in electricity activities, including planning and investment in electricity development, generation, transmission, distribution, wholesale and retail electricity sales, and the monitoring and regulation of the electricity market. It aims to stimulate development and diversify forms of investment in the electricity sector, encourage economical use of electricity, protect the country’s electricity infrastructure and develop a competitive electricity market. 15. With the passage of the Electricity Law, Viet Nam embarked on an ambitious long-term program to restructure completely its power sector by discarding its current vertically-integrated electrical utility system in favor of a competitive power market. The objective of the reform is to improve efficiency through competition in the power industry, to minimize costs to consumers, and to expand the mobilization of investment and managerial resources from outside the current, state-operated system. The Electricity Law established a new framework for the power sector, comprising:
- A planning process to select new generation investment to supply projected demand consistent with security and reliability criteria and government energy policies. The power development master planning process will continue (see below), as will the development of Provincial Power Development Plans covering distribution investments, but will be overseen by the Ministry of Industry and Trade (MOIT) rather than EVN.
- The gradual development of a competitive power market, starting with a
competitive generation market that has a single wholesaler (the Single Buyer), further developing into a wholesale competitive market, and finally the gradual development of retail competition.
- The establishment of a new regulatory agency, the Electricity Regulatory
Authority of Viet Nam (ERAV), under MOIT in 2005. ERAV’s main functions are to assist MOIT in implementing regulatory activities in the electricity sector; contribute to a market that is safe, stable, and provides a high-quality supply of electricity; support the economical and efficient consumption of electricity; and uphold equity and transparency of the sector in compliance with the law.
16. In addition to the Electricity Law, other key legislation in the electricity sector includes Decrees 105 and 106 (2005), which have to do with the implementation of the Electricity Law; the Prime Minister’s Decision 258 of 2005 which established ERAV; the Prime Minister’s Decision 26 of January 2006 which set out the roadmap for reform of the power sector; Decision 1855 of December 2007 which set out the national strategy for energy development to 2020; and Decrees 55 (2003) and 189 (2007) which established the functions, tasks, powers and organizational structure of MOIT.
17. Decision No. 1855/ QD-TTg, approved by the Prime Minister on 27 December 2008, presented a National Energy Development Strategy for the period up to 2020 with outlook to 2050, and set various energy development targets, including:
8
- Developing power plants and power networks, ensuring a sufficient supply of
electricity for socio-economic development, and ensuring the reliability of electricity supply is 99.7% in 2010. Arguably the most important policy objective in the power sector in Viet Nam is to meet the high growth in demand.
- Achieving a share of renewable energy of 3% of total power generation
capacity in 2010, 5% in 2020 and 11% in 2050, conforming to the objective set out in the national energy strategy.
- Completing the rural energy program for rural and mountainous areas.
Increasing the share of rural households using commercial energy to 50% in 2010 and 80% in 2020. By 2010, 95% of rural households are to have access to electricity.
- Changing the electricity, coal, and oil and gas sectors to operate within
competitive market mechanisms in compliance with State regulations; establishing a competitive electricity retailing market in the period after 2022; and establishing a coal and petroleum product business market by 2015.
2. Power Development Master Plans
18. The Vietnamese government relies on Power Development Master Plans (PDMPs) to advance the development of the power sector. These plans forecast growth in demand and map out the overall development of the power industry to meet that demand for a ten year period, while also providing a twenty-year overview. On July 18, 2007, the Vietnamese Prime Minister approved the Sixth Power Development Master Plan (PDMP6), covering the period 2006 – 2015, with an overview extending to 2025.6 It called for 46,000 MW of new power generation capacity by 2015 to meet the rapidly growing demand for electricity services, of which 31,000 MW would be thermal power, mostly from coal. It also called for the development of nuclear power plants and pumped-storage power plants over the medium to long term. Development of the O Mon Power Complex was one of the projects specifically identified in PDMP6. Work is currently underway on the Seventh Power Development Master Plan (PDMP7) covering the period 2010-2020 with an overview extending to 2030; it is expected to become public in 2011.
3. Power Demand
19. Viet Nam has a population of over 86 million and an annual economic growth rate exceeding 8%. Reflecting this rapid economic growth, from 1995 to 2005 power demand increased at an average annual rate of 15% and maximum power demand increased over 300% from 3,200 MW to 10,500 MW. Annual power consumption growth over the 2006-2009 period was 13.5% (Figure 1). While this trend may be affected by the recent global economic crisis, it is expected that Viet Nam’s economy will recover in 2010/11 and power demand will continue to experience rapid growth. The draft of PDMP7 envisions that with forecasted GDP growth at 7.1 – 9.8% over the 2011-2030 period, the demand for electricity will grow by 12.1% per year (low-case scenario), 13.4% per year (base-case scenario) or 16.1% per year (high-case scenario) during the 2011- 2015 period. The high growth rate in power consumption can be attributed to increasing industrial growth and increased residential use and access; for example, residential access increased from around 51% of households in 1995 to around 90% in 2005.
6 Approved by the Prime Minister in Decision No. 110/2007/QĐ-TTg dated 18/07/2007.

9
Source: Le Doan Phac and Tran Ch Thanh, 2010.
Figure 1: Annual power consumption growth rate against power generation, 2001-2009
PMDP7 Forecasted Annual Power Consumption Growth Rate %
Period
Low Base High 2011-2015 12.1 13.4 16.1 2016-2020 9.0 9.7 11.4 2021-2030 7.7 8.2 11.6
Figure 2: PDMP7 forecasted power demand in GWh for the 2011-2030 period

10
4. Power Production
20. Viet Nam’s national power system can be divided into three regional systems, North, Central and South, with the following power generation characteristics:
- the Northern region includes hydropower plants and coal-fired thermal power plants;
- the Central region includes hydropower plants; - the Southern region includes hydropower plants and oil and gas-fired thermal
power plants; and, - two North-South 500 kV transmission lines link the above systems.
21. In 2009 the total installed capacity in Viet Nam was 17,652 MW. Hydropower produced 36%, thermal power 34.9% (consisting of 10.5% from coal-fired, 3.3% from oil-fired, 18.5% from gas-fired, and 2.6% from diesel and small hydropower producers (HPPs)), and independent power producers (IPPs), build-operate-transfer (BOT) projects and importation collectively produced 29.1%.
Figure 3: Power generation by source, 2001-2009 22. Key power producers and/or players in Viet Nam include Electricity Viet Nam (EVN), Petrovietnam Power Company (PVN Power), Viet Nam National Coal and Mineral Industries Group (Vinacomin), and foreign and domestic IPPs. EVN, a state-owned monopoly established in 1994, provides the majority of electricity generation, transmission and distribution in Viet Nam; as of the end of 2009 EVN accounted for 70% of generated power, with the remainder being produced by local and foreign IPPs. EVN also controls up to 95% of the distribution and 100% of the transmission networks. EVN is under the direction of the MOIT. Both entities (MOIT and EVN) report directly to the Prime Minister whose office has final approval over power policies and development guidelines. 23. EVN has made significant progress in recent years:
- It has largely met the demand for electricity, increasing power production rapidly despite difficulties in resources.
11
- Rural electrification has been significant; the number of rural households with electricity reached 91.5% in 2006 compared with 50.7% in 1996.
- Loss of electrical energy was reduced, including commercial loss and technical loss, from 21.4% in 1995 down to 11.8% in 2005.
- EVN maintained a continuously profitable operation in spite of the retail price of electricity being fixed at a below market level.
24. Despite EVNs achievements, growth in demand has eroded reserve margins to the point where power shortages leading to rotating blackouts have been an intermittent problem since 2005, and the country’s power system frequently experiences even lower reserves during the dry season when hydropower plants output can be reduced to between 40-50% of rated output. In recent years supply shortages become more visible though the gap between production and demand narrowed in late 2008 and early 2009 as the demand growth reduced due to the global financial crisis. In 2010 as a result of low rainfalls, water levels at some reservoirs fell to 60% of the average in previous years, reducing hydroelectric power generation even further, especially in the south.7 Continued power shortages are expected during the 2011-2015 period if adequate measures are not taken to increase the power supply accordingly. 25. The main reason for shortages is that that the power system does not have a 25% system reserve margin - a widely accepted norm in the industry to achieve security of supply and end periodic shortages - as new power plants were not put into operation in accordance with the schedule in PDMP6. According to the draft PDMP7, it is estimated that an additional capacity of 4,100 MW will be required per year on average during this period to meet rapidly growing demand, and Viet Nam will require the development of some 30,000 MW of power generation between 2008 and 2015. This additional capacity is necessary to support Viet Nam’s overall economic growth and poverty reduction targets.
5. O Mon IV
26. O Mon IV was initially presented in Power Development Master Plan 5 (PDMDP5)8, and as noted above, development of the O Mon Power Complex was one of the projects specifically identified in PDMP6 to meet Viet Nam’s growing power demand. In addition, the legal framework for the development of O Mon IV includes:
- Decision No.41/QĐ-BCN dated 06/01/2006 of the Ministry of Industry with respect to the approval of the O Mon Power Complex.
- Decision No.390/QĐ-EVN-HĐQT dated 26/06/2006 approving investment for the
O Mon IV Thermal Power Plant. 27. The General Plan of the O Mon Power Complex carried out by the Power Engineering Consulting Company No. 2 (PECC2) was approved by the Ministry of Industry (Decision No. 2523/QĐ/NLDK dated September 27, 2004). The Plan was updated in 2006 (the Revised General Plan of O Mon Power Complex, approved by MOIT in Decision No.41/QĐ-BCN dated 06/01/2006) and again in 2008 (the revised General Plan of O Mon Power Complex, approved by MOIT in Decision No.7580/BCN-NL dated 27/08/2008). 28. The construction and operation of the O Mon IV power plant will have an important role in supplying power to meet national socio-economic development goals, especially in
7 Interview with Vu Huy Hoang, Minster, Ministry of Industry and Trade, May 30, 2010, in VietnamNet
(http://english.vietnamnet.vn/reports/). 8 In PDMD5 O Mon IV is referred to as O Mon II.

12
the south of Viet Nam, and will improve reliability and stability of the national power system during the period 2015 to 2025. B. Environmental Impact Assessment
1. Viet Nam’s Legal Framework
29. This EIA has been prepared consistent with the legal framework for environmental management and environmental impact assessment in Viet Nam, as summarized below:
Constitution - The 1992 Constitution of the Vietnamese Socialist Republic requires that state-
owned enterprises, governmental agencies, cooperatives and national defense units must ensure wise use of national natural resources and environmental preservation.
Relevant Laws - The Law on Environmental Protection (LEP) was ratified by Viet Nam National
Assembly in November 29, 2005, promulgated under Order No. 29/2005/L/CTN of December 12, 2005 of the State President, and came into effect on July 1, 2006. The LEP provides for environmental protection; policies, measures and resources for environmental protection and for the rights and obligations of organizations, households and individuals for environmental protection. The LEP applies to State agencies, organizations, households, individuals, Vietnamese citizens living in foreign countries, and foreign organizations and individuals that operate within the territory of the Socialist Republic of Viet Nam.
- The Law on Water Resources, approved by the National Assembly of Viet Nam
on 20/05/1998, and which came into force in January 1999.
- The Biodiversity Law No. 20/2008/QH12, which came into effect on July 1, 2009, and which stipulates biodiversity conservation and sustainable development.
Relevant Decrees and Circulars
- Decree No. 91/2002/NĐ-CP issued on Nov. 11th
, 2002 by the Government on regulating functions, responsibility, power and organizing the structure of the MONRE;
- Decree 67/2003/NĐ – CP dated 13/6/2003 by the Government on environmental
protection fees imposed on wastewater; - Decree 149/2004/NĐ-CP dated 27/07/2004 by the Government regulating the
probing, extraction and use of water resources, and discharge of wastewater to water sources;
- Decree 80/2006/NĐ-CP dated 09/08/2006 by the Government regulating in
details and providing guidelines for implementation of a number of provisions in the LEP;
- Decree 81/2006/NĐ-CP dated 09/08/2006 by the Government on administrative
sanctions in environmental protection practice;

13
- Decree 04/2007/NĐ-CP dated 08/01/2007 by the Government on amending and supplementing a number of articles of Decree 67/2003/NĐ-CP dated 13/06/2003 by the Government on environmental protection fees imposed on wastewater;
- Decree 59/2007/NĐ-CP dated 09/04/2007 by the Government on solid waste
management; - Decree 88/2007/NĐ-CP dated 28/05/2007 on drainage for urban areas and
industrial areas; - Decree 21/2008/NĐ-CP dated 28/02/2008 by the Government on amending and
supplementing a number of articles in the Decree 80/2006/NĐ-CP dated 09/08/2006 by the Government regulating details and providing guidelines for implementation of a number of provisions in the LEP;
- Decree 29/2008/NĐ-CP dated 14/03/2008 by the Government on regulations for
industrial parks, export-processing zones and economic zones; - Circular 125/2003/TTLT-BTC-BTNMT dated 18/12/2003 by the Minister of
MONRE guiding implementation of the Decree 67/2003/NĐ-CP by the Government on environmental protection fees imposed on wastewater;
- Circular 02/2005/TT-BTNMT dated 24/06/2005 by the MONRE guiding
implementation of Decree 149/2004/NĐ-CP dated 27/07/2004 by the Government regulating the probing, extraction and use of water resource, and discharge of wastewater to water sources;
- Circular 08/2006/TT-BTNMT dated 08/09/2006 by the MONRE guiding the
preparation of strategic environmental assessment, environmental impact assessments, and commitments for environmental protection;9
- Circular 12/2006/TT-BTNMT dated 26/12/2006 by MONRE explaining conditions
to run businesses, procedures to prepare application forms for business licenses, and codes for management of hazardous wastes;
- Circular No. 05/2008/TT-BTNMT guiding strategic environmental assessment,
environmental impact assessment and environmental protection commitment. This Circular repeals Circular No. 08/2006/TT-BTNMT of 9 September 2006, guiding strategic environmental assessment, environmental impact assessment and environmental protection commitments;
- Decision 152/1999/QĐ-TTg dated 10/07/1999 by the Prime Minister approving
the Strategy for Solid Waste Management for urban and industrial areas of Viet Nam by 2020;
- Decision No. 13/2006/QD-BTNMT, September 08, 2006, of the Ministry of Natural
Resources and Environment, regarding stipulation of organizations and operation of the assessment board for reports on Strategic Environmental Assessment (SEA) and EIA.
- Decision 22/2006/QĐ-BTNMT dated 18/12/2006 by the Minister of MONRE
enforcing the use of Vietnamese Standards on Environment;
9 This has been replaced by Circular 05/2008/TT-BTNMT dated 08 December 2008.
14
- Decision 23/2006/QĐ-BTNMT dated 26/12/2006 by the Minister of MONRE on the list of hazardous wastes;
- Decision No. 1281/QĐ-BTNMT issued on Aug 27th, 2007 by MONRE on
authorizing Director of Departments to review and sign approvals for Environmental Impact Assessment reports.
2. EIA and Thermal Power Production in Viet Nam
30. Under the LEP an EIA was required for the O Mon IV Project. Specifically, Appendix I of Decree 80/2006/NĐ-CP lists projects for which an EIA must be prepared, including thermo-electric projects with a “capacity from 500 MW or more”. As noted in Chapter I, this report is based in part on a review and revision of the existing EIA report prepared for the O Mon IV Project by the Power Engineering Consulting Company No. 3 (PECC3) of Electricity Viet Nam (EVN) in 2007. 31. Appendix II of the LEP lists inter-sectoral and inter-provincial projects where the responsibility for the appraisal and approval of EIA reports rests with MONRE, including “Projects of thermo-electric station with capacity from 300 MW to 500 MW with location far away from residential areas less than 2 km; other thermo-electric station projects with capacity from 500 MW or more.” As required by Appendix II, the O Mon IV EIA report prepared by PECC3 was reviewed and approved by MONRE.
3. ADB’s Environmental Assessment Requirements 32. This EIA has also been prepared in accordance with the ADB’s Safeguard Policy Statement (SPS) governing the environmental and social safeguards of ADB's operations. Environmental Safeguard Requirements 1 (SR1) of the SPS outlines the requirements that borrowers/clients are required to meet when delivering environmental safeguards for projects supported by the ADB. These requirements include assessing impacts, planning and managing impact mitigations, preparing environmental assessment reports, disclosing information and undertaking consultation, establishing a grievance mechanism, and monitoring and reporting. SR1 also includes specific environmental safeguard requirements pertaining to biodiversity conservation and sustainable management of natural resources, pollution prevention and abatement, occupational and community health and safety, and conservation of physical cultural resources.
4. Environmental Standards
a. Vietnamese Environmental Standards
33. Many (but not all) of the Vietnamese “TCVN” environmental standards first developed in the mid-1990s have been replaced by “QCVN” environmental technical regulations as per Decision No. 04/2008/QD-BTNMT dated 18/07/2008 and Decision No. 16/2008/QD-BTNMT dated 31/12/2008 by the Minister of MONRE on issuing environmental technical regulations. In general, relevant standards and regulations include:
Noise - TCVN 3985: 1985 – Limiting the maximum noise level in working area. - TCVN 5949: 1998 - Limiting the maximum noise level for public and residential
areas.
- TCVN 6962:2001 - Allowable Vibration Limits In Constructive And Industrial Production For Surrounding Environment.

15
Air Quality
- QCVN 05:2009/BTNMT - The National Technical Regulation on hazardous
substances in ambient air quality (replaced TCVN 5937: 2005 – Air Quality – Standards for Quality of Ambient Air).
- QCVN 06:2009/BTNMT - The National Technical Regulation on hazardous
substances in ambient air (replaced TCVN 5938: 2005 - Air Quality – Permitted maximum level of a number of toxic and hazardous substances in surrounding air).
- QCVN 07: 2009/BTNMT – The National Technical Regulation on Hazardous
Waste Thresholds. - QCVN 19: 2009/BTNMT - (replaced TCVN 5939: 2005 - Air Quality – industrial
production emission gas standards for dusts and inorganic substances).
- QCVN 20: 2009/BTNMT - The National Technical Regulation on industrial emission of organic substances (replaced TCVN 5940: 2005 - Air Quality – industrial production emission gas standards for a number of organic substances).
- QCVN 22: 2009/BTNMT - The National Technical Regulation on emissions of
thermal power industry (replaced TCVN 7440:2005 - emissions standards for thermal power industry).
Soil - QCVN 03/2008/TNMT - The National Technical Regulation on heavy metals in
soil. Water and Wastewater - QCVN 08/2008/TNMT - The National Technical Regulation on surface water
quality. - QCVN 09/2008/TNMT - The National Technical Regulation on ground water
quality. - QCVN 10/2008/TNMT - The National Technical Regulation on coastal water
quality. - QCVN 14/2008/TNMT - The National Technical Regulation on domestic
wastewater.
- QCVN 24/2009/TNMT - The National Technical Regulation on industrial wastewater.
Hazardous Waste
- QCVN 07: 2009/BTNMT - The National Technical Regulation on hazardous
waste thresholds.

16
b. ADB Policy on Environmental Standards
34. During the design, construction, and operation of a project the SPS requires the borrower to follow environmental standards consistent with international good practice, as reflected in internationally recognized standards such as the World Bank Group’s Environment, Health and Safety Guidelines (hereafter referred to as the EHS Guidelines).10 These standards contain performance levels and measures that are normally acceptable and applicable to projects. When host country regulations differ from these levels and measures, the borrower/client is to achieve whichever is more stringent. If less stringent levels or measures are appropriate in view of specific project circumstances, the borrower/client is required to provide full and detailed justification for any proposed alternatives.
c. Key Guidelines and Standards Utilized in the O Mon IV Environmental Assessment
i. Ambient Air Quality
35. QCVN 05:2009/BTNMT (the National Technical Regulation on hazardous substances in ambient air quality) presents the current Vietnamese ambient air quality standards. The EHS Guidelines state that emissions should not result in pollutant concentrations that reach or exceed relevant national ambient quality guidelines, or in their absence the current WHO Air Quality Guidelines. Table 1 presents a comparison between the Vietnamese ambient air quality standards and the WHO Air Quality Guidelines. The Vietnamese standards are consistent with the WHO Guidelines, and are used in this assessment. 36. In addition, according to the EHS Guidelines, emissions should not contribute a significant portion to the attainment of relevant ambient air quality guidelines or standards. As a general rule, the EHS Guidelines suggests 25% of the applicable air quality standards to allow additional, future sustainable development in the same airshed.
ii. Air Emissions
37. QCVN 22: 2009/BTNMT (the National Technical Regulation on emissions of thermal power industry) presents the current Vietnamese standards on maximum allowable air emissions (NOx, SO
2 and dust) for thermal power plants. Table 2 presents a comparison
between the Vietnamese standards and EHS Guidelines. As the EHS Guidelines are more stringent for NOx emissions they are used in this study. As there are no applicable EHS Guidelines for SO2, CO and dust (PM10), the Vietnamese standards are used.
10
World Bank Group, 2007. Environmental, Health, and Safety General Guidelines. Washington, DC. The EHS Guidelines contain discharge effluent, air emissions, and other numerical guidelines and performance indicators as well as prevention and control approaches that are normally acceptable to ADB and are generally considered to be achievable at reasonable costs by existing technology. The EHS Guidelines for thermal power plants are available at: http://www.ifc.org/ifcext/sustainability.nsf/Content/EHSGuidelines.

17
Table 1: Relevant Vietnamese and EHS ambient air pollution standards and guidelines
Parameter Standard Maximum 1 hour
Average (µg/Nm
3)
Maximum 8 hour
Average (µg/Nm
3)
Maximum 24 hour average
(µg/Nm3)
Maximum Annual average (µg/Nm
3)
Comparison of Vietnamese
Standards and EHS
Guidelines
QCVN 05:2009/BTNMT
200
- 100 40
NOx EHS Guideline
11 200 - - 40
Vietnamese standards are consistent with EHS Guidelines
QCVN 05:2009/BTNMT
350 125
50
SO2
EHS Guideline - - 125 (Interim target-1)
50 (Interim target-2)
20 (guideline)
- Vietnamese 24 hr standard meets EHS Guidelines interim target 1
QCVN 05:2009/BTNMT
300 200
140 Dust (TSP)
EHS Guideline - - - -
Not Applicable (No EHS Guideline)
QCVN 05:2009/BTNMT
- - 150
50
PM10
EHS Guideline 150 (Interim target-1)
100 (Interim target-2)
75 (Interim target-3)
50 (guideline)
70 (Interim target-1)
12
50 (Interim target-2)
30 (Interim target-3)
20 (guideline)
24 hour Vietnamese standards meets EHS interim target 1. Annual Vietnamese standard meets EHS interim target 2.
QCVN 05:2009/BTNMT
30,000 5,000 Maximum 1 hr Vietnamese standard meets EHS Guidelines.
CO
EHS Guideline 30,000 10,000
11
Based on World Health Organization (WHO). Air Quality Guidelines Global Update, 2005. PM10 24-hour value is the 99th percentile.
12
Interim targets are provided in the EHS Guidelines in the recognition of the need for a staged approach to achieving the recommended guidelines.

18
Table 2: Relevant Vietnamese and EHS thermal power plant emission standards and guidelines
Parameter Standard Fuel Oil Natural Gas Comparison of Vietnamese Standards and EHS
Guidelines
QCVN 22: 2009/BTNMT
13
420 (600)
175 (250) NOx
EHS Guideline 15214
51
EHS Guidelines are more stringent
QCVN 22: 2009/BTNMT
294 (500) 210 (300) SO2
EHS Guideline - -
Not Applicable (No EHS Guideline)
QCVN 19:2009/BTNMT
15
800 (1000 800 (1000) CO
EHS Guideline
Not Applicable (No EHS Guideline)
QCVN 22: 2009/BTNMT
126 (150) 42 (50) Dust (TSP)
EHS Guideline - -
Not Applicable (No EHS Guideline)
iii. Noise and Vibration
38. TCVN 5949: 1998 (limiting the maximum noise level for public and residential areas) present the current Vietnamese standards on maximum allowable noise. Table 3 provides a comparison between the Vietnamese standards and EHS Guidelines. For daytime the Vietnamese standards and EHS guidelines are equivalent; for nighttime the Vietnamese standards are 20 dBA lower. Since the Project will operate 24 hours a day, in practice the nighttime standard will be the limiting level. Consequently, the noise levels at the border of the O Mon Thermal Power Complex site will have to ≤ 70 dBA from 06:00 to 22:00, and ≤ 50 dBA from 22:00-06:00.
13
For NOx, SO2 and dust the first number is Cmax (calculated standards based on scale and location of plant), and the second number in brackets is C (the maximum permissible value).
Cmax = C x Kp x Kv, where:
- Cmax = the permissible maximum concentration of pollutants in thermal power plant gas emissions into ambient air, in milligrams per cubic meter at standardized conditions (mg/Nm3)
- C = the maximum permissible value of pollutant - Kp = the power factor of the thermal plant - Kv = the zoning factor of the region where the thermal power plant is developed
Cmax for O Mon IV is based on Kp = 0.7 (as plant capacity is greater than 600 MW) and Kv = 1 as the project is located within the O Mon Power Complex in an industrial area.
14
Guideline limits applies to facilities operating more than 500 hours per year. O Mon IV is expected to operate on fuel oil less than 120 hours per year; therefore this guideline is not applicable.
15
As there is no standard for CO in QCVN 22: 2009/BTNMT, the emission standard is based QCVN 19:2009/BTNMT (the National Technical Regulation on industrial emission of inorganic substances and dusts). The first number is Cmax (calculated standards based on exhaust flow rate and location of plant), and the second number in brackets is C (the maximum permissible value).
Cmax = C x Kp x Kv, where:
- Cmax = the permissible maximum concentration of pollutants in milligrams per cubic meter of emissions at standardized conditions (mg/Nm3)
- C = the maximum permissible value of pollutant - Kp = exhaust flow coefficient - Kv = the zoning factor of the region where the pollutants is released
C max for O Mon IV is based on Kp = .8, Kv = 1 and C = 1000.
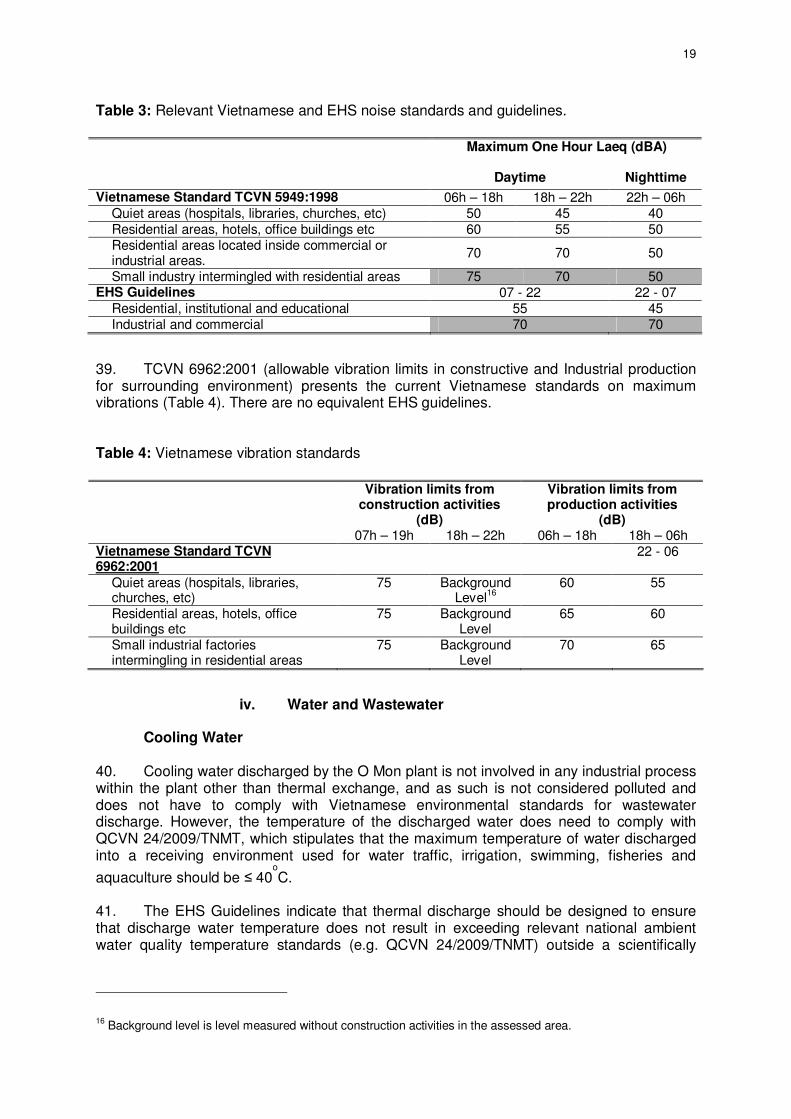
19
Table 3: Relevant Vietnamese and EHS noise standards and guidelines.
Maximum One Hour Laeq (dBA)
Daytime Nighttime
Vietnamese Standard TCVN 5949:1998 06h – 18h 18h – 22h 22h – 06h Quiet areas (hospitals, libraries, churches, etc) 50 45 40 Residential areas, hotels, office buildings etc 60 55 50 Residential areas located inside commercial or industrial areas.
70 70 50
Small industry intermingled with residential areas 75 70 50 EHS Guidelines 07 - 22 22 - 07
Residential, institutional and educational 55 45 Industrial and commercial 70 70
39. TCVN 6962:2001 (allowable vibration limits in constructive and Industrial production for surrounding environment) presents the current Vietnamese standards on maximum vibrations (Table 4). There are no equivalent EHS guidelines. Table 4: Vietnamese vibration standards
Vibration limits from construction activities
(dB)
Vibration limits from production activities
(dB) 07h – 19h 18h – 22h 06h – 18h 18h – 06h Vietnamese Standard TCVN 6962:2001
22 - 06
Quiet areas (hospitals, libraries, churches, etc)
75 Background Level
16
60 55
Residential areas, hotels, office buildings etc
75 Background Level
65 60
Small industrial factories intermingling in residential areas
75 Background Level
70 65
iv. Water and Wastewater
Cooling Water 40. Cooling water discharged by the O Mon plant is not involved in any industrial process within the plant other than thermal exchange, and as such is not considered polluted and does not have to comply with Vietnamese environmental standards for wastewater discharge. However, the temperature of the discharged water does need to comply with QCVN 24/2009/TNMT, which stipulates that the maximum temperature of water discharged into a receiving environment used for water traffic, irrigation, swimming, fisheries and
aquaculture should be ≤ 40o
C. 41. The EHS Guidelines indicate that thermal discharge should be designed to ensure that discharge water temperature does not result in exceeding relevant national ambient water quality temperature standards (e.g. QCVN 24/2009/TNMT) outside a scientifically
16
Background level is level measured without construction activities in the assessed area.

20
established mixing zone.17 In addition, the Guidelines state that thermal discharges should be designed to prevent negative impacts to the receiving water taking into account the following criteria:
- The elevated temperature areas because of thermal discharge from the project should not impair the integrity of the water body as a whole or endanger sensitive areas (such as recreational areas, breeding grounds, or areas with sensitive biota).
- There should be no lethality or significant impact to breeding and feeding
habits of organisms passing through the elevated temperature areas. - There should be no significant risk to human health or the environment due to
the elevated temperature or residual levels of water treatment chemicals. 42. Defining the extent of the mixing zone is critical because in addition to satisfying the ecological criteria above, the discharge must not violate water quality guidelines outside the mixing zone. To establish its boundaries for the O Mon facility, documents from the US Environmental Protection Agency (USEPA) were consulted in absence of a specific methodology in the EHS Guidelines for defining the mixing zone. 43. Regulatory mixing zone limits for thermal discharges in rivers among US states (EPA 1980) are of three types. In the first type, no numerical limits are imposed. The mixing zone is defined on a case-by-case basis depending on the location, the condition of the receiving waters and the characteristics of the discharge. Nearly all states with mixing zone guidelines apply this rule. 44. In the second type, a limit is imposed based on the cross-sectional area of the channel. The majority of states that have this guideline limits the mixing zone to 25% of the cross-sectional area, leaving the rest as a “zone of passage” for swimming and drifting organisms. A minority sets a larger limit of one-third or one-half of the cross-sectional area, which is determined during lowest low tide conditions. 45. The third type used by many states also place a limit on the extent of non-compliance based on the size of the river. Under this rule, the dimensions of the mixing zone are equal to either one-third or one-half of the width of the channel measured at the discharge location. The dimensions of the mixing zone are measured from the mouth of the discharge. 46. Taking the more stringent of the methods outlined, the vertical extent of the mixing zone for the O Mon facility is proposed to be defined as the area covering 25% of the cross section of the river. The horizontal extent is defined as the area within one-third the width of the Hau River from the two discharge points. The actual dimensions are be defined in the impact assessment section, and are used as the basis for evaluating the acceptability of the size of the thermal plume. 47. It should be reiterated that even if water quality criteria are not applied inside this mixing zone, the ecological criteria cited earlier must still be complied with within the zone.
17
According to the EHS Guidelines, the mixing zone is typically defined as the zone where initial dilution of a discharge takes place within which relevant water quality temperature standards are allowed to be exceeded taking into account cumulative impact of seasonal variations, ambient water quality, receiving water use, potential receptors and assimilative capacity among other considerations. Establishment of such a mixing zone is project specific.

21
Wastewater
48. Table 5 presents a comparison between the current Vietnamese standards and EHS Guidelines. In general the Vietnamese standards are equal to or more stringent than the EHS Guidelines, with the exception of suspended solids and zinc.
Surface Water Quality
49. Table 6 presents the current Vietnamese surface water quality standards. There are no corresponding EHS Guidelines.
5. Occupational Health and Safety Standards 50. Relevant Vietnamese occupational health and safety standards include:
- Ministry of Labor, Invalids and Social Affairs Circular No 37/2005/TT-BLDTBXH. Guidelines for occupational safety and health training.
- Government Decree No 68/2005/ND-CP. On chemical safety. - LDVN, Ministry of Labor, Invalids and Social Affairs, Ministry of Health, VGCL
Joint Circular No 14/2005/TTLT/BLDTBXH-BYT-TLDLDVN. Guidelines for declaration, investigation, report, recording statistics and periodic report on occupational accidents.
- Ministry of Health Circular No 13/BYT-TT. Giving instructions for the
administration of occupational health, employee's health and occupational diseases.
- Ministry of Labor, Invalids and Social Affairs Circular No. 04/2008/TT-BLDTBXH
dated February 27, 2008. Regulating and providing guidance on application and appraisal procedures of machinery, equipment, materials, and substances with strict occupational safety, hygiene and health requirements.
- Government Decree No 110/2002/ND-CP. On amending and supplementing
some articles of the Governmental Decree No 06/CP dated 20 January 1995, regulating in details some articles of the Labor Code on Labor Safety and Hygiene.
- Ministry of Labor, Invalids and Social Affairs Circular No 10/2003/TT- BLDTBXH.
Instructing the implementation of compensation to the victims of occupational accidents and diseases.
- Ministry of Labor, Invalids and Social Affairs Circular No 16/LDTBXH-TT. Guiding
the reduction of daily working hours for employees engaged in extremely hard, harmful or dangerous work.
- Ministry of Health and Ministry of Labor, Invalids and Social Affairs Joint Circular
No 08/1998/TTLT-BYT-BLDTBXH. Providing guidance on the implementation of the provisions on occupational diseases.
- Ministry of Labor, Invalids and Social Affairs Circular No 10/1998/TT-BLDTBXH.
Giving instructions for personal protective equipment.
22
- Ministry of Labor, Invalids and Social Affairs Guidance on procedures for registration and verification of machines, equipment and materials subject to strict occupational safety requirements.
- Ministry of Labor, Invalids and Social Affairs and Ministry of Health Amending and
supplementing Point 2, Item II of the Joint Circular No. 10/1999 guiding the implementation of the regime of allowances in kind to employees exposed to dangerous and hazardous working conditions.
- Ministry and Labor, Invalids and Social Affairs, Ministry of Public Security,
People's Supreme Procuracy12/01/2007. Guidance on the coordination to settle occupational accidents causing deaths, occupational accidents with criminal signs.
- Government Directive 10 /2008/CT-TTg. On strengthening the implementation of
labor protection, occupational safety.

23
Table 5: Relevant Vietnamese standards (QCVN 24/2009/TNMT) and EHS guidelines for discharge of industrial wastewater to the aquatic environment
C EHS
Guideline No. Parameter Unit
A18
B
1 Temperature 0C 40 40
2 pH - 6-9 5.5-9 6-9 3 Odor - No
Discomfort No
Discomfort
4 Color (Co-Pt at pH = 7) - 26 (20) 70 5 BOD5 (20
0C) mg/l 40 (30) 50
6 COD mg/l 66 (50) 100 7 Suspended solids mg/l 66 (50) 100 50 8 Arsenic mg/l 0.07 (0.05) 0.1 0.5 9 Mercury mg/l 0.007
(0.005) 0.01 0.005
10 Lead mg/l 0.1 (0.1) 0.5 0.5 11 Cadmium mg/l 0.007
(0.005) 0.01 0.1
12 Hexavalent chromium (VI) mg/l 0.07 (0.05) 0.1 13 Trivalent chromium (III) mg/l 0.3 (0.2) 1 14 Copper mg/l 3 (2) 2 0.5 15 Zinc mg/l 4 (3) 3 1.0 16 Nickel mg/l 0.3 (0.2) 0.5 17 Manganese mg/l 0.7 (0.5) 1 18 Iron mg/l 1 (1) 5 1.0 19 Tin mg/l 0.3 (0.2) 1 20 Cyanide mg/l 0.09 (0.07) 0.1 21 Carbolic acid mg/l 0.1 (0.1) 0.5 22 Grease mg/l 7 (5) 5 23 Oil and grease mg/l 13 (10) 20 10 24 Residual chlorine mg/l 1 (1) 2 0.2 25 PCB mg/l 0.004
(0.003) 0.01
26 Organic phosphorous pesticide
mg/l 0.4 (0.3) 1
27 Organic chloride pesticide mg/l 0.1 (0.1) 0.1 28 Sulphur mg/l 0.3 (0.2) 0.5 29 Fluoride mg/l 7 (5) 10 30 Chloride mg/l 660 (500) 600 31 Ammonia Nitrogen mg/l 7 (5) 10 32 Total Nitrogen mg/l 20 (15) 30 33 Total Phosphorous mg/l 5 (4) 6 34 Coliform MPN/100m
l 4000 (3000) 5000
35 Total α radiation Bq/l 0.1 (0.1) 0.1 36 Total β radiation Bq/l 1.3 (1.0) 1.0
18
Column A applies to O Mon IV. The initial figure in Column A is Cmax, the standard specific to O Mon IV, where Cmax = C x Kq x Kf, and Kq = 1.2, and Kf =1.1.

24
Table 6: Vietnamese surface water standards (QCVN08:2008/BTNMT).
Limit19
A B No Parameter Unit
A1 A2 B1 B2
1 pH 6-8,5 6-8,5 5,5-9 5,5-9 2 DO mg/l ≥ 6 ≥ 5 ≥ 4 ≥ 2 3 TSS mg/l 20 30 50 100 4 COD mg/l 10 15 30 50 5 BOD5 (20
0C) mg/l 4 6 15 25
6 Ammonia (NH4) as N mg/l 0,1 0,2 0,5 1 7 Chlorine (Cl) mg/l 250 400 600 - 8 Fluoride (F) mg/l 1 1,5 1,5 2 9 Nitrite (NO2) as N mg/l 0,01 0,02 0,04 0,05
10 Nitrate (NO3) as N mg/l 2 5 10 15 11 Phosphate (PO4) as P mg/l 0,1 0,2 0,3 0,5 12 Cyanide (CN) mg/l 0,005 0,01 0,02 0,02 13 Arsenic (As) mg/l 0,01 0,02 0,05 0,1 14 Cadmium (Cd) mg/l 0,005 0,005 0,01 0,01 15 Lead (Pb) mg/l 0,02 0,02 0,05 0,05 16 Chromium III (Cr
3) mg/l 0,05 0,1 0,5 1
17 Chromium VI (Cr6) mg/l 0,01 0,02 0,04 0,05
18 Copper (Cu) mg/l 0,1 0,2 0,5 1 19 Zinc (Zn) mg/l 0,5 1,0 1,5 2 20 Nickel (Ni) mg/l 0,1 0,1 0,1 0,1 21 Iron (Fe) mg/l 0,5 1 1,5 2 22 Mercury (Hg) mg/l 0,001 0,001 0,001 0,002 23 Surfactants mg/l 0,1 0,2 0,4 0,5 24 Oils & Grease mg/l 0,01 0,02 0,1 0,3 25 Phenol (total) mg/l 0,005 0,005 0,01 0,02 26 Chlorinated organic pesticides
Aldrin + Dieldrin Endrin BHC DDT Endosunfan(Thiodan) Lindan Chlordane Heptachlor
µg/l µg/l µg/l µg/l µg/l µg/l µg/l µg/l
0,002 0,01 0,05
0,001 0,005 0,3 0,01 0,01
0,004 0,012 0,1
0,002 0,01 0,35 0,02 0,02
0,008 0,014 0,13 0,004 0,01 0,38 0,02 0,02
0,01 0,02 0,015 0,005 0,02 0,4
0,03 0,05
27 Organophosphate pesticides Paration Malation
µg/l µg/l
0,1 0,1
0,2
0,32
0,4
0,32
0,5 0,4
28 Herbicides 2,4D 2,4,5T Paraquat
µg/l µg/l µg/l
100 80 900
200 100 1200
450 160 1800
500 200 2000
29 Total Radiation α Bq/l 0,1 0,1 0,1 0,1
30 Total Radiation β Bq/l 1,0 1,0 1,0 1,0
31 E. coli MPN/ 100ml 20 50 100 200 32 Coliform MPN/ 100ml 2500 5000 7500 10000
19 The classification of surface water is based on use: A1: For residential use without treatment. A2: For residential use with appropriate treatment, and preservation of aquatic life. B1: For irrigation or other purposes requiring similar water quality. B2: For water transport and other purposes requiring low water quality.
For the purposes of the O Mon IV Project it is understood that column A2 applies.

25
III. DESCRIPTION OF THE PROJECT
A. Type of Project
51. The O Mon IV Thermal Power Project (the Project) is a proposed 750 megawatt (MW) combined cycle gas turbine (CCGT) thermal power generation plant utilizing F class gas turbines, dry low NOx (DLN) combustors, a 2-2-1 configuration, natural gas from the B&52 offshore gas field, and flow through cooling from the Hau River.20 52. A CCGT power plant utilizes a combination of gas and steam turbine generators. In the gas turbine air is compressed and passed into a combustion chamber where the natural gas fuel is burned to produce high pressure hot combustion gases. This thermal and pressure energy is converted into mechanical energy by expanding the combustion gas through the gas turbine, which in turn drives a power turbine and air compressor. The power turbine is connected to a generator which produces electrical power. The hot exhaust gases from the gas turbine are passed to an unfired boiler (usually referred to as a heat recovery steam generator or HRSG) to produce steam, and the exhaust gas from the HRSG is discharged into atmosphere through an exhaust stack at a much lower temperature than when it left the gas turbine. The steam produced in the HRSG is in turn passed through a steam turbine to drive another generator to produce more electrical power. The low pressure exhaust steam from the steam turbine is condensed using cooling water and passed though a de-aerator where low pressure steam is used to remove any air dissolved in the steam condensate that might cause corrosion in the steam circuit. The deaerated condensate is returned to the HRSG to generate more steam, completing the steam cycle. 53. Combined cycle configuration describes the particular combination of gas turbine generators, HRSGs, and steam turbine generators within a power plant. The Project will have a 2-2-1 configuration, meaning that it will have 2 gas turbines, 2 HRSGs, and 1 steam turbine. 54. The Project is one of four power plants planned for the O Mon Thermal Power Complex, namely O Mon I to IV. O Mon I will have a capacity of 660 MW while O Mon II, III and IV will each have a capacity of 750 MW, giving the complex a planned total installed capacity of 2,910 MW. There is room available for a fifth power plant (O Mon V), whose construction plan has been accepted by MOIT and submitted for the Prime Minister’s approval. B. Need for the Project
55. Viet Nam has recorded a GDP growth rate of approximately 8% in recent years. Reflecting this rapid economic growth, from 1995 to 2005 power demand increased at an average annual rate of 15% and maximum power demand increased over 300% from 3,200 MW to 10,500 MW. In 2009 peak demand reached 15,000 MW, and the Sixth National Power Development Master Plan (PDMP6) projects a 17% annual increase in power demand up till 2015.21,22 While this trend may be affected by the recent global economic crisis, it is expected that Viet Nam’s economy will recover in 2010/11 and power demand will
20
F class turbine technology was initially designed in the 1980s; it represented a significant leap in the operating temperatures, cooling technology and aerothermal performance of heavy-duty gas turbines. F class gas turbines represent the majority of units operating in the U.S. today.
21
PDMP6 was approved by the Prime Minister on July 18, 2007 (No. 110/2007/QD-TTg) for the 2006-2015 period, with extended reach to 2025.
22
This prediction is supported by Dao Hong Thai, Director, Ha Noi Energy Conservation Centre, who in 2009 reported that actual demand for energy is increasing by up to 20 per cent per year.

26
continue to experience rapid growth. However, Viet Nam’s electricity infrastructure is underdeveloped, and the growth in demand is severely straining the country’s limited generating capacity. Rotating blackouts are common, especially in the dry season when power production from hydroelectric facilities, which provide the majority of the Viet Nam’s power generation, is reduced. In 2010 as a result of low rainfalls, water levels at some reservoirs fell to 50 – 60% of the average in previous years, reducing hydroelectric power generation even further, especially in the south.23 In order to meet demand Viet Nam will require the development of some 30,000 MW of power generation between 2008 and 2015. However, many investment projects identified in PDMP6 to meet the demand have fallen behind schedule, further straining the unstable power demand-supply balance. 56. The O Mon Power Complex is one of the priority projects identified in PDMP6 to address electricity shortages. When completed it is anticipated that the O Mon IV Project will play an important role in providing the power supply necessary to meet socio-economic development goals, especially in the southern parts of Viet Nam. It will also improve the reliability and stability of the overall national power system; increase the proportion of thermal power in comparison with hydroelectric power, thereby reducing shortages of power in the dry season; and contribute to reducing the cost and negative environmental impacts of power production through the use of high efficiency CCGT technology. C. Responsible Agencies
57. The Government of Viet Nam (GOV) will be the Project borrower, and will then on-lend the loan proceeds to EVN.24 EVN will be the executing agency, and have tasked the Can Tho Thermal Power Company (CTTP) to be the implementing agency and to manage the Project construction and operation. Power Engineering Consulting Company No. 3 (PECC3), a subsidiary of EVN, is the design consultant. Additional information on the Project owner, implementing agency and design consultant are provided below:
Executing Agency: Viet Nam Electricity (EVN) Address: 18 Tran Nguyen Han Street, Ha Noi, Viet Nam Main Contact: Mr. Dinh Quang Tri, Vice President Website: www.evn.com.vn Implementing Agency: Can Tho Thermal Power Company (CTTP) Address: No.1 Le Hong Phong Street, Tra Noc Ward, Binh
Thuy District, Can Tho City, Viet Nam Main Contact: Mr. Truong Hoang Vu, Deputy Director General Website: www.canthopower.vn Design Consultant: Power Engineering Consulting Company No. 3
(PECC3) Address: 32 Ngo Thoi Nhiem Street, District 3, Ho Chi Minh
City, Viet Nam Main Contact: Mr. Nguyen Ngoc Ke, Director Website : www.pecc3.com.vn
23
Interview with Vu Huy Hoang, Minster, Ministry of Industry and Trade, May 30, 2010, in VietnamNet (http://english.vietnamnet.vn/reports/).
24
For KfW, EVN will be the borrower, and the GOV will provide a state guarantee.

27
D. Location and Access
58. The O Mon IV Power Complex is located on a small island on the right (south) bank of the Hau River, in the Thoi An and Phuoc Thoi wards of the O Mon District of Can Tho City, Viet Nam (Figure 4 and Figure 5).25 The complex is approximately 18 km northwest of Can Tho City and 130 km straight-line distance southwest of Ho Chi Minh City (approximately 170 km by road). The land required for the complex has already been acquired and fenced. The O Mon IV Project will be located entirely within the Power Complex boundaries.
Figure 4: Location of the O Mon IV Power Project, Can Tho City, Viet Nam 59. The O Mon Power Complex is bound by the Hau River to the northeast and by the Vam and Chanh streams to the northwest and southeast. The Hau is one of the two main rivers of the lower Mekong Delta, and at the power complex is approximately 760 meters in width with a maximum depth of 22 to 23 meters. The Vam and Chanh streams have a maximum depth of 6 to 7 meters. The island area is level, rural and predominantly cultivated, and is subdivided by numerous irrigation ditches (Figure 6).
25
Can Tho City is at the same administrative level as a province. It was created in 2004 by a split of the former Can Tho Province into two new administrative units: Can Tho City and Hau Giang Province.
O Mon IV, Can Tho, Viet Nam
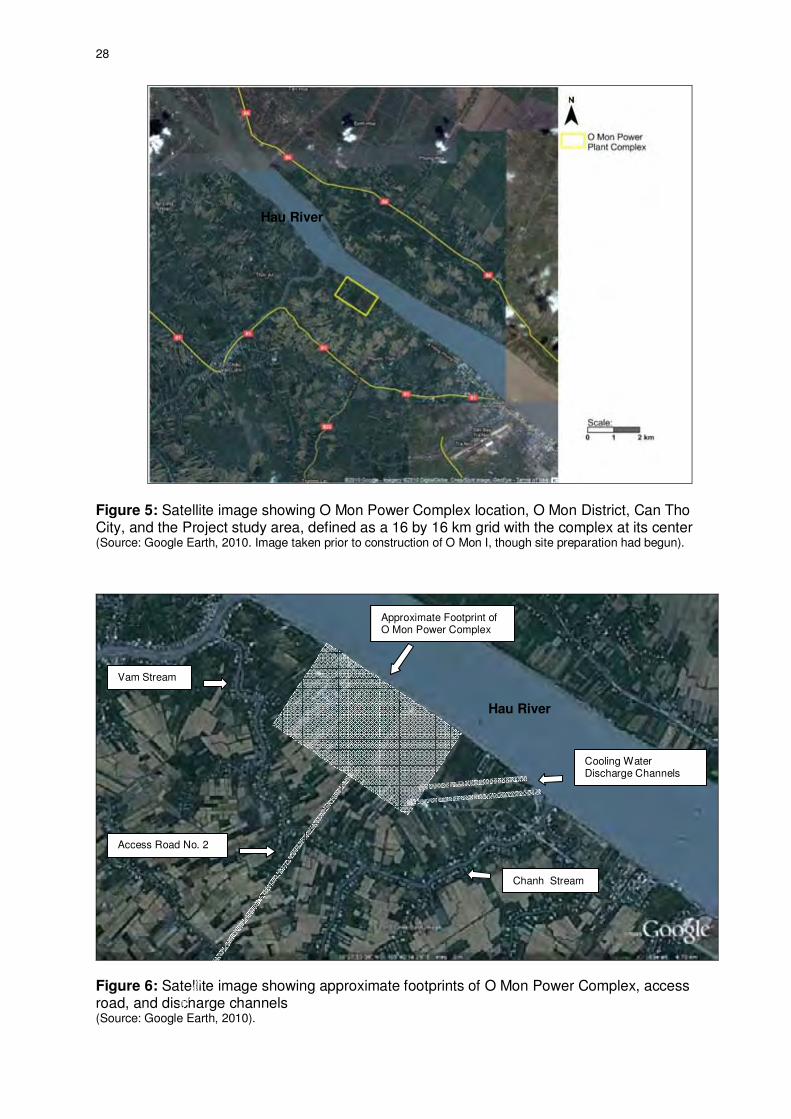
28
Figure 5: Satellite image showing O Mon Power Complex location, O Mon District, Can Tho City, and the Project study area, defined as a 16 by 16 km grid with the complex at its center (Source: Google Earth, 2010. Image taken prior to construction of O Mon I, though site preparation had begun).
Figure 6: Satellite image showing approximate footprints of O Mon Power Complex, access road, and discharge channels (Source: Google Earth, 2010).
Hau River
Approximate Footprint of O Mon Power Complex
Cooling Water Discharge Channels
Access Road No. 2
Vam Stream
Chanh Stream
Hau River

29
E. Detailed Description
1. O Mon Power Complex Overview
60. The O Mon Power Complex has a total area of 162 ha, including but not limited to power plants sites, switch yards, a gas distribution center, docks, water intakes and cooling water discharge channels. The power plants sites (O Mon I to IV) will have a total area of approximately 80 ha, the switchyards will occupy 38 ha, access road no. 2 about 4.3 ha, and the “triangle” of land for the two discharge channels approximately 40 ha. 61. As noted above, the O Mon IV Project is one of four power plants currently planned for the complex. The existing O Mon I has a planned capacity of 660 MW, while O Mon II to IV will each have a capacity of 750 MW, giving the complex a planned total installed capacity of 2,910 MW.26 There is room available for a fifth power plant (O Mon V), whose construction plan has been accepted by MOIT and submitted for the Prime Minister’s approval. Figure 7 shows an aerial view of the complex and the existing O Mon I Power Plant.
Figure 7: Aerial picture looking southwest, showing the O Mon I Power Plant. O Mon II, III and IV will be constructed to the right of O Mon I. Note cooling water discharge channel no. 1 on the left. Photo taken March, 2009. 62. Figure 8 shows the planned layout of the O Mon Power Complex upon completion of the four plants. The axes of the HRSGs and gas turbines for the power plants are shown running southwest to northeast. The connections between the generator transformers and the high-voltage bays will be 500 kV high-voltage cables laid in ducts. Fuel oil storage tanks (three existing tanks for O Mon I, and two each for O Mon II to IV) will be located north of the HRSGs. The natural gas distribution station will be located to the south of the complex, and cooling water discharge channels will be located on the eastern side. Jetties and other dock facilities will be located on the northern boundary along the banks of the Hau River.
26
At present only the 330 MW unit 1 of O Mon I is completed and running. The 330 MW unit 2 is currently at the bidding stage.
Cooling Water Discharge Channel No. 1
O Mon I O Mon II Site
O Mon III and IV Sites

30
Figure 8: O Mon Power Complex layout. Note existing O Mon I Power Plant, 110, 220 and 500 kV switch yards, and cooling water discharge channel no. 1; and planned O Mon II to IV sites, cooling water discharge channel no. 2 and gas distribution complex.
DFO Unloading Jetty
Natural Gas Distribution Complex
Existing Cooling Water Discharge Channel 1
Cooling Water Discharge Channel 2
500 kV Switch Yard
220 kV Switch Yard
110 kV Switch Yard
Cooling Water Intake and Pumping Station

31
63. O Mon I is the only power plant at the complex that is currently in operation. Funded by the Japan Bank for International Cooperation (JBIC), its conventional technology twin turbines will have a capacity of 660 MW once both units are installed (at the time of writing only one unit is in operation). O Mon I is currently being fuelled by distillate fuel oil (DFO) but will shift to natural gas when the O Mon Power Complex is connected to the B&52-O Mon pipe line.27
2. O Mon IV Layout
64. The O Mon IV site will be located entirely within the O Mon Complex boundaries, and will have an area of 17.1 ha (not including access road no. 2 and discharge channel no. 2). 65. The power plant site will be divided into 5 areas:
Area 1 will be located in the southwest portion of the site, near the main access road into the O Mon Power Complex, and will include:
- the main plant area housing the two gas turbines and generators, and the steam turbine and generator;
- the step-up transformers for the turbines; - the HRSGs and the two 40 m exhaust stacks; - the gas and steam turbine control building; and, - the diesel power plants.
Area 2 will be located in the south-central portion of the site. It is the plant administrative center, and will include:
- security building; - workshops and warehouses; - canteen; - garage; and - car and motorcycle parking.
Area 3 will be located in the north-central portion of the site, and will be devoted to the water treatment system, including:
- settling tanks and preliminary treatment (filtration); - domestic water treatment plant; - demineralization plant; - filtered water storage tanks; - demineralized water storage tanks; - water supply pumping stations; and, - fire protection pumping stations.
Area 4: will be located in the south-central portion of the site immediately adjacent and to the north-east of Area 2. It will be devoted to the wastewater treatment system, including:
- domestic wastewater treatment system; - oil-water separator; and, - central wastewater treatment system.
Area 4 will also include the plant repair facility. Area 5: will be located adjacent to the bank of the Hau River in the northeast portion of the site, and will include facilities related to DFO storage and cooling water pumping, including:
27
Distillate Fuel Oil: lighter fuel oils distilled during the refining process and used primarily for space heating, on– and off–highway diesel engine fuel (e.g., railroad engine fuel and fuel for agricultural machinery) and electric power generation.
32
- emergency DFO tanks (two); - fuel oil pumping station; - cooling water pumping station; - chlorine dosing station; - raw water pumping station (for construction phase); and, - raw water tank (for construction phase).
66. In addition, a zone of trees and grass will be established between the complex’s power plants (e.g. between O Mon III and IV and, potentially in the future, between O Mon IV and V). 67. Figure 9 shows the detailed Project layout including the locations of the five areas described above.
3. O Mon IV Main Design Features and Systems
68. Table 7 summarizes the Project design parameters while Table 8 summarizes main and auxiliary systems and buildings and infrastructure. Appendix 3 presents design features and main and auxiliary equipment in detail.
a. Power Plant Configuration and Buildings
69. O Mon IV will utilize a 2-2-1 combined cycle configuration meaning it will have two 250 MW dry low-NOx (DLN) indoor gas turbines, two HRSGs, and one 250 MW indoor steam turbine, giving a combined net power generation capacity of 750 MW. It will operate as a base load power plant, will run a minimum of 6000 full load hours per year, and will have an annual net power generation of 4500 GWh.28 Figure 10 summarizes the overall power production process.
70. The gas and steam turbines will be housed in a turbine building equipped with a crane and hoists for equipment installation and maintenance. The turbines and generators will be installed on a reinforced concrete foundation. 71. There will be two natural circulation type HRSGs, one for each gas turbine. The HRSGs will be installed on a reinforced concrete foundation supported by 30 m reinforced concrete piles. Each HRSG will be equipped with a 40 m corrosion resistant bypass stack for temporary open cycle operation, and a corrosion and heat resistant 40 m high main stack.29 The main stacks will be equipped with ladders, access platforms, and a continuous emissions monitoring system (CEMS). 72. The power plant will be operated via a three story control building located adjacent to the turbine building. To avoid vibrations the foundation of the control building will be separate from the adjacent turbine building.
28
Base load requirement is the minimum level of demand on an electrical supply system over 24 hours. Base load power sources are those plants which can generate dependable power to consistently meet demand. Base load power plants operate continuously, and typically shut down or reduce power only to perform maintenance or if there is a malfunction. Demand spikes are handled by intermediate or peak power plants which must be smaller and more responsive to changes in demand.
29
Open cycle operation refers to directly exhausting the heat from the gas turbine through a bypass stack. The use of bypass stacks is normally limited to operational conditions which occur when either the steam turbine or waste heat recovery unit is off line due to problems or for maintenance purposes and short term operation at lower plant efficiency is required. Open cycle operation results in plant thermal efficiency of around 35%.

33
Figure 9: Detailed layout of the O Mon IV Thermal Power Project site

34
Table 7: Main design parameters, O Mon IV Thermal Power Project
Item Data
Location O Mon Power Complex, Can Tho City, Viet Nam Plant Concept
Technology Combined Cycle System Combustor Type Dry Low NOx (DLN) No. Gas Turbines 2 No. of Heat Recovery Systems 2 No. Steam Turbines 1 No. Stacks 2 Stack Height 40 m Transmission voltage level 500kV
Capacity and Operating Hours Maximum Power Generation Capacity Approximately 750 MW (30
0C).
Annual Net Power Generation 4500 GWh Minimum Annual Operating Hours 6,000 hours
Type of Fuel Main fuel Natural gas from B&52 field via B&52-O Mon pipe line Emergency fuel Distillate Fuel Oil (predicted use is < 5 days per year)
Cooling Type Once through cooling Demand 18 m
3/s
Intake Hau River Discharge Hau River Temperature Rise at Condenser Outlet 6 °C maximum Temperature Rise at Cooling Channel
outlet Temperature Rise in Receiving River
5 °C estimated < 3 °C at mixing zone boundary
30
Maximum Emissions31
NOx from:
Natural Gas 50 mg/Nm3
Distillate Fuel Oil 410.68 mg/Nm3
SOx from: Natural Gas 1.2 mg/Nm
3 32
Distillate Fuel Oil 307.4 mg/Nm
3
Dust (PM10) from: Natural Gas 10.32 mg/Nm
3
Distillate Fuel Oil 23.71 mg/Nm3
CO from: Natural Gas Distillate Fuel Oil
Noise Level
84.79 mg/Nm
3
83.52 mg/Nm3
At plant boundary 70 dBA from 06 h – 22 h; 50 dBA from 22h – 06 h Economic life of plant 25 years kV = Kilovolt; MW = Megawatt; GWh = gigawatt hours; °C = degrees Celsius; m³/s = cubic meter per second; mg/Nm³ = milligram per standard cubic meter; NOX = nitrogen oxides; SO2 = sulfur dioxide; dBA = decibels on the A scale. Source: Based on PECC3 EIA (2007), Vattenfall EIA (2008), O Mon IV Power Plant – 750 MW – Construction Investment Report (Can Tho Thermal Power Company, 2010), and additional data provided by CTTP and PECC3 during the preparation of this report.
30
See Figure 41. 31
Selection of turbine supplier has not been finalized; however, these figures will be a maximum design standard. 32
Based on natural gas with a content of 7.7 mg H2S/m3 (source: PPTA 4845 EIA report). This is a higher value
for SOx emissions than presented in the MONRE-approved EIA report, which reported SOx emissions to be 0.44 mg/Nm
3.

35
Table 8: Summary of O Mon IV main systems, auxiliary systems, and main buildings and infrastructure Main Systems
Turbines and Generators
• 02 gas turbine units: – Capacity: 260 ÷ 290 MW/unit (ISO) – Generators: 300 ÷ 340 MVA capacity
– cosϕ: 0.85 (lagging), 0.9 (leading) – Auxiliary equipment
• 02 HRSGs: – Natural circulation, horizontal or vertical type – Evaporation: about 714 T/h – Height of stack: 40 m
• 01 steam turbine – Generators: 310 ÷ 340 MVA capacity – cosϕ: 0.85 (lagging), 0.9 (leading) – Auxiliary equipment
Control Communication
• Control and protection system • Communication system
Transformers, Grid Connection
• 02 step-up transformers 15.75(21)/510± 10%x1,25% kV, capacity from 300 MVA to 340 MVA
• 01 step-up transformers 15.75(21) kV/510± 10%x1,25% kV, capacity from 310 MVA to 340 MVA.
• 500kV connection • Auxiliary transformers and auxiliary electric system
Auxiliary Systems
Cooling
• Cooling water system of condenser and closed cooling water system of 18m
3/s, including:
– Water intake – Circulating pump station – Cooling water pipeline – Cooling water discharge channel
Water Supply • Filtration system, domestic water treatment system, and demineralization system
• Filtered and demineralized water storage tanks Wastewater • Wastewater treatment system, design capacity of 34m
3/h
• Surface runoff collection system, including oil/water separator Gas Supply • Gas supply and distribution system: 160,000 Nm
3/h, pressure of 40 to 60
bar Main Buildings and Infrastructure
• Water intake and circulating pump house: 18m3/s
• Cooling water pipeline: about 3,000mm diameter, 465 – 500 m length • Discharge culvert of cooling water: 2.5m x 2.5m, 100 – 110m length • Control building • Gas Turbine building • Steam turbine building • Administrative building • Warehouse • Workshop • Canteen • Garage • Parking • Parking for two-wheel vehicles • Gatehouse • Surface-water drainage system • Access road no. 2 • Internal roads • Fence and gates
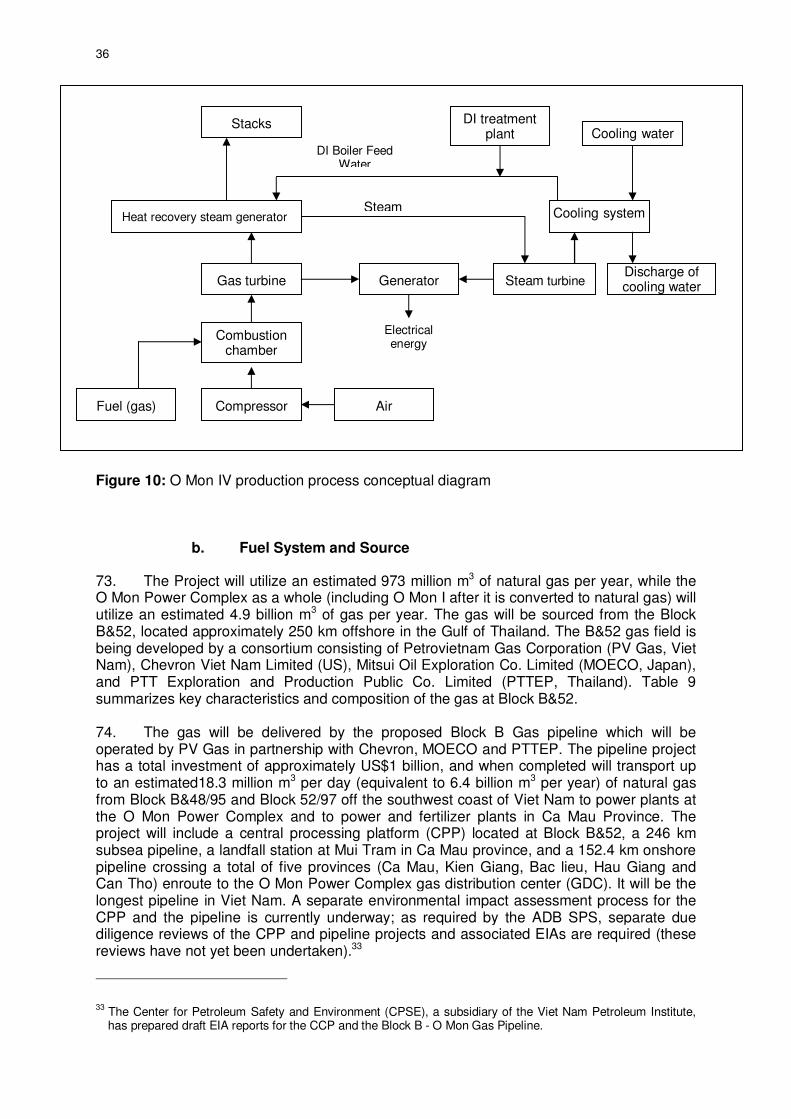
36
Figure 10: O Mon IV production process conceptual diagram
b. Fuel System and Source
73. The Project will utilize an estimated 973 million m3 of natural gas per year, while the O Mon Power Complex as a whole (including O Mon I after it is converted to natural gas) will utilize an estimated 4.9 billion m3 of gas per year. The gas will be sourced from the Block B&52, located approximately 250 km offshore in the Gulf of Thailand. The B&52 gas field is being developed by a consortium consisting of Petrovietnam Gas Corporation (PV Gas, Viet Nam), Chevron Viet Nam Limited (US), Mitsui Oil Exploration Co. Limited (MOECO, Japan), and PTT Exploration and Production Public Co. Limited (PTTEP, Thailand). Table 9 summarizes key characteristics and composition of the gas at Block B&52. 74. The gas will be delivered by the proposed Block B Gas pipeline which will be operated by PV Gas in partnership with Chevron, MOECO and PTTEP. The pipeline project has a total investment of approximately US$1 billion, and when completed will transport up to an estimated18.3 million m3 per day (equivalent to 6.4 billion m3 per year) of natural gas from Block B&48/95 and Block 52/97 off the southwest coast of Viet Nam to power plants at the O Mon Power Complex and to power and fertilizer plants in Ca Mau Province. The project will include a central processing platform (CPP) located at Block B&52, a 246 km subsea pipeline, a landfall station at Mui Tram in Ca Mau province, and a 152.4 km onshore pipeline crossing a total of five provinces (Ca Mau, Kien Giang, Bac lieu, Hau Giang and Can Tho) enroute to the O Mon Power Complex gas distribution center (GDC). It will be the longest pipeline in Viet Nam. A separate environmental impact assessment process for the CPP and the pipeline is currently underway; as required by the ADB SPS, separate due diligence reviews of the CPP and pipeline projects and associated EIAs are required (these reviews have not yet been undertaken).33
33
The Center for Petroleum Safety and Environment (CPSE), a subsidiary of the Viet Nam Petroleum Institute, has prepared draft EIA reports for the CCP and the Block B - O Mon Gas Pipeline.
Steam
Fuel (gas) Air
Gas turbine Generator
Heat recovery steam generator Cooling system
DI Boiler Feed Water
Stacks
Electrical energy
DI treatment plant Cooling water
Discharge of cooling water
Compressor
Combustion chamber
Steam turbine

37
Table 9: Characteristics and composition of natural gas at Block B&52, Gulf of Thailand
Parameter Unit Value
Hydrocarbon Mole (%) 77-80 Methane (minimum) Mole (%) 95 CO2 (maximum/typical) Mole (%) 20/18 Inert gas (maximum/typical) Mole (%) 23/21 Higher Heating Value-HHV (minimum) Btu/scf 800 Higher Heating Value-HHV (maximum) Btu/scf 900 Higher Heating Value-HHV (typical) Btu/scf 870 Hydrogen sulphide mg/Nm
3 79
Hg (maximum) mg/Nm3 50
H2O (maximum) mg/Nm3 112
BTU/SCF = British Thermal Units/Standard Cubic Foot (SCF at standard temperature and pressure under the USA system of units, where standard temperature = 60 degrees Fahrenheit and standard pressure = 1 atmosphere at sea level); mg/Nm
3 = milligrams per
standard cubic meter.
75. The Project will also use type No. 2 distillate fuel oil (DFO) for start-up and for emergency interruptions in gas delivery. Type No. 2 DFO is a distilled oil with a low sulphur content and minimal heavy metal impurities (Table 10). It does not cause hot corrosion of equipment, and has reduced environmental impacts compared to other fuel oil types. Currently DFO needs to be imported into Viet Nam, but in the future this may change as the Dung Quat Refinery, the country’s first oil refinery, began production in 2010. 76. The DFO will be delivered by petroleum tanker to the O Mon Power Complex oil transfer jetty and piped to two 10,000 m3 storage tanks located on the northeastern side of the site, adjacent to the Hau River. Because of the risk of bank erosion the tanks will be situated on a matt foundation supported by 30 m deep reinforced concrete pilings. The tanks will be situated within a secondary containment system consisting of a 1.5 m high reinforced concrete oil-proof containment wall (bund) capable of holding over 110% of the contents of the DFO tanks. The bund will include a surface water trench collection system which will lead to a gravity type oil-water separator. The oil-water separator will remove up to 99% of waste oil, which will be collected, stored and either reused, reprocessed, or sold. Sludge from the oil-separator will be dredged periodically and landfilled by a private waste contractor. The treated effluent from the oil-water separator will be directed to the central wastewater treatment system for further treatment. 77. The DFO tanks will provide a reserve sufficient for five days operation. However, both economically and environmentally, DFO is not an option for continuous power production.

38
Table 10: Distillate fuel oil composition and characteristics
Parameter Unit Value
Density 15oC kg/m
3 0.849
Viscosity 35oC mm
2/s 5.09
Sulfur content %wt 0.46 Carbon content %wt 85.5 Hydrogen content %wt 13.4 Nitrogen content %wt 0.0128 Oxygen content %wt < 0.1 Vanadium ppm < 0.01 Nickel ppm < 0.01 Na ppm 0.27 Water content % wt 0.007 Gross heating value (HHV) MJ/kg 45,695 Net heating value (LHV) MJ/kg 42,767
Note: based on analysis presented in the Phu My 2.1 Thermal Power Plant EIA. The DFO used in the Phu My power plant is a common type in Viet Nam and is the same as will be used in the O Mon IV Thermal Power Project.
c. Stack Emissions
78. The gas turbines will be equipped with DLN burners. The HRSGs will exit exhaust gases through 40 m high main stacks equipped with gas sample ports for continuous emissions monitoring. Although final selection of the supplier is not yet complete, emission concentrations for nitrogen oxides (NOx) while running on gas will be required to be ≤ 50 mg/Nm3, which is in compliance with relevant EHS Guidelines (51 mg/Nm3) and relevant Vietnamese standards (212.5 mg/m3).34 Emission concentration of sulfur dioxide (SO2) while running on gas will be ≤ 1.2 mg/Nm3, which is in compliance the Vietnamese standards of 255 mg/Nm3 (there is no corresponding IFC EHS guideline). Emission concentration of dust (PM10) while running on gas will be 10.32 mg/Nm3, which is in compliance with the Vietnamese standard of 42.5 mg/Nm3 (there is no corresponding IFC EHS guideline). 79. The Project will be equipped with a water injection system for NOx suppression when burning DFO. Maximum emission concentrations of NOx when running DFO will be 410.68 mg/Nm3, which is in compliance the Vietnamese standards of 510 mg/Nm3. Maximum emission concentrations of SOx when running DFO will be 307.34 mg/Nm3, which is in compliance with the Vietnamese standards of 425 mg/Nm3. Maximum emission concentrations of PM when running on DFO will be 23.71 mg/Nm3, which is in compliance with the Vietnamese standard of 127.5 mg/Nm3. There are no applicable EHS DFO emission guidelines as the plant will not run on DFO for more than 500 hours per year; DFO will only be used for start-up and during periods when the gas supply is unavailable. Based on experience at other CCGTs in Viet Nam, this can be expected to be a maximum of five days per year.35
d. Cooling System
80. HRSGs used in combined cycle gas turbine units require a cooling system to condense steam used to generate electricity. The Project will utilize a “once through” system with cooling water withdrawn from the Hau River at a maximum rate of 18 m3/s. (A portion of
34
QCVN 22:2009/BTNMT, provides air emission standards, including NOx, SOx and dust, for the thermal power sector (replaced TCVN 7440:2005).
35
For example, Phu My 3 utilizes DFO for less than one day per year (source: personal communication, Nguyen Thi Ha, HSE Officer, June 2010).

39
the abstracted water will also be treated and used to meet the plant’s needs for process water in the boiler system and domestic water, see below. The water will be withdrawn via an intake and pumping station located on the southeast corner of the site and transported to the HRSGs via a 390 meter long 2,700 mm diameter underground steel pipeline. From the plant the cooling water will be conveyed by a 20 meter long 2,700 mm diameter underground steel pipe to a siphon pit, and then discharged to a culvert which connects to the 1,126 m long open air discharge channel no. 2 which exits to the Hau River. Figure 8 shows both the existing discharge channel no. 1 that is being utilized by O Mon I (and which will also be used by O Mon II in the future) as well discharge channel no. 2, which will be used by both O Mon III and O Mon IV. Discharge channel no. 2 will be constructed as part of the O Mon IV Project, and will have a total capacity of 36 m3/s. 81. To protect the cooling system the water will be treated periodically (twice per day) to a level of 0.2-0.3 mg/l chlorine in a sensor controlled system. Due to evaporation in the discharge channel residual chlorine levels are predicted to be below 0.2 mg/l and in compliance with relevant Vietnamese and international standards.36 It is currently planned that this will be verified as part of the operation phase quarterly wastewater monitoring (see Chapter IX). As there are no other chemicals added to the cooling water and it does not interact with oils, solvents, etc, it is considered “clean” and can be discharged without any treatment. 82. The cooling water pump station will be a steel framed building containing 2 pumps each with a capacity of 9 m3/s. A 30 m wide intake structure will withdraw water at a maximum velocity of 0.2 m/s from a depth up to 5 m below the surface. The intake will be screened to keep out debris and aquatic flora and fauna. The intake structure will be constructed with high strength cement anchored by reinforced concrete pilings 20 m deep. Bank retaining walls on either side of the intake will protect the structure and the banks from erosion.
e. Water Supply and Treatment
83. In addition to cooling water the Project will also require domestic water for use in kitchens, bathrooms, etc; process water for use as make-up water for the loss of condensate in the system and cooling of machinery; and filtered water for fire-fighting. Raw water will be withdrawn from the Hau River via the main intake and pumping station (this amount is included within the maximum Project withdrawal rate of 18 m3/s), and diverted to a preliminary treatment plant consisting of two 2,000 m3 sedimentation basins; a 2000 m3 raw water holding tank; two clarifiers with a capacity of 50 m3/hour; two rapid sand filters, also with a design capacity of 50 m3 each; and a filtered water holding tank. At this point the filtered water will either be:
1) pumped to a 2000 m3 storage tank without any further treatment, to be
utilized in the firefighting system; 2) further treated through activated carbon filtration and chlorination, and then
pumped to a treated water tank to be used for the Project’s domestic water needs; or,
3) further treated in the ion-exchange demineralization plant and pumped to two 2000 m3 demineralized (DM) water storage tanks for use as high quality process water37.
84. A schematic for the overall water supply treatment system is presented in Figure 11.
36
The Vietnamese standard QCVN 24:2009/BTNMT limits residual chlorine in wastewater to 2 mg/l. The IFC EHS guideline is 0.2 mg/L to be achieved 95% of the time the plant is in operation.
37
Demineralization is the process of removing mineral salts from water by ion-exchange.

40
85. Demineralized water will be produced in a two-tower ion exchange process, with one tower containing a cation-exchange resin in the hydrogen (H+) form and the other containing an anion resin in the hydroxyl (OH-) form. Water flows through the cation column, whereupon all the cations are exchanged for hydrogen ions. The water then flows through the anion column, whereupon all the negatively charged ions are exchanged for hydroxide ions which then combine with the hydrogen ions to form water (H2O). A schematic of the demineralization plant is presented in Figure 12.
f. Wastewater Treatment
86. There are a number of power plant processes that will produce wastewater that will require treatment before discharge to the Hau River.
i. Domestic Wastewater Treatment
87. Domestic wastewater generated on site from the canteen, washrooms, etc, will be treated in a domestic wastewater treatment plant with a design capacity 108 m3/day, and released to the cooling water discharge channel and ultimately the Hau River. The treatment system will consist of two 3-chamber septic tanks for providing primary treatment through anaerobic digestion; an activated sludge tank and sedimentation basin to provide secondary treatment; and disinfection through the addition of sodium hypochlorite.38 The sterilized water will be pumped to a holding tank and then released into the cooling water discharge channel. This will be an effective means of treating wastewater to Vietnamese standard QCVN 24/2009/TNMT.
ii. Oily Water Collection and Treatment
88. An oily wastewater drainage system will drain all areas where oil spillages could occur, or where runoff could be oil contaminated. This includes the bunded area around the DFO tanks, the transformers (which will contain insulating oil), turbines, etc. The oily water will be directed to a gravity-type oil-water separator with the capacity to remove 99% of oil wastes. The separated waste oil will be collected, stored and either reused, reprocessed, or sold. Sludge from the oil-separator will be dredged periodically and landfilled by an appropriately licensed private waste contractor. The treated effluent from the oil-water separator will be directed to the central wastewater treatment system for additional treatment.
38
NaOCl is widely utilized for wastewater sterilization due to its effectiveness to treat wastewater media and its inherent chemical characteristics of being a safer, less costly, lower risk chemical.

41
Figure 11: Schematic of water supply treatment system
Water withdrawn from Hau River
Rapid Sand Filters
Sludge/sand collected and land filled
Pumping Station
Pumping Station
Pumping Station
Pumping Station
Pumping Station
Two 2000 m3
Sedimentation Basins
Sludge/sand collected and land filled
2000 m3 raw
water tank
Two 50 m3 /
h Clarifier Tanks
Liquid sludge to wastewater treatment plant
Liquid sludge to wastewater treatment plant
Filtered Water Holding Tank
Filtered Water Storage Tanks
Demineralization Plant
Demineralized Water Storage Tanks
Demineralized Process Water for:
- Boiler make-up - Cooling of
turbines, generators, etc
- Other uses
2000 m3
2000 m3
Activated Carbon Filter Chlorination
Domestic Water Storage Tank
Domestic Water Users
Filtered Water Storage Tank
To Fire-fighting System
2000 m3
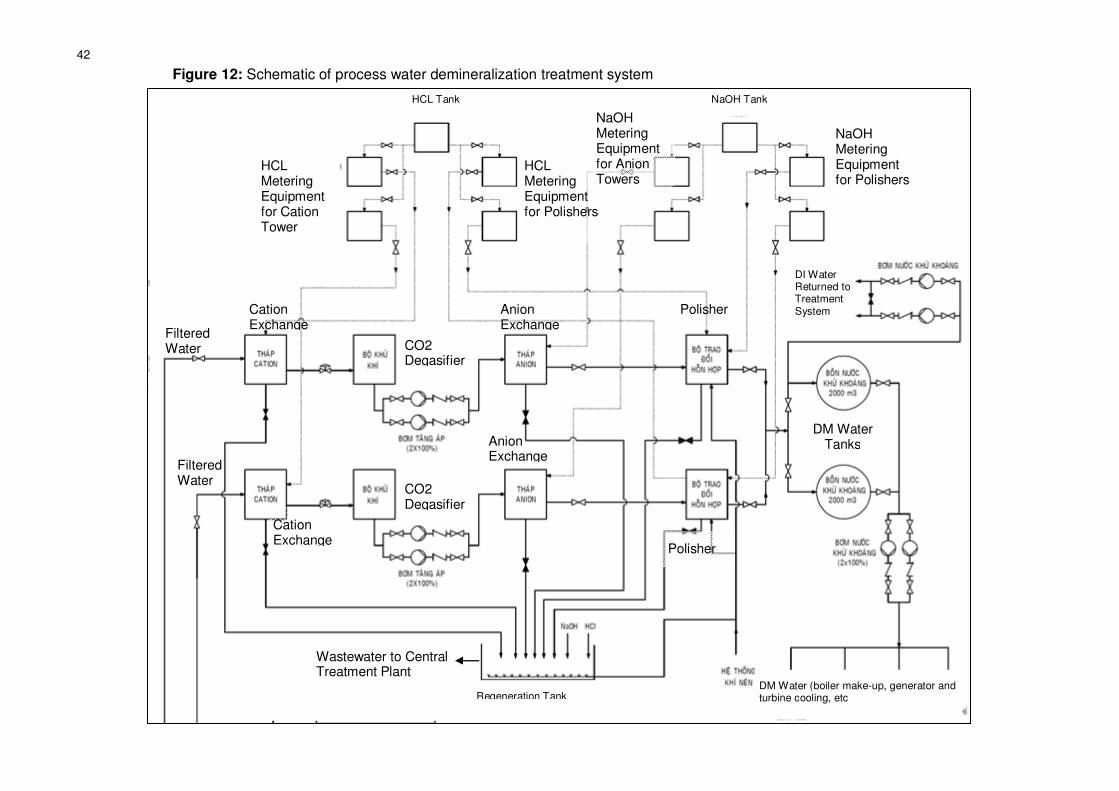
42
Figure 12: Schematic of process water demineralization treatment system
Filtered Water
Filtered Water
Cation Exchange
Cation Exchange
CO2 Degasifier
CO2 Degasifier
Anion Exchange
Anion Exchange
HCL Metering Equipment for Cation Tower
HCL Tank NaOH Tank
HCL Metering Equipment for Polishers
NaOH Metering Equipment for Anion Towers
NaOH Metering Equipment for Polishers
Polisher
Polisher
DM Water Tanks
DM Water (boiler make-up, generator and turbine cooling, etc Regeneration Tank
Wastewater to Central Treatment Plant
DI Water Returned to Treatment System

43
iii. Central Wastewater Treatment
89. A central wastewater treatment plant will treat process wastewater generated from i) the turbine and boiler areas (35 m3/day), boiler (168 m3/day), miscellaneous minor process effluents, and periodic maintenance such as washing the boiler and boiler combustion chambers; ii) liquid sludge effluent from the water supply treatment clarifiers; and iii) wastewater from the regeneration pit in the demineralization plant. The system will incorporate a central collection tank, a pH equalization tank, flocculation and settling tanks, a secondary clarifier, and an additional post treatment pH stabilization before the treated effluent is directed to a storage tank and then pumped to discharge channel no. 2. Sludge generated in the treatment process will be pumped into a settling tank, dewatered and stored before being collected and landfilled. Wastewater from the settling tank will be pumped back into the equalization tank and retreated. The treatment plant will have a capacity of 37 m3/hour and will operate for 9 hours per day. The effluent that is discharged will be in compliance with Vietnamese standard QCVN 24/2009/TNMT. The quality of the effluent from the central treatment plant will be monitored at the discharge point (see section IX-B Environmental Monitoring, page 153).
g. Surface Water Drainage System
90. Rain water runoff from building roofs, road surfaces, vegetated areas, and other areas which are not contaminated by DFO, oil, or any chemicals is considered non-contaminated and typical of surface water runoff from areas such as domestic or institutional buildings and roads. The runoff will be collected in a gravity fed surface water drainage system supported by pumps in low areas when required. The drainage system will direct the runoff to a sedimentation basin and then to discharge channel no. 2 through two control gates. A schematic of the surface water drainage system is presented in Figure 15.

44
Figure 13: Schematic of O Mon IV domestic wastewater treatment system
Domestic Wastewater
Septic Tank
Septic Tank
Pumping Station
Pumping Station
Activated-Sludge Aeration Tank
Sedimentation Tank
Disinfection (Sodium Hypochlorite)
Holding Tank
Pumping Station
To Discharge Channel No. 2
Air Pumps
Sludge to Central Wastewater Plant for Dewatering

45
Figure 14: Schematic of O Mon IV oil-water separator and central wastewater treatment plant
Oily Water From:
DO Tank Area
Transformer Area
Gas Turbine Area
Steam Turbine Area Oil-Water
Separator
Wastewater from Steam Cycle
Wastewater from Boilers
Wastewater from Regeneration Tank in Demineralization Plant
Sludge from Clarifier in Water Supply Treatment System
Pumps
Sludge Pumps
Pumps
Pumps
Pumps
Pumps
Pumps
Oil-Water Separation System
Air Pumps
Sludge Dewatering and Drying (dried sludge is transported to landfill by outside contractor)
Wastewater separated from the Sludge
Activated Sludge Treatment – Aeration Chambers
3 Chamber Treatment Tank (pH
adjustment, flocculation,
sedimen-tation)
Sodium Hydroxide Storage Tanks and Metering Equipment
Post-treatment pH
neutralization
Pumps
To Cooling Water Discharge Channel No. 2
Hydrochloric Acid Storage Tanks and Metering Equipment
Treated Wastewater from Domestic Wastewater Treatment Plant

46
Figure 15: Schematic of O Mon IV surface water drainage system

47
h. Switchyard and Grid Connection
91. The generators will transmit power to an existing 500 kV outdoor switchyard though 500 kV step-up transformers and an Isolate Phase Bus (IPB) system. The switchyard connects to the national grid through a 500 kV power transmission line. The switchyard is located immediately to the southwest of the Project site (Figure 8 and Figure 16).
Figure 16: Existing outdoor 500 kV switching yard. Picture taken from O Mon I turbine building.
i. Fire Protection System
92. The Project will have a comprehensive system to protect the entire complex in the event of excessive heat, smoke or fire. The system will including fire detection and alarm systems, indoor and outdoor hydrants and fire hose stations, water and water foam sprinkler systems, portable fire extinguishers and lighted exit signs.
i. Fire Detection and Alarm System
93. A comprehensive fire detection and alarm system will be installed, including: - a main fire alarm and control panel located in the control building; - a secondary display panel located at the main guard house; - emergency call points located at corridors, landings, doors and at the
intersections of power plant roads; - ionization smoke detectors, optical smoke detectors, and heat detectors installed
throughout the interior and exterior of the power plant; and, - audible and visible alarm equipments such as bells, sirens, and lights.
Existing 500 kV Switchyard
O Mon IV Site

48
ii. Pumping Station and Storage
94. Filtered fire suppression water for outdoor and indoor hydrants, and fire suppression sprinkler and foam systems will be stored in a 2,000 m3 outdoor tank capable of supplying the fire suppression system continuously for about five hours. The feed pumps will be capable of refueling the tank in less than eight hours. The fire suppression system will be pressurized by an electric fire pump, with a back-up diesel pump in case of a power outage. The pumps will turn on automatically when a pressure drop indicates the engagement of a water or foam suppression component.
iii. Outdoor Hydrants System
95. This system will consist of main supply pipes connecting the fire pump to the hydrants, fire hose stations, sprinklers, and isolation valves.
iv. Indoor Hydrant System
96. This system is designed for fighting fires affecting indoor equipment and facilities. It will be fed by the main supply pipe from the outdoor hydrant system, and will consist of a series of hydrants and fire hose stations.
v. Sprinkler System
97. This system is designed for fire suppression and cooling of areas such as the control building transformers, turbine oil pumping station, hydrogen plant, etc.
vi. Water-Foam System
98. A water-foam fire sprinkler system is a special application system, discharging a mixture of water and low expansion foam concentrate, resulting in a foam spray from the sprinkler. The system will protect the DFO tanks and pump area, and will include water foam hose stations and sprinklers.
vii. Inert Gas Extinguishing System
99. An inert gas fire extinguishing system is a fire-extinguishing system in which pure inert gases (argon, nitrogen or carbon dioxide) and/or mixtures are used as fire extinguishing agents. When triggered, inert gas fire extinguishing systems rapidly displace approximately 50% of the air in the protected space by inert gas, thereby extinguishing the fire. This system will be used to protect the plant control rooms.
viii. Portable Extinguishers
100. Portable (handheld) extinguishers will be distributed throughout the building and production areas of the plants. Extinguishers will include:
- CO2 portable extinguisher for electric fire suppression; - dry chemical power portable extinguisher for use in common areas of the plant;
and, - aqueous film forming foam (AFFF) portable extinguishers for suppression of oil
fires.
ix. Emergency Lighting System
101. Emergency exit lights will be installed at exists throughout the plant. They will have back-up battery power in case of electricity failure

49
j. Emergency Power and Black Start
102. The power plant will be equipped with a two 1000 kW emergency diesel generators, sufficient to provide the plant with emergency power for main and safety systems. The power plant will be started utilizing power supplied power from the 500 kV stations via the main transformers and auxiliary transformers, or from the diesel generators.
k. Ventilation and Air Condition System
103. The power plant will be provided with a ventilation and air conditioning system that complies with ASHRAE standards and handbooks.39 Areas requiring ventilation include:
- turbine building; - water treatment plant; - battery rooms; - main cooling water pump building and chlorination house; and, - shop and warehouses.
104. Areas requiring air conditioning include:
- central control room; - electrical panel room; - administration building; and, - canteen.
l. Control and Communication Systems
105. A dedicated control system (DCS), a computer system for controlling the overall plant operation, will be installed and managed from the control building. A supervisory control and data acquisition (SCADA) system will collect data from various sensors in the plant and send the data to the DCS. PABX, radio messaging systems, hand held radios, loudspeakers and a LAN will be installed throughout the power complex to provide internal and external communications.
m. Access Roads
106. The O Mon Power Complex is accessed from Can Tho by Highway 91 which runs approximately 2 kms to the southwest of the Power Complex. The Power Complex itself will be accessed by two smaller access roads off Highway 91:
i) The existing 3 km long access road no. 1, which runs from Highway 91 past the Ha Tien cement plant, across the Chanh stream, and ends at the gate to O Mon I.
ii) Access road no. 2, which will be built as part of the Project, and which will run in a
straight line directly northeast from Highway 91, crossing the Ba Su irrigation canal and the Vam stream, an ending at the main gate of the O Mon Power Complex.
107. The power complex is also accessibly by boat via the Hau River.
39
The American Society of Heating, Refrigerating and Air-Conditioning Engineers. ASHRAE develops standards for both its members and others professionally concerned with refrigeration processes and the design and maintenance of indoor environments.
50
n. Common Infrastructure
108. The O Mon IV Project is located entirely within the O Mon Power Complex boundaries. Its location within the complex will allow economies of scale through common infrastructure developed during the construction of O Mon I, including the oil loading and other docks and the 500kV switch yards. Additional common infrastructure that will be developed by the O Mon Power Complex owner include the gas distribution center and distribution pipelines, which will be used by all four power plants, and internal roads up to each power complex. Common infrastructure that will be developed by the Project includes the cooling water pump station, the cooling water discharge channel, and the administration building, all of which will be used by both O Mon III and IV.
4. Power Plant Construction
a. Contractual Arrangements
109. The Project power plant will be constructed through a single engineering, procurement and construction (EPC) package. CTTP will contract an international EPC consultant to support CTTP with the tendering procedure for, and supervision of, the EPC package, which will be implemented by an EPC contractor. The Environment, Health and Safety (EHS) Team (consisting of an International and a National EHS Officer) will be part of the EPC contractor, but will work under the authority of, and in cooperation with, staff from the Environmental Management Department of the CTTP Company (see Chapter IX Environmental Management Plan, page 153). 110. Once construction is complete, and after an appropriate hand-over from the EPC contractor, CTTP will assume responsibility for operation of the power plant. The EPC contractor will provide maintenance and warranty services and technical support on an as needed basis for a two year period.
b. Construction Stages
111. Construction will be undertaken in three stages:
Stage 1: Site Preparation: The site has already been cleared, and unexploded ordinance (UXO) removed, and it has been partially backfilled (Figure 17). It still requires completion of backfilling, compaction and leveling to an elevation height of 2.7 masl. It is expected that the entire process will take between 6 and 8 months. Most of the site preparation will be undertaken through the use of heavy machinery, so during this period there will be relatively few workers on site, and the only structures will be a temporary office building and a parking lot. Once completed the temporary office will be removed. Stage 2: Main Structures: This is the key construction stage, and involves the construction of the main structures including underground works, structure foundations, reinforced concrete structures, and steel structures. Stage 3: Equipment Installation: This stage involves the installation of all plant equipment, testing and initial operation.
c. Water and Power Supply
112. During construction it is estimated that up to 1000 m3/day of raw water will be required. To meet this need water will be withdrawn from the Hau River via two 65 m3/hour pumps, and receive treatment in a two basin settling system. Power supply during construction will come via the 110/22 kV substation at Tra Noc Industrial Park via a

51
transmission line. Once the power plant is operational the line will then be used to provide power to the Park.
Figure 17: O Mon IV site, August 2010. Site has been backfilled and roughly leveled, but not yet compacted.
d. Construction Materials
113. Construction materials will be obtained from a variety of qualified suppliers and local and international sources. An estimated 250,000 m3 of soil will have to be removed, and 450,000 m3 will be backfilled in order to raise the level of the ground to an altitude that is acceptable with respect to inundation. CTTP has already signed an O Mon IV site reclamation contract with Construction Corporation No.1 (CC1). Sand for backfilling is being obtained from DONRE approved mining concessions on the Tien and Hau Rivers. In their bidding documents CC1 submitted licenses for the concessions, duly signed by the Provincial People’s Committee (PPC). In order to obtain a license an EIA was undertaken for each concession which was reviewed and approved by the local DONRE. 114. Coarse to medium sand, which will be used for concrete and masonry works, will be obtained from the Hau River at An Giang province or imported from Cambodia. Aggregate will be sourced from suppliers in Dong Nai and An Giang provinces. Concrete will be purchased from the ready-mixed producers in the Tra Noc Industrial park, located less than 10km from the Project site. Reinforcement bar (diameters from 6 mm to 32 mm) will be sourced from those Vietnamese suppliers who in recent years have been able to produce bar to international quality standards. Special types of steel and high strength bolts will be imported from abroad. Table 11 summarizes the main construction materials.

52
Table 11: Main construction materials
No Materials Unit Amount
1 Site leveling sand m3 443,000
2 Excavation m3 252,029
3 Leveling soils m3 142,554
4 Concrete B7.5 m3 3,941
5 Concrete B20 m3 3,350
6 Concrete B22.5 m3 36,698
7 Reinforcement bar Ton 4,837
8 Steel structure Ton 1,593
9 Stabilization by CDM (Cement Deep Mixing)
pile D = 800mm 480
10 Larssen sheet pile pile 12m 3,948
11 Brick works m3 850
12 Corrugated sheet steel 2 layers with insulation
m2 15,014
13 Plate details installation Ton 14,637
14 Pre-cast pre-stressed concrete products tube D400-600 Length 24-45m
pile 2,600
15 Hot asphalt concrete with small particles
m3 1,327
16 Hot asphalt concrete with medium particles
m3 2,161
17 Macadam aggregate grade I m3 8,336
18 Macadam aggregate grade II m3 10,420
19 Cobble red aggregate m3 4,168
Source: O Mon IV Power Plant – 750 MW – Construction Investment Report. Provided by Can Tho Thermal Power Company, 05 2010.
115. Equipment and materials will either be transported by ship to either the Can Tho port or directly to the O Mon Power Complex docks, or by road. F. Land Acquisition and Resettlement
116. Land acquisition and resettlement was completed in 2006 in compliance with relevant Vietnamese regulations. The acquisition of land for the power plant affected 158 households, 66 of which required resettlement. A total of 94 billion VND was paid in compensation. Acquisition of land for access road no. 2 affected a total of 78 households, 14 of which required resettlement. A total of 14.9 billion VND was paid in compensation. At the time of writing the resettlement process is under review to ensure that it complies with ADB requirements.40
40
The due diligence review of the resettlement and compensation process is being undertaken by ADB TA 4923-VIE: Preparing the Support for the Public-Private Development of the O Mon Gas Pipeline. Based on the due diligence report it is anticipated that a corrective action plan (CAP) will be developed by CTTP to address any deficiencies that are identified in the due diligence report.

53
G. Budget and Financing
117. The total Project cost is $704.86 million USD, consisting of: $640.37 million base costs (inclusive of $61.52 million taxes and duties); $43.59 million physical contingencies; $14.83 million price contingencies; and $6.07 million financial charges during implementation (FCDI). Table 12 presents the Project cost estimates by expenditure category. 118. The Project is to be financed by ADB, KfW, JBIC and EVN (final financing arrangements have yet to be confirmed), see Table 13.
H. Implementation Schedule
119. Figure 18 presents the Project implementation schedule (construction phase). The schedule has been prepared in consultation with CTTP, with the key target that the first gas turbine unit will be commissioned by July 2014 to time with the first gas delivery. The design lifetime of the Project is 25 years.
Table 12: Project cost estimates by expenditure category
Item Foreign
Exchange Local
Currency Total Cost
A. Base Cost 1. Land clearance, acquisition and resettlement - 11.90 11.90 2. Engineering, Procurement and Construction 514.03 6.49 520.52 3. Civil works 7.80 1.38 9.18 4. Consulting services 4.1 International 11.50 1.56 13.05 4.2 National - 1.79 1.79
5. Fuel for Testing and Commissioning 15.21 - 15.21 6. Project Management - 6.33 6.33 7. Independent Monitoring of Environmental Impacts - 0.86 0.86 8. Taxes and Duties - 61.52 61.52 Subtotal (A) 548.54 91.83 640.37
B. Contingencies 1. Physical contingencies 42.96 0.63 43.59 2. Price contingencies 10.46 4.37 14.83 Subtotal (B) 53.42 5.00 58.42
C. Financing Charges during Implementation 5.52 0.55 6.07 Total (A+B+C) 607.48 97.38 704.86
86.2% 13.8% -
Table 13: Project financing plan
Source Foreign
Exchange Local
Currency Total Cost % Total
Asian Development Bank Loan 153.75 9.60 163.35 23.18
JBIC Loan 200.00 - 200.00 28.37
KfW Loan 248.14 1.86 250.00 35.47
Domestic Bank Loan - - - -
EVN 5.59 85.92 91.51 12.98
Central Government Grant - - - -
Total 607.48 97.38 704.86 100.00
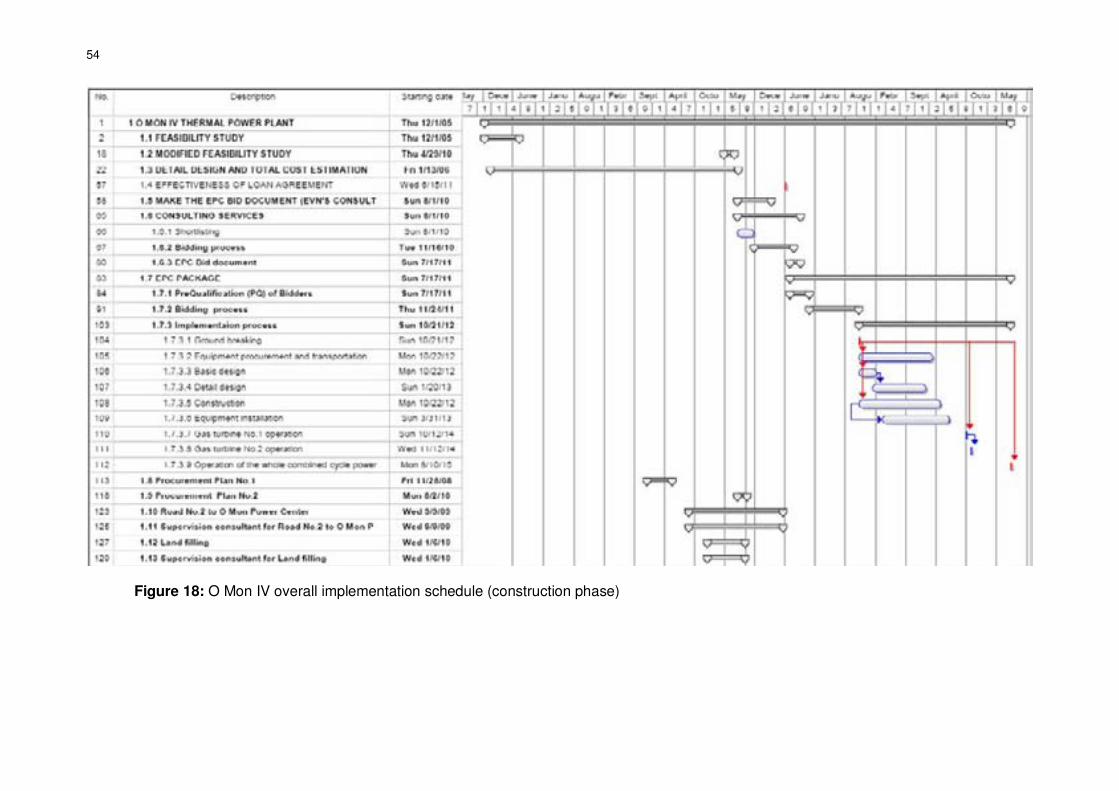
54
Figure 18: O Mon IV overall implementation schedule (construction phase)

55
IV. DESCRIPTION OF THE ENVIRONMENT
A. Ecological Resources
1. Terrestrial Resources
a. Methodology
120. Two ecological inventories have been conducted in recent years in the Project area, the first a survey conducted in 1998 by EPC-VESDEC for the O Mon I and II EIA, the second a survey carried out in 2005 also by EPC-VESDEC for the O Mon IV EIA prepared by PECC3 (2007).
b. Flora
121. 163 plant species belonging to 50 families were recorded in the Project area in the 1998 EPC-VESDEC survey, while the 2005 EPC-VESDEC survey found 157 plant species belonging to 56 families. Of these, 110 species (70%) occur naturally in the general area. Comparing the two lists notable differences between them are some herb species. For example, these species are not in the list of the O Mon IV EIA: Sagittaria sagitifolia (Alismataceae), Quisqualis indica (Commelinaceae), Cyperus blatystylis, C. cephalotes, Fuirena ciliaris (Cyperaceae). 122. The Project area vegetation is dominated by cultivated species, namely monoculture orchards in which key species are orange (Citrus sinensis), lime (Citrus aurantifolia) and coco-palm (Cocos nucifera). The second most important group of cultivated vegetation is mixed gardens, including coco-palm, banana, and plum. Rice fields collectively form a third cultivated vegetation type, but rice cultivation in the Project area is declining. The Project site area also includes typical tidally influenced river bank species, dominated by Berembang (Sonneratia caseolaris), together with Sea Holly (Acanthus ilicifolius (Acanthaceae), and Water Hyacinth Eichornia crassipes (Pontederiaceae). 123. There are no natural forests or natural protection areas within the Project site.
c. Fauna
124. There are no reports of wildlife in the two ecological surveys conducted in the Project area other than birds and rodents. Site observations in 2007 and 2008 during the preparation of the Vattenfall EIA developed under PPTA 4845 confirm the findings of these reports, as did site observations in 2010 during the preparation of the current report. Results obtained from interviews with local inhabitants in 2008 found that fauna in the Project area is similar to other rural areas in Mekong Delta, with common creatures including amphibian species (e.g. frogs and toads), reptiles (e.g. snakes and lizards), and birds.
d. Rare or Endangered Species
125. Based on the ecological surveys conducted only one IUCN Red Listed plant species has been found in the Project area: the Takian tree, a member of the Dipterocarpaceae family, is classified as Vulnerable41. Only a few stands of these species were present on the Project site and were cut as part of the site preparation. All of these had been cultivated, and compensation for their loss was provided as part of the resettlement and compensation
41
IUCN 2010. IUCN Red List of Threatened Species. Version 2010.2. <http://www.iucnredlist.org>. Downloaded on 29 June 2010. Vulnerability classification: A1cd+2cd, ver 2.3.

56
process.42 These trees did not, as such, form any part of a natural ecosystem, and no replanting or other mitigation is deemed necessary. 126. No terrestrial species listed in the Red Book of Viet Nam have been observed in the Project area.
e. Parks and Protected Areas
127. There are no protected areas or special use forests in the Project area or in O Mon district. The closest protected area to the site is at the Ngoc Hoang valley, 40 km southeast of the site (Figure 19).
2. Aquatic Resources
a. Methodology
128. The following section is based on a baseline aquatic ecology study (including phytoplankton, zooplankton, sediment, benthic fauna, fisheries, aquaculture and water quality) carried out in May and July 2007 during preparation of the Vattenfall EIA.43 Where relevant the survey data is supplemented or compared to surveys undertaken for the O Mon I EIA in August 1997 (EVN 1998) and by surveys undertaken for the PECC3 EIA44, and by sampling undertaken for the Can Tho Bridge EIA.45 Water quality is discussed on page 76 and sediment quality is discussed on page 81. 129. Aquatic organisms (phytoplankton, zooplankton and benthic macrofauna) were identified after sampling in the Hau River about 4 kilometers upstream and downstream of the planned O Mon IV cooling water outlet. Sampling was also undertaken at the O Mon River and Chanh Creek close to their outlets into Hau River. In the dry season (December to May) the water temperature is higher and the water flow is lower compared to the rainy season, and thus the dry season is the most critical period for aquatic organisms. Therefore, the baseline study of aquatic organisms and surface water quality was carried out during the end of the dry season in May 2007. In addition, interviews with fishermen and documentation of fish fauna and aquaculture were carried out in May and July 2007.
42
A due diligence review of the resettlement and compensation process was undertaken by ADB TA 4923-VIE: Preparing the Support for the Public-Private Development of the O Mon Gas Pipeline. Based on the due diligence report a corrective action plan (CAP) was developed by CTTP to address any deficiencies identified in the due diligence report.
43
The study was carried out by the Department of Environmental Management and Technology of the Institute of Tropical Biology in Ho Chi Minh City, and by the Centre of Environmental Engineering of the Cadastre and Engineering and Survey Company of Ho Chi Minh City in 2007.
44
During the preparation of the MONRE-approved O Mon IV EIA prepared by PECC3 a baseline study was carried out to describe the aquatic environment in the Hau River, O Mon River, Chanh Creek and Vam Creek, with assessments of aquatic organisms (phytoplankton, zooplankton and benthic macrofauna) and surface water quality. There are limitations in the use of this study as baseline, however. This because of unclear description of methods used, limited quantitative analysis, results presented too generally, and sampling only during the rainy season. The description of the fish fauna and fishery as well as the description of aquaculture in the O Mon area were also limited, too general and out of date. Thus the survey results were not utilized as a primary data source during the preparation of this report, though they are referred to for comparative purposes or to supplement the findings of the 2007 survey.
45
This is a secondary data source, referenced in PPTA 4845-VIE reports.
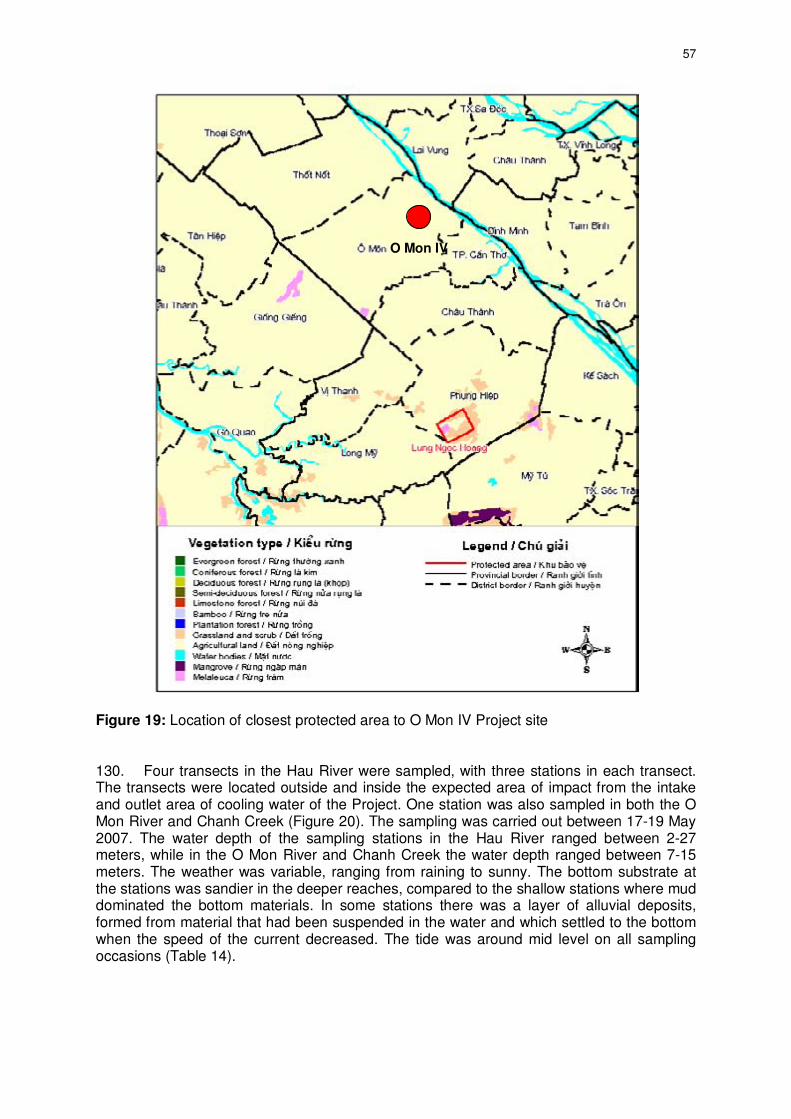
57
Figure 19: Location of closest protected area to O Mon IV Project site 130. Four transects in the Hau River were sampled, with three stations in each transect. The transects were located outside and inside the expected area of impact from the intake and outlet area of cooling water of the Project. One station was also sampled in both the O Mon River and Chanh Creek (Figure 20). The sampling was carried out between 17-19 May 2007. The water depth of the sampling stations in the Hau River ranged between 2-27 meters, while in the O Mon River and Chanh Creek the water depth ranged between 7-15 meters. The weather was variable, ranging from raining to sunny. The bottom substrate at the stations was sandier in the deeper reaches, compared to the shallow stations where mud dominated the bottom materials. In some stations there was a layer of alluvial deposits, formed from material that had been suspended in the water and which settled to the bottom when the speed of the current decreased. The tide was around mid level on all sampling occasions (Table 14).
O Mon IV

58
C3-1C3-2
C3-3
C2-1
C2-2
C2-3
C1-1
C1-2
C1-3
C4-1
C4-2
C4-3
NN
1 km
Sediment and aquatic ecology sampling
station used in 2008 Vattenfall EIA
O Mon Power Plant Complex
1 km1 km
Sediment and aquatic ecology sampling
station used in 2008 Vattenfall EIA
O Mon Power Plant Complex
Hau River
C5
C6
Figure 20: Sampling stations for sediment and aquatic organisms in the Hau River (C1-C4), Chanh Creek (C5) and O Mon River (C6) surveyed in May 2007. The existing O Mon I cooling water discharge channel is marked in red, and the proposed O Mon IV cooling water discharge channel is marked in blue. Table 14: Water depth, location, weather, sediment structure and tide during sampling of surface water quality, sediment and aquatic organisms in the Hau River (C1-C4), Chanh Creek (C5) and O Mon River (C6), May 2007
Station Depth (m) Location (Lat/Long) Weather Sediment Tide
C1-1 2 N 10.13175 E 105.67938 Sunny mud, sand Mid
C1-2 > 20 N 10.13452 E 105.68009 Sunny sand Mid
C1-3 7 N 10.13641 E 105.68493 Cloudy mud, debris Mid
C2-1 4 N 10.13947 E 105.66832 Sunny mud, debris Mid
C2-2 15 N 10.14217 E 105.67168 Cloudy sand Mid
C2-3 4 N 10.14415 E 105.6734 Cloudy mud, alluvial Mid
C3-1 3 N 10.14944 E 105.65372 Sunny mud, alluvial Mid
C3-2 > 20 N 10.15166 E 105.65788 Cloudy sand Mid
C3-3 6 N 10.15438 E 105.6593 Cloudy mud, alluvial Mid
C4-1 2 N 10.11021 E 105.70872 Sunny mud, alluvial Mid
C4-2 18 N 10.11487 E 105.71193 Sunny sand, alluvial Mid
C4-3 6 N 10.12169 E 105.71378 Sunny mud, alluvial Mid
C5 7 N 10.12711 E 105.68027 Rainy mud, debris Mid
C6 15 N 10.14195 E 105.6538 Sunny mud, debris Mid

59
i. Phytoplankton
131. One sample of phytoplankton in the surface water was collected with a net with a mesh size of 25 µm. The mouth of the net was submerged around 0.25-0.5 meters in water, and the speed of the net moving in the water was around 0.3 m/s. Samples were preserved in 5% formaldehyde. One quantitative sample was collected with a flow meter that had a volume of 60 liters. The identification and counting of different species of phytoplankton was undertaken utilizing an Olympus microscope. To convert counting data to cell quantity (individuals/m3) a Sedgewick Rafter plate was used.
ii. Zooplankton
132. One sample of zooplankton in the surface water was collected with a Juday net with a mesh size of 45 µm. The mouth of the net was submerged around 0.25-0.5 meters in water, and the speed of the net moving in the water was around 0.5 m/s. The samples were preserved in 5% formaldehyde. One quantitative sample was collected with a flow meter that had a volume of 60 liters. The identification and counting of different species of zooplankton was undertaken utilizing an Olympus microscope. To convert counting data to cell quantity (individuals/m3) a Sedgewick Rafter plate was used.
iii. Benthic Macrofauna
133. Three samples of benthic macrofauna per station were collected using a Ponar grab sampler with a bottom area of 0.025 m2. The samples were sieved through a sieve with a mesh size of 1 mm. and preserved in 5% formaldehyde. The identification and counting of different species of macrofauna was undertaken utilizing an Olympus microscope.
iv. Fish Species, Fisheries and Aquaculture
134. In order to describe fish species present, fisheries and aquaculture in an area approximately 4 kms upstream and downstream of the O Mon IV cooling water discharge outlet, interviews were undertaken and samples collected from fishermen and local fish markets in Can Tho and O Mon, and samples were preserved in 5-8% formaldehyde and the species identified. General information was also collected from the Department of Agriculture and Rural Department (DARD), Branch of Aquatic Product Protection of Can Tho City and Dong Thap province (personal communication Mrs. Diem). Interviews with 50 households on each side of the Hau River in the vicinity of the O Mon Thermal Power Complex (Thoi Loi and Than Phu) were carried out. Out of the selected households 10 were fishery households on the north riverside (Than Phu) and 3 on the south riverside (Thoi Loi). The results from the interviews were used to describe fisheries activities of households in the vicinity of the Project. Households engaged in fisheries were mostly fishing in the Hau River but some also used the O Mon River and Chanh Creek close to their outlets into the Hau River. The questions asked concerned catch per day of various species, income received from the selling of fish, and a description of fishing gear used. Observations of fishing activities and aquaculture in the Project area were carried out in May and July 2007.
b. Inventory of Aquatic Organisms
135. Primary data from the sampling of phytoplankton, zooplankton and benthic macrofauna are given in Appendices 4 to 6, respectively. Appendix 7 list fish species observed or reported in the Hau River.
i. Phytoplankton
136. The May 2007 survey identified 70 species of phytoplankton in waters of the Project area. The number of species within the phyla Cyanophyta (blue-green algae), Bacillariophyta,

60
(Diatoms) and Chlorophyta (green algae) were about equal (Figure 21). Data from the monitoring program concerning the construction of the Can Tho bridge about 20 kilometers downstream from the O Mon area showed that the number of species was almost identical in the same season (Figure 21). However, only 57% of the species were present in both areas. Almost all the species that did not occur in both areas were marine migratory species belonging to the phylum Bacillariophyta. Compared to samples from the O Mon area taken in August 1997 and 2005, more species belonged to the phylum Cyanophyta (EVN, 1998; PECC3, 2005). 137. The number of species in the 2007 survey was lower in the stations in the middle of the Hau River compared to stations near the banks. There were no general differences in species number between the Hau River compared to the O Mon River and Chanh Creek (Figure 22). The composition of species did not differ significantly between the sampling stations 138. The species Anabaena sp., Croocuccus sp., Microcystis aeruginosa, M. wesenbergi (Cyanophyta), Melosira granulata (Bacillariophyta) and Pediastrum duplex (Chlorophyta) were present at all stations in the Hau River, O Mon River and Chanh Creek in the 2007 survey. In all stations phytoplankton was totally dominated by the M. aeruginosa (Table 15). M. aeruginosa is a toxic blue green algae which is common in fresh and brackish water with high levels of nutrients, and can produce heavy algal blooms. When other factors such as nitrogen and phosphorus are not limiting, M. aeruginosa’s optimal growth range is at a water temperature around 20-22°C (Rapala 1998), and temperatures exceeding 30°C are unfavorable. According to the survey, impacts of cyanobacteria toxins on wildlife, domestic animals, and humans have been reported. Cyanobacteria toxins may for example cause allergic reactions and skin irritations in humans. Three of the most abundant species belong to the genus Microsystis. During the rainy season, the species Melosira granulata belonging to the phylum Bacillariophyta dominated in abundance in the Hau River, O Mon River and Chanh Creek (EVN 1998, PECC3 2005).
0
5
10
15
20
25
30
35
40
Cyanophyta Bacillariophyta Chlorophyta Euglenophyta
Perc
en
tag
e
Can Tho Mar 2007 n=68
O Mon May 2007 n=70
Figure 21: Percentage distribution of number of phytoplankton species in taxonomic groups during dry season in the O Mon area (Hau River, Chanh Creek and O Mon River) and Can Tho (Hau River), May 2007. n= number of species.

61
Table 15: Percentage of total abundance (cells/m3), of the dominant species of phytoplankton Microcystis aeruginosa in the Hau River (C1-C4), Chanh Creek (C5) and O Mon River (C6), May 2007
Station Percentage Abundance C1-1 97.6 9.42E+08 C1-2 95.8 1.58E+09 C1-3 95.1 3.39E+08 C2-1 82.7 1,71E+09 C2-2 91.4 1.63E+09 C2-3 98.7 2.01E+09 C3-1 96.1 5.29E+08 C3-2 99.2 1.45E+09 C3-3 98.4 1.45E+09 C4-1 98.3 1.88E+09 C4-2 97.6 1.21E+09 C4-3 97.0 1.20E+09 C5 91.0 4.77E+08 C6 95.5 1.03E+09
0
5
10
15
20
25
30
35
40
C1-1 C1-2 C1-3 C2-1 C2-2 C2-3 C3-1 C3-2 C3-3 C4-1 C4-2 C4-3 C5 C6
Station
Nu
mb
er
of
sp
ecie
s Cyanophyta
Bacillariophyta
Chlorophyta
Euglenophyta
Total
Figure 22: Number of species of phytoplankton in taxonomic groups in the Hau River (C1-C4), Chanh Creek (C5) and O Mon River (C6), May 2007
ii. Zooplankton
139. The May 2007 survey identified 41 species of zooplankton, with the highest numbers of species in the taxonomic groups Rotatoria, Cladocera and Copepoda. The species distribution was about the same as for the monitoring program undertaken at the Can Tho Bridge. During wet season sampling in August 1997 and 2005 in the O Mon area there were fewer crustacean species compared to May 2007 (EVN 1998, PECC3 2005). The species number and the composition of species did not show any major difference between the sampled stations in May 2007 (Figure 24). The total number of species was lower in August

62
1997 and 2005 compared to May 2007 (EVN 1998, PECC3 2005). The Rotatoria species Conochilus hippocrepsis and the larvae of Gastropoda, Bivalvia and Copepoda naupleus were present in all stations in the Hau River, O Mon River and Chanh Creek in May 2007. Also the Cladocera species Bosmina longirostris and the Copepoda species Thermocyclops hyalinus occurred in most of the stations. 140. Copepoda naupleus larvae dominated abundance in 71% of the sampled stations in the O Mon area in the May 2007 survey (Table 16). Copepoda naupleus larvae prefer a temperature of about 25°C. The Rotatoria species C. hippocrepsis was dominant in the other stations. C. hippocrepsis is a common species in fresh water with a high organic content. In the reproductive cycle of Rotatoria, production of cysts will occur in order to survive when environmental factors, such as temperature, are unfavorable. In the wet season in August, the Copepoda species Microcyclops varicans dominated the zooplankton fauna when sampling in the same areas as in the May 2007 survey (EVN 1998, PECC3 2005).
0
5
10
15
20
25
30
35
40
45
Protozoa Rotatoria Cladocera Copepoda Ostracoda
Perc
en
tag
e
Can Tho Mar 2007 n=68
O Mon May 2007 n=41
Figure 23: Percentage distribution of number of zooplankton species in taxonomic groups during dry season in the O Mon area (Hau River, Chanh Creek and O Mon River) and Can Tho (Hau River). n= number of species.
iii. Benthic Macrofauna
141. In May 2007, 53 species of benthic46 macrofauna were found in the O Mon area. The taxonomic groups Gastropoda, Bivalvia, Polychaeta and Amphipoda had the highest number of species (Figure 25). In contrast, data from the monitoring program concerning the construction of the Can Tho bridge showed that the highest number of species was concentrated to the taxonomic groups of Gastropoda and Bivalvia and that the other groups kept very few species. A possible explanation is that the stations in the O Mon area represent more diverse habitats compared to the Can Tho bridge area. 142. Compared to samples from the O Mon area taken in August 1997 and 2005, the number of species was much higher in the samples from May 2007 (EVN 1998, PECC3 2005). The species number and the composition of species did not show any general systematic difference between the sampled stations in May 2007 (Figure 26). For example number of species was not consistently higher in the shallow stations along the riverside compared to the deepest areas of the river.
46
Living on the bottom of the water body in question.

63
0
5
10
15
20
25
30
C1-1 C1-2 C1-3 C2-1 C2-2 C2-3 C3-1 C3-2 C3-3 C4-1 C4-2 C4-3 C5 C6
Station
Nu
mb
er
of
sp
ecie
s
Protozoa
Rotifera
Cladocera
Copepoda
Ostracoda
Larvae
Total
Figure 24: Number of species of zooplankton in taxonomic groups in the Hau River (C1-C4), Chanh Creek (C5) and O Mon River (C6), May 2007
143. The Oligochaeta species Dero sp. was the most common species found in the 2007 survey, occurring in 86% of the sampled stations, while Dero sp. was dominant in 36% of the sampled stations (Table 17). The Gastropoda species Sinotaia basicarinata and the Oligochaeta species Branchiura sowerbyi were also frequent. Most other species occurred only in a few stations. In August 1997 the Gastropoda species Corbicula baudoni was the most frequent species (EVN 1998). 144. The Gastropoda species Antimelania swinhoei is a species listed in the Vietnamese Red List as Vulnerable, which is the second highest risk category. A. swinhoei has become rare because of overexploitation for food consumption. A few individuals of this species were found in the Hau River on the opposite side of the planned outlets from the O Mon thermal power plants (C1-3) and in the Chanh Creek (C-5) (Figure 20).
Table 16: Percentage of total abundance (individuals/m3) of the dominant species of zooplankton in the Hau River (C1-C4), Chanh Creek (C5) and O Mon River (C6), May 2007
Station Species Percentage Abundance
C1-1 C. hippocrepsis 95.0 69 500 C1-2 Copepoda naupleus 59.6 28 500 C1-3 C. hippocrepsis 54.9 56 500 C2-1 Copepoda naupleus 40.0 10 000 C2-2 Copepoda naupleus 62.0 39 500 C2-3 Copepoda naupleus 42.6 102 000 C3-1 Copepoda naupleus 48.8 20 500 C3-2 Copepoda naupleus 32.5 57 000 C3-3 Copepoda naupleus 81.3 53 500 C4-1 Copepoda naupleus 47.1 8 500 C4-2 C. hippocrepsis 46.2 32 500 C4-3 Copepoda naupleus 68.3 30 000 C5 Copepoda naupleus 54.1 67 500 C6 C. hippocrepsis 50.0 30 000

64
0
5
10
15
20
25
30
35
40
Gas
tropo
da
Bivalvia
Polyc
haet
a
Isop
oda
Am
hipo
da
Olig
ocha
eta
Inse
cta
Larv
ae
Perc
en
tag
eCan Tho Mar 2007 n=27
O Mon May 2007 n=53
Figure 25: Percentage distribution of number of benthic macrofauna species in taxonomic groups during dry season in the O Mon area (Hau River, Chanh Creek and O Mon River) and Can Tho (Hau River). n= number of species.
0
2
4
6
8
10
12
14
16
18
C1-1 C1-2 C1-3 C2-1 C2-2 C2-3 C3-1 C3-2 C3-3 C4-1 C4-2 C4-3 C5 C6
Station
Nu
mb
er
of
sp
ecie
s
Gastropoda
Bivalvia
Polychaeta
Amhipoda
Oligochaeta
Insecta
Larvae
Total
Figure 26: Number of species of benthic fauna in taxonomic groups in the Hau River (C1-C4), Chanh Creek (C5) and O Mon River (C6) May 2007

65
Table 17: Percentage of total abundance (individuals/m2) of the dominating species of benthic macrofauna in the Hau River (C1-C4), Chanh Creek (C5) and O Mon River (C6), May 2007
Station Species Percentage Abundance
C1-1 Sinotaia basicarinata 50 160
C1-2 Crustacea larvae 15 4993
C1-3 Crustacea larvae 39 2440
C2-1 Corbicula baudoni 23 1040
C2-2 Dero sp. 50 160
C2-3 Corophium sp. 21 1220
C3-1 Dero sp. 24 1013
C3-2 Dero sp. 56 1180
C3-3 Dero sp. 36 560
C4-1 Sinotaia basicarinata 26 9687
C4-2 Dero sp. 40 200
C4-3 Branchiura sowerbyi 39 747
C5 Limnoperna siamensis 26 2680
C6 Limnoperna siamensis 91 4587
iv. Fish and Shellfish Fauna
145. Stationary Species. In the 2007 survey 55 fish species in the O Mon area were listed as stationary, most of which belong to the taxonomic groups Perciformes, Cypriniformes and Siluriformes (Table 18). In a survey including a large area of the Hau River, not only in the vicinity of the O Mon Thermal Power Complex, Nguyen Tanh Tung (2005) listed 95 fish species as stationary. 146. The shallow areas of the Hau River covered with water hyacinth in the O Mon area are used as spawning and nursery areas for many fish species (Figure 27). The north side of the river, opposite to the O Mon Thermal Power Plant Complex, has larger areas of shallow water covered with vegetation compared to the south side. The density of larvae and young fish in the Hau River ranges from 2 to 7 individuals per m3 from the deepest to the shallowest parts of the river (Nguyen Tanh Tung 2005). Thus, shallow areas in general, and especially on the north side of the river are the most important spawning and nursery areas for fish. 147. Migratory Species. In the 2007 survey 21 migratory fish species were found, most of them belonging to the same taxonomic groups as the stationary species (Table 18). There are two groups of migratory species: the fresh water group migrating into the O Mon area from upstream areas in the Mekong River and the estuarine group migrating from estuarine areas in the Mekong River delta near the sea. Examples of species from the first group are the genus Pangasius, Labiobarbus lineatus, Labiobarbus siamensis, Cirrhinus jullieni and Osteochilus microcephalus, while for the estuarine group gray eel-catfish (Plotosus canius), Boeseman croaker (Nibea soldado) and barramundi (Lates calcarifer) frequent the O Mon area. 148. The fish species in the fresh water group in the Mekong River generally move upstream in the dry season and downstream in the rainy season. Thus, more migratory species occur in the O Mon area of the Hau River during the rainy season (Figure 28). In particular during the rainy season eggs, larvae and young fish belonging to the shark catfishes (Pangasiidae) and minnows (Cyprinidae) drift into the O Mon area from the upper parts of the Mekong River. This passive drifting is important for the production of mature fish. The drifting into the O Mon area also tide-dependant, as eggs, larvae and young fish have no active movement like that of mature fish. Similar to the stationary fish species, shallow

66
areas of the Hau River are the most important nursery areas for migratory species. Some of the migrating fish species also move to inland waters through the O Mon River and Chanh Creek.
Figure 27: Shallow area along the riverside of the Hau River covered with water hyacinth 149. There are many crustacean species in the Hau River but only species of Green shrimps (genus Machrobrachium) have high economic value. The mother shrimps migrate to brackish water of the river close to sea where the eggs hatch. After metamorphosis the larvae migrate back to freshwater areas of the Hau River (PECC3 2007).
Table 18: Number of stationary, migratory, Vietnamese Red listed high economic value species in the Hau River, Chanh Creek and O Mon River in the vicinity of the O Mon Thermal Complex. Based on interviews and samples from fishermen and fish markets in May and July 2007
Taxonomic group Stationary Migratory Red list Fishery
Osteoglossiformes 2 1 2
Clupeiformes 2 1
Cypriniformes 15 6 1 11
Siluriformes 10 7 11
Beloniformes 2
Syngnathiformes 1
Synbranchiformes 3 2
Perciformes 20 6 4 11
Pleuronectiformes 2
Total 55 21 6 38

67
Figure 28: Upstream and downstream migration of taxonomic groups of fish species in the Mekong River during dry and wet season (after Mekong River Commission 2006)
v. Red Listed Fish Species
150. The 2007 survey found indications of six fish species that have some kind of listing in the Vietnamese Red List in the vicinity of the Project site (Table 19). These species have a
temperature optimum below 30°C and their reproduction period is mainly during the wet season. The fish species are mainly pelagic (www.fishbase.com). Four species are listed as vulnerable, which is the second highest risk category and a higher level than threatened. The giant bart (Catlocarpio siamensis) is listed as endangered (highest risk category), while the isok barb (Probarbus jullieni) and small scale mud carp (Cirrhinus microlepis) are listed as vulnerable in a survey including a large area of the Hau River, not only in the vicinity of the O Mon Thermal Power Plants (Nguyen Tanh Tung 2005). In the list from the International Union for Conservation of Nature and Natural Resources (IUCN) the isok barb is listed as endangered. All the species have been red listed because of overexploitation from fisheries, both in the Vietnamese and the IUCN Red List.
Table 19: Fish species listed in categories in the Vietnamese Red List and occurring in the vicinity of the O Mon Thermal Power Complex. Documentation was carried out from interviews and samples from fishermen and fish markets in May and July 2007. VU=Vulnerable, T=Threatened
English name Systematic name Category
Clown featherback Chitala ornata VU
Black sharkminnow Labeo chrysophekadion T
Finescale tigerfish Datnioides microlepis VU
Four-barred tigerfish Datnioides polota VU
Spotted archerfish Toxotes chatareus VU
Giant snakehead Channa micropeltes T

68
vi. Fisheries
151. Among 76 species listed in the survey of the fish fauna in May 2007 about 50% of the fishes were of economic value for the fishery in the O Mon area (Table 18). Most of the species used for fishery have a small maximum size, short life cycle and a high reproduction rate. Examples of such species are the Ganges river sprat (Corica sorbona) and the Yellow rasbora (Rasbora lateristritata) (Figure 29). There are also large sized fish species such as the Hampala barb (Hampala macrolepidota) and the Peacock eel (Mastacembelus armatus), but those species are of less importance to the fishery because of rare occurrence. Several species in the O Mon area are migratory and are only fished in the rainy season. Examples of such fishes are species from the genus Pangasius, Labiobarbus lineatus, Labiobarbus siamensis, Cirrhinus jullieni and Osteochilus microcephalus. The price of fishery catch differs significantly between species. The highest price is paid for green shrimps (Macrobrachium sp.) and the fish Ca bong lau (Pangasius krempfi) (Table 20).
Figure 29: Ganges river sprat (Corica sorbona) on the left, and the Yellow rasbora (Rasbora laterristritata) on the right
Table 20: Percentage of fishery catch and selling price per kg (VND) of different species in the vicinity of the O Mon Thermal Power Complex
English /Vietnamese name Systematic name Percentage Price
Yellow rasbora Rasbora laterristritata 24 12,273
Ganges river sprat Corica sorbona 24 12,273 Ca bong lau Pangasius krempfi 11 40,000 Java barb Barbonymus gonionotus 11 10,333 Sutchi catfish Pangasius hypophtalmus < 1 15,250 Paradise threadfin, Eastern paradise fish Polynemus paradiseus, P. dubius < 1 13,500 Gray eel-catfish Plotosus canius < 1 15,000 Green shrimp Machrobrancium sp. 1 50,000
Other undefined species of fish 28 35,000
Source: interviews of households involved in fisheries, July 2007.
152. During the field surveys in May and July 2007 fishing activity was noted in the vicinity of the O Mon Thermal Power Complex area. More fishing activities were noticed on the north side of the Hau River (Thanh Phu) compared to south side (Thoi Loi). The average yearly catch of fish and shrimps was about 800 kg for fishery households on both sides of the river. The total yearly catch of fish and shrimp in an area in Hau River about four kilometers

69
upstream and downstream from the outlets of the O Mon Thermal Power Plant Complex was estimated to about 1,400 tons with an estimated value of 30 billion VND. Many kinds of fishing equipment were observed, though the dominant equipment utilized was seine nets (Luoi Rung) (Figure 30). The nets are dragged in shallow water near the riverside and mostly catch small species of fish such as the Ganges river sprat and the Yellow rasbora. Bag nets are also mostly used to catch small species of fish.
Figure 30: Fishermen using seine net (Luoi Rung) in the Hau River Table 21: Percentage use of fishing equipment in the vicinity of the O Mon Thermal Power Complex Vietnamese name Description of fishing equipment Percentage
Luoi Rung Seine net 53 Luoi Bong Lau Cat fish net 17 Cha Fence with basket trap < 1 Don Long fence trap net 5 Luoi Me Vinh Java barb net 4 Day Bag nets 16 Dang me Inshore stake trap net < 1 Cau Hooks and lines 2 Lo Horizontal cylinder basket tram < 1 Luoi keo Trawl net and inland dredged net 1
Source: interviews of households involved in fisheries, July 2007.
vii. Aquaculture
153. In general aquaculture production is increasing in the Mekong River delta. The total aquaculture production of Can Tho City was about 150,000 tons in 2006. During the field survey carried out in May and July 2007 assessment of aquaculture facilities (cages, pens) in the Hau River and aquaculture ponds on land close to the river was undertaken. There were no observations of aquaculture facilities in the water along the south side of the Hau

70
River within four kilometers upstream and downstream from the cooling water outlets. However, on the north side opposite to the outlets, aquaculture facilities in the river were observed. There were also observations of 40-50 aquaculture ponds and the majority of them were situated on the north side of the river. One pond was situated close to the outlets of the O Mon Thermal Power Plants. The ponds use water from the Hau River. The species used for aquaculture production both in ponds and in the river were the native fish species Satchi catfish (Pangasius hypophthalmus) and Basa pangasid (Pangasius bocourti). B. Natural and Physical Conditions
1. Topography and Geology
154. The O Mon IV Thermal Power Project is located on a small island on the right bank of the Hau River, in the Thoi An and Phuoc Thoi wards of the O Mon District of Can Tho City, southern Viet Nam. The Project site and surrounding area is flat, with an average height of about 0.8 to 1.0 m, though some areas are up to 2.5 m. 155. The stratigraphy in the area consists of clay, clayey sand, clayey mud and, at the bottom, medium to coarse-grained sand. Based on a drilling program undertaken by PECC3, the local strata can be divided into 6 layers, as shown in Table 22.
Table 22: Stratigraphy at O Mon IV Project Site
Layer Thickness Material Color Remark
1 0.5-2.8 m Clay Yellow grey, light brown 2 8-14 m Clay, clay mud Dark grey Mud intermixed with fine sand 3 16-43 m Clay Green grey, yellow brown Lenses of sand 4 5-20,4 m Sand, muddy Grey, brown Clayey and muddy sand 5 24-45 m Clay Greyish brown Intermixed with fine sand 5a 0-7 m Clay Brownish grey Lenses of soft clay 6 Min 22 m Sand Grey, yellow grey Coarse to medium, from 70m
Source: PECC3, 2007a
2. Soils and Soil Quality
156. The superficial soil in the area is soft and clayey and weathered and often covered with a layer of alluvial sand arising from inundation from the Hau River. The geotechnical properties have not been measured, but the compression strength is probably low. 157. As the area is used for agriculture there is the potential for local soil to be affected by fertilizers and domestic pollution. In 2007 during preparation of the Vattenfall EIA six soil samples were collected and analyzed to establish a soil quality baseline. The location of the samples, numbered S01-S06, is shown in Figure 31. The samples were collected in hand-dug pits. The depth, material and colour of the samples are presented in Table 23, and the analytical certificate is presented in Appendix 8.

71
Table 23: Description of soil samples
Sample Depth in m Material Colour Remarks
S01 0.6 Sand Brown Well sorted S02 0.5 Clay, sandy Grey brown Sandier downwards S03 0.4 Clay, sandy Reddish brown Roots S04 0.6 Fine sand Yellowish brown Well sorted S05 0.5 Clay Brown O Mon IV area S06 0.5 Sand, clayey Brown O Mon III area
500 m
Groundwater sampling station
Soil sampling station
O Mon Power Plant Complex
500 m500 m
Groundwater sampling station
Soil sampling station
O Mon Power Plant Complex
Hau River
S01S02
S03
S04
S05
S06
W05
W04
W06
W03
W02
NN
Figure 31: Soil (S01-S06) and groundwater (W02-W06) sampling locations, 2007 survey 158. Analytical results are presented in Table 24 and compared with the Vietnamese standards applicable at that time. 47 The arsenic value in sample S02 equaled the Vietnamese maximum value. The total phosphorous value in sample S05 exceeded the norm, but if the material is considered as alluvium, the value is below the norm. As the sample was quite clayey, the lower norm is probably more applicable. The high value is most likely caused by the vicinity to human dwellings.
47
TCVN 5941:1995 - Maximum allowable limits of pesticide residues in the soil; TCVN 7209:2002 - Maximum allowable limits of heavy metals in the soil; and TCVN 7374:2004 - Index values of total phosphorus content in the soil.

72
159. The serious pollutants cadmium and pesticides/herbicides all showed values below the detection limit for the analytical method used. Mercury showed a maximum value of 0.075 mg/kg. In the absence of a Vietnamese standard, this value is low compared to European and Canadian standards or guideline values. All other metals showed low values. Sample S01 shows a higher oil and grease-value than the other samples, but the value is still low compared to European guideline values. 160. The two remarkable differences between the samples were with respect to the pH value, and the NH4
+ value, respectively. For sample S02, pH was 3.19, which is extremely acidic, and the NH4
+ 51.8 mg/kg, 35 times higher than the second-highest value. There are acidic soil types in the area, but it is not clear if this is the explanation. The extreme increase in NH4
+ was most likely due to pollution caused by human activity. 161. From the Thermal Power Complex area, samples S05 and S06 showed some differences. Most noticeable was the salinity, which was 403.3 mg/kg in S06 and only 61.4 mg/kg in S05. S06 had slightly higher values for oil and grease, NH4
+, NO3- and aluminum,
but all these values were low. The amount of cadmium and pesticides/herbicides were below detection limit in both samples.
Table 24: Soil samples analytical results
Element SO1 SO2 SO3 SO4 SO5 SO6 Unit VS*
Oil & Grease 100,3 25,6 36,1 22,1 29,6 43,9 mg/kgNH4+ 0,78 51,8 1,18 0,81 1,01 1,47 mg/kg
NO2- nd (0,1) nd (0,1) 0,3 nd (0,1) 1,3 0,2 mg/kg
NO3- nd (1,0) 9,9 7,5 nd (1,0) 4,0 5,3 mg/kg
Salinity 17,5 93,5 46,8 17,5 61,4 403,3 mg/kg
Al 0,52 2,3 2,4 0,52 2,0 2,5 %
As 5,9 12,0 9,2 nd (5) 10,0 5,9 mg/kg 12
Cd nd (0,2) nd (0,2) nd (0,2) nd (0,2) nd (0,2) nd (0,2) mg/kg 10
Cr 11,8 31,3 30,8 12,0 27,1 30,9 mg/kg
Cu 4,7 21,1 27,2 5,3 22,0 22,3 mg/kg 100
Fe 1,4 4,2 3,2 1,3 3,5 2,7 %Hg nd (0,02) 0,056 0,075 nd (0,02) 0,052 0,051 mg/kg
Mn 0,023 0,009 0,048 0,018 0,1 0,018 %
Pb 8,0 25,4 23,2 7,2 20,1 19,5 mg/kg 300
pH 6,19 3,19 5,61 7,45 7,7 5,02
P total 0,023 0,023 0,035 0,021 0,053 0,021 % 0,04 0,10 Alluvium
Zn 24,2 36,7 60,8 24,5 63,3 56,5 mg/kg 300
Pest/Herb - nd (0,5) nd (0,5) - nd (0,5) nd (0,5) ppb 100
nd (0.5) = not detected, detection limit 0.5
* Vietnamese standard. No World Bank standard
3. Mineral Resources
162. There are no mines in the area and no known mineral deposits. However, the clay in the southeastern area is of good quality and is used for brick making on a small industrial scale. There is also extensive sand mining from the bottom of the Hau River by either sand pump dredgers or excavators. This sand mining is so intensive that it could potentially alter the course of the main current in the river and affect erosion rates. However, an EIA approved by the DONRE in Can Tho is required for every application for a concession to mine the river.

73
4. Geohazards
163. A review of available studies indicates that the Project area is in a low risk area for earthquake hazards. According to Hai and Trieu (2006), the Project is located in the “Hau and Tien Rivers” fault area where the risk of earthquakes is low or absent. According to the Vietnam Institute of Geophysics (2005) the maximum credible earthquake in the area is reported as M=6.1 on the Richter scale, while Cau 2006 rates the area as low risk (see Figure 32). According to the Vietnamese Construction Standard (Volume 3), the maximum seismic activity on the MSK-64 scale is Imax=7.48 Finally, Trieu et al., (2002, as referenced in the Vattenfall EIA), also note that Can Tho belongs to a region where the “indication of earthquake is very weak”. 164. There is a risk of erosion and failure along the banks of the Hau River. It is not clear to what extent dredging in the area is exacerbating this problem.
5. Water Resources
a. Ground Water Resources
165. Based on a drilling program undertaken by PECC3 in 2005 there are two ground water layers in the area. The first is a shallow groundwater layer at a depth of 0.5-2.5 m,
48 The Medvedev-Sponheuer-Karnik (MSK-64) scale, is a macroseismic intensity scale used to evaluate the severity of ground shaking on the basis of observed effects in an area of the earthquake occurrence. The scale grades are as follows: I. Not perceptible. Not felt, registered only by seismographs. No effect on objects. No damage to buildings.
II. Hardly perceptible. Felt only by individuals at rest. No effect on objects. No damage to buildings.
III. Weak. Felt indoors by a few. Hanging objects swing slightly. No damage to buildings.
IV. Largely observed. Felt indoors by many and felt outdoors only by very few. A few people are awakened. Moderate vibration. Observers feel a slight trembling or swaying of the building, room, bed, chair etc. China, glasses, windows and doors rattle. Hanging objects swing. Light furniture shakes visibly in a few cases. No damage to buildings.
V. Fairly strong. Felt indoors by most, outdoors by few. A few people are frightened and run outdoors. Many sleeping people awake. Observers feel a strong shaking or rocking of the whole building, room or furniture. Hanging objects swing considerably. China and glasses clatter together. Doors and windows swing open or shut. In a few cases window panes break. Liquids oscillate and may spill from fully filled containers. Animals indoors may become uneasy. Slight damage to a few poorly constructed buildings.
VI. Strong. Felt by most indoors and by many outdoors. A few persons lose their balance. Many people are frightened and run outdoors. Small objects may fall and furniture may be shifted. Dishes and glassware may break. Farm animals may be frightened. Visible damage to masonry structures, cracks in plaster. Isolated cracks on the ground.
VII. Very strong. Most people are frightened and try to run outdoors. Furniture is shifted and may be overturned. Objects fall from shelves. Water splashes from containers. Serious damage to older buildings, masonry chimneys collapse. Small landslides.
VIII. Damaging. Many people find it difficult to stand, even outdoors. Furniture may be overturned. Waves may be seen on very soft ground. Older structures partially collapse or sustain considerable damage. Large cracks and fissures opening up, rockfalls. IX. Destructive. General panic. People may be forcibly thrown to the ground. Waves are seen on soft ground. Substandard structures collapse. Substantial damage to well-constructed structures. Underground pipelines ruptured. Ground fracturing, widespread landslides.
X. Devastating. Masonry buildings destroyed, infrastructure crippled. Massive landslides. Water bodies may be overtopped, causing flooding of the surrounding areas and formation of new water bodies.
XI. Catastrophic. Most buildings and structures collapse. Widespread ground disturbances, tsunamis.
XII. Very catastrophic. All surface and underground structures completely destroyed. Landscape generally changed, rivers change paths, tsunamis.

74
which is mainly fed by rain, surface and river water. The groundwater is polluted, has been highly exploited previously by local residents, and is apparently not widely used anymore. 166. The deeper groundwater is located in a medium to coarse-grained sandy layer at approximately 70 m depth. The thickness of the layer is not known, but it is at least 22 m since this was the last layer encountered, and drilling was stopped after 92 m of drilling with no change in the layering for the last 22 m. The groundwater is not artesian; the direction of flow is not known, but it likely follows the general topography of the area. 167. The deeper groundwater is used as a water source by households in the area, with well depths ranging from 70 to 100 m. The water seems to exist in sufficient amount for present use. There is no plan to use this groundwater for the power plant.
Figure 32: Maximum credible earthquake zones in Viet Nam (Ngo et. al., 2008). Can Tho is in the lowest risk category for Viet Nam.
b. Ground Water Quality
168. In 2007 during preparation of the Vattenfall EIA groundwater samples were collected and analyzed from a total of five deep groundwater wells. The location of the wells, numbered W02-W06, is shown in Figure 31. Sample W01 could not be collected, as no well was found in the area southeast of Chanh Creek, near the place where soil sample SO1 was collected. Analytical results are presented in Table 25, and the analytical certificate is presented in Appendix 9. Where relevant the results are compared to three groundwater samples analyzed by PECC3 (2007).

75
169. The analytical results show that the groundwater is of fairly good quality, possibly with the exception of sample W02, where the conductivity, NH4+, salinity and arsenic levels were higher than in the other samples. No value exceeds the Vietnamese standard at the time, shown in Table 25. There is no World Bank guideline for ground water. Oil and grease, NO2-, NO3-, cadmium, chromium and mercury all have values below the detection limit for all samples. 170. The sample W05, collected upstream of the O Mon area, shows slightly higher conductivity and salinity than the samples from the channel area. Sample W06, collected across the Hau River, had lower levels of NH4+, total P, Fe and turbidity. 171. The arsenic value in sample W02 indicates minor impacts from a pollution source, but all the other values are acceptable. Compared to the three ground water samples collected by PECC3, the pH level is somewhat lower (average 6.92 instead of 7.23). The conductivity (EC) is slightly higher for two samples and twice as high for sample W02. 172. From the results it can be concluded that W02 was likely affected by a pollution source, whereas the other samples indicate fairly good water quality. No groundwater samples were collected at the sites of the thermal power plants, since these wells were to be removed as part of the site clearing and leveling process.
c. Surface Water – Hydrology
173. The O Mon IV Project is designed to use the Hau River as a source of cooling water and as a receiver of effluent. This section discusses the available data on the flow characteristics of the river. 174. The Hau River is a downstream distributary of the Mekong River. Based on data from the Can Tho meteorological station cited in the 2007 PECC3 EIA, its annual average flow is 2,440 m³/s (Table 26). The rainy season raises the peak to more than three times the mean and accounts for more than 70% of the annual total. During the dry season, the flow falls to a minimum in April.
175. The river depth is characterized by a predominantly semi-diurnal tide with amplitudes strongly affected by the season. The rainy season lowers the amplitude to less than 0.4 m, while lower flow volume in the dry season raises it to above 2 m. Tides also impart a reversal in river currents that are most pronounced also in the dry season. Data used in both the 2007 PECC3 and 2008 Vattenfall EIA assigned a value of about 1 m/s for the amplitude of the dry season surface currents. 176. Periods of drought will reduce the discharge from the river. During such cases the intrusion of saline water from the South China Sea into the Hau and the Mekong River in general will intensify. The levels of water in the river will therefore not be significantly affected by the lack of rain, although the large tidal range typical of the dry season will persist. 177. The 2008 Vattenfall EIA took bathymetric soundings of the receiving waters off the O Mon shoreline. The resulting profile of the river is reproduced in Figure 33. The mean depth of the river during the time of the sampling is about 15 m, with a maximum below 22 m near the intakes.
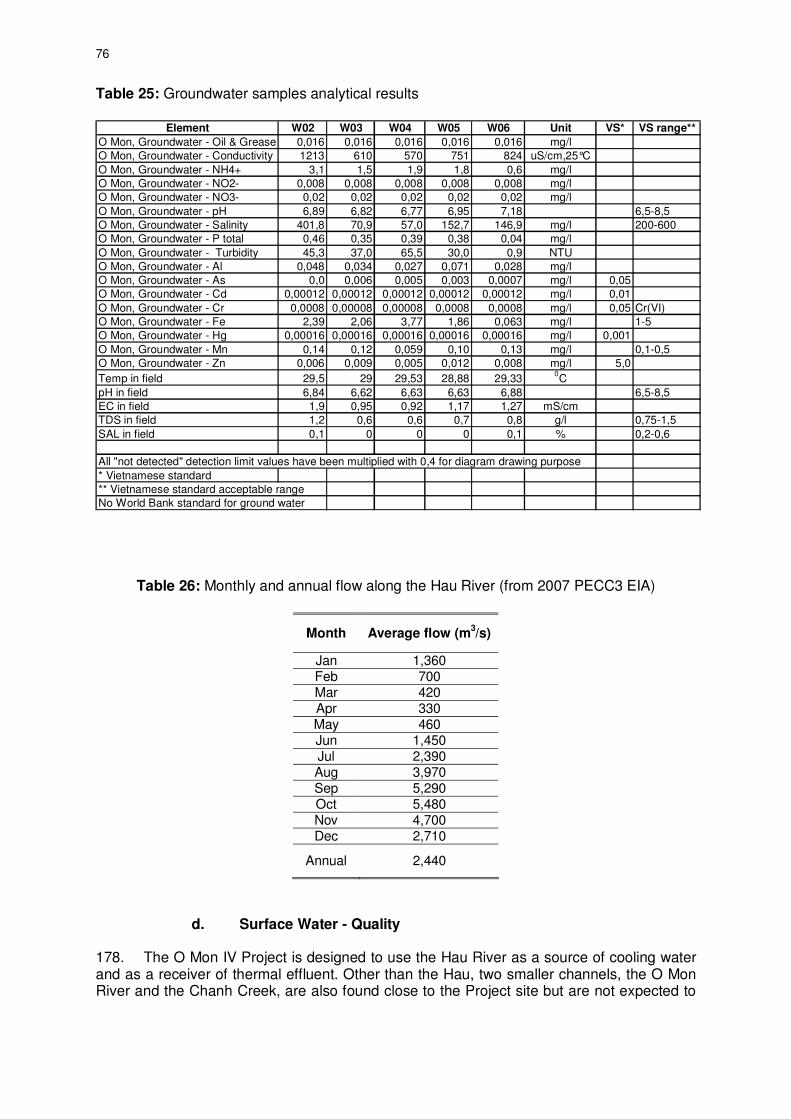
76
Table 25: Groundwater samples analytical results
Element W02 W03 W04 W05 W06 Unit VS* VS range**
O Mon, Groundwater - Oil & Grease 0,016 0,016 0,016 0,016 0,016 mg/lO Mon, Groundwater - Conductivity 1213 610 570 751 824 uS/cm,25°C
O Mon, Groundwater - NH4+ 3,1 1,5 1,9 1,8 0,6 mg/lO Mon, Groundwater - NO2- 0,008 0,008 0,008 0,008 0,008 mg/lO Mon, Groundwater - NO3- 0,02 0,02 0,02 0,02 0,02 mg/l
O Mon, Groundwater - pH 6,89 6,82 6,77 6,95 7,18 6,5-8,5O Mon, Groundwater - Salinity 401,8 70,9 57,0 152,7 146,9 mg/l 200-600O Mon, Groundwater - P total 0,46 0,35 0,39 0,38 0,04 mg/l
O Mon, Groundwater - Turbidity 45,3 37,0 65,5 30,0 0,9 NTUO Mon, Groundwater - Al 0,048 0,034 0,027 0,071 0,028 mg/lO Mon, Groundwater - As 0,0 0,006 0,005 0,003 0,0007 mg/l 0,05O Mon, Groundwater - Cd 0,00012 0,00012 0,00012 0,00012 0,00012 mg/l 0,01
O Mon, Groundwater - Cr 0,0008 0,00008 0,00008 0,0008 0,0008 mg/l 0,05 Cr(VI)O Mon, Groundwater - Fe 2,39 2,06 3,77 1,86 0,063 mg/l 1-5O Mon, Groundwater - Hg 0,00016 0,00016 0,00016 0,00016 0,00016 mg/l 0,001
O Mon, Groundwater - Mn 0,14 0,12 0,059 0,10 0,13 mg/l 0,1-0,5O Mon, Groundwater - Zn 0,006 0,009 0,005 0,012 0,008 mg/l 5,0
Temp in field 29,5 29 29,53 28,88 29,330C
pH in field 6,84 6,62 6,63 6,63 6,88 6,5-8,5EC in field 1,9 0,95 0,92 1,17 1,27 mS/cmTDS in field 1,2 0,6 0,6 0,7 0,8 g/l 0,75-1,5
SAL in field 0,1 0 0 0 0,1 % 0,2-0,6
All "not detected" detection limit values have been multiplied with 0,4 for diagram drawing purpose
* Vietnamese standard** Vietnamese standard acceptable rangeNo World Bank standard for ground water
Table 26: Monthly and annual flow along the Hau River (from 2007 PECC3 EIA)
Month Average flow (m3/s)
Jan 1,360 Feb 700 Mar 420 Apr 330 May 460 Jun 1,450 Jul 2,390 Aug 3,970 Sep 5,290 Oct 5,480 Nov 4,700 Dec 2,710
Annual 2,440
d. Surface Water - Quality
178. The O Mon IV Project is designed to use the Hau River as a source of cooling water and as a receiver of thermal effluent. Other than the Hau, two smaller channels, the O Mon River and the Chanh Creek, are also found close to the Project site but are not expected to

77
be directly affected by the operations of the power plant. This section discusses the quality of these surface waters based on the monitoring done during the two previous studies. 179. The 2007 PECC3 EIA collected surface water data in August 2005 at 10 stations which were analyzed for 12 parameters. Four of these stations were along the Hau River. The 2008 Vattenfall EIA used 14 stations of which all but two were along the Hau. Unlike the PECC3 report, dry season conditions (May 2007) are represented in the latter. A map of the sampling stations used in the two studies is presented in Figure 34. A table combining the results of the two studies is presented in Table 27. The analytical certificate for the Vattenfall EIA analysis is presented in Annex 10. No analytical certificates are available for the PECC3 studies.
Figure 33: Bathymetry of the Hau River near the O Mon Power Complex (from the 2008 Vattenfall EIA). Note that axis values are in grid distance units of 50 m.
180. As expected, temperatures along the Hau are slightly warmer in the dry season, although the two datasets show that the approximate difference in their average is less than 1°C. None of the readings in both sets are above 31.6°C or below 30.0°C. 181. Values of pH are slightly on the alkali side along the Hau River in both studies, but well within allowable range of 6 to 8.5 as specified in the QCVN08:2008/BTNMT standards. Levels of oil and grease during both seasons are below 0.1 mg/L, also within the QCVN08:2008/BTNMT guideline of 0.2 mg/L. 182. The impact of human activity in the area is indicated by counts of Total Coliform, which are elevated in both seasons and occasionally above the guideline of 5,000 MPN/100 ml in both data sets. 183. Differences in the two results reveal some seasonal changes in water quality. Wet season readings of Total Suspended Solids are all above 80 mg/L, while dry season values along the Hau all fall below 70 mg/L. Levels of ammonia and phosphates are all markedly higher during the wet season than in the dry. This result indicates the influence of runoff on the water quality of the Hau River.

78
Table 27: Results of surface water monitoring around the O Mon Power Plant Complex
Station Temp (C°)
pH Cond. (µS/m)
Salinity (ppt)
Turb. (NTU)
TSS (mg/L)
TDS (mg/L)
DO (mg/L)
BOD5 (mg/L)
COD (mg/L)
Total P (mg/L)
NH4+
(mg/L)
Oil & Grease (mg/L)
Total Fe (mg/L)
Total coliform (MPN)
E. coli (MPN)
C1-1 31.6 7.2 185 0 20 32 105 5.5 7.0 12 0.67 0.41 0.12 0.48 24,000 4
C1-2 31.0 7.1 186 0 19 12 102 6.5 8.0 13 0.66 0.16 0.09 0.32 2,400 2
C1-3 31.0 7.1 182 0 26 25 102 5.2 2.0 3 0.51 0.15 0.03 0.25 4,600 5
C2-1 30.8 7.1 190 0 24 67 104 5.8 6.0 11 0.84 0.25 0.02 0.23 930 6
C2-2 30.8 7.1 179 0 19 23 102 6.6 7.0 10 0.77 0.17 0.03 0.11 11,000 2
C2-3 30.7 7.2 162 0 23 28 104 6.4 3.0 4 0.64 0.22 0.07 0.39 1,100 1
C3-1 30.8 7.0 182 0 24 28 103 5.4 8.0 10 0.89 0.37 0.10 0.45 21,000 5
C3-2 31.0 7.0 173 0 25 27 102 6.9 2.0 3 0.66 0.18 0.04 0.35 430 0
C3-3 31.0 7.0 178 0 28 32 103 5.4 1.0 3 0.60 0.19 0.06 0.23 11,000 3
C4-1 31.5 7.1 199 0 21 30 108 4.8 2.0 4 0.75 0.38 0.17 0.54 21,000 7
C4-2 31.5 7.0 178 0 14 18 103 7.4 4.0 5 0.52 0.18 0.00 0.33 46,000 1
C4-3 31.3 7.0 179 0 14 10 104 6.2 6.0 8 0.53 0.12 0.07 0.28 24,000 5
C5 30.0 6.9 175 0 14 9 104 6.8 7.0 10 0.92 0.30 0.03 0.39 2.4×10⁶ 11
C6 31.0 7.1 178 0 12 7 104 7.4 2.0 3 0.74 0.19 0.11 0.61 24,000 3
M1 30.7 7.4 84 0 - 110 - - 3.5 - 0.13 0.05 0.05 0.34 3,500 -
M2 30.6 7.5 89 0 - 102 - - 3.1 - 0.15 0.07 0.04 0.47 5,400 -
M3 30.4 7.4 97 0 - 121 - - 3.9 - 0.10 0.06 0.07 0.63 4,900 -
M4 31.0 7.1 101 0 - 92 - - 4.2 - 0.12 0.07 0.10 0.56 9,300 -
M5 30.8 6.9 108 0 - 81 - - 2.0 - 0.13 0.06 0.04 0.74 6,900 -
M6 30.7 7.4 96 0 - 128 - - 3.4 - 0.12 0.08 0.03 0.51 9,300 -
M7 30.5 7.2 110 0 - 113 - - 3.2 - 0.10 0.06 0.02 0.54 5,600 -
M8 31.1 7.0 147 0 - 96 - - 3.6 - 0.10 0.10 0.03 0.61 11,000 -
M9 30.9 6.8 126 0 - 86 - - 2.8 - 0.08 0.06 0.04 0.57 8,900 -
M10 30.6 7.1 133 0 - 92 - - 2.9 - 0.07 0.08 0.03 0.64 9,300 -
Notes: Samples from Stations C1 to C6 were collected in May 2007 (dry season) for the 2008 Vattenfall EIA. Samples from Stations M1 to M10 were collected in August 2005 (wet season) for the 2007 PECC3 EIA. Blank cells indicate no measurements were taken.

79
C3-1C3-2
C3-3
C2-1
C2-2
C2-3
C1-1
C1-2
C1-3
C4-1
C4-2
C4-3
NN
M3
M7
M1
M2M4
M5
M6
M10
M9
M8
1 km
Dry season surface water sampling
station used in 2008 Vattenfall EIA
Wet season surface water sampling
stations used in 2007 PECC3 EIA
O Mon Power Plant Complex
1 km1 km
Dry season surface water sampling
station used in 2008 Vattenfall EIA
Wet season surface water sampling
stations used in 2007 PECC3 EIA
O Mon Power Plant Complex
Hau River
Figure 34: Dry and wet season sampling stations used in the PECC3 (2007) and Vattenfall (2008) surface water quality sampling 184. Comparing BOD5 levels in the two seasons covered by the two reports finds a slight difference in average but a large disparity in ranges. All the four wet season values along the Hau River stations in the 2007 PECC3 EIA are between 3 and 4 mg/L. By contrast, the three transect lines used in the 2008 Vattenfall EIA close to the Project site show the BOD5 concentrations to be above 5 mg/L at the southern bank and below 4 mg/L in the opposite bank. If only the southern bank stations are compared, BOD5 levels along the Hau appear to be higher in the wet season than in the dry. Further monitoring should reveal whether this wet-dry season pattern is followed in the other years. 185. Values of dissolved oxygen, turbidity and other parameters were also collected in the 2008 Vattenfall EIA, but no readings were made for the wet season. These values are also shown in Table 27. What can be concluded from the observations is that the Hau River has marginal water quality typical of water bodies crossing mixed land use similar to O Mon. 186. The 2008 Vattenfall EIA analyzed the dry season samples for total iron (Fe), zinc (Zn), cadmium (Cd), arsenic (As), total chromium (Cr), mercury (Hg), manganese (Mn). The 2007 PECC3 EIA analyzed the wet season samples only for iron, which are shown in Table 27. 187. There is a high degree of variation in the iron readings among the dry season data, with concentrations more than doubling across transect points. Values at the south bank are generally higher than the northern bank. Wet season iron concentrations are also significantly lower than in the dry other season. No explanation was provided for the variation.

80
188. Heavy metal concentrations in surface water are unremarkable, with most showing concentrations below detection limits and all well below QCVN guidelines.
e. Temperature and River Flow
189. The 2007 PECC3 EIA gathered monthly averaged temperature and flow data between 1977 to 2005 along the Hau from the Can Tho station of the NHMS. The data are presented in Figure 35. 190. Some conclusions can be drawn from these observations. First, except for an unexpectedly high value for January (which registers a mean temperature higher than those of December and February), the pattern of monthly river temperatures mirrors monthly air temperatures discussed in an earlier section. 191. Second, the Can Tho station data shows the highest mean monthly temperature along the Hau River to be 32.2°C in May. This value is critical because the Viet Nam guideline governing thermal effluent regulates the actual temperature rather than the temperature increase. This mean monthly value should therefore be assumed to be the worst-case intake temperature in the thermal plume modeling. 192. Finally, ignoring the January value, an inverse relationship between flow and temperature can be discerned. This implies that drought conditions that may bring about weaker flow can cause the river to be warmer than usual. Conversely, ample rainfall and strong flow will bring about cooler river temperatures. These factors are discussed in the impact assessment section.
Figure 35: Mean monthly flow and temperature along the Hau River (data from Can Tho Station of the NHMS, as used in the 2007 PECC3 EIA)

81
6. Sediment Quality
193. The Vattenfall survey programs measured levels of zinc (Zn), cadmium (Cd), chromium (Cr), manganese (Mn), arsenic (As) and mercury (Hg) in order to assess the extent of heavy metal contamination of the creek and river sediments (Table 28). In general there was no systematic difference in the content of heavy metals between the stations in the Hau River, Chanh Creek and O Mon River. There are no Vietnamese standards for the content of heavy metals in sediments. However, all the values of heavy metals are considered to be low when compared to the classification of sediments in fresh water according to the Swedish Environmental Protection Agency (Naturvårdsverket 1999). The laboratory analytical certificate is presented in Appendix 11. Table 28: Zinc (Zn), cadmium (Cd), chromium (Cr), manganese (Mn), arsenic (As) and mercury (Hg) (mg/kg DW) in sediment from the Hau River (C1-C4), Chanh Creek (C5) and O Mon River (C6) May 2007
Station Zn Cd Cr Mn As Hg
C1-1 36.65 0.69 4.85 15.38 4.43 0.02
C1-2 5.17 < 0.05 0.93 4.51 < 0.01 < 0.01
C1-3 26.08 0.55 4.08 18.29 2.38 0.01
C2-1 46.47 0.38 8.21 21.94 9.51 0.03
C2-2 9.29 0.20 0.24 3.95 < 0.01 < 0.01
C2-3 32.56 0.16 3.36 17.87 0.24 0.01
C3-1 39.24 1.57 4.47 12.09 1.12 0.03
C3-2 14.05 0.09 0.55 6.82 1.08 0.01
C3-3 35.95 0.62 6.59 14.17 3.21 0.01
C4-1 42.33 1.21 5.79 12.53 1.69 0.01
C4-2 2.12 < 0.05 0.15 2.67 0.07 < 0.01
C4-3 21.36 0.25 3.63 6.93 2.66 0.02
C5 40.86 0.92 7.70 13.04 3.41 0.03
C6 41.10 2.96 6.81 16.49 3.89 0.01
7. Climate
a. Data Sources
194. Climate at the Project site was described in the PECC3 EIA and, to a lesser extent, the Vattenfall EIA (2008). Additional data for the region was obtained from TRC, a supplier of processed meteorological data.
b. Temperature and Rainfall
195. The PECC3 EIA summarized meteorological conditions in the Can Tho area. Mean monthly and annual values for key weather variables are presented in Table 29. 196. Conditions at the Project site are always warm and humid, typical of tropical and near-coastal conditions. There is however a pronounced difference in rainfall between the wettest and driest months. Temperatures are highest in April just before the start of the rainy season.
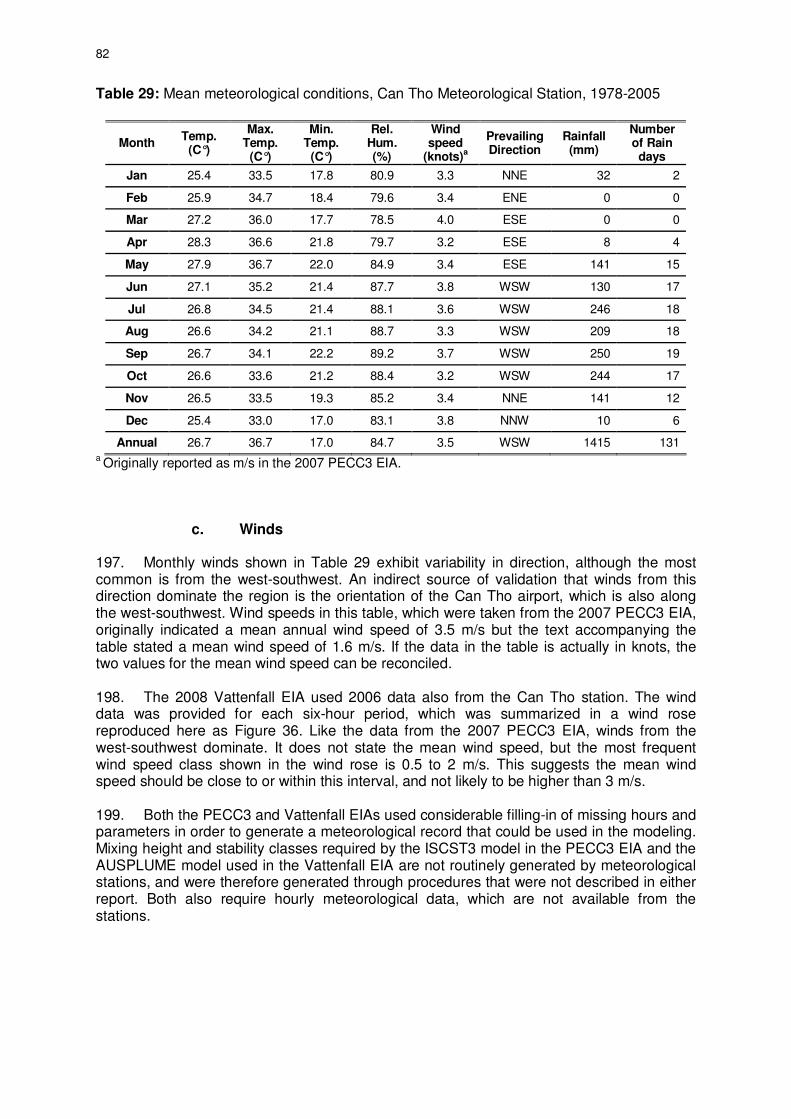
82
Table 29: Mean meteorological conditions, Can Tho Meteorological Station, 1978-2005
Month Temp.
(C°)
Max. Temp.
(C°)
Min. Temp.
(C°)
Rel. Hum. (%)
Wind speed
(knots)a
Prevailing Direction
Rainfall (mm)
Number of Rain days
Jan 25.4 33.5 17.8 80.9 3.3 NNE 32 2
Feb 25.9 34.7 18.4 79.6 3.4 ENE 0 0
Mar 27.2 36.0 17.7 78.5 4.0 ESE 0 0
Apr 28.3 36.6 21.8 79.7 3.2 ESE 8 4
May 27.9 36.7 22.0 84.9 3.4 ESE 141 15
Jun 27.1 35.2 21.4 87.7 3.8 WSW 130 17
Jul 26.8 34.5 21.4 88.1 3.6 WSW 246 18
Aug 26.6 34.2 21.1 88.7 3.3 WSW 209 18
Sep 26.7 34.1 22.2 89.2 3.7 WSW 250 19
Oct 26.6 33.6 21.2 88.4 3.2 WSW 244 17
Nov 26.5 33.5 19.3 85.2 3.4 NNE 141 12
Dec 25.4 33.0 17.0 83.1 3.8 NNW 10 6
Annual 26.7 36.7 17.0 84.7 3.5 WSW 1415 131 a Originally reported as m/s in the 2007 PECC3 EIA.
c. Winds
197. Monthly winds shown in Table 29 exhibit variability in direction, although the most common is from the west-southwest. An indirect source of validation that winds from this direction dominate the region is the orientation of the Can Tho airport, which is also along the west-southwest. Wind speeds in this table, which were taken from the 2007 PECC3 EIA, originally indicated a mean annual wind speed of 3.5 m/s but the text accompanying the table stated a mean wind speed of 1.6 m/s. If the data in the table is actually in knots, the two values for the mean wind speed can be reconciled. 198. The 2008 Vattenfall EIA used 2006 data also from the Can Tho station. The wind data was provided for each six-hour period, which was summarized in a wind rose reproduced here as Figure 36. Like the data from the 2007 PECC3 EIA, winds from the west-southwest dominate. It does not state the mean wind speed, but the most frequent wind speed class shown in the wind rose is 0.5 to 2 m/s. This suggests the mean wind speed should be close to or within this interval, and not likely to be higher than 3 m/s. 199. Both the PECC3 and Vattenfall EIAs used considerable filling-in of missing hours and parameters in order to generate a meteorological record that could be used in the modeling. Mixing height and stability classes required by the ISCST3 model in the PECC3 EIA and the AUSPLUME model used in the Vattenfall EIA are not routinely generated by meteorological stations, and were therefore generated through procedures that were not described in either report. Both also require hourly meteorological data, which are not available from the stations.

83
Figure 36: Annual (2006) wind rose for Can Tho (from 2008 Vattenfall EIA) 200. Due to the absence of the data needed for modeling, another source of meteorological information was used in this report. The modeling data for Can Tho came from a two-step process. The first step used data generated by the MM5 model, which is a weather forecasting computer program applied to the processing of global weather station records to produce a four-dimensional meteorological database. A 1° x 1° tile from a 2006 MM5 model run covering the Project area was purchased from the Atmospheric Studies Group of TRC (www.src.com). 201. The second step in generating meteorological data for modeling was to run the CALMET preprocessor of the CALPUFF modeling system (Scire et al. 2000), the dispersion model used in this study. The CALMET program was used to downscale the coarse (12 km) grid data of the MM5 model into fine (1 km) grid data suitable for modeling. Downscaling involves interpolation in space followed by an adjustment algorithm to ensure physical consistency in the flow. 202. A time series of wind data at the O Mon complex was extracted from the CALMET output for presentation. A summary is presented as an annual wind rose in Figure 37. The extract is remarkably similar to the 2006 wind rose in the Vattenfall EIA in the dominance of winds from the southwest, west-southwest and southeast. However, the monthly wind roses do not always reflect the same prevailing wind direction as the monthly summary in the 2007 PECC3 EIA. The mean wind speed in the extract is 2.4 m/s, which is higher than the corrected long-term average reported in the 2007 PECC3 EIA. Annual variability in the flow is the most likely explanation for the differences. Winds from the northwest are rare but are worth noting because they tend to have lower wind speeds that can contribute to the highest short-term concentrations.

84
Figure 37: Annual wind rose at O Mon based on 2006 CALMET extract 203. The use of processed meteorological data for modeling is approved by many regulatory agencies, including in Canada, the US and Australia. Canada and US agencies allow MM5 model outputs for use in dispersion modeling, while Australia uses another weather forecasting/preprocessor called TAPM (Hurley et al. 2005) for the same application. Additional details on the CALPUFF modeling system are presented in the impact assessment section of this report.
8. Air Quality
a. Sources of Data and Basis of Assessing Data Quality
204. The two sources of baseline air quality at the Project site are the two previous EIA reports for the O Mon IV Project: the 2007 MONRE-approved EIA prepared by the PECC3 (2007) and the 2008 Vattenfall EIA. 205. A key basis for the usefulness and quality of air quality measurements is how well a sampling station was set up. USEPA (1987) ambient monitoring guidelines recommend that the following be observed when selecting a position for sampling:
- Sufficient distance from flow obstructions such as walls and structures (10 times the height of the obstruction).
- At least 10 m from the dripline of trees. - Ground cover of low grass to prevent dust uptake. - At least 5 m away from the nearest road lane; up to 20 meters away for high-
traffic areas.

85
Figure 38: Monthly wind roses at O Mon based on 2006 CALMET extract

86
206. Non-observance of these guidelines can cause the sampling to be unrepresentative of general conditions. For this reason, photographs of sampling setups and their surroundings are typically provided in sampling reports. Alternatively, sampling logs accompanying reports should include a discussion of site selection.
b. Baseline Data from the PECC3 EIA
207. The baseline data from PECC3 EIA cites a 2005 study prepared by VESDEC, a Ha
Noi-based environmental group. Ten stations within 3 km from O Mon IV were used. At each station, one-hour samples of five parameters were measured: dust (TSP), SO2, NO2, CO and total hydrocarbons (THC). Results of the sampling are reproduced here in Table 30.
Table 30: Results of air quality monitoring at O Mon (from 2007 PECC3 EIA)
Station Dust
(µg/m³)
SO2
(µg/m³)
NO2
(µg/m³)
CO
(mg/m³)
THC
(mg/m³)
A1 210 57 21 2.1 2.9 A2 220 39 14 1.9 4.1 A3 180 27 12 1.6 3.2 A4 210 25 16 1.2 3.6 A5 140 24 13 1.3 2.4 A6 160 21 14 1.5 3 A7 100 17 12 1.0 1.9 A8 240 81 29 3.5 4.8 A9 250 83 26 5.1 5.2
A10 310* 92 46 6.2 6.3 QCVN
05:2009/BTNMT 300 350 200 30
No Guideline
*Exceeds guideline
208. The results show general compliance with QCVN 05:2009/BTNMT one-hour guidelines. One sample, TSP at the O Mon market, slightly exceeded the guideline of 300 µg/m³ (value was 310 µg/m³). Such a result is not surprising at this location and is likely to be true at many roadside locations, but it cannot be taken as typical of the largely agricultural Project impact area. 209. A copy of the VESDEC report was included as an appendix to the MONRE EIA. No description of the instrument or the sampling procedure was included, and the report does not include sampling logs. A photograph of an air sampling setup in an unpublished summary presentation of the EIA showed what appear to be a tripod-mounted high-volume sampler (for dust) and a gas bubbler, but no other description was provided. An assessment of the compliance with USEPA monitoring guidelines, and consequently the quality of the samples, cannot be done for the data in the PECC3 EIA.
c. Baseline Data from the Vattenfall EIA
210. The data from the Vattenfall EIA were collected by the Institute of Environmental Science and Technology of the University of Technology in Ho Chi Minh City. Samples were collected at four stations at two-month intervals between February to August 2004. In each occasion, three 1-hour samples of NO2, SO2, TSP, PM10, CO and three hydrocarbons were gathered. In all, 12 samples were collected from each station. The results of the sampling, reported as highest hourly concentrations, are presented in Table 31.

87
Table 31: Results of air quality monitoring at O Mon (from 2008 Vattenfall EIA)
Station NO2
(µg/m³) SO2
(µg/m³) TSP
(µg/m³) 14B2 Mậu Thân 129 39 300
19C, Zone 2, Tra Noc 68 11 330* Bus station 4B 208* 69 990*
Tra Noc Industrial park 61 89 740*
QCVN 05:2009/BTNMT 200 350 300
*Exceeds guideline
211. Sampling indicates poor air quality at the stations during the time of sampling. All the PM10 and TSP maxima exceed their 1-hour guidelines, and at least one NO2 reading exceeds the guideline. Vehicular emissions and bare soil near the sampling sites explain these exceedances. 212. The Vattenfall EIA collected only one-hour concentrations from each station. The average of the three one-hour samples taken at the same day was assumed to be the 24-hour concentration; the highest of the four averages was then reported as the maximum 24-hour concentration. Finally, the average of all 12 values was then reported as the annual concentration. 213. Calculating the daily and annual averages from such few readings is highly questionable, a point raised by the Vattenfall report itself. Hourly readings vary significantly due to meteorological conditions and the level of human activity that generate pollutants, so a large degree of uncertainty must be attached to the average of the three samples if it is to be used as an estimate of the 24-hour average. Since the samples were probably taken during working hours (and likely during rainless periods), they almost certainly represent higher concentrations than at other hours of the day. For the same reasons, the average of the 12 hourly values cannot be used as an accurate estimate of the annual concentration even if they were taken on different months. 214. As with the MONRE EIA, no photographs of the sampling set-up were available from the Vattenfall EIA, nor was there any information as to the time the samples were collected. No statement regarding how well USEPA ambient monitoring guidelines were complied with could be made. In addition, the report did not mention what instrument and corresponding analytical method was used for each pollutant.
d. Air Quality at the Project Site
215. Given that the two sampling programs at the O Mon IV site provide insufficient information, a quantitative assessment of air quality at the site cannot be made. However, given the general land use and the character of human activity in the area, it may be concluded that poor air quality leading to short-term exceedances exists near roadsides, including where most residences are located. At the same time, the predominantly agricultural surroundings can be expected to contain much better air quality conditions. Averaging over the year, ample wet season rainfall and the dominance of agricultural land use are likely to offset poor air quality along the roads and bring the area to general compliance with guidelines. 216. Because an impact assessment calls for a background concentrations that can be added to dispersion modeling results, the data from the two previous reports were supplemented by monitoring results obtained from a region with comparable land use. Details of this supplementary data are presented in the impact assessment section.

88
9. Noise
217. Monitoring of background noise was undertaken by EPC-VESDEC utilizing a Quest 1900 sound level meter in ten locations within and around the O Mon Thermal Power Complex site (PECC3, 2007a). Five of the locations are on or in the immediate surroundings of the power complex site, i.e. where the power complex will constitute a source of noise. Monitored levels varied between 57.8 and 73.2 dBA (Table 32). The highest levels were found close to roads and industrial activities such as in the area of the O Mon Market (close to the confluence of the O Mon with the Hau river) and at road 91 (southwest of the power complex site). In more rural areas the levels were lower, in the 60 dBA range. The measured maximum (equivalent) level of 73.2 dBA is marginally below the daytime limit value of 75 dBA according to the Vietnamese standard TCVN 5949:1998. It is not stated at what time the monitoring was performed, but it is assumed that it was during daytime. Based on the monitoring it can be concluded that background levels of noise are fairly high, at least during the daytime.
Table 32: Results of noise monitoring
Measured noise level (dBA) No. Marked by
Lmax LEQ Lmin
1 A1 95.7 66.5 54.2
2 A2 82.2 64.3 50.6
3 A3 84.6 61.2 47.8
4 A4 88.6 60.5 46.3
5 A5 80.3 57.8 46.7
6 A6 81.9 59.1 48.2
7 A7 85.4 60.8 49.1
8 A8 97.1 71.7 53.6
9 A9 93.4 68.3 51.3
10 A10 100.1 73.2 54.2
TCVN 5949 : 1998: 75dBA (from 6AM to 6PM) 70dBA (from 6PM to 10 PM)
50dBA (from 10PM to 6AM)
C. Socioeconomic and Cultural Profile
1. Methodology
218. This section is based on data collected during the preparation of the PECC3 EIA (2007), the Vattenfall EIA (2008), and the resettlement and compensation due diligence assessment undertaken by ADB in 2010. Socioeconomic surveys conducted under these activities focused on households directly affected by the Project.
2. Population and Labor
219. The population of O Mon district is 128,075 persons (2004), including three ethnic groups: Kinh, Hoa and Khmer. Population density is 1,016 persons/km2. 76,025 of these are of an age able to be employed, of which 37,563 are women. In Phuoc Thoi the population density is only 791 persons/km2, with a total population of 21,221 persons. The population in

89
Thoi An is higher, with 27,160 persons, leading to high population density (1,177 persons/km2). 220. The socioeconomic surveys show a society in transition. Day labor is the main source of income in the households, while the dependence on agriculture income is only 21%.
Table 33: Source of income among the Project affected people
Sector Percent of respondents
Day labor 37 Agriculture 21 Formal employment 15 Business and services 15 Other 12
3. Health and Education
221. Can Tho’s 700 bed General Hospital started operation in 2005, and many private hospitals have also been started. The intensive medical centers provide high quality medical services for people in the region, and there are medical centers in every township of the districts and medical stations in the wards. Besides disease treatment tasks, these medical centers and stations are also responsible for free vaccination and infectious disease prevention. 222. Beside the formal educational system, Can Tho has 24 training schools and vocational centers. Can Tho University and the Mekong Delta Rice Research Institute are regional and national training and scientific-technical centers, and each year train thousands of engineers, scientific and technical officials and skilled workers. 223. In O Mon district there is a school of mechanical agriculture located at Lo Vong Cung with more than a thousand students graduating each year. For those with minimal education the School of Supplement Education in O Mon organizes evening courses. It plays an important role in improving labor force while the district is developing. 224. For a detailed review of the social conditions of the people directly affected by the Project, please refer to the Resettlement Plan prepared by PPTA 4845.
4. Land Use
225. Economic development in the Project area is focusing on industry and commerce, and as a result the area of agricultural land in the Phuoc Thoi and Thoi An wards is narrowing. Land use in O Mon as well as Phuoc Thoi and Thoi An is shown in Table 34. It can be seen that there is very little forested area in the whole of O Mon District. 226. In Phuoc Thoi, there are eight projects which are know to have conducted or will need to conduct land acquisition programs. The total area of expropriated land is 260 ha, including 19 ha of residential land, 37 ha of garden and 200 ha of rice field. Detailed data are shown in Table 35.

90
Table 34: Existing land use in O Mon district, and Phuoc Thoi and Thoi An wards
Land use types O Mon Phuoc Thoi Thoi An
Natural area (ha) 12,500 2,700
2,400
Agricultural land (ha) 9,300 1,500 1,700
-Forestry 0.14 0.14
Non agricultural land (ha) 3,250 1,200 700
-Residential land 550 58 150
-Special use land 1,300 800 75
-Others 1,400 310
Source: Annual report of PC Phuoc Thoi in 2006
Table 35: Expropriated land in Phuoc Thoi ward
Project Expropriated area (ha)
Hospital 2.9
O Mon Thermal Power Complex 75
500 kV substation 3.6
Road 934 2.0
Trà Nóc industrial park No 2. 51
Road 91B 5
Guest house for workers 118
Mental hospital 2
Source: Annual report of PC Phuoc Thoi in 2006
5. Economy, Industry and Agriculture
227. Can Tho city has two industrial parks (Tra Noc industrial park with 300 ha; Hung Phu industrial park with 488 ha), and a 150 ha center for industry and handicrafts in Thot Not district. 228. According to the Can Tho PC, industrial parks in the city as of 2007 had 139 projects, with a land area of over 281 ha, and a registered investment capital of 599 million USD. The operating capital is 212 million USD, making up 35% of the registered investment capital. At that time there were nine countries and territories investing in the concentrated industrial parks with 17 production projects and four branches of services. The total foreign investment capital is 77 million USD, making up 13% of the investment capital. 229. Several industrial factories are based in O Mon: Ha Tien 2 Cement factory, one pesticide factory, Tay Do garment industry, and one shipyard. Besides, there are more than 3,600 small-scale enterprises operating in different activities: industry, service, and processing. The Tra Noc industrial park is expanding into Phuoc Thoi ward, O Mon district. 230. The economic structure of Thoi An and Phuoc Thoi is based on agriculture, aquaculture, small scale industry and service-trade. The structure is changing toward production of high quality agricultural products, services and small scale industry. This is also the trend of development of O Mon district. For instance, catfish breeding for exportation is developing in O Mon, with productivity of 12,000 tons/year. Total area of high quality orchards is about 2,500 ha, supplying 25,000 tons of fruit per year. In respect to this change, Phuoc Thoi is more industrialized; the percentage of land area of non agricultural productions is 20% in Phuoc Thoi, compared to less than 1% in Thoi An. Industry in Thoi An

91
ward is developing. The ward has some brick-kilns and some households gain income from small scale industry. The ward is planning a high technology zone. 231. Total annual rice paddy yield in Thoi An ward is estimated as 1,015 tons. Other agricultural products are mainly plants such as soy-bean, sesame, and maize; average yield is 5.38tons/ha. There are also markets gardens, breeding of fowl, and pond and cage/pen aquaculture.
6. Infrastructure and Transportation
232. Can Tho port and container port can dock 10,000 ton vessels. Cai Cui sea port in the first phase has 3 docks for 10,000 ton vessels, in which 1 dock is used for containers specifically, a container yard of 28,000 m2, another commodity yard of 8,000 m2 and a warehouse of 36,000 m2. 233. Can Tho city is beginning a process to invest 80 trillion VND to develop its infrastructure aimed at making it the most modern city in the Mekong Delta region. As planned, Can Tho will build an urban-industry-service area along the Hau river, an urban and hi-tech area to the north of O Mon river and a heavy industrial area to the south of O Mon river. To the southeast, there will be an urban area and Cai Rang port, while to the west; an eco-tourism area will be developed. The city will also build six residential areas covering a total of 5,800 ha providing homes for 690,000 people. 234. The important traffic ways are national highway No.1, No.91B and No.61 connecting Can Tho City and other provinces in the region. These are used for transporting and exchanging goods with Ho Chi Minh City. The national road No. 91 and 91B connects from national road No.1 across O Mon with a length of 20 km. There are four provincial roads connected with national road No. 91. 235. In the future, there are plans to develop an international water transport system based on Hau river and a local waterways, linking Cai San, Can Tho, O Mon and Thot Not rivers. Tra Noc airport will be upgraded to have an international terminal. 236. The O Mon Power Complex is accessed from Can Tho by Highway 91 which runs approximately 2 kms to the southwest of the power complex. The complex itself will be accessed by two smaller access roads off Highway 91:
i) The existing 3 km long access road no. 1, which runs from Highway 91 past the Ha Tien cement plant, across the Chanh stream, and ends at the gate to O Mon I.
ii) Access road no. 2, which will be built as part of the Project, and which will run in a
straight line directly northeast from Highway 91, crossing the Ba Su irrigation canal and the Vam stream, an ending at the main gate of the O Mon Power Complex.
237. The power complex is also accessibly by boat via the Hau River.
7. Power and Water Sources
238. Power and water supply: Tra Noc thermal power plant has a capacity of 200 MW supplying power for the whole region. There are two water plants with a capacity of 7,000 m3 per day and night and other plants with the total capacity of 200,000 m3 per day and night will be built in Hung Phu Industrial Park to provide clean water for production and daily living. 239. Electricity access on a household basis in O Mon is over 99% according to the PC annual report. The figures for Thoi An and Phuoc Thoi are 99% and 90%, respectively.
92
Clean water accessed household rate in Thoi An and Phuoc Thoi are said to be 98% and 94%, respectively, compared to the rate of 88% the whole city. 240. Access to infrastructure is lower in the Project area than the averages presented in the annual reports of the city and district. Only 72% of the households affected by the Project were connected to electric power supply. A mere 4% had tap water supply, although 79% had a drilled well for water. Yet, 17% of the affected households obtained water from the river or from a canal, which is be considered an unsafe water supply.
8. Physical Cultural Resources
241. Physical cultural resources are movable or immovable objects, sites, structures, groups of structures, and natural features and landscapes that have archaeological, paleontological, historical, architectural, religious, aesthetic or other cultural significance. Physical cultural resources may be located in urban or rural settings and may be above or below ground or underwater. Their cultural interest may be at the local, provincial, national or international level. 242. According to surveys undertaken in 2005 and 2007, consultations with local community members, and information obtained from local authorities, there are no known structures or sites that are of historical, archaeological, paleontological, or architectural significance in the Project area, and there are no known current use of lands and resources for traditional purposes by Indigenous Peoples in the Project area.
93
V. ASSESSMENT OF ALTERNATIVES
A. No Project
243. The most obvious alternative to the Project is the status quo; to not build the Project. This is, however, not an acceptable option, since the alternative of not implementing the Project will result in severe power outages which will negatively impact economic growth and social development in southern Viet Nam. There is already a shortfall of 1,100 MW in the power system, and with electricity demand growing at 15% to 17% per annum, failure to meet this demand will slow the GDP growth rate and worsen the power shortage situation.49 The O Mon IV Project and the O Mon Power Complex will play important roles in providing the necessary power supply to meet national socio-economic development goals, especially in the southern parts of Viet Nam, and will improve the reliability and stability of the national power system. 244. The no project alternative is also likely to have a negative impact on poverty reduction as there would be fewer opportunities for employment, both directly from the O Mon Power Complex, and secondarily from industries and manufacturing that require a stable power supply in order to be competitive. B. Alternative Technologies
245. PECC3 undertook an analysis of available production technologies for a power plant in the 750 MW range, as summarized below:
Diesel power plant Conventional diesel-fueled piston engine which drives an electrical generator.
Advantages - High efficiency: 40-50% - Suitable for a variety of fuels types: diesel oil, heavy fuel oil, natural gas, crude
oil, bio-fuels (such as palm oil, etc.) and emulsified fuels (such as Orimulsion, etc.)
- Simple design and layout - Short construction period: 24 months Disadvantages - Low power capacity: maximum production per unit is about 45 MW, so not
suitable for use in a high capacity power plant - High investment rate: 1,000 USD/kW for a large capacity unit or if using HFO - High running and maintenance costs - High environmental impacts
Conventional thermal power plant Power plant heats water into steam and use the steam to spin a turbine which drives an electrical generator.
Advantages - Broad power capacity range: from 5 MW to 1,200MW per unit - Suitable for a variety of fuels: coal, HFO, crude oil, DO, natural gas - Low maintenance costs - Economic lifetime: 30 years
49 The Seventh Power Development Master Plan (PDMP7) Interim Summary Report, prepared by the Institute of Energy (IE), May 2010.

94
Disadvantages: - High investment rate: 1,000 - 1,200 USD/kW - Long construction period: 36 months for the first unit - Inflexible in operation: slow startups and shutdowns - Large footprint - Low efficiency: 36 - 42% - Requires large amount of cooling water and feeding water for boiler - High environmental impact
Simple Cycle Gas Turbine (SCGT) Generates power by converting the heat and kinetic energies of hot, high pressure jets of gas into mechanical energy through the use of rotary blades, which in turn drives an electrical generator. Advantages - Widely used technology for power generation - Standardized design and manufacturing process - Wide range of capacity: from 0.5 to 260 MW/unit - Small plant footprint area - Short construction period (14 to 18 months) due to standardized designs and
maximum completion on site - Flexible operation mode: can startup and shutdown rapidly (referred to as
“minimum up"), and can deal with rapid load changes - Low investment rate: below or equal to 350 USD/kW
Disadvantages - Low efficiency: 32 - 38% at ISO standard conditions50 - Requires high quality fuels - High maintenance costs - If using low quality fuels such as HFO or crude oil, expensive fuel treatment
equipment and inhibitors for reducing hot corrosion are required. However, capacity, efficiency and operating lifetime of the units will be considerably reduced.
Combined Cycle Gas Turbine (CCGT) One or more gas turbines and a steam turbine are used in combination to achieve greater efficiency. The gas turbine drives an electrical generator and the turbine exhaust is used to produce steam in a heat exchanger (called a heat recovery steam generator or HRSG) so as to supply a steam turbine which also drives an electrical generator, providing the means to generate more electricity per unit of fuel. Typical CCGT configurations include one or more gas turbines, one or more HRSGs, and a steam turbine.
Advantages - Widely utilized for new power plants - Standardized design and manufacturing process - Broad power capacity range: from 30 to 1,000 MW
50 Presented in ISO standard 3977-2 (Gas Turbines - Procurement - Part 2: Standard Reference Conditions and
Ratings). The standard conditions specified in the ratings are: - Ambient Temperature - 15 deg C - Relative Humidity - 60% - Ambient Pressure - Sea Level - Inlet and Exhaust Losses - Zero - Base Load Operation - 100% rated power

95
- Footprint is smaller than for conventional thermal power plants - Short construction period (24 months in comparison with 36 months in case of a
conventional thermal power plant) thanks to standardized equipment - Flexible operation: starts up and shuts down rapidly, and can adjust to rapid load
changes - High efficiency; can reach 57% at ISO standard conditions - Low investment rate: below or equal to 600 USD/kW - Lowest environmental impact
Disadvantages - Requires high quality clean and pure fuels - Economic lifetime: 20-25 years
Table 36: Comparison of power generation technologies
Characteristics Diesel Power Conventional Thermal Power
Single Cycle Gas Turbine
Combined Cycle Gas Turbine
Unit Capacity Up to 45 MW Up to 1,200 MW Up to 290 MW Up to 1,000 MW Efficiency 40-50% 38% - 42% 35% - 36% 55% - 57% Fuels Gas or oil Various fuels Gas
Clean fuels Gas
Clean fuels Investment Rate (USD/kW)
1,000 1,000 -1,200 ≤350 ≤600
Lifetime of Power Plant (years)
20 30 20 20
Operation and Maintenance Costs
High High Low Low
Construction Period (months)
24 36 14 24
Footprint Area Medium Largest Smallest Smaller than conventional thermal plant
Water Needs Little Greatest Very little Medium Operational Flexibility
Flexible Not flexible Very flexible Flexible
Environmental Impact
High Medium or high depending on
fuels
Low with natural gas
Low with natural gas
Source: Based on O Mon IV Power Plant – 750 MW – Construction Investment Report (Can Tho Thermal Power Company, 2010).
246. Based on the above analysis it was concluded that:
i) the power capacity of diesel power units is too low for use in a 750MW power plant; and,
ii) simple cycle gas turbines have low efficiency and are most suitable for operation at peak-loads; the Project will operate at base load, and therefore SCGT technology is not suitable.
iii) CCGT is the most appropriate technology.
247. The only realistic alternative to the Project is construction of a conventional thermal power plant, most likely fired by coal. This alternative would have significant environmental disadvantages:

96
- The thermal efficiency of a CCGT plant (i.e. the proportion of the energy which is converted to electricity), is close to 60%, calculated on a net calorific value basis. This is substantially greater than the efficiency of about 35 to 40% achieved by existing coal-fired power stations.
- Compared to the average air emissions from coal-fired generation, natural gas produces half the CO2 (carbon dioxide), less than a third of the nitrogen oxides (NOx) and only one 1% of the sulphur oxides at the power plant.
- Coal power plants require large quantities of coal to be transported for the fuel, which has greenhouse gas implications. In addition, land would have to be set aside near the plant for coal storage.
- Coal power plants generate large quantities of ash. An intermediate ash storage facility would have to be constructed near the plant, and a permanent ash disposal site would need to be established within a reasonable transport distance.
- Water use is larger and the discharge of cooling water is much higher than for CCGT.
- Wastewater treatment before disposal would have to be strengthened as the larger boiler requires more cleaning water, and the run-off and leachate from the coal and ash storage would also have to be treated.
- At the ash disposal site all run-off and leachate would have to be collected and also treated.
248. Based on the advantages of CCGT compared with a conventional coal-fired thermal power plant, the CCGT is the preferred choice.51 C. Alternative CCGT Configurations
249. In order to ensure a cost-efficient project that optimizes its contribution to the national electricity network, EVN undertook an analysis of the following alternatives for CCGT configuration:
1 gas turbine + 1 HRSG + 1 steam turbine: 1-1-1 configuration 2 gas turbines + 2 HRSGs + 1 steam turbine: 2-2-1 configuration 3 gas turbines + 3 HRSGs + 1 steam turbine: 3-3-1 configuration
250. Table 37 presents an analysis of power outputs for the three configurations. Based on the analysis it was concluded that although the 1-1-1 configuration has a high efficiency rating, the capacity per block is too low. The 2-2-1 and 3-3-1 configurations both had suitable power outputs. 251. Table 38 presents a further analysis of the 2-2-1 and 3-3-1 options in terms of efficiency and investment rate. Although the 3-3-1 configuration is more flexible from an operations perspective, the 2-2-1 configuration requires a lower investment rate and offers a higher efficiency of between 7% to 9%. Thus, the 2-2-1 configuration was selected.
51 Although not considered in the analysis, a nuclear power plant is a theoretical possibility, even through Viet
Nam’s first nuclear power plant will not be operational until 2020. However, other challenges aside, the temperature increase from the discharge of cooling water would pose a major problem. Nuclear power plants discharge approximately 75% of the fuel energy as heat into the cooling water, whereas a CCGT power plants only discharge approximately 33% of fuel energy as heat.

97
Table 37: Analysis of power output and efficiency for CCGT configuration options
CCGT Configuration
and Manufacturer
Net Power Output (MW,
ISO std)
Efficiency (%, ISO
std)
Number and Type of Gas
Turbines
Steam Turbine
(MW, ISO std)
Gas Turbine Combined Cycle (MW,
30oC)
1-1-1 Configuration MPCP1-701G2 489.3 58.7 1x M701 G2 160.4 454 S-109 H 480 60 1x PG901H 160 445
2-2-1 Configuration MPCP2-701F2 799.6 57.3 2x M701F 1x 263 742 S-209FA 786.9 57.1 2x F9 FA 1x 289 740 S-209FB 825.4 58 2x F9 FB 1x 303.67 779 GUD2.94.3A 794.9 57.5 2x V94.3A 1x 281 749 KA 26-2 820.6 57.8 2x GT-26 1x 260 774
3-3-1 Configuration GUD 3.94.2 719.5 52.6 3x V94.2 1x 270 681 KA13E2-3 719 53.1 3x GT13E2 1x 250 681 GUD 3.94.2A 876.7 55 3x V94.2A 1x 326 830
Source: Based on O Mon IV Power Plant – 750 MW – Construction Investment Report (Can Tho Thermal Power Company, 2010).
Table 38: Analysis of power output, efficiency and investment rate 2-2-1 and 3-3-1 configurations
CCGT Configuration
and Manufacturer
Net power output
MW (ISO std)
Net output efficiency %
(ISO std)
Number and Type of Gas
Turbines
Steam Turbine
MW (ISO std)
Investment Rate
USD/kW
2-2-1 Configuration MPCP2-701F 799,6 57,3 2x M701F 267 283 S-209FA 786,9 57,1 2x F9 FA 289 281 S-209FB 825,4 58 2x F9 FB 303,67 286 GUD2.94.3A 794,9 57,5 2x V94.3A 281 278 KA26-2 820,6 57,8 2x GT26 260 282
3-3-1 Configuration GUD 3.94.2 719,5 52,6 3x V94.2 270 281 KA13E2-3 720 53,1 3x GT13E2 250 280
Source: Based on O Mon IV Power Plant – 750 MW – Construction Investment Report (Can Tho Thermal Power Company, 2010).
D. Alternative Fuel Sources
252. The most feasible alternative fuel from a technical point of view for a CCGT is distillate fuel oil (DFO). However, this is considered not acceptable because of the high sulfur content of Vietnamese diesel oil, high power generation costs, and higher greenhouse gas (GHG) emissions. Heavy fuel oil operation is considered infeasible for technical reasons.

98
Table 39: Analysis of efficiency CO2 emissions, oil and gas-fired thermal power plants Parameter Oil-fired power plant 300 MW Natural gas-fire combined
cycle plant 300 MW Efficiency 38% 56% Total CO2 emissions 1.30 Mt/y 0.65 Mt/y CO2 emissions (g/kWh) 740 360
253. Biogas is another option, buts its use would pose significant infrastructure problems. Assuming a dry weight of 250 kg total solids (TS)/ton waste, 90% volatile solids content, biogas yield of 0.4 m3/kg volatile solid and energy content of 1,980 MJ, each ton of organics will produce an estimated 550 kWh. In O Mon IV this corresponds to 300 kWh electricity/ton organic waste. At full capacity of 750 MW and assuming 6,000 hours of use per year, this would require about 60,000 tons or 100,000 m3 of organic material per day. The organic material would need to be converted into biogas, a process that takes about 30 days. The tank for this would need to have a volume of 3,000,000 m3, which would require a tank in the order of 40 m high and 300 m in diameter. At least two ships of 30,000 tons would need to be docked and discharged each day. Obtaining such large amounts of organic waste with guaranteed delivery everyday, year after year, at a reasonable cost, would be extremely challenging. E. Alternative Cooling Options
254. A natural draught cooling tower for a 750 MW CCGT power plant would be about 140-150 m high, have a diameter of 110-120 m at the base, and take about 2 years to build. This would increase the construction time of the power plant by 5-6 months, increase the costs by about USD 6-7 million, and decrease net output of the power plant by between 7 to 13 MW, depending on the cooling tower design. Given that the analysis of the proposed once though cooling system shows that it is not expected to have a significant impact on the Hau River temperature regime or ecology, a cooling tower option is not recommended. F. Alternative NOx Removal
255. One option for additional NOx removal is the use of Selective Catalytic Reduction. With SCR the emissions would be reduced by up to 85%. The investment cost for an SCR-system is estimated at 60 MUSD per power plant; operation adds an additional 0.4 MUSD year. It should be noted that SCR-technique also adds some negative environmental aspects through the transport and handling of ammonia (NH3) as well as emissions of NH3 and nitrous oxide (N2O). Consequently, for gas-fired turbines with Dry-Low- NOx burners, as is the case with the Project, it is normally only required when ambient NOx conditions are extremely serious.
G. Alternative Site Locations
256. The O Mon Power Complex was identified as the site for the Project in Power Development Master Plan VI. The site offers numerous advantages:
Technical
- sufficient area for a 750 MW CCGT and associated facilities - access to reliable gas source (in 2012) - access to road and water transportation networks - access to national power grid - access to existing O Mon I infrastructure - available water supply - available cooling water

99
- proposed use is in compliance with relevant land use plans and regulations
Geological - geologically stable, low earthquake risk - reasonable site leveling and compaction costs - reasonable foundation construction costs Social and Environmental
- not located close to any sensitive environmental receptors (communities, hospitals, schools, etc).
- no physical cultural resources on site - relatively low resettlement and socioeconomic impacts
257. Based on these site characteristics, there are no other known sites in southern Viet Nam that offer the advantages of the proposed site.

100
This page has been deliberately left blank to allow for double sided printing.
101
VI. ANTICIPATED ENVIRONMENTAL IMPACTS AND MITIGATION MEASURES
A. Project Siting
1. Resettlement and Compensation
258. The O Mon IV Project site will be located entirely within the O Mon Power Complex boundaries. Land acquisition and resettlement for the complex took place in 2006. The acquisition of 17.1 ha of land for the power plant affected 158 households, 66 of which required resettlement. A total of 94 billion VND was paid in compensation. Acquisition of land for access road no. 2 affected a total of 78 households, 14 of which required resettlement. A total of 14.9 billion VND was paid in compensation. The resettlement and compensation processes were conducted in accordance with Vietnamese requirements. In 2010 ADB undertook a due diligence review of the resettlement process which confirmed that it largely complied with ADB requirements.52 B. Construction Phase
259. Construction of the O Mon IV Project has the potential to result in a variety of localized environmental impacts on aquatic and terrestrial ecosystems; air, water and soil quality; noise levels; traffic; and worker and community health. Each of these is discussed in the following section.
1. Surface Water Quality
260. There are a variety of construction phase activities that have the potential to contaminate the waters of the Hau and O Mon rivers, and Vam and Chanh streams, including erosion and sedimentation from excavation, leveling and fill and from bank erosion; contaminated site runoff; spills of fuel and oil; pollution from temporary worker camps and canteens; spills and discharge of ballast water from transport ships; and dredging for fill sand. 261. To mitigate potential impacts from erosion and sedimentation a construction phase erosion and runoff control plan (ERCP) should be implemented. The ERCP includes the following key elements:
- A site drainage system should be established, and runoff should be treated in a settling pond prior to discharge.
- Cut and fill should be balanced to the maximum extent possible in order to minimize the need for fill and for spoil disposal.
- Open surfaces should be compacted. - Siltation fencing should be installed at actives work sites to protect adjacent water
bodies. - If necessary, spoil and fill piles should also be protected with siltation fences. - Excavation, leveling and fill activities should be stopped during significant rain
events where there is a potential for runoff into water bodies. - Bank erosion protection measures should be put into place in order to protect the
stability of the banks. This can include temporarily covering open surfaces with heavy duty geotextiles, but the preferred mitigation is to work in sections and to construct the final erosion protection as soon as possible. It is understood that bank protection will be provided for the entire O Mon Power Complex, however it
52 The due diligence review of the resettlement and compensation process was undertaken by ADB TA 4923-VIE:
Preparing the Support for the Public-Private Development of the O Mon Gas Pipeline. Although the review confirmed that the process largely complied with ADB requirements, some discrepancies were noted. CTTP developed a corrective action plan (CAP) to address these deficiencies.

102
will be constructed on a project-by-project basis. The O Mon IV Project will thus provide bank protection for the O Mon IV site only.
262. To mitigate potential impacts from spills a construction phase spill control plan (SPC) should be implemented. The SPC includes the following key elements:
- A hard surface parking protected by berms should be established. Runoff from the parking lot should be collected and treated in a bioswale prior to discharge.
- A roofed fuel, oil and chemical storage area should be established that includes an impermeable floor, a protective berm to contain any spills, and an oil-water separator.
- Oil absorbents should be readily accessible in marked containers. - Good housekeeping procedures should be established to avoid the risk of spills
in the first place. - Spills should be dealt with immediately, and personal should be trained and
tasked with this responsibility. 263. To mitigate potential impacts from wastes generated by workers, appropriate waste collection and sanitation facilities should be provided to workers. Refuse receptacles should be provided and solid waste should be collected regularly and disposed at a licensed waste disposal facility. Effluent from portable toilets should be collected and treated by an appropriately licensed company in accordance with relevant Vietnamese regulations. 264. Construction wastes should be utilized on site to the maximum extent possible. That which cannot be used should be collected by an appropriately licensed company for recycling and/or final disposal in a licensed waste facility. 265. To mitigate potential impacts from ship traffic, all supply ships should be required to maintain good hazardous waste management practices, and should have spill response plans in place. Ballast water from supply ships should not be discharged in the river, and should be treated in accordance with local regulations. 266. Dredging activities can lead to significant impacts, some of which are difficult to mitigate. It is understood that sand will only be sourced from licensed mining concessions in the Hau and Tien Rivers for which DONRE approved EIAs have been undertaken. It has not been possible to review the EIAs for these concessions; it is assumed, however, that they were approved only when they could demonstrate that the operator would undertake good dredging practices and the concession would not result in significant ecological or hydrological impacts.53 It is important to note that dredging is a widespread activity in the rivers of Viet Nam, and dredging undertaken for the Project will have a limited and localized impact in relation to the overall impact of all dredging activities. 267. It has not been possible in this EIA to assess potential impacts of localized non-Project related dredging on the Hau River hydrology, and whether this has implications for the withdrawal of cooling water; it is understood that this is being assessed under a separate study. When available, it is recommended that these results be incorporated into the Project detailed design phase.54
53 Good dredging practices include minimizing dredging to the extent possible, utilizing methods that minimize
sedimentation, utilizing protective silt curtains to reduce the amount suspended sediment being transported outside the dredging area, and strictly avoiding areas with fish breeding habitat or other important ecological values.
54 The study, O Mon IV Power Plant: Rapid Climate Change Threat and Vulnerability Assessment, is being
implemented under RETA 6420: Climate Change and Adaptation in Asia and the Pacific.

103
268. With the implementation of the ECRP, SCP and other mitigations noted above, construction phase risks to surface water quality and aquatic ecosystems can be minimized. What erosion does occur should not have any significant effects on surface water quality because the soil in the construction area is not polluted from heavy metals, herbicides, pesticides etc. The contribution of organic material from soil erosion should not give any measurable change in levels of organic material of the Hau River because the river is already eutrophied from agriculture production and wastewater from human activities.
269. River water quality will be monitored on a regular basis during the construction phase, and action will be taken to address Project related impacts (see section IX.B – Environmental Monitoring, page 153).
2. Groundwater Quality
270. Although local shallow groundwater sources will not be used after the start of construction, they should nevertheless be protected since contamination of groundwater from spills of fuel, oil, sanitary wastes and contaminated runoff from the construction site can have secondary effects on river water quality. 271. To mitigate potential impacts from spills a construction phase spill control plan (SPC) will be implemented (see “Surface Water Quality”, above). To mitigate potential impacts from inappropriate sanitation and waste disposal, appropriate waste collection and sanitation facilities should be provided to workers (see “Surface Water Quality”, above). 272. Deep groundwater will not be used in the O Mon Project. However, many residents in the area will continue to use this water, and it should be protected. To mitigate the risk of groundwater contamination, as mentioned above a construction phase SPC will be strictly implemented.
3. Soil Quality
273. Surficial soils in the vicinity of the Project site can be contaminated through spills of fuel, oils and chemicals, contaminated site runoff, use of contaminated fill, and inappropriate disposal of fill. To mitigate these impacts, as previously noted:
- a construction phase SPC will be implemented (see “Surface Water Quality”, above).
- a construction phase ERCP will be implemented (see “Surface Water Quality”,
above). 274. In addition, only clean fill should be utilized. Fill should be assessed for quality based on source and a visual inspection, and if necessary should be tested for contamination before being accepted onto site. 275. Contaminated spoil from the site also has the potential to cause environmental impacts if inappropriately disposed of. However, soil analysis from the site does not indicate surficial soils are polluted with heavy metals, herbicides, or pesticides. Spoil should be utilized on site to the maximum extent possible, and that which cannot be used should be disposed of in an environmentally sound manner in an approved site licensed for the disposal of construction spoil.
4. Air Quality
276. Construction activities such as truck and other equipment operation and movement on access and main roads, removal of vegetation, excavation, filling and leveling, and other

104
activities involving heavy equipment may generate significant localized levels of dust, particularly during dry weather periods. 277. Emissions of fossil fuel combustion by-products also result from the use of generators and heavy equipment that make use of diesel fuel. Although dispersion modeling can, in principle, be used to quantify air quality impact during construction, estimating emission rates is difficult and yields highly uncertain results. Emission rates vary with weather conditions, the level and nature of an activity, the type and number of equipment units in use, and the size of area being developed. 278. Even without dispersion modeling, emissions within the construction site can be expected to result in exceedances of ambient guidelines for TSP (and possibly those for NO2 and SO2 as well) close to the construction area during the dry season and periods of intense activity. During very dry and windy conditions, excessive dust levels can be expected hundreds of meters downwind of the construction site. For this reason, and as background dust concentrations are already high in the Project area, minimizing additional dust emissions and emissions from heavy equipment during the construction phase is important. 279. To mitigate potential impacts, construction sites, excavation sites, and gravel and dirt access and on-site roads should be sprayed with water as necessary to suppress dust. Accumulated soil and debris should be cleaned from tarmac roads as required. Trucks should pass through a water pit when leaving the site, and excessively muddy trucks should be washed prior to departure from site. Truckloads should be covered, with the exception of on-site or local trips. 280. To minimize vehicle emissions, modern equipment in compliance with relevant Vietnamese vehicle emissions regulations (e.g. TCVN 6438-2001) should be utilized and regularly maintained. 281. Improper handling of soil and spoil piles can also lead to the generation of dust. Cut and fill should be balanced to the maximum extent possible in order to minimize the need for fill and for spoil disposal. Soil and temporary spoil piles should be covered or sprayed if generating dust. Piles that are not going to be used in the short-term should be allowed to develop vegetation cover. 282. Overall, with the appropriate implementation of mitigation measures, air quality impacts during the construction stage are expected to be short to medium-term and localized. As the surrounding land use is predominantly rural and there are no inhabitants within 150 m, it is not anticipated that any residences will experience significant air quality impacts during the construction phase. Ambient air quality will be monitored on a regular basis during the construction phase and action will be taken to address Project related impacts (see section IX.B – Environmental Monitoring, page 153).

105
5. Noise
283. The construction of a power plant project can generate significant noise levels. Typical construction noise levels from the operation of machinery and equipment range from 85-95 dBA measured at 2 m.55 Assuming that machinery will operate throughout the site it is unlikely that during construction Vietnamese standards and EHS guidelines will be complied with at the boundary of the power complex at all times. What is critical during this phase is to determine the worst-case impact at the nearest sensitive receptor, in this case the nearest sensitive receptor being the nearest residence. The maximum level of impact without any mitigations on the nearest receptor can be calculated as follows:
L2 = L1 – 20 log(D2/D1) Where: L1 = Measured noise level in dBA L2 = Calculated noise level at receptor in dBA D1 = Horizontal distance between source and receiver D2 = Horizontal distance between source and receptor
284. The nearest residence to the power complex boundary is located 422 m to the southwest.56 Therefore the maximum unmitigated predicted sound level at that receptor from the operation of machinery and equipment at or near the power complex boundary can be calculated as follows: L422 = 95 dBA - 20 log(422/2) L422 = 48.5 dBA 285. This maximum unmitigated noise level is lower than the permitted standard at residential areas (06h – 18h) of 70 dBA (TCVN 5949:1998), is within the EHS Guidelines for industrial areas (70 dBA) , and is within the daytime EHS Guideline of 55 dBA for residential areas, but slightly exceeds the nighttime EHS guideline for residential areas of 45 dBA. 286. Pneumatic hammers used for foundation pile-driving are expected to be the most significant source of noise disturbance during the construction phase, and based on a noise level of up to 110 dBA measured at 2 m, the maximum unmitigated level at the nearest residence is predicted as follows: L422 = 110 dBA - 20 log(422/2) L422 = 63.5 dBA 287. This maximum unmitigated noise level is lower than the permitted standard at residential areas (06h – 18h) of 70 dBA (TCVN 5949:1998), and is within the EHS Guidelines for industrial areas (70 dBA) , but exceeds both the daytime EHS Guideline of 55 dBA for residential areas and the nighttime EHS residential area guideline of 45 dBA. However, it is unlikely that any pile driving will occur at the power complex boundary. 288. To mitigate potential construction noise impacts mobile acoustic barriers should be used to screen off high noise activities. Barriers should not have gaps and should have a
55 WHO Rapid Assessment of sources of air, water and land pollution, 1993. 56 The nearest residence was identified by CTTP engineers. Distance between the residence and the proposed
Power Complex boundary was measured using a Garmin GPSmap 60CSx GPS in August 2010.

106
continuous minimum surface density of 10 kg/m2 in order to minimize the transmission of sound through the barrier. Barriers should be located as close to the noise source as possible. Modern equipment (bulldozers, excavators, trucks etc) should be used that are equipped with silencers and are in compliance with relevant Vietnamese vehicle emissions regulations (e.g. TCVN 6438-2001), and equipment should be regularly maintained. This mitigation coincides with mitigations for air quality. High noise construction activities should only take place from 06h – 18h. 289. To mitigate potential impacts from pneumatic hammers "noise reduction skirts" should be utilized, and pile-driving should be restricted to weekdays and only during daytime hours (e.g. 06h – 18h). Pneumatic hammers will only be used during the construction of the plant foundations, estimated at one to two months. 290. Noise protection for workers is covered under Occupational Health and Safety (see below). 291. Overall, as the Project is located within the O Mon Complex which is surrounded by a low-density rural area, and there are no inhabitants within more than 400 m, construction noise is a moderate impact that is short to medium-term and localized. Noise levels will be monitored on a regular basis during the construction phase and action will be taken to address Project related impacts (see section IX.B.1 – Environmental Monitoring Plan, page 153).
6. Transportation
292. The construction phase, including the construction of Road No. 2, may cause localized traffic delays and disruptions. 293. To mitigate these potential impacts, information should be posted in advance in case of road closures, delays should be kept to a minimum and scheduled during low traffic volume periods, and alternative routes should be provided during closures, if required. With the implementation of these mitigation measures, traffic disruptions should be localized and short-term. 294. Potential traffic safety impacts and mitigation measures are discussed under “Community Health and Safety”.
7. Occupational Health and Safety
295. The construction of a major civil works project such as the O Mon IV Thermal Power Project poses an inherent risk of injury to workers from accidents, fires and other emergencies, and hazardous working environments. 296. To mitigate these potential impacts, prior to the commencement of civil works the EPC contractor will be required to develop an Occupational Health and Safety Plan (OHSP) that is consistent with the relevant requirements of Vietnamese law (page 21) and with good international practice as reflected in internationally recognized standards such as the World Bank Group’s Environment, Health and Safety Guidelines. The OHSP should:
(i) identify and minimize, so far as reasonably practicable, the causes of potential hazards to workers, including communicable diseases such as HIV/AIDs and vector borne diseases;
(ii) provide preventive and protective measures, including modification, substitution, or elimination of hazardous conditions;

107
(iii) provide measures for the management and appropriate disposal of hazardous wastes to ensure protection of the workforce and the prevention and control of releases and accidents;
(iv) provide for the provision of appropriate personal protective equipment (PPE) to minimize risks, including ear protection, hard hats and safety boots;
(v) provide safety protection equipment including fire fighting systems; (vi) provide adequate signage in risk areas; (vii) provide procedures for limiting exposure to high noise or heat working
environments; (viii) provide training for workers, and establish appropriate incentives to use and
comply with health and safety procedures and utilize PPE; (ix) include procedures for documenting and reporting occupational accidents,
diseases, and incidents; and (x) include emergency prevention, preparedness, and response arrangements in
place. 297. With the development of an effective OHSP, occupational health and safety risks can be minimized.
8. Community Health and Safety
298. The construction of a major civil works project such as the O Mon IV Thermal Power Project also poses a risk to local communities from emergency events such as fires or spills, dangerous working environments, and construction traffic. 299. To mitigate these potential impacts, prior to the commencement of civil works the EPC contractor will be required to develop a Community Health and Safety Plan (CHSP) that is consistent with the relevant requirements of Vietnamese law and is with good international practice as reflected in internationally recognized standards such as the World Bank Group’s Environment, Health and Safety Guidelines. The CHSP should include emergency response procedures developed in close collaboration and consultation with potentially affected communities and local authorities, and should address the following aspects of emergency response and preparedness:
(i) procedures to identify and minimize, so far as reasonably practicable, the causes of potential Project related hazards to local communities, including communicable diseases such as HIV/AIDs and vector borne diseases;
(ii) specific emergency response procedures; (iii) trained emergency response teams; (iv) emergency contacts and communication systems / protocols; (v) procedures for interaction with local and regional emergency and health
authorities; (vi) permanently stationed emergency equipment and facilities (e.g. first aid stations,
fire extinguishers/hoses, sprinkler systems); (vii) protocols for fire truck, ambulance and other emergency vehicle services; (viii) evacuation routes and meeting points; and, (ix) drills (annual or more frequently as necessary).
300. The CHSP should also include procedures for posting warning signs and fences as required to protect local community members from dangerous work areas. 301. In order to minimize risks from construction traffic, speed limit signs should be posted and all vehicles should be required to confirm with Vietnamese traffic regulations

108
9. Terrestrial Ecosystems
302. One of the most significant construction impacts is the permanent conversion of the Project site’s previous land use of mixed residential, agricultural and small scale commerce and industry to an industrial area. All existing ecosystems within the Project site and within the power complex facility will be replaced. It should be noted that the Project site has already been cleared, so this impact has also already occurred. However, the affected ecosystems and environment contain no protected areas, natural forests, or rare and endangered species, and have been determined to have no outstanding values. The impact although permanent, is localized and of low significance, and no mitigations are required other than resettlement and compensation for the land owners, which has already been undertaken.
10. Aquatic Ecosystems
303. Project construction has the potential to harm aquatic ecosystems through siltation from erosion, contaminated site runoff, spills of oil, fuel or hazardous chemicals, discharges from worker camps and canteen, and dredging of sand. 304. Mitigations to protect aquatic ecosystems and water quality are presented below in the Surface Water Quality section, and include a construction phase erosion and runoff control plan (ERCP), a construction phase spill control plan (SPC), waste collection and sanitation facilities for workers, and sourcing sand from concessions with a DONRE approved EIA. 305. Pelagic organisms, such as phytoplankton and zooplankton, in the Hau River are adapted to high levels of turbidity and organic content and therefore the contribution from soil erosion, which will be minimized through the implementation of the ERCP, should not have any significant effects. The construction of bank erosion protection and stabilization measures will temporarily disrupt benthic macrofauna along about two kilometers of the south riverside of the Hau River. However, since species will re-colonize and as there are no findings of Red List Species in the affected area, the impact on the benthic macrofauna is considered to be insignificant. Dredging for sand will cause temporary destruction of the benthic macrofauna in the area of the river where the sand is taken, but sand will only be sourced from concessions with a DONRE approved EIA. In conclusion, only small-scale and temporary effects from ground construction preparation work are expected on phytoplankton, zooplankton and benthic macrofauna. 306. Increased turbidity has the potential to temporarily affect spawning and nursery areas for some fish species along shallow areas on the O Mon side of the Hau River. However, the main spawning areas in the vicinity of the Project are along the north side of the river, and should not be affected by Project construction. There will be some loss of lower value spawning habitat along the south bank in the immediate vicinity of the power complex, but it is very localized and is not considered significant. There are no cage aquaculture activities in the vicinity of the Project; the nearest reported cage aquaculture is upstream in An Giang province.
307. Aquatic organisms may also be negatively affected if there is an accidental leakage of oil or other chemicals from machinery or boats used for transporting of construction materials. This will be minimized through the SPC. There will be wastewater generated from human activities during the construction phase that may temporarily affect aquatic organisms. However, this impact will be minimized by providing appropriate waste collection and sanitation facilities for workers.

109
308. Overall, with the appropriate implementation of the mitigation measures described in the Surface Water Quality section, impacts to aquatic ecosystems will generally be small-scale, localized and short-term (Table 40).
Table 40: Predicted impacts from erosion, accidental leakage of fuels and chemicals, and wastewater from human activities, during construction of the O Mon IV and the O Mon Thermal Power Plant Complex on surface water quality, aquatic organisms, fishery and aquaculture (with mitigations applied)
Parameter Erosion and Sedimentation Spills of Fuels and Chemicals
Wastewater
Surface water Small-scale, localized, temporary
Small-scale, localized, temporary
Small-scale, localized, temporary
Phytoplankton Small-scale, localized, temporary
Small-scale, localized, temporary
Small-scale, localized, temporary
Zooplankton Small-scale, localized, temporary
Small-scale, localized, temporary
Small-scale, localized, temporary
Benthic macrofauna
Small-scale, localized, temporary
Small-scale, localized, temporary
Small-scale, localized, temporary
Fish Small-scale, localized, temporary and permanent
Small-scale, localized, temporary
Small-scale, localized, temporary
Fishery Small-scale, localized, temporary and permanent
Small-scale, localized, temporary
Small-scale, localized, temporary
Aquaculture Small-scale, localized, temporary and permanent
Small-scale, localized, temporary
Small-scale, localized, temporary
11. Physical Cultural Resources
309. No physical cultural resources have been documented within the Project area, and no impacts on physical cultural resources are expected during the construction phase. However, in case previously unknown physical cultural resources are encountered during construction a chance-find procedure should be put in place:
- If physical cultural resources are encountered during the construction phase, all works at the find site should be immediately halted.
- The find should be assessed by a competent expert, and procedures to avoid, minimize or mitigate impacts to the physical cultural resources should be developed by the expert in cooperation with the relevant local heritage authority, proportionate to the value of the resource in question and the nature and scale of the Project’s potential adverse impacts on it.
- Work should not begin until the procedures to avoid, minimize or mitigate impacts to the physical cultural resources have been implemented.
- Where avoidance is not feasible, no alternatives to removal exist, and the Project benefits outweigh the anticipated cultural heritage loss from removal, the physical cultural resource should be removed and preserved according to the best available technique.
- Any removal should be conducted in accordance with relevant provisions of national and/or local laws.
- Records should be maintained of all finds, including chain of custody instructions for movable finds.
- All Project workers and staff should be made aware of the chance-find procedure.

110
C. Operational Phase
1. Surface Water and Aquatic Ecology
a. Water Quality
310. There are a variety of operation phase activities that have the potential to contaminate the waters of the Hau and O Mon rivers, and Vam and Chanh streams, including oil spills from the DFO tanks (2x10,000 m3), discharge of plant and domestic wastewater; spills of fuel, oil and chemicals; spills and discharge of ballast water from transport ships; and contaminated site runoff. In addition, chlorine will be added to the cooling water to prevent growth of algae and invertebrates in the cooling water system. 311. To mitigate potential impacts from oily water and spills, an oily wastewater drainage system will drain all areas where oil spillages could occur, or where runoff could be oil contaminated. This includes the bunded area around the DFO tanks, the transformers (which will contain insulating oil); turbines, etc. The oily water will be directed to a gravity-type oil-water separator with the capacity to remove 99% of oil wastes. The separated waste oil will be collected, stored and either reused, reprocessed, or sold. Sludge from the oil-separator will be dredged periodically and landfilled by an appropriately licensed private waste contractor. The treated effluent from the oil-water separator will be directed to the central wastewater treatment system for additional treatment. 312. In addition, the DFO tanks will be situated within a secondary containment system consisting of a 1.5 m high reinforced concrete oil-proof containment wall (bund) capable of holding over 110% of the contents of the DFO tanks. The bund will include a surface water trench collection system which will lead to the oil-water separator. 313. To mitigate the risk of spills of oil, fuel and chemicals in use at the facility, an operation phase spill control plan (SPC) should be implemented. The SPC includes the following key elements:
- Parking areas should be hard surfaced and protected by berms. - All areas for storage of fuels, oils or chemicals should be contained within
protective berms. - Oil absorbents should be readily accessible in marked containers. - Good housekeeping procedures should be established to avoid the risk of spills
in the first place. - Spills should be dealt with immediately, and personnel should be trained and
tasked with this responsibility. 314. To mitigate the risk of spills from ships, all supply ships should be required to maintain good hazardous waste management practices, and should have spill response plans in place. Ballast water from supply ships should not be discharged in the river, and should be treated in accordance with local regulations. 315. To mitigate impacts from domestic wastewater generated on site from the canteen, washrooms, etc., all effluent will be treated in a domestic wastewater treatment plant with a design capacity 108 m3/day, and released to the cooling water discharge channel and ultimately the Hau River. The treatment system will consist of two 3-chamber septic tanks for providing primary treatment through anaerobic digestion; an activated sludge tank and sedimentation basin to provide secondary treatment; and disinfection through the addition of sodium hypochlorite. The sterilized water will be pumped to a holding tank and then released into the cooling water discharge channel. This will be an effective means of treating wastewater to Vietnamese standard QCVN 24/2009/TNMT.

111
316. To mitigate impacts from plant wastewater, a central treatment plant will treat all process wastewater, including from i) the turbine and boiler areas (35m3/day), boiler (168m3/day), miscellaneous minor process effluents, and periodic maintenance such as washing of GAH, boiler, and boiler combustion chambers; ii) liquid sludge effluent from the water supply treatment clarifiers; and iii) wastewater from the regeneration pit in the demineralization plant. The system will incorporate a central collection tank, a pH equalization tank, flocculation and settling tanks, a secondary clarifier, and additional post treatment pH stabilization before being directed to a storage tank and then pumped to discharge channel no. 2. Sludge generated in the treatment process will be pumped into a settling tank, dewatered and stored before being collected and landfilled. Wastewater from the settling tank will be pumped back into the equalization tank and retreated. The treatment plant will have a capacity of 37 m3/hour and will operate for nine hours per day. The quality of the effluent from the central treatment plant will be monitored at the discharge point (see Section IX-B Environmental Monitoring, page 153). The effluent that is discharged should be in compliance with Vietnamese Standard QCVN 24/2009/TNMT. 317. To mitigate the impacts from non-oily site runoff, rain water runoff from building roofs, road surfaces, vegetated areas, and other areas which are not contaminated by DFO, oil, or any chemicals is considered non-contaminated, will be collected in a gravity fed surface water drainage system supported by pumps in low areas when required. The drainage system will direct the runoff to a sedimentation basin and then to discharge channel no. 2 through two control gates. 318. To mitigate potential impacts from wastes generated by workers being deposited in water bodies, refuse receptacles should be provided and solid waste should be collected regularly and disposed of at a licensed waste disposal facility. 319. To mitigate potential impacts from chlorine addition to the cooling water, chlorine will only be added to a level of 0.2-0.3 mg/l chlorine in a sensor controlled system. Due to evaporation in the discharge channel residual chlorine levels are predicted to be below 0.2 mg/l and in compliance with relevant Vietnamese and international standards.57 Further, it is anticipated that the addition of chlorine will only be required periodically on an as needed basis. Impacts associated with chlorine addition are considered insignificant.
b. Intake of Cooling Water
320. The cooling water intake is situated on the southeast corner of the Project site (Figure 9), about 1.5 kilometers downstream from the outlet of the O Mon River. The volume of water withdrawn by the Project will be a maximum of 18 m3/s, while the total cumulative withdrawal for the power complex (O Mon I, II, III, IV and V) will be a maximum of 85 m³/s. 321. The Project intake will be designed such that the speed of incoming water is less than 0.2 m/s (PECC3 2007). To mitigate the risk of fish, water plants and debris entering the cooling system the intake should be protected by a small mesh size metal screen. However, this will not prevent phytoplankton, zooplankton or pelagic egg and larvae of fish from entering the cooling system. The intake water will warm up to at most about 39°C inside the heat exchanger during operation. This will likely result in high mortality rates for phytoplankton and zooplankton. However, only small-scale changes in abundance and species composition in the Hau River are expected. This is because of high natural spatial variation in abundance and compensating inflow of phytoplankton and zooplankton from upper parts of the Hau River.
57 The Vietnamese standard QCVN 24:2009/BTNMT limits residual chlorine in wastewater to 2 mg/l. The IFC
EHS guideline is 0.2 mg/L to be achieved 95% of the time the plant is in operation.

112
322. The only Red List Species of benthic macrofauna found in the area, the gastropod species Antimelania swinhoei, is not expected to be affected by the intake of cooling water as this species is strongly attached to the bottom substrate. In conclusion, the impact on phytoplankton and zooplankton of operation of both the Project alone and the full power complex, is predicted to be insignificant because of small-scale effects in the Hau River (Table 41). 323. The maximum swimming speed of a fish is about five times its body length in meters per second.58 A fish with a body length of 4 cm should have a maximum swimming speed of about 0.2 m/s. Thus, it is probable that even small fishes are capable of swimming away from the water intakes if the speed of incoming water is less than 0.2 m/s. 324. The amount of pelagic stages of larvae and eggs from fish in the intake water will be higher during the wet season compared to the dry season since the wet season is the period when most of the fish species have their reproductive period. The impact on fish larvae and eggs is also dependent on tidal conditions and the number of power plants in operation. The maximum flow in Hau River is about 5,500 m3/s in October. The intake of water used in the O Mon IV Project and the cumulative intake of the power complex (O Mon I-V) is 0.3 and 1.6% respectively of the total water flow in the wet season. Neither operation of the Project alone nor operation of the full power complex is expected to have any large-scale significant impact on density of larvae and eggs of fish in the Hau River. This is because the volume of intake water is small compared to the water flow in the river during the wet season. 325. The ratio between volume of intake water and water flow in the river will be much higher in the dry season. However, the amount of pelagic fish larvae and eggs should be much lower during this time of the year, because the dry season is not the reproductive period for most fish species. In conclusion, the impact on fish fauna, including Red List Species, and fisheries, of operation of both the Project alone and the full power complex, is predicted to be insignificant (Table 41).
Table 41: Summary of anticipated impact of intake of cooling water for the O Mon IV Project and for the full power complex (O Mon I to V) on surface water quality, aquatic organisms, fisheries and aquaculture
c. Thermal Plume Impacts
326. The O Mon IV will utilize water from the Hau River in a once-through cooling system. A similar system is already in place at the O Mon I Power Plant. When the O Mon Power Plant Complex is at full completion, all five units power plants will be taking in and releasing about 85 m3 of warm water through two discharge channels each more than 1 km long leading to the Hau River.
58 Ingvar Lagenfelt, Swedish Board of Fisheries, personal communication, Vattenfall, 2008.
Parameter O Mon IV O Mon I-V
Phytoplankton Insignificant Insignificant Zooplankton Insignificant Insignificant Benthic macrofauna Insignificant Insignificant Fish Insignificant Insignificant Fisheries Insignificant Insignificant
Insignificant = a small-scale and temporary impact on Hau River ecology

113
i. Thermal Plume Modeling
327. Two thermal plume modeling studies have been conducted for the O Mon IV power plant. The first modeling study was presented in the 2007 PECC3 EIA. Key assumptions of the study are as follows:
- Total cooling water discharge of 80 m³/s (for O Mon I, II, III and IV) - Initial excess discharge temperature of 7°C at the condenser - Excess discharge temperature of 5.75°C at outfall mouth back into Hau River - Flow and thermal dispersion modeled for one tidal cycle using the SW-
FAST2D model. 328. The second modeling study was described in the 2008 Vattenfall EIA. Key features of the study are as follows:
- Maximum total cooling water discharge of 85 m³/s (for O Mon I, II, III, IV and V) - Initial excess discharge temperature of 7°C at the condenser - Excess discharge temperature of 6°C at outfall mouth back into Hau River - Flow and thermal dispersion modeled for two weeks (28 tidal cycles) using the
MIKE 3 model. 329. Of the two studies, preference is given to the methodology and results of the 2008 Vattenfall EIA in this report. This study used input data that are consistent with the current design, uses slightly more conservative assumptions of the discharge, and covers a longer modeling period. It models the scenario of O Mon IV running by itself, and the cumulative case of all five units in the O Mon Power Plant complex operating simultaneously. The MIKE 3 model used in the 2008 Vattenfall EIA is also in more common use. This model, developed by the Danish Hydraulic Institute (www.mikebydhi.com), solves the equations of fluid flow in three dimensions and incorporates modules for the prediction of water quality including temperature. 330. The modeling made use of the bathymetric profile of the Hau River near the Project site developed through a survey conducted as part of the EIA. This profile was presented earlier in the baseline section. The survey also included dry season measurements of currents and temperatures which were used to calibrate the model. Tidal data were taken from the Can Tho hydrologic station. River currents simulated in the MIKE 3 model show the expected flow from a straight channel (with inhomogeneities arising from creeks). 331. A major change from the assumptions of the 2008 Vattenfall EIA is the temperature of the discharge. Instead of an excess discharge temperature of 7°C at the condenser, the CTTP has committed to limit this value to 6°C as a design specification, as noted in Table 7.59 Since the cooling water discharge rate still applies, the predictions can still be used by scaling the modeling results to reflect this change. The rescaled results can then be used to determine compliance with EHS guidelines governing the thermal discharge, specifically whether a 3°C increase will occur outside the boundaries of the proposed mixing zone.
ii. Modeling Results
332. Both studies forecast compliance with the QCVN 24/2009/TNMT requirement of discharge water being ≤ 40°C at the cooling channel outlet on the Hau River for both the O Mon IV Project alone and for the cumulative discharges of O Mon I to V. Given that the facilities are designed to discharge water at the condenser 6°C warmer than the intake, and
59 This value is assumed to apply to O Mon II, III and IV, and O Mon I once it converts to burning natural gas.
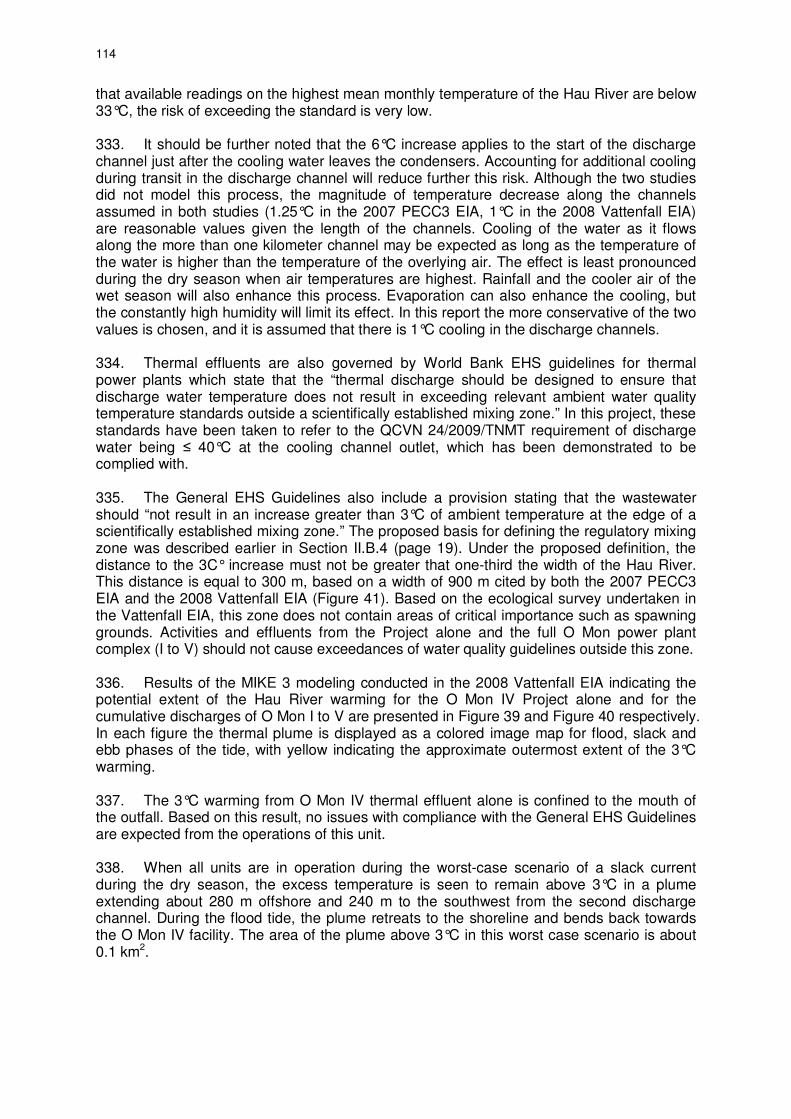
114
that available readings on the highest mean monthly temperature of the Hau River are below 33°C, the risk of exceeding the standard is very low. 333. It should be further noted that the 6°C increase applies to the start of the discharge channel just after the cooling water leaves the condensers. Accounting for additional cooling during transit in the discharge channel will reduce further this risk. Although the two studies did not model this process, the magnitude of temperature decrease along the channels assumed in both studies (1.25°C in the 2007 PECC3 EIA, 1°C in the 2008 Vattenfall EIA) are reasonable values given the length of the channels. Cooling of the water as it flows along the more than one kilometer channel may be expected as long as the temperature of the water is higher than the temperature of the overlying air. The effect is least pronounced during the dry season when air temperatures are highest. Rainfall and the cooler air of the wet season will also enhance this process. Evaporation can also enhance the cooling, but the constantly high humidity will limit its effect. In this report the more conservative of the two values is chosen, and it is assumed that there is 1°C cooling in the discharge channels. 334. Thermal effluents are also governed by World Bank EHS guidelines for thermal power plants which state that the “thermal discharge should be designed to ensure that discharge water temperature does not result in exceeding relevant ambient water quality temperature standards outside a scientifically established mixing zone.” In this project, these standards have been taken to refer to the QCVN 24/2009/TNMT requirement of discharge water being ≤ 40°C at the cooling channel outlet, which has been demonstrated to be complied with. 335. The General EHS Guidelines also include a provision stating that the wastewater should “not result in an increase greater than 3°C of ambient temperature at the edge of a scientifically established mixing zone.” The proposed basis for defining the regulatory mixing zone was described earlier in Section II.B.4 (page 19). Under the proposed definition, the distance to the 3C° increase must not be greater that one-third the width of the Hau River. This distance is equal to 300 m, based on a width of 900 m cited by both the 2007 PECC3 EIA and the 2008 Vattenfall EIA (Figure 41). Based on the ecological survey undertaken in the Vattenfall EIA, this zone does not contain areas of critical importance such as spawning grounds. Activities and effluents from the Project alone and the full O Mon power plant complex (I to V) should not cause exceedances of water quality guidelines outside this zone. 336. Results of the MIKE 3 modeling conducted in the 2008 Vattenfall EIA indicating the potential extent of the Hau River warming for the O Mon IV Project alone and for the cumulative discharges of O Mon I to V are presented in Figure 39 and Figure 40 respectively. In each figure the thermal plume is displayed as a colored image map for flood, slack and ebb phases of the tide, with yellow indicating the approximate outermost extent of the 3°C warming. 337. The 3°C warming from O Mon IV thermal effluent alone is confined to the mouth of the outfall. Based on this result, no issues with compliance with the General EHS Guidelines are expected from the operations of this unit. 338. When all units are in operation during the worst-case scenario of a slack current during the dry season, the excess temperature is seen to remain above 3°C in a plume extending about 280 m offshore and 240 m to the southwest from the second discharge channel. During the flood tide, the plume retreats to the shoreline and bends back towards the O Mon IV facility. The area of the plume above 3°C in this worst case scenario is about 0.1 km2.

115
Figure 39: Near-surface temperatures arising from O Mon IV cooling water discharge (adapted from 2008 Vattenfall EIA). Axes coordinates are in meters.

116
Figure 40: Near-surface temperatures arising from the cumulative discharges of O Mon I to V (adapted from 2008 Vattenfall EIA). Axes coordinates are in meters.
N
N

117
339. The results in Figure 40 are integrated in Figure 41, which shows the extent of the maximum potential extent of the 3-C° warming in relation to the proposed mixing zone. As may be seen in this diagram, warming remains inside the predefined mixing zone.
Figure 41: Predicted extent of cumulative 3-C° warming and proposed mixing zone limits 340. Additional detail on the thermal impact is shown in Figure 42, which depicts vertical cross-sections of the temperature profile across the Hau River at the two outfall locations when all units are in operation. Both cross sections indicate that the plume remains confined to a surface equivalent to the depth of the outfall channel. This plume cools down as it equalizes its temperature to that of the receiving waters, and is prevented from intruding to lower depths by its buoyancy. More important, it is easily seen that the areas inside the 3C° warming (denoted by red, purple and blue on Figure 42) is far smaller than the proposed mixing zone, which is assumed to be 25% of the total cross-sectional area of the channel. 341. Based on the results of the modeling, no exceedances of the EHS 3C° guideline outside the proposed mixing zone are predicted even with all the units in operation during worst-case conditions in the dry season. Cooler temperatures and larger river flow volumes of other seasons will result in a smaller impact area.
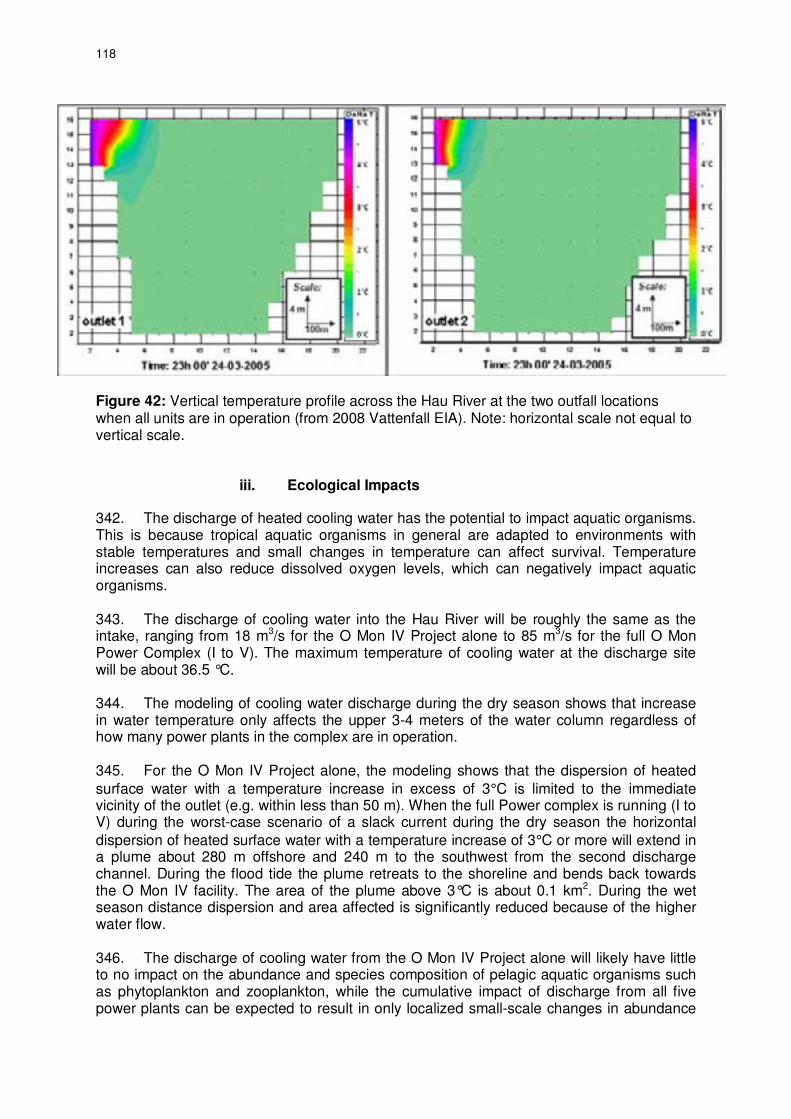
118
Figure 42: Vertical temperature profile across the Hau River at the two outfall locations when all units are in operation (from 2008 Vattenfall EIA). Note: horizontal scale not equal to vertical scale.
iii. Ecological Impacts
342. The discharge of heated cooling water has the potential to impact aquatic organisms. This is because tropical aquatic organisms in general are adapted to environments with stable temperatures and small changes in temperature can affect survival. Temperature increases can also reduce dissolved oxygen levels, which can negatively impact aquatic organisms. 343. The discharge of cooling water into the Hau River will be roughly the same as the intake, ranging from 18 m3/s for the O Mon IV Project alone to 85 m3/s for the full O Mon Power Complex (I to V). The maximum temperature of cooling water at the discharge site will be about 36.5 °C. 344. The modeling of cooling water discharge during the dry season shows that increase in water temperature only affects the upper 3-4 meters of the water column regardless of how many power plants in the complex are in operation. 345. For the O Mon IV Project alone, the modeling shows that the dispersion of heated
surface water with a temperature increase in excess of 3°C is limited to the immediate vicinity of the outlet (e.g. within less than 50 m). When the full Power complex is running (I to V) during the worst-case scenario of a slack current during the dry season the horizontal
dispersion of heated surface water with a temperature increase of 3°C or more will extend in a plume about 280 m offshore and 240 m to the southwest from the second discharge channel. During the flood tide the plume retreats to the shoreline and bends back towards the O Mon IV facility. The area of the plume above 3°C is about 0.1 km2. During the wet season distance dispersion and area affected is significantly reduced because of the higher water flow. 346. The discharge of cooling water from the O Mon IV Project alone will likely have little to no impact on the abundance and species composition of pelagic aquatic organisms such as phytoplankton and zooplankton, while the cumulative impact of discharge from all five power plants can be expected to result in only localized small-scale changes in abundance

119
and species composition. This is because of the limited size of the impact area, high natural spatial variation in abundance, and compensatory inflow of phytoplankton and zooplankton from upper parts of the Hau River. The impact should be even smaller in the wet season. 347. No increase in the abundance of toxic blue green algae is expected since a temperature exceeding 30°C is unfavorable for these organisms. Since the discharge of cooling water only affects water temperature in the surface layer, no effect on abundance and species composition of benthic macrofauna is expected. In conclusion, the impact on phytoplankton, zooplankton and benthic macrofauna is predicted to be insignificant on a large-scale in the Hau River (Table 42).
348. The discharge of cooling water from the O Mon IV Project alone will likely have little to no impact on the abundance and species composition of pelagic fish larvae and eggs in the Hau River during the dry season as the dispersion of heated surface water with a
temperature increase in excess of 3°C is limited to the immediate vicinity of the outlet. The cumulative discharge from the O Mon Complex may cause small-scale changes during the dry season. However, abundance of fish larvae and eggs are highest during wet season when the area affected by discharge of cooling water should be insignificant. In addition, juvenile and adult fishes have the ability to swim away from the heated water. 349. Upstream and downstream migration of fishes in the Hau River, and to tributary rivers, should not be affected by cooling water discharge from either the O Mon IV Project or from the cumulative discharges of the Power complex. This is because the area affected in the wet season when migration mainly occurs is insignificant. Fisheries on the south riverside from the outlets to about 0.5 kilometers upstream could be more significantly affected by the dispersion of heated surface water with a temperature increase in excess of
3°C. However, even in the case of the full Power complex this area is small, about 0.1 km2, and of less importance as spawning and nursery area for fish than the northern side which will not be affected by the cooling water discharge. Further, adult fishes have the ability to swim away from the heated water. 350. There is a potential for cumulative thermal discharges to reduce dissolved oxygen levels within the thermal plume. However, there is only a maximum decrease of 0.54 mg/l in content of dissolved oxygen expected between situations with maximum average temperature in the Hau River compared to situations with the highest temperature that can be achieved due to cooling water discharge (e.g. 32.2 to 37.2°C). 60 The variation in dissolved oxygen content between different baseline sampling stations in the Hau River during dry season was much larger, and this maximum decrease will only occur in a very limited area within the mixing zone. Thus, this is not considered to be a significant concern. 351. In conclusion, only small-scale localized impacts on fish fauna, fisheries and aquaculture is expected in the Hau River (Table 42). Nonetheless, it is important that a monitoring program which includes monitoring of intake and discharge temperatures, river water temperatures, and aquatic ecology and fisheries, be implemented to further
60 Based on the following equations:
0°C < t < 30°C (P-p) × 0.678
DO = 35 + t
30°C < t < 50°C (P-p) × 0.827
DO = 49 + t
Where P = barometric pressure in torr, t = water temperature in °C, and p = water vapor pressure in torr. Source: Standard Methods for the Examination of Water and Wastewater, 12th ed., American Public Health Association, New York, 1965.

120
understand the extent of the warming, and to alert CTTP if conditions arise where additional mitigations are required to address thermal discharge impacts. In addition, during detailed design it is recommended that options for further reducing discharge temperature, either at the condenser or over the length of the discharge channel, be examined.
Table 42: Impact of cooling water discharge from the O Mon IV and cumulative impacts from the O Mon Power Complex (I to V) on surface water quality, aquatic organisms, fisheries and aquaculture
Parameter O Mon IV O Mon I-V
Surface water Insignificant Insignificant Phytoplankton Insignificant Insignificant Zooplankton Insignificant Insignificant Benthic macrofauna Insignificant Insignificant Fish Insignificant Insignificant Fishery Insignificant Insignificant Aquaculture Insignificant Insignificant
Insignificant = a small-scale localized impact on Hau River ecology
2. Groundwater Quality
352. During the operating phase the main risk for the superficial groundwater come from oil spills from the DFO tanks (2x10,000 m3). Other risks include other types of spills, discharge of process wastewater, discharge of plant and domestic wastewater; spills of fuel, oil and chemicals; and contaminated site runoff. These are similar to the operational threats to surface water quality, and mitigations are presented in the Surface Water Quality – Operation Phase) section.
3. Air Quality
a. Methodology – Review of Previous Studies
353. Air quality impact assessment makes use of dispersion modeling to determine ambient concentrations arising from Project emissions. Both the 2007 PECC3 EIA and the 2008 Vattenfall EIA conducted dispersion modeling for the O Mon IV Project. However, results of those studies suffered from a lack of meteorological data and precluded an adequate assessment of air quality impact from the Project. 354. The 2007 PECC3 EIA made use of the ISCST3, a dispersion model from the US EPA that was previously among its preferred tools. The model is based on the Gaussian dispersion equation, and requires hourly wind, temperature, stability class and mixing height data to make a prediction of concentration. It was not clear in the report how the last two parameters were generated, given that these are not routinely available from weather forecasting stations. Only two months, January and August, were modeled, presumably to represent dry and wet seasons respectively. Annual average concentrations were therefore not predicted. 355. The 2008 Vattenfall EIA reviewed the 2007 PECC3 EIA and submitted a new modeling study. The revised report made use of AUSPLUME, a model developed in Australia. AUSPLUME is also a steady-state Gaussian plume model identical in formulation and data requirements as ISCST3. The report made use of a 2006 dataset containing wind, temperature and cloudiness every six hours, or four readings in one day. Significant processing of the raw data was therefore likely to have been done to allow data of this frequency to be used in the model, but little information was provided. The use of such data

121
however makes the predictions of 24-hour and annual receptor concentrations highly doubtful. 356. To address these deficiencies, in this report a new dispersion modeling study was undertaken using a more complete meteorological database and a more sophisticated modeling tool.
b. The CALPUFF Modeling System
357. The CALPUFF model (Scire et al. 2005) is a US EPA-recommended model that currently represents the state-of-the-art in regulatory dispersion modeling. It improves upon earlier Gaussian models by simulating pollutant emissions as a series of independent puffs rather than a steady plume. Through its meteorological preprocessor (CALMET) that generates a four-dimensional database of meteorological input out of station observations or model data, CALPUFF is also capable of incorporating horizontal variations in the flow resulting from terrain effects. 358. As was presented in the baseline section, the input meteorological data for CALMET came from the MM5 model which was downscaled into fine grid data suitable for modeling. The simulation year was 2006, the latest available from TRC. In all, there were 8760 hours of three-dimensional meteorological data used in the CALPUFF model. This quantity of data allows an adequate assessment of hourly, 8-hourly, daily and annual average pollutant concentrations around the O Mon IV facility. 359. Predictions of concentration were made using a variable receptor grid system that placed receptors at 100 m spacing within a distance of 1 km from the O Mon Power Complex fenceline, gradually increasing to a maximum of 500 m 5 km from the facility. The farthest receptors were placed 8 km away, which means a modeling domain of more than 15 km wide along both horizontal directions. This grid system provides detail where both concentrations and concentration gradients are expected to be highest, allowing an adequate geographic understanding of Project impact without requiring a large number of receptors. 360. Terrain data for the CALMET model were taken from the 90-m SRTM database (Jarvis et al. 2008), while land cover data were based on the European Space Agency (ESA) 300-m GlobCover Land Cover v2 2008 database for Southeast Asia. 361. The modeling incorporated building downwash, following good practice in regulatory dispersion modeling. Building downwash refers to the reduction in the effective plume height due to the disruption in the general flow caused by large structures surrounding the stacks. This effect was modeled using the USEPA tool BPIP-PRIME using building dimensions provided by PECC3.
c. Emissions and Scenarios
362. Four scenarios were modeled as part of the assessment (see Table 43). Case 1 represents what can be considered a baseline condition for comparison with the results of the other cases. Case 2 is included to allow an assessment of its impact separate from O Mon IV. Case 3 focuses on the O Mon IV itself. Finally, Case 4 represents the scenario of all five units operating, which can be taken as an assessment of cumulative impact. 363. There appears to be no need to model the scenario of the O Mon power plant complex units running on fuel oil as records of the Phu My 2.2 power plant show that this need arises fewer than three days a year.

122
Table 43: Scenarios modeled, air quality impact assessment
Case/Scenario Description
Case 1 O Mon I alone running on DFO (existing) Case 2 O Mon I alone running on natural gas Case 3 O Mon IV alone running on natural gas Case 4 O Mon I to V running on natural gas
364. Emissions data for the units are given in Table 44. Data for this table were obtained from the O Mon IV feasibility study undertaken by the Power Engineering Consulting Company No. 3 in 2007. The model assumed that all units are emitting at peak levels all the time, a condition that is certain to over predict average concentrations and a high likelihood of predicting peak concentrations. Table 44: Emission parameters for the O Mon Power Plant Complex
Parameter O Mon I - DFO O Mon I – natural
gas O Mon II to V (natural gas)
Stack height 140 m 140 m 40 m Stack diameter 6.4 m 6.4 m 6.6 m Discharge temperature °C °C 95.3°C Exit velocity 19.0 20.0 19.3 Emission concentrations
NOx 410.68 51.3 50 mg/Nm³ SO2 307.34 1.3 0.44 mg/Nm³ CO 83.52 84.79 84.79 mg/Nm³
PM10 23.71 10.32 10.32 mg/Nm³ Emission rates
NOx 224.0 109.4 24.4 g/s SO2 63.7 0.6 0.6 g/s CO 20.5 27.3 41.4 g/s
PM10 55.2 0.2 5.0 g/s
d. NOx to NO2 Conversion
365. Modeling the impact of thermal power plants needs to account for the conversion of nitrogen oxides (NOx) emitted by a source into nitrogen dioxide (NO2) in ambient air. In the 2007 PECC3 EIA, results were given as NOx without conversion. The 2008 Vattenfall EIA made use of a separate modeling study by the Swedish Meteorological and Hydrological Institute (SMHI) to derive a NO2 to NOx ratio. 366. This study applied another approach more commonly used in regulatory modeling called the Ozone Limiting Method (OLM, Cole and Summerhays 1979). The algorithm in this approach is as follows (Alberta Environment 2009):
If [O3] > 0.9 × [NOx] then [NO2] = [NOx] otherwise [NO2] = [O3] + 0.1 × [NOx] 367. In this expression, quantities in brackets are concentrations of the species in ppm. In simple terms, it states that if the ozone concentration is greater than 90% of the predicted NOx concentration, all the NOx is assumed to be converted to NO2. Also, the OLM assumes that 10% of the NOx emissions are generated as NO2. Additional NO2 is formed from the NO in NOx through reaction with the available ozone.

123
368. The problem with applying this approach in this study is that no data on ozone concentrations are available in the area. Ozone measurements from Ho Chi Minh City cannot be used at O Mon because of the disparity in their land use. Urban areas can generate high levels of ozone from precursors emitted by vehicles, but other emissions (such as NO) can react with the ozone to actually lower ambient levels. As a result, a location with similar levels of solar radiation and comparable land use (and with adequate air quality records) is a more appropriate source of background ozone information that can be applied to the OLM. 369. For this purpose, air quality data from the results of a two-year hourly continuous monitoring program in Batangas City in the Philippines was obtained. This station is similar to the O Mon area in several ways. Batangas City is found near a small urban area but is also in a generally agricultural zone. Background emissions of pollutants are therefore similar. Both cities are at similar tropical latitude and receive comparable levels of sunlight (which influence levels of ozone, CO and other pollutants). Both cities are near sea level and thus have similar temperatures and humidities. Both possess winds not influenced by rough terrain, therefore both have similar dispersion characteristics. 370. A key difference is the presence of three natural gas power plants generating more than 2700 MW in Batangas City. Using measurements from this city as a proxy for O Mon background concentrations therefore overestimates the actual impact of the proposed power plants when these measurements are added to the model predictions. 371. A plot of the hourly 98th percentile concentrations of ozone in Batangas City used in the OLM is presented in Figure 43. A weighted hourly running average was used to remove the irregularities in the hourly curve. The strong hourly variation is evident, with concentrations peaking about three hours after 12 noon. Because this station is close to the equator, seasonal variation is minor.
Figure 43: Plot of 98th percentile hourly ozone concentrations (µg/m³) from the Batangas City (Philippines) station (2004 to 2005) 372. Concentration percentiles of other pollutants in Batangas City were also used as proxies for conditions in O Mon in absence of other data. Due to the distance between the two locations, these should only be taken as indicative background values for O Mon. In choosing this station, some overestimation of the background remains because Batangas
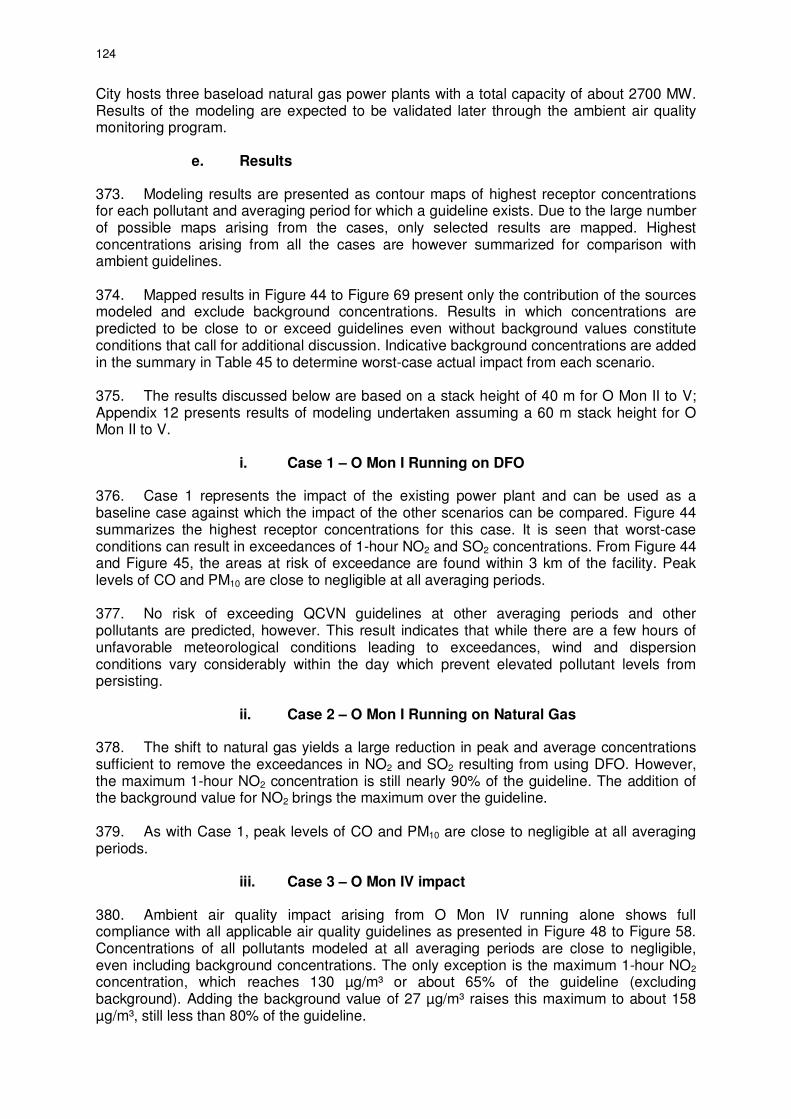
124
City hosts three baseload natural gas power plants with a total capacity of about 2700 MW. Results of the modeling are expected to be validated later through the ambient air quality monitoring program.
e. Results
373. Modeling results are presented as contour maps of highest receptor concentrations for each pollutant and averaging period for which a guideline exists. Due to the large number of possible maps arising from the cases, only selected results are mapped. Highest concentrations arising from all the cases are however summarized for comparison with ambient guidelines. 374. Mapped results in Figure 44 to Figure 69 present only the contribution of the sources modeled and exclude background concentrations. Results in which concentrations are predicted to be close to or exceed guidelines even without background values constitute conditions that call for additional discussion. Indicative background concentrations are added in the summary in Table 45 to determine worst-case actual impact from each scenario. 375. The results discussed below are based on a stack height of 40 m for O Mon II to V; Appendix 12 presents results of modeling undertaken assuming a 60 m stack height for O Mon II to V.
i. Case 1 – O Mon I Running on DFO
376. Case 1 represents the impact of the existing power plant and can be used as a baseline case against which the impact of the other scenarios can be compared. Figure 44 summarizes the highest receptor concentrations for this case. It is seen that worst-case conditions can result in exceedances of 1-hour NO2 and SO2 concentrations. From Figure 44 and Figure 45, the areas at risk of exceedance are found within 3 km of the facility. Peak levels of CO and PM10 are close to negligible at all averaging periods. 377. No risk of exceeding QCVN guidelines at other averaging periods and other pollutants are predicted, however. This result indicates that while there are a few hours of unfavorable meteorological conditions leading to exceedances, wind and dispersion conditions vary considerably within the day which prevent elevated pollutant levels from persisting.
ii. Case 2 – O Mon I Running on Natural Gas
378. The shift to natural gas yields a large reduction in peak and average concentrations sufficient to remove the exceedances in NO2 and SO2 resulting from using DFO. However, the maximum 1-hour NO2 concentration is still nearly 90% of the guideline. The addition of the background value for NO2 brings the maximum over the guideline. 379. As with Case 1, peak levels of CO and PM10 are close to negligible at all averaging periods.
iii. Case 3 – O Mon IV impact
380. Ambient air quality impact arising from O Mon IV running alone shows full compliance with all applicable air quality guidelines as presented in Figure 48 to Figure 58. Concentrations of all pollutants modeled at all averaging periods are close to negligible, even including background concentrations. The only exception is the maximum 1-hour NO2 concentration, which reaches 130 µg/m³ or about 65% of the guideline (excluding background). Adding the background value of 27 µg/m³ raises this maximum to about 158 µg/m³, still less than 80% of the guideline.

125
381. Even with compliance, EHS guidelines suggest that sources should not contribute to an increase of more than 25% of the applicable air quality standards. This provision is based on the US EPA Prevention of Significant Deterioration guidelines, and applies to the annual average concentration (EPA 1987). From Figure 50, the highest increase in annual NO2 concentrations from O Mon IV is 0.9 µg/m³ at a point about 3 km northwest of the facility. This value is less than 10% of the 40-µg/m³ QCVN and EHS guideline and is therefore acceptable under this provision. The highest predicted increase in annual average SO2 concentrations is less than 0.02 µg/m³ or less than 1% of the QCVN guideline of 50 µg/m³ (Figure 53), while that for PM10 is 0.1 µg/m³ (also less than 1% of the QCVN guideline of 50 µg/m³ as shown in Figure 58). 382. The actual contribution to the annual average concentrations from O Mon IV is certain to be lower because these results assume peak emissions 100% of the time. 383. In conclusion, emissions from O Mon IV alone are expected to result in compliance with air quality guidelines for all pollutants at all averaging periods modeled.
iv. Case 4 – Cumulative Impact from O Mon I to V
384. In the case of O Mon I to V running simultaneously at their peak capacity, the modeling predicts a maximum 1-hour NO2 concentration of 198 µg/m³ (Figure 59), just slightly below the QCVN and EHS guideline of 200 µg/m³. Adding the assumed background value of 27 µg/m³ raises this maximum to 232 µg/m³. Given the results of Case 2, much of this result is contributed by O Mon I. 385. Several factors must be considered in assessing the significance of this exceedance. The first is that the predicted maximum 1-hour NO2 concentration arising from O Mon I to V running on natural gas is still lower than the calculated maximum from the existing O Mon I running on DFO (Figure 44). The size of the area predicted to exceed the guidelines under Case 4 covers only a small cluster of receptors about 500 m south of the facility and is far smaller than the same region of exceedance found in Case 1. 386. The exceedances arising from Case 4 with background are predicted to occur a maximum of two hours per year on two separate days at a single receptor, and all other exceedances at other receptors occur only on one hour per year. This frequency is lower than that calculated under O Mon I on DFO. The predicted maximum likelihood of exceedance is about 0.02 % of total hours per year and 0.55 % of total days in this worst-affected receptor. 387. No exceedances of the NO2 guidelines for other averaging periods are predicted from Case 4. For other pollutants no exceedances are predicted even including background concentrations. In particular, 1-hour SO2 concentrations from all five units operating on natural gas (Figure 62) represents a significant improvement over O Mon I running on DFO, which was found to potentially cause exceedances (Figure 45) up six days per year of the 1-hour QCVN guideline for this pollutant. 388. Given the highly conservative assumptions used in the modeling, the low probability of peak emissions coinciding with unfavorable meteorological conditions, the location of the areas predicted to be at risk of exceedance, and the absence of sensitive receptors in these areas, the ecological and health risk from the power plant complex is considered low. 389. However, the finding of potential exceedance reiterates the need for a good ambient monitoring program to identify periods of adverse air quality and determine whether management measures will be necessary. These management measures are discussed in the environmental management plan (EMP), Section IX.

126
Table 45: Summary of air quality dispersion modeling results
Case Gas Averaging
period Max. conc
(µg/m³)
Back-ground (µg/m³)
a
Max. conc. +
background (µg/m³)
QCVN guideline (µg/m³)
NO2 1 hour 242b 27.7 270
b 200
NO2 24 hours 39 18.5 58 100 NO2 Annual 2.4 10.3 13 40 SO2 1 hour 456
b 38.7 495
b 350
SO2 24 hours 34 22.1 56 125 SO2 Annual 0.7 5.5 6 50 CO 1 hour 147 - 147 30,000 CO 8 hours 33 - 33 10,000 CO 24 hours 11 - 11 5,000 PM 24 hours 30 79.4 109 150
Case 1 – O Mon I on DFO
PM Annual 0.6 41.7 42 50 NO2 1 hour 178 27.7 206
b 200
NO2 24 hours 31 18.5 50 100 NO2 Annual 1.4 10.3 12 40 SO2 1 hour 3.7 38.7 42 350 SO2 24 hours 0.3 22.1 22 125 SO2 Annual 0.01 5.5 6 50 CO 1 hour 149 - 149 30,000 CO 8 hours 34 - 34 10,000 CO 24 hours 11 - 11 5,000 PM 24 hours 1.4 79.4 81 150
Case 2 – O Mon I on Natural Gas
PM Annual 0.03 41.7 42 50 NO2 1 hour 130 27.7 158 200 NO2 24 hours 13 18.5 32 100 NO2 Annual 0.9 10.3 11 40 SO2 1 hour 4.2 38.7 43 350 SO2 24 hours 0.3 22.1 22 125 SO2 Annual 0.02 5.5 6 50 CO 1 hour 288 - 288 30,000 CO 8 hours 67 - 67 10,000 CO 24 hours 22 - 22 5,000 PM 24 hours 2.7 79.4 82 150
Case 3 – O Mon IV
PM Annual 0.2 41.7 42 50 NO2 1 hour 198 27.7 226
b 200
NO2 24 hours 38 18.5 57 100 NO2 Annual 4.3 10.3 15 40 SO2 1 hour 10.9 38.7 50 350 SO2 24 hours 1.0 22.1 23 125 SO2 Annual 0.08 5.5 6 50 CO 1 hour 773 - 773 30,000 CO 8 hours 229 - 229 10,000 CO 24 hours 76 - 76 5,000 PM 24 hours 9.2 79.4 89 150
Case 4 – O Mon I to V
PM Annual 0.7 41.7 42 50 a Based on the 98th percentile of hourly, 98th percentile of daily and annual average concentrations in 2004 to
2005 at the Batangas City (Philippines) monitoring station. No data on CO available. b Exceeds QCVN 05:2009/BTNMT Guideline

127
Figure 44: Contour map of maximum predicted 1-hour NO2 concentrations (µg/m³) for Case 1 emissions (O Mon I running on DFO)
Figure 45: Contour map of maximum 1-hour SO2 concentrations (µg/m³) for Case 1 emissions (O Mon I running on DFO)

128
Figure 46: Contour map of maximum predicted 1-hour NO2 concentrations (µg/m³) for Case 2 emissions (O Mon I running on natural gas)
Figure 47: Contour map of maximum predicted 1-hour SO2 concentrations (µg/m³) for Case 2 emissions (O Mon I running on natural gas)

129
Figure 48: Contour map of maximum predicted 1-hour NO2 concentrations (µg/m³) for Case 3 emissions (O Mon IV)
Figure 49: Contour map of maximum predicted 24-hour NO2 concentrations (µg/m³) for Case 3 emissions (O Mon IV)

130
Figure 50: Contour map of annual average predicted NO2 concentrations (µg/m³) for Case 3 emissions (O Mon IV)
Figure 51: Contour map of maximum predicted 1-hour SO2 concentrations (µg/m³) for Case 3 emissions (O Mon IV)
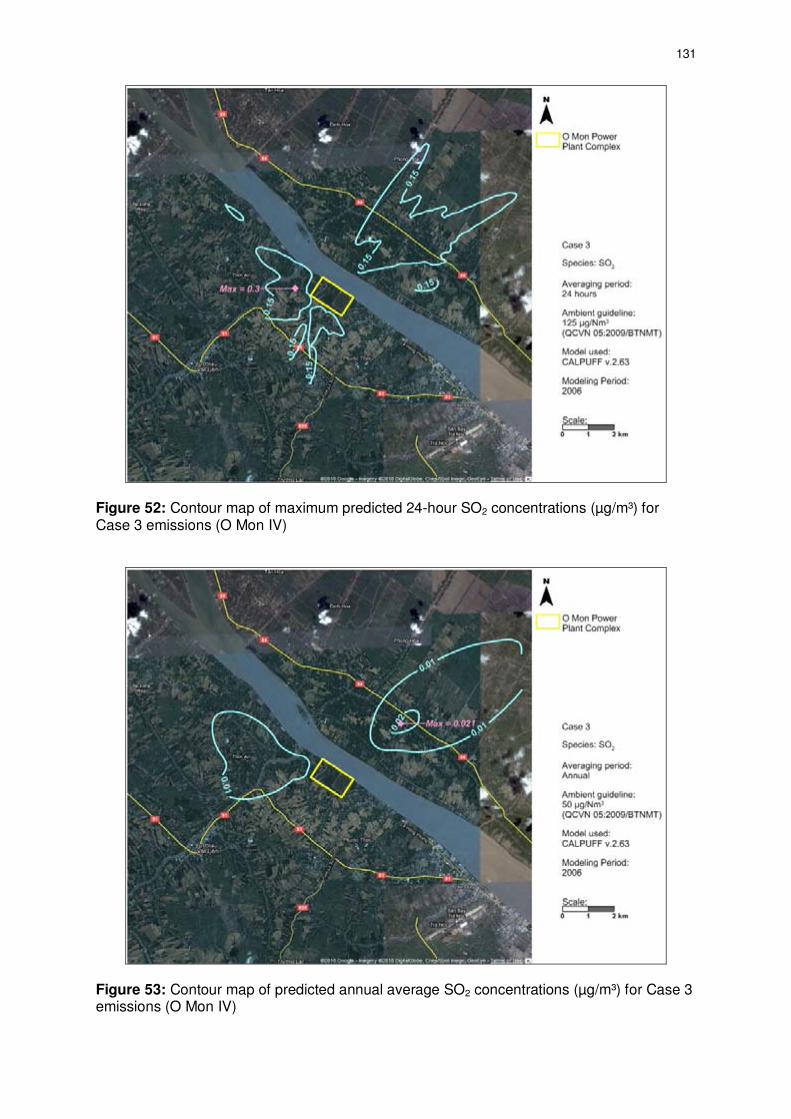
131
Figure 52: Contour map of maximum predicted 24-hour SO2 concentrations (µg/m³) for Case 3 emissions (O Mon IV)
Figure 53: Contour map of predicted annual average SO2 concentrations (µg/m³) for Case 3 emissions (O Mon IV)

132
Figure 54: Contour map of maximum predicted 1-hour CO concentrations (µg/m³) for Case 3 emissions (O Mon IV)
Figure 55: Contour map of maximum predicted 8-hour CO concentrations (µg/m³) for Case 3 emissions (O Mon IV)

133
Figure 56: Contour map of maximum predicted 24-hour CO concentrations (µg/m³) for Case 3 emissions (O Mon IV)
Figure 57: Contour map of maximum predicted 24-hour PM10 concentrations (µg/m³) for Case 3 emissions (O Mon IV)

134
Figure 58: Contour map of predicted annual average PM10 concentrations (µg/m³) for Case 3 emissions (O Mon IV)
Figure 59: Contour map of maximum predicted 1-hour NO2 concentrations (µg/m³) for Case 4 emissions (Cumulative O Mon I to V)

135
Figure 60: Contour map of maximum predicted 24-hour NO2 concentrations (µg/m³) for Case 4 emissions (Cumulative O Mon I to V)
Figure 61: Contour map of annual average predicted NO2 concentrations (µg/m³) for Case 4 emissions (Cumulative O Mon I to V)

136
Figure 62: Contour map of maximum predicted 1-hour SO2 concentrations (µg/m³) for Case 4 emissions (Cumulative O Mon I to V)
Figure 63: Contour map of maximum predicted 24-hour SO2 concentrations (µg/m³) for Case 4 emissions (Cumulative O Mon I to V)
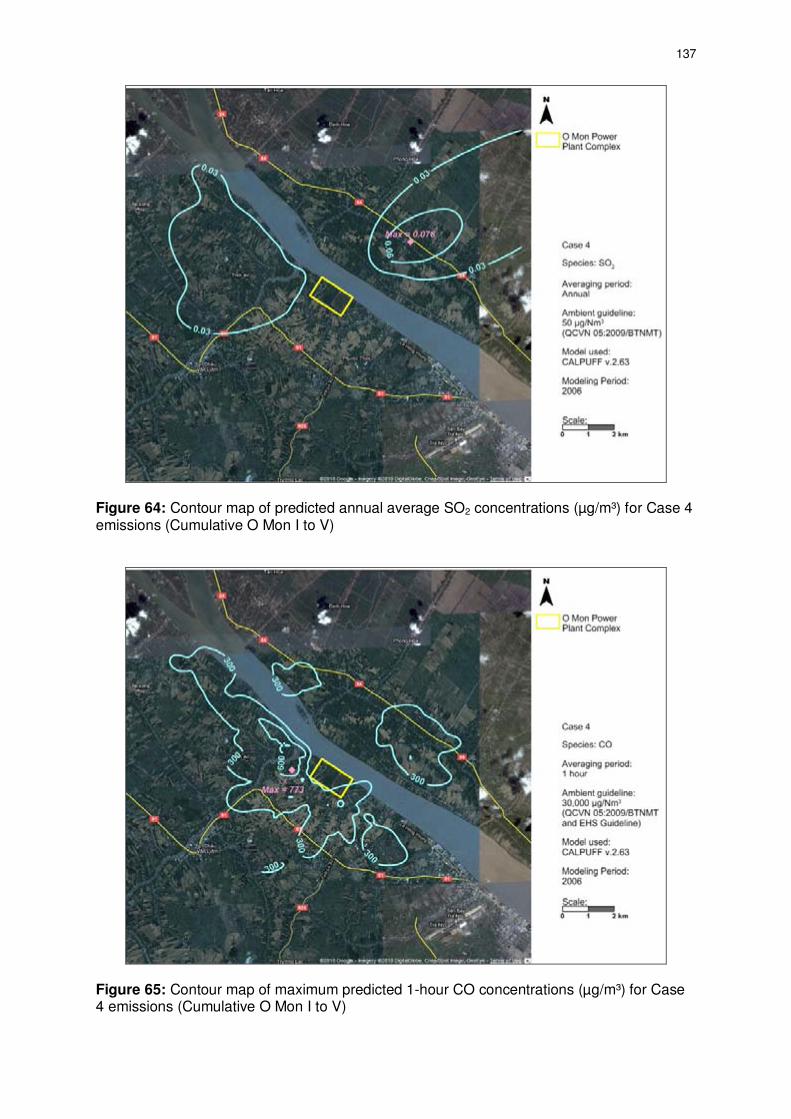
137
Figure 64: Contour map of predicted annual average SO2 concentrations (µg/m³) for Case 4 emissions (Cumulative O Mon I to V)
Figure 65: Contour map of maximum predicted 1-hour CO concentrations (µg/m³) for Case 4 emissions (Cumulative O Mon I to V)

138
Figure 66: Contour map of maximum predicted 8-hour CO concentrations (µg/m³) for Case 4 emissions (Cumulative O Mon I to V)
Figure 67: Contour map of maximum predicted 24-hour CO concentrations (µg/m³) for Case 4 emissions (Cumulative O Mon I to V)

139
Figure 68: Contour map of maximum predicted 24-hour PM10 concentrations (µg/m³) for Case 4 emissions (Cumulative O Mon I to V)
Figure 69: Contour map of predicted annual average PM10 concentrations (µg/m³) for Case 4 emissions (Cumulative O Mon I to V)

140
4. Noise
390. The operation of a thermal power plant is generally not a significant problem from a noise point of view. There are of course a variety of operational activities that generate significant noise levels, including operation of turbines, pumps, cooling fans, water pumps, etc., and many or most of these will operate 24 hours per day. However, noise levels can be mitigated through design modifications, and furthermore it is generally possible to enclose high noise operations in noise-proofed buildings that effectively contain the noise. 391. To mitigate operational noise impacts the detailed design specifications should require that noise levels at the Power complex boundary power plant comply with the relevant Vietnamese and EHS noise guidelines and standards presented in Table 3 (e.g. 70 dBA from 06 h – 18 h; 70 dBA from 18 h – 22 h; and 50 dBA from 22h – 06 h).61 This can be accomplished through:
- Selecting equipment with lower sound power levels. - Installing silencers for fans. - Installing suitable mufflers on engine exhausts and compressor components. - Installing acoustic enclosures for equipment casing radiating noise. - Improving the acoustic performance of constructed buildings, apply sound
insulation. - Installing acoustic barriers without gaps and with a continuous minimum
surface density of 10 kg/m2 in order to minimize the transmission of sound through the barrier. Barriers should be located as close to the source or to the receptor location to be effective.
- Installing vibration isolation for mechanical equipment. 392. Based on the above noted standards, the maximum daytime operational noise level at the nearest residence can be calculated as follows: L422 = 70 dBA - 20 log(422/2) L150 = 23.5 dBA 393. The maximum nighttime operational noise level at the nearest residence can be calculated as follows: L422 = 50 dBA - 20 log(422/2) L150 = 3.5 dBA 394. In both cases the results indicates that noises levels will fall to background levels before reaching the nearest residence.
5. Solid and Hazardous Wastes
395. The operation phase will generate wastes that could affect soil, air and water quality if not managed properly. This includes domestic solid wastes produced by facility staff, sludge from the oil-water separator and domestic and facility water treatment plants, and hazardous wastes resulting from production activities. 396. To mitigate potential impacts:
61 Since the O Mon Thermal Power Complex will operate 24 hours a day, in practice the nighttime noise
standards will be the limiting level.

141
- Appropriate domestic waste refuse receptacles should be provided and solid waste should be collected regularly and disposed of at a licensed waste disposal facility.
- Sludge generated by the water treatment plants should be dredged periodically
and landfilled by a private waste contractor.
- The operation phase OHS plan should include a hazardous waste management system (see Health and Safety, page 142). The main objective should be the protection of the workforce, the prevention of releases and accidents, and appropriate disposal by licensed contractors.
- All supply ships should be required to maintain good hazardous waste
management practices, and should have spill response plans in place.
6. Climate Change
a. Greenhouse Gas Production
397. The combustion of natural gas produces CO2, a greenhouse gas (GHG). Natural gas is generally considered to emit less CO2 for the same energy produced than other fossil fuels. The amount of GHGs emitted by a power plant is a measure of its contribution to global warming, and can be estimated based on fuel consumption. 398. The results of GHG production calculations for O Mon IV alone and all five power plants are presented in Table 46. The calculation does not include emissions of other gases such as methane from leaks, but the contribution of these other gases is smaller than the uncertainty in other parameters used in the estimate. Table 46: Estimated greenhouse gas emissions from the O Mon IV Power Plant and the O Mon Power Complex
Source Natural Gas
Consumption (standard m
3/yr)
Heating Valuea
(MJ/m3)
Emission factor
b
(tons CO2/TJ)
CO2 emissions per year
(tons x 106)
O Mon IV 973 × 106 1.77
O Mon I-V 4.5 × 10⁹
32.42 56.1 8.18
aPetrovietnam Blocks B&52 Gas Pipeline Feasibility Study bTable 1.4, Chapter 1 of 2006 IPCC Guidelines for National Greenhouse Gas Inventories.
b. Clean Development Mechanism
399. A central feature of the Kyoto Protocol of the United Nations Framework Convention on Climate Change is its requirement that countries limit or reduce their GHG emissions. By setting such targets, emission reductions took on economic value. To help countries meet their emission targets, and to encourage the private sector and developing countries to contribute to emission reduction efforts, negotiators of the Protocol included three market-based mechanisms – Emissions Trading, the Clean Development Mechanism (CDM) and Joint Implementation. 400. The CDM allows emission-reduction (or emission removal) projects in developing countries to earn certified emission reduction (CER) credits, each equivalent to one tonne of

142
CO2. These CERs can be traded and sold, and used by industrialized countries to a meet a part of their emission reduction targets under the Kyoto Protocol. 401. The O Mon IV Project has the potential to reduce GHG emissions by replacing more carbon intensive power generation in the grid (e.g. by coal and/or DFO) with less carbon intensive natural gas and cleaner, efficient technology. Therefore, the Project may be eligible under the CDM; at the time of report writing, its eligibility under the CDM and its potential to generate carbon credits are being investigated.
c. Flood Risks
402. The O Mon Power Complex will be elevated to a height of 2.7 m to provide protection from flooding. According to the Vattenfall EIA (2007), at this elevation the complex will be safe from inundation for a 20 year period. However, the report notes that this does not take into account sea level rise and risks from extreme weather events associated with climate change. 403. It has not been possible in this EIA to assess the validity of the design elevation from a flood risk perspective and/or from the perspective of climate change risks. A separate climate change threat and vulnerability assessment is underway to assess these issues.62
7. Seismic Instability
404. The risk of an earthquake in the Project area is low. Regardless, the plant will comply with all relevant Ministry of Construction design standards.
8. Traffic and Transportation
405. In the operation phase, modest impacts will be generated by the traffic utilizing access road no. 2, such as erosion and dust generation. To mitigate these impacts roadside ditches will be maintained, vegetation will be maintained on roadside slopes, and the road surface will be properly maintained. In addition, continuous ambient air quality monitoring will be undertaken as noted in the EMoP (see section IX-B, page 153). 406. To deal with the risk of fuel spills, an operation phase spill control plan (SPC) should be implemented (see Water Quality, page 110). 407. Potential traffic safety impacts and mitigation measures are discussed under Health and Safety (see below).
9. Health and Safety
408. The operation of a gas-fired thermal power such as the O Mon IV poses an inherent risk of injury to workers from accidents, fires and other emergencies, and hazardous working environments; and a risk to local communities from emergency events such as fires or spills, dangerous working environments, and construction traffic. 409. Prior to the commencement of plant operation the EHS Team should prepare operation phase OHS and CHS plans in accordance with relevant requirements of Vietnamese law (page 21) and with good international practice as reflected in internationally recognized standards such as the World Bank Group’s Environment, Health and Safety
62 The study, O Mon IV Power Plant: Rapid Climate Change Threat and Vulnerability Assessment, is being
implemented under RETA 6420: Climate Change and Adaptation in Asia and the Pacific.

143
Guidelines. It is anticipated that the plans would include, but not be limited to OHS and CHS aspects for any large industrial facility, including:
- basic hazard awareness; - site specific hazards; - traffic safety; - dock and ship safety; - safe work practices; - emergency procedures for fire, evacuation, and natural disaster; and - community safety.
410. In addition, the plans should address risks specifically associated with thermal plants, including:
- electric and magnetic fields (EMFs), including an EMF safety plan as a subcomponent of the OHS plan which limits worker exposure to high EMF zones;
- gas safety; - heat; - noise; - confined spaces; - electrical hazards; - fire and explosion hazards; and, - chemical hazards.
411. With the development and implementation of appropriately scaled OHS and CHS plans, operation phase risks to workers and community health can be effectively minimized. For example, since the PM2.2 thermal power plant began commercial operation in 2005, it has run for 1,982 days without an accident.63
10. Physical Cultural Resources
412. No physical cultural resources have been documented within the Project area, and no impacts on physical cultural resources are expected during the operation phase. Nonetheless, the construction phase chance-find procedure (see page 109) should remain in effect in the unlikely case that physical cultural resources are encountered.
63 Source: Mekong Energy Company, 2010.

144
This page has been deliberately left blank to allow for double sided printing.

145
VII. INFORMATION DISCLOSURE, CONSULTATION, AND PARTICIPATION
413. Public consultation and disclosure related to the O Mon Thermal Power Complex has been undertaken over a prolonged period. Public involvement in the planning and design of the O Mon Thermal Power Complex initially started in 2000, with the compensation and resettlement process of O Mon I and II. Consultation for the remaining Power complex plants, including O Mon IV, started in 2005. A. Public Consultation, July 2005
414. The Thermal Power Project Management Unit No 3 (TPPMU3) of EVN (the O Mon IV Project implementing agency prior to CTTP) and their consultants undertook public consultations in relation to the O Mon IV Project in July 2005. Participants included persons to be displaced by the expansion of the complex, ward and district People’s Committees, and women, farmer, youth and veterans organizations. The meetings discussed the Project design, environmental and socio-economic impacts, and resettlement and compensation plans. Summary information was made available and a questionnaire was distributed to persons to be displaced by the Project. Comments received include:
- Mr. Nguyen Van Nho, Chairman of Thoi An Ward People’s Committee: the Thoi An Ward People’s Committee will support the resettlement process, and for those who require it, the People’s Committee will assist in establishing resettlement sites in Thoi An Ward.
- Mr. Phạm Van Tong of Thoi An Ward: wants the Project to maintain environmental and quality of life conditions at resettlement areas, the river, etc, in pre-Project status.
- Mr. Nguyen Van Ba: wants the Project to increase transportation opportunities.
415. Appendix 13-A provides the hand-recorded consultation minutes and lists of participants. B. Public Consultation, December 2005
416. Additional information on plans to extend the O Mon Thermal Power Complex was given to the inhabitants of the area in two meetings held on 23 and 26 December, 2005. The basis for calling these meetings was the decision No 4066/QĐ-UBND dated 8 Dec 2005 by the People's Committee of Can Tho City (Table 47).
Table 47: Summary of key articles from Decision No. 4066/QĐ-UBND Decision No 4066/QĐ-UBND, dated 8 Dec 2005, issued by Can Tho People’s Committee regarding land planning for the construction of O Mon Power Complex: Article 1. Agree to plan the area of 99 ha for construction investment O Mon Power Complex, Can Tho City. Land position shown in Map No.3 of Thoi An Ward, and Map No.7, 8 of Phuoc Thoi Ward, O Mon District. Article 2. TPPMU3, owned by EVN, has to contact PC of O Mon and related Departments for carrying out compensation, ground clearance and resettlement for land users as stipulated.
417. The meetings were announced in the press and through the People's Committees of Thoi An and Phuoc Thoi wards. The meetings were primarily focused on resettlement and compensation issues.

146
C. Disclosure of MONRE-Approved EIA Report, December 2007
418. In November 2007 the MONRE-approved EIA report prepared in Vietnamese by PECC3 was disclosed to the Thoi An and Phuoc Thoi People’s Committees and Fatherland Front organizations. D. PPTA 4845 Public Consultations and Stakeholder Workshop, 2007
419. The ADB financed PPTA 4845-VIE: Preparing the Support for Public-Private Development of the O Mon Thermal Power Complex Project undertook environmental and social related public consultations twice in 2007. The first was public consultation meetings held on 21 and 22 July 2007 in Tho An and Phuoc Thoi wards; the second was a stakeholder workshop held at the O Mon Power Complex on 14 September, 2007 (Table 48).
Table 48: Dates and venues of disclosure and participation activities during PPTA 4845
Date Topic Venue No. of Participants
21/7 2007 Public participation meeting
Environmental and Social Issues
Thoi An Ward 130
22/7 2007 Public participation meeting
Environmental and Social Issues
Phuoc Thoi Ward 232
14/9 2007 Stakeholder meeting (organizations, institutions)
Environmental and Social Issues
Can Tho City 40
420. A brief summary of the issues raised in the consultation meetings and stakeholder workshop is included below.
1. Public Consultations, July 2007
421. Public consultation meetings were held in Thoi An on 21 July 2007 and in Phuoc Thoi on 22 July 2007. The meetings were attended by 130 participants in Thoi An and 232 participants in Phuoc Thoi; most were representatives of households affected by the Project. The meetings included a presentation on the O Mon Power Plant expansion, an address by the O Mon District Compensation Committee regarding the status of the compensation process, and disclosure by the PPTA 4845 consultant of the social assessment survey as well as the preliminary findings of the environmental work undertaken through PPTA 4845. Discussion groups were subsequently formed to discuss these issues in detail. 422. Although environmental issues were presented both in plenary sessions and in the working groups, most of the concerns raised by affected people were regarding the resettlement and compensation program. The issues raised regarding environment are summarized in Table 49, while detailed minutes of the meetings, including participant lists are included in Appendix 13-B.

147
Table 49: Summary of environmental topics raised in group discussions at PPTA 4845 public consultation meetings, Thoi An 21/7/2007 and Phuoc Thoi 22/7-2007
Problems Causes Solutions
Dust pollution Transportation of trucks
Investor has the responsibility to study the issue and implement mitigation measures
Flooding occurs on farm land currently
No means for water to drain through discharge channels
Make new irrigation channels for remaining land
Pollution due to wastewater from houses where workers staying
No proper accommodation prepared for workers
Construction of toilets for workers
Concerned about air pollution, water pollution
Follow appropriate environmental mitigations (as presented in the workshop)
Noise from construction sites (O Mon I)
Construction night shifts should be limited
There are too many mosquitoes, rats, snakes in the Power complex land which are affecting APs who have not yet moved (O Mon II, III and IV)
Construction to start soon, site preparation will address this issue
Some households can be affected by the electromagnetic energy from the high voltage lines
Compensation for households living under high voltage lines
Environmental pollution reducing agricultural production
Responsible organizations find the solutions
2. Stakeholder Workshop, O Mon Power Complex, 14 September 2007
423. The stakeholder workshop involved 40 representatives from the People’s Committees of Can Tho City, O Mon District, and Thoi An and Phuoc Thoi wards; the Department of Foreign Affairs, Can Tho City; the Department of Planning and Investment, Can Tho City; the Fatherland Front of Can Tho; the Women’s Union of Can Tho; the Farmer’s Union of Can Tho; affected peoples of Thoi An and Phuoc Thoi wards; the Belgian NGO Ieder Voor Allen (IVA); and representatives from TPPMU3, PECC2 and PECC3. The interest in environmental issues was stronger in this meeting, and specific environmental and technical issues were raised. Nonetheless, resettlement and compensation issues continued to have a very prominent role in the meeting, and representatives of the District Compensation Committee explained the process in detail. Below is an excerpt of the statements related specifically to environmental issues:
i) It is very important that in the final report all the concrete calculations for each scenario should be presented.
ii) The contour maps from modeling show only the values that are not representative for the most common concentrations on the ground which could create a misunderstanding on the pollution level. Please give the data with 98 percentile and mean data in the final report. In the final report, please provide all the input data for modeling work in both air and water pollution calculations.
iii) It is necessary to present all possible alternatives for air and water pollution reduction, such as:

148
a. for air, beside the increased stack height option there may be other solutions from modification of combustion process for reducing NOx generation or SCR NOx reduction;
b. for water, it could involve changing the design of the cooling water discharge outlet.
iv) EVN confirms that they will select the best technology for NOx reduction, so it is not necessary to increase the stack height from 60 to 100m (in Phu My it is only 40m).
v) In general, in a workshop like this workshop, it is not necessary to present all the technical issues that could create misunderstandings for the local people. These technical matters should be used only in meeting between consultants and PMUs and PECCs.
vi) In the Phu My plant, many fish have died in the protection nets and they need to clear them after some time. The hot water made the skin red all over the body of the workers who cleared the nets.
vii) Also in Phu My chlorine was used to kill the creatures attached in the intakes, but it affected the water environment, are there other solutions, do we need more information?
viii) Due to its high costs at the outset, and high operating costs, it was requested to find measures other than a cooling tower to address cooling water temperature issues. There are alternative technical solutions to tackle the situation of water discharged to the Hau River.
ix) For financial analysis, the consultant’s remarks on the future of the electricity market were appreciated. However, the consultant should analyze the finances of the Project instead of the financial situation of EVN.
x) This power plant will be built based on the experience of the Phu My complex. The consultant should have a visit to see the Phu My power plant.
E. Future Consultation and Disclosure Activities
424. As described in Chapter VIII (Grievance Redress Mechanism), a sign will be erected at the Project site providing the public with Project related information and summarizing the GRM process. In addition, this EIA report will be submitted to the ADB for disclosure on the ADB website (www.adb.org).

149
VIII. GRIEVANCE REDRESS MECHANISM
A. Legal Basis
425. The legal basis for the O Mon IV grievance redress mechanism (GRM) includes:
- Law on Settling Citizens’ Complaints and Denunciations (1998) and Law on Amending and Supplementing Some Provisions of the Law on Settling Citizens’ Complaints and Denunciations (2004);
- Decree No. 197/2004/ND-CP of Dec.3, 2004 on compensation, support and
resettlement when land is recovered by the state; - Decree No. 136/2006/ND-CP of November 14, 2006, detailing and guiding the
implementation of a number of articles of the Law on Complaints and Denunciation; and,
- other relevant decrees, circulars and stipulations.
B. Grievance Redress Mechanism
426. The objective of the O Mon IV GRM is to provide a systematic, transparent and timely process for receiving, evaluating and addressing affected peoples (APs) Project-related complaints, and grievances. The GRM will be open to all Project APs, regardless of the nature of their complaint. 427. The GRM procedures are as follows:
Stage 1 - District Level – CTTP and O Mon District People’s Committee
The AP lodges an oral or written complaint with either CTTP or the O Mon District People’s Committee. CTTP will identify a focal point for receiving complaints.
If the complaint is received by CTTP, the GRM procedure will be explained to the complainant, and the complaint will be recorded and forwarded to the O Mon District People’s Committee.
If the complaint is received by the O Mon District People’s Committee, the complaint will be recorded. In order to assess the nature and validity of the complaint the O Mon District People’s Committee will consult with CTTP and other relevant parties, fact-find and investigate, and within 15 days of receipt of the complaint will issue a decision:
- if the O Mon District People’s Committee agrees in favor of the complainant, then in consultation with CTTP and in compliance with relevant decrees, circulars and stipulations, a course of action and/or compensation to address the complaint will be agreed upon;
- if the O Mon District People’s Committee does not agree in favor of the complainant, and the complainant is satisfied and does not wish to proceed further, then the process ends; and,
- if the O Mon District People’s Committee does not agree in favor of the complainant, and the complainant is not satisfied, the complainant has 45 days from the date of issuance the O Mon District People’s

150
Committee decision to take his/her complaint to either the Can Tho People’s Committee (Stage 2) or the Can Tho People’s Court of Justice (Stage 3).
Stage 2 – City Level - Can Tho People’s Committee
If the complainant is not satisfied with the decision in Stage 1, the complainant has 45 days from the date of issuance the O Mon District People’s Committee decision to take his/her complaint to the attention of the Inspection Department of the Can Tho People's Committee.
In order to assess the nature and validity of the complaint the Can Tho People’s Committee will consult with the O Mon District People’s Committee, CTTP and other relevant parties; fact-find and investigate; and, within 15 days of receipt of the complaint will issue a decision:
- If the Can Tho People’s Committee agrees in favor of the complainant, then in consultation with CTTP and in compliance with relevant decrees, circulars and stipulations, the decision of the O Mon District People’s Committee will be overturned, and a course of action and/or compensation to address the complaint will be agreed upon.
- If the Can Tho People’s Committee does not agree in favor of the complainant, then the process ends.
Stage 3 – Court Case - Tho People’s Court of Justice
If the complainant is not satisfied with the decision in Stage 1, he/she can also bring a case to the Can Tho People’s Court of Justice. The Court shall consider the complaint in accordance with laws on civil procedures and shall render a decision:
- If the Can Tho People’s Court of Justice agrees in favor of the complainant, the court will request the Can Tho People’s Committee to overturn the decision of the O Mon District People’s Committee, and a course of action and/or compensation to address the complaint will be agreed upon.
- If the Can Tho People’s Court of Justice does not agree in favor of the complainant, then the process ends.
428. The Grievance Redress Mechanism is explained in detail in Figure 70. C. Publicizing the Grievance Redress Mechanism
429. A sign will be erected at the Project site that summarizes the GRM and provide contact details (address, phone number, fax, and email address) for the CTTP grievance focal point, the O Mon District People’s Committee, the Can Tho People’s Committee, and the Can Tho People’s Court of Justice. CTTP will instruct the EPC contractor as to the GRM such that they can inform any person who might approach them directly as to the appropriate steps to file a grievance.

151
Figure 70: Grievance Redress Mechanism
AP’s complaints accepted
AP’s complaints rejected
Final Decision of Can
Tho City People’s Committee (to overturn
decision of O Mon District People’s
Committee and to provide compensation or other action) issued
to AP
Final Decision of Can
Tho City People’s Committee (to reject
AP’s complaints and to require AP to follow Decision of O Mon District People’s
Committee) issued to AP
Decision implemented
(compensation or other action)
Process Ends
AP must comply with
this Final Decision
Process Ends
AP’s complaints accepted
Final Decision of Can Tho City People’s Court of Justice (to
request Can Tho City People’s Committee to cancel the decision of
the O Mon District People’s Committee
and to provide compensation or other action) issued to AP
Decision implemented
(compensation or other action)
Process Ends
AP’s complaints rejected
Final Decision of Can
Tho City People’s Court of Justice (to
reject AP’s complaint and to require AP to follow the decision of
the O Mon District People’s Committee)
issued to AP
AP must comply with
this Final Decision
Process Ends
Affected Person Complains to either:
Can Tho City People’s Committee
• Inspection Department coordinates with:
i) O Mon District People’s Committee ii) Relevant Authorities:
- Can Tho City Fatherland Front - Can Tho City Women Union - Can Tho City Peasants’ Association
iii) CTTP
to check the process and procedure of resolving AP’s complaints by O Mon District People’s Committee; to undertake fact-finding; to inspect actual conditions; and to consider the decision of O Mon District People’s Committee.
• Can Tho People’s Committee issues its decision within 15 days of receipt of complaint
Can Tho City People’s Court of Justice
On the base of decrees and other relevant laws, and with due consideration to the decision of the O Mon District People’s Committee (Stage 1), the Can Tho City People’s Court of Justice shall review the AP’s complaints in accordance with laws on civil procedure.
AP’s can only take complaint to EITHER Stage 2 OR Stage 3
Stage 1 Stage 2 Stage 3
AP’s complaints accepted
AP’s complaints rejected
O Mon District People’s Committee decision issued to
AP
O Mon District People’s Committee decision issued to
AP
Decision implemented
(compensation or other action)
AP accepts the decision
AP disagrees with the decision
AP takes complaint to either Stage 2 or Stage 3 within 45 days of the date of
issuance of the decision of the O
Mon District People’s Committee
Process Ends
Process Ends
CTTP • CTTP explains GRM procedure to AP • CTTP forwards complaint to O Mon
District People’s Committee
O Mon District People’s Committee
• Inspection Department coordinates with relevant parties, including:
ii) Land Acquisition and Compensation Council of O Mon District
iii) Relevant Authorities: - O Mon District Fatherland Front - O Mon District Women Union - O Mon District Peasants’ Association - Phuoc-thoi/Thoi-an Ward People’s Committee
iv) CTTP
to consider the AP’s complaints; to explain to the AP government policies, mechanisms and laws, if necessary; to undertake fact-finding and inspect actual conditions.
• O Mon District People’s Committee issues its decision within 15 days of receipt of complaint
• CTTP tracks the results of the complaint process.


153
IX. ENVIRONMENTAL MANAGEMENT PLAN
430. This chapter presents the Project environmental management plan (EMP), including mitigation measures, environmental monitoring, reporting and corrective actions, capacity building, and roles and responsibilities. A. Mitigation Measures
431. The construction and operation phase mitigation measures identified in Chapter VII are summarized in Table 50, along with lead responsibility for mitigation implementation and source of funds. Many of the mitigation measures during the construction phase are associated with good construction and housekeeping practices, while many of the operation phase measures are incorporated into the Project design specifications, such as the use of dry low NOx (DLN) combustors. 432. In this discussion the construction phase is considered to be three years. The term “operation phase” refers to the first two years of plant operation, which is also the period in which the EPC contractor will be providing warranty support, maintenance and technical assistance as needed. At the end of the two years it is anticipated that ADB will prepare a project completion report (PCR), and after approximately five years KfW will prepare a PCR-equivalent. However, the design life of the Project is 25 years, and CTTP will be responsible for ensuring that the mitigation measures in the EMP are implemented throughout the life span of the Project. B. Environmental Monitoring, Reporting and Corrective Actions
1. Environmental Monitoring
433. The construction and operation phase environmental monitoring plan (EMoP) is presented in Table 51. During the construction phase monitoring will be undertaken by a 3rd party environmental consultant contracted by CTTP. During the operation phase the responsibility for monitoring will be handed over to the Environmental Management Department (EMD) of CTTP, who will continue to use the services of a 3rd party consultant to undertake the monitoring.
a. Construction Phase Environmental Monitoring
434. Construction phase environmental monitoring will include:
- Regular construction site inspections to verify compliance with EMP requirements and with relevant laws and regulations.
- Occupational and community health and safety monitoring. - Sampling and analysis of fill quality to ensure the Project site is not polluted by
contaminated fill.
- Soil monitoring at the O Mon IV site boundary to ensure that the Project is not contaminating adjacent areas.
- Noise monitoring at the Power complex boundary adjacent to the O Mon IV site
and the nearest residences. - Continuous ambient air monitoring of PM10 at four stations.

154
- Monthly monitoring of groundwater at two wells using a portable water quality analyzer during the construction period.
- Monthly monitoring of surface water at twelve stations in the Hau River using a
portable water quality analyzer, and quarterly sampling and laboratory analysis at six stations.64
435. Mobile continuous ambient air PM10 monitors, and portable noise and water quality monitors will be purchased by the Project for use by the 3rd party consultant, and will be turned over to CTTP at the end of the construction phase. The 3rd party consultant will establish the mobile continuous ambient air PM10 monitors and downloaded the data from the onboard data-loggers on a monthly basis. The two monitors will be rotated between four sampling stations. The 3rd party consultant will also utilize the portable water quality analyzer to take in-situ measurements of surface and groundwater quality, and will be responsible for collection of surface water, groundwater, wastewater, soil and fill samples for analysis by a qualified laboratory. The 3rd party consultant will also undertake noise sampling. Sampling locations are presented in Figure 71 and Figure 72. 436. The 3rd party consultant will be responsible for submitting quarterly reports documenting the monitoring results to CTTP and the EPC contactor. The 3rd party consultant will also be responsible for immediately reporting to CTTP and the EPC contractor results that exceed relevant Vietnamese or international standards or requirements. CTTP will be responsible for ensuring that the EPC contractor recommends measures to address the problem, and for following up regularly to ensure the issue is addressed appropriately.
b. Operation Phase Environmental Monitoring
437. Operation phase environmental monitoring will include:
- Regular plant inspections to verify compliance with EMP requirements and with relevant laws and regulations.
- Occupational and community health and safety monitoring. - Soil monitoring at the O Mon IV site boundary to ensure that the Project is not
contaminating adjacent areas.
- Noise monitoring at the Power complex boundary adjacent to the O Mon IV site, and the nearest residences.
- Continuous ambient air monitoring of NOx, SO2, and PM10 (the monitors will be
purchased prior to the commencement of operation).
- Continuous emissions monitoring system (CEMS) for monitoring of stack emissions (NOx, SO2, PM10, CO) during the operation phase.
- Semiannual sampling and laboratory analysis of groundwater at two wells.
- Monthly monitoring of surface water at twelve stations using a portable water
quality analyzer.65
64 The term “station” here simply refers to a geographic location, which will be located utilizing a handheld GPS
and accessed either by foot or zodiac/boat. It does not imply a physical sampling station or associated infrastructure.
65 Ibid.

155
- Quarterly sampling and monitoring of all plant wastewater discharges.
- Continuous monitoring of the temperature of the cooling water at the intake and
discharge outlet.
- Quarterly monitoring of aquatic ecology and fisheries. - Annual monitoring of green house gas (GHG) production.
438. The EMD of CTTP will have overall responsibility for operational phase monitoring, and will continue to use the services of a 3rd party consultant for undertaking environmental monitoring as described in Table 51. 439. The 3rd party consultant will be responsible for submitting quarterly reports documenting their monitoring results to CTTP, and assisting CTTP prepare annual monitoring reports for submission to ADB and KfW and JBIC (if cofinancing the Project). The 3rd party consultant will also be responsible for immediately reporting to CTTP and the EPC contractor results that exceed relevant Vietnamese or international standards or requirements. The 3rd party consultant will support CTTP in developing measures to address any problem identified during the monitoring activities. It shall be CTTP´s responsibility to ensure that the measures are implemented and for following up regularly to ensure that issues are addressed appropriately.
c. Independent Monitoring Verification
440. CTTP will also retain qualified and experienced external experts to verify information collected through the EMoP. It is anticipated that the external monitors will conduction annual verification missions beginning in year two of the construction phase. The independent monitors shall recommend approaches to address any problems identified during the verification missions; it shall be CTTP´s responsibility to ensure that the measures are implemented and for following up regularly to ensure that issues are addressed appropriately.
2. Reporting and Corrective Action Plans
a. Construction Phase
441. Semiannual reports documenting the environmental management measures and monitoring results will be prepared by the EPC contractor during the construction phase and delivered to CTTP for formal submission to ADB, KfW and JBIC, and also to Can Tho DONRE and MONRE. If the monitoring has identified a weakness or deficiency in the implementation of the EMP that has already been addressed, the report should explain the manner by which the issue was resolved. If the monitoring has identified a weakness or deficiency in the implementation of the EMP that has not yet been addressed, a corrective action plan (CAP) should be developed. The CAP should describe actions necessary to address each area of concern; prioritize these actions; identify responsibilities for implementation of each corrective action; identify a time-line for their implementation; and, present a schedule for communicating the results of plan implementation to affected communities and ADB, KfW and JBIC.
b. Operation Phase
442. Annual reports documenting the monitoring results will be prepared by the EMD of CTTP based on the monitoring undertaken by the 3rd party consultant, and submitted to ADB, KfW and JBIC, and also to Can Tho DONRE and MONRE. If the monitoring has identified a

156
weakness or deficiency in the implementation of the EMP that has already been addressed, the report should explain the manner by which the issue was resolved. If the monitoring has identified a weakness or deficiency in the implementation of the EMP that has not yet been addressed, a corrective action plan (CAP) should be developed. 443. It is anticipated that at the end of the first two years of operation ADB will prepare a PCR, after which time annual reporting by CTTP to ADB will no longer be required. 66 However, if the PCR identifies outstanding environmental issues, the PCR can recommend additional measures and reporting requirements to resolve theses issues. In addition, CTTP will continue to meet the reporting requirements noted in the MONRE-approved EIA prepared by PECC3.
66 KfW’s PCR equivalent will be prepared after approximately five years of operation.

157
Table 50: O Mon IV environmental management plan: environmental impacts, mitigation measures, implementation responsibility, and cost source, construction and operation phases
Project Stage / Affected Aspects
Project Activity
Potential Environmental
Impacts
Proposed Mitigation Measures
Responsibility for Mitigation
Implementation
Mitigation Cost Source
Environmental Issues Associated with Project Siting / Preconstruction
Displaced Persons
Siting and Land Acquisition
Permanent loss of land, houses, agricultural productivity.
Resettlement and compensation for land owners (completed, and verified for compliance with ADB requirements).
CTTP Can Tho PC
Included in Resettlement
and Compensation
Plan
Environmental Issues Associated with Construction Phase
Surface Water Quality
Erosion from excavation, leveling, filling and other activities Site runoff
Sedimentation of water bodies from erosion and site runoff
A construction phase erosion and runoff control plan (ERCP) to be implemented, including the following key elements: - A site drainage system should be established, and
runoff should be treated in a settling pond prior to discharge.
- Cut and fill should be balanced to the maximum extent possible in order to minimize the need for fill and for spoil disposal.
- Open surfaces should be compacted. - Siltation fencing should be installed at actives work
sites to protect adjacent water bodies. - If necessary, spoil and fill piles should also be
protected with siltation fences. - Excavation, leveling and fill activities should be
stopped during significant rain events where there is a potential for runoff into water bodies.
- Bank erosion protection measures should be put into place in order to protect the stability of the banks. This can include temporarily covering open surfaces with heavy duty geotextiles, but the preferred mitigation is to work in sections and to construct the final erosion protection as soon as possible.
In addition, river water quality will be monitored on a regular basis during the construction phase and action will be taken
EPC Contractor
3rd party environmental
Included in EPC cost estimate
Included in construction

158
Project Stage / Affected Aspects
Project Activity
Potential Environmental
Impacts
Proposed Mitigation Measures
Responsibility for Mitigation
Implementation
Mitigation Cost Source
to address Project related impacts (see section IX.B – Environmental Monitoring, page 153)
consultant (for monitoring) and EPC Contractor
phase environmental monitoring plan budget
Fueling and operation of heavy machinery and transport vehicles
Contamination of river from spills of fuel, oil or hazardous chemicals
A construction phase spill control plan (SPC) to be implemented, including the following key elements: - A hard surface parking protected by berms should be
established. Runoff from the parking lot should be collected and treated in a bioswale prior to discharge.
- A roofed fuel, oil and chemical storage area should be established that includes an impermeable floor, a protective berm to contain any spills, and an oil-water separator.
- Oil absorbents should be readily accessible in marked containers.
- Good housekeeping procedures should be established to avoid the risk of spills in the first place.
- Spills should be dealt with immediately, and personnel should be trained and tasked with this responsibility.
EPC Contractor Included in EPC cost estimate
Worker camp, canteen, etc
Contamination of surface water from inappropriate disposal of liquid and solid wastes
Appropriate waste collection and sanitation facilities should be provided to workers. Refuse receptacles should be provided and solid waste should be collected regularly and disposed of at a licensed waste disposal facility. Effluent from portable toilets should be collected and treated by an appropriately licensed company in accordance with relevant Vietnamese regulations
EPC Contractor Included in EPC cost estimate
Construction wastes Contamination of river from inappropriate dumping
Construction wastes should be utilized on site to the maximum extent possible. That which cannot be used should be collected by an appropriately licensed company for recycling and/or final disposal in a licensed waste facility.
EPC Contractor Included in EPC cost estimate
Ship Transport Contamination of river from spills of fuel, oil and chemicals
All supply ships should be required to maintain good hazardous waste management practices, and should have spill response plans in place. Ballast water from supply ships should not be discharged in the river, and should be treated in accordance with local regulations.
EPC Contractor Included in EPC cost estimate
Dredging sand for fill Increased sedimentation, impacts on aquatic ecology
Sand should only be sourced from licensed concessions with DONRE approved EIAs.
EPC Contractor Included in EPC cost estimate
Groundwater Quality
Fueling and operation of heavy machinery and transport vehicles
Contamination of shallow groundwater and indirect contamination of surface waters
A construction phase spill control plan (SPC) to be implemented, see “Surface Water Quality”, above.
See “Surface Water Quality”
See “Surface Water Quality”

159
Project Stage / Affected Aspects
Project Activity
Potential Environmental
Impacts
Proposed Mitigation Measures
Responsibility for Mitigation
Implementation
Mitigation Cost Source
Worker camp, canteen, etc
Contamination of surface water from inappropriate disposal of liquid and solid wastes
Appropriate waste collection and sanitation facilities should be provided to workers (see “Surface Water Quality”, above).
See “Surface Water Quality”
See “Surface Water Quality”
General construction activities, spills of fuel and oil
Contamination of deep groundwater through abandoned wells
Wells should be plugged, preferably some distance under the surface, and the area surrounding the pipe should be sealed, either with bentonite, concrete or a combination of both.
EPC Contractor Included in EPC cost estimate
Soil Quality Fueling and Operation of Heavy Machinery and Transport Vehicles
Contamination of soil from spills of fuel and oil
A construction phase spill control plan (SPC) will be implemented (see “Surface Water Quality”, above).
See “Surface Water Quality”
See “Surface Water Quality”
Contamination of soils from site runoff
A construction phase erosion and runoff control plan (ERCP) will be implemented (see “Surface Water Quality”, above).
See “Surface Water Quality”
See “Surface Water Quality”
Filling and Leveling Contamination of site with polluted fill
Fill should be assessed for quality based on source and a visual inspection, and if necessary should be tested for contamination before being accepted onto site. Spoil should be utilized on site to the maximum extent possible, and that which cannot be used should be disposed of in an environmentally sound manner in an approved site licensed for the disposal of construction spoil.
EPC Contractor Included in EPC cost estimate
Construction wastes Contamination of river from inappropriate dumping
Construction wastes should be utilized on site to the maximum extent possible. That which cannot be used should be collected by an appropriately licensed company for recycling and/or final disposal in a licensed waste facility.
EPC Contractor Included in EPC cost estimate
Air Quality Operation of heavy machinery and transport vehicles
Negative impact on local ambient air quality from airborne dust from truck and other equipment movement on access and main roads
Use of water sprayers to suppress dust at construction sites, excavation sites and roads as required. Trucks to pass through water pit when leaving site. Excessively muddy trucks should be washed prior to departure from site. Truckloads should be covered. In addition, local air quality should be monitored on a regular basis during the construction phase and actions will be taken to address Project related impacts (see section IX.B – Environmental Monitoring, 153).
EPC Contractor Included in EPC cost estimate Included in construction phase environmental monitoring plan budget

160
Project Stage / Affected Aspects
Project Activity
Potential Environmental
Impacts
Proposed Mitigation Measures
Responsibility for Mitigation
Implementation
Mitigation Cost Source
Negative impact on local ambient air quality due to vehicle emissions
Modern equipment should be used that is in compliance with relevant Vietnamese vehicle emissions regulations (e.g. TCVN 6438-2001). Machinery and trucks should be regularly maintained.
EPC Contractor Included in EPC cost estimate
Management of soil and spoil piles
Negative impact on local ambient air quality from airborne dust
Cut and fill should be balanced to the maximum extent possible in order to minimize the need for fill and for spoil disposal. Soil and temporary spoil piles should be covered or sprayed if generating dust. Piles that are not going to be used in the short-term should be allowed to develop vegetation cover. Spoil should be disposed of in an environmentally sound manner in an approved site licensed for the disposal of construction spoil.
EPC Contractor Included in EPC cost estimate
Noise Pile-driving Disturbance from noise Use of "noise reduction skirts" on pneumatic hammers. Restrict pile-driving to week-days and daytime hours (6 am to 6 pm).
EPC Contractor Included in EPC cost estimate
General construction activities
Disturbance from noise Using mobile sound-absorbing screens in high noise areas. Barriers should not have gaps and should have a continuous minimum surface density of 10 kg/m2 in order to minimize the transmission of sound through the barrier. Barriers should be located as close to the source as possible. To the extent possible, high noise activities should be located as far as possible from residential areas. High noise construction activities should only take place from 06h – 18h. Monitor sound levels periodically to ensure compliance with relevant Vietnamese regulations (e.g. TCVN 5949:1998) and EHS Guidelines.
EPC Contractor Included in EPC cost estimate Included in construction phase environmental monitoring plan budget
Heavy machinery operation
Disturbance from noise Use modern equipment in compliance with relevant Vietnamese vehicle emissions regulations (e.g. TCVN 6438-2001). Regularly maintain machinery and trucks.
EPC Contractor Included in EPC cost estimate

161
Project Stage / Affected Aspects
Project Activity
Potential Environmental
Impacts
Proposed Mitigation Measures
Responsibility for Mitigation
Implementation
Mitigation Cost Source
Transportation General construction activities, construction of access road no. 2
Traffic delays and disruptions
Information should be posted in advance in case of road closures, delays should be kept to a minimum and scheduled during low traffic volume periods, and alternative routes should be provided during closures, if required.
EPC Contractor May require assistance from PC for traffic rerouting
Included in EPC cost estimate
Occupational Health and Safety
General construction activities
Risk of injury to workers from accidents, fires and emergencies, and hazardous working environments.
Prior to the commencement of civil works a Occupational Health and Safety Plan (OHSP) should be developed that is consistent with the relevant requirements of Vietnamese law and with good international practice as reflected in internationally recognized standards such as the World Bank Group’s Environment, Health and Safety Guidelines. The OHSP should:
(i) identify and minimize, so far as reasonably practicable, the causes of potential hazards to workers, including communicable diseases such as HIV/AIDs and vector borne diseases;
(ii) provide preventive and protective measures, including modification, substitution, or elimination of hazardous conditions or substances;
(iii) provide for the provision of appropriate personal protective equipment (PPE) to minimize risks, including ear protection, hard hats and safety boots;
(iv) provide procedures for limiting exposure to high noise or heat working environments;
(v) provide training for workers, and establish appropriate incentives to use and comply with health and safety procedures and utilize PPE;
(vi) include procedures for documenting and reporting occupational accidents, diseases, and incidents; and
(vii) include emergency prevention, preparedness, and response arrangements in place.
EPC Contractor Included in EPC cost estimate
Community Health and Safety
General construction activities Machinery operation, truck traffic Emergencies
Impacts on the Health and Safety of local communities
Prior to the commencement of civil works a Community Health and Safety Plan (CHSP) should be developed that is consistent with the relevant requirements of Vietnamese law and is also consistent with good international practice as reflected in internationally recognized standards such as the World Bank Group’s Environment, Health and Safety Guidelines. The CHSP should include emergency response procedures developed in close collaboration and consultation with potentially affected communities and local authorities, and should address the following aspects of
EPC Contractor Included in EPC cost estimate

162
Project Stage / Affected Aspects
Project Activity
Potential Environmental
Impacts
Proposed Mitigation Measures
Responsibility for Mitigation
Implementation
Mitigation Cost Source
emergency response and preparedness: (i) procedures to identify and minimize, so far as
reasonably practicable, the causes of potential Project related hazards to local communities, including communicable diseases such as HIV/AIDs and vector borne diseases;
(ii) specific emergency response procedures; (iii) trained emergency response teams; (iv) emergency contacts and communication
systems / protocols; (v) procedures for interaction with local and
regional emergency and health authorities; (vi) permanently stationed emergency equipment
and facilities (e.g. first aid stations, fire extinguishers/hoses, sprinkler systems);
(vii) protocols for fire truck, ambulance and other emergency vehicle services;
(viii) evacuation routes and meeting points; and, (ix) drills (annual or more frequently as
necessary). The CHSP should also include procedures for posting warning signs and fences as required to protect local community members from dangerous work areas. Speed limit signs should be posted and all vehicles should be required to confirm with Vietnamese traffic regulations.
Terrestrial Ecosystems
Land Clearance Permanent localized loss of ecosystems; however, affected ecosystems contain no protected areas, natural forests, or rare and endangered species, and have been determined to have no outstanding values. The impact although permanent, is localized and of low significance.
No mitigations are required other than resettlement and compensation for land owners.
NA NA
Aquatic Ecosystems
General construction Dredging
Impacts on aquatic ecosystems as a result of erosion and sedimentation, spills of oil, fuel and
See “Surface Water Quality” See “Surface Water Quality”
See “Surface Water Quality”

163
Project Stage / Affected Aspects
Project Activity
Potential Environmental
Impacts
Proposed Mitigation Measures
Responsibility for Mitigation
Implementation
Mitigation Cost Source
chemicals, wastes from workers, and dredging
Physical Cultural Resources
Construction activities None Chance-find procedure: - If physical cultural resources are encountered during
the construction phase, all works at the find site should be immediately halted.
- The find should be assessed by a competent expert, and procedures to avoid, minimize or mitigate impacts to the physical cultural resources should be developed by the expert in cooperation with the relevant local heritage authority, proportionate to the value of the resource in question and the nature and scale of the Project’s potential adverse impacts on it.
- Work should not begin until the procedures to avoid, minimize or mitigate impacts to the physical cultural resources have been implemented.
- Where avoidance is not feasible, no alternatives to removal exist, and the Project benefits outweigh the anticipated cultural heritage loss from removal, the physical cultural resource should be removed and preserved according to the best available technique.
- Any removal should be conducted in accordance with relevant provisions of national and/or local laws.
- Records should be maintained of all finds, including chain of custody instructions for movable finds.
- All Project workers and staff should be made aware of the chance-find procedure.
EPC Contractor Included in EPC cost estimate
Environmental Issues Associated with the Operation Phase
Surface water quality
Oil spills from the DFO tanks (2x10,000 m3) Oily-water runoff
Reduced water quality in Hau River and nearby streams Impacts on aquatic ecology Impacts on fisheries
An oily wastewater drainage system should drain all areas where oil spillages could occur, or where runoff could be oil contaminated. This includes the bunded area around the DFO tanks, the transformers (which will contain insulating oil); turbines, etc. The oily water should be directed to a gravity-type oil-water separator. The oil-water separator will remove up to 99% of waste oil, which should be collected, stored and either reused, reprocessed, or sold. Sludge from the oil-separator should be dredged periodically and landfilled by a private waste contractor. The treated effluent from the oil-water separator should be directed to the central
EPC Contractor to ensure incorporated into detailed design. CTTP to ensure effectiveness during operation (with initial support from EPC Contractor)
Included in EPC cost estimate

164
Project Stage / Affected Aspects
Project Activity
Potential Environmental
Impacts
Proposed Mitigation Measures
Responsibility for Mitigation
Implementation
Mitigation Cost Source
wastewater treatment system for further treatment. DFO tanks should be situated within a secondary containment system consisting of a 1.5 m high reinforced concrete oil-proof containment wall (bund) capable of holding over 110% of the contents of the DFO tanks. The bund should include a surface water trench collection system which will lead to the oil-water separator.
Spills of fuel, oil and chemicals
Reduced water quality in Hau River and nearby streams Impacts on aquatic ecology
Implementation of an operation phase spill control plan (SPC). The SPC includes the following key elements: - Parking areas should be hard surfaced and protected
by berms. - All areas for storage of fuels, oils or chemicals should
be contained within protective berms. - Oil absorbents should be readily accessible in marked
containers. - Good housekeeping procedures should be established
to avoid the risk of spills in the first place. - Spills should be dealt with immediately, and personal
should be trained and tasked with this responsibility.
CTTP (with initial support from EPC Contractor)
Included in EPC cost estimate
Ship Transport Contamination of river from spills of fuel, oil and chemicals
All supply ships should be required to maintain good hazardous waste management practices, and should have spill response plans in place. Ballast water from supply ships should not be discharged in the river, and should be treated in accordance with local regulations.
CTTP (with initial support from EPC Contractor)
Included in EPC cost estimate
Discharge of domestic wastewater
Reduced water quality in Hau River and nearby streams Impacts on aquatic ecology
All domestic wastewater will be treated in a domestic wastewater treatment plant with a design capacity 108 m3/day, and released to the cooling water discharge channel and ultimately the Hau River. The treatment system will consist of two 3-chamber septic tanks for providing primary treatment through anaerobic digestion; an activated sludge tank and sedimentation basin to provide secondary treatment; and disinfection through the addition of sodium hypochlorite. The sterilized water will be pumped to a holding tank and then released into the cooling water discharge channel. Wastewater should comply with Vietnamese standard QCVN 24/2009/TNMT.
EPC Contractor to ensure incorporated into detailed design. CTTP to ensure effectiveness during operation (with initial support from EPC Contractor)
Included in EPC cost estimate
Discharge of plant wastewater
Reduced water quality in Hau River and nearby streams
A central wastewater treatment plant will treat all process wastewater generated by plant operation. The system will incorporate a central collection tank, a pH equalization tank, flocculation and settling tanks, a secondary clarifier, and an
EPC Contractor to ensure incorporated into detailed design.
Included in EPC cost estimate

165
Project Stage / Affected Aspects
Project Activity
Potential Environmental
Impacts
Proposed Mitigation Measures
Responsibility for Mitigation
Implementation
Mitigation Cost Source
Impacts on aquatic ecology additional post treatment pH stabilization before being directed to a storage tank and then pumped to discharge channel no. 2. Sludge generated in the treatment process will be pumped into a settling tank, dewatered and stored before being collected and landfilled. Wastewater from the settling tank will be pumped back into the equalization tank and retreated. The treatment plant will have a capacity of 37 m3/hour and will operate for 9 hours per day. The effluent that is discharged should be in compliance with Vietnamese Standard QCVN 24/2009/TNMT. The quality of the effluent from the central treatment plant will be monitored at the discharge point.
CTTP to ensure effectiveness during operation (with initial support from EPC Contractor)
Non-oily site runoff Reduced water quality in Hau River and nearby streams Impacts on aquatic ecology
Rain water runoff from building roofs, road surfaces, vegetated areas, and other areas which are not contaminated by DFO, oil, or any chemicals will be collected in a gravity fed surface water drainage system supported by pumps in low areas when required. The drainage system will direct the runoff to a sedimentation basin and then to discharge channel no. 2 through two control gates.
EPC Contractor to ensure incorporated into detailed design. CTTP to ensure effectiveness during operation (with initial support from EPC Contractor)
Included in EPC cost estimate
Surface water withdrawals
Intake of cooling and plant water
Impacts on phytoplankton and zooplankton Impacts and fish and fisheries
Intake should be protected by a fine mesh screen to stop fish, water plants and debris entering the cooling system. Intake velocity should be less than 0.2 m/s.
EPC Contractor to ensure incorporated into detailed design. CTTP to ensure effectiveness during operation (with initial support from EPC Contractor)
Included in EPC cost estimate
River temperature
Discharge of cooling water Impacts on phytoplankton and zooplankton Impacts and fish and fisheries
Temperature of intake and discharge of cooling water to be monitored continuously (see EMoP). Intake and cooling system design limits temperature increase to a maximum of 6oC at the condenser outlets. Cooling channel design facilitates open air cooling.
EPC Contractor to ensure incorporated into detailed design. CTTP to ensure effectiveness
Included in EPC cost estimate

166
Project Stage / Affected Aspects
Project Activity
Potential Environmental
Impacts
Proposed Mitigation Measures
Responsibility for Mitigation
Implementation
Mitigation Cost Source
Cooling system design ensures maximum temperature increase in Hau River is less than 3o C outside of the mixing zone. In addition, during detailed design it is recommended that options for further reducing discharge temperature, either at the condenser or over the length of the discharge channel, be examined.
during operation (with initial support from EPC Contractor)
Groundwater Spills from DFO tanks Spills of fuels and chemicals Discharge of wastewater Oily-runoff
Impact on groundwater quality
Already covered under “Surface water quality”, above.
Air quality Stack emissions Impacts on air quality Non-compliance with Vietnamese emission standards and EHS Guidelines
Use of DLN burners with maximum emissions guaranteed to be in compliance with QCVN 22: 2009/BTNMT emission standards and EHS Guidelines. Emissions should remain in compliance with QCVN 22: 2009/BTNMT emission standards and EHS Guidelines. Compliance is to be monitored through CEMS.
EPC Contractor to ensure incorporated into detailed design. CTTP to ensure effectiveness during operation (with initial support from EPC Contractor)
Included in EPC cost estimate
Increase in ambient levels of pollutants, specifically NO2
No additional mitigation is required. However, because modeling shows a small probability of exceeding 1-hour NO2 concentrations near Project site, monitoring of ambient air quality and on-site meteorology should be conducted as soon as possible to validate modeling results and establish appropriate background concentrations. During operations, should monitoring results indicate non-compliance as a result of emissions from power plant, meteorological conditions leading to exceedances should be identified. Operations and emissions should be scaled down in response to subsequent occurrences of same meteorological conditions.
See EMoP

167
Project Stage / Affected Aspects
Project Activity
Potential Environmental
Impacts
Proposed Mitigation Measures
Responsibility for Mitigation
Implementation
Mitigation Cost Source
Noise Plant operation Disturbance from operational noise
Detailed design specifications should require that suppliers comply with the relevant Vietnamese and EHS noise guidelines and standards, as presented in Table 3. This can be accomplished through: - Selecting equipment with lower sound power levels - Installing silencers for fans - Installing suitable mufflers on engine exhausts and
compressor components - Installing acoustic enclosures for equipment casing
radiating noise - Improving the acoustic performance of constructed
buildings, apply sound insulation - Installing acoustic barriers without gaps and with a
continuous minimum surface density of 10 kg/m2 in order to minimize the transmission of sound through the barrier. Barriers should be located as close to the
- source or to the receptor location to be effective - Installing vibration isolation for mechanical
equipment The specifications should require that sound limit at the Power complex boundary adjacent to the O Mon IV site be ≤ 70 dBA from 06:00 to 22:00, and ≤ 50 dBA from 22:00-06:00 (this complies with EHS and Vietnamese daytime and nighttime guidelines for industrial and commercial areas).
EPC Contractor to ensure incorporated into detailed design. CTTP to ensure effectiveness during operation (with initial support from EPC Contractor)
Included in EPC cost estimate
Waste Disposal of domestic and hazardous waste
Impacts on air, water and soil
Appropriate domestic waste refuse receptacles should be provided and solid waste should be collected regularly and disposed of at a licensed waste disposal facility. Sludge generated by water treatment should be dredged periodically and landfilled by a private waste contractor. The operation phase OHS plan should include a hazardous waste management system (see Health and Safety, below). The main objective should be the protection of the workforce, the prevention of releases and accidents, and appropriate disposal by licensed contractors. All supply ships should be required to maintain good hazardous waste management practices, and should have spill response plans in place.
EPC Contractor to ensure incorporated into detailed design. CTTP to ensure effectiveness during operation (with initial support from EPC Contractor)
Included in EPC cost estimate

168
Project Stage / Affected Aspects
Project Activity
Potential Environmental
Impacts
Proposed Mitigation Measures
Responsibility for Mitigation
Implementation
Mitigation Cost Source
Greenhouse Gases
Plant emissions Climate change GHG emissions will be monitored and reported annually CTTP Included in EPC cost estimate
Earthquakes Plant Operation Damage to facility Potential for fire and chemical spills
Power plant designed and built in accordance with relevant Ministry of Construction standards.
EPC Contractor to ensure incorporated into detailed design. CTTP to ensure effectiveness during operation (with initial support from EPC Contractor)
Included in EPC cost estimate
Flooding Plant operation Risks of contamination of surface water Safety risks to workers
Site elevation to be raised to 2.7 masl. Results of O Mon IV Power Project: Rapid Climate Change Threat and Vulnerability Assessment, being implemented under RETA 6420: Climate Change and Adaptation in Asia and the Pacific, to be considered at detailed design stage.
CTTP to assess and direct EPC accordingly
To be decided
Traffic Plant operation Dust and erosion Roadside ditches should be maintained, vegetation should be maintained on roadside slopes, and the road surface should be properly maintained. In addition, continuous ambient air quality monitoring will be undertaken as noted in the EMoP (see section IX.B – Environmental Monitoring, 153). To deal with the risk of fuel spills, an operation phase spill control plan (SPC) should be implemented (see “Water Quality, above). Potential traffic safety impacts and mitigation measures are discussed under Health and Safety (see below).
CTTP (with initial support from EPC Contractor)
Included in EPC cost estimate
Health and Safety
Plant operation Risk of injury to workers from accidents, fires and emergencies, and hazardous working environments. Risk of impacts to health and safety of community
Prior to the commencement of plant operation the EHS Team should prepare operation phase OHS and CHS plans in accordance with relevant requirements of Vietnamese law and with good international practice as reflected in internationally recognized standards such as the World Bank Group’s Environment, Health and Safety Guidelines. It is anticipated that the plans would include, but not be limited to OHS and CHS aspects for any large industrial facility, including:
CTTP (with initial support from EPC Contractor)
Included in EPC cost estimate
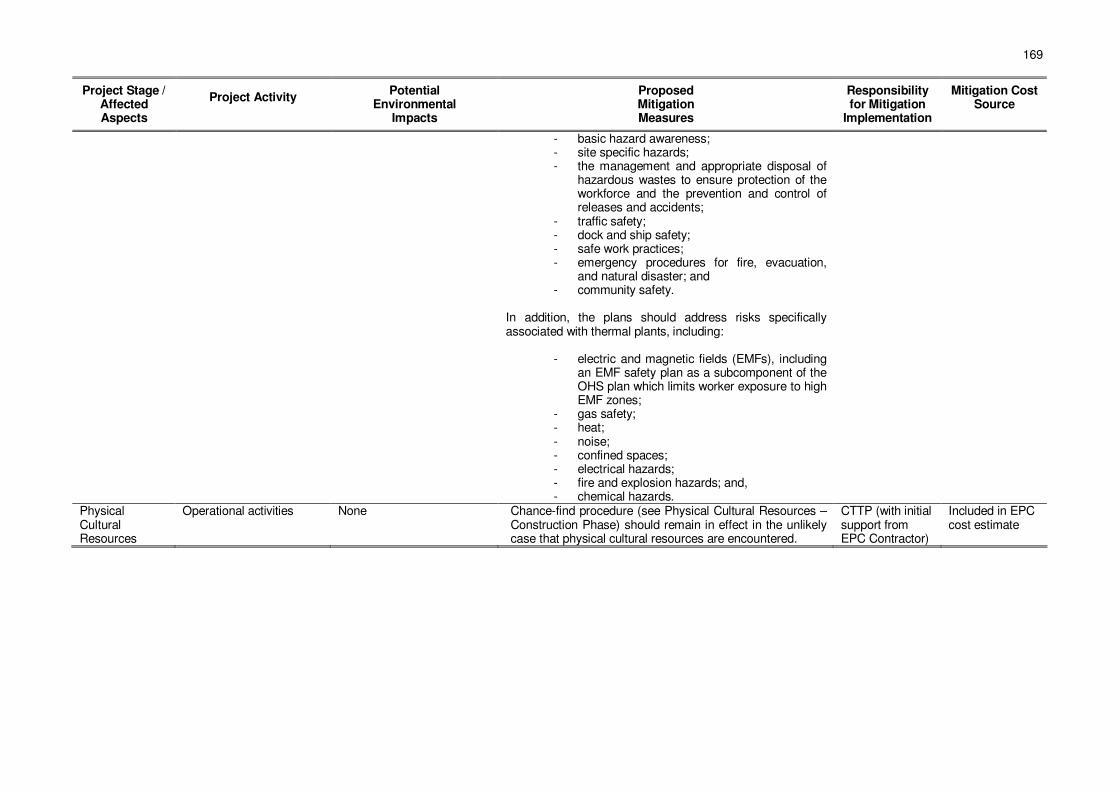
169
Project Stage / Affected Aspects
Project Activity
Potential Environmental
Impacts
Proposed Mitigation Measures
Responsibility for Mitigation
Implementation
Mitigation Cost Source
- basic hazard awareness; - site specific hazards; - the management and appropriate disposal of
hazardous wastes to ensure protection of the workforce and the prevention and control of releases and accidents;
- traffic safety; - dock and ship safety; - safe work practices; - emergency procedures for fire, evacuation,
and natural disaster; and - community safety.
In addition, the plans should address risks specifically associated with thermal plants, including:
- electric and magnetic fields (EMFs), including an EMF safety plan as a subcomponent of the OHS plan which limits worker exposure to high EMF zones;
- gas safety; - heat; - noise; - confined spaces; - electrical hazards; - fire and explosion hazards; and, - chemical hazards.
Physical Cultural Resources
Operational activities None Chance-find procedure (see Physical Cultural Resources – Construction Phase) should remain in effect in the unlikely case that physical cultural resources are encountered.
CTTP (with initial support from EPC Contractor)
Included in EPC cost estimate

170
Table 51: Construction and operation environmental monitoring program
Project Stage/Affected Component
Potential Impact/ Mitigation
Parameters to be Monitored Location Measurements Frequency Responsibility Cost USD
Construction Phase (assumes 1 year design, 2 years construction and monitoring) General Mitigation
compliance inspections
General compliance with mitigation measures presented in the EMP, and with the requirements of the construction phase EHS and CHS plans.
Project site, and all offsite areas where works are being undertaken (access roads, etc)
Visual inspection of all active work areas.
Daily EHS Team of EPC Contractor
Included in EPC cost estimate
Occupational Health and Safety
Worker health As defined in construction phase OHS plan
Project site, and all offsite areas where works are being undertaken (access roads, etc)
As defined in construction phase OHS plan
As defined in construction phase OHS plan
EHS Team of EPC Contractor
Included in EPC cost estimate
Community Health and Safety
Community health
As defined in construction phase CHS plans
Neighboring communities
As defined in construction phase CHS plans
As defined in construction phase CHS plans
EHS Team of EPC Contractor
Included in EPC cost estimate
Public concerns
Complaints
Neighboring communities
Grievance Redress Mechanism
Ongoing
CTTP
Included in EPC cost estimate
Air pollution Ambient air quality
PM10, Four stations within 500 m of construction site
Mobile continuous dust/aerosol monitor
Continuous 3rd party environmental consultant
15,000 (equipment purchase, 7,500 each; primary monitor + back-up) 500/yr calibration and maintenance, based on 250/yr/monitor
Noise Ambient noise Noise levels Power complex boundary adjacent to the O Mon IV site, nearest residences at different directions from power plant
Noise monitor Daily for three days during start of new stage of construction, once weekly thereafter
EHS Team of EPC Contractor
1,500

171
Project Stage/Affected Component
Potential Impact/ Mitigation
Parameters to be Monitored Location Measurements Frequency Responsibility Cost USD
Soil Fill quality pH, salinity, NH4+, total P, Zn, Cd, As, Cr, Hg, Cu, Pb, Oil & grease, selected pesticides, PAHs
Truck or ship Standard analytical methods
The first delivery from any source (e.g. quarry), and then random sampling of deliveries from that source
Samples collected by 3rd party environmental consultant Analysis undertaken by qualified environmental laboratory
4,125 (based on $165/sample and 25 samples)
Soil contamination
pH, salinity, NH4+, total P, Zn, Cd, As, Cr, Hg, Cu, Pb, Oil & grease, selected pesticides, PAHs
4 sites along O Mon IV site boundary, including 1 sediment station
Standard methods Semi-annual Samples collected by 3rd party environmental consultant Analysis undertaken by qualified environmental laboratory
2,650 (based on $165 sample)
Water Groundwater quality
Zn, Cd, As, Pb, Hg, Cr, Cu, Mn; total fecal coliform; NH4+, total nitrates and total phosphates; TDS, TSS
Two existing wells Standard methods Quarterly Samples collected by 3rd party environmental consultant Analysis undertaken by qualified environmental laboratory
1,040 (based on $65 sample)
Groundwater quality
Conductivity, pH, DO, salinity Two existing wells Portable water quality analyzer
Monthly 3rd party environmental consultant
3,500 (equipment purchase)

172
Project Stage/Affected Component
Potential Impact/ Mitigation
Parameters to be Monitored Location Measurements Frequency Responsibility Cost USD
Hau River water quality
Oil & grease; Zn, Cd, As, Pb, Hg, Cr, Cu, Mn; total fecal coliform; NH4+, total nitrates and total phosphates; TDS, TSS
6 stations along river front (the 150 m station at each of the three transects); three stations at mixing zone boundary
Standard methods Quarterly Samples collected by 3rd party environmental consultant Analysis undertaken by qualified environmental laboratory
3,600 (based on $75 sample)
Hau River water quality
Conductivity, pH, DO, salinity 12 stations. 3 each along 3 transects perpendicular to the shoreline (stations at 0, 150, and 500 m from the shore); and 3 stations around the mixing zone boundary
Portable water quality analyzer
Monthly 3rd party environmental consultant
See groundwater
Operation and Maintenance Phase (2 years) General Mitigation
compliance inspections
General compliance with mitigation measures presented in the EMP, and with the requirements of the operation phase OHS and CHS plans.
Project site, access roads
Visual inspection of plant.
To be defined based on operation phase HSE and CHSE plans
CTTP EMD Included in operation costs
Occupational Health and Safety
Worker health As defined in operation phase OHS plan
Project site, and all offsite areas where works are being undertaken (access roads, etc)
As defined in operation phase OHS plan
As defined in operation phase OHS plan
CTTP EMD Included in operation costs
Community Health and Safety
Community health
As defined in operation phase CHSE plans
Neighboring communities
As defined in operation phase CHS plans
As defined in operation phase CHS plans
CTTP EMD
Included in operation costs
Public concerns Complaints Neighboring communities
Grievance Redress Mechanism
Ongoing CTTP EMD Included in operation costs
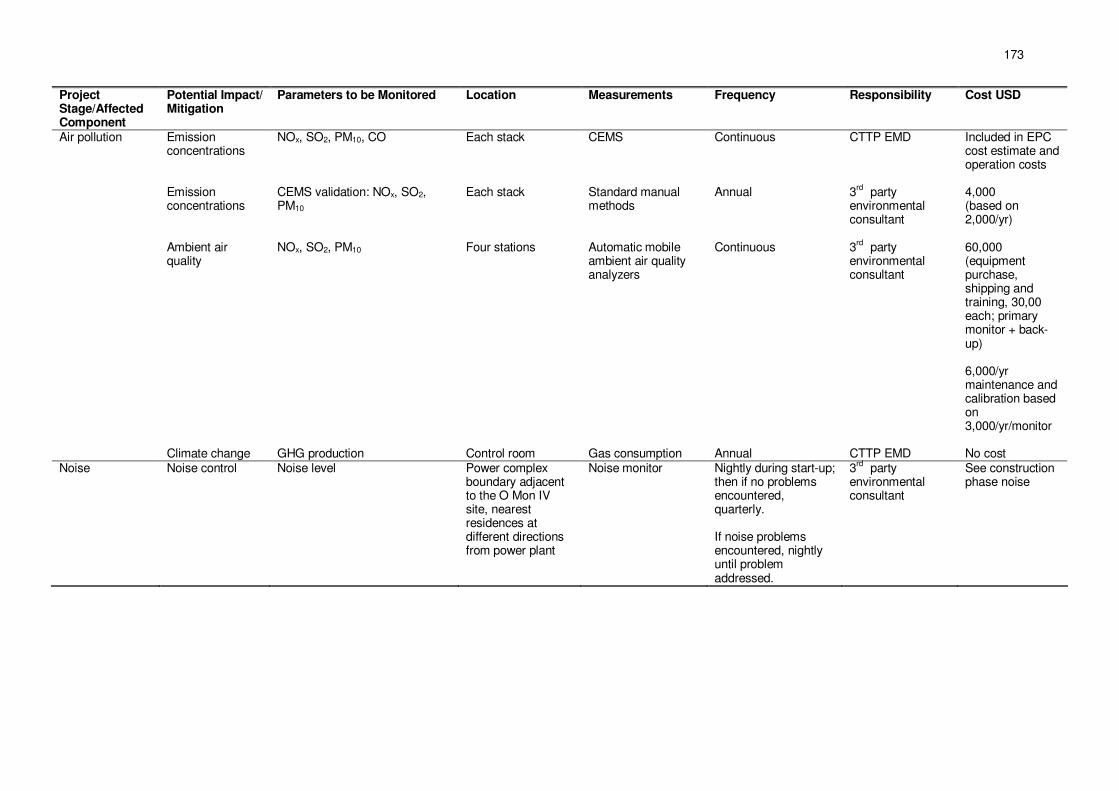
173
Project Stage/Affected Component
Potential Impact/ Mitigation
Parameters to be Monitored Location Measurements Frequency Responsibility Cost USD
Air pollution Emission concentrations
NOx, SO2, PM10, CO Each stack CEMS Continuous CTTP EMD
Included in EPC cost estimate and operation costs
Emission concentrations
CEMS validation: NOx, SO2, PM10
Each stack Standard manual methods
Annual 3rd party environmental consultant
4,000 (based on 2,000/yr)
Ambient air quality
NOx, SO2, PM10 Four stations Automatic mobile ambient air quality analyzers
Continuous 3rd party environmental consultant
60,000 (equipment purchase, shipping and training, 30,00 each; primary monitor + back-up) 6,000/yr maintenance and calibration based on 3,000/yr/monitor
Climate change GHG production Control room Gas consumption Annual CTTP EMD No cost Noise Noise control Noise level Power complex
boundary adjacent to the O Mon IV site, nearest residences at different directions from power plant
Noise monitor Nightly during start-up; then if no problems encountered, quarterly. If noise problems encountered, nightly until problem addressed.
3rd party environmental consultant
See construction phase noise

174
Project Stage/Affected Component
Potential Impact/ Mitigation
Parameters to be Monitored Location Measurements Frequency Responsibility Cost USD
Soil Soil contamination
pH, salinity, NH4+, total P, Zn, Cd, As, Cr, Hg, Cu, Pb, Oil & grease, selected pesticides, PAHs
4 sites along O Mon IV site boundary, including 1 sediment station
Standard methods Semi-annual Samples collected by 3rd party environmental consultant Analysis undertaken by qualified environmental laboratory
2,650 (based on $165 sample)
Water Groundwater Zn, Cd, As, Pb, Hg, Cr, Cu, Mn; total fecal coliform; NH4+, total nitrates, total phosphates; TDS, TSS
Two existing wells Standard methods Semi-annually (dry and wet season)
Samples collected by 3rd party environmental consultant Analysis undertaken by qualified environmental laboratory
520 (based on $65 sample)
Wastewater Temperature, chlorine, pH, BOD5, COD; Oil & grease; Zn, Cd, As, Pb, Hg, Cr, Cu, Mn; pesticides; total fecal coliform
Discharge channel outlet
Standard methods Quarterly Samples collected by 3rd party environmental consultant Analysis undertaken by qualified environmental laboratory
640 (based on $80 sample)

175
Project Stage/Affected Component
Potential Impact/ Mitigation
Parameters to be Monitored Location Measurements Frequency Responsibility Cost USD
Hau River water quality
Temperature, conductivity, pH, DO, salinity
12 stations. 3 each along 3 transects perpendicular to the shoreline (stations at 0, 150, and 500 m from the shore; and 3 stations around the mixing plume boundary
Portable water quality analyzer
Monthly 3rd party environmental consultant
See construction phase groundwater
Cooling water Temperature Intake and discharge channel outlet
Thermistor Continuous CTTP EMD Included in EPC cost estimate and operation costs
Aquatic Ecology Fisheries Visible fish kills Water intake, outlets and Hau River in O Mon area
Visual inspection Daily at start-up; weekly during rainy season; otherwise, monthly
CTTP EMD Included in operation costs
Aquatic ecology Phytoplankton, Zooplankton, Zoobenthos
Hau River Abundance, species composition
Quarterly during the first two years of operation. Results to be evaluated at the end of two years and a decision will be made at that time if additional monitoring is required.
3rd party environmental consultant and laboratory
16,000 (based on 2,000 per quarter)
Fisheries and aquaculture
Fish fauna, fisheries and aquaculture
Water intake, outlets and Hau River in O Mon area
Abundance, species composition, fish catch, aquaculture production
Quarterly during the first two years of operation. Results to be evaluated at the end of two years and a decision will be made at that time if additional monitoring is required.
3rd party environmental consultant and laboratory
8,000 (based on 1,000 per quarter)

176
Figure 71: Proposed locations for groundwater, surface water, soil and sediment monitoring and/or sampling and monitoring station locations, construction and operation phases. (At six of the surface water stations samples will be collected for more detailed laboratory analysis).
Figure 72: Proposed locations for meteorological, noise, and ambient air quality sampling and monitoring station locations, construction and operation phases

177
C. Implementation Roles and Responsibilities
444. Figure 73 provides an organization chart showing overall institutional responsibilities and lines of reporting.
1. Government of Viet Nam
Construction Phase 445. From the perspective of the ADB, the Government of Viet Nam (GOV) will be the Project borrower, and will then on-lend the loan proceeds to EVN. The GOV will sign the loan agreement, which will include a loan covenant that requires the borrower to follow the Project EMP. From the perspective of KfW, EVN will be the borrower, and the GOV will provide a state guarantee.
Operation Phase 446. As above.
2. EVN
Construction Phase 447. EVN will be the Executing Agency (EA). EVN has the overall responsibility for submission of the EIA for ADB/KfW review and approval, and has overall responsibility to ensure that the EMP is implemented and appropriately financed, though this responsibility is delegated to CTTP.
Operation Phase 448. As above.
3. Can Tho Thermal Power Company
Construction Phase 449. EVN has tasked CTTP to be the implementing agency and to manage the Project construction and operation. A CTTP Officer-in-Charge (OIC) will assume overall responsibility for O Mon IV activities. 450. The power plant will be constructed through a single engineering, procurement and construction (EPC) package, to be implemented by an EPC contractor. CTTP will contract an international EPC consultant to support CTTP with the tendering procedure for, and supervision of, the EPC package. CTTP will provide overall management of, and technical direction to, the EPC consultant and the EPC contractor. 451. On behalf of EVN, CTTP will be responsible for ensuring that the EMP is appropriately implemented during the construction phase. This will be accomplished through overseeing the performance of the EPC contractor’s environment, health and safety (EHS) team. The Environmental Management Department (EMD) of CTTP will provide technical direction to and oversee the EPC contractor’s EHS Team. The EMD of CTTP will be strengthened through the construction phase environmental monitoring and reporting and OHS/CHS training delivered under the capacity building plan (CBP). 452. CTTP will also be responsible for recruiting the 3rd party environmental consultant who will undertake the monitoring presented in the EMoP, for recruiting the external experts
178
to verify information collected through the EMoP (see Section IX.C.7, below), and semiannual reporting to ADB (based on reports prepared by the EPC contractor).
Operation Phase 453. CTTP will assume full responsibility for all aspects of Project operation once power plant operation commences. The EMD of CTTP will be responsible for EMP implementation, including:
- planning and management of operation phase environmental mitigation measures noted in the EMP, including specific mitigation plans (e.g. erosion and runoff control plan (ERCP), and spill control plan (SPC), chance-find procedure, etc.);
- coordinating with other parties in relation to environmental management activities; - ensuring compliance with OHS and CHS plans during the construction phase; - monitoring of plant stack emissions through the CEMS, ensuring that emissions
are within relevant Vietnamese or international standards or requirements, and taking action to address exceedances or other observed problems, including notifying the CTTP OIC and recommending measures to address identified existing or potential environmental problems;
- ensuring that operation phase environmental monitoring is undertaken by a 3rd party environmental consultant and/or EMD staff, including air, soil, surface water and wastewater environmental monitoring and sampling as per the requirements of the environmental monitoring plan (EMoP) presented in the EMP;
- ensuring that monitoring results are within relevant Vietnamese or international standards or requirements, and taking action to address exceedances or other observed problems, including notifying the CTTP O Mon IV OIC and recommending measures to address identified existing or potential environmental problems;
- ensuring monitoring verification by external experts; - coordination and delivery of training programs on environmental monitoring and
OHS and CHS; - annual reporting on environmental information to concerned parties; and, - functioning as a point of contact for MONRE, DONRE and other GOV agencies.
454. CTTP will allocate EHS staff from the EMD to work on O Mon IV, and have committed to the recruitment of new staff if necessary. The organization chart for the CTTP EMD is presented in Appendix 14. The EMD staff will be strengthened through the operation phase environmental monitoring and reporting and OHS/CHS training delivered under the CBP.
4. EPC Consultant
Construction Phase
455. The EPC consultant will support CTTP with the tendering procedure for, and supervision of, the EPC contractor, including ensuring the integration of EMP specifications into EPC package contract documents; ensuring that the contractor has an appropriately qualified EHS Team; and reviewing and approving the EPC Package contractor’s bidding documents to ensure their compliance with EMP specifications. However, CTTP will ultimately have responsibility for the EPC contractor’s performance.
Operation Phase 456. The EPC consultant will not have any significant responsibilities during the operation phase.

179
5. EPC Contractor
Construction Phase
457. The EPC contractor will have direct responsibility for all aspects of the EPC package, including construction of the power plant and related facilities, and implementation of mitigation measures presented in the EMP. 458. The EPC contractor’s EHS team will have day-to-day responsibility for implementation of mitigation measures. The EHS Team will consist of an International EHS Officer (eight person-months) and a National EHS Officer (26 person-months) during the three year construction phase. It is assumed that the first year of the construction phase will be primarily devoted to detailed design, so inputs from the EHS Team will be limited during that period. 459. The Environmental Management Department (EMD) of CTTP will provide EHS related technical direction to the EHS team; the team is expected to maintain a close working relationship with the EMD and liaison with them on a regular basis. 460. The overall responsibility of the EHS Team will be to ensure that, through the implementation of the mitigation measures and plans presented in the EMP, the construction of the O Mon IV Project will not result in significant negative impacts on environmental quality or worker or community health and safety. This will include:
- implementing construction phase mitigations as described in the EMP, including specific mitigation plans (e.g. erosion and runoff control plan (ERCP), spill control plan (SPC), chance-find procedure, etc);67
- ensuring compliance with all relevant Vietnamese standards and EHS Guidelines; - recruiting, in coordination with CTTP, training consultants and overseeing the
delivery of the environmental monitoring and EHS/CHS training programs; - development of OHS and CHS plans for the construction phase, and, at an
appropriate time, assisting CTTP EMD in the development of an operational phase OHS and CHS plans;
- ensuring safety of construction workers and local people during construction, and compliance with all relevant Vietnamese OHS standards;
- preparing semiannual environmental management and monitoring reports for submission to CTTP and on-submission to ADB, KfW and JBIC; and,
- coordinating with other parties in relation to environmental management activities. 461. A detailed Terms of Reference (ToR) for the EHS Team is presented in Appendix 15.
Operation Phase 462. The EPC contactor will provide warranty, maintenance and technical support for the first two years of operation. The contractor’s EHS team is expected to assist the CTTP EMD assume their EMP responsibilities during an initial hand-over phase, and then be available on an on-call basis as needed. One person month for the International EHS and three person months for the National EHS Officer are allotted to cover these responsibilities.
67 The contractors’ bidding documents should present in detail the contractors’ proposed approach to EMP
implementation.

180
6. 3rd Party Environmental Consultant
Construction Phase 463. The 3rd party environmental consultant will be responsible for undertaking the construction phase environmental monitoring and laboratory analysis as indicated in the EMoP (Table 51) and for preparing quarterly monitoring reports that are submitted to the EMD of CTTP. The consultant will also assist the EPC contractor prepare semiannual monitoring reports for submission by CTTP to ADB, KfW and JBIC. 464. The 3rd party consultant will be responsible for immediately reporting to CTTP and the EPC contractor results that exceed relevant Vietnamese or international standards or requirements.
Operation Phase 465. The EMD of CTTP will have overall responsibility for undertaking operational phase monitoring. CTTP will likely continue to use the services of a 3rd party consultant, but is expected to take on some monitoring activities themselves, such as using the portable water quality analyzer to take in-situ measurements of surface and groundwater quality. This will need to be defined in detail prior to the commencement of operation.
7. External Environmental Monitoring Verification
Construction Phase 466. As required by the ADB SPS, CTTP will retain qualified and experienced external experts to verify information collected through the EMoP. It is anticipated that the external monitors will conducti annual verification missions beginning in year two of the construction phase.
Operation Phase 467. Annual external verification monitoring will continue during the operation phase.
8. DONRE
Construction Phase 468. As the provincial level environmental regulator, the Can Tho DONRE will be responsible for monitoring the implementation of the EMP through its own internal monitoring system. This will include receiving and reviewing environmental monitoring reports prepared by the EHS Team during the construction phase and the CTTP EMD during operation. It is expected that any non-compliance with EMP requirements observed by DONRE will be reported to the EPC contractor and/or CTTP for immediate action.
Operation Phase 469. As above, except that it is expected that any non-compliance with EMP requirements observed by DONRE will be reported to CTTP for immediate action.
181
9. Training Consultants
Construction Phase 470. Independent suitably qualified international and domestic environmental monitoring and OHS/CHS experts will be recruited by the EPC contractor in cooperation with CTTP to deliver the training presented in the CBP.
Operation Phase 471. As above. The operation phase environmental monitoring and OHS/CHS training will actually be delivered at the end of the construction phase, immediately prior to the start of operation.
10. ADB
Construction Phase 472. ADB is responsible for screening projects to specify ADB’s safeguard requirements; undertaking due diligence; reviewing the EIA to ensure that safeguard measures are in place to avoid, wherever possible, and minimize, mitigate, and compensate for adverse environmental impacts; and monitoring and supervising the project’s environmental performance throughout the project cycle. ADB also discloses the EIA report on its website. 473. If the borrower fails to comply with legal agreements on safeguard requirements, including those described in EIA and EMP, ADB will seek corrective measures and work with the borrower to bring the Project back into compliance. If the borrower fails to reestablish compliance, then ADB may exercise legal remedies, including suspension, cancellation, or acceleration of maturity, that are available under ADB legal agreements. Before resorting to such measures, ADB will use other available means to rectify the situation satisfactorily to all parties to the legal agreements, including initiating dialogue with the parties concerned to achieve compliance with legal agreements.
Operation Phase 474. ADB will continue monitoring and supervising the project’s environmental performance.

182
Figure 73: Project organization chart emphasizing environmental management and reporting responsibilities during construction and operation
GOV (Borrower)
- GOV on-lends to EVN
ADB, KfW, JBIC (Financers)
Approves EIA Monitoring/supervision
EVN (Executing Agency)
- Submits EIA to ADB/KfW/JBIC & MONRE - Has overall responsibility for Project
performance, delegates this responsibility to CTTP
CTTP (Implementing Agency)
- Oversees EPC Contractor during construction
- Responsible for plant operation
CTTP EMD - Provides guidance to EPC Contractor HSE
Team during construction - Oversees 3rd party environmental
monitoring consultant during construction - Assumes all EHS responsibilities once
plant starts operation, including environmental monitoring and reporting (with assistance from 3rd party consultant)
EPC Consultant - Assists CTTP with
EPC Contractor tendering and supervision during construction
EPC Contractor HSE Team - Directly responsible for EMP
mitigations during construction
- Prepares construction phase semiannual monitoring reports
- Provides CTTP EMD technical advice during operation phase warranty
EPC Contractor - Responsible for all aspects of
plant engineering, procurement and construction
Can Tho DONRE - Reviews
monitoring reports - Ensures
compliance with VN laws and standards
MONRE - Approves EIA
Project financing
EIA submission and review
Lines of project management authority
Environmental reporting
Independent Verification
Monitor - Recruited by
CTTP - Undertakes
annual environmental monitoring verification and reporting to Financers and DONRE
Darker lines denote agencies with primary environmental responsibilities
3rd Party Environmental
Consultant - Undertakes
construction phase environmental monitoring
- Assists CTTP EMD with operation phase annual environmental monitoring and reporting
Semiannual environmental reporting by
CTTP to Financers and
DONRE during
construction and operation

183
D. Capacity Building Plan
1. Environmental Monitoring and Reporting
a. Construction Phase
475. Prior to the beginning of major land works, a suitably qualified international environmental expert will be recruited by the EPC contractor in cooperation with CTTP to develop and deliver a training program on environmental monitoring and reporting. The topics of the training will include the following:
- fundamentals of air, noise, water and soil pollution; - pollutant generation, transport and diffusion; - health and ecological effects of environmental pollution; - environmental guidelines and standards; - basic environmental statistics; - principles of operation of key environmental sampling instruments; - sampling site selection guidelines; - field and laboratory safety, quality assurance and quality control; - documentation and chain-of-custody procedures; - proper sample collection, labeling, preservation, storage and transportation; and, - environmental monitoring report preparation.
476. The training should combine classroom lectures, hands-on sessions with the equipment, field exercises, and mock (or actual) report preparation. The training will be delivered to relevant staff of the CTTP EMD, the EPC consultant and EPC contractor, the third party environmental monitoring consultant and analytical laboratory, and the DOSTE. 477. To facilitate the training and standardize the procedures, an environmental monitoring manual will be prepared prior to the training (it is anticipated that the manual can be readily adapted from the environmental expert’s existing training materials). The manual will also contain templates for reporting. EHS staff will be expected to review and update the manual periodically as new guidelines are implemented or new tools are acquired. 478. The training will likely involve a team of one international expert supported by one local expert. The expert must have extensive knowledge in the principles of environmental monitoring, demonstrate adequate experience in the conduct of sampling programs, and possess skills in technical training. The international expert will prepare the manual, design the training program, and lead the training. The local expert will assist in training, particularly in the field exercises.
b. Operation Phase
479. Prior to the commencement of plant operation a suitably qualified national environmental expert will be recruited by the EPC contractor in cooperation with CTTP to develop and deliver a training program on operation phase environmental monitoring and reporting. The topics of the training will be similar to the construction phase training program, but will also include modules on stack emission CEMS, wastewater monitoring, and development of aquatic ecology monitoring programs. The training will be delivered to relevant staff of the CTTP EMD, the third party environmental monitoring consultant and analytical laboratory, and the DOSTE.

184
2. OHS and CHS
a. Construction Phase
480. Prior to the beginning of major land works, a suitably qualified international health and safety expert will be recruited by the EPC contractor in cooperation with CTTP to develop and deliver a training program on construction phase OHS and CHS. Upon completion of the course participants should be able to recognize and adopt the basic requirements for health and safety on construction sites, including both equipment and procedures. It is anticipated that modules would include, but not be limited to:
- hazard recognition; - personal protective equipment; - chemicals and hazardous wastes; - fire hazards; - electrical hazards; - fall protection; - hoisting and rigging; - confined spaces; - asbestos; - lockout and tagging; - welding; - rigging basics; - heavy equipment; - traffic safety; - dock and ship safety; - propane; - trenching and fill; - access equipment; - back care and material handling; - community health and safety ; - legislation; and, - OHS/CHS “training for the trainers”.
481. Participants to be trained should include staff from CTTP, the EPC contractor and subcontractors. 482. The international health and safety expert should also review and strengthen as necessary the construction phase OHS and CHS plans developed by the EPC contractor’s EHS Team, and assist the EHS Team and CTTP to develop a OHS/CHS ongoing training program for all new workers and contractors.
b. Operational Phase
483. Prior to the commencement of plant operation, a suitably qualified international health and safety expert will be recruited by the EPC contractor in cooperation with CTTP to develop and deliver a training program on operation phase OHS and CHS. Upon completion of the course, participants should be able to recognize and adopt the basic requirements for health and safety at a thermal power plant. It is anticipated that modules would include, but not be limited to OHS and CHS aspects for any large industrial facility, including:
- basic hazard awareness; - site specific hazards; - safe work practices; - emergency procedures for fire, evacuation, and natural disaster; and - community safety.

185
In addition, the training should address risks specifically associated with thermal plants, including:
- electric and magnetic fields (EMFs); - gas safety; - heat; - noise; - confined spaces; - electrical hazards; - fire and explosion hazards; and, - chemical hazards.
484. Participants to be trained should include relevant CTTP staff, the EPC consultant and EPC contractor, and subcontractors. 485. The international health and safety expert should also review and strengthen as necessary the operation phase OHS and CHS plans developed by the EPC contractor’s EHS Team, and assist the CTTP to develop a OHS/CHS training program for all new workers and contractors. E. Budget
486. The EMP budget is presented in Table 52 for the three year construction phase and two year warranty and maintenance operational phase. $187,925 is allocated to the environmental monitoring, analysis and reporting; $80,000 to the independent monitoring consultant, based on four monitoring missions; $86,500 for training and capacity building in environmental monitoring; and $249,000 for the EPC contractor EHS Team. With a 15% contingency the total EMP budget is $693,939.68 The costs for laboratory analysis of surface water, groundwater, wastewater and soil samples are based on Circular No 232/2009/TT-BTC of the Ministry of Finance, dated Dec. 9th, 2009. It should be noted that cost for many of the EMP mitigation measures, such as the use of DLN burners and the treatment of all wastewater, is included in the EPC contract cost estimate and/or operating costs estimates, and is thus not included in the EMP budget. It should also be noted that this budget only covers the first two years of operation, namely the warranty and maintenance period. However, CTTP will be expected to implement the operation phase environmental management measures throughout the lifetime of the Project.
68 The EMP costs are incorporated into the following costs items in the Project budget, Table 12: A.2 Engineering,
Procurement and Construction; A.4 Consulting Services; and A.7 Independent Monitoring of Environmental Impacts.
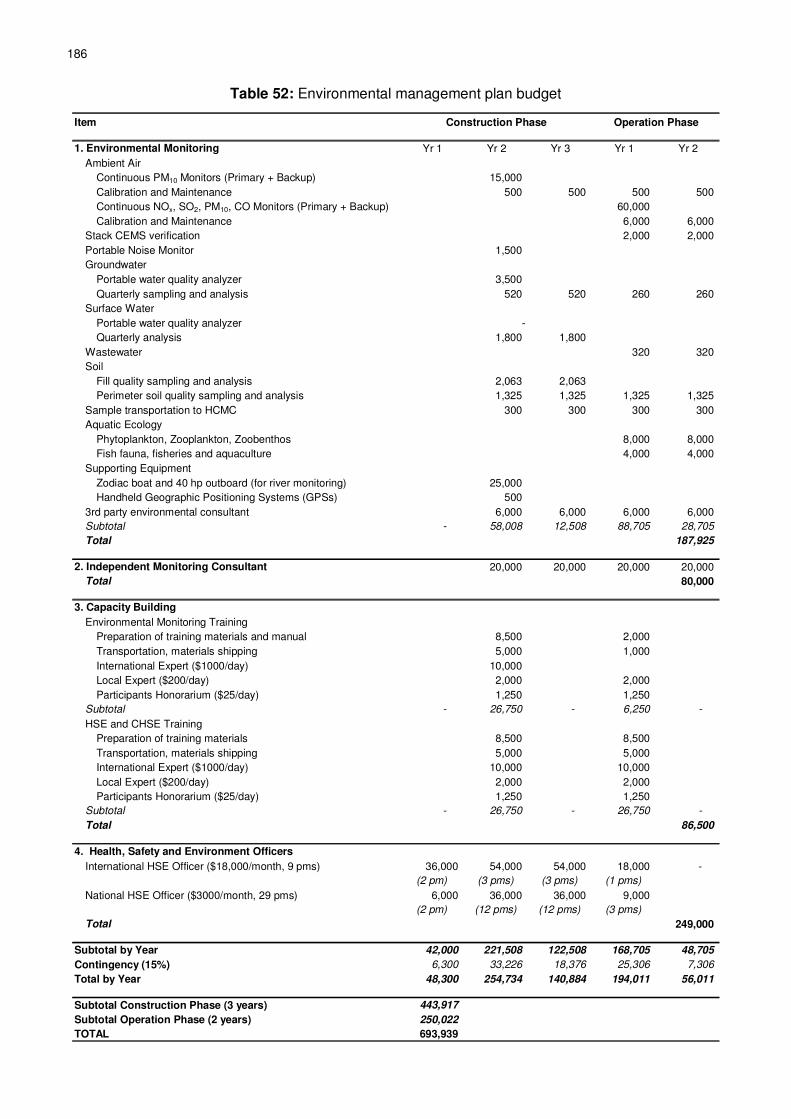
186
Table 52: Environmental management plan budget
Item
1. Environmental Monitoring Yr 1 Yr 2 Yr 3 Yr 1 Yr 2
Ambient Air
Continuous PM10 Monitors (Primary + Backup) 15,000
Calibration and Maintenance 500 500 500 500
Continuous NOx, SO2, PM10, CO Monitors (Primary + Backup) 60,000
Calibration and Maintenance 6,000 6,000
Stack CEMS verification 2,000 2,000
Portable Noise Monitor 1,500
Groundwater
Portable water quality analyzer 3,500
Quarterly sampling and analysis 520 520 260 260
Surface Water
Portable water quality analyzer -
Quarterly analysis 1,800 1,800
Wastewater 320 320
Soil
Fill quality sampling and analysis 2,063 2,063
Perimeter soil quality sampling and analysis 1,325 1,325 1,325 1,325
Sample transportation to HCMC 300 300 300 300
Aquatic Ecology
Phytoplankton, Zooplankton, Zoobenthos 8,000 8,000
Fish fauna, fisheries and aquaculture 4,000 4,000
Supporting Equipment
Zodiac boat and 40 hp outboard (for river monitoring) 25,000
Handheld Geographic Positioning Systems (GPSs) 500
3rd party environmental consultant 6,000 6,000 6,000 6,000
Subtotal - 58,008 12,508 88,705 28,705
Total 187,925
2. Independent Monitoring Consultant 20,000 20,000 20,000 20,000
Total 80,000
3. Capacity Building
Environmental Monitoring Training
Preparation of training materials and manual 8,500 2,000
Transportation, materials shipping 5,000 1,000
International Expert ($1000/day) 10,000
Local Expert ($200/day) 2,000 2,000
Participants Honorarium ($25/day) 1,250 1,250
Subtotal - 26,750 - 6,250 -
HSE and CHSE Training
Preparation of training materials 8,500 8,500
Transportation, materials shipping 5,000 5,000
International Expert ($1000/day) 10,000 10,000
Local Expert ($200/day) 2,000 2,000
Participants Honorarium ($25/day) 1,250 1,250
Subtotal - 26,750 - 26,750 -
Total 86,500
4. Health, Safety and Environment Officers
International HSE Officer ($18,000/month, 9 pms) 36,000 54,000 54,000 18,000 -
(2 pm) (3 pms) (3 pms) (1 pms)
National HSE Officer ($3000/month, 29 pms) 6,000 36,000 36,000 9,000
(2 pm) (12 pms) (12 pms) (3 pms)
Total 249,000
Subtotal by Year 42,000 221,508 122,508 168,705 48,705
Contingency (15%) 6,300 33,226 18,376 25,306 7,306
Total by Year 48,300 254,734 140,884 194,011 56,011
Subtotal Construction Phase (3 years) 443,917
Subtotal Operation Phase (2 years) 250,022
TOTAL 693,939
Construction Phase Operation Phase

187
X. CONCLUSION AND RECOMMENDATION
487. This report has been prepared based on a review of existing studies and reports, including the O Mon IV PECC3 EIA produced in 2007 and the Vattenfall EIA produced in 2008, supported by site visits, stakeholder consultations and additional air quality dispersion modeling undertaken in 2010. Through this process a thorough assessment has been undertaken of the key potential impacts attributable to the construction and operation of the O Mon IV Thermal Power Project, and cumulative impacts attributable to the operation of all power plants that are planned or might conceivably be constructed at the O Mon Power Complex (i.e. O Mon I to V). Alternatives to the Project and to key design aspects were also examined. 488. During construction, the main environmental issues are noise, dust, and the disturbance to natural vegetation. There is also a risk of contaminating the soil, groundwater and the Hau River during oil spills. Erosion of soil and stored materials leading to increased turbidity in the river may also occur during rainy periods. 489. Noise and dust, including the contamination of groundwater, constitute public health concerns. As the Hau river is both of ecological and economic importance to the region, deterioration in its quality would be considered a significant adverse impact. These risks and impacts are not unusual issues for similar projects at this stage of development. They are generally manageable through good housekeeping and a diligent implementation of the Environmental Management Plan for construction. Focus will be required on the closest homes for monitoring. 490. Social impacts such as the displacement of people’s homes and disruption of their livelihoods prior to construction have been dealt with in a separate resettlement and compensation process. 491. During operation, one of the most significant impacts is the increase in short-term ambient NO2 concentrations. It has been demonstrated through dispersion modeling that the magnitude and probability of exceedances (and therefore of adverse health impacts) from air pollution from both the Project alone and from the full Power complex is very low, and no additional mitigation is necessary. Daily and annual concentrations of air pollutants were found to be limited by the highly variable wind conditions in the area. Continuous ambient monitoring of selected pollutants during operations has been proposed to address the lack of adequate baseline data in the area and as a means to verify the modeling results. 492. The other major impact is the warming of the river by the thermal discharge. The warming of the river is not expected to exceed applicable guidelines nor affect key aquatic resources such as spawning grounds. The monitoring program, which includes continuous monitoring of intake and discharge temperatures, monthly monitoring of river water temperatures, and quarterly monitoring of aquatic ecology and fisheries, has been formulated to further understand the extent of the warming, and to alert CTTP if conditions arise where additional mitigations are required to address thermal discharge impacts. 493. A comprehensive EMP has been developed which includes: i) construction and operation phase mitigation measures; ii) a rigorous environmental monitoring and reporting plan; iii) independent third party verification of the monitoring result; and iv) an EHS team that will oversee mitigation implementation, monitoring and reporting during the construction stage, and assist CTTP assume this responsibility during the operation phase. With a 15% contingency the total EMP budget is $693,939. It should be noted that cost for many of the EMP mitigation measures, such as the use of DLN burners and the treatment of all wastewater, are included in the EPC contract cost estimate and/or operating costs estimates, and are thus not included in the EMP budget.

188
494. The construction and operation of the Project will have an important role in supplying power necessary to meet national socio-economic development, especially in the south of Viet Nam, and will improve reliability and stability of the national power system during the period 2015 to 2025. Based on the analysis conducted in this assessment it is concluded that overall the Project will result in significant positive socioeconomic benefits, and those potential negative environmental impacts that have been identified are small-scale and localized, and can be minimized adequately through good design and the appropriate application of mitigation measures. It is therefore recommended that the Project be supported by ADB, KfW and JBIC, subject to the implementation of the commitments contained in the EMP and allocation of appropriate technical, financial and human resources by stakeholders to ensure these commitments are effectively and expediently implemented.

189
APPENDICES
Appendix 1: References
Appendix 2: Unofficial Translation of MONRE Approval Letter for O Mon IV Environmental Impact Assessment
Appendix 3: O Mon IV Detailed Design Features and Systems
Appendix 4: Analytical Certificate - Phytoplankton
Appendix 5: Analytical Certificate - Zooplankton
Appendix 6: Analytical Certificate - Benthic Macrofauna
Appendix 7: Hau River Fish Species
Appendix 8: Analytical Certificate – Soil Quality
Appendix 9: Analytical Certificate – Groundwater Quality
Appendix 10: Analytical Certificate – Surface Water Quality
Appendix 11: Analytical Certificate – Sediment Quality
Appendix 12: Supplementary Air Quality Modeling Results
Appendix 13: Public Consultation and Disclosure
Appendix 14: Organization Chart, Environmental Management Department, CTTP
Appendix 15: EPC Contractor’s EHS Team Terms of Reference

190
This page has been deliberately left blank to allow for double sided printing.

191
APPENDIX 1: REFERENCES
Can Tho Thermal Power Company, 2010. O Mon IV Power Plant – 750 MW – Construction Investment Report. Can Tho, Viet Nam. Based on O Mon IV feasibility study undertaken by the Power Engineering and Consulting Company 3 in 2007. Can Tho Thermal Power Company, 2010. O Mon IV Summary Report (Power Point Presentation). Cole, H.S. and J. E. Summerhays, 1979. A review of techniques available for estimating short-term NO2 Concentration. JAPCA 29:812 (1979). Electricity Viet Nam, 1998. O Mon I and II Thermal Power Plant Environmental Impact Assessment. Prepared by The Power Investigation and Design Company II. Environmental Protection Agency, 1980. Mixing Zones: Water Quality Standards Criteria Digest. A Compilation of State/Federal Criteria. Office of Water Regulations and Standards. Washington DC. Environmental Protection Agency, 1987. Ambient Monitoring Guidelines for Prevention of Significant Deterioration (PSD). EPA-450/4-87-007, US EPA Office of Air Quality Planning and Standards (OAQPS), Research Triangle Park, NC 27711. Environmental Protection Agency, 1987. On-Site Meteorological Program Guidance for Regulatory Modeling Applications. EPA-450/4-87-013, OAQPS, Research Triangle Park, NC 27711. EVN, 2007: O Mon IV Thermal Power Plant Environmental Impact Assessment Report. Prepared for EVN by PECC3. Ho Chi Minh City, Viet Nam. EVN, 2008: Draft O Mon IV Thermal Power Plant Environmental Impact Assessment Report. Prepared for EVN by Vattenfall Power Consultants AB, under the ADB financed PPTA 4845-VIE: Preparing the Support for Public-Private Development of the O Mon Thermal Power Complex Project (PPTA 4845-VIE). GlobCover Land Cover v2 2008 database. European Space Agency, European Space Agency GlobCover Project, led by MEDIAS-France. 2008. http://ionia1.esrin.esa.int/index.asp Hurley P., W. Physick, and A. Luhar, 2005. TAPM – A practical approach to prognostic meteorological and air pollution modeling, Environmental Modeling and Software, 20, 737-752. Institute of Energy, 2010. The Seventh Power Development Master Plan (PDMP7) Interim Summary Report. Ha Noi, Viet Nam. Jarvis A., H.I. Reuter, A. Nelson, E. Guevara, 2008, Hole-filled seamless SRTM data V4, International Centre for Tropical Agriculture (CIAT), available from http://srtm.csi.cgiar.org. Nguyen Thanh Tung, 2005. Đánh giá sự biến động về thành phần loài, số lương cá bột và cá con ở thuỷ vực Vĩnh Xương và Quốc Thái thuộc hạ lưu sông Cửu Long. Luận án Tiến sĩ Sinh học. Viện Hải dương học Nha Trang. Nguyen, Thanh Nhan and Ha-Duong, Minh, 2008. Economic Potential of Renewable Energy in Viet Nam's Power Sector. Centre International de Recherche sur l'Environnement et le Developpement (CIRED).

192
Phung Chi Sy and Nguyen Thi Quynh Huong, 2009. Support to Harmonization of Environmental Impact Assessment (EIA) under the Hanoi Core Statement on Aid Effectiveness. Ha Noi, Viet Nam. Scire, J.S., D. G. Strimaitis, and R. J. Yamartino, 2005. User's Guide for the CALPUFF Dispersion Model (Version 5.0). Earth Tech, Inc., 196 Baker Avenue, Concord, MA 01742. Vietnam Union of Science and Technology Association (VUSTA), 2007. Assessment of Vietnam Power Development Plan. Ha Noi, Viet Nam. Web: www.iucnredlist.org www.fishbase.com

193
APPENDIX 2: UNOFFICIAL TRANSLATION OF MONRE APPROVAL LETTER FOR O MON IV ENVIRONMENTAL IMPACT ASSESSMENT

194

195

196
This page has been deliberately left blank to allow for double sided printing.

197
APPENDIX 3: O MON IV DETAILED DESIGN FEATURES AND SYSTEMS
1. Main Items - Gas turbine and air compressor - Recuperative furnace - Bypass stack and main stack - Diverter damper - Steam turbine - Condenser - Gas turbine generator, steam turbine generator and excitation system - Feed water pump system - Deaeration system - Water treatment system - Waste water treatment system - Gas supply and treatment system - DO storage tanks and supplying system - Dedicated DCS control system for O Mon IV power plant, capable of transmitting information to
Center Control Room located in O Mon III power plant and connected to SCADA/EMS system - SCADA/EMS and communication system - Auxiliary transformer and all electrical auxiliary system ( including power source for cooling water
pumping system) 2. Auxiliary Items - Water injection system for lowering NOx concentrations when running on DO - Fuel ignition system - Lubricating and control oil system for gas-turbine and steam-turbine - Hydrogen and nitrogen supplying system - Ammonia/hydrazine dosing system - Phosphate dosing system - Auxiliary cooling water system - Sampling system - Air-compressor plant - Gas-turbine cooling system - Crain, hoist and lifting system inside turbine house and HRSG house - Main connecting and branched to 02 auxiliary transformers for 02 gas-turbine generators -IPB
system - Main connecting IPB system for 01 steam-turbine generator - CCTV system for all area of O Mon IV power plant and including CCTV system for cooling water
pump station (shared with O Mon III) - Emergency diesel generator 3. Equipment Installed at 500kV Switchyard - 02 Circuit Breakers 500kV, 05 Disconnect Switches , 06 CT, 03 PT, 03 LA for connecting GT1 to
500kV voltage busbar - 02 Circuit Breakers 500kV, 05 Disconnect Switches , 06 CT, 03 PT, 03 LA for connecting GT2 to
500kV voltage busbar - 02 Circuit Breakers 500kV, 05 Disconnect Switches , 06 CT, 03 PT, 03 LA for connecting ST3 to
500kV voltage busbar - Relay protection system for protecting feeder connection from 3 Step-up Transformer of 02 Gas
Turbine Generator and 01 Steam Turbine Generator down to the power plant - Supply CTs for 02 Busbar 500kV protection system - Providing 27/59, 25-type relays installed at 500kV substation control building and auxiliary
equipments serviced for installing - Electrical meters installed at the power plant and 500kV substation 4. Construction works (platform and foundation included) - Gas turbine house and steam turbine house - Houses for HP, IP, LP water pumps - Foundation for HRSG, bypass stack and main stack - Center control building

198
- Emergency diesel generator foundation - Hydrogen plant - Gas distribution house - Water treatment house - Wastewater treatment house - DO storage tanks and supplying system - Foundation for sampling system house - Fire-fighting water pumping station - Gas-pipes racking and supporting system from Technical Corridor No.2 to dedicated gas station of
O Mon IV power plant - Oil-pipes racking and supporting system from Technical Corridor No.2 to oil storage tanks - Racking and supporting system for water, steam – pipes and cable supporting system - Cable trench system - Surface water drainage system - Bridge and road No.2 (intended to share investment cost among four power plant inside power
complex, each power plant 25% total investment cost) - Internal roads inside power plant - Grounding leveling - Chlorine dosing house - Maintenance and repairing workshop - Warehouse - Motorcycle house - Garage - Canteen - Sewage tanks - Siphon pits - Power plant embankments and boundary - Site office - Administration buildings - Fences and guard house - Foundation, enclosure wall, oil collecting pit of step-up transformer - Foundation, oil collecting pits of auxiliary transformers - Gantry towers at step-up transformer - Gantry towers and busbar frame at 500kV switchyard - Foundation for CBs, DSs, CT, PT, LA inside 500kV switchyard 5. Common Gas, Oil, Water, Auxiliary Steam Pipe Systems - Starting point: At the fences of O Mon III and O Mon IV, along the Technical Corridor No.2 - Ending point: At the boundary between O Mon IV and O Mon V, along the Technical Corridor No.2 6. Gas Supply Pipe System - Starting point: At the starting point of Technical Corridor No.2, located in the common racking and
supporting system of Technical Corridor No.2 - Ending point: At the dedicated gas station of O Mon IV power plant 7. DO Piping System - Starting point: At the fence of O Mon III and O Mon IV power plant, located in the common pipe
supporting system of Technical Corridor No.2 - Ending point: At the 2x10000m3 storage oil tanks of O Mon IV power plant 8. Cooling Water Pumping Station - Chlorine house - 02 main cooling water pumps - Coarse and fine racking system - Wash pumping system - Electrical and control system 9. Cooling Water Intake and Discharge System - Water pipes from mail cooling water pumps to condenser and from condenser to siphon tanks - Cooling water discharge culvert box from siphon tanks to boundary between O Mon III and O Mon
IV
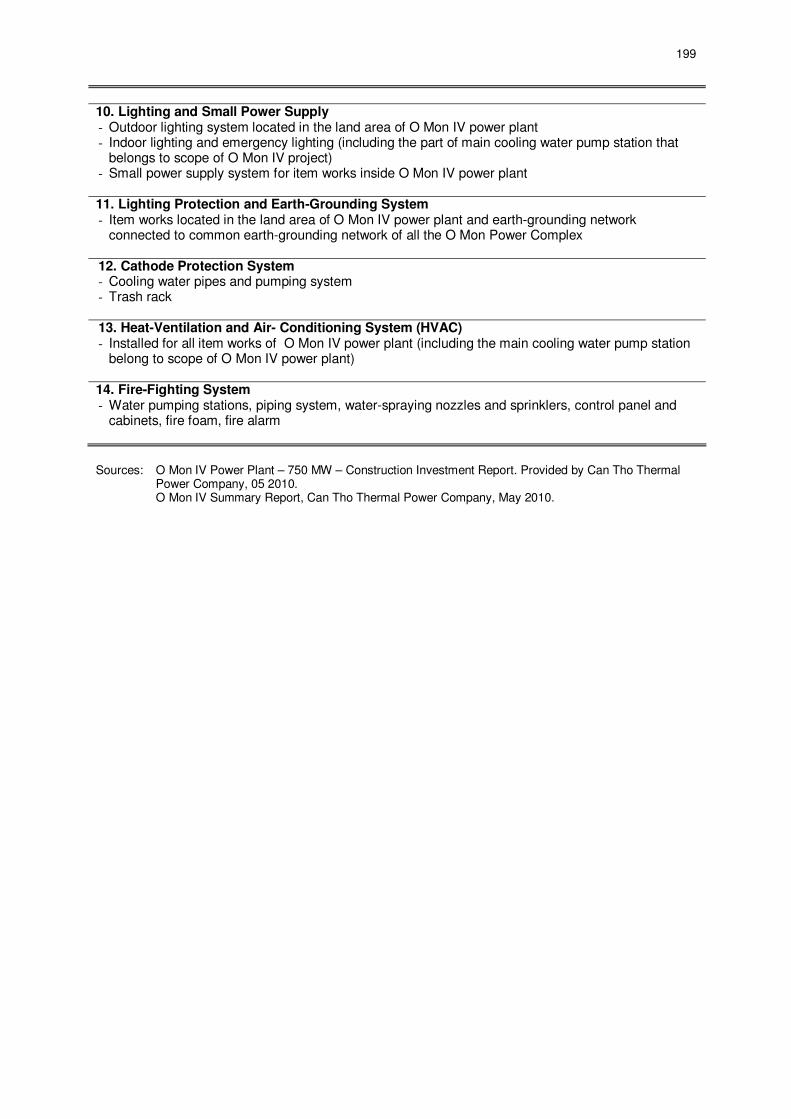
199
10. Lighting and Small Power Supply - Outdoor lighting system located in the land area of O Mon IV power plant - Indoor lighting and emergency lighting (including the part of main cooling water pump station that
belongs to scope of O Mon IV project) - Small power supply system for item works inside O Mon IV power plant 11. Lighting Protection and Earth-Grounding System - Item works located in the land area of O Mon IV power plant and earth-grounding network
connected to common earth-grounding network of all the O Mon Power Complex 12. Cathode Protection System - Cooling water pipes and pumping system - Trash rack 13. Heat-Ventilation and Air- Conditioning System (HVAC) - Installed for all item works of O Mon IV power plant (including the main cooling water pump station
belong to scope of O Mon IV power plant) 14. Fire-Fighting System - Water pumping stations, piping system, water-spraying nozzles and sprinklers, control panel and
cabinets, fire foam, fire alarm
Sources: O Mon IV Power Plant – 750 MW – Construction Investment Report. Provided by Can Tho Thermal
Power Company, 05 2010. O Mon IV Summary Report, Can Tho Thermal Power Company, May 2010.

200
This page has been deliberately left blank to allow for double sided printing.

201
APPENDIX 4: ANALYTICAL CERTIFICATE - PHYTOPLANKTON

202

203
APPENDIX 5: ANALYTICAL CERTIFICATE - ZOOPLANKTON


205
APPENDIX 6: ANALYTICAL CERTIFICATE - BENTHIC MACROFAUNA

206
This page has been deliberately left blank to allow for double sided printing.

207
APPENDIX 7: HAU RIVER FISH SPECIES
1 = Species occurring in the
vicinity of the O Mon Thermal Power Plant Complex, based on interviews and samples
2 = Fish species in the Hau River, based on Nguyen Thanh Tung, 2005
3 = Red List Species of Viet Nam. 4 = Red List Species of IUCN 5 = Species of economic value 6 = Migratory species
Order/Family/ Sub-family/ Common Name
Scientific Name 1 2 3 4 5 6
Order: OSTEOGLOSSIFORMES
Family: Notopteridae
Clown featherback Chitala ornata (Gray, 1831) X X X X
Bronze featherback Notopterus notopterus (Pallas, 1780) X X X
Order: ANGUILLIFORMES Family: Ophichthidae
Ophichthus rutidoderma (Bleeker, 1853) X
Rice-paddy eel Pisodonophis boro (Hamilton, 1822) X
Order: CLUPEIFORMES Family: Clupeidae Sub-family Pellonulinae
Corica laciniata (Fowler, 1935) X
Ganges river sprat Corica sorbona (Hamilton, 1822) X X
Borneo river sprat Clupeoides borneensis (Bleeker, 1851) X
Sumatran river sprat Clupeichthys goniognathus (Bleeker, 1855)
X
Family: Engraulidae
Gray's grenadier anchovy
Coilia grayii (Richardson, 1845) X
Lindman's grenadier anchovy
Coilia lindmani (Bleeker, 1858) X
Osbeck's grenadier anchovy
Coilia mystus (Linnaeus, 1758)
Tenualosa thibaudeaui (Durand, 1940) X
Order: CYPRINIFORMES Family: Cyprinidae Sub-family: Danioninae
Mekong flying barb Esomus longimanus (Lunel, 1881) X
Striped flying barb Esomus metallicus (Ahl, 1923) X
Luciooma bleekeri (Steindachner, 1878) X
Blackline rasbora Rasbora borapetensis (Smith, 1934) X
Rasbora daniconius (Hamilton, 1822) X
Yellow rasbora Rasbora lateristriata (Bleeker, 1854) X X
Myer’s silver rasbora Rasbora myersi (Brittan, 1954) X X
Sidestripe rasbora Rasbora paviana (Tirant, 1885) X
Dwarf scissortail rasbora
Rasbora spilocerca (Rainboth & Kottelat, 1987)
X
Sub-family: Cultrinae
Indian glass barb Chela laubuca (Hamilton, 1822) X
Paralaubuca barroni (Fowler, 1934) X
Paralaubuca riveroi (Fowler, 1935) X
Paralaubuca typus (Bleeker, 1863) X

208
Order/Family/ Sub-family/ Common Name
Scientific Name 1 2 3 4 5 6
Sub-family: Barbinae
Hampala dispar (Smith, 1934) X
Hampala barb Hampala macrolepidota (Van Hasselt, 1823)
X X
Giant bart Catlocarpio siamensis (Boulenger, 1890) X X
Cyclocheilichthys armatus (Valenciennes, 1842)
X
Beardless barb Cyclocheilichthys apogon (Valenciennes, 1842)
X X
Cyclocheilichthys enoplos (Bleeker, 1850) X
Cyclocheilichthys repasson (Bleeker, 1853)
X
Isok barb Probarbus jullieni (Sauvager, 1880) X X X
Spotted barb Puntius binotatus (Valenciennes, 1842) X
Puntius brevis (Bleeker, 1860) X X X
Javaen barb Puntius orphoides (Valenciennes, 1842) X X
Red tailed tinfoil Barbonymus altus (Gunther, 1868) X X X
Java barb Barbonymus gonionotus (Bleeker, 1850) X X X
Golfoil barb Barbonymus schwanenfeldii (Bleeker, 1853)
X X
Thynnichthys thynnoides (Bleeker, 1852) X
Cosmochilus harmandi (Sauvage, 1878) X
Amblyrhynchichthys truncatus (Bleeker, 1850)
X
Sub-family: Labeoinae
Labiobarbus leptocheila (Valenciennes, 1842)
X
Labiobarbus lineatus (Sauvage, 1878) X X X
Labiobarbus siamensis (Sauvage, 1881) X X X
Epalzeorhynchos munense (Smith, 1934) X
Crossocheilus reticulatus (Fowler, 1934) X
Crossocheilus siamensis (Smith, 1931) X
Black shark minnow Labeo chrysophekadion (Bleeker, 1850) X X X X
Labeo erythropterus (Valenciennes, 1842) X
Siamese mud carp Hemicorhynchus siamensis (Sauvage, 1888)
X X X X
Small scale mud carp Cirrhinus microlepis (Sauvage, 1878) X X
Cirrhinus lobatus (Smith, 1945) X
Osteochilus lini (Fowler, 1935) X
Silver shark minnow Osteochilus hasseltii (Valenciennes, 1842) X X X
Osteochilus melanopleurus (Bleeker, 1852)
X X X
Stonelapping minnow Garra cambodgiensis (Tirant, 1883) X
Garra fasciacauda (Fowler, 1937) X Sub-family: Cyprininae
Puntioplites proctozysron (Bleeker, 1865) X X X Family: Cobitidae Sub-family: Botiinae
Tiger botia Botia helodes (Sauvage, 1876) X X
Orangefin loach Botia modesta (Bleeker, 1865) X X Sub-family: Cobitinae
Acantopsis sp. (Rainboth, 1996) X
Lepidocephalichthys hasselti (Valenciennes, 1846)
X
Java loach Pangio oblonga (Valenciennes, 1846)
Acanthopsoides gracilentus (Smith, 1945) X

209
Order/Family/ Sub-family/ Common Name
Scientific Name 1 2 3 4 5 6
Homaloptera zollingeri (Bleeker, 1853) X
Family: Gyrinocheitidae
Siamese algae-eater Gyrinocheilus aymonieri (Tirant, 1883) X
Gyrinocheilus pennocki (Fowler, 1937) X
Order: SILURIFORMES Family: Bagridae
Black lancer catfish Bagrichthys macracanthus (Bleeker, 1854) X
Asian bumblebee catfish
Pseudomystus siamensis (Regan, 1913) X
Mystus albolineatus (Roberts, 1994) X
Mytus bocourti (Bleeker, 1864) X
Mystus mysticetus (Roberts, 1992) X
Mystus rhegma (Fowler, 1935) X X X
Striped dwarf catfish Mystus vittatus (Bloch, 1794) X
Gangetic mystus Mystus cavasius (Hamilton, 1822) X X
Hemibagrus filamentus (Fang & Chaux, 1949)
X
Asian redtail catfish Hemibagrus nemurus (Valenciennes, 1840)
X X X
Family: Siluridae
Belodontichthys dinema (Bleeker, 1851) X X
Hemisilurus mekongensis (Bornbusch & Lundberg, 1989)
X
Wallago Wallago attu (Bloch & Schneider, 1801) X
Butter catfish Ompok bimaculatus (Bloch, 1794) X X
Ompok hypophthalmus (Bleeker, 1846) X
Kryptopterus cheveyi (Durand, 1940) X
Kryptopterus cryptopterus (Bleeker, 1851) X
Micronema bleekeri (Gunther, 1864) X X Family: Schilbeidae
Laides hexanema (Bleeker, 1852) X Family: Pangasiidae
Pangasius bocourti (Sauvage, 1880) X X X X
Pangasius conchophilus (Roberts & Vidthayaon, 1991)
X X X
Sutchi catfish Pangasius hypophthalmus (Bleeker, 1878) X X X X
Pangasius krempfi (Fang and Chaux, 1949) X X X
Spot pangasius Pangasius larnaudii (Bocourt, 1866) X X X X
Pangasius macronema (Bleeker, 1851) X X X
Pangasius pleurotaenia (Sauvage, 1878) X
Helicophagus waandersii (Bleeker, 1858) X Family: Clariidae
Clarias macrocephalus (Gunther, 1864) X X
Walking catfish Clarias batrachus (Linnaeus, 1785) X X X Family: Ariidae
Arius truncatus (Valenciennes, 1840) X
Hemipimelodus borneensis (Bleeker, 1851)
X
Family: Plotosidae
Gray eel-catfish Plotosus canius (Hamilton, 1822) X X X
Order: BELONIFORMES Family: Belonidae
Freshwater garfish Xenentodon cancila (Hamilton, 1822) X Family: Hemiramphidae
Zenarchopterus clarus (Mohs, 1926) X
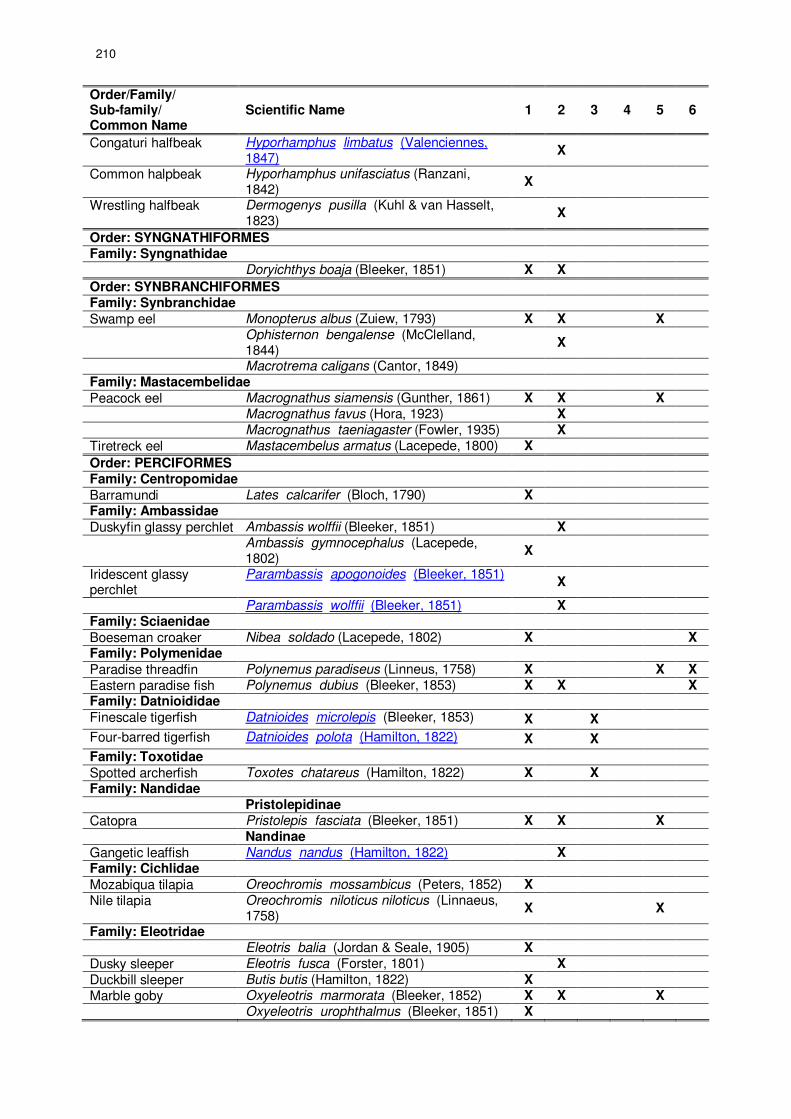
210
Order/Family/ Sub-family/ Common Name
Scientific Name 1 2 3 4 5 6
Congaturi halfbeak Hyporhamphus limbatus (Valenciennes, 1847)
X
Common halpbeak Hyporhamphus unifasciatus (Ranzani, 1842)
X
Wrestling halfbeak Dermogenys pusilla (Kuhl & van Hasselt, 1823)
X
Order: SYNGNATHIFORMES Family: Syngnathidae Doryichthys boaja (Bleeker, 1851) X X
Order: SYNBRANCHIFORMES Family: Synbranchidae
Swamp eel Monopterus albus (Zuiew, 1793) X X X
Ophisternon bengalense (McClelland, 1844)
X
Macrotrema caligans (Cantor, 1849) Family: Mastacembelidae
Peacock eel Macrognathus siamensis (Gunther, 1861) X X X
Macrognathus favus (Hora, 1923) X
Macrognathus taeniagaster (Fowler, 1935) X
Tiretreck eel Mastacembelus armatus (Lacepede, 1800) X
Order: PERCIFORMES Family: Centropomidae
Barramundi Lates calcarifer (Bloch, 1790) X Family: Ambassidae
Duskyfin glassy perchlet Ambassis wolffii (Bleeker, 1851) X
Ambassis gymnocephalus (Lacepede, 1802)
X
Iridescent glassy perchlet
Parambassis apogonoides (Bleeker, 1851) X
Parambassis wolffii (Bleeker, 1851) X Family: Sciaenidae
Boeseman croaker Nibea soldado (Lacepede, 1802) X X Family: Polymenidae
Paradise threadfin Polynemus paradiseus (Linneus, 1758) X X X
Eastern paradise fish Polynemus dubius (Bleeker, 1853) X X X Family: Datnioididae
Finescale tigerfish Datnioides microlepis (Bleeker, 1853) X X
Four-barred tigerfish Datnioides polota (Hamilton, 1822) X X
Family: Toxotidae
Spotted archerfish Toxotes chatareus (Hamilton, 1822) X X Family: Nandidae
Pristolepidinae
Catopra Pristolepis fasciata (Bleeker, 1851) X X X
Nandinae
Gangetic leaffish Nandus nandus (Hamilton, 1822) X Family: Cichlidae
Mozabiqua tilapia Oreochromis mossambicus (Peters, 1852) X
Nile tilapia Oreochromis niloticus niloticus (Linnaeus, 1758)
X X
Family: Eleotridae
Eleotris balia (Jordan & Seale, 1905) X
Dusky sleeper Eleotris fusca (Forster, 1801) X
Duckbill sleeper Butis butis (Hamilton, 1822) X
Marble goby Oxyeleotris marmorata (Bleeker, 1852) X X X
Oxyeleotris urophthalmus (Bleeker, 1851) X

211
Order/Family/ Sub-family/ Common Name
Scientific Name 1 2 3 4 5 6
Family: Gobiidae Sub-family: Gobiinae
Acentrogobius chlorostigmatoides (Bleeker, 1849)
X
Glossogobius giuris (Hamilton, 1822) X
Glossogobius sparsipapillus (Akihito & Meguro, 1976)
X X X
Sub-family: Gobionellinae
Stigmatogobius sadanundio (Hamilton, 1822)
X
Gobiopterus chuno (Hamilton, 1822) X
Gobiopterus brachypterus (Bleeker, 1855) X
Yellowstripe goby Mugilogobius chulae (Smith, 1932) X
Kabili bumblebee goby Brachygobius kabiliensis (Inger, 1958) X
Eugnathogobius oligactis (Bleeker, 1875) X X X X Sub-family : Oxudercinae
Periophthalmodon schlosseri (Pallas, 1770)
X X
Sub-family: Amblyopinae
Taenioides gracilis (Valenciennes, 1837) X
Family: Anabantidae
Climbing perch Anabas testudineus (Bloch, 1792) X X X Family: Osphronemidae
Pygmy gourami Trichopsis pumila (Arnold, 1936) X
Croaking gourami Trichopsis vittata (Cuvier, 1831) X
Moonlight gourami Trichogaster microlepis (Gunther, 1861) X X X
Snakedkin gourami Trichogaster pectoralis (Regan, 1910) X X
Three spot gourami Trichogaster trichopterus (Pallas, 1770) X X Family: Channidae
Snakehead murrel Channa striata (Bloch, 1797) X X X
Giant snakehead Channa micropeltes (Cuvier, 1831) X X X
Order: PLEURONECTIFORMES
Family: Soleidae
Achiroides melanorhynchus (Bleeker, 1851)
X
Brachirus harmandi (Sauvage, 1878) X X X
Brachirus panoides (Bleeker, 1851) X
Velvety sole Synaptura villosa ( Weber, 1907) Family: Cynoglossidae Sub-family: Cynoglossinae
Bengal tongue sole Cynoglossus cynoglossus (Hamilton, 1822)
X
Cynoglossus lingua (Hamilton, 1822) X X
Cynoglossus macrolepidotus (Bleeker, 1851)
X
Order: TETRAODONTIFORMES Family: Tetraodontidae
Greenbottle pufferfish Auriglobus nefastus (Roberts, 1982) X Total 76 116 9 1 38 21

212
This page has been deliberately left blank to allow for double sided printing.

213
APPENDIX 8: ANALYTICAL CERTIFICATE – SOIL QUALITY

214

215

216

217

218

219

220

221

222

223
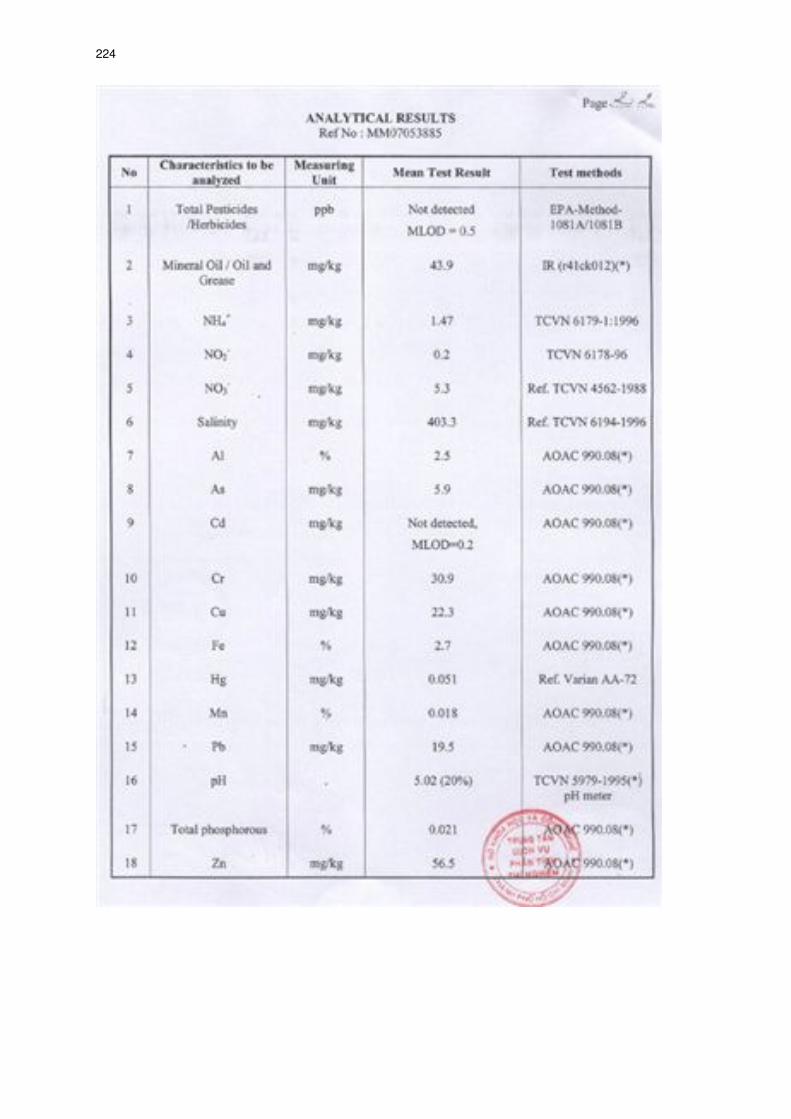
224

225
APPENDIX 9: ANALYTICAL CERTIFICATE – GROUNDWATER QUALITY

226

227

228

229

230

231

232

233
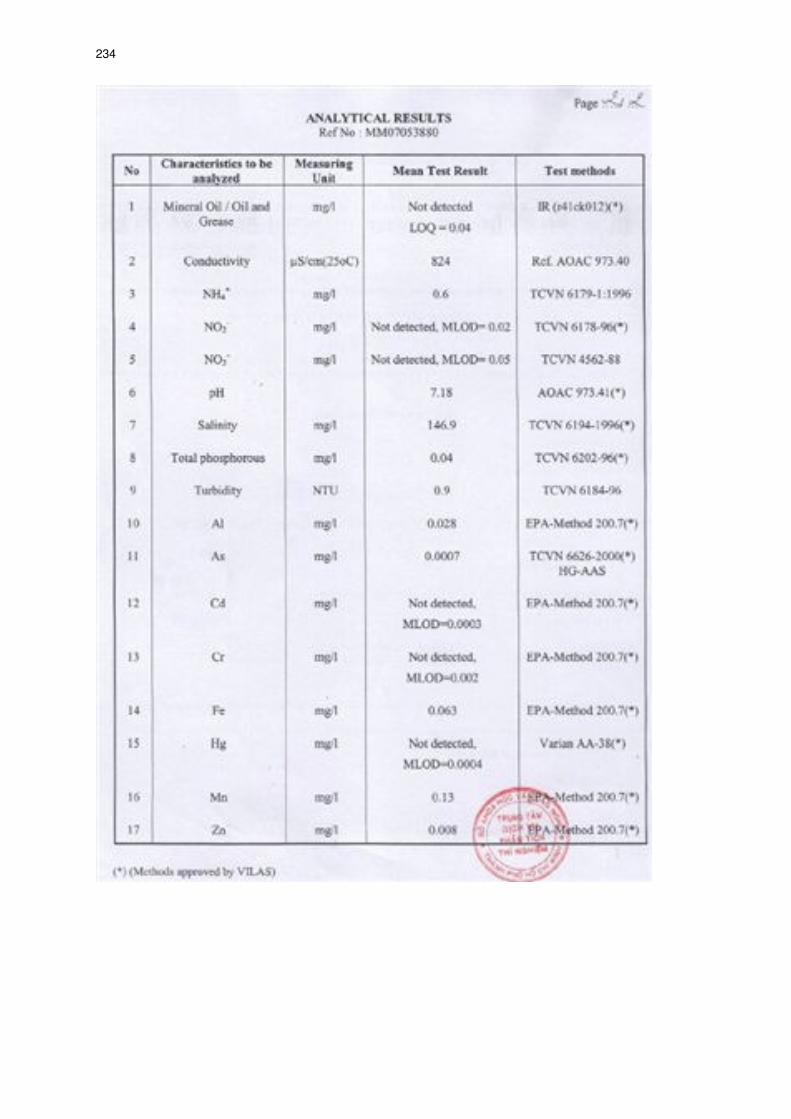
234

235
APPENDIX 10: ANALYTICAL CERTIFICATE – SURFACE WATER QUALITY

236

237
238

239
APPENDIX 11: ANALYTICAL CERTIFICATE – SEDIMENT QUALITY

240
This page has been deliberately left blank to allow for double sided printing.

241
APPENDIX 12: SUPPLEMENTARY AIR QUALITY MODELING RESULTS
This appendix contains modeling results for the following: Case 1 ( O Mon I running on DFO, Figure 1 to Figure 9), Case 2 (O Mon I running on natural gas, Figure 10 to Figure 18), and a supplemental case identical to Case 4 except that O Mon II to V are assumed to emit using 60 m stacks instead of 40 m (Figure 19 to Figure 29). A key finding in the supplemental case is that raising stack heights will not reduce the maximum one-hour receptor concentrations. This also applies to NO2, for which the maximum (198 µg/m³) is close to the guideline (200 µg/m³) without including the background. When a background value is added, the exceedance of this guideline will not be addressed by increasing the stack height. At longer averaging periods, the 60 m stacks consistently reduce the maximum concentrations. But because there has not been any risk of exceeding any guideline for any pollutant at these averaging periods, this reduction is of minor importance. A closer inspection shows that the higher stacks can actually slightly increase the maximum one-hour concentration, a finding most pronounced in the case of CO. This counterintuitive result arises because building downwash can change the contribution of each source to a receptor. As concentrations decrease with increasing stack height, the geographic distribution of impact is also reconfigured. This reconfiguration can cause the total impact of individual stacks to increase at some receptors. In conclusion, there appears to be no benefit to raising the stack heights from 40 m to 60 m. Table 1: Summary of air quality dispersion modeling results for the supplemental case
Gas Averaging
period
40-m stacks (Case 4)
max. conc. (µg/m³)
60-m stacks max. conc.
(µg/m³)
QCVN guideline (µg/m³)
NO2 1 hour 198 198 200 NO2 24 hours 38 35 100 NO2 Annual 4.3 3.1 40
SO2 1 hour 10.9 3.8 350
SO2 24 hours 1.0 0.4 125
SO2 Annual 0.08 0.16 50
CO 1 hour 773 794 30,000 CO 8 hours 229 227 10,000 CO 24 hours 76 76 5,000 PM 24 hours 9.2 9.1 150 PM Annual 0.7 0.4 50

242
Figure 1: Contour map of maximum predicted 24-hour NO2 concentrations (µg/m³) for Case 1 emissions (O Mon I running on DFO)
Figure 2: Contour map of annual average predicted NO2 concentrations (µg/m³) for Case 1 emissions (O Mon I running on DFO)

243
Figure 3: Contour map of maximum predicted 24-hour SO2 concentrations (µg/m³) for Case 1 emissions (O Mon I running on DFO)
Figure 4: Contour map of predicted annual average SO2 concentrations (µg/m³) for Case 1 emissions (O Mon I running on DFO)
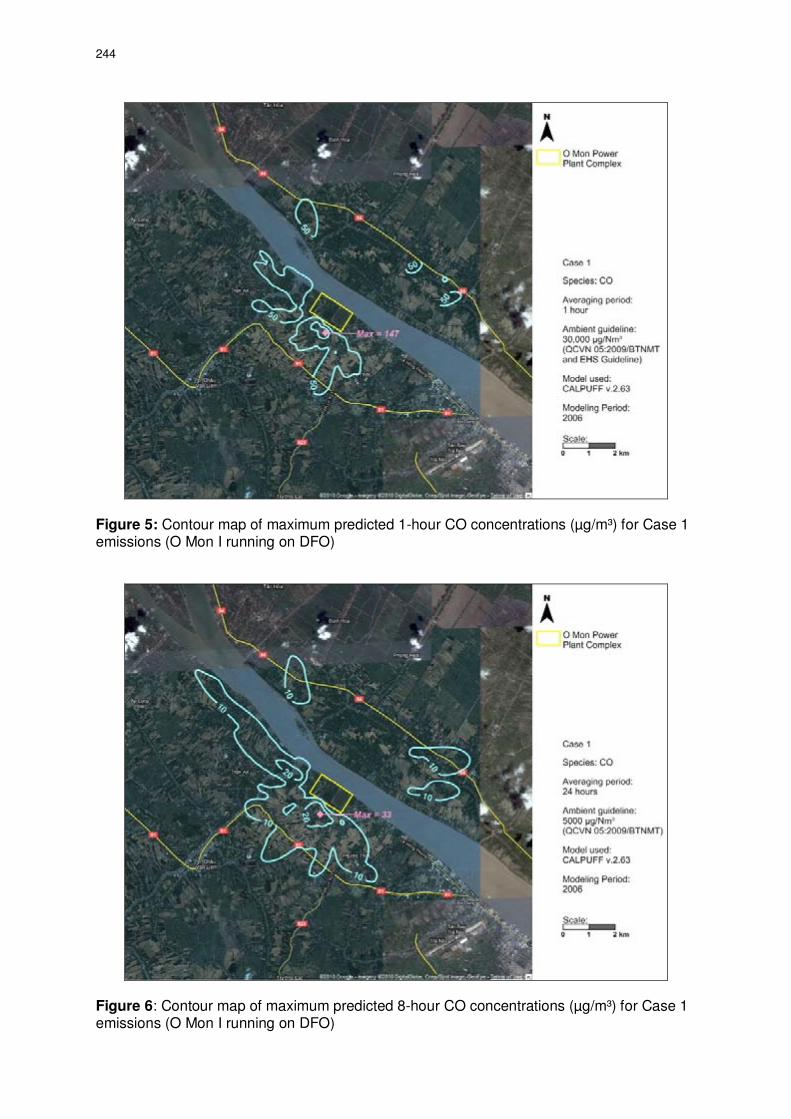
244
Figure 5: Contour map of maximum predicted 1-hour CO concentrations (µg/m³) for Case 1 emissions (O Mon I running on DFO)
Figure 6: Contour map of maximum predicted 8-hour CO concentrations (µg/m³) for Case 1 emissions (O Mon I running on DFO)

245
Figure 7: Contour map of maximum predicted 24-hour CO concentrations (µg/m³) for Case 1 emissions (O Mon I running on DFO)
Figure 8: Contour map of maximum predicted 24-hour PM10 concentrations (µg/m³) for Case 1 emissions (O Mon I running on DFO)
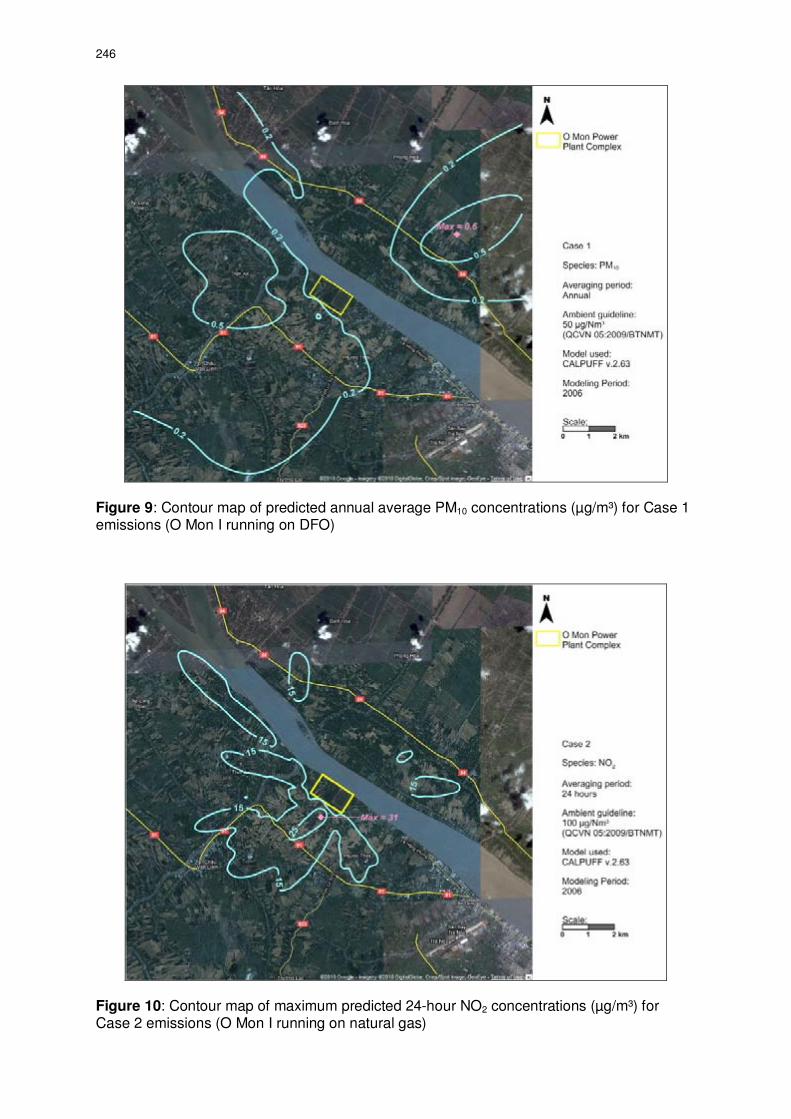
246
Figure 9: Contour map of predicted annual average PM10 concentrations (µg/m³) for Case 1 emissions (O Mon I running on DFO)
Figure 10: Contour map of maximum predicted 24-hour NO2 concentrations (µg/m³) for Case 2 emissions (O Mon I running on natural gas)

247
Figure 11: Contour map of annual average predicted NO2 concentrations (µg/m³) for Case 2 emissions (O Mon I running on natural gas)
Figure 12: Contour map of maximum predicted 24-hour SO2 concentrations (µg/m³) for Case 2 emissions (O Mon I running on natural gas)

248
Figure 13: Contour map of predicted annual average SO2 concentrations (µg/m³) for Case 2 emissions (O Mon I running on natural gas)
Figure 14: Contour map of maximum predicted 1-hour CO concentrations (µg/m³) for Case 2 emissions (O Mon I running on natural gas)
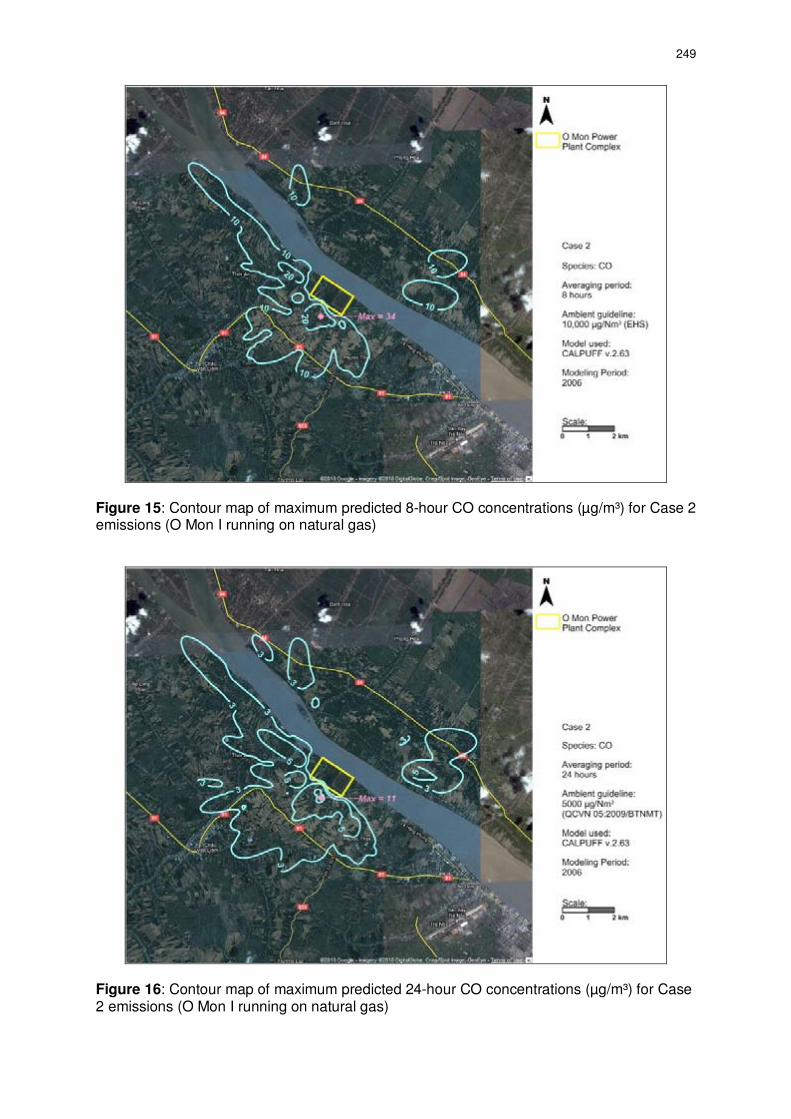
249
Figure 15: Contour map of maximum predicted 8-hour CO concentrations (µg/m³) for Case 2 emissions (O Mon I running on natural gas)
Figure 16: Contour map of maximum predicted 24-hour CO concentrations (µg/m³) for Case 2 emissions (O Mon I running on natural gas)

250
Figure 17: Contour map of maximum predicted 24-hour PM10 concentrations (µg/m³) for Case 2 emissions (O Mon I running on natural gas)
Figure 18: Contour map of predicted annual average PM10 concentrations (µg/m³) for Case 2 emissions (O Mon I running on natural gas)

251
Figure 19: Contour map of maximum predicted 1-hour NO2 concentrations (µg/m³) for the supplemental case (O Mon II to V with 60-m stacks)
Figure 20: Contour map of maximum predicted 24-hour NO2 concentrations (µg/m³) for the supplemental case (O Mon II to V with 60-m stacks)

252
Figure 21: Contour map of annual average predicted NO2 concentrations (µg/m³) for the supplemental case (O Mon II to V with 60-m stacks)
Figure 22: Contour map of maximum predicted 1-hour SO2 concentrations (µg/m³) for the supplemental case (O Mon II to V with 60-m stacks)

253
Figure 23: Contour map of maximum predicted 24-hour SO2 concentrations (µg/m³) for the supplemental case (O Mon II to V with 60-m stacks)
Figure 24: Contour map of predicted annual average SO2 concentrations (µg/m³) for the supplemental case (O Mon II to V with 60-m stacks)

254
Figure 25: Contour map of maximum predicted 1-hour CO concentrations (µg/m³) for the supplemental case (O Mon II to V with 60-m stacks)
Figure 26: Contour map of maximum predicted 8-hour CO concentrations (µg/m³) for the supplemental case (O Mon II to V with 60-m stacks)

255
Figure 27: Contour map of maximum predicted 24-hour CO concentrations (µg/m³) for the supplemental case (O Mon II to V with 60-m stacks)
Figure 28: Contour map of maximum predicted 24-hour PM10 concentrations (µg/m³) for the supplemental case (O Mon II to V with 60-m stacks)

256
Figure 29: Contour map of predicted annual average PM10 concentrations (µg/m³) for the supplemental case (O Mon II to V with 60-m stacks)

257
APPENDIX 13: PUBLIC CONSULTATION AND DISCLOSURE
A. Public Consultation Meeting Minutes and Participants List, 23 July 2005, Thoi An and Phuoc Thoi Wards

258

259

260

261

262

263

264
265
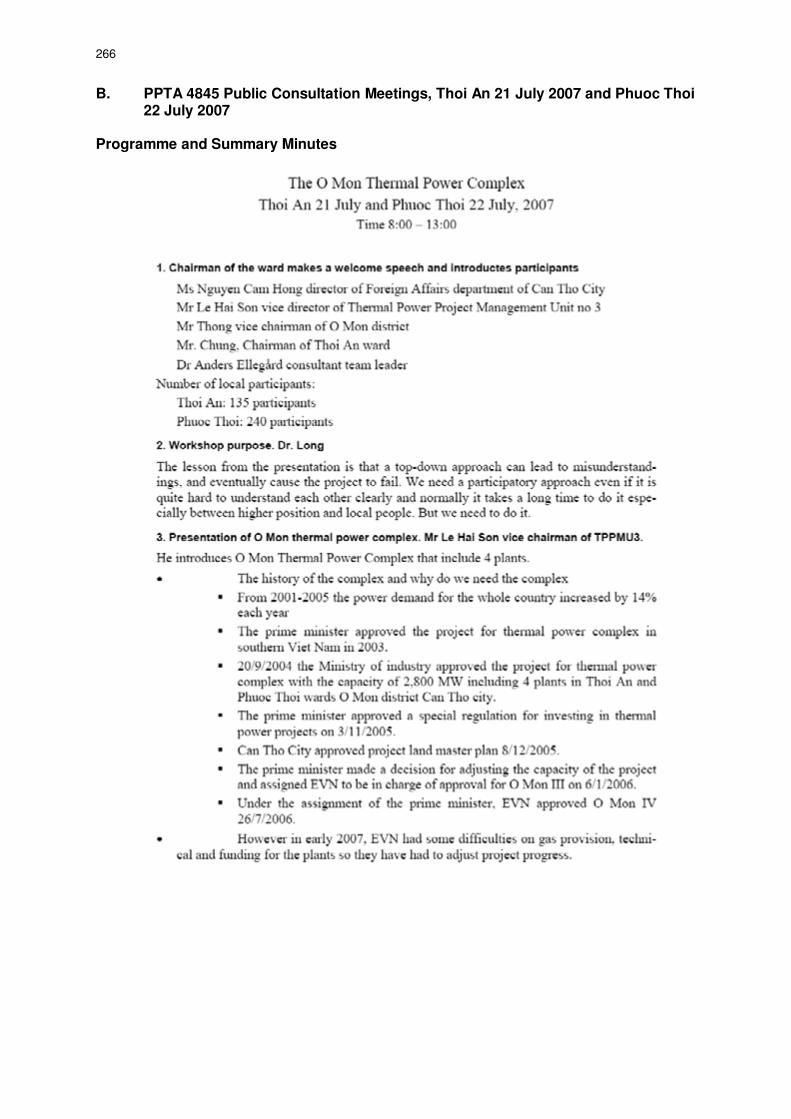
266
B. PPTA 4845 Public Consultation Meetings, Thoi An 21 July 2007 and Phuoc Thoi 22 July 2007
Programme and Summary Minutes

267

268
Results of group discussions, Thoi An 21/7/2007 Group No.1 Facilitator: Nguyen Tan Dan, Thoi An - 21/7/2007
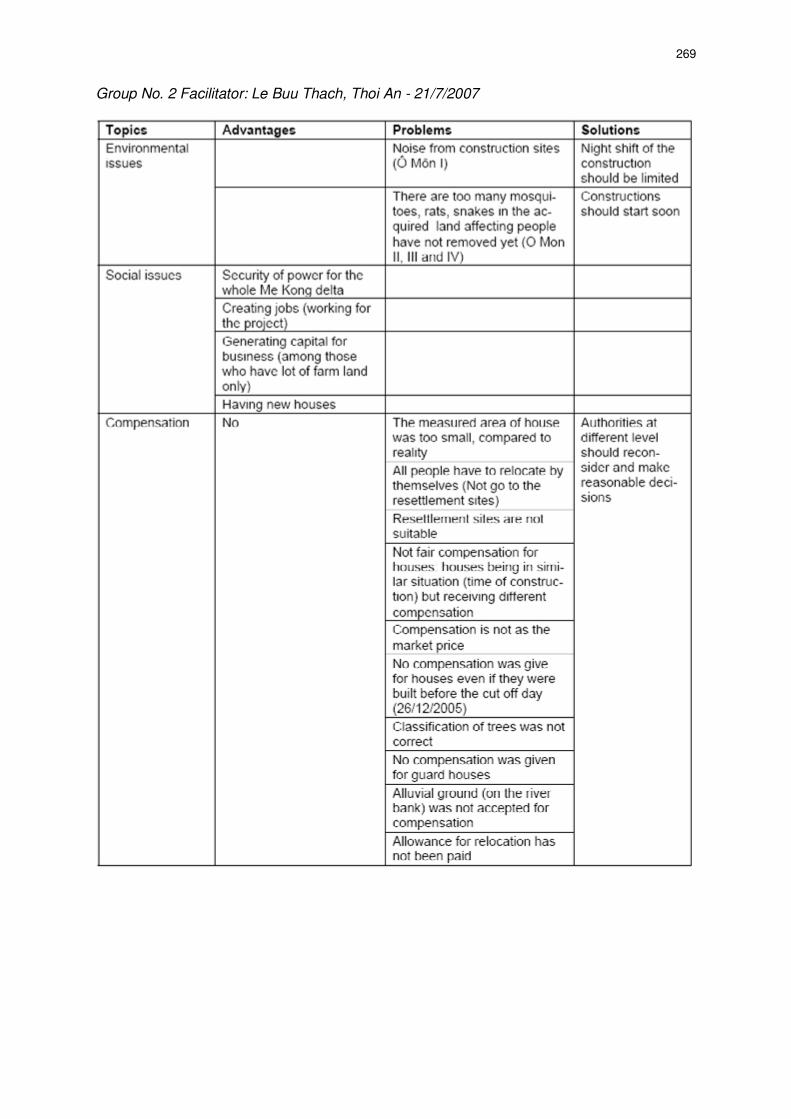
269
Group No. 2 Facilitator: Le Buu Thach, Thoi An - 21/7/2007

270
Group No.3 Facilitator: Vũ Ngọc Long, Thoi An - 21/7/2007

271
Group No. 4 Facilitator: Lai Tung Quan, Thoi An - 21/7/2007

272
Results of group discussions, Phuoc Thoi, 22/7/2007 Group No.1 Facilitator: Lai Tung Quan Phước Thới 22/7/2007

273
Group No.2 Facilitator: Nguyễn Tấn Dân. Phước Thới 22/7/2007

274
Group No.3 Facilitator: Le Buu Thach. Phước Thới 22/7/2007

275
Group No.4 Facilitator: Vu Ngoc Long. Phước Thới 22/7/2007

276
C. PPTA 4845 Stakeholder Workshop, O Mon Power Complex Consultation Meetings, Thoi An 21 July 2007 and Phuoc Thoi 22 July 2007
Agenda
Content Person in charge
Warming up, Introduction (8:00) Dr. Vu Ngoc Long Opening PC Can Tho Introduction workshop programme Dr. Le Buu Thach Progress of the O Mon Project TPPMU-3 VPC – outline of the study Dr. Anders Ellegård 1. Financial analysis, economic, and technology Dr. Tran Minh Kham 2. Air pollution Dr. Do Thanh Bai Tea break (10:00 – 10:15)
3. Aquatic Ecology MSc. Ngo Xuan Quang 4. Geography and Hydrology MSc. Ngo Xuan Quang
5. Social impact, Compensation and resettlement programme.
Dr. Vu Ngoc Long and Dr. Le Buu Thach
Lunch time (11:00 – 13:30) Group discussion ITB Staff Tea break (15:00 – 15:15) Presentation of group discussions Group leader Comment of PVC Dr. Anders Ellegård Conclusion and Closing (16:00) PC Can Tho.
Present The number of participants was 40, consisting of people from People’s Committees of Can Tho City, O Mon District, Thoi An Ward and Phuoc Thoi Ward. Department of Foreign Affairs, Natural Resource and Environment, Plan and Investment, Union of Fatherland Front, Women’s Union, Farmers Union of Can Tho, Representative of Women’s Union, Farmer’s Union, Fatherland Front and affected people of the two wards Thoi An Phuoc Thoi, nongovernment organizations Ieder Voor Allen (IVA), and representatives from TPPMU3, PECC2 and PECC3. Summary Vattenfall Power Consultant AB (VPC) held a Stakeholder workshop with the support of Department of Foreign Affair on behalf of Can Tho People Committee on 14 September 2007. Pursuant to the work program of VPC, the members of VPC presented reports of their work, upon which they received comments and suggestion that serve to enrich the documents further. These comments covered financial analysis, technical, economic, financial, environmental and social aspects of the project. Warming up 8:20 am Mr. Long was warming up the workshop with figures of some projects under ADB fund, it had become successful owing to public participation and stakeholder consultation. That is one reason for the stakeholder meeting to be held today. Opening Mrs. Cam Hong from Department of Foreign Affairs gave opening speech. She highly appreciated VPC’s role in holding this meeting in order to get comments from related stakeholders following the assessment results of Construction of O Mon Thermal Power Complex project that VPC being carried out.

277
Introduction of Vattenfall Power Consultant and PPTA Anders introduced Vattenfall Power Consultant AB which has been assigned to assess the impacts of the technical, economic, financial, environment and social aspects of the project for ADB’s consideration in providing the credit for building of the O Mon IV Power Plant. Those assessment results will be presented in this meeting. Also Anders thanked his members for the work that they had put into documents for the meeting. Introduction of Workshop program Thach introduced the meeting program, then Mr. Long invites participants to give their preliminary comments regarding the construction of O Mon IV Power Plant (while waiting for collecting and classifying Expectation sheets). Preliminary comments to project by WS participants 1/ Representative of Union of Women (Thoi An Ward). Beside the benefit provided from Thermal Power Plant, some disadvantages are as follow:
- there will be no place for poor people without property, so resettlement area is an urgent matter.
- Lost job - Compensation be paid in smaller installments that will affect their future plan.
2/ Representative of Thoi An farmer Union:
- Advantage: no environment pollution. - Lost job, hope affected people could find suitable job in project site.
3/ Union of Fatherland Front (Thoi An Ward)
- project provides advantages for the region, but wondering if it could create more job - for affected people. - When the power plant is operating, environment pollution is unavoidable. - Compensation rates should be fair and take into account transaction cost - Compensation process should be made earlier, due to inflation
4/ Representative of Fatherland Front (Thoi An Ward)
- Power Plant creates the economic strength for the region. - Hope compensation and clearing allowance should be solved fairly. - Managing board support affected people so that they can be relocate satisfactorily
and could establish a new life outside of the project area 5/ Representative of affected people in Phuoc Thoi Ward
- Power Plant provides advantages for the region. - Resettlement area should be established. - Free resettlement would not assure people life - For houses built in farmland, compensation rate should be made reasonably. - Help people to find job so that they can stabilize their life
6/ Representative of affected people in Thoi An Ward
- Local people welcome project for its advantages, but - For poor people without property, managing board should offer a special treatments
enable them to establish a better living situation outside of project site.

278
7/ Representative of EVN
- Interesting in attending the workshop, this is the opportunity to listen to people’s comments as well as authorities in developing project.
- Learning study results of Vattenfall Power Consultant AB. - Could make suggestion for Workshop.
Result of fast survey of participants’ expectation A rapid survey of the participants’ specific fields of interest was carried out, by distributing “expectation” sheets to the participants at the beginning of the workshop. Participants were asked to answer the question “Please let us know which field you pay attention most when attending this Workshop” and write it on the sheet. The sheets were then collected. 36 out of 40 participants completed the sheets. The result of the rapid survey of participant’s expectation is shown in Table 1. The result was reported back to the participants before the continued meeting, and attempts were made to accommodate the expectations to the greatest degree possible. Table 1 Participants’ specific fields of interest in the WS Field of interest No.
The content of Environment impact assessment of the project 9 Compensation and ground clearing policy 9 Resettlement allowance, job and stabilizing life 6 The content of social impact assessment of the project 4 Process of project 3 The Influence of the transmission line on households 2 VPC’s comments on technical, financial 2 Resolving of people petition 2 Proposal of VPC to EVN for resolving the impacts on environment and social 1 Compensation policy
Presentations Process of project (TPPMU3 presentation) Mr.Tai presented the legal basis and process of Thermal Power Plant O Mon IV project. There are some related decisions:
- Decision 1195/QĐ-TTg dated 09 November 2005 issued by Prime Minister stipulated for some specific mechanism policies for construction investment urgent electricity work in period 2006 – 2010.
- Decision 390/QĐ-EVN-HĐQT dated 26/7/2006 issued by Electricity of Viet Nam regarding approval project of Investment Power Plant O Mon IV
- In April, 2007, the Thermal Power Project Managing Unit No.3 submitted Technical Design.
Actually the whole project has been postponed due to undetermined gas supply. Thermal Power Project Managing Unit No.3 (TPPMU3) has submitted a request for EVN to take a decision regarding the implementation of the infrastructure component by using a local budget. Such works include, for instance: Leveling ground and building temporary barrier, operating managing area. Compensation and ground clearing started from September for Power Plant O Mon III and O Mon IV. The number of households affected are shown in Table 2 and associated costs are shown in Table 3. Table 2 Households affected by the project, compensation eligibility

279
Households Percent of total Percent of eligible
Affected households 660 100 Approved for compensation 442 67 100 Received compensation 412 62 93 Not eligible for compensation 137 21
Table 3 Cost and disbursement status of compensation program BVND Percent of total MUSD equivalent
Total compensation cost approved
248 100 15.5
Total compensation cost disbursed to date
207 83 13.9
Compensation pending disbursement
41 17
There have been complaints from households, and some have refused to receive compensation. So, compensation in O Mon III and O Mon IV is the crucial point. Presentation of Financial analysis, economic, and technology (Vattenfall Power Consultant) Mr. Kham presented the financial and economic analysis, and technology assessment. Mr. Le Quang Vinh from Project Appraisal Department (EVN Hanoi) inquired whose view does VPC based on to analysis the project. Vattenfall Power Consultant: VPC have signed contract with ADB. So, VPC study and analysis project is based on ADB’s criteria and policies. Presentation of Air Pollution and Noise (Vattenfall Power Consultant) Mr. Bai presented the results on studies of air pollution and noise. Some questions were raised from EVN as follows: Question Ms. Dao Thi Hien (EVN) Why did you take the data of Can Tho Air quality in 2004, not 2005 and 2006. Did you review the data provided in EIA report of O Mon IV? Vattenfall Power Consultant: We reviewed all available data and the data of 2004 is the best set (full) Question Ms. Dao Thi Hien (EVN) Why did you consider the aspect “Eutrophication” that is used only for water pollution? Vattenfall Power Consultant: We use it because NOx emission could create nitrogenous pollution of water, i.e. eutrophication. Vattenfall Power Consultant: The compensation lists are all based on property documents, which are not exactly the same as households. One household can have more than one property document. Statement Ms. Nguyen Thi Hien (EVN) It is not necessary to address scenario No 5 with 5 power plants (of the O Mon thermal power complex) operating. In fact EVN and Viet Nam Government have only approved the plan with four power plants. So it is suggested that all the calculation for air and water pollution should be based on only four operating power plants (I, II, III, IV and not V). The

280
consequences caused by using scenario No-5 is increased pollution level that will never happen in fact, and it may then create the following problems:
a. Increased, unnecessary, investment for pollution abatement and b. Complaints from the local people when hearing this information.
Question Mr. Le Quang Vinh (EVN) Why didn’t you present all possible alternatives for air pollution abatement (except the increasing Stack height from 60 – 100m) Vattenfall Power Consultant: These alternatives will be presented in the final report. Question Mr. Le Quang Vinh (EVN) Is it necessary to increase the stack height while the pollution from all 4 blocks still below the standard (Viet Nam and World Bank)? Vattenfall Power Consultant: We will consider this matter in cooperation with the technical experts. Presentation of Aquatic and Hydrology component (Vattenfall Power Consultant) Mr. Tai requested VPC to consider other measures besides building cooling tower in order to mitigate the thermal effect of cooling water discharged into the river, for example, VPC could calculate the structure at the outlet. Presentation of Social impact, compensation and resettlement program (Vattenfall Power Consultant) VPC presented the social impact, compensation and resettlement program. Then, participants were invited to have lunch at 11:30 am. Group discussion Participants had been divided into 3 groups for discussion in specific themes:
1. Social impact and resettlement group. This group was lead by Mr. Long. 28 persons participated in this group, including representatives for local government (Mr. Thong Deputy Chairman of PC of O Mon District and Chief of Compensation Council), organizations and unions (Fatherland Front, Women, Farmer’s Union) and affected people by project, TPPMU3 (Mr.Tai, Director and Mr. Son – Deputy Director).
2. Environmental-technical group. This group was lead by Dr. Kham, Dr. Bai and Mr. Quang. Ten participants came into this group including all 3 person from EVN.
3. Compensation group, lead by Mr. Hai of TPPMU3, with two more participants.
Number of participants in each group depended on which field they paid attention. Most selected to join the discussion on social impact and resettlement. Discussion minutes of social impact and resettlement group Mr. Thong (vice chairman of PC of O Mon/ head of compensation committee):
- The project has occupied a large area so its influence on the interest of local community is certainly large. Regarding the rumor of unfair compensation, PC of O Mon had admitted that mistake to the public. Unfair compensation actually had been paid in some cases but it was not much, it is acceptable basing on the rate of only 12 household in 640 households resolved, wrong paid compensation was 550 MVND in the whole of 245 billion VND.10
- The compensation committee always strictly abides by the government policy, however, it has submitted to PC of Can Tho the proposal of supporting poor
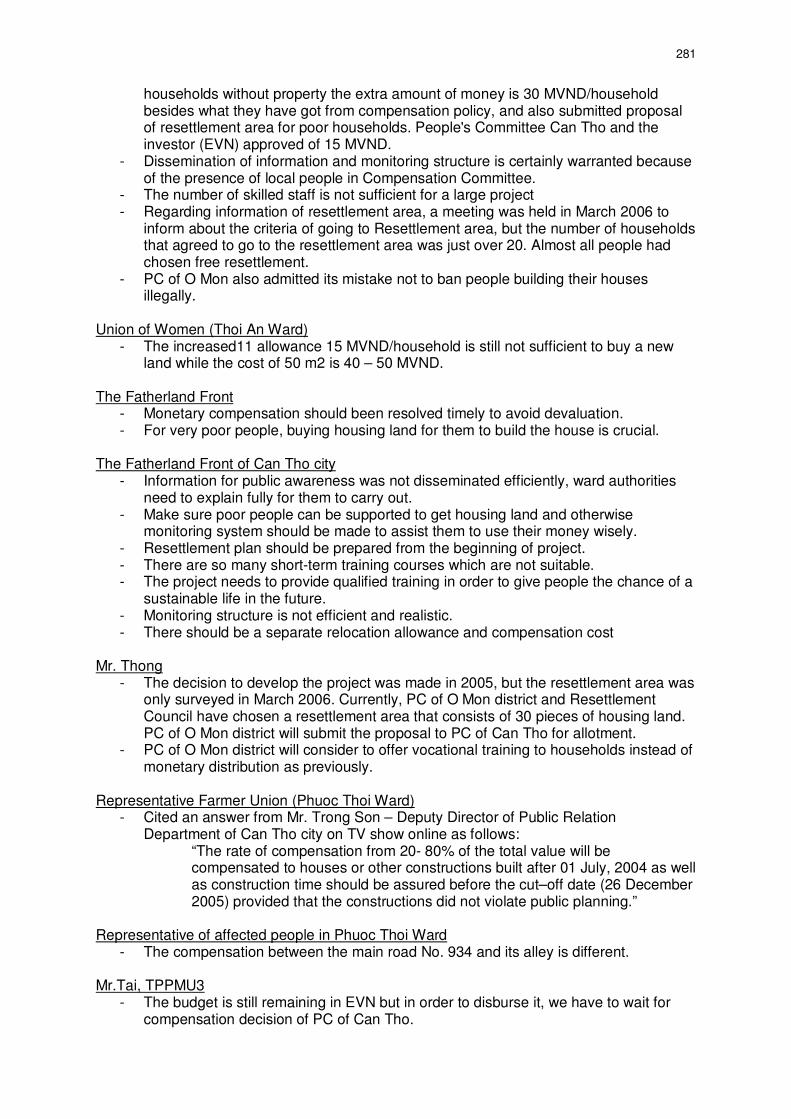
281
households without property the extra amount of money is 30 MVND/household besides what they have got from compensation policy, and also submitted proposal of resettlement area for poor households. People's Committee Can Tho and the investor (EVN) approved of 15 MVND.
- Dissemination of information and monitoring structure is certainly warranted because of the presence of local people in Compensation Committee.
- The number of skilled staff is not sufficient for a large project - Regarding information of resettlement area, a meeting was held in March 2006 to
inform about the criteria of going to Resettlement area, but the number of households that agreed to go to the resettlement area was just over 20. Almost all people had chosen free resettlement.
- PC of O Mon also admitted its mistake not to ban people building their houses illegally.
Union of Women (Thoi An Ward)
- The increased11 allowance 15 MVND/household is still not sufficient to buy a new land while the cost of 50 m2 is 40 – 50 MVND.
The Fatherland Front
- Monetary compensation should been resolved timely to avoid devaluation. - For very poor people, buying housing land for them to build the house is crucial.
The Fatherland Front of Can Tho city
- Information for public awareness was not disseminated efficiently, ward authorities need to explain fully for them to carry out.
- Make sure poor people can be supported to get housing land and otherwise monitoring system should be made to assist them to use their money wisely.
- Resettlement plan should be prepared from the beginning of project. - There are so many short-term training courses which are not suitable. - The project needs to provide qualified training in order to give people the chance of a
sustainable life in the future. - Monitoring structure is not efficient and realistic. - There should be a separate relocation allowance and compensation cost
Mr. Thong
- The decision to develop the project was made in 2005, but the resettlement area was only surveyed in March 2006. Currently, PC of O Mon district and Resettlement Council have chosen a resettlement area that consists of 30 pieces of housing land. PC of O Mon district will submit the proposal to PC of Can Tho for allotment.
- PC of O Mon district will consider to offer vocational training to households instead of monetary distribution as previously.
Representative Farmer Union (Phuoc Thoi Ward)
- Cited an answer from Mr. Trong Son – Deputy Director of Public Relation Department of Can Tho city on TV show online as follows:
“The rate of compensation from 20- 80% of the total value will be compensated to houses or other constructions built after 01 July, 2004 as well as construction time should be assured before the cut–off date (26 December 2005) provided that the constructions did not violate public planning.”
Representative of affected people in Phuoc Thoi Ward
- The compensation between the main road No. 934 and its alley is different. Mr.Tai, TPPMU3
- The budget is still remaining in EVN but in order to disburse it, we have to wait for compensation decision of PC of Can Tho.

282
Discussion minutes of technical and environmental group PART 1: Technical, economic and financial assessment Afternoon 14 September 2007 Mr. Nam Tien from EVN
- Among slides of part 1 you spend a lot of time for macro energy policies, do you think it is too far from O Mon IV project?
Vattenfall Power Consultant:
- EVN will takes this loan but EVN’s financial situation depends heavily on macro energy policies such as retail tariff system, power market and equitization policies. On the other side, VPC would like to clearly define the working environment of O Mon IV when it goes into operation. Any way we will review it by draft final report.
Mr. Le Quang Vinh from EVN
- Please base on ADB’s point of view to make clear the effect on NPV, FIRR, when the price of natural gas increases!
Vattenfall Power Consultant:
- We will make it in the next step. Mr. Le Quang Vinh from EVN:
- We think black start capability is very necessary for the western Mekong delta region. If the other power plants in the region do not have this capability it is necessary to have this capability in O Mon IV.
Vattenfall Power Consultant
- We think so, we will check it. Mr. Le Quang Vinh from EVN
- On the cooling system, please make clear all measures to keep temperature of water in Hau river in standard without using cooling tower. We agree that cooling tower is the last solution.
Vattenfall Power Consultant
- Agree, we will make it clear by draft final report. Mr. Le Quang Vinh from EVN:
- On the side of EVN we think by-pass facility is necessary to increase flexible capability of operation of power plant. Around 2012 Viet Nam will still have a shortage of energy so we will operate it about 6 months before completion.
Vattenfall Power Consultant
- We will consider it. PART 2: Environmental impact assessment Statement: 1. It is very important that in the final report all the concrete calculations for each scenario should be presented. Vattenfall Power Consultant:
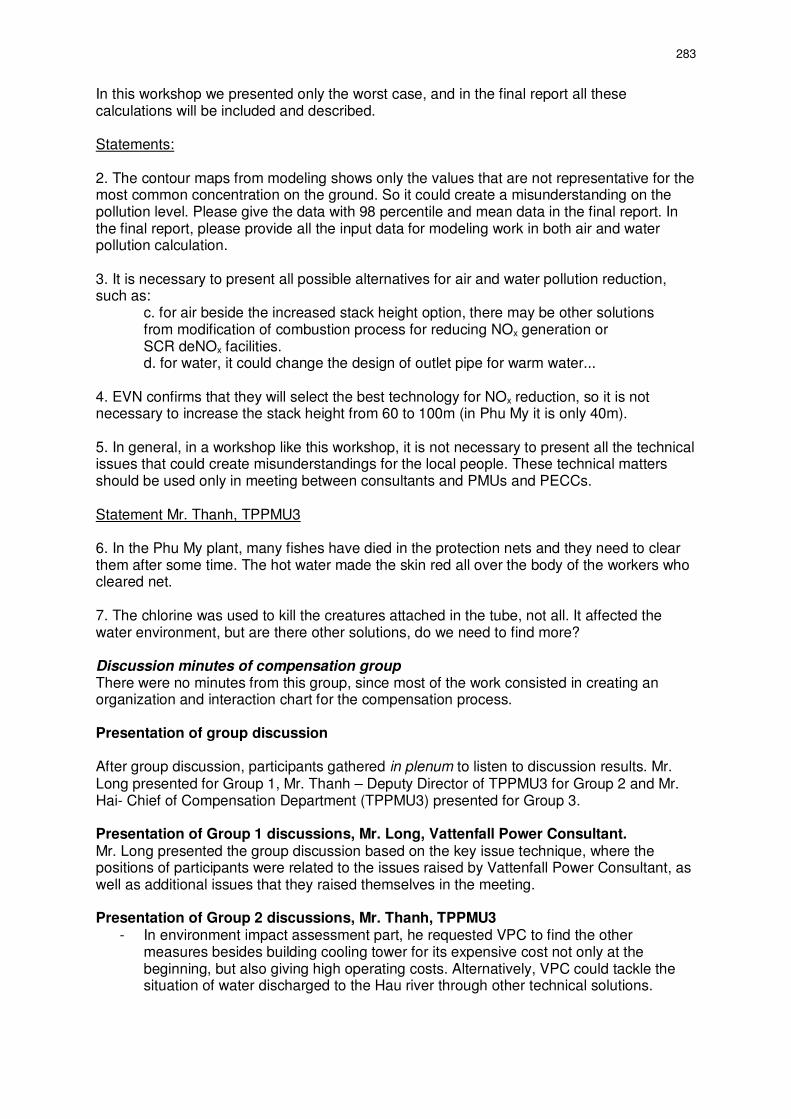
283
In this workshop we presented only the worst case, and in the final report all these calculations will be included and described. Statements: 2. The contour maps from modeling shows only the values that are not representative for the most common concentration on the ground. So it could create a misunderstanding on the pollution level. Please give the data with 98 percentile and mean data in the final report. In the final report, please provide all the input data for modeling work in both air and water pollution calculation. 3. It is necessary to present all possible alternatives for air and water pollution reduction, such as:
c. for air beside the increased stack height option, there may be other solutions from modification of combustion process for reducing NOx generation or SCR deNOx facilities. d. for water, it could change the design of outlet pipe for warm water...
4. EVN confirms that they will select the best technology for NOx reduction, so it is not necessary to increase the stack height from 60 to 100m (in Phu My it is only 40m). 5. In general, in a workshop like this workshop, it is not necessary to present all the technical issues that could create misunderstandings for the local people. These technical matters should be used only in meeting between consultants and PMUs and PECCs. Statement Mr. Thanh, TPPMU3 6. In the Phu My plant, many fishes have died in the protection nets and they need to clear them after some time. The hot water made the skin red all over the body of the workers who cleared net. 7. The chlorine was used to kill the creatures attached in the tube, not all. It affected the water environment, but are there other solutions, do we need to find more? Discussion minutes of compensation group There were no minutes from this group, since most of the work consisted in creating an organization and interaction chart for the compensation process. Presentation of group discussion After group discussion, participants gathered in plenum to listen to discussion results. Mr. Long presented for Group 1, Mr. Thanh – Deputy Director of TPPMU3 for Group 2 and Mr. Hai- Chief of Compensation Department (TPPMU3) presented for Group 3. Presentation of Group 1 discussions, Mr. Long, Vattenfall Power Consultant. Mr. Long presented the group discussion based on the key issue technique, where the positions of participants were related to the issues raised by Vattenfall Power Consultant, as well as additional issues that they raised themselves in the meeting. Presentation of Group 2 discussions, Mr. Thanh, TPPMU3
- In environment impact assessment part, he requested VPC to find the other measures besides building cooling tower for its expensive cost not only at the beginning, but also giving high operating costs. Alternatively, VPC could tackle the situation of water discharged to the Hau river through other technical solutions.

284
- For financial analysis, he appreciate VPC’s remarks on electricity market for future. However, VPC should analyze the finance of the project instead of financial situation of EVN so much.
- This power plan was built based on the experience of Phu My complex. Vattenfall Power Consultant should have a visit to see Phu My power plant.
Presentation of Group 3 discussions, Mr. Hai, TPPMU3 Mr. Hai presented matrix of the process of compensation and the actors and activities involved, which the group had put together.
- He explained the reason monetary compensation was not paid in one time. This was due to the request of households that had no consistency between its members.
- There has been 94 household have not yet received compensation while the compensation process has been carrying out.
- - It was suggested that households that had been paid compensation should move away at their earliest convenience.
- Regarding the Resettlement Area, only 6 households have registered to go to resettlement site which will be built in Phuoc Thoi Ward.
- It was suggested that PC O Mon district should hand over the land soon. The Land Development Center has not worked efficiently so far.
Closing Closing remarks were made by VPC, TPPMU3, and Can Tho People’s Committee. Vattenfall Power Consultant AB Anders Ellegård expressed his gratefulness to participants for their valuable comments contributed especially with respect to Resettlement and Compensation Plan which will be submitted to ADB and related institutions in order to have a better solution assisting affected people in stabilizing their life. Mr. Long thanked to PC of Can Tho for their support to hold this meeting. TPPMU3 Mr.Tai thanked to VPC and all participants for all their comments to the workshop. Some problems have been clarified during the meeting. EVN cooperates with local authorities and PC of Can Tho in order to promote the project to achieve quality and progress. We have to abide by the law, and harmonize our interests with it. We hope to continue to receive all comments assisting for the success of the project Can Tho People’s Committee Ms. Cam Hong, on behalf of Can Tho People’s Committee thanked for the well-prepared documents of VPC, active participants of Departments in Can Tho, and representatives of people in Thoi An and Phuoc Thoi wards who are affected directly by project. All contributed to made workshop succeed. The discussion results of the three groups and the concluding comments had confirmed that the content of VPC’s study report is real. Comments from people and TPPMU3 will be fully reported to PC of Can Tho for better managing measures of this and other projects in Can Tho City. Thanking VPC who are doing their best in order to enhance the life of local people in Can Tho city. Good health to participants! The Workshop ended at 4:00 pm in the same day. List of participants in Stakeholder Workshop for O Mon Thermal Power Project, 14/9 2007 The meeting counted 40 invited participants, including Ms. Cam Hong of People's Committee Can Tho, who chaired the meeting. Vattenfall Power Consultant team consisted of seven persons, assisted by four facilitators from Institute of Tropical Biology.

285
Electricity of Viet Nam – EVN Hanoi Dang Trung Nam Tien, Construction Management Department Dao Thi Hien, Environment and Technical Science Department Le Quang Vinh, Project Appraisal Department Thermal Power Project Management Unit No.3 – TPPMU3 Nguyen Phat Tai, Director Le Hai Son, Deputy Director Quach Dinh Thanh, Deputy Director Truong Quang Minh, Deputy Chief of Planning and Logistic Service Dep. Do Hoai Nam, Deputy Manager of Technical and Supervisor Dep. Lam Quoc Hai, Chief of Compensation Dep. Nguyen Quoc De Power Engineering Consulting Company No.2 – PECC2 Pham Hong Hai Dao Van Pha Tran Trong Kien Power Engineering Consulting Company No.3 – PECC3 Nguyen van Minh Department of Foreign Affairs Can Tho City Nguyen Thi Cam Hong, Director Huynh Thi Cam Binh Do Quoc Viet Pham Thi Cuc Pham Hoang Anh Department of Planning and Investment Can Tho City Nguyen Thi Ngoc Yen Local government Le Hoang Thong, Vice Chairman, People's Committee O Mon District Nguyen Van De, People's Committee O Mon District Trang Thanh Trung, People’s Committee of Thoi An – Phuoc Thoi Nguyen Ngoc Thanh, People’s Committee of Thoi An – Phuoc Thoi wards Dang Van Phien Thoi Loi village – Thoi An Ward Nguyen Van Buoi, Thoi Loi village – Thoi An Ward Nguyen Ngoc An, Thoi Loi village – Phuoc Thoi Ward Ho Thanh Gioi, Thoi Trinh village – Phuoc Thoi Ward Tran Van Be Hai, Thoi Trinh village – Phuoc Thoi Ward Nguyen Van Nghia, Thoi Trinh village – Phuoc Thoi Ward Women Union of Can Tho Nguyen Thi Ha Farmer’s Union Huynh Van Tiep, Can Tho City Tran Van Phuong Phuoc Thoi Ward Huynh Huu Duyen, Thoi An Ward Tran Thi Kim Phuong, Thoi An Ward Representative of affected people Hue Van Phen, Phuoc Thoi Ward
286
Cao Trong Quyen, Phuoc Thoi Ward Tran Phong Nha, Phuoc Thoi Ward Le Van Thanh, Thoi An Ward Non government organization - Ieder Voor Allen (IVA) Trinh Kim Lien Vattenfall Power Consultant Anders Ellegård, Team leader Vu Ngoc Long, Social expert Le Buu Thach, environmental expert Tran Minh Kham, Power systems expert Do Thanh Bai, Air pollution and noise expert Nguyen Xuan Quang, Aquatic ecologist Lay Thi Loi, Administrator Facilitators Institute of Tropical Biology (ITB) Nguyen Thanh Mai Do Thanh Phu Hoang Minh Duc Nguyen Quy Bien

287
APPENDIX 14: ORGANIZATION CHART, ENVIRONMENTAL MANAGEMENT DEPARTMENT, CTTP

288
This page has been deliberately left blank to allow for double sided printing.

289
APPENDIX 15: EPC CONTRACTOR’S EHS TEAM TERMS OF REFERENCE
1 Introduction The O Mon IV Thermal Power Project will be designed in detail and constructed through a single engineering, procurement and construction (EPC) package implemented by an EPC contractor recruited by CTTP. CTTP will also contract an international EPC consultant to support CTTP with the tendering procedure for, and supervision of, the EPC package. The EPC contractor will be involved in the project for a total of five years; a three year detailed design and construction phase, and a two year operation phase warranty and maintenance period. The EPC consultant will include an Environment Health, and Safety (EHS) Team, consisting of an International EHS Officer (eight person-months) and a National EHS Officer (26 person-months) during the three year construction phase. It is assumed that the first year of the construction phase will be primarily devoted to detailed design, so inputs from the EHS Team will be limited during that period. The EPC contactor will provide warranty, maintenance and technical support for the first two years of operation. During this period the EPC contractor’s EHS team is expected to assist the CTTP’s Environmental Management Department (EMD) to assume their EMP responsibilities during an initial hand-over phase, and then be available on an on-call basis as needed. One person month for the International EHS and three person months for the National EHS Officer are allotted to cover these responsibilities. 2 Implementation Arrangements The CTTP will provide overall management of, and technical direction to, the EPC contractor. The EMD of CTTP will provide EHS related technical direction to the EHS team during the construction phase; the team is expected to maintain a close working relationship with the EMD and liaison with them on a regular basis. During the two year warranty and maintenance phase, CTTP will call on the EHS team on an as needed basis for technical support. 3 Responsibilities An environmental impact assessment (EIA) including an environmental management plan (EMP) has been prepared for the Project.1 The EMP includes required construction and operation phase environmental mitigation measures, occupational and community health and safety requirements, and an environmental capacity building plan. The overall responsibility of the EHS Team is to ensure that, through the implementation of the measures and plans presented in the EMP, the construction of the O Mon IV project will not result in significant negative impacts on environmental quality or worker or community health and safety. Environmental monitoring will be undertaken by a 3rd party environmental consultant. Once plant operation commences the EMD of CTTP will assume responsibility for plant operation and all aspect of EMP implementation, including mitigation implementation, Occupational Health and Safety (OHS), Community Health and Safety (CHS), and environmental monitoring and reporting.
1 An O Mon IV EIA was prepared by the Power Engineering and Consulting Company 3 (PECC3) of EVN and
was approved by the Ministry of Natural Resources and Environment (MONRE) on December 20th, 2007.
However, due to delays in ensuring a supply of natural gas additional preparatory work was delayed until the spring of 2010. In 2010 a revised and updated EIA was prepared so as to comply with the requirements of ADB’s Safeguards Policy Statement, which became effective on 20 January 2010.

290
3.1 Environmental Management The EHS Team will have overall responsibility for planning and management of all construction phase environmental mitigation measures noted in the EMP, including:
- ensuring the adequate implementation of mitigation measures, including any
implementing construction phase mitigations as described in the EMP, including specific mitigation plans (e.g. erosion and runoff control plan, spill control plan, chance-find procedure, etc.);2
- ensuring compliance with all relevant Vietnamese standards and EHS Guidelines; - recruiting, in coordination with CTTP, training consultants and overseeing the
delivery of the environmental monitoring and OHS/CHS training programs; - development of OHS and CHS plans for the construction phase, and, at an
appropriate time, assisting CTTP EMD in the development of an operational phase OHS and CHS plans;
- ensuring safety of construction workers and local people during construction, and compliance with all relevant Vietnamese OHS standards;
- preparing semiannual environmental management and monitoring reports for submission to CTTP and on-submission to ADB and KfW; and,
- coordinating with other parties in relation to environmental management activities. During the warranty and maintenance period (the first two years of plant operation) the EHS Team will provide technical support to the CTTP EMD on an as needed basis. It is anticipated that this will be a “front-loaded” activity, with the majority of effort allocated to a hand-over period in the first three months of operation. 3.2 Health and Safety Prior to the commencement of civil works the EHS Team will develop an Occupational Health and Safety Plan (OHSP) that is consistent with the relevant requirements of Vietnamese law and with good international practice as reflected in internationally recognized standards such as the World Bank Group’s Environment, Health and Safety Guidelines. The OHSP should:
- identify and minimize, so far as reasonably practicable, the causes of potential hazards to workers, including communicable diseases such as HIV/AIDs and vector borne diseases;
- provide preventive and protective measures, including modification, substitution, or elimination of hazardous conditions or substances;
- provide for the provision of appropriate personal protective equipment (PPE) to minimize risks, including ear protection, hard hats and safety boots;
- provide safety protection equipment including fire fighting systems; - provide adequate signage in risk areas; - provide procedures for limiting exposure to high noise or heat working
environments; - provide for training workers, and establish appropriate incentives to use and
comply with health and safety procedures and utilize PPE; - include procedures for documenting and reporting occupational accidents,
diseases, and incidents; and - include emergency prevention, preparedness, and response arrangements in
place.
2 The contractors’ bidding documents should present in detail the contractors’ proposed approach to EMP
implementation.

291
In addition, the EHS Team will also develop a construction phase Community Health and Safety Plan (CHSP) that is consistent with the relevant requirements of Vietnamese law and is with good international practice as reflected in internationally recognized standards such as the World Bank Group’s Environment, Health and Safety Guidelines. The CHSP should include emergency response procedures developed in close collaboration and consultation with potentially affected communities and local authorities, and should address the following aspects of emergency response and preparedness:
- procedures to identify and minimize, so far as reasonably practicable, the causes of potential project related hazards to local communities, including communicable diseases such as HIV/AIDs and vector borne diseases;
- trained emergency response teams; - emergency contacts and communication systems / protocols; - procedures for interaction with local and regional emergency and health
authorities; - permanently stationed emergency equipment and facilities (e.g. first aid stations,
fire extinguishers/hoses, sprinkler systems); - protocols for fire truck, ambulance and other emergency vehicle services; - evacuation routes and meeting points; - drills (annual or more frequently as necessary); - outreach to local communities on community health and safety issues and plans.
The CHSP should also include procedures for posting warning signs and fences as required to protect local community members from dangerous work areas. In order to minimize risks from construction traffic, speed limit signs should be posted and all vehicles should be required to conform with Vietnamese traffic regulations Prior to the commencement of project operation, and in cooperation with the CTTP EMD, the OHS and CHS should be updated to take operational risks into account, including:
- basic hazard awareness; - site specific hazards; - safe work practices; and - emergency procedures for fire, evacuation, and natural disaster.
In addition, the OHS should address risks specifically associated with thermal plants, including:
- electric and magnetic fields (EMFs); - gas safety; - heat; - noise; - confined spaces; - electrical hazards; - fire and explosion hazards; and, - chemical hazards.
3.3 Reporting The EHS Team will be responsible for assisting CTTP to prepare construction phase semiannual reports documenting environmental management activities. If environmental monitoring identifies weakness or deficiencies in the implementation of the EMP, the EHS Team should develop a corrective action plan (CAP). The CAP should:
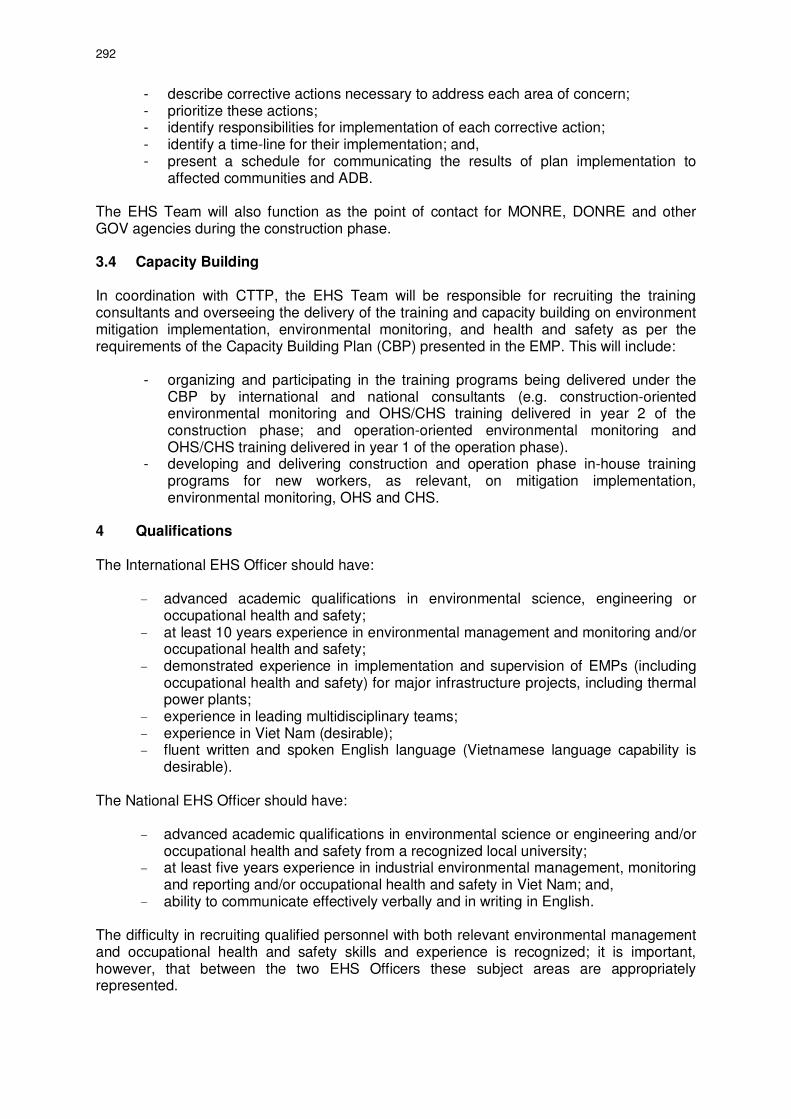
292
- describe corrective actions necessary to address each area of concern; - prioritize these actions; - identify responsibilities for implementation of each corrective action; - identify a time-line for their implementation; and, - present a schedule for communicating the results of plan implementation to
affected communities and ADB. The EHS Team will also function as the point of contact for MONRE, DONRE and other GOV agencies during the construction phase. 3.4 Capacity Building In coordination with CTTP, the EHS Team will be responsible for recruiting the training consultants and overseeing the delivery of the training and capacity building on environment mitigation implementation, environmental monitoring, and health and safety as per the requirements of the Capacity Building Plan (CBP) presented in the EMP. This will include:
- organizing and participating in the training programs being delivered under the CBP by international and national consultants (e.g. construction-oriented environmental monitoring and OHS/CHS training delivered in year 2 of the construction phase; and operation-oriented environmental monitoring and OHS/CHS training delivered in year 1 of the operation phase).
- developing and delivering construction and operation phase in-house training programs for new workers, as relevant, on mitigation implementation, environmental monitoring, OHS and CHS.
4 Qualifications The International EHS Officer should have:
- advanced academic qualifications in environmental science, engineering or
occupational health and safety; - at least 10 years experience in environmental management and monitoring and/or
occupational health and safety; - demonstrated experience in implementation and supervision of EMPs (including
occupational health and safety) for major infrastructure projects, including thermal power plants;
- experience in leading multidisciplinary teams; - experience in Viet Nam (desirable); - fluent written and spoken English language (Vietnamese language capability is
desirable). The National EHS Officer should have:
- advanced academic qualifications in environmental science or engineering and/or
occupational health and safety from a recognized local university; - at least five years experience in industrial environmental management, monitoring
and reporting and/or occupational health and safety in Viet Nam; and, - ability to communicate effectively verbally and in writing in English.
The difficulty in recruiting qualified personnel with both relevant environmental management and occupational health and safety skills and experience is recognized; it is important, however, that between the two EHS Officers these subject areas are appropriately represented.
Copyright © 2022 FDOKUMEN