Competitiveness of Food Processing in Viet Nam - IFPRI ...
133
COMPETITIVENESS OF FOOD PROCESSING IN VIET NAM: A STUDY OF THE RICE, COFFEE, SEAFOOD, AND FRUIT AND VEGETABLES SUBSECTORS Prepared by Nicholas Minot International Food Policy Research Institute Washington, DC Prepared for: Development Strategies Institute Ministry of Planning and Investment Hanoi, Viet Nam and Medium-Term Industrial Strategy Project TF/VIE/95/A58 United Nations Industrial Development Organization Hanoi, Viet Nam 19 April 1998
-
Upload
khangminh22 -
Category
Documents
-
view
1 -
download
0
Transcript of Competitiveness of Food Processing in Viet Nam - IFPRI ...
COMPETITIVENESS OF FOOD PROCESSING IN VIET NAM:
A STUDY OF THE RICE, COFFEE, SEAFOOD, AND
FRUIT AND VEGETABLES SUBSECTORS
Prepared by
Nicholas MinotInternational Food Policy Research Institute
Washington, DC
Prepared for:
Development Strategies InstituteMinistry of Planning and Investment
Hanoi, Viet Nam
and
Medium-Term Industrial Strategy ProjectTF/VIE/95/A58
United Nations Industrial Development OrganizationHanoi, Viet Nam
19 April 1998

i
ACKNOWLEDGMENTS
First and foremost, the author would like to express appreciation for the excellent supportprovided by the Medium-Term Industrial Strategy (MTIS) project team, including the UNIDOproject staff and the local consultants at the Development Strategy Institute (DSI) of theMinistry of Planning and Investment. Professor Ngo Thi Mai (General Director of the NationalFood Industries Research Institute and DSI consultant) and Nguyen Thi Nga (Researcher atDSI) were very helpful in providing information on the sector and logistical assistance with theinterviews. Dr. Luu Bich Ho (President of the Development Strategy Institute) and other DSIstaff provided useful feedback on the preliminary results of the study. On the UNIDO side,Lars Holmstrom (Chief Technical Advisor to the MTIS), was instrumental in coordinating theresources and people to make the best use of a four-week mission. His ideas and feedback,along with those of Muhammad Ather (UNIDO Associate Expert) were critical in focusing andclarifying the message of the report. Nguyen Nam Phuong (UNIDO Administrative Assistant)was impressively capable in providing administrative and logistical support.
The author would also like to thank the interpreter/guides with whom he worked and traveled. In Ho Chi Minh City and Vung Tau, he benefitted from the assistance of Lo Thi Xien from thesub-National Institute of Agricultural Planning and Projection (sub-NIAPP), and in Buon MaThuot he worked with Nguyen Viet Lap (sub-NIAPP). Both helped make the time in theseregions rewarding as well as productive. They were arranged through the generousassistance of Dr. Nguyen The Binh (Vice-Director of sub-NAIPP). For shorter assignments inHanoi and Hai Phong, the author appreciates the capable assistance of Nguyen Viet Hai(Ministry of Agriculture and Rural Development), Hoang Trung Lap (NIAPP), and Nguyen VanCong (National Economic University).
The formatting and production of the report was carried out by Lisa Grover (Word ProcessingSpecialist/Program Assistant at the International Food Policy Research Institute) with her usualproficiency.
Finally, the author would also like to thank the numerous food processing enterprisemanagers, government officials, and consultants (listed at the end of the report) for taking timeto be interviewed for this study. It is hoped that their generosity in time and ideas will beeventually bear fruit, intangible and indirect though it may be, in the form of constructivepolicies, good investments, and a more competitive food processing sector.

ii
TABLE OF CONTENTS
ACKNOWLEDGMENTS . . . . . . . . . . . . . . . . . . . . . . . . . . . . . . . . . . . . . . . . . . . . . . . . . . . . . . i
TABLE OF CONTENTS . . . . . . . . . . . . . . . . . . . . . . . . . . . . . . . . . . . . . . . . . . . . . . . . . . . . . . ii
LIST OF TABLES . . . . . . . . . . . . . . . . . . . . . . . . . . . . . . . . . . . . . . . . . . . . . . . . . . . . . . . . . . iii
1. INTRODUCTION . . . . . . . . . . . . . . . . . . . . . . . . . . . . . . . . . . . . . . . . . . . . . . . . . . . . . . 11.1. INTERNATIONAL PATTERNS IN FOOD PROCESSING . . . . . . . . . . . . . 11.2. FOOD PROCESSING IN VIET NAM . . . . . . . . . . . . . . . . . . . . . . . . . . . . . 4
2. RICE MILLING . . . . . . . . . . . . . . . . . . . . . . . . . . . . . . . . . . . . . . . . . . . . . . . . . . . . . . . 112.1 BACKGROUND . . . . . . . . . . . . . . . . . . . . . . . . . . . . . . . . . . . . . . . . . . . . . . . . . . 112.2. RICE PRODUCTION AND MARKETING . . . . . . . . . . . . . . . . . . . . . . . . . 122.3. RICE MILLING INDUSTRY . . . . . . . . . . . . . . . . . . . . . . . . . . . . . . . . . . . 152.4. RICE CONSUMPTION . . . . . . . . . . . . . . . . . . . . . . . . . . . . . . . . . . . . . . . 172.5. PROSPECTS AND POLICY ISSUES . . . . . . . . . . . . . . . . . . . . . . . . . . . 202.6 SUMMARY AND CONCLUSIONS . . . . . . . . . . . . . . . . . . . . . . . . . . . . . . . . . . . . 27
3. COFFEE PROCESSING . . . . . . . . . . . . . . . . . . . . . . . . . . . . . . . . . . . . . . . . . . . . . . . 373.1 BACKGROUND . . . . . . . . . . . . . . . . . . . . . . . . . . . . . . . . . . . . . . . . . . . . . . . . . . 373.2. COFFEE PRODUCTION . . . . . . . . . . . . . . . . . . . . . . . . . . . . . . . . . . . . . 373.4. COFFEE PROCESSING AND MARKETING . . . . . . . . . . . . . . . . . . . . . . 393.5. COFFEE CONSUMPTION . . . . . . . . . . . . . . . . . . . . . . . . . . . . . . . . . . . . 433.6. PROSPECTS AND POLICY ISSUES . . . . . . . . . . . . . . . . . . . . . . . . . . . 463.7. CONCLUSIONS AND RECOMMENDATIONS . . . . . . . . . . . . . . . . . . . . . 53
4. FRUIT AND VEGETABLE PROCESSING . . . . . . . . . . . . . . . . . . . . . . . . . . . . . . . . . 614.1. BACKGROUND . . . . . . . . . . . . . . . . . . . . . . . . . . . . . . . . . . . . . . . . . . . . 614.2. FRUIT AND VEGETABLE PRODUCTION AND MARKETING . . . . . . . . . 614.3. FRUIT AND VEGETABLE PROCESSING . . . . . . . . . . . . . . . . . . . . . . . . 634.4. FRUIT AND VEGETABLE DEMAND . . . . . . . . . . . . . . . . . . . . . . . . . . . . 654.5. PROSPECTS AND POLICY ISSUES . . . . . . . . . . . . . . . . . . . . . . . . . . . 674.6 CONCLUSIONS AND RECOMMENDATIONS . . . . . . . . . . . . . . . . . . . . . . . . . . 74
5. SEAFOOD PROCESSING . . . . . . . . . . . . . . . . . . . . . . . . . . . . . . . . . . . . . . . . . . . . . 845.1. BACKGROUND . . . . . . . . . . . . . . . . . . . . . . . . . . . . . . . . . . . . . . . . . . . . 845.3. SEAFOOD PROCESSING . . . . . . . . . . . . . . . . . . . . . . . . . . . . . . . . . . . . 875.4. SEAFOOD CONSUMPTION . . . . . . . . . . . . . . . . . . . . . . . . . . . . . . . . . . 885.5. PROSPECTS AND POLICY ISSUES . . . . . . . . . . . . . . . . . . . . . . . . . . . 905.6 CONCLUSIONS AND RECOMMENDATIONS . . . . . . . . . . . . . . . . . . . . . . . . . . 96
6. CONCLUSIONS AND RECOMMENDATIONS . . . . . . . . . . . . . . . . . . . . . . . . . . . . . 1086.1. Conclusions for the food processing sector . . . . . . . . . . . . . . . . . . . . . . 1086.2. Recommendations for the food processing sector . . . . . . . . . . . . . . . . . 1106.3. Conclusions and recommendations for the rice subsector . . . . . . . . . . . 113

iii
6.4. Conclusions and recommendations for the coffee subsector . . . . . . . . 1146.5. Conclusions and recommendations for the fruit and vegetable subsector
. . . . . . . . . . . . . . . . . . . . . . . . . . . . . . . . . . . . . . . . . . . . . . . . . . . . . . . . 1156.6. Conclusions and recommendations for the seafood subsector . . . . . . . 116
REFERENCES . . . . . . . . . . . . . . . . . . . . . . . . . . . . . . . . . . . . . . . . . . . . . . . . . . . . . . . . . . . 118
PEOPLE CONTACTED . . . . . . . . . . . . . . . . . . . . . . . . . . . . . . . . . . . . . . . . . . . . . . . . . . . . 120
LIST OF TABLES
Table 1.1 Contribution of food processing to Gross Domestic Product . . . . . . . . . . . . . . . . . 7Table 1.2 Contribution of agriculture, forestry, and fisheries to exports . . . . . . . . . . . . . . . . 7Table 1.3 Size of food processing enterprises . . . . . . . . . . . . . . . . . . . . . . . . . . . . . . . . . . . 8Table 1.4 Employment in food processing sector by type of ownership . . . . . . . . . . . . . . . . 8Table 1.5 Value of fixed assets of food processing enterprises . . . . . . . . . . . . . . . . . . . . . . 9Table 1.6 Value of capital of food processing enterprises . . . . . . . . . . . . . . . . . . . . . . . . . . . 9Table 1.7 Gross revenue of food processing enterprises . . . . . . . . . . . . . . . . . . . . . . . . . . 10Table 1.8 Food processing enterprises with profits and with losses . . . . . . . . . . . . . . . . . . 10Table 1.9 Fixed assets and revenue of food processing enterprises . . . . . . . . . . . . . . . . . 10Table 2.1 Trends in rice production in Viet Nam . . . . . . . . . . . . . . . . . . . . . . . . . . . . . . . . . 29Table 2.2 Contribution of area, yield, and intensity to rice production growth . . . . . . . . . . . 30Table 2.3 Geographic distribution of rice production . . . . . . . . . . . . . . . . . . . . . . . . . . . . . . 30Table 2.4 Geographic patterns in rice surplus (1996) . . . . . . . . . . . . . . . . . . . . . . . . . . . . . 31Table 2.5 Trend in the number and size of rice mills . . . . . . . . . . . . . . . . . . . . . . . . . . . . . . 32Table 2.6 Geographic pattern in the number and size of rice mills (1995) . . . . . . . . . . . . . 32Table 2.7 Trends in production, consumption, and export . . . . . . . . . . . . . . . . . . . . . . . . . . 33Table 2.8 Domestic demand for rice . . . . . . . . . . . . . . . . . . . . . . . . . . . . . . . . . . . . . . . . . . 34Table 2.9 Trend in rice exports . . . . . . . . . . . . . . . . . . . . . . . . . . . . . . . . . . . . . . . . . . . . . . 35Table 2.10 Rice exports by destinations (1995) . . . . . . . . . . . . . . . . . . . . . . . . . . . . . . . . . . 35Table 2.11 Allocation of 1997 rice export quota . . . . . . . . . . . . . . . . . . . . . . . . . . . . . . . . . . 36Table 3.1 Trends in coffee production . . . . . . . . . . . . . . . . . . . . . . . . . . . . . . . . . . . . . . . . . 55Table 3.2 Geographic distribution of coffee production (1996) . . . . . . . . . . . . . . . . . . . . . . 56Table 3.3 Trends in coffee processing . . . . . . . . . . . . . . . . . . . . . . . . . . . . . . . . . . . . . . . . 56Table 3.4 Characteristics of medium and large coffee processors in Dak Lak . . . . . . . . . . 57Table 3.5 Cost structure of coffee processing . . . . . . . . . . . . . . . . . . . . . . . . . . . . . . . . . . . 58Table 3.6 Trends in coffee exports . . . . . . . . . . . . . . . . . . . . . . . . . . . . . . . . . . . . . . . . . . . 59Table 3.7 Coffee quality standards . . . . . . . . . . . . . . . . . . . . . . . . . . . . . . . . . . . . . . . . . . . 60Table 3.8 Import tariffs on coffee products . . . . . . . . . . . . . . . . . . . . . . . . . . . . . . . . . . . . . 60Table 4.1 Trends in fruit area . . . . . . . . . . . . . . . . . . . . . . . . . . . . . . . . . . . . . . . . . . . . . . . 76Table 4.2 Trends in fruit and vegetable production . . . . . . . . . . . . . . . . . . . . . . . . . . . . . . . 76Table 4.3 Geographic distribution of fruit and vegetable production in 1995 . . . . . . . . . . . 77Table 4.4 Trends in fruit and vegetable processing . . . . . . . . . . . . . . . . . . . . . . . . . . . . . . . 78Table 4.5 Cost structure of fruit and vegetable processors . . . . . . . . . . . . . . . . . . . . . . . . . 78Table 4.6 Domestic demand for vegetables in Viet Nam . . . . . . . . . . . . . . . . . . . . . . . . . . . 79Table 4.7 Trend in fruit and vegetable exports . . . . . . . . . . . . . . . . . . . . . . . . . . . . . . . . . . 80Table 4.8 Trend in the unit value of fruit and vegetable exports . . . . . . . . . . . . . . . . . . . . . 81

1
Table 4.9 Import tariffs on fresh and dried fruits and vegetables . . . . . . . . . . . . . . . . . . . . 82Table 4.10 Import tariffs on fruits and vegetables products . . . . . . . . . . . . . . . . . . . . . . . . . . 83Table 5.1 Trends in fishery production . . . . . . . . . . . . . . . . . . . . . . . . . . . . . . . . . . . . . . . . 98Table 5.2 Geographic patterns in marine fisheries production . . . . . . . . . . . . . . . . . . . . . . 98Table 5.3 Geographic patterns in inland fisheries and aquaculture . . . . . . . . . . . . . . . . . . . 99Table 5.4 Trends in seafood processing . . . . . . . . . . . . . . . . . . . . . . . . . . . . . . . . . . . . . . . 99Table 5.5 Geographic distribution of seafood export processing by province . . . . . . . . . . 100Table 5.6 Geographic distribution of seafood export processing by region . . . . . . . . . . . . 101Table 5.7 Largest seafood processor-exporters . . . . . . . . . . . . . . . . . . . . . . . . . . . . . . . . 101Table 5.9 Domestic demand for fish and shrimp in Viet Nam . . . . . . . . . . . . . . . . . . . . . . 103Table 5.10 Domestic demand for fish sauce in Viet Nam . . . . . . . . . . . . . . . . . . . . . . . . . . 104Table 5.11 Trend in the composition of seafood exports . . . . . . . . . . . . . . . . . . . . . . . . . . . 105Table 5.12 Trend in the value of seafood exports . . . . . . . . . . . . . . . . . . . . . . . . . . . . . . . . 105Table 5.13 Seafood exports by destination (1995) . . . . . . . . . . . . . . . . . . . . . . . . . . . . . . . 106Table 5.14 Seafood exports by product (1995) . . . . . . . . . . . . . . . . . . . . . . . . . . . . . . . . . . 106Table 5.15 Exports and domestic sales by SEAPRODEX . . . . . . . . . . . . . . . . . . . . . . . . . . 107

2
1. INTRODUCTION
This report examines the competitiveness of the food processing sector in Viet Nam, focusingon four subsectors: rice milling, coffee processing, seafood processing, and fruits andvegetables. The rationale for the study is that Viet Nam, as a member of the Association ofSouth East Asian Nations (ASEAN), is obliged to follow the trade liberalization scheduledefined by the ASEAN Free Trade Agreement (AFTA). Under this agreement, Viet Nam willhave to reduce the import tariffs on almost all goods imported from ASEAN members to lessthan 5 percent by 2003. An important question for the government is how trade liberalizationis likely to affect the food processing sector and what steps can be taken to make thetransition a successful one.
This chapter provides an overview of the food processing sector in general and a brief outlineof its size and structure in Viet Nam. Chapters 2 through 5 examine each of the four selectedsubsectors. In each chapter, production, marketing, processing, domestic demand, and exportdemand are described. There is also a discussion of the prospects and main policy issues forthe sector. Chapter 6 provides the conclusions of the study, including recommendations forwith recommendations
1.1. INTERNATIONAL PATTERNS IN FOOD PROCESSING
Food processing can be defined as the transformation of agricultural commodities as part oftheir preparation for human consumption. This definition encompasses relatively simpleactivities such as cleaning, grading, and storage as well as more involved transformations suchas milling, canning, and freezing.
The food processing sector is best understood as one link in the marketing channel betweenthe farmer (or fisherman) and the ultimate consumer. On the one hand, the characteristics ofthe raw material have a strong influence on the way the food processing sector is organized. For example, the processing of goods that are bulky but highly perishable, such as sugarcane,normally takes place close to the producing areas. On the other hand, changes in the foodprocessing sector are often driven by shifts in consumer preferences. For example, risingincomes tend to increase the demand for convenience foods and hence for food processing.
1.1.1. Role of food processing in development
Food processing plays an important role in economic development. Food processing canprovide new outlets for agricultural output, raising the income of farmers, who tend to bepoorer than the non-farmers. This sector is sometimes involved in providing credit, seed, andtechnical assistance to producers in order to obtain a higher-value crop. Furthermore, foodprocessing generates employment, more so than many other manufacturing sectors because itis relatively labor-intensive. Furthermore, since food processing plants are often located inrural areas, they create jobs for rural households, where poverty is often concentrated. Finally,the food processing sector can play a role in improving nutrition through fortification and thesupply of foods with longer shelf-life (Austin, 1996).

3
On the other hand, food processing should not be seen as a panacea. Food processors mayprefer to purchase raw materials from larger, well-endowed farmers rather than the poorestfarmers. The employment created by the food processing sector is usually relatively low-paying, at least compared to other manufacturing sectors. And processed foods are usuallymore important in the consumption patterns of high income than low-income households. Nonetheless, a healthy and dynamic food processing sector is an important component in theprocess of economic development and industrialization.
1.1.2. Distinctive characteristics of food processing
Food processing differs from other manufacturing sectors in several important respects, mainlyrelated to the raw material. First, the supply of the raw material for food processing is oftenhighly seasonal. For larger capital-intensive food processing activities, this creates a strongincentive to store the commodity for off-season processing when possible. When storage isnot possible, food processors often attempt to stagger production to reduce its seasonality. Alternatively, food processors may seek other commodities to process in the off-season. Inspite of these strategies, food processing plants are sometimes idle during part of the year. Thus, excess capacity is not necessarily a sign of poor management, although it does raise theunit processing costs.
Second, the supply of the raw material is difficult to predict and often varies significantly fromone year to the next. As a result, prices and profitability may fluctuate. This complicates theprocurement of the raw material and can result various types of risk reducing or risk shiftingbehavior such as fixed-price contracts with suppliers. Skills and flexibility in procurement arecritical to the success of food processing enterprises.
Third, the quality of the raw material used by food processors is quite variable, in large partdue to its perishability. This would not be a problem if quality could be observed without cost,but it is often difficult for buyers for food processors to assess the quality of the raw material. This leads to the establishment of grading systems and price differences between differentgrades. The unavoidable subjectivity in the grading process often leads to conflicts betweenproducers and processors.
Fourth, as mentioned above, the raw material for food processors tends to be “bulky” in thesense that the value per kilogram is low. This means that food processors tend to locate theirplants in or near producing areas, particularly when the commodity is more perishable or morecostly to transport in its unprocessed form than in its processed form.
Fifth, the cost of raw materials accounts for a relatively large share of the total cost of foodprocessors, typically 50-80 percent in developing countries. The implication is thatprocurement of high-quality raw materials at low prices is even more important in foodprocessing than in other manufacturing sectors.
Sixth, food processors are subject to special attention by the government because of theimportance of the final product in social well-being. Food processors face health and safetyregulations to protect the consumer. This is another consequence of the difficulty in observingquality. In addition, they may face political pressure and/or government controls to pay “fair”prices to farmers or to charge “reasonable” prices to consumers.
4
1.1.3. Trends in food consumption
The development of the food processing industry in most countries reflects the changes infood consumption patterns as incomes rise. Engle’s Law, one of the most universal patternsof economics, is that as income rises, the budget share allocated to food declines. Moreprecisely, the total expenditure on food continues to rise, but it does so more slowly than totalexpenditure.
In addition, the composition of food expenditure changes with higher incomes. There is a shiftfrom staple foods, which are generally the least expensive source of calories, to foods that aremore expensive on a per calorie basis. Fruit and vegetable consumption rises more quicklythan staple consumption, and meat, fish, and dairy consumption rises the fastest. As part of this process of diversification of diets, households begin to purchase moreprocessed foods. Some processed foods are easier and quicker to prepare, such as instantsoup packages or canned beans. Higher-income households are willing to pay extra for semi-prepared foods because it saves them time, whether they use that extra time for work orleisure. In a sense, with higher incomes, households can afford to "hire" food processors toassist with food preparation. Other processed foods have the advantage of allowingconsumption of a greater variety of foods than are possible from fresh products alone. Canned and frozen goods can be consumed thousands of kilometers from where they wereproduced.
Another trend is that as per capita income rises, households begin to put greater priority onfood quality and safety. This may take the form of buying goods with trusted brand labelsrather than buying in bulk, since the reputation behind the label serves as an assurance ofquality. Another example is trend toward "organic" or "clean" fruits and vegetables, respondingto the fact that high-income consumers are willing to pay a premium for produce grown withoutthe use of agricultural chemicals. In addition, these households are willing to pay extra forpackaging that makes shopping or consumption more convenient. Examples includebeverages that are sold in one-portion containers rather than 1-2 liter containers and cannedgoods with easy-to-open lids. In
1.1.4. Trends in food processing
The trends in food consumption have important implications for the evolution of the foodprocessing sector. Initially, when the market consists primarily of low-income consumers, thefood processing sector concentrates on the minimum transformation necessary to make thecommodity edible. Furthermore, the processing is often done on a small scale if technologypermits. The drying of fish and fruits, grain milling, and cassava processing are examples.
Later, processing responds to the demand for variety in the diet, becoming larger and morediverse. As wage rates rise and markets expand, the scale and capital intensity of foodprocessing gradually increase. It is worth noting that automation and capital intensity are notthe cause of development but rather the consequence. In other words, development andhigher wages make it profitable to purchase machinery that replaces labor. In a low-wageeconomy, a modern capital-intensive processing plant may be less profitable than a morelabor-intensive one. In some cases, automated processes are necessary to achieve export-

This is based on the food processing value added of 4600 million dong in 1989 prices (see1
Table 1.1), a GDP deflator of 0.117 for 1997, and an exchange rate of 13,000 dong/US$.
5
level quality, but technical efficiency (in terms of conversion ratios or canning rate) does notguarantee economic efficiency in the sense of profitability.
As the complexity of food processing increases, a larger share of consumer food spendinggoes to marketing and processing. As a result, the proportion of consumer spending reachingthe farmer declines. Finally, there is a paradoxical pattern regarding the size of the foodprocessing sector. Although it tends to grow in absolute terms, since consumers arepurchasing more processed foods, it tends to shrink as a proportion of the manufacturingsector. This is a consequence of Engle’s Law - as incomes rise, a larger share of householdbudgets are allocated to non-food items, creating the demand for larger industrial and servicessector. Once again, it is the trend of rising income that causes the expansion of the industrialsector, rather than the reverse.
1.2. FOOD PROCESSING IN VIET NAM
1.2.1. Role of food processing in Vietnamese economy
The food processing sector is a large and rapidly growing industry in the Vietnameseeconomy. In 1997, the value added in the food processing sector is estimated to be aboutUS$ 2.0 billion . As shown in Table 1.1, this represents about 8.8 percent of GDP and 35.51
percent of industrial value added. Furthermore, the contribution of food processing to GDPappears to be growing. In 1991, food processing represented just 6.7 percent of GDP, butover the period 1991-1997, value added in food processing has grown 14.0 percent annually,while GDP has grown only 8.9 percent annually. Furthermore, the growth in the foodprocessing has even outpaced, by a small margin, the industrial sector in general.
Food processing also plays an important role in Viet Nam’s exports, as shown in Table 1.2. Agricultural, fishery, and forest products, almost all of which are processed in some way beforebeing exported, account for US$ 3.2 billion in exports, or 36.8 percent of total exports. In spiteof the 19.7 percent annual rate of growth in exports of agricultural, fishery, and forestryexports, its share in total exports has declined somewhat due to even more rapid growth inother exports such as oil and manufactured goods.
The four subsectors that are the focus of this study, rice, coffee, seafood, and fruits andvegetables, account for 25.3 percent of all exports, though this figure has varied between 25and 33 percent in recent years. The value of exports of these four commodities has grown at23.2 percent annually, almost as fast as the growth in the total value of exports (26.9 percent). As will be shown later, seafood and rice are the most important exports among the four,followed by coffee. Fruit and vegetable exports are relatively small.
1.2.2. Characteristics of the food processing sector
A picture of the structure of the food processing sector can be obtained from the 1995Economic Census, carried out by the General Statistics Office. The Economic Census

The 1995 Economic Census included state, private, and foreign-invested companies, but2
excluded farmers, who probably number 22-24 million. It is likely that the Census also omittedmany self-employed individuals, based on the average enterprise size (3.1) is large byinternational standards.
6
covered 2 million enterprises and 6.7 million workers . This Census identified 163 thousand2
food processing enterprises employing 505 thousand workers. Thus, the food processingsector represents about 8 percent of the enterprises and a similar percentage of theemployment in the enterprise sector (see Table 1.3). In other words, employment perenterprises is roughly the same in food processing and other sectors. Enterprises with lessthan 10 workers account for the vast majority of food processing enterprises (98 percent) andmost of the food processing employment (62 percent). Just one quarter of the food processingsector workers are in enterprises with more than 100 workers.
Foreign-invested enterprises account for 6.2 percent of the employment in the food processingsector (see Table 1.4). This percentage is somewhat higher than for enterprises in general(4.8 percent), suggesting that the food processing industry attracts foreign investment morethan the average of other sectors.
Tables 1.5 reveals that food processing enterprises have less capital (fixed and operating)than enterprises in other sectors, on average. Almost 84 percent of food processingenterprises have less than 1 billion dong (US$ 91 thousand) in fixed capital, compared to just76 percent of all Vietnamese enterprises. A similar pattern holds if we examine total capital, asshown in Table 1.6. Capital intensity can be measured by the value of capital per worker. Although the available data from the 1995 Economic Census do not allow the calculation ofthe capital intensity (capital per worker), the data do suggest that food processing is lesscapital intensive than other sectors. This conclusion is based on the fact that food processingenterprises have the same number of workers as other enterprises (see Table 1.3), but haveless fixed and total capital (see Tables 1.5 and 1.6).
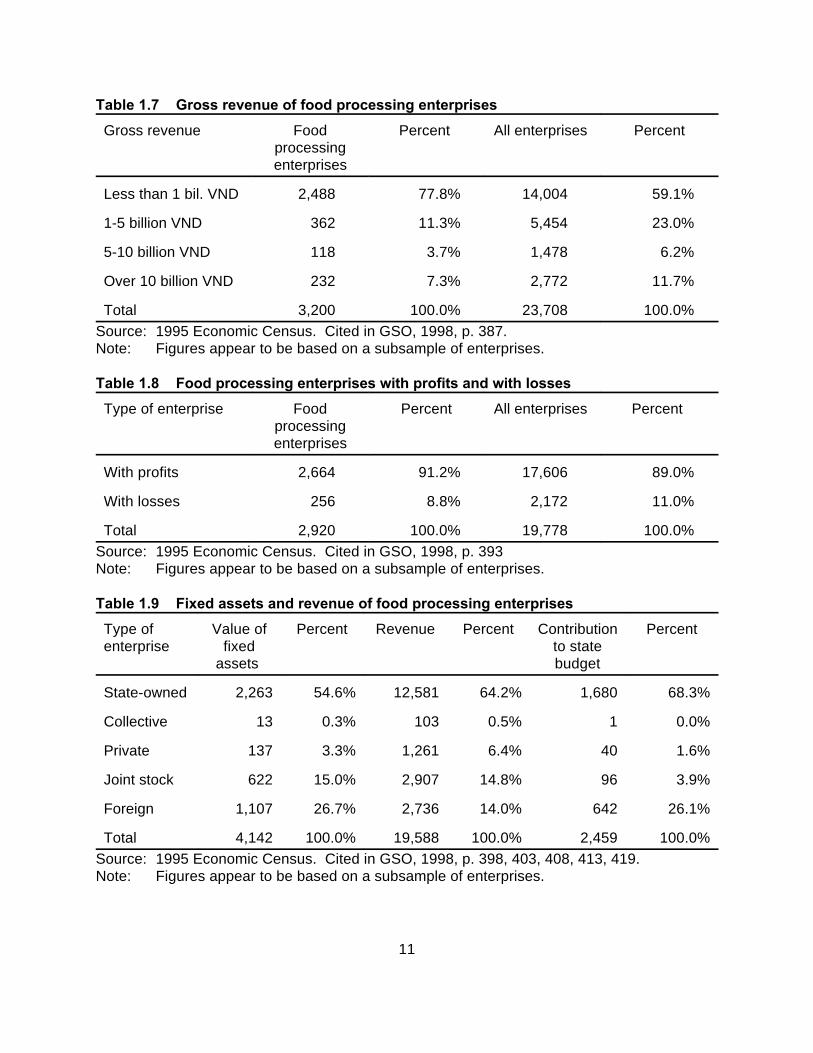
Table 1.7 indicates that over three quarters (78 percent) of food processing enterprises havegross revenues below 1 billion dong, compared to just 59 percent of all enterprises. Onceagain, this suggests that food processing enterprises are, in general, somewhat smaller thanenterprises in other sectors.
The 1995 Economic Census also attempted to identify enterprises that were making profitsand those that were making losses. Although the results should be interpreted with cautiondue to the difficulty in getting reliable data on profits, the results in Table 1.8 suggest that 9percent of food processing enterprises make losses, compared to 11 percent of all enterprises. To extent that these figures can be trusted, they suggest that food processing companies,although they are smaller and less capital intensive than others, are no less likely to beprofitable.
State enterprises dominate the food processing sector. According to Table 1.9, stateenterprises represent over half the value of fixed assets and 64 percent of the revenue in thefood processing sector. Foreign and joint stock enterprises follow with 42 percent of the fixedassets and 29 percent of the revenue.
7
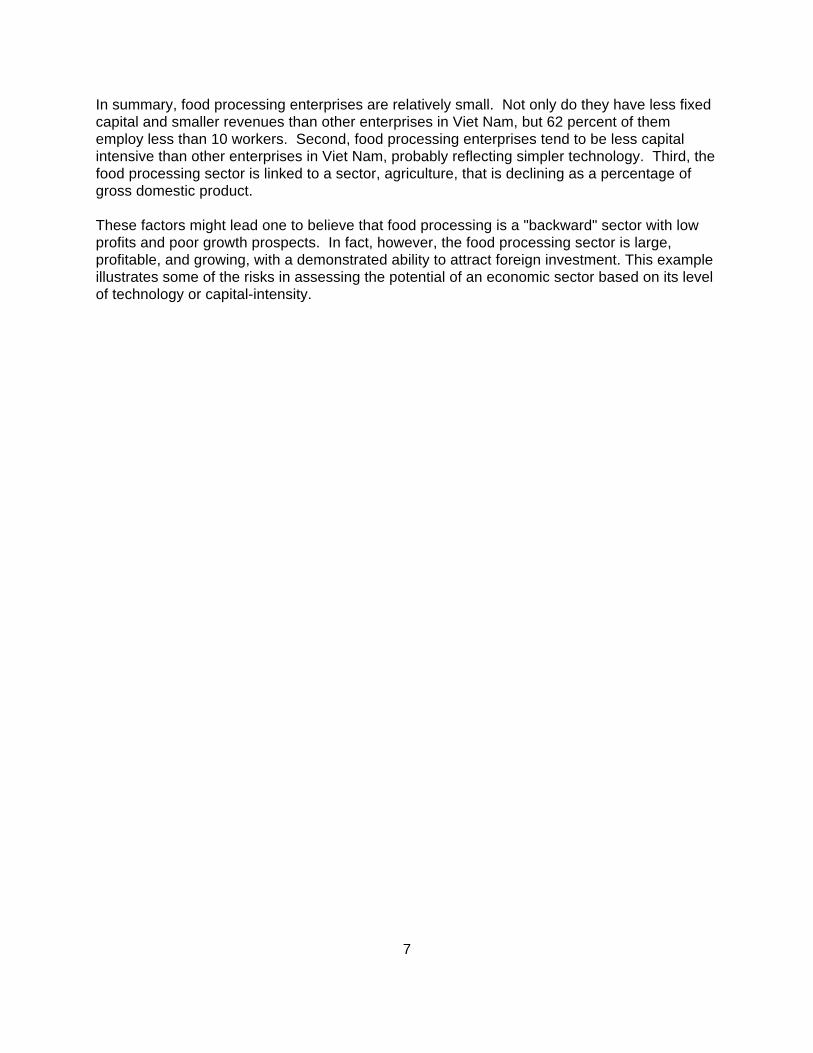
In summary, food processing enterprises are relatively small. Not only do they have less fixedcapital and smaller revenues than other enterprises in Viet Nam, but 62 percent of thememploy less than 10 workers. Second, food processing enterprises tend to be less capitalintensive than other enterprises in Viet Nam, probably reflecting simpler technology. Third, thefood processing sector is linked to a sector, agriculture, that is declining as a percentage ofgross domestic product.
These factors might lead one to believe that food processing is a "backward" sector with lowprofits and poor growth prospects. In fact, however, the food processing sector is large,profitable, and growing, with a demonstrated ability to attract foreign investment. This exampleillustrates some of the risks in assessing the potential of an economic sector based on its levelof technology or capital-intensity.

8
Table 1.1 Contribution of food processing to Gross Domestic Product
Year Gross Industrial Food Food FoodDomestic value added processing processing as processing asProduct value added pct of GDP pct of industry
(billion dong at 1989 prices) (percent) (percent)
1991 31,286 6,042 2,100 6.7% 34.8%
1992 33,991 6,921 2,346 6.9% 33.9%
1993 36,735 7,766 2,602 7.1% 33.5%
1994 39,982 8,771 2,994 7.5% 34.1%
1995 43,797 9,998 3,460 7.9% 34.6%
1996 47,888 11,448 4,000 8.4% 34.9%
1997 52,198 12,960 4,600 8.8% 35.5%
Annual 8.9% 13.6% 14.0%growth
Source: Data provided by DSI, Ministry of Planning and Investment.
Table 1.2 Contribution of agriculture, forestry, and fisheries to exports
Year Total exports Export of agricultural, forestry, Export of rice, coffee,and fisheries products seafood, fruits, and
vegetables
(million US$) (million US$) (% of total (million US$) (% of totalexports) exports)
1991 2,087 1,090 52.2% 629 30.1%
1992 2,581 1,276 49.4% 849 32.9%
1993 2,985 1,444 48.4% 923 30.9%
1994 4,054 1,905 47.0% 1,327 32.7%
1995 5,449 2,521 46.3% 1,806 33.1%
1996 7,260 3,051 42.0% 1,954 26.9%
1997 8,700 3,200 36.8% 2,204 25.3%
Annual 26.9% 19.7% 23.2%growth
Source: Data provided by DSI, Ministry of Planning and Investment.

9
Table 1.3 Size of food processing enterprises
Number of Food Percent Food Percent Workers perworkers processing processing enterprise
enterprises workers
1-10 160,238 98.1% 311,823 61.7% 1.9
11-100 2,645 1.6% 63,278 12.5% 23.9
101-500 325 0.2% 72,533 14.3% 223.2
501-1000 47 0.0% 30,655 6.1% 652.2
1001-2000 19 0.0% 24,969 4.9% 1,314.2
More than 2000 1 0.0% 2,460 0.5% 2,460.0
Total 163,275 100.0% 505,718 100.0% 3.1
Food processing 8.0% 7.9%as pct of allenterprises
Source: 1995 Economic Census. Cited in GSO, 1998, p. 182-183.
Table 1.4 Employment in food processing sector by type of ownership
Number of workers Food Percent Enterprise Percentprocessing employment
employment
Domestic invested 173,009 93.8% 1,937,023 95.2%
Foreign invested 11,366 6.2% 97,832 4.8%
Total 184,375 100.0% 2,034,855 100.0%Source: 1995 Economic Census. Cited in GSO, 1998, p. 365.Note: Figures appear to be based on a subsample of enterprises.

10
Table 1.5 Value of fixed assets of food processing enterprises
Value of fixed assets Food Percent All enterprises Percentprocessingenterprises
0-1 billion VND 2,683 83.8% 18,094 76.3%
1-5 billion VND 319 10.0% 3,548 15.0%
5-10 billion VND 79 2.5% 927 3.9%
Over 10 billion VND 119 3.7% 1,139 4.8%
Total 3,200 100.0% 23,708 100.0%Source: 1995 Economic Census. Cited in GSO, 1998, p. 375.Note: Figures appear to be based on a subsample of enterprises.
Table 1.6 Value of capital of food processing enterprises
Value of fixed assets Food Percent All enterprises Percentprocessingenterprises
Less than 1 bill. VND 2,621 81.9% 16,673 70.3%
1-5 billion VND 346 10.8% 4,183 17.6%
5-10 billion VND 82 2.6% 1,083 4.6%
Over 10 billion VND 151 4.7% 1,769 7.5%
Total 3,200 100.0% 23,708 100.0%Source: 1995 Economic Census. Cited in GSO, 1998, p. 381.Note: Figures appear to be based on a subsample of enterprises.
11
Table 1.7 Gross revenue of food processing enterprises
Gross revenue Food Percent All enterprises Percentprocessingenterprises
Less than 1 bil. VND 2,488 77.8% 14,004 59.1%
1-5 billion VND 362 11.3% 5,454 23.0%
5-10 billion VND 118 3.7% 1,478 6.2%
Over 10 billion VND 232 7.3% 2,772 11.7%
Total 3,200 100.0% 23,708 100.0%Source: 1995 Economic Census. Cited in GSO, 1998, p. 387.Note: Figures appear to be based on a subsample of enterprises.
Table 1.8 Food processing enterprises with profits and with losses
Type of enterprise Food Percent All enterprises Percent processingenterprises
With profits 2,664 91.2% 17,606 89.0%
With losses 256 8.8% 2,172 11.0%
Total 2,920 100.0% 19,778 100.0%Source: 1995 Economic Census. Cited in GSO, 1998, p. 393Note: Figures appear to be based on a subsample of enterprises.
Table 1.9 Fixed assets and revenue of food processing enterprises
Type of Value of Percent Revenue Percent Contribution Percententerprise fixed to state
assets budget
State-owned 2,263 54.6% 12,581 64.2% 1,680 68.3%
Collective 13 0.3% 103 0.5% 1 0.0%
Private 137 3.3% 1,261 6.4% 40 1.6%
Joint stock 622 15.0% 2,907 14.8% 96 3.9%
Foreign 1,107 26.7% 2,736 14.0% 642 26.1%
Total 4,142 100.0% 19,588 100.0% 2,459 100.0%Source: 1995 Economic Census. Cited in GSO, 1998, p. 398, 403, 408, 413, 419.Note: Figures appear to be based on a subsample of enterprises.

12
2. RICE MILLING
For decades, Viet Nam was a consistent importer of rice. This was understandable during thewar, but the inability of the country to meet its own food requirements even after reunificationand peace in 1975 was a key factor in raising doubts about the efficiency of agriculturalcollectives and central planning. A series of partial reforms carried out in the 1980s, yieldedlimited but encouraging successes. As part of the doi moi (renovation) policies starting in1986, more dramatic reforms were introduced including the allocation of collective land to farmhouseholds, market liberalization, and depreciation of the exchange rate to a realistic marketlevel. In 1989, Viet Nam became one of the three largest rice exporter in the world, a positionit has maintained ever since.
The rice milling sector is still responding to the expansion in rice production, the neworientation toward exports, and the liberalization of rice markets. This section describes therice milling industry in the context of the rice sector. A number of policy issues are raised andthe impact of alternative policies is discussed.
2.1 BACKGROUND
Rice has been the dominant staple in Viet Nam for several thousand years. Wet ricecultivation is thought to have been practiced in the Red River Delta as early as 2000 BC. Theorganization required to build and maintain dykes and irrigation systems was an importantmotivation for the development of centralized authority in northern Viet Nam. Furthermore, thesurpluses generated by intensive rice cultivation allowed high population densities in the RedRiver Delta and facilitated the the expansion of the Vietnamese nation toward the south overthe period 1200-1800.
Intensive cultivation of the Mekong Delta is more recent, having been initiated by the Frenchcolonial administration around the turn of the century. Tenant farmers in the Mekong Deltaproduced surpluses allowing Viet Nam to export 1-2 million tons from the 1920s until the end ofWorld War II. These exports coincided with periods of deprivation and even famine within thecountry, contributing the sensitivity of policymakers today to the food security implications ofrice exports.
In the 1960s, the north was self-sufficient and the south became a consistent rice importer,due to the effect of economic and military aid on the exchange rate. After reunification in1975, the government attempted to organize farmers into collectives which were obliged to selltheir surplus to the government at fixed prices. The repeated failure of the country to stimulaterice production under this system was a key factors leading to various experiments giving moreautonomy and incentives to farm households. The process of decollectivization, marketliberalization, and exchange rate adjustment in 1989 created an impressive response fromfarmers: after years of rice imports, Viet Nam became the third largest rice exporter in 1989. Rice exports have climbed from around 2 million tons in the early 1990s to 3.6 million tons in1997.
13
Rice export policy is politically sensitive, and the decision to liberalize exports was not an easyone. Policymakers are concerned about the impact of exports on domestic availability andprices. This is understandable given that rice accounts for 75 percent of the caloric intake ofthe average Vietnamese household (World Bank, 1996). Thus far, however, rice exportgrowth has not been achieved at the expense of domestic consumption. In fact, per capita riceconsumption has risen since the late 1980s.
2.2. RICE PRODUCTION AND MARKETING
2.2.1. Crop characteristics
Rice (oryza sativa) is an annual grass that grows from 70 cm to more than 2 meters. It is theonly grain that can germinate in submerged soil and produces the highest yield when grownunder these conditions. The growing period varies from four to six months. Although there areover 6000 varieties of rice, most of them can be classified into two types. Indica rice is grownin tropical areas such as south and southeast Asia and southern China. Japonica is grown intemperate regions such as Korea, Japan, Europe, the United States, and Australia.
Both lowland and upland cultivation methods are used to grow rice. Most of world productionis lowland rice, in which irrigation is used to keep the rice field submerged during most of thegrowing period. The water level is generally 5-15 cm, but it may be over one meter in the caseof deepwater rice. The yields average around 2 tons/ha in developing countries and around 5tons/ha in Japan and the United States. Upland rice is grown in areas where irrigation is notpossible, although the rainfall must be relatively high. The yields are much lower than forlowland rice, averaging 1 ton/ha or less (Brown, 1991). 2.2.2. Production trends
Between 1985 and 1995, rice production expanded by 57 percent, representing an averageannual rate of 4.6 percent. This growth occurred in spite of a small reduction in the area ofland cultivated with rice. The expansion was due to increases in cropping intensity and yield. Cropping intensity (the average number of rice crops produced in a year) has increased from1.3 in 1985 to 1.6 in 1995, or 2.0 percent per year. Much of this change has been the result ofimproved irrigation and drainage infrastructure in the Mekong River Delta, converting single-cropped areas into double-cropped areas. In addition, the average yield has increased from2.78 tons/ha in 1985 to 3.69 tons/ha in 1995, or 2.9 percent per year. Yield growth is theresult of greater use of fertilizer, better water control, and the adoption of higher-yieldingvarieties of rice. Thus, yield growth contributed somewhat more than half of the increase inoutput over this time, while increased cropping intensity accounted for the remainder. 2.2.3. Geographic patterns
The Mekong River Delta in the south and the Red River Delta in the north are the "ricebaskets" of the country, accounting for 51 and 18 percent of total production (see Table 2.3). The importance of the rice production in these two delta does not stem from their overall size:they represent barely 15 percent of the national territory. Rather it is due to the fact that, asriver deltas, over half of their area can be farmed and over three quarters of their agricultural

Cultivated rice area refers to land which has rice during at least one cropping season during3
the year. Sown rice area refers to the sum of areas planted with rice over the differentcropping seasons.
14
land is used for rice production. Thus, these two regions account for 60 percent of thecultivated rice area and 63 percent of the sown rice area in Viet Nam. In addition, better water3
control in these two regions allows yields of over 4 tons of paddy per hectare, compared to anaverage of less than 3.5 tons/ha in the rest of the country. Between the two, the Red River Delta is more intensively cultivated in terms of croppingintensity, the degree of specialization in rice, and average yield. Nonetheless, the MekongRiver Delta accounts for a much larger share of national rice production because its cultivatedrice area is over three times that of the Red River Delta.
The Northern Uplands and the Central Highlands are both rice deficit regions, importing ricefrom the deltas. The yields and cropping intensity are lower, largely because irrigation is lessprevalent. Upland rice production (including “slash and burn” cultivation) is practiced on arelatively large area of the remote parts of these regions, but production is limited.
The North and South Central Coast are also rice deficit regions. Irrigated rice production takesplace in the small river valleys along the coast, while less intensive production occurs in themountainous areas away from the coast. The Southeast produces rice, but crop mix is morediversified than in other regions due to the demand for fruits, vegetables, and other specialtycrops by Ho Chi Minh City.
2.2.4. Seasonal patterns
The concept of crop seasons is somewhat artificial since rice is harvested somewhere in VietNam every month of the year. Nonetheless, the Ministry of Agriculture and Rural Development(MARD) classify production into three growing seasons.
Since most of the rain falls in the second half of the year, the winter-spring season is the dryseason. In the Mekong River Delta, the winter-spring crop is planted in November-Decemberand harvested in February-March. In the Red River Delta, the winter-spring crop is planted inFebruary and harvested in May-June. In both areas, the winter-spring rice crop is often part ofa double-rice cropping rotation.
In the Mekong River Delta, the summer-autumn rice crop is planted in April-May and harvestedin August-September. Rice is generally not grown during this season in the Red River Delta,the North Mountain and Midlands, and in the Central Highlands.
The rainy season (or monsoon) rice crop is planted in June-July and harvested in October-January. Almost all rainfed rice production occurs during this season. With irrigation,however, a rainy season crop can be part of a double-rice cropping system, as is commonlydone in the Red River Delta.

This is based on 1995 output of 12.8 million tons of paddy, a milling ratio of 66 percent, and4
estimated losses of 14.5 percent.
Much of the description of rice marketing channels is based on a national survey carried out5
by the International Food Policy Research Institute in 1995-96. The sample included 850farmers, 853 millers, 850 traders, and 30 state-owned enterprises.
15
2.2.5. Marketing channels
Throughout the country, the paddy harvest is accomplished by hand, using a sickle. Threshingmay be done by manual rotating threshers or (particularly in the south) threshing machines thatare brought to the fields. Typically farmers dry paddy under the sun on flat surfaces such asfarm yards or roadsides, using cement and brick yards, plastic sheets, or bamboo mats.
Much of the paddy never enters the marketing system. Farmers pay small mills to convert theirharvest into rice to be stored and consumed at home. The proportion retained for ownconsumption varies from more than two thirds in the rice deficit areas to just one quarter in theMekong River Delta.
The channels by which rice moves from the farmer to the consumer are complex and varyaccording to region. A survey of rice farmers, traders, millers, and state-owned enterprisescarried out by the International Food Policy Research Institute sheds some light on thesepatterns (IFPRI, 1996). Because the two deltas account for almost 70 percent of Vietnameserice production, the focus of our description is on these two regions.
The marketing system in the Mekong River Delta handles an enormous volume of rice. Mekong farmers produce about 7.1 million tons of rice , of which an estimated 5.1 million tons4
pass through the marketing system. As in other regions, over 96 percent of the farmers reportselling to a private assembler . Two-third of the volume handled by assemblers is sold in5
paddy form to millers, predominantly medium and large millers. Over half of the sales of ricemillers goes to state-owned enterprises (SOEs) who, in turn, export rice and ship it to thedeficit regions within Viet Nam. Although this assembler-miller-SOE route is the mostimportant marketing channel, no more than one third of all marketed rice follows this path. Assemblers also have paddy milled on a contract basis and sell rice to wholesalers and, to alesser extent, state-owned enterprises and retailers. Millers also sell rice to wholesalers whosupply other wholesalers (including those in other regions), state-owned enterprises, andretailers.
In the Red River Delta, the marketing channels are somewhat different. As in the MekongDelta, farmers sell the vast majority of their surplus to private traders. But unlike their Mekongcounterparts, assemblers in the Red River Delta generally have the paddy milled into rice on acontract basis before selling the rice to wholesalers. Over 90 percent of assembler sales arein the form of rice rather than paddy. Almost two thirds of the rice sold by wholesalers goes toother wholesalers. Much of this trade may be from rural wholesalers to their counterparts inHanoi. Wholesalers also sell rice to retailers, who in turn sell to consumers. Unlike in the

16
Mekong River Delta, neither assemblers nor millers nor wholesalers report significant sales tostate-owned enterprises.
In the other five regions of Viet Nam, the most distinctive aspect of the rice marketing systemis large inflows of rice. Production is about 4.2 million tons of rice, but consumption is roughly6.3 million tons, implying an inflow of over 2 million tons. As in the Red River Delta,assemblers buy paddy from farmers have it milled on a contract basis. About two-thirds ofassemblers' rice sales go to wholesalers, who in turn sell it to other wholesalers and toretailers. The flows of locally produced rice are supplemented by inflows from the MekongDelta and, to a much smaller extent, from the Red River Delta. Part of the inter-regional tradeis carried out by state-owned enterprises. However, the infrequency with which traders reportpurchases from state-owned enterprises indicates that a significant proportion of this trade isundertaken by wholesalers.
2.3. RICE MILLING INDUSTRY
2.3.1. Technical aspects of rice milling
Harvested paddy consists of the rice grain, germ, and bran, covered with a shell or hull. Itsmoisture content is generally 18-25 percent. Broadly defined, rice milling consists of fivesteps: drying, cleaning, removing the hull, removing the bran layers, polishing, and sizing. Each step is described as follows:
C Paddy is dried to 12-14 percent to avoid deterioration and improve milling efficiency. This may be accomplished by spreading the paddy out in the sun, by using amechanical drier, or by some combination of the two.
C Cleaning to remove stones, dirt, and other foreign material serves to increase the valueof the final product and avoid damage to milling equipment. This is accomplished witha variety of vibrating screens that separate by size and density.
C The rice hull can be removed by hand pounding, but more commonly it is accomplishedwith a hulling (or shelling) machine. These machines use rotating disks, steel rollers, orrubber rollers to separate the hull and part of the germ.
C The next step is milling (narrowly defined), which is removing the outer bran layersusing machines that create abrasion. The degree of milling is variable. Less milled ricehas more bran, making it more nutritious. At the same time, less milled rice is chewier,darker, takes longer to cook, and has a shorter shelf-life. As a result, white rice isgenerally preferred by consumers. The conversion ratio between paddy and riceranges 60 to 70 percent if we include broken grains, or 40 to 62 percent of whole grains(Brown, 1991).
C Polishing is the removal of the innermost layer of bran (also called polish). This stageis optional, depending on consumer preferences and willingness to pay for whiter rice.
C Grains may be separated according to size using two machines. Rough sizing can bedone with vibrating screens with different sized holes, similar to those used for other

It is likely that this is an underestimate of the number of rice mills in the country. The 19946
Agricultural Census collected information on agricultural machinery owned by rural householdsand counted 106,000 rice mills. Presumably, this estimate excludes the larger state andprivate rice mills.
In the extreme, if all rice were processed by two mills, then the average throughput of rice7
mills would be twice the ratio of rice production to rice mills.
17
grains. Finer sizing can be done with screens with thousands of small indentations topick up individual kernels. As the screen is tilted to become vertical, the longest grainsare the first to fall out.
Not all rice mills carry out all of these processing activities. Smaller mills usually focus oneither shelling or milling (bran removal). Medium-size mills may clean, shell, and mill, but donot polish or grade by size. Only the largest mills typically perform all of these tasks.
2.3.2. Structure of the rice milling sector
Vietnamese statistics on the number of mills include everything from large miller-polishers thatproduce export quality rice to small shellers that can be moved from one field to another. Thenumber of rice mills (under this broad definition) has grown rapidly over the last ten years, fromless than 16 thousand in 1985 to almost 80 thousand in 1995, as shown in Table 2.5 . This6
represents a 17.7 percent annual growth rate. The growth rate was relatively slow (7.3percent) from 1985 to 1989, but following trade liberalization and exchange rate depreciation in1989, the growth in rice mills accelerated to 25 percent.
The growth in the number of rice mills exceeds the growth in rice production, which was 4.6percent annually over the same period. In other words, the ratio of rice production to rice millshas actually declined from 562 to 173 tons/mill. At the same time, we know that the dramaticexpansion of rice production and exports in Viet Nam has stimulated investment to modernizethe rice milling sector and build new large-scale rice mills, particularly in the Mekong Delta.
Two explanations can be offered for these apparently contradictory trends. First, the rapidgrowth in the number of rice mills is primarily outside of the Mekong Delta. In the MekongDelta, the number of rice mills grew just 3.1 percent per year, while rice production in thisregion expanded at 6.4 percent annually over the same period. In other words, the volume ofrice per rice mill has increased in the Mekong Delta, as large mills have been installed toprocess rice for export. The other regions have seen a proliferation of privately-owned mini-rice mills (including shellers), which are eroding the market share of larger state-owned ricemills.
The second explanation is that there is a trend toward the use of mini-rice mills located nearthe production zones to carry out rough processing, removing the hull and some of the bran. The brown rice is then transported to the cities and towns where large-scale rice mills processthe rice further, either for local consumption or for export. Since two mills process the samerice under this system, the implication is that the ratio of rice production to rice millsunderestimates the average throughput of rice mills . 7

18
The geographic distribution of rice mills, shown in Table 2.6, highlights the differences in therice milling sector across regions. If we assume that the proportion of rice milled by two mills isthe same across regions, then the average size of rice mills in the Mekong River Delta isapproximately ten times the average size of rice mills in other regions. This is a reflection ofthe importance of the rice export market in the Mekong River Delta which requires moresophisticated milling equipment.
Rice mills can be classified by size. Small mills handle less than 1 ton/day. They are almostalways privately-owned and located in rural areas near production zones. Typically, these millsremove the husk and part of the bran, but do not have facilities for cleaning, drying, sizing, orpolishing. Medium mills process 1-10 tons/day. Many of these are privately owned and someare managed by local authorities. They are generally able to mill and may have equipment tocarry out other tasks. Large mills have capacities of over 10 tons/day. These mills are likely tohave a wider range of equipment for drying, cleaning, milling, and sizing. In addition, there arespecialized polishers that reprocessed milled rice for export. Finally, a few of the largestmillers are miller-polishers, able to process paddy into export-quality rice.
In the Mekong River Delta, there are at least 68 rice mills operated by central and provincialstate-owned enterprises. Most of these mills are large, with capacities of 30 tons/day or more. These mills are usually fully integrated, carrying out the full range of processing activities fromshelling to polishing. In addition, there are 112 rice mills managed by district authorities. These mills tend to be smaller than the central and provincial mills, and only some of themhave polishing equipment (IFPRI, 1996, p. 362).
The privately owned rice mills in the Mekong Delta probably number around 6000. Almost allof these are small mills. They generally produce rice for domestic consumption, although anincreasing number are supplying brown rice or roughly milled white rice to large millers thatreprocess for export. There is also a small but growing number of medium and large privaterice millers.
In the Red River Delta, there are 22 large rice millers with capacities of over 15 tons/day. Thefour largest of these can process 60 tons/day. Another 57 rice mills have capacities of around5 tons/day, making them medium-sized (IFPRI, 1996, p 361). As shown in Table 2.6, there arearound 20 thousand mills owned by Red River Delta households, almost all of which arepresumably small mills. Most of the large and medium rice mills are managed by state-ownedenterprises, while almost all of the small mills are privately owned.
Furthermore, the number of rice mills continues to expand. For example, in February andMarch of this year, the Sinco Machinery Company of Ho Chi Minh City signed 19 contracts tosupply rice milling machines for companies in the south. The owner had thought that thedemand for rice mills was saturated, but the recent increase in the pace of rice production andexports stimulated more investment (Saigon Daily Times, 26 March 1998).

The 1992-93 Viet Nam Living Standards Survey, with a sample of 4800 households, found a8
similar figure: 156 kg per capita.
19
2.4. RICE CONSUMPTION
2.4.1. Domestic demand for rice
Virtually every Vietnamese household consumes rice. According to the 1994 HouseholdSurvey covering 91,000 households, the average consumption was 153 kg of rice per capita . 8
This is equivalent to 11.8 million tons of total rice consumption or roughly 70 percent of the1997 rice harvest.
As shown in Table 2.6, rice consumption patterns vary according to both income level andregion. Across income groups, rice consumption tends to rise initially and then decline. Partof this pattern is due to the fact that urban household eat less rice than rural ones do, and thehigher income groups contain more urban households than lower income groups. However,even within urban and rural areas, this pattern can be found.
Across regions, rice consumption also varies. Per capita rice consumption is above 160 kg inthe Red River Delta and the Northern Uplands, compared to just 133 in the Southeast. Thelow level of rice consumption in the Southeast is presumably due to the large urban populationwith relatively high incomes in Ho Chi Minh City. The two delta regions together account foralmost 44 percent of total rice demand in Viet Nam.
A rough idea of the historical trends can be obtained by calculating apparent rice consumption,defined as production (adjusted for milling and losses) minus exports divided by thepopulation. This is an approximate measure because it does not take into account changes instocks, smuggling, and changes in milling efficiency. Table 2.8 reveals that apparent riceconsumption was around 145 kg per capita in the late 1980s. When rice exports first began in1989-1990, apparent rice consumption fell to around 135 kg per capita. Since then, apparentrice consumption has risen steadily, surpassing 170 kg per capita in recent years. Theimplication is that, except for the first two years, Viet Nam’s dramatic appearance on worldmarkets as a leading rice exporter has not occurred at the expense of domestic consumers. Infact, consumers have benefits from the rapid rate of growth in rice production facilitated by theliberalization of agricultural and export markets.
2.4.2. Rice export markets
World rice production has grown at an average rate of 2.7 percent per year since 1961,surpassing 500 million tons of paddy in the early 1990s. Most of this expansion has been theresult of yield growth of around 2 percent per year. In recent years (since 1990), productionand yield growth have slowed somewhat, but the growth in the traded volume has increased. This is partly due to supply factors, namely the emergence of India and Viet Nam as major riceexporters. In addition, demand factors have played a role, as countries such as Indonesia andthe Philippines have largely abandoned their attempts to achieve rice self-sufficiency throughimport controls. As a result of these trends, the traded volume of rice has recently risen from12 million tons in 1990 to over 20 million tons in recent years. The largest exporters are

20
Thailand, Viet Nam, the United States, India, Pakistan, and Burma. These six countriesaccount for over 80 percent of the exported volumes of rice on the world market.
Thailand exports around 5 million tons of rice annually, giving it a 20-25 percent share in worldrice trade. The marketing and milling industry in Thailand is very sophisticated and responsive,allowing it to compete with the United States for the long-grain high-quality market and withIndia and Viet Nam in the lower-quality markets.
After several years as the third largest exporter, Viet Nam became the second largest exporterin 1997. Although it was considered a low-quality and an unreliable exporter in the early1990s, investments in milling and infrastructure, along with increased experience in dealingwith importers, have improve both quality and reliability. Nonetheless, remaining problemscontribute to a discount for Vietnamese rice compared to similar grades of Thai rice.
The United States is often the second largest exporter, serving the high-quality end of themarket. It has a reputation both for very high quality control and flexibility in the grade, variety,and packaging. These attributes give rice from the United States a US$ 30-50 premium overthe same grade of rice from Thailand.
India was for many years a food deficit country, exporting only small quantities of high-valuearomatic rice such as Basmati. In 1995, after a series of good harvests during which thegovernment accumulated stocks, India suddenly exported to 3.0 million tons. It is expected toremain among the world’s leading exporters for some years, although the quality of its exportsis low.
Pakistan exports both long-grained high-value aromatic rice to the Middle East and medium-grain rice to south and southeast Asia. The rice sector in Burma is less developed than in VietNam, so it tends to supply low-quality rice to the world market.
Importers are usually divided into consistent importers and occasional importers. Consistentimporters include the Middle East, Latin America (particularly Brazil, Peru, Cuba, and Mexico),Europe, Africa (particularly Senegal, Cote d’Ivoire, and Nigeria), and parts of Asia (Hong Kongand Malaysia).
Occasional importers enter the markets when there are shortfalls in domestic production. These include Indonesia, the Philippines, and China. The occasional demand for imports bythese countries is a major source of price instability in world rice markets.
Importers can also be distinguished according to the types of rice that they tend to import,based on preferences and purchasing power. For example, Canada, Western Europe, SaudiArabia, and South Africa generally import high-quality long-grain rice. Latin America, theCaribbean, and the rest of the Middle-East are more price-sensitive, switching between high-and medium-quality depending on prices and domestic conditions.
Perhaps the most distinctive characteristics of world rice markets is that it is unstable in thesense that the volumes and directions of flows vary from year to year. Rice prices also tend tobe somewhat more volatile than the prices of other grains. There are several reasons for this.

21
C First, 90 percent of rice production is in Asia, so that weather-related supply shockstend to be positively correlated across rice producing countries. In other words, a poorrice harvest in Thailand is likely to coincide with a poor harvest in Viet Nam,exacerbating the shortfall.
C Second, only a small percentage (4-5 percent) of world rice production is traded. Thus,a small percentage change in production can result in a large percentage change intraded volume. Combined with “friction” in international trade, this contributes toinstability in world prices.
C Third, because of the importance of rice as a basic staple, Asian governments havetraditionally tended to shield domestic consumers and producers from internationalprice fluctuations. By making traded volumes less sensitive to price changes, policiesto stabilize internal prices have the unintended effect of exacerbating international priceinstability. The General Agreement on Trade and Tariffs (GATT) and the trend towardless interventionist trade policies have reduced this third effect, but it still plays a role inworld rice markets.
This instability in rice flows is reflecting in the list of major importers of Vietnamese rice. Table2.9 shows the largest buyers of rice from Viet Nam in 1995, but the list changes every year. Infact, nine different countries have appeared among the top four importers over the four yearperiod 1992-95. This fact highlights the dynamic nature of world rice markets and theimportance of closely monitoring changes in international markets and responding quickly tothose trends.
2.5. PROSPECTS AND POLICY ISSUES
2.5.1. Prospects for production growth
According to most of the standard methods for forecasting production, Viet Nam must bereaching its capacity in terms of rice production. Over half of all the agricultural land and thevast majority of irrigated land in Viet Nam is cultivated with rice. The area available for riceproduction is shrinking in the Red River Delta due to urbanization and agriculturaldiversification. In the Mekong Delta, the area for expansion is considered very limited. Furthermore, the cropping intensity in the two deltas is already high: 1.8 in the Red River Deltaand 1.6 in the Mekong Delta. Finally, yields are higher than in any other major rice producingdeveloping country, with the exception of China.
Before accepting this pessimism, it is important to recognize that a number of internationalorganizations have expressed doubts about the potential for further growth in rice production,only to be contradicted by continued expansion. A 1993 World Bank study examined trends inproduction, consumption, and world prices, concluding that exports would reach 1.4 milliontons in 1997 and would then slip to 1.1 million tons in 2000 (World Bank, 1993). Similarly, ananalyst at the United State Department of Agriculture prepared a report in 1995 suggestingthat production constraints and growing local demand would prevent export growth beyondthen-current levels of 2 million tons (Valdecanas, 1995). Finally, researchers from theInternational Rice Research Institute published a paper identifying various productionconstraints, concluding that exports above 2.0 million tons would be difficult to achieve (Pingali

22
et al, 1998). In fact, exports reached 3.6 million tons in 1997 and appear likely to attain asimilar level in 1998.
On the demand side, these studies have overestimated the growth in demand by notrecognizing the slowing of population growth and the fact that per capita demand is reaching asaturation point, as discussed below. On the supply side, Viet Nam has surpassed theexpectations of most observers primarily in yield growth. Yield growth is accounting for anincreasing share of the overall rice production growth. For example, since 1995 yield growthhas accounted for over 80 percent of the increase in output, compared to 62 percent for theperiod 1985-1995 (see Table 2.2). The critical role of yield growth in maintaining riceproduction growth highlights the key role of agricultural research and extension in the ricesector.
2.5.2. Prospects for domestic rice markets
The prospects for continued growth depend, in part, on changes in the domestic demand. Since 70-75 percent of the demand for Vietnamese rice is from Vietnamese consumers, evensmall changes in the domestic demand can have relatively large effects on the exportablesurplus.
The most important determinants of long-term changes in rice demand are population growth,urbanization, and income growth. The trends in each of these variables and its likely impacton rice demand is discussed below.
C With regard to population growth, projections by the World Bank and the UnitedNations indicate that the population growth rate will fall to between 1.2 and 1.6 percentfor the period 2005-2010 and 1.2 percent for 2015-2020.
C Econometric analysis of household budget data from the Viet Nam Living StandardsSurvey indicate that the income elasticity of rice demand is approximately 0.35,implying that per capita rice demand should rise at one third the rate of per capitaincome, other things being equal. Based on the consumption trends discussed earlier,we can expect per capita rice consumption to continue rising slowly for a number ofyears, to stabilize, and then eventually to decline with further increases in income. Thispattern is not unique to Viet Nam. Countries such as Japan, South Korea, and Taiwanhave already reached the point where rice consumption has declined substantially. Forexample, per capita rice consumption in Japan peaked at 141 kg in the 1930s and haddeclined to 71 kg by 1988 (Tsutsumi, 1991).
C Urbanization tends to reduce per capita rice demand since urban households tend tohave more diversified diets, consuming less rice than rural households. Huang andDavid (1993) argue that urbanization is a major factor in the decline in per capita riceconsumption in Asia. Nonetheless, the impact of urbanization on rice demand in VietNam has probably not been very large. Although per capita rice consumption is lowerin Vietnamese cities than in the rural areas, the increase in the share of the populationliving in urban areas has been relatively slow.

23
As a result of trends in all three of these factors, we can expect the growth in rice demand toslow and possibly stabilize over the coming decade. Since apparent rice consumption isalready over 170 kg per capita, one of the highest levels in the world, we expect per capitademand to peak within the next 5-10 years.
2.5.3. Prospects for rice export markets
In the short term, the biggest factors affecting Viet Nam’s rice export markets are 1) the Asiancurrency crisis and the devaluation of the Thai baht in particular and 2) the weather effects ofEl Nino. The devaluation of the baht should, other things being equal, have a dampeningeffect on world rice prices. In theory, the devaluation means that Thai farmers get a higherbaht return for each ton of rice they export, encouraging them to expand production andexports which puts downward pressure on world rice prices. In fact, the baht price of rice inThailand rose 27 percent between 1996 and 1997. Thai export volume, however, grew by only2 percent, so the effect on world prices has been negligible. Given the lags in agriculturalsupply response, it is possible that the full effect of the devaluation has not yet taken place.
Any effect of devaluation on rice prices has been more than offset by El Nino, which hasadversely affected Indonesian rice harvests. The resulting shortfall is being met through riceimports, putting upward pressure on world rice prices.
A number of trends will affect Viet Nam’s rice export markets in the longer run. First, under theGeneral Agreement on Tariffs and Trade (GATT), Korea and Japan are obliged to beginopening their rice markets. Both countries have had self-sufficiency policies that involvedessentially banning rice imports and maintaining domestic prices far above international prices. The most immediate beneficiaries will be the United States and Thailand, because they are theonly countries that can meet the quality requirements of consumers in these countries. Because the schedule for opening their rice markets is quite gradual, Viet Nam may have timeto upgrade its processing and milling capacity to meet this demand. Even if it does not,however, Viet Nam should benefit indirectly because of the overall increase in rice demand.
Normalization of the international trade of Iraq would also benefit Viet Nam. Viet Nam hasexported to Iraq through government-to-government contracts under the United Nationssponsored food-for-oil program. Further normalization would create a new large market forVietnamese rice.
Another trend with consequence for Viet Nam is the growth in rice demand within the UnitedStates associated with the image of rice as healthier than many substitute foods. Risingdemand for rice within the United States erodes its ability to export. Since the United Statesonly exports high-quality rice, the main beneficiary of this trend is Thailand, but Viet Nam andother rice exporters benefit indirectly.
2.5.4. Quality issues
Rice quality is a function of several variables. Perhaps the most important factor is thepercentage of broken rice grains. Rice that is 5 or 10 percent broken is considered highquality, while 35 percent broken is poor quality. In addition, the length of the grain is important. Long-grained rice is considered preferable in most countries. The aroma and color are

24
considered important quality criteria, with highly aromatic varieties such as basmaticommanding a premium.
As a result of investments in rice milling, including a rapid expansion of the private millingsector, the quality of Vietnamese rice exports has improved dramatically. The proportion ofhigh quality rice (10 percent broken or less) has risen from less than 2 percent in 1989 to 55percent in 1995. Over the same period, the proportion of low quality rice (35 percent broken ormore) has fallen from 88 percent to less than 4 percent (IFPRI, 1996, p. 241).
Further improvement is possible, however. The 100% B grade exported by Thailand is 100percent whole grain or 0 percent broken. Achieving this level of quality economically wouldrequire varietal purity, more even drying, and improved milling. Varietal purity refers to havingan entire batch of rice of the same variety, a standard that is difficult to achieve when millersare receiving rice from numerous small farmers.
In addition, broken percentage is not the only quality criteria. For example, only a handful ofthe largest rice mills in Viet Nam have color sorters that would allow exporters to ensure thatoff-color rice grains are excluded. Similarly, machinery to sort rice by size is not common inVietnamese mills. It is important to recognize that the constraint is not just having moremodern machinery. For example, to become a major exporter of long-grained rice, it would benecessary to make complementary investments in agricultural research to select appropriatelong-grain varieties for local conditions and improve the grading system. The current gradingsystem in Viet Nam only distinguishes between rice of different broken percentage. Contractsbetween importers and exporters often specify other quality characteristics, but without a well-defined and administered grading system to codify these characteristics, enforcement isdifficult. In contrast, the Thai grading system distinguishes incorporates grain length, brokenpercentage, and other quality characteristics.
2.5.5. Size of the export quota
Rice exports have been controlled by a quota system since Viet Nam began exporting rice. The concern was that excessive exports would leave the country with insufficient supplies tomeet domestic demand. In a well-functioning market, this would be avoided automaticallysince domestic shortfalls would push up the domestic price and eventually eliminate theprofitability of exports. Nonetheless, policymakers were unfamiliar with market mechanismsand, perhaps correctly, suspected that the market might not function smoothly initially.
The rice export quota remained in the range of 1.5 to 2.0 million tons in the early 1990s. However, the quota policy came under criticism for reducing the farm-gate prices of ricegrowers. A study by the International Food Policy Research Institute (1996) estimated that in1995, the export quota was equivalent to a 23 percent tax on exports. The results, firstpresented in October 1995, suggested that the food security impact of quota removal would beneutral or mildly positive, since 90 percent of the poor live in rural areas and many of thesewould benefit from higher paddy prices. Change in the quota policy was further catalyzed byconcern over the low level of Mekong paddy prices. The quota was raised to 3.1 million tons in1996, 3.5 million tons in 1997, and 4.0 million tons in 1998. Some market observers believethat Viet Nam will not be able to export 4.0 million tons this year, implying that the export quotais non-binding.

25
A binding export quota has two adverse effects. One is to reduce the price that farmers get fortheir rice. Although there are some benefits for consumers, particularly those in urban areas,the costs to farmers exceed the benefits to consumers (IFPRI, 1996). The other is to restrictcompetition in the export sector. State enterprises, which may or may not be the most efficientor experienced exporters, are guaranteed a portion of the rice export business.
2.5.6. Allocation of export quotas
Another aspect of export policy is the allocation of the export quotas. In 1989-90, any state-owned enterprise could export provided certain procedures were followed. Inexperience withinternational trade led some of them to sign disadvantageous contracts with low prices, someof which were abrogated by government or SOE decision. This gave Viet Nam a reputation asan unreliable exporter, a reputation which lingers today to a lesser extent. This experiencealso convinced the government that excessive competition among exporters resulted in lowerexport prices. In response to this perceived problem, the government allocated the bulk of theexport quota to VINAFOOD 2, the general food corporation in the south. In 1997 and 1998,this policy was reversed, allocating a majority of the export quota to rice surplus provinces inthe Mekong Delta. Table 2.10 shows the allocation of 3.6 million tons of export quota for thefirst nine months of 1998.
Fears that a large number of exporters will reduce the FOB export price appear to bemistaken. If exporters contract to sell rice at a low price, it is the result of inexperience and notan excessive number of exporters. Furthermore, the losses they make from such transactionswill be a strong incentive to avoid them in the future.
2.5.7. Role of state-owned enterprises
Since Viet Nam began to export in 1989, only state-owned enterprises have been allowed toexport rice. When the quota is binding (as has generally been the case), the quotas arevaluable and the SOEs have been the favored beneficiaries. For example, the IFPRI studyestimated that, in 1995, the quotas may have been worth US$ 64 per ton. Even when thequota is not binding (as may be the case in 1998), the reservation of a portion of the exportbusiness for these enterprises constitutes a restriction on the degree of competition amongexporters. This restriction is likely to reduce the prices that farmers receive for their rice.
The SOE monopoly on rice exports is defended by arguing that the private millers are toosmall and too inexperienced to be able to export. Allowing them to export, the argument goes,would reduce the export price received by the country and damage the countries reputation forreliability and quality. However, the state-owned enterprises have experienced some of thesesame problems. In 1989, when Viet Nam was first entering the world markets, a number ofSOEs made unprofitable contracts and/or abrogated contracts. Furthermore, the expansion inthe number of provincial SOEs authorized to export resulted in a number of inexperiencedSOEs losing money on contracts by offering a price too low.
Many private millers are indeed too small to participate in exports, but a number of privatemillers are large and have developed contacts among importers. In many cases, they arrangethe export contract with the importer and the SOE is only brought in as the “formal” exporter.
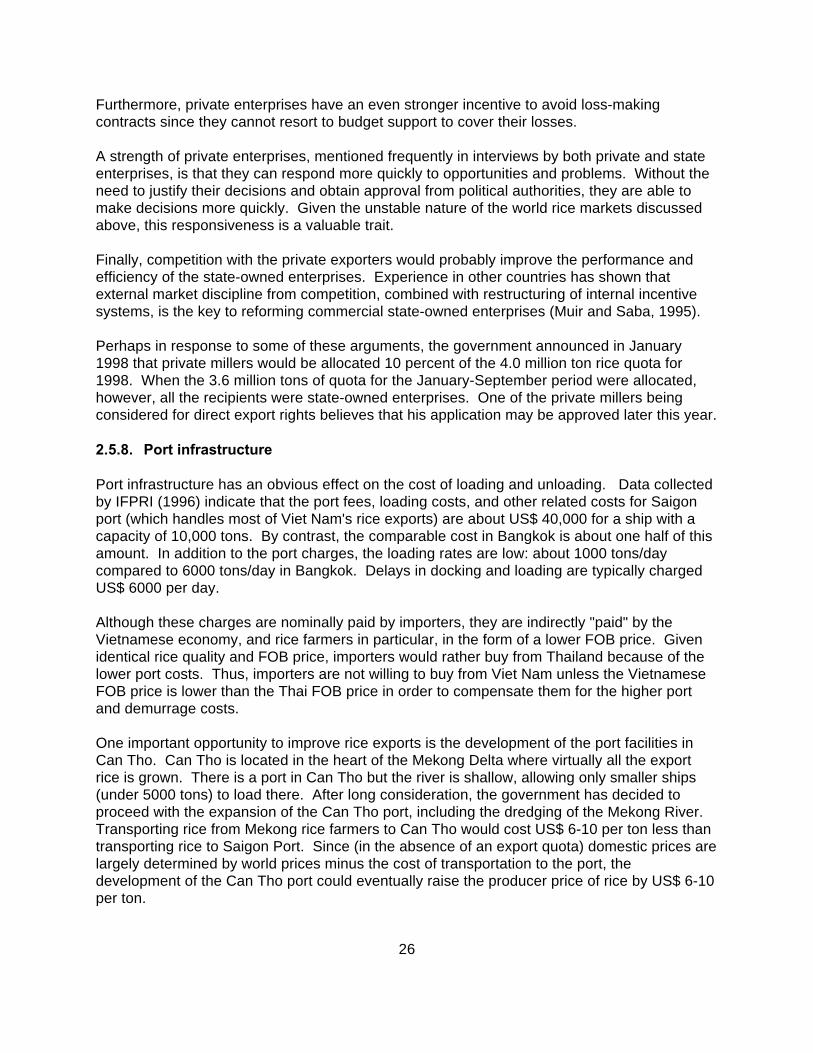
26
Furthermore, private enterprises have an even stronger incentive to avoid loss-makingcontracts since they cannot resort to budget support to cover their losses.
A strength of private enterprises, mentioned frequently in interviews by both private and stateenterprises, is that they can respond more quickly to opportunities and problems. Without theneed to justify their decisions and obtain approval from political authorities, they are able tomake decisions more quickly. Given the unstable nature of the world rice markets discussedabove, this responsiveness is a valuable trait.
Finally, competition with the private exporters would probably improve the performance andefficiency of the state-owned enterprises. Experience in other countries has shown thatexternal market discipline from competition, combined with restructuring of internal incentivesystems, is the key to reforming commercial state-owned enterprises (Muir and Saba, 1995).
Perhaps in response to some of these arguments, the government announced in January1998 that private millers would be allocated 10 percent of the 4.0 million ton rice quota for1998. When the 3.6 million tons of quota for the January-September period were allocated,however, all the recipients were state-owned enterprises. One of the private millers beingconsidered for direct export rights believes that his application may be approved later this year.
2.5.8. Port infrastructure
Port infrastructure has an obvious effect on the cost of loading and unloading. Data collectedby IFPRI (1996) indicate that the port fees, loading costs, and other related costs for Saigonport (which handles most of Viet Nam's rice exports) are about US$ 40,000 for a ship with acapacity of 10,000 tons. By contrast, the comparable cost in Bangkok is about one half of thisamount. In addition to the port charges, the loading rates are low: about 1000 tons/daycompared to 6000 tons/day in Bangkok. Delays in docking and loading are typically chargedUS$ 6000 per day.
Although these charges are nominally paid by importers, they are indirectly "paid" by theVietnamese economy, and rice farmers in particular, in the form of a lower FOB price. Givenidentical rice quality and FOB price, importers would rather buy from Thailand because of thelower port costs. Thus, importers are not willing to buy from Viet Nam unless the VietnameseFOB price is lower than the Thai FOB price in order to compensate them for the higher portand demurrage costs.
One important opportunity to improve rice exports is the development of the port facilities inCan Tho. Can Tho is located in the heart of the Mekong Delta where virtually all the exportrice is grown. There is a port in Can Tho but the river is shallow, allowing only smaller ships(under 5000 tons) to load there. After long consideration, the government has decided toproceed with the expansion of the Can Tho port, including the dredging of the Mekong River. Transporting rice from Mekong rice farmers to Can Tho would cost US$ 6-10 per ton less thantransporting rice to Saigon Port. Since (in the absence of an export quota) domestic prices arelargely determined by world prices minus the cost of transportation to the port, thedevelopment of the Can Tho port could eventually raise the producer price of rice by US$ 6-10per ton.

27
2.5.9. Market coordination
In early 1998, the Ministry of Trade announced that it was developing plans to create a RiceExport Transaction Center. According to the Viet Nam News (17 March 1998), the Center will:
be in charge of promoting and signing rice export contracts between Vietnamese andoverseas enterprises... be responsible for guaranteeing fair competition between riceexporters... will organize rice export transactions in the form of bidding and allowselected rice exporters to sign specific contracts with foreign customers.
It is difficult to evaluate the plan without having more details, but the proposal is much lessinnocuous that it may appear. The concept of a central clearinghouse for rice transactionssounds reasonable and the description of bidding and a “trading floor” sounds modern. However, it is worrisome that, unlike a commodity trading board, it does not appear to bevoluntary. Importers and exporters would be obliged to use the center whether or not it wasfound to be useful. The fact that the center would “allow selected rice exporters to signspecific contracts” implies that the center would not just facilitate contracts but actually approvethem. This could be cumbersome at best and an invitation to irregular transactions at worst.
The concept of a commodity market with anonymous buyers and sellers works only when thequality of the product can be very precisely defined and the contracts are easily enforceable. Under these circumstances, buyers and sellers do not need to worry about the capacity orreputation of the other party; only the price and the terms of the contract matter. Ricecommodity markets have never developed in the United States or elsewhere largely becauserice is too heterogeneous. In Viet Nam, the additional problem of enforcing contracts meansthat the reputation of the exporter is even more important. In rice markets, importers havegood reason to care who they are buying from and are not likely to accept a system in whichtheir suppliers are selected by government officials.
On the other hand, there is a need for a more transparent system for rice exports. Under thecurrent system, market participants (including the government) do not know the volumes thathave been committed for export until they are loaded on the ship. This makes it difficult for thegovernment and market participants to know the pace of exports commitments. To deal withthis problem, the United States Department of Agriculture publishes an agricultural exportreport which provides a weekly accounting of export commitments. All exporters are obliged toreport on a weekly basis the volumes contracted and are entitled to receive a copy of thepublication. By improving the flow of information, such a publication can make the marketfunction more smoothly and allow the government to make policy on the basis of betterinformation.
2.5.10. Effect of trade liberalization
Trade liberalization under the ASEAN Free Trade Agreement (AFTA) will almost certainly havea positive effect on the Vietnamese rice sector, including the rice milling industry. Significantimports of rice are impossible because of the strong comparative advantage of Viet Nam inrice. At the same time, the AFTA, to the extent that opens the doors of neighboring southeastAsian nations to Vietnamese rice, should benefit the sector. In particular, AFTA will make itmore difficult for importers such as Indonesia, Malaysia, and the Philippines to restrict

Devaluation refers to a government decision to increase the value of foreign currency in9
terms of local currency, when the rate is fixed by the government. Depreciation refers to amarket-driven increase in the value of foreign currency in terms of local currency, when theexchange rate is determined by market forces.
28
Vietnamese rice imports. Their interest in doing so is based on the idea that they can developtheir rice production sector by protecting it from competition for lower-cost producers such asViet Nam.
Because rice milling is a bulk-reducing process, transportation costs are minimized by locatingprocessing facilities as close to production zones as possible. Unlike some manufacturingprocesses, where different stages of production can be located in different countries, ricemilling must be located in or very near the production zones. As a result, there is no risk ofAFTA resulting in the loss of rice milling competitiveness.
In the longer run, the reduction in import barriers to rice trade under AFTA and the GATT willalso have the effect of reducing the volatility of rice prices. As mentioned earlier, whencountries use trade policy to stabilize domestic prices relative to international prices, theyprevent the price signals from reaching domestic consumers and producers. As a result, thoseproducers and consumers do not respond as fully to price changes, making exports from orimports to that country less responsive than it would be under freer trade. The cumulativeeffect of making traded volumes less responsive to price changes is that larger price changesare needed to adjust to a given shock. For example, the increase in Indonesian demand dueto El Nino would result in a larger price increase if other countries do not allow the full priceincrease to be transmitted to their domestic producers and consumers.
2.5.11. Effect of the exchange rate
The exchange rate and export policy probably have a larger effect on the returns to riceproduction and processing than does AFTA. Even though most rice is marketed domestically,the price of rice (particularly in the south) is determined by the world price of rice and theamount that the government allows to be exported. The effect of devaluation (ordepreciation ) of the Vietnamese dong on the rice milling industry depends on the rice export9
policy.
C If a binding quota is in place, then devaluation would have little effect on rice farmersand rice millers. Devaluation would, however, widen the gap between the world priceof rice and the domestic price of rice, making the value of the quota higher and creatingwindfall profits for those companies who hold quota rights. It would also increase theincentives for smuggling rice out of the country.
C If a binding quota were not in place, then a devaluation of the dong would raise thedong price of rice within the country, thus stimulating rice supply and suppressing ricedemand. The combined effect would be to increase the exportable surplus in the nextcrop cycle. The rice milling industry would benefit from an increase in throughput as aresult of the policy. This benefit would be partially offset by the higher cost of fuel andimported machinery. The effect would be more adverse for the larger rice millers who

29
tend to use more sophisticated imported milling machinery. By increasing theincentives to purchase local machinery, however, it would favor domesticmanufacturers of milling equipment.
2.6 SUMMARY AND CONCLUSIONS
The most important constraint on the growth of the rice processing subsector is thesustainability of rice export growth. Vietnamese rice exports have expanded rapidly as a resultof decollectivization of agriculture and the improved incentives to use fertilizer and modernseed varieties. However, it is very unlikely that rice export volume can continue to grow at thesame pace that it has over the past decade.
An increasing share of rice production growth is due to yield growth. The cultivated area ofrice lands has not increased since the mid-1980s. Production growth has been due to risingcropping intensity and higher yields. Further increases in cropping intensity are probablylimited, as evidenced by slowing growth in recent years. Thus, yield growth is becoming theonly avenue for expanding rice output.
The government should strengthen its support for rice research. The rate of return oninvestment in agricultural research is probably high, particularly given the importance ofcontinuing to raise rice yields. This investment could be in the form of better salaries and morefunds for equipment and operating costs.
Raising the unit value of rice exports requires improvements in port facilities, reliability, and ricequality. This conclusion generates several recommendations for government action:
The government should improve Saigon Port facilities, focusing on reducing the delays inloading which depress the FOB price. Furthermore, developing the Can Tho port wouldreduce the cost of moving rice to the port, thus raising the producer price.
The government should avoid policies that result in exporters abrogating existing rice exportcontracts. The costs of such policies are not visible, but by damaging the reputation of VietNam as a reliable exporter, they reduce the FOB price that the country will receive in thefuture. The government should implement a system for reporting rice export commitments. Thiswould allow policymakers to limit the volume of rice exports for food security reasons withoutcausing exporters to abrogate their contracts. It would also generate information useful formonitoring rice markets.
The government should allow private rice millers to participate in rice exports. A morecompetitive export sector will benefit farmers without reducing the price Viet Nam receives forits rice exports. In addition, based on international experience and the experience of otherfood processing sectors in Viet Nam, private exporter are more likely to seek out and exploitmarket niches for specialty rices.

30

31
Table 2.1 Trends in rice production in Viet Nam
Year Sown area Yield Production(thousand hectares) (tons of paddy per hectare) (million tons of paddy)
1985 5,704 2.8 15,875
1986 5,689 2.8 16,003
1987 5,588 2.7 15,103
1988 5,726 3.0 17,000
1989 5,896 3.2 18,966
1990 6,028 3.2 19,225
1991 6,303 3.1 19,622
1992 6,475 3.3 21,590
1993 6,559 3.5 22,837
1994 6,598 3.6 23,528
1995 6,766 3.7 24,964
1996 6,924 4.2 29,100
1997 (est.) 7,000 4.4 30,600Source: General Statistics Office, 1996, p. 61 for data up to 1995.
Viet Nam News, 27 December 1997, for 1996 and 1997.

32
Table 2.2 Contribution of area, yield, and intensity to rice production growth
Component Level Annual growth Contribution1985-95 of each factor
1985 1995
Cultivated area (1000 ha) 4,297 4,204 -0.2% -4.7%
Cropping intensity (ratio) 1.32 1.61 2.0% 43.3%
Yield (tons/ha/crop) 2.78 3.69 2.9% 62.0%
Interaction 0.0% -0.6%
Production (1000 tons) 15,874 24,964 4.6% 100.0%Source: Calculated from data in General Statistical Office, 1996.
Table 2.3 Geographic distribution of rice production
Region Total Sown Paddy Paddy productionarea paddy area yield
(1000 ha) (1000 ha) (tons/ha) (1000 tons) (% of nationalproduction)
North Uplands 10,297 808 2.79 2,254 9.0
Red River Delta 1,258 1,042 4.44 4,623 18.5
North Central Coast 5,118 682 3.14 2,141 8.6
South Central Coast 4,518 518 3.38 1,749 7.0
Central Highlands 5,618 173 2.48 430 1.7
Southeast 2,339 352 2.66 935 3.7
Mekong River Delta 3,956 3,191 4.02 12,832 51.4
Viet Nam 33,104 6,766 3.69 24,964 100.0Source: General Statistical Office, 1996: 14-15, 18-19, 62-67.

33
Table 2.4 Geographic patterns in rice surplus (1996)
Region Rice Consumption Population Consumption Apparentproduction per capita (millions) (mill. tons) rice surplus (mill. tons) (kg/person/yr) (mill. tons)
Northern 2.11 170.5 13.1 2.23 (0.13)Uplands
Red River Delta 2.31 177.7 15.4 2.74 (0.43)
N. C. Coast 1.38 160.1 10.8 1.73 (0.35)
S. C. Coast 1.13 144.5 8.5 1.23 (0.10)
Cen. Highlands 0.27 171.8 3.1 0.53 (0.26)
Southeast 0.59 140.9 9.2 1.30 (0.70)
Mekong Delta 8.26 160.9 16.9 2.72 5.55
Total 16.08 162.0 77.0 12.47 3.60Source: Rice production calculated from paddy production in 1996 from GSO (1997)
assuming 65% milling ratio and 15% disappearance in seed, feed, and losses. Percapita consumption from the 1994 Household Survey (GSO, 1998), with amountsscaled up by 5.9 percent to reflect consumption growth and make totals balance. Total consumption calculated as per capita consumption multiplied by population. Apparent surplus calculated as rice production minus rice consumption.

34
Table 2.5 Trend in the number and size of rice mills
Year Rice mills Paddy production Rice production Rice production per mill(thousands) (1000 tons) (1000 tons) (tons/mill)
1985 15.6 15,875 8,771 562
1986 16.9 16,003 8,842 523
1987 18.4 15,103 8,344 454
1988 19.2 17,000 9,393 489
1989 20.7 18,966 10,479 506
1990 25.4 19,225 10,622 418
1991 33.0 19,622 10,841 329
1992 35.5 21,590 11,928 336
1993 52.1 22,837 12,617 242
1994 76.3 23,528 12,999 170
1995 79.9 24,964 13,793 173
Annual 17.7% 4.6% 4.6% -11.1%growth
Source: GSO, 1996, p. 40-41.
Table 2.6 Geographic pattern in the number and size of rice mills (1995)
Region Rice mills Paddy production Rice production Rice production(thousand tons) (thousand tons) per mill (tons/mill)
Northern Uplands 20,091 2,254 1,245 62
Red River Delta 20,688 4,623 2,554 123
N. C. Coast 12,718 2,141 1,183 93
S. C. Coast 9,605 1,749 966 101
Central Highlands 7,383 429 237 32
Southeast 3,280 935 517 157
Mekong Delta 6,173 12,831 7,089 1,148
Total 79,938 24,962 13,792 173Source: GSO, 1996, p. 40-41 and 66-67.

35
Table 2.7 Trends in production, consumption, and export
Year Paddy Rice Rice Apparent Population Apparentproduction production export consumption (millions) consumption(000 tons) (000 tons) (000 tons) (000 tons) per capita
(kg/person/yr)
1985 15,875 8,771 8,771 59.9 146.4
1986 16,003 8,842 8,842 61.1 144.7
1987 15,103 8,344 8,344 62.5 133.5
1988 17,000 9,393 9,393 63.7 147.4
1989 18,966 10,479 1,420 9,059 64.8 139.8
1990 19,225 10,622 1,624 8,998 66.2 135.9
1991 19,622 10,841 1,033 9,808 67.8 144.7
1992 21,590 11,928 1,946 9,982 69.4 143.8
1993 22,837 12,617 1,722 10,895 71.0 153.5
1994 23,528 12,999 1,893 11,106 72.5 153.2
1995 24,964 13,793 1,998 11,795 74.0 159.4
1996 29,100 16,078 3,003 13,075 75.5 173.2
1997 30,600 16,907 3,600 13,307 77.0 172.8
Annual 5.6% 5.6% 12.3% 3.5% 2.1% 1.4%growth
Source: Paddy output from GSO (1996). Rice output assuming 65% conversion and 15% losses. Exports from GSO(1996). Apparent consumption calculated as rice output minus exports. Population from GSO (1995).
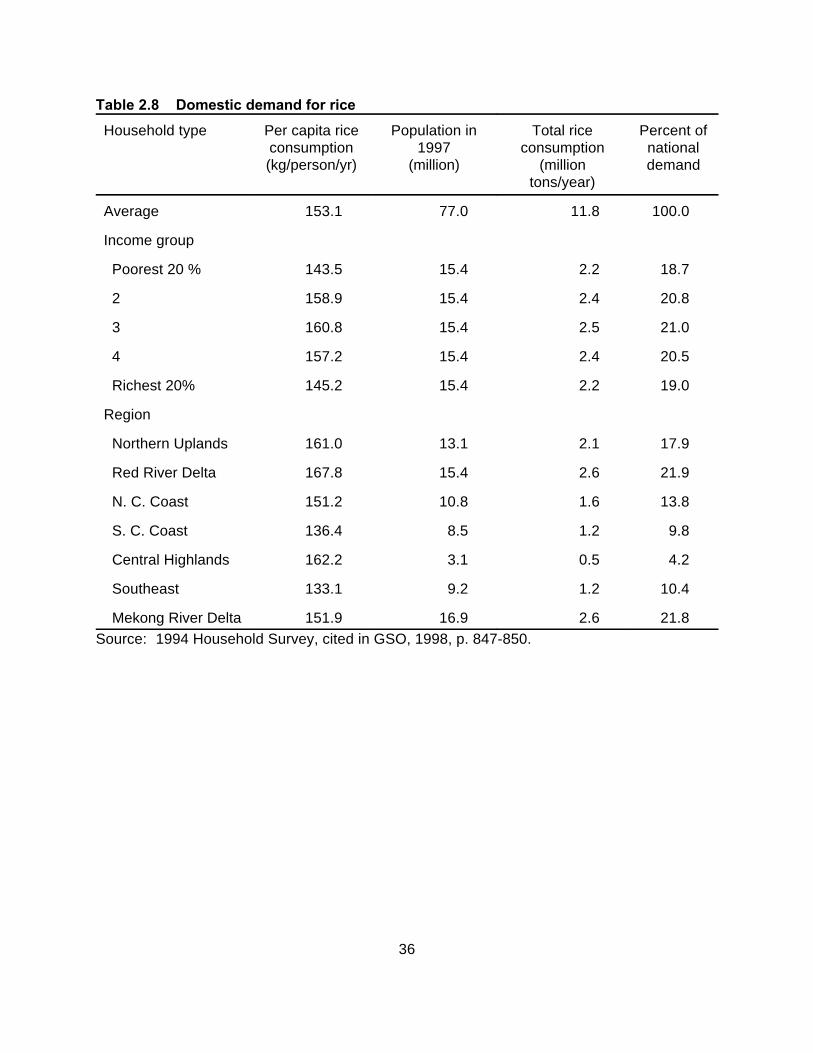
36
Table 2.8 Domestic demand for rice
Household type Per capita rice Population in Total rice Percent ofconsumption 1997 consumption national(kg/person/yr) (million) (million demand
tons/year)
Average 153.1 77.0 11.8 100.0
Income group
Poorest 20 % 143.5 15.4 2.2 18.7
2 158.9 15.4 2.4 20.8
3 160.8 15.4 2.5 21.0
4 157.2 15.4 2.4 20.5
Richest 20% 145.2 15.4 2.2 19.0
Region
Northern Uplands 161.0 13.1 2.1 17.9
Red River Delta 167.8 15.4 2.6 21.9
N. C. Coast 151.2 10.8 1.6 13.8
S. C. Coast 136.4 8.5 1.2 9.8
Central Highlands 162.2 3.1 0.5 4.2
Southeast 133.1 9.2 1.2 10.4
Mekong River Delta 151.9 16.9 2.6 21.8Source: 1994 Household Survey, cited in GSO, 1998, p. 847-850.

37
Table 2.9 Trend in rice exports
Year Rice exports Rice exports Total exports Value of rice exports(000 tons) (million US$) (million US$) as a percentage of
total exports
1991 1,033 234.5 2,087 11.2%
1992 1,946 417.7 2,581 16.2%
1993 1,722 361.9 2,985 12.1%
1994 1,893 424.4 4,054 10.5%
1995 1,998 530.0 5,449 9.7%
1996 3,003 856.0 7,256 11.8%
1997 3,600 885.0 8,700 10.2%
Annual growth 23.1% 24.8% 26.9%Source: General Statistics Office.
Table 2.10 Rice exports by destinations (1995)
Country Volume Percentage of total(000 tons)
Indonesia 511.9 25.6%
China 463.8 23.2%
Cuba 200.1 10.0%
Malaysia 147.8 7.4%
Philippines 104.5 5.2%
Others 571.9 28.6%
Total 2,000.0 100.0%Source: Calculated from Ministry of Trade data.

38
Table 2.11 Allocation of 1997 rice export quota
Exporter Quota Percentage of total(000 tons)
An Giang province 450 12.5%
Can Tho province 330 9.2%
Dong Thap province 330 9.2%
Long An province 210 5.8%
Vinh Long province 250 6.9%
Kien Giang province 130 3.6%
Tien Giang province 270 7.5%
Tra Vinh province 150 4.2%
Soc Trang province 120 3.3%
Bac Lieu province 70 1.9%
Ca Mau province 30 0.8%
Ben Tre province 20 0.6%
Thai Binh province 40 1.1%
Ho Chi Minh City 120 3.3%
Sub-total for provinces 2,520 70.0%
Southern Food Corp. 620 17.2%
Northern Food Corp. 300 8.3%
Gedosico Imp.-Exp. Co. 100 2.8%
Central Agri. Material Corp. 30 0.8%
Grain Imp.-Exp. Co. 30 0.8%
Sub-total for central SOEs 1,080 30.0%
Total 3,600 100.0%Source: Circular No. 01/1998 TM/XNK dated 14 February 1998 by
Ministry of Trade. Cited in Vietnam Business 8 (6) 16-31 Mar. 1998.Note: The 3.6 million ton quota is for the period January-September 1998. Another 0.4
million tons is to be allocated for the final three months of the year, pendinginformation on the size of the harvest.

39
3. COFFEE PROCESSING
3.1 BACKGROUND
Coffee was introduced into Viet Nam by French missionaries in 1857. Coffee plantations wereestablished in the North Midlands in the late 1800s and in the North Central Coast in the early20 century. In the 1920s, suitable coffee growing areas were discovered in the Centralth
Highland region. By 1945, Viet Nam had about 10 thousand hectares of coffee, most of whichwas in the central region. Because of the low yields (around 0.5 tons/ha), production was just4500 tons, most of which was exported to France (DSI, 1998).
During the period when Viet Nam was divided (1954-1975), the north took over Frenchplantations and formed 24 state cooperatives. Production reached close to 5000 tons in 1968,but declined subsequently. In the South, coffee production reached a similar level in 1973. Following reunification and peace, coffee production more than doubled to reach 12 thousandtons in 1980 (DSI, 1998). This expansion was facilitated by policies to relocate people fromthe densely populated north and coastal areas toward the thinly populated Central Highlands. Although ethnic minorities predominated in the region, almost all of the immigrants and most ofthe new coffee farmers were ethnic Vietnamese (kinh). The government has tried to redresssome of the resentment resulting from this immigration by establishing coffee schemes forethnic minority households in the Central Highlands.
Between 1980 and 1985, coffee area and production were stagnant and yields were low(around 1 tons/ha). For reasons discussed below, coffee production has expandeddramatically since 1986. Coffee exports now account for 6-12 percent of the total value ofexports, making it the second most important export crop after rice.
3.2. COFFEE PRODUCTION
3.2.1. Crop characteristics
Coffee is a perennial tree that grows in the tropics (between 25E N and 25E S) where thetemperature ranges from 20 to 25E C. Coffee trees takes three to five years to beginproducing. The lifespan is around 40 years, but maximum yield occurs in trees between fiveand fifteen years old.
The two main types of coffee are arabica and robusta. Arabica coffee is grown at higheraltitudes (1200 to 2000 meters), has a milder flavor, and fetches higher prices on worldmarkets. Robusta is normally grown at lower altitude (below 1200 meters) and is easier toprocess than arabica (Brown, 1991).
The flowering of the coffee tree is generally triggered by rainfall, and the tree produces coffeecherries 6-9 months after flowering. The cherries ripen at different rates in the same field andeven in the same tree. Harvesting is done by hand and is quite labor-intensive. Strip-pickinginvolves removing all the cherries from the tree at one time. This method of harvesting is morecommon with the lower-priced robusta coffee. Selective picking involves selecting the ripe

40
cherries for harvesting over the course of several picking sessions. This method is more oftenused with arabica coffee, particular when the wet processing method is used (see section3.3.1).
3.2.2. Production trends
Starting in 1986, the doi moi reforms allocated cooperative land to farm households, legalizedprivate ownership of productive assets, deregulated agricultural marketing and prices, anddevalued the exchange rate. These reforms resulted in better farm-level prices for coffee andstimulated private farmers to expand coffee cultivation. At the same time, many of the statecoffee farms began allocating plots to workers, converting them from members of acooperative to tenants or renters who were responsible for the production of a given parcel ofland. These two trends reduced the proportion of coffee area under state farm managementfrom 75 percent to perhaps 10-20 percent today.
The results of these policy changes have been dramatic. Over the period 1986-96, coffeeproducing area grew at 21 percent annually, while yields have grown almost 6 percentannually. As a result, coffee production has expanded 12 fold. Coffee exports have come toaccount for 6-12 percent of the total value of Vietnamese exports (see Table 3.1). On theworld market, Viet Nam has become the fourth largest coffee exporter.
3.2.3. Geographic and seasonal patterns
The coffee harvest takes place between November and February. Because the harvestoccurs during the dry season, the cherries can be dried outside by spreading them out on theground. As will be discussed later, this method is inexpensive but results in lower qualitycoffee.
Coffee production is concentrated in the Central Highlands (80 percent) and the Southeast (16percent). The province of Dac Lac alone produces about 58 percent of national coffee output,with Dong Nai and Lam Dong contributing 13-16 percent each (see Table 3.2). The averageyield is 1.8 to 2.0 tons per hectare. There is some regional variation in yield, with the mostimportant coffee producing regions having higher yields than the rest of the country. Forexample, the yields in the Central Highlands and the Southeast are around 1.9 tons/hacompared to less than 1.1 tons/ha in the other regions.
Over 90 percent of the coffee produced in Viet Nam is robusta. However, the government ispromoting the expansion of arabica areas, particularly in the North Uplands region. TheFrench development assistance agency is helping to expand arabica area by 40,000 hectaresin the north.
3.3.3. Production systems
Coffee is grown under a wide range of production systems, including small farms of less thanone hectare and state farms with more than 1000 hectares. Around 85-90 percent of the

The exact figure is difficult to obtain, partly due to different definitions of coffee area10
(planted vs. harvested) and partly because state farms have allocated plots to households,blurring the line between the two production systems.
41
coffee area is cultivated by small farmers . These farm households may receive credit or10
fertilizer from a buyer, but they own their own land and operate it as an independent business. A survey of coffee farmers in the Central Highlands revealed that the average coffee farmerhad 1.2 hectares of land, of which just 0.7 hectares was planted with coffee. If we acceptthese figures as representative, then there are around 300 thousand households growingcoffee. Furthermore, the survey indicates that these households obtained over 90 percent oftheir income from coffee. The average income of these coffee farmers was about US$ 225per capita (Binh, 1997). This is about 25 percent higher than the national average income and50 percent higher than the rural average income, according to the Survey on Households of1994 (GSO, 1998: 823).
At the other extreme are state farms, accounting for 10-15 percent of coffee area. Thisincludes state farms managed by the Viet Nam Coffee Corporation (VINACAFE) and statefarms under provincial control. VINACAFE has state farms with 22 thousand hectares ofcoffee, accounting for about 10 percent of the 1996 planted area. Seven of these farms are inDak Lak province, operating under the name Viet Duc. In addition, the government ispromoting arabica coffee production by establishing state farms in the North Mountain andMidlands region with the idea of eventually allocating plots to farmers. In addition, there are anumber of state farms under provincial management. For example, Dak Lak has at least fivesuch state farms (see Table 3.4).
Some of the state farms were originally private coffee plantations that were abandoned duringthe war and converted into state farms soon after the war. Others were started in the 1980s tofulfill the export agreements with the east bloc countries. And a third group have been formedsince the doi moi reforms as a way to promote coffee production and to generate revenue forthe province or the central government. As part of the doi moi reforms, most of the land hasbeen divided into plots for cultivation by individual farm households. The state farm retainsownership of the land and the trees and provides a variety of inputs and services to the farmer:irrigation, fertilizer, credit, and so on. In some cases, the households are similar to tenantfarmers, paying a proportion of their output to the state farm management for the use of theland and trees, as well as for fertilizer, water, and services provided by the management. Inother cases, the household are renters, paying a fixed amount each year for the use of theland, the trees, and any additional inputs provided by the state farm. Some state farms splitthe cost and profits of coffee production in a joint-venture-like arrangement. Most farms use acombination of these different organizational forms. For example, the Phuoc An State Farm inDak Lak has 2000 ha of centrally managed coffee and 1000 ha produced in “joint-venture” withfarm households. The Thang Loi State Farm, also in Dak Lak, 700 ha of centrally managedcoffee land and 1300 ha in two different types of joint venture arrangements.

The terminology is somewhat confusing, particularly since the Vietnamese term for coffee11
cherries translates as “green coffee”.
42
3.4. COFFEE PROCESSING AND MARKETING
3.4.1. Technical aspects
Coffee processing can be divided into two parts. Primary processing involves the conversionof harvested coffee cherries into green coffee beans and is always done in the producing11
country. Secondary processing involves the transformation of green coffee beans into finalconsumer products such as roasted beans, ground coffee, and soluble (instant) coffee. Secondary processing is almost always carried out in the consuming country for reasonsdiscussed later. Thus, the vast bulk of international trade in coffee is in the form of greencoffee beans.
There are two types of primary processing, known as the dry method and the wet method. The first, the dry method, is generally used with robusta coffee. It involves harvesting thecoffee cherries and drying them to reduce the moisture content from 25-60 percent to 10-15percent. The drying may be done by spreading the cherries out in the sun for 5-10 days, bymechanical drying, or by some combination of the two. The purpose of drying is to loosen theinner green bean from its husk. After drying, hulling machines are used to removing the husk,leaving the green bean. The huller usually involves a large, helically pitched screw that turnsinside a matching concave chamber. The friction among the beans causes the husk to berubbed off. The quality of the green bean can be further improved by cleaning, sorting, andgrading. Particles of different size are separated using a stack of three to five screens withdifferent sized holes that is made to vibrate. Particles of different density are separated usingeither a vibrating slanted surface or jets of air that come up through many tiny holes in a table. Finally, particles of different color can be separated using a color sorter, which uses anelectronic “eye” to sense the color of each bean passing through a set of parallel shoots. Thedevise is connected to a mechanical switch that diverts off-color beans to another channel. Color sorters are the most expensive and sophisticated elements of coffee processors and areonly found in a handful of processing plants in Viet Nam. A series of bucket elevators andconveyor belts move the beans from one machine to the next.
The second type of primary processing, the wet method, is generally used for arabica coffee. First, the coffee cherries are fed into a pulping machine that removes the soft outer layer,leaving the green bean and a sticky covering. The beans are then put in tanks of water for 6-72 hours. During this time, the sticky covering ferments, allowing it to be removed by repeatedwashing. Finally, the green beans are dried, cleaned, and sorted as in the dry method.
Secondary processing includes decaffeination, blending, roasting, grinding, and transformationinto soluble (instant) coffee. Decaffeination is a five-part procedure involving the use ofchemical solvents to remove caffeine and the use of steam to remove the solvents. Blendinginvolves mixing different coffee varieties (often arabica and robusta varieties) to achieve amild, consistent flavor. Roasting involves cooking the beans using hot air for a period of 5 to20 minutes. Grinding converts the roasted beans into a powder for use with various types offilter coffee machines. Producing soluble (instant) is a complex and capital-intensive

43
procedure involving the extraction of soluble solids, filtering, and spary- or freeze-drying. Robusta coffee is preferred for making soluble coffee because it retains more of its originalflavor in the process (Brown, 1991).
3.4.2. Marketing channels
In the past, almost all coffee in Viet Nam was robusta and most of it was grown on state farms. The harvested cherries were dried and delivered to the state farm processing plant. Statefarms processing plants generally have capacities of around 3000 tons, making themappropriate for farms of around 1000 to 1500 hectares. The green beans would then bedelivered to the port for export under a government-to-government contract.
Since doi moi, the marketing channels have become much more complex. Farmers associatedwith a state farm generally sell their output to the state-farm processing plant, though theyhave the option of selling some outside provided fulfill their financial responsibilities to the statefarm. This option has created problems for some state farms, because farmers can moreeasily avoid repaying debts to the farm management.
Independent farmers may sell the dry cherries to a private trader, to an agent of a processingplant, or directly to a processing plant. An increasingly common pattern, however, is for thefarmer to pay a small coffee processor to hull the dry cherries, retaining ownership of thegreen beans. These small processors are privately-owned locally-made hullers with capacitiesof less than 1000 tons/year. Many of them are mobile, allowing them to be moved from oneproduction area to another during the harvest season. The resulting green beans are not veryclean and need to be reprocessed for export. On the other hand, the beans (unlike the drycherries) can be stored for up to two years, giving the farmer the option of holding the coffee inexpectation of a high price. In addition, these small processors reduce the weight of the coffeeby 40-44 percent, reducing the cost of transporting the coffee to a larger processing facility. One researcher estimates that about one half of all coffee is processed in this way.
The green bean are eventually sold to a trader or an agent of a larger processing plant. State-owned enterprises with processing plants, including both state farms and specializedprocessor-exporters, are allowed to export directly. Until March of this year, private processingplants, even large ones, did not have the right to export directly. Instead, they were forced toexport through state enterprises, most often the specialized processor-exporters.
A small portion (perhaps 18,000 tons or 8 percent of 1996 production) of the green coffeebeans are consumed within the country. Most of this is sold to consumers as roasted beans. One VINACAFE factory in Bien Hoa (Dong Nai province) makes ground coffee and soluble(instant) coffee. The volume is quite small: the use of green coffee beans is 600 tons/year,from which less than 150 tons of soluble coffee and 50 tons of ground coffee are produced.
3.4.3. Structure of coffee processing and export sector
Official statistics on the processing capacity or volumes of coffee processors do not appear tobe available. This section uses information collected from interviews in Dak Lak, whichrepresents about 60 percent of national production.

44
As is generally the case, the smallest processors are the most numerous. The number ofsmall first-stage coffee processors in Dak Lak is estimated to be several hundred, with anaverage capacity of less than 1000 tons. As mentioned above, these plants may process halfof the output, but the resulting beans cannot be exported without further processing.
In addition, it is estimated that Dak Lak has 10-15 private processors in the range of 1000 to2000 tons per year. These plants have not exported directly, partly because as privateenterprises they were not allowed to. But there is some question as to whether they are largeenough to establish and maintain contacts with importers and achieve the quality needed fordirect export.
The processing plants on state-farms are usually medium sized with capacities of 3000 tonsper year. There are about 14 processing plants associated with state farms in Dak Lak. VINACAFE has seven processing plants in Dak Lak which are supplied by the seven statefarms that are part of the Viet Duc Coffee Company. In addition, there are processing plantson the provincially-managed state farms such as Thang Loi, Phuoc An, and the Thang 10(October) Coffee Farm in Dak Lak.
The larger processing plants (those with capacities of at least 5000 tons) tend to be owned bycompanies that specialize in processing and export. Most of the processing plants this sizeare owned by state enterprises. Some of the largest processor-exporters make use of severalprocessing plants. For example, INEXIM has three plants with capacities of 5000, 7000, and10,000 tons per year. The largest single processing plant is the one of Dak-Man, a jointventure between DALIMEXCO (a Dak Lak state enterprise) and E.D.& F. Mann, a Germancompany. This plant has a capacity of 15-20 thousand tons.
There are three private companies that have capacities of 5000 tons or more in Dak Lak. Thelargest is Hiep Phuc Trading Company, which processes around 8000 tons. Since privateexporters have not been allowed to export, Hiep Phuc exports through SIMEXCO. Lien PhatCoffee Company and Doan Ket Coffee Company each process about 5000 tons per year. These companies report exporting through SIMEXCO, INEXIM, and others.
The structure of exports is more concentrated than processing, though the number ofexporters is large and increasing. There are currently around 100 companies that exportVietnamese coffee, almost all of which are also coffee processors. The exports of the 15largest companies account for 60 percent of the total. The remaining companies export lessthan 2000 tons each, with some exporting only a few hundred tons. The number of exporterswill probably increase as private processors are allowed to export, although it is unclear howmany of them will have the resources and expertise to export directly.
3.4.4. Costs and competition
The costs of coffee processing are difficult to specify, partly because of the variety ofmarketing channels, the different sizes and locations of the coffee plants, and seasonalvariation. Because of the growing importance of two-stage processing, involving a small hullernear the farm and a larger reprocessor, Table 3.5 presents the approximate costs for this typeof marketing channel.

Note that all prices are expressed in terms of the value per ton of processed green bean. 12
The farmgate price of dry coffee cherries per tons of dry cherries would be about 56 percent ofthe figure in the table, based on the conversion ratio between the two forms.
45
The most striking aspect of this table is the small size of the margins between the farm-gateand the FOB price . The cost of hulling is $ 36 per ton of green beans, the cost of12
reprocessing is about US$ 30 per ton, compared to an FOB price of close to US$ 1800. Transportation costs from the farm to the plant and from the plant to Ho Chi Minh City addanother US$ 20 per ton. Overall, the cost of transportation, hulling, and processing accountfor less than 5 percent of the FOB value. This tight margin highlights the importance of buyinggood quality cherries or green beans at a good price. Since the FOB price is largely outside ofthe control of the processor-exporter, small errors in buying can have large consequences onthe profit margin.
Another interesting aspect of the table is that the labor costs are only US$ 5 per ton. Thisfigure should be interpreted in context however. For a plant that processes 5000 tons peryear, this would imply a payroll of roughly US$ 25,000. Given that the average monthly wagefor workers is about 700,000 VND or US$ 54, this implies that the plant generates about 460person months of employment per year.
The opinions of processors was quite consistent in recognizing that the increase in the numberof traders and processors had increased the level of competition to buy the farmers’ product. Several interviewees noted that farmers now have a good idea of the daily changes in theprice of coffee on the London commodity exchanges. Many of the coffee buyers subscribe toReuter’s wire service, giving them up-to-date information on the prices which they use innegotiation with farmers. In addition, the London coffee prices are broadcast on localtelevision news shows.
Because the margin is so small, it is even possible for the green coffee bean buying price toexceed the FOB price. This is possible because the buying price is also affected byexpectations of changes in coffee prices and the exchange rate over the next month or two. Iftraders or processors expect prices to rise or the exchange rate to depreciate, they will bewilling to buy at prices above the FOB price. Indeed, some processors argued that this wascurrently the case (as of April 1998).
Virtually all processors recognized that extending direct export rights to private coffeeprocessors would further increase the competition, giving farmers better prices. Some of thestate enterprises expressed the view that inexperienced processors would try to export low-quality coffee, thus damaging the reputation of Vietnamese coffee in general. However, someof the private processors, such as Hiep Phuc and Doan Ket, noted that they have alreadydeveloped contacts among importers and have developed a reputation for quality as a result oftheir indirect export contracts.

Apparent consumption is calculated as production minus exports. Because of stocks held13
over from one year to the next, apparent consumption fluctuates from year to year so thisfigure is based on the average over recent years.
46
3.5. COFFEE CONSUMPTION
3.5.1. Domestic coffee consumption
Viet Nam is traditionally a tea-drinking country. Coffee consumption is quite modest in percapita terms, according to different sources. In recent years, apparent consumption of green13
coffee is about 20 thousand tons, or 9 percent of production. Most of this is purchased in theform of roasted coffee, either as beans or ground, rather than soluble (instant) coffee. Thereare several brands of roasted coffee, all of them Vietnamese, and VINACAFE appears todominate this market. However, it is likely that most roasted coffee is purchased in bulkwithout packaging or brand, particularly outside the major cities.
The Bien Hoa coffee factory in Dong Nai, owned by VINACAFE, produces about 150 tons ofsoluble coffee per year, equivalent to about 400 tons of green coffee. Instant coffee producedby Vinacafe is under strong competitive pressure from brands from Singapore and Indonesia,including Nescafe, MacCoffee, and Eagle King. Casual inspection of retail outlets suggeststhat Vinacafe has a minority position in the domestic instant coffee market.
Analysis of the patterns in coffee consumption across income categories using the VLSSsuggests that coffee consumption will rise at approximately the rate of income growth. If thispattern holds over time and Viet Nam continues to maintain its current pace of economicgrowth, we would expect per capita coffee demand to rise by 6 to 8 percent per year.
3.5.2. International coffee market and consumption
Every year, over 4 million tons of green (unroasted) coffee is traded. The largest coffeeimporters are the United States, Germany, and Japan, followed by other European countries. Thus, it is not surprising that the largest markets for Vietnamese coffee are the United States(24 percent) and Germany (17 percent). Seven other European countries and Japan make upthe ten largest importers of coffee from Viet Nam. This pattern is relatively new, however. Until recently, the embargo on Vietnamese exports meant that most Vietnamese coffee wasexported to Singapore where it was reprocessed and exported.
The largest coffee exporters are Brazil and Colombia. Brazil produces medium to low-qualitycoffee in a production system that includes many large-scale coffee plantations. In contrast,Colombia produces high-quality arabica coffee, due largely to the fact that Colombian coffee isgrown by small farmers who invest more labor in selective harvesting and other quality-controlmeasures (see Box 3.1). The high quality and good reputation of Colombian coffee results ina higher price in world markets.
Coffee producers in Asia and West Africa generally grow robusta coffee rather than arabicabecause robusta is easier to process and it grows better in warm climates. Robusta coffeereceives a lower price on world markets than arabica because it is less mild and less aromatic

47
than arabica. On the other hand, robusta coffee beans are more resistant to the percolationand dehydration involved in making soluble coffee. Thus, robusta is used for instant coffeeand for blending with higher price arabica.
The international coffee market tends to go through “boom and bust” cycles as a result of twofactors: 1) the largest coffee exporter, Brazil, has occasional frosts and 2) there is a lag in thesupply response to coffee price changes. A significant part of Brazil’s production area is farenough south to experience coffee-damaging frosts every ten years or so. Any reduction inBrazilian exports (or indeed the expectation of reduced supply) pushes coffee prices up on theworld market. Coffee farmers elsewhere respond to the higher price by planting new coffeetrees. There is a 3-5 year period between planting new trees and harvesting them, so it takesseveral years for the supply of beans to respond to the higher price. During this time, farmerscontinue to plant new trees. When the newly planted trees begin to produce, the price returnsto normal. But for several years new trees continue coming into production, pushing coffeeprices below the long-term average. When this happens, farmers in marginal areas mayneglect coffee trees, decline to harvest them, or actually uproot trees. Eventually, the marketstablizes until the next frost in Brazil.
In 1962, the International Coffee Organization was formed to support and stabilize worldcoffee prices. Under the ICO, a series of International Coffee Agreements were signedestablishing export quotas, buffer stocks, and “trigger prices”. The ICAs did not succeed ineliminating the boom and bust cycles, however. In 1975 and again in 1985, Brazilian frostsdrove world coffee prices up, only to have then collapse later. Like any cartel, the ICA createdstrong incentives to “cheat” (to export more than the quota amount), particularly for exporterswith foreign exchange shortages. Increasing hostility to international commodity agreementsby the United States and other importers led to the demise of the system in the early 1990s.

48
Box 3.1: Coffee Industry in Colombia
Coffee was introduced to Colombia in 1732 by Spanish Jesuit missionaries. Commercial productionand exports began in the mid-19th century and by the 1890, coffee represented 70 percent ofColombian exports. Coffee production continued to expand in the 20 century, although its share ofth
total exports has declined as the economy has diversified and industrialized. In recent decades,coffee exports have grown from 240 thousand tons in 1960 to 840 thousand tons in 1995, all of whichis arabica coffee. In the past several years, exports have fallen to 600 thousand tons, but Colombiaremains the second largest coffee exporter in the world after Brazil.
Coffee is grown by 300 thousand small and medium-sized farmers with an average of 3 hectareseach. The production areas are on the slopes of the Andes Mountains at 1200 to 1600 meters abovesea-level. These areas are characterized by rich volcanic soil, cool temperatures all year (17-22° C),and enough rainfall (1500-2500 mm per year) to make irrigation unnecessary.
Coffee farmers in Colombia practice “selective picking,” in which only the ripe coffee cherries areharvested on each pass. As a result, the coffee trees are typically harvested 6-8 times per season. Growers themselves carry out much of the processing, using the “wet processing” method. The firststep is to remove the pulp with a pulping machine. Next, the beans are put in a tank of water for 12-24 hours to allow the sticky coating to ferment. Third, the beans are washed with clean water toremove the coating. Finally, the beans are dried, either by sun or in mechanical dryers. The greencoffee beans are then sold for further cleaning and selection. The processing and export industry iscomposed of both private companies and coffee cooperatives. Although Colombia does producesoluble coffee, virtually all of its exports are in the form of green (unroasted) beans.
The Federacion Nacional de Cafeteros Colombianos (the National Federation of Colombian CoffeeGrowers or FEDECAFE) has played an important role in developing the coffee sector. With revenuesgenerated from a small export tax, FEDECAFE funds coffee research at various centers, an effectiveextension system, and a coffee inspection service. It also funds projects to improve infrastructure andsocial services in coffee-growing areas and to diversify income among small farmers. FEDECAFEalso sponsors a successful world-wide advertising campaign to maintain Colombia’s reputation as ahigh-quality producers. The advertising campaign is only successful, however, because it is backedup by efforts to ensure coffee quality. Colombia defines six grades of export-quality Excelso coffeebased on seven criteria: humidity, aroma, color, bean size, defects, foreign material, and taste. Coffee that does not meet Excelso standards cannot be exported by law and is marketeddomestically.
3.6. PROSPECTS AND POLICY ISSUES
3.6.1. Prospects for the domestic market
Given continued growth in per capita income in Viet Nam, we can expect three trends indomestic demand for coffee.
C The per capita demand for coffee will rise somewhat more quickly than per capitaincome. This follows from the fact that the income elasticity of coffee demand isgreater than one. For example, if income growth is 6 percent and the elasticity is 1.5,

49
we would expect 9 percent growth in per capita coffee demand. At this rate, per capitademand would double in eight years.
C The demand for soluble coffee will rise more quickly than the demand for ground coffeeand coffee beans. This is because soluble coffee is more expensive, but also moreconvenient. As incomes rise and a premium is put on convenience, consumers willslowly shift to soluble coffee.
C The demand for roasted coffee will shift from bulk coffee beans to packaged andground coffee and to branded coffee. This is related to the convenience factormentioned above and to the quality assurance associated with brands.
These trends will have little effect on the overall demand for coffee beans because domesticdemand is such a small portion of total. They will, however, create a larger market forVINACAFE’s Bien Hoa coffee factory. On the other hand, the government has recentlyapproved a joint venture with Nestle to build a second soluble coffee factory in Dong Nai. Thisplant will provide stiff competition for the Bien Hoa factory, particularly given that the Nescafebrand is already well-established in Viet Nam. At the same time, the joint venture, with itsname brand and international expertise in management and marketing, will stand a muchbetter chance of competing against imported soluble coffee.
3.6.2. Prospects for export markets
In some ways, the prospects for Vietnamese coffee exports are bright. The demand for coffeeis strong, as reflected in relatively high world prices. Coffee demand continues to grow,although at a modest rate. Furthermore, Viet Nam still accounts for a relatively small share ofworld exports so that increases in output do not have a noticeable effect on world prices. Andthere is a growing interest in coffee, particularly higher quality coffee, in Western countries. One sign of this is the greater availability of different types of coffee beans in supermarkets. They are labeled both by the country of origin and by the roasting method. Another indicationis the rapid growth in the United States of coffee shops selling premium coffee in the mediumand large cities, the most notable example being the successful Starbucks chain.
At the same time, Viet Nam faces a number of issues in developing its coffee sector. First,although the taste of Vietnamese coffee beans is considered good for robusta, it does notfetch as high a price as Indonesian coffee on the world market. Second, the system forcarrying out research and extension in coffee production and processing is weak andunderfunded. Third, the world market for coffee is notoriously unstable and prices willprobably fall over the next few years. Fourth, virtually all of Viet Nam’s coffee exports arerobusta, but arabica coffee has a higher price and probably better growth prospects. Fifth,often it is argued that Viet Nam must carry out more processing in the country, particularlysecondary processing. Sixth, VINACAFE faces conflicts between its role as a commercialprocessor-exporter than must cover its costs and its developmental role which, while sociallybeneficial, are not profitable to the enterprise. Finally, Viet Nam’s entry into the ASEAN-sponsored ASEAN Free Trade Agreement will have consequences for the coffee industry. These issues are discussed below.

50
3.6.3. Coffee quality
As shown in Table 3.7 the Vietnamese system for classifying green coffee beans for exporthas three grades based on four criteria. According to interviews with SIMEXCO, one of thelargest processor-exporters in the country, only 2 percent of Vietnamese coffee exports satisfythe strict requirements of Grade 1. And yet, on international markets Grade 1 coffee beansare worth US$ 50 to 60 per ton more than Grade 2 and US$ 100-120 per tons more thanGrade 3.
The first and most commonly cited explanation for Viet Nam’s relatively low quality is the dryingprocedures used by Vietnamese coffee farmers. As Brown (1991) notes:
Drying is critical to both wet and dry processing. Flavor, bean color, and other qualityfactors are materially affected at this stage. Production of high-quality beans requiresthe correct combination of temperatures, duration of heat, ventilation, and light.
Many of the state farms use brick drying yards and some farmers have invested in concreteyards or plastic sheeting, but the overall capacity is limited. According to one source, Viet Namhas just 0.8 hectares of suitable drying ground per 100 hectares of producing coffee,compared to the optimal level of 3 hectares per 100 hectares of coffee (VET, 1998, p 36). The remainder of the coffee is dried on the ground or even in roads. This practice introducesstones, dirt, and other foreign material. Some of this foreign material can be removed inprocessing, but at a cost. Off-color beans can also be removed in processing, but this requireslaborious hand selection or expensive color sorting machinery. The effect of drying on flavorcannot be corrected in processing.
A related problem is that occasionally it rains during the drying season. If the beans remainwet for too long, mold will develop with serious implications for the taste and consequent valueof the green coffee beans. The long-term solution to these problems involves farm-levelmechanical driers and/or storage facilities.
The second most commonly cited problem is processing facilities. Coffee processing is not avery complex procedure. As described earlier, it involves vibrating screens with different sizedholes to separate particles of different sizes, vibrating surfaces to separate according todensity, and a series of bucket elevators and conveyor belts to move the beans from onemachine to the next. The most expensive piece of machinery in a coffee processing plant isthe color sorter. Not only does it cost as much as the rest of the machinery combined, butcalibrating the color sorter is a complex and skilled task.
Although there is little doubt that the machinery used in Vietnamese coffee processing plantsis relatively simple, this does not necessarily imply that capital investment should be thehighest priority. More detailed and technical evaluation of the processing facilities would benecessary to make this judgement. It should be noted that there is a tendency of companydirectors and plant managers to attribute all problems to inadequate machinery, perhaps in theexpectation that the interviewer will facilitate the approval of loans for capital investment. Thisis partly a reflection of the problems of Vietnamese financial markets in which investmentdecisions are largely determined by the government using political criteria rather than by banks

51
using financial ones. It is also a reflection of the engineering approach which dominated in thepre-reform era, in which production was seen as a technical rather than an economic problem.
3.6.4. Research and extension
The research and extension system for the coffee suffers from the general neglect ofagricultural research in Viet Nam, compounded by the fact that the coffee sector has grown soquickly that the supporting institutions to maintain the sector have not been able develop intandem. VINACAFE operates the EAKMAT Coffee Research Institute in Dak Lak province. The research activities are being supported by a GTZ-funded coffee project. Nonetheless, theallocation of financial and human resources to coffee research is inadequate given theimportance of the coffee sector and the high returns that agricultural research yields. Threeareas deserve particular attentions.
C The first is farm-level post-harvest technology. More attention needs to be given todeveloping low-cost methods for drying and storing coffee in order to avoid problems offoreign materials, mold, and uneven drying. Coffee farmers have generated relativelyhigh incomes over the past few years, but they lack information on how to invest in theircoffee processing in ways that will increase the price they receive for their coffee.
C The second area is coffee disease. Because coffee is a relatively new crop, diseasehas not been a problem. But as the area planted to coffee grows, the risk of anoutbreak increases. This is particularly true given the concentration of coffeeproduction in Dak Lak province and the fact that the coffee is grown under irrigatedconditions, thus facilitating the spread of soil-born diseases. An early warning systemfor such diseases depends crucially on farmers’ ability to recognize symptoms andreport it to the appropriate authorities.
C The third area for research is water resources. Viet Nam is somewhat unusual ingrowing coffee under irrigated conditions. The El Niño-related drought this yearhighlights the importance of water for the coffee sector, but the problem will notdisappear with the end of the drought. Roughly 30 percent of the water used to irrigatethe coffee in Dak Lak is ground water and the rate of water extraction may exceed themaximum sustainable yield. The evidence of this is that the water table appears to befalling. The sustainability of the coffee sector is dependent on finding ways to reduceground water use to a sustainable level. The solution will probably require moreresearch into the size and nature of the problem, investments to make more effectiveuse of surface water resources, the development of recommendations for reducedwater use in coffee production, and some system for pricing or taxing water use togenerate the appropriate incentives for conservation.
The key issue is how to fund coffee research and extension efforts. Perhaps the most reliablefunding method would be through a small tax on coffee exports. Even a tax of $15/ton (about1 percent of the F.O.B value) would generate US$ 4.5 million dollars per year. In Colombia,the National Federation of Coffee Growers (FEDECAFE) is funded this way and has been amajor force in coffee research, extension, and community development in coffee growingareas (see Box 3.1). It is important to establish a method for feedback to ensure that the
52
organization caters to the needs of coffee farmers. One approach would be to subject the taxto a referendum among coffee growers every few years.
3.6.6. International price volatility
As discussed above, the international coffee market is subject to volatility due, in large part, tosupply shocks in Brazil combined with the lag between price changes and supply response. There are no easy solutions to this problem, although there are some policy options.
Some participants in the coffee sector propose a buffer stock, in which the government wouldbuy coffee when prices are low and sell when they are high. The government might make aprofit in these transactions, but it is unlikely unless the government has better informationabout future trends in world supply and demand than specialized coffee traders that work inthe commodity exchanges of New York and London. Because Vietnamese exports are small(less than 8 percent) relative to world trade, the operations of a buffer stock are unlikely toinfluence world markets. And because competition will maintain farmgate prices close to worldprices, the buffer stock would not have much influence on domestic prices. Thus, a bufferstock is not likely to address the problem of volatile prices and could be expensive to thegovernment.
Another option is to use a variable levy, an export tax that varies depending on world prices. In principle, an export tax would be imposed when world prices are high and the revenuewould be used to pay for a subsidy when world prices are low. This would moderate the pricevariability within Viet Nam relative to the variability in world prices. The experience in othercountries is not promising, however. In one case (Cameroon), the export tax revenue wasspent on the over-expansion of the state enterprise managing coffee exports so that noassistance was available when world prices fell. In another case (Rwanda), the tax revenuewas invested in state tin mines that eventually failed. Again, the funds were not availablewhen world coffee prices fell.
A third option is to provide farmers with information to allow them to anticipate and prepare forprice volatility. A study of a coffee boom in Kenya showed that farmers were more likely tosave the temporary windfall associated with the boom than the government was. Thus, coffeefarmers may be better protected by allowing them to receive the higher price and preparethemselves for the eventual decline. Although Vietnamese farmers are quickly learning aboutworld coffee markets, they have less experience than coffee farmers in Kenya and othertraditional coffee growing countries. For this reason, coffee extension services shouldemphasize the volatility of coffee prices and encourage farmers to be prepared for pricedeclines. In Colombia, the National Federation of Coffee Growers has programs to help smallfarmers diversify their income sources to maintain food security in the event of lower coffeeprices (see Box 3.1).
3.6.7. Arabica promotion
Arabica coffee accounts for less than 5 percent of coffee area in Viet Nam. Although arabicahas a higher price on world markets, the “wet” process used for arabica is more complex. Coffee berries need to be picked selectively to get those of the right maturity. The berries are

53
then depulped, soaked in a tank, allowing the sticky coating to ferment, and then washed. Finally, the berries are dried, cleaned, and sorted. In Colombia, the depulping, soaking,washing, and drying is done at the farm level, thanks to many decades of experience withcoffee and an effective extension service (see Box 3.1)
Currently, the French development agency is helping to plant 40,000 hectares of arabicacoffee in the north of the country. The idea of exploring the viability of arabica coffeeproduction is certainly a good one. However, it is worth raising two concerns with regard tothis project.
First, even though arabica coffee gets a higher price than robusta on world markets, this doesnot necessarily make it profitable for Viet Nam. The profitability of arabica production in VietNam depends largely on the yields that can be obtained under local growing conditions, theadditional costs of arabica processing, and level of quality than can be achieved. Thesefactors can only be determined by pilot programs and careful cost-benefit analysis. It is notclear whether the project has invested sufficiently in background research to verify theeconomic viability of arabica coffee production in Viet Nam.
Second, arabica coffee is being promoted using a centralized production system in whichVinacafe builds a processing plant, grows the trees, and “rents” the plots to farmers tomanage. This may be useful as a transitional phase, but the objective should be to establishindependent coffee growers that are able to carry out the “wet method” processing. This isanother case where the commercial role of Vinacafe as a processor-exporter may conflict withthe developmental role of Vinacafe as the promoter of a stronger coffee sector.
3.6.8. Secondary processing
Some observers have argued that Viet Nam should carry out secondary processing (roasting,grinding, decaffeination, etc.) instead of exporting green coffee beans. The argument is thatby processing the coffee further within the country, the domestic value added, employment,and income effects of the coffee sector would be enhanced. Although this argument isintuitively appealing, it is not necessarily true. The price difference between green coffeebeans and soluble coffee generally corresponds to the processing costs in countries that arecurrently producing soluble coffee. Assuming that quality is not an issue, Viet Nam canincrease its value added only if it can produce soluble coffee at a lower cost than othercountries. If Viet Nam’s costs are higher, whether due to lack of domestic packaging materials,smaller plant size, or any other reason, the value added will be negative. Thus, processinginvestments must be subject to case-by-case evaluation of costs and benefits. A prioriarguments and the experience of other countries are only useful to identify areas that deservefurther study.
In the world coffee market, secondary processing is almost always done in the consumingcountry. In 1995, world exports of green (unroasted) coffee beans were 4.2 million tons, whileexports of roasted coffee were just 220 thousand tons, less than 5 percent of total coffeeexports (FAO Agrostat). One reason is that secondary processing usually involves blendingarabica and robusta coffee to produce a consistent smooth flavor. This would not be possiblecurrently in Viet Nam because of the lack of arabica coffee. Even in countries like Colombia

The internal rate of return is the annual interest rate that a project could repay and still14
break even, based on the flow of costs and benefits generated by the project.
54
that produces 600 thousand tons of high quality arabica coffee and has an internationalreputation in coffee, virtually all its coffee exports are in the form of green coffee beans.
Another factor is that roasted coffee is a highly differentiated product, with consumerpreferences varying sharply across countries, particularly the high-income countries that formmost of the world demand for coffee. In Europe, international trade in roasted coffee is limitedbecause consumers will rarely accept coffee roasted in another country. For example,German consumers buy almost exclusively coffee that has been roasted in that countrybecause of the specific taste that their processors give it.
One possibility would be to produce roasted or soluble coffee for low-income, relativelyundiscriminating markets. In the end, however, this is a commercial decision that should bemade by investors on commercial grounds, not by policymakers. It is difficult to identify aneconomic argument for promoting or subsidizing such an investment.
3.6.9. Role of VINACAFE
VINACAFE fulfills a variety of roles in the coffee sector. On the one hand, it is responsible forthe promotion of the coffee industry in general. This includes implementing government policyregarding the expansion of arabica areas, research, extension, quality certification, andrepresenting Viet Nam at international coffee fora. On the other hand, it is a competitor withinthe coffee industry, accounting for perhaps 10 percent of coffee production and around 25percent of coffee exports. Mr. Khai, President of VINACAFE, believes that his companyshould concentrate on coffee processing and export. This response is understandable fromthe point of view of a commercial organization that is saddled with unprofitable functions suchas research and extension. It illustrates the tension created by forcing a state enterprise tocover its own costs and fulfill a social function.
Although the social functions of quality control, research, and extension are not profitable toVINACAFE, they are almost certainly “profitable” from the point of view of the economy as awhole. Numerous studies of agricultural research and extension (over 100 have beenpublished) demonstrate that the internal rate of return for these investments is 25-50%, farhigher than many alternative investments . It is more difficult to measure the benefits of14
establishing grades and providing quality certification, but the consensus is that these activitiesare socially profitable. The public good characteristics of quality standards, new varieties, andimproved cultivation practices make it impossible for the institute to charge the full value forthese services. Thus, subsidization of research, extension, and quality control activities is fullyjustified by both economic theory and empirical evidence.
On the other hand, it is generally accepted the commercial functions of state-ownedenterprises are performed more efficiently when the SOE is subject to internal incentives forefficiency and external discipline from the market. Among the elements of external discipline isthat the enterprise be forced to compete against other enterprises without any government-provided advantages such as subsidies.

55
Thus, VINACAFE, like many state-owned enterprises, has a mandate to pursue socialobjectives that should be funded by the government because of their public goodcharacteristics as well as commercial objectives that should not be subsidized in order toimpose market discipline on the enterprise. Because of this conflict, one of the principles inreforming state-owned enterprises (SOEs) is that commercial and social functions should beseparated. A report on improving state enterprise reform expresses the idea this way:
A critical element contributing to the poor performance of many SOEs has been thediverse, ill articulated and often conflicting roles set by [the government] for themanagement of these enterprises (Muir and Saba, 1995).
International experience with SOE reform suggests two solutions to this problem. The first is toensure that the non-commercial functions of the SOE are clearly identified and separated interms of the accounting of the enterprise, allowing the government to subsidize or fully fundthose activities. If performance can be quantified, performance contracts should beconsidered. The second solution is to separate the two functions in different institutions, onefor the social objectives and the other operating as a commercial enterprise.
3.6.10. Effect of trade policy
Trade liberalization under the ASEAN Free Trade Agreement will take the form of phasedreduction of tariffs on goods imported from the members of the Association of South EastAsian Nations (ASEAN). This trend will generally be either neutral or positive for the coffeesector in Viet Nam, although it may adversely affect the secondary coffee processing industry.
Currently, the tariff rate on unroasted (green) coffee beans is 20 percent. Eliminating this tariffwould not adversely affect the coffee sector. Because of climate, natural resources, and laborcosts, Viet Nam has a comparative advantage in coffee production so that movement toward amore liberalized trade regime in the area can only benefit coffee farmers. Threecharacteristics of primary processing virtually require that it be carried out near productionareas. First, the farm-level product (dried cherries) is more perishable than the processedproduct (green beans), creating incentives for processing to take place near the producingarea. Second, processing reduces the bulk of the product, so that transportation costs areminimized by processing as close to the farm as possible. Third, the economies of scale arenot very great. There appear to be little or not cost advantage in processing plants above10,000 tons per year. Processing plants with large capacities generally just install multiplecopies of the machinery under one roof. These characteristics explain the tendency of newplants to be established in Dak Lak rather than Ho Chi Minh City. They also suggest stronglythat even in a free trade environment, primary processing of Vietnamese coffee will continue totake place in the coffee zones of Viet Nam.
The tariff rate on both soluble and non-soluble roasted coffee is now 50 percent, representinga significant level of protection for the Bien Hoa coffee factory and other coffee roasters. Inthe case of soluble coffee, imports from Singapore and Indonesia already have seem to havea majority of the domestic market. Thus, eliminating or reducing the tariff would furtherweaken, and possibly eliminate, VINACAFE’s position in the domestic soluble coffee market. Reducing the tariff will benefit coffee consumers at the expense of soluble coffee processor(s),

56
but there would be no effect on coffee farmers because local soluble coffee is a negligibleportion of the demand for Vietnamese coffee.
With regard to roasted nonsoluble coffee, it is likely that domestic roasters would not beaffected by the elimination of the 50 percent tariff. The packaging and transportation cost ofimported roasted (non-soluble) coffee would probably not allow it to compete with locallyroasted coffee, except for the high-income market.
3.7. CONCLUSIONS AND RECOMMENDATIONS
The increase in the number of coffee processors and traders has reduced coffee marketingmargins and improved the prices received by farmers. Although information on margins overtime is not available, this is the conclusion of almost all coffee processors (including state andprivate).
Recent policy decisions to allow private coffee processors to export will have a modest effectinitially, but a large effect over the coming years. Initially, few private processors will have theexpertise, contacts, and liquidity to export, but the incentives for direct exporting will encourageprivate processors to develop the expertise, make contacts, and seek credit.
One of the main threats to sustained coffee exports is the depletion of groundwater resourcesin the Central Highlands. The current drought has highlighted the dependence of coffee onwater, but the problem will not disappear with the return of normal rainfall.
Another threat to sustained coffee exports is the risk of an outbreak of disease. Coffeeproduction has expanded more quickly than the institutional capacity to deal with outbreaks ofdisease. The use of irrigation increases the risk of disease.
The government should not limit the number of companies that are allowed to export coffee,nor set minimum export prices. Greater competition in the export sector will improve the pricesreceived by farmers without lowering the export price. Importers will prevent inexperienced orunder-capitalized processors from exporting, although it might be useful for the government to"certify" some exporters as qualified.
The government should invest more in coffee research and extension, focusing on disease,post-harvest practices, and water conservation. As a result of the risks described above,research in the issue of sustainable water use, Arabica production, and disease is needed, asare extension efforts to establish a system for monitoring and reporting diseases.
The government should consider a small export tax to fund coffee research and extensionactivities. This would ensure that research funds are available on a sustained basis to supportthe coffee sector. The example of FEDECAFE in Colombia should be studied as a model,though initially a Vietnamese institute should pursue a more modest agenda.
The government should separate the commercial and public service roles of VINACAFE. Stateenterprises should not be given public services functions and expected to cover all their costs. Nor should the public service functions of VINACAFE be neglected in the interest of stateenterprise reform. Commercial activities should be self-financing, while public service activities

57
(research, extension, inspection, etc) should be fully funded by the government or by taxingthe coffee sector.
The government should evaluate the economic returns to arabica coffee production. Theexpansion of arabica coffee production in the north appears to be following an acceleratedschedule, and it is not clear whether there have been adequate studies of the agronomic andfinancial aspects of this investment.
The government should study the issue of groundwater depletion in the Central Highlands inorder to design policies to ensure the sustainability of coffee production in this region. Such astudy would examine the extent of depletion and the mechanisms that the government coulduse to reduce water use and/or increase water supply.

58
Table 3.1 Trends in coffee production
Year Planted area Harvested area Yield Production(000 ha) (000 ha) (tons/ha) (000 tons)
1986 65.6 19.1 1.00 19.1
1987 92.0 23.4 0.99 23.1
1988 111.9 32.3 1.04 33.7
1989 123.1 43.3 0.99 43.0
1990 119.3 61.9 1.57 97.4
1991 115.1 73.2 1.51 110.6
1992 103.7 81.8 1.93 158.1
1993 101.3 82.1 2.11 173.6
1994 123.9 99.9 2.08 208.2
1995 186.4 99.9 2.07 206.5
1996 127.5 1.82 231.5
1997 300.0
Annual growth 20.9% 6.1% 28.3%Source: GSO (1996, p 166) for 1986-1995. Binh (1997) for 1996.

59
Table 3.2 Geographic distribution of coffee production (1996)
Region or province Yield Production Percent of total(tons/ha) (000 tons)
North Mountain & Midlands 0.99 4,443 1.9%
Red River Delta - - 0 0.0%
North Central Coast 1.09 2,486 1.1%
South Central Coast 0.86 1,618 0.7%
Central Highlands 1.88 185,895 80.3%
Dac Lac 2.09 134,815 58.2%
Lam Dong 1.49 37,690 16.3%
Gia Lai 1.59 11,457 4.9%
Southeast 1.83 37,056 16.0%
Dong Nai 1.87 29,894 12.9%
Mekong River Delta - - 0 0.0%
Total 1.82 231,498 100.0%Source: GSO, cited in Binh (1997).
Table 3.3 Trends in coffee processing
Year Value (billion VND) Ratio of valueadded to gross
outputGross output Value added
1991 33.8 1.8 5.4%
1992 46.2 2.4 5.2%
1993 71.4 3.7 5.2%
1994 82.6 4.3 5.2%
1995 119.7 6.0 5.0%
1996 138.0 6.9 5.0%
1997 151.0 7.6 5.0%
Annual growth 23.5% 21.9%Source: General Statistics Office. (Data obtained by DSI/MPI).

60
Table 3.4 Characteristics of medium and large coffee processors in Dak Lak
Processor Ownership Production Number Processing Export(tons/year) of plants capacity volume
(tons/year) (tons/year)
INEXIM province 0 3 22,000 45,655
SIMEXCO province 0 - - - - 42,934
Viet Nam Coffee Co. central 0 1 - - 34,052
Phuoc An province 4,500 1 12,000 13,701
Dak Lak Trading Co. province 0 - - - - 13,307
Thang Loi Coffee Co. province 5,000 1 8,000 12,912
Viet Duc central yes 7 15,000 11,611
Hiep Phuc private 0 1 8,000 0
Dak-Man JV 0 1 15,000 8,182
Doan Ket Coffee Co. private 800 1 5,000 0
Lien Phat private 0 1 5,000 0
Imp.-Exp. Transp. Co. province 0 - - 4,182
October Coffee Farm province yes - - 2,396
Buon Ma Thuot Coffee province yes - - 2,175
Mountain Area Dev. central 0 - - 1,368Co.
Duc Lap Coffee Farm province yes - - 828
Total 193,303Source: Export data from Department of Planning and Investment, Dak Lak. Production and
processing data from interviews.Note: The production and processing data should be considered indicative since only seven
of the processors were interviewed and there were conflicting reports on some of thenumbers.

61
Table 3.5 Cost structure of coffee processing
Item Cost Cost Percent of Percent of(VND/kg of (US$/ton of total costs processinggreen bean) green bean) costs
Dry coffee cherry 22,036 1,695 95.2%
Labor for hulling 170 13 0.7% 36.6%
Petrol for hulling 59 5 0.3% 12.7%
Hulling machine 195 15 0.8% 42.0%
Other hulling costs 40 3 0.2% 8.6%
Total hulling costs 464 36 2.0% 100.0%
Green bean (cherry+hulling) 22,500 1,731 97.2%
Transport to reprocessing plant 60 5 0.3%
Labor for reprocessing 60 5 0.3% 15.4%
Electricity 10 1 0.0% 2.6%
Sacks 100 8 0.4% 25.6%
Depreciation and profit 200 15 0.9% 51.3%
Tax to province 20 2 0.1% 5.1%
Total reprocessing cost 390 30 1.7% 100.0%
Transport to HCMC 200 15 0.9%
Total (FOB price) 23,150 1,781 100.0%Source: Hulling costs from Binh (1997), Table 12. Additional processing costs from interviews
with Manager of INEXIM Plant No. 1 and others.

62
Table 3.6 Trends in coffee exports
Year Coffee Coffee Coffee Total exports Coffee as aexport export price export value (million US$) percentagevolume (US$/ton) (million US$) of total
(000 tons) exports
1985 9.2
1986 18.6
1987 25.6
1988 33.8
1989 57.4 871 50.0 1,946 2.6%
1990 89.6 859 77.0 2,404 3.2%
1991 93.5 816 76.3 2,087 3.7%
1992 116.2 787 91.5 2,581 3.5%
1993 122.7 903 110.8 2,985 3.7%
1994 176.4 1,872 330.3 4,054 8.1%
1995 248.1 2,411 598.1 5,449 11.0%
1996 239.0 1,410 337.0 7,256 4.6%
1997 355.0 1,208 429.0 8,700 4.9%
Annual 25.6% 4.2% 30.8% 20.6%growth1989-1997
Source: For 1985-1990, GSO (1996, p 9) and Binh (1997). For 1991-1997, General Statistics Office (data provided by DSI/MPI).
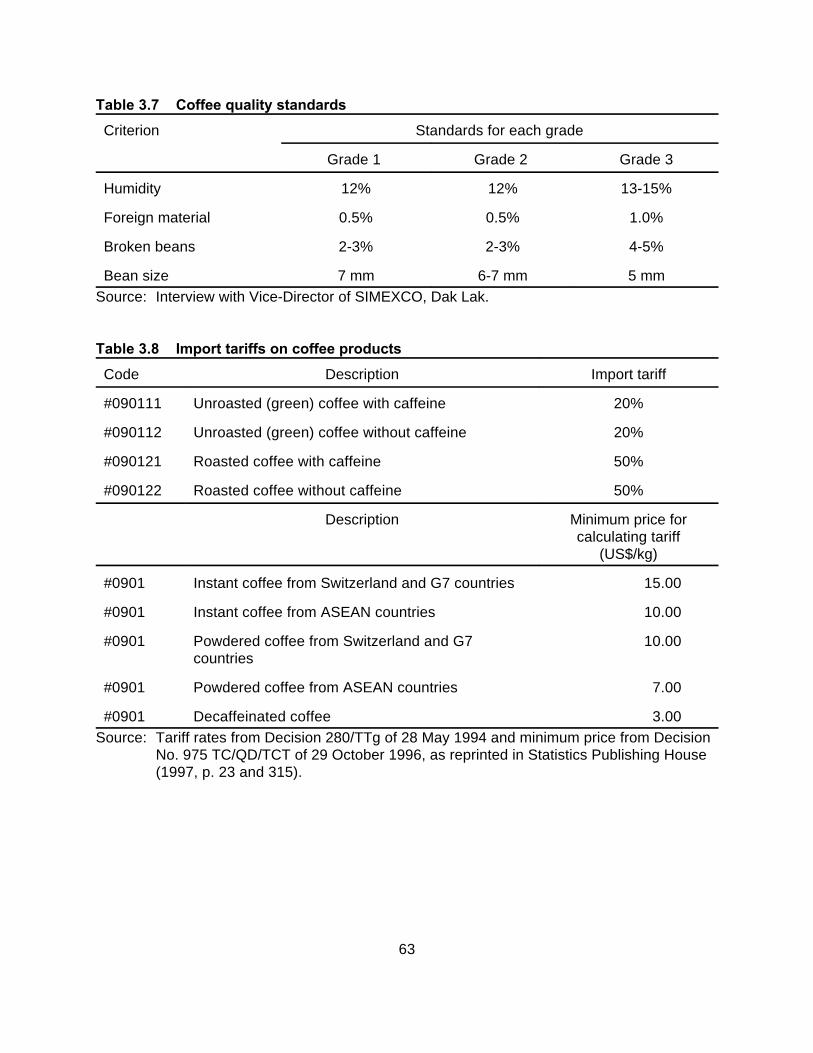
63
Table 3.7 Coffee quality standards
Criterion Standards for each grade
Grade 1 Grade 2 Grade 3
Humidity 12% 12% 13-15%
Foreign material 0.5% 0.5% 1.0%
Broken beans 2-3% 2-3% 4-5%
Bean size 7 mm 6-7 mm 5 mmSource: Interview with Vice-Director of SIMEXCO, Dak Lak.
Table 3.8 Import tariffs on coffee products
Code Description Import tariff
#090111 Unroasted (green) coffee with caffeine 20%
#090112 Unroasted (green) coffee without caffeine 20%
#090121 Roasted coffee with caffeine 50%
#090122 Roasted coffee without caffeine 50%
Description Minimum price forcalculating tariff
(US$/kg)
#0901 Instant coffee from Switzerland and G7 countries 15.00
#0901 Instant coffee from ASEAN countries 10.00
#0901 Powdered coffee from Switzerland and G7 10.00countries
#0901 Powdered coffee from ASEAN countries 7.00
#0901 Decaffeinated coffee 3.00Source: Tariff rates from Decision 280/TTg of 28 May 1994 and minimum price from Decision
No. 975 TC/QD/TCT of 29 October 1996, as reprinted in Statistics Publishing House(1997, p. 23 and 315).

64
4. FRUIT AND VEGETABLE PROCESSING
4.1. BACKGROUND
During the 1970s and 1980s, Viet Nam’s membership in the the Council on Mutual EconomicAssociation defined its export opportunities in most sectors. As one of the few CMEAmembers with a tropical climate, Viet Nam was called upon to supply the east bloc countrieswith fruits and vegetables. Farmers were organized in cooperatives and were obliged to selltheir output to state enterprises, thus facilitating procurement for food processors. Trade wasnegotiated between governments, so the only task of the food processors was to meet theirproduction targets.
With the collapse of the CMEA and the liberalization of agricultural markets, fruit and vegetableprocessors found themselves in a very different environment. Now, they had to compete withtraders and other processors for the farmers' harvest, requiring them to be attuned to marketprices and quality issues. In addition, they could no longer count on the government toarrange export agreements for them and were forced to learn how to contact importers,negotiate contracts, and arrange for delivery. The early 1990s were difficult years for many ofthe state-owned fruit and vegetable processors, with the value added in fruit and vegetableprocessing and the value of exports falling by over half. The sector started to recover in 1994,based on the expansion of exports. By 1997, the value added of fruits and vegetables wasmore than double the 1990 level.
Viet Nam’s low wages, varied climate, and proximity to large growing markets in east Asiasuggest that fruit and vegetable processing exports have the potential to expand further. Government assistance will be required to overcome weaknesses in the production andmarketing system in order to take full advantage of this potential.
4.2. FRUIT AND VEGETABLE PRODUCTION AND MARKETING
4.2.1. Product characteristics
Fruits are generally colorful fleshy parts of a tree or bush that contain the seed(s), whilevegetables are a diverse category that includes a variety of other parts of the plant includingthe roots (e.g. potatoes, carrots, and onions), stalks (e.g. celery and rhubarb), and leaves (e.g.lettuce, spinach, cabbage). The definitions used in everyday terminology, however, arecultural rather than botanical. For example, tomatoes and squash fit the botanical definition offruit, but are generally considered vegetables because they are not sweet and they areconsumed like vegetables (cooked or in salads) rather than like fruit (as desert).
Unlike many other food commodities that are processed, almost all fruits and many vegetablescan be eaten in their original fresh state. Thus, the motive for processing fruits and vegetablesis not to convert the commodity into an edible form, as it is with rice and coffee. Rather themain motivation is to preserve them so they can be consumed far from the place of harvestand throughout the year. Perhaps one of the most distinguishing characteristics of fruits andvegetables is their perishability in the fresh state. Although the root vegetables such as

GSO tables refer to “oranges”, but the statistics cover include orange, mandarin, lemon, and15
grapefruit.
Growth in production is less than the sum of growth in area and yield in GSO statistics. 16
Presumably, area refers to planted area, whereas yield is calculated on the basis of producingarea.
65
potatoes and onions can last four to nine months without refrigeration, most fruits andvegetables will spoil within two or three weeks.
4.2.2. Production patterns
The economic reform process in Viet Nam has stimulated the production of fruits andvegetables in three ways. First, by raising the production and domestic availability of rice, ruralhouseholds are able to allocate part of their land to fruits and vegetables with some assuranceof purchasing the rice needed for household consumption. Second, by expanding domesticincomes, the reforms have increased the demand for fruits and vegetables as consumers seekto add diversity to their diets. The two largest cities are particularly important as sources ofdemand for fruits and vegetables. Because of the perishability of fruits and vegetables, theproduction zones to supply the city are often located relatively close to the cities. Third, byestablishing a realistic exchange rate and liberalizing exports, the reforms have created newoutlets for fruit and vegetable processors. The reforms have not been without costs, as anumber of processors have faced costly adjustments to the new, and more demanding, exportmarkets.
As shown in Table 4.1, the area planted with fruit trees grew 71 percent between 1985 and1995, equivalent to a rate of 5.5 percent per year. This growth has been equally sharedbetween the north and the south of the country. Citrus area has grown even more rapidly15
than other fruits and now accounts for 17 percent of the total fruit area. Banana area is largebut stagnant, so its share of fruit area has declined to 26 percent. Pineapple area declined inboth absolute and relative terms between 1990 and 1995 for reasons discussed below. Mango area has grown at the same rate as total fruit area, maintaining its share at 6 percent. These four fruit crops account for over half (57 percent) of the fruit area in Viet Nam.
Production data reveal that citrus production increased 14 percent per year period 1985-1995,but almost all of this growth has occurred in the second half of this period. The annual growthrate over 1989-1995 was close to 25 percent. Most of this growth is attributable to a four-foldincrease in planted area since 1990, but yields have also risen by more than 25 percent overthis period. The data for banana production is limited to the first half of the 1990s, but shows16
little trend upward or downward. Pineapple production grew steadily in the second half of the1980s and then fell abruptly by over 35 percent in 1992. This drop was caused by the sharpreduction in production in just two provinces, Kien Giang and Minh Hai, presumably due Thisdrop is apparently related to the abandonment of plantations the result of reductions in bothyield and sown area of pineapple. Vegetable output has increased 4.8 percent per year.
The geographic patterns in fruit and vegetable production are shown in Table 4.3. With regardto fruits, the Mekong Delta accounts for over two thirds of the output of citrus, pineapple, and

66
mango. Banana production is somewhat more dispersed, with important production in theMekong Delta, Southeast, and the Red River Delta.
Concerning vegetables, the Red River Delta has the largest production, accounting for 29percent of the national output. This is the result of its good soils, cooler climate, and access tothe Hanoi market. Temperatures are cool enough in the October-February period to growtemperate vegetables such as cabbage, onions, tomatoes, turnips, and cauliflower. TheMekong Delta is the second most important region, representing 13 percent of national output. Dalat, in the Central Highlands, has specialized in the production of fruits and vegetables bothfor export and for domestic consumption.
4.2.3. Marketing channels
The marketing channels vary depending on the product and the eventual consumer. It isestimated that about half of vegetable production is marketed, largely for domesticconsumption. In the simplest case, fruits and vegetables are harvested and brought to town inbamboo baskets by bicycle or bus and sold to stall-based retailers at the marketplace. Forlonger distance internal trade, the farmer may sell his produce to a wholesaler who arrangestransport into the city. Transportation is readily available, although it is rarely refrigerated,limiting the distance it can be shipped. Private traders in the Dalat area have organizedovernight truck services to ship vegetables into Ho Chi Minh City some 250 km away to be soldthe following day (World Bank, 1993, p. 65).
Processors use a variety of methods to procure their raw materials. Pineapples for canningare usually produced on state farms in the north. The state farm may be vertically integratedwith the processor-exporter. For example, the Dong Giao Export Foodstuff Company (acentral SOE) obtains pineapples for its canning factory both from its own farm with 2000cultivated hectares and from other state farms in the area (DSI, 1998). In the south, there arefewer state farms so procurement from farmers is more common. For example, the Tan BinhFoodstuff Export Company purchases pineapples for canning from farmers using agents in theprovinces. Another system is for pineapples to be purchased through contracts withcommunal authorities. The authorities agree to sell a given volume to the plant and organizeselected households in the commune to fulfill the contract.
4.3. FRUIT AND VEGETABLE PROCESSING
4.3.1. Technical aspects
Fruit and vegetable processing can be defined broadly to include sorting, grading, andpackaging of fresh produce. It can also be defined more narrowly to include only thetransformations of fruits and vegetables to preserve them and to reduce preparation time. Preservation methods include canning, freezing, drying, and pickling. Processing to increaseconvenience include combining different ingredients, removing inedible parts, and carrying outother steps that consumers would otherwise do in the home.
The vast majority of fruits and vegetables in the world are consumed in fresh form, butprocessing has become more important over time. With rising incomes, consumers become

67
more willing to pay to have their favorite fruits and vegetables available in the off season andfar from the production areas. In addition, they become willing to pay for semi-prepared foodsthat require less preparation time.
Canning increases the shelf life of fruits and vegetables to 1-3 years, depending on theproduct. After cleaning the produce, it is peeled using air pressure, chemicals, or abrasion. Next, the produce is blanched, which involves raising the temperature to 95-100° C for a briefperiod to wilt the product, remove bubbles of air, and inactivate enzymes. The cans are filled,air at the top of the can is “exhausted” by heating, and the can is sealed. The cans are thensterilized by heating them to a specified temperature (usually 85-115° C) for a time sufficient tokill micro-organisms. The criteria vary depending on the size of the can, the acidity of theproduct, and other factors. Spoilage is usually caused by leakage, corrosion, or inadequateheating.
Because of the chemical reactions involved in canning, the fruit and vegetable varieties thatare good for fresh consumption may not be suitable for canning. For example, tropicaltomatoes often have a high level of acidity which results in a bitter and discolored product aftercanning. Similarly, the best varieties of pineapple for fresh consumption are not necessarilybest for canning.
Drying preserves food by reducing the water content below the level needed for micro-organisms to survive. Normally, 95 percent of the water content is removed. Fruits andvegetables are peeled and prepared, removing inedible portions and making even slices tofacilitate uniform drying. Next, in the case of most products, preservatives are applied. Thedrying may be accomplished in sun or shade, though contamination by dust or insects is aproblem. Alternatively, a variety of kilns, vacuum trays, and air chambers are used to dry fruitsand vegetables. Dried goods usually have a shelf life of one year or so.
Freezing preserves food by making the water needed by micro-organisms unavailable. Inorder to avoid water loss in the initial cooling period, it is necessary to freeze fruits andvegetables relatively quickly. Freezing methods include, in order of increasing cost andeffectiveness, still-air freezing, air blast freezing (where fans accelerate the cooling), liquidimmersion freezing, and cryogenic freezing.
4.3.2. Structure of the fruit and vegetable processing sector
The fruit and vegetable processing industry in Viet Nam is dominated by state-ownedenterprises. Although this is true in other subsectors as well, the degree of SOE control overfruit and vegetable processing appears to be greater than in rice, coffee, and seafood.
The Vegetables and Fruits General Corporation (VEGETEXCO) is a centrally-managed state-owned enterprise under the Ministry of Agriculture and Rural Development. VEGETEXCO has14 fruit and vegetable processing companies with capacities from 600 tons/year to 10,000tons/year. In 1997, the company produced 11,000 tons of processed fruits and vegetables,their main products being canned pineapple, other canned fruit, jarred pickles, fruit drinks, andcanned vegetables. VEGETEXCO has entered into a joint venture with Dona Newtower, Ltdof Hong Kong to produce fruit juice in Dong Nai under the “Nature” label. The exports ofVEGETEXCO were US$ 22 million in 1997, but only half of this was in fruits and vegetables.

68
Thus, VEGETEXCO represents about 7-8 percent of Viet Nam’s US$ 140 million export salesof fruits and vegetables.
There are also an estimated 22 provincial state-owned enterprises (SOEs) involved in fruit andvegetable processing. The capacity of these companies ranges from 500 to 10,000 tons/year. One of the largest of these is a joint venture between a Malaysian company and a Dong Naiprovincial SOE to produce fruit juice under the “Wonderfarm” label. Finally, there are 17private fruit and vegetable processors. Another example is the Vegetable and Fruit Companyof Ho Chi Minh City (VEGFRUCO) which processes and exports a wide variety of productsincluding lychee, red dragon fruit, Chinese cabbage, and garlic. VEGFRUCO sells severalthousand tons of fresh and frozen goods to demanding markets in Japan, Taiwan, andEurope.
The structure of the fruit and vegetable processing sector appears to be changing, with theprovincial and private companies expanding at the expense of VEGETEXCO. For example,VEGETEXCO was said to be producing 30,000 tons of canned and frozen good in 1993,compared to just 11,000 in 1997. Much of the decline appears to be related to the loss ofpineapple export markets, particularly in the former eastern bloc.
4.3.3. Processing costs
According the General Statistics Office, the cost of raw materials accounts for 72 percent ofthe output value of fruit and vegetable processors. Among the actual processing costs, laboris the largest item, representing 10 percent of the value of output.
These figures should be treated with some caution, however, since the structure of costsvaries widely depending on the product and the type of processing. Interviews with pineapplecanners suggested that raw material were only 40 percent of the final value and that thepackaging (mostly the cans) represent another 40 percent. The remaining 20 percent wasdivided among labor, depreciation, and other operating costs. These figures indicate that theeconomic viability of the canning industry is dependent on access to cans at a reasonableprice. Since the metal for the cans is imported, the price of cans is sensitive to changes in theexchange rate.
4.4. FRUIT AND VEGETABLE DEMAND 4.4.1. Domestic demand for fruits and vegetables
Vietnamese households consume an average of 52 kg of vegetables per person per year,according to the 1994 Household Survey. As shown in the Table 4.6, per capita vegetableconsumption rises with income but tends to level off at middle and higher incomes. The tablealso reveals a regional pattern in which vegetable consumption tends to be higher in the norththan in the south. At the extremes, the per capita vegetable production is almost twice as high(64 kg) in the Northern Uplands as it is in the Mekong River Delta (34 kg). This patternpresumably represent, in part, differences in price and availability, since production per capitais much higher in the Northern Uplands and Red River Delta than in the south.

69
Information on the consumption patterns for fruit alone is not available, but we expect theincome pattern to be similar. Econometric analysis of the 1992-93 Viet Nam Living StandardsSurvey suggests that the income elasticity for fruits and vegetables as a group is close to 1.0. This means that per capita consumption will rise at approximately the same rate as per capitaincome. With regard to the regional demand for fruits, it is probably higher in the south due tothe concentration of production of the four major fruits in the Mekong Delta and Southeast.
Little information exists on the consumption of processed fruits and vegetables. Informalsurveys of retail shops in the urban areas reveal some general patterns, however. First,canned fruits and vegetables can be found in most shops, even small shops that carry only afew dozen products. Among canned fruits, lychee is the most important, followed byrambuttan, pineapple, and mixed fruit. In lychee and rambuttan, Vietnamese brands such asVEGETEXCO and Foli compete with numerous Thai brands such as Twin Elephants. Onelarge supermarket in Ho Chi Minh City carried 10 Thai brands of canned lychee. In moststores, the imported brands appear to dominate, at least as measured by shelf space.In pineapple, VEGETEXCO and Tuyen Ky brands are the most important, with little importcompetition. In mixed fruit, the Ligo brand, containing fruit from the United States and SouthAfrica, dominates with no local competition.
Fruit preserves (jam) is available only in the medium and large food stores, suggesting that thedemand is limited to high-income households. The main brands are from Holland and Spain,with some competition from a less expensive Thai product sold under the Best Foods brand.
There are two Vietnamese brands of canned fruit juice, Wonderfarm and Nature, one or bothof which are available in most medium-sized and large stores. Each produces juices from 4-5fruits, as well as coffee and herbal drinks. In the supermarkets, one can find Taiwanese herbaldrinks and “fruit teas”, but these are less widely available.
In canned vegetables, the most widely available products are mushrooms, baby corn, peas,and sweet corn. In mushrooms and baby corn, local brands such as VEGETEXCO, Tuyen Ky,and Topwell appear to be the most important. Canned peas and corn are primarily importedfrom the United States under the Crystal brand. Other vegetables such as green beans andmixed vegetables, are available only in the larger supermarkets and are imported.
Pickled vegetables are not common in smaller stores, but one large supermarket had a widerange of pickled vegetables produced by a number of Vietnamese companies. Frozenvegetables are not sold in Viet Nam, even in the larger supermarkets.
4.4.2. Export demand for fruits and vegetables
More than the other three food sectors in this report, the fruit and vegetable industry wasseverely affected by the collapse of the Soviet Union and the shift from central planning to amarket economy. As one of the few tropical countries within the Council for Mutual EconomicAssistance (CMEA), Viet Nam was an important supplier of off-season vegetables and tropicalfruits to the Soviet Union and eastern Europe. In 1985, Viet Nam exported almost 12thousand tons of fresh bananas and 3.5 thousand tons of fresh pineapple, but these exportshad fallen to one third of this level by 1990 (GSO, 1996, p 9). In the late 1980s, the Tan BinhFoodstuff Export Company (part of VEGETEXCO) exported 7 thousand tons of canned and
70
frozen produce to the east bloc through government-to-government contracts. In 1990-91,these markets virtually disappeared and the company “lost” two years finding new exportmarkets. Only in the last few years have they established new markets for their goods inJapan, Taiwan, and the United States.
These patterns are reflected at the national level in Table 4.7, which shows a sharp decline infruit and vegetable exports in 1991, a long trough, and then a recovery starting in 1995. Therecovery has been rapid and 1997 exports were US$ 140 million, 170 percent above the 1985level. Data from the Food and Agriculture Organization, shown in Table 4.8, do not show asharp drop in exports but confirm that growth has accelerated in the past few years. Differences between the two sets of figures may be related to differences in the definition offruits and vegetables.
Detailed information on the composition of fruit and vegetable exports is not available, but itappears there is a trend toward higher-valued and more diversified fruit and vegetable exports. According to FAO statistics, in 1985 dry beans and canned fruit (largely pineapple)represented two thirds of the value of fruit and vegetable exports. During the 1980s, theaverage value of fruit and vegetable exports ranged from US$ 250 to US$ 390 per ton duringthe 1980s, averaging US$ 323 per ton for the decade (see Table 4.8). By contrast, 1996exports include dry beans, onions, fresh mushrooms, canned mushrooms, bananas, mangoes,and canned pineapple, none of which account for more than 10 percent of the total value. Furthermore, starting in 1991 Viet Nam began to export higher value fruits and vegetables. The average value of fruit and vegetable exports over 1990-1996 was US$ 507 per ton, 57percent higher than the average value during the 1980s.
Although VEGETEXCO continues to try to revive canned pineapple exports to the east bloc,newer smaller competitors have been opening markets in Japan, Taiwan, Hong Kong, andSingapore. In addition, interviews with processors give the impression that much of the newfruits and vegetable exports to Asia are fresh and frozen goods rather than canned.
4.5. PROSPECTS AND POLICY ISSUES
4.5.1. Prospects for the domestic market
As mentioned above, analysis of household survey data indicates that the income elasticity offruits and vegetables is close to 1. This implies that as incomes rise, the per capita demandfor fruits and vegetables should rise at roughly the same rate. Given the budget share of foodfalls with higher incomes, this means that an increasing portion of the food budget ofVietnamese households will be spent on fruits and vegetables.
In 1993, a World Bank report noted that “there is as yet almost no internal market for cannedor frozen vegetables and only a luxury market for canned fruit”. This may still be true, but onesuspects that the domestic market for canned goods has increased. Five years later, cannedfruit can now be found in even the smaller retail food outlets in the cities, and cannedvegetables are not uncommon in such stores. Pineapple, lychee, and baby corn are some ofthe more common canned products in food stores. Nonetheless, given the general preferencefor fresh ingredients in Vietnamese cooking, it seems that the domestic demand for cannedfruits and vegetables will grow slowly.

71
4.5.2. Prospects for export markets
Given the high transportation costs of fruits and vegetables, either in fresh or processed form,fruit and vegetable exporters are only successful when they have some advantage overdomestic producer in the importing country. Three types of advantages have been identified(Jaffee, 1992):
C One type of advantage is lower costs of production of the exported product. Inprinciple, this could be lower costs of processing or lower costs of commodityproduction. In practice, because the raw material represents a large share of the totalcost, the exporter must be a lower cost producer of the commodity. In a study ofsuccessful agricultural export industries, five of the six fruit and vegetable cases werebased at least in part on lower costs of commodity production. Lower processing costswas not seen to be an advantage in any of the six cases.
C A second type of advantage for fresh fruit and vegetable exporters is supply during theoff-season. For example, fruit and vegetable exporters in Chile, South Africa, and NewZealand have taken advantage of their ability to ship fresh products to the largemarkets in the northern hemisphere (see Box 4.1). In addition, tropical countries suchas Kenya and Mexico have made use of their warmer climates to ship fruits andvegetables north during the winter (see Box 4.2).
C A third type is to provide a differentiated product or service associated with the product. For example, Mexican tomato producers were able to provide vine-ripened tomatoes tothe US market, which were preferred by consumers to the artificially ripened varietyproduced domestically. The provision of tropical fruits to temperate climate countries isanother example. Other exporters may gain an advantage by being able to supply abroad range of fruits and vegetables or in establishing a more economical method ofshipping.

72

73
Box 4.1: Chile fruit exports
Chile has become an important supplier of temperate fruits, primarily table grapes andapples, to North America. Exports took off in the mid-1970s following devaluation, tradeliberalization, and other economic reforms. Fresh temperate fruit exports have risen fromless than 50 thousand tons in 1974 to almost 900 thousand tons in 1989, generating overUS$ 700 million in export revenue (Jaffee, 1992). Currently, fruit and vegetable exportsfrom Chile are worth US$ 1.6 billion per year, of which table grapes represent US$ 429million (FAO Agrostat).
Trade policy reform provided the initial stimulus for the fruit export industry. Its growth wassustained by a number of other factors, however. First, the labor costs in Chile aresignificantly lower than those of other southern hemisphere fruit exporters such as NewZealand and Australia. Second, improvements in quality and yield have been madepossible by the large number of Chileans who have obtained graduate degrees atuniversities in California, bringing improved methods and technology back to Chile whenthey returned. Over time, Chilean universities and Fundacion Chile, a semi-public institution,have developed local capacity to train agricultural scientists. Agricultural research has notonly increased yields, but it has introduced new varieties that extend the season over whichChile can export fresh fruit. Third, banking sector reforms in the 1970s allowed a 30-foldincrease in the disbursement of long-term credit over the period 1974-80.
Although Chile's initial growth has been based on the grape and apple exports to NorthAmerica, it is now diversifying into other markets, such as Europe and the Middle East, andinto other temperate fruits. For example, apple and grape exports represented two thirds offruit and vegetable exports in 1985 but only 42 percent by 1996.
Fruit production in Chile involves a large number of medium and large-scale growers. According to Jaffee (1992), the sector employs over 10 percent of the active labor force. Growers are organized in voluntary producer associations which facilitate the disseminationof new seed and methods. Coordination between growers and exporters is oftenmaintained through the use of production contracts. Agricultural research is carried out bypubic universities and Fundacion Chile. The government supports the fruit industry byproviding information about export markets and trade policy in other countries, by organizingand participating in trade fairs, and by providing product inspection and certificationservices. The government has also provided subsidies for irrigation development andpacking and processing facilities, but in general, it has adopted a policy of minimalintervention in direct production and marketing activities, focusing its efforts on facilitatingmarket development.
The example of Chilean fruit exports demonstrates that, while comparative advantage basedon climate and cost of production are generally a necessary foundation for agriculturalexports, they are not sufficient. Appropriate macroeconomic policy, research, and technicalskills are necessary to adapt to changing markets and meet quality standards, particularly inthe fresh fruit and vegetable export market.

74

75
Box 4.2: Kenyan Fresh Vegetable Exports
Kenya has become an important supplier of fresh vegetables to the European market. These exports have grown from less than 2 thousand tons in 1970 to over 20 thousand tonsin the late 1980s (Jaffee, 1992). Today, fruit and vegetable exports generate US$ 150million per year in foreign exchange revenue (FAO, Agrostat).
In the 1960s, Kenyan vegetable growers supplied lower-value less pershable vegetablessuch as potatoes and onions to the domestic and regional market and higher-qualityvegetables to the European settler population and growing tourist industry. In the 1970s,fresh vegetable exports from Kenya to Europe began to take off. Kenya became a leadingsupplier to Europe for sweet peppers, courgettes, green beans, and a variety of specialtyvegetables catering to the Asian immigrant community (chilies, okra, etc.). Several factorscontributed to this to growth. First, the tourism industry resulted in a higher frequency ofdirect air carrier service with Europe. Second, the low labor costs made Kenya competitivewith European producers. Third, its equatorial location and high-altitude production areasmade it possible to supply a wide variety of vegetables throughout the year. Fourth, tradewas facilitated by business and family links between south Asian traders in Kenya andAsian importers in the United Kingdom.
Even after establishing itself as a leading “niche” producer of specialty vegetables, Kenyawas not immune from competition. In the 1980s, Kenya lost its European market forpeppers and courgettes to Mediterranean suppliers. It was able to offset this loss, however,by expanding its exports of fresh green beans to Europe.
Vegetable production was initially carried out by larger farmers. Over time, productionshifted to thousands of small farmers, many of whom grow vegetables on contract,receiving seed, inputs, and technical assistance from the buyer-exporter. The governmentfacilitated the growth of the industry by providing market information, quality inspectionservices, and cold storage facilities at the airport. It also controlled air freight rates,although this was not a major factor in Kenya's cost competitiveness. It was not involved inproduction or marketing of vegetables, and export promotion played only a minor role (seeJaffee, 1992 for more details).
This case study demonstrates the potential of creating a niche as a supplier of a widevariety of fresh vegetables to high-income markets. It also shows that even a high-qualityspecialty-good exporter is subject to competition from other suppliers. There are no safe,permanent export markets, but adaptability and flexibility in production and managementare critical skills for dealing with this uncertainty.
Viet Nam should be able to export initially on the basis of its lower costs of production (relatedto lower wages and land values) for export to high-wage markets such as Europe, NorthAmerica, Japan, Taiwan, South Korea, Hong Kong, and Singapore. In addition, Viet Nam hasclimate-based advantages for exporting fruits and vegetables. On the one hand, Viet Nam cansupply tropical fruits (processed or fresh) and fresh vegetables during the winter to temperate

76
markets such as Europe, Russia, Japan, and North America. On the other hand, it can supplytemperate vegetables produced in the Central Highlands and Northern Uplands to tropicalmarkets.
The development of the third type of advantage will take more time and experience withinternational markets. Jaffee (1991) notes that agricultural exporters often start as low-costcommodity exporters and later, building on this experience, become producers of differentiatedor value-added products for niche markets. Thus, there is not a question of “choosing” a low-cost based strategy or a high-value differentiated product strategy; rather, the experience andreputation established as reliable low-cost supplier allows the evolution of differentiatedproduct exports. Some of the main obstacles faced by the fruit and vegetable processingindustry include problems with product quality, dispersed production, financial constraints intraditional markets of the former east bloc, and reduced export demand associated with theAsian currency crisis.
4.5.3. Quality issues
Under the old system, exports were arranged by government-to-government contracts andproduct quality was rarely an issue. Fruit and vegetable processor-exporters becameaccustomed to the idea that whatever was produced would be exported, regardless of quality. With the new market orientation of domestic and international trade, fruit and vegetablesprocessor-exporters have had to raise quality standards in order to compete.
Product quality is a function of varieties, production methods, transportation, and processing. Nonetheless, fruit and vegetable processors are almost universal in their complaints about thefruit and vegetables varieties in Viet Nam. For example, in pineapples a major obstacle togreater exports is that the main variety grown in Viet Nam, Queen Victoria, is small, low-yielding, and more appropriate for fresh consumption than canning. Although the taste is verygood, it is woodier and not as juicy as consumers in high-income markets have come toexpect. Citrus and bananas are other examples in which the current varieties have served thedomestic market well, but their size, yield, and taste characteristics prevent them from beingmajor export products. Addressing this problem would require agricultural research to identifyappropriate varieties, credit for farmers to replace existing tree crops, and technical assistanceto improve cultivation methods.
The quality of packaging and labeling is an issue as well. Both of the joint ventures to producecanned fruit juice have installed equipment to allow the labels to be printed directly on the can. In addition, the graphics and labels are of export quality. Many of the canned fruit andvegetable products, however, have labeling which appear dated and do not contribute tointernational marketability.
Processors also identify outdated canning technology as a constraint. One example cited byofficials from VEGETEXCO is that the equipment in Viet Nam seals cans using a tin strip. Health concerns about this method are making it less acceptable in the industrializedcountries, calling for investment in equipment to seal cans with electric welding. In general,however, food processing enterprises (particularly state owned ones) appear too willing tobelieve that larger and more modern machinery is the solution to what are really complexinstitutional and marketing problems.

Although canned goods are not mentioned by name, they seem to be included in category17
#200500 described as “Other vegetables treated or stored by all without vinegar and aceticacid; but not frozen”.
77
4.5.4. Processed vs. fresh fruit and vegetable export
It is often assumed that exporting processed commodities is more advantageous for a countrythan exporting unprocessed commodities. Thus, for example, some argue that exportingcanned or frozen fruits and vegetables will be more profitable than exporting fresh fruits andvegetables because of its higher value added. There are two flaws with this argument.
First, although the gross revenue from exporting processed goods is generally greater thanthat of exporting unprocessed goods, the profitability of processing a commodity is determinedby a comparison of the additional revenue and the additional cost of processing. Since thedifference in the world price of unprocessed and processed goods is closely related to the costof processing in competing countries, the question is whether the exporting country canprocess the commodity at a lower cost than competing countries can. It is not possible toanswer this question in general; rather it can only be answered on a case-by-case basis aftercareful cost-benefit analysis.
Second, fresh fruits and vegetables have a high value on world markets, sometimes evenhigher than some types of processed fruits and vegetables. For example, Chile is an importantexporter of fresh table grapes and apples (see Box 4.2). The unit value of these two exports in1996 was US$ 836 per ton and US$ 504 per ton, respectively. By comparison, the unit valueof canned pineapple exports is US$ 677 per ton. The explanation is that exporting fresh fruitsand vegetables is an operation requiring careful timing of harvest, packaging, cold storage, airfreight, and marketing. Exporters need skills to deal with the risk of
4.5.5. Effect of trade policy
The effect of joining the Asian Free Trade Agreement (AFTA) will be to lower the barriers forVietnamese products in the other countries of the Association of Southeast Asian Nations(ASEAN), as well as lowering the barriers in Viet Nam to products from those countries. Theeffect of this policy depends on the current import restrictions and the degree to which they willbe reduced. Import restrictions can be classified into two groups: tariff barriers and non-tariffbarriers.
C Tariff barriers for fruit and vegetable products vary between 20 and 40 percent. Asshown in Table 4.9, the import tariff on most fresh and dried vegetables is 20 percent,while the tariffs on all fresh and dried fruit is 30 percent. Table 4.10 shows that thetariff rates for pickled and canned fruits and vegetables have tariff rates of 40 percent .17
C Non-tariff barriers consist of a system of import permits and import quotas that limit theimport of goods already produced in the country. According to an official atVEGETEXCO, which is involved in imports as well as exports, the non-tariff barriershave been a more important barrier than the tariffs.

The exempted goods are petrol and oil, fertilizer, construction steel, cement, paper,18
construction glass, sugar, and liquor.
One discrepancy is that the official reported that the quotas were removed in 1997, but the19
decree is dated January 1998. Either a separate decision was made earlier for fruits andvegetables, or the implementation of the quota was relaxed in 1997 in anticipation of the policychange.
78
In an important but relatively unpublicized move, the government has issued a decision todrastically reduce non-tariff import barriers. Except for a specified list of goods , the decision18
states that
Enterprises that have been granted a license to export or import a particular good shallbe allowed to import such goods depending on their own demand and shall pay importduties in accordance with existing laws. Quota and permission on import of consumergoods is hereby abolished... (Decision No. 11/1998/QD-TTg of 23 January 1998)
An official at one of the VEGETEXCO subsidiaries noted that earlier their main competitionwas from other domestic canners because of the import quotas. Now, with the quotaseliminated, the company faces more competition from imported canned fruits and vegetables,particularly from Thailand.19
As mentioned earlier, imported goods represent a substantial share of the canned fruits andvegetable products in local retail outlets. Whether or not these goods are smuggled into thecountry, the removal of import tariffs will increase the market share of foreign canners inVietnamese markets. If the imported goods are entering officially and paying the 40 percenttariff, then eliminating the tariff will sharply reduce domestic prices of canned goods. If theimported goods are entering illegally, the effect may be less dramatic but we would still expectan increased volume of imports and lower domestic prices. This is because smugglinginvolves additional risks, such as confiscation, and additional costs, such as those associatedwith shipping goods in small lots to avoid detection.
This policy may be behind the reported increases in imported fresh fruit in Ho Chi Minh City inrecent months. According to press reports, about 7000 tons of fruit was imported in all of1997, but 2500 tons was imported in the first three months of 1998. Although imported freshfruit used to be rare at the city market, it now accounts for roughly half of the fruit sold there,according to press reports. The market offers a wide variety of imported fruit includingChinese apples, pears, citrus, grapes, and plum form Thailand, Singapore, and Australia (VietNam News, 20 April 1998).
4.5.6. Effect of exchange rates
The Asian currency crisis is putting pressure on the dong in two ways. First, capital inflows toViet Nam have been slowed, partly due to a loss of confidence in the region among investorsand partly due to domestic problems of Asian investors, particularly those from South Korea. With smaller capital inflows, the availability of foreign currency in Viet Nam is tighter, putting

79
upward pressure on the exchange rate. Second, the devaluation of other currencies, notablythose of Thailand and Indonesia, make it more difficult for Vietnamese exports to competeagainst exports from those countries.
In addition, it is possible that the Asian Free Trade Agreement (AFTA) will put pressure on theVietnamese dong. AFTA will probably raise imports from ASEAN countries to Viet Nam, aswell as stimulating Vietnamese exports to ASEAN members. If Viet Nam’s trade barriers arehigher than those of the other ASEAN countries, then trade liberalization may worsen the tradedeficit, possibly resulting in devaluation. Thus, it is worth examining the effect of devaluationon fruit and vegetable processing.
On the one hand, devaluation would alleviate some of the pressure on fruit and vegetableprocessors caused by imported goods. For example, 10 percent devaluation would cause theVietnamese dong price of Thai oranges to rise by 10 percent (assuming that Thai exportersmaintain a constant margin). This would make it easier for local citrus producers to compete. On the other hand, devaluation would raise the price of imported machinery and inputs,making it more difficult to replace and upgrade machinery. The net result of these two effectsis complex, but a first approximation can be obtained by comparing the share of costs going toimported goods and the share of output that is exported.
In general, it is safe to say that the fresh fruit and vegetable sector would benefit fromdevaluation. Producers for the domestic market would face less competition from imports, andexporters would receive higher dong prices for their sales. Furthermore, the costs ofmachinery and imported goods is a small part of their costs.
The canning industry is more vulnerable to devaluation. Although it is more dependent onimported machinery, capital costs are a very small portion of total costs. More important istheir dependence on cans. Because cans are made with imported metal, their price will risewith a devaluation. Cans are a relatively large component of costs of canned fruits andvegetables. As mentioned earlier, in canned pineapple production, cans represent almost 40percent of the costs of production.
At the same time, devaluation helps canneries on the revenue side. A company such as theTan Binh Foodstuffs Export Company (a branch of VEGETEXCO), for which exports make up95 percent of sales and for which imports make up less than 50 percent of costs, will generallybenefit from devaluation. Since export revenue exceeds the cost of the cans, the net effect ofdevaluation would be positive. A canner that produces for the domestic market will receivemore protection from imported cans, since the latter are made more expensive by thedevaluation. Thus, although the result is less assured than for fresh fruit and vegetableproducers, fruit and vegetable canners should also benefit from devaluation.
4.6 CONCLUSIONS AND RECOMMENDATIONS
The fruit and vegetable export processing subsector is the least developed of the foursubsectors. This is partly because, unlike the other three commodities, fruits and vegetablesdo not need to be processed (transformed) in order to be edible. Furthermore, virtually all ofthe domestic market and some of the export market is for fresh fruits and vegetables.
80
Furthermore, fruit and vegetables exports are small compared to rice, coffee, and seafoodexports.
More than the other export food processing sectors, fruit and vegetable export processorswere adversely affected by the collapse of the Soviet Union than the other three subsectors. Rice was not an export crop in the 1980s. Similarly, coffee exports were minimal in the mid-1980s and have grown during the economic reform process. Seafood exports were largeduring the 1980s, but even then they were oriented toward Japan and other marketeconomies.
Fruit and vegetable processors are recovering by seeking new markets and developing newproducts. The new markets include Japan, Taiwan, Hong Kong, Singapore, and to a lesserdegree the United States and other southeast Asian nations. The traditional exports of drybeans, bananas and pineapples have declined, while a variety of fresh and canned products. The average value of fruit and vegetable exports has been 57 percent higher during the 1990sthan it was in the 1980. This is the result of the economic reforms that have providedincentives for smaller private and provincial processor-exporters to seek out high-valuemarkets.
The subsector is overly focused on canned fruits and vegetables, in spite of the fact that themore rapidly growing markets are in fresh fruits and vegetables. Too often the assumption isthat exporting canned and frozen fruits and vegetables is more profitable and beneficial for theeconomy than exports of fresh fruits and vegetables. But demand growth is higher in freshproduce and, because of the skills required to market fresh produce the returns can be high.
Some of the main opportunities in fresh fruit and vegetable exports are temperate fruits andvegetables for Hong Kong and Singapore, and tropical fruits for Japan, Taiwan, South Korea,and North America. These patterns take advantage of the range of climatic conditions in VietNam,
One of the main constraints on the fruit and vegetable export processing sector is the lack ofvarieties that are suitable for processing and/or export. For example, pineapple processorsconsistently noted that the Queen Victoria variety grown in Viet Nam is too small and not juicyenough for international markets.
The government should expand its investment in research to select and develop suitablevarieties of fruit and vegetable for domestic consumption and for export. Citrus, pineapple,and banana are some of the more obvious examples, but nearly every product would benefitfrom the introduction of new varieties with higher yields and/or characteristics desired byimporting countries.
The government should facilitate the collection and dissemination of information about exportmarkets, particularly standards, health restrictions, prices, and demand patterns. This wouldmake it easier for Vietnamese processors and exporters to become informed about foreignmarkets and identify opportunities.
The government should facilitate the formation of an association of fruit and vegetable productexporters. As mentioned earlier, the association should be voluntary and open to all interested

81
parties. It should not be involved in setting terms for dealing with farmers or with importers, butrather should focus on information exchange, the identification of ways the government cansupport the subsector, and assistance to the government in the establishment of grades andcertification.

82
Table 4.1 Trends in fruit area
Year Citrus Banana Pineapple Mango Other fruit Total
Planted area (1000 hectares)
1985 12.7 33.1 202.5
1990 14.5 88.3 38.9 16.4 119.6 277.7
1995 59.5 91.8 24.0 21.1 150.0 346.4
Annual 16.7% 0.8% -3.2% 5.2% 4.6% 5.5%growth
Percentage of total fruit area
1985 6.3% 16.3% 100.0%
1990 5.2% 31.8% 14.0% 5.9% 43.1% 100.0%
1995 17.2% 26.5% 6.9% 6.1% 43.3% 100.0%Source: General Statistics Office, 1996, p. 109, 191, 197, 203, and 209.
Table 4.2 Trends in fruit and vegetable production (000 tons)
Year Citrus Banana Pineapple Mango Vegetables
1985 99.3 363.0 2,605.2
1986 112.0 374.9 2,938.1
1987 103.0 403.6 3,014.2
1988 103.1 420.5 2,909.1
1989 101.0 458.5 3,152.3
1990 119.2 1,221.4 467.9 173.0 3,224.9
1991 121.1 1,285.8 420.2 139.9 3,213.7
1992 160.1 1,365.5 264.2 112.1 3,304.9
1993 249.7 1,397.7 257.5 119.2 3,484.9
1994 285.6 1,375.1 235.0 135.5 3,783.8
1995 379.4 1,282.2 184.8 152.5 4,145.6
1996
Annual growth 14.3% 1.0% -6.5% -2.5% 4.8%Source: General Statistics Office, 1996, p. 109, 191, 197, 203, and 209.

83
Table 4.3 Geographic distribution of fruit and vegetable production in 1995 (000 tons)
Region Vegetables Citrus Banana Pineappl Mango e
North Uplands 635 25 124 7 4
Red River Delta 1,200 24 270 16 0
North Central Coast 336 23 90 19 0
South Central Coast 230 22 128 9 24
Central Highlands 282 0 21 1 1
Southeast 512 3 325 1 22
Mekong River Delta 950 301 323 131 101
Viet Nam 4,146 379 1,282 185 153
Percentage of national production
North Uplands 15.3% 6.6% 9.7% 3.8% 2.6%
Red River Delta 28.9% 6.3% 21.1% 8.6% 0.0%
North Central Coast 8.1% 6.1% 7.0% 10.3% 0.0%
South Central Coast 5.5% 5.8% 10.0% 4.9% 15.7%
Central Highlands 6.8% 0.0% 1.6% 0.5% 0.7%
Southeast 12.3% 0.8% 25.4% 0.5% 14.4%
Mekong River Delta 22.9% 79.4% 25.2% 70.8% 66.0%
Viet Nam 100.0% 100.0% 100.0% 100.0% 100.0%Source: General Statistics Office, 1996, p. 109, 191, 197, 203, and 209.
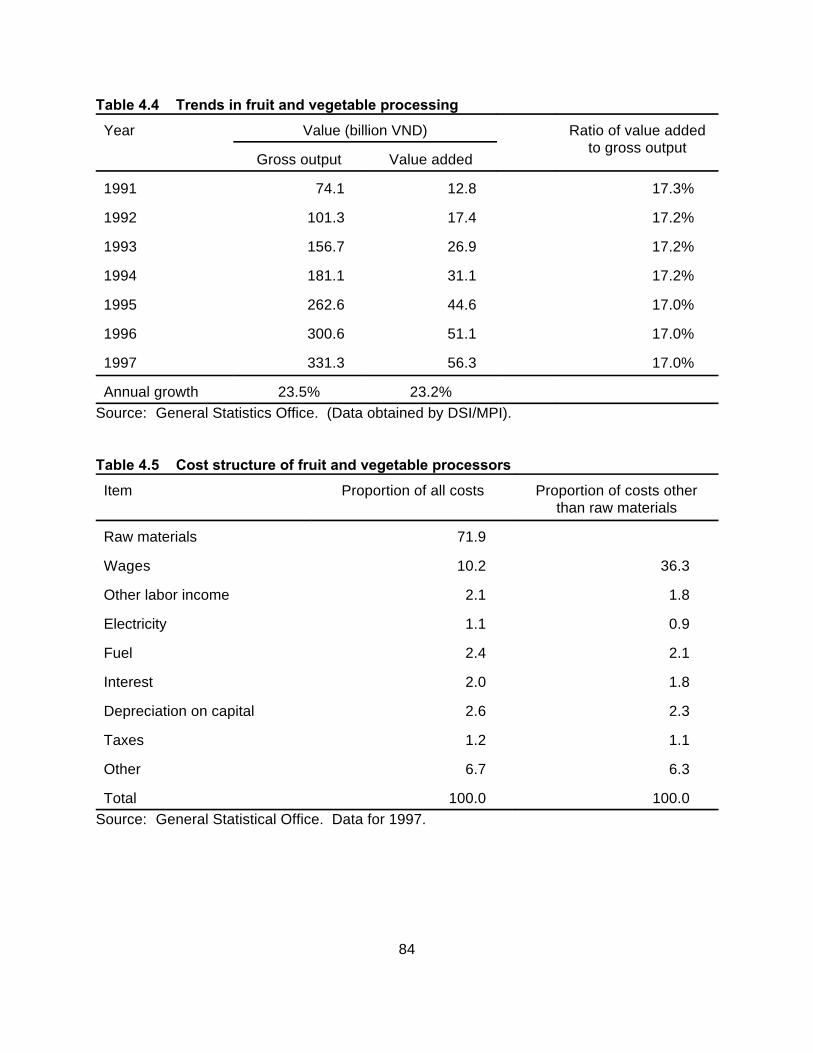
84
Table 4.4 Trends in fruit and vegetable processing
Year Value (billion VND) Ratio of value addedto gross output
Gross output Value added
1991 74.1 12.8 17.3%
1992 101.3 17.4 17.2%
1993 156.7 26.9 17.2%
1994 181.1 31.1 17.2%
1995 262.6 44.6 17.0%
1996 300.6 51.1 17.0%
1997 331.3 56.3 17.0%
Annual growth 23.5% 23.2%Source: General Statistics Office. (Data obtained by DSI/MPI).
Table 4.5 Cost structure of fruit and vegetable processors
Item Proportion of all costs Proportion of costs otherthan raw materials
Raw materials 71.9
Wages 10.2 36.3
Other labor income 2.1 1.8
Electricity 1.1 0.9
Fuel 2.4 2.1
Interest 2.0 1.8
Depreciation on capital 2.6 2.3
Taxes 1.2 1.1
Other 6.7 6.3
Total 100.0 100.0Source: General Statistical Office. Data for 1997.

85
Table 4.6 Domestic demand for vegetables in Viet Nam
Household type Per capita Population Total consumption Percent ofconsumption of (million) of vegetables total
vegetables (000 tons/year) demand(kg/person/yr)
Average 52.1 75.0 3,906 100.0
Income group
Poorest 20 % 46.1 15.0 691 17.7
2 50.5 15.0 758 19.4
3 53.3 15.0 799 20.5
4 55.4 15.0 832 21.3
Richest 20% 56.6 15.0 850 21.8
Region
North Uplands 65.5 12.8 835 21.4
Red River Delta 74.2 15.0 1,112 28.5
N. C. Coast 52.1 10.5 547 14.0
S. C. Coast 39.0 8.3 322 8.2
Central Highlands 49.1 3.0 147 3.8
Southeast 46.9 9.0 422 10.8
Mekong River Delta 34.4 16.5 568 14.5Source: 1994 Household Survey (GSO, 1998, p. 847-850).

86
Table 4.7 Trend in fruit and vegetable exports
Year Fruit and vegetable Total exports Fruit and vegetablesexports (million US$) as a percentage of
(million US$) total exports
1990 52.3 2,404 2.2%
1991 33.2 2,087 1.6%
1992 32.3 2,581 1.3%
1993 23.6 2,985 0.8%
1994 20.8 4,054 0.5%
1995 56.1 5,449 1.0%
1996 110.0 7,256 1.5%
1997 140.0 8,700 1.6%
Annual growth 15.1% 20.2%Source: General Statistics Office. Data assembled by DSI/MPI.

87
Table 4.8 Trend in the unit value of fruit and vegetable exports
Year Volume Value Unit value(thousand tons) (US$ million) (US$/ton)
1980 33.2 8.4 253.0
1981 44.7 17.6 393.7
1982 75.4 28.1 372.7
1983 51.2 19.0 371.1
1984 73.0 28.6 391.8
1985 104.6 35.5 339.4
1986 188.1 42.5 225.9
1987 167.4 44.5 265.8
1988 155.3 50.8 327.1
1989 139.8 40.6 290.4
1990 129.4 50.8 392.6
1991 81.4 41.2 506.1
1992 132.7 69.7 525.2
1993 117.5 55.7 474.0
1994 166.2 88.2 530.7
1995 179.6 99.3 552.9
1996 182.0 102.8 564.8
Average 103.3 31.6 323.1in 1980s
Average 141.3 72.5 506.6in 1990s
Source: Volume and value of fruit and vegetable exports from FAO, Agrostate database(World Wide Web address: apps.fao.org/cgi-bin/nph-db.pl?subset=agriculture). Unitvalue calculated as value divided by volume.
Note: There are discrepancies between these data (from FAO) and the data presented inTable 4.7 (from GSO). This difference may be partly or entirely due to differences inthe definition of fruit and vegetable exports, such as whether or not cashews,bananas, and canned goods are included.

88
Table 4.9 Import tariffs on fresh and dried fruits and vegetables
Code Description Import tariff
#070200 Fresh or frozen tomatoes 20%
#070300 Fresh or frozen bulb, onion, leek, garlic, etc. 20%
#070400 Fresh or frozen cabbage, kohlrabi, cauliflower, etc. 20%
#070500 Fresh or frozen salad, lettuce 20%
#070600 Fresh or frozen carrot, radish, and other edible tubers 20%
#070700 Fresh or frozen cucumber 20%
#070800 Fresh or frozen bean kinds 20%
#070900 Other fresh or frozen green vegetables 20%
#071000 Green vegetables (boiled or not), low frozen 20%
#071100 Contemporary treated vegetables not already eaten 20%
#071200 Dried vegetables, whole or bits, or powder 25%
#080300 Banana, fresh or dried 30%
#080400 Date-palm fruit, ananas, fig, Chinese pear, guava, 30%mango, mangosteen; fresh or dried
#080500 Orange fruits, fresh or dried 30%
#080600 Fresh or dried grape 30%
#080700 Melon, watermelon, fresh papaya 30%
#080800 Fresh apple, pear 30%
#080900 Fresh apricot, peach, cherry, plum 30%
#081000 Other fresh fruits 30%
#081310-30 Dried apricot, red plum, and apple 30%Source: Tariff rates promulgated in conjunction with Decree 54/CP of 28 August 1993, except
for last line which is from Decision No.848 TC/QD/TCT dated 1 November 1997.Statistics Publishing House, 1997, p. 22-23, 472.

89

90
Table 4.10 Import tariffs on fruits and vegetables products
Code Description Import tariff
#200100 Vegetables, fruits, nuts, and other edible plant parts 40%treated or stored by acetic acid or vinegar
#200200 Tomatoes treated or stored by all without vinegar and 40%acetic acid
#200300 Mushroom treated or stored by all without vinegar and 40%acetic acid
#200400 Other vegetables treated or stored by all without vinegar 40%and acetic acid low frozen
#200500 Other vegetables treated or stored by all without vinegar 40%and acetic acid; but not frozen
#200600 Fruits, nuts, fruit shells, and other plant parts treated by 40%sugar (extracted water, ice-frozen)
#200700 Confitures, fruit, agar-agar, sugar preserved fruits (of 40%citrus fruits), fruit juices, filtered and concentrated, fruitpaste boiled, not or mixed sugar or other sweets
#200800 Fruits, edible plant parts stored treated by other ways, 40%mixed or not sugar or other sweets, or alcohol; notdescribed elsewhere
#210320 Tomato mushroom sauces and other tomato sauces 40%Source: Tariff rates promulgated in conjunction with Decree 54/CP of 28 August 1993, except
for last line which is from Decision No.848 TC/QD/TCT dated 1 November 1997.Statistics Publishing House, 1997, p. 26-27, 472.

91
5. SEAFOOD PROCESSING
The Vietnamese seafood subsector has grown rapidly: since 1985, the value of seafood outputhas grown by an average of 5 percent per year. The export performance of this sector hasbeen even more impressive, averaging 20 percent per year over the same period. The valueof seafood exports reached US$ 776 million in 1997. By comparison, rice exports in 1997were around US$ 900 million.
For the purposes of this report, seafood is defined broadly as food derived from fish,crustaceans, and other aquatic animals, whether from the ocean or from freshwater. Thefisheries industry includes marine fisheries, marine (or coastal) aquaculture, freshwaterfisheries, and freshwater aquaculture. Marine and freshwater fisheries are sometimes called“capture fisheries” to distinguish them from aquaculture.
5.1. BACKGROUND
Unlike many of the export sectors, the seafood industry was not oriented toward supplying theeastern bloc countries during the 1970s and 1980s. Japan has been the main market forVietnamese seafood throughout this period and remains the most important outlet for seafoodexports today. The seafood sector has, however, seen dramatic changes. During the 1980sand early 1990s, the only legal exporter of seafood was SEAPRODEX, a state-ownedenterprise (SOE) managed by the Ministry of Fisheries. In the 1980, the government usedSEAPRODEX as an experiment in SOE reform. Initially, SEAPRODEX was given greaterautonomy in its management and required to cover its own costs from the export revenue itgenerated.
In 1994, the reforms were extended by allowing other companies, private and SOE, to exportdirectly. The number of exporters has grown to over 100 and a large number of new seafoodprocessors have entered the field. Most of these new entrants have been provincial stateenterprises and private enterprises, particularly in the Mekong River Delta and the southerncoast. The market share of SEAPRODEX in seafood exports has fallen sharply, reaching 17percent in 1997. The general impression among seafood processors is that the private sectoris growing faster than the SOE sector and that the competition for raw material has intensifiedin the last several years.
5.2. SEAFOOD PRODUCTION AND MARKETING
5.2.1. Production trends
Gross output of fisheries has risen from 0.82 million tons in 1986 to 1.6 million tons in 1997(VEN, 1998). This represents an annual growth rate of 6.2 percent, but even this figureunderstates the growth in the economic importance of fisheries. The value of exports hasincreased almost eight fold since 1986, growing at 20 percent per year since that date. Marinecapture fisheries account for about two third of the total volume, but the importance ofaquaculture is growing. Fisheries researchers believe that marine capture fisheries may be

92
close to the maximum sustainable yield, but aquaculture has the potential to continue its rapidpace of expansion (ADB, 1996 and VEN, 1998).
5.2.2. Fisheries production
The national fishing fleet contains an estimated 93,600 boats. About one third of these(31,500) are not motorized. These boats are used for near shore fishing using simpletechnology and generating only modest returns for the fisherman. The bulk of the fleet(62,000 vessels) consist of larger motorized fishing boats, generally 10-20 meters long with 20-40 hp inboard engines. Only 100 vessels are equipped for deep-sea fishing. These boatshave 500 hp engines and are often owned by state-owned enterprises. The average boat andengine size tends to be larger in the south than in the north. About half of the fishing fleet is inthe South Central Coast, with Da Nang ranking as the largest marine fishing port (ADB, 1995,p. 2-6).
The marine fisheries catch in 1995 was 929 million tons, compared to the estimatedmaximum sustainable yield is 1.3 million tons per year. The situation is not as favorable assuggested by these figures, however. To begin with, because of the small size of the majorityof the boats, much of the fishing activities are concentrated close to shore. It is estimated that86 percent of the catch comes from waters less than 30 m in depth. In these areas, fishingactivity may be reaching or exceeding maximum sustainable yield. Furthermore, the marinecatch is rising at 5 percent per year, so it may reach 1.3 million tons within five years.
The marine fishing industry follows a distinct seasonal pattern. In most regions, the mainfishing season occurs during the dry season (November to April), when fishing activity isconcentrated around the offshore islands. During the rainy season, the boats move closer toshore following as a number of species in their spawning migration. The main species of fishare tuna, bonito, sardine, mackerel, gizzard shad, and giant catfish.
There are also regional differences. The marine fishing grounds of Viet Nam are usuallydivided into four areas: the Tonkin Bay in the north, the central coast, the southeastern coast,and the southwestern coast. The Tonkin Bay fishing industry is relatively small, accounting forjust 13 percent of the marine fishing vessels and 12 percent of the annual catch. The water isless productive, and Vietnamese fishing boats face intense competition from Chinese andHong Kong boats. The central coast boast the largest fishing fleet, with 50 percent of thevessels, though it accounts for just 21 percent of the catch. The continental shelf is verynarrow in this region, so the fishing industry tends to focus on large pelagic (deep sea) fishrather than demersal (bottom-feeding) fish. As in the north, fishing on the central coast isdisrupted annually by typhoons.
The southeast region is the most productive due to nutrients flowing from the Mekong River, awide continental shelf, and little international competition. With just 16 percent of the vessels,this region accounts for 43 percent of the catch. The fishing boats in this region tend to besomewhat larger and more powerful than those in the center and north. The southwest regioninvolves fishing in the Gulf of Thailand, using ports in Kien Giang in the Mekong Delta. Itaccounts for 21 percent of the vessels and 23 percent of the catch (IFES, 1995).

One fish processor who does buy direct, does so by providing the credit, ice, fuel, and boat20
repair services needed by fishermen.
93
The output of aquaculture and inland fisheries was 409 thousand tons, representing about 31percent of the total fisheries catch (see Table 5.1). Inland fisheries are an important sourceof income in some areas, but many of the main rivers are either overfished or environmentallydamaged. The damage is related to the dyke systems that interfere with spawning patternsand the run-off from agricultural chemicals. Although statistics are hard to find, it appears thatinland fisheries produce less than aquaculture.
Aquaculture production is complex and involves a variety of species and methods. Coastalaquaculture includes marine fish cages, pearl oyster production, lagoon-based extensiveaquaculture, brackishwater fishponds, and shrimp farming. Near Danang, fish farmers buyyellowtail fish fry from China, raise them in cages, and export the harvested fish to Japan. Inthe Mekong Delta, shrimp farms cover 200 thousand hectares and produce 80 thousand tonsof shrimp per year. Freshwater fish culture is thought to produce 275 thousand tons of fish,including 100 thousand tons from fishponds and 24 thousand tons from freshwater fish cages. There are an estimated 450 freshwater hatcheries producing 6 billion fish larvae and fish fryeach year. The most common fish for freshwater aquaculture are the Chinese carp speciesand the Indian carp species.
5.2.3. Marketing channels
Given the numerous marketing channels for each type of fishery production, it is only possibleto provide the broad outlines here. The inland fishery activity is mostly on a small scale, sothat the marketing is done through a local trader or directly by a member of the fisherman’sfamily (often his wife). Aquaculture activities are more likely to be commercial and sometimesfor export, most notably shrimp farming. Normally, shrimp farmers sell to agents representingwholesalers, who in turn sell to processors or processor/exporters.
For the marine fishing industry, the first link in the marketing channel is the private trader. Therelationships between the traders and fishermen are long-standing and complex, based on aweb of debts and obligations. Traders provide credit to fishermen for ice, fuel, boat repairs,and new equipment. In exchange, the fishermen are bound to sell a portion of the catch tothat trader, sometimes at a fixed price. The relationship need not be exclusive in that a givenfisherman may have relationships with more than one trader. Traders sell to wholesalers orone of their agents. Unlike the traders who specialize in a set of fishermen and purchase avariety of species, the wholesaler generally specializes in one product and perhaps one market(e.g. restaurants, fish oil factories, export processing plants). Seafood processors buy fromwholesalers and traders, but report that it is almost impossible to buy directly from fishermenbecause of the fisherman-trader bond . 20
Perhaps 90 percent of the marine fisheries catch is consumed within Viet Nam, either in freshform, dried, or as fish sauce. The remaining 10 percent is exported, usually in frozen form ordried form. Processors that export tend to be specialized in that area, selling 90-100 percentof their output to other countries.

94
5.3. SEAFOOD PROCESSING
5.3.1. Structure of seafood processing sector
As mentioned above, seafood processing plants tend to specialize in catering to either thedomestic market or the export market. The ADB (1996: 4-14) estimates that there are morethan 350 processing plants producing fish sauce, fish paste, and dried fish for the domesticmarket. There are 40-50 fish sauce processing plants produce an estimated 150 million litersof fish sauce. Normally, the plants have capacities of 0.5-2 million liters, but some havecapacities of 6 million liters per year. Dried fish production is often done on a small scale usingsun drying on simple racks. Dried fish from the Mekong Delta is transported to fish sauceplants in the north.
There are 214 seafood processors producing for the export market, although not all exportdirectly. These processors are located in 33 provinces, primarily on the coast or in one of thetwo main cities. As shown in Table 5.4, Ho Chi Minh City has the largest number of seafoodprocessors serving the export market, with 51 processors or 24 percent of the total. Otherprovinces with large numbers of processors include Kanh Hoa (25), Ca Mau Bac Lieu (17), andBa Ria - Vung Tau (14). These top four seafood processing areas account for half Viet Nam’sseafood processors producing for the export market.
Table 5.4 also shows the number and proportion of export seafood processors in eachprovince that were licensed to export to the European Union in late 1997. Overall, 61 seafoodprocessors (28 percent) were licensed for export to the EU. The proportion varies acrossprovinces, being highest in “Other Mekong Delta” provinces. This category includes An Giang,Tien Giang, Vinh Long, and Tra Vinh provinces. The proportion of EU licensed processors is50 percent in Hai Phong, Binh Dinh, and Can Tho.
The same data is presented by region in Table 5.5. This table highlights the concentration ofexport-oriented seafood processors in the southern part of Viet Nam. Fully 80 percent of theprocessors and 91 percent of the EU-licensed processors are located in the three southernregions.
As of 1995, the proportion of state-owned export processors (including both central andprovincial) was 81 percent, the remaining 19 percent being private enterprises . There are nostatistics on the proportion of production or exports generated by each type of processor. Onthe one hand, the state enterprises tend to be larger than the private ones, so we wouldexpect the SOEs share of output to be greater than 81 percent. On the other hand, there is ageneral perception among processors that the private sector is growing more rapidly than thestate sector.
The largest seafood processor-exporter is SEAPRODEX. Formed in 1978, SEAPRODEXoriginally had responsibility for all seafood exports. In the 1980s, it became one of the firststate-owned enterprises to be held responsible for covering its own expenses. Its monopolyon seafood exports was removed in 1994. The number of seafood exporters rose quickly andthe market share of SEAPRODEX has declined to around 17 percent.

95
5.3.2. Processing margins
The processing margin for seafood varies depending on the product. For frozen shrimp, thecost of the raw material accounts for 80 percent of the value of the final product. Labor anddepreciation are each roughly 10 percent in frozen shrimp processing. Dried products varywidely, but one company reports that raw materials represent 60 percent of the value of itsdried squid products. Although the drying process is quite simple, laying the squid out to dryand collecting them is a relatively labor-intensive process. SEAPRODEX produces somepackaged consumer goods such as spring rolls for the Japanese market. In this case, the rawmaterial costs are said to be just 50 percent of the ex-factory value of the final product.
These figures illustrate the importance of procurement skills for the competitiveness ofindividual companies. Small errors in purchasing can have large consequences in terms of theprofitability of seafood processing, particularly in the case of frozen shrimp production. Indeed,complaints about “excessive” competition for seafood raw material among processors werealmost universal among interviews with seafood processors.
5.4. SEAFOOD CONSUMPTION
5.4.1. Domestic consumption
According to the 1994 GSO Household Survey, with a sample of 91 thousand households,Vietnamese households consume an average 15 kg of fish and shrimp per person per year. Not surprisingly, consumption of these items rises with income. Consumption of fish andshrimp is 8.5 kg per capita among the poorest 20 percent of the households, rising to 21.4 kgper capita among the richest 20 percent (see Table 5.7). This pattern suggests that theincome elasticity of demand is close to 1.0 at low incomes but falls below that level at middleand higher incomes.
Fish and shrimp consumption show even greater variation across regions. Households in theSouth Central Coast and the Mekong Delta consume more than 20 kg per capita, while thosein the Northern Uplands and the Red River Delta consume less than 10 kg per capita. Thispresumably reflects regional differences in consumer preferences, prices, and availability.
By far the most commonly consumed processed seafood product is fish sauce. According tothe 1994 Household Survey, the average consumption is 4.9 liters per capita. Althoughconsumption rises somewhat with income, there is less variation with income than in the caseof fish and shrimp consumption. The implication is that the income elasticity of demand for fishsauce is lower than that of fish and shrimp demand.
Detailed information on the breakdown of seafood demand into different types (fresh, canned,dried, frozen, etc.) is not available, but interviews with fishery industry participants and informalvisits to urban retail outlets suggests a number of patterns. First, the bulk of seafoodconsumption is undoubtedly in fresh form, being consumed near the place where it wasbrought to land or harvested. The inventory of retail food stores confirms that fish sauce is themost important processed seafood product in the consumption basket of Vietnamesehouseholds. Fish sauce is sold in 750-1000 ml bottles in even the smallest retail food stores.
96
Furthermore, the importance of this product is reflected in both the shelf space allocated to itand the large number of brands. In one large supermarket, over 20 brands of fish sauce wereavailable. All the brands were Vietnamese.
Another important processed seafood product is canned sardines, most commonly packed intomato sauce. In this market, Vietnamese brands such as Saki, Sun-Up, and CANFOOCOcompete with Thai brands such as Three Lady Cooks and Pigeon, as well as other brandsfrom Indonesia, Taiwan, and Malaysia. It appears that Vietnamese brands have a minorityposition in this market. The Three Lady Cooks brand, for example, can be found in almost anyretail food store and at sidewalk vending stands, whereas the Vietnamese brands are onlyfound in larger stores with a wider variety. Canned tuna is a much smaller market thansardines, but the competing brands are similar. Canned fish and squid are even more rare,being found only in the largest supermarkets.
Frozen fish products are not available in small and medium food stores, but they are availablein supermarkets and in specialized seafood stores. One fish store in Ho Chi Minh City had anentire freezer full of about two dozen frozen seafood products produced including spring rollsand various types of dumplings. All the products were supplied by one company, AgrexSaigon, a state-owned enterprise managed by the Ho Chi Minh City municipal government. Ingeneral, it seems likely that such prepared frozen foods are purchased only by high-incomeurban households or for special events. 5.4.2. Seafood export market
Seafood exports from Viet Nam have shown remarkably high growth rates, sustained for morethan a decade. As shown in Table 5.8, seafood exports have risen from US$ 90 million in1985 to US$ 776 million in 1997, representing a 20 percent annual growth rate over the 12-year period. The table also shows that this growth is relatively broad based, with exports offrozen shrimp, frozen squid, frozen fish, and dried products all growing at over 20 percent peryear over the period 1985-95. Seafood exports account for 10-12 percent of total exports,making seafood the third largest export after crude oil and rice.
In the 1980s, SEAPRODEX had a legal monopoly over seafood exports. In addition, Viet Namexported seafood to just three countries: Japan, Hong Kong, and Taiwan. Today, there areover 100 exporters, and Vietnamese seafood is shipped to 28 countries. Japan continues todominate the list of importers: in 1995, slightly more than half of Vietnamese seafood exportswere shipped to Japan. Europe is a relatively new market for Vietnamese seafood. Onlyrecently have Vietnamese seafood processors been licensed for export to the EuropeanUnion, passing strict hygiene standards. The share of exports going to Europe may beincreasing: in 1997, Japan accounted for just 40 percent of Vietnamese seafood exports, whileexports to Europe represented 25 percent of the total.
Seafood exports are dominated by frozen shrimp. As shown in Table 5.9, frozen shrimprepresents 62 percent of the value and 52 percent of the volume of seafood exports. Frozensquid and fish represent 8 and 13 percent of the value of exports, respectively. Theproportions of the different products demanded by different countries are relatively similar. Forexample, shrimp is the main item for almost all the main markets for Vietnamese seafood. One exception is Taiwan, which imports more fish than shrimp from Viet Nam.

This survey was carried out in 1992-93 using a sample of 4800 households. The income21
elasticity was estimated by regression the budget share of fish and seafood as a function oftotal expenditure, local prices, and a variety of household characteristics.
97
Data on export destinations for 1997 is available from SEAPRODEX, the largest seafoodexporter in Viet Nam. As shown in Table 5.10, the exports of SEAPRODEX reflect the nationalpattern, with Japan accounting for about half of exports. This table also highlights the widevariation in the unit value (average value per ton) of seafood exports. As a general rule, unitvalues are generally highest for exports to high-income countries. SEAPRODEX exports tothe industrialized countries are generally above US$ 5,000 per ton.
5.5. PROSPECTS AND POLICY ISSUES
5.5.1. Prospects for the domestic market
The most important determinants of food demand in the long run are income growth,urbanization, and population growth. Econometric analysis of demand patterns using the VietNam Living Standards Survey suggests that the income elasticity of demand for seafood21
products is 1.05. This implies that, other things being equal, the per capita domestic demandon seafood can be expected to rise approximately at the rate of per capita income. Theanalysis also reveals that urban households consume somewhat less seafood than ruralhouseholds, presumably due to the proximity of the latter to sources of fresh seafood. Theeffect, however, is not large enough to make a noticeable difference, particularly given therelatively low pace of urbanization in Viet Nam. These results suggests that seafood demandwill follow the rate of population growth. This rate is about 2 percent currently but is expectedto fall to close to 1.2-1.6 percent for the period 2005-2010.
Although the per capita demand may not change much, we can expect the composition ofseafood demand to shift with higher incomes. For example, we can expect a gradual shifttoward the more expensive types of seafood, including shrimp. Currently, the demand forfrozen and semi-prepared seafood products is negligible. As households freezer capacityincreases and as households change their shopping patterns to make purchases lessfrequently, we would expect frozen seafood demand to rise, primarily in the largest cities. Furthermore, as incomes rise the convenience of semi-prepared items such as frozen springrolls and fish fillets will begin to outweigh the additional cost. Given the very low base, thisprocess is expected to be gradual.
5.5.2. Prospects for export markets
Japan is by far the largest market for fisheries products in the world, importing 3.3 million tonsworth almost $US 17 billion in 1994. Only 2 percent of these imports come from Viet Nam,suggesting that there is room for significant expansion provided that Viet Nam can competesuccessfully with other suppliers. The import demand from Japan appears to be stable,showing neither growth nor contraction. Seafood consumption is declining as a result of“westernization” of food consumption patterns, including growing demand for bread, meat, anddairy products. This trend, however, is offset by declining fisheries production due to risinglabor costs and import competition.

98
Japanese seafood consumers are considered very demanding and well informed. They placea high priority on cleanliness and hygiene and, for this reason, tend to prefer seafood caughtby Japanese fishing vessels. Shrimp is the main product purchased from Viet Nam. In thismarket, Viet Nam represents less than 20 percent of Japan’s imports and competes withIndonesia, Thailand, India, and China. In Japan, fish is often consumed raw as sushi orsashimi, importers place a premium on products that are fresh and completely free of bacterialcontamination.
Europe is a large and growing market for imported seafood. Partly as a result of decliningdomestic fisheries industries, the level of imports is rising. The largest importers are Spain,France, and Italy. Current imports from Viet Nam are dominated by frozen shrimp, in partbecause transportation costs are a smaller share of the high-valued products. Theharmonization of seafood import requirements has benefitted seafood exporters such as VietNam. Although the licensing requirements for the European Union are strict, one approvalopens up the markets for the continent.
The United States is also a very large market for seafood (imports are US$ 12 billion), amarket that Viet Nam has only started to exploit. Seafood consumers in the United States areconsidered less informed than those in Japan, since seafood has always played a smaller rolein US diets. The demand for shrimp, the largest seafood import, tends to be in moreprocessed form, such as peeled and/or deveined. With regard to fish, US consumers tend toprefer fish that are white, bland, and have few bones.
The main limitations on Vietnamese exports is meeting the sanitary requirements of theimporting countries and establishing a reputation with importers. A major task of seafoodprocessors is to achieve certification to export to the large markets.
5.5.3. Quality issues
In 1994, the National Fisheries Inspection Quality Assurance Center (NAFIQACEN) wasformed to establish standards, regulate seafood processors, and issue quality and healthcertification to Vietnamese seafood processors. NAFIQACEN was created in recognition ofthe need for an independent body to regulate food quality and certify processors. In doing so,it reduces the transaction costs for importers by providing information about products they arepurchasing. This is an example of a positive and constructive role for the government infacilitating the economy in the new market mechanism.
Seafood inspection and regulations in all the industrialized countries are being revised inaccordance with a system called Hazard Analysis Critical Control Point (HACCP). HACCP is aset of procedures for identifying, correcting, monitoring, and documenting possible sources ofcontamination. Once established, a HACCP system does not require much time but has beenshown effective in minimizing the risk of contamination. Fisheries experts say thatVietnamese legislation on seafood health and safety is sufficient, but the capacity to enforcethose regulations is weak.
Importers have their own health and safety requirements, and they vary across importers. InJapan, the importer has primary responsibility for ensuring quality. Generally, when workingwith a new exporter, the importer will visit the processing plant, inspect the equipment, and

99
examine the raw material available. If these are acceptable, the importer negotiates a contractand leaves a technician at the plant to monitor the processing. Sometimes, a referencesample of processed product is taken and later compared with the export shipment. Thissample serves as a standard against which to compare the eventual shipment. In subsequentshipments, the importer reduces the level of monitoring. Japanese importers are said to placegreat weight on freshness, as determined by appearance, texture, and smell.
Certification by the United States and by Europe tends to be based more on bacterial countsand other scientific measures rather than smell and appearance. The European Union (EU)certifies a local organization (NAFIQACEN in this case) to monitor and certify local processingplants following criteria set by the EU. It may send EU inspectors to verify that certified plantsdo indeed meet the required standards. In early 1998, the EU announced that it would carryout an inspection of Vietnamese seafood processors. NAFIQACEN decertified a large numberof processors, apparently in order to protect its own reputation as a certifying agency. Thishas disrupted seafood exports to the EU, although it is hoped that many of these processorswill be recertified following the inspection.
The United States seafood quality is under the jurisdiction of the Food and Drug Administration(FDA). The importer is held responsible for ensuring that the imported product meets FDAhealth standards, subject to random inspections by the FDA. A recent report by the GeneralAccounting Office (a U.S. government institute that evaluates the effectiveness of publicagencies) criticized the FDA for inspecting just 1.7 percent of shipments of imported seafood,fruits, and vegetables. The report argued that since imports now represent over half of theseafood consumed in the United States, the FDA should be given authority and budget tocontrol the quality of imported food. In particular, the report recommended that the FDA begiven the authority to require processors and exporters in other countries to adopt safepractices for seafood, fruits, and vegetables shipped to the United States (Washington Post,1998),
5.5.4. Upgrading the seafood processing industry
There are two areas where Vietnamese seafood processor need to upgrade their facilities andskills: the improvement of hygienic conditions within the plant and the ability to produce value-added products.
In the area of plant hygiene, there are numerous steps. First, there is a need for investment inwaste water treatment in the form of either settling ponds or filtration systems. Second, thesurfaces in the plant need to be gradually converted to tile, stainless steel, and other surfacesthat can be cleaned more effectively. Third, cleaning procedures themselves would be moreeffective carried out with hot water under pressure rather than room-temperature tap water. Fourth, although all plants have a quality control section, the lack of laboratory supplieshampers their ability to scientifically test samples. Fifth, few seafood processing plants haveadequate facilities to chill raw material until processing. And finally, the capacity of iceproduction is below what is considered necessary by international standards.
The second area of investment is in equipment and skills to produce so-called value-addedproducts. This includes machinery for making fillets, spring rolls, dumplings, and otherconsumer products. This includes machinery for higher quality packaging.
100
It is not, however, the role of the government to provide these equipment out of the statebudget. All of these are commercial investments that generate returns for the processor andthus do not need to be subsidized. The market incentives for installing health and safetyequipment comes from the advantages of certification for export to Japan, the EU, or theUnited States. Importers are in a better position than the government to help processorsdecide the most cost-effective way to meet these requirements. Similarly, investing inmachinery to produce consumer goods requires extensive information about the demands ofthe market, the capacity of different machines, and the training necessary to operate themefficiently. All of these are more likely to come from a Japanese or Taiwanese importer thanfrom a planning official in Hanoi.
5.5.5. Role of state-owned enterprises
There are about 200 seafood processors that produce for export. As noted above, themajority are state-owned enterprises, mostly owned by provincial People’s Committees. Thispattern is the legacy of socialist central planning in which all medium- to large-scaleenterprises were managed by the state. During the 1980s, SEAPRODEX had a monopoly ofseafood exports. In the late 1980s, the state-owned seafood processors were allowed toretain the foreign exchange they earned from exports. Since the exchange rate was severelyovervalued, there was little incentive to sell the earnings back to the state. Instead, the

101
Box 5.1: Shrimp industry in China
By the 1970s, China’s marine shrimp resources were fully exploited at the same time thatworld demand, and Asian demand in particular, was growing. This created incentives forprivate and public enterprises in China to invest in aquaculture shrimp production. Duringthe 1980s, cultured shrimp production grew from less than 26 thousand tons to 200thousand tons, while exports expanded from 22 thousand tons to 123 thousand tons.
The government played a key role in starting the shrimp culture industry, creating a shrimpSOE, providing low interest loans and tax benefits to producers and processors, andcreating a highly effective system of research and extension for aquaculture. These policymeasures built on existing cost advantages related to China’s long coastline, low laborcosts, and an elaborate system of dykes that facilitates the creation of shrimp ponds. Onthe other hand, the relatively cool climate means that the growing season in much of Chinais just 4-5 months. The strongly seasonal production cycle creates a problem forprocessors and exporters. Although China has become a leading supplier of shrimp to theUnited States and Japan, it is a low-quality producer of undifferentiated products, exportingmainly 2-kg blocks of frozen shrimp.
Of the 14 cases studies of successful expansion of a high-value agricultural commoditystudied by Jaffee (1992), the case of Chinese shrimp exports is the only one in which thegovernment took a leading role in direct production and marketing. It is also one of the fewin which little progress has been made in moving to more differentiated value-addedproduct.
earnings were used to import scarce consumer goods for resale. This system was quiteprofitable and generated a large increase in installed capacity among the state enterprises. Asa result, there is a problem of over-capacity in the state-owned seafood processing sector.
The fact that almost all the seafood processors are managed by the provincial authorities putsa constraint on the development of the sector. On the one hand, the management of theprocessing enterprises is selected by the provincial People’s Committees. In some cases, thePeople’s Committees have brought in qualified managers from outside. In other cases, themanagers are unqualified, having been selected on the basis of other criteria. A relatedproblem is that, as a unit of the People’s Committee, these processors are often not able toaccumulate retained earnings for investment. Instead, retained earnings are absorbed by thePeople’s Committee. This legal status also makes it difficult or impossible to obtain credit fromcommercial banks. As a result, the only source of capital for these enterprises is the People’sCommittee, that must approve and fund any capital spending by seafood processors.
Seafood processors (both private and state) made a number of observations about thedifferences between the two:
C The most common comment was that private enterprises are able to make decisionsmore quickly. State enterprises must get decisions approved by political authorities andoccasionally miss opportunities as a result of the delay.

102
Box 5.2: Shrimp industry in Thailand
Like China, Thailand reached the maximum capacity of its marine shrimp resources in theearly 1970s. Also like China, it benefitted from relatively low labor costs and a largeirrigated delta area where shrimp could be grown. Mirroring the growth in Chinese shrimpexports, Thai shrimp exports rose from less than 20 thousand tons to over 75 thousand tonsin the 1980s. And finally, in Thailand (as in China), shrimp aquaculture was initiallycharacterized by low yields (under 300 kg/ha), but the adoption of larger varieties of shrimpand more intensive management has resulted in yields of over 800 kg/ha (Jaffee, 1992).
A major difference between the Chinese and Thai shrimp industries has been the role of thegovernment. In Thailand, the government was not directly involved in production,processing, and export. Instead, it limited its involvement to aquaculture research andextension, factory inspection and certification services, and some investment in cold storagefacilities. The government also managed buffer stocks in an attempt to stabilize prices. Shrimp raising, processing, and export is carried out almost entirely by aquaculture farmersand private enterprises.
Another difference with China is that the Thai shrimp industry has developed a wide rangeof value-added products for export, including cooked and peeled shrimp, peeled tempura,battered and breaded shrimp, spring rolls, dumplings, and shrimp skewers. These value-added shrimp products are exported to Japan, the United States, and Europe. According toJaffee (1992, p 97), “Thailand has developed the most diversified shrimp product mix andmarket outlets of any of the Asian shrimp-exporting countries.” It is tempting to concludethat Thailand’s ability to diversify into value-added products is related to a more flexiblemarket-oriented processing and export industry.
C State enterprises are less flexible in their labor management. They are required bystatute to fill certain positions, regardless of the size of the enterprise. Furthermore, itis more difficult for state enterprises to lay off workers.
C Another frequent comment was that a manager at a state enterprises must make aprofit on each transaction, at the risk of losing his job or (in extreme cases) beingarrested for misuse of state funds. As a result, SOE managers may abrogate acontract in order to avoid losing money. By contrast, a private manager can decide tolose money on one transaction if it is necessary to develop or maintain a reputation forreliability. In the long run, this is an advantage for private enterprises.
C Managers at state-owned enterprises argue that part of the profitability and success ofprivate processors is due to their ability to evade taxes and to smuggle products intoChina. By contrast, SOEs are required to obtain receipts for every purchase, even ifrequiring a receipt means paying a higher price for the input (suppliers can more easilyavoid taxes if they do not provide an official “red receipt”.

103
International experience suggests that private enterprises may be more likely to seek out andtake advantages of opportunities to export new products, particularly more differentiatedproducts with a higher value added. The comparison of the shrimp industries in China andThailand illustrates this point (see Box 5.1 and 5.2).
5.5.6. Effect of trade policy
Currently, there is a 20 percent import tariff on fish, crustaceans, and molluscs, whether live,frozen, dried, or processed in any other way (Decree No. 82 of 13 December 1996, as cited inStatistics Publishing House, 1997, p. 397). Under the Asian Free Trade Agreement, this ratewould be reduced gradually toward zero. In general, the seafood processing industry will notbe adversely affected by this import liberalization. The existence of sizable exports of frozenshrimp, frozen squid, and fish is a reliable sign that Viet Nam has a comparative advantage infisheries. Furthermore, the perishability of unprocessed seafood products guarantees thatseafood processing will remain close to its source of raw material, that is in Viet Nam.
To the extent that other southeast Asian countries reduce their import barriers, Vietnameseseafood exports to some of its ASEAN neighbors could increase. This effect is likely to belimited, however, since many of the other members of ASEAN are already seafood exporters,notably Thailand and Indonesia.
There are two areas where import liberalization could erode the market share of Vietnameseseafood processors. The first area is canned seafood. As noted above, Vietnamese seafoodcanners already faces strong competition from Thailand and Indonesia in canned sardines andtuna even within the country. To the extent that these imports pay duties now and will pay lessunder AFTA, consumers will benefit at the expense of domestic seafood canners. It is worthnoting that domestic seafood canning is a relatively small portion of the demand for seafood inViet Nam.
The second area where import liberalization may allow increased import of processed seafoodis in specialty and convenience food. Semi-prepared food, particularly that involving numerousingredients and some high-technology processing, may be imported more easily under theAFTA. The volumes will be quite small and concentrated in the larger cities. Although seafoodprocessors may see this as a sign that import protection is needed, they should instead view itas providing free information about the potential market for value-added products in thedomestic market.
5.6 CONCLUSIONS AND RECOMMENDATIONS
The seafood processing sector has grown rapidly on the basis of low wages, a long coastline,and proximity to important markets in Asia, primarily Japan. The adjustment of the seafoodsubsector to the doi moi reforms was less painful than that of the fruits and vegetablessubsector because it was not closely tied to trade with the eastern bloc in the 1980s.
The seafood processing sector is dependent on the continued availability of seafood atreasonable prices. Although Thailand has developed a tuna canning industry based on raw

104
materials caught outside its waters, this is unusual. In general, the success of the seafood processing industry is tied to the success of the fisheries sector, including aquaculture.
The biggest threat to the subsector growth is the sustainability of marine seafood resources. Estimates of the maximum sustainable yield are not very accurate, but most studies agree thatViet Nam is at or will soon arrive at the capacity of the coastal waters. Spectacular collapsesof North Sea (Europe) and Grand Banks (North America) fish stocks demonstrate that under-regulated fishing can result in the rapid disappearance of marine resources.
Further growth in seafood production and exports will depend to an increasing extent onaquaculture. The process of switching to aquaculture as the basis of seafood processing andexport growth has already occurred in China and Thailand. In both countries, the transitionwas facilitated by strong support for aquaculture research and extension.
The development of shrimp aquaculture is vulnerable to epidemic diseases. A sizableTaiwanese shrimp export subsector was completed undermined by problems related todisease and pollution. Smaller scale disease problems are already appearing in theVietnamese press.
The government should increase its efforts to study and monitor the maximum sustainableyield of different types of marine species and in different regions. This information is vital inorder to design fishing regulations that protect the marine resources without unnecessarilylimiting the growth of the marine fisheries industry.
The government should strengthen its enforcement of existing regulations designed to protectfishery resources. Fisheries specialists believe that the current regulatory system is adequate,given the limited information available, but that enforcement is weak and inconsistent. Although enforcement may be expensive, the costs are small relative to the value of theresource being protected.
The government should increase its investment in research and extension in aquaculture. Atleast three areas should receive special attention. First, shrimp yields are low by Thai andChinese standards and will need to be raised to maintain competitiveness. Second, researchand extension efforts are needed in monitoring and controlling contagious diseases(particularly in shrimp). And third, the development of improved breeds would facilitate thetransition to a more aquaculture-based seafood subsector.
The government should facilitate the collection, analysis, and dissemination of information onseafood export markets, particularly in the area of health and safety regulations of importers. Health and safety regulations are tighter on seafood than any of the other three subsectors. Furthermore, the regulations vary widely from one importer to another. Initially, informationcould be collected and disseminated by a government institute, but eventually this functionshould be taken over by a seafood exporters association.

105
Table 5.1 Trends in fishery production
Year Marine Aquaculture and Total fisheries Percent fromfisheries inland fisheries catch marine fisheries(000 tons) (000 tons) (000 tons)
1986 570.5 234.9 805.4 70.8%
1987 611.8 242.2 854.0 71.6%
1988 630.6 233.1 863.7 73.0%
1989 626.7 247.1 873.8 71.7%
1990 641.5 300.8 942.3 68.1%
1991 699.4 341.0 1,040.4 67.2%
1992 696.6 356.1 1,052.7 66.2%
1993 798.1 368.0 1,166.1 68.4%
1994 890.0 397.2 1,287.2 69.1%
1995 928.9 408.8 1,337.7 69.4%
Annual growth 5.6% 6.4% 5.8% - -Source: IFEP, 1997.
Table 5.2 Geographic patterns in marine fisheries production
Region Percent of fishing Percent of fishing Percent of marinevessels horsepower fisheries catch
North 13% 7% 12%
Central 50% 39% 21%
Southeast 16% 22% 43%
Southwest 21% 32% 23%
Total 100% 100% 100%Source: IFEP, 1997, pages 27,29.

106
Table 5.3 Geographic patterns in inland fisheries and aquaculture
Region Potential Estimated area Used area as a 1995 production Share of totalarea for used for percentage of of inland fisheries production
aquaculture aquaculture potential area and aquaculture(000 ha) (000 ha) (000 tons)
Northern Uplands 187.4 67.7 36.1% 24.1 5.9%
Red River Delta 145.7 62.4 42.8% 53.5 13.1%
N. C. Coast 101.5 32.9 32.4% 23.2 5.7%
S. C. Coast 119.9 15.9 13.3% 7.6 1.9%
Cent. Highlands 65.0 4.2 6.5% 5.6 1.4%
Southeast 140.5 61.5 43.8% 20.3 5.0%
Mekong Delta 619.0 301.4 48.7% 274.5 67.1%
Total 1,379.0 546.0 39.6% 408.8 100.0%
Source: Ministry of Fisheries, cited in IFEP, 1997, pages 35, 36.
Table 5.4 Trends in seafood processing
Year Value (billion VND) Ratio of value addedto gross output
Gross output Value added
1991 1,514.9 248.4 16.4%
1992 2,070.1 335.4 16.2%
1993 3,202.1 518.7 16.2%
1994 3,701.4 599.6 16.2%
1995 5,365.3 858.4 16.0%
1996 6,143.1 982.9 16.0%
1997 6,770.9 1,083.3 16.0%
Annual growth 23.5% 23.0%Source: General Statistics Office. (Data obtained by DSI/MPI).

107
Table 5.5 Geographic distribution of seafood export processing by province
Province Number of Percentage Number of Percentage ofcompanies of all seafood export seafood export
seafood processors with processors withexport EU certification EU certification
processors
Quang Ninh 5 2.3% 1 20.0%
Hai Phong 6 2.8% 3 50.0%
Ha Noi 4 1.9% 0 0.0%
Other Red R. Delta 5 2.3% 1 20.0%
Thanh Hoa 7 3.3% 0 0.0%
Quang Tri 4 1.9% 0 0.0%
Thua Thien Hue 6 2.8% 2 33.3%
Other N.C. Coast 6 2.8% 2 33.3%
Da Nang 11 5.1% 4 36.4%
Kanh Hoa 25 11.7% 4 16.0%
Quang Ngai 4 1.9% 0 0.0%
Binh Dinh 4 1.9% 2 50.0%
Binh Thuan 4 1.9% 0 0.0%
Other S.C. Coast 6 2.8% 1 16.7%
Ba Ria - Vung Tau 14 6.5% 3 21.4%
Ho Chi Minh City 51 23.8% 18 35.3%
Dong Thap 4 1.9% 0 0.0%
Ben Tre 4 1.9% 0 0.0%
Can Tho 6 2.8% 3 50.0%
Kien Giang 10 4.7% 3 30.0%
Ca Mau - Bac Lieu 17 7.9% 6 35.3%
Other Mekong Delta 11 5.1% 8 72.7%
Total 214 100.0% 61 28.5%Source: Calculated from data from the Ministry of Fisheries, SEAQIP project.

108
Table 5.6 Geographic distribution of seafood export processing by region
Region Number of Percentage Number of Percentage ofcompanies of all seafood export seafood export
seafood processors with processors withexport EU certification EU certification
processors
Northern Uplands 5 2.3% 1 20.0%
Red River Delta 15 7.0% 4 26.7%
North Central Coast 23 10.7% 4 17.4%
South Central Coast 54 25.2% 11 20.4%
Southeast 65 30.4% 21 32.3%
Mekong River Delta 52 24.3% 20 38.5%
Total 214 100.0% 61 28.5%Source: Calculated from data from the Ministry of Fisheries, SEAQIP project.
Table 5.7 Largest seafood processor-exporters
Company Value of exports Percent of all(million US$) seafood exports
Ca Mau - Minh Ha Frozen Seafood PME Co. 53.2 6.9%(CAMINEX)
Can Tho Animal Fishery Prod. PE Enterprise 42.5 5.5%(CAFATEX)
FIMEX - Viet Nam 36.2 4.7%
Kim Anh Company Ltd. 30.5 3.9%
STAPIMEX 30.0 3.9%
An Giang Fishery Imp.-Exp. Company (AGIFISH) 26.3 3.4%
SEAPRODEX Exporter Centre 25.2 3.2%
Aquatex Products Trading Company (APT Co.) 22.9 3.0%
Special Aquatic Product Imp.-Exp. Co. (SEASPIMEX) 20.9 2.7%
Coastal Fisheries Development Corp. (COFIDEC) 20.3 2.6%
Others 468.0 60.3%
Total 776.0 100.0%Source: Data from Ministry of Fisheries, SEAQIP Project.
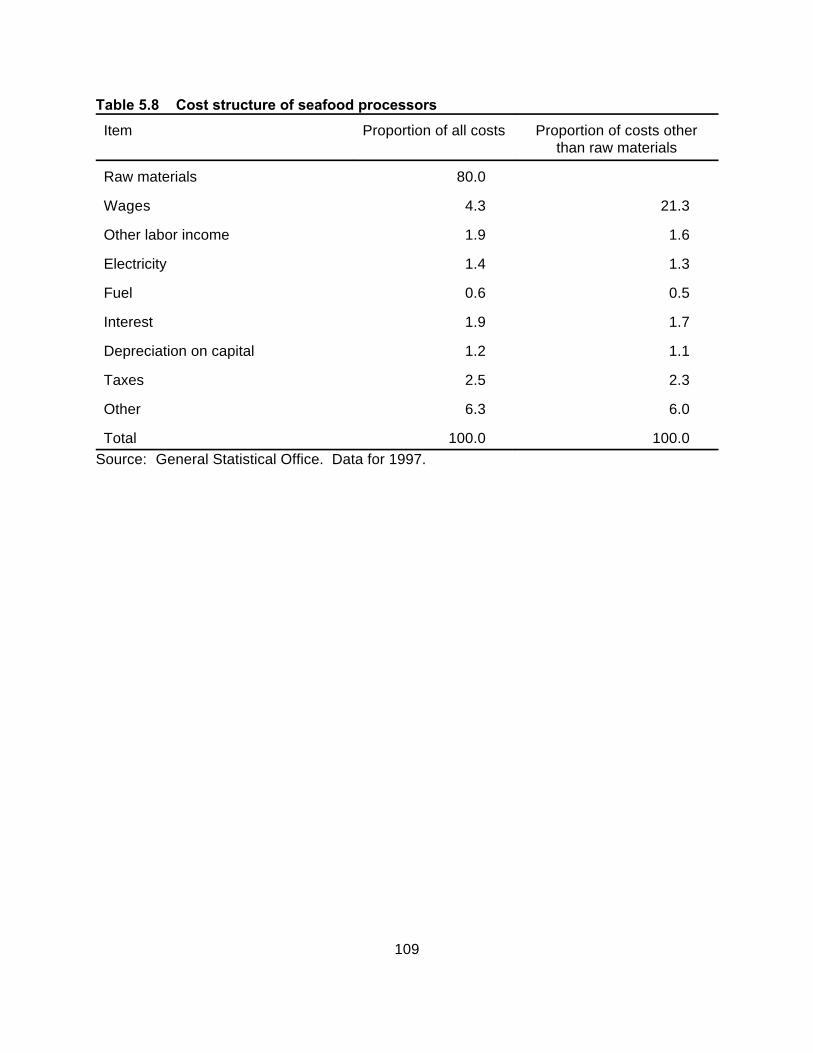
109
Table 5.8 Cost structure of seafood processors
Item Proportion of all costs Proportion of costs otherthan raw materials
Raw materials 80.0
Wages 4.3 21.3
Other labor income 1.9 1.6
Electricity 1.4 1.3
Fuel 0.6 0.5
Interest 1.9 1.7
Depreciation on capital 1.2 1.1
Taxes 2.5 2.3
Other 6.3 6.0
Total 100.0 100.0Source: General Statistical Office. Data for 1997.

110
Table 5.9 Domestic demand for fish and shrimp in Viet Nam
Household type Per capita Population Total consumption Percent ofconsumption of (million) of fish and shrimp totalfish and shrimp (000 tons/year) demand(kg/person/yr)
Average 15.2 75.0 1,143 100.0
Income group
Poorest 20 % 8.5 15.0 128 11.2
2 13.0 15.0 194 17.0
3 16.4 15.0 247 21.6
4 18.8 15.0 283 24.7
Richest 20% 21.4 15.0 320 28.0
Region
Northern Uplands 4.6 12.8 58 5.1
Red River Delta 8.0 15.0 121 10.6
N. C. Coast 13.0 10.5 136 11.9
S. C. Coast 24.8 8.3 205 17.9
Central Highlands 10.1 3.0 30 2.6
Southeast 18.5 9.0 166 14.6
Mekong River Delta 26.6 16.5 440 38.5Source: 1994 Household Survey (GSO, 1998, p. 847-850).

111
Table 5.10 Domestic demand for fish sauce in Viet Nam
Household type Per capita Population Total consumption Percent ofconsumption of (million) of fish sauce total
fish sauce (million liters/year) demand(liters/pers/year)
Average 4.9 75.0 369 100.0
Income group
Poorest 20 % 3.4 15.0 50 13.7
2 4.6 15.0 68 18.5
3 5.3 15.0 79 21.5
4 5.8 15.0 86 23.4
Richest 20% 6.1 15.0 92 24.9
Region
Northern Uplands 2.9 12.8 37 10.0
Red River Delta 4.7 15.0 70 19.0
N. C. Coast 4.3 10.5 45 12.3
S. C. Coast 6.1 8.3 50 13.7
Central Highlands 4.4 3.0 13 3.6
Southeast 5.3 9.0 48 12.9
Mekong River Delta 7.1 16.5 117 31.7Source: 1994 Household Survey (GSO, 1998, p. 847-850).Note: Because it is difficult for household surveys to measure accurately the consumption
of condiments, these estimates may have a high margin of error.

112
Table 5.11 Trend in the composition of seafood exports
Year Volume (000 tons) Value(mill. US$)
Frozen Frozen Frozen Dried Totalshrimp squid fish products
1985 8.5 0.7 0.9 2.3 12.4 90.0
1990 34.0 4.8 3.2 5.0 47.0 205.0
1991 40.0 4.5 10.9 5.1 60.5 262.2
1992 48.1 5.3 16.5 8.2 78.1 305.1
1993 55.4 7.1 23.1 9.2 94.8 368.4
1994 63.1 10.0 25.5 12.3 110.9 458.2
1995 66.5 11.3 31.4 18.5 127.7 550.6
1996 670.0
1997 776.0
Annual 22.8% 32.1% 42.6% 23.2% 26.3% 19.7%growth
Source: Data for 1985-1995 from Ministry of Fisheries, cited in ADB (1996), Appendix H, p. 6. Figures for 1996 and 1997 from Viet Nam News (5 January 1998).
Table 5.12 Trend in the value of seafood exports
Year Seafood Total exports Seafood exports as aexports (million US$) percentage of total
(million US$) exports
1991 285.4 2,087 13.7%
1992 307.7 2,581 11.9%
1993 427.2 2,985 14.3%
1994 551.2 4,054 13.6%
1995 621.4 5,449 11.4%
1996 651.0 7,256 9.0%
1997 750.0 8,700 8.6%
Annual growth 17.5% 26.9%Source: General Statistics Office, 1997.

113
Table 5.13 Seafood exports by destination (1995)
Value (million US$) Percent oftotal
Frozen shrimp Frozen squid Fish Total
Japan 183.7 33.7 20.9 285.7 51.9%
Europe 50.7 2.9 4.6 73.1 13.3%
Hong Kong 32.8 2.7 3.2 44.0 8.0%
Singapore 26.6 0.9 7.5 36.6 6.6%
Taiwan 4.2 0.3 6.2 13.2 2.4%
S Korea 5.6 2.0 2.6 11.8 2.1%
Others 35.6 2.9 28.8 86.2 15.7%
Total value 339.2 45.4 73.8 550.6 100.0%Source: Ministry of Fisheries, cited in ADB (1996), Appendix H, p. 7. Note that column
headings in original were in the wrong order and have been corrected here.
Table 5.14 Seafood exports by product (1995)
Volume Percent of Value Percent of Unit value(000 tons) volume (million US$) value (US$/ton)
Frozen 66.5 52.0% 339.2 61.6% 5,101shrimp
Frozen squid 11.3 8.8% 45.4 8.2% 4,018
Fish 31.4 24.6% 73.8 13.4% 2,350
Other 18.7 14.6% 92.2 16.7% 4,930
Total 127.9 100.0% 550.6 100.0% 4,305Source: Ministry of Fisheries, cited in ADB (1996), Appendix H, p. 7. Note that product
headings in original were in the wrong order and have been corrected here.

114
Table 5.15 Exports and domestic sales by SEAPRODEX
Country Volume Value Percent of Percent of Average price(tons) (000 US$) total exports total sales (US$/ton)
Japan 11,416 62,087 49.8% 47.2% 5,439
Hong Kong 2,021 10,231 8.2% 7.8% 5,062
United States 896 9,107 7.3% 6.9% 10,164
Singapore 593 3,205 2.6% 2.4% 5,405
Thailand 1,202 3,205 2.6% 2.4% 2,666
Holland 649 2,998 2.4% 2.3% 4,619
Belgium 548 2,861 2.3% 2.2% 5,221
Taiwan 794 2,733 2.2% 2.1% 3,442
Italy 1,065 2,023 1.6% 1.5% 1,900
Other 6,903 26,160 21.0% 19.9% 3,790countries
Total exports 26,087 124,610 100.0% 94.7% 4,777
Viet Nam 1,709 6,932 - - 5.3% 4,056
Total sales 27,796 131,542 - - 100.0% 4,732Source: Data provided by SEAPRODEX.

115
6. CONCLUSIONS AND RECOMMENDATIONS
6.1. Conclusions for the food processing sector
The competitiveness of food processing industry depends largely on quality and the cost ofproduction of the raw material. For export-oriented food processing enterprises, the price ofthe output is fixed by international prices. At the same time, the price of raw materials typicallyaccounts for 70-90 percent of the cost of producing the exported product. Thus, a smallchange in the cost or the quality of the raw material will make a large difference in the ability ofthe processor-exporter to compete with other suppliers on the world market. The success ofthe food processing sector hinges on the ability of farmers and fishermen to make continualprogress in productivity. This implies a need for higher yields, more efficient use of inputs, andreduction in post-harvest losses. This message is reinforced by international experience:cases of successful expansion of high-value agricultural commodities is almost always based,at least in part, on lower costs of commodity production.
The competitiveness of food processing in international markets is subject to rapid change. International experience provides numerous cases of countries that were major exporters, onlyto lose their ability to compete in export markets some years later. This may be due to risingwage rates or land use patterns in the exporting country, the emergence of new competitors,or shifts in demand patterns among importers. Furthermore, this pattern is, if anything,stronger among "niche" markets for differentiated high-value products. Thus, it is not enoughto find a niche; countries must develop the ability to continuously seek new niches. The foodprocessing sectors in countries like Thailand and Taiwan have succeeded mainly by being ableto respond quickly to changing market conditions (see Box 6.1).
Most countries progress from exporting unprocessed, undifferentiated commodities towardhigher quality, differentiated products. This process is facilitated by a competitive market-oriented (private) food processing sector. The vast majority of the dramatic "success stories"in exports of high-value agricultural commodities were characterized by private producers andprocessor-exporters, facilitated by strong public support in the areas of research, extension,inspection and certification, and dissemination of information (see Jaffee, 1992). Acomparison of the shrimp industries in China and Thailand illustrates this point. Similarly, ineach of the four subsectors examined in this report, high-value niche exports have grown withthe liberalization of the economy and the emergence of private and provincial enterprisesoperating on a commercial basis.
In Viet Nam, state-owned enterprises (particularly centrally managed ones) play a dominantbut declining role in the food processing sector. In all four subsectors, a centrally-managedstate-owned enterprise formerly had a large share of the processing and export market andoften was involved in production as well. In some of the subsectors, such as seafood andcoffee, the SOE had a monopoly on exports. In all four subsectors, the share of this dominantSOE has declined rapidly as provincial SOEs and private companies have proven themselvesmore agile and efficient. VINACAFE now has a 20 percent share of coffee exports andSEAPRODEX now accounts for 7 percent of seafood exports. This does not necessarily mean

116
that exports by these formerly-dominant SOEs have declined; rather provincial and privateenterprises have been responsible for much of the dramatic growth in these sectors.
The main reason for the decline in the share of food processing being carried out by centralSOEs is lack of flexibility, slow decision-making, and higher costs. Both private and state-owned processors identify the lack of flexibility as a key constraint on state enterprises. OneSOE manager complained that regulations required him to employ people for certain positionseven if he did not need them. Furthermore, SOEs are perceived by those inside and outsidethe state sector as unable to take advantage of unexpected opportunities, a serious handicapin a rapidly growing and evolving subsector. Decision-making by SOEs was widely seen astoo slow and bureaucratic, with centrally managed SOEs needing permission fromheadquarters and provincial SOEs needing authorization from the People’s Committee. Although good cost data are difficult to obtain, the SOEs appear to have higher overheadexpenses related to over-staffing, larger office spaces, and, in some cases, inappropriatemachinery.

117
Box 6.1: Evolution of food processing exports from Taiwan
Taiwan illustrates both the long-term trends in food processing that most countries undergo,as well as the dynamic nature of food processing exports (this case is based on Jaffee,1992). In the early 1960s, Taiwan’s agricultural sector was dominated by rice and ricemilling, reflecting the fact rice was the dominant commodity in Taiwanese diets at the time. As a result of rapid economic growth, food consumption patterns changed: the demand forrice fell, while that of wheat, meat, dairy, and vegetables rose rapidly. Higher wages andurbanization has increased the demand for packaged partially-prepared “convenience” food. These demand shifts have been reflected in the agricultural and food processing sectors.
In 1960, Taiwan’s main agricultural export was sugar, followed by bananas and cannedpineapples. In the 1970s, banana and canned pineapple exports stagnated in the face ofcompetition from lower-wage countries, but shrimp, fish products, canned mushrooms, andcanned asparagus expanded rapidly to become the dominant agricultural exports. Duringthe 1980s, the exports of sugar, canned mushrooms, and canned asparagus collapseddramatically, having become uncompetitive relative to Thailand, China, and other countries. Similarly, disease and pollution virtually destroyed the Taiwanese shrimp industry. However, exports of hogs and pork products, other canned vegetables and eel productsexpanded more than enough to fill the gap.
The government’s role in the agricultural sector has included strong support for one of thebest systems of agricultural research and extension in the region, infrastructure, marketinginformation systems, the establishment of hog auction markets, and the promotion of avoluntary cooperative system for vegetable marketing. Subsidies were provided for someinputs and investment, but they tended to be focused on declining traditional sectors ratherthan emerging ones. The food processing industry is composed of a several hundred smallto medium private enterprises, known for strong management, high productivity, andflexibility. The sustained growth in agricultural exports in spite of the dramatic changes inthe composition of exports is a reflection of the strength and adaptability of the Taiwanesefood processing sector.
The creation of general corporations has not improved SOE performance. In spite of theconsolidation of state-owned enterprises into large general corporations, it is the provincialSOEs and private companies that are expanding their market shares in the four foodprocessing subsectors considered in this report. Furthermore, the international experiencewith merging SOEs into general corporations or holding companies is not promising. In manycountries, it tends to lead to cross-subsidization of weaker SOEs and more layers ofmanagement. Indeed, the success of small, specialized provincial SOEs relative to centralSOEs is a strong sign that the merging of SOEs is not likely to bear fruit.
Outdated machinery is not the key constraint in the food processing sector. It is striking thatthe most successful enterprises are not those with the most modern and technologicallyadvanced equipment. Rather, the successful ones are those that are skilled at finding a new

118
and better way to do something: the coffee processor who realizes he can save money ontransportation by filling the truck for the return trip from Ho Chi Minh City, the seafoodprocessor who works to develop relationship directly with fish traders instead of wholesalers, orthe vegetable exporter who to accepts a loss on one shipment in order to maintain hisreputation for reliability with the importer. "Modern" machinery is almost always more efficientfrom a technical point of view, but to be efficient from an economic point of view it must justifyits higher cost. Certainly, additional equipment is needed in many cases, but it will do little toimprove the economic performance without strong management, responsive marketing skills,adequate training, and a good incentive structure.
Financial sector reform is a key element in improving the competitiveness of the foodprocessing sector. The economic reforms have moved in the financial sector in the rightdirection by separating commercial banking functions from the State Bank and allowing theentrance of foreign financial companies. However, government policy maintains interest ratesthat are low in real terms (relative to inflation), presumably to protect existing borrowers,including a large number of indebted state enterprises. This policy, however, has two adverseeffects. First, it makes it difficult for banks to mobilize domestic capital, that is to attracthousehold savings, thus limiting the pool of capital available for investment. Second, it forcesbanks to pursue a highly risk-averse lending strategies such requiring high levels of collateraland focusing on short-term commercial credit rather than longer-term investment lending.
Importers and foreign investors are important sources of marketing and management expertise. Interviews with food processors revealed numerous examples in which importers and/orforeign partners work with domestic processors to provide technical assistance, quality control,and sometimes credit. In the seafood processing industry, Japanese importers have taken anactive role in upgrading skills and procedures, and in some cases providing credit for theestablishment of new private enterprises to supply seafood. In fruits and vegetables, it is moreoften a joint venture partner. Even if when no knew equipment is involved, this is an importantform of technology transfer and should be facilitated by the government.
6.2. Recommendations for the food processing sector
Given the importance of the cost and quality of raw materials to the competitiveness of thefood processing sector, agricultural and fisheries research and extension activities are criticalfor maintaining the competitiveness of the food processing industry. In the case of rice, theopportunities for area expansion have already been exhausted and opportunities for raisingcropping intensity are being exhausted. The only way to maintain the existing pace of riceproduction growth is by increased public investment in agronomic research and extensionservices. Although Viet Nam’s agricultural research institutes are staffed with dedicatedresearchers, they work in conditions of very limited resources. Numerous studies ofagricultural research across the world indicate that the economic returns to agriculturalresearch are quite high, in the range of 30-50 percent. At the least, investment in agriculture(particularly agricultural research and extension) should be proportional to its share in grossdomestic product.
Reform of the state-owned enterprises (SOEs) is central to the evolution of a stronger foodprocessing sector. International experience shows that certain common patterns in successful

119
reform of the state-owned enterprise sector. First, commercial and public service functionsshould be separated, forcing the former to cover its costs and fully funding the activities of thelatter. This is issue is particularly relevant in the case of VINACAFE, which is responsible forboth commercial functions of processing and exporting coffee and public service functions ofresearch and promotion. Second, SOEs involved in commercial activities should be requiredto compete on the same terms as private enterprises. Although Viet Nam has made progressin reducing direct subsidies, indirect support through low-interest loans, uncollected loans,access to land, and (in the case of rice and coffee) preferential access to export markets. Third, the internal structure of SOEs needs to be reformed to create incentives for efficiencyand commercial orientation. This implies giving management greater autonomy from thepolitical authorities and perhaps partial equitization.
The government should not limit the number of exporters in a subsector since export prices arenot affected by the number of exporters. There is a widespread belief that the existence of alarge number of exporters means that exports are sold at below their market value. Thisargument has been a persistent part of the debate over rice export policy and appears indiscussions of coffee export policy as well. This argument leads to proposals for governmentlicensing to reduce the number of exporters. Limiting the number of exporters, however, doesnot improve export prices and is likely to hamper the development of the food processing-export sector. Exporting 3 million tons of rice has the same effect on world prices whether fiveexporter ship 600 thousand tons each or 30 exporters ship 100 thousand tons each. Generally, unqualified exporters will have difficulties finding a buyer and financing thetransaction, so the problem is self-regulating.
The government should not require approval of the price of export contracts. Exporters dooccasionally make mistakes and offer goods at a too-generous price. But this is rare amongexperienced exporters. If the price is too generous, the exporter will lose money on thecontract. Government intervention is not needed to ensure that exporters follow their own self-interest. Furthermore, the price depends on so many factors including world marketconditions, expectations about future market conditions, the quality of the product, thereputation of the exporter (this affects the risk of default or conflicts), the efficiency of portfacilities, and the bargaining skills of each party. Thus, evaluating the “fairness” of eachcontract is not easy. At best, the approval system would be cumbersome. At worst, it wouldcreate a temptation for irregular payments. One exception to this rule is that case of intra-company transfers. When the buyer and seller are the same company, "transfer pricing" maybe used to avoid taxes. In this case, tighter regulation is warranted.
The government should strengthen its role in disseminating market information and facilitatingmarket coordination. Collecting and disseminating information is an important role of thegovernment. Interviews with food processors revealed numerous cases in which enterpriseshad little information about recent government decisions, the nature of the firms they competeagainst, long terms trends in their markets, and so on. With experience, these enterprises willbecome better informed because it is in their interest, but the government can accelerate theprocess. In rice, information is needed regarding the commitments to export rice in order tohelp the government and processors make more informed decisions. In seafood, there is aneed for information about health and safety certification procedures and regulatory activities

120
by the government. In fruits and vegetables, information about markets, shipping options, andprice trends would be useful.
The government should facilitate the creation and strengthening of business associations. These associations should be voluntary and open to all participants in the sector. It isimportant that these organization not become involved in setting prices or other anti-competitive behavior nor should they be a regulatory body with the power to sanctionmembers. Making them open to all would reduce this risk since each group (exporters,processors, wholesalers, etc.) could monitor the others. These groups could also serve animportant function of proposing standards for certification of quality. The standards wouldhave to be approved by the relevant authorities, but it is important to get input from those thesystem is designed to serve.
The government should focus address issues related to common-pool resources. Common-pool resources are resources available to many people with no limits on their access. This isone situation when self-interested behavior is often destructive. In the case of fishing, even iffishermen realize that they are over-fishing an area, there no incentive for an individual toconserve. The Ministry of Fisheries has taken steps to prevent over-fishing of coastal waters,including size limits, seasonal restrictions, and protection of spawning areas. Nonetheless,greater resources should be devoted to monitoring fish stocks, estimating maximumsustainable yield, designing protective measures, and enforcing those measures. In the areaof coffee development, the issue is groundwater resources. There are signs that coffeeproduction is depleting groundwater resources. The Ministry of Agriculture and RuralDevelopment should study the evidence, develop a plan to ensure sustainable use ofgroundwater, and enforce the policy.
The government should de-emphasize its role in promoting specific sectors of the economy. Advocates of industrial policy believe that the government should select specific sectors withgrowth potential and promote them. In the 1950s, governments were advised to promote“infant industries”. In the 1960s, the emphasis was placed on sectors with growth linkages. Inthe 1980s, industrial policy advocates recommended supporting high-value or high-wageindustries. And currently, the attention has turned to high-technology sectors. While thearguments are intuitively plausible, they face severe problems in implementation. First,governments rarely have better information about the future direction of the economy than theprivate sector. Second, government decisions on which sectors to promote are too oftenaffected by lobbying and personal relations. And third, assistance in the form of importprotection or subsidies seems to make enterprises less competitive rather than more so. Indeed, a key ingredient in the Asian currency crisis was the fact that some governments havechanneled foreign loans into sectors that, although not profitable, were favored by the politicalauthorities. The agricultural sector and the food processing sector are neither high-wagesectors, nor high-value sectors, nor a high-technology sectors, and thus are neglected in mostindustrial policy proposals. And yet these sectors have grown rapidly, providing jobs formillions of Vietnamese and raising the standards of living among many poor households. Thegrowth in income and subsequent changes in demand will inevitably result in a gradual declinein the share of agriculture in GDP, but this does not mean that the government can acceleratethe rise in incomes by neglecting agriculture.
121
Technology should be defined broadly to include any improved method using resources toproduce and market a good or service, rather than narrowly as industrial machinery. Amonggovernment officials and enterprise managers, there is a tendency to think of technology innarrow terms. This misunderstanding is linked to the idea that the main determinant ofeconomic growth is fixed capital. Other factors such as natural resources, human capital, andefficient institutions are equally important determinants of growth, as has been repeatedlydemonstrated in economic analysis of growth in developing countries. For example, thetechnology of improved rice seed, developed in part from varieties from the International RiceResearch Institute, has undoubtedly contributed more to raising Vietnamese standards of livingthan all the sugar mills in the country, even though the latter are more visibly impressive. Similarly, technology that raises yields on shrimp farms by 10 percent would almost certainlyhave a greater economic impact than a new high-speed modern cannery.
6.3. Conclusions and recommendations for the rice subsector
The most important constraint on the growth of the rice processing subsector is thesustainability of rice export growth. Vietnamese rice exports have expanded rapidly as a resultof decollectivization and market liberalization which have improved incentives to use fertilizerand modern seed varieties. However, some of this increase is a onetime response to reforms. It is very unlikely that rice production and exports can continue to grow at the same pace that ithas over the past decade.
An increasing share of rice production growth is due to yield growth. The cultivated area ofrice lands has not increased since the mid-1980s. Production growth has been due to risingcropping intensity and higher yields. Further increases in cropping intensity are probablylimited, as evidenced by slowing growth in recent years. Thus, yield growth is becoming theonly avenue for expanding rice output.
Raising the unit value of rice exports requires improvements in port facilities, reliability, and ricequality. This conclusion generates several recommendations for government action:
These conclusions lead to a number of recommendations. First, the government shouldstrengthen its support for rice research. The rate of return on investment in agriculturalresearch is probably high, particularly given the importance of continuing to raise rice yields. This investment could be in the form of better salaries and more funds for equipment andoperating costs.
In addition, the government should improve Saigon Port facilities, focusing on reducing thedelays in loading which depress the FOB price. Furthermore, developing the Can Tho portwould reduce the cost of moving rice to the port, thus raising the producer price.
The government should avoid policies that result in exporters abrogating existing rice exportcontracts. The costs of such policies are not visible, but by damaging the reputation of VietNam as a reliable exporter, they reduce the FOB price that the country will receive in thefuture. The government should implement a system for reporting rice export commitments. Thiswould allow policymakers to limit the volume of rice exports for food security reasons without

122
causing exporters to abrogate their contracts. It would also generate information useful formonitoring rice markets.
The government should allow private rice millers to participate in rice exports. A morecompetitive export sector will benefit farmers without reducing the price Viet Nam receives forits rice exports. In addition, based on international experience and the experience of otherfood processing sectors in Viet Nam, private exporter are more likely to seek out and exploitmarket niches for specialty rices.
6.4. Conclusions and recommendations for the coffee subsector
The increase in the number of coffee processors and traders has reduced coffee marketingmargins and improved the prices received by farmers. Although information on margins overtime is not available, this is the conclusion of almost all coffee processors (including state andprivate).
Recent policy decisions to allow private coffee processors to export will have a modest effectinitially, but a large effect over the coming years. Initially, few private processors will have theexpertise, contacts, and liquidity to export, but the incentives for direct exporting will encourageprivate processors to develop the expertise, make contacts, and seek credit.
One of the main threats to sustained coffee exports is the depletion of groundwater resourcesin the Central Highlands. The current drought has highlighted the dependence of coffee onwater, but the problem will not disappear with the return of normal rainfall.
Another threat to sustained coffee exports is the risk of an outbreak of disease. Coffeeproduction has expanded more quickly than the institutional capacity to deal with outbreaks ofdisease. The use of irrigation increases the risk of disease.
The government should invest more in coffee research and extension, focusing on disease,post-harvest practices, and water conservation. As a result of the risks described above,research in the issue of sustainable water use, Arabica production, and disease is needed, asare extension efforts to establish a system for monitoring and reporting diseases.
The government should consider a small export tax to fund coffee research and extensionactivities. This would ensure that research funds are available on a sustained basis to supportthe coffee sector. The example of FEDECAFE in Colombia should be studied as a model,though initially a Vietnamese institute should pursue a more modest agenda.
The government should not limit the number of companies that are allowed to export coffee,nor set minimum export prices. Greater competition in the export sector will improve the pricesreceived by farmers without lowering the export price. Importers will prevent inexperienced orunder-capitalized processors from exporting, although it might be useful for the government to"certify" some exporters as qualified.
The government should separate the commercial and public service roles of VINACAFE. Stateenterprises should not be given public services functions and expected to cover all their costs. Nor should the public service functions of VINACAFE be neglected in the interest of state
123
enterprise reform. Commercial activities should be self-financing, while public service activities(research, extension, inspection, etc) should be fully funded by the government or by taxingthe coffee sector.
The government should evaluate the economic returns to arabica coffee production. Theexpansion of arabica coffee production in the north appears to be following an acceleratedschedule, and it is not clear whether there have been adequate studies of the agronomic andfinancial aspects of this investment.
The government should study the issue of groundwater depletion in the Central Highlands inorder to design policies to ensure the sustainability of coffee production in this region. Such astudy would examine the extent of depletion and the mechanisms that the government coulduse to reduce water use and/or increase water supply.
6.5. Conclusions and recommendations for the fruit and vegetable subsector
The fruit and vegetable export processing subsector is the least developed of the foursubsectors. This is partly because, unlike the other three commodities, fruits and vegetablesdo not need to be processed (transformed) in order to be edible. Furthermore, virtually all ofthe domestic market and some of the export market is for fresh fruits and vegetables. Furthermore, fruit and vegetables exports are small compared to rice, coffee, and seafoodexports.
More than the other export food processing sectors, fruit and vegetable export processorswere adversely affected by the collapse of the Soviet Union than the other three subsectors. Rice was not an export crop in the 1980s. Similarly, coffee exports were minimal in the mid-1980s and have grown during the economic reform process. Seafood exports were largeduring the 1980s, but even then they were oriented toward Japan and other marketeconomies.
Fruit and vegetable processors are recovering by seeking new markets and developing newproducts. The new markets include Japan, Taiwan, Hong Kong, Singapore, and to a lesserdegree the United States and other southeast Asian nations. The traditional exports of drybeans, bananas, and pineapples have declined, while a variety of fresh and canned products.
The average value of fruit and vegetable exports has been 57 percent higher during the 1990sthan it was in the 1980. This is the result of the economic reforms that have providedincentives for smaller private and provincial processor-exporters to seek out high-valuemarkets.
The subsector is overly focused on canned fruits and vegetables, in spite of the fact that themore rapidly growing markets are in fresh fruits and vegetables. Too often the assumption isthat exporting canned and frozen fruits and vegetables is more profitable and beneficial for theeconomy than exports of fresh fruits and vegetables. But demand growth is higher in freshproduce and, because of the skills required to market fresh produce the returns can be high.
Some of the main opportunities in fresh fruit and vegetable exports are temperate fruits andvegetables for Hong Kong and Singapore, and tropical fruits for Japan, Taiwan, South Korea,

124
and North America. These patterns take advantage of the range of climatic conditions in VietNam,
One of the main constraints on the fruit and vegetable export processing sector is the lack ofvarieties that are suitable for processing and/or export. For example, pineapple processorsconsistently noted that the Queen Victoria variety grown in Viet Nam is too small and not juicyenough for international markets.
The government should expand its investment in research to select and develop suitablevarieties of fruit and vegetable for domestic consumption and for export. Citrus, pineapple,and banana are some of the more obvious examples, but nearly every product would benefitfrom the introduction of new varieties with higher yields and/or characteristics desired byimporting countries.
The government should facilitate the collection and dissemination of information about exportmarkets, particularly standards, health restrictions, prices, and demand patterns. This wouldmake it easier for Vietnamese processors and exporters to become informed about foreignmarkets and identify opportunities.
The government should facilitate the formation of an association of fruit and vegetable productexporters. As mentioned earlier, the association should be voluntary and open to all interestedparties. It should not be involved in setting terms for dealing with farmers or with importers, butrather should focus on information exchange, the identification of ways the government cansupport the subsector, and assistance to the government in the establishment of grades andcertification.
6.6. Conclusions and recommendations for the seafood subsector
The seafood processing sector has grown rapidly on the basis of low wages, a long coastline,and proximity to important markets in Asia, primarily Japan. The adjustment of the seafoodsubsector to the doi moi reforms was less painful than that of the fruits and vegetablessubsector because it was not closely tied to trade with the eastern bloc in the 1980s.
The seafood processing sector is dependent on the continued availability of seafood atreasonable prices. Although Thailand has developed a tuna canning industry based on rawmaterials caught outside its waters, this is unusual. In general, the success of the seafood processing industry is tied to the success of the fisheries sector, including aquaculture.
The biggest threat to the subsector growth is the sustainability of marine seafood resources. Estimates of the maximum sustainable yield are not very accurate, but most studies agree thatViet Nam is at or will soon arrive at the capacity of the coastal waters. Spectacular collapsesof North Sea (Europe) and Grand Banks (North America) fish stocks demonstrate that under-regulated fishing can result in the rapid disappearance of marine resources.
Further growth in seafood production and exports will depend to an increasing extent onaquaculture. The process of switching to aquaculture as the basis of seafood processing andexport growth has already occurred in China and Thailand. In both countries, the transitionwas facilitated by strong support for aquaculture research and extension.

125
The development of shrimp aquaculture is vulnerable to epidemic diseases. A sizableTaiwanese shrimp export subsector was completed undermined by problems related todisease and pollution. Smaller scale disease problems are already appearing in theVietnamese press.
The government should increase its efforts to study and monitor the maximum sustainableyield of different types of marine species and in different regions. This information is vital inorder to design fishing regulations that protect the marine resources without unnecessarilylimiting the growth of the marine fisheries industry.
The government should strengthen its enforcement of existing regulations designed to protectfishery resources. Fisheries specialists believe that the current regulatory system is adequate,given the limited information available, but that enforcement is weak and inconsistent. Although enforcement may be expensive, the costs are small relative to the value of theresource being protected.
The government should increase its investment in research and extension in aquaculture. Atleast three areas should receive special attention. First, shrimp yields are low by Thai andChinese standards and will need to be raised to maintain competitiveness. Second, researchand extension efforts are needed in monitoring and controlling contagious diseases(particularly in shrimp). And third, the development of improved breeds would facilitate thetransition to a more aquaculture-based seafood subsector.
The government should facilitate the collection, analysis, and dissemination of information onseafood export markets, particularly in the area of health and safety regulations of importers. Health and safety regulations are tighter on seafood than any of the other three subsectors. Furthermore, the regulations vary widely from one importer to another. Initially, informationcould be collected and disseminated by a government institute, but eventually this functionshould be taken over by a seafood exporters association.
126
REFERENCES
ADB (Asian Development Bank). 1996. Vietnam Coastal Aquaculture Sector Review. Preparedby SCP Fisheries Consultants Australia for the Ministry of Fisheries. Hanoi.
Binh, Nguyen Viet. 1997. “Coffee Development in Viet Nam”. Sub-National Institute forAgricultural Planning and Projection. Ho Chi Minh City.
Brown, J.G. (ed.). 1991. “Agroindustry Profiles: Rice.” Economic Development InstituteWorking Papers. The World Bank. Washington, DC.
Brown, J.G. (ed.). 1991. “Agroindustry Profiles: Coffee.” Economic Development InstituteWorking Papers. The World Bank. Washington, DC.
DSI (Development Strategy Institute). 1998a. “Rice Sector”. Report prepared by DSI, Ministryof Planning and Investment for the United Nations Industrial Development Organization,project TF/VIE/95/A58. Hanoi.
DSI (Development Strategy Institute). 1998c. “Survey Result Report: Thang Loi CoffeeCompany”. Report prepared by DSI, Ministry of Planning and Investment for the UnitedNations Industrial Development Organization, project TF/VIE/95/A58. Hanoi.
DSI (Development Strategy Institute). 1998d. “Survey Result Report: Dong Giao ExportFoodstuff Company”. Report prepared by DSI, Ministry of Planning and Investment for theUnited Nations Industrial Development Organization, project TF/VIE/95/A58. Hanoi.
DSI (Development Strategy Institute). 1998b. “Coffee Subsector Profile”. Report prepared byDSI, Ministry of Planning and Investment for the United Nations Industrial DevelopmentOrganization, project TF/VIE/95/A58. Hanoi.
GSO (General Statistics Office). 1998. Major social and economic information obtained fromthe large scale surveys in period of 1990-1996. Statistical Publishing House. Hanoi.
GSO (General Statistical Office). 1996. Statistical Yearbook 1995. Statistical PublishingHouse. Hanoi.
GSO (General Statistical Office). 1996. Statistical data of agriculture, forestry, and fishery1985-1995. Statistical Publishing House. Hanoi.
IFEP (Institute for Fisheries Economics and Planning). 1997. Vietnam’s Fisheries: A NationalOverview of Fisheries and Aquaculture. Prepared by IFEP for the Ministry of Planning andInvestment and the Ministry of Fisheries for the First Donor Coordination Meeting for Fisheries,9 December 1996. Hanoi.
IFPRI (International Food Policy Research Institute). 1996. Rice Market Monitoring and PolicyOptions Study. Prepared by IFPRI for the Asian Development Bank. Washington, DC.

127
Jaffee, S. 1992. Exporting high-value food commodities: Success stories from developingcountries. World Bank Discussion Papers No. 198. Washington, DC.
Muir, R. and J.P. Saba. 1995. Improving state enterprise performance: The role of internal andexternal incentives. World Bank Technical Paper No. 306. The World Bank. Washington, DC.
Pingali, P., N. Khiem, R. Gerpacio, and V. Xuan. 1998. “Sustainability of rice export growth inVietnam”. Food Policy. February.
Saigon Times Daily. (various issues).
Statistics Publishing House. 1997. The tariff and the list of the imports-exports: The latestwriting. Hanoi.
Tsutsumi, T. 1991. “Changing dietary intake and processed food consumption”. In Foodprocessing industry in Asia and the Pacific. Asian Productivity Organization. Tokyo.
Valdecanas, T. 1996. “Vietnam’s agricultural sector”. Economic Research Service, UnitedStates Department of Agriculture. Washington, DC.Brown, J.G. (ed.). 1991. “Agroindustry Profiles: Fruits and vegetables.” Economic DevelopmentInstitute Working Papers. The World Bank. Washington, DC.
VET (Vietnam Economic Times). Various issues.
Viet Nam News. (various issues).
Vietnam Business. 1998. Phuoc An Coffee Company takes a look back at post 20 year”. Vol.8, No. 6. March 16-31. Hanoi.
Washington Post. 1998. "As food imports grow, Federal inspections lag." Associated Press.Page A2. May 12, 1998.
World Bank. 1993. Viet Nam Agricultural Marketing Study. Washington, DC.

128
PEOPLE CONTACTED
Fritz Jepsen, DANIDA Seafood Export and Quality Improvement Project (SEAQIP), Ministry ofFisheries, Hanoi
Tran Khai, President, Vietnam Coffee Corporation (VINACAFE), Hanoi
Pham Ngoc Quyen, Fisheries Engineer, Ministry of Planning and Investment, Hai Phong
Pham Van Dan, Vice-Director, Ha Long Canned Food Company, Hai Phong
Nguyen Van Hoa, Hai Phong Processing and Export Seafood Compnay, Hai Phong
Nguyen Van Be, Vegetable and Fruits Corporation of Ho Chi Minh City (VEGFRUCO), Ho ChiMinh City
Nguyen Van Son, Director of Planning Division, Food Company of Ho Chi Minh City(FOOCOSA), Ho Chi Minh City
Nguyen Tan Luy, Deputy Chief of the Import-Export and Trading Division, Food Company ofHo Chi Minh City (FOOCOSA), Ho Chi Minh City
Dang Hong Quan, Director, Cuu Long Rice Mill No. 1, Ho Chi Minh City
Pham Thi My Giang, Manager of Import-Export Department, Viet Phu Seaproducts Processingand Import-Export Company, Ho Chi Minh City
Trung The Thanh Thuy, Vinh Phat Rice Milling Company, Ho Chi Minh City
Nguyen Thi Thanh Mai, Export Foodstuffs and Agricultural Products Company (Agrex Saigon),Ho Chi Minh City
Le Thi Nhung, Director, Tan Binh Foodstuffs Export Company, Ho Chi Minh City
Hoang Vinh, Manager of International Cooperation and Marketing, SEAPRODEX, Ho Chi MinhCity
Bui The Ngoc, Director, Long Hai Food Company, Long Hai, Ba Ria-Vung Tau Province
Doan Nguyet Huy, Director, Phuoc Co Aquatic Products Processing Factory (VIMEXCO), VungTau, Ba Ria-Vung Tau Province
Phan Thanh Chien, Director, Hai Viet Factory (HAVICO), Vung Tau, Ba Ria-Vung TauProvince
Ngo Duc Trung, Assistant Director, Vung Tau Export Seaproducts Processing Company(VTESCO), Vung Tau, Ba Ria-Vung Tau Province

129
Huynh Minh Tan, Chief of Administrative Department, Vung Tau Export SeaproductsProcessing Company (VTESCO), Vung Tau, Ba Ria-Vung Tau Province
Nguyen Thanh Son, Vice-Director, Department of Planning and Investment, Buon Ma Thuot,Dak Lak Province
Vo Ngoc Tuyen, Chief of Department of Economics, Department of Planning and Investment,Buon Ma Thuot, Dak Lak Province
Melchior Landolt, Project Coordinator, GTZ Viet Duc Coffee Project, Buon Ma Thuot, Dak LakProvince
Frank Gerke, Technical Expert, GTZ Viet Duc Coffee Project, Buon Ma Thuot, Dak LakProvince
Le Tien Hong, Vice-Director, September 9 Import-Export Company (SIMEXCO), Buon MaThuot, Dak Lak Province
Nguyen Thin Phuoc, Vice-Director, Hiep Phuc Trading Company, Buon Ma Thuot, Dak LakProvince
Nguyen Duc Toan, Dak Lak Investment Export-Import Company (INEXIM), Buon Ma Thuot,Dak Lak Province
Hoa Dinh Toan, Manager of Plant No. 1, Dak Lak Investment Export-Import Company(INEXIM), Buon Ma Thuot, Dak Lak Province
Hoa Lan, Manager of Plant No. 3, Dak Lak Investment Export-Import Company (INEXIM),Buon Ma Thuot, Dak Lak Province
Nguyen Ba Nhat, Director, Lien Phat Coffee Processing Company, Buon Ma Thuot, Dak LakProvince
Thi My Hoa, Lien Phat Coffee Processing Company, Buon Ma Thuot, Dak Lak Province
Nguyen Van Giam, Director, Doan Ket Coffee Company, Buon Ma Thuot, Dak Lak Province
Nguyen Van Ba, Doan Ket Coffee Company, Buon Ma Thuot, Dak Lak Province
Dinh Xuan Suu, Manager of Planning Department, Thang Loi Coffee Company, Buon MaThuot, Dak Lak Province
Nguyen Quoc Luong, Vice General Director, Vietnam National Vegetables and FruitsCorporation (VEGETEXCO), Hanoi
Le Van Anh, Director, Vegetables and Fruits Export-Import Company I Hanoi (VEGETEXCO IHanoi), Hanoi
Ross Kreamer, Agricultural Attache, United States Embassy, Hanoi