Ministry of natural resources and environment of viet nam
165
Draft 1 1 Ministry of natural resources and environment of viet nam Unep/gef project "Viet Nam: Expedited financing for measures for capacity building in priority areas (Phase II)" Technical report on the identification and assessment of technology needs for GHG emission reduction and climate change adaptation in Viet Nam Ha Noi, November 2005.
-
Upload
khangminh22 -
Category
Documents
-
view
1 -
download
0
Transcript of Ministry of natural resources and environment of viet nam

Draft 1
1
Ministry of natural resources andenvironment of viet nam
Unep/gef project "Viet Nam: Expedited financing for measures forcapacity building in priority areas (Phase II)"
Technical report on the identification and assessment oftechnology needs for GHG emission reduction and
climate change adaptation in Viet Nam
Ha Noi, November 2005.
Draft 1
2
FOREWORDThis work is the continuation and constituent part of the Initial National Communication on theClimate Change of Viet Nam submitted to the United Nations Framework Convention onClimate Change (UNFCCC) Secretariat in November 2003 at COP 9, Milan, Italy.
The Technology Needs Assessment (TNA) report provides an assessment of national needs forboth types of technologies - greenhouse gas abatement technologies and adaptation technologies.It has been designed into two parts structured as follows:Part 1: TNA for Abatement of GHG Emissions - this part gives an assessment for country needson less GHG emission technologies, for each sector that contributes to the greenhouse gasemission.
Part 2: TNA for Adaptation Technology - this part gives an assessment for country needs onadaptation technologies focused on the Viet Nam’s coastal zone.
The TNA report starts with an introduction, including the Convention context, explanation onwhat are the TNA and the structure of the report
The present document focuses mainly on the identification, assessment and application ofeffective technologies needs with a view of improving the policies, measures related to ClimateChange issues in specified economic sectors including the determination of principal barriers inthe technologies transfer and project implementation in Viet Nam.
This work is sponsored and financed by UNEP/GEF under the project "Viet Nam: Expeditedfinancing for measures for capacity building in priority areas (Phase II)" and prepared by theInternational Cooperation Department of Ministry of Natural Resources and Environment of VietNam in cooperation with experts, scientists from different Ministries, Agencies, Organizations ofViet Nam.The results of this work are a good and important basis for the stocktaking exercise andespecially preparation of the Second National Communication on Climate Change of Viet Namto the UNFCCC Secretariat in pursuance of Articles 4.1 and 12.1 of the Convention. They alsocontribute to achieve sustained environmentally sound socio-economic development goals in thecountry.
On the occasion of the publication of the present document, I would like to take this opportunityto express my sincere thanks to all authors for their effective contribution to this report.
Finally, I wish to extend my deep gratitude to the UNEP, GEF for their unceasing support andfruitful cooperation during the implementation of the above-mentioned project in Viet Nam
Nguyen Khac HieuDeputy Director General
International Cooperation DepartmentMinistry of Natural Resources and Environment of Viet Nam
Draft 1
3
CONTENTS
Foreword ..........................................................................................................................
Introduction .....................................................................................................................Chapter 1: National circumstances ...............................................................................
1.1. Geography ............................................................................................................1.2. Climate .................................................................................................................
1.3. Natural resources ..................................................................................................1.4. Population ............................................................................................................
1.5. Socio-economic profile and development ............................................................1.6. Industry ................................................................................................................
1.7. Energy ..................................................................................................................1.8. Agriculture ...........................................................................................................
1.9. Forestry ................................................................................................................
Chapter 2: The Needs assessment process ....................................................................
Part I: Technology needs assessment for GHGs abatement .......................................Chapter 3: The Technology needs assessment for energy supply .............................
3.1. Overview of options and resources .................................................................
3.2. Selection of key technologies ..........................................................................
3.2.1. GHG Emissions from Energy sector from National GHG inventory(1994) ........................................................................................................
3.2.2. Main orientations of applying the GHG reduction technologies forenergy supply ..........................................................................................
3.2.3. Analysing and estimating of the demand on environmentally friendlytechnologies used for electricity production .............................................
3.2.4. Analysing and estimating the demand on environmentally friendlytechnologies used for coal mining ............................................................
3.2.5. Estimating the demand on renewable energy technologies ......................
3.3. Identification of existing barriers and policy needs ......................................3.3.1. Absence of GHG concerns in project consideration of energy planners
and policy makers .....................................................................................3.3.2. High investment need of new and modern energy technologies ...............
3.3.3. Absence of a national coherent programme and policies for renewableenergy development ..................................................................................
3.4. Definition and selection of actions ................................................................
Page2
1118
1819
2021
2228
3032
3342
5354
5455
55
55
56
5657
60
60
60
6061
Draft 1
4
3.4.1. GHG reduction-oriented technological options for non-renewableenergy supply ............................................................................................
3.4.2. GHG reduction-oriented technological options for renewable energysupply ........................................................................................................
3.4.3. GHG reduction related policy instruments for promotion of energysupply ........................................................................................................
3.5. Stakeholders .........................................................................................................
Chapter 4: The Technology needs assessment in Service and Household sector ......4.1. Overview on options and resources .....................................................................4.2. Selection of key technologies ..............................................................................
4.3. Identification of barriers and policy needs ...........................................................4.4. Stakeholders .........................................................................................................
Chapter 5: The Technology needs assessment for Industry sector ............................5.1. Overview on options and resources .....................................................................
5.1.1. Cement ......................................................................................................5.1.2. Steel ...........................................................................................................
5.1.3. Construction materials ..............................................................................5.2. Selection of key technologies ..............................................................................
5.2.1. Cement sector ............................................................................................5.2.2. Steel sector ................................................................................................
5.2.3. Construction material sector .....................................................................5.3. Identification of barriers and policy needs ..........................................................
5.3.1. Regulatory barriers ....................................................................................5.3.2. Economic system and sectoral structure ...................................................
5.3.3. Low awareness ..........................................................................................5.3.4. Capital .......................................................................................................
5.3.5. Supplier .....................................................................................................5.4. Definition and selection of actions .......................................................................
5.4.1. Capacity building ......................................................................................5.4.2. Policy and incentives ................................................................................
5.4.3. Funding .....................................................................................................5.4.4. Demonstration ...........................................................................................
5.5. Stakeholders .........................................................................................................
Chapter 6: The Technology needs assessment for Transport sector ..........................6.1. Overview on options and resources .....................................................................
61
61
6263
6767
6871
7273
7373
7373
7474
7983
8787
8888
8888
8888
8989
8989
9090

Draft 1
5
6.2. Selection of key technologies...............................................................................6.2.1. Developing the public transport system, limiting the number of moto-
scooter/motorcycle in the cities of Viet Nam ...........................................6.2.2. Constructing and operating the public railway system in Viet Nam ........
6.2.3. Using LPG for the transport means in Viet Nam ......................................6.2.4. Implementing the road map of exhaust gases standards for road
transport means .........................................................................................6.3. Identification of barriers and policy needs ...........................................................
6.4. Definition and selection of actions .......................................................................6.4.1. Railway transport development ................................................................
6.4.2. Transport development in big cities .........................................................6.4.3. Cleaner fuel transport means development ..............................................
Chapter 7: The Technology needs assessment for Forestry sector ............................7.1. Overview on options and resources .....................................................................
7.1.1. Changing forest areas ................................................................................7.1.2. Forest development strategy .....................................................................
7.1.3. GHG inventory in forestry and land use change in 1998 ..........................7.2. Selection of key technologies .............................................................................
7.2.1. The identification of Technology needs assessment for Forestry andland use change sector ..............................................................................
7.2.2. Forest protection immediate tasks .............................................................7.2.3. Afforestation .............................................................................................
7.2.4. Natural forest recovery technology ...........................................................7.2.5. Planting scattered trees ..............................................................................
7.2.6. Forest fire prevention and fight technology ..............................................7.3. Identification of barriers and policy needs ...........................................................
7.4. Definition and selection of actions .......................................................................7.5. Stakeholders ........................................................................................................
Chapter 8: The Technology needs assessment for Agricultural sector .....................
8.1. Overview on options and resources ................................................................
8.2. Selection of key technologies ..............................................................................
8.2.1. The identification of technology needs assessment for Agriculturalsector .........................................................................................................
8.2.2. Assessment of technology needs for Agricultural sector .........................8.3. Identification of barriers and policy needs ...........................................................
92
9292
93
94
9494
9494
9495
9595
9596
96
9696
9697
9797
9898
98100
100102
102
103105

Draft 1
6
8.3.1. Water management from rice paddy .........................................................8.3.2. Improved nutrition through integrated supplementation - feeding
molasses urea block ..................................................................................8.3.3. Manure treatment by using digesters ........................................................
8.4. Definition and selection of actions .......................................................................8.5. Stakeholders .........................................................................................................
Part II: Technology needs assessment for adaptation to climate changes .................Chapter 9: Identification and assessment of adaptation technology needs onAgriculture, Water resources, Coastal zone management ..........................................
9.1. Overview on options and resources ................................................................9.2. Selection of key technologies in Agricultural sector ...................................
9.2.1. Background ...............................................................................................9.2.2. The key adaptation technologies in Agricultural sector ............................
9.2.3. Identification of barriers and policy needs ................................................
9.3. Selection of key technologies in Water resources ........................................9.3.1. Background ...............................................................................................9.3.2. The key adaptation technologies in Water resources sector .....................
9.3.3. Identification of barriers and policy needs ...............................................
9.4. Selection of key technologies in Coastal zone management ......................9.4.1. Background ...............................................................................................
9.4.2. Selection of key adaptation technology in Coastal zone management .....9.4.3. The key adaptation technology in Coastal zone management ..................
9.4.4. Identification of barriers and policy needs ................................................
Chapter 10: Participation in systematic observation network ...................................10.1. Hydro-Meteorological Networks .......................................................................
10.1.1. Meteorological stations network .............................................................10.1.2. Hydrological stations network ................................................................
10.1.3. System of Hydro-Meteorological forecasts ............................................10.1.4. Research and international cooperation activities of the National
Hydro-Meteorological Service of Viet Nam ............................................10.2. The main barriers in developing the observations network ...............................
10.3. Development orientation of the National Hydro-Meteorological Service ofViet Nam up to 2015 ..........................................................................................
Conclusions ......................................................................................................................References ........................................................................................................................
105
105105
105107
108
109109
109
109110
110111
111113
113113
113114
115116
117117
119120
120
131131
132
133134

Draft 1
7
Abbreviations, measurement units, exchange units .....................................................The list of potential projects for mitigating GHG emissions ......................................
The list of authors ...........................................................................................................
138141
164

Draft 1
8
LIST OF FIGURES
Chapter 11.1. Structure of GDP 2004 at current prices by ownership (%) ................................
1.2. Structure of GDP 2004 at current prices by economic sector (%) .......................
Chapter 88.1. 1994 GHG emission inventory ............................................................................
Chapter 1010.1. Organization chart of NHMS .............................................................................10.2. Weather radars ...................................................................................................
10.3. NHMS's Communication network .....................................................................10.4. NHMS's WAN ...................................................................................................
10.5. NHMS's MET TV ..............................................................................................10.6. Data Processing system .....................................................................................
10.7. Forecasting system ............................................................................................10.8. Functions of each forecasting level ...................................................................
Page
25
25
101
118119
125125
126126
127128
Draft 1
9
LIST OF TABLES
Chapter 11.1. Population and population density in Viet Nam in 2004 by region .....................
1.2. Average population in Viet Nam by sex and by residence ..................................1.3. Gross domestic product at constant 1994 prices by economic sectors ................
1.4. Estimated GHGs emissions to 2020 by sectors ...................................................1.5. GHG inventory in 1994 .......................................................................................
1.6. Growth rate by economic sectors (at constant 1994 prices) ................................1.7. Universities offering training of environmental technological engineers in Viet
Nam ......................................................................................................................
Chapter 22.1. Criteria for technology need assessment ..............................................................2.2. Key priorities sectors for TNA in Viet Nam ........................................................
2.3. Areas to be selected for technology needs assessment ........................................
Chapter 33.1. Synthesizing the need for GHG reduction technologies
of energy sector and their GHG reduction capability determined for the period2010 - 2020 ..........................................................................................................
3.2. Environmental policy instrument related to GHG emission reduction ................
Chapter 44.1. Total final commercial energy consumption by fuels, MTOE ............................4.2. Viet Nam electricity consumption by sector (TWh,%) .......................................
Chapter 55.1. Cement productions .............................................................................................
5.2. Demand and production* volume (forecast and planned) ...................................5.3. GHG Emission from Viet Nam cement sector ....................................................
5.4. Technology needs identification ..........................................................................5.5. Added cement production capacity ......................................................................
5.6. Technology assessment ........................................................................................5.7. Iron, steel production of Viet Nam in 2002 .........................................................
5.8. GHG emission of Viet Nam steel sector ..............................................................5.9. Identification of technology needs .......................................................................
5.10. Technology assessment ......................................................................................
Page
21
2225
2727
29
40
48
4950
5962
67
67
7476
7677
7877
8081
8283

Draft 1
10
5.11. Situation of construction materials production from 1995 to 2002 ...................5.12. Energy consumption of brick – kilns in Viet Nam ............................................
5.13. Coal consumption of some types of brick-kilns ................................................5.14. Volume of GHG emissions from brick production in Viet Nam ......................
5.15.The growth rate of some main construction materials in past years ..................5.16. GHG emission from brick production sector in Viet Nam (period 2002-2020)
5.17. Kiln types with EE and better fuel combustion .................................................5.18. Fuel consumption of vertical shaft brick and traditional kiln ............................
Chapter 66.1. Volume of passengers carried by type of transport .............................................
6.2. Volume of passenger’s traffic by type of transport .............................................6.3. Volume of freight by type of transport ................................................................
6.4. Volume of freight traffic by type of transport .....................................................
Chapter 77.1. Changes in forest cover between1943 to 2003 ....................................................
Chapter 88.1. 1994 GHG emissions from agricultural sector ....................................................8.2. The technologies needs for reducing GHG emission in Agricultural sector
(livestock and rice cultivation) .............................................................................8.3. The experimental results on water management with intermittent draining for
reducing CH4 in Viet Nam ..................................................................................8.4. The aspects of technical, finance, policy and institution to implement ...............
Chapter 99.1. Change of annual run-off due to climate change impacts ...................................
8384
8585
8686
8687
90
9091
91
95
101
102
103106
112
Draft 1
11
INTRODUCTIONClimate change is one of the critical environmental problems, which the world and VietNam is facing today. Effects of climate change in various sectors affect many countriesincluding Viet Nam. The consequences may be profound on agriculture and terrestrialsystems, hydrology and water resources, human health, forests and wild life, coastalzones, finance, insurance, energy, commerce, industry and urban and rural settlements.Presently, initiatives are underway to identify and develop technologies and practices formitigating climate change and adapting to it. The development and application of thetechnologies is fully consistent with the general goals of sustainable development.Article 4.5 of the UNFCCC calls for country parties to undertake technology transfer andneeds assessment with the aim of adapting to and mitigating the effects of climatechange. In undertaking the task, the Viet Nam Government reviewed its nationalcircumstances and identified priority climate change issues that need intervention throughtechnology transfer and needs assessment.Viet Nam signed the United Nations Framework Convention on Climate Change(UNFCCC) at the Rio de Janeiro Earth Summit in June 1992, after the Convention wasadopted on 9 May 1992. The Climate Convention entered into force globally on 21March 1994 and specifically for Viet Nam ratification on 16 November 1994 and KyotoProtocol (KP) on 25 September 2002.The Ministry of Natural Resources and Environment of Viet Nam was assigned by theGovernment of Viet Nam as a National Focal Authority for taking part in andimplementing UNFCCC and KP. The International Cooperation Department of MONREhas responsibilities to assist the Minister of MONRE in coordinating and managing allactivities related to the UNFCCC, KP and Clean Development Mechanism in Viet Nam.The Project "Viet Nam: Preparation of the Initial National Communication on ClimateChange to the UNFCCC - GF/2200-97-54" financially and technically supported byUNEP/GEF was successfully completed in 2002. This INC of Viet Nam was submitted tothe UNFCCC Secretariat in November 2003. Within the framework of this INC, theGHGs inventory for 1994 and GHGs emission projection to 2020 were carried out;different GHG abatement options in energy, agriculture and forestry sectors weredeveloped; the potential impacts of climate change on some major economic activitiesand adaptation measures were evaluated; the GHGs mitigation strategies through socio-economic development plan were also presented.The Project "Viet Nam: Expedited financing for measures for capacity building inpriority areas (Phase II) - GF/2724-03-4701" funded and assisted by UNEP/GEF ismanaged by ICD, MONRE. The main objectives of this project are:
• To help meet the added requirement of enhancing capacity in order to identify andanalyse technological needs;
• To access information on technology transfer and sensitise the public awareness onclimate change;
Draft 1
12
• To build capacity to prepare climate change programmes promoting technologytransfer;
• To build the capacity to improve the quality of climate change enabling activities.This project is a follow-up to the INC. It helped Viet Nam reinforce capacities, identifyand assess technological needs in the area of climate change.Structure of the reportThe TNA report provides an assessment of national needs for both types of technologies -greenhouse gas abatement technologies and adaptation technologies. The TNA reportstarts with an Introduction, including the UNFCCC context, explanation on what are theTNA and the structure of the report. It has been designed into two parts structured asfollows:
• Foreword
• Introduction
• Chapter 1: National circumstances
• Chapter 2: The Needs assessment processPart I: Technology needs assessment for abatement of GHG emissions
• Chapter 3: The Technology needs assessment for Energy supply
• Chapter 4: The Technology needs assessment in Service and Household sector
• Chapter 5: The Technology needs assessment for Industry sector
• Chapter 6: The Technology needs assessment for Transport sector
• Chapter 7: The Technology needs assessment for Forestry sector
• Chapter 8: The Technology needs assessment for Agricultural sectorPart II: Technology needs assessment for adaptation technology
• Chapter 9: Identification and assessment of adaptation technology needs onagriculture, water resources, coastal zone management
• Chapter 10: Participation in Systematic observation network
• Conclusions
Draft 1
13
A. What is the Technology needs assessmentThe UNFCCC identifies TNA as one of the five key elements of a framework to enhancetechnology transfer 1. The elements of the technology transfer are as following:
• Technology needs and needs assessment• Technology information• Enabling environments• Capacity building• Mechanisms for technology transfer
This framework to facilitate and enhance technology transfer activities under theUNFCCC is based in large part on examination of the experience gained through existingtechnology transfer initiatives between developing countries and donor organizations.According to the Intergovernmental Panel on Climate Change (IPCC), “technologytransfer” means a set of processes covering the flows of know-how, experience andequipment for mitigating and adapting to climate change amongst different stakeholderssuch as governments, private sector entities, financial institutions, NGOs and research/education institutions.TNA as a component of the technology transfer process is a mean by which assessmentof development and climate response needs and opportunities are brought together andintegrated. TNA is a complex process, it is not a stand alone activity; rather it is acontinuation of the work most countries have already carried out oridentified/recommended in their National Communications and through other activities toenhance technology transfer.TNA entails the identification and evaluation of technical means for achieving specifiedends. From a climate change and developmental perspective, TNA would identifytechnologies, practices and reforms that might be implemented in different sectors of acountry to reduce GHG emissions and vulnerability to climate change and to contributeto development goals.Technology needs assessment is therefore a component of an integrated set of activitiesthat are designed to enhance technology transfer, and which is critical to the avoidance ofadopting mal-suited technologies that could run counter to sustainable developmentobjectivesB. Approaches and Principles of Technology needs assessmentTechnology needs assessments (TNAs) are frameworks designed to help identify thetechnology needs and priorities of Viet Nam in order to ensure technology transfer canoccur successfully. Because successful technology transfer depends crucially on theexistence of local abilities to assess and acquire technology (‘acquisition capability’), theTNA frameworks developed in this report focus on needs, strengths and weaknesses froma country capability point of view.
There are two major dimensions of technological capability. First, is the capability todevelop strategies and manage technological acquisition, use and further development
Draft 1
14
(sometimes called ‘techno-managerial’ capabilities). Second, is the detailed engineering(or scientific) capacity needed to acquire and develop specific technologies.
Technology needs assessment entails the identification and evaluation of technical meansfor achieving specified ends. From a climate change and developmental perspective,TNA prioritises technologies, practices, and policy reforms that can be implemented indifferent sectors of a country to reduce greenhouse gas emissions and/or to adapt to theimpacts of climate change by enhancing resilience and/or contributing to sustainabledevelopment goals in Viet Nam.Think of TNA as an approach by which sustainable development, climate changetechnologies, and opportunities are integrated. Many of the applicable technologies formitigating GHG emissions and adapting to climate change may also be well-suited tosustainable development priorities in a broad sense. Indeed, those concerned withadaptation – such as those that protect or improve natural resources, or that maintain andimprove agricultural output – are also necessary for sustainable development. Similarly,many of the technologies being developed in response to the needs of GHG mitigation,especially those related to renewable energy and energy efficiency, will also help toproduce and consume energy in a sustainable way. TNA is not a stand-alone activity.Rather, it is a continuation of the work countries have carried out or identified in theirNational Communications and through other activities to enhance technology transfer. inparticular developing countries, in the process of technology transfer.Conducting technology needs assessment for climate change requires a focus on twomajor areas, GHG mitigation and adaptation to the impacts of climate change. It needs tobe recognised at the outset that the particular processes used to assess technology needsin these two areas, though fundamentally consistent in key areas, may be operationallydistinct in others.Assessing technologies for mitigating GHG emissions is fairly “straightforward”. Suchtechnologies have a simple and clear objective – i.e., the reduction or avoidance of GHGemissions – and tend to target specific, well-known, emitting sectors such as powergeneration and transportation.There is a large case study literature of mitigation technology applications that yieldslessons that can be learned and taken into account when assessing such technologies in alocal context.Assessing technologies for adapting to climate change poses a more complex challengeon two levels.
• First, there’s inherently more uncertainty regarding vulnerability, as impacts tend tobe highly site-specific and not easily general sable across spatial and temporal scales.This uncertainty carries over to identification of appropriate adaptation measures,options, and technologies – as well as the stakeholders that are affected. Therefore,hard technologies may not be appropriate.
• Secondly, adaptation concerns have only recently moved onto centre stage of theclimate change negotiations. Unlike the mitigation area, which can claim a formal
Draft 1
15
protocol as a framework for North-South cooperation on reducing GHGs (i.e., theKyoto Protocol), there is no comparable approach as yet in the adaptation area.
Technology Needs Assessment is country-driven and must be done through aconsultative process that engages all relevant stakeholders. To achieve that, the NationalClimate Change Co-coordinator brought all stakeholders to a common level ofunderstanding of the TNA process by developing introductory materials for them. Thismaterial referred to as the ‘ Scoping Document’ defined in general the TNA process andoutlined the purpose and the generic approach to TNA. In addition, the scoping documentgave a brief background to the United Nations Framework Convention on ClimateChange, indicating in particular the status of technology transfer negotiating process.As was mentioned by IPCC, the technologies serving for climate change impactsmitigation and adaptation to climate change must be an Environmentally SoundTechnology (EST) and support the sustainable development. While identifying thetechnology needs of Viet Nam not only the assessment of specific technology types isnecessary, but it is also significant to consider the entire systems, which include suchaspects as know-how, production procedures, goods and services, organization andmanagement. Thus the concept “technology” covers not only the physical appearance butalso all of the procedures concerning production and usage of a technology in its’physical terms.Manufacturing and introduction of new technologies must base upon the nationaleconomic development priorities. Achievement of social and economic growth is thebasic objective of economic policies pursued by Viet Nam with transition economies.However methods of how to achieve and support economic growth must conform toenvironmental standards and priorities.
Methodology of studyMethod of study included the preparation of a scoping document that gave a backgroundto the UNFCCC and the TNA process. This was discussed by a Technical Committee onTechnology Needs Assessment composed of all relevant stakeholders under grand byMONRE. Terms of reference for work to be carried out under the various sectorsidentified under the initial national communication chapter on mitigation options weredeveloped and experts from the relevant institutions identified. They carried out literaturesearches, reviewed national reports and documents to come up with reports oninformation on GHG emissions and technologies/practices in their areas of expertise.These reports were reviewed and in-depth analysis carried out in workshops organized bythe Technical Committee. After the finalization of the work, the compiled report wascirculated to all stakeholders and a final workshop called to adopt the report.

Draft 1
16
C. Objective of TNA in context of National development goalsThe objective of report is valuable to anyone wishing to understand how to undertake anassessment of climate change adaptation technologies, regard less of their level offamiliarity with the particular technologies associated with GHG mitigation andadaptation, and may be tasked with organising policy or project formulation related toEnvironmentally Sound Technology transferThe role of technology needs assessment has been defined and justified under the ClimateChange Convention. From a climate change and developmental perspective, technologyneeds assessment entails the identification and evaluation of technologies, practices andreforms that can be implemented in different development sectors to reduce green housegas emissions and climate change vulnerability and also to contribute towards nationaldevelopment goals.Technology needs assessment is capable of yielding a variety of outputs, depending onhow it is applied. While specific outputs depend on the particular needs and goals of theexercise, in general, a completed TNA process leads to a clarification of technologybarriers, strategies, policies, and options that a country could implement to reduce GHGemissions and/or enhance the ability to adapt to climate change. These can be aimed atdifferent levels of society, as well as at different sectoral and temporal scalesMany of the technologies and practices for adaptation to and mitigating adverse effects ofclimate change are well suited to the needs of the country’s socio-economic development.Also, many of such technologies have become economically important sources ofsupplying and utilizing energy efficiently.The Viet Nam Government has established institutional structures and arrangements toengage various stakeholders and development partners in technology transfer and needsassessment. Priority technologies have been identified and appraised based on specialcriteria that encompass development benefits, market potential and adaptation to climatechange. Presently, the priority sectors selected for climate change adaptation includeenergy, transport, agriculture, irrigation, water, meteorology, industry, health andeducation.This report purpose will be to identify and exploit the country and internationalopportunities for technology transfer. Several major outcomes are envisioned:
• National policy development: TNA can be used to explore governmental decisionsaimed at integrating sustainable development planning with the impacts of climatechange. For adaptation, this policy focus may be directed at important sectors of thenational economy such as agriculture, forestry, water resources, coastal zones, etc.For mitigation, the transportation or power generation sectors could be targeted.
• Adaptation and mitigation assessments: Technology used to address mitigationissues may also have implications for addressing adaptation issues. TNA can be usedto explore these potential linkages in conjunction with other initiatives aimed atanalysing options and/or national plans for mitigation and adaptation.
Draft 1
17
D. Methodologies for TNAThe concept of a methodology for technology needs assessment is simply a clear,comprehensive and consistent description of a set of activities that can help to ensure thatTNA is undertaken in an effective and efficient manner. It is simply an outline oroverview of a step-by-step approach to a particular problem. This does not mean thatTNA can be reduced to a simplistic or linear approach (where one step must be followedby another); there are linkages and feedbacks between all of the steps and activitiesdescribed here.It is possible to identify a wide range of issues for Viet Nam seeking to improve thedevelopment and transfer of technologies – assessment of technology needs is only oneof aspect. The report is concerned with this aspect alone, but this is not to suggest thatTNA is any more or less important than any of the other activities that can improve theflow of technologies and know-how between and within Viet Nam and others countries;indeed needs assessments only make sense when viewed within this wider context.It is also the case that a variety of approaches to technology needs assessment areavailable; several studies have considered, either explicitly or implicitly, the TNAprocess. These studies entail varying degrees of complexity, in part as a result of theextent to which they focus solely on TNA, or also deal with wider issues. It is not thepurpose of the report to provide a discussion of different approaches and their merits;rather it is to set out a viable and consistent approach that Viet Nam may apply directlyFinally, it is important to be clear that in describing an approach, or methodology, forTNA the report does not set out to prescribe a single, inflexible means by which TNAmay be delivered. This diversity of circumstance is often captured in the expression ‘onesize does not fit all’. However, there are many steps and considerations that are commonto all and the approach set out here is designed, as far as is practicable, to be modifiedand adapted to suit circumstances.

Draft 1
18
CHAPTER 1NATIONAL CIRCUMSTANCES
IntroductionThere is a growing awareness that the increase in the amount of greenhouse gases beingreleased into the atmosphere will have adverse effects on the global weather systems.This will likely affect the natural resources. The key natural resource sectors that mightbe susceptible to changes in climate include agricultural crops, livestock, forests, waterresources, coastal resources, fisheries, and wildlife.Viet Nam is more vulnerable than industrialized countries to the effects of climaticchange for two reasons. First, the current economic and ecological crises have weakenedthe capacity of many countries to adjust to drastic economic and ecological changes.Second, most of the people depend on agriculture for their subsistence, and agriculturedepends a great deal on climatic patterns.Viet Nam is one of the countries that have ratified the United Nations FrameworkConvention on Climate Change. Under this Convention, Parties to the Convention mustcommunicate to the Conference of the Parties (COP) their national inventories ofanthropogenic emissions of all greenhouse gases by sources and sinks using comparativemethodologies. Viet Nam undertook their greenhouse gas inventory based on the years1990 and 1994. Additionally, Viet Nam has started to assess the vulnerability ofimportant sectors (Energy, Transport, Agriculture, Forest and others) to climate changeimpacts and recommend adaptation and mitigation measures.The aim of this chapter is to give thecontext in which Viet Nam exists,especially in relation to climate change andcapacity of the country to respond toclimate change impacts. The subsequentsections give a summary of Viet Nam’sgeography and climate, natural resources,land use, history and climate, population,energy, industry and tourism, socio-economic and development profile, forestryand agriculture of Viet Nam. 1.1. GeographyViet Nam country is located in the SouthEast Asia, stretching from 8027 to 23023 Nand from 102008 to 109030 E, Viet Nam hasa total land area of 329,314 km2, of whichthe area of plains is only 7 million ha andthe remainder is mountains, hills andplateau. Viet Nam has also a sea waterterritory under sovereignty and jurisdiction

Draft 1
19
of approximately 1 million km2 and 3000 big, medium and small islands with total areaof more than 1600 km2. The entire length of the coastline is 3260 km.Viet Nam is a strip of land shaped like the letter "S". It borders China to the North, Laosand Cambodia to the West, the East Sea to the East and the Pacific Ocean to the East andSouth. The inland border is 4500 km. The country total length from North to South is1650 km. Its width, stretching from East to West, is 600 km at the widest point in theNorth, 400 km in the South and 50 km at the narrowest part, in the Centre, in Quang Binhprovince. Viet Nam is also a transport junction from the Indian Ocean to the PacificOcean.1.2. ClimateViet Nam climate generally is subtropical andtropical, hot and wet monsoon climate. Itsclimate is characterized by strong monsoons, aconsiderable number of sunny days, high levelsof rainfall and high humidity.Although, the entire country lies in the tropicsand subtropics, it presents a very diverseclimate according to its different altitudes andlatitudes. Based on climate conditions, VietNam can be divided into two regions, separatedby the Hai Van mountain pass, with is locatedbetween Hue and Da Nang cities. In the areasNorth from Hai Van Mountain pass, it is coldin the winter and hot and wet in the summer,with average annual temperature of 22 - 240C.The average temperature of the coldest monthis 15 - 190C, and average temperature of thehottest month is 32 - 34.40C. In the areas fromSouth of the Hai Van mountain pass, it is hotall the year round, with average annualtemperature of 25 - 270C (except Tay Nguyen plateau with average annual temperature of20 - 220C), and average temperature in the coldest month of 21 - 260C and averagetemperature in the hottest month of 32 - 34.50C.Viet Nam is often threatened by typhoons, storms, floods and salinity intrusion. Onaverage, Viet Nam is hit annually by 4 - 5 typhoons.The rainfall in Viet Nam is irregularly distributed during the year and over differentregions of the country. Therefore, floods and inundation occur during rainy season but indry season, drought is often recorded in several regions. The average annual rainfall ofViet Nam is from 1500 to 2500 mm and the average annual humidity is 80 - 85%. Thetotal amount of annual solar radiation is 95 - 175Kcal/cm2.

Draft 1
20
1.3. Natural resourcesViet Nam is richly endowed with natural resources, and the country’s economy is heavilydependent on this base. Agriculture, forestry and fisheries account for 25.7% of totalGDP and 70% of total employment.These sub-sectors underpin almost all rural economic activity. But trends indicate thatuse and management patterns in the natural resource sector are a threat to Viet Nam’scontinued economic viability. Environmental degradation from unsustainable use isincreasingly undermining this sector’s capacity to support current, let alone forecastincreases in, economic demand. This is because use patterns in all sub sectors are causingenvironmental degradation. While there are issues common to the entire natural resourcesector, each sub-sector has its own unique set of use and management characteristics thatare causing this degradation.Viet Nam's coal reserves are located mainly in the northeastern province of Quang Ninh.Reserves are estimated at 3.88 billion tons, of which 660 million tons are approved and410 million tons are accessible through underground operations. Most of the reserves areanthracite or semi-anthracite varieties. Lignite coal in the Red River Delta has theforecast reserves of 250 billion tons. Peat coal is concentrated in the Mekong River Deltawith the reserves of about 10 billion tons. Fat coal is distributed in many areas with smallreserves. The annual production is approximately 200,000 - 300,000 tons per year.In Viet Nam, there are six operating fields (all offshore) producing between 245,000 to290,000 barrels per day. Recoverable reserves of gas have been estimated to be as high as60 - 80 trillion cubic feet.Viet Nam has a high rainfall and a dense rivers-streams system. Over 400 small hydrostations are now in place with a total installed capacity of 30 MW. On a smaller scale, itis believed that over 100,000 micro and family hydropower generators are now in use.In Viet Nam, solar energy potential is rather rich. Average total annual insulation rangesfrom 4 - 5 kWh per square meter per day. There are currently five large-scale solarphotovoltaic power systems in Viet Nam. A considerable number of hybrid systems ofsolar PV and micro-hydropower generation and hybrid systems of PV and diesel arebeing built. The government of Viet Nam has financed the construction of 100 solarhome systems and 200 solar community systems for inhabitants of islands off thenortheast coast.The wind energy potential is not high, mainly in islands and coastal areas. The ResearchCenter for Thermal Equipment and Renewable Energy (RECTARE), Ho Chi MinhTechnical University is organization developing and promoting wind energytechnologies, and has installed over 800 wind generators in over 40 provinces and townsthroughout Viet Nam. The largest numbers of these units have been installed near NhaTrang city in Khanh Hoa province on the South-Central coasts, where 135 units are inuse. The potentials of biogas and biomass in Viet Nam are rather big and mainly used forfuel in rural areas.

Draft 1
21
1.4. PopulationViet Nam has 54 different ethnic groups,living on an equal ground and in a close-knit manner, creating a large family ofbrother-like people, which act for thecause of national development. Viet Namhas 64 cities/provinces, and Ha Noi is thecapital city with the population of about3.2 million people.Viet Nam is one of the world's mostpopulated countries. In 2004, itspopulation reached 82.03 million people,of which women account for 50.85%. Thepopulation growth rate is 1.4%. Thepopulation's part of the working ageincludes about 43.6 million people, i.e.53% of the total population. The averagelife expectancy is 71 years old. Thepopulation density is 249 persons per km2.By the end of 2004, the urban populationaccounting for about 26.3%.Approximately 73.7% of the population inViet Nam is still living on agriculture.
Table 1.1. Population and population density in Viet Nam in 2004 by region
No. Region Averagepopulation
(1000 persons)
Area (km2) Populationdensity
(person/km2)
1. Red River Delta 17,836.0 14,812.5 1,204
2. North East 9,244.8 63,629.8 145
3. North West 2,524.9 37,336.9 68
4. North Central Coast 10,504.5 51,510.8 204
5. South Central Coast 6,981.7 33,069.0 211
6. Central Highlands 4,674.2 54,473.7 86
7. South East 13,190.1 34,743.1 380
8. Mekong River Delta 17,076.1 39,738.7 430
Whole Country 82,032.3 329,314.5 249
Sources: Viet Nam Statistical Yearbook 2004

Draft 1
22
Table 1.2. Average population in Viet Nam by sex and by residence
By sex By residence
No. YearTotal
(1000 persons)Male(1000
persons)
Female(1000
persons)
Urban(1000
persons)
Rural(1000
persons)
1. 1995 71,995.5 35,237.4 36,758.1 14,938.1 57,057.4
2. 1996 73,156.7 35,857.3 37,299.4 15,419.9 57,736.8
3. 1997 74,306.9 36,473.1 37,833.8 16,835.4 57,471.5
4. 1998 75,456.3 37,089.7 38,366.6 17,464.6 57,991.7
5. 1999 76,596.7 37,662.1 38,934.6 18,081.6 58,515.1
6. 2000 77,635.4 38,166.4 39,469.0 18,771.9 58,863.5
7. 2001 78,685.8 38,684.2 40,001.6 19,469.3 59,216.5
8. 2002 79,727.4 39,197.4 40,530.0 20,022.1 59,705.3
9. 2003 80,902.4 39,755.4 41,147.0 20,869.5 60,032.9
10. 2004 82,032.3 40,317.9 41,714.4 21,591.2 60,441.1
Sources: Statistical Yearbook 20041.5. National Socio-economic profile and developmentIn the last 15 years, 1990 - 2005, Viet Nam's gross domestic product (GDP) was nearlytriple. Remarkable achievements in social performance were observed. The internationaleconomic relations, especially in international trade and FDI, are continuously expanded.The physical and spiritual living conditions of the population are improved, and thepolitical and social status is stable.Continuing the cause of renewal, Viet Nam has achieved encouraging successes in socio-economic development and environmental protection. The economic growth rate hasbeen continuously increasing; in 15 years from 1990 to 2004, the GDP has beenincreased by 7.5% per year on the average (it was 7.3% for 2001 - 2004 period). Theaverage GDP per capita in 2004 is about 560 USD. The 2004 GDP at current prices byeconomic sectors are agriculture, forestry and fishing: 21.76%; industry and construction:40.09% and services: 38.15%. Industry grew at 11% per year (it was 10.3% for the last 5years). The value of services has been grown up by about 7% per year on the average.Agriculture has maintained its annual growth rate of 4.06% (3.6% for the last 5 years) inspite of many difficulties in terms of natural disasters.

Draft 1
23
In the five-year-plan 2001-2005:Viet Nam has set as the primaryobjectives of this period therestoration of a rapid and sustainableeconomic growth and improvementof the quality of development inorder to stabilize and improve theliving standards of the people toaccelerate the process ofrestructuring the economy towardsindustrialization and modernization.Viet Nam will focus all efforts onachieving following targets: GDP in2005 double that in 1995; averageannual GDP growth rate of 7.5% during the period 2001-2005. Agricultural, forestry andfishery output increases by 4.8% per year. Industrial output increases 13% per year.Service revenue increases 7.5% per year.Planned structure of sectors in GDP by 2005: Agriculture sector accounts for 20-21%.Industry sector accounts for 38-39%. Service sector accounts for 41-42%. Reduce thepopulation growth rate to 1.16% by 2005.Export has been increased quickly, with the export value increased by 16% per year andthe export market maintained and expanded. The export value per capita is approximately324 USD in 2004.The fiscal deficit, estimated at 3.8%of GDP, is below the Government’starget of 5.0%. GDP growth isprojected at around 7.6% for 2005,7.6% in 2006, and 7.5% in 2007,supported by strong domestic demandand export growth. The fiscal positionis expected to remain expansionarybut manageable to cover the cost ofreforms and infrastructure. Inflation(average for the period) will likelymoderate to 6% in 2005 and 5.2% in2006 and 2007.
In response to an improvedinvestment climate, FDI commitmentswere strong in 2004, reaching $4.0billion, or almost one third higher than in the previous year. Net FDI rose from $1.2billion to $1.7 billion. Foreign exchange inflows were pushed up by official development
Draft 1
24
assistance and by private remittances through official channels. These private remittancesrose from $2.6 billion in 2003 to about $3.2 billion in 2004.
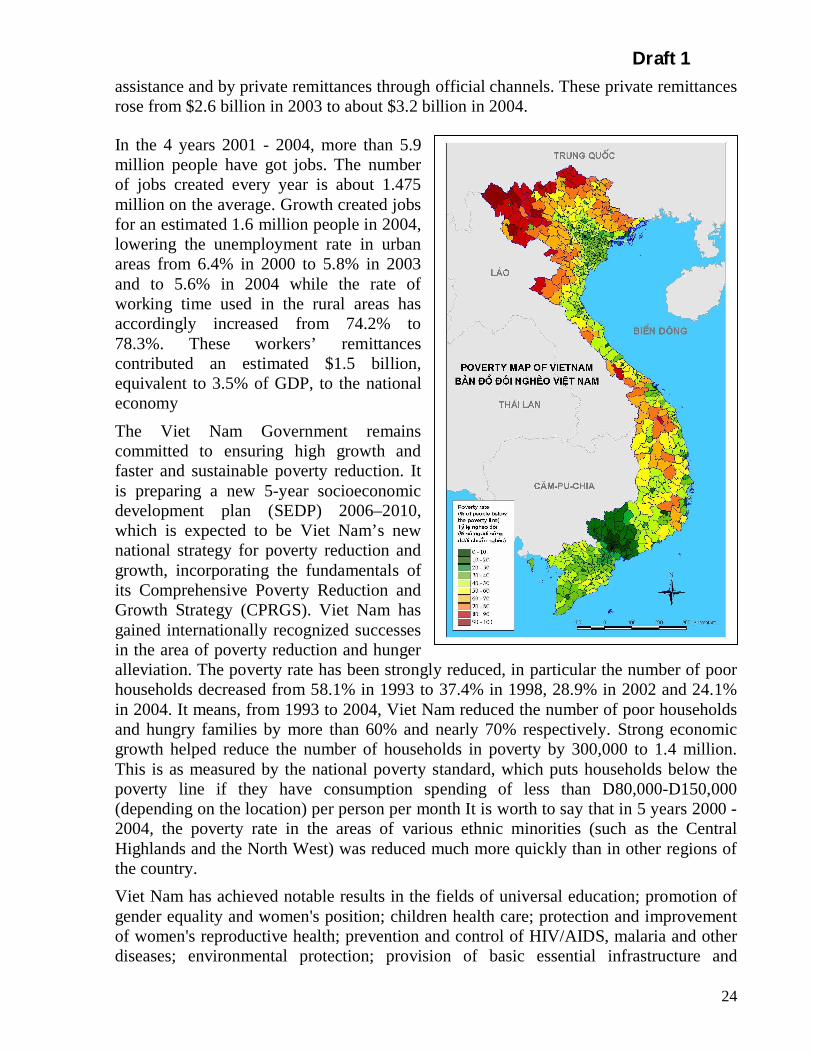
In the 4 years 2001 - 2004, more than 5.9million people have got jobs. The numberof jobs created every year is about 1.475million on the average. Growth created jobsfor an estimated 1.6 million people in 2004,lowering the unemployment rate in urbanareas from 6.4% in 2000 to 5.8% in 2003and to 5.6% in 2004 while the rate ofworking time used in the rural areas hasaccordingly increased from 74.2% to78.3%. These workers’ remittancescontributed an estimated $1.5 billion,equivalent to 3.5% of GDP, to the nationaleconomyThe Viet Nam Government remainscommitted to ensuring high growth andfaster and sustainable poverty reduction. Itis preparing a new 5-year socioeconomicdevelopment plan (SEDP) 2006–2010,which is expected to be Viet Nam’s newnational strategy for poverty reduction andgrowth, incorporating the fundamentals ofits Comprehensive Poverty Reduction andGrowth Strategy (CPRGS). Viet Nam hasgained internationally recognized successesin the area of poverty reduction and hungeralleviation. The poverty rate has been strongly reduced, in particular the number of poorhouseholds decreased from 58.1% in 1993 to 37.4% in 1998, 28.9% in 2002 and 24.1%in 2004. It means, from 1993 to 2004, Viet Nam reduced the number of poor householdsand hungry families by more than 60% and nearly 70% respectively. Strong economicgrowth helped reduce the number of households in poverty by 300,000 to 1.4 million.This is as measured by the national poverty standard, which puts households below thepoverty line if they have consumption spending of less than D80,000-D150,000(depending on the location) per person per month It is worth to say that in 5 years 2000 -2004, the poverty rate in the areas of various ethnic minorities (such as the CentralHighlands and the North West) was reduced much more quickly than in other regions ofthe country.Viet Nam has achieved notable results in the fields of universal education; promotion ofgender equality and women's position; children health care; protection and improvementof women's reproductive health; prevention and control of HIV/AIDS, malaria and otherdiseases; environmental protection; provision of basic essential infrastructure and

Draft 1
25
services for extremely disadvantaged communes; improvement of living standards,preservation and development of ethnic minority cultures and vulnerability reduction etc.
Table 1.3. Gross domestic product at constant 1994 prices by economic sectorsNo. Year Total (billion
VN dong)Agriculture,forestry and
fishing (billionVN dong)
Industry andconstruction(billion VN
dong)
Service (billion VNdong)
1 1990 131.968 42.003 33.221 56.7442 1995 195.567 51.319 58.550 85.6983 2000 273.666 63.717 96.913 113.0364 2001 292.535 65.618 106.986 119.9315 2002 313.247 68.352 117.125 127.7706 2003 336.242 70.827 129.399 136.0167 2004 362.092 73.309 142.601 146.182
Sources: Viet Nam Statistical Yearbook 2004Figure 1.1. Structure of GDP 2004 at current prices by ownership (%)
B: 30.11%
D: 8.39%
E: 7.11%
C: 15.17%
A: 39.22%
A - StateB - HouseholdC - Foreign invested sectorD - PrivateE - Collective
Figure 1.2. Structure of GDP 2004 at current prices by economic sector (%)
C: 21.76%
B: 40.09%
A: 38.15%A - Service
B- Industry and construction
C - Agriculture, forestry and fishing
Sources: Viet Nam Statistical Yearbook 2004

Draft 1
26
Key socioeconomic development challenges for the next 5 years (2006-2010) include (i)sustain high economic growth and poverty reduction; (ii) create jobs for new labormarket entrants; (iii) reduce inequality through targeted poverty reduction; (iv) supportsocial development by improving health and education services, gender equality, andsocial inclusion; (v) protect the environment; and (vi) improve governance to ensurethese challenges are sufficiently and efficiently addressedThe next 5-year socioeconomic development plan (2006-2010) has a target of 7.5-8.0%annual average GDP growth, broken down into 3.0-3.5% in agriculture, forestry, andfisheries; 10.0-15.0% in industry; and 7.2-7.5% in services. The aim is to create 8 millionadditional jobs and reduce the number of poor households. The plan is expected toachieve the Government’s Comprehensive Poverty Reduction and Growth Strategy andViet Nam Sustainable Development Goals--the local version of the MillenniumDevelopment Goals. Given that the country has achieved rapid economic expansion andpoverty reduction over the past decade, the targets seem plausible, provided that theGovernment ensures that total investment stays at about 35% of GDP, improvements aremade in the productivity of capital, and economic growth benefits all sectors of society.In next 5 year (2006-2010) the Viet Nam’s government policy will focus on the followingmeasures:
• First, continue to strongly renovate and restructure the economy, especially theagricultural production, in order to increase productivity and efficiency in this sector,and to increase income of the people in rural area.
• Second, accelerate restructuring the banking sector to build up a sound bankingsystem to meet the need of credit, monetary and financial services of the economy.
• Third, accelerate restructuring and renovation aimed at developing and improving theeffectiveness of SOEs.
• Fourth, promote reasonable consumption and effectively mobilizing domestic savingfor development investment.
• Fifth, improve the quality and reputation of exports, stimulate export promotion.
• Sixth, focus efforts on solving critical social problems and making clear progress tothe social situation.
Viet Nam Initial National communication Under the United Nations FrameworkConvention on Climate ChangeIn order to fulfill the commitment described in the Articles 12.1, 12.5 of UNFCCC andfollowing the guidelines “Preparation of the Initial National Communication” for Non-Annex I Parties that was approved at COP-2 dated 19 July 1996, the Government of VietNam assigned the Hydro-Meteorological Service, nowadays Ministry of NaturalResources and Environment of Viet Nam as a National Authority, to implement theproject “Viet Nam: Preparation of the Initial National Communication to the UnitedNations Framework Convention on Climate Change (UNFCCC) - GF/2200-97-54” withthe financial and technical support from the Global Environment Facility (GEF) and theUnited Nations Environment Programme (UNEP).
Draft 1
27
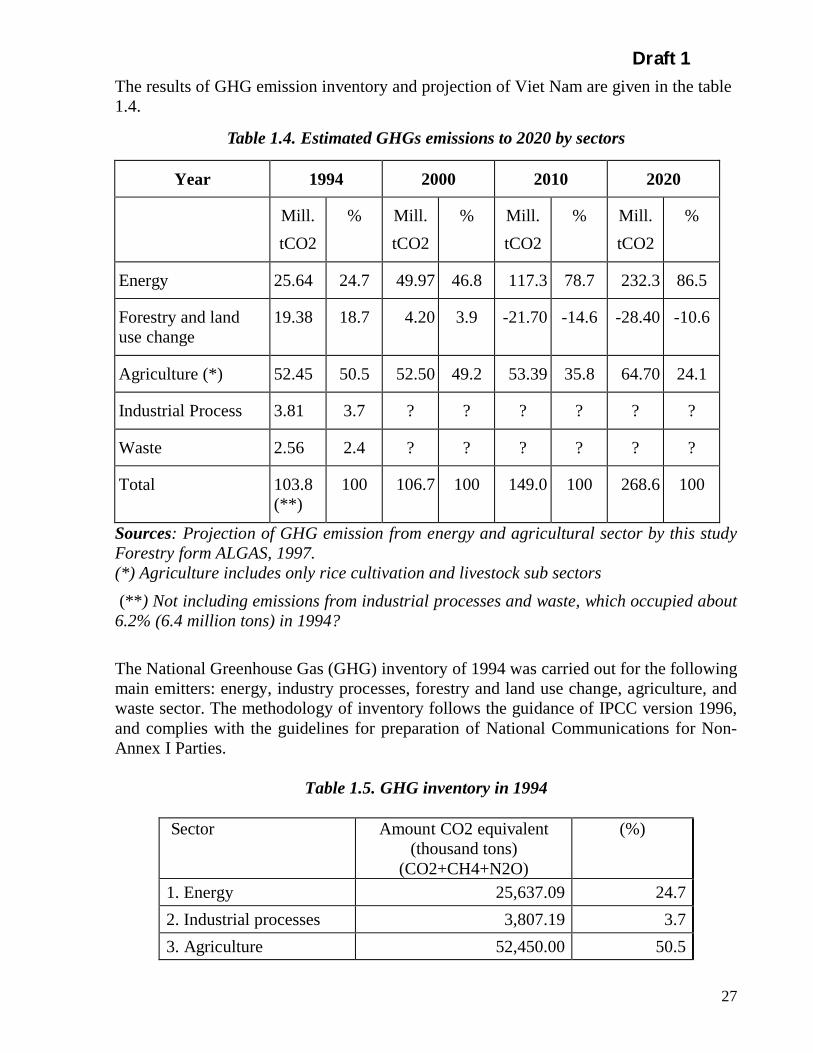
The results of GHG emission inventory and projection of Viet Nam are given in the table1.4.
Table 1.4. Estimated GHGs emissions to 2020 by sectors
Year 1994 2000 2010 2020
Mill.tCO2
% Mill.tCO2
% Mill.tCO2
% Mill.tCO2
%
Energy 25.64 24.7 49.97 46.8 117.3 78.7 232.3 86.5
Forestry and landuse change
19.38 18.7 4.20 3.9 -21.70 -14.6 -28.40 -10.6
Agriculture (*) 52.45 50.5 52.50 49.2 53.39 35.8 64.70 24.1
Industrial Process 3.81 3.7 ? ? ? ? ? ?
Waste 2.56 2.4 ? ? ? ? ? ?
Total 103.8(**)
100 106.7 100 149.0 100 268.6 100
Sources: Projection of GHG emission from energy and agricultural sector by this studyForestry form ALGAS, 1997.(*) Agriculture includes only rice cultivation and livestock sub sectors(**) Not including emissions from industrial processes and waste, which occupied about
6.2% (6.4 million tons) in 1994?
The National Greenhouse Gas (GHG) inventory of 1994 was carried out for the followingmain emitters: energy, industry processes, forestry and land use change, agriculture, andwaste sector. The methodology of inventory follows the guidance of IPCC version 1996,and complies with the guidelines for preparation of National Communications for Non-Annex I Parties.
Table 1.5. GHG inventory in 1994
Sector Amount CO2 equivalent(thousand tons)
(CO2+CH4+N2O)
(%)
1. Energy 25,637.09 24.72. Industrial processes 3,807.19 3.73. Agriculture 52,450.00 50.5

Draft 1
28
4. Forestry and land usechange 19,380.00 18.7
5. Waste 2,565.02 2.4Total emissions 103,839.30 100.0
Based on BAU scenario, estimated GHG emissions for 2010 is 140 million tons and for2020 are 233 million tons of CO2 equivalents.1.6. IndustryViet Nam’s energy endowments including, coal reserves (37 billion tons/ 3.88 billiontons proven), oil (2.3 billion tons/ 615-967 million tons proven), gas (1,300 billion m3/600 billion m3 proven), and hydro (300 billion kWh/ 50-70 billion kWh technical-economical potential).Viet Nam, with GDP growth of 8% inrecent years and forecast growth at 7%,Viet Nam’s, demand for energy will becontinue to grow rapidly. Final energyconsumption in Viet Nam was 17.8million TOES in 2004, which representsan annual average growth rate of 10.8%since 1991. Viet Nam is expected toachieve an annual average growth rate of7.0-7.5% from now to 2010 and about7.0% over the period 2011-2020 VietNam exports coal and crude oil andimports petroleum products.Future energy policy considerations inViet Nam include, social economicdevelopment, security and defense,energy independency, regional energycooperation, safety and efficiency,environmental pollution, a open andcompetitive energy market, investmentincentives, energy for rural andmountainous areas, and science and technology development. In addition, theGovernment is also formulating investment policies and incentives for energydevelopment and seeks to diversify investments in using tools such as BOT, BTO, JV,IPP to mobilize various capital sources at home and abroad.In 5 years from 2000 to 2004, industry continues to be developed (see table 1.6; itsproduction structure and quality of products have been improved.Industrial activities consist of mining and quarrying; manufacturing and production anddistribution of electricity, gas and water.
Draft 1
29
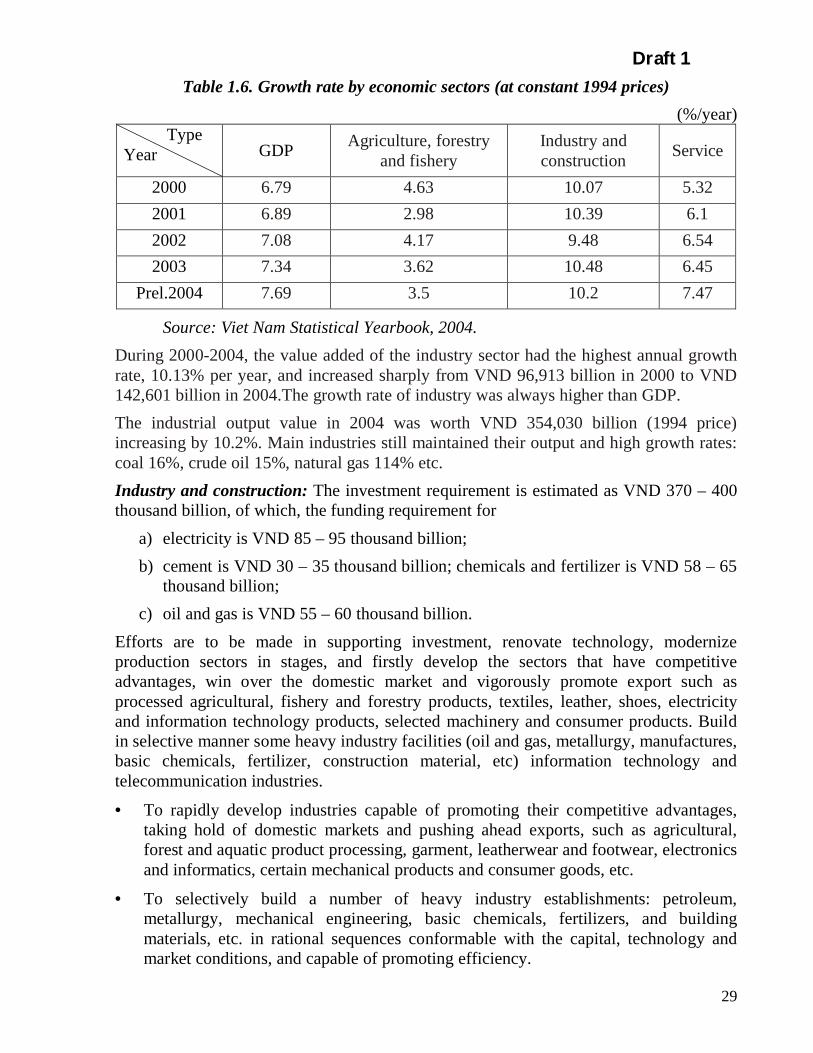
Table 1.6. Growth rate by economic sectors (at constant 1994 prices) (%/year)
TypeYear GDP Agriculture, forestry
and fisheryIndustry andconstruction Service
2000 6.79 4.63 10.07 5.322001 6.89 2.98 10.39 6.12002 7.08 4.17 9.48 6.542003 7.34 3.62 10.48 6.45
Prel.2004 7.69 3.5 10.2 7.47
Source: Viet Nam Statistical Yearbook, 2004.During 2000-2004, the value added of the industry sector had the highest annual growthrate, 10.13% per year, and increased sharply from VND 96,913 billion in 2000 to VND142,601 billion in 2004.The growth rate of industry was always higher than GDP.The industrial output value in 2004 was worth VND 354,030 billion (1994 price)increasing by 10.2%. Main industries still maintained their output and high growth rates:coal 16%, crude oil 15%, natural gas 114% etc.Industry and construction: The investment requirement is estimated as VND 370 – 400thousand billion, of which, the funding requirement for
a) electricity is VND 85 – 95 thousand billion;b) cement is VND 30 – 35 thousand billion; chemicals and fertilizer is VND 58 – 65
thousand billion;c) oil and gas is VND 55 – 60 thousand billion.
Efforts are to be made in supporting investment, renovate technology, modernizeproduction sectors in stages, and firstly develop the sectors that have competitiveadvantages, win over the domestic market and vigorously promote export such asprocessed agricultural, fishery and forestry products, textiles, leather, shoes, electricityand information technology products, selected machinery and consumer products. Buildin selective manner some heavy industry facilities (oil and gas, metallurgy, manufactures,basic chemicals, fertilizer, construction material, etc) information technology andtelecommunication industries.
• To rapidly develop industries capable of promoting their competitive advantages,taking hold of domestic markets and pushing ahead exports, such as agricultural,forest and aquatic product processing, garment, leatherwear and footwear, electronicsand informatics, certain mechanical products and consumer goods, etc.
• To selectively build a number of heavy industry establishments: petroleum,metallurgy, mechanical engineering, basic chemicals, fertilizers, and buildingmaterials, etc. in rational sequences conformable with the capital, technology andmarket conditions, and capable of promoting efficiency.
Draft 1
30
• To vigorously develop hi-tech industries, especially information, telecommunication,electronic and automation technologies.
• To give priority to turning the informatics software industry into an economic sectorwith an outstanding growth rate.
• To develop necessary defense industry units, combining defense with civil industries.
• To plan for a rational industrial apportionment nationwide. To efficiently developindustrial parks and export processing zones, set up a number of hi-tech zones, andform major industrial clusters and open economic zones.
• To extensively develop small and medium industrial establishments with diversetrades and crafts. To renovate and upgrade the technology in existing establishmentswith a view to improving productivity, quality and efficiency. To appropriately applypotentially labor-intensive technologies. To develop various forms of integrationamong small, medium and large enterprises, among raw materials production andproduct processing and marketing on the basis of ensuring harmony of interests. Toincrease the local contents in subcontracting and assembling industries. To enhanceoperations for product quality control, industrial property ownership protection, andenvironmental protection.
1.7. EnergyViet Nam has the potential to become a regional coal, oil and natural gas supplier.Ongoing exploration has led to several coal, oil and gas discoveries in recent years.Much of Viet Nam’s large population relies heavily on non-commercial biomass energysources such as wood, dung, and rice husks. As a result, Viet Nam’s per capitacommercial energy consumption ranks among the lowest in Asia. The country’scommercial energy consumption is predicted to rise in coming years, primarily due toincreases in the use of natural gas.OIL : Viet Nam has 600 million barrels of proven oil reserves, but that total is likely toincrease as exploration continues. Crude oil production averaged 403,300 barrels per day(bbl/d) in 2004, making Viet Nam the third-largest oil producer in Asia.NATURAL GAS : Viet Nam has proven gas reserves of 6.8 trillion cubic feet (Tcf), butis expected to contain up to 10 Tcf. Viet Nam’s natural gas production and consumptionare rising, with further increases expected as additional fields come on-stream. Naturalgas is currently produced entirely for domestic consumption. The Cuu Long basin, asource of associated gas from oil production, is the largest Viet Namese natural gasproduction area.COAL : Viet Nam contains coal reserves estimated at 3.6 billion tons, the majority ofwhich is anthracite. Production has increased dramatically, with Viet Nam producingover 14 Mt in 2002, 11 Mt more than in the previous year. As a result, Viet Namexported a record 5 Mt of coal, primarily to Japan and China , in 2002. Other exportmarkets for Viet Namese coal include Thailand , the European Union, Mexico , andBrazil . Vinacoal hopes to produce 30 Mt of coal in 2005, exporting at least 11 Mt.

Draft 1
31
ELECTRICITY: Although Viet Nam’s per capita electricity consumption is among thelowest in Asia , demand has risen in recent years, straining the country’s limitedgenerating capacity. Rapid commercial sector growth, population migration to majorcities, and elevated living standards has all contributed to a growing demand forelectricity. In 2002, Viet Nam had a total electric generating capacity of 8.3 gig watts(GW) and generated 34.5 billion kilowatt-hours (kWh) of electricity, of which 60% washydropower.In the Viet Nam energy structure in 2004, oil occupied 46.5%, coal 34.5%, hydropower9.4% and gas 9.6%. Total energy exploitation has increased from 7.1 MTOE in 1990 to43.6 MTOE in 2004, in which:
• Clean coal production has increased from 4.5 million tons in 1990 to 25.05 milliontons in 2004 with the average annual growth rate of 22.7%.
• Crude oil exploitation has increased from 2.7 million tons in 1990 to 20.3 milliontons in 2004 with the average annual growth rate of 15.5%.
• Natural gas exploitation reached approximately 4.67 billion m3 in 2004.
• Electricity generation has increased from 8.7 billion kWh in 1990 to 46.2 billionkWh in 2004 with the average annual growth rate of 12.7%, in which hydropowerhas increased from 5.37 billion kWh in 1990 to 18 billion kWh in 2004. Commercialelectricity has increased from 6.2 billion kWh in 1990 to 39.7 billion kWh in 2004with the average annual growth rate of 14.2%.
In past ten years, economy of Viet Nam increased quickly with average growth rate of7% per year. In order to meet the energy demand of the national economy in general andelectricity demand in particularly. The energy sector has developed a lot of big projects incoal, oil, gas, and electricity sub sectors.By the end of 2004 Viet Nam had a installed power capacity of 11.000MW, generatedabout 46 TWh; coal production achieved 27 mill tones, oil production is 20 mill tones;average growth rate of energy is over 10% per year.However efficiency of energy use in economy and household sectors are still low. Energyintensity for GDP is higher than countries in region.The Viet Nam was a good model for energy investment, with several examples of goodinvestment. Viet Nam is process of opening its policies for economical development sohave to build development programs, mend and make new regulation, reform institutionsand administration etc.Energy consumption of Viet Nam is quickly creasing. Research results of the Nationalprojects on energy saving and efficiency, such as National project on energy conservationin period of 1994-1997, National program of energy in period of 1996-2000 headed byMOSTE and some subprojects on DSM, lighting, headed by Ministry of Industry inrecent years, showed that energy saving potential in a lot of energy use is very big.Government and also many relevant sectors are concerning to create good conditions forimplementation of energy efficiency. (Decree No 02/2003/ND-CP dated 03 September2003 on “efficient and saving energy use”). Country target program on saving and
Draft 1
32
efficiency energy use in period of 2006-2015 is prepared by Ministry of Industry andrelevant others and submitted to the government, foreseeing to begin in 2006 year. Targetof program: enhance awareness, promote and compel to implementation saving andefficient energy use.1.8. AgricultureViet Nam is an agricultural country, 80% of its population are involved in agriculture.The arable area is 7.3 million hectares, equals 22.2% of the country total land. Populationdensity is 234 people/km2 in 2000.Versatile and various climates of the regions create a variety of vegetation and domesticanimals (originated in the temperature area, sub-tropical and tropical areas). Droughts inthe dry season, flood and storm in the rainy season, effected regularly to agriculturalproduction.Viet Nam has 13 main soil groups in which the red-yellow soil occupies 15.8 millionhectares, the alluvium soil, the grey soil, the alum and salted soil covered 2.93, 2.48,2.14and 0.99 million hectares respectively (data from the National Institute for AgriculturePlanning and Projection).Viet Nam is predominantly an agricultural economy based on food crops, industrial cropsand livestock husbandry. The ratio of agricultural production in the total economy hasgradually been declining with the growth of the economy. The average growth rate ofgross agriculture production for 1995-2000 is 4.4% p.a. Within the agricultural sector, theratio of cultivation sub-sector and the animal husbandry was 79% and 18% respectivelyin many years. However since 2000, these figures have started changing to 78 and 19percent. The increase in animal husbandry share in gross agricultural output value underthe condition of continuous growth of absolute value in cultivation is of greatsignificance.Targets for the period to 2010:(1) Agricultural value growth rate: 4-4.5%/annum, GDP growth rate: 3.3 –3.5%/annum.(2) Rural economy growth rate: 7.5-8%/annum.(3) Forest coverage: 43-44% of the total natural space, of which the coverage of special -use forest and protection forest is 43-45% of the total forest land space.(4) Assurance of national food safety to meet the diverse demand of the people for foodsand provisions and special attention paid to the ethnic minority people in themountainous and remote areas; 45 million tons of production of food seed, of which thereare 39 million tons of rice and 6 million tons of corn.(5) Established comparative advantages to be promoted along the promotion of exportand improvement of export quality. By 2010, the value of agricultural and forestry exportwill reach USD 7 billion (increased by 12%/annum on average).(6) Making best use of available conditions in combination with scientific andtechnological advances to develop further production of plants and animals to substitute

Draft 1
33
imports and exploitation of the domestic market for products such as cotton, tobaccoleaves, corn, soya bean, cooking oil, paper material, milk etc…(7) Rural economic structure:
- Agriculture : 50%;- Industry, small industry and handicrafts, services: 50%
(8) Value of production on 1 ha of agricultural land : VND 30 million/year;(9) GDP per capita in rural area : 2 times that of 2000;(10) Agricultural labour : 50% of the rural workforce.
Estimated investments for the period 2006 - 2010 are:
Total investment (BillionVND)
To be directly managed bythe MARD (Billion VND)
Total 5 years 146,050 30,580Irrigation 37,900 20,600
Agriculture 7,300 4,000
Forestry 30,000 3,400
Sald Industry 3,000 1,000
Research 2,000 1,000
Training 800 600
1.9. Forestry
Viet Nam has a total area of 331.123 km2. According to 2004 estimates, currently 36percent of the country’s land is covered by forest. In 2003, Forests have been classifiedinto 3 categories: production forests, (watershed) protection forests, and special useforests, which covers forests managed for biological diversity conservation and protectedfor other purposes. Most recent data indicates that 4.6 million hectares are classified asproduction forests, 5.7 million ha as protection forests, and 1.8 million ha as special-useforests. In condition of existing forest areas in 2003 following:

Draft 1
34
However, this is under review and in the process of being completed. According toinitial surveys, there are about 20 planned protected areas that are not organized ormanaged. Therefore, they are being seriously degraded and no longer meet the criteria forSUFs.Initially, Viet Nam was richly endowed with high-quality forest, covering virtually thewhole country, but by 1943 the forest cover of Viet Nam had been reduced to only 14,3million (M) ha, or 43 % of the national land territory. Subsequently, the total forestdecreased very rapidly, especially during the war and the period of 1976-1985. Besideforest loss, every year, thousands hectares of the forests are degraded.
Area ofproduction forest
(ha)
Area ofprotectionforest (ha)
Area of specialuse forest (ha)
No.
National/Agro-
Ecologicalzone/
Province
Percentageof forestcoverage
(%)
Totalforestareas
designatedas
nationalpermanent
forestestate (ha)
Natural Planted Natural Planted Natural Planted
Shiftingcultivationareas (ha)
National 37.1 194010853087651123265845855647485581611323 96192 653188
1
Northernmountainandhighland
41.37 7648332 699425 5186721960082263499 334026 21320 365660
2 Red RiverDelta 12.97 169496 1143 12827 21225 35686 36846 20732 590
3 NorthernCentral 45.19 3738471 522624 250267 894999159339 491666 9273 20276
4SouthernCentralCoast
39.56 2928805 414030 156513 853958118226 182249 8743 76749
5 CentralHighlands 54.88 38307001353332 82663 718617 34689 431486 9808 173996
6 SoutheastSouth 19.09 603473 96165 50021 110457 85062 96214 10616 7205
7MekongRiverDelta
8.46 481808 932 161695 26226 52057 38836 15700 8712
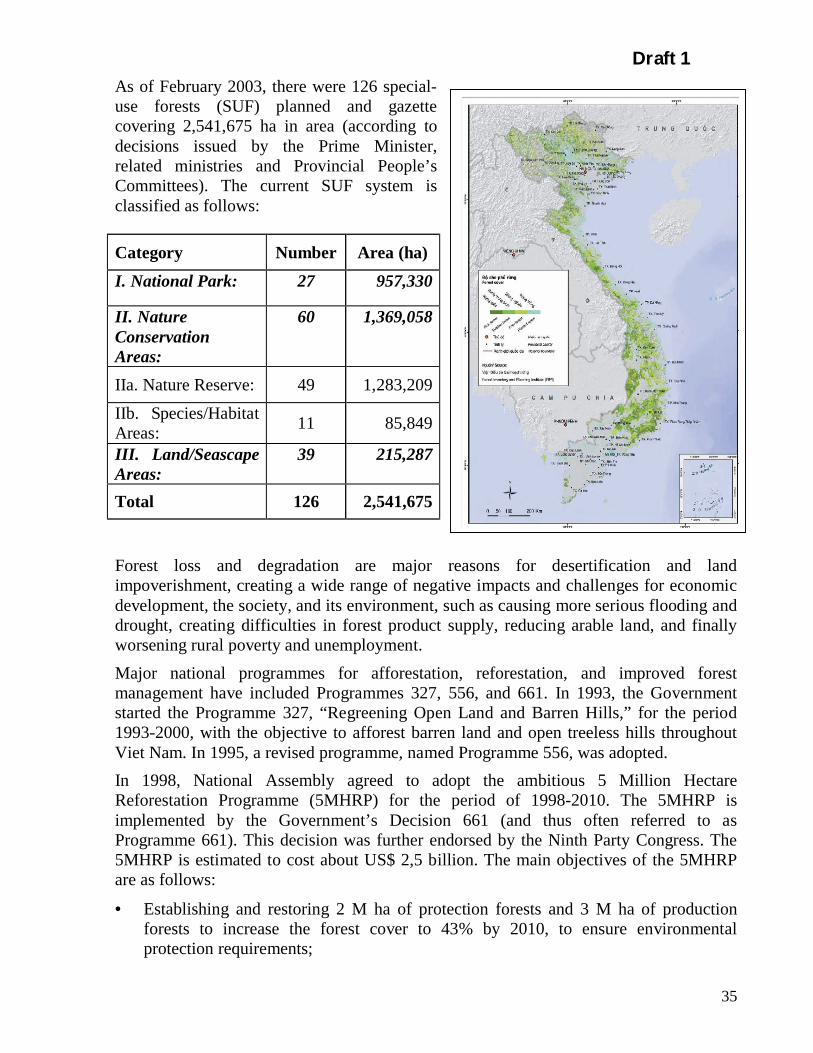
Draft 1
35
As of February 2003, there were 126 special-use forests (SUF) planned and gazettecovering 2,541,675 ha in area (according todecisions issued by the Prime Minister,related ministries and Provincial People’sCommittees). The current SUF system isclassified as follows:
Category Number Area (ha)I. National Park: 27 957,330
II. NatureConservationAreas:
60 1,369,058
IIa. Nature Reserve: 49 1,283,209
IIb. Species/HabitatAreas: 11 85,849
III. Land/SeascapeAreas:
39 215,287
Total 126 2,541,675
Forest loss and degradation are major reasons for desertification and landimpoverishment, creating a wide range of negative impacts and challenges for economicdevelopment, the society, and its environment, such as causing more serious flooding anddrought, creating difficulties in forest product supply, reducing arable land, and finallyworsening rural poverty and unemployment.Major national programmes for afforestation, reforestation, and improved forestmanagement have included Programmes 327, 556, and 661. In 1993, the Governmentstarted the Programme 327, “Regreening Open Land and Barren Hills,” for the period1993-2000, with the objective to afforest barren land and open treeless hills throughoutViet Nam. In 1995, a revised programme, named Programme 556, was adopted.In 1998, National Assembly agreed to adopt the ambitious 5 Million HectareReforestation Programme (5MHRP) for the period of 1998-2010. The 5MHRP isimplemented by the Government’s Decision 661 (and thus often referred to asProgramme 661). This decision was further endorsed by the Ninth Party Congress. The5MHRP is estimated to cost about US$ 2,5 billion. The main objectives of the 5MHRPare as follows:
• Establishing and restoring 2 M ha of protection forests and 3 M ha of productionforests to increase the forest cover to 43% by 2010, to ensure environmentalprotection requirements;

Draft 1
36
• Ensuring the forest products supply for development (every year 15 M m3 of timberand 20 M steres of fuel wood), thereby reducing the pressure on natural forests; and
• Implementing efforts for poverty alleviation, hunger eradication and development ofrural mountainous areas, by creating forestry-related employment for 2 M people,and increasing the income of people living in forest areas.
• Prior to the establishment of Programme 327, Government estimated that the forestcover had declined to 28,2 % in 1990. According to 1999 national statistics, the totalforested area was 10.88 million ha, of which 9.5 million ha were natural forest and1.39 million ha were plantations, while the bare hilly land was as much as 9.0 millionha. In 2003, the total forested area is about 12.094 million ha, of which 9.878 millionha are natural forests and 1.914 million ha are plantations.
As of 2003, the 5MHRP has achieved approximately 2 million out of the planned 5million ha of improved forest management or rehabilitation. The majority of theachievements have been in the area of protection and special use forests, whereasperformance for the production forests is lagging behind the targets. Consequently, theMinistry of Agriculture and Rural Development is now undertaking a study to look athow the implementation of the 5MHRP can be improved.According to official statistics, forest cover has increased by 1.5 million ha, reaching36,1% in 2004 (MARD 2004). Nonetheless, it is generally acknowledged that the qualityof natural forests continues to be degraded. Among the production forests, currently only9% are classified as rich forests (with the timber volume of 150 m3/ha) and 33% asmedium forests (with the timber volume of 80-150m3/ha).Forestry’s contribution to the national economy is under-valued. The official estimatesare that forestry contributes only about 1 % to GDP. Such estimates, however, do notaccount for forestry’s contributions to industrial production, firewood (which contributes7% of national energy needs) or to a range of environmental goods and services, such ascarbon sequestration, eco-tourism, or biological diversity conservation. These figures alsodo not include the contribution of timber extracted “illegally,” which could account forover 50% of national round wood supply.The forest sector has been actively engaged in preparation of its 5-year plan (2006-2010),to serve as a contribution to the MARD 5-year plan (5YP) and National Socio-economicDevelopment Plan (NSEDP). In line with the CPRGS, as well as the forthcomingNational Forest Strategy, the forest sector 5YP focuses on achieving goals of economicgrowth, environmental sustainability, improvement of social conditions including povertyreduction, and improved forest sector management. Considerable efforts have been takento link the 5-year planning process with the preparation of the new National ForestStrategy, which will include action plans to implement the strategy (with a detailed planfor the first 5 years).Some Possible Success Indicators for 2005
• Forestry, Poverty, and Rural Livelihoods Study completed• Forestry and Gender issues study completed• Outputs of poverty and gender studies provide inputs into new strategy
Draft 1
37
• New National Forest Strategy (2006-2020) adopted by Prime Minister• New strategy used to guide preparation of 5-year forest sector development plan
for 2006-2010, with more focus on how the forest sector can contribute to CPRGSimplementation and national socio-economic development
• 5 Million Hectare Reforestation Programme (Decision 661) revised• Trust Fund for Forests supporting one or more full-sized projects focusing on
forestry-poverty linkages and/or other key TFF strategic priorities• Forest Sector Monitoring and Information Systems (FOMIS): sectoral monitoring
system being piloted, and improved, including indicators on poverty in forest-dependent districts
• Support to SFE reform, with a particular focus on reallocation of forest landcurrently allocated to SFEs to local communities and households
• Strategy prepared to improve research, extension, training, and education linkages• Improving support to communities and households allocated forest land, i.e.
extension, credit, seeds and seedlings, forest management guidelines, etc.• Decentralisation of key forest sector and FSSP activities, with a particular focus
on the northern uplands and central highlands. Activities may include:o Support to regional networkso Support to the national community forestry working groupo Support to allocation of forest lands to communities
Review of Legislative and Institutional FrameworkViet Nam has no specific legislation or policy on climate change adaptation technologiesin the very strict sense. However, there are laws, guidelines, standards and relatedpolicies, which one would need to take into account if there is an intention to introduce anew technology into the Viet Nam. The focus of this section is therefore not on TNA andadaptation technology transfer in stricter sense but on institutions, policies, guidelinesand related framework that may be relevant to adaptation technology transfer.
The Viet Nam Government has issued specific policies in accordance with viewpointsand orientations on sustainable development in general and environmental soundtechnology in particular as defined in laws and the national socio-economic developmentstrategy. These policies are defined in State management documents and promulgatedaccording to the decentralization and power of administrations at different levels of theState management system. For example, the Government issues Decrees and the PrimeMinister’s decisions, Ministries (Ministries of Industry, Science and Technology,Planning and Investment, Finance…) promulgate circulars, inter-ministerial circulars,Ministers’ decisions while provincial and city People’s Committees issue regulations,rules and regulations of Chairmen of provincial and city People’s Committees…..
Existing legal documents governing environmental protection include laws and sub-lawdocuments such as decrees, decisions, circulars, directives, regulations… issued by statemanagement agencies (Government, ministries, provincial and city authorities…) inaccordance with their power. Existing laws which are directly related to climate changeadaptation and environmental sound technologies include:

Draft 1
38
- The Law on Environmental Protection (1993, 2005)
- The Law on Natural Minerals (1996)
- The Law on Water Resources (1998)
- The Fisheries Law (2003)
- The Law on Oil and Gas (1993)
- The Law on Forestry Protection and Development (1991,2004)
- The Land Law (2003)
- The Civil Code (1995)
- The Penal Code (1999)
- The Law on Enterprises (2000)
- The Law on the Protection of People’s Health (1989)
- The Law on the Encouragement of Domestic Investment (1999)
- The Law on Foreign Investment (2000).
The Government’s Decree No.45/1998/ND-CP issued on July 1st, 1998 governingtechnology transfer states that technologies, which are not allowed to be transferred inViet Nam include “ those which fail to meet the requirements defined in Viet Nameselaws in respect of occupational safety and health, human health and environmentalprotection” (Article 5).
Other Government documents including Decree No.51 /1999/ND-CP dated July 8th,1999 governing the enforcement of the revised Law on Encouragement of DomesticInvestment and Decree No.24/2000/ND-CP dated July 31st, 2000 governing theenforcement of the Law on Foreign Investment in Viet Nam also include similarprohibitions and discouragement.
At the central Government level, regulations on incentives and encouragement of cleantechnology are mostly clarified and concentrated in Decrees No.51/1999/ND-CP andDecree No.24/2000/ND-CP. Clean technologies and incentives and preferential for cleantechnology are defined in frames 4,5 and 6.
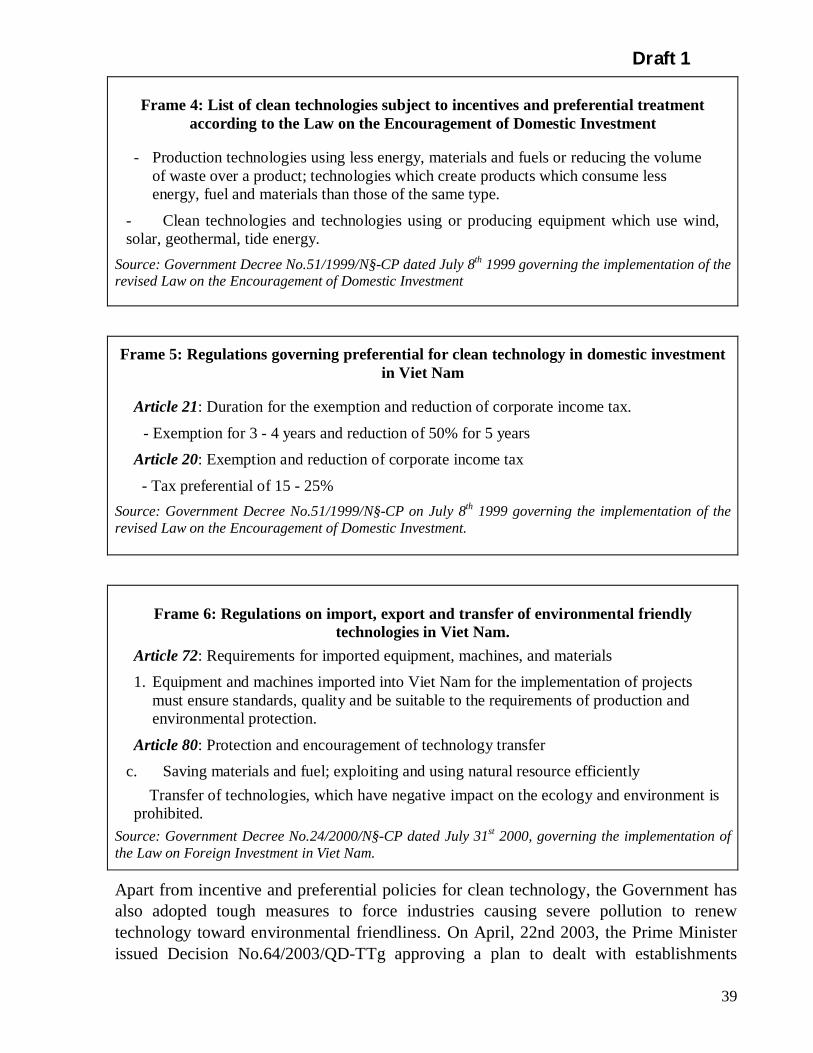
Draft 1
39
Frame 4: List of clean technologies subject to incentives and preferential treatmentaccording to the Law on the Encouragement of Domestic Investment
- Production technologies using less energy, materials and fuels or reducing the volumeof waste over a product; technologies which create products which consume lessenergy, fuel and materials than those of the same type.
- Clean technologies and technologies using or producing equipment which use wind,solar, geothermal, tide energy.
Source: Government Decree No.51/1999/N§-CP dated July 8th 1999 governing the implementation of therevised Law on the Encouragement of Domestic Investment
Frame 5: Regulations governing preferential for clean technology in domestic investmentin Viet Nam
Article 21: Duration for the exemption and reduction of corporate income tax.
- Exemption for 3 - 4 years and reduction of 50% for 5 yearsArticle 20: Exemption and reduction of corporate income tax
- Tax preferential of 15 - 25%Source: Government Decree No.51/1999/N§-CP on July 8th 1999 governing the implementation of therevised Law on the Encouragement of Domestic Investment.
Frame 6: Regulations on import, export and transfer of environmental friendlytechnologies in Viet Nam.
Article 72: Requirements for imported equipment, machines, and materials1. Equipment and machines imported into Viet Nam for the implementation of projects
must ensure standards, quality and be suitable to the requirements of production andenvironmental protection.
Article 80: Protection and encouragement of technology transferc. Saving materials and fuel; exploiting and using natural resource efficiently Transfer of technologies, which have negative impact on the ecology and environment isprohibited.
Source: Government Decree No.24/2000/N§-CP dated July 31st 2000, governing the implementation ofthe Law on Foreign Investment in Viet Nam.
Apart from incentive and preferential policies for clean technology, the Government hasalso adopted tough measures to force industries causing severe pollution to renewtechnology toward environmental friendliness. On April, 22nd 2003, the Prime Ministerissued Decision No.64/2003/QD-TTg approving a plan to dealt with establishments

Draft 1
40
which cause serious environmental pollution, under which relevant central and localagencies make a list of such establishments according to specific and consistent criteria.These establishments are requested to settle the problem by closing their production ormoving to another area or applying environmental sound technologies or installing wastetreatment systems. Among these solutions, the application of environmental soundtechnologies or the installation of climate change adaptation technology are especiallyencouraged. Technological innovation and climate change adaptation are also requiredeven in the event that the industry moves to another area.
Education, training and public awarenessIn recently years, Viet Nam is carrying out environment education programmes inuniversities and vocational schools.
Some universities in Viet Nam offer training of environmental engineers includingengineers of environmental technology (Table 1.7).
Table 1.7. Universities offering training of environmental technologicalengineers in Viet Nam
Order Universities Training Startingyear
1 The Hanoi ConstructionUniversity
Environmental engineers 1964
2 The Hanoi University ofTechnology
Engineers of environmentaltechnology
1990
3 The HCM city Universityof Technology
Engineers of environmentaltechnique
1981
4 The HCM city Van LangUniversity
Engineers of environmentaltechnology and management
1995
5 The Hanoi Dong DoUniversity
Environmental engineers 1996
6 The Hanoi ArchitectureUniversity
Engineers of infrastructuretechnique and urbanenvironment
1998
7 The Hanoi NationalUniversity
Bachelors of environmentalscience
1995
8 The Hue University Bachelors of environmentalscience
1995
9 The Hanoi NationalEconomics University
Bachelors of economics andenvironmental management
2000
Draft 1
41
Training workshops on cleaner production and technology are mainly organized by theViet Nam Cleaner Production Center with financial and technical assistance frominternational organizations (UNIDO, UNEP, UNDP…).To date, the Viet Nam Cleaner Production Center has granted certificates of cleanerproduction to 100 trainees, across the country, who serves as an important initial humanresource base for expanding and promoting the application of cleaner production andtechnologies.Furthermore some short-term training courses on CC were organized for teachers andstudents from technical universities and for environment management officials fromlocal, central agencies and enterprises. Many publications on CC, including theUnited Nations Framework Convention on Climate Change (UNFCCC), KyotoProtocol, Climate change information documents, pamphlets...etc. are delivered tovarious experts and people through meetings, conferences, workshops, etc.In the long term, Viet Nam is planning to integrate CC issues into educationprogrammes. Many direct and indirect activities contribute to raise the publicawareness on CC, such as:
• TV and radio programmes on CC broadcasted on central and local TVs and radiostations.
• “Energy Saving Programme” carried out by Ministry of Science, Technology and“Renewable Energy Programmes” by Ministry of Industry.
• “National Environment Week” organized annually to encourage people toparticipate in the environment protection activities.
In spite of these, only few people have received basis training on CC issues, manypeople still have a limited knowledge on CC. So that there are needs to work out andto implement a comprehensive national public awareness campaign on CC. The maingoals of the campaign are to rise up public awareness on CC with the proposedstrategy as follows:
• Encourage policy makers, managers to integrate CC issues in decision makingprocess.
• Enhance public awareness and understanding of the science of CC and itspotential impacts.
• Promote actions to support policy measures in GHG mitigation and adaptation toCC.
• Improve the expertise on technology transfer for specialists and technical staffs.

Draft 1
42
CHAPTER 2THE TECHNOLOGY NEEDS ASSESSMENT PROCESS
BackgroundArticle 4.5 of the UNFCCC states that developed countries who are members of theUNFCCC “shall take all practicable steps to promote, facilitate, and finance, asappropriate, the transfer of, or access to, environmentally sound technologies and know-how to other parties, particularly developing country parties, to enable them implementthe provision of the convention.”Prior to the UNFCCC era, technology transfer had occurred in all socio-economic sectorsbut the focus was not to address climate change through adaptation to and mitigation ofclimate change although indirectly some of them met the climate change needs.Article 4.5 further enhances the process of technology transfer to meet the UNFCCCobjective. Technology transfer will also enhance the diffusion and use of appropriatetechnologies for the purposes of adaptation to and mitigation of climate change.This section describes what is required in undertaking a TNA. Essentially, the processinvolves a common set of organising activities that should be closely linked to otherrelevant national development processes. At its heart, the TNA process should reflectnational response to climate change technology needs that is informed by the privatesector, the general public, and other stakeholders.The TNA process directlyaddresses the question: “Whatare the key actions, priorities,and criteria with respect toGHG mitigation andadaptation to climate risks?”.The Framework of ModifiedTechnology NeedsAssessment Activities, asApplied to Adaptation, whichare illustrated in Figure below.The arrows between theactivities should not beinterpreted as indicating a fixedsequence of tasks, but rather assuggesting important conceptuallinks.

Draft 1
43
Institution Coordination OrganizationAfter ratifying the UNFCCC, the Governmentof Viet Nam has assigned the Hydro-Meteorological Service (HMS) of Viet Nam,nowadays Ministry of Natural Resources andEnvironment with its ICD as a National FocalAgency Authority for taking in andimplementing UNFCCC and KP in Viet.The present institutional arrangement in thecontext of climate change is described inbelow chart:
It closely coordination with relevant government agencies, public institutions and privatestakeholders, ICD of MONRE has been executing as coordinator and manager of almostall climate change projects. In addition ICD also implemented a great number ofactivities for raising public awareness and training expertise on CC with the supportprovided by working groups of experts from the ministries, departments, researchesinstitutes, NGO’s.Stakeholder EngagementAssessing the need for technology occurs through policymaking and decisions madeamong stakeholders –individuals, groups, organisations (e.g., government agencies,NGOs), and networks. The TNA process considers stakeholders as fundamental, since itis stakeholders who will sustain the implementation process.
Ministry ofNatural Resourcesand Environment
(MONRE)
InternationalCooperation
Department (ICD)
ClimateChange
Country Team
ClimateChange Project
Managers
SecretariatStaff
TechnicalExpert Team
GHGinventory
Unit
MitigationGroup
V &AGroup
ESTTransferGroup
CNECB’s Meeting

Draft 1
44
The purpose of this step within the TNA is to ensure that key stakeholders arefundamentally engaged. The term ‘key stakeholders’ refers to those affected by climatechange and those positioned most effectively to advance mitigation and adaptationpriority actionsThe Identify Stakeholders provides a starting point for identifying the range ofstakeholders that should be consulted in a technology assessment. The extent to which allare represented will differ by country, but it is important that as many of these types ofstakeholder as possible are involved from an early stage. As a practical matter, since sucha large number of people are legitimately classified as stakeholders in some of these. Thetaskforce team identified a list of stakeholders that included government institutions,private sector, NGOs, academia, faith groups and international technical donors andinstitutions.Government Departments and Agency with responsibility for policy formulation andregulation, management, includes:
Organization Sub bodies RoleMinistriesMONRE International Cooperation Dept. National Focal Point Agency
National Environment Agency Environment monitoringEnvironment Dept. Environment managementDept. of Hydrometeorology Hydrometeorology managementNational HMS Climate change monitoring
MOI Dept. of Energy&Petroleum Energy, RE managementDept. of Science&Technology EE&ES management
MOST Dept. of Science&Technology ofindustry
Science&Technology developmentin Industry
Dept. of Science&Technology ofAgriculture&forestry
Science&Technology developmentin Agriculture &Forestry
MPI Dept. of Science, Technology,Education and Environment
Project validation
MOFA Dept. of Internationalorganizations
Focal Point of foreign policies
MOF Financing policies, fund, financeincentives
MARD Agriculture, forestry and ruraldevelopment
MOT Dept. of Science&Technology Environment management intransport
Viet Nam Register Gases pollution control of transportmeans
Provinces andcities
Local management
Sector industries, associations, and distributors (Households, small businesses, andfarmers) that are involved in the provision of utility services (i.e., responsible for GHGemissions) or are sensitive to climate change impacts (e.g., tourism, agriculture, industry,

Draft 1
45
transport, water resources, forestry, …) and involved in the manufacture, import, and saleof environmentally sound technologies or other hard or soft technologies, appropriate formitigation or adaptation and using the technologies and practices in question, and/or whoare or could experience some of the effects of climate change, includes:
Enterprises Sub bodies RoleState owned atNational levelEVN Dept. of Science& Technology New tech. introduction
Regional Companies Elec. Transmission and distributionDispatching Center DataPower plants End users
CementCorporation
Dept. of Science&Technology New tech. introduction
Cement plants End usersVINASteel Dept. of Science&Technology New tech. introduction(SteelCorporation)
Steels plants End users
VINACoal Dept. of Science&Technology New tech. introduction(Coal Corporation) Coal mines End usersPetroViet Nam Dept. of Science&Technology New tech. introduction(PetroCorporation)
Petro companies End users
VINA Paper Dept. of Science&Technology New tech. introduction(PaperCorporation)
Paper & pulp Mills End users
Sugar Dept. of Science&Technology New tech. introductionCorporation Cement plants End usersOther EntitiesProvincial level Companies End usersPrivate sectors - Domestic companies
- Foreign invested companies- Joint venture companies
End users
Finance - State banks- Private and foreign banks- Funds
Financing
Foreigncounterparts
- Carbon funds- Investors- Carbon buyers
Co-project developers
Institutions International organisations and donors Country divisions ofinternational companies NGOs Labour unions, consumer groups, and mediainvolved with the promotion of environmental and social objectives and that providetechnical and scientific support to both government and industry, e.g. academicorganisations, industry R&D, think tanks, consultants, etc., and responsible forinvestments of critical importance to climate policy, e.g., the energy sector, agriculture,forestry

Draft 1
46
The multilateral organizations such as WB, UNDP, UNEP, GEF, ADB, UNIDO, ESCAP,etc. and The bilateral counterparts NGOs important role in the field of climate change.During stakeholder consultations, a Taskforce Technology Team with a chairperson wasformed to lead the foundation of the technology transfer and needs assessment. Throughconsultations the Institutional Arrangements were agreed upon as follows:
- Institute of Energy- Institute of Forestry Planning and Inventory- Institutes of Agriculture Science- Institute of Water Resources- Institute of Brewery- Institute of Mine Science Technology- Universities of Politechniques ( Hanoi, HoChiMinh, Danang).- Universities of Forestry (Hanoi, Ho Chi Minh).- Viet Nam Academy of Science&Technology- Viet Nam Academy of Social Science
And others organizations. As Women Union, Young Union, Science technologiesAssociations, Farmer Union, etc.
Initial Technology Transfer and Needs Assessment Consultative Workshop.An initial national consultativeworkshop for a wide range ofstakeholders was held in Ha Noi,November 2004 at which h thescooping paper on climate changetechnology transfer and needsassessment in Viet Nam was presented.In addition some invited stakeholderswere requested to prepare and presentpapers at the workshop.The consultative workshop produced anumber of outputs vital for thetechnology transfer and needsassessment process in the Viet Nam.The following are some of the outputs:
• Endorsement of the technologytransfer and needs assessment process
• Stakeholders agreed on sectors to be considered
• Criteria for selection of the national technologies agreed upon
The Third Workshop on “Technology needsassessment for GHG emission reduction”
Draft 1
47
• The initial identification and prioritisation of technologies was undertaken
• Technology taskforce steering team endorsed
• Outline of the climate change technology transfer and needs assessment developed
• Chapter authors and peer reviewers identifiedCriteria Establishment for Selecting Technology Priorities.Criterions of technology needs identification for identification of technology needs isvery important task in terms of prevention of the dangerous consequences of climatechange. This is mainly explained by the necessity to efficiently use the natural resourcesof Viet Nam.At the most general level, the criteria for selecting sectors and technologies for TNA willdepend upon three factors, which are not necessarily mutually exclusive:
• Contribution to development goals. How much overlap exists between thetechnology and the already identified technology needs?
• Contribution to climate change mitigation or adaptation. How effective is thetechnology in reducing GHG emissions and/or increasing resilience to the impacts ofclimate change?
• Market potential. Is there a ready niche for the technology?Each of the above factors in turn will entail deeper levels of analysis depending on thesector, and technology in question. For example, the contribution to development goalswill likely involve an analysis of the benefits involved (e.g., food security, healthimprovements, protection from natural disasters, social acceptability, and potential forreducing non-climate impacts). An important consideration here is the environmental andcultural impact of the technology and may entail a more detailed analysis of climatechange adaptation technology impact assessment.
The contribution to climate change mitigation will involve a quantification of the GHGemission reduction potential and/or the enhancement of carbon sinks. The contribution toclimate change adaptation will likely involve an assessment of the degree to whichclimate change-related risks can be reduced.
The contribution to market potential will likely involve an analysis of capital andoperating costs relative to alternatives, the commercial availability of the technology, andthe technology’s replicability, applicability, adaptability, and potential scale of utilisation.
Through a consultative process held at a scooping workshop, stakeholders agreed to usethe three basic globally accepted criteria namely: Development benefits, Implementationpotential and lastly Contribution to climate change response measures and goals. Thebasic criteria were sub-divided for depth and completeness taking national strategy onsustainable development into consideration as follows:

Draft 1
48
Table 2.1. Criteria for technology need assessment
Code Keycriteria
Sub criteria Criteria content
A1. GHG reductionpotential
The study is specialized in GHGreduction technologies
A2. Local environmentquality
Reduction of solid waste, liquid wasterand air pollution-SDA
Environmentprotection A3. Biodiversity and
resource conservationMineral, water, land, forest and bioresources-SD
B1. Initial investment Specific investment-Investment perproduct. National circumstance: lackof capital
B2. Payback period High IRR – National circumtanceBEconomicdevelopment B3. Low O&M cost and
intensiveNational circumtance
C1. Good impacts tosioeconomicdevelopment of locals
Improving local education, healthcare, job creation, poverty reduction,etc.- SD
C2. Less barrier onprevalence practice,psychology
Good public acceptance andparticipationC
Goodsocialimpacts
C3. Contributions toscience technologycapacity
Better tech. Transfer, localization,manpower development-SD
D1. Advanced butestablished tech.
Mature commercialization. No secondhand – SD and high adaptability
D2. Appropriate tech (but established)
Effective deployment, O&M,exploitation-SD
DTech.Development
D3. Up scalling SD
Following criterions are applied while selecting the climate change adaptationtechnology:
• Economic sectors, which are important in terms of reduction of GHG emissions;• Share of the selected sector in the structure of GDP;• Assessment of existing technologies;• Interaction with the other technologies;• Permanency of GHG emissions reduction;• Quantitative reduction of GHG emissions obtained once the technologies change;• Environmental, political and socio-economic importance of technologies;• Further improvement opportunities.
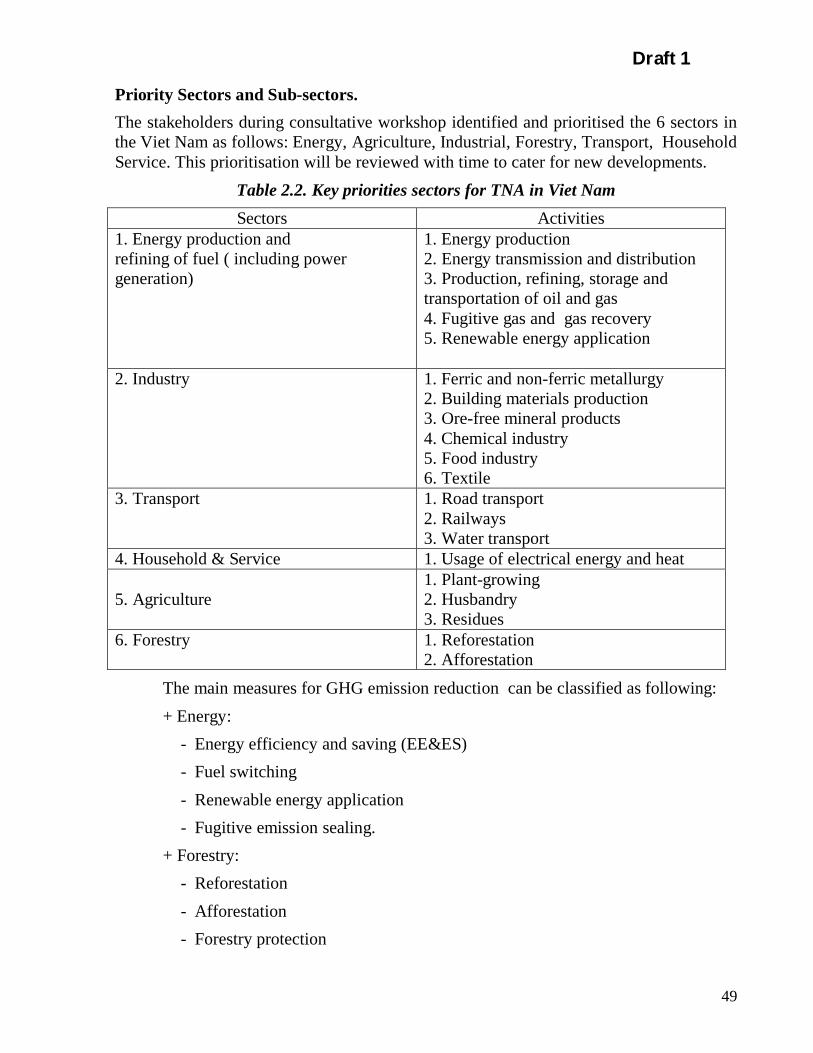
Draft 1
49
Priority Sectors and Sub-sectors.The stakeholders during consultative workshop identified and prioritised the 6 sectors inthe Viet Nam as follows: Energy, Agriculture, Industrial, Forestry, Transport, HouseholdService. This prioritisation will be reviewed with time to cater for new developments.
Table 2.2. Key priorities sectors for TNA in Viet NamSectors Activities
1. Energy production andrefining of fuel ( including powergeneration)
1. Energy production2. Energy transmission and distribution3. Production, refining, storage andtransportation of oil and gas4. Fugitive gas and gas recovery5. Renewable energy application
2. Industry 1. Ferric and non-ferric metallurgy2. Building materials production3. Ore-free mineral products4. Chemical industry5. Food industry6. Textile
3. Transport 1. Road transport2. Railways3. Water transport
4. Household & Service 1. Usage of electrical energy and heat
5. Agriculture1. Plant-growing2. Husbandry3. Residues
6. Forestry 1. Reforestation2. Afforestation
The main measures for GHG emission reduction can be classified as following:+ Energy:
- Energy efficiency and saving (EE&ES)- Fuel switching- Renewable energy application- Fugitive emission sealing.
+ Forestry:- Reforestation- Afforestation- Forestry protection
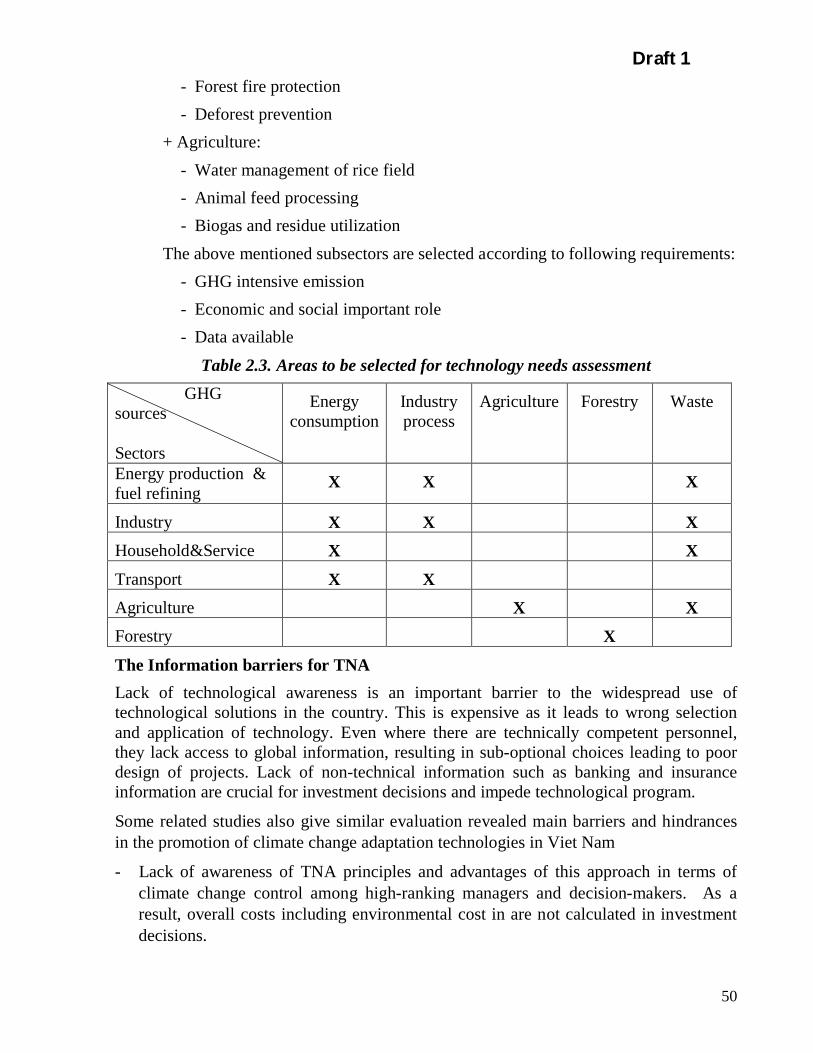
Draft 1
50
- Forest fire protection- Deforest prevention
+ Agriculture:- Water management of rice field- Animal feed processing- Biogas and residue utilization
The above mentioned subsectors are selected according to following requirements:- GHG intensive emission- Economic and social important role- Data available
Table 2.3. Areas to be selected for technology needs assessment GHGsources
Sectors
Energyconsumption
Industryprocess
Agriculture Forestry Waste
Energy production &fuel refining
X X X
Industry X X XHousehold&Service X XTransport X XAgriculture X XForestry X
The Information barriers for TNALack of technological awareness is an important barrier to the widespread use oftechnological solutions in the country. This is expensive as it leads to wrong selectionand application of technology. Even where there are technically competent personnel,they lack access to global information, resulting in sub-optional choices leading to poordesign of projects. Lack of non-technical information such as banking and insuranceinformation are crucial for investment decisions and impede technological program.
Some related studies also give similar evaluation revealed main barriers and hindrancesin the promotion of climate change adaptation technologies in Viet Nam
- Lack of awareness of TNA principles and advantages of this approach in terms ofclimate change control among high-ranking managers and decision-makers. As aresult, overall costs including environmental cost in are not calculated in investmentdecisions.

Draft 1
51
- Inadequate information about the concept of TNA on the mass media. Therefore,industries are not put under strong pressure to reduce the negative impact of theiroperations on human health and the environment.
- Lack of human resources that can provide consultancy on TNA and technologytransfer of climate change adaptation.
- Lack of information about the status of TNA and available climate change adaptationtechnologies as well as new trends of technology, product markets and technologysuppliers. In fact, there a numerous reports, announcements and even WebPagesfeaturing successful research and technical information about adaptation technologiesbut most of them are presented as part of a certain project.
- Poor observation and enforcement of environmental regulations and policy. Existingenvironmental regulations and standards mainly aim to urge producers to adoptsolutions to climate change adaptation technologies rather than to put pressure onthem to do so.
Sectors Activities Data status1. Energyproduction andrefining of fuel (including powergeneration)
1. Energy production
2. Energy transmission anddistribution3. Production, refining, storageandtransportation of oil and gas4. Fugitive gas and gas recovery5. Renewable energy application
1. Lack of data from privatesectors, IPP and SPP2. Good data
3. Good data. Fund needed
4. Poor data5. Scattered and inconsistent
2. Industry 1. Ferric and non-ferricmetallurgy2. Building materials production3. Ore-free mineral products4. Chemical industry5. Food industry6. Textile
1. Good data. Fund needed2. Only for main products3. No data4. Poor data. Fund needed5. Poor data. Scattering. Fundneed6. Poor data. Scattering. Fundneed
3. Transport 1. Road transport2. Railways3. Water transport
1. Poor data2. Good data3. Poor data
4. Household &Service
1. Usage of electrical energy andheat
1. Poor data
5. Agriculture1. Plant-growing2. Husbandry3. Residues
1. Available. Fund needed2. Available. Fund needed.3. Very poor data.
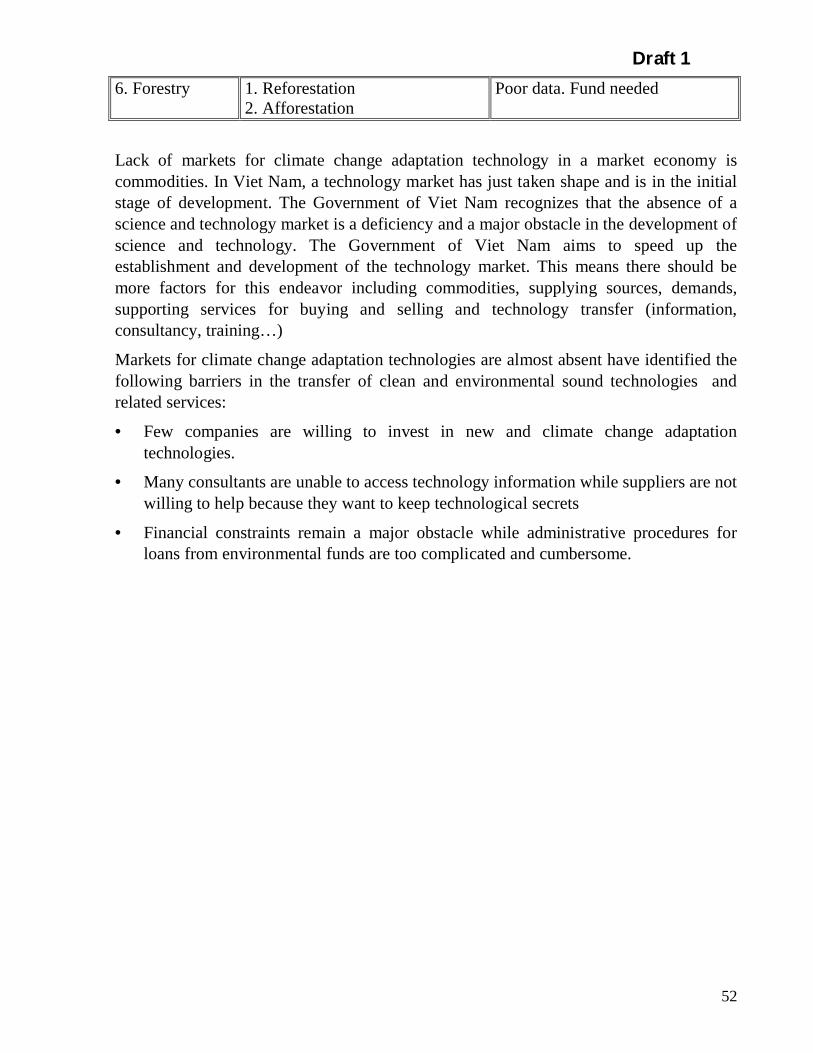
Draft 1
52
6. Forestry 1. Reforestation2. Afforestation
Poor data. Fund needed
Lack of markets for climate change adaptation technology in a market economy iscommodities. In Viet Nam, a technology market has just taken shape and is in the initialstage of development. The Government of Viet Nam recognizes that the absence of ascience and technology market is a deficiency and a major obstacle in the development ofscience and technology. The Government of Viet Nam aims to speed up theestablishment and development of the technology market. This means there should bemore factors for this endeavor including commodities, supplying sources, demands,supporting services for buying and selling and technology transfer (information,consultancy, training…)
Markets for climate change adaptation technologies are almost absent have identified thefollowing barriers in the transfer of clean and environmental sound technologies andrelated services:
• Few companies are willing to invest in new and climate change adaptationtechnologies.
• Many consultants are unable to access technology information while suppliers are notwilling to help because they want to keep technological secrets
• Financial constraints remain a major obstacle while administrative procedures forloans from environmental funds are too complicated and cumbersome.

Draft 1
53
PART I:TECHNOLOGY NEEDS ASSESSMENT FOR GHGs ABATEMENT
IntroductionThe Viet Nam’s TNA for abatement of GHG emissions aims at prioritizing of the lessGHG emissions technologies. This assessment of technology needs has been madethrough a sector-by-sector approach, starting with the energy sector which, according tothe Viet Nam’s First National Communication and Inventory has the most significantcontribution to the overall GHG emissions inventory. The Technology Needs Assessmentcovers sectors such as Household & Service & Forestry; Agriculture; Transport andIndustry.According to the IPCC guidelines for estimation of GHG emissions sources areconsidered under the energy category. For that reason, the GHG abatement analysisalready performed in the frame of the Viet Nam’s First National Communication andInventory has considered the services, industry, and transport under the energy category.For the same reason, the TNA for energy sector considers also the services, industry, andtransport sector under its focus.For each sector under assessment, the analysis has passed through the following steps:
• Overview of options and resources (this step covers (i) an overview of the each sectorprofile;(ii) policy and legislation framework for the sector under assessment; (iii)existing work carried out under the Viet Nam s First National Communication andInventory and (iv) take the stock of technologies currently in use.)
• Selection of key technologies
• Identification of barriers and policy needs
• Definition and selection of actions
• Stockholders
Draft 1
54
CHAPTER 3THE TECHNOLOGY NEEDS ASSESSMENT FOR ENERGY SUPPLY
3.1. Overview of options and resourcesThe GHG reduction TNA for energy supply is established in the following generalVietnamese energy context:
• The Viet Nam Electricity Development Master Plan - Phase V for the year 2010 withperspective to 2020;
• The Viet Nam Coal Development Master Plan for the year 2010 with perspective to2020;
• The Viet Nam Overall Energy Balance Development for the horizons 2010 and 2020;Based on Viet Nam Overall energy Balance Development for the horizons 2010 and 2020in the period after 2010, the basic primary energy sources in Viet Nam, in whichhydropower will be critically exploited. If there would be no new important additionalprimary energy sources such as oil and gas, after the year 2010, it would be difficulty inprimary energy supply for electricity generation. Therefore, the renewable energy sources(biomass, hydropower, solar, wind etc.) are of great importance in Viet Nam overallenergy balance. A Renewable Energy Action Plan has been established with expectedrenewable energy share of 5% and 10% of total primary energy use forecast for the year2010 and 2020. Besides that, the following primary energy sources have been consideredfor the period 2010 - 2020:
• Hydropower imported from Mekong River - based regional hydropower developmentproject;
• Nuclear power;
• Coal imported from other countries (Australia, Indonesia etc.).The above two first primary sources (imported hydropower and nuclear power) play therole of decisive importance in the GHG reduction for Viet Nam energy development inthe future, while the third one (imported coal) is not favorable consideration ofVietnamese energy/electricity planners and decision makers.

Draft 1
55
3.2. Selection of key technologies3.2.1. GHG Emissions from Energy Sector from National GHG Inventory (1994).
Unit: Million tCO2 equivalent.
Year 1994(inventoried)
2000(estimated)
2010(forecast)
2020(forecast)
GrowthRate 1994
- 2020(%)
Energy-relatedGHG Emissions(million CO2e)
25.64 49.97 117.3 232.3 14.8
Share of Energy-relatedGHG Emissions inNational totalone (%)
24.7 46.8 78.7 86.5 -
Per capital energy-related GHGemission p.a.(tCO2e/cap/yr).
0.368 0.644 1.337 2.374 -
Per capita nationaltotal GHGemissions p.a.(tCO2e/cap/yr)
1.490 0.727 1.698 2.745 -
Sources: Institute of Energy, Institute of Geography.Comments on the development of energy-related GHG emissions from the first NationalGHG Inventory carried out in year 1993:
• High growth rate of energy-related GHG emissions: averagely of 14.8% perannum for the period 1994 - 2020;
• Rapid increase of the share of energy-related GHG emissions in the national totalone: from 24.7% increased to 86.5% for the period 1994 - 2020;
• Rapid increase of the per capita energy-related GHG emissions: from 0.368 tCO2ein year 1994 increased to 1.337 tCO2e in year 2010 and 2.374 tCO2e in year 2020.
3.2.2. Main Orientations of Applying the GHG Reduction Technologies for EnergySupply.Using modern technologies for energy conservation and high energy efficiency.
• Using the high energy efficiency technologies for all phases of exploitation -production - transporting - distribution - utilization of energy.

Draft 1
56
• Applying the energy demand side management (DSM) to increase the efficiencyof energy end-use, reduce gradually the fossil fuel use, reduce the energy lossesand save the energy.
Increasing the use of renewable energy sources for electricity generation.
• Medium, small scale and mini/micro-hydropower.
• New energy types: solar, wind, geothermal energy.
• Biomass (GHG-neutral) (rice husk, biogases) - based co-generation.Switching from high GHG emission fossil fuels to the cleaner ones (for instant from DOto natural gas) and reducing the share of diesel, coal-fired and FO-fired thermal power.3.2.3. Analysing and estimating of the demand on environmentally sound technologiesused for electricity production
• Eliminate outdated technologies used by coal-and oil-fired thermal power.
• Increase the capacity and efficiency of existing thermal power plants.
• Import new coal-fired thermal power technologies with high thermal efficiency,low GHG.
• Apply the new & renewable energy technologies.
• Pay special attention to DSM programmes in oriented to energy saving and energyefficiency in electricity end-uses.
• Reconstruct and improve the current industrial steam boilers largely used byindustries and residential & service sectors.
• Reduce the electricity loss and enhance the efficiency of electricity transmission &distribution.
3.2.4. Analysing and estimating the demand on environmentally friendly technologiesused for coal miningIn the coal mining, a large amount of concentrated CH4 is released to the atmospherefrom open air and underground coal fields.
• Open air coal mining technology: Currently the CH4 emission from this activity isnot clearly estimated; and the CH4 emission reduction technology is still notidentified
• Underground tunneling coal mining: This coal mining technology is applied forproducing about 30% - 40% of total coal production, while most machines usedare outdated that cause a coal loss percentage up to 30% - 50%.
The GHG reduction TNA for coal mining shows two main technological options,namely:
• Modernizing the technologies used for detonating mines and drilling.
• Enlarging the application of hydraulic powered coal mining.

Draft 1
57
3.2.5. Estimating the demand on renewable energy technologies a. Characteristics ofRenewable Energy Sources are:
• Clean energy, Multiform and decentralized renewable energy (mini-hydro-power,biomass, solar, wind, biogas energy etc.), Low level of exploitation.
• Mini-hydropower:(i) 1500 - 2000 MW (8% - 10% of total).(ii) Exploiting level: Supplying hydropower for 200,000
rural/mountainous households and saving 27,000 tons of oil/year.(iii) Current status of hydropower technology: Domestic machinery can
manufactures the small hydropower equipment up to 2000 KW/unitcapacity with automatic governor.
(iv) Technological need: Technological localisation and cost reduction formanufacturing equipment.
• Solar energy(i) Up to 2002 in Viet Nam, installed capacity of solar energy: 702,402
Wp. Imported solar energy equipment/technologies (PV).(iii) Technological need: Centralized solar photovoltaic array to serve the
community in combination with other energy type (hybrid system).Development of solar heating technology.
• Wind energy(i) Domestic machinery can manufacture wind equipment up to 3 KW
capacities.(ii) Wind potential of Viet Nam is still not completely investigated.(iii) Technological need: Development of wind power technology in
industrial scale.
• Biomass energy(i) Current status: Small-scale biogases-fired cogeneration centers.(ii) Technological need: grid-connected biomass-fired centralized large-
scale co-generation center.Orientations of applying renewable energy technologies to reduce GHG emissions.
• Develop large scale renewable energy centers that are managed by officialprofessional management system.
• Enhance the share of renewable energy in overall energy balance up to 5% in year2010 and 10% in year 2020.
• Develop off grid renewable energy application for remote areas.
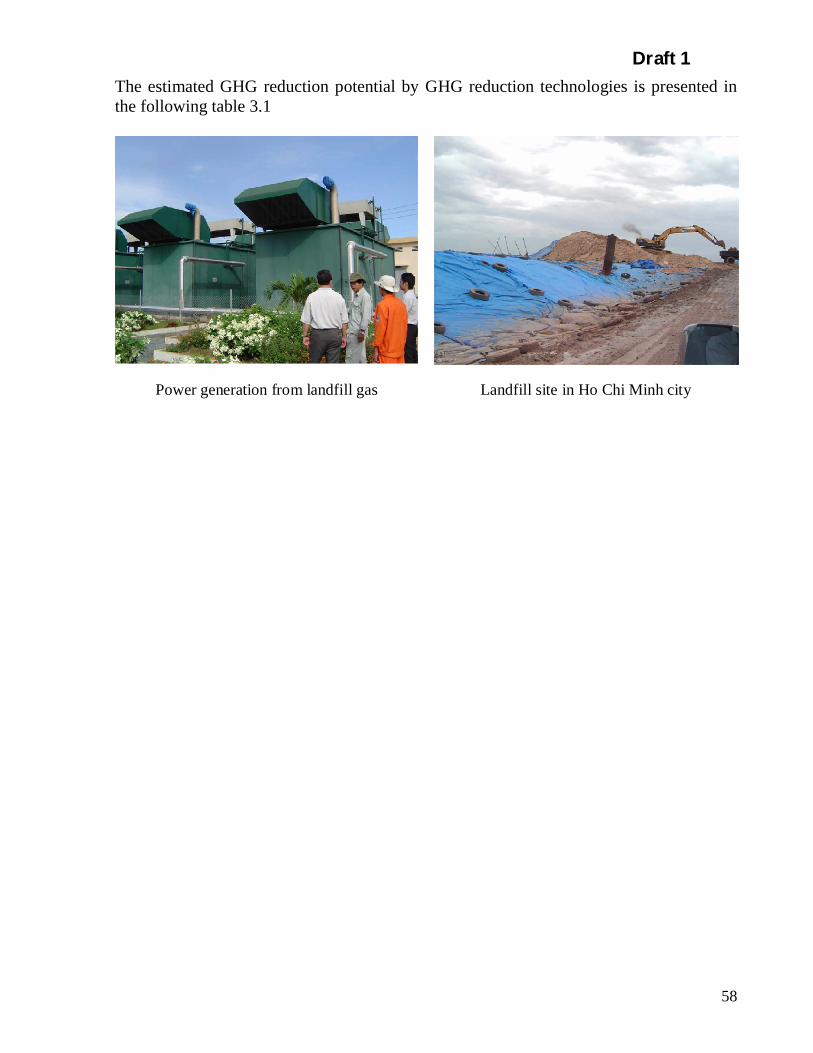
Draft 1
58
The estimated GHG reduction potential by GHG reduction technologies is presented inthe following table 3.1
Power generation from landfill gas Landfill site in Ho Chi Minh city
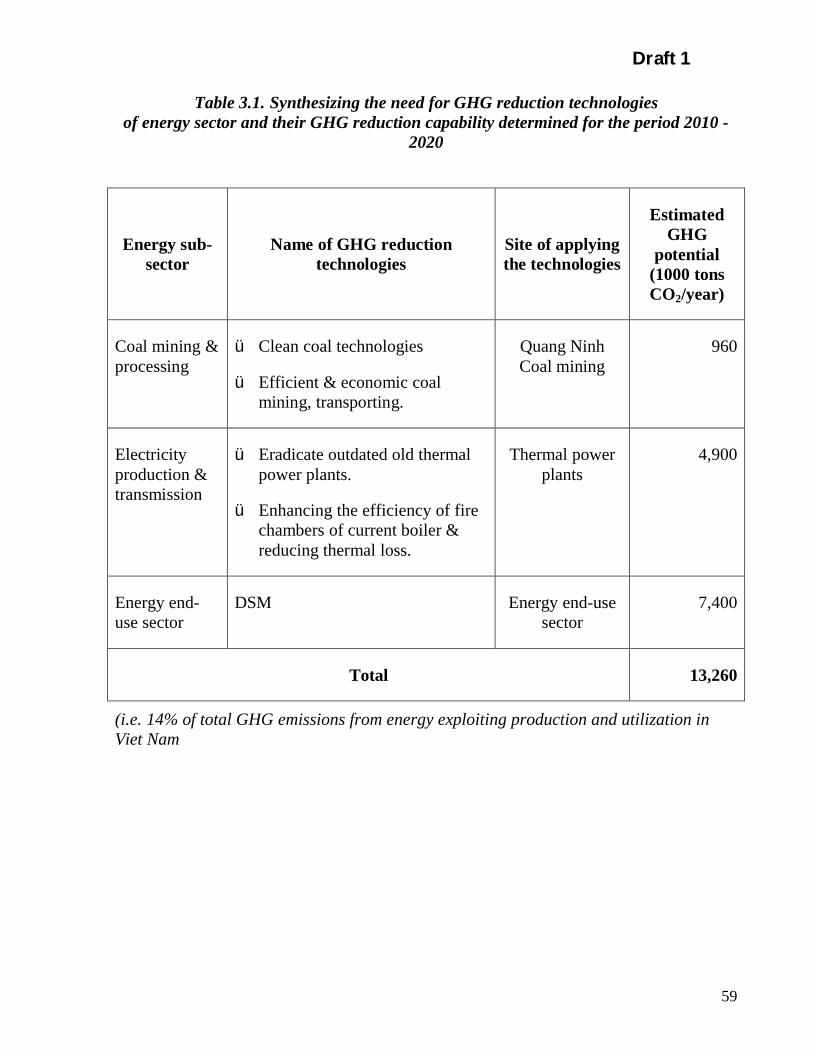
Draft 1
59
Table 3.1. Synthesizing the need for GHG reduction technologiesof energy sector and their GHG reduction capability determined for the period 2010 -
2020
Energy sub-sector
Name of GHG reductiontechnologies
Site of applyingthe technologies
EstimatedGHG
potential(1000 tonsCO2/year)
Coal mining &processing
ü Clean coal technologies
ü Efficient & economic coalmining, transporting.
Quang NinhCoal mining
960
Electricityproduction &transmission
ü Eradicate outdated old thermalpower plants.
ü Enhancing the efficiency of firechambers of current boiler &reducing thermal loss.
Thermal powerplants
4,900
Energy end-use sector
DSM Energy end-usesector
7,400
Total 13,260
(i.e. 14% of total GHG emissions from energy exploiting production and utilization inViet Nam
Draft 1
60
3.3. Identification of existing barriers and policy needs3.3.1. Absence of GHG concerns in project consideration of energy planners and policymakersAlthough Viet Nam has signed the UN FCCC and KP, the GHG reduction generally andthe energy - related GHG reduction particularly is not in the prime consideration ofVietnamese energy/electricity development policy makers, planners and designers atnational, sectoral, provincial and local level.Consequently, the feasibility study of every energy projects is commonly and mainlybased on technical - economic - pollution concerns without considering its GHGemissions.
3.3.2. High investment need of new and modern energy technologiesThere is the second difficulty faced by of applying the modern energy technologies, thatis the high investment needs of importing running and maintaining the new and moderntechnologies used for coal mining, gas and oil drilling and processing, electricitygeneration/transmission/distribution, as well as for developing renewable energytechnologies;3.3.3. Absence of a national coherent programme and policies for renewable energydevelopmentOver the past two decades, many pilot projects have been undertaken in Viet Nam todemonstrate their technical feasibility for remote upland an mountainous power supply,especially for small-scale, mini/micro-hydropower supply, the barriers faced by applyingthe renewable/energy technologies for remote rural and mountainous areas) are:
• Absence of a national coherent program to develop promising renewable energyoptions using domestic and international expertise;
• Absence of a pipeline of financially viable projects that could be financed byGovernment or by multilateral and bilateral organizations;
• Absence of renewable energy-oriented technological services to serve themaintaining and repairing and the renewable energy equipment and fabricatingtheir spare parts in order to keep reliable and stable running for them.
• Lack of an adequate policy and regulatory framework encouraging renewableelectricity.
• Inadequate information about renewable energy technologies.
• Lack of commercial business to provide renewable electricity equipment andservices.
• Lack of financing for consumers, businesses and developers.
• Inadequate resource and market data to plan a major program and to developprojects.

Draft 1
61
3.4. Definition and selection of actions3.4.1. GHG reduction-oriented technological options for non-renewable energy supplyIn orienting to energy-related GHG reduction, the following GHG reduction-orientedtechnological options and action programs should be considered and implemented:
• For the period from now up to the year 2010, the raising of energy saving andenergy efficiency should be considered as the most important purposes of GHGreduction-oriented technological options with two main technological energyprograms, namely the Demand Side Management (DSM) program forconventional energy/electricity exploitation, production and end-use as well as theEnergy Conservation/Saving Program for all energy consuming sectors in VietNam.
• From the period after year 2010 up to year 2020, because of scarcity ofconventional energy/electricity sources, in order to promote the energy supply inorienting to energy-related GHG reduction, the imported hydropower provided byMekong River-based regional hydropower project and the nuclear power shouldbe considered as two most important GHG reduction-oriented energytechnologies;
3.4.2. GHG reduction-oriented technological options for renewable energy supplyIn orienting to energy-related GHG reduction on the basis of developing the use of cleanenergy sources, the following renewable energy action plan has been suggested.
• Objectives and indicators.Objective: Providing electricity for economic and social development in remoteareas.Indicators: Number of renewable electricity systems; number of isolated grids andof served households; per household electricity use, and number of renewableelectricity facilities selling electricity to grid.
• Strategies and principles: Economically viable, Supplied on a commercial basis;Active contribution and participation to projects by communities and individualsGovernment acting as a market enabler.Long-term credit to improve projects financial viability limited grants assistanceprovided.
• Program components: RE policy and institutional development; Individualhousehold/institutional system; Community isolate Hydro Grids; Grid-connectedrenewable electricity; Technology/market development and resource assessment.
• Expected results and costs is estimated total: US$ 46 - 91 million in Phase 1.Provision of electricity to: 35,000 - 90,000 households off national grid forecast Installedcapacity: 41 - 50 MW.

Draft 1
62
3.4.3. GHG reduction related policy instruments for promotion of energy supplyIn orienting to energy supply-originated GHG reduction, the following economicinstruments, control instruments-law, and institutional and financial arrangements aresuggested:
Table 3.2.Environmental policy instrument related to GHG emission reduction
Policy Instruments Application (examples)
Economic Instruments
• Tax• Emission trading
• GHG emissions• Acid deposition
• Subsidy/tax relief • Energy research• Energy conservation instruments• Fuel characteristics improvement• Efficiency improvement
• Direct public investment• Grant aid of financing at low
interest rate
• Energy research• Co-generation• Demonstration plant of sustainable energy
Control Instruments - Laws
• Public regulation; Law• Legal liability
• Toxic wastes• Emission limits• Fuel pollutant content limits
• Local negotiation • Issues on local basis
• Purchase of kWh at guarantiedprice.
• Obligation to purchase
• Renewable, Sustainable energy
Value
• Self regulation • Green consumers and producer
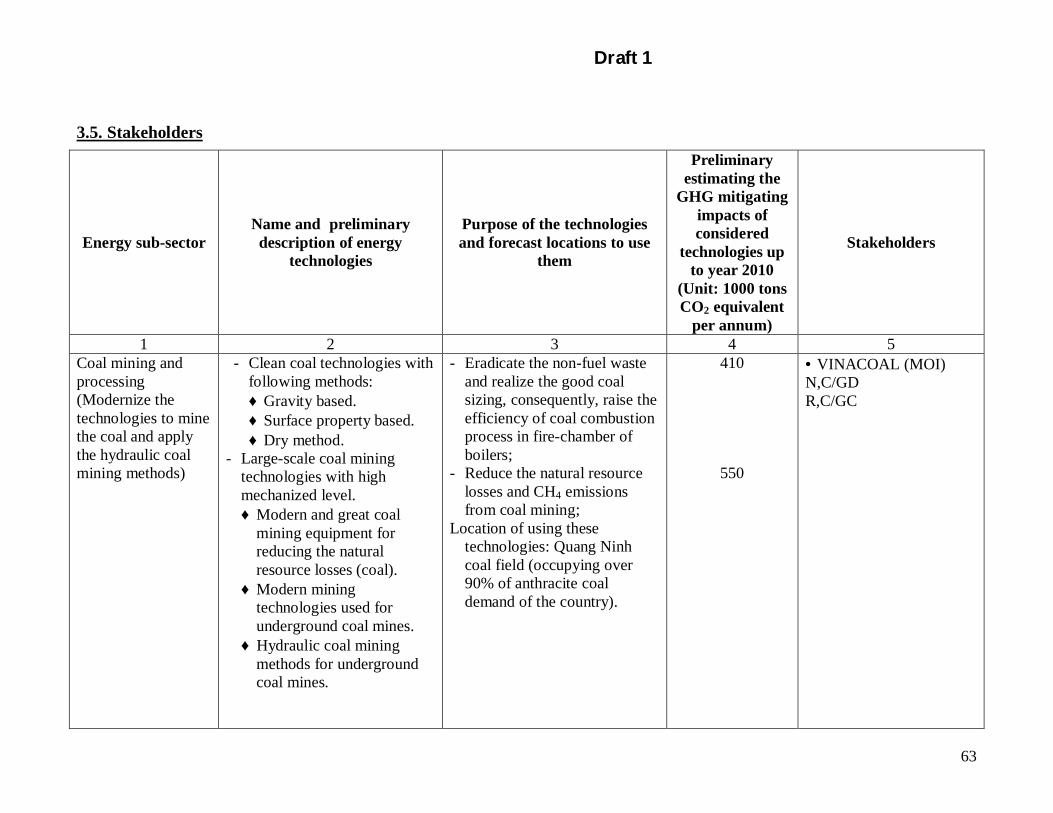
Draft 1
63
3.5. Stakeholders
Energy sub-sectorName and preliminarydescription of energy
technologies
Purpose of the technologiesand forecast locations to use
them
Preliminaryestimating the
GHG mitigatingimpacts ofconsidered
technologies upto year 2010
(Unit: 1000 tonsCO2 equivalent
per annum)
Stakeholders
1 2 3 4 5Coal mining andprocessing(Modernize thetechnologies to minethe coal and applythe hydraulic coalmining methods)
- Clean coal technologies withfollowing methods:♦ Gravity based.♦ Surface property based.♦ Dry method.
- Large-scale coal miningtechnologies with highmechanized level.♦ Modern and great coal
mining equipment forreducing the naturalresource losses (coal).
♦ Modern miningtechnologies used forunderground coal mines.
♦ Hydraulic coal miningmethods for undergroundcoal mines.
- Eradicate the non-fuel wasteand realize the good coalsizing, consequently, raise theefficiency of coal combustionprocess in fire-chamber ofboilers;
- Reduce the natural resourcelosses and CH4 emissionsfrom coal mining;
Location of using thesetechnologies: Quang Ninhcoal field (occupying over90% of anthracite coaldemand of the country).
410
550
• VINACOAL (MOI)N,C/GDR,C/GC

Draft 1
64
1 2 3 4 5ElectricityProduction(modernize the coalcombustiontechnologies or fire-chamber of coal-fired thermal powerplants)
- Gradually eradicate the oldand outdated coal-firedthermal power plants andsubstitute high efficiency coalcombustion technologies ofmodern fire-chamber forthem.
- Modernize the coalcombustion technologiesthrough improve theefficiency of fire-chamber ofcurrent boilers.
- Apply the modern pulverizedcoal-fired boilers (PC boilers)with high efficiency, greatunit capacity (up to 300 MW -500 MW per unit) and highsteam parameters.
- Modernize the current coalcombustion technology;enhance the efficiency of fire-chamber of current boilersand reduce their specific coalconsumption per kWh.♦ Ninh Binh coal-fired
thermal power plant:Reduce its current 788g/kWh down to 325 g/kWh.
♦ Uong Bi coal-fired thermalpower plant: Reduce itscurrent 740 g/kWh down to325 g/kWh.
- Reduce their specific coalconsumption from 454 g/kWhdown to 325 g/kWh.♦ Extension of 300 MW for
Ninh Binh coal-firedthermal power plant.
♦ Extension of 300 MW forUong Bi coal-fired thermalpower plant.
♦ Construction of Hai Phongthermal power plant of 2 ×300 MW = 600 MW.
♦ Construction of QuangNinh thermal power plantof 3 × 300 MW = 900 MW.
2412
• EVN (MOI) Viet Namgeneral Power Company.S, N, R, C - /GDS, N. R. C/GC• IPP (Non-governmentIndependent Power Plant)C/PC• Government researchinstitutions and centersC, N/GR• UniversitiesC, N - GR
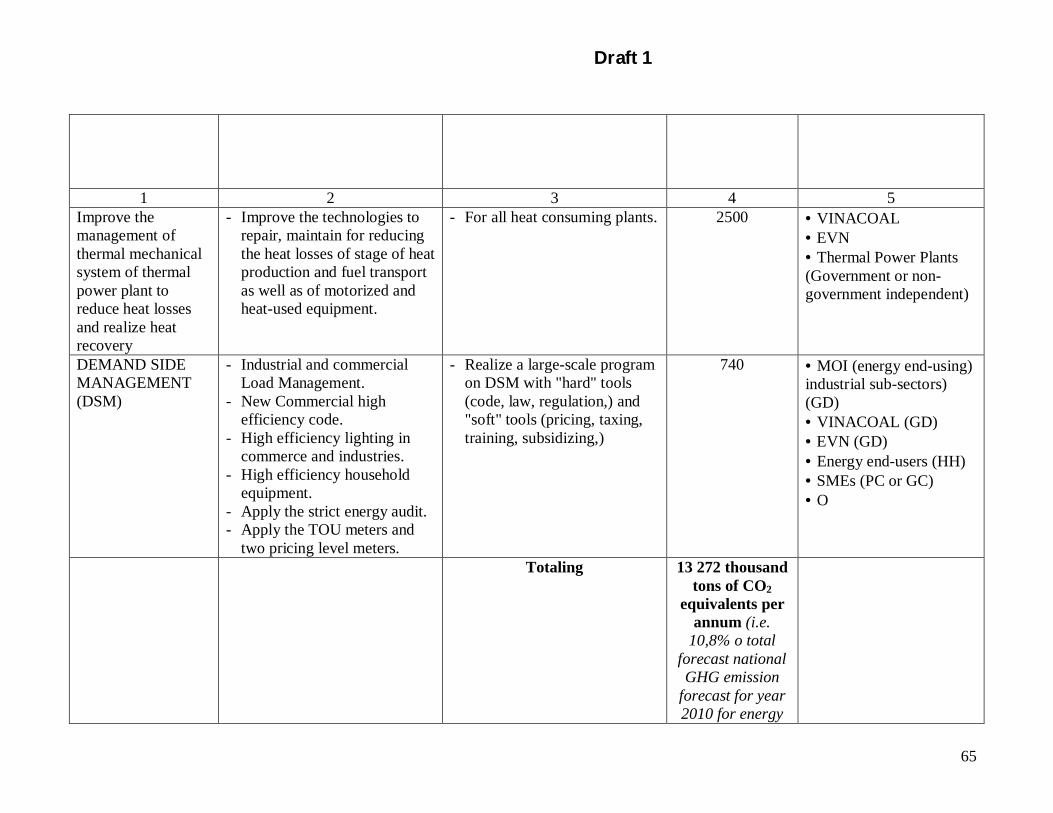
Draft 1
65
1 2 3 4 5Improve themanagement ofthermal mechanicalsystem of thermalpower plant toreduce heat lossesand realize heatrecovery
- Improve the technologies torepair, maintain for reducingthe heat losses of stage of heatproduction and fuel transportas well as of motorized andheat-used equipment.
- For all heat consuming plants. 2500 • VINACOAL• EVN• Thermal Power Plants(Government or non-government independent)
DEMAND SIDEMANAGEMENT(DSM)
- Industrial and commercialLoad Management.
- New Commercial highefficiency code.
- High efficiency lighting incommerce and industries.
- High efficiency householdequipment.
- Apply the strict energy audit.- Apply the TOU meters and
two pricing level meters.
- Realize a large-scale programon DSM with "hard" tools(code, law, regulation,) and"soft" tools (pricing, taxing,training, subsidizing,)
740 • MOI (energy end-using)industrial sub-sectors)(GD)• VINACOAL (GD)• EVN (GD)• Energy end-users (HH)• SMEs (PC or GC)• O
Totaling 13 272 thousandtons of CO2
equivalents perannum (i.e.
10,8% o totalforecast nationalGHG emission
forecast for year2010 for energy

Draft 1
66
sector)
Notes:1. Level of stakeholders: HH - household and energy end-user level; C - Firm, plant or Company level (C); S - State/provinciallevel; R - Regional level; N - National level.2. Type of stakeholders: GD Government department or ministry; GC - Government company; PC - Private sector company; PR- Private research association; GB - Government statutory body or commission; GR - Government research institution; PB -Private Board, association or federation; O - Others; SMEs - small and medium enterprises;

Draft 1
67
CHAPTER 4THE TECHNOLOGY NEEDS ASSESSMENT IN SERVICE
AND HOUSEHOLD SECTOR
4.1. Overview on options and resourcesEnergy consumptionFinal commercial energy consumption of Viet Nam is quickly increasing, in 1990 year isabout 7MTOE in 2004 year is 17,7 MTOE, average growth rate is about 10% per year.Total commercial energy consumption by fuels kinds is presented in table 4.1.
Table 4.1. Total final commercial energy consumption by fuels, MTOE
Year 1995 1996 1997 1998 1999 2000 2001 2002 2003 2004
Coal 2.03 2.58 2.93 3.21 2.79 3.23 3.74 4.01 4.2 4.6
Oil 4.17 5.05 5.34 5.78 6.56 6.97 7.45 8.67 8.95 9.2
Gas+LPG
- - - 0.09 0.25 0.26 0.42 0.42 0.51 0.55
Electricity 0.96 1.15 1.31 1.52 1.68 1.92 2.22 2.59 3.0 3.38
Total 7.16 8.78 9.58 10.61 11.28 12.38 13.83 15.69 16.66 17.73
In total of final commercial energy consumption oil products occupying about 50%,consuming mainly in transportation sector, after that in industry and residential sectors.Although Viet Nam exports crude oil, but all oil products are imported up to now. Coalconsumption is increasing and occupied about 30%, electricity is about 19%.Electricity consumption of Viet Nam increased very fast in recent years with averagegrowth rate of 14-15% per year.
Table 4.2. Viet Nam electricity consumption by sector (TWh,%)
TT 1995 1996 1997 1998 1999 2000 2001 2002 2003 20041 Industry 4614 5503 6163 6781 7590 9088 10394 12681 15205 17305
Share (%) 41.3 41.1 40.3 38.4 38.7 40.6 40.4 42.0 43.6 43.6
2 Agriculture 632 643 691 715 582 428 478 505 555 636
Share (%) 5.6 4.8 4.5 4.0 3.0 1.9 1.9 1.7 1.6 1.6
3 Household 4929 6136 7221 8849 10020 10986 12646 14333 15991 18239
Share (%) 44.1 45.9 47.2 49.7 51.1 49.0 49.1 47.4 45.9 46.0
4 Non_Industry 1010 1092 1228 1380 1400 1895 2227 2078 3087 3503
Share (%) 9.0 8.2 8.0 7.9 7.2 8.5 8.6 9.0 8.9 8.8

Draft 1
68
5 Commercial 11185 13374 15303 17725 19592 22397 25752 30228 34853 39683
Share (%) 20.6 19.2 14.8 15.7 10.5 14.3 15.0 17.4 15.12 13.92
6 Capitalconsumption(kWh/year)
151 177 200 233 255 295 338 382 432 490
7 Losses (%) 21.7 19.3 18.2 16.09 15.53 14.03 14.0 13.8 13.5 13.3
4.2. Selection of key technologiesAccording to data of state statistics to 2004 year in whole country there are about 72thousands of enterprises, thousands and thousands of big buildings, 15 mill households,etc. In which there are many kinds of energy consumption technologies with multiformfor used function, type, size and using energy: electricity, using directly fuels as coal, oil,gas, wood, new and renewable energy, etc; and sources from different countries.However it can estimate generally energy consumption technologies in Viet Nam are stilla lot of old and backward technologies, they consume much energy, and energy savingpotential is very big. Technologies presented following if can be used will save energyand reduce emission.1. Lighting technologies
• Lighting technology using Compact fluorescent- Life of lamp: 10.000 h; Efficiency: 48 lumen/W- Electrical saving potential: 60-70% electricity comparing to incandescent
lamp.- In public lighting using sodium lamp of 150-250WW to be saved 30-40%
electricity comparing to normal fluorescent.
• Energy saving potential: Measures of energy saving in lighting
- Short term: Management, exchange lamp- Medium term: Study and production high efficiency lamps with small size.- Long term: Investment to production high efficient lamps.
Electricity consumption structure in Viet Nam in household and service sector occupationabout 45-60% of total.
1999 2000 2001 2002 2003 2004
Electric. Consume. Total (Bill. KWh) 19,55 22,4 25,86 30,22 34,83 39,68
Household and service (Bill. KWh) 10,02 10,98 12,64 14,33 15,99 18,24
% 51,1 49,0 49,1 47,4 45,9 46

Draft 1
69
Lamp quantity estimated:- From survey data of DSM project (MOI) in 2002 year- From survey data of lighting project in 2001: Lamp quantity using in Viet Nam by
2004 year estimated about 100 mills. Lamps, in which: incandescent: 30 mills.Lamps; Fluorescent: 70 mills. Lamps
- Using compact lamp to replace incandescent saving 60% electricity- Using compact lamp to replace fluorescent, saving 20% electricity.- Estimate by 2010 exchanging 15% of incandescent lamps and 10% of fluorescent
lamps.- By 2015 exchanging 30% incandescent and 20% of fluorescent lamps.
• Energy saving:
2010 2015
Incandescent (bill. kWh) 0.35 0.53
Fluorescent (bill. kWh) 0.08 0.16
Saving total (bill. kWh) 0.43 0.69
• The estimate of GHG emission reduction potential provide to electricity savingpotential above and emission factor studied in CD4 CDM project 0.570kgCO2/KWh and GHG emission reduction in follow table
2010 2015
CO2 reduction (103t CO2) 245 393
2. Cooling and air-conditioning technology- Using wide currency in household and service sectors- Among past 25-30 years: Energy consumption reduced about 60-65% for
refrigerator and 45-50% for air conditioning (see fig.)- Energy efficiency (ER) of advance units achieved about 8, 9, 10, 11 BTU/W; ER
estimated about 6-7 in Viet Nam.Energy saving potential estimated of cooling and air conditioning sectors in Viet Nam
2000 2005 2010
Cooling capacity total (Bill BTU/h) 3-3.5 4.2-5.0 6-7
Power capacity (MW) 400 550-600 750-850
Electricity demand GWh 1200 1600-1800 2500-2800
Draft 1
70
- If ER increases 10%, saving electricity with 2005: 160-180 mill KWhrespective 160-180 bill VND; and 2010: 250-280 mill KWh respective 250-280bill VND
Emission reduction potential based on use CO2 emission factor from IPCC is 0,9kgCO2/KWh for GHG emission reduction potential in cooling and air conditioning inhousehold and service sectors as follow: 2005 year: 144-162 KtCO2/year; and 2010 year:225- 252 KtCO2/year.
3. Cogeneration technologyThe Cogeneration is a system that production simultaneous by electricity and heat, andincludes boiler, turbine (back pressure or extract condensate) and consumers.The Cogeneration technology has a lot of advances
- Energy efficiency is very high, about 50-60%, while EE of advance thermal powerplant is only 40%
- Supplying simultaneously electricity and head for consumers; Suitable size forconsumers; Using a lot of fuel kinds; Reducing GHG.
The estimate of GHG emission reduction potential for COGEN technology based on useemission factor from IPCC guideline 0,9kg CO2 per 1KWh to be provide
- Energy efficiency of cogeneration is 0,5, efficiency of thermal power plant is 0,37;That means efficiency of cogeneration is higher 30%
- GHG emission reduction of Cogen. is lower than thermal power plant about 30%,that means 0,3kgCO2/KWh
- Viet Nam has about 310 MW of cogen in present, operation time per year is about3200h and production 1 bill kWh/year
- Total account of GHG may be reduced 0,3 kgCO2 x 1 bill KWh/year = 300.000TCO2/year
- Forecasted data by 2010, 1000MWW of Cogeneration will be installed, GHG totalaccount will be reduced 0,3kgCO2/kWh x 3, 5 bill KW/year= 1, 05 mill TCO2.
4. Electricity engine and control (engine system)- Viet Nam is using many electricity motors that are old generation, efficiency
being low and consuming much electricity. Controlling motor is not used yet.Electricity motors consume about 60-70% total electricity consumption inindustry. Using new electricity engine and control can save about 25-30%electricity in average. Electricity consumption in Viet Nam industrial sector by2004 year is about 17, 5 TWh, that mean about 43% of consumption total of VietNam.
- Suppose that in 5 coming years, 10% of old motors are replaced by enginesystems, it can save 0,43-0,52 TWh/year. GHG emission reduction potential maybe achieve about 245000-296000 tones equip CO2 per year.
Draft 1
71
5. Biogas Technology- Technology transmits organic substance into biogas in which main gas is CH4 to
use for cooking, lighting, electricity production...Making good manure and cleanenvironment
- Normal size of biogas shelter is 4-5 m3 or 6-8m3 for family and 40-50m3 orbigger for farms.
- There are about 73,000 units and plan up to 2010, will be added about 180.000 –200.000 units.
- The Estimate of CO2 emission reduction potential based on use emission factorfrom IPCC for coal 26.8 tc/Tj being baseline.
+ Unit of 6-8m3 can be given 3m3 of biogas
+ Equivalent fuel per year is 785kg of coal, equivalent of 0.01804TJ
+ With existing units (73.000) can be reduced 141.328 tCO2/year
+ With 2010 plan can be reduced 489.808 tCO2 /year.
- Application capacity of technology: Investment is no big but receives a lot ofbenefits; There are families in country having good conditions for developingbiogas; Having technical guide and finance support from government andinternational organizations.
4.3. Identification of barriers and policy needs
• About averages, the participant views of energy saving are different, people are alittle considered, the energy companies are interested in increasing energyproduction, sale and profits, the energy saving not being their priority.
• The lack of information from outside countries also in country about energysaving technologies and knows how, good typical activities of energy efficiency.
• The lack of offices to implement new technology transfer and advice to carry outactivities of energy saving.
• About finance, lack of fund to use new technologies, production modernization.
• Energy price is not suitable yet, power tariff in household sector is lower than inindustrial sector, and coal price is relatively lower comparing to other fuels.
• Lack of policies and concrete mechanics to implementation energy efficiency,such as: measures for promoting energy saving; reducing tax for new technologytransfer etc.
• Monopoly in energy activities is still high, that limited the investment in energyproduction and activities of energy efficiency.
Draft 1
72
4.4. StakeholdersThe activity of energy efficiency is a collection work, it needs the participation of muchorganization, and personals, and it may list as following
- Ministry of Industry being the focus office to guide implementation of energyefficiency use in whole country.
- Ministry of Construction has the responsibility to coordinate and implementationenergy efficiency program in buildings.
- Ministry of Transportation has the responsibility to combine and implementationenergy efficiency program in the transportation sector.
- Ministry of Education and Training head and combine with other organization toimplementation energy efficiency training.
- Ministry if Science and Technology has the responsibility to implementationenergy efficiency project programs
- Ministry of Finance having the responsibility of finance balance.- Ministry of Plan and Investment having the responsibility of plan of finance and
man power, calling investment from inside and outside country resources.- Local governments of cities and provinces in whole country- Viet Nam union societies of science and technology.- Companies, Factories, enterprises buildings using much energy (about 1000 units)- International organizations and others.
Draft 1
73
CHAPTER 5THE TECHNOLOGY NEEDS ASSESSMENT FOR INDUSTRY SECTOR
5.1. Overview on options and resourcesIn industrial sectors, for time limitation, we only examine three industries: Cement, Steel,Construction materials because they consume most of energy in industry, with high GHGemission and they also play an important role in the process of national industrializationand modernization. The other sectors should be investigated further.
5.1.1. CementCement production is highly energy-intensive, leading to significant energy-related andprocess CO2 emissions. Energy costs approximately 30-40% of the costs of cementproduction [4].Global cement production in 1995 was estimated at 1.45 billion tons. Total (energy-related and process) emissions from global cement production in 1994 were estimated at1.1 billion tons CO2, or 5% of global energy-related CO2 emissions in the same year.Cement production accounted for an estimated 1-2% of global primary energyconsumption [4].In Viet Nam the Cement sector is also biggest energy consumer in industry (17% energyin industry-1998) [2]. But energy efficiency in this sector is still low: 950Kcal/kg clinkerand 100kWh/tone cement.In 2002, total GHG emission from cement sector was 14,420 ktCO2 [3], accounted forabout 41.2 % total GHG emission in industry. And in 2010, the total GHG emission fromthis sector will be 40,260 ktCO2 [3], about 50.8% of total GHG emission from industry.5.1.2. SteelThe iron and steel industry is the largest energy consuming industrial sector in the world.In 1990, its global energy consumption was estimated to be 18-19 exajoule (EJ), or 10-15% of the annual world industrial energy consumption (WEC, 1995). The associatedCO2 emissions were estimated to be 1,425 Mt (De Beer et. al., 1999). In 1995 thisamount increased to 1,442 Mt CO2, equals about 7% of global anthropogenic CO2emissions. When mining and transportation of ore and coal are included, this share is near10% of total emissions. Fossil fuel combustion is the primary source of GHG emissionsfrom iron and steel production, and energy costs about 15-20% of steel manufacturingcosts [9].In Viet Nam, steel was the second energy consumer (7.7%) and biggest electricityconsumer (56%-1998) [11]. Energy efficiency is low only equal about 50% of advancedlevel.
5.1.3. Construction materialsThis is one of the most leading industry sectors in term of production capacity. In newestablished market-driven condition during past 10 years, this sector has significantlydeveloped and met the basic demand of infrastructure and civil construction of thecountry. In many past years, this sector maintains continuously high growth rate. The

Draft 1
74
main products of construction material production sector include: cement, iron, steel, andsome types of the basic construction material as roof material, building glass, buildingsand, brick…In Viet Nam, brick is the traditional construction material. About 60 – 70 % of brickoutput has been manufactured by traditional blast furnaces. This kiln consumes more fueland pollutes surrounding environment. At present, ratio of fuel and electric expenditure intotal brick production cost in Viet Nam ranges from 20% to 30% depending on the brickmanufacturing technology, the traditional kiln has highest fuel cost, because of differentreasons, occupies 31% in total brick production cost.Generally in Viet Nam, brick manufacture mainly depends on small and mediummanufacturing households with old technology. Energy consumption is relatively high,therefore high of GHG emissions. The total GHG emission from brick manufacture was2,070 ktCO2 [16], accounted for 6.5% in total emission from energy sector in 1995. In2002, GHG emission from this sector increased to 3,302.94 ktCO2, about 9.54 % of totalemission from industry. By 2010, with growth of brick output as forecast, the emissionwill be increase much more, about 5,803.61 ktCO2, accounted for 7.33 % total GHGemission from industry sectors.
5.2. Selection of key technologies5.2.1. Cement sector1. Current condition of existing technologiesInstalled capacity: to 2003, the installed capacity of cement sector is as 10 large cementunits (rotary kiln) with total installed capacity 15.26 million tones/year includes: 6 stateown plants of 9.4 million tones/year capacity; 4 Joint ventures of 5.86 million tones/yearcapacity; 55 small plants (less than 80,000 tones/year capacity) with vertical kilntechnology with total installed capacity: 3.0 million tones/year; 40 clinker grinding unitswith total capacity: 4.35 million tones/year.The cement production during last period is following
Table 5.1. Cement productionsUnit: Ktones
Sector 1995 1998 1999 2000 2001 2002Cement
- State own- Non state- Foreign
5,8285,82800
9,3787,73571,996
10,4897,870112,588
13,2989,560973,641
16,07310,684252.5,137
19,48112,6404556,386
Source: Viet Nam Statistic Yearbook-2002The production figure includes the imported clinker for domestic grinding. 3.33 Mtones(see table 5.2) to get 3.7 Mtones cement.Energy consumption: Current average specific energy consumption includes Heatconsumption: 950Kcal/kg clinker (3.98GJ/t clinker); Electricity consumption:

Draft 1
75
100kWh/tone cement; Electricity consumption for clinker grinding: 40kWh/t clinker.Total energy consumption (2002): 16.00 Mtones, with for clinker production (90% ofcement): 14.4 Mtones;Electricity consumption: (100kWh/t cement): 1600.0 million kWh/year, with Fuelconsumption: 57,312 TJ/year (2.6 Mtones of coal-HV=5500Kcal/kg); Clinker grinding:Electricity consumption for grinding 3.33 Mtones of clinker is: 133.2 million kWh.Evaluation of GHG emission from the manufacture of cement can be expressed asfollowing:
Total emissions forcement production
= Process emissions+ emissions from fuel combustion
+ (indirect) emissions from electricity consumed+ emissions from some kinds additive used+ emissions associated with additive preparation
The energy-related emissions of CH4 and N2O combined typically represent less than0.5% of total energy-related emissions, so could be omitted from emission baselineswithout having a significant impact on either the stringency of the emissions baseline oron the uncertainty of credits.Process emissions = Emissions from clinker production + emissions from additional limeused in masonry cementFor the evaluation it is commonly to use the IPCC (1996) [5] Emissions from clinkerproduction = 0.5071 t CO2/t cli * tons clinker produced.Then, process emission of Viet Nam cement in 2002 will be: 7.30 Mtones CO2.Fuel used in Viet Nam cement is mainly anthracite, with IPCC emission factor: [5]98.356tCO2/TJ and the fuel consumption of 57,312 TJ, the emission will be: 5.64Mtones CO2.Emission from electricity consumption with grid emission factor with OM&BMapproach: 0.855 kg CO2/kWh. [6].Then (1600.0+133.2) MkWh of grid emitted: 1.48Mtones CO2Total GHG emission from cement sector: 14.42 Mtones CO2 in 2002GHG Emission projection up to 2020Table 5.2 shows the demand and production projection in development plan. Theinformation is taken from Cement master development plan up to 2010 with outlook at2020(done in 2002). The plan was approved by the Prime Minister in Nov. 18 2002 (Gov.decision No 164/2002/QD-TTg).

Draft 1
76
Table 5.2. Demand and production* volume (forecast and planned)
Indicators 2002 2005 2010 2015 2020Demand growth(%)
20 13 10 5-8 2.5-3Demand-mt 19.7 29.1 48.6 63-65 68-70Production-mt 16.0 22.0 49.8 62.8 68
Source: Cement master development plan-2002. And Production is not included the grindingoutput from imported clinker.
Technology target: heat consumption: 730Kcal/kg clinker. (3.06 GJ/t clinker); Electricityconsumption: 95kWh/t cement; Dust in exhaust gas: 50mg/Nm3.
Table 5.3. GHG Emission from Viet Nam cement sector
* Following assumptions are made for emission projection evaluation:+ Technology level in 2005 is same as in 2002: 3.98GJ/kg Clinker and 100kWh/t of
cement.+ Technology level in 2010 and after is the target values.+ Process emission factor (0.5071TCO2/T clinker) is unchanged.+ Grid emission factor also unchanged
Total emission from Cement sector
14.42 19.89
40.2650.77 54.98
0.0010.0020.0030.0040.0050.0060.00
2002 2005 2010 2015 2020
year
Mto
nes
of C
O2
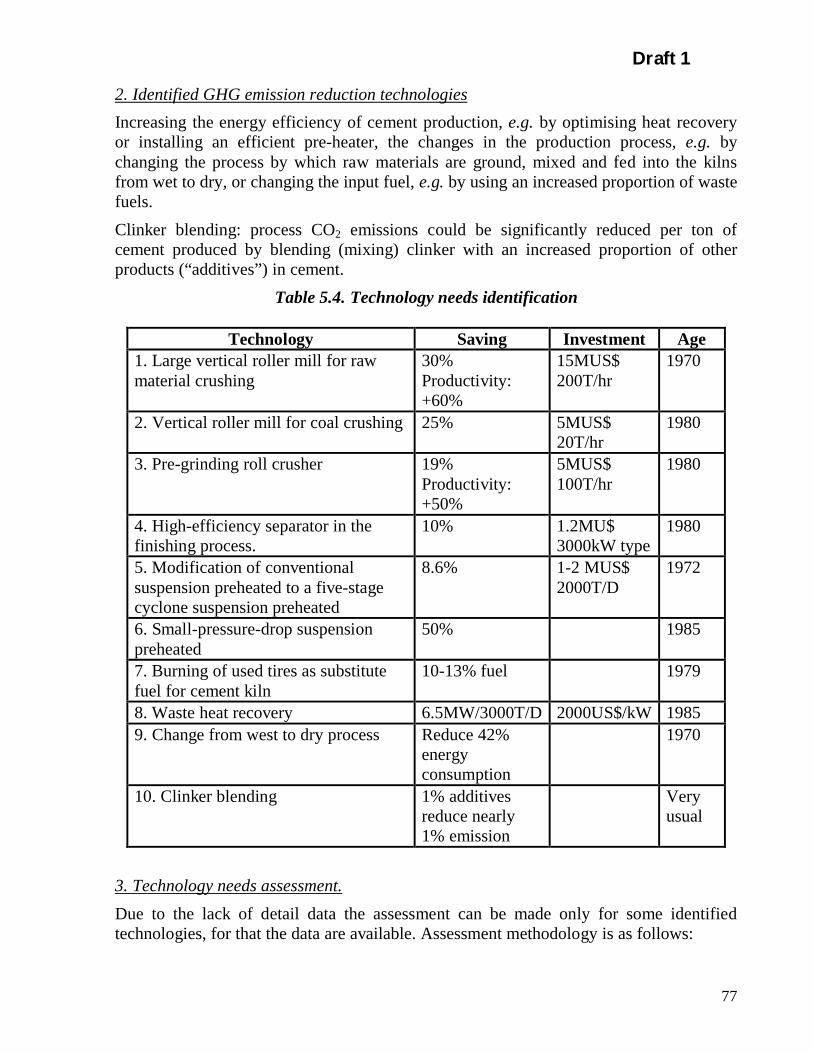
Draft 1
77
2. Identified GHG emission reduction technologiesIncreasing the energy efficiency of cement production, e.g. by optimising heat recoveryor installing an efficient pre-heater, the changes in the production process, e.g. bychanging the process by which raw materials are ground, mixed and fed into the kilnsfrom wet to dry, or changing the input fuel, e.g. by using an increased proportion of wastefuels.Clinker blending: process CO2 emissions could be significantly reduced per ton ofcement produced by blending (mixing) clinker with an increased proportion of otherproducts (“additives”) in cement.
Table 5.4. Technology needs identification
Technology Saving Investment Age1. Large vertical roller mill for rawmaterial crushing
30%Productivity:+60%
15MUS$200T/hr
1970
2. Vertical roller mill for coal crushing 25% 5MUS$20T/hr
1980
3. Pre-grinding roll crusher 19%Productivity:+50%
5MUS$100T/hr
1980
4. High-efficiency separator in thefinishing process.
10% 1.2MU$3000kW type
1980
5. Modification of conventionalsuspension preheated to a five-stagecyclone suspension preheated
8.6% 1-2 MUS$2000T/D
1972
6. Small-pressure-drop suspensionpreheated
50% 1985
7. Burning of used tires as substitutefuel for cement kiln
10-13% fuel 1979
8. Waste heat recovery 6.5MW/3000T/D 2000US$/kW 19859. Change from west to dry process Reduce 42%
energyconsumption
1970
10. Clinker blending 1% additivesreduce nearly1% emission
Veryusual
3. Technology needs assessment.Due to the lack of detail data the assessment can be made only for some identifiedtechnologies, for that the data are available. Assessment methodology is as follows:

Draft 1
78
- Baseline: BAU: Business As Usual. For emission from electricity consumption, theemission factor of grid, calculated as ½ OM+½ BM.
- GHG emission reduction options:+ Refurbishment is applied for 65 existing cement plants with capacity of 18.26 Mt
of cement per year. The refurbishment rate is suggested to finish the fullrefurbishment in 2012.
+ New built is applied for newly built cement plants with capacity added describedin table 5.12. It is taken from Cement Mater Development plant.
Table 5.5. Added cement production capacity
04 05 06 07 08 09 10 15 20Production, Mt 18,8 22,0 27,9 35,3 42,0 47,6 49,8 62,8 68Added capacity,Mt
- 3,20 5,95 7,35 6,70 5,60 2,2 13 5,2
Table 5.6 gives the results of assessment.
Table 5.6. Technology assessment
Tech. parameters 05-25 accumulated CO2reduction of wholesector, MtCO2eq.
Reduction costUSD/tCO2
Technology
E.saving
Cost Refurbishment Newbuilt
Refurbishment Newbuilt
1. Largevertical rollermill for rawmaterialcrushing
30% 15 MUSD/200t per hour
1.7 4.5 146.0 4.0
2. Verticalroller mill forcoal crushing
25% 5MUSD/5t per hour
0.13 0.37 838.0 4.45
3. Pre-grindingroll crusher
19% 5MUSD/100t per hour
1.0 2.8 42.6 1.9
4. High-efficiencyseparator in thefinishingprocess.
10kWh/tcement
1.2MUSD/3MW
1.5 4.3 -35.7 -52.0
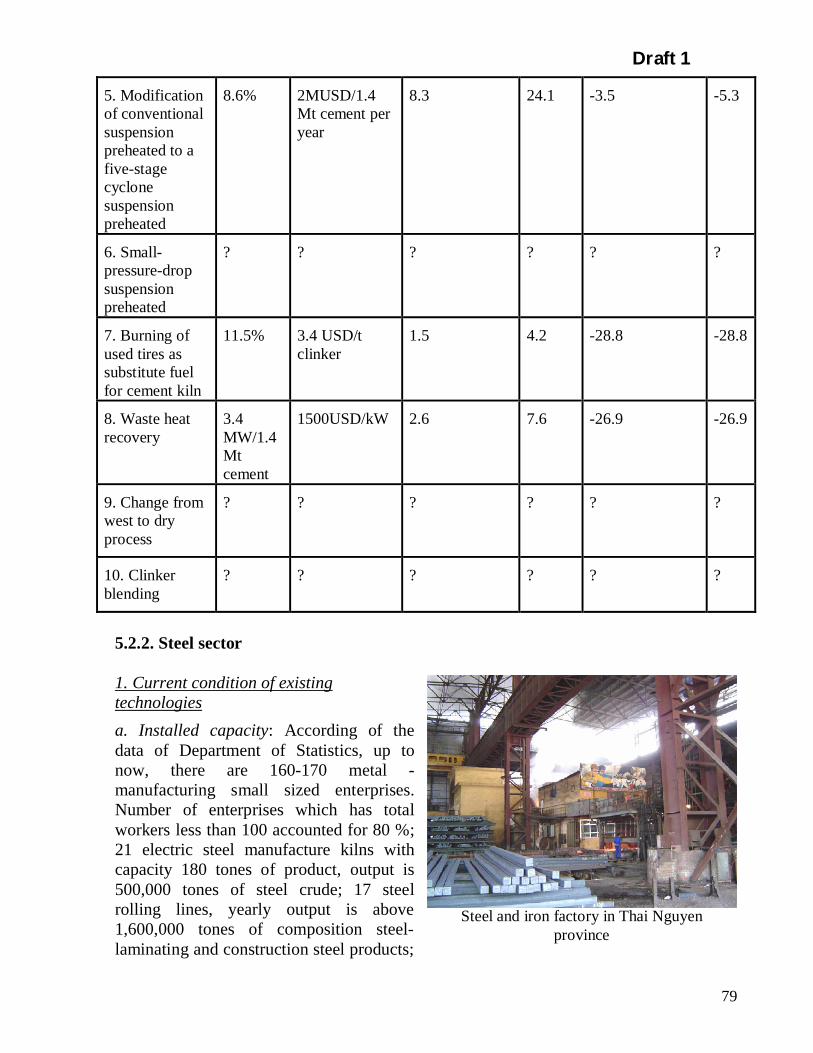
Draft 1
79
5. Modificationof conventionalsuspensionpreheated to afive-stagecyclonesuspensionpreheated
8.6% 2MUSD/1.4Mt cement peryear
8.3 24.1 -3.5 -5.3
6. Small-pressure-dropsuspensionpreheated
? ? ? ? ? ?
7. Burning ofused tires assubstitute fuelfor cement kiln
11.5% 3.4 USD/tclinker
1.5 4.2 -28.8 -28.8
8. Waste heatrecovery
3.4MW/1.4Mtcement
1500USD/kW 2.6 7.6 -26.9 -26.9
9. Change fromwest to dryprocess
? ? ? ? ? ?
10. Clinkerblending
? ? ? ? ? ?
5.2.2. Steel sector
1. Current condition of existingtechnologiesa. Installed capacity: According of thedata of Department of Statistics, up tonow, there are 160-170 metal -manufacturing small sized enterprises.Number of enterprises which has totalworkers less than 100 accounted for 80 %;21 electric steel manufacture kilns withcapacity 180 tones of product, output is500,000 tones of steel crude; 17 steelrolling lines, yearly output is above1,600,000 tones of composition steel-laminating and construction steel products;
Steel and iron factory in Thai Nguyenprovince
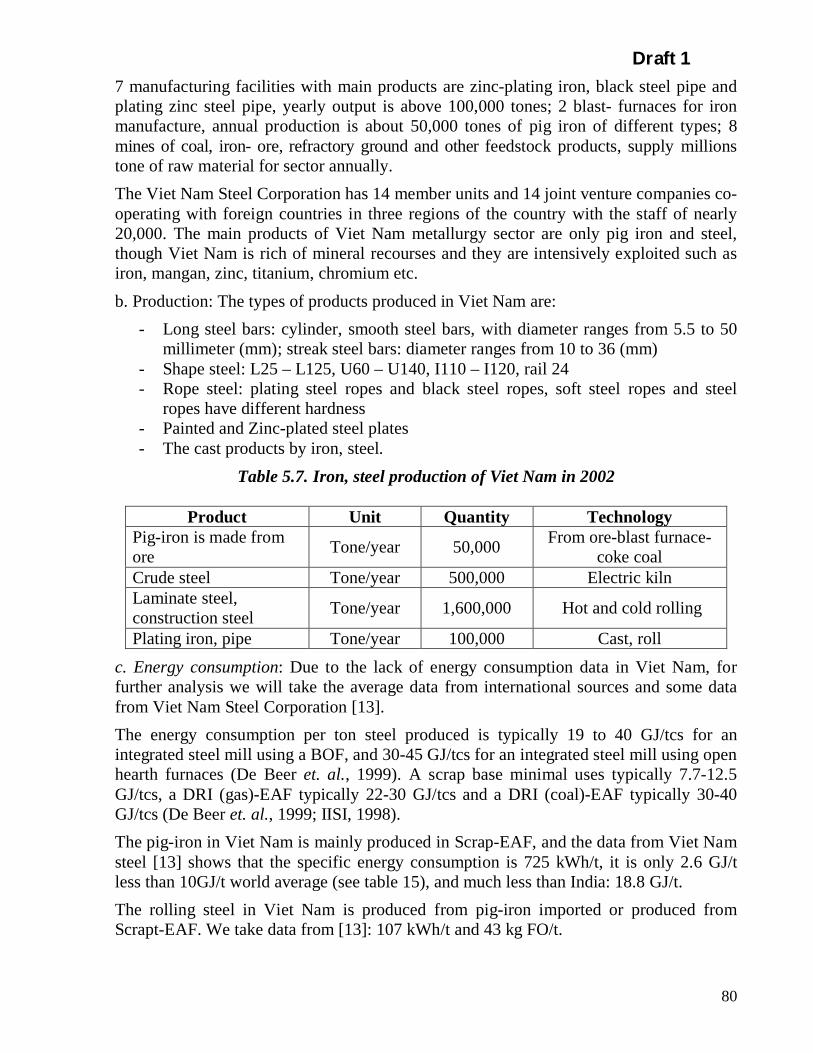
Draft 1
80
7 manufacturing facilities with main products are zinc-plating iron, black steel pipe andplating zinc steel pipe, yearly output is above 100,000 tones; 2 blast- furnaces for ironmanufacture, annual production is about 50,000 tones of pig iron of different types; 8mines of coal, iron- ore, refractory ground and other feedstock products, supply millionstone of raw material for sector annually.The Viet Nam Steel Corporation has 14 member units and 14 joint venture companies co-operating with foreign countries in three regions of the country with the staff of nearly20,000. The main products of Viet Nam metallurgy sector are only pig iron and steel,though Viet Nam is rich of mineral recourses and they are intensively exploited such asiron, mangan, zinc, titanium, chromium etc.b. Production: The types of products produced in Viet Nam are:
- Long steel bars: cylinder, smooth steel bars, with diameter ranges from 5.5 to 50millimeter (mm); streak steel bars: diameter ranges from 10 to 36 (mm)
- Shape steel: L25 – L125, U60 – U140, I110 – I120, rail 24- Rope steel: plating steel ropes and black steel ropes, soft steel ropes and steel
ropes have different hardness- Painted and Zinc-plated steel plates- The cast products by iron, steel.
Table 5.7. Iron, steel production of Viet Nam in 2002
Product Unit Quantity TechnologyPig-iron is made fromore Tone/year 50,000 From ore-blast furnace-
coke coalCrude steel Tone/year 500,000 Electric kilnLaminate steel,construction steel Tone/year 1,600,000 Hot and cold rolling
Plating iron, pipe Tone/year 100,000 Cast, roll
c. Energy consumption: Due to the lack of energy consumption data in Viet Nam, forfurther analysis we will take the average data from international sources and some datafrom Viet Nam Steel Corporation [13].The energy consumption per ton steel produced is typically 19 to 40 GJ/tcs for anintegrated steel mill using a BOF, and 30-45 GJ/tcs for an integrated steel mill using openhearth furnaces (De Beer et. al., 1999). A scrap base minimal uses typically 7.7-12.5GJ/tcs, a DRI (gas)-EAF typically 22-30 GJ/tcs and a DRI (coal)-EAF typically 30-40GJ/tcs (De Beer et. al., 1999; IISI, 1998).The pig-iron in Viet Nam is mainly produced in Scrap-EAF, and the data from Viet Namsteel [13] shows that the specific energy consumption is 725 kWh/t, it is only 2.6 GJ/tless than 10GJ/t world average (see table 15), and much less than India: 18.8 GJ/t.The rolling steel in Viet Nam is produced from pig-iron imported or produced fromScrapt-EAF. We take data from [13]: 107 kWh/t and 43 kg FO/t.
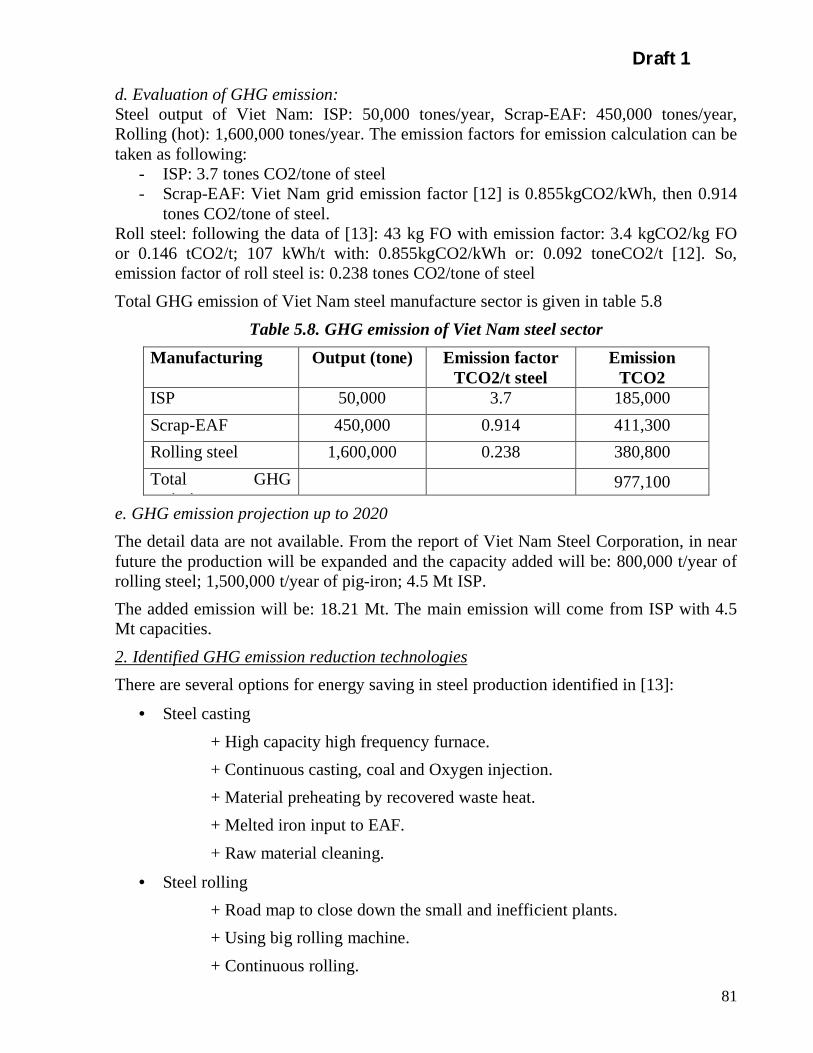
Draft 1
81
d. Evaluation of GHG emission:Steel output of Viet Nam: ISP: 50,000 tones/year, Scrap-EAF: 450,000 tones/year,Rolling (hot): 1,600,000 tones/year. The emission factors for emission calculation can betaken as following:
- ISP: 3.7 tones CO2/tone of steel- Scrap-EAF: Viet Nam grid emission factor [12] is 0.855kgCO2/kWh, then 0.914
tones CO2/tone of steel.Roll steel: following the data of [13]: 43 kg FO with emission factor: 3.4 kgCO2/kg FOor 0.146 tCO2/t; 107 kWh/t with: 0.855kgCO2/kWh or: 0.092 toneCO2/t [12]. So,emission factor of roll steel is: 0.238 tones CO2/tone of steelTotal GHG emission of Viet Nam steel manufacture sector is given in table 5.8
Table 5.8. GHG emission of Viet Nam steel sectorManufacturing Output (tone) Emission factor
TCO2/t steelEmission
TCO2ISP 50,000 3.7 185,000Scrap-EAF 450,000 0.914 411,300Rolling steel 1,600,000 0.238 380,800Total GHGemission
977,100
e. GHG emission projection up to 2020The detail data are not available. From the report of Viet Nam Steel Corporation, in nearfuture the production will be expanded and the capacity added will be: 800,000 t/year ofrolling steel; 1,500,000 t/year of pig-iron; 4.5 Mt ISP.The added emission will be: 18.21 Mt. The main emission will come from ISP with 4.5Mt capacities.2. Identified GHG emission reduction technologiesThere are several options for energy saving in steel production identified in [13]:
• Steel casting+ High capacity high frequency furnace.+ Continuous casting, coal and Oxygen injection.+ Material preheating by recovered waste heat.+ Melted iron input to EAF.+ Raw material cleaning.
• Steel rolling+ Road map to close down the small and inefficient plants.+ Using big rolling machine.+ Continuous rolling.

Draft 1
82
+ Hot rolling and heat recovering.+ Big size pig-iron for rolling (length 12 m).+ Water circulation.+ Using foggy FO.
Some identified above technologies have more detail information. They are listed in thetable 5.9:
Table 5.9. Identification of technology needs
Technology Saving Investment Age1. DC arc furnace use water tocool the furnace wall
5-10% electricity40-50% electrodes
1990
2. High frequency meltingfurnace 12-13% 1MUS$
1000kg/hr1979
3. Drying and humidity controlequipment for refine coke oven
Reduction 1%humidity, saving18,000Kcal/Tcoal
18MUS$3.2MT/year
1983
4. BOF exhaust gas recoverydeviceBOF: Basic Oxygen Furnace
250Mcal/Tsteel 18MUS$250T/hr
1962
5. Raw material preheated forelectric arc furnace
70Mcal/T 8MU$150T/shief
1981
6. Heating furnace withregenerative burners
10-30% 0.25MUS$/pair 1990
7. Ladle heating apparatus withregenerative burners
56% 1.2MUS$ 1990
8. ES operating electric arcfurnace
13% 1980
3. Technologies needs assessmentDue to the lack of detail data the assessment can be made only for some identifiedtechnologies, for that the data are available. Assessment methodology is as follows:- Baseline: BAU: Business As Usual. For emission from electricity consumption, the
emission factor of grid, calculated as ½ OM+½ BM.- GHG emission reduction options:
Refurbishment is applied plants with suggestion of new technology penetrationrate with all existing steel plants of total capacity 1.7 Mt and 100% penetration in2011. (Table 5.10 gives the results of assessment)

Draft 1
83
Table 5.10. Technology assessment
Tech. parameters 05-25accumulated
CO2reduction ofwhole sector,
MtCO2eq.
Reductioncost
USD/tCO2
Technology
E. saving Cost Refurbishment
Refurbishment
1. BOF exhaust gasrecoverydevice.BOF: basicOxygen Furnace
80kWh/t 18 MUSD/200t per hour
0.991 -48.6
2. High frequencymelting furnace
12.5% 1MUSD/1t per hour
1.084 312.7
3. Raw materialpreheated for electricarc furnace
70Mcal/t 8MUSD/150t per batch
0.638 -44.4
4. Drying andhumidity controlequipment for refinecoke oven
306MCal/tcoal
18 MUSD/3Mt/year
0.157 8.6
5.2.3. Construction material sector1. Current condition of existing technologiesa. Production capacity and current technologies: This is one of the most leading industrysectors in term of production capacity. Total production of some construction materialsfrom 1995 to 2002 is shown in table 5.11
Table 5.11. Situation of construction materials production from 1995 to 2002
Product Unit 1995 1999 2001 2002 Growthrate(%/Year)
Glass(non-state) ktone 77.0
(12 .0)105.9(22.2)
114.9(24.5)
116.7(25.1) 6.12
Porcelainsanitation(non-state)
Millionproducts
187.0
(169.0)
219.7
(202.7)
314.1
(287.7)
327.3
(300.0)8.32
Brick(non-state) Million
pieces6,892
(5,769)
7,830.7(5,848.4
)
8,910.5(7,236)
11,009.8(8,366.1) 6.92
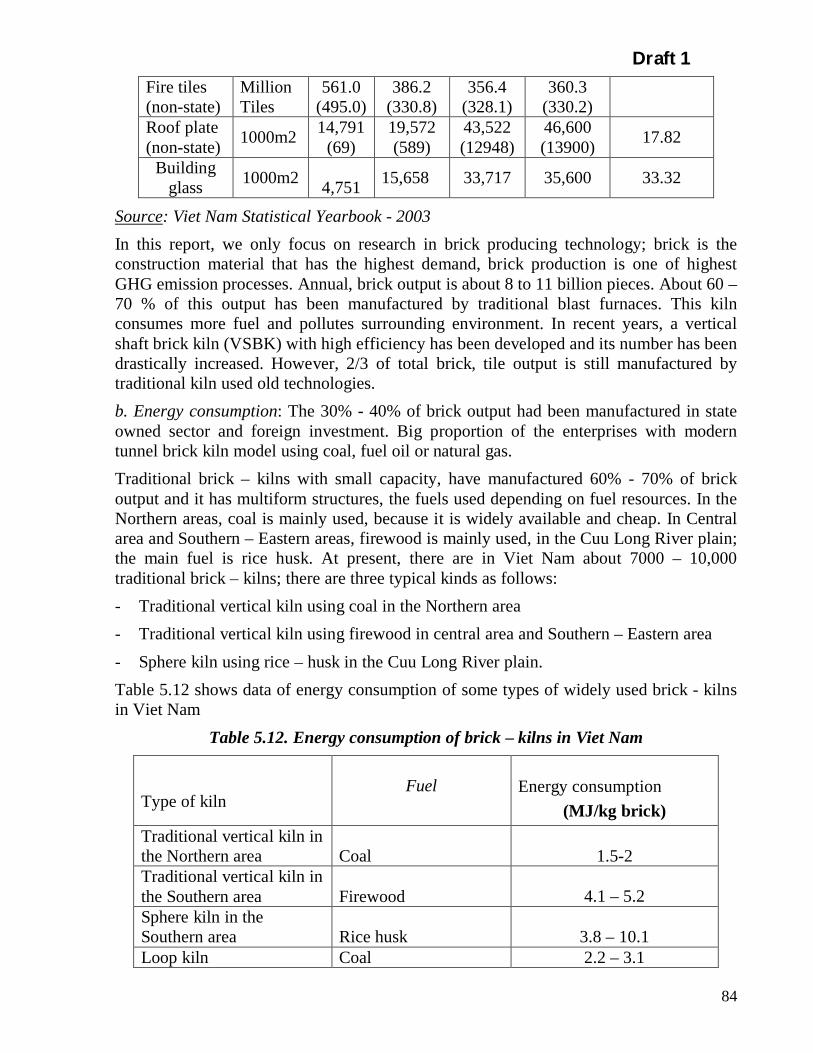
Draft 1
84
Fire tiles(non-state)
MillionTiles
561.0(495.0)
386.2(330.8)
356.4(328.1)
360.3(330.2)
Roof plate(non-state) 1000m2 14,791
(69)19,572(589)
43,522(12948)
46,600(13900) 17.82
Buildingglass 1000m2 4,751 15,658 33,717 35,600 33.32
Source: Viet Nam Statistical Yearbook - 2003In this report, we only focus on research in brick producing technology; brick is theconstruction material that has the highest demand, brick production is one of highestGHG emission processes. Annual, brick output is about 8 to 11 billion pieces. About 60 –70 % of this output has been manufactured by traditional blast furnaces. This kilnconsumes more fuel and pollutes surrounding environment. In recent years, a verticalshaft brick kiln (VSBK) with high efficiency has been developed and its number has beendrastically increased. However, 2/3 of total brick, tile output is still manufactured bytraditional kiln used old technologies.b. Energy consumption: The 30% - 40% of brick output had been manufactured in stateowned sector and foreign investment. Big proportion of the enterprises with moderntunnel brick kiln model using coal, fuel oil or natural gas.Traditional brick – kilns with small capacity, have manufactured 60% - 70% of brickoutput and it has multiform structures, the fuels used depending on fuel resources. In theNorthern areas, coal is mainly used, because it is widely available and cheap. In Centralarea and Southern – Eastern areas, firewood is mainly used, in the Cuu Long River plain;the main fuel is rice husk. At present, there are in Viet Nam about 7000 – 10,000traditional brick – kilns; there are three typical kinds as follows:- Traditional vertical kiln using coal in the Northern area- Traditional vertical kiln using firewood in central area and Southern – Eastern area- Sphere kiln using rice – husk in the Cuu Long River plain.Table 5.12 shows data of energy consumption of some types of widely used brick - kilnsin Viet Nam
Table 5.12. Energy consumption of brick kilns in Viet Nam
Type of kilnFuel Energy consumption
(MJ/kg brick)Traditional vertical kiln inthe Northern area Coal 1.5-2Traditional vertical kiln inthe Southern area Firewood 4.1 – 5.2Sphere kiln in theSouthern area Rice husk 3.8 – 10.1Loop kiln Coal 2.2 – 3.1

Draft 1
85
Tunnel kiln Coal, oil, gas 1.5 – 2.4
Source: Nguyen Xuan Quang and Nguyen Thi Anh Tuyet
Table 5.13. Coal consumption of some types of brick-kilns
Type of kilnFuel consumption
(kg coal /1000bricks)
brick size(Kg/brick)
FuelLHV
(MJ/kg)
Energyconsumption
(MJ/kg)Tradition brickkiln 150 1.85 19.26 1.562
VSBK 85 1.87 19.26 0.876Trieu Duongtunnel brick kiln 160 1.6 22.45 2.245Binh Dinhtunnel brick kiln 120 1.6 22.2 1.665
Source: VIE/00/004 projectGenerally, energy consumption in brick production sector in Viet Nam is largely variable,from 0.876 – 2.245 MJ/kg, it depends on type of kiln and clay used in unbaked brickmanufacture.c. Evaluation of GHG emission: Total volume of gases and CO2 emission from brickproduction in 2 years 1995 and 1997 in Viet Nam is shown in table 5.16
Table 5.14. Volume of GHG emissions from brick production in Viet Nam
Year
Total CO2emission ofenergysector(Millionton)
Brick output(Millionpieces)
TonCO2/millionpieces
CO2emissionfrom brickmanufacture(Million ton)
Share intotalemissionfrom energysector (%)
1995 31.7 6,892 300 2.07 6.51997 45.5 7,262 300 2.18 4.8
Source: VIE/00/004 projectd. GHG emission projection up to 2020: Construction material demand growth rateprojection is given in Table 5.15

Draft 1
86
Table 5.15.The growth rate of some main construction materials in past years
Glass (%/Year)
Civilporcelain(%/year)
Firebrick(%/Year)
Roof plate(%/Year)
Constructionglass (%/year)
6.12 8.32 6.92 17.82 33.32
It is forecasted that the growth rate will be maintained in the future. Followingassumptions are made for emission projection evaluation:
- Technology level in 2010 is the same as 2002 and after 2010 the technology of VSBKwill fully substitute the traditional technology
- Growth rate from this time to 2020 is expected to be about 7.3%Table 5.16. GHG emission from brick production sector in Viet Nam (period 2002-
2020)
Unit 2002 2005 2010* 2015 2020Providebrick
Millionpieces 11,009.80 13,601.24 19,345.38 27,515.40 39,135.82
VolumeCO2emission
Kton 3,302.94 4,080.37 5,803.61 4303.41 6120.84
* Used entire the technology of vertical shaft brick kiln2. Identified GHG emission reduction technologies.Only two technologies currently identified for brick production. They are:
Table 5.17. Kiln types with EE and better fuel combustion
No Technology Saving(1000 VNd)
Investment(million
VNd)
Age
1 Vertical shaft brick kiln 80,200.2 80 2001
2 Dry cellar and tunnel fireone uninterrupted channel 1992
Source: Brief introduction of vertical shaft brick kiln : Nguyen Quang Senh (Viglacera Company)3. Technology assessmentResults compared VSBK with traditional kiln in fuel consumption are shown in table5.18

Draft 1
87
Table 5.18. Fuel consumption of vertical shaft brick and traditional kiln
Parameter VSBK Traditional kiln Fuel savingFuel consumption (kg/brick) 0.085 0.15 0.065
Annual brick output (1000 brick)
3,886 3,886
Firewood volume for per kilnstart 400 200
Disqualified % 8 10
Production cost-VND/brick 138 116
Investment cost-VND/brick 90
Note: kiln operates 330-day/ year, capacity: 11776 brick pieces/daySource: VIE/00/004 projectThe capacity of traditional brick kilns in 2002 is 7,156 million pieces is suggested to bereplaced by VSBK fully in 2013. In this case, the total emission reduction will be 3,852kt CO2eq. With reduction cost about 2.62 USD/tCO2eq?5.3. Identification of barriers and policy needsThe barriers to implementation of GHG emission reduction technologies include thegeneral barriers of advanced technology transfer and specific barriers of GHG reductiontechnologies.5.3.1. Regulatory barriers
• There is a regulation of EE and ES issued as government decree in 2003. It is goodmeasure to enhance the EE&ES activities, hence the GHG emission reduction. But byour observation still the concrete actions are being taken very slowly. Many issuessuch as standards, codes practice, labeled etc. are still being developed but not comeinto force. It is general barrier for EE&ES technology development and for GHGemission reduction technologies development.
• Some important industrial branches are still under strong government regulation, likecement, steel, oil etc. Under regulation not only their product sale price but also theprice of input for them, like coal price, oil price or electric price. Most of enterprisesin these branches are state owned; the leaders are not willing to introduce newtechnologies that will complicate their life, their position that is lasting only limitedperiod.
• Regulatory specific barriers to GHG emission reduction technology transfer is thelack of legal frame work of Climate change and CDM activities. The first governmentlegal document on CDM implementation is still under preparation.

Draft 1
88
5.3.2. Economic system and sectoral structure
• State sector is dominated. As mentioned above, in all important industrial branches,the state owned enterprise is dominated. The leaders are mostly do not care about thebenefits and look at short term strategy corresponding to the term of their position.That is very big barrier. State enterprises are normally under complicated structure,coming from Ministry, corporation, company the factory. Decision making is longprocess and it is every body thing and means no body thing.
• Private sector is being developed very quickly now, but still small sized. They aremore flexible and more active in technology transfer, but they are lack of manpower,capital hence mostly has no vision to long term business.
5.3.3. Low awareness
• People can know some general advanced technologies, but when coming to moredetail such as technology specifications, suppliers, qualities, prices or design etc. it isdifficult to find out the information sources or the trusted consultation. It is in generalsubject and it is worse in climate change and CDM subjects. Low developingconsultative and energy service capacity is serious barrier for technology transfer.
5.3.4. Capital
• Lack of capital is common barrier in all developing countries and especially in VietNam. And the lack of capital and financing system in the new and less
• Understanding activities of climate change and CDM is more evident even only forproject development.
5.3.5 Supplier
• There is difficulty to find out the appropriate domestic supplier of GHG emissionreduction technologies.
5.4. Definition and selection of actionsWe restrict the consideration only in climate change adaptation technology aspect wherethe process can be controlled by Ministry of Natural Resources and Environment.5.4.1. Capacity buildingUnder national projects and international projects there were many workshops, trainingcourses etc. organized for capacity building. During the project implementation a groupof experts also got the chance for education. But till now most the training materials aretoo general, it is high time to come to sectoral specifics aiming to create the core team ofexperts in each main industrial sector. They should and only they can initiate thetechnology transfer process starting from need identification to implementation. There isalso a need to have in each ministries, province and financing institution experts, whounderstand subjects of climate change and CDM.As the basement for development there is a need to create several excellent centers(NGO, private, research).
Draft 1
89
5.4.2. Policy and incentivesClimate change and CDM is new branch of activities and only at beginning stage. Itneeds special policy and incentives for development.
5.4.3. FundingThe new deal faces bigger risk. To manager the risk and to encourage the developmentsome fund should be allocated to support the pioneer.
5.4.4. DemonstrationThe strongest effect of advocacy is the success of real projects. If Viet Nam can have aCDM project registered and CER delivered, every thing will be moved quickly.
5.5. StakeholdersThere are three categories of stakeholders identified: policy makers, implementations andsupporters relevant to GHG emission reduction technology transfer and development.The most important policy makers in these activities are in MONRE, MOI, MOST, MPI,MOF, MOFA, and MARD. At provincial level they are in DOI, DONRE, DOST, DARD.They have triple missions: initiators, supporters and regulators for the projects.The important supporters are the multilateral organizations such as WB, UNDP, UNEP,GEF, ADB, etc. The maximal effective utilizations of their aids with better coordinationwill be a good contribution to the technology development.Community organizations. In Viet Nam they have strong voice in all levels. Sometechnologies cannot be implemented without their support, especially that need wideparticipation.

Draft 1
90
CHAPTER 6THE TECHNOLOGY NEEDS ASSESSMENT FOR TRANSPORT SECTOR
6.1. Overview on options and resources:Recently, the transport infrastructure of Viet Nam consists of over 2000 km of roads,nearly 3.000 km of railways, over 40.000 km of inland-waterways, nearly 100 ports and18 international/domestic airports; this well developed infrastructure is creating basicconditions for the development of the transportation to almost of the areas of the countryand with the world.Volume of passengers and freight transport was following (see table 6.1 - table 6.4):
Table 6.1. Volume of passengers carried by type of transportmill. persons
By type of transportYear Total
Railway Road Inland waterway Aviation transport
1990 376.5 10.4 293.2 72.1 0.5
1995 563.0 8.8 441.7 108.9 2.4
2000 761.7 9.8 621.3 126.5 2.8
2001 805.2 10.6 655.4 133.9 3.9
2002 853.7 10.8 699.3 137.7 4.4
2003 1106.2 11.6 926.2 161.7 4.5
2004 1186.2 12.8 999.7 166.2 5.6
Table 6.2. Volume of passenger s traffic by type of transportmill.persons.km
By type of transportYear Total
Railway Road Inland waterway Aviation transport
1990 15,252.4 1,913.0 11,432.8 1,167.1 457.6
1995 24,504.8 2,133.3 16,526.3 1,699.4 4,094.3

Draft 1
91
2000 33,000.8 3,199.9 23,192.4 2,136.9 4,383.0
2001 36,359.7 3,426.1 24,237.7 2,484.1 6,110.7
2002 39,388.6 3,697.2 26,010.2 2,481.4 7,101.4
2003 43,786.3 4,069.0 29,180.8 3,282.4 7,112.0
2004 48,650.5 4,378.0 31,730.7 3,440.0 8,948.0
Table 6.3. Volume of freight by type of transportthous.tons
By type of transportYear Total
Railway Road Inlandwaterway
Maritimetransport
Aviationtransport
1990 88,414.9 2,341.0 54,640.2 27,071.0 4,358.7 4.0
1995 101,715.5 4,515.0 92,255.5 28,466.9 7,306.9 32.0
2000 206,010.3 6,258.2 141,139.0 43,015.4 15,552.5 45.2
2001 223,310.0 6,456.7 151,483.0 48,488.2 16,815.3 66.8
2002 241,041.8 7,051.9 163,126.4 52,299.7 18,491.8 72.0
2003 261,401.1 8,385.0 175,856.2 55,258.6 21,811.6 89.7
2004 284,929.4 8,829.4 192,562.5 59,071.4 24,363.6 102.5
Table 6.4. Volume of freight traffic by type of transportmill.tons.km
By type of transportYear Total
Railway Road Inlandwaterway
Maritimetransport
Aviationtransport
1990 17,766.2 847.0 2,446.1 2,502.1 11,966.9 4.1
1995 25,328.1 1,750.6 5,137.6 3,015.5 15,335.2 89.2

Draft 1
92
2000 45,469.8 1,955.0 7,888.5 4,267.6 31,244.6 114.1
2001 49,810.2 2,054.4 8,095.4 4,672.4 34,829.8 158.2
2002 56,431.7 2,391.5 8,650.1 4,968.2 40,250.1 171.8
2003 60,992.0 2,725.4 9,402.8 8,140.5 43,512.6 210.7
2004 67,261.9 2,790.8 10,305.5 5,591.8 48,335.9 237.9
In order to meet the annual transportation need the Transportation Sector has consumedapproximately 2.5 - 3.0 millions tons of fossil fuel (gasoline, diesel oil, FO) holdingapproximately 30% of the total amount of fossil fuel imported, in which road transportsector combusted about 60% among the transport sector. So, emission of GHG by theroad transport activity is the highest in the transport sector in Viet Nam.6.2. Selection of key technologies:Taking into account the characteristic of transport sector in Viet Nam, we shouldconcentrate on the road transport in order to reduce the GHG emitted by transportactivities. The main technologies for GHG emission reduction in road transport activitiesinclude:
6.2.1. Developing the public transport system (bus), limiting the number of moto-scooter/motorcycle in the cities of Viet NamAt present in the cities of Viet Nam, the public transport system (bus, taxi) only meets 8-9% of moving needs of people, and the main transport means are motor-scooter/motorcycle (55 - 60%), the other means (walking, bicycle, car) occupyapproximately 30 - 35%. The public transport system can save fuel and reduce GHGemission because the unit of fuel consumption for bus (calculating according topassenger.km) is lower in comparison with car and motorcycle. The strategy target ofUrban Transport Development in Viet Nam in the stage from now to 2020 is:
- To 2010: The bus meets 30% of the need
- To 2020: The bus meets 40 ÷ 45% of the need
6.2.2. Constructing and operating the public railway system in Viet NamAt present the railway network in Viet Nam includes 07 main lines that have the lengthnearly 3.000 km with 3 types of the rails: 1.000mm, 1.435 mm and the double rails; thereisn’t electrification railway yet. In general, the transport of passenger by railway onlyholds approximately 1, 5% of the passenger volume and about 13% of the passengervolume traffic in comparison with the road transport. Now, there isn’t yet urban publicrailway system. The development of public railway in the big cities is the importantsolution to reduce GHG emission in the transport sector. The main reasons are as follows:- The capacity of passenger transport by railway is bigger in comparison with road
transport.

Draft 1
93
- The unit of fuel consumption (DO) of for rolling-stock is less in comparison with roadtransport.
According to the transport development plan of Viet Nam to 2010 and oriented to 2020the structure of urban transport of passenger is as follow:- In 2010: The bus (30%); The urban railway (0%); The other means (70%)
- In 2020: The bus (40 ÷ 45%); The urban railway (25%); The other means (30 - 35%)To 2020 if the transport of passenger by urban railway met 25% of need the fuel using forthe public transport of passenger would decrease very much and, obviously, the amountof greenhouse gas emission would decrease in the transport sector. In the case of theelectric railway transport, there will none greenhouse gas emitted.
6.2.3. Using LPG for the transport means in Viet NamAccording to the statistics up to 30 April 2005 in Viet Nam, there are approximately549.000 cars and more than 13 millions of motorbike. The road transport means in VietNam mainly use conventional fossil fuel such as gasoline and diesel oil. Recently, LPGfuel has just applied experimentally in some taxi companies in Hanoi, Ho Chi Minh andVung Tau cities. The switching from gasoline/diesel oil to LPG is able to carry out in thefollowing ways:- Bi-fuel: The means can use conventional fossil fuel or LPG- Dual- fuel: The means can use conventional fossil fuel and LPG at the same time.- Dedicated: The means are converted to use LPG only and can not use conventional
fossil fuel.Among solutions of using the cleaner fuel for road transport means, the use of LPG is amost effective solution for GHG emission reduction in road transport.For switching from the conventional fossil fuel (gasoline, diesel oil) to LPG for transportmeans in Viet Nam, the plan for the technology application should be developed infollowing directions:- Establishing the legal framework to develop the LPG supply network for the transport
means including:+ The standards for designing and installing the LPG supply station for the transport
means.+ The standards for designing and installing the fuel converter for the transport
means presently using the conventional fossil fuel.+ Designing, manufacturing and installing the fuel converter for cars.
- Establishing the network of the installation and maintenance stations for the fuelconverters and the LPG supply stations.
- Training the staff for installing and maintaining the fuel converter on the transportmeans.
Draft 1
94
- Advocating advantages of LPG uses.- Setting up incentive measures for LPG uses.6.2.4. Implementing the road map of exhaust gases standards for road transport meansThe decision on implementation road map of exhaust gases standards in road transportwas issued by Prime minister in October 2005. It aims to reduce air pollution by roadtransport means. The targeted pollution limit is defined following the EU limit (Euro 2).This road map will be completely implemented in 2008.
6.3. Identification of barriers and policy needs
• High investment capital of the urban public railway transport system.
• Prevalent habit of using the private transport means.
• Incompletion of urban public transport system.
• Lack of LPG supply stations network for transport means.
• Lack of center for exhaust gases control.6.4. Definition and selection of actions6.4.1. Railway transport development
- Raising the rate of passenger and passenger.km from railway transport.- Developing high speed train over 120km/h.
6.4.2. Transport development in big cities- Improving the transport infrastructure in the big cities.- Ensuring 25% of urban land for transport infrastructure.- Limiting growth rate of motorbike under 10% per year.
6.4.3. Cleaner fuel transport means development- Setting up appropriate policies on the land, tax, investment.- Encouraging the use of the transport means using cleaner fuel (such as LPG).

Draft 1
95
CHAPTER 7.THE TECHNOLOGY NEEDS ASSESSMENT FOR FORESTRY SECTOR
7.1. Overview on options and resourcesOver 60% of Viet Nam's land area, some 16 million ha, is classified as forestland, andmost of the forests are located mainly in the mountain zone. They have the mostimportant erosion preventing, soil protecting and water- regulating functions and are asource of industrial raw materials and food products.Forestland in Viet Nam is divided into three categories for administrative purposes:production forests, protection forests and special use forests.7.1.1. Changing forest areasDeforestation has been widespread for several decades, and remains a serious problem.
Table 7.1. Changes in forest cover between1943 to 20031,000 ha
YearTypes 1943 1976 1980 1985 1990 1995 1999 2002 2003
Natural forest 14.000 11.077 10,486 9,308 8,430 8,252 9,444 9,865 10,004
Plantation forest 0 92 422 584 745 1,050 1,471 1,919 2,090
Forest cover 43.0 33.8 32.1 30.0 27.2 28.1 33.2 35.8 36.1
Source: National 5 million hectare reforestation program 1998-2010, Hanoi 2001
- Between 1943 -1990 there was a steady and rather rapid decline in natural forestcoverage. Although the area of plantations increased, it was too small tocompensate for the decline in natural forests.
- Since 1990, the loss of natural forest has been much slower, only 36,000ha peryear on average during the period 1990-1995. At the same time the area ofplantations increased rapidly.
- Between 1995 to now, the areas of both natural forest and plantations increasedrather rapidly.
Wood biomass reduction and worsening land status resulted in a reduction of air carbonaccumulation by trees, shrubs, and soils, and an increase of soil carbon emission due toland erosion and degradation.
7.1.2 Forest development strategyThe aims of Forest development strategy to 2010: Forest lands: 16 Mha, (48,3%), fromwhich is Protection forests: 6,0 Mha, (18,2 %); Special use forests: 2,0 Mil ha, (6,1%); Production forests: 8,0 Mha, (24,3 %).The regreening of barren land for watershed protection and effective conservation ofecosystems biodiversity and environment condition

Draft 1
96
Returning barren lands to efficient productions in order to alleviate poverty and promotesustainable development, especially in mountainous rural areas forestland.7.1.3 1998 GHG inventory in forestry and land use change sector
CO2 absorption by biomass growthCO2 absorption by biomass growthCH4, N2O Emissions (estimated in CO2 equivalent)CO2 absorption by natural regenerationCO2 emission from soil
- 43,47 Tg+ 44,69 Tg+ 3,49 Tg-12,04 Tg-17,73 Tg
Total + 10,40 Tg
Compared with 1994 Greenhouse Gas statistics, the amount of CO2 emission in 1998about 9 tones of CO2.7.2. Selection of key technologies.7.2.1. The identification of Technology needs assessment for forestry and land usechange sector:
- The Identify that the Forests aremajor carbon dioxide storagefacilities.
- The goal is to increase forestryproductivity,
- The Objectives of reducing GHGemission can be met withoutcompromising the goal of " Nationalfive million hectare reforestationprogramme (1998-2010)"
The technologies needs for reducing GHGemission in forestry and land use changesector:7.2.2. Forest protection immediate tasks are to strictly protect 12.094,518 hectares offorests, includes 10,004,709 hectares of natural forest and 2,089,809 hectares ofplantation. The forest protection work requires not only forestry technology solutions butalso economic and social regulations. The forest protection work is annually entrusted tothe units and households.7.2.3. Afforestation : The targets of afforestation up to the year 2010 are:
- Protection forest and special use forest: 2 million hectares- Productive forest: 3 million hectares.
New plantation in Ha Tay province

Draft 1
97
At present, thanks to hybridation of Acacia, Eucalyptus, the productivity of afforestationcan reach 20m3/ ha per year. Here are the results of some models types:
- Eucalyptus uro by intensive methods at the age of 7 - 8 reach 16m3/ ha/ perannum.
- Eucalyptus caiman grown by seeds, intensive methods, at the age of 8 - 9 canreach 16m3/ ha/ per annum.
Acacia mangium grown by seeds at the age of 8 can reach 17 - 18 m3/ ha, per annum andcan reach 20 - 25m3/ ha/ per annum thanks to intensive planting.The whole country had more than 6,771 million hectares of bare ground without forestsincluding grassland, bushes, regeneration plants, rocks denuded of forests, which needsafforestation. Additionally, should recover the forest on 2 million hectares of barrenforestland.7.2.4. Natural forest recovery technologyRecovered natural forests bring much value in the fields of stable forest ecology,biological diversity, protection function, forest fire and insect prevention and fight. Theserecovered natural forests are considerably than the newly planted forests.In order to accelerate the speed and to boost the quality of naturally recovered forestsmay put into effect the sylvicultural technological option solution of forest enrichment.7.2.5. Planting scattered treesPlanting annually about 250 - 300 million trees all over the country, equal to 100,000hectares.7.2.6. Forest fire prevention and fight technologyIn Viet Nam, there are about 5 million hectares of flammable forests comprising pinforests, cajuput forests, eucalyptus forests, bamboo forests, and dipterocarpus forests.Forest fires left lots of fatal consequences on environment. Forest fires quickly consumednatural resources, destroyed tragically animal habitats, worsened and reduced foreststability, broke and destroyed the ecological balance.Some general solutions to forest fire prevention and fight- To boost awareness among the people, to make propaganda to the community of local
inhabitants about the importance of forest fires prevention and fight handle.- To establish the network of forest fire warning units on the basis of well informed
documents supplied by hydro meteorological, weather forecast stations at all levelsfrom the center to localities.
- To develop the system of telecommunication which is very useful and essential toforest fire forecast warning, to devise a scheme for fighting and preventing forest firesin a successful way.
- To carry out the silvicultural technological steps to reduce flammable materials.

Draft 1
98
- To erect and put up fire hindrance barriers, channels, canals, water reservoirs, guardtowers with the functions of protecting the forests.
- To be equipped with modern machines run by the state.Principal technology groups of solutions aiming at lessening GHG on forest sector are:Existing Forest protection, afforestation7.3. Identification of barriers and policy needsA lack of science research establishments
• A lack of local employees with high level to implement several projects.
• The obstacles in potential and finance
• The forestry projects with a long period of business rotation cycle of 30 - 40 yearsare not yet attractive for investors
7.4. Definition and selection of actionsTo speed up forest plantation, regreen bare land, protect existing forests as well as newforests; increase the protective function of the forests and protect the environment andbiodiversity; create favorable conditions for sustainable national development; andincrease the forest cover to 40% of the national territory.To prevent deforestation, to promote forest protection and care, to annihilate harmfulinsects, to carry out afforestation (on degraded and barren forest land) and to promotenatural forest regeneration, the programmers of planting in the urban and rural areas- To raise the efficiency of forest harvest, timber processing and the use of wood. To
raise the efficiency of the use of forest products.- To enhance and to raise the productivity of trees aiming at decreasing the mount of
agricultural production land.Classification of Land and Forests in the field to identify the forest land and classify itinto the three categories (special-use, protection and production)Research and application of advanced technologies for forest development:- Search for, test and apply advanced techniques for forest rehabilitation through
assisted natural regeneration.- Study suitable planting techniques, apply intensive techniques in planting,- Study the suitability of different tree species, the issue of seed quality- Supply of seeds and seedlings and forest extension services7.6. StakeholdersAt national level: Ministry of Agriculture and Rural Development (MARD); Departmentof Agriculture and Rural Development (DOA); Forest Inventory and Planning Institute(FIPI); Forest Science Institute of Viet Nam (FSIV); and others.

Draft 1
99
At international level: Food and Agriculture Organization of the United Nations (FAO);United Nation Development Program (UNDP); Netherlands Development Organization(SNV); and others.

Draft 1
100
CHAPTER 8THE TECHNOLOGY NEEDS ASSESSMENT FOR AGRICULTURAL SECTOR
8.1. Overview on options and resourcesThe 9th National Congress of the Communist Party of Viet Nam has set up the directionof agricultural development in Viet Nam.The goals of agricultural sector are:- To satisfy the basic material, spiritual and cultural needs of all the people of Viet
Nam, both present and future generation, through the wise management of naturalresources;
- To develop all high valuable tree kinds via the intensive cultivation, new plantation inorder to respond to the requirement of raw materials for processing industry.
- To form the regions of concentrated breeding, the firms of processing food-stuffs withseveral shape/scale types.
Strategic objectives are:- To build diversified, commodity agriculture, develop in sustainable way, speedily
access and effectively apply new scientific and technological achievements, hightechnology, and increase competitiveness in domestic and international markets.
- To build new rural areas with developed infrastructure, modern direction andrational economic structure: agriculture – industry - developing services.
- To ensure employment, poverty eradication, a civilized, democratic and equitablerural society, and wealthy life.
Immediate objectives are:- Growth rate of agricultural production: 4 - 4,5% per year- Growth rate of industry, services in rural areas: 10-12% per year- Food production: 40 millions ton per year- Export turnover: US$ 9-10 billion by the year of 2010 in which agricultural – forestry
productions occupies US$ 6-7 billion.- Effective exploit and use of wasteland and bare hill.- Development of industry and service in rural areas and rural agriculture economy
structure continues to shift following direction in which more than 50% ofagricultural rural labor force transfers to industry and services; 100% of communeshas primary schools, secondary schools, and health centers, and to makecompulsory to everyone at primary and secondary education in some importantregions; basically eradicate all serious venereal diseases and almost all householdscould access to electricity and clean water.
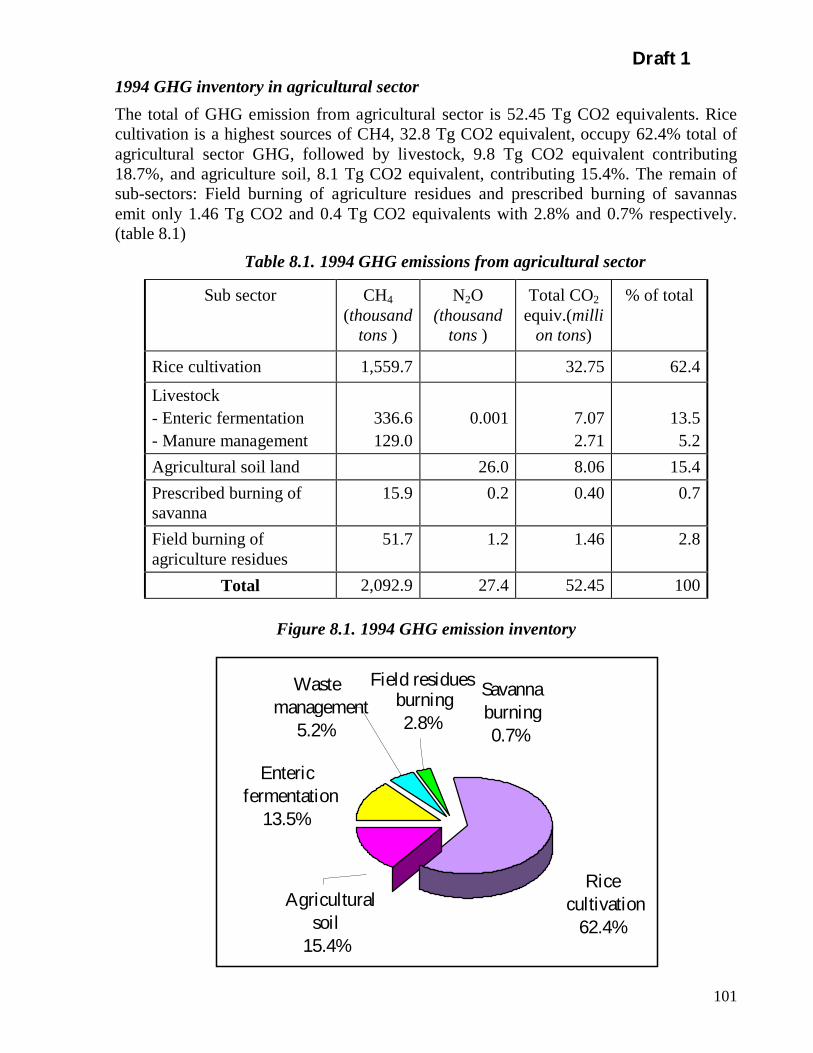
Draft 1
101
1994 GHG inventory in agricultural sectorThe total of GHG emission from agricultural sector is 52.45 Tg CO2 equivalents. Ricecultivation is a highest sources of CH4, 32.8 Tg CO2 equivalent, occupy 62.4% total ofagricultural sector GHG, followed by livestock, 9.8 Tg CO2 equivalent contributing18.7%, and agriculture soil, 8.1 Tg CO2 equivalent, contributing 15.4%. The remain ofsub-sectors: Field burning of agriculture residues and prescribed burning of savannasemit only 1.46 Tg CO2 and 0.4 Tg CO2 equivalents with 2.8% and 0.7% respectively.(table 8.1)
Table 8.1. 1994 GHG emissions from agricultural sector
Sub sector CH4(thousand
tons )
N2O(thousand
tons )
Total CO2equiv.(milli
on tons)
% of total
Rice cultivation 1,559.7 32.75 62.4
Livestock- Enteric fermentation- Manure management
336.6129.0
0.001 7.072.71
13.55.2
Agricultural soil land 26.0 8.06 15.4Prescribed burning ofsavanna
15.9 0.2 0.40 0.7
Field burning ofagriculture residues
51.7 1.2 1.46 2.8
Total 2,092.9 27.4 52.45 100
Figure 8.1. 1994 GHG emission inventory
Ricecultivation
62.4%
Agriculturalsoil
15.4%
Entericfermentation
13.5%
Wastemanagement
5.2%
Field residuesburning2.8%
burningSavanna
0.7%
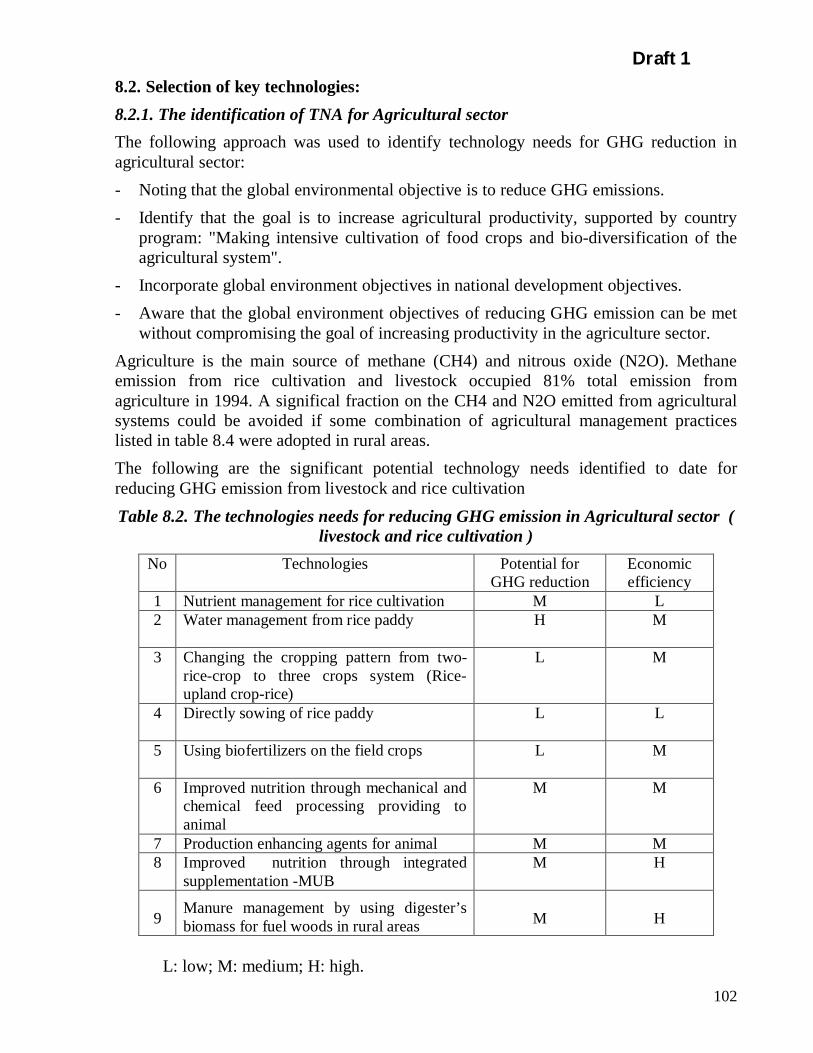
Draft 1
102
8.2. Selection of key technologies:8.2.1. The identification of TNA for Agricultural sectorThe following approach was used to identify technology needs for GHG reduction inagricultural sector:- Noting that the global environmental objective is to reduce GHG emissions.- Identify that the goal is to increase agricultural productivity, supported by country
program: "Making intensive cultivation of food crops and bio-diversification of theagricultural system".
- Incorporate global environment objectives in national development objectives.- Aware that the global environment objectives of reducing GHG emission can be met
without compromising the goal of increasing productivity in the agriculture sector.Agriculture is the main source of methane (CH4) and nitrous oxide (N2O). Methaneemission from rice cultivation and livestock occupied 81% total emission fromagriculture in 1994. A significal fraction on the CH4 and N2O emitted from agriculturalsystems could be avoided if some combination of agricultural management practiceslisted in table 8.4 were adopted in rural areas.The following are the significant potential technology needs identified to date forreducing GHG emission from livestock and rice cultivationTable 8.2. The technologies needs for reducing GHG emission in Agricultural sector (
livestock and rice cultivation )No Technologies Potential for
GHG reductionEconomicefficiency
1 Nutrient management for rice cultivation M L2 Water management from rice paddy H M
3 Changing the cropping pattern from two-rice-crop to three crops system (Rice-upland crop-rice)
L M
4 Directly sowing of rice paddy L L
5 Using biofertilizers on the field crops L M
6 Improved nutrition through mechanical andchemical feed processing providing toanimal
M M
7 Production enhancing agents for animal M M8 Improved nutrition through integrated
supplementation -MUBM H
9Manure management by using digester’sbiomass for fuel woods in rural areas M H
L: low; M: medium; H: high.
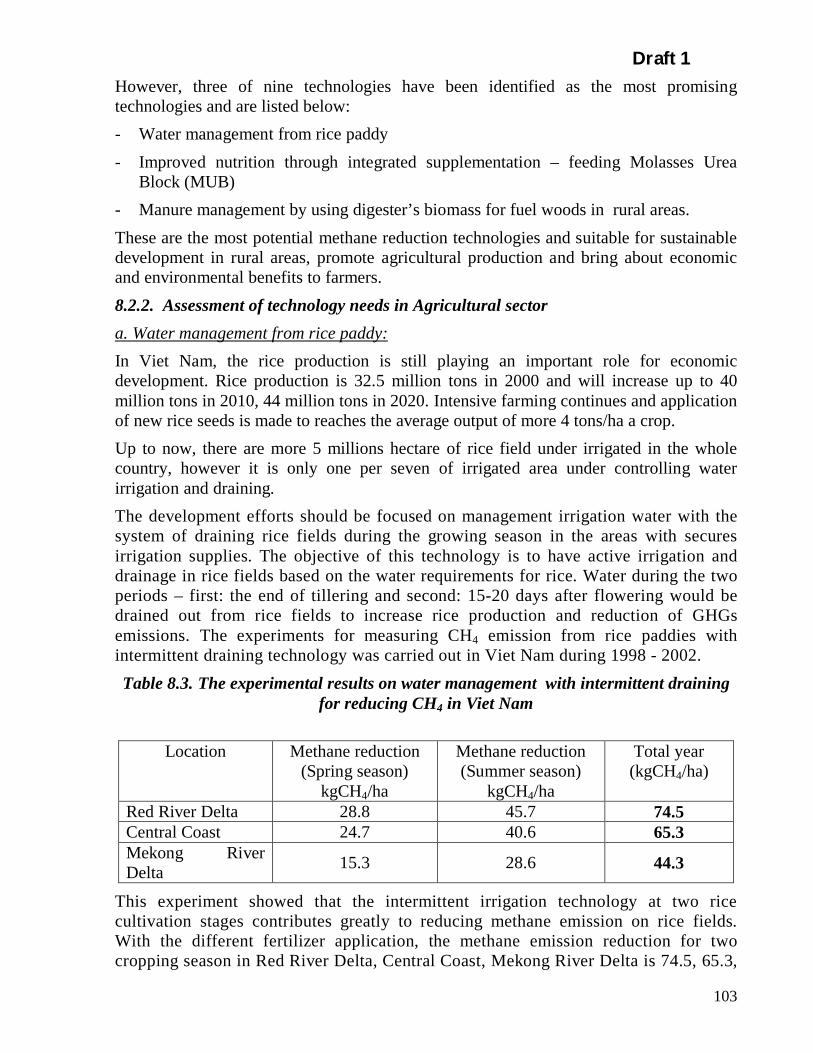
Draft 1
103
However, three of nine technologies have been identified as the most promisingtechnologies and are listed below:- Water management from rice paddy- Improved nutrition through integrated supplementation – feeding Molasses Urea
Block (MUB)- Manure management by using digester’s biomass for fuel woods in rural areas.These are the most potential methane reduction technologies and suitable for sustainabledevelopment in rural areas, promote agricultural production and bring about economicand environmental benefits to farmers.8.2.2. Assessment of technology needs in Agricultural sectora. Water management from rice paddy:In Viet Nam, the rice production is still playing an important role for economicdevelopment. Rice production is 32.5 million tons in 2000 and will increase up to 40million tons in 2010, 44 million tons in 2020. Intensive farming continues and applicationof new rice seeds is made to reaches the average output of more 4 tons/ha a crop.Up to now, there are more 5 millions hectare of rice field under irrigated in the wholecountry, however it is only one per seven of irrigated area under controlling waterirrigation and draining.The development efforts should be focused on management irrigation water with thesystem of draining rice fields during the growing season in the areas with securesirrigation supplies. The objective of this technology is to have active irrigation anddrainage in rice fields based on the water requirements for rice. Water during the twoperiods – first: the end of tillering and second: 15-20 days after flowering would bedrained out from rice fields to increase rice production and reduction of GHGsemissions. The experiments for measuring CH4 emission from rice paddies withintermittent draining technology was carried out in Viet Nam during 1998 - 2002.Table 8.3. The experimental results on water management with intermittent draining
for reducing CH4 in Viet Nam
Location Methane reduction(Spring season)
kgCH4/ha
Methane reduction(Summer season)
kgCH4/ha
Total year(kgCH4/ha)
Red River Delta 28.8 45.7 74.5Central Coast 24.7 40.6 65.3Mekong RiverDelta 15.3 28.6 44.3
This experiment showed that the intermittent irrigation technology at two ricecultivation stages contributes greatly to reducing methane emission on rice fields.With the different fertilizer application, the methane emission reduction for twocropping season in Red River Delta, Central Coast, Mekong River Delta is 74.5, 65.3,

Draft 1
104
44.3 kg CH4 per ha/ year respectively. This reduction is equivalent to 8-11% methaneemission of rice fields compared to continuously irrigate.It is estimated that the rice areas with water management would be 5 million hectareby 2020 including 1.1 Mha in Red River Delta, 0.6 Mha in Central Coast and 3.3 Mhain Mekong River delta under this technology.The total amount of CH4 reduction is expected of 149,938 t CH4/ year, or 3 Mt CO2equivalent/year.b. Improved nutrition through integrated supplementation - feeding Molasses Urea Block(MUB).The objective of this technology is to increase quantity and quality of the processed foodfor ruminant animals and proportion of micro-matters for higher meat and milkproduction, meanwhile, to reduce GHGs emission.Manipulation of methanogenesis in the rumen is also possible through MUB feedingwhere poor quality roughage is used. Research in India and Bangladesh demonstratedthat milk production in cows was doubled when MUB were given with straw based diets(Islam and Begum, 1997) which could be seen as an indicative of reduced methaneemission. Strategic supplementation with MUB could promote efficient fermentationdigestion and thereby decrease methane generation per unit digestive feed by 30 % to50% of digestible energy.In Viet Nam, studies concerning feeding supplement of MUB were carried out with theresults that supplementation of MUB tends to increase ruminant gained weight by 10-18%, milk production by 13 – 15%. This technology is cost efficient, as the principleingredients of MUB were locally available at low prices such as molasses, lime, cement,mineral, and groundnut pond....With MUB provision, ruminant feeding time will be reduced. Estimated time will be 3months shorter in comparison with without MUB. In this case, methane emissionreduction by providing MUB is estimated about 11 kg CH4/ head/year. It is expected toprovide MUB for 3.6 M head of buffalo and 5.8 M head of cattle in 2010. The GHGreduction potential by this technology is 103.6 Gg CH4/01 year, or 2.17 M ton CO2equivalent/ 01 year.c. Manure treatment by using digesters in rural areas.The objective of this technology is to use biogas (formed from decomposition ofanimal waste/manure) as an alternative cooking and heating fuel for households inrural areas. It reduces the expenditure for firewood in rural areas and improvesenvironmental sanitation.Digesters are designed to enhance the anaerobic decomposition of organic matters andto optimize methane production and recovery. Small-scale digesters typically requirea small amount of manure and are relatively simple to build and to operate. Therefore,they are an appropriate strategy for small - medium farms. These digesters are alsosuitable for countries with limited technical and financial resources such as Viet Nam.So that the number of installed digesters has been increased from 10.000 digesters in

Draft 1
105
2000 to 80.000 digesters in 2004.It is expected that biogas digesters will be largely installed in rural areas of Viet Namwith a number of 300,000 plants by 2010 and reaching 500,000 plants by 2020. TheGHG reduction potential is 14 Gg CH4/ year or 294 Gg CO2/year equivalents.8.3. Identification of barriers and policy needs8.3.1 Water management from rice paddy- The incompletion of irrigation system, especially draining system causes
difficulties for implementing this technology.- The farmer rice cultivation tradition is to keep water in the field.- The irrigation canal and ditch system has not been strongly built.
8.3.2 Improved nutrition through integrated supplementation - feeding MUB.- The feeding habits are still free grazing. There is lack of care about intensive
farming in many areas of the country.- The size of cattle and buffalo group is not large enough for this technology
application.- Storage for MUB is needed, however there is lack of storehouses.8.3.3 Manure treatment by using digesters- The farmer's investment capital is very limited.- Viet Nam animal husbandry is still dispersed widely.- Digester design appropriate for different regions is on going development.
8.4 Definition and selection of actionsThe suggested actions in agriculture sector can be described as below:- Studying and developing new agricultural farming techniques with a view of
increasing agricultural production as well as mitigating GHG emission.- Improving irrigation-drainage management system in rice fields.- Strengthening capacities of agriculture research institutions.- Improving agricultural data banks and processing facilities to serve specialized
research in agriculture and climate change.
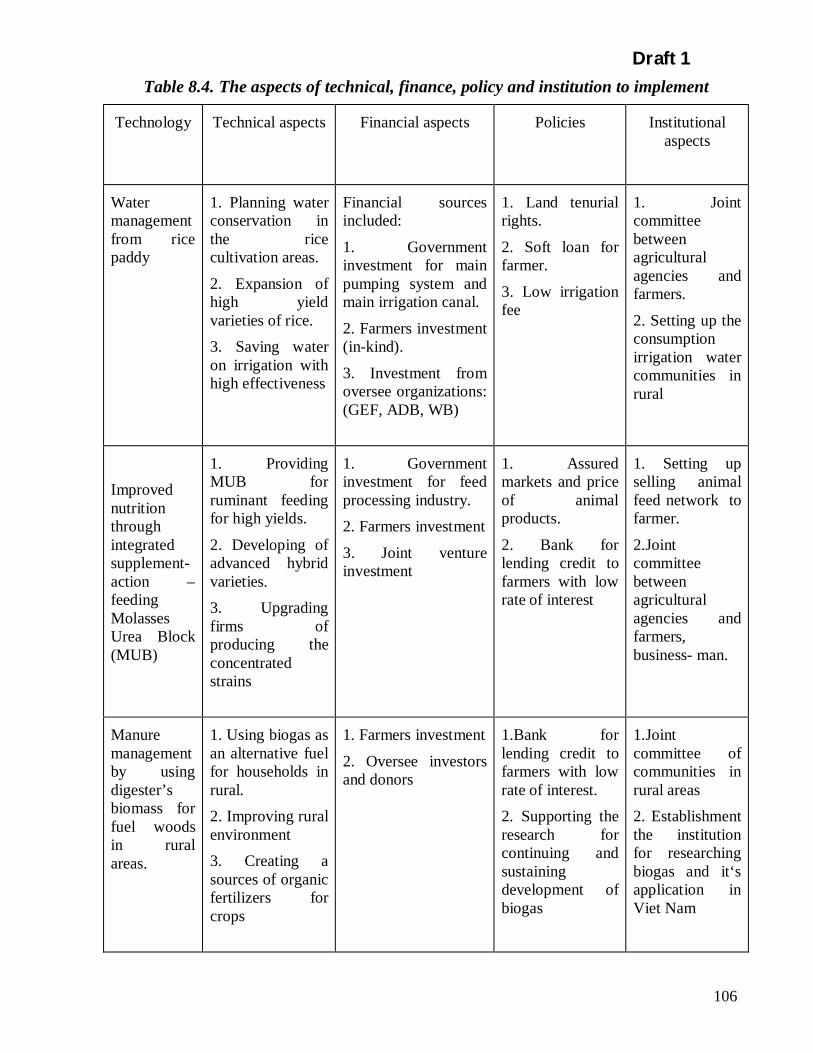
Draft 1
106
Table 8.4. The aspects of technical, finance, policy and institution to implement
Technology Technical aspects Financial aspects Policies Institutionalaspects
Watermanagementfrom ricepaddy
1. Planning waterconservation inthe ricecultivation areas.
2. Expansion ofhigh yieldvarieties of rice.3. Saving wateron irrigation withhigh effectiveness
Financial sourcesincluded:
1. Governmentinvestment for mainpumping system andmain irrigation canal.
2. Farmers investment(in-kind).
3. Investment fromoversee organizations:(GEF, ADB, WB)
1. Land tenurialrights.
2. Soft loan forfarmer.
3. Low irrigationfee
1. Jointcommitteebetweenagriculturalagencies andfarmers.
2. Setting up theconsumptionirrigation watercommunities inrural
Improvednutritionthroughintegratedsupplement-action –feedingMolassesUrea Block(MUB)
1. ProvidingMUB forruminant feedingfor high yields.
2. Developing ofadvanced hybridvarieties.3. Upgradingfirms ofproducing theconcentratedstrains
1. Governmentinvestment for feedprocessing industry.2. Farmers investment
3. Joint ventureinvestment
1. Assuredmarkets and priceof animalproducts.
2. Bank forlending credit tofarmers with lowrate of interest
1. Setting upselling animalfeed network tofarmer.
2.Jointcommitteebetweenagriculturalagencies andfarmers,business- man.
Manuremanagementby usingdigester’sbiomass forfuel woodsin ruralareas.
1. Using biogas asan alternative fuelfor households inrural.2. Improving ruralenvironment3. Creating asources of organicfertilizers forcrops
1. Farmers investment
2. Oversee investorsand donors
1.Bank forlending credit tofarmers with lowrate of interest.2. Supporting theresearch forcontinuing andsustainingdevelopment ofbiogas
1.Jointcommittee ofcommunities inrural areas2. Establishmentthe institutionfor researchingbiogas and it‘sapplication inViet Nam

Draft 1
107
Table 8.4 presented the aspects of technical, finance, policy and institutions to implementabove-mentioned technologies in Viet Nam. These aspects are also made importantcontributions to reducing GHG in agricultural sector.
8.5 Stakeholders:At national level: Ministry of Agriculture and Rural Development ( MARD);Departments of Agriculture and Rural Development in Provinces/Cities ( DARD);Institute of Agricultural Science and Technology ( IASC); Institute of Soil Science(IOSS); Institute of Agricultural Economies; National Institute of Agricultural Planningand Projection.(NIAPP); Department of Water Resources Management, MONRE; VietNam Union of Science and Technology Association (VUSTA) and others.At international level: United Nation Development Program (UNDP); Food andFoodstuff Agriculture Organization (FAO); Netherlands Development Organization(SNV); and others.

Draft 1
108
PART II:TECHNOLOGY NEEDS ASSESSMENT FOR ADAPTATION TO CLIMATE
CHANGESIntroductionThe TNA for adaptation to climate change is a continuation of the work performed underthe Viet Nam’s First National Communication and inventory. Unlike the Viet Nam’sFirst National Communication and Inventory the TNA for adaptation is focused on VietNam’s agriculture, water resources and coastal area rather than on its overall territory.Why Viet Nam s costal area?Viet Nam’s agriculture, water resources and coastal area is the most important part of thecountry from the economic and human activity viewpoint. It generates a large number ofservices and goods that are valuable to the country. It has attracted many people andinvestors, especially for the tourism development opportunities.The vulnerability analysis under Viet Nam’s First National Communication andInventory has shown this area as of high vulnerability to current climate. Expectedchanges in temperature and precipitation patterns as well as the expected increase in sealevel are likely to impact significantly in this area. This is the main reason that thevulnerability and adaptation team has decided to narrow the focus of assessment to thisarea.IPCC Methodological and Technological Issues in Technology Transfer, 2000The coastal adaptation technology to climate change must be seen as part of broadercoastal-management policy, which includes consideration of numerous non-climaticissues. It typically follows a continuous and iterative cycle involving four main steps:
- Information development and awareness raising;- Planning and design;- Implementation and- Monitoring and evaluation.
To date, technology transfer for coastal adaptation has focused primary on theimplementation stage: the actual hardware that can be employed to protect, retreat andaccommodate. Coastal adaptation should also aim at increasing the extend to whichmechanisms are in place and technologies, expertise and other resources are available toassist.

Draft 1
109
CHAPTER 9IDENTIFICATION AND ASSESSMENT OF ADAPTATION TECHNOLOGIESNEEDS ON AGRICULTURE, WATER RESOURCES AND COASTAL ZONE
MANAGEMENT9.1. Overview on options and resourcesThe term adaptation means any adjustment, whether passive, reactive or anticipatory, thatis proposed as a means for ameliorating the anticipated adverse consequences associatedwith climate change ( Stakhiv,1993) [10]
The Intergovernmental Panel on Climate Change (IPCC) is aware that taking measureson reducing GHG emissions only is not enough to prevent the dangerous human impacton the climate change. Work on adaptation is of great importance for sustainabledevelopment, rational natural resources management and human health protection.The V&A assessment within “Viet Nam - Initial National Communication under theUNFCCC” document showed that the agriculture, water resources and coastal zonemanagement sectors are defined as the most vulnerable sectors influenced by climatechange. So that appropriate adaptation measures and technologies could reduce orprevent unfavorable consequences of climate change, providing a general preparednessfor climate change and a contribution to sustainable development.The major factors of adaptation technology needs assessments are as bellows- Adaptation can considerably reduce the climate change unfavorable impacts in the
long and mid-term prospects.- Increasing the adaptation potential is urgent to decrease vulnerability of the poor in
rural regions, of too sensitive natural resources and national economy sectors.- Measures and technologies can considerably reduce damages and expenditures.- The adaptation potential is very different in different regions and socio-economic
groups; however it is poor regions and poor groups that are most vulnerable, havinggreat difficulties in the process of adaptation to climate change.
9.2 Selection of key technologies in agricultural sector9.2.1 BackgroundThe vulnerability assessment showed that a considerable dependence of the agriculturalproduction on climate conditions and their variability. Every year, the unfavorableweather conditions and phenomena such as storms, flood, inundation, drought, and saltwater intrusion ....cause considerable damage to the agricultural sector of the country.In August 1996, large floods occurred on the Red River, 120 km of dykes was eroded byflooding combination with high tides. In November 1997, typhoon Linda struck thecoastal area of Southern Viet Nam, thousands of fishermen’s were killed and thousandsof fishing ships and boats were damaged or sunk . In November 1999, two extremelyheavy rain storms inundated a large area of central Viet Nam. Massive losses resulted.

Draft 1
110
With the change of climate conditions, the flood, drought, heavy rain, typhoon, salt waterintrusion... will occur more frequently that could seriously affect agricultural production.The damages could be even worse in the future if appropriate protective measures are notundertaken.9.2.2 The Key adaptation technologies in agricultural sectora. Cultivation sub-sector:
- Increasing irrigation water use efficiency: Increasing irrigation efficiency byshifting from the low performing, surface and overhead systems, to highperformance ones like the centre pivot and drip. On the other hand, reducingwater consumption by adopting drought tolerant cultivars.
- Developing crop patterns suitable to climate change: Cropping seasons andcropping structure should be rearranged to take advantage of favorableconditions and avoid hazardous ones.
- Improving irrigation system: Gradually improving the existing irrigation anddrainage pumping station network in the Red River Delta, Central Coast zonesand constructing multipurpose reservoirs to increase low flows in dry season.
- Developing new species and varieties adapted to climate change: Selectingheat, drought and pest resistance crop varieties for improvement of crops yieldand quality under climate change condition, it would be beneficial for cropadaptation..
- Creating and introducing local crop varieties, resistant to unfavorable climateconditions; establishing crop seed bank by setting up national research centerfor new species and varieties.
- Developing farming techniques appropriates to climate change: Changing thetime of farm operation to better fit new climate conditions such as advancedsowing dates to offsets moisture stress during dry season.
- Changing farming practices to conserve soil moisture and nutrients, to reducerunoff and to control soil erosion
b. Livestock sub-sector- Designing and constructing animal breeding farms and ranches with its facilities
suitable for climate change.- Improving feeding nutrition by using protein, vitamin and mineral supplements.- Using feeding supplements such as MUB to reduce extensive grazing and to
increase production.- Developing animal interbreeding, selecting and applying technologies which are
suitable to different ecological and climatic conditions.9.2.3 Identification of barriers and policy needs
- Lack of access to information on adaptation technologies.

Draft 1
111
- Lack of investments and financial support for adaptation.- Limitation of research capacity on adaptation technologies.- Lack of comprehensive adaptation policy and legal framework
9.3 Selection of key technologies in water resources9.3.1 BackgroundWater resources are vital for socio-economic development. Impacts of climatechange on the water resources can causerisks, therefore assessment of the risks andadaptation technologies is very necessary.In assessing the impacts of climate changeand adaptation technology on waterresources, the representative basinapproach is used. A basin is chosen fromthree hydro climatic zones: Red RiverDelta from the north river system; MekongRiver Delta from the south river systemand Central Coastal zones from the CentralCoast river system.The average simulation of CSIRO is used to develop simulation of climate change inViet Nam for assessment of climate change impacts and/or development of adaptationmeasures and technologies in various areas.The models (RRMOD- Rainfall Runoff Model, SSARR- Simulated Stream flow AndReservoir Regulation) are used for calculating and assessing the variation of annualrun-off, low flow and flood flow according to the respective scenarios.Viet Nam is located in down streams of two big international rivers: Mekong and RedRivers. The Mekong river basin area is about 795,000 km2 (including Tonlesap andDelta), annually; water runoff to the East Sea is 505 billion m3. The Red River has abasin of 169.000 km2; annually it transports to the East Sea 138 billion m3 of water.So, for whole territory, the total runoff reaches 835 billion m3.The spatial and temporal distribution of runoff is very uneven. More than 80% of run-off concentrates in summer (5-6 months), the rest 20% of run-off distributes for 6-7months in dry season. In some areas (for instance, in the mountainous areas of ThuaThien, Bac Quang provinces), run-off is high, the module reaches 75-80 l/s/km2, butin some areas, run-off module is small and only reaches 10-12 l/s/km2, such as in therivers of Binh Thuan province.Beside surface water, the ground water that can be exploited annually is 50 billion m3,i.e. equivalent to module of 4.8 l/s/km2 or the depth of ground water of 150 mmannually.
Yaly Hydro Power in Gia Lai province

Draft 1
112
The Red River and Mekong River BasinIn 2070 annual run-off changes from +4% down to -19%, the change of low flow israther significant from -2% down to -24%. Because daily rainfall increases from 12 to19%, the peak discharge increases significantly and return period also decreases. Theflood peak, which formerly had return period of 100 years, now only 20 years. Theflood peak, which formerly had return period of 20 years, now only 5 years, etc., i.e.the frequency of flood occurrence would be higher.The Medium and small rivers basinThe studies show that by 2070, the biggest decrease of annual run-off would berecorded in the East of South Viet Nam (29-33%), Central Viet Nam from QuangBinh to Quang Ngai province (23-40.5%), North Viet Nam and North of Central VietNam (2-11.5%), and biggest increase in extreme South of Central Viet Nam (49%),Central Highland (6-16%).(table 9.1)
Table 9.1. Change of annual run-off due to climate change impacts
Basin Yo:At present(mm)
By 2070 Change (%)
- Ma & Chu- Yen- Hoang Mai- Ca- Rao Cai- Rac- Gianh- Ta Trach- Tra Khuc- An Chi- Hinh- Cai Nha Trang- Luy- Se San- Srepok- Ba- Dong Nai- Be- Sai Gon- Vam Co
890838741
1,1301,4401,7302,3302,3622,0722,0731,6771,420
4381,3101,080
7201,1191,053
656447
797829723
1,093976
1,5961,7901,3501,2561,2352,5111,504
6531,3971,2551,710
794708363221
-11.5-2.1-3.5-4.3
-33.3-7.8
-23.2-42.9-39.4-40.5+49.7
+5.9+49.0
+6.6+16.2
-4.0-29.1-32.8-44.7-50.6
+ Yo (mm): the depth of annual run-off+ For the case at present , the data series of 1961-1990 was used
When air temperature increases by 1oC, 2.50C, the potential evaportranspiration wouldincrease by 3%, 8% respectively.
Draft 1
113
Water requirement for agriculture: Due to warming effect the water demand for foodcrops particularly rice crops will be increased. The studies showed that the projectedincrease in irrigation water requirement for rice paddy referenced to the base periodwater requirement due to climate change by 2070 would be 5.12 billion m3.9.3.2 The key adaptation technologies in water resources sector- Building reservoirs with the total additional capacity of 15-20 billion m3 for
containing floodwater to mitigate losses caused by floods, meanwhile, regulatewater during low-flow season. The high priority should be given to the East ofSouth Viet Nam, Central Highland and mountainous areas in North Viet Nam.
- Upgrading and rising the scale of drainage system;- Increasing the irrigation system efficiency and introducing new methods of
irrigation and water saving including rehabilitating and reconstructing irrigationsystems to reduce water losses.
- Encouraging water-saving technologies in industry, agriculture, households andwater management.
- Increasing the adoption of drought tolerant cultivars.- Conducting studies in long-term water resources prediction.
9.3.3 Identification of barriers and policy needs- The uncertainty related to the precise climate change scenarios to enable confident
evaluation and qualification of impacts remains a major problem. It is thus verydifficult to identify the most appropriate adaptation measures and the relatedtechnologies.
- The lack of financial resources and capacity of irrigation managers.- The lack of knowledge and information on adaptation technologies in water
resources9.4 Selection of key technologies in coastal zone management9.4.1 Background:Viet Nam has more than 3,260 km of coastline and more than 1 million sq. km of sealying in the Southeast Asian inter-tropical monsoon zone. The coastal and sea areacovering nearly half of the provinces, one-fourth of the districts and one-sixth of thepopulation of the country, is of great importance in terms of economic developmentand national defense. It is of great scenic beauty and typical of tropical eco-systemssuch as submerged forests, coral reefs and estuary and coastal swamps.Climate change with potential impacts of sea level rise, as well as increase in seatemperature on coastal systems of Viet Nam is considered the most damaging. Theimpact is not limited to a narrow coastal zone but will even be more serious furtherinland. This is caused by the raise of the river beds and the backwater effects whichhas much more influence in the riverside area than near the sea where the river isusually very wide and deep due to tidal action. According to previous studies carried

Draft 1
114
out under the Asian Development Bank, GEF, and UNDP...it has been estimated that:a. Flood and inundation:Sea level rise by 1m would cause flood and inundation; about 40,000 km2 will beflooding annually. 17 million people will be subject to annual flooding; over 14million of these will be in the Mekong delta provinces.The wetlands affected and threatened by sea level rise could be as much 1700 km2which are about 60% of Viet Nam’s coastal wetlands. Most seriously area will be theforest of Ca Mau province, Ho Chi Minh City, Vung Tau and Xuan Thuy sea forestareas.b. Mangrove forestSea level rise might make a large number of existing forests totally under water. Otherclimate change features would also affect characteristics and structures of mangrove.Warmer winter would create favorable conditions for development of mangroves incoastal zone of North Viet Nam, but in coastal zone of Central Viet Nam, theincreasing dry, hot and drought weather would adversely affect the growth anddevelopment of mangrove forest. Aggregation and erosion occurring in many coastalplaces would increase and stronger wave that would adversely affect mangrove forest.c. Residential areas and constructionSea level rise would make a great area of land in the Mekong, Red River deltas andCentral Coastal zone become narrower, unless an enough high dyke system would bebuilt. On the other hand, storm surge would be stronger, threaten structures in thecoastal zone and low lands.Sea level rise would threaten industrial, transport and national defense structures thatwere designed according to present sea level. The increase of flood and inundationwould negatively affect the foundations of structures. The increase of typhoons,tornadoes would require strengthening the resistance of structures that lead to increaseof their costs.d. Sea products and fisheriesDue to sea level rise, hydro-physical hydro-biological and hydro-chemical regimeswould be degraded, and as a result, the existing coenobium would change its structureand components, supplemental reserve would reduce seriously. It is predicted thateconomic sea product capacity would reduce at least one third in comparison to thepresent.Due to increasing temperature, benefit resources distribution would be moredispersed. Meanwhile, the number of tropical fishes with low commercial value,except tuna, would increase. The number of sub-tropical fishes (with high commercialvalue) would decrease or even disappear. Most fishes in coral reef would vanish.9.4.2 Selection of key adaptation technology in coastal zone management- Full protection: implement all-sided protection measures to maintain present
situation, effectively response to sea level rise. This option requires making all

Draft 1
115
dykes higher and strengthening coastal management. To prevent salinity intrusion,pumping for drainage and making land foundation higher would be very necessary.
- Accommodate: reform infrastructures and habits of the people living in the coastalzone to adapt to sea level rise. To accept some losses, paying special attention tobuild “adaptive” infrastructures and transfer to suitable farming techniques.
- Withdrawal (also called Retreat ): Avoid natural impacts of sea level rise byresettlement, moving houses, and infrastructures from threatened areas. Thisoption would also include natural landward migration of wetlands as a response tosea level rise.
In accordance with reality, in each locality one or two above-mentioned strategiescould be used and implemented. However, in nation-wide scale, there should becombination of all three strategies.9.4.3 The key adaptation technology in coastal zone management- Full protection: It would require to improve and enhance existing sea dike system
of 2700 km and to build additional ones of 2000 km. A sophisticated system of seadikes already exits in the northern part of the country. In the Mekong Delta,however, the existing sea dike system needs to be strengthened considerably tomeet national standards devised for future climate change. The costs requiredupgrading the existing sea dike system and to build a new one is about US$ 870million.Coastal erosion protection by groynes that they are structures placedperpendicularly to the shore to trap sediments often in direct response to an acuteerosion problem. It will be constructed at the most serious threat beaches such asHai Hau, Ngo Chien district’s beach.Hand-placed rock sea walls are the ones that demonstrated to be an effectivetechnology. Hand placed rocks to form sea walls are a common line of protectionused. Placed correctly and maintained the sea walls for protecting waves and sealevel rise.
- Accommodate: Raised lands for special industrial areas, which are part of theGovernment's development plans, will be raised; Raised houses raising in height ofabout 1m above the highest flood level will be required to improve the presentsafety level of the population in some areas. The total cost is estimated at US$ 3.7billion;Pumping: Improvement of pumping system and pumping capacity to relieve floodsin waterlogged areas where rainwater and infiltration water collects behind thedykes. Total cost for pumping installations and upgrading works is estimated atUS$ 2 billion with an annual operating and maintenance cost required of US$ 200million;Flood warning system: These systems provide real-time forecasts of high tides,surges and wave overtopping
Draft 1
116
- Withdrawal (also called Retreat ):Replacement casements such as coastal accessroads may need to be rearranged far in advance of their erosion/ submergenceSetback building distance: This is a buffer zone between the shoreline andpermanent structures, which protect properties in the event of sea level rise andmore frequent flooding.
9.4.4 Identification of barriers and policy needs- Limitation of institutional capacity, lack of infrastructure and insufficient
legislations and regulations relating coastal zone management.- High cost of coastal engineering projects.- Development of an ICZM programme is still in an early stage.- Coastal adaptation technologies cannot be extrapolated from one site to another
because the very different conditions from one to other.- Lack of integration of climate change issues and environment protection into coast
zone management programmes.
Draft 1
117
CHAPTER 10PARTICIPATION IN SYSTEMATIC OBSERVATION NETWORKS
10.1 Hydro-Meteorological NetworksLocated in the tropical monsoon area, adjacent to the East Sea and the North West PacificOcean, Viet Nam has diversified and prosperous climate resources, however it is alsoaffected by a lot of natural disasters, especially typhoon, flood and drought. Hydro-meteorological activities in Viet Nam have been systematically carried out since ancienttime.In 1976, the Hydro-Meteorological Service (HMS) of Viet Nam was officiallyestablished in basis of corporation of Meteorological Agency and Department ofHydrology from the Ministry of Water Resources. HMS was an Agency directly underthe Government of the S.R. Viet Nam and had the responsibility to provide information,data and materials on meteorology, hydrology and atmospheric and water environmentincluding periodical meteorological and hydrological forecasts with different time ranges,the forecasts and warnings of natural disasters such as typhoon, flood and drought, etc. tomeet the requirements of natural disaster prevention, preparedness and socio-economicactivities.In August 2002, the Ministry of Natural Resources and Environment (MONRE) wasestablished. Since then, the National Hydro-Meteorological Service (NHMS) has been aninstitutional organization under MONRE and responsible for most functions and tasks ofthe former HMS.

Draft 1
118
Figure 10.1. Organization chart of NHMS
monre
nhms
DIRECTOR
1. Central Centerfor Hydro-MeteorologicalForecasts
5. Aero-Meteorologicalobservatory2. Center for
hydrological,meteorologicaland environmentalstation network 6. Center for
Application ofHydro-MeteorologicalTechnology
3. Hydro-meteorologicalData Center
7. Hydro-MeteorologySurveyDetachment
INSTITUTIONAL UNITS
4. Marine Hydro-MeteorologicalCenter
1. AdministrationOffice
2. PersonnelOffice
3. Finance andplanning Office
4. S&T andInternationalcooperation Office
Assistant Offices
1. Northwest 2. Mid Northern 3. Northeast
4. Red river delta 5. North central 6. Mid Central
7. South Central 8. Central Highland 9. Southern
REGIONAL HYDRO-METEOROLOGICAL CENTERS

Draft 1
119
The NHMS’s local units:• 9 Regional Hydro-Meteorological Centers (RHMCs)• 54 Provincial Hydro-Meteorological Centers (PHMCs)• Observation station network
10.1.1 Meteorological stations networkTotal 168 stations, divided into 3 categories:Class 1: Weather watch: 24/24 hrs; Observation of: Wind (direction & speed), Rainfall,Air pressure, Air Temperature, Humidity, Sunshine, Evaporations, Land Temperature(ground and deep layers); Cloud, Visibility, Ground conditions, Radiation (at somestations). Data collection & transmission: 8 obs/dayClass 2: Same as class 1, but not doing the observation of radiation, air pressure (at somestations). Data collection & transmission: 4 obs/dayClass 3: Same as class 2, but not doing the observation of air pressure. Data transmissionat request.
- Class 1: 57- Class 2: 65- Class 3: 46- Synoptic : 122- Climatic : 46- Radiation : 13- Agro. met. : 27- Belong to Global Observing System: 25
The Water and air environment monitoringstation network:
- Laboratories: 3- Water of river, lake, sea, air environment
stations: 143
The Aero- Meteorological Observation:- Radiosonde stations: 3- Wind-gauge by theodolite (Pilot): 7- Ozone and UV : 3- Weather radars: 6
The Marine Hydro-Meteorological Observation:- Marine Meteo. Stations: 21
Figure 10.2. Weather radarsnetwork

Draft 1
120
- Marine Research vessel: 110.1.2 Hydrological stations networkTotal: 232 stations, divided into 3 categories:Class 1: Hydraulic condition watch: 24/24 hrs; Measurement of: Water level, Discharge,Sediment load, Water temperature, Air temperature, Rainfall.Class 2: Same as class 1, but not measurement of Sediment loadClass 3: Same as class 2, but not measurement of Discharge and Sediment load
- Class 1: 60- Class 2: 20- Class 3: 152- Water level recorder: 88- Tidal influence: 100- Non tidal influence: 132
Calibration of hydro-meteorological instruments: The National Hydro-MeteorologicalService is equipped with good calibration equipments and is authorized by theGovernment to conduct calibration of such meteorological and hydrological instrumentsas air temperature, humidity, atmospheric pressure, wind speed and flow speed.
10.1.3 System of Hydro-Meteorological forecastsThe NHMS is responsible for providing information on hydro-meteorological, marineforecasts for the needs of natural disaster prevention and preparedness, social andeconomic activities.The system of hydro-meteorological forecasts includes three levels:
- Central level realized by Central Center for Hydro-Meteorological Forecasts(CCHMF)
- Regional level realized by Regional Hydro-Meteorological Centers (RHMCs)- Provincial level realized by Provincial Hydro-Meteorological Centers (PHMCs)
10.1.3.1 Meteorological forecasts1. Services:Weather services consist of short-range, medium-range and long-range forecasts. Thefollowing forecasts and warnings are issued by CCHMF to the public:(a) Weather Bulletins are issued for different inland regions, some cities and coastalwater areas of Viet Nam 3 times/day. A weather forecast for the whole country covers therest of the day and/or the next day depending on the time of issue of the forecast, and aweather outlook for 48 hours.

Draft 1
121
(b) Tropical Cyclone Warnings issued 4 times/day increasing to 8 times/day dependingon the relative position of TC center to threatened coastal areas. The warnings containinformation on the location and movement of the tropical cyclone, its intensity and thelikely effects on Viet Nam.(c) Warnings of other meteorological hazards includes Heavy rain warnings areincluded in weather bulletins; Cold air surge warnings are issued 4 times/day providingwarning of strong winds and cold weather; Very Hot Weather Warnings are included inweather bulletins2. Forecasting tools:The CCHMF constantly keeps a close watch on the changing weather situation to make anotification to RHMCs as well as to the public.The main method used in weather forecasts is synoptic method in accordance with theusage of satellite imagery, radar imagery and NWP products.Synoptic method: is performed by analyses of current weather charts, which areconstructed from surface observations and radiosonde observations. The weather chartsused in Viet Nam are composed of about 400 to 500 surface observations andapproximately 200 to 300 upper observations over the World transmitted to the CCHMFby GTS.Satellite imagery: During 5 years form 1997 to 2002 the satellite ground receptionsystem at the CCHMF had been receiving high-resolution cloud images from GMS-5.Since the back up of GMS-5, 22 May 2003, the CCHMF has implemented the receptionof GOES-9 IR1 data through Internet from the Japan Meteorological Agency (JMA)server.In 2003, the polar satellite receiving station was maintained and enhanced to receivecloud images of 5 channels from NOAA-15, NOAA-16, and NOAA-17 satellites.Supplying high-resolution images and provided with the observation of 3.7 µm channel,NOAA satellite images enable very detailed observations of severe weather phenomena,particularly at night when visible images of GMS-5 were not available.Since the transition to GOES-9 of Geo-stationary satellite, NOAA images have becomeespecially important in operational weather forecasting and monitoring of severe weathersystems such as Tropical cyclones.The application of satellite images in rainfall estimation has been carried out at theCCHMF. Such kind of products is useful in assessing the rainfall situation and tendencyover interested area, particularly where the conventional network of rain gaugeobservations is not dense. These products are provided to Hydrological Division to helpin water level and flood forecasting.Besides, additional satellite information, such as Quikscast, TRMM, TraP... accessedthrough internet web pages are used in procedure of TC forecasting.

Draft 1
122
Radar imagery: Radar observation network in Viet Nam is currently consisting of 6weather radar stations, locating at Phu Lien, Viet Tri, Vinh, Tam Ky, Nha Trang and HoChi Minh city. Observations of three stations at Phu Lien, Viet Tri, and Vinh areregularly transmitted to the CCHMF each 3 hours.NWP models: NWP products provide an objective tool for weather forecasts withestimations of the timing and intensity for weather system developments up to severaldays. Recently, meteorological forecasts are heavily dependent on NWP products.Digital projects of global models have been received via internet form overseasmeteorological centers, such as JMA since 1997 and Bureau of Meteorology (BoM),Australia since 2000.Graphical NWP projects of UKMET, ECMRWF, USA, Korea... are referred to throughweb pages.To further enhance the forecast accuracy in Viet Nam The NCHMF has begun operatinga High Resolution Numerical Model (HRM). The HRM originally developed by DWD(for shared memory computers (base on the OpenMP standard) firstly were installed inWS IBM RS/6000 with 2 CPU in 2000). Later, this code was developed for distributedmemory systems like Linux PC clusters (based on the MPI standard) by the Viet NameseHRM group in co-operation with a local Institute of Mathematics, Viet Nam Academy ofScience and Technology (VAST). This new MPI version HRM had installed on a PC-based parallel computer with 8 processors and been running operationally since May2002. The newest version of HRM model with horizontal resolution of 14 km is capableof estimating the development of relatively small scale weather features up to 72 hours.Besides this the ETA model obtained from NCEP ftp severs has also been running inexperimental mode since middle of 2003.Moreover, bar tropic model WBAR and some statistical models for tropical cyclone trackforecasts are run in case of tropical cyclones.To make the best benefit of the NWP application, digital products from HRM models andother models, such as GSM (JMA) and TLAPS (BoM) are displayed in the graphic formwith different combination of information by using GrADS software. These products areput on Local Area Network inside CCHMF and also distributed to other RHMCs forguidance in daily operational forecasting. Some outputs from HRM model are served asinitial conditions for other models such as WAM, hydrological models.In this year, a NAWPIS (NCEP Advanced Weather Interactive Processing System)system obtained from NWS (NOAA) was successfully installed on PC-Linux at NCHMF(with the latest version GEMPAK 5.7.3). This system is a complex convenient tool forforecasters as it can produce observations maps, display NWP products and overlappingseveral products (NWP, satellite images, observations). NAWIPS system has been putinto operations at CCHMF since June, 2004.
Draft 1
123
10.1.3.2 Hydrological forecasts1. ServicesProducts of hydrological services contain short-range, medium and long-range forecastsfor all rivers in Viet Nam territory.(a) Hydrological bulletins on water level and discharge forecasts are issued everydaywith lead time of 5 days in rainy season and of 10 days in dry season for 20 main riversalong the country. Monthly and seasonal forecasts: there is a prediction of maximumwater level in a forecast period.(b) Flood warnings with lead time form 12 to 48 hours are issued once/day andtwice/day in case of emergency. Medium flood forecasts with lead time from 5 to 10 daysare issued everyday for some main rivers in the North and in the Lower Mekong river.(c) Warnings of other hydrological hazards on drought warning2. Forecasting toolsHydrological forecasts in Viet Nam are mostly based on conceptual models, andstatistical methods.- Conceptual models: There are several types of conceptual models such as SSARR,
TANK, NAM operationally used in forecasting for several main rivers. NewMARINE and Hydraulic models for short-term flood forecasting and flood controlhave been applied for Red and Da rivers.
- Statistical models: Multi-variable regression models and objective statistical modelshave been developed for some specific rivers, such as Da river, Red river, Thai Binhriver, Mekong river.
For improvement of hydrological forecasts it is necessary to expand the observationnetwork and the system for real time data collection. There have been considerableefforts to set up more hydrological stations and automatic stations for the observationnetwork in Viet Nam, up to now there are about 232 hydrological stations scattered overthe country. At CCHMF, software for the preservation of hydro-meteorological database,for hydrological data collection and processing has been developed and put intooperation.Recently, all researches mainly focus on developing new hydrological models with theuse of new technology, such as GIS... to improve the capacity of flood forecasting.In addition, the more attention is also paid to the Improvement of hydrological productsto meet users' requirements and expectation, for example, the improvement ofhydrological forecasting products for Hoa Binh hydro-electric power regulation (in Dariver); the improvement of hydrological forecasting products for the building of newhydro-electric power Son La in Da river; the improvement of hydrological forecastingproducts for the irrigation of reservoirs in the North; and the improvement ofhydrological forecasting products for Regulating of all hydro-electric power systems inViet Nam.

Draft 1
124
3. Product disseminations:To governmental offices: tropical cyclone warnings and flood warnings are directly sentthrough fax or by WAN to the Central Committee for Natural Disaster Prevention andother Ministries such as Ministry of Aquiculture, Ministry of Telecommunication,Ministry of Agriculture and Rural Development.To the public: All the forecasts and warnings are sent to RHMCs through WAN;broadcasted on the Viet Nam National Television, Voice of Viet Nam, local Televisions,daily newspapers.In recent years, CCHMF makes effective use of an Internet website(http://www.nchmf.gov.vn) for dissemination of all meteorological and hydrologicalinformation to the public.To special users: forecasts and warnings are also supplied at cost to special usersthrough fax or telephone. Such users include private firms, public utilities and hydro-electric power plants and other companies whose operations are meteorological andhydrological sensitive.International telecommunication system of NHMS
• Hanoi - Moscow: 100 bauds
• Hanoi - Beijing: 75 bauds
• Hanoi - Bangkok: 1200bps
• PCVSAT: Hanoi - Beijing: 9600bpsDomestic telecommunication system of NHMS
• Telephone line
• WAN
• MetTV

Draft 1
125
Figure 10.3. NHMS's Communication network
Figure 10.4. NHMS's WAN

Draft 1
126
Figure 10.5. NHMS's MET TV
Figure 10.6. Data Processing system
GTS
SERVERNCHMF MSS
Diagnosticmaps charts
ØNumerical models(HRM, JMA, BoM)
Forecast andwarning bulletins
ØProducts received fromInternet
ØSatellite imagesØRadar imagesØAero-meteorological
data
WAN

Draft 1
127
Figure 10.7. Forecasting system
Central Center forHydro-
MeteorologicalForecasts
Regional Hydro-Met. Center
Regional Hydro-Met. Center
Regional Hydro-Met. Center
Regional Hydro-Met. Center
Provincial Hydro-Met. Center
Provincial Hydro-Met. Center
Provincial Hydro-Met. Center
Central Hydro-Met. Center
Regional Hydro-Met. Center: 9
Provincial Hydro-Met. Center: 54

Draft 1
128
Figure 10.8. Functions of each forecasting level
Central Center forHydro-
MeteorologicalForecasts
Background forecast
Regional Hydro-Met. Center
Forecasts
ProvincialHydro-Met.
Center
Typhoon analysis and forecast
• Daily, medium-and long-termweather forecasts
• Flood forecast• Forecasts of heavy rain, cold
surge, hot and dry weather• Warnings of severe weather
phenomena
Weather and hydrological short-andlong-term forecasts for a region
Weather and hydrological short-andlong-term forecasts for a province
Marine forecasts
TV, VOVCoast broadcastradio stations
GTS

Draft 1
129
Weather and climate bulletins
• Daily weather (land and waters): 3 times/day
• Warnings of severe weather
• Cold surge: 4 times/ day
• Typhoon and tropical depression: according to special regulations (up to 8times/day)
• 10-day forecast
• Monthly
• Seasonal
Hydrological bulletins
• During flood season: 1 time/day
• Flood summary: According typhoon-flood alert regulation
• Medium-term flood forecast: 1 time/5 day (during flood season), 1 time/10days(during dry season)
• Monthly and seasonal forecasts
• Drought forecastForecasting methods
• Synoptic / statistical methods
• Numerical prediction models
• NWP products
• Utilization of Satellite images
• Utilization of Radar imagesNumerical weather prediction models
• The Limited Area Model HRM (Germany) with resolution of 28 km (put intooperation since May 2002).
• The ETA model (US) with resolution of 37 km (under test since mid of 2003).
• Barometric model WBAR for prediction of typhoon track (tested for 2003 typhoonseason).
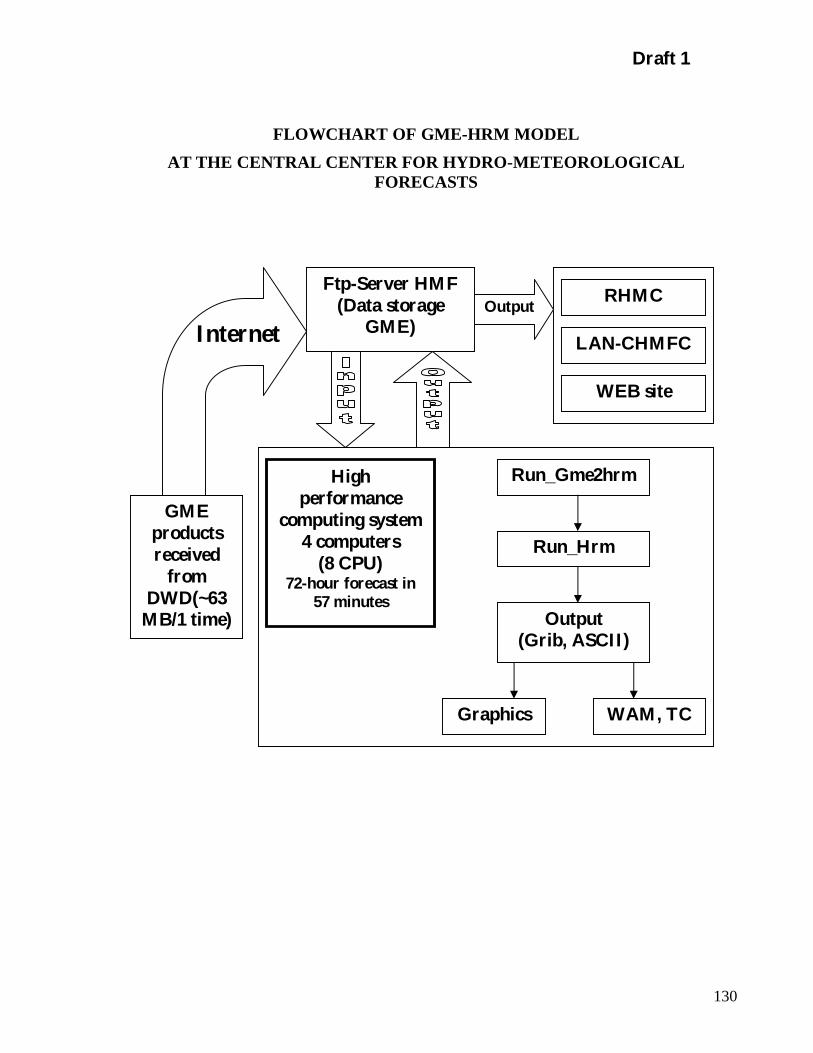
Draft 1
130
FLOWCHART OF GME-HRM MODELAT THE CENTRAL CENTER FOR HYDRO-METEOROLOGICAL
FORECASTS
Ftp-Server HMF(Data storage
GME)
RHMC
LAN-CHMFC
WEB site
GMEproductsreceived
fromDWD(~63
MB/1 time)
Highperformance
computing system4 computers
(8 CPU)72-hour forecast in
57 minutes
Run_Gme2hrm
Run_Hrm
Output(Grib, ASCII)
Graphics WAM, TC
Output
Internet
Draft 1
131
10.1.4 Research and international cooperation activities of the National Hydro-Meteorological Service (NHMS) of Viet NamViet Nam has been the member of World Meteorological Organization (WMO) since1955 and participated in Regional Association II (Asia), Typhoon Committee (TC), Sub-committee on Meteorology and Geophysics (SCMG), International HydrologyProgramme (IHP), Mekong River commission (MRC). Viet Nam participates in theWMO Programmes such as World Weather Watch (WWW), World Climate Programme(WCP), Atmospheric Research and Environment Programme (AREP), Applications ofMeteorology Programme (AMP), Hydrology and Water Resources Programme (HWRP),etc.NHMS cooperates with international and regional organizations: UNDP, WB, UNEP,UNESCO, ESCAP, ADB, IHP, ASEAN... Besides, NHMS cooperates with GEWEXAsian Monsoon Experiment (GAME) and Soundings of Ozone and Water in theequatorial region (SOWER). These programmes provided NHMS with scientificequipment and expendables to make ozone and water vapour sonde observations in VietNam.NHMS has bilateral cooperation with many WMO member countries in the world and inthe region such as:
• Germany on tropical cyclone dynamics and problems of forecasting tropicalcyclones.
• Australia on numerical weather prediction...
• Russia on enhancing MRL-5 radar, exchanging of ozone and ultraviolet data andresearching marine hydro-meteorology.
• Japan on remote sensing studying and improving quality of weather prediction...
• America on flood forecasting, numerical weather prediction and marine hydro-meteorology researching
• China on typhoon forecast research
• Italy on early flood warningBesides, Viet Nam also cooperates with France, Norway, Korea, Lao PDR, Cambodiaand others.
10.2 The main barriers in developing the observations networkThere are the following main barriers, which are characteristic to the observationsnetwork in Viet Nam.
• NHMS does not have enough modern and complete equipment.
• Many equipments, and devices used in the observation and monitoring networksare outdated and worn-out.
• Lack of highly qualified specialists
Draft 1
132
• The participation in the Global Climate Observing System and other networks inthe world appear difficult.
• The assistance in consolidating and developing the observation and monitoringnetworks as well as improving meteorological and hydrological staff's technicalknowledge, skills from International Organizations and developed countries isneeded.
10.3 Development orientation of the National Hydro-Meteorological Service of VietNam up to 2015The NHMS of Viet Nam conducts the implementation of hydro-meteorologicalinfrastructure survey, collects and evaluates hydro-meteorological materials andelements; processes and supplying hydro-meteorological information, materials andforecast; appraises hydro-meteorological technical standards of projects on infrastructureconstruction, renovation, expansion and upgrading of hydro-meteorologicalconstructions; organizes the registration, issuance and withdrawal of operation licenses ofhydro-meteorological constructions in accordance with the provisions of lawDevelopment orientation Goal of NHMS:
a) Enriching data sources (quantity, quality, in time) for weather, hydrologicalforecast and warnings:
• Consolidating and upgrading observation network to meet requirement ofstorm and flood forecasting and warning activities;
• Reequipping stations network;
• Updating observation technology;
• Strengthening hydro-met. Survey capabilities;b) Improvement of forecast capabilities
• Improvement of telecommunication facilities;
• Interpretation of satellite and radar images
• Familiarizing and mastering new observation equipment and technologiesc) Improvement of meteorological, hydrological, environment data collection,
processing, archives and service system:
• Improving the management system of meteorological and hydrological datato meet increasing needs of socio-economic activities, scientific research,etc.
• Strengthening the material technical base for hydro-meteorologicaldocumentation.
Draft 1
133
CONCLUSIONSThe present document focuses on TNA for Energy, Industry, Transport, Forestry andAgriculture sectors and on the identification and assessment of adaptation technologyneeds in Agriculture, Forestry, Water resources and Coastal zone management sectors inViet Nam.This work will effectively contribute to the further climate change activities in Viet Namand the preparation of the Viet Nam Second National Communication on Climate Changeto UNFCCC Secretariat.Technology needs assessments allow Viet Nam to identify their climate changeadaptation technology transfer priorities and develop effective strategies to address them.They can be powerful instruments for focusing the attention of government agencies, theinternational donor community and private sector investors on a well-defined set ofpriority activities. These needs assessments will be most successful when they focus ontechnologies and actions that meet national development goals while also responding toclimate change concerns, and when implementation actions complement existingdevelopment programs. Effective technology needs assessments actively engage all keystakeholders, including government officials, businesses, technical institutions, andinternational partners in the selection of technology priorities and design of actions toovercome barriers to technology implementation.
Experience has shown that the individual actions of the step-by-step methodologypresented in this report are much less effective if performed in isolation. Acomprehensive, integrated approach—spanning identification of priority technologies,evaluation of implementation barriers, design and implementation of priority actions, andfollow-up evaluation—maximizes the chances of success for any technology transferprogram since it not only results in well-informed, detailed technology transfer strategiesbut also provides the basis for countries to secure the technical and financial supportnecessary to implement their technology transfer activities.
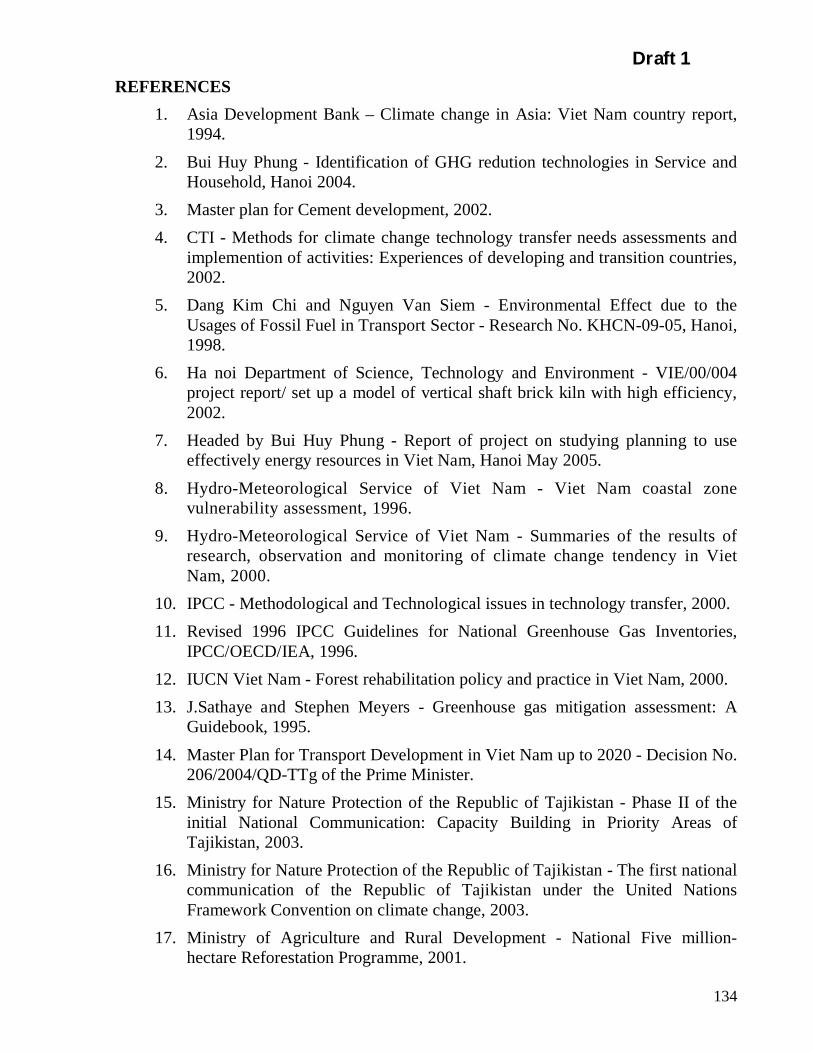
Draft 1
134
REFERENCES1. Asia Development Bank – Climate change in Asia: Viet Nam country report,
1994.2. Bui Huy Phung - Identification of GHG redution technologies in Service and
Household, Hanoi 2004.3. Master plan for Cement development, 2002.4. CTI - Methods for climate change technology transfer needs assessments and
implemention of activities: Experiences of developing and transition countries,2002.
5. Dang Kim Chi and Nguyen Van Siem - Environmental Effect due to theUsages of Fossil Fuel in Transport Sector - Research No. KHCN-09-05, Hanoi,1998.
6. Ha noi Department of Science, Technology and Environment - VIE/00/004project report/ set up a model of vertical shaft brick kiln with high efficiency,2002.
7. Headed by Bui Huy Phung - Report of project on studying planning to useeffectively energy resources in Viet Nam, Hanoi May 2005.
8. Hydro-Meteorological Service of Viet Nam - Viet Nam coastal zonevulnerability assessment, 1996.
9. Hydro-Meteorological Service of Viet Nam - Summaries of the results ofresearch, observation and monitoring of climate change tendency in VietNam, 2000.
10. IPCC - Methodological and Technological issues in technology transfer, 2000.11. Revised 1996 IPCC Guidelines for National Greenhouse Gas Inventories,
IPCC/OECD/IEA, 1996.12. IUCN Viet Nam - Forest rehabilitation policy and practice in Viet Nam, 2000.13. J.Sathaye and Stephen Meyers - Greenhouse gas mitigation assessment: A
Guidebook, 1995.14. Master Plan for Transport Development in Viet Nam up to 2020 - Decision No.
206/2004/QD-TTg of the Prime Minister.15. Ministry for Nature Protection of the Republic of Tajikistan - Phase II of the
initial National Communication: Capacity Building in Priority Areas ofTajikistan, 2003.
16. Ministry for Nature Protection of the Republic of Tajikistan - The first nationalcommunication of the Republic of Tajikistan under the United NationsFramework Convention on climate change, 2003.
17. Ministry of Agriculture and Rural Development - National Five million-hectare Reforestation Programme, 2001.

Draft 1
135
18. Ministry of Construction - Survey data of Institute of Science of ConstructionMaterial, 2001.
19. Ministry of Environment & Science of Ghana - Ghana’s Climate changetechnology needs and needs assessment report, 2003.
20. Ministry of Environment of Republic of Indonesia - Identification of less GHGemission technologies in Indonesia, 2001.
21. Ministry of Industry - Draft of National Energy Policy, Hanoi April 2005.22. Ministry of Industry - Draft of National Target programe on Energy Saving
and Efficiency on period of 2006 - 2015, Hanoi, June 2005.23. Ministry of Industry - Research of Environmental and Industrial waste water
programme, 1999-2000.24. Ministry of Natural Resources and Environment - UNEP/GEF project,
Report on Expert’s survey results on screenning and assessing the GHGemission reduction and addaptation technology need criteria, 2005.
25. Ministry of Natural Resources and Environment - Viet Nam Initial NationalCommunication on Climate Change, 2003.
26. Ministry of Planning and Investment of Viet Nam - The strategic orientationfor sustainable development in Viet Nam, 2004.
27. Mitra A. P - Methane emission in rice paddies in India, 1996.28. National Communications Support Programme, 2000. Workshop Report on
Vulnerability and Adaptation Assessment - Jacarta, Indonexia, May 2000.29. National Politics Publishing House - Documents of the 9th National
Congress of the Communist Party of Viet Nam, 2001.30. National Project 1996-2000 - NSS on Sustainable Energy Development in the
period 2000-2020.31. Nguyen Mong Cuong - Climate change of vulnerability and adaptation
assessment on agricultural sector in Viet Nam, 2002.32. Nguyen Mong Cuong - Identification of technology needs for climate change
adaptation in agricultural sector in Viet Nam, 2004.33. Nguyen Mong Cuong - National GHG abatement strategy and action plan in
agricultural sector in Viet Nam, 1999.34. Nguyen Mong Cuong - The results of experiments on measuring of methane
emission on rice fields under intermittent draining technology in Viet Nam,2002.
35. Nguyen Thi Anh Tuyet - Brick and ceramic industry in China, Viet Nam,India, Philippines and Sri Lanka: A study on Energy and Environment Issues,ARRPEEC Fellowship Report submitted to Energy Program, Asian Institute ofTechnology, Thailand, August 2000.

Draft 1
136
36. Nguyen Tien Nguyen - Report of Identification of technology needs GHGreduction emission in the energy sector, CD4CDM Project, April 2004.
37. Nguyen Trong Sinh - Impacts of climate change on water resources andsustainable development strategy, 1994.
38. Nguyen Van Thong - EE options in Viet Nam Steel corporation, report attraining workshop on CDM project development.
39. Nguyen Xuan Quang - Survey of brick production in Viet Nam.40. OECD and IEA information Paper - An Initial View on methodologies for
emission baseline iron and steel case study, June 2000.41. OECD Cement baseline methology, 2001.42. Pham Khanh Toan & Nguyen Van Hanh - Evaluation of technology needs
GHG reduction emission in production, consumption of electricity and energyin Viet Nam. Project “Expedited financing for measures for capacity buildingin priority areas”, July 2005.
43. Planning for the Development of Road Network in Viet Nam up to 2010 andOrientations till 2020 - Decision No. 162/2002/QD-TTg, dated 15th November2002 of the Prime Minister.
44. Research Center for Energy and Environment. CDM project document ofhydropower plant, 2004.
45. Shukla P. K - Climate change and India, Vulnerability assessment andadaptation, 2003.
46. Stakhiv.E - Evaluation of IPCC adaptation strategies, 1993.47. Strategies on Developing the Viet Nam Railways up to 2020 - Decision No.
06/2002/QD-TTg, dated 07th January 2002 of the Prime Minister.48. The European steel industry and the climate change, November 2000.49. The Mauritius Meteorological Service (MMS) - Technology Needs
Assessment and maintenance and enhancement of capacities for climatechange activities in Mauritius, 2004.
50. The State Hydro-Meteorological Committee of Azerbaijan Republic, 2001 -Phase II of the initial National Communication: Capacity ImprovementActivities on Climate change in the Priority Areas of Economy of Azerbaijan.
51. Tran Thanh Xuan - Impacts of climate change on rivers flow, 1999.52. UNEP - Economics of Greenhouse Gas Limitations: Methodological
Guidelines, 1999.53. UNEP - Handbook on methods for climate change impact assessment and
adaptation strategies, 1998.54. V.M. Shastri - Steel sector and CDM potential, October 2003.

Draft 1
137
55. Viet Nam - NSS on CDM, 2004.56. Viet Nam Statistical Yearbooks of 1990, 1995, 2000, 2002, 2003, 2004, 2005.57. Viet Nam Thermal Association - Brief introduction of vertical shaft brick kiln,
April 2004.

Draft 1
138
ABBREVIATIONS, MEASUREMENT UNITS, EXCHANGE UNITS
No Abbreviation Explanation
1. 0C Degree Celsius
2. ADB Asian Development Bank
3. AFTA ASEAN Free Trade Agreement
4. AMP Applications of Meteorology Programme
5. AREP Atmospheric Research and Environment Programme
6. BAU Business As Usual
7. BOF Basic Oxygen Furnace
8. CC Climate Change9. CCHMF Central Center for Hydro-Meteorological Forecasts
10. CDM Clean Development Mechanism
11. CH4 Methane
12. CO2 Carbonic
13. DARD Department of Agriculture and Rural Development14. DNA Designated National Authority15. DOI Department of Industry
16. DONRE Department of Natural Resources and Environment
17. DOST Department of Science, Technology
18. DRI Direct Reduced Iron
19. DSM Demand side management
20. EAF Electric Arc Furnace
21. EE Energy Efficiency
22. ES Energy Saving
23. EVN Electricity of Viet Nam, a state own corporation
24. FAO Food and Agriculture Organization of the United Nations
25. FIPI Forest Inventory and Planning Institute
26. FO Fuel Oil
27. FSIV Forest Science Institute of Viet Nam
28. GAME GEWEX Asian Monsoon Experiment
29. GDP Gross Domestic Product
30. GEF Global Environment Facility
31. GHG Greenhouse Gas
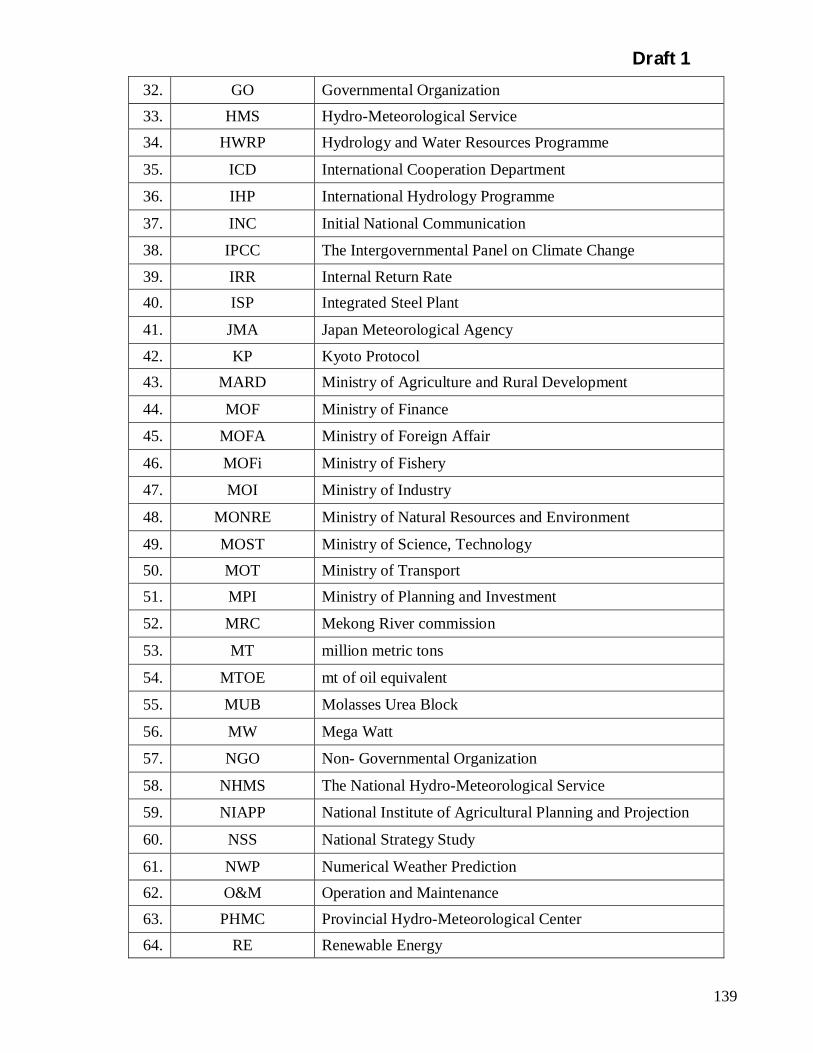
Draft 1
139
32. GO Governmental Organization33. HMS Hydro-Meteorological Service34. HWRP Hydrology and Water Resources Programme
35. ICD International Cooperation Department
36. IHP International Hydrology Programme
37. INC Initial National Communication
38. IPCC The Intergovernmental Panel on Climate Change
39. IRR Internal Return Rate40. ISP Integrated Steel Plant
41. JMA Japan Meteorological Agency
42. KP Kyoto Protocol43. MARD Ministry of Agriculture and Rural Development
44. MOF Ministry of Finance
45. MOFA Ministry of Foreign Affair
46. MOFi Ministry of Fishery
47. MOI Ministry of Industry
48. MONRE Ministry of Natural Resources and Environment
49. MOST Ministry of Science, Technology50. MOT Ministry of Transport51. MPI Ministry of Planning and Investment
52. MRC Mekong River commission
53. MT million metric tons
54. MTOE mt of oil equivalent
55. MUB Molasses Urea Block
56. MW Mega Watt
57. NGO Non- Governmental Organization
58. NHMS The National Hydro-Meteorological Service
59. NIAPP National Institute of Agricultural Planning and Projection
60. NSS National Strategy Study
61. NWP Numerical Weather Prediction62. O&M Operation and Maintenance63. PHMC Provincial Hydro-Meteorological Center64. RE Renewable Energy

Draft 1
140
65. RECTARE The Research Center for Thermal Equipment and Renewable
66. RHMC Regional Hydro-Meteorological Center
67. SCMG Sub-committee on Meteorology and Geophysics
68. SD Sustainable Development69. SNV Netherlands Development Organization
70. SOWER Soundings of Ozone and Water in the equatorial region
71. TC Typhoon Committee
72. TCS Ton of crude steel73. TNA Technology Needs Assessment74. TV Viet Nam Television75. TWh Tera Watt hour
76. UNDP United Nations Development Programme
77. UNEP United Nations Environment Program78. UNFCCC United Nations Framework Convention on Climate Change
79. VAST Viet Nam Academy of Science and Technology80. VND Viet Nam dong - currency unit of Viet Nam81. VSBK Vertical Shaft Brick Kiln
82. VUSTA Viet Nam Union of Science and Technology Associations
83. WAN Wide Area Network
84. WB World Bank
85. WCP World Climate Programme
86. WMO World Meteorological Organization
87. WWW World Weather Watch
Unit Exchange Unitcm Centimeterm Meter
km Kilometer 103mha Hectare 104m2
km2 Square Kilometer 106m2
t ton 106gKt Kilo ton 109gTg Tetra gram 1012g
Mha Million hectare

Draft 1
141
THE LIST OF POTENTIAL PROJECTS FOR MITIGATING GHG EMISSIONSProject 1. The Model Project for Renovation to Increase the Efficiency Use ofEnergy in Brewery in Thanh Hoa, Viet NamLocationNo 152, Quang Trung Street, Thanh Hoa provinceProject participants
- Thanh Hoa Beer Joint Stock Company (Project site of BTH)- Ha Noi Alcohol Beer and Beverage Corporation or HABECO (Parent company
of the project site)- Research Institute of Brewing or RIB (A division of HABECO, Technical
advisor to BTH)- Ministry of Industry (Government office in charge of HABECO)- Mayekawa MFG, Co., Ltd.
ActivityOverall renovation for energy conversation of a medium-size Thanh Hoa brewerycompany in Viet NamCapacityBeer production in 2003 and 2004 is 42,000 kL. It is expected to expand beer productionsubstantially to 53,000 kL driven by strongly growing demand in Viet NamTechnologyEnergy saving technologies used in the project are an integrated system of:
- Vapor Recovery Compressor or VRC- Improvement of refrigeration efficiency & thermal storage- Optimization of pasteurizer efficiency- Biogas boiler
They are transferred from JapanTime scheduleProject time schedule:
- Starting date of the project activity: 01/04/2006- Expected operational lifetime: 30 years
Crediting period:- Starting date: 01/04/2006- Length: 10 years
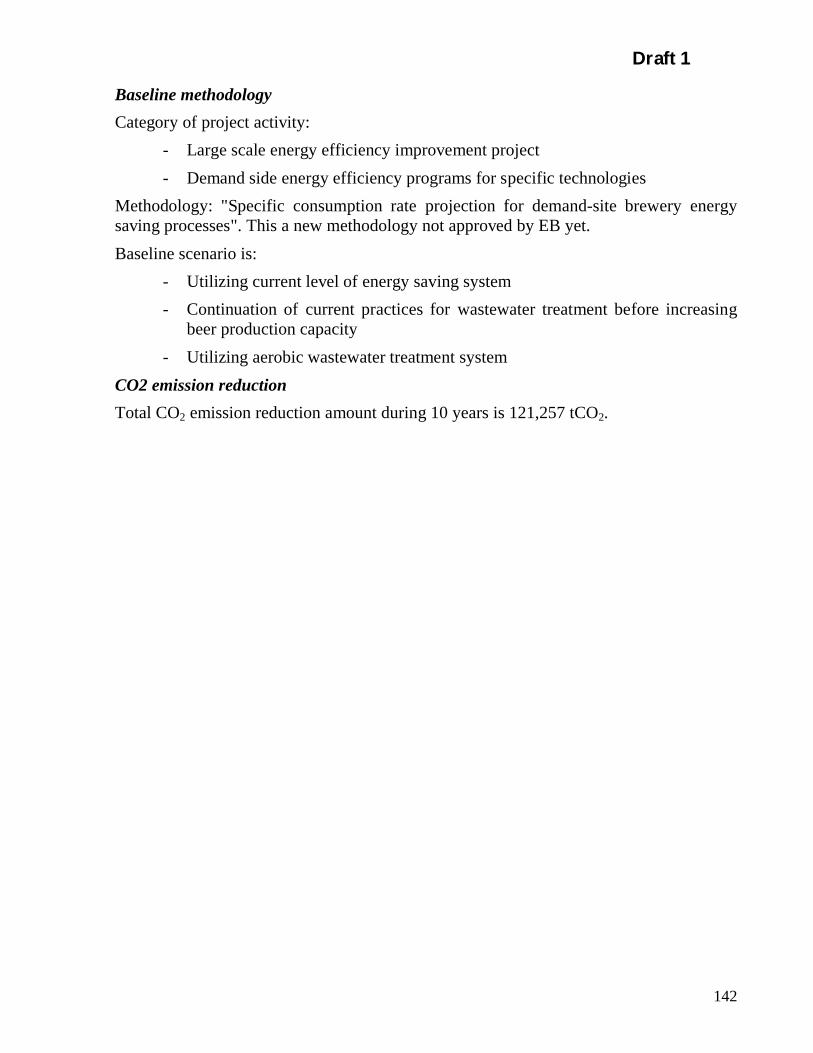
Draft 1
142
Baseline methodologyCategory of project activity:
- Large scale energy efficiency improvement project- Demand side energy efficiency programs for specific technologies
Methodology: "Specific consumption rate projection for demand-site brewery energysaving processes". This a new methodology not approved by EB yet.Baseline scenario is:
- Utilizing current level of energy saving system- Continuation of current practices for wastewater treatment before increasing
beer production capacity- Utilizing aerobic wastewater treatment system
CO2 emission reductionTotal CO2 emission reduction amount during 10 years is 121,257 tCO2.
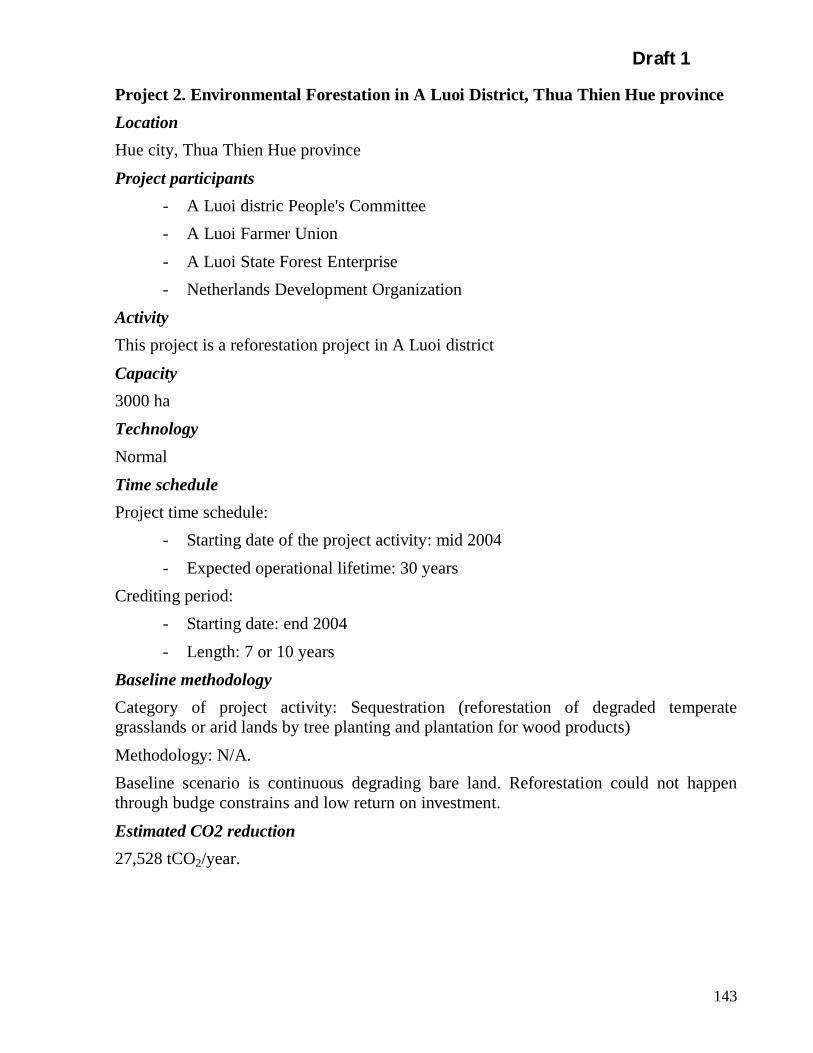
Draft 1
143
Project 2. Environmental Forestation in A Luoi District, Thua Thien Hue provinceLocationHue city, Thua Thien Hue province
Project participants- A Luoi distric People's Committee- A Luoi Farmer Union- A Luoi State Forest Enterprise- Netherlands Development Organization
ActivityThis project is a reforestation project in A Luoi district
Capacity3000 haTechnologyNormalTime scheduleProject time schedule:
- Starting date of the project activity: mid 2004- Expected operational lifetime: 30 years
Crediting period:- Starting date: end 2004- Length: 7 or 10 years
Baseline methodologyCategory of project activity: Sequestration (reforestation of degraded temperategrasslands or arid lands by tree planting and plantation for wood products)Methodology: N/A.Baseline scenario is continuous degrading bare land. Reforestation could not happenthrough budge constrains and low return on investment.
Estimated CO2 reduction27,528 tCO2/year.

Draft 1
144
Project 3. Song Con 2 HydroelectricityLocationDong Giang district, Quang Nam province
Project participants- Song Con Joint Stock Company- Central Construction Corporation- Research Center for Energy and Environment and Asian Carbon Group
(project developer)ActivityHydro electricity generation
Capacity57 MWTechnologyNormalTime scheduleStarting date of operation: N/AStarting date of construction: N/AExpected operational lifetime: 30 yearsBaseline methodologyCategory of project activity: Renewable electricity generation for a grid.Methodology: A new methodology will be proposed.Baseline scenario is: Viet Nam national electricity grid.Estimated CO2 reduction110,448 tCO2/year.

Draft 1
145
Project 4: Development of renewable energyBackgroundViet Nam has big potential of renewable energy: 2000 MW of small hydro-power, 80MW of biomass power, 100 MW of household hydro-power, 1 MW household solarbattery, rich wind power sources in coastal zones and islands.Project on renewable energy aim at rapid application of new energy technology throughelimination of barriers and reduction of implementation costs. The project includes 2components: (i) Investment of technology (ii) Capacity building through exploitation ofrenewable energy sources. The project will also aim at mitigation of GHG emissions andraise living standard of the people in remote and isolated areas.
Project objectives- To exploit renewable energy potential to serve socio-economic development
and raise the living standard of the people, particularly in remote areas.- To mitigate greenhouse gases emissions.
ActivitiesInvestment of technology:- Small hydropower network: 200 small hydropower systems in villages.- Wind-diesel combination: Replacing the existing diesel systems in islands by
wind-diesel combination systems with rational distribution mechanism.- Small household-scale hydropower stations.- Household-scale solar energy system.
Capacity strengthening to eliminate barriers- Developing appropriate policies and supporting the use of this kind of energy.- Developing trading skills, marketing strategy, distribution and consumption
services.- Developing technology and personnel training- Encouraging demands, raising public awareness.
Expected outputs- Set up electricity network using wind, solar and hydropower;- Train technical staff in manufacture, distribution and consumption, etc.;- Improve living standard of the people in the remote and isolated areas; Created
employment for the- Labors.
Implementation budgetTotal budget: US$ 50,000,000

Draft 1
146
In which: GEF: US$ 10,000,000WB: US$ 20,000,000Government inputs: US$ 20,000,000
Implementation duration: 2005-2009
Draft 1
147
Project 5: Energy saving in industryBackground At present, technology of Viet Nam industry is still backward with low energy useefficiency. The potential for energy saving is very high. In comparison with present hightechnology, energy saving potential in Viet Nam industry is 10-13%, in electricity savingis 4-6%. Therefore, the improvement of efficiency in industrial enterprises wouldsignificantly mitigate GHGs emissions.This project is one of important projects of the on-going Energy Saving Program in VietNam. The project outputs could help big enterprises to save energy, decrease products’prices and increase their competitiveness as well as mitigate waste gas emissions,including GHGs emissions.Project objectivesTo demonstrate, introduce energy saving and efficient measures in industrial industries inorder to mitigate energy consumption and protect environment.Activities
- Auditing energy in 80 big plants, occupying 50% of energy consumption.- Installing an energy management system.- Educating and training staff.- Demonstrating co-generation capacity
Expected outputsThe project is divided into 2 phases:For the first phase, the estimated outputs are as follows:
- Install energy management systems at plants within the project framework;- Train energy auditing staff and operators for energy management systems.
For the second phase:On the basis of the results of the first phase, a demonstration model of co-generation atbig well equipped plants will be established.Implementation budget: For the first phase: US$ 3.3 million
Expected implementation duration: The first phase: 2 years

Draft 1
148
Project 6: Encouraging utilization of renewable energy in rural areasBackground The project is implemented within the framework of Viet Nam Energy SavingProgram. The project aims at popularization of knowledge of renewable energy forms,development of organization and management including institutional and financialmechanisms to introduce and apply new energy technologies, to assist elaboration oflocal technologies.Objectives
- To develop cooperative program among relevant agencies to remove the barriersfor utilization of renewable energy.
- To introduce renewable energy technologies.Project activities
- Developing cooperative programs among relevant agencies.- Developing legislative mechanism, strengthening implementing capacity to
remove barriers in- Utilization of renewable energy.- Advertising, encouraging the enlargement of market of renewable energy
technologies.- Encouraging domestic design and manufacture of renewable energy equipment.
Expected outputs- Strengthen capacity and raise awareness of utilization of renewable energy;- Prepare pre-feasibility report on utilization of renewable energy in rural areas.
BudgetUS$ 460,000Implementation duration: 2005 - 2007Implementing agencies: Energy Saving Program, Ministry of Science, Technology
and Environment, Provincial Departments of Science, Technology and Environment, VietNam Electricity.

Draft 1
149
Project 7: Project on forest plantation on sandy soil in the coast of the SouthernCentral Viet NamBackgroundIn 1998, the National Assembly of the Socialist Republic of Viet Nam approved the 5-million hectare forestation Programme. According to the programme, during the periodof 1998-2010, among 5 million hectares of newly planted forest, there would be 60.000hectares of coastal protective forest. It is mainly forest bands for preventing sandmovement in the central coastal zones.The coastal zone in the Southern Central Viet Nam, bounded by the coast and theNational Road No 1, is mainly covered by sea sand. In this zone, there are many movingsand areas and unused sand dunes or few shrubs. That is why not only crops andinfrastructure but also living habitats of the local people are threatened by sand wind andtyphoons.It is an urgent need to plant and improve coast protective forest in order to mitigate thelosses caused by sand moving. This area is one of the first priority areas in the forestationprogramme of Viet Nam.Project objectives
- To improve productivity of the cultivated lands located behind the newlyplanted forest and the improvement of environment would make a part ofunused land due to sand invasion cultivable to produce more products for thelocal people.
- To provide a significant portion of firewood for the local people throughsecondary products gained from forest nursery practices (pruning, trimming).
- To create jobs and income for the local people involved in forest plantation andprotection.
- To contribute to bio-diversity improvement and environmental conservation inlarge coastal zone.
Activities- Planting 11,015 hectares of sea pines, sandalwood trees on the sandy soil of the
Southern Central Viet Nam coastal zone at 55 planting sites.- Building logistic bases for forest plantation (operation roads, temporary nursery
gardens, houses, etc.- Providing equipment and materials for forest planting.
Expected outputsPlant 11,015 hectares of protective forest consisting mainly of sea pines, sandalwoodtrees in 4 provinces: Quang Nam, Quang Ngai, Phu Yen and Khanh Hoa. In which:
- Quang Nam: 4,043 hectares- Quang Ngai: 1,959 hectares

Draft 1
150
- Phu Yen: 2,810 hectares- Khanh Hoa: 2,203 hectares
Project budget: US$ 11.5 millionExpected duration: 5 years, starting in 2005, ending in 2009.

Draft 1
151
Project 8: Improving cooking stoves of the rural - mountainous communityBackgroundThe 80% population of Viet Nam lives in the rural and mountainous areas. Normally, thepeople use biomass fuel such as firewood, agricultural residuals in cooking. The use ofthis kind of fuel would remain in many decades to come. The main reason is thealternative energy sources such as electricity, gas etc. are still very expensive or unable tobe widely popularized in rural and mountainous areas of Viet Nam.Forest is a main source of firewood for households. However, forest is exhausting day byday so far. Although firewood source is more and more limited, the use of firewood iswasteful and inefficient. Most of households use traditional cooking stoves - the openingstoves that have been used for thousands years. Low burning efficiency of these stovesleads to high fuel consumption and emission of harmful gases that may have adverseimpacts on the health, particularly of the old, women and children.Therefore, it is very important, necessary and urgent to introduce widely the improvedcooking stoves (improvement in both burning efficiency and heat conductibility) suitableto traditional cooking habits of local people.Project objectives
- To save fuel used for households;- To release and reduce smoke and dust in kitchen of rural households.- To reduce illness caused by emitted smoke from stoves.- To contribute to protect forest resources.- To mitigate GHGs emissions through reduction of fuel consumption.- To create opportunities and jobs for poor people in rural areas, contribute to
alleviate poverty as well as the hardship of women.
ActivitiesIt is planned to carry out the project in nation-wide scale for 7 ecological zones
with the following main activities:- Developing institutional framework for cooking stoves improvement program of
national scale.- Conducting an investigation and feasibility study for pilot sites, carrying out
widely application of improved stoves.- Setting up systematic dissemination on mass media (radio, newspapers,
television).- Organizing training courses on improved cooking stoves.- Transferring technology – marketing.

Draft 1
152
Expected outputs- One million rural households could be able to use improved cooking stoves
through direct and indirect financial support.- Create jobs for about 3 thousands people through manufacturing and trading
improved cooking stoves, contribute to poverty alleviation.- Strengthen capacity for research and technology transferring institutions.- Contribute to forest protection, especially the 5-million hectare afforestation
program (up to 2010).- Reduce about 30 % of GHGs emissions in comparison with the present thank to
fuel saving.
BudgetThe total budget is US$ 350,000:- Project preparation and demonstration US$ 50,000- Region-scale implementation US$ 100,000- Nation wide scale implementation US$ 200,000
Expected durationFrom 2005 to 2011, consisting of 3 phases:1. 2005 - 20062. 2007 - 20093. 2009 - 2011

Draft 1
153
Project 9: Using biogas as fuel to mitigate greenhouse gas emission in ruralareasBackgroundThe orientation of Viet Nam husbandry from now to 2030 is following: Developinghusbandry following commodities production approach, focusing on raising pig, poultry,dairy cattle, cow and expanding husbandry areas as farm scale, delineating areas forconcentrated husbandry. Up to now, Viet Nam has rather significant number of cattleheads and poultry. According to statistical data of 1999: pig: 19 millions, buffalo: 3millions, cow: 4 millions, poultry: 179 millions. However, waste from domestic cattle isnot processed, but often exposed to the sun or gathered in a neat heap resulting inpollution and bad condition of hygiene in rural areas. On other hand, most of ruralinhabitants use straws, firewood, coal for cooking and this is also a significant CO2emission source. Therefore, the building of biogas tanks in husbandry areas could notonly process cattle waste to make environment clean, but also reduce firewood forcooking, liberate women’s labor in rural areas.Project objectives
- To build biogas systems containing cattle waste to generate methane used asfuel for cooking in rural areas in order to reduce methane and CO2 emissions.
- To protect clean environment in rural areas.- To help farmers to save fuel consumption.- To raise awareness of the people on environment and GHG mitigation.
Activities- Popularizing benefits of the use of biogas instead of conventional fuel and
raising awareness of the people on environment and GHG mitigation.- Selecting technologies and models for building appropriate biogas tanks for
specific locality.- Building 500,000 biogas tanks with various volumes from 5 to 12 m3 in
different rural areas, focusing on the concentrated husbandry areas.- Organizing training courses for the technicians who will guide the construction
and use of biogas stoves.- Conducting measurement, monitoring the reduced methane emission thanks to
using biogas.Expected outputs
- Raise awareness of the farmers on environment and GHG.- Build 500,000 well-operated biogas tanks, saved expenditure on cooking fuel
for rural households.

Draft 1
154
- Reduce methane and CO2 emission from 2 sources: management of fertilizerand burning materials in the rural areas with the total of 2.7 million tones ofCO2 equivalent during a period of 20 years.
- Improve environment in rural areas and liberate women’s labor thanks toreducing cooking time.
Project budget: US$ 1,500,000In which:- Farmer’s input : U S $ 300,000- Government input : U S $ 500,000- GFF input : U S $ 700,000
Expected duration: from 2005 to 2007.
Draft 1
155
Project 10: Research on co-generation technology (electricity and heat) frombiomass fuel in Viet NamBackgroundRenewable energy, including biomass energy is considered as clean energy sources andsolutions to mitigate GHGs. Because while burning biomass, there is the neutralization ofCO2 emission, and SOx emission almost equals to zero due to the absence of sulfur in thecomposition of the fuel.
Viet Nam has big potential in biomass fuel source. Annually, the agricultural cast-off is more than 40 million tones, equivalent to about 20 million tones of coal dust. It isestimated that annually, the agricultural cast-off would increase about 2%. At present,there is more than 10% of the above cast-off such as rice husk, sugar cane dregs in riceand sugar mills that are very suitable for development of cogeneration technology (orcombined electricity-heat generation). Thus, while applying the above mentiontechnology, beside the adequate provision of energy to the mills, the surplus electricitywould be added to the national electricity network or sold out directly to the surroundingadditional charge. The potential of technical capacity from this fuel form is about 300MW for the period from 2001 to 2010.
Objectives- To strengthen capacity of sustained exploitation and effective utilization of the
existing local biomass fuel in order to be less dependent on fossil fuel and tomitigate GHGs emissions.
- To create a reliable electricity and heat supply source with competitive, cheapprices (thank to reduction of transportation losses) for of rice and sugar mills,and consequently, to reduce production cost, improve product quality and toincrease the competitiveness of enterprises.
Activities- Assessment of the present status of biomass fuel development plan for energy
co-generation in Viet Nam.- Preparation of pre-feasibility and feasibility reports, building of demonstration
models for 3 - 4 factories with capacity of 10 MW.Expected outputs
- Generate electricity with expected potential capacity of 300 MW, being lessdependent on coal.
- Neutralize CO2 emission (non-CO2 emission) by using the existing biomasssuch as rice husk, straw, sugarcane dregs, etc.; SOX emission would be almostzero because there is not sulfur in biomass fuel.
Project budgetTotal: US$ 135,000 including:

Draft 1
156
- Phase 1: Assessment of current status and planning: US$ 60,000;- Phase 2: Pre-feasibility and feasibility studies: US$ 75,000Expected duration: 3 years, from 2005 to 2008. The period is divided into 2
phases:- Phase 1: Planning from 2005 to 2006- Phase 2: Preparation of feasibility report from 2006 to 2008.

Draft 1
157
Project 11 : Project on energy conservation and saving in small and medium-sizedenterprisesBackground
- The project is implemented within the framework of Energy Saving Programand GEF Strategy for the period of 2000 - 2010.
- The potential of energy saving and GHG mitigation in small and medium scaleenterprises of Viet Nam is very high. It is estimated that the value may reach13% for thermal energy and 6% for electricity energy.
- Awareness on energy saving is not yet high, financial capacity is low.Objectives
- To support the saving of energy in the small and medium scale enterprises.- To strengthen the implementing capacity and policy mechanism to facilitate the
adaptability of efficient energy technology in small and medium scaleenterprises.
- To set up Energy Information Center for small and medium scale enterprises.- To monitor the implementation of energy efficiency and environment projects in
small and medium scale enterprises.- Activities:- Identifying the sector of small and medium scale enterprises to be put under
energy audit.- Removing barriers of technology application and successful implementation in
small and medium scale enterprises in order to reduce energy consumption andmitigate GHGs.
- Developing an education and training program for managers, auditors andexperts in small and medium scale enterprises.
- Developing energy-saving projects for small and medium scale enterprises.Expected outputs
- Fulfill energy audit in small and medium scale enterprises;- Train energy auditors and energy managers for small and medium scale
enterprises.- Set up Energy Information Center for small and medium scale enterprises.
Estimated budgetUS$ 1.5 million
Implementation duration: 2005 - 2008 (3 years).Estimated after-project investment: US$ 5.5 - 8.5 millions

Draft 1
158
Project 12 : Wind power stations for the people in remote island (Coto island,Quang Ninh province)BackgroundThe Coto Island - one of the big islands in Quang Ninh province - is located in thearchipelago in Northeast Viet Nam, about 60 miles from the land with the area of 3850hectares. By 2000, the island’s population is 2308. The island has rich economicpotential. However, the living standard of people is still low with few supplementaryjobs. The main income sources of the island’s inhabitants are from agriculture andfishery. The cultural life is poor. Electricity for living is diesel generated. Because of thefar distance, diesel supply is very difficult resulting in rather high price of electricity(VND 2,500 per kWh). The island could not access to national electricity network due tolong distance from main land.Wind power potential of the island: In Coto island, during winter, from October toMarch, the dominating wind is Northeast with frequency from 50% to 70 % per monthand average speed of 5.5 mps. Thus, the places open to the northeast or favorable fornortheast wind have very high wind power potential.Project objectives
To generate electricity using wind energy in combination with diesel to reduceelectricity price as well as to protect environment.Activities
- Survey to prepare pre-feasibility and feasibility justifications- Detailed design- Install equipment, operate and hand over the project
Expected outputs- Install wind motors with capacity of 500 kW (phase 2002 - 2005) and 1000 kW
(phase 2005 - 2010).- By the end of the first phase, 95 % of households could be accessible to
electricity for living; By the end of the second phase, electricity supply couldmeet 95% demands for living and 90% demands for production.
Budget: The estimated budget is US$ 200,000Estimated duration:
Phase 1: 2005 - 2008Phase 2: 2008 - 2013

Draft 1
159
Project 13: Project on planting protective forest in the watershed of Ngan Sau, NganPho RiversBackgroundViet Nam is located in the Southeast Asia with a population of more than 70 million.About three fourth of its territory is hilly and mountainous areas. The existing forest areais 9.3 million hectares. Forest plays an important role in economy, society, ecologicalenvironment and national security. In recent years, the irrational utilization of forestresources resulted in unforeseen consequences. The high rate of forest degradation inboth area and quality led to decreasing of forest cover in Viet Nam.The degradation of forest quality, especially forest in river watershed has resulted in badconsequences such as unusual floods and inundation, soil erosion, etc. and that in theirturn threat the sustainability of national economy, normal life of millions people indownstream and bio-diversity. The 5-million hectare forestation programme wasapproved by the National Assembly of the Socialist Republic of Viet Nam in 1998.According to the plan, among 5 million hectares of newly planted forest there would be1,735,000 hectares of watershed protective forest planted during the period of 1998- 2001It is an objective and urgent need to quickly restore forest in Ngan Sau and Ngan Phoriver watershed in order to set up and stabilize the protective forest system in this area; toimprove and raise the living standard of the local people and to contribute actively inflood/inundation prevention, stabilize political life and social security in the westboundary area of Ha Tinh province, in particular, and the country, in general.Project objectives
- To develop and improve the protective forest system in Ngan Sau, Ngan PhoRivers watershed in order to prevent soil erosion, protect water sources andlocal environment, to enhance the absorption sinks and minimize the possibleimpacts on droughts, floods and inundation.
- To increase forest coverage in this area from 51% at present to 64% by 2010.- To improve forest quality, to increase the ratio of rich and medium forest from
31% at present to 46% by 2010.- To create jobs for 5180 households living nearby forest area, to attract more
than 8,700 labors into forest protection, planting protective forest and doingagro-forestry production.
Activities and expected outputsActivities
- Protecting 84,410 hectares of the existing forest and 36,021 hectares of thenewly planted forest (in the period from 2001 to 2012);
- Delineating areas for growing and restoring 20,442 hectares of forest during theperiod of 2001 - 2012, in which 5,214 hectares is in very important and 15,228hectares is in important areas. XXX

Draft 1
160
- Planting forest and carrying out agro-forestry including planting concentratedforest and building forest gardens, forest farms in Huong Khe, Huong Son, DucTho districts.
Expected outputs- Protecting 80,241 hectares of natural forest and 4,169 hectares of exist planted
forest in project area.- Planting 42,114 hectares of new forest, in which: Delineating areas for forest
restoration: 20,442 hectares Newly planted forest : 15,579 hectares- Building forest gardens, forest farms : 6,093 hectares
Project budget: US$ 7,01 millionExpected duration: from 2005 to 2014.

Draft 1
161
Project 14: Irrigation management of wetland rice field to reduce methane emissionBackgrounds
Viet Nam agriculture is based on two main branches: cultivation and husbandry.Cultivation plays an important role, in 1994, it produced 77.3% of total agriculturalproducts. In cultivation, there are rather multiform cereal crops with various varieties.Rice is the main food cereal crop in Viet Nam. Together with application of newtechnology, Viet Nam regularly improves of the irrigation systems, particularly those forwetland rice fields. The channel systems at various levels (I, II and III, IV and V) are setup and put into operation to serve food and foodstuff production.The National Strategy for improvement of irrigation systems to 2020 has been developed.One of the main objectives is to ensure water used in agriculture with improved irrigationand drainage techniques in order to get high crop yield. Conservation of water resourcesis also one of main policies of the Government to attain sustainable development (Law onWater Resources).This project aims at reducing methane emission by rational irrigation and drainagemanagement with draining out water in two growing periods: stem spreading and beforeharvest. Meanwhile, the project also brings about the following benefits: (i) saving waterand (ii) increasing rice yield - the targets mentioned in the National Strategy and NationalAgricultural Programme.Project objectives
- To reduce methane emission from wetland rice fields.- To develop a comprehensive technical manual for irrigation management in
wetland rice fields with the aim of increasing rice yield.- To strengthen capacity of technical and management staffs to implement
appropriate irrigation techniques procedures.- To raise public awareness on climate change.
Activities- Setting up a mechanism, legislation from the central down to provincial levels in
regulated irrigation management, meanwhile establishing the project-management committees at various levels;
- Conducting surveys and selecting the areas feasible for implementation of theregulated irrigation management.
- Conducting experimental measurement and monitoring on methane emissionreduction from the wetland rice field.
- Building pilot active irrigation/drainage management systems.- Organizing educational and training courses for water management technicians.

Draft 1
162
Outputs- Detailed technical manual on water irrigation for wetland rice fields;- Upgraded irrigation systems, especially those of third and fourth levels;- Trained staff of water management, policymaking, project management and
supervision.- Strengthened capacity on water management.- Project achievements are extended to other areas.- Reduced methane emission: 37,000 tones during the period of 20 years.
Total budget: US$ 5,025,000- Input from GEF is US$ 1,525,000- Input from Viet Nam government is US$ 3,500,000
Expected duration: from 2003 to 2004 (02 years)
Draft 1
163
Project 15: Exploitation of geo-thermal energy in Viet NamBackground
Viet Nam has potential in geo-thermal energy that can be utilized in electricitygeneration, particularly in various areas of Central Viet Nam. It is estimated that in thisregion, a capacity of 50 MW can be developed from geo-thermal hot water sources.However, it is necessary to evaluate this potential in details in order to make plan forfurther exploitation.Project objectives
- To assess feasibility of developing 50 MW from geo-thermal hot water sourcesin provinces of Central Viet Nam.
- To establish maps on geo-thermal energy potential.Activities
Exploration drilling to collect data on:- Maps of regional geo-thermal energy; Evaluation of heat and temperature of
geo-thermal liquid.- Assessment of socio-economic impacts resulted from the construction and
operation of geo-thermal energy plants.- Development of plan and projection on the exploitation of the national geo-
thermal energy.Expected outputs
- Clearly identify potential of geo-thermal energy of the country.- Comprehensive projection on exploitation of geo-thermal energy.
Implementation budget:PDFB of GEF : US$ 300,000Government inputs: US$ 100,000
Implementation duration: 2005-2008

Draft 1
164
THE LIST OF AUTHORS
1 Mr. Nguyen Khac HieuDeputy Director General, International Cooperation Department, Ministry ofNatural Resources and Environment
2 Mr. Ninh Van HiepDirector, Institute of Socio-economic Development for Rural and Mountainousareas
3 Prof. Bui Huy PhungViet Nam Academy of Science and Technology
4 Prof., Dr. Nguyen Tien NguyenDeputy Director, Research Center for Energy and Environment
5 Dr. Nguyen Van SiemScience and Technology Department, Ministry of Transport
6 Dr. Pham Khanh ToanDirector, Institute of Energy, Ministry of Industry
7 Dr. Nguyen Van HanhInstitute of Energy, Ministry of Industry
8 Mr. Hoang Manh HoaSenior Expert on Climate Change, National Office for Climate Change and OzoneProtection, International Cooperation Department, Ministry of Natural Resourcesand Environment
9 Mr. Nguyen Mong CuongDirector, Research Center for Climate Change and Sustainable Development
10 Mr. Phung Tuu BoiViet Nam Forestry Science and Technology Association
11 Mr. Pham Van KhienInstitute of Agricultural Economics, Ministry of Agriculture and RuralDevelopment
12 Dr. Nguyen Chi QuangHa Noi University of Technology, Ministry of Education and Training

Draft 1
165