ASSESSING THE BIODIVERSITY IN VIET NAM - BIODEV2030
73
© WWF-Viet Nam / Thanh The Vinh OCTOBER 2021 | FINAL REPORT ASSESSING THE BIODIVERSITY IN VIET NAM ANALYSIS OF IMPACTS FROM ECONOMIC SECTORS FUNDING COORDINATION IMPLEMENTATION IN VIET NAM In cooperation to facilitate biodiversity engagement
-
Upload
khangminh22 -
Category
Documents
-
view
2 -
download
0
Transcript of ASSESSING THE BIODIVERSITY IN VIET NAM - BIODEV2030

© WWF-Viet Nam / Thanh The Vinh
OCTOBER 2021 | FINAL REPORT
ASSESSING THE BIODIVERSITY IN VIET NAMANALYSIS OF IMPACTS FROM ECONOMIC SECTORS
FUNDING COORDINATIONIMPLEMENTATION IN VIET NAM
In cooperation to facilitate biodiversity engagement

FOREWORDThe health of the ecosystem on which we and all other species rely for their survival has been deteriorating at an unpredictable rate. WWF's Living Planet Report 2020 shows an average 68% decrease in monitored vertebrate species populations between 1970 and 2016 of which status is considerably more serious in some key biodiversity hotspots. Biodiversity erosion has been affecting the livelihoods, food security, health and quality of life of people around the world, and also triggering our economic and financial risks. The urgent task now is to reverse the biodiversity loss and preserve ecosystems if we want to achieve the Sustainable Development Goals by 2050.
“Biodiversity Engagement Facilitation” Initiative - BIODEV2030 is funded by the French Development Agency (AFD), coordinated by Expertise France. This Initiative has been implemented in 16 pilot countries, of which Viet Nam is the only one located in Asia. In Viet Nam, the Initiative starts from July 2020 under the joint implementation and cooperation of the World Wide Fund for Nature in Viet Nam (WWF-Viet Nam) and the Nature and Biodiversity Conservation Agency (BCA) – an agency under the Viet Nam Environment Administration (VEA), the Ministry of Natural Resources and Environment. One of its ambitious goals is to build voluntary commitment models to transform production methods of at least two economic sectors towards minimizing negative impacts and enhancing positive ones on biodiversity, which will contribute to the process of halting biodiversity loss by 2030 and restoring biodiversity by 2050.
The scientific assessments of the status and drivers leading to biodiversity decline, of the economic activities’ impacts on biodiversity, and the analysis of stakeholders as well as the institutional and policy context of the country, will provide an important basis for stakeholders (including government, civil society organizations, businesses, and communities) to engage in dialogues in order to develop appropriate voluntary commitment models. Ultimately, the results from these voluntary commitment models will provide valuable practical experiences to help replicate the commitment models in Viet Nam; and to share with other countries including the Initiative-implementing ones through key international events in the United Nations Decade on Ecosystem Restoration (2021-2030).
The report “Assessing the biodiversity in Viet Nam – Analysis of Impacts from Economic Sectors” is the first in a series of scientific diagnosis activities under the framework of the BIODEV2030 Initiative in Viet Nam. Despite certain limitations in the data collection and analysis process, the report has outlined quite clearly the current status of biodiversity in Viet Nam, thereby pointing out the direct and indirect causes leading to biodiversity loss. At the same time, Aquaculture and Forestry have been identified as two sectors with great impacts on biodiversity loss in Viet Nam, which creates the premise for further in-depth studies to determine more clearly the extent, scale, and trend of impacts of these two economic sectors on Viet Nam biodiversity. On that basis, appropriate recommendations will be given for future transformational voluntary commitment models.
We would like to express our deepest appreciation to the assessment team led by Oréade-Brèche company for their great efforts to help us conduct this scientific diagnosis. Our special thanks also go to members of the Core Working Group of the Initiative in Viet Nam, organizations and individuals who have contributed ideas at our two previous consultation workshops and during the development of this report.
This independent assessment report is one of the research activities under the BIODEV2030 Initiative. The scientific diagnosis is conducted by an independent consortium led by Oréade-Brèche firm.
The views expressed in this report are those of the authors and do not necessarily reflect the views of the Nature and Biodiversity Conservation Agency (BCA) and the World Wide Fund for Nature in Viet Nam (WWF-Viet Nam). This publication serves as a reference for management agencies and organizations involved in biodiversity conservation including BCA and WWF-Viet Nam, and is considered for the development of appropriate policies and regulations on biodiversity conservation in the coming time
Suggested citation:
Thuaire B, Allanic Y, Hoang Viet A, Le Khac Q, Luu Hong T, Nguyen The C, Nguyen Thi T (2021). Assessing the biodiversity in Viet Nam – Analysis of the impacts from the economic sectors. WWF-Viet Nam, Ha Noi, Viet Nam.
For further information, please contact:
Mr. Vuong Quoc ChienEmail: [email protected]
Ms. Pham Thi Hai AnhEmail: [email protected]
World Wide Fund for Nature (WWF): One of the world’s largest and most experienced independent conservation organizations. WWF’s mission is to stop the degradation of the planet’s natural environment and to build a future in which humans live in harmony with nature by conserving the world’s biological diversity, ensuring the sustainable use of renewable natural resources, and promoting the reduction of pollution and wasteful consumption.
Nature and Biodiversity Conservation Agency (BCA): BCA is a functional agency under the Viet Nam Environment Administration (VEA), the Ministry of Natural Resources and Environment of Viet Nam. BCA provides the advisory function to help the Director General of the VEA in government management and law enforcement for nationwide nature and biodiversity conservation.
The original report is in English. The Vietnamese version is an unofficial translation.
© Luis Barreto / WWF-UK

ABBREVIATION
AFD French Development Agency (Agence Française de Développement)
BCA Nature and Biodiversity Conservation Agency
CBD Convention on Biological Diversity
CITES Convention on International Trade in Endangered Species of Wild Fauna and Flora
FPD Forest Protection Department
GSO General Statistic Office
IBAT Integrated Biodiversity Assessment Tool
LPI Living Planet Index
IEBR Institute of Ecology and Biological Resources
IUCN International Union for the Conservation of Nature
KBA Key Biodiversity Area
MARD Ministry of Agriculture and Rural Development
MOCST Ministry of Culture, Sports and Tourism
MOIT Ministry of Industry and Trade
MONRE Ministry of Natural Resources and Environment
NP National Park
NR Nature Reserve
NTFP Non-timber forest products
PA Protected Area
SFC State Forest Companies
SFE State Forest Enterprise
SIE Southern Institute for Ecology
STAR Species Threat Abatement and Restoration
VAST Vietnam Academy of Science and Technology
VEA Vietnam Environment Administration
VEPF Vietnam Environment Protection Fund
VFPDF Vietnam Forest Protection and Development Fund
VNFOREST Vietnam Administration of Forestry
UE Union European
UNCCD United Nations Convention to Combat Desertification
UNFCCC United Nations Framework Convention on Climate Change
WWF World Wide Fund for Nature
SUMMARYINTRODUCTION ...................................................................................................................................... 10
METHODOLOGY ..................................................................................................................................... 121.1. The approach, at a glance ................................................................................................................. 131.2. Literature review ................................................................................................................................ 13
1.2.1. Approach to review ecosystem diversity ..................................................................................... 131.2.2. Approach to review species diversity ........................................................................................... 161.2.3. Approach to review biodiversity-related policies and assess key economic sectors ............. 161.2.4. Data sources .................................................................................................................................... 17
1.3. Remote sensing analysis ................................................................................................................... 171.3.1. Land cover and land use changes at country level ..................................................................... 171.3.2. Land cover and land use changes at PA and KBA level .............................................................. 201.3.3. Remote sensing analysis at species level ..................................................................................... 20
1.4. Star metrics .......................................................................................................................................... 211.4.1. Goals and components .................................................................................................................. 211.4.2. Analysis based on global results ................................................................................................... 231.4.3. Analysis of the drivers of the threatened species ....................................................................... 23
LIMITATIONS OF THE STUDY ........................................................................................................ 242.1. Literature review ................................................................................................................................ 252.2. Remote sensing analysis ................................................................................................................... 252.3. Star analysis ......................................................................................................................................... 27
RESULTS .................................................................................................................................................... 283.1. Literature review at species level ................................................................................................... 29
3.1.1. Mammals ......................................................................................................................................... 293.1.2. Birds .................................................................................................................................................. 303.1.3. Amphibians and reptiles ................................................................................................................ 303.1.4. Other groups ................................................................................................................................... 313.1.5. Vascular plants ................................................................................................................................ 31
© Freepik.com

3.2. Literature review at ecosystems level ............................................................................................343.2.1. Ecosystems’ diversity in Viet Nam from a global study ...............................................................343.2.2. Ecosystem’s diversity from the literature review .........................................................................373.2.3. Ecosystems’ diversity in protected areas ......................................................................................43
3.3. Threat classification based on the literature review ..................................................................503.3.1. At species level .................................................................................................................................503.3.2. At ecosystem level............................................................................................................................553.3.3. Conclusion: a lack of quantitative and exhaustive analysis of the biodiversity threats ..........62
3.4. Remote sensing analysis ....................................................................................................................623.4.1. Land cover and land use change at country level ........................................................................623.4.2. Land cover and land use changes at PA and KBA level ...............................................................663.4.3. Analysis at species level ..................................................................................................................683.4.4. Economic sectors classification according to land changes analysis in Viet Nam ...................71
3.5. STAR analysis .........................................................................................................................................723.5.1. Contribution of Viet Nam in threat abatement and habitat restoration at global scale .........723.5.2. Threat’s classification based on threat abatement score from global dataset ........................723.5.3. Threats’ location according to start global datasets ....................................................................773.5.4. Economic sectors classification according to STAR metric in Viet Nam ....................................77
3.6. Policy review and economic sectors commitments .....................................................................783.6.1. International Environmental Agreements ....................................................................................783.6.2. Institutional and Legislation Framework to implement international commitments .............783.6.3. Economic sector assessment .........................................................................................................88
CONCLUSIONS AND RECOMMENDATIONS ............................................................................ 1084.1. Ten overall recommendations for mainstreaming biodiversity in policies, activities and
ensuring its conservation ........................................................................................................................ 1104.2. Specific recommendations for the economic sectors ............................................................... 112
BIBLIOGRAPHY ..................................................................................................................................... 114
ANNEXES ........................................................................................................................................................ 119Annex 1: The occurrence of threats and biome types in protected areas of Viet Nam .......................... 120Annex 2: List of documents for literature review related to Appendix 1 information. ............................ 122Annex 3: IUCN threats classification scheme (Version 3.0) ......................................................................... 130Annex 4: Detailed land cover and land use changes analysis between 2000 and 2018 at country level ....... 132Annex 5: Detailed land cover and land use changes analysis between 2000 and 2010 at country level ........134Annex 6: Detailed land cover and land use changes analysis between 2010 and 2018 at country level ....... 136Annex 7: Economic sectors commitments on biodiversity and possibility of achievement. ................... 138

FiguresFigure 1: Distribution of Curcuma vitellina in southern Viet Nam as seen on the IUCN Red List website. .......................................................................................................................................30Figure 2: Distribution of a plant ranked as VU in the Viet Nam Red Data Book (Part II. Plants, 2007). .......................................................................................................................................... 30
Figure 3: Ocean divisions. ....................................................................................................... 46
Figure 4: Land cover in 2000 .................................................................................................. 62
Figure 5: Land cover in 2018 .................................................................................................. 62
Figure 6: Land cover evolution for artificialized areas from 2000 to 2018 ....................... 62
Figure 7: Analysis of flooded forest areas converted in other uses between 2000 and 2018. .63
Figure 8: Analysis of mixed forest areas converted in other uses between 2000 and 2018. ....63
Figure 9: Analysis of mangroves areas converted in other uses between 2000 and 2018. .63
Figure 10: Analysis of forested areas converted in other uses between 2000 and 2018. 64
Figure 13: Distribution of endangered amphibian species in Viet Nam ............................ 67
Figure 14: Distribution of endangered reptile species in Viet Nam .................................... 67
Figure 15: Distribution of endangered mammal species in Viet Nam ............................... 67
Figure 18: Hotspots of biodiversity determined in Central Viet Nam ................................. 68
Figure 19: Chart depicturing the 10 highest START scores from the IUCN threats level 2 classification. ............................................................................................................................. 72
Figure 20: Chart depicturing in details the highest START scores from the IUCN threats level 3 classification. applied to amphibians. .................................................................................... 73
Figure 21: Chart depicturing in details the highest START scores from the IUCN threats level 3 classification. applied to mammals. ....................................................................................... 73
Figure 23: Annual & perennial non-timber crops distribution across Viet Nam. ............. 75
Figure 25: Forest cover change from 1943 to 2020 ............................................................. 84
Figure 31: Areas of Rubber plantation 2005-2018 ............................................................... 93
Figure 34: Brackish Shrimp Farming and Natural Mangrove Forest change 2000-2018 (Sources: GSO, FPD). .................................................................................................................. 98
TablesTable 1: Methods to obtain details data/information on ecosystem diversity, distribution and threats. 12Table 2: Number of assessed species of mammals, birds, reptiles, amphibians and fishes recorded in Viet Nam (Source: IUCN and GBIF, 2021). ...........................................................................................................................28Table 3: Populations trends for mammals, birds, reptiles, amphibians and fishes in Viet Nam (Source: IUCN, 2021). ......................................................................................................................................................................28Table 4: The realms, biomes and EFGs in Viet Nam. ........................................................................................33Table 5: Internationally recognized important area. .......................................................................................36Table 6: Forest areas by the origin .....................................................................................................................37Table 7: Protected areas in Viet Nam according to the Decision No. 1107/QD- BTN&MT dated May 12, 2015.. 37Table 8: The number and areas (ha) of protected areas that conserve different biomes (According to the Decision No. 45/QD-TTg). .....................................................................................................................................38Table 9: List of planned marine protected areas (enclosed to the Decision No. 742/QD-TTg) and the updates of establishment. ...................................................................................................................................................40Table 10: Ecosystem diversity in protected areas based on the Decision 1976. ...........................................41Table 11: Synthesis of wetland protected areas in the Mekong Delta. ..........................................................44Table 12: Classification of mammals, birds, reptiles, amphibians and fishes according to the IUCN Red List (Source: IUCN, 2021). ............................................................................................................................................48Table 13: Main threats to mammals, birds, amphibians, reptiles and fishes in Viet Nam. ........................49Table 14: Conservation needs of mammals, birds, reptiles, amphibians and fishes. ..................................49Table 15: Threats to vascular plants in Viet Nam (Source: IUCN Red List of threatened plant species, 2021). ... 51Table 16: Threats in protected areas based on the Decision 1976. ...............................................................53Table 17: Forest conversion between 2006-2014. ............................................................................................54Table 18: Reduction of coral reefs in some coastal regions in Viet Nam .......................................................55Table 19: Statistics of illegal logging and trading of wildlife in the period 2007-2013 ................................56Table 20: Number of alien and invasive plant species in studied PAs. ..........................................................58Table 21: Land cover and land use analysis at country level. .........................................................................60Table 22: Land cover and land use analysis at protected area level. ............................................................65Table 23: Land cover and land use analysis at KBA level. ...............................................................................65Table 24: Endangered species of Viet Nam according to the IUCN Red List by category and taxonomic group. 66Table 25: Number of threatened species per conservation status. taken into account in the STAR analyses. .... 70Table 26: Threat abatement and habitat restoration scores for Viet Nam (IUCN, 2021). ...........................70Table 27: START score tailored to the IUCN threats level 2 classification. .....................................................71Table 28: Area of forest converted to rubber between 2006 and 2013 .........................................................94Table 29: Sector impacts on natural resources. ............................................................................................. 103
© Freepik.com

The BIODEV2030 Initiative “Biodiversity engagement facilitation”, financially supported by AFD (the French Development Agency) and coordinated by Expertise France has started. Its overall goal is to assist sixteen pilot countries in leveraging commitments from economic sectors to stop biodiversity loss over the next decade. In other words, the initiative aims at mainstreaming biodiversity through sector-based commitments emerging from multi-stakeholder dialogue in these countries. The specific objectives of the initiative are to:
In Viet Nam, the initiative is implemented by WWF-Viet Nam and its partner – the Nature and Biodiversity Conservation Agency (BCA). The country is one of the world’s sixteen most biologically diverse countries. Over 50,000 species have been identified, consisting of nearly 7,500 micro-organisms, 20,000 terrestrial and water plants, 10,500 terrestrial animals, 2,000 invertebrates and freshwater fish, and over 11,000 marine species (UNDP, 2021). Nevertheless, as every country around the World, this biodiversity is strongly impacted by human activities. As part of the BIODEV2030 Initiative, WWF-Viet Nam hired a contractor to perform a study aiming to scientifically assess biodiversity decline, identify drivers, pressures and impacts caused by economic sectors to serve as a base to identify two business sectors targeted for voluntary biodiversity commitments. Specific objectives of this study are the following:
This analysis has been conducted through three complementary levels:1. Literature review focused on biodiversity, its threats and biodiversity policies2. GIS analysis,3. STAR analysis
This report describes the main outputs of these analyses. It indicates the methodology to collect and analyse data, it presents the key results, limitations of the study and the report propose a discussion.
Determine the scientific basis of voluntary multi-actor commitments for biodiversity at national level,
Support the country formalize voluntary national commitments on integrating biodiversity into economic sectors,
Contribute to the international debate through the dissemination of commitments and contributions discussed in Viet Nam.
Carry out a diagnosis analysis of drivers of, and pressures on, the decline of Viet Nam’s biodiversity caused by impacts of economic sectors by proposing and mobilizing scientific methodologies and assessment tools (e.g., STAR, IBAT, LPI, Ecological Footprint, others) which will help to robustly identify and scientifically measure the level of pressures from different economic sectors,
Pre identify the two economic sectors with the most significant (but politically and economically reversible) impacts on the decline of biodiversity and diagnose the drivers of biodiversity decline for these sectors,
Facilitate multi-stakeholder contributions to the identification of at least two sectors with strong impacts on biodiversity decline.
i
ii
iii
ASSESSING THE BIODIVERSITY IN VIET NAM – ANALYSIS OF IMPACTS FROM ECONOMIC SECTORS 11

1.1. The approach, at a glanceIn order to have a strong and comprehensive understanding of the biodiversity decline, our analyses have been carried out through both a species approach and a habitat approach, using a literature review, remote sensing tools and STAR metrics. The analyses have been performed at national level for understanding the economic sectors having the most significant and negative impact on biodiversity, but also at the protected areas level and the Key Biodiversity Areas level, which are nationally and internationally key areas for conserving biodiversity, especially regarding threatened species. Besides, our approach combines qualitative and quantitative analyses.
Our approach is based on three complementary methods:• A literature analysis aiming at getting a first idea of the biodiversity state (at species and habitat level), its threats and the biodiversity policies,• A remote sensing analysis aiming at understanding the drivers of the biodiversity decline at the habitat level, based on a long satellite imagery monitoring (2000-2018). This tool provides qualitative and quantitative information on a number of land changes,• A STAR (Species Threat Abatement and Restoration) analysis, based on scientific information collected by IUCN for threatened species.
1.2. Literature review1.2.1. Approach to review ecosystem diversityBiodiversity has been reviewed at 2 of its 3 levels, e.g., ecosystem and species level, since scientific publications on the genetic diversity in Viet Nam are limited and requires additional investigations that are not allowed in the timeframe and budget of this assignment. At the ecosystem level, our aim was to obtain the state of the knowledge of the existing ecosystems in Viet Nam, through the broader literature. For that we are answering the following key questions:
Which ecosystems are available in Viet Nam?
How have they changed over time?
What are the threats to them?
Where are they?
© Wirestock / Freepik.com
13

To understand the ecosystem diversity, we first need an ecosystem classification system that allows us to classify all existing ecosystems. In Viet Nam, usually each biome (e.g., forest, marine etc.) has their own classification system and a system that allows the systematic classification of all existing ecosystems has not been developed. We, therefore, used a global ecosystem classification system that allows us to have an overall and a consistent understanding of the ecosystem biodiversity across the country. The results from using the global classification system also allow us for the first time to compare with the regional and global level of ecosystem biodiversity. In addition, it also enables us to develop a red list of ecosystems in Viet Nam. Having an ecosystem classification system helps us answer the first questions. To answer the remaining three questions, we applied the following three methods for all of them and divided our ecosystem review work into three stages (Table 1):
Table 1: Methods to obtain details data/information on ecosystem diversity, distribution and threats.
STAGE METHOD DESCRIPTION STRENGTH WEAKNESS
Stage 1 – desk study
Using the existing literature (literature review)
- Systematic search for the required information in the literature
- With reliable data, this method provides detailed and accurate information at almost no cost.
- Some thematic studies from the literature can provide deep understanding about ecosystems
- Very time consuming
- We may miss lots of information from the grey literature which hardly can be accessed online.
- Can only be focused on the level of protected areas where the existing information/data is available.
- Sometime information is outdated and low reliability
Stage 2 – field mission
Using the information from the government agencies
- The central government agencies (e.g., MARD, MONRE) have basic information of the existing ecosystems under their management (i.e., protected areas).
- High level of details and accuracy
- Most updated and quantitative
- Highly reliable
- Hard to obtain the information/data from the central government
- Inadequate information since some information may need the support from the local government.
Stage 3 – desk study
Using land use map
- Using the current land use maps to understand the current stage of the land use, while in combination with the land use map of e.g., 10 years ago can reveal the land use change
- Understand at the national scale
- Can be updated information
- Have systematic information
- Need to acquire land use map over time
Threat classification and its scope of studyTo answer question 4, we also need to have a threat classification system that allows us to classify all threats. We used the IUCN threat classification scheme (Version 3.2) (IUCN, n.d.) that classify threats into 12 groups as follow:
We assessed threats on the basis of protected areas with the available information from the literature. We also used land cover change maps to identify the areas changed and that also allows us to understand various threats (e.g., no. 1-4, 7, 10 and 12).
At the protected areas level of study (i.e., stage 1 and stage 2), the following data /information have been collected:
1. Areas and distribution,2. Year of establishment or registration/recognition (applied to regional and international sites)3. Types of protected area (e.g., national park, nature reserve, landscape protection zone, species and habitat conservation area)4. State of knowledge about the ecological/biological characteristics (i.e., ecosystem types),5. Change in areas of the ecosystems,6. Past and current direct threats to the ecosystem/areas,7. Economic sectors have direct impacts on ecosystems.
(i.e., the development of housing and urban areas; commercial & industrial areas; tourism and recreation areas);
(i.e., habitat shifting & alteration; droughts; temperature extremes; storms & flooding; other impacts),
(i.e., volcanoes; earthquakes/Tsunamis; avalanches/landslides),
(i.e., fire & fire suppression; dams & water management/use; other ecosystem modifications),
(i.e., recreational activities; war, civil unrest & military exercises; work & other activities),
(i.e., domestic & urban wastewater; industrial & military effluents; agricultural & forestry effluents; garbage & solid waste; air-borne pollutants; excess energy),
(i.e., invasive non-native/alien species/diseases; problematic native species/diseases; introduced genetic material; problematic species/diseases of unknown origin; viral/prion-induced diseases; diseases of unknown cause),
(other threats).
(i.e., hunting & collecting terrestrial animals; gathering terrestrial plants; logging & wood harvesting; fishing & harvesting aquatic resources),
(i.e., road & railroads; utility & service lines; shipping lanes; flight paths),
(i.e., oil & gas drilling; mining and quarrying; renewable energy),
(i.e., annual & perennial non-timber crops; wood & pulp plantations; livestock farming & ranching; marine & freshwater aquaculture),
Residential & commercial
development
Agriculture & aquaculture
Energy production &
mining Transporta-
tion & service corridors
Biological resource
use
Human intrusions and distur-
bance
Nature system and
modifica-tions Invasive
and other problemat-ic species, genes and diseases
Pollution
Geological events
Climate change
and severe weather
Other options
12 3
4
5
6
79 8
12
11
10
ASSESSING THE BIODIVERSITY IN VIET NAM – ANALYSIS OF IMPACTS FROM ECONOMIC SECTORS 15

1.2.2. Approach to review species diversityAt species level, the key fauna and flora biodiversity taxa investigated are mammals, birds, amphibians, fishes, reptiles and angiosperms, which are also listed under national parks and nature reserves as well as at the National Biodiversity Database System (NBDS, http://nbds.ceid.gov.vn/). Global databases such as the Global Biodiversity Information Facility (www.gbif.org) and the IUCN Red List of Threatened Species (www.iucnredlist.org) were consulted. As long as the data were available, the following information was collected and detailed by taxonomic groups:1. Area of distribution,2. State of knowledge,3. Number of species,4. Endangered species,5. Special cases of species conservation in Viet Nam.
Special attention was given to the following species: nationally and/or globally threatened species according to the IUCN Red List, endemic species, species with little information, species for which the state of knowledge is not up to date or not reliable. For these taxa, the following information was collected:1. Area of distribution,2. Population and spatial dynamic,3. Conservation status,4. State of knowledge,5. Conservation and research needs.
The threats to the ecosystem and species level, as well as their links to economic sectors, were collected based on the IUCN threat classification scheme (Version 3.2), listed previously.
Results were summarized in the literature review report and in this final report. Illustrating maps were drawn, especially for biodiversity, at the ecosystem level.
1.2.3. Approach to review biodiversity-related policies and assess key economic sectors The review of the biodiversity-related policy has taken into account the major international agreements signed by Viet Nam as well as the main last main national legislation focused on the natural resources and biodiversity conservation.
The assessment of the economic sectors impacting biodiversity was analysed from the review of all relevant papers which stated their commitment to respond to biodiversity loss in Viet Nam. Regarding their commitments, the measurement applied here is to gather all relevant papers which state the orientation or specific commitment of biodiversity conservation (law, degree, strategy, circular, pledge for wildlife, etc.).
In addition, the role of the main Vietnamese institutions linked to the natural resources’ management have been described.
The economic sectors reviewed encompass key sectors identified has having a significant negative impact on biodiversity. These sectors are:
Agriculture Forestry Fishery Tourism Aquaculture
1.2.4. Data sources
1 https://www.landcovermapping.org/en/landcover/2 In this paper, the authors present further into details the Regional Land Cover Monitoring System (RLCMS) architecture that is customized to create land cover products using primitive map layers. Best practices are presented to create and assemble primitives from optical satellite using computing technologies, decision tree logic and Monte Carlo simulations to integrate their uncertainties.3 The project and its outcomes have been presented in the context of a regional land cover map based on a shared regional typology with 18 land cover classes agreed on by stakeholders from Cambodia, Laos PDR, Myanmar, Thailand, and Viet Nam.
EcosystemsFor the stage 1 (desk review), we collected information and data from reliable websites/organizations to obtain freely available resources. These can be peer-reviewed papers, scientific reports, management reports of government organizations, government decisions, consulting reports from NGOs, theses, etc. The searching approaches are: (1)
search by protected area (i.e., using the protected area name as the main keyword); (2) search by topic (i.e., keywords are the topics e.g., wetlands of Viet Nam, marine ecosystems of Viet Nam etc.). The aim of the search by protected area is to collect all required information for each protected area. The aim of the search by topic is to increase the potential to reach more information and data from detailed studies. With this approach, we obtained many valuable resources on the studies relevant to our interested topics. We performed the search on both google scholar and google search.
From the literature review results, we have found out that information from the literature is abundant and can provide a relatively good understanding of the patterns of ecosystem diversity as well as threats. However, to supply the results with more updated and reliable information, we seeked data support from the central government agencies in a field data collection (i.e., stage 2 – field mission).
SpeciesSpecifically, for animals, available datasets of the 2020 IUCN Red List (www.redlist.org) and the GBIF (www.gbif.org) for Viet Nam (2021) were freely downloaded and were analysed for extinction rates, threats, impact drivers, population trends, conservation
needs, etc. This dataset also provides distribution (point; GBIF) and occurrence (area size; IUCN) data that help to assume species’ distribution changes timely along with forest/land cover changes. Other specific and individual data were collected as supplementing data. Especially, data of highly endangered and conservation-concerned species were collected and analysed as cases/evidence of Viet Nam’s biodiversity decline and loss.
1.3. Remote sensing analysis1.3.1. Land cover and land use changes at country levelBiodiversity loss in terms of land use change was analysed for the 2000 - 2018 period using the Regional Land Cover Monitoring System1, which has been developed by the SERVIR-Mekong project (Saaha &al., 2020).A period of 18 years has been chosenIn 2020, D. Saaha & al.,, including international and Vietnamese famous organizations (such as
Forest Inventory and Planning Institute, National Institute of Agriculture Planning and Projection, Space Technology Institute -Viet Nam Academy of Science and Technology) drafted a scientific paper entitled “Primitives as building blocks for constructing land cover maps” that was released and accepted by the scientific journal such as Elsevier for example (https://doi.org/10.1016/j.jag.2019.101979)2, where further details are provided3.
ASSESSING THE BIODIVERSITY IN VIET NAM – ANALYSIS OF IMPACTS FROM ECONOMIC SECTORS 17

‘Deciduous forests’
are dominated by trees of which 60% of canopy cover have a tree height above 5 m. Deciduous tree species make up>60% of the total tree cover,
‘Evergreen broadleaf forests’
is dominated by trees of which 60% of canopy cover are trees above 5 m. Dominant tree species are evergreen broadleaf,
‘Mixed forests’ is defined as habitat with more than 60% tree canopy cover, tree height is greater than 5 m, and the forest composition is mixed such that no single forest type makes up more than 60% of the total tree cover,
‘Flooded forests’ have fresh water inland habitats with more than 10% of tree canopy cover, a tree height above 2 m, and seasonal or permanent flooding,
‘Mangrove’ is defined as coastal sediment habitats with more than 10% woody vegetation canopy cover and the majority of cover is higher than 2m,
‘Shrubland’ are lands where the majority of woody vegetation cover is less than 5m in height and greater than 10% canopy cover. Shrub species can be evergreen or deciduous,
‘Grassland’ are lands with herbaceous cover, where wetland obligate species are scarce,
‘Wetland’ are seasonally flooded regions dominated by herbaceous or shrub vegetation,
‘Barren areas’ are natural and semi-natural lands comprised of exposed soil, sand, and rocks,
‘Aquaculture’ is the farming of aquatic organisms, including fish, molluscs, crustaceans and aquatic plants. It includes man-made pond systems within fresh and salt water bodies or temporarily flooded regions,
‘Cropland’ includes lands with herbaceous and shrubby crops followed by harvest and a bare soil period (Loveland and Belward, 1997). This category includes single, mixed, multiple, and seasonal cropping systems,
‘Rice paddies’ include irrigated or flooded rice fields and low land paddy fields where rice is intensively planted for more than 1 cycle per year (can be 2 or 3 cycles). Rice is the only plant there,
‘Mining land’ are mostly exposed soil, sand, or rocks originating from mining, gravel production, or other human activity,
‘Orchard and plantation’
include lands cultivated with perennial crops that reach heights above 5m and occupy the land for long periods (Blanchez, 1997). Commercial tree crops in the region are mainly rubber, palm oil, cashew nut, and coconut plantations,
‘Built-up areas’ were defined as cultural lands covered by buildings, roads, and other built structures,
‘Surface water’ was defined as open water larger than 30m by 30m that is open to the sky, including fresh and saltwater.
Therefore, land changes are analysed for the following sectors:
agriculture, forestry, urbanization, mining, aquaculture.
The imagery resolution is 600 meters per side, that makes it possible to highlight major changes in land use, at the scale of a country.
This system distinguishes the following land cover classes: deciduous forest, evergreen broadleaf, mixed forests, flooded forests,
1 https://servir.adpc.net/
mangroves, shrubland, grassland, wetland and barren areas. Some land use classes are also found: aquaculture, cropland, rice paddies, mining land, orchard and plantation, Built-up areas. Datasets come from SERVIR Mekong1. More details on classes are given below:
© Vladimircech / Freepik.com
ASSESSING THE BIODIVERSITY IN VIET NAM – ANALYSIS OF IMPACTS FROM ECONOMIC SECTORS 19
Land use changes were calculated and summarized at national level for 2000 and 2018 giving an overall understanding of the land changes in Viet Nam. These calculations were summarized in a matrix table used (Annex 4) as a measurement tool between the two sets of data (2000 and 2018) to quantify and assess:
± Similarities (identical values between two sets of data),
± Evolution (values that have changed).
Additional data presenting the land use, land cover results between 2010 and 2018 are also presented in the report and in Annex 6.
To perform the analyses, the geographic coordinates have been used as a common basis between the two datasets. In the case of rasterized data, the analysis is made at the level of the raster cell. In the context of land use, the matrix makes it possible to assess the changes between two dates. For this, the land use data known at two different dates are geographically overlaid and the number of raster cells of each combination are counted and synthesized in the form of a matrix. Then, the number of cells is translated into area units.
1.3.2. Land cover and land use changes at PA and KBA levelIn addition to the analysis performed at the national level, an in-depth analysis has been performed at the protected areas and KBAs level. The shapefiles of the KBAs, date back to 2021, and is accessible on IBAT1 website, while the shape files of the Protected Areas date back to 2017 and is accessible from WDPA2 website.
1 https://www.ibat-alliance.org/data_downloads2 https://www.protectedplanet.net/en/thematic-areas/wdpa?tab=WDPA3 https://www.iucnredlist.org/resources/spatial-data-download
1.3.3. Remote sensing analysis at species levelAt species level, databases analysed were gathered from the global IUCN Red List website3 and from the Birdlife International that is assessing bird species according to the IUCN Red List methodology; year targeted was 2020 for all the taxon, except for the birds whose data date could be back to 2021. Areas of distribution of the assessed species were compiled on a single map in which the KBAs and PAs were also
located.
These maps are very important as they provide information on the distribution of threatened species in Viet Nam, thus giving a visual understanding of the location of the critical areas for threatened species. Coupled with STAR maps, they will allow decision-makers to select areas of interest. These maps allow determining presently known places of conservation importance in the country.
Further analysis regarding the evolution of distribution areas of threatened species over a period of time (e.g.: 2010-2020) were planned but IUCN was unable to share their historical records of threatened species datasets.
This analysis deals with threatened species (according to the IUCN methodology), meaning only species assessed as Critically endangered, Endangered and Vulnerable were included.
1.4. STAR metrics1.4.1. Goals and components
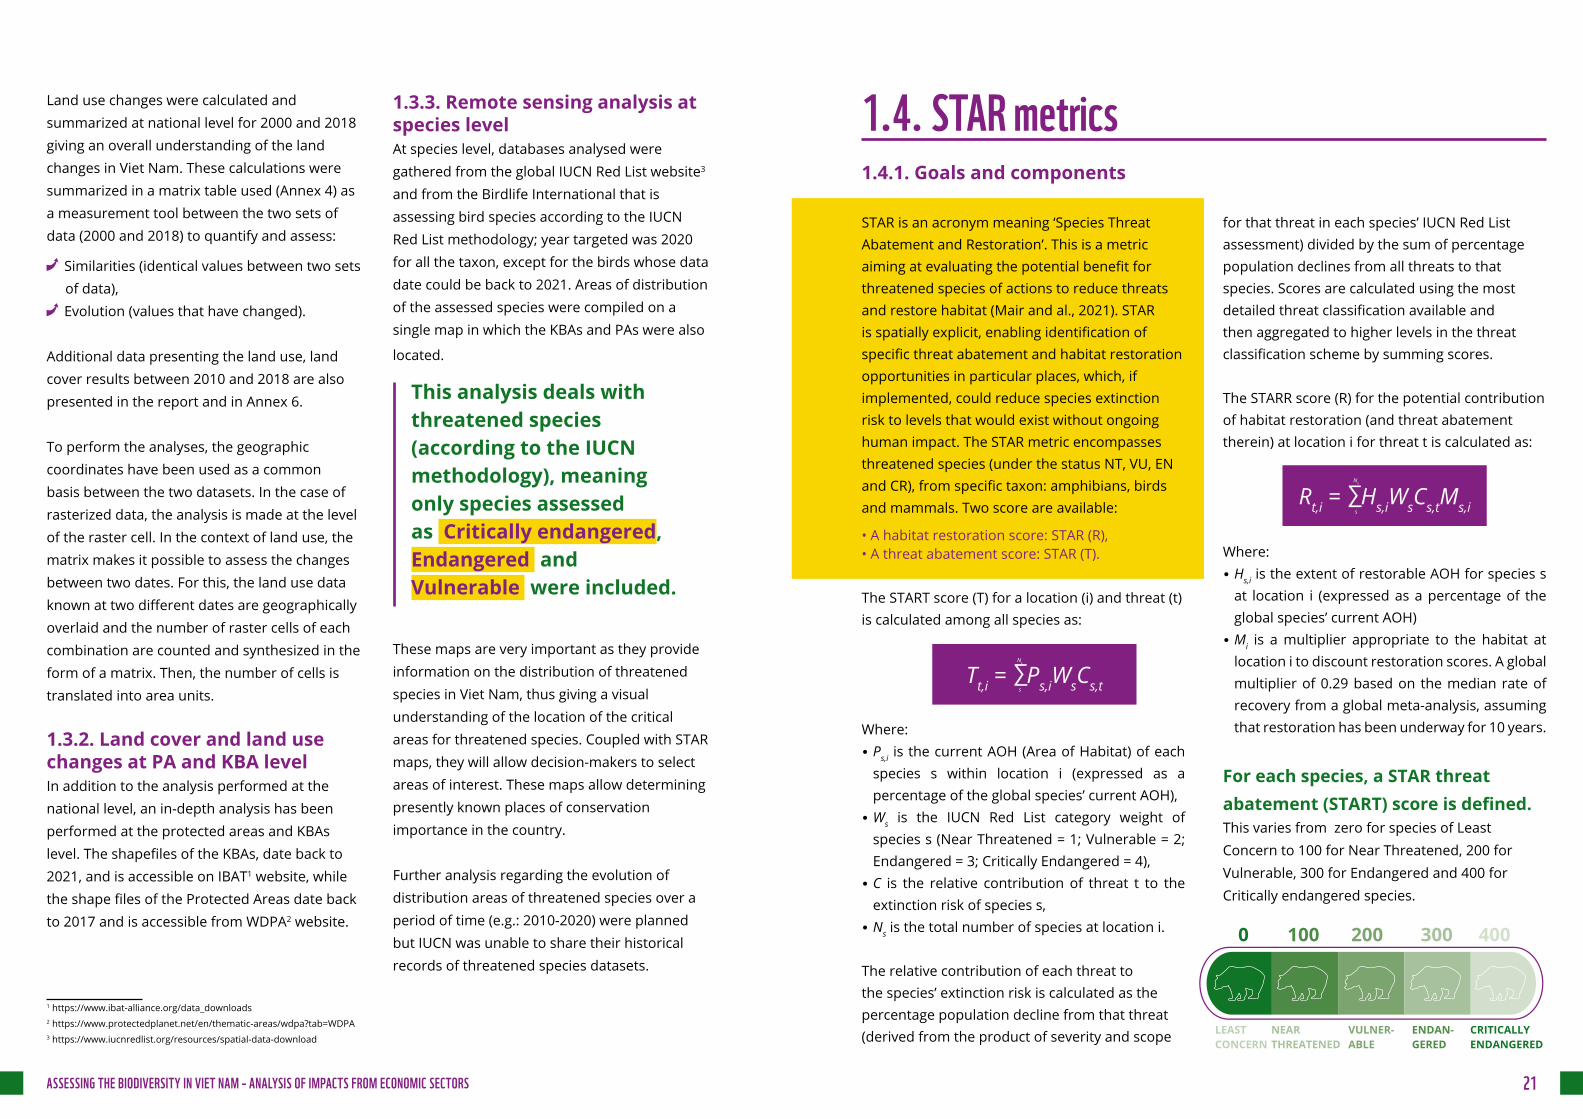
STAR is an acronym meaning ‘Species Threat Abatement and Restoration’. This is a metric aiming at evaluating the potential benefit for threatened species of actions to reduce threats and restore habitat (Mair and al., 2021). STAR is spatially explicit, enabling identification of specific threat abatement and habitat restoration opportunities in particular places, which, if implemented, could reduce species extinction risk to levels that would exist without ongoing human impact. The STAR metric encompasses threatened species (under the status NT, VU, EN and CR), from specific taxon: amphibians, birds and mammals. Two score are available:
• A habitat restoration score: STAR (R),• A threat abatement score: STAR (T).
The START score (T) for a location (i) and threat (t) is calculated among all species as:
Where:• Ps,i is the current AOH (Area of Habitat) of each
species s within location i (expressed as a percentage of the global species’ current AOH),
• Ws is the IUCN Red List category weight of species s (Near Threatened = 1; Vulnerable = 2; Endangered = 3; Critically Endangered = 4),
• C is the relative contribution of threat t to the extinction risk of species s,
• Ns is the total number of species at location i.
The relative contribution of each threat to the species’ extinction risk is calculated as the percentage population decline from that threat (derived from the product of severity and scope
for that threat in each species’ IUCN Red List assessment) divided by the sum of percentage population declines from all threats to that species. Scores are calculated using the most detailed threat classification available and then aggregated to higher levels in the threat classification scheme by summing scores.
The STARR score (R) for the potential contribution of habitat restoration (and threat abatement therein) at location i for threat t is calculated as:
Rt,i = ∑Hs,iWsCs,tMs,i
Ns
s
Where:• Hs,i is the extent of restorable AOH for species s
at location i (expressed as a percentage of the global species’ current AOH)
• Mi is a multiplier appropriate to the habitat at location i to discount restoration scores. A global multiplier of 0.29 based on the median rate of recovery from a global meta-analysis, assuming that restoration has been underway for 10 years.
For each species, a STAR threat abatement (START) score is defined. This varies from zero for species of Least Concern to 100 for Near Threatened, 200 for Vulnerable, 300 for Endangered and 400 for Critically endangered species.
Tt,i = ∑Ps,iWsCs,t
Ns
s
0 100 200 300 400
LEAST CONCERN
NEAR THREATENED
VULNER-ABLE
ENDAN-GERED
CRITICALLY ENDANGERED
ASSESSING THE BIODIVERSITY IN VIET NAM – ANALYSIS OF IMPACTS FROM ECONOMIC SECTORS 21

1.4.2. Analysis based on global resultsAs a first step, based on the overall calculation of the STAR scores provided by IUCN, the contribution of Viet Nam in the reduction of the global species extinction is highlighted.
1.4.3. Analysis of the drivers of the threatened speciesFollowing the first step, a second analysis is provided to describe location of the main drivers across the country building on maps results. This analysis of drivers describes the threats, following IUCN classification. It comes from the analysis performed through the STAR metrics (IUCN tool) that locate the magnitude of the threats, based on habitats datasets covering 1992-2015, and on species dataset dating to 2019. The magnitude of threats is depictured through colours: dark green means areas where the risk of extinction from a threat is weak, < green < yellow < orange < red means areas where the risk of extinction from a threat is the highest.
The sum of START values across all species represents the global threat abatement effort needed for all species to become Least Concern. The STAR restoration component applies a similar logic to the STAR threat abatement component, but for habitat that has been lost and is potentially restorable (that is, restorable AOH). The STAR restoration component quantifies the potential contribution that habitat restoration activities could make to reducing species’ extinction risk. For a particular species at a particular location, the STAR restoration (STARR) score reflects the proportion that restorable habitat at the location represents of the global area of remaining habitat for that species
START and STARR scores are mapped at the 5-km grid cell resolution. For each species, the START score per grid cell is calculated by multiplying each species’ total START score by the proportion of the species’ current AOH in the grid cell. The STARR score per grid cell is calculated by multiplying the species’ total STARR score by the proportion of the species’ restorable AOH present in the grid cell. Global maps of total START and STARR scores are produced by summing the respective score maps across all species.
STAR uses existing publicly available datasets: Species’ extinction risk categories and threat classification data were obtained for amphibians, birds and mammals from the IUCN Red List (2019) or, for country endemics not yet assessed globally, from national red lists. The IUCN/Conservation Measures Partnership Threat Classification Scheme is hierarchical, and threats to species are classified at the most detailed level possible. For each threat to each species,
the scope (proportion of the global population impacted), severity (rate of decline driven by the threat within its scope) and timing (past, ongoing or future) of the threat are coded as part of the Red List assessments.
The IUCN threat classification (reminded in Annex 3) has been used for identifying the economic sectors. Species’ AOH has been estimated using species’ ranges, habitat associations, and elevation limits, along with digital elevation models and current and historical land cover maps. The data available for carrying out the analysis for each species, span from 1992 to 2015. To be noted that assessment of individual species by IUCN has been done in different years and so there is no general assessment of all species in particular years except for a massive assessment of plants (about 450 species) in Indochina in 2012 (final results submitted to IUCN in 2013). After 2013, there are some additions of several species to IUCN Red List, based on submission by some expert groups. Besides, since many assessments are based on changing trend of population size of individual species over 3 their generations, there is no common year (or period) for all species to compare them all together (i.e., each species has a different length of generation). Therefore, one cannot make comparisons of changes for all species during a period (between years).
The European Space Agency Climate Change Initiative (ESA CCI) land use and cover maps from 2015, were used. The ESA CCI original 37 land cover classes were reclassified into ten major classes (forests, wetlands, arid ecosystems, natural grasslands, shrublands, croplands, cultivated grasslands, rock and ice, urban areas
To sum up, STAR is a complementary tool to the two previous ones (literature analysis and GIS analysis), that enable to identify the drivers of the biodiversity decline by focusing on threatened species from amphibian, bird and mammal taxa, whose population dynamic and threats have been analysed by scientists and experts from the IUCN.
and water bodies) then matched to the habitat classes from IUCN Red List assessments. Species’ range maps were then overlaid with land cover and digital elevation maps to map the AOH within each species’ range,
constrained by the species’ elevation range (from the IUCN Red List). Species’ range map polygons were coded for presence and origin.
© Gerardmartincarrasquero / Freepik.com
ASSESSING THE BIODIVERSITY IN VIET NAM – ANALYSIS OF IMPACTS FROM ECONOMIC SECTORS 23

2.1. Literature reviewDue to the time and the Covid-19 pandemic constraints, general information on the country’s biodiversity of species has been analysed and generated, based mainly on accessible published literature. This has been presented in the relevant analyses.
Limitations of the literature review for ecosystem level are due to the limited available information and data. Indeed, we currently focus our understanding of the ecosystem diversity, distribution and threats in protected areas. Even with that scope, the available information from the search engines may not capture adequately the desired information. The obtained information and data may be out of date because lots of data are not available online and require access from the government database e.g.,
systematic information on threats, ecosystem diversity etc. For some information e.g., areas of protected areas, years of establishment, areas impacted collected from websites, news, the question of the reliability and updates remains.Regarding the biodiversity policy review and the economic sectors, it was difficult to have primary datas from relevant sectors. Most of the data used for the report were collected from the Viet Nam General Statistic Office Website (https://www.gso.gov.vn/en/statistical-data/) . However, in some case, it might have been inconsistent with the information from the sector’s reports. There also had a lack of sector’s comprehensive report to present the trend of biodiversity loss according to the hot spots location. Therefore, the information were gathered from a number of electronic newspapers from internet foundation.
2.2. Remote sensing analysisRegarding the species, the data collected do not enable to draw exhaustive maps of biodiversity distribution nationwide. The analyses presented
in this report might be improved if updated data and reports from national authorities and scientific institutions were available. However, the databases used from the IUCN Red List of Threatened Species (IUCN, 2021) can help map a national concentration of globally threatened species of amphibians, reptiles, mammals, birds, freshwater fishes and plants.
Regarding the land use and land cover analyses, the most recent data set is from 2018. Therefore, land use changes have been underestimated.
Regarding the accuracy of the results, the land use / land cover data collected fall under two different main levels of accuracy:
© Rawpixel.com / Freepik.com
25

± Semantic accuracy: This is the quality and precision of the description of land use classes (example: a forest classified as forest by mistake),± Spatial accuracy: This is the geographic accuracy describing the land use (rasterized data at a resolution of 600m) In terms of semantic accuracy, the downloaded data has not undergone any processing aimed at altering or improving the initial quality. The results displayed therefore have the initial precision of the data, i.e. between 70% and 80% reliability, thus confirming that the analysis tools used are powerful tools for predictive changes at a large scale.
Further methodological details are given in the article of Poortinga A., & Al (2020). In terms of spatial accuracy, land use data are at the same resolution regardless of the year analyzed. Again, no action was taken to improve or degrade the accuracy of the initial data. More accurate data analysis could be performed at local level in case new goals has to be met, by using additional data.
2.3. STAR analysisThe STAR analysis is carried out for threatened species classified as CR, EN, VU and NT and does not encompass every single species. Several taxonomic groups were not included in the calculation of STAR scores: fish (freshwater), mollusks, reptiles, insects and flowering plants). Besides, the pressures on aquatic environments are not thoroughly assessed and the documentation of pressures on mammals is not as completed as the birds. Thus, for mammals, the relative share of each pressure on the risk of extinction is not quantified for all species. In these cases, all pressures are weighted in the same way. These limitations might raise the question of representativeness and a ground verification of the threats would complement the outcomes the STAR maps.
Generally speaking, updated records of species in Viet Nam are needed for such studies which is why data were requested from Vietnamese authorities/research institutions in order to develop some analyses. However, feedbacks from them indicate that there is no synthetic data to supply this study. Additionally, such assessment needs involvement of different biodiversity experts (mammal, bird, amphibian, etc.) and takes time and costs that exceed this initiative scope. As this report is drafted, data from the current Vietnamese Red Data Book is out of date (published in 2007 and based on earlier assessments) and does not contain detailed information necessary for STAR analysis. Furthermore, even data from IUCN remains gaps as many species were assessed long time ago.
The results were therefore used at a
resolution of 600m, which makes it possible to highlight major changes in
land use, at the scale of a country.
Finally, this analysis does not provide information on every single economic sector that might have a negative impact on biodiversity (ex: absence of information about energy production and dams) but it enables to understand the magnitude of the major critical economic sectors also identified through the literature review and the STAR analysis such as agriculture, forestry, urbanization, aquaculture and mining on biodiversity.
ASSESSING THE BIODIVERSITY IN VIET NAM – ANALYSIS OF IMPACTS FROM ECONOMIC SECTORS 27
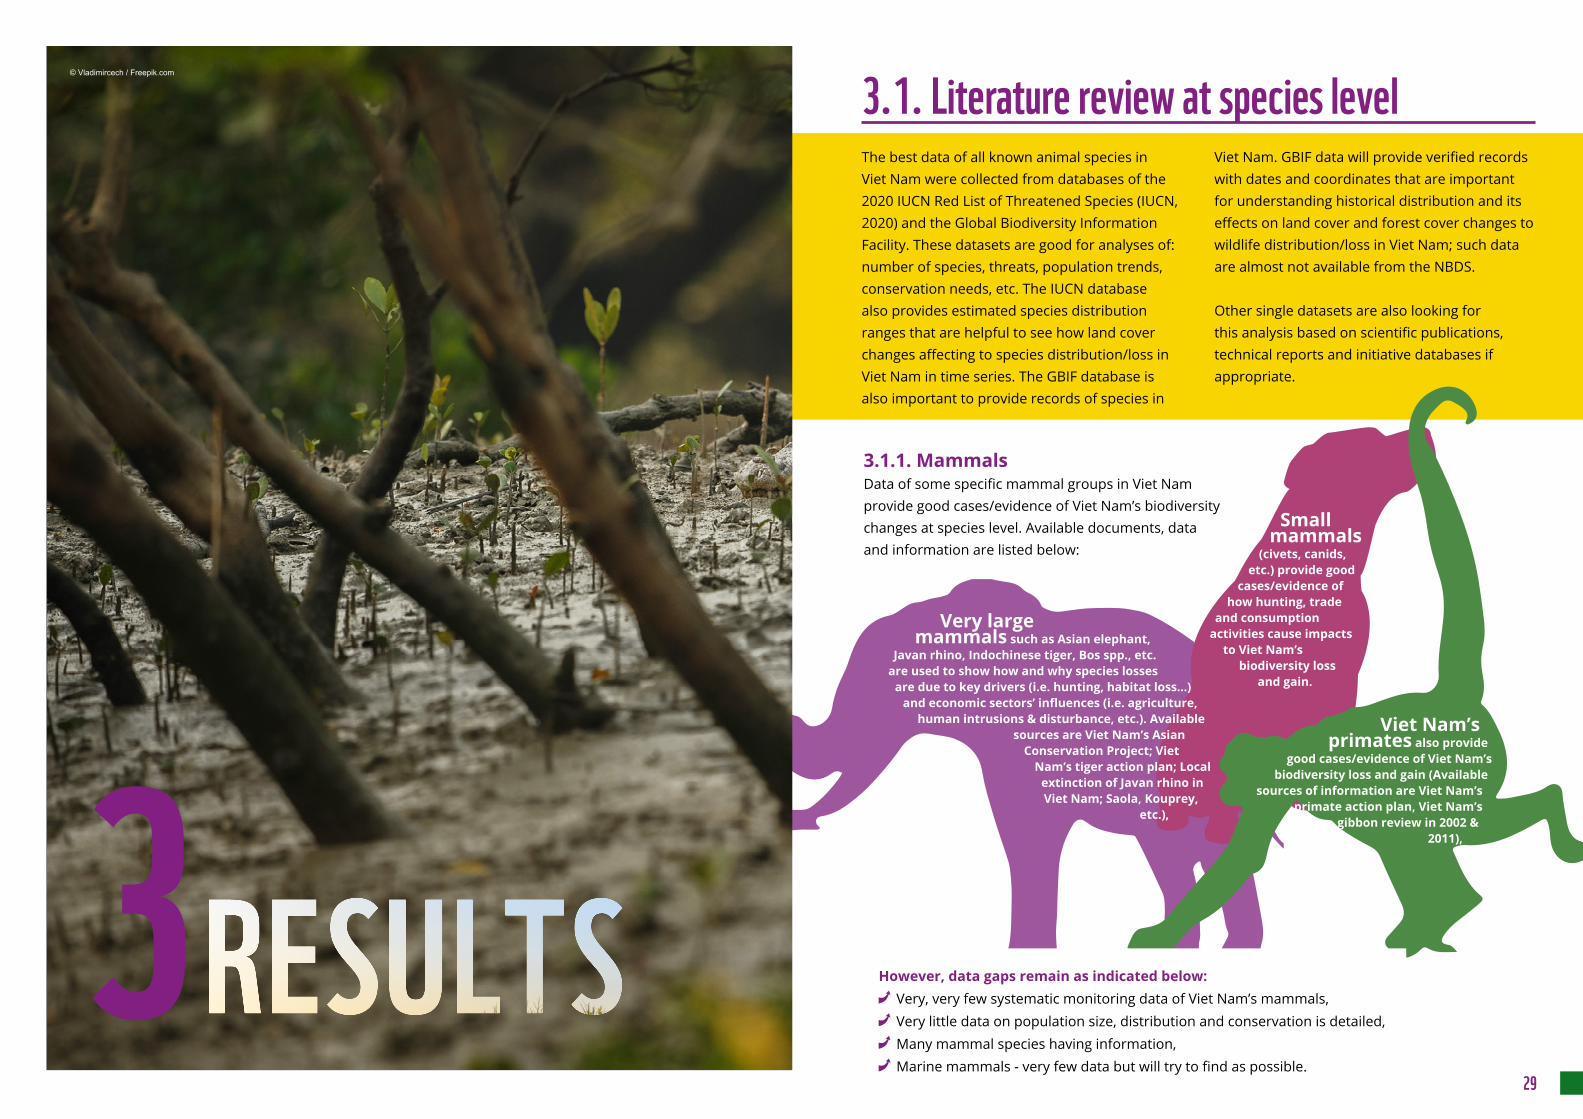
3.1. Literature review at species levelThe best data of all known animal species in Viet Nam were collected from databases of the 2020 IUCN Red List of Threatened Species (IUCN, 2020) and the Global Biodiversity Information Facility. These datasets are good for analyses of: number of species, threats, population trends, conservation needs, etc. The IUCN database also provides estimated species distribution ranges that are helpful to see how land cover changes affecting to species distribution/loss in Viet Nam in time series. The GBIF database is also important to provide records of species in
Viet Nam. GBIF data will provide verified records with dates and coordinates that are important for understanding historical distribution and its effects on land cover and forest cover changes to wildlife distribution/loss in Viet Nam; such data are almost not available from the NBDS.
Other single datasets are also looking for this analysis based on scientific publications, technical reports and initiative databases if appropriate.
3.1.1. MammalsData of some specific mammal groups in Viet Nam provide good cases/evidence of Viet Nam’s biodiversity changes at species level. Available documents, data and information are listed below:
Small mammals
(civets, canids, etc.) provide good
cases/evidence of how hunting, trade
and consumption activities cause impacts
to Viet Nam’s biodiversity loss
and gain.
Viet Nam’s
primates also provide good cases/evidence of Viet Nam’s
biodiversity loss and gain (Available sources of information are Viet Nam’s
primate action plan, Viet Nam’s gibbon review in 2002 &
2011),
Very large mammals such as Asian elephant,
Javan rhino, Indochinese tiger, Bos spp., etc. are used to show how and why species losses
are due to key drivers (i.e. hunting, habitat loss…) and economic sectors’ influences (i.e. agriculture,
human intrusions & disturbance, etc.). Available sources are Viet Nam’s Asian
Conservation Project; Viet Nam’s tiger action plan; Local
extinction of Javan rhino in Viet Nam; Saola, Kouprey,
etc.),
However, data gaps remain as indicated below:± Very, very few systematic monitoring data of Viet Nam’s mammals,± Very little data on population size, distribution and conservation is detailed,± Many mammal species having information,± Marine mammals - very few data but will try to find as possible.
© Vladimircech / Freepik.com
29

3.1.4. Other groupsThere is little data of other animal species like fishes and insects collected from the IUCN and GBIF datasets. Due to the lack of systematic survey and monitoring data of other animals (e.g. fishes, insects, macro bentos…), it needs to collect data from Viet Nam’s authorities for this analysis. There is also an absence of comprehensive global threat assessments of invertebrates occurring in the Indo-Burma biodiversity hotspot even if progress is being made with some groups, for instance: dragonflies and various aquatic molluscs. However, other groups likely to contain species under rapid decline have not been assessed, including large beetles, which attract high prices in the pet and specimen trades (CEPF, 2021).
Data gaps are the following:± No accessible (and verified) database of fish
fauna and other animals (insects, shrimp, crabs, macrobenthos, etc.) in Viet Nam;
± Very little published data on population size, monitoring, harvesting amounts, etc. of other animals as mentioned above.
3.1.5. Vascular plantsPham-Hoang (1991–1993) published Viet Nam’s first national flora (i.e. Cây cỏ Việt Nam - An illustrated Flora of Viet Nam) with about 10,500 vascular plants, where he estimated that the vascular flora of Viet Nam would have about 12,000 species. His updated version (1999-2000) increased the number to 11,662. Nguyen et al. (2003-2005) listed 11,083 species including 10,267 angiosperms, at least 874 introduced species and many possible synonyms. Meanwhile, about 9,600 indigenous species of vascular plants plus about 750 naturalized, introduced and cultivated species were reported for Viet Nam (Nguyen T.H., 1997; Phan, 1998). In fact, every year of the last more than decade witnessed more than 50 new species or new country records published from Viet
Nam (e.g., Luu et al., 2017, 2018, 2019 & 2020; Middleton et al., 2014). As such, a recent analysis (Middleton et al., 2019) shows that the actual total number of vascular plant species in Viet Nam should well exceed Pham-Hoang’s estimate.
At protected area level, where detailed inventory of biodiversity has been implemented, a checklist of several hundreds to thousands of plants is always available but many of them may not be exactly located as no geographic records are known. In most cases, it is hard to confirm the existence of many listed plants although they may be found in a certain ecosystem. It is because they are listed based mainly on field observation or literature. Regalado et al. (2005) has shown that this has caused our incomplete understanding of the national flora, especially in regard to the reliable numbers of threatened species or total number of species. Reliable checklists should rely on credible botanical inventories with high-quality, fully documented vouchers of all plants. As such, a reliable digital database of plants (and also of animals) with detailed information fields following GBIF protocol cannot be built up for almost the nation’s protected areas.
3.1.2. Birdshave been recorded in Viet Nam but there are very few systematic data of bird fauna
of Viet Nam. The best data are only from IUCN and GBIF/eBirds available. Specific data of
some endangered birds were collected and analysed as cases/
evidence of Viet Nam’s bird declination such as: hunting and consumption of common birds, Sarus Crane, Viet Nam’s Pheasant, Spoon-billed sandpiper, etc. Forest destruction, in particular of primary and mangrove forests, is very important to loss of bird diversity in Viet Nam.
Data gaps are the following:± No database of population size, distribution
and conservation of Viet Nam’s birds,± No monitoring data of population,± Very little information/publication of birds
in Viet Nam.
Summarised datasets of IUCN and GBIF, number of species has been recorded in Viet Nam is presented in the Table 02 below:
Table 2: Number of assessed species of mammals, birds, reptiles, amphibians and fishes recorded in Viet Nam
No. TaxonIUCN (2021) GBIF (2021)
#species #species #records
1 Mammals 348 258 3,657
2 Birds 869 893 150,708
3 Reptiles 384 260 3,705
4 Amphibians 221 181 12,582
5 Fishes 2,041 1,237 5,435
Source: IUCN and GBIF, 2021.
Due to dataset of the Viet Nam’s Red Data Book was assessed before 2007, it was not suitable to use in this analysis. Generally, population trend of each species was assessed by assigned IUCN/Survival Specialists Groups in 2015-2020.
3.1.3. Amphibians and reptiles
1 As stated above, it is impossible to make comparisons to track changes with consensus timeline for all species together. Only general trend is possible to see.
Only data comes from the IUCN and GBIF/AmphibiaWeb&Reptilia Database. Other information had to be collected from individual publications. Available data, in particular of highly endangered and endemic species, were emphasized for analyses
Data gaps are the following:± No accessible (and verified) database of
amphibians and reptiles in Viet Nam,± No database of population size, distribution
and conservation of Viet Nam’s amphibians and reptiles,
± No monitoring data of population.
Table 3 shows that many species of mammals, birds, reptiles, amphibians and fishes are decreasing in population size, especially mammals (33% of the known species), birds (46% of the known species) and amphibians (61% of the known species) during 1992-2015 (IUCN, 2021).
Table 3: Populations trends for mammals, birds, reptiles, amphibians and fishes in Viet Nam (Source: IUCN and GBIF, 20211.)
No. Population trend(1992-2015)
Number of species
Mammals Birds Reptiles Amphibians Fishes
1 Decreasing 114 (33%) 404 (46%) 54 (14%) 135 (61%) 228 (11%)
2 Increasing 9 (3%) 51 (6%) 5 (1%) 2 (1%) 4 (0%)
3 Stable 78 (22%) 330 (38%) 117 (30%) 25 (11%) 332 (16%)
4 Unknown 147 (42%) 84 (10%) 208 (54%) 59 (27%) 1,477 (72%)
Grand Total 348 869 384 221 2014
Up to date,
about 1,000 bird species
© Wirestock / Freepik.com
ASSESSING THE BIODIVERSITY IN VIET NAM – ANALYSIS OF IMPACTS FROM ECONOMIC SECTORS 31

The fact that no records of exact coordinates were shown helps hide the location of the threatened species and thus protect them from risks of illegal exploitation, but also challenges effective management and scientific activities.
Meanwhile, national herbaria, which are established and managed by university and research institutions, hold many hundred thousand of plant specimens but most of them have not been digitized and managed with modern database platforms. Information on coordinates of collection location may be seen in labels on the specimens. Besides many specimens have not been identified, many scientific names written on specimens’ labels need verification; this can be found in international herbaria holding Vietnamese plants as well.
Attempts to revise particular plant groups have been published, such as common plants (Le et al., 1969–1976), forest trees (Viet Nam Ministry of Forestry, 1971–1988; Vu, 1996), conifers (D.T.L. Nguyen & Thomas, 2004; Phan et al., 2013, 2017), dipterocarps (H.N. Nguyen, 2005), ferns (Phan, 2010), orchids (Averyanov 2008, 2010, 2011, 2013; Averyanov & Averyanova, 2003; T.T. Nguyen, 2001), etc. The on-going compilation of a national flora of Viet Nam has been implemented by the Institute of Ecology and Biological Resources of the Viet Nam Academy of Science and Technology since 1996 resulting in 21 published volumes accounting for 3,773 species, subspecies & varieties. However, the species concepts tend to be narrower than common international publications and, again, almost no exact coordinates of actual distribution of studied species are provided. In
most cases, the ecosystems (e.g. forest types) where the species is found are mentioned.
Based on the reported data, Regalado et al. (2005) lists the nation’s three centers of plant diversity namely the Hoang Lien Son Range, the Truong Son Range (Annamites), and the Tay Nguyen Plateaus (Central Highlands) thanks to their high degree of environmental heterogeneity for climate, soil, landscape and topography. These are also the country’s centers of plant endemism.
The endemism of Vietnamese plants has been estimated differently by authors. The proportion of endemics is estimated as 10% (Vo, 1995), 20% (Pocs, 1965) to 50% for the whole country (Thai, 1999). A moderate number was given as 30% by Regalado et al. (2005). There have not been elaborated accounts come to a reliable figure, but it is generally accepted that the endemism differs among families and the highest endemism is found in the Acanthaceae, Anacardiaceae, Annonaceae, Apocynaceae, Araceae, Arecaceae, Asclepiadaceae, Celastraceae, Ericaceae, Euphorbiaceae, Fagaceae, Myrsinaceae, Rubiaceae, Sapindaceae, Sapotaceae, Symplocaceae, Theaceae and Zingiberaceae (Schmid, 1974; Takhtajan, 1986; Rundel, 1999; Averyanov et al., 2003; Regalado et al., 2005). Given many hundreds of new plants described from Viet Nam in the recent two decades, this list should be revised. For example, Averyanov et al. (2003) reports 19% of Vietnamese orchids as endemics based on the then known 753 orchid species; however, the number of recorded orchids in Viet Nam has well exceeded 1,200 with many new species (and thus would be endemic) being described.
Given the current context, there are policies and actions from the Government and related authorities to anticipate negative impacts and
In fact, some threatened or important species may be recognized, mapped or monitored at some scale but almost no information on their exact distribution is published. Actual distribution of specific species may be found in reports of projects funded by the National Program of Sustainable Genetic Conservation and Use under the Ministry of Science and Technology and Provincial Program of Sustainable Genetic Conservation and Use by provincial Department of Science and Technology. In most of these projects, national or/and provincial distribution of the studied plants is inventoried. However, it is unknown how many species have been inventoried by these programs.
Exact location of plant distribution can be found in individual scientific reports, recent publications of new species and especially in international platforms. Information on distribution of Vietnamese plant specimens including coordinates of collecting location are abundant in databases of internationally known herbaria in developed countries such as France, UK, the Netherlands, USA, etc. Many of these databases can be accessed online and mostly linked and/or concentrated in GBIF (www.gbif.org) which is based in Copenhagen (Denmark). Viet Nam became the 57th member (as an Associate Participant) of GBIF in 2018 and the Nature and Biodiversity Conservation Agency (BCA) under the Ministry of Natural Resources and the Environment (MONRE) plays as a national node. Currently, GBIF holds 144,663 records of Vietnamese vascular plants from 123 published datasets worldwide, of which 69,326 have information of coordinates of collection location. Obviously, this is a good source of data, together with that available at the IUCN Red List portal (www.iucn.org) where most of the threatened species assessed are provided with coordinates of species collections, that can be used to develop an actual distribution
map of Vietnamese plants. For example, a site distribution map of Curcuma vitellina, which is a Viet Nam-endemic zinger ranked as Endangered by IUCN (Leong-Škorničková et al., 2019), can be seen at the IUCN Red List website based on five records with coordinates (Figure 1).
Figure 1: Distribution of Curcuma vitellina in southern Viet Nam as seen on the IUCN Red List website.
Figure 2: Distribution of a plant ranked as VU in the Viet Nam Red Data Book (Part II. Plants, 2007).
Such exact maps for many nationally threatened species cannot be re-produced from Viet Nam Red Data Book (Part II. Plants, 2007) although distribution maps of all assessed species are presented (Figure 2) and the distribution of each species was mentioned at the provincial (and sometimes district) level, just like in other publications on national flora (e.g., Pham-Hoang, 1999-2000; Nguyen et al., 2003-2005).
ASSESSING THE BIODIVERSITY IN VIET NAM – ANALYSIS OF IMPACTS FROM ECONOMIC SECTORS 33

Table 4: The realms, biomes and EFGs in Viet Nam.
REALM BIOME ECOSYSTEM FUNCTIONAL GROUP (EFG)
Terrestrial (T)
1. Terrestrial (T1) - Tropical-subtropical forests
1. T1.1 Tropical subtropical lowland rainforests2. T1.2 Tropical subtropical dry forests and thickets3. T1.3 Tropical-subtropical montane rainforests
2. Terrestrial (T2) - Temperate-boreal forests & woodlands
4. T2.4 Warm temperate laurophyll forests
3. Terrestrial (T4) - Savannas and grasslands
5. T4.1 Trophic savannas6. T4.2 Pyric tussock savannas
Intensive land-use systems (T7)* T7.1 Annual croplandsT7.2 Shown pastures and fieldsT7.3 PlantationsT7.4 Urban and industrial ecosystemsT7.5 Derived semi-natural pastures and old fields
Subterranean (S)
4. Subterranean (S1) - Subterranean lithic systems
7. S1.1 Aerobic caves
5. Subterranean-Freshwater (SF1) - Subterranean freshwaters
8. SF1.1 Underground streams and pools9. SF1.2 Groundwater ecosystems
Anthropogenic subterranean freshwaters (SF2)*
SF2.1 Water pipes and subterranean canalsSF2.2 Flooded mines and other voids
Freshwater (F1)
6. Freshwater (F1) - Rivers and streams 10. F1.1 Permanent upland streams11. F1.2 Permanent lowland rivers12. F1.4 Seasonal upland streams13. F1.5 Seasonal lowland rivers14. F1.7 Large lowland rivers
7. Freshwater (F2) - Lakes 15. F2.2 Small permanent freshwater lakes16. F2.3 Seasonal freshwater lakes
Artificial wetland (F3)* F3.1 Large reservoirsF3.2 Constructed lacustrine wetlandsF3.3 Rice paddiesF3.4 Freshwater aquafarmsF3.5 Canals, ditches and drains
Marine (M) 8. Marine (M1) - Marine shelfs 17. M1.1 Seagrass meadows18. M1.3 Photic coral reefs19. M1.5 Photo-limited marine animal forests20. M1.6 Subtidal rocky reefs21. M1.7 Subtidal sand beds22. M1.8 Subtidal mud plains23. M1.9 Upwelling zones
9. Marine (M2) - Pelagic ocean waters 24. M2.1 Epipelagic ocean waters25. M2.2 Mesopelagic ocean waters26. M2.3 Bathypelagic ocean waters27. M2.4 Abyssopelagic ocean waters
10. Marine (M3) - Deep sea floors 28. M3.1 Continental and island slopes29. M3.3 Abyssal plains30. M3.4 Seamounts, ridges and plateaus31. M3.5 Deepwater biogenic beds
Anthropogenic marine systems (M4)* M4.1 Submerged artificial structuresM4.2 Marine aquafarms
protect biodiversity, such as Law on Biodiversity, Law on Forestry, Law on Environment Protection, etc. For invasive species, the Decree 27/2013/TTLT-BTN&MT-BNNPTNT jointly issued by MONRE and MARD identifies 81 invasive species and directs activities for effective management. Those were reported in detail in the Viet Nam National Biodiversity Strategy to 2020, vision to 2030 (MONRE, 2013).
Knowledge gaps noted for vascular plants are:± Coordinates of plant records and actual
distribution are not available for many plants, including those threatened,
± Specific threats to individual species are adequately assessed (by IUCN experts) for small part of the flora while the national Red Data Book seems to have been out of date,
± Data on monitoring of changes in distribution and population size is not available for most of species,
± Impacts caused by several threats such as Transportation development, Residential & commercial development, Climate change and Invasive species are not known for many specific plant species.
3.2. Literature review at ecosystems level3.2.1. Ecosystems’ diversity in Viet Nam from a global studyGlobal classification systems of ecosystems were searched, yet the results were very limited. If present, they are often outdated or focus on classifying a certain ecosystem type, e.g., natural terrestrial ecosystems (Walter and Box, 1976; Ollis et al., 2015; Jung et al., 2020).
The best result from the search was the IUCN global ecosystem typology 2.0 (hereby referred as IUCN-GET) that was just published by IUCN in 2020.
From a detailed study of the IUCN-GET and from expert knowledge, at least 21/25 biomes (84.0%) and 60/108 (55.5%) ecosystem functional groups (EFGs) were identified in Viet Nam. These include 16 natural, 5 artificial biomes and 45 natural, 15 artificial EFGs (Table 4).
The IUCN-GET classified ecosystems on earth into three levels: realms, biomes and ecosystem functional groups (Keith et al., 2020). It was developed with the contribution of more than 100 scientists globally, who are experts in earth’s ecosystem types.
With these six principles, earth’s ecosystems can be distinguished into five realms (terrestrial, subterranean, freshwater, marine and atmospheric) that can be divided into 25 biomes that can be classified into 108 ecosystem functional groups (EFG) (Keith et al., 2020).
The scientists used six following principles to classify ecosystems: (i) representation of ecological processes; (ii) representation of biota; (iii) conceptual consistency throughout the biosphere; (iv) scalable structure; (v) spatially explicit units; (vi) parsimony and utility, which none of the previous studies met these criteria.
ASSESSING THE BIODIVERSITY IN VIET NAM – ANALYSIS OF IMPACTS FROM ECONOMIC SECTORS 35

3.2.2. Ecosystem’s diversity from the literature review
Terrestrial – Freshwater (TF)
11. Freshwater-terrestrial (TF1) - Palustrine wetlands
32. TF1.1 Tropical flooded forests and peat forests 33. TF1.4 Seasonal floodplain marshes
Freshwater-marine (FM)
12. Freshwater-marine (FM1) - Semi-confined transitional waters
34. FM1.2 Permanently open riverine estuaries and bays35. FM1.3 Intermittently closed and open lakes and lagoons
Marine- terrestrial (MT)
13. Marine-terrestrial (MT1) - Shoreline systems
36. MT1.1 Rocky shorelines37. MT1.2 Muddy shorelines38. MT1.3 Sandy Shorelines
14. Marine-terrestrial (MT2) - Supralittoral coastal systems
39. MT2.1 Coastal shrublands and grasslands
Anthropogenic shorelines (MT3.1)* MT 3.1 Artificial shorelines
Subterranean - marine (SM)
15. Subterranean-marine (SM1) - Subterranean tidal systems
40. SM1.1 Anchialine caves41. SM1.2 Anchialine pools42. SM1.3 Sea caves
Marine-freshwater-terrestrial (MFT)
16. Marine-freshwater-terrestrial (MFT1) - Brackish tidal systems
43. MFT1.1 Coastal river deltas44. MFT1.2 Intertidal forests and shrublands45. MFT1.3 Coastal saltmarshes and reedbeds
*Biomes that are excluded from the present study
The distribution maps in the IUCN-GET provided a general understanding of the distribution of the ecosystems, yet to the international and country level only. Currently, IUCN-GET has not integrated threats to those ecosystems since it is location-specific.
Information of the artificial ecosystems in Viet Nam was searched, the information was poorly presented. In addition, the level of biodiversity in artificial ecosystems is often low due to its nature of focusing on optimizing productivity and using techniques to simplify natural biodiversity for the ease of the management, e.g., the application of monoculture, simplified biodiversity, and using pesticides. Therefore, biodiversity of artificial ecosystems was not studied further in the present study.
After the literature search, nearly 350 documents with related information (e.g., area, year of establishment, distribution, ecosystem type, threats, area change etc.) were selected. Initially, ecosystems were intended to classify to the EFG level, which requires detailed information as presented in Box 1. After a few efforts and a quick study of the searched documents, this task appears to be infeasible due to the inadequacy of available descriptions of the ecosystems in the literature, which often mention the name of the ecosystem only. However, a classification to the biome level is appropriate, and the existing ecosystems correspond to 16 different biomes. The classification to the biome level only provides a less detailed understanding of the ecosystems, yet it has no impacts on the results of the review.
BOX 1 Criteria to distinguish EFG
• Resource filters (e.g., waters, nutrients, energy, oxygen, carbon)
• Ambient environmental filters (e.g., temperature, geomorphology, solid substrate, fluid circulation, seasonality, interannual variability, UV-B radiation, salinity, geothermal flux);
• Disturbance regime filters (e.g., fires, floods, storms, volcanism);
• Mass movement (e.g., autotrophic competition, herbivory & predation, ecosystem engineers, mutualisms and symbioses, detrivory, decomposition);
• Anthropogenic filters (e.g., structural transformation, water extraction, diversion & impoundment, pollution, assisted biotic, climate change);
• Ecological traits (energy sources, trophic structure, productivity, autophoph traits, biogenic structure, heterotroph diets, body sizes, phenology, salinity tolerance and regulation, water conservation, buoyancy).
Source: IUCN-GET (Keith et al., 2020)
Viet Nam biodiversity profileViet Nam’s topography and climate hold
significant advantages that support a high level of biodiversity. Three-fourth of the country
areas are mountainous and hilly (The Government, n.d.) with karst mountains covering about 60,000 km2 (18% of the country surface) (Tuyet, 2010). The country has two main deltas: Red River (15,000 km2) and Cuu Long (Mekong, 40,000 km2) with the river system of 41,000 km length in total (The Government, n.d.). The 3,260 km long coastline (Rhind, 2012) running along the countries form the country’s marine biodiversity. With the long shape, the country lies in the tropics with high temperature and humidity all year around with some high-elevated parts experiencing the subtropical climate.
© Wirestock / Freepik.com
ASSESSING THE BIODIVERSITY IN VIET NAM – ANALYSIS OF IMPACTS FROM ECONOMIC SECTORS 37

Table 6: Forest areas by the originForest manager Natural forest (ha) Plantation (ha) Total (ha)
Special-use forest management board 2,086,842 96,967 2,183,809
Protection forest management board 2,515,571 508,293 3,023,864
Social-economic organization 1,100,952 619,961 1,720,913
Army forces 124,391 63,901 188,291
Science, technology organizations 105,854 131,419 237,274
Households, individuals 1,318,510 1,874,659 3,193,169
Communities 1,095,320 71,150 1,166,470
Foreign-invested enterprises 8,101 14,840 22,941
Commune people’s committee 1,923,644 1,016,840 2,940,484
Total 10,279,185 4,398,030 14,677,215
Source: Decision No. 1558/QD-BNN-TCLN dated April 13, 2021 by the Minister of the Ministry of Agriculture and Rural Development (2021)
The country’s high level of biodiversity has received international records (Table 5):
1 Source: Olson and Dinerstein (1998).2 Source: cited in Carew-Reid et al. (2010).3 Source: https://www.ramsar.org/ (updated May, 2021)4 Source: http://www.unesco.org/new/en/natural-sciences/environment/ecological-sciences/biosphere-reserves/asia-and-the-pacific/vietnam/5 Source: https://whc.unesco.org/6 Source: http://chm.aseanbiodiversity.org/7 Source: https://www.birdlife.org/8 Source: http://www.keybiodiversityareas.org/
Table 5: Internationally recognized important area.
Types of records No. of sites Locations Total areas (ha)
Priority eco-regions1 6/238
Northern Indochina Sub-tropical Moist Forests; Southeast China- Hainan Moist Forests; the Annamite Range Moist Forests; Indochina Dry Forests; Mekong River; and Xi Jiang Rivers and Streams
NA
Centres of Plant Diversity identified by the IUCN2
7 NA NA
RAMSAR3 9
Ba Be NP (Bac Kan), Bau Sau Wetlands and Seasonal Floodplain (Dong Nai), Con Dao NP (Ba Ria – Vung Tau), Lang Sen Wetland Reserve (Long An), Mui Ca Mau NP (Ca Mau), Tram Chim NP (Dong Thap), U Minh Thuong NP (Kien Giang), Van Long Wetland NR (Ninh Binh), Xuan Thuy Natural Wetland Reserve (Nam Dinh)
120,549
Biosphere Reserve4 9
Cat Ba (Hai Phong), Red River Delta (Thai Binh, Nam Dinh, Ninh Binh), Cu Lao Cham – Hoi An (Quang Nam), Western Nghe An (Nghe An), Langbiang (Lam Dong), Dong Nai (Dong Nai, Lam Dong, Dak Nong, Binh Duong, Binh Phuoc), Can Gio mangrove (Ho Chi Minh city), Kien Giang (Kien Giang), Mui Ca Mau (Ca Mau)
4,380,504
Natural World Heritage Sites5 3
Ha Long Bay (Quang Ninh), Phong Nha - Ke Bang National Park (Quang Binh) and Trang An Landscape Complex (this is a mix of Natural and Cultural heritage)
399,033 (including the buffer zone)
ASEAN Heritage Parks6 10
Kon Ka Kinh NP (Gia Lai), Chu Mom Ray NP (Kon Tum), BA Be NP (Bac Kan), Hoang Lien NP (Lao Cai and Lai Chau), U Minh Thuong NP (Kien Giang), Bai Tu Long NP (Quang Ninh), Bidoup Nui Ba NP (Lam Dong), Vu Quang NP (Ha Tinh), Lo Go - Xa Mat NP (Tay Ninh), Ngoc Linh NR (Kon Tum)
365,389
Important Bird Areas (IBA), Including 7 IBAs 7
63 NA
Key Biodiversity Area8 122 3,879,600
Areas and distribution of ecosystemsAccording to MARD (2021), by December 31,
2020, Viet Nam has 14,677,215 ha of forested land, with 10.279.185 ha of natural forests and 4.398.030 ha
of plantations (Table 6).
Of the 10.3 million ha of natural forest,
Due to the unavailability of the required information in natural forests managed by other managers rather than special-
use forests (Table 6), data collection for the present study was focused in the special use forests. The information on biodiversity may be acquired from protection forest management board with support from the government
agencies.
4.6 million ha (44.7%) is currently under the
management of the government in special-
use and protection forest
Table 7: Protected areas in Viet Nam according to the Decision No. 1107/QD- BTN&MT dated May 12, 2015.
Protected area No. of sites Total areas (ha) Proportion (%)
National Park 31 1,109,425.65 45.75
Nature Reserve 64 1,139,776 47.01
Species & habitat conservation sites
16 80,326.18 3.31
Landscape conservation site
55 95,128.49 3.92
Total 2,424,656.32 100
Regarding the special-use forests, according to the Decision No. 1107/QD-BTN&MT dated May 12, 2015, Viet Nam has 31 national parks (NP), 64 nature reserves (NR), 16 species and habitat conservation sites and 55 landscape conservation sites (Table 7).
ASSESSING THE BIODIVERSITY IN VIET NAM – ANALYSIS OF IMPACTS FROM ECONOMIC SECTORS 39

Sixty eight wetland sites were recommended as having environmental and biodiversity values and 10 wetland sites were considered as having highest values according to Ramsar Convention’s criteria (Tien Yen estuary, Bach Dang estuary, Van Uc estuary, Ba Lat estuary, Lim Son tidal flat, Tam Giang – Cau Hai lagoons, Tra O marsh, Dong Nai estuary, Tien estuary, Southwest Ca Mau tidal flat (cited in IUCN, 2005). In the Mekong delta only, Thinh (2003) also recommended ten wetland sites of high biodiversity values: U Minh Thuong, Tram Chim and Mui Ca Mau national park; Lang Sen, Thanh Phu, Tra Su, Lung Ngoc Hoang and Vo Doi Nature Reserve, Tinh Doi Forest Fish Enterprise, Ha Tien Grassland.
Thinh (2003) also listed special-use forests that protect wetland, including: Tram Chim (7,588 ha) and U Minh Thuong National Parks (8,038 ha), Vo Doi (4,000 ha), Lung Ngoc Hoang 2,800 ha for conservation of inland wetland ecosystems. For coastal wetlands, Thinh (2003) listed Dat Mui National Park (46,000 ha) and Thanh Phu Nature Reserve (4,300 ha). Besides, several bird sanctuaries were established in some provinces e.g., Ca Mau, Bac Lieu, Ben Tre, Tra Vinh, Soc Trang, and Dong Thap provinces.
According to the Decision No. 45/QD-TTg, dated January 08, 2014 on approval of biodiversity conservation planning by 2020 with a vision to 2030 (summarized in Table 9), the Government planned to have 45 wetland protected area with a total of 0.33 M ha by 2020.
According to the Decision No. 45/QD-TTg, dated January 08, 2014 on approval of biodiversity conservation planning by 2020 with a vision to 2030 (summarised in Table 8), Viet Nam planned to have terrestrial 156 protected areas that conserve terrestrial ecosystem (with a total of 2.5 M ha); 45 wetland protected areas (appx. 335,000 ha) and 13 marine protected area (nearly 230,000 ha).
Table 8: The number and areas (ha) of protected areas that conserve different biomes (According to the Decision No. 45/QD-TTg).
Protected area Terrestrial Wetland Marine Total
Habitat and species conservation site 17 (112,402.04 ha) 12 (110,438 ha) 1 (2,881.47 ha) 30 (225,721.51 ha)
Landscape conservation site 45 (70,081.19 ha) 8 (42,218.3 ha) 3 (79,465 ha) 56 (191,764.49 ha)
National Park 30 (1,080,517.23 ha) 1 (7,100 ha) 1 (7,850 ha) 32 (1,095,467.3 ha)
Nature Reserve 64 (1,277,380.21 ha) 25 (177,071.3 ha) 8 (139,005 ha) 97 (1,593,456.51 ha)
Total 156 (2,540,380.67 ha) 45 (334,854.1 ha) 13 (229,201.5 ha) 215 (3,106,409.74 ha)
By early 2019, the protection
forests of Viet Nam are under the management
of 229 protection management boards,
including:the department of agriculture and rural
development manage (136)
the district people of
committee manage (85)
sub-department of forest protection
(2)
sub-department of agriculture and
rural development
(5)
army forces (1)
The remaining
330,000 ha of protection forests is
managed by communities, households, army forces and other
organizations (Duc et al., 2019)
Due to the unavailability of the required information for the
protection forests, species & habitat conservation sites and landscape
conservation sites from the online resources, we rely solely on the support of the government agencies in the stage 2 of the review in filling the
data gap of these sites. With the online resources at the stage 1 of the study, we focused only on understanding of ecosystem biodiversity in national parks and natural reserves under the special-use forests.
WetlandsIn Viet Nam, wetlands are broadly classified as inland wetlands and coastal wetlands (Thinh, 2003), which compared to IUCN-GET are somehow equivalent
to freshwater, marine and their transition zones with terrestrial ecosystems. Mangrove forests and mudflats are concentrated mainly in the deltas, estuaries and tidal areas, while lagoons mainly along the coastline of the central (Thua Thien - Hue to Ninh Thuan Provinces) and coral reefs and seagrass beds are in the south-central coastal (IUCN, 2005).
The country has a total of 11,847,975 ha of wetlands,
accounting for 37% of the country’s total area (cited in MONRE, 2019). This figure did not include the area of freshwater ecosystems e.g., rivers and streams (that are seasonally flooded), springs, spots of hot water, and mineral water.
© Wirestock / Freepik.com
ASSESSING THE BIODIVERSITY IN VIET NAM – ANALYSIS OF IMPACTS FROM ECONOMIC SECTORS 41

3.2.3. Ecosystems’ diversity in protected areasFrom our literature review, we synthesized the distribution of the 16 biomes in the national parks and nature reserves based on the list in the Decision 1976 as in Table 10 (details in Annex 1). It should be noted that due to the limitations of the available data, we could not obtain a full understanding of the distribution of the biomes in Viet Nam. The information in the Table 10 and Annex 1 only partly reveals the distribution of the biomes across the national parks and nature reserves. Information from the databases of MARD and MONRE may allow us to fill the data gaps.
Table 10: Ecosystem diversity in protected areas based on the Decision 1976.
Type of biomes No. occurrence in National Parks
No. of occurrence in Nature Reserves Total
1. Terrestrial tropical & subtropical forests 29 42 71
2. Temperate boreal forests & woodlands NI NI
3. Terrestrial savannas & grasslands 7 10 17
4. Subterranean lithic systems 3 NI 3
5. Subterranean freshwater NI NI
6. Underground streams & pools NI NI
7. Subterranean marine 1 NI 1
8. Freshwater terrestrial - Palustrine wetlands 6 3 9
9. Freshwater - Rivers & streams 7 1 8
10. Freshwater - Lakes 6 NI 7
11. Freshwater-marine- Semi Confined transitional waters NI 1 1
12. Marine shelf 6 NI 6
13. Marine- Deep sea floors NI NI
14. Marine terrestrial - Shoreline systems 2 NI 2
15. Marine terrestrial - Supralittoral coastal systems NI NI
16. Marine freshwater terrestrial - Brackish tidal systems 5 1 6
*NI: no information.
The following section demonstrates the stage of the knowledge of the ecosystems and biomes in protected areas across Viet Nam.
Terrestrial (T1): Tropical – subtropical forestsThe Tropical-subtropical forests (T1) in Viet Nam include three EFGs (Keith et al., 2020): (T1.1) Tropical subtropical lowland rainforests; (T1.2) Tropical subtropical dry forests and thickets; (T1.3) Tropical-subtropical montane rainforests. Different EFGs have their own species diversity and level of endemism. The T1 biome covers a wide range of tropical forests in Viet Nam e.g., tropical evergreen forests, limestone forests, montane evergreen forests, bamboo forests. The evergreen forests of various types are the most extensive forest types and occur throughout Viet Nam (Carew-Reid et al., 2010; Phuong et al., 2012). T1 biome occurs in at least 29/34 national parks and 42/55 nature reserves (Annex 1). It can be concluded that the T1 biome is the most common terrestrial biome, occurring across the country.
According to the Decision No. 45/QD-TTg, dated January 08, 2014 on approval of biodiversity conservation planning by 2020 with a vision to 2030, the Government planned to have 13 marine protected areas with a total of 0.22 M ha by 2020. In Decision No. 742/QD-TTG, the no. of marine protected areas planned was 16 (Table 9).
Table 9: List of planned marine protected areas (enclosed to the Decision No. 742/QD-TTg) and the updates of establishment.
No. Name of marine conservation zone/province
Total areas (ha) Sea area (ha) Updates of the establishment by 2020
1 Tran island/Quang Ninh 4,200 3,900 Detailed planning in 2020 under the name Co To - Dao Tran
1 Co To/Quang Ninh 7,850 4,000
2 Bach Long Vi/Hai Phong 20,700 10,900 Established (2013)
3 Cat Ba/Hai Phong 20,700 10,900 Established (No information about the year - NI)
4 Hon Me/Thanh Hoa 6,700 6,200 Planning
5 Con Co/Quang Tri 2,490 2,140 Established (2009)
6 Hai Van - Son Tra/Thua Thien - Hue - Da Nang
17,039 7,626 Planning
7 Cham islet/Quang Nam 8,265 6,716 Established (NI)
8 Ly Son/Quang Ngai 7,925 7,113 Established (NI)
9 Nam Yet/Khanh Hoa 35,000 20,000 Planning
10 Nha Trang Bay/Khanh Hoa 15,000 12,000 Established (2012)
11 Nui Chua/Ninh Thuan 29,865 7,352 Established (2015)
12 Phu Quy/Binh Thuan 18,980 16,680 Planning
13 Hon Cau/Binh Thuan 12,500 12,390 Established (2012)
14 Con Dao/Ba Ria - Vung Tau 29,400 23,000 Established (NI)
15 Phu Quoc/Kien Giang 33,657 18,700 Established (2007)
16 Bai Tu Long/Quang Ninh Established (NI)
Marine ecosystemsWith a coastline of 3,260 km and more than 3,000 inshore and offshore islands and islets
(de Queiroz et al., 2013; Lutaenko et al., 2011; Mau et al., 2015), the coastal areas of Viet Nam hold a high level of biodiversity conservation values and especially they are important habitat for globally threatened migratory birds, cited in (de Queiroz et al., 2013). The coastal areas with its abundant resources are the important source of livelihoods for approximately 20 million people in 125 coastal districts (MONRE, 2014).
On May 26, 2010, the Prime Minister issued Decision No. 742/QD-TTg on approving the plan on the system of Viet Nam’s marine conservation zones through 2020. According to Decision No. 742, the protected sea areas of Viet Nam will be 0.24% by 2020. However, by 2020, only 12 out of 16 planned marine protected areas (Table 9) have been established with a total
213,400 ha (i.e., 0.185% of the sea areas under protection) (Tong cuc thuy san, 2021).
ASSESSING THE BIODIVERSITY IN VIET NAM – ANALYSIS OF IMPACTS FROM ECONOMIC SECTORS 43

Systematic studies about aerobic caves across the countries seem not present. There is very little information about the occurrence of cave ecosystems in protected areas. The Oxalis Adventure company listed many marvellous caves in Viet Nam that have been utilized for tourisms e.g., the Trang An complex in Ninh Binh province with 48 small and large caves and other caves in Ninh Binh province (e.g., Mua cave); Son Doong cave with up to 5 km in length , 200 m in height and 150 m in width and 38.5 M m3 in volume; other caves in Phong Nha - Ke Bang NP (e.g., Thien Duong cave with 72 m in height, 150 m in width; En cave with up to 2 km in length, 120 m in height and 140 m in width; Va cave; Tien cave, Phong Nha cave), in Quang Binh province (e.g., Dong Tu cave complex including many different caves), in Quang Ninh province (e.g., Dau Go cave, Sung Sot cave), etc.
The literature indicates the occurrence of S1 biomes in Bai Tu Long, Cat Ba and Phong Nha - Ke Bang National Parks (Annex 1).
Subterranean-Freshwater (SF1) – Subterranean freshwatersTwo EFGs of SF1 in Viet Nam: SF1.1 – Underground streams and pools and SF1.2 Ground water ecosystems. Although the biome SF1 occurs in Viet Nam, their detailed distribution is not well-known and seldom indicated in the literature of protected areas. Some documents e.g., Anonymous (n.d.) and Limbert et al. (2014) described the presence of the SF1 in Phong Nha - Ke Bang.
Subterranean-marine (SM1) – Subterranean tidal systemsAccording to the description of the SM1, Viet Nam may have the presence of all: SM1.1 – Anchialine caves, SM1.2 – Anchialine pools, SM1.3 – Sea caves. According to Keith et al. (2020), abundance of the SM1 biomes occurs along the coastline of the north and north central of Viet Nam. The actual distribution of the SM1 biomes is very little known from the literature of protected areas and general literature. It is known to occur in Bai Tu Long National Park.
Freshwater-terrestrial (TF1) – Palustrine wetlands (or inland wetland)According to the description and the map of the TF1 in Viet Nam, two types of the biomes occur in the country: (1) TF1.1 Tropical flooded forests and peat forests; (2) TF1.4 Seasonal floodplain marshes. Both EFGs occur widely in the Mekong delta of southern Viet Nam. In the Mekong Delta, it is dominated by the Melaleuca forest (natural or planted), seasonally inundated grassland, swamp, extensive grasses, sedges and forbs (Buckton et al., 1999; Carew-Reid et al., 2010). The conditions of the TF1 support populations of several threatened waterbirds, as well as Wild Rice (Oryza rufipogon), the wild progenitor of cultivated rice (Carew-Reid et al., 2010).
Terrestrial (T2) – Temperate-boreal forests and woodlandsOf the EFG of the T2 biome, only the T2.4 – warm temperate laurophyll forests may occur in Viet Nam. According to the description and the map of distribution of the EFGs in T2 (Keith et al., 2020), T2.4 can be found in the Central Highlands, Southeastern and northeast of Viet Nam. According to the classification of sub-ecological zone of Viet Nam (Phuong et al., 2012), the T2.4 may occur in high mountainous areas in the northeast, northwest and north central and the central highlands of Viet Nam. Existing information from the literature does not allow us to better understand the distribution of T2 across the country.
Terrestrial (T4) – Savannas and grasslandsAccording to the description of the EFG, Viet Nam has two EFGs of the T4 biome: T4.1 – Trophic savannas and T4.2 – Pyric tussock savannas. The T4.1 and T4.2 are distinguished in the strong top-down processes. While T4.1 is the biotic interactions and the abundance of nutrients, in T4.2 it is the low-intensity fire. In the distribution map of EFG in (Keith et al., 2020), T4.1 does not occur in Viet Nam, while most areas in the Central Highlands are T4.2 EFG. In Viet Nam, the strong top-down processes of herbivory and predation may not be as prominent as in trophic savannas in Africa, yet the T4.1 may occur in Yok Don National Park where Thuy (2017) demonstrated similar mechanisms driving the ecosystems like other savannas. The abundance of livestock (which estimated to more than 20,000 individuals – per comms. with the Park vice-director) was observed in the park.
In Viet Nam, the deciduous dipterocarp forest (T4.1) mainly occurs in the Central Highlands, the south-central coast and the southern provinces e.g., Khanh Hoa, Ninh Thuan, Binh Thuan, Kon Tum, Gia Lai, Dak Lak, Dak Nong, Lam Dong, Binh Duong, Binh Phuoc and Tay Ninh. In protected areas, the T4 biomes are present in key PA e.g., Yok Don, Nui Chua, Chu Mom Ray, Kon Ka Kinh, Bidoup - Nui Ba, Ba Na - Nui Chua, Binh Chau - Phuoc Buu, Ea So, Krong Trai, Ngoc Linh (Annex 1). Patches of grasslands may occur in Phong Nha - Ke Bang, Bach Ma, Hoang Lien, Pu Hu, Sao la (Thua Thien - Hue), Tay Yen Tu, Nui Ong, Bat Dai Son and Che Tao (Annex 1).
Subterranean (S1) – Subterranean lithic systemsThere are three EFGs in the Subterranean lithic systems (S1) biomes and we can be certain about the occurrence of S1.1 Aerobic caves in Viet Nam. However, information on subterranean and cave systems in particular in Viet Nam is very poor. Aerobic caves in Viet Nam are relatively abundant in karst topography, which occurs widely from Ha Giang to Kien Giang provinces, yet they mostly spread in the north and northern central of Viet Nam (southwards to Da Nang City) (Carew-Reid et al., 2010). Provinces with abundant karst topography include Hoa Binh, Cao Bang, Tuyen Quang, Lang Son, Quang Ninh, Thanh Hoa, Nghe An, etc. (Anonymous, n.d.).
ASSESSING THE BIODIVERSITY IN VIET NAM – ANALYSIS OF IMPACTS FROM ECONOMIC SECTORS 45

According to MONRE (2012) and Carew-Reid et al. (2010) Viet Nam has more than 2,360 rivers of more than 10 km length, of which 109 rivers are 1st order. The river and stream system in Viet Nam occurs throughout the country. Viet Nam has two major river basins which belong to two major deltas (the Hong and Mekong). The country also has 16 domestic river basins with > 2,500 km2 of catchment area. Ten out of the 16 basins are > 10,000 km2 in areas (Bang Giang – Ky Cung, Hong – Thai Binh, Ma, Ca, Vu Gia – Thu Bon, Ba, Srepok, Se san, Dong Nai, Me Cong). The rest six are 2,500-10,000 km2 (Thach Han, Gianh, Huong, Tra Khuc, Kon, and basins in Southeast of Viet Nam).
In the literature (Annex 2), the following protected areas indicate the occurrence of streams and rivers: Ba Be, Chu Mom Ray, Kon Ka Kinh, Lo Go - Xa Mat, Phu Quoc, Vu Quang, Yok Don and Bat Dai Son. The actual distribution of stream and river biome in protected areas in Viet Nam might be far more abundant.
Freshwater (F2) – LakesEFGs of lake biome are distinguished in size, salt, seasonality, the presence of freeze-thaw, ephemeral. According to the descriptions (Keith et al., 2020), Viet Nam may have two EFGs: (F2.2) Small permanent freshwater lakes; (F2.3) Seasonal freshwater lakes. For natural lakes only, Viet Nam has a total of 20.000 ha (Carew-Reid et al., 2010). Some of the natural lakes in Viet Nam are: Ba Be (Bac Kan), Thac Ba (Yen Bai), To Nung (Gia Lai), Lak (Dak Lak), Ta Dung (Dak Nong), Hoan Kiem (Ha Noi), West Lake (Ha Noi), Xuan Huong (Lam Dong), Lap An (Hue), Tuyen Lam (Lam Dong). The literature (Annex 2) indicates the occurrence of lake biome in the following NPs: Ba Be, Ben Ben, Cat Ba, Cat Tien, and Ta Dung. The actual distribution of lake biomes might be far more abundant.
Freshwater-marine (FM1) – Semi-confined transitional watersFrom the descriptions and the maps of distribution (Keith et al., 2020), Viet Nam has two EFGs: (FM1.2) Permanently open riverine estuaries and bays; (FM1.3) Intermittently closed and open lakes and lagoons. Viet Nam has >130 estuaries with an average of an estuary per every 25 km of coastline and occurring in the territories of 24 provinces and cities (Thanh et al., 2013). Some estuaries have been studied e.g., Ba Lat, Bach Dang (in the Red River); Thuan An (one of estuaries of Tam Giang – Cau Hai lagoon); Dinh An, Sai Gon - Dong Nai, the Mekong mouths (Thanh et al., 2013; Duong and Dong, 2019). Some estuaries in small deltas of the central region e.g., Ma, Ca, Thu Bon, Da Rang (Duong and Dong, 2019).
Estuaries areas can be in open sea (Central and Mekong), into large bays (Red River mouth), small bays (Han estuary) or opening into lagoon (Huong River estuary opens into Tam Giang lagoon) (Duong and Dong, 2019). The funnel-shaped estuaries are often located on the shorelines. In Viet Nam, lagoons are
Thinh (2003) studied wetland types in the Mekong delta. According to the information in Thinh (2003), a large area of the Mekong delta belongs to the TF1 biome (Table 11). The results from the literature (Annex 2) indicate the occurrence of TF1 in Ba Vi, Lo Go - Xa Mat, Mui Ca Mau, Tram Chim, U Minh Ha and U Minh Thuong NPs, and Binh Chau - Phuoc Buu, Lang Sen and Lung Ngoc Hoang NRs.
Table 11: Synthesis of wetland protected areas in the Mekong Delta.
Protected area Area Wetland types Types of biomes
U Minh Thuong NP8154 ha, and 13,000 ha surrounding the park are buffer zone
Peatland, swamp Melaleleuca forest, swamp, grassland and open water, water ways.
TF1 and other freshwater ecosystem
Tram Chim NP 7588 ha Inland wetlands: Melaleuca swamp, Seasonally inundated grassland, Lotus swamp TF1
Lang Sen NR 3,280 ha and surrounding area
Inland wetlands: Seasonally flooded (Melaleuca forest, open swamp, seasonally flooded grasslands
TF1
Thanh Phu NR 4800 haEstuary wetlands: natural mangrove swamp, mangrove plantation, mud-flat, sandy beach, natural waterways, shrimp ponds
TF1, FM1, MT1, and other Freshwater ecosystem
Tra Su NR 860 ha Inland wetlands: Seasonally flooded swamp, Seasonally inundated grassland TF1
Tinh Doi Forest Fish Enterprise 2053 ha
Inland wetlands: Seasonally inundated grassland, seasonally flooded swamp, seasonally inundated grassland,
TF1
Ha Tien Grassland 16000 Grassland, inundated swamp forest TF1
Lung Ngoc Hoang NR 2800 Inland wetlands: Melaleuca plantation, rice field, seasonally inundated grassland TF1
Vo Doi NR 3724 Inland wetlands: Peatland; swamp forest, seasonally inundated grassland TF1
Mui Ca Mau NP46,000 ha (15000 ha of new land and 21,000 ha of shallow sea).
Sub-tidal and tidal coastal wetlands: mud flat, mangrove swamp, shrimp ponds TF1, FM1
Source: Thinh (2003)
Freshwater (F1) – Rivers and streamsFive EFGs in F1 biome are present in Viet Nam: (F1.1) Permanent upland streams; (F1.2) Permanent lowland rivers; (F1.4) – Seasonal upland streams; (F1.5) Seasonal lowland rivers; (F1.7) Large lowland rivers. The information on rivers and streams may be revealed in natural and social-economic conditions of the protected areas or provinces, yet it is usually absent from the description of ecosystems in protected areas. Very little understanding of the distribution of the rivers and streams in protected areas was found.
ASSESSING THE BIODIVERSITY IN VIET NAM – ANALYSIS OF IMPACTS FROM ECONOMIC SECTORS 47

Marine (M3) - Deep Sea floorsBased on the description in Keith et al. (2020), Viet Nam has four EFGs of the M3 biome: (M3.1) Continental and island slopes; (M3.3) Abyssal plains; (M3.4) Seamounts, ridges and plateaus; (M3.5) Deepwater biogenic beds. They might occur in the deep-sea areas of the country.
Marine-terrestrial (MT1) - Shoreline systemsThere are three EFGs of the MT1 biome in Viet Nam: (MT1.1) Rocky shorelines; (MT1.2) Muddy shorelines; (MT1.3) Sandy shorelines. They are abundant in the shorelines.
Marine-terrestrial (MT2) - Supralittoral coastal systemsThere is one EFG of MT2 biome in Viet Nam: (MT2.1) Coastal shrublands and grasslands. No information of this biome was found in the literature of protected areas. This ecosystem may occur in the coastal areas of the country.
Marine-freshwater-terrestrial (MFT1) - Brackish tidal systemsThere are three EFGs of the MFT1 in Viet Nam: (MFT1.1) Coastal river deltas; (MFT1.2) Intertidal forests and shrublands; (MFT1.3) Coastal saltmarshes and reedbeds. The tidal ecosystems are highly abundant in the tidal zone. According to Keith et al. (2020), the MFT1.1 is concentrated in the tidal zone of the southern Viet Nam and same as the MFT1.2. The coastal saltmarshes and reedbeds may occur in the tidal zone of the north.
The intertidal forests and shrublands (MFT1.2) include mangrove forests, which are located widely in coastal areas of Viet Nam and especially more extensive in the south and the north (Veettil et al., 2019). The literature of protected areas indicates the occurrence of MFT1 in Bai Tu Long, Cat Ba, Con Dao, Mui Ca Mau and Phu Quoc NPs and in Tien Hai NR. The actual distribution of this biome might be far more extensive.
concentrated in the Central region (from Thua Thien - Hue to Ninh Thuan). There are 12 typical lagoons in the country with a total of 458 km2 and distributed over about 21% of the country’s coastline. Key lagoons e.g., Tam Giang - Cau Hai (run for 70 km along the coast of Thua Thien - Hue province, with a width of 216 km2 (Duong and Dong, 2019).
Marine (M1) – Marine shelfsAccording to Keith et al. (2020), Viet Nam has at least four EFGs of the marine shelf biome: (M1.1) Seagrass meadows; (M1.3) Photic coral reefs; (M1.5) Photo-limited marine animal forests; (M1.6) Subtidal rocky reefs; (M1.7) Subtidal sand beds; (M1.8) Subtidal mud plains; (M1.9) Upwelling zones. Marine shelf (M) ecosystems are highly abundant along coastal areas of Viet Nam.
Marine (M2) - Pelagic Ocean watersBased on the description in Keith et al. (2020) (Figure 3), Viet Nam has four EFGs of the M2 biome: (M2.1) Epipelagic ocean waters; (M2.2) Mesopelagic ocean waters; (M2.3) Bathypelagic ocean waters; (M2.4) Abyssopelagic ocean waters. They are likely to occur in the ocean areas.
Figure 3: Ocean divisions.
ASSESSING THE BIODIVERSITY IN VIET NAM – ANALYSIS OF IMPACTS FROM ECONOMIC SECTORS 49

Table 13: Main threats to mammals, birds, amphibians, reptiles and fishes in Viet Nam.
No. ThreatsNumber of species (% of the assessed species)
Mammals Birds Reptiles Amphibians Fishes
1 Competition 6 (2%) 4 1 5
2 Ecosystem conversion 24 (7%) 28 (3%) 126 (33%) 1 31 (2%)
3 Ecosystem degradation 217 (62%) 192 (22%) 209 (54%) 193 (87%) 679 (33%)
4 Reduced reproductive success 46 (5%) 2
5 Species disturbance 65 (19%) 56 (6%) 4 (1%) 1 36 (2%)
6 Species mortality 262 (75%) 230 (26%) 178 (46%) 193 (87%) 988 (48%)
As a part of assessment processes, IUCN/SSC Specialist Groups also indicated conservation needs to wildlife. According to IUCN (2021), conservation needs of mammal species include awareness and communications (for 28% of the assessed species), harvest management (24%), resource and habitat protection (23%) and trade management (13%); awareness and communications (8%), linked enterprises and
livelihood alternatives (4%) and resource and habitat protection (4%) to birds; resource and habitat protection (9%), harvest management (9%), trade management (8%) and awareness and communications (6%) to reptiles; resource and habitat protection (15%),harvest management (11%) and trade management (6%) to amphibians; harvest management (9%) and trade management (5%) to fishes (see Table 14).
Table 14: Conservation needs of mammals, birds, reptiles, amphibians and fishes.
No. Conservation neededNumber of species (% of assessed species)
Mammals Birds Reptiles Amphibians Fishes
1 Awareness & communications 96 (28%) 73 (8%) 23 (6%) 8 (4%) 65 (3%)
2 Captive breeding/artificial propagation 25 (7%) 14 (2%) 16 (4%) 3 (1%) 5
3 Habitat & natural process restoration 34 (10%) 12 (1%) 6 (2%) 8 (4%) 21 (1%)
4 Harvest management 84 (24%) 15 (2%) 33 (9%) 24 (11%) 176 (9%)
5 Linked enterprises & livelihood alternatives 15 (4%) 38 (4%) 16 (4%) 3 (1%) 5
6 Policies and regulations 7 (2%) 2 15 (4%) 27 (1%)
7 Reintroduction 10 (3%) 2 9 (2%) 3
8 Resource & habitat protection 81 (23%) 32 (4%) 36 (9%) 33 (15%) 60 (3%)
9 Species recovery 29 (8%) 11 (1%) 12 (3%) 66 (3%)
10 Trade management 46 (13%) 3 30 (8%) 14 (6%) 95 (5%)
Source: IUCN (2021)
3.3. Threat classification based on the literature review3.3.1. At species level
VertebratesThe following tables give information about the number of endangered species per main groups following the IUCN Red List classification, main threats for each group and the conservation needs.
Due to the dataset of Viet Nam’s Red Data Book was assessed before 2007, its data was not used in this analysed. According to IUCN (2021), 75 (21%) mammals, 57 (6%) birds, 75 (19%) reptiles, 53 (24%) amphibians and 136 (7%) fishes are listed as threatened species, i.e., in CR, EN and VU categories (Table 12).
Table 12: Classification of mammals, birds, reptiles, amphibians and fishes according to the IUCN Red List
No. IUCN Red List CategoryNumber of species
Mammals Birds Reptiles Amphibians Fishes
1 Extinct 1
2 Regionally Extinct 1
3 Critically Endangered (CR) 21 11 16 3 22
4 Endangered (EN) 26 19 23 28 40
5 Vulnerable (VU) 28 27 36 22 74
6 Near Threatened (NT) 17 51 11 15 39
7 Least Concern (LC) 220 760 233 120 1,515
8 Data Deficient (DD) 34 1 65 33 351
Grand Total 348 869 384 221 2,041
Source: IUCN, 2021
According to the Viet Nam’s National Biodiversity Strategy to 2020 with a vision to 2030 (MONRE, 2015), threats to wildlife in Viet Nam include: illegal and over exploitation (e.g., hunting and trapping, over-fishing etc.), illegal trade, habitat loss and
disturbance, pollution, and climate change. However, based on IUCN’s threat categories, ecological degradation and species mortality are main threats to mammals, birds, reptiles, amphibians and fishes in Viet Nam (Table 13).
ASSESSING THE BIODIVERSITY IN VIET NAM – ANALYSIS OF IMPACTS FROM ECONOMIC SECTORS 51
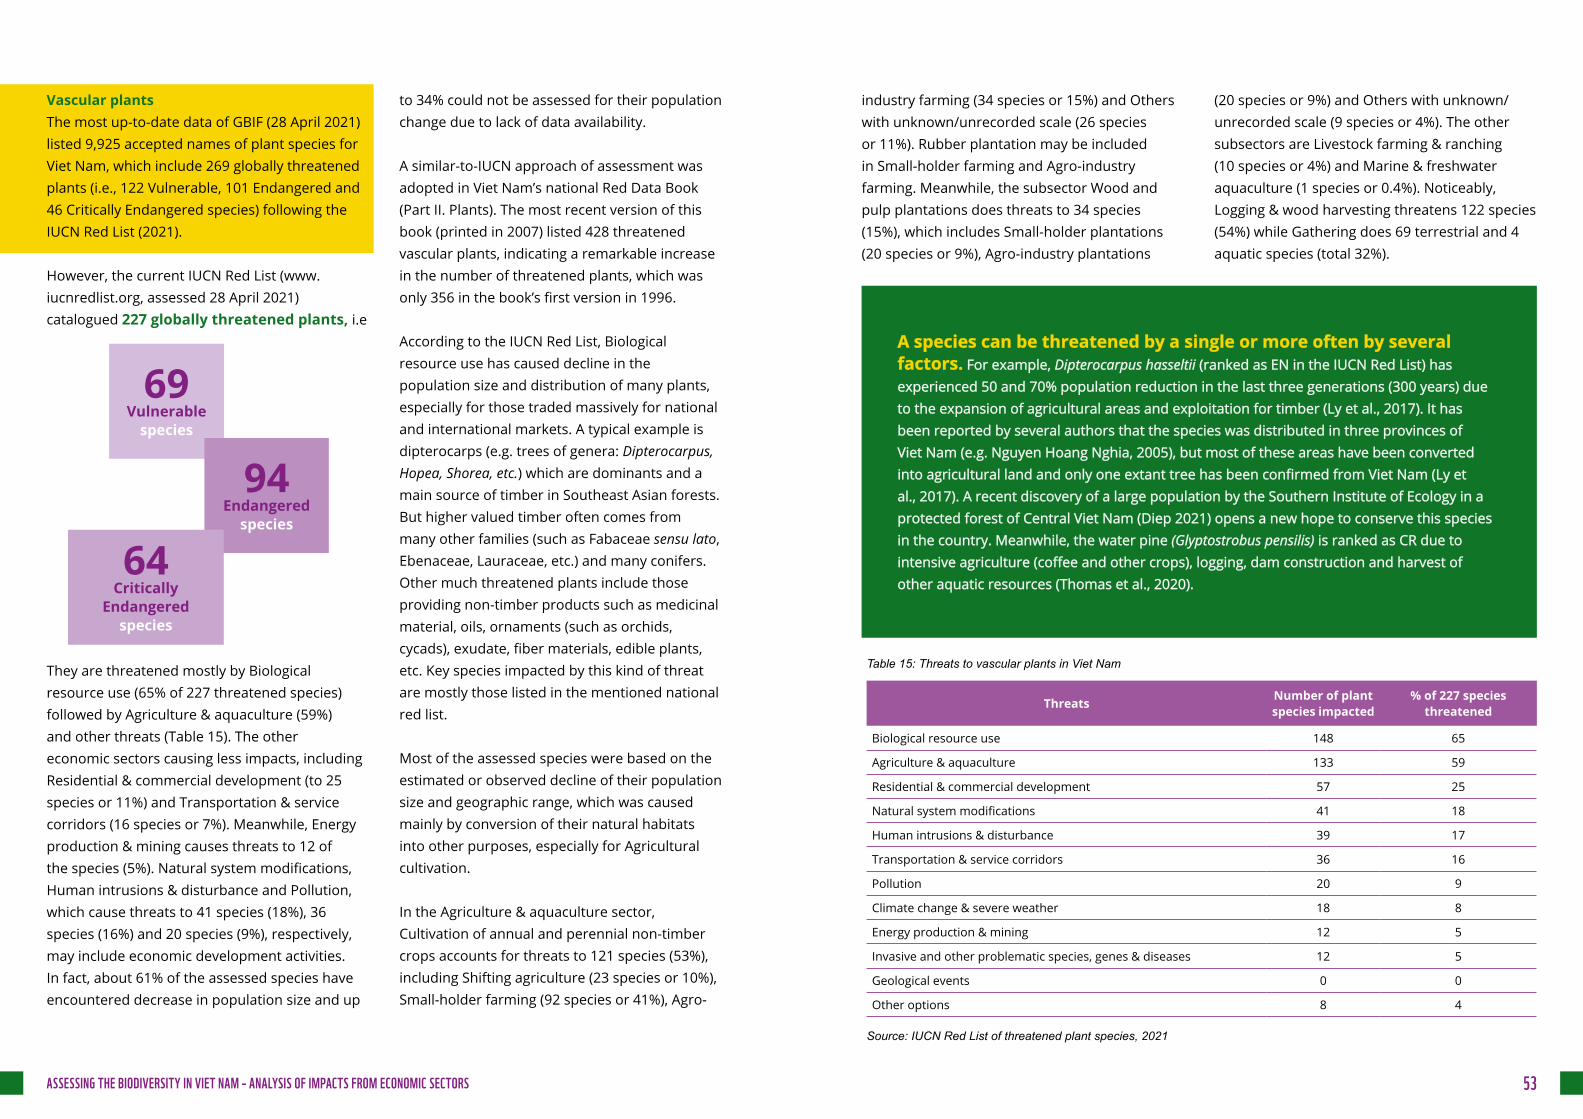
industry farming (34 species or 15%) and Others with unknown/unrecorded scale (26 species or 11%). Rubber plantation may be included in Small-holder farming and Agro-industry farming. Meanwhile, the subsector Wood and pulp plantations does threats to 34 species (15%), which includes Small-holder plantations (20 species or 9%), Agro-industry plantations
(20 species or 9%) and Others with unknown/unrecorded scale (9 species or 4%). The other subsectors are Livestock farming & ranching (10 species or 4%) and Marine & freshwater aquaculture (1 species or 0.4%). Noticeably, Logging & wood harvesting threatens 122 species (54%) while Gathering does 69 terrestrial and 4 aquatic species (total 32%).
Vascular plantsThe most up-to-date data of GBIF (28 April 2021) listed 9,925 accepted names of plant species for Viet Nam, which include 269 globally threatened plants (i.e., 122 Vulnerable, 101 Endangered and 46 Critically Endangered species) following the IUCN Red List (2021).
However, the current IUCN Red List (www.iucnredlist.org, assessed 28 April 2021) catalogued 227 globally threatened plants, i.e
They are threatened mostly by Biological resource use (65% of 227 threatened species) followed by Agriculture & aquaculture (59%) and other threats (Table 15). The other economic sectors causing less impacts, including Residential & commercial development (to 25 species or 11%) and Transportation & service corridors (16 species or 7%). Meanwhile, Energy production & mining causes threats to 12 of the species (5%). Natural system modifications, Human intrusions & disturbance and Pollution, which cause threats to 41 species (18%), 36 species (16%) and 20 species (9%), respectively, may include economic development activities. In fact, about 61% of the assessed species have encountered decrease in population size and up
to 34% could not be assessed for their population change due to lack of data availability.
A similar-to-IUCN approach of assessment was adopted in Viet Nam’s national Red Data Book (Part II. Plants). The most recent version of this book (printed in 2007) listed 428 threatened vascular plants, indicating a remarkable increase in the number of threatened plants, which was only 356 in the book’s first version in 1996.
According to the IUCN Red List, Biological resource use has caused decline in the population size and distribution of many plants, especially for those traded massively for national and international markets. A typical example is dipterocarps (e.g. trees of genera: Dipterocarpus, Hopea, Shorea, etc.) which are dominants and a main source of timber in Southeast Asian forests. But higher valued timber often comes from many other families (such as Fabaceae sensu lato, Ebenaceae, Lauraceae, etc.) and many conifers. Other much threatened plants include those providing non-timber products such as medicinal material, oils, ornaments (such as orchids, cycads), exudate, fiber materials, edible plants, etc. Key species impacted by this kind of threat are mostly those listed in the mentioned national red list.
Most of the assessed species were based on the estimated or observed decline of their population size and geographic range, which was caused mainly by conversion of their natural habitats into other purposes, especially for Agricultural cultivation.
In the Agriculture & aquaculture sector, Cultivation of annual and perennial non-timber crops accounts for threats to 121 species (53%), including Shifting agriculture (23 species or 10%), Small-holder farming (92 species or 41%), Agro-
69 Vulnerable
species
94 Endangered
species
64 Critically
Endangered species
A species can be threatened by a single or more often by several A species can be threatened by a single or more often by several factors.factors. For example, For example, Dipterocarpus hasseltiiDipterocarpus hasseltii (ranked as EN in the IUCN Red List) has (ranked as EN in the IUCN Red List) has experienced 50 and 70% population reduction in the last three generations (300 years) due experienced 50 and 70% population reduction in the last three generations (300 years) due to the expansion of agricultural areas and exploitation for timber (Ly et al., 2017). It has to the expansion of agricultural areas and exploitation for timber (Ly et al., 2017). It has been reported by several authors that the species was distributed in three provinces of been reported by several authors that the species was distributed in three provinces of Viet Nam (e.g. Nguyen Hoang Nghia, 2005), but most of these areas have been converted Viet Nam (e.g. Nguyen Hoang Nghia, 2005), but most of these areas have been converted into agricultural land and only one extant tree has been confirmed from Viet Nam (Ly et into agricultural land and only one extant tree has been confirmed from Viet Nam (Ly et al., 2017). A recent discovery of a large population by the Southern Institute of Ecology in a al., 2017). A recent discovery of a large population by the Southern Institute of Ecology in a protected forest of Central Viet Nam (Diep 2021) opens a new hope to conserve this species protected forest of Central Viet Nam (Diep 2021) opens a new hope to conserve this species in the country. Meanwhile, the water pinein the country. Meanwhile, the water pine (Glyptostrobus pensilis) (Glyptostrobus pensilis) is ranked as CR due to is ranked as CR due to intensive agriculture (coffee and other crops), logging, dam construction and harvest of intensive agriculture (coffee and other crops), logging, dam construction and harvest of other aquatic resources (Thomas et al., 2020).other aquatic resources (Thomas et al., 2020).
Table 15: Threats to vascular plants in Viet Nam
Threats Number of plant species impacted
% of 227 species threatened
Biological resource use 148 65
Agriculture & aquaculture 133 59
Residential & commercial development 57 25
Natural system modifications 41 18
Human intrusions & disturbance 39 17
Transportation & service corridors 36 16
Pollution 20 9
Climate change & severe weather 18 8
Energy production & mining 12 5
Invasive and other problematic species, genes & diseases 12 5
Geological events 0 0
Other options 8 4
Source: IUCN Red List of threatened plant species, 2021
ASSESSING THE BIODIVERSITY IN VIET NAM – ANALYSIS OF IMPACTS FROM ECONOMIC SECTORS 53

and recorded 134 alien plants in 10 protected areas nationwide. Le (2016) recorded 50 to 84 alien species in Ca Mau, U Minh Thuong and Tram Chim National Parks. However, ecological impacts of invasive species to natural ecosystems and local biodiversity are rarely studied and reported, except for the case of Mimosa pigra in the Mekong Delta (Tran et al., 2003, 2004 & 2008).
Climate change and severe weather may cause impacts to plants but those are more often reported for ecosystems rather than for individual species. These are presented in more detail in the ecosystem part.
3.3.2. At ecosystem levelEcosystems in Viet Nam have been under various threats. Carew-Reid et al. (2010) and Rhind (2012) ranked the key threats to biodiversity of Viet Nam in decreasing order as follows: (1) Hunting/illegal wildlife trade; (2) Infrastructure development; (3) Deforestation/illegal timber trade. The website keybiodiversityarea.org used the IUCN threat classification system and listed 9 types of threats that the KBAs have been facing, of which the most abundant threats are biological resource use (about 50 KBAs are under this threat), closely followed by agriculture and aquaculture (more than 40 KBAs), transportation (20 KBAs), human disturbance (nearly 20 KBAs), and residential and commercial development. The number of KBAs that are facing threats from pollution is equivalent to those under threats of energy production and mining, while the number of KBAs under threats of natural system modification is equivalent to those with Invasive species.
From the literature review, a list of threats mentioned under the name of proposed protected areas in the Decision 1976 as was synthesized in Table 16.
Table 16: Threats in protected areas based on the Decision 1976.
Type of PA Occur-rences in National
Park
Occur-rence in Nature Reserve
Total
Residential & commercial development
10 6 16
Agriculture & aquaculture 14 24 38
Energy production and mining 3 8 11
Transportation and service corridors 4 5 9
Biological resource use 22 41 63
Human intrusion & disturbance 4 1 5
Nature system modifications 12 18 30
Invasive & other problematic species and genes
3 1 4
Pollution 6 5 11
Climate change & severe weather 6 2 8
Drawbacks of the available understanding of threats from the literature as follows:± Threats are often associated with the name of
the protected area without details of the location of the threat e.g., in the core or buffer zone,
± The magnitude of the threats is mostly absent and that does not allow us to rank the threat from the available literature,
± The available information on threats is unsystematic and does not reveal all kinds of threats.
Due to the mentioned drawbacks, the figures in Table 16 only provide partial understanding of threats to protected areas. Additional methods, e.g., acquiring the information on threats from databases of the governmental agencies and retrieving indirect information of threats from maps of land use cover change are required to have better understanding of threats.
The following sections present our current understanding of threat types from the literature.
Besides, modification of their ecosystems is seen as a main threat to narrowly distributed species, especially for those living in special environments such as karst (e.g. gesneriads, begonias, etc.). In this regard, Mining is the key player for loss of habitats and associated species, which are normally seen as locally endemics, such as Begonia bataiensis (VU in IUCN Red List) and Ornithoboea emarginata (CR) – both are confined to the karst of Kien Giang Province.
The later species is ranked as Critically Endangered due to its narrow distribution in this unique karst of the Vietnamese Mekong Delta, which has been and will be heavily declined due to mining (Middleton & Vermeulen, 2016). The full assessment of this species is cited here: “On three hills the species occurs in small numbers. On Nui Bai Voi and Nui Hang Cay Ot subpopulations have fallen victim to quarrying. On both hills, small subpopulations occur on parts of the hills excluded from quarrying concessions. However, in November 2015 no individuals could be found there during the height of the flowering season (pers. comm. J.J. Vermeulen). Most of Nui Khoe La will be quarried in the near future, including the localities where the species was observed. A flourishing subpopulation of several hundred individuals occurs on Nui Ba Tai (0.2 km²), at the foot of a rock face bordered by deep mangrove swamp and therefore rather inaccessible. This subpopulation includes at least hundreds of individuals (Vermeulen J. et al 2015). Although the subpopulation on Nui Ba Tai is relatively large, the other three subpopulations are small and are
close to extinction. The four subpopulations are separated by large areas of unsuitable habitat and since the seeds from this plant are just scattered from dry capsules with no adaptation to animal or wind dispersal, it is extremely unlikely that seeds could easily disperse between subpopulations (D. Middleton, pers. comm. 2016). Therefore, the population is considered to be severely fragmented”. Such a competent assessment is not common for plants living in other mined karst areas which are mostly located in northern Viet Nam.
Remarkably, only 11 species (5% of the threatened plants) are considered to have stable populations, such as Newmania sontraensis (a recently described plant that is ranked as Endangered) that has been found at 5 forested sites mostly within protected areas in Central Viet Nam (Tran et al., 2019). Meanwhile, although the integrity of many natural forests has been interrupted by Development of transportation systems, the effect of this threat is more considered for animals than for plants. Likewise, the impacts of Residential & commercial development to plants are less paid attention to in reports of environment impacts assessment (EIA) for development projects.
Recently, Invasive species have become more and more concerned by the authorities and the public. However, their impacts to agricultural cultivation are more emphasized than to natural ecosystems, except several cases such as Mimosa pigra, which is one of the key threats to many wetlands of conservation importance such as Tram Chim National Park which is also a RAMSAR site. There have been inventories of invasive species in provinces and protected areas, such as provinces of Khanh Hoa, Son La, etc. and national parks of Tram Chim, U Minh Thuong, etc. Dang et al. (2012) listed 956 alien species for Viet Nam, accounting for 9% of the national flora,
Mining is the key player for loss of habitats and associated species living in special environments such as karst
ASSESSING THE BIODIVERSITY IN VIET NAM – ANALYSIS OF IMPACTS FROM ECONOMIC SECTORS 55

Mangrove forests, lagoons, and coastal tidal flats have been rapidly converted to
intensive aquacultural areas (e.g., shrimp ponds, clam raising), leading to a near-complete loss of mangrove forests in many provinces e.g., in Van Phong Bay (MONRE, 2015; 2019; Tuấn, 2016). For mangrove forests only, between 1943-1999, due to impacts of wars and aquacultural development, the mangrove forest area has declined by 62% (Rhind, 2012). Similarly, MONRE (2015) estimated a loss of at least 220,000 ha of mangrove forests during the period of 1943-2005 due to deforestation and aquacultural development. According to Chu Hoi (2012), Quang Ninh Province and Hai Phong City lost
40,000 ha of mangrove forests over the last three decades (1960 - 1995) and the area of the remaining mangrove forests in the provinces was 15,700 ha.
For the marine ecosystem, thousands of hectares of coral reefs and seagrasses have also
been lost due to exploitation and/or the use of aquacultural cages (MONRE, 2015; 2019). Rhind (2012) suggested that the area of seagrasses and corals has declined to 30% in some areas, and only 1% is considered to be in good condition. The reduction of the area of coral reefs in several key areas studied was shown in Table 18.
Table 18: Reduction of coral reefs in some coastal regions in Viet Nam
No. Region Quantity of survey sites
Reduced area of live coral reefs
(%)
Reduced area of hard coral reefs
(%)
Reduced area of soft coral reefs
(%)Duration
1 Cu Lao Cham 5 16.8 10.4 6.4 2002-2007
2 Van Phong 5 2.8 2.7 0.1 1995-2006
3 Nha Trang 8 16.2 13.1 3.1 1994-2007
4 Ninh Hai 6 6.3 6.5 0.2 2002-2007
5 Ca Na 5 6.3 4.9 1.4 1995-2006
6 Con Dao 8 16.8 12.9 1994-2004
7 Phu Quoc 6 8.9 0.1 1994-2007
Source: MONRE, 2015
Evidence from the literature (Annex 2) suggested that threats caused by agriculture and aquaculture occurred in the following national parks: Ba Be, Bach Ma, Bidoup - Nui Ba, Cat Ba, Chu Mom Ray, Kon Ka Kinh, Mui Ca Mau, Phong Nha - Ke Bang, Phu Quoc, Pu Mat, Tam Dao, Tram Chim, Xuan Thuy and Yok Don; and the following nature reserves: Song Thanh, Bac Huong Hoa, Bac Me, Copia, Dakrong, Ea So, Hang Kia - Pa Co, Hoang Lien - Van Ban, Kon Chu Rang, Krong Trai,
Lang Sen, Lung Ngoc Hoang, Muong Nhe, Na Hang, Na Hau, Nam Nung, Ngoc Linh, Phu Canh, Pu Hu, Ta Kou, Than Sa - Phuong Hoang, Tien Hai and Van Long as well as Dam Doi and Bac Lieu Bird Sanctuaries.
Loss of seagrass area and coral reefs
2.3.2.1. Residential & commercial developmentConstruction of tourism infrastructure has been on the rise and shown significant impacts on
the landscape (Tuấn, 2016). The forest land converted for infrastructure development was 580.32 ha (in 2007), 5,830.76 ha (2008), 164.19 ha (2009), 7,115.08 ha (2010), 12,157.08 ha (2011) and 89.34 ha (2012) as cited in MONRE (2014).
Evidence from the literature (Annex 2) suggested that residential and commercial development threatened ecosystems in the following national parks: Ba Be, Ba Vi, Bach Ma, Bidoup - Nui Ba, Chu Mom Ray, Hoang Lien, Mui Ca Mau, Phong Nha - Ke Bang, Tam Dao and Yok Don, and the following nature reserves: Bac Me, Hon Ba, Kon Chu Rang, Lang Sen, Na Hau and Van Long.
2.3.2.2. Agriculture & AquacultureAccording to Duc et al. (2019), over 20 years (1975-1995), natural forests of the country
decreased by 2.8 M ha and the loss of natural forests continued in the following years, mainly due to land use conversion. For the period
2003-2009, annually 25,000 ha of forest was converted to other use purposes (MONRE, 2015). For the period 2006-2014, forests continued being lost and The World Bank Group (2019) synthesized these areas as shown in Table 17 but these figures did not reflect the actual total deforestation. For the period 2017-2018 only, the government received requests for conversion of land within special-use and protection forests from 50/60 provinces; 33 of those proposed to convert natural forests in 3,021 projects (with a total of 122,851 ha) and projects in 22/33 provinces were approved. In the Central Highlands, the loss of natural forests in Dak Lak, Dak Nong and Gia Lai provinces were 3,472 ha, 3,811 ha and 10,219 ha, respectively (Duc et al., 2019). The land planned for rubber areas by 2030 is 343,890 ha and 79% of the expanded areas are from natural forests (Duc et al., 2019). Kissinger (2020) indicated that between 2005 and 2015, the rubber, coffee, cassava and pepper areas increased 198% (~172,308 ha), 29% (~ 106,000 ha), 157,292 ha and 106% (52,000 ha), respectively. In 2008, 150,000 ha of deciduous dipterocarp forests in the Central Highlands, which were regarded as degraded, were allowed to be converted to rubber plantations (MONRE, 2015).
Infrastructure construction
Forest conversion to plantations and agricultural areas
Table 17: Forest conversion between 2006-2014.
Types of conversion No. of projects Total area (ha)Forest type (ha)
Special-use Protection Production
Hydropower development 237 29,562 4,094 15,534 9,954
Mineral mining 545 15,330 19 7,696 7,615
Rubber plantation 460 327,205 327,205
Agriculture 211 61,964 304 7,720 53,940
Resettlement 57 5,244 1,238 4,006
National security and defense 99 4,228 80 1,839 2,309
Industry and ports 73 3,895 87 2,779 1,029
Tourism and services 122 4,603 4,067 332 204
Irrigation 80 5,199 33 596 4,570
Rural infrastructure (roads, electricity, etc.)
1,107 19,190 174 9,634 9,382
Source: The World Bank Group, 2019
Mangrove forest conversion to aquaculture
© Wirestock / Freepik.comASSESSING THE BIODIVERSITY IN VIET NAM – ANALYSIS OF IMPACTS FROM ECONOMIC SECTORS 57
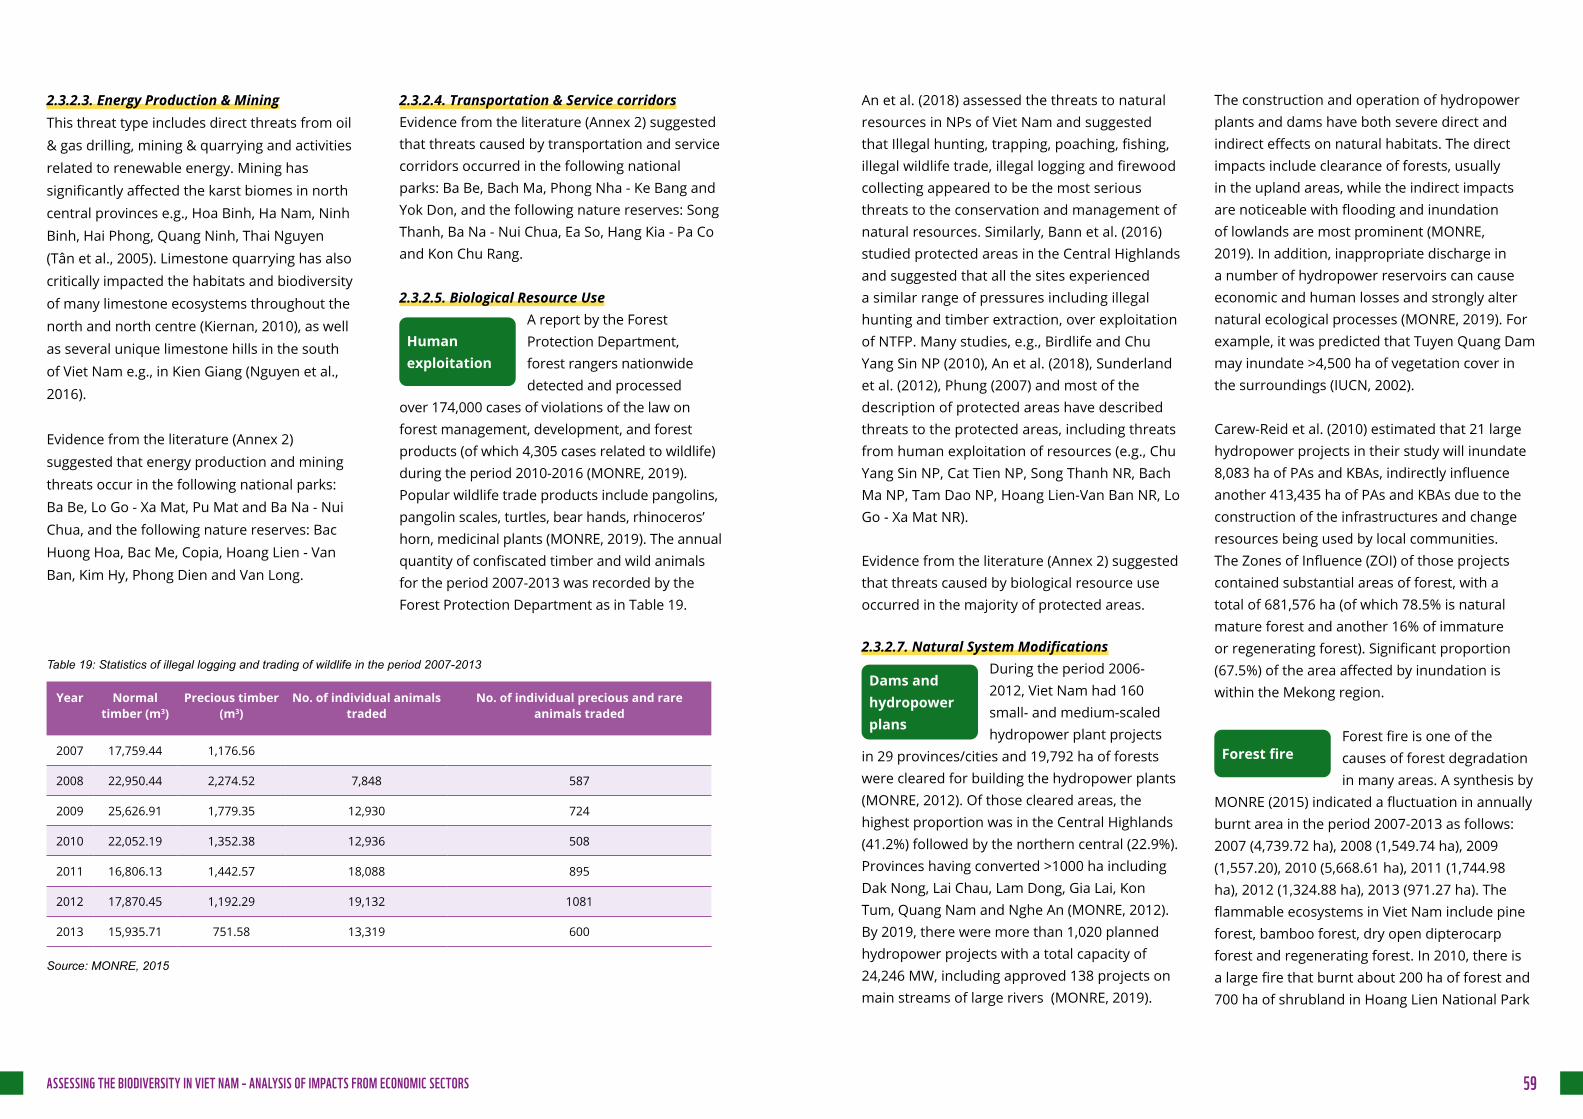
An et al. (2018) assessed the threats to natural resources in NPs of Viet Nam and suggested that Illegal hunting, trapping, poaching, fishing, illegal wildlife trade, illegal logging and firewood collecting appeared to be the most serious threats to the conservation and management of natural resources. Similarly, Bann et al. (2016) studied protected areas in the Central Highlands and suggested that all the sites experienced a similar range of pressures including illegal hunting and timber extraction, over exploitation of NTFP. Many studies, e.g., Birdlife and Chu Yang Sin NP (2010), An et al. (2018), Sunderland et al. (2012), Phung (2007) and most of the description of protected areas have described threats to the protected areas, including threats from human exploitation of resources (e.g., Chu Yang Sin NP, Cat Tien NP, Song Thanh NR, Bach Ma NP, Tam Dao NP, Hoang Lien-Van Ban NR, Lo Go - Xa Mat NR).
Evidence from the literature (Annex 2) suggested that threats caused by biological resource use occurred in the majority of protected areas.
2.3.2.7. Natural System ModificationsDuring the period 2006-2012, Viet Nam had 160 small- and medium-scaled hydropower plant projects
in 29 provinces/cities and 19,792 ha of forests were cleared for building the hydropower plants (MONRE, 2012). Of those cleared areas, the highest proportion was in the Central Highlands (41.2%) followed by the northern central (22.9%). Provinces having converted >1000 ha including Dak Nong, Lai Chau, Lam Dong, Gia Lai, Kon Tum, Quang Nam and Nghe An (MONRE, 2012). By 2019, there were more than 1,020 planned hydropower projects with a total capacity of 24,246 MW, including approved 138 projects on main streams of large rivers (MONRE, 2019).
The construction and operation of hydropower plants and dams have both severe direct and indirect effects on natural habitats. The direct impacts include clearance of forests, usually in the upland areas, while the indirect impacts are noticeable with flooding and inundation of lowlands are most prominent (MONRE, 2019). In addition, inappropriate discharge in a number of hydropower reservoirs can cause economic and human losses and strongly alter natural ecological processes (MONRE, 2019). For example, it was predicted that Tuyen Quang Dam may inundate >4,500 ha of vegetation cover in the surroundings (IUCN, 2002).
Carew-Reid et al. (2010) estimated that 21 large hydropower projects in their study will inundate 8,083 ha of PAs and KBAs, indirectly influence another 413,435 ha of PAs and KBAs due to the construction of the infrastructures and change resources being used by local communities. The Zones of Influence (ZOI) of those projects contained substantial areas of forest, with a total of 681,576 ha (of which 78.5% is natural mature forest and another 16% of immature or regenerating forest). Significant proportion (67.5%) of the area affected by inundation is within the Mekong region.
Forest fire is one of the causes of forest degradation in many areas. A synthesis by
MONRE (2015) indicated a fluctuation in annually burnt area in the period 2007-2013 as follows: 2007 (4,739.72 ha), 2008 (1,549.74 ha), 2009 (1,557.20), 2010 (5,668.61 ha), 2011 (1,744.98 ha), 2012 (1,324.88 ha), 2013 (971.27 ha). The flammable ecosystems in Viet Nam include pine forest, bamboo forest, dry open dipterocarp forest and regenerating forest. In 2010, there is a large fire that burnt about 200 ha of forest and 700 ha of shrubland in Hoang Lien National Park
Dams and hydropower plans
Forest fire
2.3.2.3. Energy Production & MiningThis threat type includes direct threats from oil & gas drilling, mining & quarrying and activities related to renewable energy. Mining has significantly affected the karst biomes in north central provinces e.g., Hoa Binh, Ha Nam, Ninh Binh, Hai Phong, Quang Ninh, Thai Nguyen (Tân et al., 2005). Limestone quarrying has also critically impacted the habitats and biodiversity of many limestone ecosystems throughout the north and north centre (Kiernan, 2010), as well as several unique limestone hills in the south of Viet Nam e.g., in Kien Giang (Nguyen et al., 2016).
Evidence from the literature (Annex 2) suggested that energy production and mining threats occur in the following national parks: Ba Be, Lo Go - Xa Mat, Pu Mat and Ba Na - Nui Chua, and the following nature reserves: Bac Huong Hoa, Bac Me, Copia, Hoang Lien - Van Ban, Kim Hy, Phong Dien and Van Long.
2.3.2.4. Transportation & Service corridorsEvidence from the literature (Annex 2) suggested that threats caused by transportation and service corridors occurred in the following national parks: Ba Be, Bach Ma, Phong Nha - Ke Bang and Yok Don, and the following nature reserves: Song Thanh, Ba Na - Nui Chua, Ea So, Hang Kia - Pa Co and Kon Chu Rang.
2.3.2.5. Biological Resource Use A report by the Forest Protection Department, forest rangers nationwide detected and processed
over 174,000 cases of violations of the law on forest management, development, and forest products (of which 4,305 cases related to wildlife) during the period 2010-2016 (MONRE, 2019). Popular wildlife trade products include pangolins, pangolin scales, turtles, bear hands, rhinoceros’ horn, medicinal plants (MONRE, 2019). The annual quantity of confiscated timber and wild animals for the period 2007-2013 was recorded by the Forest Protection Department as in Table 19.
Human exploitation
Table 19: Statistics of illegal logging and trading of wildlife in the period 2007-2013
Year Normal timber (m3)
Precious timber (m3)
No. of individual animals traded
No. of individual precious and rare animals traded
2007 17,759.44 1,176.56
2008 22,950.44 2,274.52 7,848 587
2009 25,626.91 1,779.35 12,930 724
2010 22,052.19 1,352.38 12,936 508
2011 16,806.13 1,442.57 18,088 895
2012 17,870.45 1,192.29 19,132 1081
2013 15,935.71 751.58 13,319 600
Source: MONRE, 2015
ASSESSING THE BIODIVERSITY IN VIET NAM – ANALYSIS OF IMPACTS FROM ECONOMIC SECTORS 59

206,400 tons of COD, 22,400-39,000 tons of BOD, 38,800-125,900 tons of N-T, 11,900-23,300 tons P-T, 428,400-1,724,000 tons TSS, 51.5-83 tons of crop protection chemicals and 7.8-430 tons of heavy metals.
Evidence from the literature (Annex 2) suggested that threats from pollution occured in the following national parks: Ba Be, Bai Tu Long, Kon Ka Kinh, Phong Nha - Ke Bang, Phu Quoc and Xuan Thuy, and the following nature reserves: Hoang Lien - Van Ban, Lang Sen, Phong Dien, Takou and Van Long.
2.3.2.10. Climate change and severe weatherViet Nam is one of the countries that are most affected by climate change. Climate change is likely to have more severe impacts on humans and ecosystems in the coastal areas of the two largest deltas (especially the Mekong River Delta) of Viet Nam than the other regions (Rhind, 2012). Impacts of climate change to different areas vary, e.g., the low-lying areas are more likely to be impacted by typhoons, while upland areas will face greater risks from flash flooding and landslides caused by heavy rain (Rhind, 2012). It is forecasted that the Mekong Delta region will experience significant inundation (estimated 30-50% of land areas will be inundated in half of the provinces in the region), as cited in Rhind (2012). Protected areas near the coastal areas are predicted to be at greater risk from direct impacts e.g., storms and floods, while protected areas further from the coastline are likely to face increased pressure from people’s migration from flooded and inundated areas and this results in threats of encroachment, land conversion and illegal logging (Rhind, 2012). It is cited from Rhind (2012) that 39% of National Parks and 22% of Nature Reserves will be at risk of inundation with the scenario of one metre sea level rise.
Recently, MONRE (2019) published detailed scenarios of the 1m sea level rise. According to that scenario, 16.8% of the Red River Delta area and 38.9% of the Mekong River Delta are at risk of flooding and approximately 17.8% of Ho Chi Minh City’s area is in danger of being inundated. Van Don (Quang Ninh province), Con Dao (Ba Ria - Vung Tau) and Phu Quoc (Kien Giang) Islands are likely to face the highest risk of climate change. With that scenario, 78 out of 286 critical habitats (equivalent to 27%), 46 protected areas (equivalent to 33%), nine biodiversity areas of national and international value (23%) and 23 other biodiversity areas in Viet Nam would be severely affected (MONRE, 2019).
(Lao Cai province) and similarly, the fire of the same year in Tram Chim NP destroyed about 200 ha of forest (MONRE, 2015).
Evidences from the literature (Annex 2) suggested that threats caused by natural system modifications have occurred in the following national parks: Bach Ma, Bidoup - Nui Ba, Cat Tien, Chu Mom Ray, Hoang Lien, Phong Nha - Ke Bang, Tam Dao, Tram Chim, U Minh Ha, U Minh Thuong, Vu Quang and Yok Don, and the following nature reserves: Song Thanh, Ba Na - Nui Chua, Bac Huong Hoa, Dakrong, Hoang Lien - Van Ban, Kon Chu Rang, Krong Trai, Lang Sen, Na Hau, Nam Nung, Ngoc Linh, Phong Dien, Phu Canh, Pu Hu, Ta Xua, Tay Con Linh, Van Long, and Son Tra.
2.3.2.8. Invasive & other problematic species, genes & diseases
MONRE (2019) cited a statistic of 94 alien species imported into Viet Nam, including 42 known
invasive species of which 12 are fast-growing. In 2019 MARD announced a list of 48 aquatic alien animals that have become abundant in Viet Nam through different pathways. Of these, 14 species are considered to have adverse impacts on aquatic biodiversity (MONRE, 2019). The numbers of alien and invasive plant species in ten national parks studied by Tan et al. (2012) ranged from 38-65 species and 8-15 species, respectively (Table 20). 25 of their total 134 exotic weeds identified were classified as invasive species, including plants (such as Eichhornia crassipes, Chromolaena odorata, Mikania micrantha, M. diplotricha, Mimosa diplotricha, Mim. pigra, Panicum repens) and animals (such as golden snail - Pomacea canaliculata, P. insunarum, red-eared slider - Trachemys scripta elegans and freshwater lobsters).
Table 20: Number of alien and invasive plant species in studied PAs.
Site Alien plant species
Invasive plant species
Hoang Lien NP 38 9
Cat Ba NP 38 15
Cuc Phuong NP 49 10
Vu Quang NP 49 8
Phong Nha - Ke Bang NP 45 12
Son Tra NCA 53 12
Chu Mom Ray NP 52 12
Cat Tien NP 65 12
Tham Chim NP 44 12
U Minh Thuong NP 47 12
Total no. of species 134 25
Source: Tan (2012)
Evidence from the literature (Annex 2) suggested that invasive species caused threats in Lang Sen Nature Reserve and the following national parks: Cat Tien, Phong - Nha Ke Bang and Tram Chim.
2.3.2.9. PollutionPollution threats tend to be a significant problem of marine, freshwater and brackish ecosystems. An estimate of annual solid waste discharge of 28 coastal provinces is 14.03 M tons (about 38,500 ton/day) (Chu Hoi, 2012). In 2009, the discharge of solid waste from hospitals in coastal provinces was estimated to be 248 ton/day (of which 20% is dangerous wastes that require treating before discharging) (Chu Hoi, 2012). On average, one ha of shrimp ponds discharges 5 ton of solid waste and tens of thousands m3 of water waste (Chu Hoi, 2012).
Evaluations of Chu Hoi (2012) on the water pollution of the coastal areas in Hai Phong – Quang Ninh, Da Nang – Quang Nam, Ba Ria – Vung Tau – Ho Chi Minh showed that annually these coastal areas discharged to the sea 175,6-
Invasive species
© Wirestock / Freepik.com
ASSESSING THE BIODIVERSITY IN VIET NAM – ANALYSIS OF IMPACTS FROM ECONOMIC SECTORS 61

3.3.3. Conclusion: a lack of quantitative and exhaustive analysis of the biodiversity threats The literature review enabled to highlight the following points:±There is a lack of an exhaustive analysis encompassing both all the species taxa and the ecosystems, that
would quantify the complex relationship between threats and the biodiversity trends at these two levels.±However, key trends are confirmed and the main threats can be summarized as follow:
3.4. Remote sensing analysis3.4.1. Land cover and land use change at country levelSixteen land classes have been analyzed based on the dataset made available by SERVIR-Mekong1 (see section 1.2). It includes 10 land covers and 6 land uses. A surface of approximately 330,000 km² was studied, split between 159,749 km² of land cover and 169,449 km² of land uses (see Table 21).
Table 21: Land cover and land use analysis at country level.
1 Sea is not included. Surface Water was defined as open water larger than 30m by 30m that is open to the sky, including fresh and saltwater.
Orchard or Plantation Forest
58,894.72 62,352 69,261.76 36.81% 37.4% 40.87% 3,457.28 5.87% 6909.76 11.08% 10,367.04 +17.60%
Urban and Built Up 3,097.92 4,384.96 4,778.88 1.94% 2.63% 2.82% 1,287.04 41.55% 393.92 8.98% 1,680.96 54.26%
Cropland 33,671.36 35,253.76 32,078.72 21.04% 21.14% 18.93% 1,582.4 4.70% -3175.04 -9.01% -1,592.64 -4.73%
Rice 56,040.96 55,771.84 54,219.52 35.02% 33.45% 32.00% -269.12 -0.48% -1552.32 -2.78% -1,821.44 -3.25%
Mining 160.96 161.6 161.92 0.10% 0.10% 0.10% 0.64 0.40% 0.32 0.2% 0.96 0.60%
Aquaculture 8,147.84 8,795.52 8,948.16 5.09% 5.28% 5.28% 647.68 7.95% 152.64 1.74% 800.32 9.82%
Total of land uses 160,013.76 166,719.68 169,448.96 100.00% 100.00% 100.00% 6,705.92 +4.19% 2,729.28 +1.63% 9,435.2 +5.90%
In 2018, evergreen broadleafs are the most represented habitats, since they cover around 48% (76,000 km²) of the total superficies of the land cover. If added up to forests and mixed forests, these three habitats represent around 90% of the land cover in Viet Nam. This shows that most of the natural surfaces of the country, which extend over an area of 160,000 km², are covered by wooden lands.
Land classesSurface (km²) Surface (%) 2000-2010 2010-2018 2000-2018
2000 2010 2018 2000 2010 2018 In km² % In km² % In km² %
Shrubland 32.64 57.92 91.2 0.02% 0.04% 0.06% 25.28 77.45% 33.28 57.46% 58.56 179.41%
Grassland 2,524.8 4,016.96 5,133.76 1.49% 2.47% 3.21% 1495.16 59.10% 1116.8 27.8% 2,608.96 103.33%
Wetlands 630.4 1,019.2 1,073.28 0.37% 0.62% 0.67% 388.8 61.68% 54.08 5.31% 442.88 70.25%
Evergreen Broadleaf 73,735.68 75,308.16 76,254.72 43.60% 46.36% 47.73% 1,572.48 2.13% 946.56 1.26% 2,519.04 3.42%
Surface Water 7,147.2 7,187.52 7,267.52 4.23% 4.43% 4.55% 40.32 0.56% 80 1.11% 120.32 1.68%
Forest 44,519.04 45,328 42,551.04 26.32% 27.91% 26.64% 808.96 1.82% -2776.96 -6.13% -1968 -4.42%
Barren 2,264.32 2,070.08 2,144.32 1.34% 1.27% 1.34% -194.24 -8.58% 74.24 3.59% -120 -5.30%
Mangroves 1,339.52 1,166.72 1,185.6 0.79% 0.72% 0.74% -172.8 -12.90% 18.88 1.62% -153.92 -11.49%
Mixed Forest 34,316.16 25,202.88 23,220.48 20.29% 15.51% 14.54% -9,113.28 -26.56% -1982.4 -7.87% -11,095.68 -32.33%
Flooded Forest 2,611.2 1,057.6 827.2 1.54% 0.65% 0.52% -1,553.6 -59.50% -230.4 -21.79% -1,784 -68.32%
Total of land covers 169,120.96 162,415.02 159,749.12 100.00% 100.00% 100.00% -6,314.5 -3.74% -2,665.92 -1.64% -9,371.84 -5.54%
orchards and plantation forests represent around
41% (70,000 km²) of the total land uses areas (170,000 km²)
closely followed by rice cultures
32% ( 54,000 km²)
Added together, they represent 93% of the total land uses.Between 2000 and 2018, more than 9,371 km² of land cover have been lost, representing more than 5% of the initial area. The major decline occurred between 2000 and 2010 (-3.74%).
croplands
19% ( 32,000 km²)
Regarding land uses,
Forested areas have been the most impacted habitats : mixed forest (-11,095 km², accounting a 32% decrease in comparison with the area in 2000), forests (-1,968 km², accounting a 4% decrease in comparison with the area in 2000), flooded forests (-1,784 km², accounting a 68% decrease in comparison with the area in 2000), mangroves (-153 km², accounting a 11% decrease in comparison with the area in 2000), with the exception of evergreen broadleaf forests (+2,500 km² accounting a 4% increase in comparison with the area in 2000) whose surfaces expanded between 2000 and 2018. On average, the major decline of the forested areas occurred between 2000 and 2010.
The superficies of grasslands (+2600 km²) and shrublands (+60 km²) have expanded between 2000 and 2018.
The first set of maps provided by remote sensing analysis (Figures 4 to 6) gives information on land cover in 2000, and 2018. Based on these maps
and available data, land changes analyses were performed for every land class to have a better idea of the location of the land changes between the 2000-2018 period.
Regarding land uses, as a balance with the land cover areas changes, a continuous increase of the superficies happened between 2000 and 2018, while the bigger increase was between 2000 and 2010.
Between 2000 and 2018, orchards/plantation forests is the anthropic habitat that had biggest continuous expansion, gaining around 10,400 km² (+18%), especially worsening between 2010 and 2018. Still between 2000 and 2018, the Urban areas have increased by 1,680 km² (+54%). Aquaculture surfaces have also grown, gaining 800 km² (+10%), while agricultural surfaces such as rice fields (-1,800 km², -3%) and croplands (-1,600 km², -5%) have gone through a slight regression. Mining areas have remained stable, gaining less than 1 km² (< +1%).
At the species level: ecosystem degradation, land conversion are the most significant threats to wildlife animal. For plants, biological resource uses, agriculture and aquaculture, residential and commercial development are three most significant threats.
At the ecosystem level: biological resource use (including hunting and illegal trade of wildlife), agriculture and aquaculture, infrastructure development, natural system modification are the most common and key threats.
ASSESSING THE BIODIVERSITY IN VIET NAM – ANALYSIS OF IMPACTS FROM ECONOMIC SECTORS 63

1 The natural dynamics of vegetation (or evolutionary series of an ecosystem) can be progressive, that is to say they can evolve towards a new state of relatively stable equilibrium such as the evolution of vegetation meadow towards forest vegetation. In this case, the [forest area in year N + 1] = [forest area N-1] - [forest areas converted between (N) and (N-1)] + [areas of vegetation resulting in a progressive dynamic evolution]
2 Some modified habitats in 2018 may have smaller areas than in 2010 because they may have been transformed into other modified habitats between 2010 - 2018 (Ex: a rice crop can be drained and converted into another crop), resulting in to a "loss" of area of rice crop habitat in 2018. In this case, the [N + 1 rice area] = [N-1 rice area] + [rice areas created by conversion of natural habitat] - [rice areas converted to other habitats].
Figure 4: Land cover in 2000 Figure 5: Land cover in 2018
Figure 6: Land cover evolution for artificialized areas from 2000 to 2018
Source: Oréade-Brèche. 2021
Annex 4, 5 and 6 provide a detailed analysis of the conversion of the land respectively between 2000 and 2018, 2000-2010 and 2010-2018. Given that forested areas have been the most impacted habitat, hereinafter, a special attention is paid on these habitats.
Beneath, figures 7, 8, 9 and 10 highlights land changes of the most impacted natural forest areas, identifying the drivers of their decline.
The superficies of natural habitats converted during the periods (2000 - 2010), then (2010 to 2018) might be different from the superficies of natural habitats converted between 2000 and 2018 because the superficies of natural habitats are not simply affected by the phenomenon of habitats destruction and because the areas of modified habitats are not frozen in time:
The figure 7 depictures the areas of flooded forests that have been converted in new uses (mainly in aquaculture and rice) between 2000 and 2018. The conversion in rice paddies (769 km²) and in aquaculture (372 km²) mainly occurred between 2000 and 2010. Additional details are mentioned in Annex 4, 5 and 6.
The figure 8 depictures the areas of mixed forests that have been converted in new uses (cropland, orchards or plantations forests) between 2000 and 2018, with a total of 2,257.28 ha (plantation) and 1,787.84 ha (croplands). The conversion in croplands mainly occurred between 2000 and 2010 (1513 km²) while the conversion in orchards and plantations mainly occurred between 2010 and 2018 (1535 km²). Additional details are provided in Annex 4, 5 and 6.
Figure 7: Analysis of flooded forest areas converted in other uses between 2000 and 2018.
Figure 8: Analysis of mixed forest areas converted in other uses between 2000 and 2018.
Cropland
1787,84Orchards or Plantation Forests
2257,28
Aquaculture
397,44Rice
888,96
Orchards or Plantation Forests
122,24
The figure 9 depictures the areas of mangroves that have been converted in new uses (mainly aquaculture and rice) between 2000 and 2018, with a total of 185.28 ha (aquaculture) and 20.16 ha (rice paddies). The conversion in aquaculture mainly occurred between 2000 and 2010 (145 km²). The conversion in rice paddies also mainly occurred between 2000 and 2010 (14 km²). Additional details are provided in Annex 4, 5 and 6.
Figure 9: Analysis of mangroves areas converted in other uses between 2000 and 2018.
Urban and Built up
6,72Rice
20,16
Aquaculture
185.28
65

Table 22: Land cover and land use analysis at protected area level.
Land classesSurface (km²) Surface (%) Changes between 2000 and 2018
2000 2018 2000 2018 In km² %
Shrubland 0.32 1.28 0.00% 0.01% 0.96 300.00%
Grassland 126.4 347.2 0.68% 1.94% 220.8 174.68%
Wetlands 107.52 203.84 0.58% 1.14% 96.32 89.58%
Evergreen Broadleaf 5,936.64 6,024.96 32.00% 33.61% 88.32 1.49%
Surface Water 1,353.28 1,349.76 7.29% 7.53% -3.52 -0.26%
Forest 8,068.48 8,278.08 43.49% 46.18% 209.6 2.60%
Barren 57.6 63.04 0.31% 0.35% 5.44 9.44%
Mangroves 255.36 272.32 1.38% 1.52% 16.96 6.64%
Mixed Forest 1,999.04 1,223.04 10.77% 6.82% -776 -38.82%
Flooded Forest 648.64 161.6 3.50% 0.90% -487.04 -75.09%
Total 18,553.28 17,925.12 100.00% 100.00% - 628.16 - 3.39%
Orchard or Plantation Forest 6,320.96 6,845.76 54.39% 55.60% - 524.8 8.30%
Urban and Built Up 144 202.56 1.24% 1.65% - 58.56 40.67%
Cropland 2,021.12 1,765.44 17.39% 14.34% 255.68 -12.65%
Rice 1977.28 2,212.8 17.01% 17.97% - 235.52 11.91%
Mining 6.72 6.4 0.06% 0.05% 0.32 -4.76%
Aquaculture 1,151.36 1280 9.91% 10.40% - 128.64 11.17%
Total 11,621.44 11,160.96 100.00% 100.00% +691.52 -5.95%
3.4.2. Land cover and land use changes at PA and KBA levelThanks to the shapefiles used, the analysis has been performed on 99 Protected Areas and 167 KBA. In 2018, for protected areas, the most represented land cover are forests, which represent 8,300 km² (46% of the total land cover). They are followed by evergreen broadleaf (6,000 km², 34%), surface waters (1,350 km², 8%) and mixed forests (1,200 km², 7%). Just like for the national scale, forests seem to dominate most natural areas, adding up to 87% of the total natural surfaces. Regarding artificial habitats, orchards and plantation forests cover largest part of the land uses in protected areas (6800 km², 56%), followed by rice cultures (2200 km², 18%), croplands (1800 km², 14%) and aquaculture (1280 km², 10%).
Between 2000 and 2018, mixed forests have massively decreased losing 776 km² of their surface (-39%). The same observation can be made for flooded forests (-490 km², -75%). Most of the superficies of the land uses have increased, especially for orchards/plantation forests (520 km², +8%), as well as 240 km² of rice fields (+12%) and 130 km² of aquaculture areas (+11%). “Urban and Built Up” surfaces have also known an important growth, since they have gained 60 km² (+41%).
If we compare land changes trends at protected areas level with the land changes trend at country level, the same type of habitat is mainly impacted (forested habitat). Magnitude of loss is even higher in PA than at country level (-32% of mixed forest at the country level, VS -38 % at the protected areas level, while flooded forests decreased by 68% at the national level VS 75% at the protected areas level) that raise the question of the efficiency of the protected areas.
In 2018, KBAs are mostly covered by forests: evergreen broadleaf forests spread over 8800 km², (75% of land cover), while forests cover 1700 km² (14% of land cover) and mixed forests spread over 800 km², (7% of land cover). Regarding land uses, orchards and plantation forests are the main artificial habitat (2030 km², 50% of the land uses) followed by croplands and rice cultures, both spreading over 1757 km² (43% of the land uses). Between 2000 and 2018, mixed forests have significantly decreased, losing 549 km² of their surface (-40%), while croplands are the most spreading land uses, expanding over 348 km² (more than 43%). If we compare the land changes in KBAs, with the previous results, it turns out the trends are similar in terms of natural habitat decline, with a worrying decrease of mixed forests.
Figure 10: Analysis of forested areas converted in other uses between 2000 and 2018.
Cropland
3240,96 Orchards or Plantation Forests
2297,76
Table 23: Land cover and land use analysis at KBA level.
Land classesSurface (km²) Surface (%) Changes between 2000-2018
2000 2018 2000 2018 km² %Shrubland 0.32 1.28 0.00% 0.01% 0.96 300.00%Grassland 109.44 176.64 0.89% 1.50% 67.2 61.40%Wetlands 16.32 24 0.13% 0.20% 7.68 47.06%Evergreen Broadleaf 8,640.32 8,792 70.54% 74.75% 151.68 1.76%Surface Water 228.16 230.08 1.86% 1.96% 1.92 0.84%Forest 1,847.04 1,684.8 15.08% 14.32% -162.24 -8.78%Barren 19.52 22.4 0.16% 0.19% 2.88 14.75%Mangroves 26.88 19.84 0.22% 0.17% -7.04 -26.19%Mixed Forest 1,358.72 809.6 11.09% 6.88% -549.12 -40.41%Flooded Forest 2.24 1.28 0.02% 0.01% -0.96 -42.86%
Total land cover 12,248.96 11,761.92 100.00% 100.00% -487.04 -3.97%
Orchard or Plantation Forest 1,895.68 2,030.4 53.37% 50,27% 134.72 7.11%
Urban and Built Up 35.84 60.48 1.01% 1,50% 24.64 68.75%Cropland 808.32 1157.12 22.76% 28,65% 348.8 43.15%Rice 628.8 600.32 17.70% 14,86% -28.48 -4.53%Mining 2.24 2.24 0.06% 0,06% 0 0.00%Aquaculture 180.8 188.16 5.09% 4,66% 7.36 4.07%
Total (Artificial habitats) 3,551.68 4,038.72 100.00% 100.00% 487.04 13.71%
The figure 10 highlights that areas classified as forest have been mostly converted in croplands and in orchard or plantation forests between 2000 and 2018. The conversion in croplands mainly occurred between 2000 and 2010 (2515 km²) while the conversion in orchards and plantations was similar between the periods 2000 – 2010 (1438 km²) and 2010- 2018 (1431 km²). Additional details are provided in Annex 4, 5 and 6.
ASSESSING THE BIODIVERSITY IN VIET NAM – ANALYSIS OF IMPACTS FROM ECONOMIC SECTORS 67

3.4.3. Analysis at species levelThe following maps give information on the spatial distribution of species assessed according to the IUCN Red List methodology for Critically endangered, Endangered and Vulnerable categories. 7 maps are available (see Table 24).
Table 24: Endangered species of Viet Nam according to the IUCN Red List by category and taxonomic group.
Map CR EN VU Total
Amphibians 2 27 22 51
Reptiles 16 16 28 60
Mammals 15 25 26 66
Birds 11 14 25 50
Freshwater fishes 34 71 85 190
Plants 5 14 6 25
Global 83 167 191 441
Figure 11: Distribution of endangered species in Viet Nam
Source: Oréade-Brèche. 2021
Figure 13: Distribution of endangered amphibian species in Viet Nam
Source: Oréade-Brèche. 2021
Figure 15: Distribution of endangered mammal species in Viet Nam
Source: Oréade-Brèche. 2021
Figure 12: Distribution of endangered plant species in Viet Nam
Source: Oréade-Brèche. 2021
Figure 14: Distribution of endangered reptile species in Viet Nam
Source: Oréade-Brèche. 2021
Figure 16: Distribution of endangered bird species in Viet Nam
Source: Oréade-Brèche. 2021
ASSESSING THE BIODIVERSITY IN VIET NAM – ANALYSIS OF IMPACTS FROM ECONOMIC SECTORS 69

plants are forests in the northwest, northeast (bordered to China), southern Annamite Range and southeast of Viet Nam. A smaller area includes forests surrounding Cuc Phuong National Park (Ninh Binh Province). Some KBAs and many protected areas (PAs) are located in these areas. All of these are well known for their biodiversity values but surprisingly, most of Central Viet Nam, which includes northern and central Annamites with many KBAs and PAs, are mapped as low (or even zero) concentration of threatened plants.
Trend is confirmed with terrestrial vertebrate species (amphibian, reptiles, mammals and birds). Endangered reptile species appear to be mostly found in the North in forest landscapes, mammals in the centre and South (except extreme South where rice fields are quite important), same for birds with a presence around the Mekong Delta which is obviously a hotspot for bird species. Amphibian species map is weak compared to other groups (51 species assessed). This can be explained by the fact that many of these species have been described in the last 20 years, indicating that many more remain to be described. While the need for conservation action for Southeast Asian amphibians is becoming increasingly apparent, information is often insufficient to allow specific action to be taken. Indeed, before any red list assessment, it is necessary for the region being assessed to have up-to-date taxonomic lists in order to have a clear knowledge of which species can be found or not. Finally, freshwater fishes threated species appear to be found in the South, centre, and the North – to be noted that river and stream are one habitat highly impacted around the World.These results must now be confronted with
national stakeholders who have a better understanding of land use changes at national level, drivers of habitat degradation in a specific part of the country or future economic activities planned.
3.4.4. Economic sectors classification according to land changes analysis in Viet Nam Thereby, according to the land changes analysis, between 2000 and 2018, at the country level, agriculture and forestry are the two main economic sectors having the greatest negative impact on the natural habitats in Viet Nam, especially on forested areas.
Indeed, between 2000 and 2018 more than 10,544 km² of forested areas (encompassing the following classes: forest, evergreen broadleaf, mixed forest) have disappeared and they have been mainly converted into plantations and orchards (4855 km²) and croplands (5028 km²).
The same main impacting economic sectors come out the analysis carried out between 2010 and 2018: more than 3 813 km² of forested areas have disappeared and they have been mainly converted into plantations and orchards (2965 km²) and croplands (1375 km²).
First, the situation found in the global map of threatened biodiversity, which is combined of the above thematic map of total 441 threatened species (see Table 24). In this global map (Figure 11), one can see the threatened species are distributed almost throughout the country though concentrated (up to 109 threatened species per 5 km x 5 km cell) in the following areas (north to south): northeast, mountainous areas around Hanoi, Central (from Ha Tinh to Binh Thuan Provinces and Central Highlands), southeast and northern Mekong Delta. The concentration of threatened species may be overstated for many areas, where forests have been converted into agricultural land; this is quite obvious in southern Central, Central Highlands, southeast and northern Mekong Delta, and may hold for the areas around Hanoi. However, the areas with high concentration of threatened species in southern Central Viet Nam well cover
hotspots of extremely high biodiversity that are determined in a recent unpublished study by the Southern Institute of Ecology (under Vietnam Academy of Science and Technology) using satellite images, actual records of >100 threatened species, modelling and ground check (Diep 2021).
Meanwhile, the northwest and Tay Nghe An Biosphere Reserve appears to have much less threatened species; this recalls gaps of scientific research as stated for the thematic maps.
For plants, distribution maps of total 25 threatened plant species from the IUCN Red List were used to generate a map to show the concentration of threatened plants and thus the areas of conservation importance nationwide (Figure 12). The resulted map indicates that areas with higher concentration of threatened
Figure 17: Distribution of endangered freshwater fishes’ species in Viet Nam
Source: Oréade-Brèche. 2021
Figure 18: Hotspots of biodiversity determined in Central Viet Nam
Source: Diep 2021
These maps highlight a couple of things quite interesting.
© Wirestock / Freepik.com
ASSESSING THE BIODIVERSITY IN VIET NAM – ANALYSIS OF IMPACTS FROM ECONOMIC SECTORS 71

Table 27: START score tailored to the IUCN threats level 2 classification1.
Ranking IUCN threats from the Level 2 START score % START score
1 Annual & perennial non-timber crops 5034 35.5%
2 Logging & wood harvesting 2673 18.8%
3 Hunting & collecting terrestrial animals 2384 16.8%
4 Roads & railroads 717 5.1%
5 Mining & quarrying 533 3.8%
6 Housing & urban areas 449 3.2%
7 Fire & fire suppression 305 2.1%
8 Tourism & recreation areas 301 2.1%
9 Dams & water management/use 291 2.1%
10 Gathering terrestrial plants 263 1.9%
11 Housing & urban areas 252 1.8%
12 Recreational activities 177 1.2%
13 Marine & freshwater aquaculture 149 1.1%
14 Livestock farming & ranching 144 1.0%
15 Wood & pulp plantations 121 0.9%
16 Problematic native species/diseases 78 0.6%
17 Agricultural & forestry effluents 56 0.4%
18 Utility & service lines 42 0.3%
19 Fishing & harvesting aquatic resources 40 0.3%
20 Domestic & urban waste water 31 0.2%
1 The detailed classification of the IUCN threats is provided in Annex 3)
3.5. STAR analysis3.5.1. Contribution of Viet Nam in threat abatement and habitat restoration at global scale
The STAR metrics applied in Viet Nam is based on the analysis of 180 threatened species assessed in the IUCN global red list species in 2019. 62
species belong to the mammal taxon. 65 species belong to the bird taxon and 53 species belong to the amphibian taxon (see Table 25 below).
Table 25: Number of threatened species per conservation status. taken into account in the STAR analyses.
Critically endangered Endangered Vulnerable Near Threatened Total
Amphibians 0 19 20 14 53
Birds 8 8 15 34 65
Mammals 15 17 20 10 62
Based on the STAR analyses performed at the global level in 195 countries. the contribution of Viet Nam in the threat abatement of threatened species is 1.16. meaning it is above the country average. while its contribution in the restoration of their habitats is 0.31 %. In other words, in Viet Nam, impact of efforts dedicated to the threat
abatements will be higher for reducing the risk of extinction of threatened species rather than efforts dedicated to habitats restoration (see Table 26 below). However, restoration could still be used as a complementary tool.
Table 26: Threat abatement and habitat restoration scores for Viet Nam (IUCN, 2021).
Component Country score Global total Country percentage of global total
Threat Abatement 14,192.53 1,226.300 1.16%
Restoration 1,936.75 615,888.53 0.31%
3.5.2. Threat’s classification based on threat abatement score from global dataset
Based on the total threat abatement scores (see Table 26) for each IUCN threat level 2 classification, it turns out the three activities having the highest impact (see Figure 19) on the risk of extinction of the threatened species are: (i) annual and perennial non-timber crops and, (ii) logging and wood harvesting. “Annual and perennial non-timber crops” encompass crops planted for food, fodder, fibre, fuel, or other uses. They can either come
from shifting agriculture, smallholder farming and agro-industry farming. The START score is significantly higher than the other threats: 5034 (35.5% of the total START score) while the START score of the second major threat is 2673 (18.8% of the total START score). Thereby, developing sets of actions on annual and perennial non-timber crops is expected to have the most efficient impact for reducing the risk of extinction of threatened species.
“Logging and wood harvesting” refers to harvesting trees and other woody vegetation for timber, fibber or fuel. It can be made for subsistence /small scale purposes and at larger scale. This category also includes multiple species or enrichment plantings in a quasi-natural system.
“Hunting and collecting terrestrial animals” refers to killing or trapping terrestrial wild animals or animal products for commercial. recreation. subsistence. research or cultural purposes. or for control/persecution reasons. It includes accidental mortality/bycatch. This category focuses on animals that primarily live in a terrestrial environment and species that live on the terrestrial/aquatic boundary.
From these analyses, it also turns out that pressures coming from “Marine & freshwater aquaculture” (defined as aquatic animals raised in one location on farmed or non-local resources. It also includes hatchery fish allowed to roam in the wild) and “Fishing & harvesting aquatic resources” (defined as harvesting aquatic wild animals or plants for commercial, recreation, subsistence, research, or cultural purposes, or for control/persecution reasons. It includes accidental mortality/bycatch) are respectively ranked at the 13th and 19th position and do not appear to be key activities having the highest impact on reducing extinction of the threatened species.
ASSESSING THE BIODIVERSITY IN VIET NAM – ANALYSIS OF IMPACTS FROM ECONOMIC SECTORS 73

Figure 20 provides a very detailed analysis on the IUCN threats level 3 classification for amphibians. Agro-industry farming and small-holder farming have both obtained a score twice as important as the third most important activity. This shows that agriculture is a major threat which possesses an important potential regarding the risk of extinction of threatened species.
21 Tourism & recreation areas 30 0.2%
22 Work & other activities 28 0.2%
23 Invasive non-native/alien species/diseases 21 0.1%
24 Commercial & industrial areas 13 0.1%
25 Other ecosystem modifications 13 0.1%
26 Renewable energy 12 0.1%
27 Commercial & industrial areas 12 0.1%
28 Industrial & military effluents 9 0.1%
29 Volcanoes 8 0.1%
30 Viral/prion-induced diseases 2 0.0%
31 Avalanches/landslides 2 0.0%
32 War. civil unrest & military exercises 2 0.0%
33 Garbage & solid waste 1 0.0%
34 Storms & flooding 1 0.0%
35 Flight paths 1 0.0%
36 Oil & gas drilling 0 0.0%
37 Shipping lanes 0 0.0%
38 Air-borne pollutants 0 0.0%
5000
4000
3000
2000
1000
0
Annua
l & pe
rennia
l non
-timbe
r crop
s
Logg
ing & w
ood h
arves
ting
Huntin
g & co
llecti
ng te
rrestr
ial an
imals
Roads
& railro
ads
Mining
& quarr
ying
Housin
g & ur
ban a
reas
Fire & fir
e sup
press
ion
Touris
m & recre
ation
area
s
Dams &
wate
r man
agem
ent/u
se
Gatheri
ng te
rrestr
ial pl
ants
Figure 21: Chart depicturing in details the highest START scores from the IUCN threats level 3 classification. applied to mammals.
1600
1400
1200
1000
800
600
400
200
0
Agro-in
dustr
y farm
ing
Small-ho
lder fa
rming
Inten
tiona
l use
(spe
cies i
s the
targe
t)
Uninten
tiona
l effe
cts: (l
arge s
cale)
[harv
est]
Uninten
tiona
l effe
cts: (s
ubsis
tence
/small
scale
)...
Roads
& railro
ads
Shiftin
g agri
cultu
re
Motiva
tion U
nkno
wn/Unre
corde
d
Mining
& quarr
ying
Inten
tiona
l use
: (sub
sisten
ce/sm
all sc
ale) [h
arves
t]
Trend U
nkno
wn/Unre
corde
d
Touris
m & recre
ation
area
s
Uninten
tiona
l effe
cts (s
pecie
s is n
ot the
targe
t)
Indus
trial a
quac
ulture
Housin
g & ur
ban a
reas
Habita
t shif
ting &
alter
ation
Agro-in
dustr
y graz
ing, ra
nchin
g or fa
rming
Threats analysis for amphibians
Cumulated threat abatement score
1000
800
600
400
200
0
Inten
tiona
l use
(spe
cies i
s the
targe
t)
Motiva
tion U
nkno
wn/Unre
corde
d
Small-ho
lder fa
rming
Housin
g & ur
ban a
reas
Roads
& railro
ads
Shiftin
g agri
cultu
re
Mining
& quarr
ying
Uninten
tiona
l effe
cts (s
pecie
s is n
ot the
...
Recrea
tiona
l acti
vities
Dams (
size u
nkno
wn)
Threats analysis for mammals
Figure 19: Chart depicturing the 10 highest START scores from the IUCN threats level 2 classification.
Figure 20: Chart depicturing in details the highest START scores from the IUCN threats level 3 classification. applied to amphibians.
ASSESSING THE BIODIVERSITY IN VIET NAM – ANALYSIS OF IMPACTS FROM ECONOMIC SECTORS 75

Figure 21 provides a very detailed analysis on the IUCN threats level 3 classification. to mammals. In this case the main threat is the intentional use of targeted species (bushmeat hunting. trophy hunting. beaver trapping. butterfly collecting. honey or bird nest hunting. etc).
Figure 22 provides a very detailed analysis on the IUCN threats level 3 classification to birds. Unintentional effects of harvesting represent the highest score regarding threat abatement, which may be understood as the consequences of a vegetation loss and habitat degradation. Other agriculture-related uses, such as agro-industry farming, small-holder farming and shifting agriculture, also have a high score.
500
400
300
200
100
0
Uninten
tiona
l effe
cts: (s
ubsis
tence
/small
scale
) [harv
est]
Agro-in
dustr
y farm
ing
Inten
tiona
l use
(spe
cies i
s the
targe
t)
Small-ho
lder fa
rming
Shiftin
g agri
cultu
re
Uninten
tiona
l effe
cts: (l
arge s
cale)
[harv
est]
Habita
t shif
ting &
alter
ation
Touris
m & recre
ation
area
s
Uninten
tiona
l effe
cts (s
pecie
s is n
ot the
targe
t)
Figure 22: Chart depicturing in details the highest START scores from the UICN threats level 3 classification. applied to birds.
Threats analysis for birds
Figure 24: Logging & wood harvesting activities distribution across Viet Nam.
3.5.3. Threats’ location according to START global datasets
Figures 23 and 24 provide information on spatial distribution of the 2 main threats in Viet Nam. They show the distribution of the threat abatment score for each threat according to the distribution of the threatened species. In red color, the maps show that in these areas, there are a larger number of threatened species affected by logging and wood harvesting. Centre of the country seems to be highly impacted by agriculture and logging while North and South are less impacted.
3.5.4. Economic sectors classification according to STAR metric in Viet Nam
Thereby, according to the STAR metrics, agriculture and forestry are the two main economic sectors having the greatest potential impact for reducing the risk of extinction of the threatened species. The central and western parts of the country (depicturing in red) should be the areas prioritized for implementing actions and reducing the risk of extinction of threatened species linked to these economic activities.
Figure 23: Annual & perennial non-timber crops distribution across Viet Nam.
© Jaynothing / Freepik.com
ASSESSING THE BIODIVERSITY IN VIET NAM – ANALYSIS OF IMPACTS FROM ECONOMIC SECTORS 77

the VPA/FLEGT Agreement is to establish a legal framework ensure that all wood products exported from Viet Nam to the Union European Union (EU) of legal origin and production. This target is consistent with the commitment to sustainable management of all forests of both sides,
this protocol on Biosafety to the Convention on Biological
Diversity is an international agreement on biosafety as a supplement to the Convention on Biological Diversity. Viet Nam became a full member of the Protocol on April 19, 2004. The MONRE has been assigned by the Government to act as the national focal point for this Protocol,
The Nagoya Protocol on Access to Genetic Resources
and the Fair and Equitable Sharing of Benefits Arising from their Utilization to the Convention on Biological Diversity, also known as the Nagoya Protocol on Access and Benefit Sharing is a 2010 supplementary agreement to the 1992 Convention on Biological Diversity. Viet Nam signed this Protocol in 2014. The MONRE has been assigned by the Government to act as the national focal point for this Protocol,
3.6.2. Institutional and Legislation Framework to implement international commitments
Institutional arrangementsTo fulfil the international commitment, Government of Viet Nam had done many efforts about institutional arrangement, improvement, and legislation development and revision according to the national development circumstances. In Viet Nam, State management responsibilities for biodiversity. Environmental Protection, Climate Change and Biodiversity Conservation are spread across all related ministries.
is the Government agency performing the state management function in the following fields: Land; Water Resources; mineral
and geological resources; environment; hydrometeorology; Climate Change; surveying and cartography; general management of natural resources and environmental protection of sea and islands. MONRE is the national focal point responsible for implementing the United Nations Framework Convention on Climate Change. MONRE is also administers laws relating to environment protection, biodiversity, water resource management. The Ministry of Natural Resources and Environment shall take responsibility to the Government for performing the state management of biodiversity.
is an organization directly under MONRE performing the function of advising and assisting the Minister of MONRE in state management and law enforcement on
Cartagena Protocol, 2003
Nagoya Protocol, 2010
The Ministry of Natural Resources
Environment (MONRE)
The Vietnam Environment
Administration (VEA)
3.6. Policy review and economic sectors commitments
3.6.1. International Environmental Agreements
The government of Viet Nam has signed several International Conventions to join global efforts to overcome environmental problems and Biodiversity Conservation:
(signed 1993 and ratified 1994), objectives of the CBD are the conservation of biological diversity, the sustainable use of
its components, and the fair and equitable sharing of the benefits arising from commercial and other utilization of genetic resources. The agreement covers all ecosystems, species, and genetic resources,
(signed 1998), UNCCD aims to combat desertification and mitigate the effects of drought in countries experiencing serious drought
and/or desertification, particularly in Africa, through effective actions at all levels, supported by international co-operation and partnership arrangements, in the framework of an integrated approach which is consistent with Agenda 21, with a view to contributing to the achievements of sustainable development in affected areas,
(signed 1992 and ratified 1994), UNFCCC sets an overall framework for intergovernmental efforts to tackle the challenge posed by
climate change. Its objectives are to stabilize greenhouse-gas concentrations in the
atmosphere at a level that would prevent dangerous anthropogenic interference with the climate system, within a time-frame sufficient to allow ecosystems to adapt naturally to climate change; to ensure that food production is not threatened; to enable economic development to proceed in a sustainable manner. The Paris Agreement under the UNFCCC was adopted in December 2015 and entered into force on November 2016. This agreement was the outcome of the negotiations launched in 2011 at the 17th Conference of the Parties in Durban to develop a legal instrument applicable to all Parties to cut greenhouse gases (GHG) emissions and to be implemented from 2020. Viet Nam signed the Paris Agreement on 22 April 2016 and become effective 3 December 2016,
(signed 1989), Ramsar Convention’s broad aims are to halt the worldwide loss of wetlands and to conserve,
through wise use and management, those that remain, in particular as habitats for waterfowl,
(signed 1994), CITES contributes to nature conservation by regulating international trade in listed species by means of a permit system. Through this control
system all parties assist in maintaining the listed rare and threatened species in the wild,
(signed 2018 and become effective in 2019), objective of
United Nations Convention
to Combat Desertification (UNCCD), 1994
United Nations Framework
Convention on Climate Change
(UNFCCC)
Ramsar Convention
on Wetlands, 1971
Convention on International
Trade in Endangered
Species of Wild Fauna and Flora
(CITES), 1973
The VN-EU Voluntary Partnership Agreement
(VPA) on Forest Law Enforcement, Governance
and Trade (FLEGT)
Convention on Biological
Diversity (CBD), 1992
© Rawpixel.com / Freepik.com
ASSESSING THE BIODIVERSITY IN VIET NAM – ANALYSIS OF IMPACTS FROM ECONOMIC SECTORS 79

programs, projects, activities, environmental protection tasks and coping with climate change are not included in the national budget plan.
is a State financial institution under MARD. The VNFF’s function is to mobilize social resources
for forest protection and development, contributing to the implementation of the policy of socializing forestry; raising awareness and responsibility for forest protection and development; improve the capacity and efficiency of capital management and use, contributing to the implementation of the Forestry Development Strategy.
So, at the central level, responsibilities for the state management of biodiversity belongs to MONRE and MARD. However, at sub-national level, no equivalent unit under Provincial’s Department of Natural Resources and Environment (DONRE) is in charges of this function.
Ministries, ministry-level agencies and People's Committees at provincial level shall mainstream natural capital development investments into socio-economic development strategies, plans, programs, projects, and project proposals.”
at all level shall, within the ambit of their tasks and powers, perform the state management of biodiversity as assigned
by the Government as decentralized by the Government. Besides the state management agencies mentioned above, scientific research agencies related to biodiversity include:
± The Institute of Ecology and Biological Resources (IEBR) belong to Vietnam Academy of Science and Technology (VAST). Its function consists of studying biological resources and typical ecosystems in order to supply the needs of the population in foodstuffs, food grains, consumer goods, to recommend planning activities for socio-economic development and environmental protection and to carry out the education and training of scientists on ecology and biological resources to provide a basis for recommendations on the rational utilization, restoration and protection of these precious resources.
± The Southern Institute for Ecology (SIE) under to Vietnam Academy of Science and Technology (VAST). Its key major scientific activities are: i) Investigate and study the structure and function of ecosystem, individual ecology, population ecology and human ecology; ii) Research fauna, flora and fungi of southern Viet Nam; discover, evaluate, and recommend strategies to restore and develop threatened fauna, flora and fungi species, and protect genetic resources; iii) Study impacts of climate change on biodiversity, propose methods to respond to, and minimalize the impacts of, climate change; iv) Study and evaluate biodiversity resources of terrestrial ecosystem, water bodies, provide management strategies, sustainable use of ecosystems and bioresources; v) Research and discover sensitive ecosystems, predict ecological dynamics, propose methods to utilize and restore ecosystems.
Vietnam Forest Protection and
Development Fund (VNFF)
The other Ministries and
ministerial-level agencies and
People Committee
environmental protection and biodiversity in the whole country. The Nature and Biodiversity Conservation Agency (BCA) belong to VEA performs the function of advising and assisting the VEA’s Leader in state management and organizing the enforcement of the law on conservation of nature and biodiversity nationwide
is a governmental agency for a umbrella of responsibility for rural development, governance and promotion of agriculture, fisheries,
forestry, and irrigation, includes marine biodiversity management, and flood control. Thereby biodiversity issues related to the forestry, fisheries and agricultural sectors are managed by the MARD rather than under the unified management of MONRE under the Law on Biodiversity.
under the VNFOREST that has the function of advising and synthesizing to assist the Director General of VNFOREST in performing
state management and exercising the rights and obligations of a member country of the Convention on trade international endangered species of wild fauna and flora.
under the VNFOREST performing state management functions on forest protection and law enforcement on forest
protection, forest development and forest product management. Department of Protected Area Management under VNFOREST acting as an advisory body to assist the Director General in
performing the function of state management of forestry in the field of special-use forest system management, protection and conservation of nature and biodiversity in forest ecosystems.
responsible for the management and conservation of aquatic resources, including:
Announce the aquatic species listed in the Vietnam Red Book and the aquatic species that need to be protected and the aquatic species banned from exploitation; publish criteria for classification and establishment of inland water conservation zones, marine conservation; conservation, regeneration and development of aquatic resources, conservation of aquatic biodiversity gene.
is a governmental agency performing state management on industry
and trade in following branches and domains includes renewable energy, oil and gas, chemicals, industrial explosives, mining and mineral processing industries.
is the government ministry in Viet Nam responsible for state administration on culture, family, sports
and tourism nationwide, in addition to the management of public services in those field.
is the National Environment Protection Fund, a state financial institution under the Ministry of Natural Resources
and Environment (MONRE). The main function of the VEPF is lending preferential interest rates, grants, co-financing, interest rate support for
The CITES Management
Authority of Vietnam
Forest Protection
Department (FPD)
The Ministry of Industry and Trade (MOIT)
The Ministry of Culture, Sports
and Tourism (MOCST)
Vietnam Environment
Protection Fund (VEPF)
The Ministry of Agriculture
and Rural Development
(MARD)
Directorate of Fishery under
MARD
ASSESSING THE BIODIVERSITY IN VIET NAM – ANALYSIS OF IMPACTS FROM ECONOMIC SECTORS 81

protection forest, forest protection and sustainable forest use, forest development and forest management and conversion of forest to other use purposes.
± Law on Fisheries, 2017 (2003)Law on Fisheries No. 18/2017/QH14 contains revised provisions for the fisheries sector in Viet Nam. The Law applies to Vietnamese organizations and individuals, foreign individuals engaged in fishery in land, islands, archipelago and sea of Viet Nam; Vietnamese individuals engaged in commercial fishing activities outside the Viet Nam’s maritime boundary. Its provisions concern, among other things, co-management in fishery resources protection, planning on protection and exploitation. Decree No. 26/2019/ND-CP dated March 08, 2019 of the Government on detailing a number of articles of, and measures to implement the Law on Fisheries.
± Water Resource Law, 2012 Law No. 17/2012/QH13 on Water Resources provides on management, protection, exploitation and use of water resources, as well as the prevention, combat against and overcoming of harmful effects caused by water in the territories. Decree No. 43/2015/ND-CP providing the establishment and management of water source protection corridors with regard to the water sources defined in Article 31 of the Law.
± Law on Marine and Island Resources, 2015Law on Marine and Island Resources No. 82/2015/QH13 prescribes integrated management of marine and island resources and protection of the marine and island environment, and the rights, obligations and responsibilities of agencies, organizations and individuals in integrated management of marine and island
resources and protection of the marine and island environment of Viet Nam. The protection of the marine and island environment, and the management, exploitation and use of marine and islands. Decree No. 40/2016/ND-CP dated May 15, 2016 on detailing a number of articles of, and measures to implement the Law on Marine and Island Resources.
± Land use Law, 2013 (1993, 2003) Land Law No. 45/2013/QH13 prescribes for the land ownership, powers and responsibilities of the State in representing the entire-people ownership of land and uniformly managing land, the land management and use regimes, and the rights and obligations of land users over the land in the territory of Viet Nam. Decree No. 43/2014/ND-CP detailing a number of articles of the Land Law, compensation, support, resettlement; land prices; collection of land use levy; collection of land and water surface rentals; and sanctioning of land-related administrative violations.
± Investment Law, 2020 (2014)The Law on Investment No.61/2020/QH14 prescribe for business investment activities in Viet Nam and business investment activities from Viet Nam to abroad. Among the industries and trades banned from investment and business listed in Article 6, there is trading in specimens of plants and wild animals of natural origin specified in Appendix I of CITES; specimens of endangered, precious and rare species of forest plants, animals and aquatic animals of Group I, derived from natural exploitation specified in Appendix III of this Law.
± Law on Crop Production (2018)Crop Production Law No.31/2018/QH14 prescribes plant varieties; fertilizers; cultivation; harvest, preliminary processing, preservation,
Legislation frameworkIn the last two decades, biodiversity conservation has been given high attention by the Vietnamese Government. The country has gradually internalized international laws and created a comprehensive legal framework around the conservation of biodiversity and wildlife protection. There were many important laws in the natural resources have been legislated. Promulgated laws include law on state management of natural resources and biodiversity conservation and law on handling violations on protection of natural resources and biodiversity.
± Biodiversity Law, 2008The Law on Biodiversity No. 20/2008/QH12 and Decree No. 65/2010/ND-CP dated June 11, 2010 detailing and guiding the implementation of a number of articles of the Law on Biodiversity, with regulations on the protected area system, in which most of the terrestrial and wetland conservation systems and marine protected areas. This Law provides for the conservation and sustainable development of biodiversity and it also elevates the principles and priorities of biodiversity conservation to the level of law independent of other sectors in Viet Nam.
± Law on Environmental Protection, 2020 (1993, 2005, 2014)Law on Environmental Protection No. 72/2020/QH14 coming into force 01/01/2022. This law thoroughly amends the Law on Environmental Protection 2014 and sets out requirements for
a wide range of environmental issues. Articles 92 to 94 of the law make provisions for climate change, which specifically consist of greenhouse gas (GHG) reduction, ozone layer protection, and the national database on climate change. A governmental decree to implement the Law on Environmental Protection 2020 is under finalizing process. The degree is expected to enter into force on January 1, 2022, similar to the Law on Environmental Protection of 2020. These legal documents stipulate: prohibited activities in the protected area; environmental impact assessment of projects using land in protected areas; strategies, master plans and plans for exploitation of resources from seas, islands, nature reserves and mangroves.
The Law synchronizes environmental management tools in each phase of the project, starting from the consideration of investment plan, project appraisal, project implementation until the project is officially put into operation and project completion. The tools includes national strategy on environmental protection, environmental protection planning, strategic environmental assessment (SEA), environmental impact assessment (EIA), environmental permit, and environmental registration.
The Law has completed the legal framework for the protection of natural heritage (wetland conservation areas, protected areas being special-use forests, marine protected areas) in accordance with international law on world heritage, meet the requirements of the international integration process.
± Forestry Law, 2017 (2004) Forestry Law No. 16/2017/QH14, Decree No. 156/2017/ND-CP dated November 16, 2018 detailing the implementation of some articles of the Law on Forestry dated November 15, 2017, the law is stipulating special-use forest,
Legislation on state management of biodiversity conservation
ASSESSING THE BIODIVERSITY IN VIET NAM – ANALYSIS OF IMPACTS FROM ECONOMIC SECTORS 83

± Decision No. 2139/QD-TTg dated December 5, 2011 of the Prime Minister approving the national Strategy for Climate Change. One of the key strategy tasks is protection and sustainable development of forests, increase of GHG absorption and biodiversity conservation - to conserve biodiversity, attach importance to protecting and developing ecosystems, varieties and species resilient to climate change; to protect and conserve the gene pools and varieties and species endangered by climate change.
± Decision No.1250/QD-TTg dated July 31, 2013 of the Prime Minister approving the National Biodiversity Strategy to 2020, vision to 2030 (NBSAP 2013). The overall objectives of the strategy are: conservation of important natural ecosystems; endangered, rare and precious species, and genetic resources are preserved and sustainably used, contributing to the development of the green economy, and actively responding to climate change.
± Decision No. 523/QD-TTg dated April 1, 2021 of the Prime Minister approving Viet Nam’s forestry development strategy for the 2021 - 2030 period, with a vision to 2050 (VFDS 2021-2030) with the relevant objective is forest makes an increasingly important contribution to socio-economic development, environmental protection, water security, disaster mitigation, and major response be active and effective with climate change, conserve natural resources and biodiversity, provide a variety of forest environmental services.
± Decision No. 419/QD-TTg dated 5 April 2017 on Approval of the National Programme on the Reduction of Green-house Gas Emissions through the Reduction of Deforestation and
Forest Degradation, Sustainable Management of Forest Resources, and Conservation and Enhancement of Forest Carbon Stocks (REDD+) by 2030 (NRAP, 2017-2030).
± Decision No. 339/QD-TTg dated March 11, 2021 of the Prime Minister on approving the Strategy for Development of Viet Nam›s Fisheries by 2030 with vision towards 2045. The development’s point of view of the Fishery sector is step up industrialization and modernization of the fishery industry in a market-oriented, environmentally friendly manner, to protect, regenerate and develop aquatic resources, and to conserve biodiversity; adaptation to climate change; ensure disease safety, biological safety, social security.
These strategies play as the vital role to address the biodiversity concerns in a long vision.
Ministry policiesTo perform the state management function of natural resource protection, environmental protection and biodiversity conservation, relevant ministries have issued many policies and documents guiding the implementation of laws and policies of the state in the field of resource protection and biodiversity conservation.
According to the objectives in Laws, National strategies and sector development master plans related to natural resources protection and biodiversity conservation, the related Economic Sectors have been developing the orientation or commitment to achieve the objectives through their relevant policies. (see Annex 7).
processing, trading, and quality management of crop products. It also defines rights and obligations of organizations and individuals engaged in crop production and state management of crop production. In order to use natural resources effectively and sustainably, the Law devotes Chapter IV to providing cultivation activities, focusing on use of natural resources, agricultural facilities, equipment and supplies in cultivation. The exploitation use and genetic resources of plant varieties comply with the provisions of this Law and the Law on biodiversity.
These legal documents are the most comprehensive legislations on the conservation and sustainable development of biological species, endangered, precious and rare species prioritized for protection, wild species, and conservation facilities, biodiversity conservation.
± Criminal Code No.100/2015/QH13, amended by Law No. 12/2017/QH14 of the National Assembly sets out criminal penalties for violations of the key wildlife protection laws.
± Resolution No. 05/2018/NQ-HDTP, dated 05 November 2018 by the Judges’ Chambers –Supreme People’s Court guiding the implementation of Article 234 and Article 244 related to crimes on wildlife protection of Penal Code 2017.
± Law No. 15/2012/QH13 of the National Assembly on handling of administrative violations. and Law No. 67/2020/QH14 amending and supplementing some article of the Law No.
15/2012/QH13, Law No. 54/2014/QH13, and Law No. 18/2017/QH14. The Laws regulations on sanctioning administrative violations and administrative handling measures for violations related to wild, endangered, precious and rare animals.
± Decree 35/2019/ND-CP dated April 25, 2019 of the Government on sanctioning of administrative violations in the field of forestry. This Decree provides administrative penalties towards acts of illegal hunting, trapping, captive breeding, transporting, buying, selling, trading, storing, and processing forest products.
± Decree No. 155/2016/ND-CP dated November 18, 2016 of the Government on sanctioning of administrative violations in the field of environmental protection. This Decree governs administrative violations on biodiversity: Conservation and sustainable development of natural ecosystems; conservation and sustainable development of biological species and conservation and sustainable development of genetic resources.
± Decision No. 45/QD-TTg dated January 8, 2014 of the Prime Minister approving Master plan for National Biodiversity Conservation by 2020, with a vision to 2030. The general objective of Master plan is ensuring important natural ecosystems, the endangered, precious and rare species and genetic resources are conserved and sustainably developed; maintaining and developing the ecosystem services to adapt to climate change in order to promote sustainable development of the country.
Legislation on handling violations on protection of natural resources and biodiversity:
National and Sector Strategy related to natural resources and biodiversity:
ASSESSING THE BIODIVERSITY IN VIET NAM – ANALYSIS OF IMPACTS FROM ECONOMIC SECTORS 85

A familiar situation with Shrimp Farming in mangroves forest area that to encourage and support local farmers increased Shrimp farming areas to meet the demand of Shrimp production for export. Ca Mau and Kien Giang province issued Decision No. 19/2010/QD-UBND dated September 22, 2010 by the PPC of Ca Mau province on implementation of some policies for forest protection and development in Ca Mau and Decision No. 25/2011/QD-UBND dated July 28, 2011 by the PPC of Kien Giang on regulations for forest planting, forest protection and use of coastal protection forest in Kien Giang. According to these provincial decisions, local households and individuals that are forest owners and contracted forest protection with the Management Board of Forest Protection to use up to 40% (in Ca Mau) and 30% (in Kien Giang) of non-forested area in the allocated protection forest areas for agricultural and fishery production. Most of the local farmers are preferred to establish the Shrimp farming Pool. The regulated ratio provides the relation between protected mangrove forest area and aquaculture farming in the protection forest zone. There are no sufficient results available on the value of the 70:30 regulation in Kien Giang and the 40:60 regulations in Ca Mau but the consequence is too many ha of mangrove forest was converted to shrimp farming in the region due to a lack of critical monitor and control of the relevant authority agencies.
Some of the economic development policies of the sectors paid attention to the sustainable use of natural resources and the conservation of biodiversity. However, there are also a number of policies that have indirectly affected forest resource degradation and biodiversity loss. For example:
To help the rubber industry achieve the planning target of 800,000 hectares, the Ministry of Agriculture and Rural Development issued Circular No. 76/2007/TT-BNN dated 21 August, 2007 by MARD guiding the conversion of forests and forestry land to rubber plantations. According to this circular, the types of forestry land that can be arranged to convert to rubber plantations includes i) Forest land has been planned as production forest (natural forest or planted forest); ii) degraded natural forest (poor quality, with targeted tree species of class A and type B accounting for less than 50% of the forest reserve according to Decision 682B/QDKT dated 1/8/1984 by MARD), restored young forest, bamboo forest; low efficiency plantations. The document stated that the converted area needs conformity with master plans and plans on land use; forest protection and development planning and plans approved by competent state agencies; and there is a plan to plant new forests to replace the forest area that will be converted to other uses. These conditions are very important for conversion, but in practice, it is almost of little interest to the locality. According to Clause 6, Section II stipulates that the order and procedures for converting land to rubber plantations of agricultural and forestry farms are very simple, so the result is a lot of forest and forestry land has been converted to rubber plantations from other farmers, forestry farm, and State Forest Enterprises (SFEs) due to lack of strict control and monitor from relevant government agencies.
Forest assessment for conversion only required to assess in terms of area and quality, without information on forest biodiversity. This has led to the conversion of many high conservation value forests.
According to Decree 83/2020/ND-CP dated July 15th, 2020 on amending and supplementing multiple articles of Decree No. 156/2018/ND-CP, dated November 16th,2018, which details the implementation of several articles covered in the Law on Forestry: Application for forest use conversion only requires forest inventory in requested area, including two criteria naming forest area and forest reserves. Therefore, it is needed to include biodiversity assessment as one of the compulsory requirements for forest assessment for conversion purposes to avoid future loss of high biodiversity areas.
ASSESSING THE BIODIVERSITY IN VIET NAM – ANALYSIS OF IMPACTS FROM ECONOMIC SECTORS 87

Although the forest area has been increased significantly due to expansion a large area of plantation, however, natural forest area increased insignificantly, even with a period of decrease from 10.41 million ha by 2006 was down to 10.1 million ha by 20141. Even in some regions, the planted area of plantation forest increased sharply, but the area of natural forest decreased deeply. Particular in Central Highlands region, according to data from the VNforest, in 2019, the planted forest area in the Central Highlands increased by 18,387 ha compared to 2018, but the area of natural forest decreased by 15,753 ha. Same situation occurs, in 2018 the planted forest area increased by 20,210 ha in comparison to 2017, but the natural forest decreased by 16,708 ha2. In the period of implementation of Viet Nam’s Forestry Development Strategy 2006-2019, by the end of 2019 in the whole country the total forest area increased by 1.74 million ha, but natural area decreased by 117,707 ha (MARD, 2020).
Besides that, quality of natural forests continues to degrade. According to MARD, 2016, total area of poor and extremely poor forests (10-100 m3
1 http://www.kiemlam.org.vn/Desktop.aspx/List/So-lieu-dien-bien-rung-hang-nam 2 http://www.kiemlam.org.vn/Desktop.aspx/List/So-lieu-dien-bien-rung-hang-nam 3 Drivers of Deforestation in the Greater Mekong Subregion Viet Nam Country Report
per ha) is 3.359 million ha (counting for 40.27% of total natural forest areas with at least 10m3/ ha volume stock) and the rich forest area (over 200 m3 per ha) is only 769,845 ha (counting for 8.71% of total natural forest areas with at least 10m3/ ha volume stock) (see Figure 26). Although the natural forests have many valuable species such as Cẩm lai (Dalbergia bariensis), Lim xanh (Erythrophleum fordii), Sến mật (Madhuca pasquieri), Gụ lau (Sindora tonkinensis), Căm xe (Sindora tonkinensis), etc., however a large amount of these native species has been exploited, leaving only trees with a small diameter, curved or with defects.
Natural forest loss and quality of natural forest decline are a result of mixed causes. Illegal and unsustainable logging, forest fires, and weak forest law enforcement are indirect drivers (De Koninck, 1999; Pham et al., 2012). According to the study report by Do Anh Tuan, 20153, illegal logging resulted in 76,557 ha loss (or 7.9% of the total natural forest loss) and legal or unsustainable logging resulted in 32,991 ha loss (or 3.4% of the total natural forest loss).
3.6.3. Economic sector assessment
In 1943, Viet Nam had 14.3 million ha of natural forests, covering 43% of the total land area of the country. However, forest area has fallen rapidly and by 1990 was just 9.18 million ha or 27.2% of the total land area (FAO, 2009). After Policy Reform period 1980s – 1990s, forest area has increased as a result of forest rehabilitation and plantation programmes. Forest area was rapidly increased from 10.916 million ha (33.2%) in 2000 to 14.062 million ha (40.84%) by 2000. From 2016 to 2020, forest area has been slightly increased annually and total national forest area was reached 14,677 million ha (42.01%) of which 10,292 million ha of natural forest and 4,398 million ha of plantation forest by the end of 20201, (see Figure 26).
1 http://www.kiemlam.org.vn/Desktop.aspx/List/So-lieu-dien-bien-rung-hang-nam/NAM_2019/ 2 FAO 2009. Viet Nam forestry outlook study
The Figure 25 shows that during the period 1945-
1975, the whole country lost about 3 million ha
of forest, an average of 100,000 ha per year. The
process of deforestation happened faster in the
period 1975-1990- about 2.8 million ha was lost,
an average of 140,000 ha/year2. However, from
1990s, with the synchronous implementation of
land and forest allocation policies and encourage
mechanisms to forest owner, the forest area had
been increased. Forest cover in whole country
increase over the last 20 year is remarkable, from
33.2% by 2000 to 42.1% by 2020.
0
5
10
15
20
25
30
35
40
45
50
1943
1976
1980
1990
1995
2000
2014
2015
2016
2017
2018
2019
2020
43
33.8
32
28
28.232
40.43
40.84
41.19
41.45
41.65
41.89
42.01
769,845588,150
2,165,480
2,971,033
0
500,000
1,000,000
1,500,000
2,000,000
2,500,000
3,000,000
NAT
UR
AL
FOR
EST
AR
EA (H
A)
Figure 26: Natural forest quality by stock volume in 2016 Source: FPD
FORESTRY
Figure 25: Forest cover change from 1943 to 2020 Source: FPD
ASSESSING THE BIODIVERSITY IN VIET NAM – ANALYSIS OF IMPACTS FROM ECONOMIC SECTORS 89

Selective logging
During the 1960-1980 period, the central task of the forestry sector was to harvest timber to create a source of raw materials for national reconstruction and domestic consumption. The Government established a system of State Forest Enterprise (SFE) for harvesting timber from natural forest. By 1975, the whole country had about 200 SFEs established (To Xuan Phuc and Tran Huu Nghi, 2014) and by 1997, there were 422 SFEs established (MARD, 2006). The trend of harvested volumes from natural forest is different in period from 1955 to 2003 presented at Figure 29.
The Figure shows the long-term logging level from natural forests is estimated to settle from 600,000m3 to 800,000 m3 per year. The highest
harvest volume per year is 1.6 million m3 in the period 1976-1980. Since 2000, the management of logging has been tightened, specifically decentralized and sharply reduced the number of SFEs, the government has set up a policy to gradually reduce logging from natural forests, so the amount of timber harvested is only from 200,000-300,000 m3/year from 2000- 2008. In 2012, the harvested volume was only about 110,000 m3(1). These volumes are exploited from areas with a high volume of standing stock and with too many hard woods tree species. According to this the harvested area of natural forest also reduced from 25,000 ha/year by 1996 down to 12,000 ha/year by 2000 (FAO, 2009). Besides of this, there were a large amount of timber volumes and area of forest lost when harvesting enterprise-built skid trail, forest road and landing areas for harvesting operations which has not yet been included.
1
2
3
4
5
6
7
8
9
0
1955
-1960
1961
-1965
1966
-1975
1976
-1980
1981
-1985
1986
-1989
1990
-1998
1999
-2002
2002
-2003
1 http://www.kiemlam.org.vn/PortletBlank.aspx/AB643F9FDB734E16AE8A3AF613D6ADC9/View/Tin-tuc-su-kien/Xem_xet_kha_nang_tam_dong_cua_rung_tu_nhien_tren_toan_quoc/?print=709138485
Har
vest
ing
volu
me
(Mill
ion
m3)
Unstainable firewood and NTFPs collectionAs a developing country, rural households depend on firewood as a main energy source. With about 66% of the rural population (63,086,436 people)1 local famers need a huge amount of firewood. Up to date, there is no report that study the comprehensive situation of the firewood collection and use at national wide. However, according to Chien P.D 2001, annually, from 22 to 23 million tons of firewood are harvested2 and the fact-finding results to prepare the Emission Reduction Program (supported by the World Bank) stated that during time from 2010- 2014, there were on average over 5 million steres of firewood extracted per year in a target province of the program in Nord Central Provinces region (Thanh Hoa, Nghe An, Ha Tinh, Quang Binh, Quang Tri and Thua Thien - Hue Provinces)3.
1 Vietnam General Statistic Office, 2020. Completed results of the 2019 Viet Nam population and housing census.2 Chien P.D 2001. Demography of threatened tree species in Viet Nam3 WB, 2016. Strategic Environmental Social Assessment for the proposed Emission Reduction Program in Nord Central Provinces.4 Hung T.V et al, 2020. 2020. Viet Nam Forestry Development Strategy: Implementation results for 2006–2020 and recommendations for the 2021–2030 strategy5 Thanh V.N et al, 2020. Determinants of Non-Timber Forest Product Planting, Development, and Trading: Case Study in Central Viet Nam
NTFPs to become a primary industry and to make up over 20% of the total forestry production value. The value of exports increased from USD 0.23 billion in 2006 to USD 0.8 billion in 20204. The NTFP groups that include plants with fibers, medicinal plants, essential oils, and plastic and oils have led to the annual harvest of 350 million bamboo plants, 4500 tons of rattan, 1500 tons of bamboo shoots, 300 tons of fruits, 5000 tons of other products for food, 4500 tons of medicinal herbs, and 130,000 tons of essential oils and plastic5. However, exploitation of NTFPs mostly operated by household level without any sustainable strategy and harvesting plan and it is still spontaneous, scattered, wasteful, and the economic efficiency is very low. The use of NTFPs is still mainly based on available natural exploitation, with little attention to conservation and development.
Figure 27: Harvested volume from natural forest 1955-2003 Source: MARD, 2006
© Nataliiastoksuietska / Freepik.com
ASSESSING THE BIODIVERSITY IN VIET NAM – ANALYSIS OF IMPACTS FROM ECONOMIC SECTORS 91

Figure 28: Violation case of illegal logging for all the country 2007 – 2013 Source: FDP
Illegal logging
Illegal logging of natural forest continues is a problem in Viet Nam. Up to date no thorough research has been done on the topic. Although the Government of Viet Nam has made many efforts to strengthen law enforcement, However, illegal logging is still a matter of concern first in Viet Nam so far. According to annual report on forest violation by FPD, from 2007 to 2013 there are over 2,000 cases to 4,500 cases of illegal logging1 in the whole country. (see Figure 28).
There is no updated statistic figures reflected the total amount of illegal logging at national level, however many high-valued timber species are being degraded rapidly. About 100,000 m3 of illegally harvested logs are confiscated each year (Vu Huu Tuynh and Pham Xuan Phuong, 2001). The most of violation cases are often occurred in rich forest areas in 8 forestry ecological zones.
1 http://www.kiemlam.org.vn/Desktop.aspx/List/Hanh-vi-vi-pham-Luat-BV-va-PT-rung/2 https://nhandan.com.vn/vi-moi-truong-xanh/vuon-quoc-gia-yok-don-dang-bi-xam-hai-nghiem-trong-223221 3 http://baochinhphu.vn/Phap-luat/Pha-rung-nghiem-trong-tai-Phong-Nha-Ke-Bang/361251.vgp 4 https://bnews.vn/pha-rung-o-vuon-quoc-gia-ba-be-da-tro-thanh-diem-nong/93246.html 5 https://vnexplorer.net/illegal-logging-rampant-in-vietnams-central-highlands-a202022393.html
The purpose of logging is also diverse: one is for the valuable logs which they sell for money, and the other is the local people who need timber to build houses or clear forest land for cultivation.
Illegal logging threatens natural valuable species and vulnerable protected forest where under management of National Parks, Nature Reserve and Forest Protection Management Board. The 115,000-ha Yok Don National Park in Dak Lak is a hot spot for forest violations because of its prized trees in the forest whose timber fetches high prices2. Other hotspots include Phong Nha-Ke Bang National Park in Quang Binh Province3, Ba Be National Park and Kim Hy Natural Reserve in Bac Kan Province4. Forest located at the border of the Central Highlands provinces of Gia Lai and Dak Lak in Viet Nam is being destroyed at an alarming rate by both loggers and local people5.
Viol
atio
n ca
se
2007 2008 2009 2010 2011 2012 2013 2015 2016 2017 2018 2019 2020
4000
4500
3500
3000
2500
2000
1500
1000
500
0
ThreatsOverharvesting in a long time by State Forest Enterprise (SFC), unstainable NTFPs collection and Illegal logging are direct drivers to deforestation and forest degradation. Their negative impacts not only the direct damage to the quality of forest resources but also the process in forest conversion and led to biodiversity loss. The major threat of these activities is habitat loss, forest ecosystem fragmentation and low natural regeneration due to reduce of mother trees.
Illegal logging is a serious concern in forest protection and management. Illegal logging and unsustainable collection of NTFPs resulted decline of endemic or high value plant species for both timber and herbal medicinal plants, increasing the number of endangered and extinct plant species, particular in primary forest in protected areas. (e.g. Gõ đỏ (Afzelia xylocarpa,) Gụ mật (Sindora siamensis), Thông nước
(Glyptostrobus pensilis), Hoàng đàn (Cupressus torulosa), Bách xanh (Calocedrus macrolepis), Đinh (Markhamia stipulata Seem), Lim xanh (Erythrophleum fordii) and Gió trầm (Aquilaria), Sâm Ngoc Linh (Panax Vietnamensis), Lan Kim Tuyến (Anoectochilus setaceus).
A research on species composition, diversity and structure of secondary tropical forest following selective logging in Huong Son Forest Company, Ha Tinh Province shows that percent composition of families and number of commercial species found in sample pilot (after 2 years logged) were lower than in comparison with other plots, and the result of basal area of the sample pilot area (after 12 years logged) were lower than others, and slight low diversity indices for commercial species (Hop et al 2004). This leads to the depletion of forest resources, which will inevitably reduce the biodiversity of the forest and negatively affect the lives of people who depend on the forest.
© Wirestock / Freepik.com
ASSESSING THE BIODIVERSITY IN VIET NAM – ANALYSIS OF IMPACTS FROM ECONOMIC SECTORS 93

Despite the impressive increase in planted forest area, however, focus is mainly on the area of commercial plantations (production forest) with fast growing exotic species (Eucalyptus spp, Acacia spp). As statistic from annual publication of national forest status by MARD, in the period from 2002 to 2020, the planted area of the special-use forest increased on average
about 81,200 ha (account for 2.47% of the total increased plantation area), protection forest increased on average about 657,607 ha (account for 20.04% of the total increased plantation area), the planted production forest increased on average about 2.54 million ha (account for 77.49% of the total increased plantation area) annually (see Figure 30).
PlantationForest plantations initiatives began since the late 1980s when the start of Doi Moi (Innovation) with land reform policy and have expanded rapidly in the period 1993 – 2010 through two large national programs called 3271 program and 661 programs2 with the same objective is to increase the area and forest coverage, and to create conditions for ethnic minorities in remote and disadvantaged areas to benefit from the forest.
According to MARD, 2011, by 2010 up to 2.45 million ha of forest had been planted during 1998-2010, of which 898,000 ha of special-use and protection forest and 1.552 million ha of production forest. Forest plantations have expanded rapidly in response to forest and forestland allocation policies and the financial support from the state and local governments in the period 2011 – 2020. The booming woodchip industry and amazing achievement of wood and timber product export recently (see Box 2)
1 Decision no. 327-CT dated September 15, 1992 by the Chairman of the Minister Council (Prime Minister) on the policies and objectives in utilization of barren land and hills, alluvial coastal areas and water surface areas.2 Decision no. 661/QD-TTg dated July 29, 1998 by the Prime Minister on the target, task, policy and organisation for implementation of the project on planting of five million hectares of forest.3 http://www.kiemlam.org.vn/Desktop.aspx/List/So-lieu-dien-bien-rung-hang-nam/ 4 This increase of natural forest might come from forest rehabilitation efforts by 327, 661 programs (natural regeneration, for example)
accelerated the development of plantation in this period, from about 1.92 million ha in 2002 to 4.39 million ha in 20203. According to the Government’s report on the implementation of the Forest Protection and Development Plan for the 2011-2020, in the past 10 years, on average, the whole country planted about 230,000 hectares of forest each year contribute to the protection and environment protection functions of forests and creating a source of raw materials from planted forest wood for the wood processing industry. However, the area of natural forest has not increased significantly. Even in some areas, the area of production forest increased sharply, but the area of natural forest decreased deeply. In particular, the Central Highlands region, according to data from the VNFOREST in 2019, the area of planted forests in the Central Highlands increased by 18,387ha compared to 2018, but the area of natural forests However, it decreased by 15,753ha. (see Figure 31)
Figure 29: Natural forest and plantation forest area change4
Source: FDP
BOX 2
Viet Nam’s wood processing and forestry products industry has developed rapidly in recent years. The export turnover of wood and forest products has grown by 12-17% over the years. The amazing exporter of wood and forest products in the world and second in Asia, accounting for 6 percent of the world’s market share. (Source: http://www.mard.gov.vn/en/Pages/prime-minister-calls-for-sustainable-development-of-wood-processing-industry.aspx?item=6)
By 2018, the total supply wood materials for the wood processing industry is over 40 million m3, of which the amount of harvested timber from domestic plantation is about 30 million m3 (account for 75% of the total supply wood materials). Source: Quyen N.T 2019. VIFORES’s report to the Forum-Wood and forest product export and processing industry 2018-Success, lessons learned and breakthrough solution in 2019).
Natural forest Plantation forest
Figure 30: Composition of plantation area by 3 types of forest Source: FPD
ASSESSING THE BIODIVERSITY IN VIET NAM – ANALYSIS OF IMPACTS FROM ECONOMIC SECTORS 95

Rubber
1 https://vietnamnews.vn/economy/939299/rubber-industry-needs-to-develop-production-chain.html 2 Decision 2855/BNN-KHCN dated 17 September, 2008 by MARD announcing the determination of Rubber plant as multi-purpose tree.3 Decision 750/QD-TTg, on June 3, 2009 by the Prime Minister approving the rubber development master plan to 2015 with vision to 2020
Viet Nam has been a country with rubber production capacity leading in Asia since 2013. Export turnover of natural rubber and rubber products of Viet Nam has increased in recent years. Statistics from the GSO indicate that rubber areas have considerably increased from 482,700 ha in 2005 to 978,900 ha in 2014 and go down to 941,800 ha in 2019 (see Figure 31). Export value of processed rubber products was about $3.11 billion in 2020, accounting for 39.6 per cent of the total rubber industry. Rubber wood exports was $2.36 billion, accounting for 30.1 per cent of the total rubber industry1. Viet Nam has become the world’s fourth largest natural rubber exporter after Thailand, Indonesia and Malaysia.
The rising of the global natural rubber consumption has pushed Viet Nam to expand its area under rubber trees as a multipurpose crop2 for the national development in economy. Considering the increasing world demand of rubber products, Viet Nam Government has promulgated a decision in 20093 to set a target of total domestic rubber area will stabilise at the level of 800,000 ha by 2015. However, as shown in Figure 31, total planted area for rubber plantation covered an area of nearly 1,000,000 ha in 2014, surpassing the plan for 2015.
The area of planted forest has increased rapidly in last two decades to meet the demand for raw materials for the wood processing industry, create jobs and contribute to improving the livelihoods of afforestation households. However, due to high demand of timber raw material for wood processing industry and market price of woodchip, many areas of natural forest were encroached for Acacia plantation. In either case, the rate of deforestation associated with Acacia plantations fluctuates annually and is subject to rapid change. Recently, deforestation and encroachment of natural forest for growing Acacia is taking place in all the forested provinces. The most common is the destruction of protection forests for Acacia plantations in the localities with damaged area from a number of ha to hundred ha. For example, Nghe An1, Ha Tinh2, Quang Binh3, Quang Nam4, Gia Lai5, Kon Tum6, Binh Dinh7, etc.
Deforestation and forest encroachment is currently a matter of concern in Viet Nam. In the first four months of the year 2021, the damaged forest area was 483.6 hectares, up 19.5% over the same period last year, the area of deforested was 349.5 ha, an increase of 49% over the same period of 2020. Particularly in April 2021 the area of deforested was 99.8 ha, an increase of 72.5%, some provinces with high deforestation area are Dak Lak 46 ha, Dak Nong 11.7 ha, Bac Kan 5, 8 ha, Nghe An 5.2 ha8.
1 http://congan.com.vn/doi-song/hang-tram-hecta-rung-phong-ho-dau-nguon-bi-cao-troc-de-trong-keo_108148.html 2 https://www.moitruongvadothi.vn/moi-truong/ha-tinh-rung-phong-ho-bi-buc-tu-a82030.html 3 https://vov.vn/xa-hoi/rung-phong-ho-o-quang-binh-bi-bam-nat-676225.vov 4 https://vtv.vn/vtv8/bung-phat-nan-pha-rung-lay-dat-trong-keo-o-quang-nam-20190613161217.htm 5 https://laodong.vn/xa-hoi/gia-lai-pha-trang-rung-phong-ho-o-xa-bien-gioi-ia-puch-860903.ldo 6 https://vtv.vn/trong-nuoc/pha-rung-chiem-dat-trong-keo-hoat-dong-trai-phep-dien-ra-cong-khai-2019012209231723.htm 7 http://daidoanket.vn/phat-hien-them-mot-vu-pha-rung-phong-ho-de-trong-keo-381817.html 8 http://consosukien.vn/tinh-hinh-kinh-te-xa-hoi-ca-nuoc-4-thang-dau-nam-2021.htm 9 Jeremy H. 2008. Monoculture tree plantations are “green deserts” not forests, say activists available at https://news.mongabay.com/2008/09/monoculture-tree-plantations-are-green-deserts-not-forests-say-activists/
Issues
Forest encroachment for monoculture plantation is direct driver of deforestation. Conversion of primary or secondary forest to commercial plantations can lead to significant biodiversity losses, a decrease of general ecosystem productivity,
Recent studies have shown that monoculture tree plantations caused loss of biodiversity and net emitters of carbon. “Tree plantations are not forests. A plantation is a highly uniform agricultural system that replaces natural ecosystems and their rich biodiversity”9. Therefore, event expansion rapidly of plantation cannot compensated the biodiversity loss from encroached natural forest areas,
Monocultural exotic plantation less species rich than natural and semi-natural forest (shrublands, mixed stand with native species).
Clear cut harvesting method and burn of harvest residuals made habitat loss and wild animal, insect escape or dead,
Using bulldozers or excavator to build skid trail, forest road in plantation area for planting and harvesting operations and burning harvest residue of acacia plantation destroy soil conditions and other environmental effects.
AGRICULTURE
Are
as o
f Rub
ber p
lant
atio
n (1
000
ha)
Figure 31: Areas of Rubber plantation 2005-2018 Source: GSO
ASSESSING THE BIODIVERSITY IN VIET NAM – ANALYSIS OF IMPACTS FROM ECONOMIC SECTORS 97

Land sources for rubber plantation development is to be mobilised from unproductive agricultural land and degraded natural forest. For technical support, MARD issued a technical guidance on how to plant rubber trees on forestland1. According the report on situation of conversion of forest to other purposes from 2006 to 2013 there were 260,880 ha of forests were converted to rubber since 2006; of which 231,567 ha were natural forests. The largest planned converted areas occur in the Central Highland, North Central Coast and Southeast regions (see detail at Table 28)2.
Table 28 shows that most of converted forest area under production forest type, none of converted area under Special-Use and protection forest. But in total 260,880 ha converted forest; natural forest area is 231,567 ha (accounting
1 Circular no. 127/2008/TT-BNN dated 31 December 2008 by MARD provided guidance on how to plant rubber trees on forestland 2 Decision no. 829/QD-BNN-TCLN dated 23 April 2014 by MARD3 https://vov.vn/kinh-te/rung-chuyen-sang-trong-cao-su-co-hoan-toanngheo-kiet-330327.vov
for 88.8%). The largest converted area is in Central Highland (118,702 ha- 36% of total converted area in the country). Most of these forestland in the Central Highlands, including production forest, is managed by State Forest Companies (SFCs) and the availability land for rubber plantation in this area derive from this source. A study report on Rubber expansion and forest in Viet Nam described that forest land area managed by EaHleo SFC has decreased from 27,000 ha in 1980s to 8,000 ha in 2012 for rubber plantation and residential areas in EaHleo district, Daklak province (To Xuan Phuc and Tran Huu Nghi, 2014). In addition, according to Prof. Nguyen Ngoc Lung, former Director of Forestry Department, MARD “More than half of the area converted to rubber plantations is not poor forest, even rich forest”.3
Table 28: Area of forest converted to rubber between 2006 and 2013
Region Projects Area (ha)Forest status 3 types of forest
Total Natural Planted Bare SUF Prot. Prodn.
Total 460 327,205 260,880 231,567 29,309 66,329 - - 327,205
Northern mountainous region 39 37,944 26,388 15,543 10,845 11,556 - - 37,944
North Central Coast 166 59,921 59,588 54,742 4,846 333 - - 59,921
South Central Coast 11 60,597 37,117 32,740 4,377 23,480 - - 60,597
Central Highlands 239 118,702 96,787 94,002 2,785 21,915 - - 118,702
South East 5 50,041 40,996 34,540 6,456 9,045 - - 50,041
Source: MARD 2014.
“More than half of the area converted to rubber plantations is not poor forest, even rich forest”Prof. Nguyen Ngoc Lung, former Director of Forestry Department, MARD
Cassava
1 https://vietnamnews.vn/economy/463982/cassava-struggles-to-reach-export-goal.html 2 https://www.gso.gov.vn/px-web-2/?pxid=V0630&theme=N%C3%B4ng%2C%20l%C3%A2m%20nghi%E1%BB%87p%20v%C3%A0%20th%E1%BB%A7y%20s%E1%BA%A3n 3 https://en.vcci.com.vn/vietnam-gains-cassava-export-growth-in-2020
Cassava is one of the four main cash crops in rural area of Viet Nam (rice, maize, sweet potato and cassava). Cassava became a commodity crop since the period 1990-2000 and up to date Cassava is one of Viet Nam’s billion-dollar export products1, mostly for export and raw material for ethanol production. The area of cassava cultivation had been rapidly growing and became out of control in many localities. By 2016, the area cassava cultivation had reached 569,000 ha (GSO)2, more than double compared to the area in 2000 (237,000 ha), (see Figure 32). Cassava exports in 2020 reached 2.76 million tons, earning US$ 989 million, an increase of 9% in volume and 2.4% in value compared to 20193. This is partially due to the ease of production and not require high input farming techniques of this crop and its growing use for both domestic animal feed and as an industrial export crop, exported mainly to China.
Are
as o
f Cas
sava
(10
00 h
a)
The Prime Minister Decision No. 124/QD-TTg of February 2, 2012 on approving the master plan on development of agricultural production to 2020 and vision for 2030 states the need to “keep a stable area of 450,000 ha of cassava to 2020: with cassava production of about 11 million tons for animal feed and biofuels in areas of land under 15-degree slopes, mainly in the northern mountains, coastal North Central, South Central, Central Highlands, the South East for cassava production”.
Figure 32: Planted area of cassava between 2000 and 2019 Source: GSO
ASSESSING THE BIODIVERSITY IN VIET NAM – ANALYSIS OF IMPACTS FROM ECONOMIC SECTORS 99

Although the number of violations of deforestation for agricultural cultivation has decreased sharply, however, so far on average, about 200 ha of forest are still encroached annually1. The Central Highlands provinces are still hot spots for deforestation for agriculture (from 2010-2016), due to fast growing commercial agriculture, migrant and traditional cultivation of ethnic minorities, e.g. Dak Nong province lost 8,300 ha2; in 2019, Krong Bong State Forest Company, Dak Lak province lost 7.7 ha3; from 2011-2012 there were 13.3 ha of deforested area in Dak Mon commune, Đăk Glei district, Kon Tum province4. According to an inspector official of Gia Lai province, during the inspection (2016-2020) the unit found that the most common point about the loss of natural forest in the long term was clearing for cultivation and it could not prevent5.
1 http://vacne.org.vn/rung-tay-nguyen-van-bi-tan-pha/23382.html2 https://baotainguyenmoitruong.vn/rung-tay-nguyen-con-dau-bai-2-rung-bi-tan-pha-chu-rung-vo-can-235756.html 3 http://baodaklak.vn/channel/3481/201904/phat-hien-36-vu-pha-rung-lam-nuong-ray-5628240/ 4 https://www.qdnd.vn/kinh-te/cac-van-de/kon-tum-nguoi-dan-van-ngang-nhien-pha-rung-lam-ray-385788 5 https://tuoitre.vn/gia-lai-mat-gan-8-000ha-rung-tu-nhien-nhu-the-nao-20201108080250081.htm
The massive and rapid growth of cassava has shown impacts on forest resources and forest land in the localities. nearly 80% of the land is planted with commodity crops, including cassava, which is forestry land or derived from converted forest land legally or illegally through encroachment (Meyfroidt et al 2013). Rapid expansion of cassava disrupts crop planning as well as land use planning in many localities. In particular, studies on the relationship between expansion of cassava production and forest resources shows that nearly 6,087 ha (73% of allocated forests) of forest and forest land allocated to local households according to Decision no. 304/2005/QD-TTg1 in Sa Thay District, Kon Tum province and 2,218 ha forest and forest land in Binh Thuan province has lost, but the main cause has encroached forest and forest land for agricultural cultivation including cassava in the period from 2004 - 2013 (Nguyen Hai Van, et al 2016).
1 Decision No. 304/2005/QD-TTg on the pilot allotment of forests and contractual assignment of forests for protection to ethnic minority households and communities in hamlets and villages in the Central Highland provinces.
Threats
Rapid expansion of rubber plantations and cassava have ignored the targets on stable cultivation areas in their master plans resulted in extensive deforestation. Monocultural rubber plantations and Cassava have replaced tropical forest, causing forest ecosystem fragment and biodiversity loss.
Monoculture rubber plantations showed to harbour less than half of the species richness in various plant and animal groups compared with natural forest, and many of these species are unable to exist permanently in rubber plantations1.
Cassava production has had a effect on the biodiversity, however, the actual loss of biodiversity in this process has not been well-documented.
1 He Pia and Martin, K. 2016. Effects of rubber cultivation on biodiversity in the Mekong Region.
Issue/Threat
Agricultural expansion in upland areas is resulting in primary vegetation loss and fragmentation. With the current increase in population and influx of commercial agricultural prospects, the land degradation and fragmentation from agricultural expansion for food will continue to threaten the biodiversity at site level.
Slash and burn practice in agroforestry farming can have devastating effects on the biodiversity in the area. With large areas of land being incinerated, many animal habitats are lost in the fire. This pushes animals out of the forest, decreasing biodiversity, and increasing the number of endangered and extinct animal species.
Subsistence agricultureWith subsistence agriculture, local farmers in mountainous focused cultivation crops to feed for their family’s subsistence purpose such as dry rice, maize, bean, etc. Poverty and population pressure are threats for food security and environment risk on the existing land resources.
The rapid growth in industrial crops production for export in the last decade has directly impacted subsistence production. The conversion of agricultural lands to commercial crops can cause displacement of poorer households relying on shifting cultivation towards the forest margins. Given that the production of these crops, in particular in upland areas is for subsistence purposes the direct and indirect drivers causing
expansion into forested areas which can create the direct impacts to biodiversity.
Although the subsistence crops may be the actual cause of the removal of forests it is as a result of displacement of local crops due to the expansion of commercial crops. This trend has been most clearly seen in the rapid deforestation in the Central Highlands with coffee, pepper, Macadamia production.
Statistic from FPD shows that from 2007 to 2013 the violation case of forest encroachment for shifting cultivation had rapid reduced from 3,105 cases in 2007 down to 1,423 cases by 2013 (see Figure 33).
Figure 33: Encroached forest for shifting cultivation (Source: FPD).
Viol
stio
n ca
se p
er y
ear
ASSESSING THE BIODIVERSITY IN VIET NAM – ANALYSIS OF IMPACTS FROM ECONOMIC SECTORS 101

To support farmer increased area of shrimp production, Ca Mau and Kien Giang provinces allowed household and individual that are forest owner and contracted forest protection to use up to 40% (in Ca Mau1) and 30% (in Kien Giang2) of non-forested area in the allocated or contracted protection forest areas for agricultural and fishery production. This ratio provides the relation between protected mangrove forest area and aquaculture farming in the protection forest zone. There are no sufficient results available on the value of the 70:30 regulation in Kien Giang and the 40:60 regulations in Ca Mau but consequence is too many ha of mangrove forest was converted to shrimp farming in the region.
1 Decision No. 19/2010/QD-UBND dated September 22, 2010 by the PPC of Ca Mau province on implementation of some policies for forest protection and development in Ca Mau2 Decision No. 25/2011/QD-UBND dated July 28, 2011 by the PPC of Kien Giang on regulations for forest planting, forest protection and use of coastal pro-tection forest in Kien Giang 3 Phan N.H and Hoang T.S Mangrove of Viet Nam 19934 http://www.kiemlam.org.vn/Desktop.aspx/List/So-lieu-dien-bien-rung-hang-nam/From 2016 to date, the term of “mangrove forest” was merged in new term called “Forest on wetland” in annual report on national forest status therefore it is difficult to identify the area of mangrove forest
Expansion of Shrimp farming as a driver of mangrove forest clearance in coastal areas. According to the Forest Inventory and Planning Institute (FIPI), there are 205,900 ha of natural mangrove forest of which 141,700 ha of trees and 64,200 ha of shrub and 73% of the mangrove forest area (149,400 ha) distributed in Southern Delta3. However, according to the MARD’s report on annual announcement of national forest status annually, the area of natural mangrove forest is only 70,684 ha in 2002 and this area decreased annual slightly to 62,072 ha by 2005 down to 60,882 ha by 2012 and fall down to 19,559 ha by 20154 (see Figure 3). To date, there is no any comprehensive study report to present how many ha of mangrove forest were converted to shrimp farming at national level.
FISHERIES
Brackish Water Shrimp FarmingShrimp farming is an important aquacultural business in Viet Nam, Mekong Delta in particular. This is because shrimp provides close to half of the country’s revenue from seafood1. The shrimp farming is not only for domestically consumption, either it is exported all over the globe. After a nearly 40 years of development, the farming area has reached over 700,000 thousand ha in 2018, the output is nearly 690,000 tons, shrimp farming has become a key commodity product in aquaculture. Identified as the main aquaculture species, making an important contribution to the country’s economic development, brackish water shrimp are being raised in 30 provinces and cities across the country and becoming a major commodity product. In the period 2000-2018, the area of shrimp farming increased from 324,100 ha to 713,100 ha2 (see Figure 34). In 2020, Viet Nam’s shrimp exports reached 3.85 billion USD, up 15% compared to 20193.
1 VASEP 2020. Fishery industry report 20202 https://www.gso.gov.vn/px-web-2/?pxid=V0646&theme=N%C3%B4ng%2C%20l%C3%A2m%20nghi%E1%BB%87p%20v%C3%A0%20th%E1%BB%A7y%20s%E1%BA%A3n 3 https://www.mard.gov.vn/en/Pages/shrimp-exports-in-2020-reached-3-85-billion-usd.aspx 4 https://tcnn.vn/news/detail/37309/Xay_dung_nong_thon_moi_o_tinh_Ca_Mau_giai_doan_2011_2015_Thanh_tuu_va_nhung_bai_hoc_kinh_nghiemall.html
Use of mangrove resources is diverse. Local people destroyed a large area of mangrove forest to make way for developments and investments in aquaculture, cutting tree for family use and trade, cutting tree for charcoal, etc. production at district and commune levels. During the period 1980 – 1990, Government of Viet Nam has encouraged Shrimp farming for export, and it became a wide-spread activity. This was often at the expense of mangrove forests, especially in southern Viet Nam (Hong and San, 1993). Expansion of aquaculture in the 1980s and 1990s resulted in the loss of about two-thirds of Viet Nam’s remaining mangroves by 2000 (IUCN, 2012).
Aquaculture production has developed rapidly in the period from 2010 to 2015 in Mekong Delta area. In 2015, the total aquaculture area in Ca Mau reached 298,138ha (increasing more than 3 times compared to before), of which 268,500ha of shrimp production and extensive shrimp farming area is estimated at 75,000 ha (7.5 times higher than the end of 2010)4.
Issue/Threat
Mangrove forests play an important role in the life of millions of local people living in coastal areas. They serve as habitat nurturing many marine species that have a high economic value. However, destruction of mangrove forests for primitive extensive shrimp farming has caused harmful impacts on resources and the environment includes biodiversity,
Rapid expansion of brackish shrimp farming led mangrove deforestation and its consequence is fragmented mangrove forest ecosystem,
Destruction of mangrove forests for the expansion of shrimp farming has resulted a decline in local biodiversity resources (habitat loss, decrease in species of marine wildlife population such as fish, shrimp, crabs, mollusc and other aquatic organisms),
Intensive Brackish Shrimp farming in high density in the Mekong Delta is also a cause of organic pollution in many water areas, affecting natural ecosystems and aquatic communities in these areas.
Figure 34: Brackish Shrimp Farming and Natural Mangrove Forest change 2000-2018 Sources: GSO, FPD
ASSESSING THE BIODIVERSITY IN VIET NAM – ANALYSIS OF IMPACTS FROM ECONOMIC SECTORS 103

Viet Nam has been recognized as an emerging tourism market in recent years. Tourism has brought tremendous benefits reflected through socio-economic indicators in this country. Besides, there are many business opportunities coming from the booming of the Vietnamese tourism market. However, the tourism sector is recently facing some huge challenges to maintain sustainable development in the coming time. In this context, a new development strategy is needed to change Viet Nam’s tourism forward to a sustainable approach.
Tourism has been increasing in recent years, the statistics have clearly demonstrated a strong increase in the number of foreign and domestic visitors over time and have been particularly prone to a sharp rise over the past ten years. Besides, the growth expands in the number of both domestic and foreign tourists. In the detail, in the past twenty years (2000-2019), Viet Nam has totally welcomed 812 million tourists including 683.2 million domestic visitors (account by 84.1%) and 128.8 million foreign visitors (account by 15.9%; Figure 35).
TOURISMM
illio
n pe
rson
Domestic visitor Domestic visitor
In parallel with the increased number of visitors, the tourism revenue has also been increasing fast. According to the statistics of GSO, in 2000, the Vietnamese tourism revenue was only VND 17 trillion, it increased to VND 68 trillion in 2009 and then reached VND 726 trillion) in 2019. During the period of 2000-2019 (20 years), the tourism revenue of Viet Nam was 42.5 times higher as
1 https://www.gso.gov.vn/so-lieu-thong-ke/
compared to the 2000 level1. In 2019, the tourism industry welcomed 85 million domestic tourists and 18 million foreign visitors reached a revenue of VND755,000 billion, contribute over 9.2% to the country’s GDP. Tourism industry achieved a high growth rate of 22.7% per year in the period of 2015-2020.
Eco-tourism in special-use forestsViet Nam has great potential for ecotourism for its high biodiversity. The unique ecosystems in Viet Nam includes tropical forest ecosystem, mangrove forest ecosystem, coral ecosystem, wetland ecosystem, etc. with a rich biodiversity of fauna, flora and aquatic species.
Eco-tourism in special-use forests has grown rapidly in term of both tourists and tourism revenue recent years. Until 2019, 61 out of 164 special-use forests had organized ecotourism activities, of which 26/33 national parks (accounting for 15.85% of the total number of special-use forests and 78.8% of the national
parks). In 2015, special-use forests nationwide welcomed over 1.15 million visitors with a revenue of nearly 77.3 billion VND. This increased to 114 billion VND in 2016 and 136 billion VND in 2017. In 2019, the number of visitors special-use forests reached 2.42 million visitors (up 53% compared to 2017), revenue reached 185 billion VND, up 36% compared to 2017. National parks attracted 97.5% of total visitors on eco-tourism. National parks with high rates of visitor attraction are Cuc Phuong National Park, Phong Nha-Ke Bang National Park, Cat Tien National Park, Ba Vi National Park, etc.
Rev
enue
(Bill
ion
VND
)
Visitor Revenue
Figure 35: Annual visitor in Viet Nam from 2000 to 2019 Source: GSO
Figure 36: Ecotourism in special-use forest on the 2015-2019 period (Source: MARD 2019).
© Wirestock / Freepik.com
ASSESSING THE BIODIVERSITY IN VIET NAM – ANALYSIS OF IMPACTS FROM ECONOMIC SECTORS 105

Issue/Threat
Tourism development presents benefits of favorable conditions to a specific location, like jobs, income and the establishment of certain services. However, it has also resulted environmental degradation, biodiversity declination and other adverse impacts,
Massive construction of hotels, resorts build hotels and other tourism serving infrastructure have been negatively changed of natural landscape, deforestation,
Intact forests in protected areas are heavily tramped on, vulnerable ecosystems, sea islands, caves, coral reefs, etc. are damaged by tourist activities,
Liquid and solid waste pollutes seriously the environment at the tourism sites.
High demand of wild consumption at tourism sites (NTFPs, wild animal meat, fresh fish, sea foods).
© Wirestock / Freepik.comASSESSING THE BIODIVERSITY IN VIET NAM – ANALYSIS OF IMPACTS FROM ECONOMIC SECTORS

Therefore, the agriculture and forestry sectors, including aquaculture, should be selected for an in-depth analysis aiming at developing voluntary national and sectoral commitments to relieve pressures on biodiversity.
Viet Nam, officially the Socialist Republic of Vietnam, is a country of Southeast Asia located at the eastern edge of the Indochinese Peninsula. It is divided into 58 provinces, 5 municipalities, cover 330,000 km² and has a population of 96 million inhabitants. This great country also harbours an astonishing range of habitats, from rainforests and dry forests to mangroves and coral reefs and is home to an unusually rich array of plants and animals. At present, over 50,000 species have been identified, consisting of nearly 7,500 microorganisms, 20,000 terrestrial and water plants, 10,500 terrestrial animals, 2,000 invertebrates and freshwater fish, and over 11,000 marine species (UNDP, 2021). The reasons for Viet Nam’s extraordinarily rich biodiversity are complex, and that complexity is captivating biodiversity scientists nowadays. As a result of this high biological diversity, the country has been ranked the 16th most biologically diverse country in the world. These diverse ecosystems provide clean water, soil stability, buffers against storms and climate shocks as well as a basis for tourism. Biodiversity conservation is an essential component of achieving sustainable and resilient development.
Although biodiversity brings direct benefits to humans, contributes to the national sustainable development strategy, and protects the environment, Viet Nam is experiencing rapid biodiversity loss due to population growth, overexploitation of natural resources, illegal logging, and the expansion and intensification of agriculture.
Figures speak for themselves: 21% of mammals are endangered, 6.5% for birds, 19% for reptiles, 24% for amphibians, 38% for fishes and 2.5% for vascular plants. No matter which tool is used to assess species and ecosystems threats, human activities always come first. Agricultural, forestry and aquaculture have significantly affected biodiversity loss in Viet Nam. From the literature review, biological use (hunting and collecting wildlife, timber logging and harvesting aquatic resources) and forested land conversion especially for agriculture and aquaculture, appear to be the most frequent and impacted drivers of biodiversity loss.
FROM THE LAND USE CHANGES ANALYSIS, it turns out that between 2000 and 2018, forested areas are the most impacted habitat. More than 10 544 km² of forested areas (encompassing the following classes: forest, evergreen broadleaf, mixed forest) have disappeared and they have been mainly converted into plantations and orchards (4855 km²) and croplands (5028 km²). Indeed, during the last 20 years, 2.8 million hectares of natural forests were lost because of land conversion to other commodity areas. Mangroves, lagoons, and coastal tidal flats are habitats impacted because of intensive aquaculture areas. Finally, STAR analysis highlights that the two main threats impacting biodiversity in Viet Nam, at the threatened species level, were: (1) Annual and perennial non timber crops, (2) Logging and wood harvesting.
© Wirestock / Freepik.com
109

considered in Strategic Environmental Assessment (SEA). Capacity building in EIA should also be developed to better conduct the assessment. Future policies to promote economic development should be deliberately developed and take into account environmental and biodiversity consequences and strictly and effectively enforced.
Second, for areas already being converted to intensive agriculture, aquaculture and monoculture plantations, it is strongly recommended to have policies that promote sustainable management practices e.g., sustainable agriculture, integrated landscape management, sustainable management certifications to improve sustainable biodiversity management and reduce environmental impacts.
Third, regulations on biodiversity conservation should be specifically targeted in Laws, yet they remain absent in many laws e.g., Law on Land (2013), Mineral Law (2010), Law on Enterprise (2020), Investment Law (2021), Public Investment Law (2019), Construction Law (2020) and Law on Credit Institutions (2010). More policy documents related to these laws should be issued to integrate biodiversity stakes and regulate biodiversity conservation.
Fourth, planning for biodiversity conservation for 2021-2030 with a vision to 2050 needs to address weak points of the previous planning period e.g., the integration, compatibility with the planning of other sectors.
Fifth, impacts of economic sectors on biodiversity need to be systematically monitored and documented to regulate appropriate commitments and activities of the economic sectors over biodiversity. Impact indicators should be used for monitoring the economic sectors. Remote sensing tools and STAR metrics can support the determination of values for these indicators.
Sixth, biodiversity conservation should be mainstreamed in policies of all government levels and more concrete commitments on biodiversity conservation should be seen in the related policies of economic sectors. Information on biodiversity and threatened species in different locations should be published or shared with relevant agencies to aid the conservation and EIA.
Seventh, there should be policies to promote the participation of the private sectors, civil society organizations, and local communities in biodiversity conservation.
Eighth, there is a need to have better coordination on biodiversity conservation among organizations of the central government and lower-level management organizations.
Nineth, biodiversity conservation should be clearly integrated in strategy and development plans of the private sectors.
Tenth, more biodiversity related incentives and more financial investments tools should be mobilized for farmers, fishemen, forest managers, and more broadly for the private sector to ensure a smooth transition from the current business model towards biodiversity-friendly business model.
First, the most prominent threats from the economic sectors to biodiversity is land use conversion. Therefore, it is critical to enforce sustainable land use planning policies as well as concrete policies and law enforcement to strictly control forest land conversion. This requires: (i) to review and complete regulations and policies on forest inventory for land use conversion purposes; (ii) to provide detailed guides on biodiversity assessment and environmental impact assessment in the documents to apply for land use conversion; (iii) EIA to be strictly enforced in all stages from the assessment itself, consultation, appraisal and making decision for approval to the project implementation of the project owner after being approved. In this process, it is important to provide detailed requirements on biodiversity assessment. As such, it is required to have a much better understanding of biodiversity and biodiversity threats to provide more detailed guidelines, requirements and criteria on biodiversity assessment in EIA (Nguyen and Nguyen, 2016). Similarly, biodiversity assessment must be strictly implemented and the results must be carefully
4.1. Ten overall recommendations for mainstreaming biodiversity in policies, activities and ensuring its conservationNumerous recommendations could be listed to address the biodiversity loss by the economic sectors due to the wide diversity of the stakeholders impacting directly and indirectly species and ecosystems. However, no study having comprehensively identified and quantified every single biodiversity economic sectors' impacts, a selection of ten recommendations is provided hereinafter, based on the outcomes from this assignment.
© Wirestock / Freepik.com
ASSESSING THE BIODIVERSITY IN VIET NAM – ANALYSIS OF IMPACTS FROM ECONOMIC SECTORS 111

4.2. Specific recommendations for the economic sectors
According to the 5-year social development plan formulation cycle. The period of 2016-2020 has ended, the period of 2021-2025 is beginning. Therefore, too many sector’s policies have been expired and the new policies are under development. In the bridging time it is necessary to update the real situation to revise or adjust the new coming policies accordingly. Following are some specific recommendations for sectors.
± It is necessary to update and finalise legal framework on forest assessment for changing forest use purpose. Specifically, biodiversity should be included as one of the requirements of forest inventory for considering the conversion.
± It is necessary to have a policy on Enrichment planting in Special-Use forests. According to current policies, this activity is not allowed implement in protected areas, however, in fact there is a number of endemic native plant species just fits site conditions where they are growth before,
± When developing new policy to support communities in buffer zone of protected area it is need to include communities live in or next to protection forests,
± The supported budget for planting special-use forest, protection forest, coastal protection forest should be an investment amount not a subsidy amount as in existing policies. The investment norms need to update according to the new economic circumstances,
± Update new cost-norm for forest protection. With the current norm VND300,000 – VND 400,000 is low,
± It is necessary to have a guideline for the development of sustainable NTFPs harvesting
planning, including a regime for reporting the annual volume of NTFPs harvested,
± Pay more attention in the allocation of state budget for biodiversity-related such as biodiversity inventory; establishment of the biodiversity database system; scientific research on biodiversity; modern equipment for biodiversity monitoring; and other infrastructural biodiversity facilities,
± Strengthening Political agreements on bilateral and multilateral cooperation and promote cooperation with neighboring countries to control illegal logging and trade (timber and Wildlife) and promote biodiversity conservation,
± Provide the necessary legal education and advice support to communities to be aware of legal rights and available redress mechanisms related biodiversity.
± Need to have more detailed assessments on the scale and impacts of activities in forestry sector on biodiversity at the national scale to develop voluntary commitments to reduced negative impacts on biodiversity and restore nature.
± It is necessary to have financial mechanisms and related guidelines to promote development of sustainable and deforestation-free agricultural production,
± Introduce and implement policies on promoting
Forestry
Agriculture
the adoption of Green Agriculture/ organic and ecological-based agriculture through environmental science research and transfer and promote international certification for agricultural commodities,
± Introduce and promoting a Production Traceability System for Agricultural Products to ensure the environment and biodiversity are secured.
Fishery
± To continue study to better understand the scale and impacts of fishery and aquaculture on biodiversity and from that to develop appropriate models to reduce pollution and negative impacts on biodiversity.
± It is necessary to have a financial mechanisms and related guidelines to promote development of sustainable and deforestation-free aquaculture production,
± It is necessary to have a detail guideline to promote brackish Shrimp farming to get Certification (Natureland, Best Aquaculture Practices (BAP), Aquaculture Stewardship Council (ASC), Global GAP).
Tourism
± It is necessary to have appropriate mechanism of collaboration between authorities and various sectors in the development of policies and ecotourism planning. Tourism industry is related to numerous sectors, so it requires a close cooperation between stakeholders for its development (Construction, Forestry, Energy),
± It is necessary to develop a mechanism and its guidelines to encourage local communities to invest and participate in Eco-tourism activities
in protected areas. Most of community-based Eco-tourism activities in protected areas are spontaneous without specific products, target markets and region tourism planning,
± Finalization of policies on Capacity building training for staff working in protected areas with Eco-tourism Management and Marketing Skills includes provide visitors with basic knowledge of the ecosystem of forest ecosystem, fauna and flora species particular with the endemic species at the region,
± Need to issue the specific regulation and guidelines for implementation of organizing joint ventures, tourism business association or leasing forest environment makes tourism business in some national parks and protected areas according to Decree 156/ND-CP,
± Promote ecofriendly practices of ecotourism in prioritized sites as a means to address poverty alleviation and biodiversity conservation goals.
± It is recommended that relevant ministries and government agencies need to complete and strongly enforce legal frameworks, tools and guidelines for evaluating ecosystem services and mainstreaming them into integrated Land-Use Planning.
± To further strengthen communication and environmental education about threatened species in protected areas such as the National Parks and Nature Reserves in order to widely publicize and raise awareness on biodiversity stakes and values
± To encourage people and economic sectors
to participate in the development and
implementation of a more effective plan for
natural resource management and biodiversity
conservation.
It is needed to clearly stipulate responsibilities for publishing environmental impact assessment report (EIA) results in accordance with the Law on Environmental Protection 2020, and allow the access to that documents.
ASSESSING THE BIODIVERSITY IN VIET NAM – ANALYSIS OF IMPACTS FROM ECONOMIC SECTORS 113

BIBLIOGRAPHY
An. L.T.. Markowski. J.. Bartos. M.. 2018. The comparative analyses of selected aspects of conservation and management of Viet Nam’s national parks. Nat. Conserv. 25. 1–30. https://doi.org/10.3897/natureconservation.25.19973
Anonymous. n.d. General understanding about Karst and Karst caves [WWW Document]. URL https://skhcn.quangbinh.gov.vn/3cms/upload/khcn/File/SachKhoaHoc/ThienduonghangdongQB/chuong 2.pdf (accessed 5.30.21).
Anonymous. n.d. General understanding about Karst and Karst caves [WWW Document]. URL https://skhcn.quangbinh.gov.vn/3cms/upload/khcn/File/SachKhoaHoc/ThienduonghangdongQB/chuong 2.pdf (accessed 5.30.21).
Averyanov. L. & Averyanova. A.L.. 2003. Updated Checklist of the Orchids of Viet Nam. Hanoi: Viet Nam National University Publishing House.
Averyanov. L.V.. 2008. The orchids of Viet Nam. Illustrated survey. Part 1. Subfamily Apostasioideae. Cypripedioideae and Spiranthoideae. Turczaninowia 11(1): 5–168.
Averyanov. L.V.. 2010. The orchids of Viet Nam. Illustrated survey. Part 2. Subfamily Orchidoideae. Turczaninowia 13(2): 5–98.
Averyanov. L.V.. 2011. The orchids of Viet Nam. Illustrated survey. Part 3. Subfamily Epidendroideae (primitive tribes – Neottieae. Vanilleae. Gastrodieae. Nervilieae). Turczaninowia 14(2): 15–100.
Averyanov. L.V.. 2013. The orchids of Viet Nam. Illustrated survey. Part 4. Subfamily Epidendroideae (tribes Arethuseae and Malaxideae). Turczaninowia 16(1): 5–163.
Bann. C.. Linde. L.. Nguyen. H.Q.. Nguyen. M.H.. Tran. T.T.H.. 2016. Border area development project - Rapid ecosystem assessment 0–4.
Birdlife. I.. Chu Yang Sin. N.P.. 2010. Chu Yang Sin National Park - Assessment of proposed road and trail developments in the core zone 2.
Buckton. S.. Cu. N.. Tu. N.D.. Quynh. H.Q.. 1999. The Conservation of key wetland sites in the Mekong Delta. Ha Noi. Viet Nam.
Carew-Reid. J.. Kempinski. J.. Clausen. A.. 2010. Biodiversity and Development of the Hydropower Sector: Lessons from the Vietnamese Experience – Volume I: Review of the Effects of Hydropower Development on Biodiversity in Viet Nam. Prepared for the Critical Ecosystem Partnership Fund. Ha Noi. Viet Nam.
Critical Ecosystem Partnership Fund, 2020. Ecosystem Profile – Indo-Burma Biodiversity Hotspot, 2020 update.
Chu Hoi. N.. 2012. Đầu tư cho các Hệ sinh thái Vùng bờ biển: Tài liệu Hướng dẫn cho các Nhà báo về Vai trò của các Hệ sinh thái Vùng bờ biển. Rừng ngập mặn cho tương lai. IUCN. Gland. Thuỵ Sĩ.
Conversion of dipterocarp forest to rubber plantation in Central Highland. available at https://vov.vn/kinh-te/rung-chuyen-sang-trong-cao-su-co-hoan-toanngheo-kiet-330327.vov.
Convention of the Biological Diversity. 2020. https://www.cbd.int/doc/handbook/cbd-hb-01-en.pdf
de Queiroz. J.S.. Griswold. Da.. Nguyen. D.T.. Hall. P.. 2013. Viet Nam tropical forest and biodiversity assessment
Diep. D.P.. 2021. Application of remote sensing technology and database in research and planning of biodiversity conservation in the Central highlands and southern Central Viet Nam. Scientific report. Southern Institute of Ecology. Unpublished. [In Vietnamese].
Disperati. L.. Virdis. S.G.P.. 2015. Assessment of land-use and land-cover changes from 1965 to 2014 in Tam Giang-Cau Hai Lagoon. central Viet Nam. Appl. Geogr. 58. 48–64. https://doi.org/10.1016/j.apgeog.2014.12.012
Duc. L.T.. Hung. L.A.. Thien. N.H.. Nam. V.T.. TRa. T. Le. 2019. Report on special use and protection forests of Viet Nam. Vietnam Administration of Forestry. Ha Noi.
Duong. L.H.. Dong. T.M.H.. 2019. East Sea - Natural Resources in Viet Nam. Eur. J. Eng. Res. Sci. 4. 65–69. https://doi.org/10.24018/ejers.2019.4.9.1516
FPT.2013. Natural Rubber Industry. FPT report 2013.
GBIF. 2021. Data occurrences for Viet Nam. www.gbif.org
General Statistic Office of Vietnam. Planted area of Rubber. Available at: https://www.gso.gov.vn/px-web-2/?pxid=V0632&theme=N%C3%B4ng%2C%20l%C3%A2m%20nghi%E1%BB%87p%20v%C3%A0%20th%E1%BB%A7y%20s%E1%BA%A3n.
Hoa. N.X.. Thuy. N.N.N.. Hieu. N.T.. 2015. Current status and trends of mangrove forests and seagrass beds in Nha Trang Bay. Collect. Mar. Stud. 201-211 (in Vietnamese).
Hoang. N.H.. 2017. A Study of the Drivers of Land Use Change in the Ha Tien Plain. The University of Queensland.
Hoang. N.H.. Dargusch. P.. Moss. P.. Aziz. A.A.. 2017. Land-use change and socio-ecological drivers of wetland conversion in Ha Tien Plain. Mekong Delta. Viet Nam. Land use policy 64. 101–113. https://doi.org/10.1016/j.landusepol.2017.02.019
IUCN. 2015. Phong Nha-Ke Bang National Park (Renomination and extention of “Phong Nha-Ke Bang National Park”) - An IUCN evaluation report.
IUCN. 2005. Overview of Wetlands status in Viet Nam following 15 years of Ramsar Convention Implementation. Ha Noi. Viet Nam.
IUCN. 2002. Supplementary Environmental Impact Assessment of the Tuyen Quang Dam: Final Report. PARC Proj. VIE/95/G31&031. Gov. Viet Nam/UNOPS/UNDP/IUCN. Ha Noi.
115

IUCN. n.d. Threats Classification Scheme (Version 3.2) [WWW Document]. IUCN. URL https://www.iucnredlist.org/resources/threat-classification-scheme
Jung. M.. Dahal. P.R.. Butchart. S.H.M.. Donald. P.F.. De Lamo. X.. Lesiv. M.. Kapos. V.. Rondinini. C.. Visconti. P.. 2020. A global map of terrestrial habitat types. Sci. Data 7. 1–8. https://doi.org/10.1038/s41597-020-00599-8
Keith. D.A.. Ferrer-paris. J.R.. Nicholson. E.. Kingsford. R.T.. 2020. IUCN Global Ecosystem Typology 2.0: descriptive profiles for biomes and ecosystem functional groups. IUCN Global Ecosystem Typology 2.0: descriptive profiles for biomes and ecosystem functional groups. https://doi.org/10.2305/iucn.ch.2020.13.en
Kissinger. G.. 2020. Policy responses to direct and underlying drivers of deforestation: Examining rubber and coffee in the central highlands of Viet Nam. Forests 11. 1–25. https://doi.org/10.3390/F11070733
Le. B.T.. 2016. A physio-ecological study of invasive plants in Tram Chim. U Minh Thuong and Mui Ca Mau National Parks and recommendation for control and prevention [Nghiên cứu đặc điểm sinh lý sinh thái các loài thực vật xâm hại tại VQG Tràm Chim. U Minh Thượng. Mũi Cà Mau; và đề xuất các giải pháp kiểm soát và ngăn chặn]. Scientific report. Southern Institute of Ecology. Unpublished. [In Vietnamese]
Le. K.K.. Vo. V.C. & Vu. V.C. (eds). 1969–1976. Common plants in Viet Nam. vols 1–6. Hanoi: Publishing House for Science and Technology.
Leong-Škorničková. J.. Tran. H.D.. Newman. M.F. & Dinh Quang. D.. 2019. Curcuma vitellina. The IUCN Red List of Threatened Species 2019: e.T201889A132688601. https://dx.doi.org/10.2305/IUCN.UK.2019-3.RLTS.T201889A132688601.en. Downloaded on 27 May 2021.
Limbert. H.. Nadler. T.. Avereyanov. L.. Blake. G.. Czernecki. E.. Helvoort. B. van. Thuc. N.T.. 2014. Phong Nha - Ke Bang National Park. Quang Binh. Viet Nam. Renomination Expanding Property and Inscription on Vriteria (VIII). (IX) and (X).
Lin. C.W.. Hsu. T.C.. Luu. H.T.. Nguyen. I.L.P.T.. Yang. T.Y.A. & Li. C.W.. 2021. Revision of Begonia (Begoniaceae) in Bidoup - Nui Ba National Park. Southern Viet Nam. including two new species. Phytotaxa 496(1): 77–89.
Lutaenko. K.A.. Choi. K.-S.. Thai. N.C.. 2011. Coastal Marine Biodiversity of Vietnam : Regional and Local Challenges and Coastal Zone Management for Sustainable Development.
Luu. H.T.. Nguyen. Q.D.. Nguyen. H.C.. Van. H.T.. Nguyen. V.D.. 2020. Arisaema liemiana (Araceae: Arisaemateae). a new species from southern Central of Viet Nam. Phytotaxa 468(2): 214–220.
Luu. H.T.. Pham. H.N.. Nguyen. Q.D.. Nguyen. T.V.. Nguyen. T.M.. Vu. N.L.. 2018. Two new species of Billolivia (Gesneriaceae) from the Langbiang Plateau. Viet Nam. Phytotaxa 385(1): 037–042.
Lưu. H.T.. Trần. H.Đ.. Nguyễn. T.L.. Nguyễn. Q.B & Leong-Škorničková. J.. 2019. Alpinia vietnamica (Zingiberaceae). a new species from central Vietnam. Annales Botanici Fennici 56: 221–226.
Luu. H.T.. Van. H.T.. Ngo. T.T.D.. Nguyen. L.P.. Le. H.P.. 2017. Typhonium thatsonense (Araceae). a New Species from Viet Nam. Novon 25(4): 438-441.
Ly. V.. Nanthavong. K.. Pooma. R.. Luu. H.T.. Nguyen. H.N.. Vu. V.D.. Hoang. V.S.. Khou. E. & Newman. M.F.. 2017. Dipterocarpus hasseltii. The IUCN Red List of Threatened Species 2017: e.T31313A2804014. https://dx.doi.org/10.2305/IUCN.UK.2017-3.RLTS.T31313A2804014.en. Downloaded on 27 May 2021.
Mau. L.D.. Lam. T.H.. Cuong. N.M.. 2015. Present State of Ocean Observations and Service in Vietnam. Tạp chí Khoa học và Công nghệ Biển 15. 309–319. https://doi.org/10.15625/1859-3097/15/4/7376
MARD, 2021. Decision No. 1558/QD-BNN-TCLN. dated on April 13. 2021 by MARD on publishing the forest Status of Vietnam in 2020.
MARD, 2014. Decision no. 829/QD-BNN-TCLN dated 23 April 2014 by MARD approving compensation planting for conversion forest to other purpose projects.
MARD, 2008. Decision 2855/BNN-KHCN dated 17 September. 2008 by MARD announcing the determination of Rubber plant as multi-purpose tree.
MARD, 2008. Circular no. 127/2008/TT-BNN dated 31 December 2008 by MARD provided guidance on how to plant rubber trees on forestland
Middleton. D. & Vermeulen. J.J.. 2016. Ornithoboea emarginata. The IUCN Red List of Threatened Species 2016: e.T201790A89661984. https://dx.doi.org/10.2305/IUCN.UK.2016-1.RLTS.T201790A89661984.en. Downloaded on 27 May 2021.
Middleton. D. J.. Atkins. H.. Luu. H.T.. Nishii. K. & Möller. M.. 2014. Billolivia. a new genus of Gesneriaceae from Vietnam with five new species. Phytotaxa 161(4): 241-269.
Middleton. D.J.. Armstrong. K.. Baba. Y.. Balslev. H.. Chayamarit. K.. Chung. R.C.K.. Conn. B.J.. Fernando. E.S.. Fujikawa. K.. Kiew. R.. Luu. H.T.. Aung. M.M.. Newman. M.F.. Nobuyuki. T.. Tagane. S.. Thomas. D.C.. Tran. T.B.. Utteridge. T.M.A.. van Welzen. P.C.. Widyatmoko. D. & Yahara. T.. 2019. Progress on Southeast Asia’s Flora projects. Gardens' Bulletin Singapore 71 (2): 267–319.
MONRE. 2019. The sixth national report of the United Nations convention on biological diversity. Ha Noi.
MONRE. 2015. Vietnam National Biodiversity Strategy to 2020. Vision to 2030.
MONRE. 2014. Vietnam’s Fifth National Report To The United Nations Convention On Biological Diversity: Reporting period 2009-2013. Ha Noi.
MONRE. 2012. Môi trường nước mặt. in: Báo Cáo Môi Trường Quốc Gia. MONRE. Ha Noi. Viet Nam. pp. 1–117.
Murphy. B.P.. Bowman. D.M.J.S.. 2012. What controls the distribution of tropical forest and savanna? Ecol. Lett. 15. 748–758. https://doi.org/10.1111/j.1461-0248.2012.01771.x
Nguyen. D.T.L. & Thomas. P.. 2004. Conifers in Vietnam. an illustrated field guide. Hanoi: World Publishing House. [In Vietnamese].
Nguyen. H.N.. 2005. Dipterocarps of Vietnam. Hanoi: Agriculture Publishing House. [In Vietnamese].
Nguyen. N.T. 1997. Manual on Research of Biodiversity. Agricultural Publishing House. Hanoi. [In Vietnamese].
Nguyen. T.B. (ed.) et al.. 2005. Checklist of Plant Species of Vietnam. vol. 3. Hanoi: Agriculture Publishing House. [In Vietnamese].
Nguyen. T.B. (ed.) et al.. 2003. Checklist of Plant Species of Vietnam. vol. 2. Hanoi: Agriculture Publishing House. [In Vietnamese].
Nguyen. T.T.. 2001. The orchids of Viet Nam. part 1. Ho Chi Minh City: Agriculture Publishing House. [In Vietnamese].
Nguyen, V.D., Luu, H.T., Nguyen, Q.D., Hetterscheid, W.L.A., 2016. Amorphophallus kienluongensis (Araceae), a new species from the Mekong Delta, Southern Vietnam. Blumea 61: 1–3.
Nuwer. R.. Bell. D.. 2014. Identifying and quantifying the threats to biodiversity in the U Minh peat swamp forests of the Mekong Delta. Viet Nam. Oryx 48. 88–94. https://doi.org/10.1017/S0030605312000865
Ollis. D.J.. Ewart-Smith. J.L.. Day. J.A.. Job. N.M.. Macfarlane. D.M.. Snaddon. C.D.. Sieben. E.J.J.. Dini. J.A.. Mbona. N.. 2015. The development of a classification system for inland aquatic ecosystems in South Africa. Water SA 41. 727–745. https://doi.org/10.4314/wsa.v41i5.16
Olson. D.M.. Dinerstein. E.. 1998. The global 200: priority ecoregions for global conservation. Conserv. Biol. 12. 502–515. https://doi.org/10.1046/j.1523-1739.1998.012003502.x
Pham-Hoang. H.. 1991–1993. An Illustrated Flora of Vietnam. vols 1–3. Mekong Printing. Canada.
Pham-Hoang. H.. 1999–200). An Illustrated Flora of Vietnam. ed. 2. vols 1–3. Tre Publishing House. Viet Nam.
Phan. K. L.. 1998. On the systematic structure of the Vietnamese flora. In: Zhang. A.L. & Wu. S.K. (eds.). Floristic Characteristics and Diversity of East Asian Plants. China Higher Education Press. Beijing & Sprioger-Verlag. New York.
Phan. K.L.. 2010. The Updated Checklist of the Fern Flora of Viet Nam following the classification scheme of A. Smith et al. (2006). J. Fairylake Bot. Gard. 9(3): 1–13.
Phan. K.L.. Pham. VT.. Nguyen. S.K.. Nguyen. T.T.H. & Averyanov. L.V.. 2013. Native Conifers of Vietnam – Updated checklist. J. Ecological Economy 45: 33–50. (In Vietnamese)
Phan. K.L.. Pham. VT.. Phan. K.L.. Regalado. J.. Averyanov. L.V. & Maslin. B.. 2017. Native Conifers of Vietnam – A review. Pakistan J. Bot. 49(5): 2037–2068.
Phung. D.T.K.. 2007. Rural livelihoods in the buffer zone of Lo Go - Xa Mat National Park and their impacts on local forest biodiversity. Swedish Biodiversity Centre.
Phuong. V.T.. Viet Anh. H.. Ngoc Lung. N.. Dinh Sam. D.. Dinh Ky. N.. Viet Lien. T.. 2012. Forest Ecological Stratification in Viet nam. Ha Noi. Viet Nam.
Pócs. T.. 1965. Analyse aire-géographique et ecologique de la flore du Vietnam Nord. Az Egri Tanárképző Főiskola Tudományos Közleményei 3: 395–452.
Prime Minister. 2009. Plan- Decision 750/QD-TTg. on June 3. 2009 by the Prime Minister approving the rubber development master plan to 2015 with vision to 2020
Regalado. Jr.. J.C.. Nguyen. T.H.. Phan K.L.. Averyanov. L. & Harder. D.K.. 2005. New insights into the diversity of the Flora of Viet Nam. Biol. Skr. 55: 189–197.
Rhind. S.G.. 2012. Vietnam’s vanishing wildlife: the new threat of climate change. Wildl. Clim. Chang. 137–143. https://doi.org/10.7882/fs.2012.020.
Rundel. P.W.. 1999. Forest habitats and flora in Lao PDR. Cambodia and Vietnam. Conservation Priorities in Indochina – WWF Hanoi.
Schmid. M. 1974. Vegetation du Vietnam: le Massif Sud-Annamitique et les regions limitrophes. Mém. O.R.S. T.O.M. 74: 1-243.
Sunderland. T.. Sayer. J.. Hoang. M.-H.. 2013. Evidence-based Conservation: Lessons from the Lower Mekong. CIFOR. Bogor. Indoneisa.
Takhtajan. A. 1986. Floristic Regions of the World. Univ. California Press. Berkeley. Los Angeles. London.
Tan. D.T.. Thu. P.Q.. Dell. B.. 2012. Invasive plant species in the national parks of Viet Nam. Forests 3. 997–1016. https://doi.org/10.3390/f3040997
Tân. T.V.. Tâm. V.T.. Tuyết. Đ.. Khiển. N.X.. Ngọc. N.L.. Tuỳ. P.K.. Kế. T.D.. Thắng. Đ.V.. Hà. P.V.. 2005. Phát triển bền vững các vùng đá vôi ở Việt Nam. Hà Nội. Việt Nam.
Thanh. N.V.. Tuan. V.M.. Dan. N.A.. Trung. N.V.. Zheng. J.. 2013. Overview of Estuary Research and Waterway Engineering in Viet Nam. Proc. 35Th Iahr World Congr. Vols Iii Iv.
Thai. V.T.. 1999. The Tropical Forest Ecosystems in Vietnam. Science and Technic Publishing House. Ho Chi Minh City. [In Vietnamese].
The Government. n.d. Socialist Republic of Viet Nam [WWW Document].
ASSESSING THE BIODIVERSITY IN VIET NAM – ANALYSIS OF IMPACTS FROM ECONOMIC SECTORS 117

Copyright Credit © Copyright owner / WWF-
The orientation for the rubber development. available at: http://agro.gov.vn/vn/tID9162_Dinh-huong-phat-trien-xuat-khau-cao-su-Viet-Nam-.html.
The World Bank. 2019. Country Forest Note: Viet Nam. The World Bank.
Thinh. P.T.. 2003. Findings from wetlands classification and inventory of wetlands/aquatic ecosystems in the Mekong basin Viet Nam. Mekong River Comm. Natl. Mekong Committee. Environ. Progr. 112pp.
Thomas. P.. Yang. Y.. Farjon. A.. Nguyen. D. & Liao. W.. 2020. Glyptostrobus pensilis (amended version of 2011 assessment). The IUCN Red List of Threatened Species 2020: e.T32312A177795446. https://dx.doi.org/10.2305/IUCN.UK.2020-3.RLTS.T32312A177795446.en. Downloaded on 27 May 2021.
Thuy. T.N.. 2017. Savanna dynamics in seasonal tropical forests: how fire. grass and drought shape deciduous dipterocarp forests in continental Southeast Asia. PhD thesis. The University of Melbourne.
Tong Cuc Thuy San. 2021. Kết quả hoạt động quản lý hệ thống khu bảo tồn biển Việt Nam giai đoạn 2010-2020. nhiệm vụ giai đoạn 2021-2030 [WWW Document]. URL https://tongcucthuysan.gov.vn/vi-vn/bảo-tồn-ptnl-thủy-sản/bảo-tồn-biển/doc-tin/015587/2021-01-29/ket-qua-hoat-dong-quan-ly-he-thong-khu-bao-ton-bien-viet-nam-giai-doan-2010-2020-nhiem-vu-giai-doan-2021-2030 (accessed 5.29.21).
To X.P. and Tran H.N.. 2014. Rubber Expansion and Forest protection in Viet Nam.
Tran. H.D. & Leong-Škorničková. J.. 2019. Newmania sontraensis. The IUCN Red List of Threatened Species 2019: e.T131724810A131724836. https://dx.doi.org/10.2305/IUCN.UK.2019-3.RLTS.T131724810A131724836.en. Downloaded on 27 May 2021.
Tran. T. Le. C.K.. et al.. 2003. The invasion of Mimosa pigra L. in the Mekong Delta [Sự xâm lấn của cây trinh nữ đầm lầy (Mimosa pigra L.) ở đồng bằng sông Cửu Long]. Proceedings of the national workshop on management and prevention of alien species: 65-74. Hanoi. 7-8 October 2003. [In Vietnamese].
Tran T.T.H et al.. 2018. Vietnam Rubber Industry- Current status and sustainable development solution.
Tran. T.. Nguyen. T.L.T. & Nguyen. P.N.. 2008. Inventory and assessment of impacts by alien plants in several national parks [Điều tra đánh giá tác hại của các loài thực vật ngoại lai tại một số Vườn quốc gia của Việt Nam]. Scientific report. Vietnam National University. Ho Chi Minh City. [In Vietnamese].
Tuấn. V.S.. 2016. Bảo tồn đa dạng sinh học biển nhằm phát triển kinh tế xanh ở tỉnh Khánh Hòa. Việt Nam. Tuyển Tập Nghiên Cứu Biển 22. 172–179.
Tuyet. D.. 2010. Characteristics of Karst Ecosystems of Vietnam and Their Vulnerability to Human Impact. Acta Geol. Sin. - English Ed. 75. 325–329. https://doi.org/10.1111/j.1755-6724.2001.tb00539.x
VCB. 2020. Natural Rubber Industry in Vietnam. Vietcombank Report 2020.
Veettil. B.K.. Ward. R.D.. Quang. N.X.. Trang. N.T.T.. Giang. T.H.. 2019. Mangroves of Vietnam: Historical development. current state of research and future threats. Estuar. Coast. Shelf Sci. 218. 212–236. https://doi.org/10.1016/j.ecss.2018.12.021
Vietnam’s Rubber export. available at: https://dangcongsan.vn/kinh-te/xuat-khau-cao-su-nam-2020-uoc-dat-2-38-ty-usd-572684.html
Vietnam Ministry of Forestry. 1971–1988. Vietnam forest trees. vols 1–7. Hanoi: Agriculture Publishing House. [In Vietnamese].
Vietnam news. 2013: Rubber bounces growing deforestation concern. Available at https://vietnamnews.vn/opinion/245593/rubber-bounces-a-growing-deforestation-concern.html.
Vietnam National University. Ha Noi. 2001. Checklist of Plant Species of Vietnam. vol. 1. Hanoi: Agriculture Publishing House. [In Vietnamese]
Vo. Q.. 1995. Conservation of flora. fauna. and endangered species in Vietnam. BIOTROP Special Publ. 55: 139-146.
Vu. V.D. (ed.). 1996. Vietnam Forest Trees. Hanoi: Agriculture Publishing House.
Walter. H. Box. E.. 1976. Global classification of natural terrestrial ecosystems. Vegetatio 32. 75–81. https://doi.org/10.1007/BF02111901
WWF, 2013. Ecosystems in the Greater Mekong: Past trends, current status, possible futures.
ANNEXES
ASSESSING THE BIODIVERSITY IN VIET NAM – ANALYSIS OF IMPACTS FROM ECONOMIC SECTORS 119

ANNEX 1 The occurrence of threats and biome types in protected areas of Viet Nam Noted: The list of protected area is based on the Decision No. 1976
No. PA by Decision 1976 Province A1 A2 A3 A4 A5 A6 A7 A8 A9 A10 B1 B2 B3 B4 B5 B6 B7 B8 B9 B10 B11 B12B13 B14 B15 B16
1 Ba Bể Bac Kan 1 1 1 1 1 1 1 1 12 Ba Vì Hà Nội 1 1 13 Bạch Mã Thua Thien Hue, Quang Nam 1 1 1 1 1 1 14 Bái Tử Long Quảng Ninh 1 1 1 1 1 15 Bến En Thanh Hoá 1 16 Bidoup-Núi Bà Lâm Đồng 1 1 1 1 17 Bù Gia Mập Bình Phước 1 18 Cát Bà Hai Phong, Quang Ninh 1 1 1 1 1 1 1 19 Cát Tiên Lâm Đồng, Dong Nai 1 1 1 1 110 Chư Mom Ray Kon Tum 1 1 1 1 1 1 1 111 Chu Yang Sin Đắk Lắk 1 112 Côn Đảo Bà Rịa-Vũng Tàu 1 1 1 113 Cúc Phương Ninh Binh, Hoa Binh, Thanh Hoa 1 114 Du Già Hà Giang 115 Hoàng Liên Lao Cai, Lai Châu 1 1 1 1 116 Kon Ka Kinh Gia Lai 1 1 1 1 1 117 Lò Gò Xa Mát National Park Tây Ninh 1 1 1 1 118 Mũi Cà Mau Cà Mau 1 1 1 1 1 119 Núi Chúa National Park Ninh Thuận 1 1 1 120 Phia Oac Mountain – Phia Den Cao Bằng 121 Phong Nha Kẻ Bàng Quảng Bình 1 1 1 1 1 1 1 1 1 1 122 Phú Quốc Kiên Giang 1 1 1 1 1 1 1 1 123 Phước Bình Ninh Thuận 124 Pù Mát National Park Nghệ An 1 1 1 125 Tà Đùng Đắk Nông 1 126 Tam Đảo Vinh Phuc, Tuyen Quang, Thai Nguyen 1 1 1 1 1 1 127 Thất Sơn An Giang28 Tràm Chim National Park Đồng Tháp 1 1 1 1 129 U Minh Ha National Park Cà Mau 1 1 1 130 U Minh Thuong National Park Kiên Giang 1 1 1 131 Vũ Quang Hà Tĩnh 1 1 132 Xuân Sơn Phú Thọ 1 133 Xuân Thuỷ Nam Định 1 1 1 1 134 Yok Don Đắk Lắk 1 1 1 1 1 1 1 1
1 Sông Thanh Quảng Nam 1 1 1 1 12 An Toàn Binh Dinh 13 Bà Nà – Núi Chúa Da Nang, Quang Nam 1 1 1 1 1 14 Bắc Hướng Hoá Quảng Trị 1 1 1 1 15 Bắc Mê Hà Giang 1 1 1 16 Bát Đại Sơn Hà Giang 1 1 17 Bát Xát Lao Cai8 Bình Châu - Phước Bửu Bà Rịa-Vũng Tàu 1 1 1 19 Chàm Chu Tuyên Quang 110 Chí Sán
I. National Park
II. Nature Reserve
11 Copia Sơn La 1 1 112 Dakrong Quảng Trị 1 1 113 Đồng Sơn – Kỳ Thượng Quảng Ninh 114 Ea Sô Đắk Lắk 1 1 1 1 115 Hang Kia – Pà Cò Hoà Bình 1 1 1 116 Hoàng Liên Văn Bàn Lao Cai 1 1 1 1 1 117 Hòn Bà Khánh Hoà 1 118 Hữu Liên Lạng Sơn 119 Kẻ Gỗ Hà Tĩnh 1 120 Kim Hỷ Bắc Kạn 1 1 121 Kon Chư Răng Gia Lai 1 1 1 1 1 122 Krong Trai Phú Yên 1 1 1 1 123 Láng Sen Long An 1 1 1 1 1 1 1 124 Lung Ngọc Hoàng Hậu Giang 1 1 125 Mường La Son La 1 1 126 Mường Nhé Điện Biên 1 1 127 Na Hang Tuyên Quang 1 1 128 Nà Hẩu Yên Bái 1 1 1 129 Nam Kar Đắk Lắk 130 Nam Nung Đắk Nông 1 1 1 131 Ngọc Linh Kon Tum 1 1 1 1 132 Ngọc Sơn – Ngổ Luông Hoà Bình 1 133 Núi Ông Bình Thuận 1 134 Phong Điền Thừa Thiên Huế 1 1 1 1 135 Phong Quang Hà Giang 1 136 Phu Canh Hoà Bình 1 1 1 137 Pù Hoạt Nghệ An 138 Pù Hu Thanh Hoá 1 1 1 1 139 Pù Huống Nghệ An 1 140 Pù Luông Thanh Hoá 1 141 Sao la - Thừa Thiên Huế 1 1 142 Sốp Cộp Sơn La 1 143 Tà Kou Bình Thuận 1 1 1 144 Tà Xùa Sơn La 1 145 Tây Côn Lĩnh Hà Giang 1 1 146 Tây Yên Tử Bắc Giang 1 1 147 Thần Sa - Phượng Hoàng Thái Nguyên 1 1 148 Thượng Tiến Hoà Bình 1 149 Tiền Hải Thái Bình 1 1 150 Vân Long Ninh Bình 1 1 1 1 1 1 151 Xuân Liên Thanh Hoá 1 1 152 Xuân Nha Sơn La 153 Bà Nà – Núi Chúa Quảng Nam54 Bán đảo Sơn trà Đà Nẵng 1 1 155 Mường Tè Lai Châu
11 Copia Sơn La 1 1 112 Dakrong Quảng Trị 1 1 113 Đồng Sơn – Kỳ Thượng Quảng Ninh 114 Ea Sô Đắk Lắk 1 1 1 1 115 Hang Kia – Pà Cò Hoà Bình 1 1 1 116 Hoàng Liên Văn Bàn Lao Cai 1 1 1 1 1 117 Hòn Bà Khánh Hoà 1 118 Hữu Liên Lạng Sơn 119 Kẻ Gỗ Hà Tĩnh 1 120 Kim Hỷ Bắc Kạn 1 1 121 Kon Chư Răng Gia Lai 1 1 1 1 1 122 Krong Trai Phú Yên 1 1 1 1 123 Láng Sen Long An 1 1 1 1 1 1 1 124 Lung Ngọc Hoàng Hậu Giang 1 1 125 Mường La Son La 1 1 126 Mường Nhé Điện Biên 1 1 127 Na Hang Tuyên Quang 1 1 128 Nà Hẩu Yên Bái 1 1 1 129 Nam Kar Đắk Lắk 130 Nam Nung Đắk Nông 1 1 1 131 Ngọc Linh Kon Tum 1 1 1 1 132 Ngọc Sơn – Ngổ Luông Hoà Bình 1 133 Núi Ông Bình Thuận 1 134 Phong Điền Thừa Thiên Huế 1 1 1 1 135 Phong Quang Hà Giang 1 136 Phu Canh Hoà Bình 1 1 1 137 Pù Hoạt Nghệ An 138 Pù Hu Thanh Hoá 1 1 1 1 139 Pù Huống Nghệ An 1 140 Pù Luông Thanh Hoá 1 141 Sao la - Thừa Thiên Huế 1 1 142 Sốp Cộp Sơn La 1 143 Tà Kou Bình Thuận 1 1 1 144 Tà Xùa Sơn La 1 145 Tây Côn Lĩnh Hà Giang 1 1 146 Tây Yên Tử Bắc Giang 1 1 147 Thần Sa - Phượng Hoàng Thái Nguyên 1 1 148 Thượng Tiến Hoà Bình 1 149 Tiền Hải Thái Bình 1 1 150 Vân Long Ninh Bình 1 1 1 1 1 1 151 Xuân Liên Thanh Hoá 1 1 152 Xuân Nha Sơn La 153 Bà Nà – Núi Chúa Quảng Nam54 Bán đảo Sơn trà Đà Nẵng 1 1 155 Mường Tè Lai Châu
A1 Residential_n_commercial_developmentA2 Agriculture_n_aquacultureA3 Energy_production_n_miningA4 Transportation_n_service corridorsA5 Biological_resource_useA6 Human_intrusion_n_disturbanceA7 Natural_system_modificationsA8 Invasive_n_other_problematic_species_n_genesA9 PollutionA10 Climate_change_n_severe_weatherB1 Terrestrial_T1_Tropical_subtropical_forestsB2 Terrestrial_T2_Temperate_boreal_forests_woodlandsB3 Terrestrial_T4_Savannas_n_grasslandsB4 Subterranean_S1_Subterranean_lithic_systemsB5 Subterranean_Freshwater_SF1_Subterranean_freshwatersB6 Subterranean_marine_SM1_Subterranean_tidal_systemsB7 Freshwater_terrestrial_TF1_Paulustrine_wetlandsB8 Freshwater_F1_Rivers_n_streamsB9 Freshwater_F2_LakesB10 Freshwater-marine_FM1_Semi-confined_transitional_watersB11 Marine_M1_Marine_shelfsB12 Marine_M2_Pelagic Ocean watersB13 Marine_M3_Deep_sea_floorsB14 Marine_terrestrial_MT1_Shoreline_sytemsB15 Marine_terrestrial_MT2_Supralittoral_coastal_systemsB16 Marine_freshwater_terrestrial_MFT1_Brackish_tidal_systems
ASSESSING THE BIODIVERSITY IN VIET NAM – ANALYSIS OF IMPACTS FROM ECONOMIC SECTORS 121

ANNEX 2List of documents for literature review related to Appendix 1 information.
1. http://www.unesco.org/new/en/natural-sciences/environment/ecological-sciences/biosphere-reserves/asia-and-the-pacific/vietnam/can-gio-mangrove
2. https://www.mdpi.com/2076-3417/10/12/4058/htm3. https://thiennhienviet.org.vn/sourcebook/source_book/South%20east/SB%20Can%20Gio.htm4. https://www.thiennhien.net/2020/05/03/rung-ngap-man-can-gio-co-the-gap-rui-ro/5. https://www.sciencedirect.com/science/article/abs/pii/S00489697203054536. https://www.sciencedirect.com/science/article/abs/pii/S00456535183227197. https://www.sciencedirect.com/science/article/abs/pii/S02697491183361828. http://www.mangrove.or.jp/img/publications/book_pdf/TR06-Technical_6.pdf9. http://www.unesco.org/new/en/natural-sciences/environment/ecological-sciences/biosphere-reserves/asia-and-
the-pacific/vietnam/dong-nai10. https://iopscience.iop.org/article/10.1088/1755-1315/316/1/012009/pdf11. http://www.namcattien.org/conservation.htm12. http://www.unesco.org/new/en/natural-sciences/environment/ecological-sciences/biosphere-reserves/asia-and-
the-pacific/vietnam/cat-ba/13. http://catba.net.vn/ecosystem/?lang=en14. https://www.researchgate.net/publication/319416790_Monitoring_Mangrove_Forest_changes_in_Cat_Ba_
Biosphere_Reserve_using_ALOS_PALSAR_Imagery_and_a_GIS-based_Support_Vector_Machine_Algorithm15. https://www.thiennhienviet.org.vn/sourcebook/pdf/3%20Red%20River%20Delta/Cat%20Ba.pdf16. https://www.tandfonline.com/doi/abs/10.1080/09669582.2015.104551417. http://taichinhvietnam.net.vn/sieu-du-an-3-ty-usd-cua-sun-group-de-doa-dao-cat-ba-d1721.html18. https://tuoitre.vn/vuon-quoc-gia-cat-ba-nham-nho-vi-bi-xam-hai-2018042508043038.htm19. https://proceedings.systemdynamics.org/2010/proceed/papers/P1312.pdf20. https://core.ac.uk/download/pdf/38095518.pdf21. https://tuoitre.vn/hai-phong-quyet-xu-ly-dut-diem-cac-sai-pham-tai-cat-ba-20201218144119817.htm22. http://tapchimoitruong.vn/moi-truong-va-cong-dong-84/Ðánh-giá-rủi-ro-sinh-thái-tại-xã-Phù-Long-và-Khu-dự-trữ-
sinh-quyển-Cát-Bà-2130523. http://www.unesco.org/new/en/natural-sciences/environment/ecological-sciences/biosphere-reserves/asia-and-
the-pacific/vietnam/red-river-delta24. https://en.unesco.org/silkroad/silk-road-themes/biosphere-reserve/red-river-delta"25. http://www.unesco.org/new/en/natural-sciences/environment/ecological-sciences/biosphere-reserves/asia-and-
the-pacific/vietnam/kien-giang26. https://skhcn.kiengiang.gov.vn/Trang/TinTuc/ChiTiet.aspx?nid=1596&chuyenmuc=20427. http://mabvietnam.net/khu-du-tru-sinh-quyen-the-gioi-kien-giang28. http://duanvesinhmoitruong-tphcm.vn/wp-content/uploads/2016/11/Project_Book-VN-PDF-web.pdf29. http://tapchimoitruong.vn/dien-dan--trao-doi-21/Bảo-tồn-và-phát-huy-các-giá-trị-đa-dạng-sinh-h%E1%BB%8Dc-
tại-Khu-dự-trữ-sinh-quyển-ven-biển-và-biển-đảo-Kiên-Giang-1454830. https://skhcn.kiengiang.gov.vn/Trang/TinTuc/ChiTiet.aspx?nid=1596&chuyenmuc=20431. https://daln.gov.vn/en/drastic-conservation-and-development-of-kien-giang-biosphere-reserve.70.enews32. http://www.unesco.org/new/en/natural-sciences/environment/ecological-sciences/biosphere-reserves/asia-and-
the-pacific/vietnam/western-nghe-an33. http://sinhquyennghean.vn/khu-du-tru-sinh-quyen-1-8-2707.html34. http://www.unesco.org/new/en/natural-sciences/environment/ecological-sciences/biosphere-reserves/asia-and-
the-pacific/vietnam/mui-ca-mau/35. http://icem.com.au/documents/biodiversity/wetlands%20wshop/Day%20One%20-%202%20Feb%202012/7b.%20
Adapt_Vietnam%20(Ca%20Mau).pdf36. http://www.unesco.org/new/en/natural-sciences/environment/ecological-sciences/biosphere-reserves/asia-and-
the-pacific/vietnam/cu-lao-cham-hoi-an37. https://vietnamnews.vn/environment/467790/tourism-boom-threatens-cham-island-ecosystems.html38. https://www.sciencedirect.com/science/article/abs/pii/S0308597X1730270139. https://tuoitre.vn/rung-du-tru-sinh-quyen-the-gioi-cu-lao-cham-bi-ui-tho-bao-20180224095435028.htm
40. http://khusinhquyenculaocham.com.vn/index.php/hoat-dong/giam-sat-danh-gia/1345-luoi-long-loai-hinh-danh-bat-huy-diet-dang-de-doa-den-he-sinh-thai-vung-bo
41. https://pledge4wildlife.org/en/poaching-at-cu-lao-cham-reserve-park/42. https://greenviet.org/chuong-trinh/cac-du-an-nghien-cuu-khoa-hoc/tai-nguyen-thuc-vat-da-dang-cua-cu-lao-
cham-gap-de-doa-truoc-suc-ep-phat-trien/43. http://vjs.ac.vn/index.php/vjbio/article/view/1008244. http://khusinhquyenculaocham.com.vn/index.php/hoat-dong/giam-sat-danh-gia/1269-tieu-diet-ke-thu-cua-san-
ho-tai-cu-lao-cham45. https://vietnamnet.vn/en/sci-tech-environment/seabed-sediment-in-central-vietnam-under-threat-535703.html46. http://truyenhinhthanhhoa.vn/tin-tuc/xa-hoi/201806/quang-nam-rac-thai-de-doa-khu-du-tru-sinh-quyen-the-gioi-
cu-lao-cham-8127626/47. https://baotainguyenmoitruong.vn/tram-tich-long-bien-mien-trung-dang-bi-de-doa-237678.html48. http://www.unesco.org/new/en/natural-sciences/environment/ecological-sciences/biosphere-reserves/asia-and-
the-pacific/vietnam/langbiang49. http://extwprlegs1.fao.org/docs/pdf/vie98327.pdf50. https://www.marinemammalhabitat.org/portfolio-item/con-dao/51. http://extwprlegs1.fao.org/docs/pdf/vie98327.pdf52. https://thiennhienviet.org.vn/sourcebook/source_book/Red%20River%20Delta/SB%20Dao%20Bach%20Long%20
Vi.htm53. https://whc.unesco.org/en/list/672/54. https://whc.unesco.org/en/soc/390155. http://trangandanhthang.vn/tin-tuc/quan-the-danh-thang-trang-an-kho-bau-ve-da-dang-sinh-hoc-106356. https://thiennhienviet.org.vn/sourcebook/pdf/Tay%20nguyen/Earal.pdf57. https://thiennhienviet.org.vn/sourcebook/pdf/DB%20Song%20cuu%20long/Phu%20Quoc%20-%20season.pdf58. https://nld.com.vn/kinh-te/o-nhiem-de-doa-khu-bao-ton-bien-phu-quoc-20170707221039324.htm"59. http://tapchimoitruong.vn/moi-truong-va-cong-dong-84/Bảo-vệ-giá-trị-đa-dạng-sinh-h%E1%BB%8Dc-của--Khu-
bảo-tồn-thiên-nhiên-rừng-sến-Tam-Quy-2075960. https://thiennhienviet.org.vn/sourcebook/pdf/Bac%20Trung%20Bo/Tam%20Quy.pdf61. https://thiennhienviet.org.vn/sourcebook/pdf/Tay%20nguyen/Trap%20Kso.pdf62. https://dantocmiennui.vn/de-xuat-mo-rong-va-nang-hang-cap-quoc-gia-khu-bao-ton-loai-va-sinh-vat-canh-vuon-
cao-vit-trung-khanh/172936.html63. https://whc.unesco.org/en/tentativelists/6262/64. https://rsis.ramsar.org/ris/1938?language=en65. http://static1.1.sqspcdn.com/static/f/1200343/26921539/1458250826810/Vietnamese_J_Primatol_Vol_1-5_2011.
pdf?token=Byx6rwRIVEM27a3TwDDx7jtxKRg%3D#page=5666. http://mekonginfo.org/assets/midocs/0002772-environment-report-on-a-diagnostic-survey-of-conservation-and-
development-opportunities-in-khang-ninh-commune-in-the-buffer-zone-of-ba-be-national-park.pdf67. https://www.jstage.jst.go.jp/article/tropics/24/4/24_153/_pdf/-char/ja68. https://asean.chm-cbd.net/ba-be-national-park-home-viet-nams-largest-and-highest-natural-lake69. http://www.babenationalpark.com.vn/en/introduction/ba-be-national-park.aspx70. https://rsis.ramsar.org/RISapp/files/RISrep/VN1938RIS.pdf?language=en71. https://vietnamnews.vn/opinion/209551/ba-be-lake-under-threat-from-ore-exploitation-and-deforestation.html72. http://www.vinanren.vn/default.aspx?page=tmv_chitiettin&cat=news&zoneid=58&lang=en&contentid=41273. https://vuonquocgiabavi.com.vn/tong-quan/74. https://tuoitre.vn/loi-ich-kinh-te-de-doa-huy-diet-rung-1060852.htm75. http://www.kiemlam.org.vn/Download.aspx/CF6F8EBB762E481AA533EE4F3DEB128F/1/Bach_ma.pdf76. https://vnexpress.net/chuyen-gia-lo-he-sinh-thai-vuon-quoc-gia-bach-ma-bi-pha-huy-3823582.html77. https://www.cifor.org/publications/pdf_files/WPapers/WP240Pham.pdf78. http://tapchikhcnln.vnuf.edu.vn/documents/5898355/14372365/12.NguyenVanMinh.pdf79. http://cand.com.vn/dieu-tra-theo-don-ban-doc/Lam-tac-lien-tuc-xam-hai-Vuon-Quoc-gia-Bach-Ma-376261/80. http://vuonquocgiabaitulong.vn/Kham-pha-su-da-dang-sinh-thai-Vuon-Quoc-gia-Bai-Tu-Long/dta/vi/636/81. http://benennp.com.vn/web/trang-chu/du-lich-sinh-thai82. https://pubs.iied.org/sites/default/files/pdfs/migrate/G03050.pdf?83. https://www.cambridge.org/core/journals/environmental-conservation/article/abs/socioeconomic-profiles-
of-timber-consumers-in-the-buffer-zones-of-bu-gia-map-national-park-vietnam/154271336B4214FA2F657AF478736774
ASSESSING THE BIODIVERSITY IN VIET NAM – ANALYSIS OF IMPACTS FROM ECONOMIC SECTORS 123

84. http://vuonquocgiabugiamap.vn/vi/news/Gioi-thieu/Gioi-thieu-ve-Vuon-quoc-gia-Bu-Gia-Map-274/85. http://www.unesco.org/new/en/natural-sciences/environment/ecological-sciences/biosphere-reserves/asia-and-
the-pacific/vietnam/cat-ba/86. http://catba.net.vn/ecosystem/?lang=en87. https://www.researchgate.net/publication/319416790_Monitoring_Mangrove_Forest_changes_in_Cat_Ba_
Biosphere_Reserve_using_ALOS_PALSAR_Imagery_and_a_GIS-based_Support_Vector_Machine_Algorithm88. https://www.thiennhienviet.org.vn/sourcebook/pdf/3%20Red%20River%20Delta/Cat%20Ba.pdf89. https://www.tandfonline.com/doi/abs/10.1080/09669582.2015.104551490. http://taichinhvietnam.net.vn/sieu-du-an-3-ty-usd-cua-sun-group-de-doa-dao-cat-ba-d1721.html91. https://tuoitre.vn/vuon-quoc-gia-cat-ba-nham-nho-vi-bi-xam-hai-2018042508043038.htm92. https://proceedings.systemdynamics.org/2010/proceed/papers/P1312.pdf93. https://core.ac.uk/download/pdf/38095518.pdf94. https://tuoitre.vn/hai-phong-quyet-xu-ly-dut-diem-cac-sai-pham-tai-cat-ba-20201218144119817.htm95. http://tapchimoitruong.vn/moi-truong-va-cong-dong-84/Ðánh-giá-rủi-ro-sinh-thái-tại-xã-Phù-Long-và-Khu-dự-trữ-
sinh-quyển-Cát-Bà-2130596. https://whc.unesco.org/en/tentativelists/5070/97. https://moitruongdulich.vn/index.php/item/265698. https://nhandan.com.vn/thoi-su-phap-luat/Nạn-khai-thác-cát-đe-d%E1%BB%8Da-Vườn-quốc-gia-Cát-
Tiên-539010/99. https://baotainguyenmoitruong.vn/cat-tac-xam-hai-vuon-quoc-gia-cat-tien-235212.html100.https://rsis.ramsar.org/ris/1499101.https://vran.vn/en/about-bau-sau-wetlands-and-seasonal-floodplain/102.https://rsis.ramsar.org/RISapp/files/RISrep/VN1499RIS.pdf103.http://vnppa.org/thuy-dien-bua-vay-vuon-quoc-gia-cat-tien.html104.https://asean.chm-cbd.net/protected-areas/chu-mom-ray-national-park105.https://asean.chm-cbd.net/chu-mom-ray-national-park-legendary-paradise-kon-tum106.https://thiennhienviet.org.vn/sourcebook/source_book/Central%20Highlands/SB%20Chu%20Mom%20Ray.htm107.https://www.iucn.org/content/poachers-lose-motorbikes-chu-mom-ray-national-park-vietnam108.https://thiennhienviet.org.vn/sourcebook/source_book/Central%20Highlands/SB%20Chu%20Yang%20Sin.htm109.https://icem.com.au/documents/envassessment/chu_yang_sin/cysnp_final%20report_vn.pdf"110.http://www.bariavungtautourism.com.vn/cac-tour-du-lich/du-lich-sinh-thai/w4399-vuon-quoc-gia-con-dao.htm111.https://www.thiennhien.net/2014/11/02/vuon-quoc-gia-con-dao-la-khu-ramsar-thu-6-cua-viet-nam/112.http://www.condaopark.com.vn/vn/cac-moi-de-doa-doi-voi-rua-bien-con-dao.html113.http://english.vietnamnet.vn/fms/environment/190836/illegal-logging-destroying-cuc-phuong-national-park.html114.https://tuoitre.vn/thanh-lap-vuon-quoc-gia-du-gia-cao-nguyen-da-dong-van-955275.htm115.https://vietnamtourism.gov.vn/english/index.php/items/8974116.https://www.vietnamplus.vn/lap-vuon-quoc-gia-du-giacao-nguyen-da-dong-van-rong-15000ha/339123.vnp117.https://asean.chm-cbd.net/hoang-lien-sa-pa-national-park-site-fansipan-viet-nams-highest-point118.https://thiennhienviet.org.vn/sourcebook/pdf/2%20north%20east/Hoang%20Lien.pdf119.https://www.biotaxa.org/Phytotaxa/article/view/phytotaxa.423.1.4120.https://www.thesaigontimes.vn/105129/Lo-ngai-cap-treo-se-la-tham-hoa-cho-Fansipan.html121.https://vqghl.laocai.gov.vn/Default.aspx?sid=1258&pageid=28490&catid=45795&id=472001&catname=&title=xa-
hoang-lien-quyet-tam-quyet-liet-thuc-hien-thao-do-leu-lan-say-thao-qua-trong-rung-dac-dung122.https://vqghl.laocai.gov.vn/1258/28490/45796/537631/quan-ly-bvr/tao-dong-thuan-xoa-bo-trong-cay-thao-qua-
duoi-tan-rung-tu-nhien123.https://vqghl.laocai.gov.vn/1258/28490/45798/228077/pcccr/dap-tat-hoan-toan-chay-rung-vuon-quoc-gia-hoang-
lien124.https://vietnamnews.vn/environment/249821/national-park-suffers-from-fires-logging.html125.https://www.thiennhien.net/2021/04/30/lam-ro-viec-khai-thac-rung-trai-phep-tai-vuon-quoc-gia-hoang-lien/126.https://asean.chm-cbd.net/protected-areas/kon-ka-kinh-national-park127.https://thiennhienviet.org.vn/sourcebook/report_pdf/report11.pdf128.https://tud.qucosa.de/api/qucosa%3A30068/attachment/ATT-0/129.https://www.thiennhienviet.org.vn/sourcebook/pdf/Tay%20nguyen/Kon%20Ka%20Kinh.pdf130.https://thiennhienviet.org.vn/sourcebook/pdf/Tay%20nguyen/Lo%20Go%20-%20Xa%20Mat.pdf131.http://vci.vnu.edu.vn/upload/15022/pdf/5763859f7f8b9a5e3d8b4664.pdf132.https://rsis.ramsar.org/ris/2088
133.https://www.thiennhienviet.org.vn/sourcebook/pdf/DB%20Song%20cuu%20long/Mui%20Ca%20Mau.pdf134.https://link.springer.com/article/10.1007/s11852-017-0513-9135.https://www.sciencedirect.com/science/article/abs/pii/S096456911830156X136.http://www.unesco.org/new/en/natural-sciences/environment/ecological-sciences/biosphere-reserves/asia-and-
the-pacific/vietnam/mui-ca-mau137.https://baotainguyenmoitruong.vn/vuon-quoc-gia-nui-chua-khu-bao-ton-da-dang-sinh-hoc-232690.html138.http://caobanggeopark.com/en/news/geoheritage/phia-oac-phia-den-national-park-40.html139.https://js.vnu.edu.vn/EES/article/view/4367/3958140.https://whc.unesco.org/en/soc/3901141.https://thiennhienviet.org.vn/sourcebook/source_book/Mekong%20Delta/SB%20Phu%20Quoc.htm142.https://vietnamnews.vn/environment/277594/pollution-harming-phu-quoc-island-environment.html143.https://vietnamnews.vn/society/276355/phu-quoc-works-to-curb-illegal-logging.html144.http://wildlifeatrisk.org/wp-content/uploads/2019/01/books.P8.-PQ-mammal-Reptile-amphibians-guide.pdf145.http://iebr.ac.vn/database/HNTQ6/832.pdf146.https://sj.ctu.edu.vn/ql/docgia/tacgia-12422/baibao-5614.html147.http://www.vqgphuocbinh.org.vn/Noidung/145_Noidunglienquan.aspx148.https://www.thiennhienviet.org.vn/sourcebook/pdf/Bac%20Trung%20Bo/Pu%20Mat.pdf149.http://www.vjst.net/index.php/vjbio/article/view/15122150.https://daknonggeopark.com/vi/vuon-quoc-gia-ta-dung/151.http://www.kiemlam.org.vn/Download.aspx/5AEAAC70606F4883AF9E1F58BC78E917/1/Tam_dao.pdf152.https://www.mdpi.com/2072-4292/2/5/1249/htm153.https://www.sciencedirect.com/science/article/pii/S2351989416300749154.http://cerec.org.vn/userfiles/file/Protected%20area/Tam%20Dao%20NP/Rapid%20assessment%20of%20
mammals_English.pdf155.https://vietnamnet.vn/en/sci-tech-environment/tam-dao-national-park-pine-trees-illegally-exploited-601879.html156.http://datazone.birdlife.org/index.php/site/factsheet/tam-dao-iba-vietnam/text157.http://tongcuclamnghiep.gov.vn/LamNghiep/Index/diem-tin-ngay-20072015-2608158.https://link.springer.com/referenceworkentry/10.1007%2F978-94-007-4001-3_41159.https://www.wwf.or.th/?107460/Landscape-Management-and-Sustainable-Livelihoods-at-Tram-Chim-National-
Park-Project160.https://nhandan.com.vn/vi-moi-truong-xanh/bat-hoa-giua-nuoc-va-lua-o-vuon-quoc-gia-tram-chim-209319161.http://www.baodongthap.vn/xa-hoi/xay-ra-chay-o-vuon-quoc-gia-tram-chim-76322.aspx162.https://www.researchgate.net/publication/311946912_Tram_Chim_Mekong_River_Basin_Vietnam163.https://nld.com.vn/moi-truong/vuon-quoc-gia-tram-chim-bi-de-doa-20191018214932185.htm164.https://www.wwf.or.th/?107460/Landscape-Management-and-Sustainable-Livelihoods-at-Tram-Chim-National-
Park-Project165.https://vuonqgumh.camau.gov.vn/wps/portal/?1dmy&page=tct.chitiet&urile=wcm%3Apath%3A/vqgumhlibrary/
tttdtvqgmcm/gtc/112166.https://vtv.vn/trong-nuoc/vuon-quoc-gia-u-minh-ha-bi-de-doa-do-dan-tu-phat-nuoi-tom-20160820104219253.
htm167.https://vuonqgumh.camau.gov.vn/wps/portal/ttsk168.https://www.researchgate.net/profile/Triet-Tran-2/publication/309436449_U_Minh_Peat_Swamp_Forest_Mekong_
River_Basin_Vietnam/links/5ad6b8f8a6fdcc293582ce81/U-Minh-Peat-Swamp-Forest-Mekong-River-Basin-Vietnam.pdf
169.https://iopscience.iop.org/article/10.1088/1757-899X/1092/1/012085/pdf170.http://elib.vnuf.edu.vn/bitstream/123456789/12271/1/22.%20Bai%2022.pdf171.https://vuonqgumh.camau.gov.vn/wps/portal/?1dmy&page=tct.chitiet&urile=wcm%3apath%3a/vqgumhlibrary/
tttdtvqgmcm/sdftyrehs1/tuan+112172.https://iopscience.iop.org/article/10.1088/1757-899X/736/7/072014/pdf"""173.https://rsis.ramsar.org/ris/2228174.https://www.researchgate.net/profile/Triet-Tran-2/publication/334112397_CLIMATE_CHANGE_VULNERABILITY_
ASSESSMENT_U_MINH_THUONG_NATIONAL_PARK_VIETNAM_Mekong_WET_-Building_Resilience_of_Wetlands_in_the_Lower_Mekong_Region/links/5d1a3ee1458515c11c092bec/CLIMATE-CHANGE-VULNERABILITY-ASSESSMENT-U-MINH-THUONG-NATIONAL-PARK-VIETNAM-Mekong-WET-Building-Resilience-of-Wetlands-in-the-Lower-Mekong-Region.pdf
175.https://vietnam.vnanet.vn/english/mekong-delta-intensifies-measures-to-prevent-forest-fires/480589.html
ASSESSING THE BIODIVERSITY IN VIET NAM – ANALYSIS OF IMPACTS FROM ECONOMIC SECTORS 125

176.https://kiemsat.vn/lieu-linh-san-te-te-trong-vuon-quoc-gia-56903.html177.https://asean.chm-cbd.net/u-minh-thuong-national-park178.https://www.iucn.org/sites/dev/files/u_minh_thuong_va_summary.pdf179.https://www.thiennhienviet.org.vn/sourcebook/pdf/4%20Mekong%20Delta/U%20Minh%20Thuong.pdf180.https://www.thiennhien.net/2019/12/20/vuon-quoc-gia-u-minh-thuong-khu-rung-doc-dao-quy-hiem-tren-the-
gioi/181.https://www.cambridge.org/core/journals/oryx/article/identifying-and-quantifying-the-threats-to-biodiversity-in-
the-u-minh-peat-swamp-forests-of-the-mekong-delta-vietnam/473B7CAF49A37B1465CBC77A4D2943AF182.https://www.researchgate.net/publication/333910137_Enhancing_bird_diversity_through_improved_water_
management_in_a_Viet_Nam_wetland_national_park [Page 55]"""183.https://www.researchgate.net/publication/248692922_The_importance_of_Vu_Quang_Nature_Reserve_Vietnam_
for_bird_conservation_in_the_context_of_the_Annamese_Lowlands_Endemic_Bird_Area184.https://baohatinh.vn/nong-nghiep/vuon-quoc-gia-vu-quang-don-nhan-danh-hieu-vuon-di-san-asean/202383.htm185.https://www.mdpi.com/1999-4907/3/4/997/pdf186.https://baohatinh.vn/nong-nghiep/phong-ba-hoa-de-doa-rung-vu-quang/192018.htm187.https://journals.sagepub.com/doi/pdf/10.1177/194008291400700211188.http://www.vjs.ac.vn/index.php/vjbio/article/view/5259/pdf189.https://nhandan.com.vn/thoi-su-phap-luat/ngang-nhien-pha-rung-dac-dung-tai-vuon-quoc-gia-xuan-son-636499/190.https://tuoitre.vn/phe-binh-giam-doc-canh-cao-nhieu-can-bo-de-pha-rung-dac-dung-vuon-quoc-gia-xuan-
son-20210404210620662.htm191.https://www.vietnamplus.vn/phu-tho-xu-nghiem-vu-pha-rung-dac-dung-o-vuon-quoc-gia-xuan-son/697559.vnp192.https://nhandan.com.vn/thoi-su-phap-luat/xu-ly-nghiem-to-chuc-ca-nhan-de-xay-ra-pha-rung-dac-dung-tai-vuon-
quoc-gia-xuan-son-637116/193.http://jsrsai.jp/Annual_Meeting/PROG_48/Resume4/rD03-5%20Nguyen%20NGA.pdf194.https://edepot.wur.nl/8151195.https://www.forest-trends.org/wp-content/uploads/imported/ft-report-xtnp-edited-thuy-24-may-2010-first-draft-
pdf.pdf196.https://journals.qucosa.de/jve/article/view/53/pdf_5197.https://js.vnu.edu.vn/EES/article/view/4221198.https://orbi.uliege.be/bitstream/2268/205441/1/ICOAD2016_NGUYEN%20THI%20TRANG%20Nhung_Abstract.pdf199.https://194.95.142.59/jve/article/view/74/73200.http://www.kiemlam.org.vn/Download.aspx/F5EC59D2F65F43278A5A7218C18F937C/1/Yok_don.pdf201.https://www.scirp.org/pdf/ARS_2015060518184231.pdf202.https://moitruong.com.vn/moi-truong-sos/canh-bao-moi-truong/thuy-dien-lai-de-doa-vqg-yok-don-6506.htm203.http://datazone.birdlife.org/site/factsheet/yok-don-iba-vietnam/text204.https://www.adb.org/sites/default/files/linked-documents/48189-002-sd-04.pdf205.https://core.ac.uk/download/pdf/83983671.pdf206.https://baovemoitruong.org.vn/vuon-quoc-gia-yok-don-van-dang-bi-rut-ruot207.https://www.adb.org/sites/default/files/linked-documents/48189-002-sd-04.pdf208.https://kinhtemoitruong.vn/quang-nam-thanh-lap-vuon-quoc-gia-song-thanh-51915.html209.https://tuoitre.vn/dung-5-du-an-thuy-dien-de-doa-khu-bao-ton-thien-nhien-song-thanh-259673.htm210.https://www.cifor.org/publications/pdf_files/Books/BSunderland120103.pdf211.https://baotainguyenmoitruong.vn/khu-bao-ton-thien-nhien-song-thanh-keu-cuu-244996.html212.https://www.adb.org/sites/default/files/project-documents/49026/49026-004-iee-en.pdf213.https://www.researchgate.net/publication/336459446_A_large_population_of_the_northern_yellow-cheeked_
gibbon_Nomascus_annamensis_and_new_records_on_the_primate_diversity_in_Ba_Na-Nui_Chua_Nature_Reserve_Danang_Vietnam
214.http://iebr.ac.vn/database/HNTQ5/687.pdf215.http://sdh.vnuf.edu.vn/documents/779420/11332553/Tomtatluanan%20%28TiengAnh%29%20-%20ncs.
ThaiVanThanh_DHLN.pdf216.https://www.adb.org/sites/default/files/project-documents/54211/54211-001-iee-en_87.pdf217.https://data.opendevelopmentmekong.net/dataset/0b47a1b5-c435-467d-81ff-e4bfc1bc18de/resource/dfabce05-
eb61-4708-9c8e-85b998ff7ca8/download/2015bao-cao-lhh-ha-giang.pdf218.http://static1.1.sqspcdn.com/static/f/1200343/27337011/1479355173173/Tonkin+Snub-
nosed+Monkey+Action+Plan+English.pdf?token=h9hWi81ekIEZ8CNjS1LCKSwqhX4%3D
219.https://scholar.colorado.edu/downloads/2514nk56q220.https://nature.org.vn/vn/wp-content/uploads/2017/05/110517_cacvande_SonTra.pdf221.https://danang.gov.vn/gioi-thieu/chi-tiet?id=3006&_c=163222.https://greenviet.org/tin-tuc/khu-bao-ton-thien-nhien-son-tra/223.https://nature.org.vn/vn/wp-content/uploads/2017/07/210717_ThamluanDangHuyHuynh.pdf224.https://thanhnien.vn/thoi-su/la-phoi-xanh-ban-dao-son-tra-bi-cac-du-an-sai-pham-bam-nat-1138877.html225.https://nhandan.org.vn/vi-moi-truong-xanh/41-dien-tich-rung-son-tra-bi-cat-giam-chuyen-doi-muc-dich-su-
dung-291603/226.https://www.thiennhien.net/2020/07/07/theo-chan-biet-doi-pha-bay-cuu-thu-tai-khu-bao-ton-thien-nhien-son-
tra/227.https://baotainguyenmoitruong.vn/da-nang-phat-hien-hon-1-300-bay-thu-o-khu-bao-ton-thien-nhien-son-
tra-305757.html228.https://www.researchgate.net/publication/343384688_PLANT_DIVERSITY_FLORA_AND_VEGETATION_OF_BAT_
DAI_SON_MOUNTAIN_AREA_NORTHERN_VIETNAM229.https://batxat.laocai.gov.vn/Default.aspx?sid=1263&pageid=28655&catid=68900&id=578080&catname=&title=b
an-quan-ly-khu-bao-ton-thien-nhien-bat-xat-thuc-hien-tot-cong-tac-bao-ve-rung-bttn-da-dang-sinh230.https://khoahoc.tv/phat-hien-quan-the-cay-thiet-sam-quy-hiem-o-lao-cai-101490231.https://www.researchgate.net/publication/259848695_MAMMAL_FAUNA_OF_BINH_CHAU-PHUOC_BUU_NATURE_
RESERVE_XUYEN_MOC_DISTRICT_BA_RIA-VUNG_TAU_PROVINCE232.https://thiennhienviet.org.vn/sourcebook/pdf/southeast/Binh%20Chau-Phuoc%20Buu.pdf233.http://iebr.ac.vn/database/HNTQ5/384.pdf234.https://www.koreascience.or.kr/article/JAKO202026061031392.pdf235.http://accountvienst.readyhosting.com/database/HNTQ5/718.pdf236.https://zmmu.msu.ru/rjt/articles/ther19_2_193-209.pdf237.https://www.researchgate.net/publication/346549965_The_first_studies_of_small_mammals_of_the_Cham_Chu_
and_Bac_Me_Nature_Reserves_north-eastern_Vietnam238.http://bch-cbd.naturalsciences.be/vietnam/contribution/cham_chu.pdf"239.http://baohagiang.vn/khoa-hoc-cong-nghe/201508/cong-bo-xac-lap-khu-bao-ton-thien-nhien-chi-san-meo-
vac-605453/240.http://iebr.ac.vn/database/HNTQ5/642.pdf241.http://baosonla.org.vn/vi/bai-viet/phong-chong-giac-lua-rung-dac-dung-copia-21926242.http://datazone.birdlife.org/site/factsheet/dakrong-iba-vietnam/text243.https://thiennhienviet.org.vn/sourcebook/source_book/North%20Central%20Coast/SB%20Dakrong.htm244.http://www.psgb.org/Conservation/documents/AbstractNguyenManhHafinal.pdf245.http://iebr.ac.vn/database/HNTQ5/1064.pdf246.http://tapchikhcnln.vnuf.edu.vn/documents/5898355/14652554/9.DuongTrungHieu.pdf247.http://thanhnienviet.vn/2018/11/05/bao-ton-da-dang-sinh-hoc-o-khu-bttn-dong-son-ky-thuong/248.http://www.kiemlamqni.org.vn/Desktop.aspx/List/Tin-hoat-dong/Khu_Bao_ton_thien_nhien_Dong_Son-Ky_
Thuong_he_sinh_thai_rung_kin_thuong_xanh_nui_thap_lon_nhat_vung_Dong_Bac_Viet_Nam/249.https://www.researchgate.net/figure/Location-of-Ea-So-Nature-Reserve-and-Yok-Don-and-Cat-Tien-National-
Parks-The-inset_fig1_232003962250.https://thiennhienviet.org.vn/sourcebook/source_book/Central%20Highlands/SB%20Ea%20So.htm251.https://thiennhienviet.org.vn/sourcebook/pdf/2%20Central%20Highlands/Ea%20So.pdf252.http://datazone.birdlife.org/site/factsheet/ea-so-iba-vietnam/text253.https://nhandan.com.vn/vi-moi-truong-xanh/rung-bao-ton-ea-so-truoc-ap-luc-bi-tan-pha-457143/254.https://dantocmiennui.vn/khu-bao-ton-thien-nhien-ea-so-dang-bi-xam-hai/25988.html255.https://kinhtemoitruong.vn/dieu-tra-xu-ly-nghiem-doi-tuong-pha-rung-o-khu-bao-ton-thien-ea-so-51984.html256.http://khubttneaso.org.vn/index.php/cac-bai-vi-t-dang-t-i/van-hoa-xa-h-i/560-khu-ba-o-ta-n-thia-n-nhia-n-ea-sa-
ba-xa-m-ha-i-ta-pha-a257.https://laodong.vn/phap-luat/truy-quet-lam-tac-pha-rung-o-khu-bao-ton-thien-nhien-ea-so-802356.ldo258.https://baodansinh.vn/khoi-to-vu-an-khai-thac-go-trai-phep-tai-khu-bao-ton-thien-nhien-ea-so-tinh-dak-
lak-20210219103654736.htm259.http://baodaklak.vn/channel/3481/202012/81-cay-go-quy-bi-don-ha-tai-khu-bao-ton-thien-nhien-ea-so-5715517/260.https://www.thiennhien.net/2021/04/30/khoi-to-37-lam-tac-trong-vu-pha-rung-o-khu-bao-ton-thien-nhien-ea-so/261.http://documents1.worldbank.org/curated/en/764921468328526489/
pdf/598920V10WP0P0101PUBLIC10Assessment.pdf
ASSESSING THE BIODIVERSITY IN VIET NAM – ANALYSIS OF IMPACTS FROM ECONOMIC SECTORS 127

262.http://iebr.ac.vn/database/HNTQ7/482.pdf263.https://data.opendevelopmentmekong.net/dataset/573439ea-6cd1-4ce1-a3af-58aec85d055c/resource/bb2de2fc-
12fd-4e30-8979-603be5a39bc2/download/2009hkpcanimalsurveyfinalreportvietnamese.pdf264.https://nature.org.vn/vn/2010/02/da-dang-sinh-hoc-khu-bttn-hang-kia-pa-co/265.https://www.nature.org.vn/en/wp-content/uploads/2019/09/200919_Thesis_Luna_S.viarum.pdf266.https://www.cifor.org/publications/pdf_files/Books/BSunderland120106.pdf267.https://www.researchgate.net/profile/Kiem-Truong/publication/340050301_STUDY_ON_THE_DIVERSITY_OF_
VEGETATIONS_IN_HOANG_LIEN_-_VAN_BAN_NATURE_RESERVE_LAO_CAI_PROVINCE_FOR_BIODIVERSITY_CONSERVATION_PURPOSE/links/5e7476c3299bf1c76a20106b/STUDY-ON-THE-DIVERSITY-OF-VEGETATIONS-IN-HOANG-LIEN-VAN-BAN-NATURE-RESERVE-LAO-CAI-PROVINCE-FOR-BIODIVERSITY-CONSERVATION-PURPOSE.pdf
268.https://vov.vn/xa-hoi/nhieu-cong-trinh-trai-phep-moc-giua-khu-bao-ton-thien-nhien-hon-ba-497550.vov269.https://nld.com.vn/ban-doc/phu-tram-de-doa-khu-bao-ton-2012102310107840.htm270.https://nhandan.com.vn/thoi-su-phap-luat/Xét-xử-hành-vi-giết-hại-vo%E1%BB%8Dc-chà-vá-538432/271.http://khudutruthiennhienhuulien.com/gioi-thieu/29/gioi-thieu-ve-khu-du-tru-thien-nhien-huu-lien/259.aspx272.https://thiennhienviet.org.vn/sourcebook/pdf/Dong%20bac/Huu%20Lien.pdf273.http://iebr.ac.vn/database/HNTQ6/440.pdf274.http://journal.hcmue.edu.vn/index.php/hcmuejos/article/download/2590/2559275.https://www.thiennhienviet.org.vn/sourcebook/pdf/Bac%20Trung%20Bo/Ke%20Go.pdf276.https://baohatinh.vn/phap-luat-doi-song/can-lam-ro-tinh-trang-trau-mac-bay-trong-khu-bao-ton-thien-nhien-ke-
go/187288.htm277.https://www.thiennhien.net/2020/02/17/ha-tinh-thao-go-hang-tram-bay-thu-rung-o-khu-bao-ton-ke-go/278.https://www.moitruongvadothi.vn/phap-luat/phap-luat-moi-truong/bai-2-mau-rung-van-chay-khu-bao-ton-thien-
nhien-ke-go-noi-kho-a21388.html279.https://thiennhienviet.org.vn/sourcebook/source_book/North%20east/SB%20Kim%20Hy.htm280.https://vietnamnews.vn/environment/261963/kim-hy-park-under-threat-in-bac-kan.html281.https://konchurang.org/home282.http://karadag.com.ru/static/media/images/books/kbs_works/Trudy_3%2811%29.pdf#page=54283.https://nature.org.vn/vn/wp-content/uploads/2019/07/210619_PanNature_sachDadangSH.pdf284.https://www.thiennhienviet.org.vn/sourcebook/pdf/Nam%20Trung%20Bo/Krong%20Trai.pdf285.http://cand.com.vn/Phong-su-tu-lieu/Phu-Yen-Khu-bao-ton-thien-nhien-Krong-Trai-keu-cuu-24628/286.https://nld.com.vn/thoi-su-trong-nuoc/rung-cam-krong-trai-dang-bi-xoa-so-83303.htm287.https://thiennhienviet.org.vn/sourcebook/pdf/DB%20Song%20cuu%20long/Lang%20Sen.pdf288.https://www.thiennhien.net/2017/11/14/lap-rung-dac-dung-khu-bao-ton-dat-ngap-nuoc-lang-sen/289.https://wwf.panda.org/wwf_news/?260211/Lang-Sen-Wetland-Reserve-recognized-as-the-7th-Ramsar-site-of-
Vietnam290.http://dwrm.gov.vn/index.php?language=vi&nv=news&op=Hoat-dong-cua-dia-phuong/Cong-dong-vung-dat-
ngap-nuoc-de-bi-ton-thuong-boi-bien-doi-khi-hau-8378291.https://rsis.ramsar.org/ris/2227292.https://www.iucn.org/sites/dev/files/content/documents/ccva_report_lang_sen_wetland_viet_nam.pdf293.https://www.researchgate.net/publication/334113026_CLIMATE_CHANGE_VULNERABILITY_ASSESSMENT_LANG_
SEN_WETLAND_RESERVE_VIETNAM_-_Mekong_WET_-Building_Resilience_of_Wetlands_in_the_Lower_Mekong_Region
294.https://www.iucn.org/sites/dev/files/lang_sen_viet_nam_climate_change_vulnerability_assessment_summary.pdf295.https://thiennhienviet.org.vn/sourcebook/source_book/Mekong%20Delta/SB%20Lung%20Ngoc%20Hoang.htm296.https://vnuf.edu.vn/documents/4400543/7062060/17.PhamThanhTrang.pdf297.https://muongla.sonla.gov.vn/1299/31462/64735/569395/thong-tin-tuyen-truyen/khu-bao-ton-thien-nhien-
muong-la-tang-cuong-bao-ve-rung-va-bao-ton-da-dang-sinh-hoc298.https://nhandan.com.vn/khoa-hoc-thien-nhien/thanh-lap-khu-bao-ton-thien-nhien-muong-la-283947/299.http://cdc.org.vn/cong-thong-tin/bao-ton-tai-nguyen/bao-ton-cac-loai-dong-thuc-vat-quy-hiem-o-khu-bao-ton-
thien-nhien-muong-la-3661.300.html; https://baotainguyenmoitruong.vn/giu-rung-muong-la-238682.html301.https://baotainguyenmoitruong.vn/thanh-lap-khu-bao-ton-thien-nhien-muong-la-281093.html302.https://thiennhienviet.org.vn/sourcebook/report_pdf/report26.pdf303.http://bttnmuongnhe.org.vn/portal/pages/2020-1-9/Tuyen-phat-24-thang-tu-ve-toi-vi-pham-quy-dinh-
khah7rc3ul8ct05.aspx304.https://www.cepf.net/sites/default/files/tonkinsnubnosedmonkeyscap_nahang_1.pdf
305.http://citeseerx.ist.psu.edu/viewdoc/download?doi=10.1.1.629.4066&rep=rep1&type=pdf306.http://bch-cbd.naturalsciences.be/vietnam/contribution/na_hang.pdf307.http://datazone.birdlife.org/site/factsheet/ban-bung-iba-vietnam/text308.http://iebr.ac.vn/database/HNTQ6/689.pdf309.https://vnuf.edu.vn/documents/454250/1804635/7.Dong%20Thanh%20Hai%20-%20QLTNR%26MT.pdf310.https://yenbai.gov.vn/noidung/tintuc/Pages/chi-tiet-tin-tuc.aspx?ItemID=86&l=Thangcanhdulich&lv=11311.http://kiemlamyenbai.gov.vn/tin-tuc/to-chuc-tuyen-truyen-xay-dung/?UserKey=Chi-cuc-Kiem-lam-Yen-Bai-voi-
cong-tac-phong-chong-tham-nhung312.https://vov.vn/xa-hoi/xot-xa-rung-trong-khu-bao-ton-thien-nhien-nam-kar-bi-tan-sat-982738.vov313.https://thuonghieuvaphapluat.vn/ghi-tai-vung-loi-khu-bao-ton-thien-nhien-nam-kar-d27723.html314.https://thiennhienviet.org.vn/sourcebook/source_book/Central%20Highlands/SB%20Nam%20Nung.htm315.http://tapchikhcnln.vnuf.edu.vn/documents/6229534/7062567/16.NguyenThiThu.pdf"316.http://st1.asflib.net/MEDIA/ASF-CD/ASF-M-00005/CDDATA/report_pdf/report10.pdf317.http://datazone.birdlife.org/index.php/site/factsheet/12046318.https://www.kontum.gov.vn/pages/detail/33709/Khu-Bao-ton-thien-nhien-Ngoc-Linh-duoc-trao-danh-hieu-Vuon-
Di-san-ASEAN.html319.http://datazone.birdlife.org/index.php/site/factsheet/ngoc-linh-iba-vietnam/text"320.http://elib.vnuf.edu.vn/bitstream/123456789/8610/1/LV10674.pdf321.http://svw.vn/wp-content/uploads/2017/05/SVW_Winter-spring-survey-for-small-carnivores-and-pangolins.pdf322.https://www.researchgate.net/profile/The-Pham-4/publication/306080178_Contribution_to_assess_the_
conservation_status_of_some_potential_plant_taxa_in_Ngoc_Son_-_Ngo_Luong_Nature_Reserve_Hoa_Binh_province/links/57aea16408ae95f9d8ed3316/Contribution-to-assess-the-conservation-status-of-some-potential-plant-taxa-in-Ngoc-Son-Ngo-Luong-Nature-Reserve-Hoa-Binh-province.pdf
323.https://www.thiennhienviet.org.vn/sourcebook/pdf/Tay%20nguyen/Nui%20Ong.pdf324.https://baovemoitruong.org.vn/khu-bao-ton-thien-nhien-nui-ong-binh-thuan/325.https://pdf.usaid.gov/pdf_docs/PA00TSFV.pdf326.https://thiennhienviet.org.vn/sourcebook/pdf/Bac%20Trung%20Bo/Phong%20Dien.pdf327.https://vnuf.edu.vn/documents/454250/1793717/8.%20Hoàng%20Văn%20Sâm.pdf328.https://thiennhienviet.org.vn/sourcebook/source_book_vn/Dong%20Bac/Phong%20Quang.htm329.https://js.vnu.edu.vn/index.php/NST/article/download/2743/2459330.https://thiennhienviet.org.vn/sourcebook/source_book/North%20west/SB%20Phu%20Canh.htm331.http://cand.com.vn/Xa-hoi/Hoa-Binh-Khu-bao-ton-quoc-gia-van-con-bi-de-doa-64756/332.https://nhandan.com.vn/tin-tuc-kinh-te/bao-ve-rung-phu-canh-225695333.https://www.corenacca.org/du-an/khu-bao-ton-thien-nhien-pu-hoat-huyen-que-phong-tinh-nghe-an/334.http://gust.edu.vn/media/27/uftai-ve-tai-day27364.pdf335.https://www.thiennhienviet.org.vn/sourcebook/source_book/North%20Central%20Coast/SB%20Pu%20Hu.htm336.http://iebr.ac.vn/database/HNTQ5/435.pdf337.http://iebr.ac.vn/database/HNTQ6/700.pdf338.http://documents1.worldbank.org/curated/en/764921468328526489/
pdf/598920V10WP0P0101PUBLIC10Assessment.pdf339.https://www.researchgate.net/publication/323880716_THANH_PHAN_LOAI_VA_SU_PHAN_BO_THEO_SINH_CANH_
CUA_KHU_HE_CHIM_O_KHU_BAO_TON_THIEN_NHIEN_PU_HUONG340.https://www.thiennhienviet.org.vn/sourcebook/pdf/Bac%20Trung%20Bo/Pu%20Huong.pdf341.http://puluong.org.vn/web/trang-chu/bao-ton-amp;-ddsh/da-dang-sinh-hoc-tai-khu-bttn-pu-luong.html342.http://puluong.org.vn/web/trang-chu/tin-tuc-su-kien/xet-xu-luu-dong-cong-khai-vu-an-vi-pham-khai-thac-bao-ve-
rung-va-lam-san-khu-bao-ton-thien-nhien-pu-luong.html343.https://nongnghiep.vn/mau-rung-chay-giua-dai-ngan-pu-luong-d251902.html344.https://nongnghiep.vn/nhung-canh-rung-nguyen-sinh-quy-hiem-pu-luong-dung-truoc-nguy-co-bien-
mat-d166851.html345.https://nongnghiep.vn/khu-bao-ton-thien-nhien-pu-luong-van-con-nhieu-bat-on-d168415.html346.https://pdf.usaid.gov/pdf_docs/PA00TSFQ.pdf347.https://www.thiennhienviet.org.vn/sourcebook/pdf/Tay%20bac/Sop%20Cop.pdf348.http://takou.org.vn/vi-vn/tintuc-4961-khu-bao-ton-thien-nhien-ta-kou-mot-vung-co-tinh-da-dang-sinh-hoc-quan-
trong-o-vu.aspx349.https://www.researchgate.net/profil
ASSESSING THE BIODIVERSITY IN VIET NAM – ANALYSIS OF IMPACTS FROM ECONOMIC SECTORS 129

ANNEX 3IUCN Threats classification scheme (Version 3.0)
First and second levels Third level
1. Residential & commercial development 2. Agriculture & Aquaculture
1.1 Housing & urban areas1.2 Commercial & industrial areas1.3 Tourism & recreation areas1.4 Village settlements
2.1.1 Shifting agriculture2.1.2 Small-holder farming2.1.3 Agro-industry farming2.1.4 Scale Unknown/Unrecorded2.2.1 Small-holder plantations2.2.2 Agro-industry plantations2.2.3 Scale unknown/unrecorded2.3.1 Nomadic grazing2.3.2 Small-holder grazing, ranching or farming2.3.3 Agro-industry grazing, ranching or farming2.3.4 Scale Unknown/Unrecorded2.4.1 Subsistence/artisanal aquaculture2.4.2 Industrial aquaculture2.4.3 Scale Unknown/Unrecored
2. Agriculture & aquaculture2.1 Annual & perennial non-timber crops2.2 Wood and pulp plantations2.3 Livestock farming & ranching2.4 Marine & freshwater aquaculture
3. Energy production & mining3.1 Oil & gas drilling3.2 Mining & quarrying3.3 Renewable energy
4. Transportation & service corridors4.1 Roads & railroads4.2 Utility & service lines4.3 Shipping lanes4.4 Flight paths
5. Biological resource use 5. Biological resource use5.1. Hunting & trapping terrestrial animals5.2. Gathering terrestrial plants5.3. Logging & wood harvesting5.4. Fishing & harvesting aquatic resources
5.1.1 Intentional use (species in the target)5.1.2. Unintentional effects (species is not the target)5.1.3 Persecution/control5.1.4 Motivation Unknown/Unrecorded5.2.1 Intentional use (species in the target)5.2.2 Unintentional effects (species is not the target)5.2.3 Persecution/control5.2.4 Motivation Unknown/Unrecorded5.3.1. Intentional use (subsistence/small scale)5.3.2 Intentional use (large scale)5.3.3 Unintentional effects (subsistence/small scale)5.3.4 Unintentional effects (large scale)5.3.5 Motivation Unknown/ Unrecorded5.4.1 Intentional use (subsistence/small scale)5.4.2 Intentional use (large scale)5.4.3 Unintentional effects (subsistence/small scale)5.4.4 Intentional use (large scale)5.4.5 Persecution/ control5.4.6 Motivation Unknown/ Unrecorded
6. Human intrusion & disturbance6.1 Recreation activities6.2 War, civil unrest & military exercises6.3 Work & other activities
7. Natural system modifications7.1 Fire & fire suppression7.2 Dams & water management/ use7.3 Other ecosystem modifications
8. Invasive non-native/alien species8.1 Invasive non-native/alien species8.2 Problematic native species8.3 Introduced genetic material8.4 Problematic species/diseases of unknown origin8.5 Viral/prion-induced diseases8.6. Diseases of unknown cause
9. Pollution 7. Natural system modifications
9.1 Domestic & urban waste water9.2 Industrial military effluents9.3 Agricultural & forestry effluents9.4 Garbage & solid waste9.5 Air-bone pollutants9.6 Excess energy
7.1.1 Increase in fire frequency/intensity7.1.2 Suppression in fire frequency/intensity7.1.3 Trend Unknown/ Unrecorded7.2.1 Abstraction of surface water (domestic use)7.2.10 Large dams7.2.11 Abstraction of surface water (commercial use)7.2.2 Abstraction of surface water (commercial use)7.2.3 Abstraction of surface water (agriculture use)7.2.4 Abstraction of surface water (unknown use)7.2.5 Abstraction of ground water (domestic use)7.2.6 Abstraction of ground water (commercial use)7.2.7 Abstraction of ground water (agriculture use)7.2.8 Abstraction of ground water (unknown use)7.2.9 Small dams
10. Geological events10.1 Volcanoes10.2 Earthquakes/ tsunamis10.3 Avalanches/landslides
11. Climate change & severe weather11.1 Habitat shifting & alternation11.2 Droughts11.3 Temperature extremes11.4 Storms & flooding11.5 Other impacts
ASSESSING THE BIODIVERSITY IN VIET NAM – ANALYSIS OF IMPACTS FROM ECONOMIC SECTORS 131

ANNEX 4Detailed land cover and land use changes analysis between 2000 and 2018 at country level
Area in Km2
In 2018
Surface Water Mangroves Flooded
Forest Forest
Orchard or
Plantation Forest
Evergreen Broadleaf
Mixed Forest
Urban and Built Up
Cropland Rice Mining Barren Wetlands Grassland Shrubland Aquaculture Total
In 2000
Surface Water 6 617.28 6.72
1.92
9.60
96.64
12.16
1.60
56.32 44.16 140.48
-
15.36 102.72 - - 42.24 7 147.20
Mangroves 16.32 1 101.12
0.96
-
1.60
0.32 -
6.72 -
20.16
-
0.64 6.40 - - 185.28 1 339.52
Flooded Forest 8.64 0.96
787.52
0.64
122.24
9.60 -
8.32 0.32
888.96
-
1.60 384.96 - - 397.44 2 611.20
Forest 117.12 -
0.96
35 516.48
2 597.76
731.20
825.92
25.60 3 240.96
2.24
0.96
6.40 6.72
1 427.20 18.24 1.28 44 519.04
Orchard or Plantation Forest
154.24 1.60
14.40
966.08
54 231.04
2 130.56
200.96
114.24 975.04
34.24
0.32
45.12 19.20
4.80 2.24 0.64 58 894.72
Evergreen Broadleaf
23.68 1.28
2.24
1 247.04
1 389.76
69 815.68
638.72
10.56 81.92
2.88
0.64
7.04 1.28
504.96 8.00 - 73 735.68
Mixed Forest 47.68 -
-
4 655.04
2 257.28
3 388.80
21 472.64
8.64 1 787.84
-
0.64
3.52 0.64
660.48 32.96 - 34 316.16
Urban and Built Up
7.68 -
-
3.84
66.88
3.52
0.32
2 926.08 25.60
41.28
-
15.36 1.28
2.88 - 3.20 3 097.92
Cropland 99.84 -
1.28
141.44
7 205.76
137.28
79.04
261.76
25 360.00
246.40
-
89.60 12.80
32.32 3.52 0.32 33 671.36
Rice 112.00 1.92
15.04
1.28
1 168.32
7.04 -
1 227.52 468.16
52 421.12
-
206.72 33.92 - - 377.92 56 040.96
Mining - -
-
0.32
0.64
-
0.32
0.32 -
-
159.36 - - - - - 160.96
Barren 17.60 0.32
-
1.60
84.48
2.88 -
118.08 78.72
206.72
-
1 744.32 4.80 - 1.28 3.52 2 264.32
Wetlands 26.88 0.32
2.24
0.96
32.32
0.96
0.32
0.96 10.88
52.80
-
3.84 490.24 - - 7.68 630.40
Grassland - -
-
6.08
-
13.12
0.32
0.32 3.84
-
- - -
2 501.12 - - 2 524.80
Shrubland - -
-
0.64
3.52
0.64
0.32
- 0.64
-
-
1.92 - - 24.96 - 32.64
Aquaculture
18.56 8.00
0.64
-
3.52
0.96 -
13.44 0.64 162.24
-
2.88 8.32 - - 7 928.64 8 147.84
Total 7 267.52 1 185.60
827.20
42 551.04
69 261.76
76 254.72
23 220.48
4 778.88 32 078.72
54 219.52
161.92
2 144.32 1 073.28
5 133.76 91.20 8 948.16 329 212.48
% Evolution
0.02 - 0.11 -
0.68 -
0.04
0.18
0.03 -
0.32
0.54 - 0.05 -
0.03
0.01 -
0.05 0.70
1.03 1.79 0.10
ASSESSING THE BIODIVERSITY IN VIET NAM – ANALYSIS OF IMPACTS FROM ECONOMIC SECTORS 133

ANNEX 5Detailed land cover and land use changes analysis between 2000 and 2010 at country level.
Area in Km2
In 2018
Surface Water Mangroves Flooded
Forest ForestOrchard or Plantation Forest
Evergreen Broadleaf Mixed Forest Urban and
Built Up Cropland Rice Mining Barren Wetlands Grassland Shrubland Aquaculture Total
In 2000
Surface Water 6 617.28 6.72 1.92 9.60 96.64 12.16 1.60 56.32 44.16 140.48 - 15.36 102.72 - - 42.24 7 147.20
Mangroves 16.32 1 101.12 0.96 - 1.60 0.32 - 6.72 - 20.16 - 0.64 6.40 - - 185.28 1 339.52
Flooded Forest 8.64 0.96 787.52 0.64 122.24 9.60 - 8.32 0.32 888.96 - 1.60 384.96 - - 397.44 2 611.20
Forest 117.12 - 0.96 35 516.48 2 597.76 731.20 825.92 25.60 3 240.96 2.24 0.96 6.40 6.72 1 427.20 18.24 1.28 44 519.04
Orchard or Plantation Forest
154.24 1.60 14.40 966.08 54 231.04 2 130.56 200.96 114.24 975.04 34.24 0.32 45.12 19.20 4.80 2.24 0.64 58 894.72
Evergreen Broadleaf 23.68 1.28 2.24 1 247.04 1 389.76 69 815.68 638.72 10.56 81.92 2.88 0.64 7.04 1.28 504.96 8.00 - 73 735.68
Mixed Forest 47.68 - - 4 655.04 2 257.28 3 388.80 21 472.64 8.64 1 787.84 - 0.64 3.52 0.64 660.48 32.96 - 34 316.16
Urban and Built Up 7.68 - - 3.84 66.88 3.52 0.32 2 926.08 25.60 41.28 - 15.36 1.28 2.88 - 3.20 3 097.92
Cropland 99.84 - 1.28 141.44 7 205.76 137.28 79.04 261.76 25 360.00 246.40 - 89.60 12.80 32.32 3.52 0.32 33 671.36
Rice 112.00 1.92 15.04 1.28 1 168.32 7.04 - 1 227.52 468.16 52 421.12 - 206.72 33.92 - - 377.92 56 040.96
Mining - - - 0.32 0.64 - 0.32 0.32 - - 159.36 - - - - - 160.96
Barren 17.60 0.32 - 1.60 84.48 2.88 - 118.08 78.72 206.72 - 1 744.32 4.80 - 1.28 3.52 2 264.32
Wetlands 26.88 0.32 2.24 0.96 32.32 0.96 0.32 0.96 10.88 52.80 - 3.84 490.24 - - 7.68 630.40
Grassland - - - 6.08 - 13.12 0.32 0.32 3.84 - - - - 2 501.12 - - 2 524.80
Shrubland - - - 0.64 3.52 0.64 0.32 - 0.64 - - 1.92 - - 24.96 - 32.64
Aquaculture 18.56 8.00 0.64 - 3.52 0.96 - 13.44 0.64 162.24 - 2.88 8.32 - - 7 928.64 8 147.84
Total 7 267.52 1 185.60 827.20 42 551.04 69 261.76 76 254.72 23 220.48 4 778.88 32 078.72 54 219.52 161.92 2 144.32 1 073.28 5 133.76 91.20 8 948.16 329 212.48
% Evolution 0.02 - 0.11 - 0.68 - 0.04 0.18 0.03 - 0.32 0.54 - 0.05 - 0.03 0.01 - 0.05 0.70 1.03 1.79 0.10
ASSESSING THE BIODIVERSITY IN VIET NAM – ANALYSIS OF IMPACTS FROM ECONOMIC SECTORS 135

ANNEX 6Detailed land cover and land use changes analysis between 2010 and 2018 at country level.
EVOLUTION 2010 - 2018
Area in Km2
in 2018
Surface Water Mangroves Flooded
Forest ForestOrchard or Plantation Forest
Evergreen Broadleaf
Mixed Forest
Urban and Built Up
Cropland Rice Mining Barren Wetlands Grassland Shrubland Aquaculture TOTAL
in 2010
Surface Water 6845.44 5.76 1.6 7.04 83.52 10.56 2.88 30.4 31.68 63.36 0 8.32 72.32 0 0 24.64 7187.52
Mangroves 6.4 1097.92 0.64 0 1.92 0.32 0 1.28 0 7.36 0 0.32 3.2 0 0 47.36 1166.72
Flooded Forest 5.12 0.96 784 0.64 104.96 9.28 0 6.4 0.64 100.48 0 1.28 29.12 0 0 14.72 1057.6
Forest 72.64 0 0.96 40125.12 1430.72 806.08 1259.52 10.56 975.36 1.92 0.96 4.8 5.12 623.04 10.24 0.96 45328
Orchard or Plantation Forest
78.72 1.6 16 708.16 59100.16 1723.52 189.76 36.16 414.08 25.6 0.32 28.16 22.4 4.48 2.24 0.64 62352
Evergreen Broadleaf 21.76 1.28 2.24 401.28 1187.2 72554.56 801.28 6.4 50.88 2.24 0.32 5.76 0.64 264.64 7.68 0 75308.16
Mixed Forest 29.44 0 0 1139.84 1535.04 1004.48 20843.52 3.84 400 0 0 1.28 0.32 224.96 20.16 0 25202.88
Urban and Built Up 10.56 0 0.96 2.88 78.72 2.88 0.64 4137.92 33.92 83.2 0 24.64 1.92 2.88 0 3.84 4384.96
Cropland 83.2 0 0.64 151.68 4832.64 120 115.2 121.92 29650.24 77.44 0 57.6 11.2 28.48 3.52 0 35253.76
Rice 69.12 1.6 13.44 0.96 792.64 7.04 0 379.52 468.16 53682.56 0 168.32 23.04 0 0 165.44 55771.84
Mining 0 0 0 0 0.32 0 0.32 0.64 0 0 160.32 0 0 0 0 0 161.6
Barren 8.96 0.32 0 0.96 81.6 3.52 0 35.84 40 54.4 0 1838.72 3.84 0 0.96 0.96 2070.08
Wetlands 20.16 0 5.76 0.64 24.96 0.64 0.32 0.96 4.8 54.4 0 2.24 891.2 0 0 13.12 1019.2
Grassland 0 0 0 10.88 0 8 4.8 0 8 0 0 0 0 3985.28 0 0 4016.96
Shrubland 0 0 0 0.96 3.84 2.88 2.24 0 0.32 0 0 1.28 0 0 46.4 0 57.92
Aquaculture 16 12.8 0.96 0 3.52 0.96 0 7.04 0.64 66.56 0 1.6 8.96 0 0 8676.48 8795.52
TOTAL 7267.52 1185.6 827.2 42551.04 69261.76 76254.72 23220.48 4778.88 32078.72 54219.52 161.92 2144.32 1073.28 5133.76 91.2 8948.16 329212.48
% Evolution 1.11% 1.62% -21.79% -6.13% 11.08% 1.26% -7.87% 8.98% 631.56% -2.78% 0.20% 3.59% 5.31% 27.80% 57.46% 1.74%
ASSESSING THE BIODIVERSITY IN VIET NAM – ANALYSIS OF IMPACTS FROM ECONOMIC SECTORS 137

ANNEX 7Economic sectors commitments on biodiversity and possibility of achievement.
Orientation/Commitment Primary source Regulatory and resource framework Possibility of achievement or obstacle
Forestry
- Establishing, managing, protecting, sustainable development and use of 16.24 million ha of land planned for forestry; increase the percentage of
forested land to 42–43% by 2010 and 47% by 2020; ensure broad participation of economic sectors and social organizations in forestry development to contribute increasingly to socio-economic development, protect ecological environment, conserve biodiversity and provide environmental services, contribute to poverty reduction, improve living standards for rural mountainous people and maintain national security and defense’.
- By 2030, 100% of forest areas of forest owners will be organizations and sustainably managed; in a period of 2021 - 2025, 10% and a period of 2026 - 2030, 20% of the natural forest area will be upgraded with quality; improve efficiency of biodiversity conservation and protection capacity of forests, minimize violations of forestry law, ensure environmental security
- To conserve and sustainably develop important natural eco-systems, values of natural landscapes, historical and cultural relics and scenic places and endangered, precious and rare species in the special-use forest system- to increase the total area of special-use forests from 2.2 million ha.
- To complete mechanisms and policies on organizational structure, human resource and financial development to meet the requirements of sustainable management and development of natural resources in protected areas;
- Minimize the conversion of natural forest use purposes to non-forestry purposes
- Promote the link between conservation and development with the active participation of stakeholders in forest management.
- Strengthen and develop special-use forests system, conserve and promote the value of forest tree genetic resources, forest resources and biodiversity, meeting the requirements of maintaining ecological balance and sustainable forestry development.
- Forestry Law 2017
- Directive 13-CT/TW dated January 12, 2017 —Enhancing Party’s leadership in forest management, protection and development
- Decision No. 1976/QD-TTg dated 30/10/2014 by the prime Minister approving special-use forest system of the country by 2020 vision to 2030.
- Resolution No. 71/NQ-CP of August 8, 2017, promulgating the Government's Program of Action for implementation of Directive No.13-CT/TW of January 12, 2017
- Decision No. 523/QD-TTg dated April 1, 2021 of the Prime Minister approving Viet Nam's forestry development strategy for the 2021 - 2030 period, with a vision to 2050 (VFDS 2021-2030)
- Decision No. 523/QD-TTg dated April 1, 2021 by the PM approving VFDS 2021-2030 with a vision to 2050.- Decision No. 419/QD-TTg of Prime Minister dated 5 April 2017 on the Reduction of Green-house Gas Emissions through the reduction of Deforestation and Forest Degradation, Sustainable Management of Forest Resources, and Conservation and Enhancement of Forest Carbon Stocks (NRAP). - Decision No. 626/QĐ-TTg dated 10/5/2017 by the Prime Minister, on approving the Plan to Strengthen Management Capacity of the Protected Area System to 2025, Vision to 2030;
Forest protection:Contracted forest protection:- VND300,000/ha/year (Decision No. 38/2016/QD-TTg dated September 14, 2016)- 400,000 VND/ha/year up to 30 ha per household for ethnic minority household located in remote mountainous area (Decree No. 75/2015/ND-CP dated September 9, 2015)- VND100.000/ha/year for the entire forested area of the forest owner (Decision No. 24/2012/QD-TTg dated June 01, 2012).- VND 100,000/ha/year for natural forest area under temporary management of the Communal People Committee (CPC)- (Decision No. 07/2012/QD-TTg dated 08/02/2012)
Forest development:Planting protection and special-use forests: - VND 30 million/ha (Decision No. 38/2016/QD-TTg dated September 14, 2016); (Decree No. 75/2015/ND-CP dated September 9, 2015)Assisted natural regeneration:- VND 3 million/ha/6 years (without additional planting)- VND 6.6 million/ha/6 years (with additional planting) (Decision No. 38/2016/QD-TTg dated September 14, 2016)Buffer zone development:- VND 40 million/village/year for community living in buffer zone implementing co-management of special-use forest (Decision No. 24/2012/QD-TTg dated June 01, 2012).Infrastructural investment for Management Board of Special-use forest.- State budget fund invested to MB of special-use forest in building essential infrastructure facilities and physical foundation for operation of the forest management and protection and for biodiversity monitoring.
- The state budget only secured the payment of salaries to the forest management and protection forces in the management boards of special-use forests and protection forests. There is a number of localities can’t allocate fund for silviculture activities and biodiversity conservation in protected areas.
- Supported fund for silvicultural activities (Decision No. 38/2016/QD-TTg) such as planting special-use and protection forests, assisted natural regeneration is low (it is a subsidy, not an investment), so many protected areas cannot be deployed these activities.
- The policy on buffer zone development (Decision No. 24/QD-TTg) was terminated in 2020, therefore, it is necessary to have a new policy replaces Decision No. 24/QD-TTg).
- The Decision No.24/QD-TTg did not mention community living in or next to protection forests.
- Lack of funds to protect protection forests managed by the Commune People's Committee or the forest owner is individual household.
- Lack of policies to invest in forest enrichment planting in protected areas.
- Need to strengthen Strengthen law enforcement
ASSESSING THE BIODIVERSITY IN VIET NAM – ANALYSIS OF IMPACTS FROM ECONOMIC SECTORS 139

Orientation/Commitment Primary source Regulatory and resource framework Possibility of achievement or obstacle
- Conserve existing natural forests of 2.25 Mha and no conversion allowed, and no conversion of poor natural forests to industrial crops such as rubber or coffee in Central Highland
- To manage, protect, evelop and rationally use forest resources, contribute to socioeconomic development, ecological environment protection, biodiversity conservation, environmental services, hunger eradication, poverty alleviation, improvement of living standards for people and contributing to maintaining security, defence, social order and safety of the Central Highlands.
Notice No. 191/TB-VPCP dated 22/7/2016 Conclusion of the Prime Minister at the Conference on Sustainable Forest Restoration Solutions in the Central Highlands (2016–2020)
- Decision No. 297/QD-TTg dated March 18 2019 of the Prime Minister of Viet Nam approving the Scheme “forest protection, restoration and sustainable development in the Central Highlands Viet Nam in the 2016-2030 period”
Estimated investment demand up to VND19,856,000 million from state budget; VND 7,346,100 million from ODA, and VND9, 171,700 million from outside state budget sources (VND 5, 150,000 millin from PFES and VND 4,021,700 million from other sources).
- Strengthen law enforcement.
- Supported fund for silvicultural activities such as planting special-use and protection forests, assisted natural regeneration is low (it is a subsidy, not an investment), so many protected areas cannot be deployed these activities.
- The policy on buffer zone development (Decision No. 24/QD-TTg) was terminated in 2020, therefore, it is necessary to have a new policy replaces Decision No. 24/QD-TTg).
- Stopping the exploitation of timber of natural forests nationwide.
- Strictly controlling the stages of processing and trading of timber to prevent the illegal consumption and use,
- Strictly monitoring the exploitation of timber of natural forests of households and individuals that are allocated with forests:
Decision No. 2242 /QD-TTg issued 11/12/2014 on Approving the scheme for strengthening the management of exploitation of timber of natural forest for the period 2014-2020
The central budget provides financial support VND 200,000/ha/year forestry companies that have to suspend exploitation according to Decision No. 2242/QD-TTg. (Circular No. 330/2016/TT-BTC, dated 26 December 2016).
From 2015-2018 a total budget of VND 332.18 billion had been supported1.
100% SFCs closed their natural forests from July 2016 including those certified by the Forest Stewardship Council (FSC).
Protect the existing coastal forest area of 310,695 ha
- Newly planted 46,058 ha, increasing the total coastal forest area to 356,753 ha by 2020 and coastal forest coverage from 16.9% (2014) to 19.5% in 2020
Decision No. 120/QD-TTg dated January 22, 2015, approving the project on protection and development of coastal forests to cope with climate change
Contracted forest protection:- VND450.000/ha/year (Decree No. 119/2016/ND-CP August 23, 2016)Natural regeneration:- VND 4 million/ha for 5 years
- Investment capital from the state budget for the protection and development of coastal forests is still limited. Lack of specific Investment norms for afforestation and additional planting and restoration of coastal protection and special-use forests. It depend on the available fund from localities;
- Supported fund for forest protection and silvicultural activities (Decree No. 119/2016/ND-CP August 23, 2016) such as protection forests, assisted natural regeneration is low (it is a subsidy, not an investment).
- need to have a new programme on protection and development of coastal forest replaces Decision No. 120/QD-TTg dated January 22, 2015,
- To conserve and sustainably develop important natural eco-systems, values of natural landscapes, historical and cultural relics and scenic places and endangered, precious and rare species in the special-use forest system- to increase the total area of special-use forests from 2.2 million ha.
- To complete mechanisms and policies on organizational structure, human resource and financial development to meet the requirements of sustainable management and development of natural resources in protected areas.
Decision No. 626/QĐ-TTg dated 10/5/2017 by the Prime Minister, on approving the Plan to Strengthen Management Capacity of the Protected Area System to 2025, Vision to 2030
- The Management Board of Special-Use forest and Protection forest have been developing their Sustainable Forest Management Planning for the period 2021-2030 according to Circular 28/2018/TT-BNN.
- Need to provide an efficient policy on financial autonomy in protected areas according to Decree 141/2016/ND-CP.
- Need to have a new policy on buffer zone development (replaced Decision No. 24/QD-TTg)
- Need to strengthen law enforcement
- Provide a list of endangered, precious and rare species of forest fauna and flora; management and protection of and procedures for exploitation endangered, precious and rare species of forest fauna and flora; nurture of usual forest fauna; observation of the Convention on International Trade in Endangered Species of Wild Fauna and Flora (hereinafter referred to as "CITES”) in Viet Nam.
- Decree 06/2019 /ND-CP on management of endangered, precious and rare forest plants and animals and implementation of the Convention on international trade in endangered wild animals and plants
- Decree 160/2013 /ND-CP dated 12/11/2013 of the Government on criteria for identifying species and management regime of species on the list of endangered precious and rare species prioritized for protection
- Need to strengthen law enforcement
- Capacity building for forest rangers.
- Awareness-raising
1 http://thoibaotaichinhvietnam.vn/pages/nhip-song-tai-chinh/2019-03-07/ho-tro-hon-332-ty-dong-dung-khai-thac-go-rung-tu-nhien-68583.aspx
ASSESSING THE BIODIVERSITY IN VIET NAM – ANALYSIS OF IMPACTS FROM ECONOMIC SECTORS 141

Orientation/Commitment Primary source Regulatory and resource framework Possibility of achievement or obstacle
Agriculture
Keep a stable area of 450,000 ha of cassava to 2020; with cassava production of about 11 million tons for animal feed and biofuels in areas of land under 15 degree slopes, mainly in the northern mountains, coastal North Central, South Central, Central Highlands, the South East for cassava production”.
Decision No. 124/QD-TTg of February 2, 2012 by Prime Minister on approving the master plan on development of agricultural production to 2020 and vision for 2030
N/A
- Even though the Law on Crop Production (Law Crop Production No. 31/2018/QH14) was passed by the National Assembly in 2018 but the Law did not mention about free-deforestation agriculture.
- Need to have an efficient Monitoring and Evaluation plan/tool (M&E)
By 2020, the rubber area will be stable at 800,000 ha, Rubber’s latex yield will reach 1.2 million tons, and export turnover will reach 2 billion USD.- Commitment of no significant conversion of natural forest to afforestation or bare land,- Commitment to comply with FSC policies on forest management and forest certification,- Commitment not to destroy high conservation values (HCV) in forestry activities.
Prohibited acts:- Logging, encroachment of forestland- Bring waste, toxic chemicals into the forest- Hunting, captivity, transporting, trading and using forest animals; Exploiting and collecting specimens of forest plants- Violation of regulations on forest fire prevention- Violation of regulation on prevention of harmful organisms and management of harmful alien organisms
Decision 750/QD-TTg, on June 3, 2009 by the Prime Minister approving the rubber development master plan to 2015 with vision to 2020
https://vnrubbergroup.com/media/phattrienbenvung/VRG%20tuyen%20bo%20cam%20ket%20thuc%20hien%20lo%20trinh%20FSC.pdf
- Decision No. 25/QĐ-HDQTCSVN dated 19/2/2021 by the Viet Nam Rubber Group promulgation of ban on exploitation of forest plants, wildlife animals and forest fire prevention in the areas of rubber development projects.
N/A
Fishery
- Exploitation of aquatic resources must be based on reserves of aquatic resources associated with the protection, regeneration and development of aquatic resources, not depleting aquatic resources, and not affecting biodiversity; Conservative approach, based on ecosystems and scientific indicators in fisheries operations management to ensure sustainable development.
- Contributing at least 1% of the total revenue made in the period of the aquaculture enterprise or businesses associated with individuals and aquaculture households.
- Fisheries Law 2017
- Decree No. 156/2018/ND-CP dated November 16, 2018 by the PM detailing the implementation of a number of articles of the Forest Law.
N/A Need to have an efficient Monitoring and Evaluation plan/tool (M&E)
Tourism
- To protect natural landscape and environment protection in tourism development
- Support eco-tourism development
- Contributing at least 1% of the total revenue from ecotourism activities in the period
- Law on Tourism No. 09/2017/QH14, dated 19 June 2017)
Decree No. 99/2010/ND-CP and Decree 147/2016/ND-CP replaced decree 99/2010/ND-CP
- Decree No. 156/2018/ND-CP dated November 16, 2018 by the PM detailing the implementation of a number of articles of the Forest Law.
N/A - There is no policy to support initial investment/infrastructure for eco-tourism in protection forest.
- Awareness-raising on eco-tourism
- Need to have an efficient Monitoring and Evaluation plan/tool (M&E)
ASSESSING THE BIODIVERSITY IN VIET NAM – ANALYSIS OF IMPACTS FROM ECONOMIC SECTORS 143

vietnam.panda.org
© 2021
© 1986 Panda symbol WWF – World Wide Fund for Nature (Formerly World Wildlife Fund)® “WWF” is a WWF Registered Trademark. WWF, Avenue du Mont-Bland,1196 Gland, Switzerland. Tel. +41 22 364 9111. Fax. +41 22 364 0332.
For contact details and further information, please visit vietnam.panda.org