Rice Value Chains in China, India, Lao PDR, and Viet Nam:
452
Asian Development Bank TA-7648 REG Regional - Research and Development Technical Assistance (R-RDTA) The Final Report Component 2: Delivering Agri-food Value Chain Rice Value Chains in China, India, Lao PDR, and Viet Nam: 2012 Survey Results, Interpretations, and Implications for Policy and Investment Submitted by The International Food Policy Research Institute September 15, 2013 1
-
Upload
khangminh22 -
Category
Documents
-
view
1 -
download
0
Transcript of Rice Value Chains in China, India, Lao PDR, and Viet Nam:

Asian Development Bank TA-7648 REG Regional - Research and Development Technical Assistance (R-RDTA)
The Final Report
Component 2: Delivering Agri-food Value Chain
Rice Value Chains in China, India, Lao PDR, and Viet Nam: 2012 Survey Results, Interpretations, and Implications
for Policy and Investment
Submitted by
The International Food Policy Research Institute
September 15, 2013
1

Acknowledgments
This report is based on research supported under the Asian Development Bank TA-7648 Regional – Research and Development Technical Assistance (R-RDTA). The research team consists of the following members:
Kevin Z. Chen (Team Leader), Senior Research Fellow and China Program Leader, The International Food Policy Research Institute Thomas Reardon, Professor, Michigan State University and Renmin University Dao The Anh, Director, Centre for Agrarian Systems Research and Development, Viet Nam Larry Wong, Program Director, Technology, Innovation, Environment and Sustainability (TIES), at the Institute of Strategic and International Studies (ISIS), Malaysia Zuhui Huang, Dean and Professor, Chinese Academy of Rural Development, Zhejiang University, PRC Sunipa Das Gupta, Senior Research Analyst, The International Food Policy Research Institute-New Delhi Office Jiangying Wang, Doctoral Student, Zhejiang University, PRC
The final report is compiled based on the following documents:
The Rice Value Chain from Jiangxi to Zhejiang in China by Jianying Wang, Thomas Reardon, Kevin Chen and Zuhui Huang
The Rice Value Chain from Eastern Uttar Pradesh to Urban Madhya Pradesh in India by Sunipa DasGupta, Thomas Reardon, and Kevin Chen
Rice Value Chain Study in the Mekong River Delta, Viet Nam by Dao The Anh, Thomas Reardon, Kevin Chen, Thai Van Tinh, Vu Nguyen, Nguyen Ngoc Vang, Nguyen Van Thang, and Le Nguyen Doan Khoi
Foreign Direct Investment in the Rice Value Chain with Special Focus
2

on the Mill Sector in Lao PDR by Larry C.Y. Wong, Kevin Chen, and Thomas Reardon Quiet Revolution of Rice Value Chains in Asia by Thomas Reardon, Kevin Chen, Bart Minten, Lourdes Adriano, Dao The Anh, Jiangying Wang, and Sunipa DasGupta Matrix for Policy Dialogue and Investment Opportunities by Kevin Chen, Thomas Reardon, Dao The Anh, Larry Wong, Jiangying Wang, and Sunipa DasGupta
Moreover, we deeply appreciate that the Ministries of Finance in PRC China, India, Lao PDR, and Viet Nam for approving of this important study. In addition, we would like to thank Ms. Lourdes Adriano from the ADB and Dr. Mark Rosegrant from IFPRI for their guidance and support throughout research process. In addition, this report would not have been possible without the help of those who conducted our field surveys in PRC China, India, Lao PDR, and Viet Nam. Special thanks goes to Ms. Claire Hsu, who provided valuable research support during the preparation of this report.
3

Table of Contents
Acknowledgments ............................................................................................................................. 2
Chapter 1 Introduction .................................................................................................................... 8 1.1. Background ..................................................................................................................... 8 1.2. Knowledge Gaps and Purpose of the Present Study ..................................... 9 1.3. Research Questions .................................................................................................. 10 1.4. Analytical Framework and Methods ................................................................ 12
1.4.1. Analytical Framework .................................................................................... 12 1.4.2. Methods ................................................................................................................ 16
1.5. Organization ................................................................................................................ 17
Chapter 2 Overview of Rice Sectors in China, India, Lao PDR, and Viet Nam ............. 18 2.1. Rice Sector Overview in PRC ................................................................................ 18
2.1.1. Rice Consumption ............................................................................................ 18 2.1.2. Paddy Production ............................................................................................. 19 2.1.3. Rice Imports and Exports ............................................................................. 20 2.1.4. Rice Value Chains and Markets .................................................................. 20 2.1.5. PRC Government Roles .................................................................................. 21
2.2. Rice Sector Overview in India .............................................................................. 23 2.2.1. Rice Consumption ............................................................................................ 23 2.2.2. Paddy Production in India ............................................................................ 24 2.2.3. Rice Imports and Exports ............................................................................. 26 2.2.4. Rice Value Chains and Markets .................................................................. 27 2.2.5. Government Roles ............................................................................................ 28
2.3. Viet Nam ........................................................................................................................ 29 2.3.1. Rice Consumption ............................................................................................ 29 2.3.2. Paddy Production ............................................................................................. 29 2.3.3. Rice Imports and Exports ............................................................................. 31 2.3.4. Rice Value Chains and Markets .................................................................. 32 2.3.5. Government Roles ............................................................................................ 33
2.4. Lao PDR ......................................................................................................................... 35 2.4.1. Rice Consumption ............................................................................................ 35 2.4.2. Paddy Production ............................................................................................. 36 2.4.3. Rice Imports and Exports ............................................................................. 42 2.4.4. Rice Value Chains and Markets .................................................................. 43 2.4.5. Government Roles ............................................................................................ 47
Chapter 3 Study Areas, Survey Methods, and Sampling Framework ............................ 48 3.1. China ............................................................................................................................... 48
3.1.1. Survey Areas ....................................................................................................... 48 3.1.2. Survey and Sampling Areas ......................................................................... 49
4

3.2. India ................................................................................................................................ 51 3.2.1. Study Areas ......................................................................................................... 51 3.2.2. Survey Methods, and Sampling Framework ......................................... 52
3.3. Viet Nam ........................................................................................................................ 55 3.3.1. Sampling Areas .................................................................................................. 55 3.3.2. Survey and Sampling Methods ................................................................... 57
3.4. Lao PDR ......................................................................................................................... 62 3.4.1. Study Areas ......................................................................................................... 62 3.4.2. Study Methods ................................................................................................... 62
Chapter 4 Rice Value Chain from Rural Jiangxi to Urban Zhejiang in China ............... 64 4.1. Introduction ................................................................................................................ 64 4.2. Upstream—Rice Farming ...................................................................................... 64
4.2.1. Structure of the Rice Farm Segment ........................................................ 64 4.2.2. Conduct of the Rice Farm Segment ........................................................... 87 4.2.3. Performance of the Rice Farm Segment ............................................... 115
4.3. Midstream—Transformation of the Rice Mill Segment ......................... 118 4.3.1. Structure of the Rice Mill Segment of the Value Chain ................... 119 4.3.2. Rice Mill Segment: Procurement, Sales, Finance, and Other Services ........................................................................................................................... 140 4.3.3. Performance of the Rice Mill Segment: Quality, Costs, and Profits ............................................................................................................................................ 160
4.4. Midstream—Transformation of the Trader Segment ............................. 175 4.4.1. Structure: Characteristics and Seasonality in Paddy and Rice Trading ............................................................................................................................ 175 4.4.2. Conduct: Procurement and Sales, Value-Chain Financing, and Other ................................................................................................................................ 180
4.5. Downstream—Rice Retail Transformation ................................................. 195 4.5.1. Structure of Traditional Rice Retail ........................................................ 195 4.5.2. Conduct of Traditional Rice Retail .......................................................... 197 4.5.3. Performance of Traditional Rice Retail ................................................. 201 4.5.4. The Rise of Modern Food Retail in Zhejiang ....................................... 204
4.6. Performance of the Rice Value Chain ............................................................. 208
Chapter 5 Rice Value Chain from Eastern Uttar Pradesh to Urban Madhya Pradesh in India ............................................................................................................................ 214
5.1. Introduction .............................................................................................................. 214 5.2. Upstream—Rice Farming .................................................................................... 214
5.2.1. Structure of the Rice Farm Segment ...................................................... 214 5.2.2. Conduct of the Rice Farm Segment ......................................................... 231
5.3. Midstream—Transformation of the Rice Mill Segment ......................... 249 5.3.1. Structure, Conduct, and Performance of Rice Mills ......................... 249
5.4. Midstream—Transformation of the Trader Segment ............................. 270
5

5.4.1. Structure, Conduct, and Performance of Rice and Paddy Traders ............................................................................................................................................ 270
5.5. Downstream—Rice Retail Transformation ................................................. 287 5.5.1. Structure of Rice Retail ................................................................................ 287
5.6. Performance of the Rice Value Chain ............................................................. 296
Chapter 6 Rice Value Chain in Mekong River Delta, Viet Nam ...................................... 300 6.1. Introduction .............................................................................................................. 300 6.2. Upstream: Rice farming ........................................................................................ 300
6.2.1. Structure of rice farms ................................................................................. 300 6.2.2. Farm management ......................................................................................... 306 6.2.3. Performance of the rice farms segment ............................................... 315
6.3. Midstream: Transformation of the Rice mill and Trader segments .. 317 6.3.1. Rural trader ....................................................................................................... 317 6.3.2. Mills ...................................................................................................................... 327
6.4. Downstream: Rice retail transformation ...................................................... 341 6.4.1 Urban traders .................................................................................................... 341 6.4.2. Modern and traditional retails ................................................................. 347
6.5. Performance of Mekong rice value chain ..................................................... 356 6.5.1. Costs, Rewards, and Overall Margins in the Rice Value Chain .... 356 6.5.2. Cost Items in the Rice Value Chain .......................................................... 358
Chapter 7 Case Study on Foreign Direct Investment in the Rice Value Chain: Lao PDR ............................................................................................................................................ 360
7.1. Background ................................................................................................................ 360 7.2. Investment in Rice Value Chain in Lao PDR ................................................ 364 7.3. FDI in the Mill Sector ............................................................................................. 368 7.4. Salient Issues Distilled .......................................................................................... 376
Chapter 8 Quiet Revolution in Rice Value Chains in Asia: Synthesis with Earlier Surveys .............................................................................................................................. 380
8.1. Introduction .............................................................................................................. 380 8.2. Transformation of the technology of the segments of the rice VC .... 382
8.2.1. Farm segment technology transformation .......................................... 382 8.2.2. Mill segment technology transformation ............................................. 384
8.3. Transformation of the marketing conduct of the rice VC ...................... 385 8.3.1. Farm Segment marketing transformation ........................................... 385 8.3.2. Mill segment marketing transformation .............................................. 386 8.3.3. Trader segment marketing transformation ........................................ 388 8.3.4. Retail segment marketing transformation .......................................... 389
8.4. Transformation of “value chain finance” in the rice VC ......................... 390 8.5. Structural Transformation in the rice VC ..................................................... 391
8.5.1. Farm segment structural transformation ............................................ 391 8.5.2. Mill segment structural change ................................................................ 392
6

8.5.3. Structural transformation patterns in the trader segment .......... 393 8.5.4. Structural Transformation in the retail segment ............................. 394
8.6. Transformation of government role in the rice VC .................................. 394 8.6.1. Government role in farm segment .......................................................... 394 8.6.2. Government role in Mill and Trader Segments ................................. 395
8.7. Conclusions ................................................................................................................ 395
Chapter 9 Major Findings and Implications for Policy and Investment .................... 397 9.1. Major Findings ......................................................................................................... 397
9.1.1. China .................................................................................................................... 397 9.1.2. India ..................................................................................................................... 412 9.1.3. Viet Nam ............................................................................................................. 420 9.1.4. Lao PDR ............................................................................................................... 432
9.2. Implications for Policy Dialogues .................................................................... 433 9.2.1. Policy Dialogues for China .......................................................................... 433 9.2.2. Policy Dialogues for India ........................................................................... 434 9.2.3. Policy Dialogues for Viet Nam ................................................................... 434 9.2.4. Policy Dialogues for Lao PDR .................................................................... 435
9.3. Implications for Investment Opportunities ................................................. 436 9.3.1. Investment Opportunities for China ...................................................... 436 9.3.2. Investment Opportunities for India ....................................................... 436 9.3.3. Investment Opportunities for Viet Nam ............................................... 437 9.3.4. Investment Opportunities for Lao PDR ................................................ 437
References ....................................................................................................................................... 446
7

Chapter 1 Introduction
1.1. Background
Recent research has shown that a new agri-food value chain (VC) triumvirate is emerging, which features traditional, transforming and modern agri-food supply chains. Traditional chains are “long” in terms of the number of segments or links, fragmented, uncoordinated, and relatively inefficient and unable to differentiate quality, assure food safety and traceability, and add value. Transforming-traditional VCs are traditional VCs that are beginning to transform, and are undergoing shortening with some disintermediation (via the disappearance of field broker links) and technological change at both the farm level, in the form of new farm inputs, and post-farm-gate, via technological change and investments in improved mills and warehouses, better packing and labeling, and in the form of technologies related to the service provision of distribution and retailing. Modern VCs are characterized by further and deeper changes along the same lines as transforming VCs, but are spurred by significant investment by modern private sector companies upstream (in input provision and design, and sometimes in farming itself), midstream (in logistics/wholesale and processing) and downstream (in retail and in exporting). These chains appear to feature greater traceability, greater production efficiency at both the farm and service levels, and disintermediation, or more direct sourcing from farmers, investments in quality and food safety, and use of labels and certification. Earlier research (Reardon et al 2012) demonstrated, for rice value chains going from commercial production zones to big cities in China, India, and Bangladesh, that there is indeed rapid change occurring: (a) upstream at the farm level, with the uptake of intensification technologies (tube-wells, fertilizer, pesticides, herbicides), differentiation of quality and varieties, ; (b) midstream at the level of processors/mills with dis-intermediation and consolidation (with direct purchase from farmers (eschewing the traditional rural broker) and direct sale to wholesalers in big cities and to retailers) ; (c) downstream at the retail level with the rise of supermarkets using modern retail methods to differentiate quality and sell at lower prices. These discoveries overturned the conventional wisdom that staple food value chains in Asia are stagnant, traditional and “sleepy”, and revealed the occurrence of ferment and rapid transformation, at least with restructuring, and at least from commercial agricultural zones near big cities.
8

1.2. Knowledge Gaps and Purpose of the Present Study
Five key gaps were identified by the above research in those countries as critical for the design of supportive policies and guidance of investment strategies aimed at maximizing the potential of VCs to improve food security in the region. The earlier research pointed to technology as a key driver of change in the value chains – but the work did not uncover its nature, its determinants, who is participating in using and shaping it, and what policy instruments are available to spur change in it. We conceive of this gap as existing at several levels, using the system-thinking that the VC structure inspires: upstream in input supply firms, upstream in farm technology uptake, and midstream in milling technology change. Thus, in the new work we have a component on technology change along the value chain, from farmers to mills and wholesalers, to retailers. The earlier research focused on the most commercial agricultural zones nearest to the big cities (with the exception of the Viet Nam study that had focused on the less advanced zone); but policymakers are also keenly interested in zones that currently have high potential but are characterized by low performance, zones with high poverty rates, and also zones of key strategic importance in rice supply. The earlier research used a small sampling of the mill sector to provide a broad stroke description of the situation. And, despite its preliminary nature, the research gave an initial glimpse of organizational and institutional change in the mill sector and showed its importance for the transforming value chains. Unfortunately, there has been little empirical research done in the region on that sector in the past 20 years (the little work that was done prior to this was in the 1960s-1970s when governments integrated mills to source public distribution networks). Although earlier work hinted at deep change, little is known or understood about organizational and institutional change in the mill sector (or its technological change, as noted in (a) above). Thus, we will expand our surveys on the mill sector in each of the three countries of China, India, and Viet Nam to explore the transformation in this segment in-depth – change in the milling technology, scale expansion, capacity use and costs and profitability and return on investment in different mill strata, mills’ relations with farmers, mill-government relations, mills’ sales to wholesalers and retailers, institutional issues (such as standards and contracts), marketing trends (such as labeling and packaging), and organizational considerations (such as market channel structure and barriers to entry).
9

Private sector participation in the integration of food supply chains in the region is growing, but is not well documented, especially those investments that have a significant impact on short- and long-term structural concerns and the fulfillment of the goals noted above. Thus, we identify opportunities for expanding innovative public and private partnership arrangements that employ the private sector’s profit-maximizing behavior in increasing national and regional food and nutrition security and organize them by type of engagement (input supply, processing, and distribution) and by scale (small, medium, large). In particular, we will also look at the impact of foreign direct investment on the rice value chain in Lao PDR and its impact on the technology use and organization of the value chain. We will also assess the policies that led to and conditioned this sort of FDI. Prior work on rice value chains opened the door to deliberations on public and private approaches to strengthening rice value chains to achieve equity/poverty alleviation, food security, and competitiveness objectives. There is a need to take further stock of policy approaches already happening and to push the envelope on forward thinking about innovative approaches that can be taken and cross-country lessons that should be drawn. There is a special need to draw implications from this in-depth study and its policy implications in order to identify opportunities for, and inform the detailed design of, investments by MDBs like ADB. This assures that MDBs’ investments achieve the broadest impact on food security in the region possible, while at the same time generating rural growth. The proposed project has undertaken rigorous primary data surveys to address the information gaps identified.
1.3. Research Questions
To address the above general issues, the project will address the following specific research questions for rice VCs:
1) What forms the costs and value-added across the segments (farming,
wholesale/logistics, milling, retail- both in the export and domestic markets) of
rice VCs extending from production areas into big cities, and thus what are the
cross-segment determinants of urban rice prices?
2) How do the answers to (1) differ over advanced and less advanced production
areas, where urbanization, agro-industrialization, and
infrastructure/transaction costs differ? What type of farm/farmers benefit from
these changes?
10

3) What organizational and institutional changes are occurring in rice VCs? What
are the determinants and patterns over the past decade in shortening of supply
chains in rice with what effect on costs in the chains?
4) What technological change is occurring in the various segments of the chain:
what are the points of technological change, capital deepening/investment, over
the chain's segments that have affected performance, with special emphasis on
inputs, farm, milling, and logistics? What are the policy and non-policy drivers1
and enabling factors that spurred these technological changes? What type of
farms/rural small and medium enterprises (SMEs) are early adopters of change
and what are their characteristics? Do these characteristics imply the
existence of barriers to the entry of new entrepreneurs? What will the
technologies portend for the food security debate?
5) What are patterns and drivers of quality differentiation, branding, packing, and
traceability in the VCs and who serves as their catalysts? Do standard
regulations (HACCP, SPS, etc.) help?
6) What are the detailed roles of linkage mechanisms in the chain such as contracts
and financing links?
7) What are the detailed roles of policy and interventions in each segment in
affecting the above? What are the scenarios with and without various types of
government interventions such as reserve management, input producer and
consumer subsidies, and intra-domestic trade regulations.
8) What is the interface of foreign direct investment and imports/exports (such as
export and import restrictions) with these chains in terms of inducing change?
9) What is the link between retailers’ behavior and strategy and fundamental
changes of the chain?
10) What are the food security policies of these (national and local) governments for
rice in the context of their implications/impact on the changes of the value
chains, and what could be the policy options for governments for sustainable
food security related to rice? What are the implications of the shortened and
technology-driven value chains for attaining inclusive growth? What are the
options for affecting rice value chains through trade and foreign investment
related policies, compared with domestic policies?
1 Note that these drivers can be a wide range of factors, including macro and agricultural policies, but also non-agricultural factors such as the return to nonfarm employment and its effect on the cost of labor.
11

Our first hypothesis is that the traditional VCs, and to a certain extent the transforming-traditional VCs are, because of their natures noted above, less able than the modern VCs to deliver affordable, nutritious, and safe food. These can be considered key goals in the region. A concomitant hypothesis is that private sector (midstream and downstream) investment in the VCs can facilitate the development of technologically modernized, efficient, adaptable, quality- and safety-generating, and inclusive (of the poor) food supply chains. Our second hypothesis is that the extent to which modern VCs can attain these advantages, and the reasons for unrealized potential in transforming-traditional VCs, is conditioned by (1) hard and soft infrastructure (logistics, storage, and information and communication technology (ICT) infrastructure); (2) financial arrangements/mechanisms to facilitate the participation of small-scale farmers and small- and medium-scale traders and processors; (3) technology adaptation, creation, and extension related to each segment of the value chain; and (4) transparency, predictability, and accountability in regulatory frameworks for investments and contracts. There is emerging evidence that the above conditioning factors (of infrastructure, financial mechanisms, and institutional and organizational arrangements and regulations) are themselves influenced by new private sector initiatives (midstream and downstream in the VC) in the Asia/Pacific Region. The private sector has resources and expertise that it is using for investments in all three of these to attain the goals noted above, as well as market-sustainability and scale-ability via linking to rapidly expanding urban markets and export markets, and fueled by profitability for the private sector as well as for farmers wanting to differentiate their quality and access modern markets.
1.4. Analytical Framework and Methods
We studied rice value chains in PR China, India, and Viet Nam. In each country, multiple major production zones are studied – in each zone the full set of surveys of segments were conducted. Furthermore, a case study on the impact of increasing land acquisition on the rice value chain in Lao PDR was conducted.
1.4.1. Analytical Framework
The study’s research questions can be grouped into the standard classification used in industrial organization studies to characterize subsectors or supply chains or value chains by their structure, conduct, and performance.
12

In terms of structure, the following questions were asked: How are rice value chains structured? What is the distribution across the three segments (defined in the next paragraph) of the formation of costs and value added? What differentiation do value chains display in terms of restructuring from traditional into intermediate–transitional and modern supply chains? How concentrated are the chains across segments and, hence, what share of a chain’s profits do farmers capture? How concentrated are the value chains within sub-segments - that is, what role do medium- and large-scale actors such as large farms, mills, supermarkets play, compared with marginal and small-scale actors? Structure is then assessed in two ways. First, structure in the value chains is represented by the distribution of output, costs, and profits across segments of a value chain. The segments for the value chains studied are (1) upstream—the farmers, as well as suppliers of inputs such as land, water, labor, fertilizer, and chemicals; (2) midstream—the traders (village traders, rural wholesale market traders, and urban wholesale market traders) and storage and processors (rice mills; and (3) downstream—the retailers. Knowing the structure can help determine, for example, whether the farmers’ share of total profit generated by the value chain is higher in a particular country, product, or quality of product, than in another. Second, structure in the value chains is represented by the distribution of output, costs, and profits across sub-segments in each segment. The relevant sub-segments per segment are large- and medium-scale actors versus small-scale actors, on the one hand, and rural versus urban on the other. Knowing this structure, and its differentiation for a given product in a given zone or country, can answer questions such as whether there are several forms or versions of the rice value chain in a given country where one is “more traditional” and another is “more modern.” Relative modernity can be measured in one or both of two ways. First, by length, as a proxy for transaction costs: a chain can be longer (with more actors) and thus more traditional; or shorter, with disintermediation, which is with fewer actors and more direct buying from suppliers. Second, by scale, in principal, as a proxy for efficiency or market power or both: a chain can have one or more segments dominated by large- or medium-scale actors. These criteria comprise a spectrum of value chain forms, from most traditional to most modern, with various intermediate structures. An example of a modern value chain that satisfies both criteria would be one in which the retailers are supermarket chains that buy rice from big mills that source directly from farmers. A very traditional value chain would proceed from small-scale farmers,
13
to village traders, to rural wholesale markets, to semi-wholesalers (who both wholesale and retail), to urban wholesale markets who ultimately sell via semi-wholesalers to small retailers in the city. In terms of conduct, a question is: What is the behavior of the actors in the value chains, differentiated into their segments and sub-segments, and of the different kinds of value chains per product, including traditional, intermediate-transitional, and modern? Conduct is assessed in four categories and three ways. The four categories of conduct correspond to how actors finance production, buy inputs, make their product, and sell it. The three ways each category is assessed are technical, physical, and/or geographical; institutional (such as standards and contracts); and organizational. The four categories and three ways are elaborated on below. The first category is related to finance, specifically value-chain finance, and in particular, buyers’ credit to suppliers and suppliers’ credit to clients. A value chain may be financed from within the chain or from sources external to it. Finance from within the value chain is based on the value-chain relationships, such as a trader advancing funds to a farmer who buys inputs, produces a crop, and markets the crop to the trader. Finance from outside the value chain is predicated on value-chain relationships, such as a bank lending to a mill because it has a contract with a retailer, which substitutes for collateral. This report focuses only on finance within the value chain: trader, miller, and retailer credit to suppliers and clients. Value-chain finance is one of many ways that value-chain actors can finance their production. Other examples include self-finance, which predominates, and credit, which is not always predicated on value-chain relationships, such as a straight bank loans or microcredit. All value- chain actors may also provide credit services to each other—farmers de facto lending to traders, traders advancing cash to farmers, retailers getting credit from mills, retailers allowing delayed payment by consumers, and so on. Finance within the value chain is assessed in the three ways already noted: (1) technical and /or physical: assessing the quantitative importance of traders’ credit to suppliers and buyers; (2) institutional: evaluating whether traders’ credit is linked to contracts and/or specification of meeting certain standards such as of quality; and (3) organizational: whether the credit is funneled via organizations such as cooperatives. The second category is related to input procurement. Farmers buy inputs; traders buy intermediate inputs such as paddy and factor inputs such as trucks,
14

petrol, and labor; mills buy intermediate inputs such as paddy and factor inputs (electricity, equipment, labor, and transport services); and retailers buy intermediate inputs (rice) and factor inputs (stalls, transport services, and labor). Input procurement is assessed in the same three ways: (1) technical and/or physical: assessing the quantitative importance of the kinds of inputs such as purchased seeds and herbicides in farmers’ costs, or transport services in traders’ and retailers’ costs, the geography and socioeconomics of their sourcing (such as whether the traders buy from small-scale farmers, whether retailers buy from small mills, and so on); (2) institutional: evaluating whether traders’ credit is linked to contracts and/or specification of meeting certain standards such as of quality; and (3) organizational: determining whether the credit is funneled via organizations such as cooperatives. The third category is related to output production technology. All actors in the value chain are considered to be producers, not just the farmers. Farmers grow paddy; millers mill paddy and produce rice; traders buy or broker rice or paddy and perform a service of storing and transporting and selling; and retailers also buy, store, transport, and sell the produce. Production technology is assessed in three ways: (1) technically, in terms of the inputs used, such as the intensity of labor use and capital per unit of output: for example, a supermarket may be more capital intensive than a traditional retailer; (2) technically, in terms of the scale of production and of farm, plant, or stall; and (3) economically, in terms of costs incurred (intermediate input and factor prices paid) by different actors. The fourth category is related to selling and marketing output. Farmers sell paddy; millers sell milling services; traders sell logistics, grading and sorting, and marketing services; and retailers sell the final product. This is assessed in the same three ways: (1) technical and/or physical: assessing the quantitative importance of the various kinds of products, such as varieties and qualities of rice; services such as providing delivery or credit along with the primary product or service; and the geography and socioeconomics of their marketing; (2) institutional: whether the marketing is done on contract or a spot market, and per standards or without; and (3) organizational: whether marketing is done in cooperatives or associations or individually, and off-market versus in clusters such as wholesale markets and wet markets. In terms of performance, the value chains as a whole and their component parts or segments can be analyzed with respect to two outcomes: efficiency and equity.
15

Of course there is a trade-off between them—for example, a cost in the system can be cut by disintermediation via eliminating village traders (a common trend), but that means an equity effect (employment) on small-scale traders. Efficiency measures the cost of food and resources that were used to move the crops from the farmers’ fields to the retail shelves. This book does not present partial or total factor productivity analyses, but rather comparative cost estimates over actor types and study zones per product. The study also evaluates traditional versus modern retail prices for rice. Equity measures the “inclusion” of poorer groups in the value chains and the effects on poor consumers. This is analyzed by comparing prices earned by different scales of farmers (i.e., small-, medium-, and large-scale), and their participation in different value chains. Implicitly, this issue is also addressed in the other segments by examining structural change, in particular, concentration within the trading, mills, and retail segments. Food prices charged by different kinds of retailers are considered, but the study did not include consumer surveys.
1.4.2. Methods
First, “Stacked VC-segment surveys” were conducted in each combination of production zone and big city: that is, per zone/city there was a farm survey of; trader/wholesaler surveys; miller survey; and retail surveys of traditional retailers and supermarkets, and consumers. This allowed a scientific analysis of the VC and its segments, testing for impacts and conditions. Second, due to the relatively new nature of this topic (foreign direct investment in rice value chains), and budget constraints, in Lao PDR, we undertook a case study, starting with an inventory of prior work, identification of a case study, and then performed key informant interviews in the relevant value chain segments. Third, using findings from the surveys, a menu of the priority investment areas for rice supply chain partnerships are identified in participating countries. This menu is constructed using a taxonomy of the supply chain areas and strata of farmers, millers, wholesalers, identified by the survey data. Fourth, desktop review and stakeholders’ consultation will be conducted to identify major policies and regulations and their impacts along the rice value chain in China, India, and Viet Nam. A particular policy issue on the impact of foreign direct investment on the rice value chain was also examined.
16

1.5. Organization
This report is organized as follows: chapter 2 provides a rice sector overview by country, chapter 3 discusses the study areas, survey methods, and sampling frameworks by country, chapters 4-6 examine the rice value chain transformation in China, India, and Viet Nam, respectively, chapter 7 offers a case study on foreign direct investment in the rice value chain in Lao PDR, chapter 8 provides comparative results with earlier surveys, and finally, chapter 9 reviews major findings by country and policy and investment implications.
17

Chapter 2 Overview of Rice Sectors in China, India, Lao PDR,
and Viet Nam
This chapter provides background information for the rest of the book. The first two sections lay out the key points about the rice sector; their patterns and trends in the sample zones in the economies studied in terms of consumption, production, imports and exports, domestic marketing, and the key points of government policy on the two products.
2.1. Rice Sector Overview in PRC
The overview of rice in the PRC relies on Reardon et al. (2012) and is updated with new information.
2.1.1. Rice Consumption
Though the PRC is the world’s top rice producer, it is also the top rice consumer owing to its huge population and diet preference. Rice is a main part of the cereal diet in the PRC, accounting for about 45% of per capita consumption of cereal from 1969-2001 while wheat and maize accounted for almost the other half. Despite the increase in population, at the end of 2011, total annual consumption in the PRC was 119.5 million tons of milled rice, and had decreased from 134 million in 2000. Per capita rice consumption (including for food, feed, seed, and industrial use) in the PRC, fell about 7% from 2000 to 2011. Timmer and Dawe (2010) note that in the PRC, rice accounted for 38.7% of caloric intake in 1970 but dropped to 26.8% by 2007, or from a low of 444 in 1961 to a high of 872 in 1990, and then dropped to 799 by 2007. However, there are differences between rural and urban areas. For example, in 2011, it was 80.7 kg per capita for urban consumers and 97.1 kg per capita for rural residents (The PRC Statistical Yearbook, 2012). There are also differences by purpose. Lee and Kim (2007) note that over 1980-2004, rice demand decreased for food and seed purposes, while the demand for feed and industrial uses steadily increased.
18

2.1.2. Paddy Production
Two main kinds of rice are produced: japonica and indica. In 2003 about 61% of rice produced was indica and 26% was japonica, while in 2011 about 68% was indica and 31% was japonica (the Ministry of Agriculture of the PRC). The rice area rose from 27 million ha in 1961 to 35 million ha in 1980, and then dropped to 30 million ha during the 2000s. Now the PRC produces about 190 million tons of paddy rice per year which is close to one third of total world rice output, and the output in 2011 was 201 million tons of paddy rice (The PRC Statistical Yearbook, 2012). The PRC’s rice is largely supplied by millions of small farmers with an average land size of 0.4 hectares. Paddy production varies widely within zones and between regions. There are three major rice-producing regions. Region 1 (the northeast), including provinces such as Heilongjiang, Jilin, and Liaoning, produced japonica rice only. Region 2 (the east), including Fujian, Guangdong, Guangxi, Guizhou, Hainan, Hubei, Hunan, Jiangxi, Sichuan, and Yunnan provinces, produced only indica. Region 3 (southeast), including Anhui, Jiangsu, Shanghai, and Zhejiang, produced both indica and japonica. Hunan, Jiangxi (our study province), and Heilongjiang were among the three largest rice producing provinces, accounting for about 14%, 11% and 8% of rice cultivated area, respectively, and about 12.8%, 10.3% and 9.7% of rice production (The PRC Statistical Yearbook, 2012). Jiangxi ranks second among indica-growing provinces. The PRC’s paddy yields more than tripled since 1961, when they were roughly 2 t/ha, to 6.8 t/ha in 2011 (The PRC Statistical Yearbook, 2012). The PRC’s rapid yield increase can largely be attributed to the adoption of hybrid rice. Less than 1% of rice area was planted with hybrid rice in 1976, but this increased to about 54% in 1991 and about 63% in 2008 (Li et al. 2009). The PRC’s rice culture also “de-seasonalized” with the diffusion of irrigation. Commonly, the rice crop in the PRC has three seasons: (1) planting in February (early indica planted in the south); (2) mid-year planting (in May, such as indica in the south and japonica in the north); and (3) late year crop of indica, planted in July in the south. From 1990 to 2011, statistics show a shift toward mid and late rice, reflecting a shift toward japonica and increased rice production in the north, and toward mid- and late-season rice in the south. Thus we can say that the diffusion of new varieties had been accompanied by a shift to higher quality
19

rice (quality here refers to cosmetic attributes such as the length to width ratio of the milled kernel).
2.1.3. Rice Imports and Exports
The PRC is basically self-sufficient in rice. Rice trade accounted for less than 1.5% of total consumption or production. The PRC was a very small net rice importer in 1995 but a net exporter in 2000, 2005, and 2009. In 2000 and 2009, the PRC exported 1.8 million tons of rice, which occupies less than 1% of its output. However, in 2012, important changes took place. The PRC imported 2.35 million tons of rice from Viet Nam (65.9%), Pakistan (24.7%), and Thailand (7.5%), 1.77 million tons more than last year. But The PRC only exported 0.279 million tons of rice, 0.236 million tons less than last year, with year-on year decline of 45.9 %.(The Ministry of Commerce of the PRC, 2012).
2.1.4. Rice Value Chains and Markets
There has been a secular trend for concentration of the rice mill sector. Most paddy was processed in town-level mills, which numbered around 100,000 in the second half of the past decade (Mckee, 2010). However, recently large agribusiness companies, such as The PRC Oil and Food Corporation (COFCO) and Singapore’s Wilmar International, have invested in large rice mills. In 2003 about 73% of the rice mills were private sector and 26% public sector (like COFCO). Companies with large-scale mills (about 25 of these companies by the second half of the 2000s) may account for roughly a quarter of rice milled. It appears that village small mills milling 5-10 tons per day have largely disappeared in the second half of the 2000s. Most remaining mills fall within a capacity of 50 to 200 tons per day. The number of milling companies was about 7,600 in 2007 and declined by 5.1% from that of 2008, but the number of mills with capacity of more than 400 tons per day increased from 81 in 2007 to 115 in 2008 (He, and Wen, 2009). In 2008, mills in Heilongjiang, Jiangxi, and Hubei accounted for 14.9%, 14.5% and 13.2% of national capacity, respectively (He and Wen, 2009). Modern food retail is developing very quickly in the PRC, from none just before 1990, to a low base in the early and mid-1990s, to rapid growth in the 2000s (Hu et al. 2004; Reardon et al. 2012a, 2012b). Reardon et al. (2012a) estimate that some 50% of rice consumed in Beijing was purchased from a modern retail chain. At least based on the findings of the prior study focusing on the rice supply chain from Heilongjiang to Beijing (Reardon et al. 2012a), there has been a rapid increase over the second half of the 2000s in rice packaging and branding,
20

mainly with mill brands, accompanied by differentiation of rice types and qualities sold in urban retail. This is especially pronounced in supermarkets, but also widespread in urban retail in Beijing.
2.1.5. PRC Government Roles
The government has a very limited direct role in rice markets. The government discontinued its rice shops in the early 1990s and limited itself in the 2000s to purchases to stock public reserves for price stabilization; in 2008, the government purchased 7.5 million tons (only 4% of national output) of rice for public stocks. These stocks were then sold to private traders. The government set an indicative floor price but did not have strict enforcement mechanisms in place so that prices tended to fluctuate, from market forces, around the floor price. The floor price, however, grew quickly (Figure 2.1). Figure 2.1: Minimum paddy purchase price (USD/ton)
Data source: Execution plan of minimum paddy purchase price for each year. 6.45 RMB=1 USD
The government has continuously stated the goal of grain self-sufficiency. In 2009, the National Development and Reform Commission (NDRC) issued a detailed plan to raise grain production by 50 MMT by 2020. The government issued its annual “Document No.1” for 9 years, noting a commitment of the government to expand investment, subsidies, and financial services, public services, and policy support to rural areas, with priority given to, for example, increasing rural income (2009), reinforcing agriculture and rural development (2010), improving water conservation in farmlands (2011), and enhancing agricultural science and technology (2012). The four major grain subsidies the central government provided are summarized in Table 2.1.
210240270300330360390420
2005 2006 2007 2008 2009 2010 2011 2012
Early indica Middle and late indica Japonica
21

Machine purchase subsidies were mainly directed toward harvesters, rice transplanters, seedling planters, seedling trays, and paddy drying equipment. Large tractors (over 100 horsepower), large planters, large combines, large rice germination (programmable) equipment, and dryers can been subsidized at 0.12 million RMB per machine (per the 2012 Agricultural Machinery Purchase Subsidy Implementation Guide of the Government of PRC). There are also agricultural machinery operation subsidies, such as subsidies for rice transplanting, and incorporating straw into the soil (Agricultural Machinery [2011] 2, Government of PRC). Table 2.1: Four major grain subsidies.
Year Direct
subsidy Fine seed subsidy
Subsidy on purchase of
machine
Comprehensive agricultural
subsidy
Total (billion
USD)
2004 1.8 0.44 0.01 — 2.25
2005 2.05 0.58 0.05 — 2.67
2006 2.2 0.64 0.09 1.86 4.8
2007 2.34 1.03 0.31 4.28 7.96
2008 2.34 1.91 0.62 11.1 15.98
2009 2.95 3.08 2.02 11.72 19.76
2010 2.34 3.16 2.4 11.1 19.01
2011 2.34 3.41 2.71 13.33 21.8
Data sources: the annual government work report, as well as coverage for agricultural subsidies.
6.45 RMB=1 USD
The text table below provides a summary of major agricultural domestic and trade policies since 2001.
Policy/Effective year 2001 2002 2003 2004 2005 2006 2007 2008
Accession to WTO X
Tariff rate quotas X X X X X X X X
Seed subsidies X X X X X X X X
Direct subsidies X X X X X
Price support program X X X X X
Elimination of taxes on agricultural
land X X X X X
Subsidy on purchase of machinery X X X X
VAT exemption for farm use of
seed and fertilizers X X X
Direct subsidy for farm use of fuel X X X
22

and fertilizers
Elimination of the 13% VAT rebate
on ethanol exports X X
Agricultural insurance premium
subsidies X X
Elimination of the VAT rebate on
grain exports X
Grain export taxes X
Fertilizer export duties X
Grain domestic transportation
subsidies X
Source: Cheng (2010)
In the text table above, there is a mix of domestic policies and trade policies; as we are focused on the domestic rice supply chain we focus on the domestic policies. While we are cognizant that policy is but one of many factors (others being for example the rising wage rate) affecting farmers and other actors in the value chain, we note that the main tendency of the policies put in place recently is to increase, all else equal, the incentive for intensification of the use of purchased seed and fertilizer (as there are subsidies and tax exonerations on these) and on farm machinery (as there are subsidies on fuel and on farm machinery). The presence of these policies may help to explain patterns that we observe in the data from the surveys we undertook in Jiangxi. Also there is a price support policy, which mainly implies the reserve stock system; there too we may expect to see some effect on farmer, trader and mill behavior in terms of sales to the government for storage, at least as a hypothesis.
2.2. Rice Sector Overview in India
Similar to the case of PR China, the overview of rice in India that follows relies on Reardon et al. (2012) but provides related updates with new information.
2.2.1. Rice Consumption
Rice comprised only about half the food grain consumed in India - it constituted 53% of cereal consumed in India in 2007-08, a bit up from 52.9% in 2000-01 and 50.1% in 1993-94. The trend in per capita consumption of rice in India shows a gradual average decline – from 85 kg in 1993, to 75 kg in 2000, to 81 kg in 2008. This trend seems
23

to corroborate the observation of rising incomes and the falling share of food in the overall household consumption budget, in India, over several decades. In India, the share of food in overall household consumption budget has decreased from 60% in 1972 to 51% in 2004; with the share of cereals in the total food budget decreasing – in the rural areas from 55% to 35%, and in urban areas from 35% to 25% over 1972-2006 (Minten et.al., 2008). Extant literature on cereal demand in India shows that while low income groups still show positive income elasticities of demand for cereals, income responsiveness for the population as a whole is declining. A demand supply projection by Ganesh Kumar et al. (2011) estimated expenditure elasticity for rice to be -0.2105. However, there are consumption differences between rural and urban areas. For example, in 1999-2000 urban residents consumed 5.2 kilograms (kg) of rice per capita, while rural residents consumed 6.78 kg (www.indiastat.com).
2.2.2. Paddy Production in India
The major breakthrough in cereal production in India came with the Green Revolution in 1969-70. Paddy production on average increased by 45%, with the average production being around 52 million tons; the area under paddy cultivation was about 40 million ha on average with 41% being covered by irrigation. Yields increased by almost 30% compared with the previous decade, reaching an average of about 1.3 tons per ha. Towards the end of the 1980s production reached 70 million tons, which further increased to 80 million tons on average during the 1990s. The area under production was around 43 million ha, of which 50% was irrigated. Yields on average increased by 40% compared with the 1980s, reaching around 1.8 tons per ha in the 1990s. In the 2000s, production averaged around 90 million tons, though productivity had reached a plateau, at around 2.0 tons/ ha. Since the latter half of the 1980s there has been a gradual decline in the variability in production and yield of food grains in general, and paddy per se, attained with the spread of HYV throughout India, the expansion of irrigation, and the development of varieties resistant to pests and diseases (Chand and Raju, 2009). The major varietal breakthrough was in the form of the introduction of high yield cultivars (HYV)- within a span of 40 years between 1970-2008/09 more than 500 high yield paddy varieties have been released. 15% of these being on the national seed chain, while only one third of these has been widely adopted and
24

popularized (Menon, 2001). 16 hybrid varieties were released, of which 3 are privately bred and the rest are publicly bred. Only 5 varieties are marketed, by public and private seed vendors. By 2005 about 80% of the total rice area in India is planted with HYV (Jha et.al. 2007); while in 2008 only 3% of the total rice area in 2008 was under hybrid rice (Gulati, 2010). With the varietal breakthrough, and rapid diffusion of irrigation, paddy production has not only become geographically dispersed across different ecosystems (Irrigated, Rain fed Upland, Rain fed Lowland, and Flood Prone), but has also been “de-seasonalized” - paddy is cultivated almost round the year (Zaid or summer, Kharif or rainy season, Rabi or winter and autumn rice). 86% of paddy is Kharif paddy; while 55% of the area under paddy production is irrigated (www.indiastat.com ). About 67% of the total paddy output in the country comes from the swathe formed by the states of Haryana, Punjab, Uttar Pradesh, Bihar, Jharkhand, Chhattisgarh, Orissa, West Bengal and Assam (Agricultural Statistics at a Glance, 2012). 78% of the paddy output coming from this swathe is from eastern areas: Bihar, Eastern Uttar Pradesh (our study area in this report), West Bengal, Jharkhand, Chhattisgarh, Orissa, and Assam. These eastern areas mainly produce non-aromatic (aromatic is for example basmati, also called fragrant rice in Southeast Asia) paddy. The other 22% of the paddy in this swathe comes from Punjab, Haryana, and Western Uttar Pradesh (Singh, 2012) with 16% comprised of non-aromatic paddy, and 6% of aromatic paddy (www.airea.net) . The entire state of Uttar Pradesh (or “UP”, our study state for both the earlier report and the present report) contributed around 13% to the All India production of rice in 2011-12, with 85% of this coming from the Eastern part of the state (comprised of 27 districts out of the total of 72 districts in the state) and only 15% from the west (Agricultural Statistics at a Glance, 2012; Singh, 2012). Farms are smaller in eastern UP compared with western UP. 82% of the farm households in eastern UP are marginal farmers with 39% of the total operational holding (essentially farm area), 13% are small farmers with 24% of operational holding, and 5% are medium/large farmers with 38% operational holding. Note that while the average farm size is 0.63 ha, Eastern UP is somewhat concentrated if one notes that 95% of the farms have only 63% of the land; however, the average farm in Western UP is 0.95 ha, so that the average for the whole state is 0.83 ha.
25

There is no official information distinguishing the marketed surplus rate of Eastern UP per se, but official data show paddy farming in general is commercialized in the state, with the state level marketed surplus rate at 63% in 1988/89 and 80% in 2006/07; the latter is similar to India as a whole (Agricultural Statistics at a Glance, 2009). The increase in paddy production in Eastern UP over time, along with the dispersion of the paddy culture across four different agro climatic zones in the region wherein paddy is cultivated as a main “Kharif” or rainy season crop has mainly been driven by the adoption of HYV rice as a rainy season (kharif) crop since the 1980s along with the wide spread diffusion of tube-well irrigation or other ground water irrigation methods in Uttar Pradesh, on the whole – a trend observed in many other rain-fed ecosystems in the country (Selvaraj and Ramaswami, 2006). Moreover, to further promote rice production in eastern UP and other eastern areas, the Government of India launched a program called “Bringing Green Revolution to Eastern India (BGREI)”, in 2009. The program was designed to develop cropping in Eastern Indian states, taking into consideration the problems faced by the Green Revolution impacted Northern states like Punjab, Haryana, Western Uttar Pradesh, due to over-exploitation of resources (heavy use of ground water, chemical runoff, and so on). 41% of the funds of BGREI (that total nearly 11 million USD) are for rice activities: increasing SRR; distribution of hybrid rice seeds; cultivation of summer (Zaid) paddy in flood prone areas; bringing 5-7% of area under aromatic rice cultivation; distribution of farm equipment (in 2008-09 the government distributed 5,360 implements including rotovettors, zero tillers, seed drillers, and conoweeders; in 2009-10 these totaled 8,488, and 11,000 in 2010-11); distribution of NPK fertilizers (in 2008-09 government distributed 1.4 mmt; in 2009-10 1.6 mmt, and in 2010-11, 1.8 mmt) and gypsum for reclamation of sodic land. 12% of the total fund allocated for Eastern UP under BGREI has been for the creation of additional irrigation. By 2010-11 irrigation had been increased by 300,000 ha.
2.2.3. Rice Imports and Exports
India is basically self-sufficient in rice. External rice trade is a very minor part of the rice economy in India. India exported on average 4.5% of its rice output during the crop years (CYs) 2001/02–2011/12. India’s rice imports had been negligible (less than 1% of total rice consumption in any year since 1990). That
26

very little rice was externally traded by India justifies the focus on the domestic market as the rice value chain’s end point.
2.2.4. Rice Value Chains and Markets
From the late 1960s through the late 1990s, the mill sector featured the co-existence of huller mills with modern mills comprised of bulk parboiling (sometimes pressure-parboiling), conveyor-belt transport, paddy cleaning, rubber-roll shelling, and cone-polishing. Hullers (not expensive) spread throughout the state, on the heels of rural electrification. The huller numbers leapt from 34,000 in the 1960s to 100,000 in the 1980s. Starting in 1984 the government subsidized a shift to modernized hullers (http://mofpi.nic.in). Modern rice mills were regulated by state level cooperatives and parastatals. By the 1980s, only 9% of mills in West Bengal were modern ones; in the southern rice-producing belt the proportions (modern mills to total mills) varied from 16-60 per cent; in the rice exporting belt of the north-west these accounted for 30% of mills in Punjab and 55% in Haryana; in Bihar they amounted to but 1% (Harris-White, 2005). Low capacity utilization (Lele, 1970) and high marketing and processing costs led to their long-term dependence upon state subsidies. In 1997, the Rice Milling Industry (Regulation) Act 1958 & Rice Milling Industry (Regulation & Licensing) Rules 1959 was repealed and this sector was de-reserved. That meant that larger scale firms were allowed to invest in mills. New technologies (for rural India) came in, such as husk-fired mechanical driers, reducing pre-milling processing from 3-5 days to 24 hours and increasing the milling season from 250-300 days to the whole working year. Modern mills still remained eligible for subsidised loans for technical upgrades under a central sector huller subsidy scheme that was launched in the early 1990s, subsidizing about half the cost of the upgrade. According to the Annual survey of Industries in 2003-04, 37% of total registered food processing units mill rice. 99% of the rice mills are under private ownership (ASI, 2003-04).By 2003, 50% of the overall rice produced was processed by modern mills with huller-cum-disc-shellers, or rubber roller, 40% by single hullers and only 10% by hand pounding (Ministry of Food Processing Industries, Government of India, 2003). In 2001, the rice milling sector processed around 58 million tons of paddy annually and had a turnover of around 5.5 billion USD per year (Planning Department, Government of Uttar Pradesh, 2001).Sales of milled rice in India are restricted under the Rice Milling Industry Act 1958.Rice millers are required to
27
supply a certain proportion (levy) of the milled rice to the Public Distribution System (PDS) at a fixed processing margin.Levy rates and margins vary across states. Distribution of rice at the retail level takes place through: 1) the government-run Public Distribution System and 2) the open market characterized by the coexistence of the “traditional retailer” and the “modern retailer”. The PDS of grains to consumers is executed through Fair Price Shops (FPS). The latter are usually not directly run by the government, but are given on lease to private individuals who get commissions based on the volume of sales. There were about 476,000 in rural and urban India in 2004, having gradually spread over time (Rashid et al., 2008).
2.2.5. Government Roles
About 33% (in 2010/11) of rice in India is under the government purview - a relatively high share by Asian standards after widespread market liberalization in the 1990s. This share had been increasing staggeringly from 15.8% in 1996/97, to 25.1% in 2000/01, and 29.5% in 2007/08 (Rashid et al. 2008). The Government uses two channels for paddy/rice procurement in India: 1) directly buying paddy from farmers at the Minimum Support Price and getting it milled by private millers – this is the custom milling of rice; 2) buying milled rice from the private mills at a pre-announced levy price. This is the levy system of procurement under which the mills are mandated to sell a fixed proportion of the milled rice to the government before they can make any open market sales. The proportion of levy rice that a miller must sell to the government differs across state and time; for example in UP in 2012/13 this was 60%. At the all-India level the importance of levy procurement has been declining over time vis-à-vis custom milling – in 1990 around 65% of the total rice procured by the government was through levy, while in 2012-13 this has declined to 30%. In UP, one of the leading rice producing states in the country the share of levy procurement has come down from 99% in 1990-91 to 67% in 2000-01 to 65% in 2010-11 (Gupta, 2013). 37% of the total rice procured from the state comes from the Eastern districts (Singh, 2012). About 28% of the rice economy in Eastern UP is regulated by the government, which leaves 72% to the private purview- this overwhelmingly private sector – mainly the realm of farmers, private millers, private traders, and private retailers.
28

2.3. Viet Nam
2.3.1. Rice Consumption
Since the on-going economic reform process took off in the early 1990s, Viet Nam has sustained relatively rapid economic growth and poverty reduction, while attaining national food security. During the 2005 to 2007 period, Viet Nam’s per capita dietary energy supply was 2770 kcal per day, surpassing the results of all other Asian developing countries and China. The share of rice in dietary energy supply has fallen from a peak of 75% in the mid to late 1980s to about 55% recently and that number in dietary protein supply fell from 63% in 1990 to 45% in 2007 (Dao et al., 2010). Per capita consumption now in Viet Nam is approximately 135 kg, although this has fallen to just over 100 kg within the urban population. Nevertheless, there remain significant pockets of poverty and food insecurity in Viet Nam. The food poverty rate is almost 30% and some 20% of children under age five are moderately or severely malnourished (Jaffee et al., 2011).
2.3.2. Paddy Production
Between 1990 and 2010, national paddy production doubled from 19.2 million tons to nearly 40 million tons. During the 1990s, both the area planted and the productivity change each grew at a relatively rapid pace. The area of dedicated rice land increased only marginally from 4.11 million ha in 1990 to 4.21 million ha in 2000, yet improvements in water resources management and the availability of shorter growing period varieties enabled an increase in the intensity of plantings (i.e. crop seasons per year) from 1.47 to 1.82. Therefore, the total sown area for rice rose steadily during the 1990s, reaching an all-time high of 7.67 million hectares in 2000. Over time, the pace of productivity growth has slowed somewhat, having averaged more than 2.8% per annum in the late 1990s, yet only around 1.5% per annum during the past five years. In 2010, average national yields were 5.32 tons/ha, yet with wide variations among seasons, locations, and farm size categories. Average national yields have been increasing about 1 ton per hectare per decade (Jaffee et al., 2012). Mekong is the most important area for rice production in Viet Nam. These advances occurred on the basis of long and sustained investments in irrigation canals and other water resources infrastructures, in agricultural research and advisory services, as well as an enormous amount of hard work by farming households. Despite frequent, localized problems with flood inundation,
29

saltwater intrusion, drought, and/or outbreaks of pests and diseases, the overall regional pattern of output expansion is remarkably robust. The MKD farmland dedicated to rice production has actually been declining over the long term. Such land amounted to 2.238 million hectares in 1980, thirty years later—in 2010—it was 1.929 million hectares, some 309,000 hectares (or 14%) less. However, the sown area for paddy has continued to expand. Historically, in most parts of the Delta only one rice crop was grown. Yet, with the successful development of shorter season growing varieties and with improved flood and water management measures, an intensification of production has occurred, first involving the shift from single to double cropping, and, more recently, to the development of triple cropping in suitable agro-ecological areas. Over time, the single cropped areas (typically in the coastal zones) have become less and less important. And, while the triple cropped areas accounted for only 18% of the region’s plantings in 2000, a decade later they accounted for 39% (Jaffee et al., 2012). The most productive season is the Winter– Spring season (rice cultivation begins in the winter and harvesting begins the following spring), for which average yields have approached 6.5 tons/hectare in recent years. The W-S crop has recently accounted for just under 50% of the annual paddy production of the MKD and is the primary source of rice sold as exports. The second most important season is the Summer-Autumn season. This is frequently impacted by extended periods of flood inundation. Average regional yields of S-A season have been about 4.7 tons/hectare in recent years. The Autumn-Winter crop now accounts for less than 10% of the annual MKD output. Recently, average yields for this season have topped out at 4 tons/hectare (Dao, 2010). The structure of rice cultivating farms in the MKD differs markedly from that in most parts of the country. This relates not only to the greater prominence of double and triple season cropping, but also the size of many rice growing farms. Nation-wide, about 47% of growers have rice plots of less than 0.2 hectares, which account for over 63% in the Red River Delta rice production area and less than 8% percent in MKD. Nationally, less than 3% of rice growers have more than 2 hectares under cultivation; this share is 14% in the Mekong Delta. While the Mekong Delta accounts for only 16% percent of the total number of rice growers nation-wide, it accounts for 55% and 89% of those national rice growers with production areas between 0.5 and 2.0 hectares and more than 2.0 hectares, respectively (Jaffee et al, 2011). If there ever was a ‘typical’ MKD rice grower, it is increasingly difficult to define this actor today. According to results from the VHLSS, the majority of MKD’s 1.46 million rice growers are now net buyers of rice. Most ‘smaller’ growers in the
30

MKD can be defined thus: 1.25 hectares- rely upon rice for only a small (and evidently, declining) share of household income. Smaller growers tending to rely primarily on household labor, are less inclined to use certified seed, have had lower adoption rates of sustainable practices, and utilize little mechanization. Most of the very small and the middle size (1 to 1.75 ha) growers sell the majority of their paddy. However, most of these buy back rice with a value equivalent to or greater than the value of their paddy sales.
2.3.3. Rice Imports and Exports
Since the Renovation reforms, the MKD has resumed its critical place as a major source for the nation’s rice supply and export. The region’s share of national output has risen from 49% in 1990 to 51% in 2000 and 53% in 2009. Also, the bulk of the MKD’s expanded rice production has been exported. In the early part of the 2000’s, about 40% of the MKD’s rice output was exported. During the past two years, this share has grown to between 65 and 70 percent. The region accounts for at least 95 percent of Viet Nam’s rice exports (Jaffee et al., 2011). Between 2000 and 2012, Viet Nam’s rice export volume increased from 3.48 million tons to 8.1 million tons, consisting mostly of rice from the Mekong delta. Rice also dominates Viet Nam’s food exports, which are valued at $2 – 3.7 billion (GSO, 2012). Viet Nam currently accounts for more than 20 percent of world rice exports. Viet Nam’s rice exportation was managed by Viet nam Food Association (VFA), which has contracts with mills and export companies. The provincial authority is less involved in rice exportation, and so it will be difficult to precisely estimate the rice exportation by province. The role of MKD rice in ensuring food security has thus grown internationally, rather than just nationally over the past decade. This is even more evident when one considers that a large and growing proportion of the export trade was carried out on the basis of government-to-government transactions with the shipped rice frequently being distributed through safety nets or other concessional government programs in the Philippines, Indonesia, Cuba, Africa and elsewhere. In recent years, the quantities of MKD rice distributed abroad through such public distribution channels—some 2.5 to 3.0 million tons per annum, was greater than the amount of MKD rice sold or otherwise distributed domestically outside of the MKD and the nearby HCMC metropolitan area (Jaffee et al., 2011). Viet Nam also imports a small quantity of rice from neighboring countries like Cambodia and Laos, mostly through informal trade with an estimated volume of about 1 million ton/year.
31

2.3.4. Rice Value Chains and Markets
From the post-production process, the ‘value chain’ adds considerable cost, incurs considerable physical and quality loss, and contributes little value-added. Most farmers harvest paddy manually. Labor constraints in some areas result in harvesting the paddy when it is overripe. For the Summer-Autumn crop, rice plants are knocked over by falling rain and therefore harvests must be done when rice is inundated by floodwater. Physical crop losses of 2 to 3% occur and quality is adversely affected. The harvested paddy is wet and needs to be properly and evenly dried in order to prevent cracking. The physical losses are estimated to range from 1.14% for the Autumn-Winter crop to 3.49% for the Summer-Autumn crop and 2.12% on average for the entire year (Jaffee et al., 2012). In the Mekong rice value chain, storage is one of main constraints. In the past, when there was generally a single rice crop in the MKD, farmers regularly stored and dried paddy in their homes because they had time after the harvest. Now with two seasons or three seasons per year farmers don’t have enough capacity for in-home storage. Also, cooperatives or private mills in the supply chain rarely have high-quality storage capacity. Drying services have existed in the area for several years. Semi-dried or wet paddy is transported by barge at a small-scale (50 ton/day) by local traders. In the low season, farmers can sell the dried paddy, but in the high season, farmers mostly sell the wet paddy in the field. The trader brings wet paddy to the drying service provider, and then sells the paddy to millers who husk the paddy, which is then transported to larger millers who produce the polished or unpolished white rice. Before milling, paddy tends to be stored outside or in the barges, perhaps under some kind of shading or roofing. Consequently, physical losses occur again here, estimated at 1.7% on an annual basis (Jaffee et al., 2012). According to Jaffee’s estimation, between the farmers’ field and the first stage of processing, approximately 1 million tons of paddy is damaged or otherwise physically lost. The value chains for MKD rice remain remarkably underdeveloped from both a physical and an institutional perspective. While there are certainly exceptional outliers, the chains are generally characterized by the following features: First, a lot of stakeholders participate in the chain, thereby making the chain "long". In the domestic channels, there are about six actors between the rice field and the consumer; for exports, about five actors are active from the farm-gate to the shipping port.
32
Second, even with the majority of small farmers and traders involved in the rice chain, instances of collective action are limited. This is the result of the current period of cooperative failure in Viet Nam and the Cooperative law’s prejudice against these actors. Now there are few well-functioning farmer cooperatives or other joint action groups. Local traders, millers, or transport operators function mostly through informal commercial networks. The leading state owned mill and rice trading enterprises operate within a cluster of parent and subsidiary companies—probably with high levels of interaction. Although there is a Rice Association comprised of most of the leading exporters, its functions are mainly monitoring and quota distribution for exports and applying certain administrative rules like buying paddy with floor prices for buffer stock. Throughout the whole chain, there is a lack of vertical coordination and collective strategy for future market development and competitiveness (Jaffee et al., 2012). Third, the vast majority of the product produced is undifferentiated. Exported products are graded according to the % of ‘broken rice’ although this doesn’t reflect the possible (and typical) mixing of varieties. Few Viet Namese brand names are recognized in international markets and the product is not distinguished by its geographical origins. In the domestic market, some special varietal distinctions and product origins are recognized. The bulk of MKD rice sold domestically is simply divided into standard quality lots (Jaffee et al., 2012).
2.3.5. Government Roles
In terms of food security, the Government promulgated a new Resolution No. 63/NQ-CP (23/12/2009) about National food security. These policies focus on ensuring food supply sources including rice and other staple food and foodstuffs, meeting nutrition needs, and ensuring people's access to food. This resolution proposes solutions for enabling intensive rice farming, particularly in the Mekong and Red River Deltas, to create stable supplies for current and long-term national food security. This will be achieved by ensuring that, by 2020, food producers’ incomes will be 2.5 times higher than the current level. By this year, a protected rice land area of 3.8 million ha will be maintained to enable an output of 41-43 million tons paddy to meet the total domestic consumption, plus export demand of around four million tons of rice per year. This policy was intended to eliminate food shortages and hunger by 2012, by ensuring that 100% of the population had access to adequate food supplies (Dao, 2010). Unfortunately, local food insecurity persists in some remote areas due to the low capacity of policy realization at different local governments.
33

The main proposed measures of policy-makers for government interventions are:
1) Agricultural planning and rice land planning specifically for different levels:
provinces, districts and communes to protect 3.8 million ha of rice field up to
2020.Encouraging favorable land security policies towards peasants, to keep rice
land and enterprises producing and trading in rice: longer land security (50
years vs. 20 years), higher maximum size (3 ha) andencouraging the expansion
of the area and crop intensity (rotation)
2) Infrastructure, particularly irrigation investment and storage for rice; the annual
budget for scientific and technological development for agriculture will increase
by 10-15%, Human resource training: by 2020, 50% of the food producers will
be trained. Government is in charge of operating rice export and enterprises are
allocated export quotas for food security, granting preference to state-owned
enterprises in the rice export business.
3) Renovating collective production organizations by consolidating cooperatives,
farmer associations, farmer collaborative groups in order to develop agricultural
service-providing networks
4) Facilitating productive alliances with commercial enterprises like public-private
partnership (PPP); large scale field models, etc.
5) Ensuring the availability of credit with lower interest rates to attract the private
sector and FDI to rural areas, land-use tax and irrigation fee exemption
6) Applying safety net measures like cash transfers or post-disaster aid for farmers,
specific aid for the poorest areas and to initiate the insurance scheme for rice,
etc.
7) Developing food security information systems: consolidating and enhancing the
systems of supervising and monitoring production development, forecasting
food production of the whole country down to the district level, and warning of
adverse weather conditions affecting food security to facilitate effective
responses
8) Rice value chain trading policies:
• Effectively combine the market stabilization reserve and state reserve in
order to meet the emergency food and foodstuff relief requirements:
government support for private business investment in building a buffers
stock system with a 4 million tons paddy scheme,
• Announcing the price floor to buy rice when market prices are low to ensure
profits for rice farmers (no less than 30% of cost) and financial support to
34

enterprises for purchasing rice during the harvest
• TVA tax exemption for rice exportation
• Supporting farmers, businesses with reasonable interest credits for
investment in harvesting machinery, processing, storage
• Modernization of the retail system in the cities
• Stabilization of retail price through support for modern distribution
• Promotion of branding and intellectual property in the rice sector
The government policy continuously focused on production intensification and quality improvement with specific measures:
1) To invest in research on and extension of quality and resistant varieties in the
context of climate change, to develop a hybrid rice seed industry in order to
achieve an average annual increase of 3 percent in rice yields to stabilize
productivity and meet the seed quality expectations of domestic and
international customers (Bui, 2010).
2) To promote "green production" in the rice sector in order to contribute to the
20% reduction of GHGs in agriculture by 2020.
3) To sustain high quality rice yields with high output-input ratios by focusing on
good agricultural practice standards and food safety, such as through VietGAP,
GlobalGAP, SRI, Low GHG emission-green rice...
In brief, Viet Nam has food production and food security supportive policies and also maintains rice exportation. But the new Resolution for Food security and policy measures are not only still primarily administrative but also infeasible due to a lack of institutional, administrative capacity.
2.4. Lao PDR
2.4.1. Rice Consumption
In terms of consumption, Lao PDR has one of the highest per capita consumptions of rice in the world, with around 163 kg/person/year. More than 90% of rice consumption is accounted for by glutinous rice (Schiller et al. 2006). This is borne out in a regional comparison of rice consumption in Asian countries in Table 2.2 which also seem to indicate that rice per capita consumption in Lao PDR may have peaked. This is consistent with the findings of Eliste and Santos (2012)
35

Table 2.2: Rice consumption in Asian countries(ordered by rate of change between 1993 and 2007)
Country Kg/person/year
(1993) Kg/person/year
(2007) Rate of change
(%)
Malaysia 86.5 76.5 -11.5
Thailand 115.0 103.1 -10.3
India 76.6 70.9 -7.4
Cambodia 163.8 152.2 -7.0
Indonesia 133.8 125.3 -6.3
Lao PDR 166.5 162.6 -2.3
China 78.0 77.5 -0.7
Myanmar 156.0 156.9 0.6
Viet Nam 160.3 165.6 3.3
Philippines 88.3 129.3 46.4
Source: FAOSTAT.
2.4.2. Paddy Production
At the outset, it would be prudent to highlight some underlying features of Lao PDR and its rice sector. Lao PDR is the only country in Southeast Asia which is land-locked (so by definition, all trade is border-trade with a high dependency for ‘economic or trade corridors’ in neighboring countries for both imports and exports) with 236,800 square kilometres of largely hilly and forested land sparsely populated by 6.5 million people. Land under cultivation amounted to only 1,233,250 ha, of which rice accounts for 80%. In terms of irrigated areas, it is the lowest both in terms of physical acreage as well as percentage of total rice areas amongst the ASEAN rice producing countries. It also produces and consumes mainly glutinous rice, some 80 to 90% over the years.
36

Figure 2.2: Total rice area irrigated (‘000 ha) and share of rice area irrigated (%) for selected countries Total rice area irrigated (‘000 Ha) Share of rice area irrigated (%)
Source: Eliste and Santos (2012) - Harvested areas according to FAOSTAT, excerpt for the Lao PDR (uses MAF data); irrigated rice areas according to AQUASTAT; data for the Lao PDR refers to 2011, while data for Viet Nam refers to 2005, for Cambodia and Myanmar to 2006 and for Thailand to 2007.
Rice has long been the most important food crop cultivated in Lao People’s Democratic Republic (Lao PDR), accounting for more than 80% of the area under cultivation within the country. The rice production systems in Lao PDR can be classified into three broad ecosystems of irrigated lowland, rain-fed lowland and upland rice areas. According to the Lao Census of Agriculture conducted in 2012 and depicted in Table 2.3, out of a total rice area of 986,600 ha, the total areas of rice planted in 2010/11 was 987,000 ha (714,000 ha of wet season lowland rice, 57,000 ha of dry season rice and 215,000 ha of upland rice) of which 774.963 ha was harvested. The total production was about 2,822,098 tons and average yield was 3.75 tons/ha (This average yield is suspiciously high considering the weaknesses associated with seeds, fertilizer and extension service and agri-support services stressed in the literature. There is a noted tendency of countries with a strong central command to overstate their harvested areas and yields – discrepancies of up to 50% are not uncommon from my experience. Unfortunately, for this study, there was no time for any ground-truthing exercise by visiting production areas. So we will only flag this for closer scrutiny of quality and consistency of data. For the present task, recourse is to depend on figures used/quoted by more recent international agency reports, especially Eliste and Santos (2012), both for purposes of consistency as well as the fact that it is a joint study between the World Bank, FAO and IRRI who have all representative offices in Lao PDR and hence would have reconciled or stressed data weaknesses wherever and whenever appropriate). Some 77% of total production comes from the wet season lowland
37

system. The most important rice growing provinces are Savannaket (220,000 ha) and Champasack (100,700 ha). Table 2.3. Rice harvest areas and production in Lao PDR (2010/11)
Particular Harvest area (ha) Production (Million tons)
Yield
Wet season 604.235 2.214.391 3.5
Dry season 101.611 477.110 4
Upland 69.117 141.597 NA
Total 774.963 2.822.098
Source: Agriculture Census, MAF, May 2012.
Figure 2.3 provides a comparison of the impressive record of production and yield increases achieved in Lao PDR since 1980 with those of other CLMV countries and Thailand, underscoring the very rapid increase. Figure 2.3: Evolution of rice production and yields in regional perspective (1980: basis 100)
Source: FAOSTAT.
a) Total national rice paddy production
38

Source: FAOSTAT.
Relative prices of glutinous and non-glutinous rice: Figure 2.4 graphs the glutinous and non-glutinous retail rice prices in Lao PDR over the last 22 years, in real terms. Over the entire period, non-glutinous rice price was almost always higher than glutinous rice at the retail level. This is noteworthy as exactly the opposite holds for their relative prices on the global market, where glutinous rice is invariably priced higher than non-glutinous rice. Figure 2.4: Retail prices of glutinous rice and ordinary white rice, 1990-2011
Source: Rice policy study, 2012
b) National average rice paddy yield
39

Self Sufficiency: It is incredible how Lao PDR has managed to develop from a rice importing country, often at the mercy of floods and drought, to a country enjoying growing rice surpluses since the turn of the century as indicated in Figure 2.5 which shows a surplus of 375,000 MT in 2011. Figure 2.5: Rice surplus since 1990 (tonnes of raw milled rice)
Source: Eliste and Santos (2012) - MAF, NBS data and the authors’ calculations.
Surplus and deficit Provinces: Most of Lao PDR’s rice production comes from the ‘7 Plains’ or major granaries. The key rice statistics of the 7 Plains are provided in Table 2.4.
40

Table 2.4: Rice production statistics in the ‘7 Plains’, 2010
Plain No. of
growers Wet season
area (ha) Dry season area (ha)
Average yield (tonnes/ha)
Total production
(tonnes)
Attapeu plain 12,800 17,070 870 2.7 45,918
Champasack plain 49,600 88,300 4,025 3.0 267,549
Savannaketh plain 69,100 169,925 8,225 3.9 659,309
Khammuane plain 44,900 74,050 5,450 4.0 296,200
Xedone plain 48,500 86,225 6,075 3.5 303,512
Bolikhamsay plain 26,900 40,200 1,900 4.0 162,408
Vientiane plain 44,370 73,925 16,150 4.4 327,480
Total 296,170 549,695 42,695 3.8 2,062,384
Source: 2010–2011 Lao Agriculture Census and MAF. Brief Report on the Rice Production in the Seven Large Plains (Unpublished).
Overall, the major rice deficit provinces are in the north of the country where there are mountainous areas (deficit estimated at 43.000 tons). On the other hand, the provinces of Savannaket, Khammouan and Vientiane (including municipality) in the central region and Saravan province in the southern region account for most of the rice surplus accounting for 83 percent of the total provincial surplus in Lao PDR. The breakdown of rice surplus and deficit provinces as a percentage of total consumption in 2010 is provided in Figure 6 while Figure 7 provides the spatial distribution of the surplus and deficit provinces. Figure 2.6: Rice surplus/deficit as percentage of consumption by province, 2010
Source: Eliste and Santos (2012) - MAF, NBS data and the authors’ calculations.
41

Figure 2.7: Rice Surplus and Deficit Provinces, 2010 Agriculture Project Location and Products
Source: Compiled from NAFRI data sets.
2.4.3. Rice Imports and Exports
As Lao PDR is a land-locked country where border crossings or posts are the main gateways for both formal and informal trade (smuggling) as well as the crucial link for Lao rice supply chains to international trading networks (for both exports and import) via Thailand, Viet Nam or China. Figure 2.8 indicates the locations of the key border crossings or posts.
42

Figure 2.8: Border Crossings/Posts to Neighboring Countries
Source: NAFRI Records
2.4.4. Rice Value Chains and Markets
Overall mapping of rice supply/value chain: As depicted in Figure 2.9, at the input level, the government is still responsible for providing good/certified seeds, agri-support services and infrastructure like irrigation and drainage as well as farm roads. The private sector supplies increasing quantities of fertilizers and pesticides as well as machines and mechanization services. Some 724,000 farm families cultivate around 987,000 ha of rice land, as individuals, under a cooperative system or as contract farmers. Most of them mill and consume part of their output through custom mills which are small single-pass steel-hullers (2 tons/day capacity). Their marketable surpluses are sold to collectors or directly to millers operating larger mills (1 ton/hour capacity) who may or may not also supply inputs like seeds and fertilizers. Such larger mills are invariably involved in the collection and trading of rice. Paddy collectors or agents supply larger mills at the district or provincial capital levels some of which are involved in contract farming and provide seeds, fertilizers and even, more recently, mechanization services. Some of them also distribute rice to deficit areas as well as have contracts to supply the military. They then sell their milled rice to wholesalers in 50 kg bags with increasing numbers of mills being involved in selling packed and branded rice of 10, 5 and 2 kg packs to supermarkets,
43

minimarkets and modern retail outlets. Most of the mills sell off the bran as ingredients for animal feed (including for aquaculture) and their brokens for snacks and wine production as well as vermicelli. Some mills also have contracts with beer factories while others also produce rice wine and rice drinks. Foreign traders also buy rice directly from some mills to export to Thailand and Viet Nam, mostly through informal channels. Some of the mills also act as wholesalers and supply to supermarkets and minimarkets. A small number of mills, such as those aligned to Lao Farmer’s Product, also export pre-packed, branded and ready for shelf (of even 250 and 500 gm boxes) of certified organic and exotic varieties and even GABA (pre-germinated) rice to Europe via Thailand under ‘Everything But Arms’ (EBA) agreement, where they are exempt from import duty. Overall, we found that in the case of Lao PDR, the mills and processing plants are increasingly acting as the fulcrum linking/driving upstream and downstream development/transformation of the supply chain. Upstream through contract farming, the provision of good/certified seeds, fertilizers and mechanization services and downstream to modern retailers like supermarkets and minimarkets with branded packaged rice. Some are also involved in exports both formal and informal (more so) of mainly glutinous rice and in some cases also paddy. There are also imports of mainly non-glutinous and aromatic rice for major cities as well as industrial use and snacks and also some hybrid rice from China to Northern Lao.
44

Figure 2.9: Overall Rice Supply Chain in Lao PDR - 2011
Rice millsBig rice mill <10 mills (>30 ton/day)Modern new mill-200 (15 ton/day)
8,000 commercial mills
Input Paddy production
Rice processing
International trade
Certified seed(Public Sector)
Chemical fertilizer and pesticide(Private Sector)
Farm machineries --Tractors
-Threshers
- harvesters
-water pumps
Agri-support service (Public sector)
Irrigation, Drainage (Public Sector)
No. farm family= 724,000
Paddy land =987,000 ha
Paddy collector
Milled rice(White rice)
Rice bran Broken rice
Wholesale Market
Local rice exporters
Exporters’ warehouse
Prepared for export
Rice traders (Intermediaries)
Local rice exporter
Europe (EBA)Thailand, Vietnam (Lak20), China (border trade)
Animal feed
Wholesalers in Vientiane
Rice wholesalers and other markets in rice deficit areas
Retail Markets
Super-
market
C O N S U M E R S
Government contract(military/police)
Snack and liquor
Contract Farmers
Source: Wong (2013)
Differentiated/sub-chains: In the course of the study we distinguished five different sub-chains. Firstly, a) the most traditional rice value chain where the producers milled the bulk of their output for their own consumption through custom milling with the excess sold to local small mills or collectors. This form is prevalent in both surplus and deficit provinces especially in areas far away from district and provincial capitals as well as areas where infrastructure is still poor. Here, the antiquated and small mills are used to supply the local community and surrounding areas. Secondly, b) comprising the chain linking rural to urban and/or surplus to deficit areas. This is also a traditional rice value chain involving small and medium size mills and traders involved in both spatial and temporal arbitrage. Thirdly, c) are those involving larger mills dealing with bigger volumes linking or operating in distribution hubs to channel rice from surplus to deficit areas and also supplying under contract to Military and Beer Companies. Fourthly, d) large modern mills which are involved in contract farming, providing seeds and fertilizers as well as mechanization services on credit. They are sometimes referred to as leading companies designated and partly funded or incentivized by the government to be part of an emergency seed
45

and rice reserve pilot scheme. Some of them have mechanical dryers, wet polishers and color sorters and are hence capable to producing high quality rice which is packed and branded and sold to supermarkets and minimarkets. Lastly, e) which are variants of c) and d) that are involved in the export of packed and branded rice to Europe (certified organic and exotic glutinous rice – purple, brown and black glutinous as well as ‘Small Chicken Rice – ‘Khao Kai Noy’ exotic rice and GABA rice mainly for Lao Framer’s Product to EU) under Everything but Arms (EBA) which enjoys tax exemption. Included in this category is the now dormant (defunct) Lao Arrowny Corporation, a Lao-Japanese joint-venture started in 2002 with a concession to contract farm up to 18,500 ha country wide (but the largest acreage contract farmed was 800 ha in 2004) to produce ‘bio-organic’ Japonica to be exported back to Japan and Japanese Restaurants in the region. Other modern mills are also developing similar chains to export their own branded products to Europe while others are involved in border trade to Thailand, Viet Nam and China, in both rice and paddy forms. Structure and performance: Empirical work on the economics of production and margins along value chains were patchy and showed great variation. Many reports by line agencies in MAF (including in Lao language) highlighted the competitiveness of Lao rice production at the farm level in terms of cost of production per hectare as well as per unit output when compared to other ASEAN countries. On the basis of this, they went on to suggest that there is great potential for Lao PDR to be an exporter of rice in the future in view of its increasing surplus and proceeded to set export targets. However, it should be pointed out that rice is not consumed or traded generally in paddy form, competitive and comparative advantage should be studied at the rice stage (after processing and storage) and at the point of sale or in the case of exports, port of discharge. Therefore milling cost, quality of rice produced (depending on technology and sophistication of mills) and transportation and freight costs must also be factored in. In this regard, one must consider the higher processing and storage cost (because of technology, hardware, software and financing cost), transportation (due to the poor condition of roads and high fuel costs), and logistics to specific export markets (especially for a land-locked country like Lao). So Lao PDR may not be as competitive as a mere comparison of cost of production at the farm level would suggest. There are also considerations related to the types of rice exported in relation to international trade norms and price curves. So overall, it is invariably more difficult for land-locked countries to export large quantities of rice. Be that as it may, the larger quantities of rice produced in Lao are more likely to be channeled through the other sub-chains, especially those linking rural to
46

urban as well as those linking surplus to deficit areas as well as the major distribution hubs and to big cities like Vientiane, Savannakhet and Champasak where the modern retail trade is evolving.
2.4.5. Government Roles
It may be prudent to recall the historical development trajectory of the Lao PDR rice sector together with key milestones. In the 1970s and 1980s, Lao PDR was a rice importer and food availability was particularly vulnerable to extreme climate events of floods and droughts. A subsequent key development was the introduction of the cooperative movement over the 1978-1988 period which involved tax incentives and credit access as well as improved incentives for producers. A major turning point was the political decision to transition from a socialist to a market-economy effectively in 1986. In the 1990s, there was a focused expansion of dry season rice production through irrigation investment coupled with increased fertilizer use and the adoption of improved seed varieties released by NAFRI leading to self-sufficiency and an increasing surplus since the turn of the century. The resultant evolution of rice production and harvested acreage is depicted in Figure 2.10. Figure 2.10: Evolution of rice production and harvested area in Lao PDR
Source: FAOSTAT data from www.fao.org as of August 2012
47

Chapter 3 Study Areas, Survey Methods, and Sampling
Framework
3.1. China
3.1.1. Survey Areas
We surveyed a rural sample of rice farmers, villages, townships, village paddy traders, and mills in March-April 2012. Jiangxi was chosen as representative of the main indica growing provinces; Jiangxi ranks second (NBS, 2010) of the southern indica growing provinces, the first being Hunan, which is farther away than Jiangxi from Zhejiang, one of the most important rice/paddy buying/consuming eastern coast provinces, and one of the fastest growing and most developed of the PRC’s provinces. Shangrao city in Jiangxi was chosen for the survey because it is the closest city to Quzhou city, Zhejiang province; Shangrao is also, per information from our key informant discussions before the survey in both Zhejiang (wholesalers we talked with in Wenzhou, Quzhou, and Taizhou) and in Jiangxi. This was subsequently borne out in the survey, as the reader will see. A side-note is needed concerning what is meant in the PRC by the term “city.” It means both a city per se, as well as an administrative unit around an urban area that includes both urban and rural areas; under the city are a number of counties, and in those, a number of townships, and in those, a number of villages. In turn there are a number of cities in a province, and a number of counties in a city. So Shangrao City is not the urban area called Shangrao, but the administrative area that includes that urban area plus rural areas around Shangrao. For the ease of the international reader we will henceforth refer to the Chinese “Shangrao city” as “Shangrao district”. Figure 3.1 provides a map of the rural study zone and the urban areas.
48

Figure 3.1: Map of China Study Zones
3.1.2. Survey and Sampling Areas
Information on total rice area, yield, population, and other key variables of all 10 counties in Shangrao district was collected. In order to link rice flow from Shangrao district to Zhejiang (the value chain we are studying) from the 10 counties, we chose three counties to represent the 10 but make a survey manageable. The three counties were not chosen randomly; instead we used reasoned (spatial) choice: we chose one county (Yanshan) closest to Zhejiang, one at a medium distance (Wannian) and one further away (Yugan); this permits study of the distance effect. Within each county, we chose two townships randomly. In each township, two villages were chosen at random. With the help of the local government, all households in the village were listed. We then selected 25-30 households at random in each village. All together the sample then was of 6 counties, 12 villages and 345 households. Our selection of mills for the mill survey was as follows. Our village survey (administered in each village sampled) indicated about 0-2 mills per village; we selected 10 mills in the sampled villages for part of the mill sample of our mill survey. The mills in the villages are mainly small-scale mills and mainly performing “custom milling” (a farmer or trader brings in paddy and the mill removes the husk and/or polishes then the farmer/trader takes the rice home or to the trader base; he/she may leave the by-products (bran etc.) with the miller as payment, or take the rice and by-products back, or pay cash for the milling). Another 30 mills at the “town level” or “county level” were chosen as representative; these were in the capital city of the town or county (the town area seat and the county area seat); these were mainly medium or large scale
49

mills. Another 20 mills were chosen in three cities (urban areas) (Wenzhou, Quzhou and Taizhou) in Zhejiang province. To sample all but the village level mills, we got lists of the mills (at town, county, and urban city levels) from the local Grain Bureau or the Agricultural Bureau (both are government), who provided information of the names, addresses, owners, scales, and other variables on the list of mills. We found in practice that their lists exceeded (depending on the county) the actual (universe) number of mills; hence we called each mill in the lists to make sure the mill was still running, and to make an appointment for the interview; at that stage some mills refused to be interviewed and we retained of course only those willing to be interviewed. We then interviewed the whole universe of mills at the selected township, county, and city levels in Zhejiang and in Shangrao in Jiangxi (as there were not many so sampling from them was not needed for practical purposes). Note that no village-level mills were surveyed in the three (urban) cities in Zhejiang. Our selection of traders for the trader survey was as follows. As the village survey indicated that there are about 1-2 paddy traders per village, we selected in total 12 village traders. Generally, we surveyed one trader in each village. But there were two villages where the traders were away so not surveyed, so one more trader in the neighboring village in the same town was surveyed to make sure the total number of traders was 12. There is no rice wholesale market in Shangrao city (nor was there ever); there had only been government rice purchase and marketing centers in Shangrao city before the 1990s when grain marketing was privatized). We only surveyed rice (as opposed to paddy) wholesalers in our chosen three (urban) cities in Zhejiang. Only 1 rice wholesale market was in Quzhou city area seat and we surveyed 12 out of a total number of 15 wholesalers (only 12 were present and/or willing to be interviewed). There are two rice wholesale markets in the Wenzhou city area seat, and one of them was newly built and with low level of business because of its being far away from the city center. So we chose the traditional one and surveyed 35 out of a total number of 45 rice wholesalers. 2 rice wholesale markets were in Taizhou and both were not large. We chose the larger one and surveyed 13 out of a total number of 17 rice wholesalers. Thus, a total of 60 city rice wholesalers were surveyed.
Our selection of retailers for the retailer survey was as follows. For (urban) city traditional rice retailers and supermarkets (that sell rice, which is roughly the universe of them), we sampled only in the three sampled (urban) cities in Zhejiang. We first obtained from the city government (Trade and Industry Bureaus) the lists of the universe of “wetmarkets” (called “wet” because they have perishables, but they also usually have retailers of rice and other dry foods) and leading supermarket chains. We randomly selected in each city 2 wet
50

markets from the lists; in each wet market, we randomly selected (from a list of all rice sellers provided by the market) 2-3 traditional rice retailers. From this we generated a total sample of 136 traditional rice retailers. We visited all the leading chain supermarkets (from the list provided by the government) and other smaller chains and independent supermarkets (chosen randomly in terms of the distance to the wet markets surveyed) and surveyed 160 supermarket chains retailers.
3.2. India
3.2.1. Study Areas
For this study we chose Eastern UP, in general, as our survey location in order to make a comparative analysis of the rice economies of the marginal holder dominated subsistence agricultural zone of Eastern UP to the relatively commercialized areas of Western UP (example, Shahjahanpur) that we had covered in the prior study. Eastern UP is particularly interesting because it is the focus of the BGREI program since 2009. We studied the rice value chain from Allahabad in Eastern UP to the city of Jabalpur in Madhya Pradesh. Allahabad was chosen as the survey location as the district is considered by market actors as one of the main rice districts of eastern UP, producing 5% of the total paddy production in Eastern UP. It is also an important supplier to urban areas, in particular to the closest large city of Jabalpur in Madhya Pradesh. This is important for our study, as we were seeking to compare major supply chains from rural to urban areas, but have one (in the earlier study) based in a dynamic area supplying a mega city (Delhi), to compare with a more hinterland area supplying major cities. Through a rapid reconnaissance of various stakeholders in the rice economy in Allahabad, we found that of the total milled rice produced in Allahabad, 33% is marketed in the district itself, 32% to other places in UP outside Allahabad, and 35% to other states in India outside UP. Of the rice going to other Indian states 43% goes to Madhya Pradesh (MP), 14% each to Chhattisgarh, Orissa, and parts of Andhra Pradesh respectively, 20% goes to Maharashtra and 9% to the rest of India. Of the rice going to Madhya Pradesh, 40% goes to Jabalpur, 33% to Rewa and 7% to other places within MP. Based on the literature review done in the first half of 2012 and interviews done with key informants in the value chain in February/March 2012, questionnaires were designed for each level. These questionnaires were fielded in May/June – November/December 2012, using primarily a five year recall.
51

Figure 3.2: Map of India Study Zones
3.2.2. Survey Methods, and Sampling Framework
We selected a sample and surveyed a sample of 400 rice farmers, 20 village heads, 100 rural mills, and 140 wholesalers (in both Allahabad district and Jabalpur), and 90 retailers in Jabalpur (comprising both “traditional” and “modern” retail). A side note is needed regarding what is meant in India by the term “district” used to identify the production zone. The district has an administrative headquarters around an urban area, which may be a city per se (for example, in our case the Allahabad city is the district headquarters); under the district there are several sub-divisions called “tehsils” that are the smaller administrative (revenue-collection) divisions comparable to counties in other countries. The tehsil in turn consists of one or more “blocks”; each block in turn comprises towns and villages around the towns. So the Allahabad district comprises the administrative area that includes the urban areas plus the rural areas around these. Information on the total rice area, yield, population, and other key variables of all 8 “tehsils” in Allahabad district was collected. We chose four tehsils of the 10 to make the survey manageable. The four counties were not chosen randomly; instead we used reasoned (spatial) choice: we had arranged the 8 tehsils in the
52

district in descending order on the basis of their distance from the consumption zone, Jabalpur. The minimum distance is approximately 310 km and the maximum around 460 km. This arrangement makes the case directly comparable to the companion case in the research set of Jiangxi and Zhejiang in the PRC. We then classified the tehsils into three distance classes: those closest to the consumption zone (between 310-360 km); those farthest from the consumption zone (between 410-460 km) and those at an intermediate distance (between 360-410 km). We then chose 4 tehsils, one randomly from those lying nearest to the consumption zone, one from the farthest ones and two from those lying in the intermediate distance. We chose randomly 1,1,2,1 blocks out of the 2,1,4,3 blocks respectively in the chosen “tehsils”. From each block we randomly chose 4 villages. That made a total of 20 villages across 5 blocks. In each selected village, we conducted a census of households. Using the census questionnaire, a list of all the households in the village was made. Each household was asked questions on their total land under cultivation and land under paddy cultivation. 20 households were selected in each village, so a total of 20*20=400 households were selected and surveyed. This was done in the following steps: first, we ranked the households indescending order by their land size; second, we made a random selection of 10 households who cultivate more than 50% of the total area cultivated in the village and 10 households that cultivate 50% or less of the total cultivated area in the village. This makes the selection procedure comparable to that used in the prior study in central-western UP. For the mill surveys, we sampled 80 mills from a list of 224 registered mills (that were noted as all in the district) provided by the Regional Food Corporation, Allahabad, the district level paddy/rice procurement and distribution agency of the government of UP. The list showed the milling capacity of each mill. On the basis of their milling capacities we categorized the mills into small (capacity <1 ton/ hr), medium (between 1-3 ton/hr) and large (> 3 ton/hr) mills. Out of the 159 small mills in the list we randomly chose 37, out of the 55 medium mills we chose 33, and we took all of the 10 large mills in our list. This tercile approach also made this sampling comparable to what we had done in the prior study that included mills in central-western UP. These mills are located not only in the rural areas, but are also dispersed across the adjoining urban areas via the “rur-urban” stretches. While the large mills are concentrated in the urban areas, the medium mills exhibit a “rur-urban” concentration, and more than half the small units are located in the rural areas (but not at the village-level).
53

Table 3.1. Location of the mills from the census Small
(N=159 mills)
Medium (N=55 mills)
Large (N=10 mills)
Overall (N=224 mills)
% of mills located in (N=224 mills)
Rural areas 57 35 0 31
Rur-urban areas 40 55 2 32
Urban areas / towns in the tehsil 3 10 98 37
Further, we did a census of mills in each of the 20 villages. These were mainly small mills (to which a farmer or trader brings in the paddy for de-husking, de-braning and polishing and then takes it to the trader base. The miller either retains the by-products as the payment for milling, or takes cash for milling and gives back the by-products along with the milled rice to the client). We found that each village on average had 2 such mills. Thus we got a list of approximately 40 village-level mills from which we randomly chose 20 village-level mills. So in total we surveyed 100 mills. The selection of the 70 traders surveyed in the production zone was done in the following way. For the village level traders we conducted a census of all paddy/rice traders who had serviced the village in the 12 months preceding the survey. We obtained a list of such traders for each village in the course of the household and mill census in the village. On average we found each village to be serviced by 2 traders. So we got a list of 40 traders from which we randomly selected 20 (or 1 trader per village). For the traders outside the village and off (outside) the wholesale markets, we did a census of all traders operating with a permanent stall outside the selected village premises. We cross checked with both the farmers at the village as well as these traders to find out whether any of them collected paddy/rice from the farmers at the village through agents or brokers. For all those traders who reported that they buy only from farmers who come to sell at their shops, we formed a list. Simultaneously we also did a census of traders who sell at the weekly markets/ “haats” outside the village. From the list of around 60 traders with permanent shops outside village and off wholesale markets we randomly chose 10; from the list of 120 who operate at the weekly markets outside villages we randomly chose 10 more; that is, we sampled 20 off-village traders out of a list of 180. For traders on the wholesale market we first obtained the list of wholesale markets for grains from farmers, village traders, and the sub-district offices. There are 5 such markets within the district. Then for each of these
54

wholesale markets we went to the “mandi samity” (the governing authority of the wholesale markets or mandi) and got the list of all traders that sell paddy and or rice. We interviewed the universe of paddy and rice traders present in the wholesale markets (25, 35, 28, 40, 55 traders respectively in each of these five markets) and randomly chose 40 from there (approximately 10 per mandi). Thus in the production zone, we surveyed 20 village level traders, 20 off-villages and off-market traders, and 30 traders operating on the wholesale markets. We followed a similar strategy, like that followed in the production zone, for choosing the 70 on-market urban traders, in Jabalpur. Out of a total of 130 (=67+63) traders across two wholesale markets in Jabalpur, we randomly chose 35 traders per market (a total of 70 from two markets). For the retail surveys in the consumption zone, first we randomly selected 13 wards (urban administrative units) from a total of 35 wards in Jabalpur. Then we did a census of all PDS/ fair price shops, wet markets (where there are traditional retail stalls selling rice, among various kinds of stalls), traditional retail shops and modern retail outlets in these wards. We obtained a list of 30 PDS shops (with 2 per ward on average) from which we randomly selected 15 (with 1 per ward on average). From the ward offices we got a list of wet markets in the ward. Each ward has on average 2 wet-markets, so we got a list of around 26 wet markets. From these we randomly chose 13 (that is 1 per ward). For each wet-market we got a list of rice/paddy sellers on the market from the market authority. We randomly chose 2 traders per market, and hence got a sample of 26 wet-market rice/paddy retailers. We further conducted a census of all traditional retail stores in each ward, and found a total 78 traditional retail outlets (with 6 per ward on average) that sell rice; from which we randomly chose 39 traditional retailers (with 3 per ward on average). However, we found only 10 modern retailers across all 35 wards and hence surveyed all of these.
3.3. Viet Nam
3.3.1. Sampling Areas
An giang has the largest population, but the fourth largest area in the Mekong Delta. Meanwhile Hau giang has a smaller area and the smallest population but is a centrally-located province. An giang and Hau giang are regarded as the two main rice-producing centers. These two provinces are well-known for producing a big surplus of rice, and are thus very attractive to traders and rice trading companies either for export or domestic sale. There are some value chain studies in this area (Jaffee, 2011, 2012, Son et al, 2010…) but they mostly focus on the
55

rice export chain. There is a knowledge gap regarding the situation of rice from An giang and Hau giang in the domestic market. Other reports on this area confirm that the high quality rice produced by farmers cannot be properly exported due to the mixture of grain qualities during the post-harvest stages. As a result, the export price of high quality rice varieties is low. But within the region, farmers are still increasing the area cultivated with high quality varieties. We would like to check the hypothesis that this high quality rice should be sold in the domestic market at a reasonable price. Our study of the domestic chain of rice from An giang, Hau giang – the center of the core rice belt of the Mekong river delta - will address a new area of research within the larger field of the rice value chain in Viet Nam. Figure 3.3: Map of Viet Nam Study Zones
Table 3.2 Area and population of An giang and Hau giang provinces
Characteristic Unit An giang Hau giang
Total area Km2 3,537 1,601
Agricultural land Ha 280,600 132,400
Rice land Ha 255,371 80,040
Population Persons 2,273,150 769,200
Density of population Persons /km² 608 473
Urban population Persons 645,574 176,000
Rural population Persons 1,627,576 593,200
Source: Statistical Yearbook 2011
The total area of An giang is 353,676 ha, in which 280,600 ha is used for agriculture (79%), 14.700 ha is forest land (4%), 25.400 ha is used for specific uses (7%) and the rest is used for residential purposes (4%). Most agricultural land is used to cultivate annual crops, mainly rice and different types of farm produce. The rice area of An giang represents 92% of total agricultural land,
56

making rice the main agricultural product. In An giang, most of the population lives in rural areas, the rural population is 2.5-3 times greater than the urban population, and therefore agriculture has a considerable impact on the livelihood of these citizens. In Hau giang province, agricultural land represents about half of the land in An giang with 132,400 ha in 2011, of which 62% (82,500 ha) was used for rice production. Hau giang province has a population density lower than An giang with 473 persons/km2 compared to 608 persons/km2 which is due to the fact that the Hau giang area rice production area is less fertile than that of An giang. Table 3.3 Output value of agriculture sector in An giang and Hau giang (2010)
Characteristic Unit An giang Hau giang
Total output value of agriculture sector Billions VND 28,022 8,032
Structure of Agricultural sector in value % 100 100
Crop production (mostly rice) % 85 70
Animal husbandry % 7 23
Agricultural services activities % 9 7
In both provinces, agriculture is the main productive sector. In the structure of the total output value of agriculture, crop production represents the most important share with 84.9 % in An giang and 70% in Hau giang. Crop production makes such a substantial contribution to rice production because the share of rice area in both provinces is significant. In Hau giang, sugar-cane is another important crop.
3.3.2. Survey and Sampling Methods
For this research in Viet Nam, the value chain quantitative approach is based on information collected from all stakeholders in the rice value chain using a unique “stacked survey” method (Reardon et al, 2012). In Viet Nam, we chose samples in the rural and urban areas in the rice belt of the Mekong river delta, in the south of the country. The research involved 610 interviews in the Mekong river delta and Ho chi Minh city, comprised of 300 rice farmer households, 70 millers in rural peri-urban areas, 50 paddy traders in rural areas, 60 rice traders in urban areas, 100 traditional rice retailers in urban areas, and 30 supermarkets in urban areas. We add to this sample, 20 quantitative surveys of villages. We also conduct 20 case studies of agricultural input traders or service suppliers. We selected 2 representative provinces for the study, including An giang, Hau giang, and 2 cities, including Ho Chi Minh City and Can tho. Can tho is the fifth largest city of Viet Nam, located near the production area and having an
57

increasingly urban area. Ho chi Minh is the biggest city in the South of Viet Nam, and is the center of consumption, whereas, An giang and Hau giang are the most important production areas among the provinces. Can tho is one of the places with many mills and polishing factories for domestic consumption due to the fact that Can tho is the “Carrefour” of the rivers and the mill has always been located on the river bank for the sake of logistical convenience. The distance from the production area to the consumption market is about 210 km from An giang town and 165 km from Hau giang town. In the production area, we select the two districts of each province that are most important in terms of rice production volume. In An giang province, the two districts have different natural characteristics: Chau thanh district is a plain area and Tri ton district is a hilly area. In Hau giang province two districts were selected: Vi thuy and Long my. Vi thuy district is located near to Can tho city and the Long my district is in the farther distance from Can tho city. Table 3.4 Distance matrices between production and consumption
Consumption
Production Can Tho city Ho Chi Minh city
Hau Giang province Vi Thuy district 20 km 170 km
Long My district 40 km 190 km
An Giang province Tri Ton district 90 km 220 km
Chau Thanh district 70 km 200 km
In the project’s framework for Viet Nam, we divide the survey into 2 parts including the survey in the rural area – the production area (farmers, traders and wholesalers, mill-polishing chains) and the urban area – outside production (wholesalers, traditional and modern retailers). The mills in this region are located mostly in rural areas with ready access to river transit routes. They are concentrated in some small towns for the mill industry near the city. Farmer households: For household sampling, 300 households were selected, focusing on 4 districts. We selected 20 villages (communes) in 4 districts (5 villages per district). The villages were selected randomly from the list of villages provided by the districts. In each village, we selected 15 rice producer households. The households were randomly selected from the list of households provided by the village authority. The list of households in each village was built based on the geographical location of the houses.
58

The farmers segment is divided into 3 categories: Marginal size (<1ha/household); Small size (1 – 2ha/ household); Medium size (>2ha/ household) Rice mill: we surveyed 70 mills in total. The mill segment is divided into 4 categories: small size (< 1 ton/hour); medium size (1- 5 ton/hour); large size (>5 ton/hour); Mill-polishing chain. The sample included 40 mill-polishing chains from towns, 20 large mills from towns, 20 medium mills from towns, and 10 small mills in villages. Only small scale mills exist in the village, while larger mills are mostly located in the town in order to access some minimum logistical infrastructure related to transport, electricity, etc. The list of small mills was provided by the village authority. The larger mill list was provided by the Trade and Industry department of the province, where they manage the registration of the mills, other than small mills. Upstream trader: we surveyed 60 rural traders (upstream traders) in total including rice wholesalers, traders and brokers. Traders are the most important actors in terms of their numbers in the rural area, so we surveyed 50 in total. They buy paddy from farmers to sell to mills. Traders are divided into 2 categories: big rural traders (30) and village small traders (20). The big traders have the barges and come from other locations. The village small traders come from the village. The list of traders was provided by the village authorities because they have to register at the village in order to have the right to buy rice in the village field. 10 remaining surveys were distributed equally to village brokers (5) and rural rice wholesalers (5). There are two different categories with smaller numbers compared to traders. The village brokers play an intermediate role between farmers and traders. They benefit from a commission from farmers and also from traders. The list of village brokers was provided by the village authorities. The rice wholesalers buy the rice from mills and trade rice in the domestic market. They are located in the town near the mill center and not in the village. The list of rice wholesalers was provided by the Trade department of the province. We collected information based on questionnaires built for all supply chain segments: urban wholesalers, modern retailers (supermarket/food shops), traditional retailers for rice. The modern food shop is a branch of a supermarket in Ho chi minh city. They are located in some private houses open to the street and sell the commodities supplied by supermarkets at the same price offered by the supermarket. They sell various goods including rice. These agents are randomly selected from the list provided by the Trade department of the cities.
59
Ho Chi Minh City is the main rice consumption market. The sample includes 45 supermarkets/or food shops, 100 traditional retailers and 50 rice urban wholesalers. The 50 rice wholesalers were selected in 5 grand markets for trading agricultural products. The 5 markets were selected from 5 different districts of Ho Chi Minh city. In each market, the list of urban rice traders was provided by a market manager. 10 rice traders were selected randomly from each market. 20 retailers were selected from each of the 5 urban districts. The selection of the 5 urban districts was also random. As there was no urban retailer list, we made our selection by observing retailers on the street in different quarters. We took one retailer for every 5 observed shops. In the secondary city of Can tho, we surveyed 35 traditional retailers using the same street observation method and included one of every 3 retailers. Can tho is very close to the production and mill such that there are no rice wholesalers in the city centre. The retailer can buy rice directly from mills. So we did not survey urban rice wholesalers in Can tho city.
60
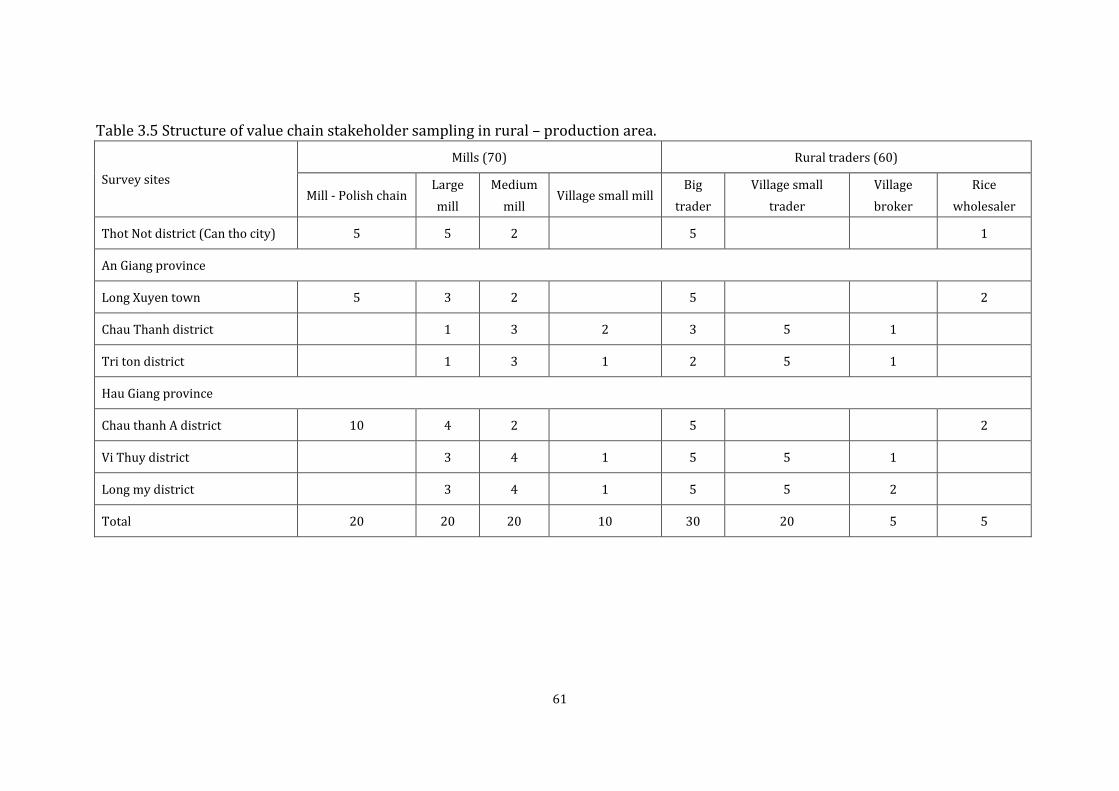
Table 3.5 Structure of value chain stakeholder sampling in rural – production area.
Survey sites Mills (70) Rural traders (60)
Mill - Polish chain Large mill
Medium mill
Village small mill Big
trader Village small
trader Village broker
Rice wholesaler
Thot Not district (Can tho city) 5 5 2
5
1
An Giang province
Long Xuyen town 5 3 2
5
2
Chau Thanh district
1 3 2 3 5 1
Tri ton district
1 3 1 2 5 1
Hau Giang province
Chau thanh A district 10 4 2
5
2
Vi Thuy district
3 4 1 5 5 1
Long my district
3 4 1 5 5 2
Total 20 20 20 10 30 20 5 5
61

Table 3.6 Structure of trader sampling in urban area
Order Rice supply chain actors Number of survey
HCM City Can Tho
1 Urban Wholesaler 50 -
2 Traditional retailer 50 35
3 Modern retailer (supermarket and food shop)
45 -
3.4. Lao PDR
3.4.1. Study Areas
As part of the larger body of work dedicated to the study of food/rice value chains in Southeast Asia, this report analyzes FDI in the rice value chain in Lao PDR with a special focus on FDI in land, especially how increasing FDI in land affects rice value chain development. This research was largely prompted by the spate of recent work on large concessions of land given to foreign investors in developing countries, including Lao PDR (IFPRI 2012, Kenney-Lazar 2011, Deininger and Byerlee 2011 and GTZ 2009).
3.4.2. Study Methods
An initial literature review and field study indicated that there was little systematic information or data characterizing the nature, trend and structure of FDI in Laos’s rice sector, particularly on different segments of the rice supply chain. As the study progressed, it was quickly found that the drivers of supply or value chain transformation in Lao PDR are not the FDI in land per se (as initially thought) but rather in the FDI and local investments at strategic points along the rice supply chain as well as some market/marketing/international trade considerations that have been missed by many in the received literature. Consequently, and influenced by Reardon et al (2012), we elected to re-orientate this short study to examine FDI and local investments as well as other considerations at the upstream (inputs, farmers organization of production units); midstream (milling, other processing and wholesaling); and downstream (retailing, especially supermarkets) segments and their impact on the transformation of Lao PDR rice value chains. Guided by the peculiarities of Lao PDR when compared to other ASEAN rice producing and exporting countries, of being land-locked and almost exclusively producing and consuming glutinous rice, we also elected to examine the flows of paddy and rice and the current and future prospects of exporting rice in view of it’s incredible transformation from a once rice importing country to one with an increasing exportable surplus.
62

Admittedly, a short study like this runs the risk of ‘scratching the surface’, especially by casting the net too widely, but a strong motivation in doing so is to enable the identification and highlighting useful areas of future research on sustainable and inclusive growth and food security, especially with respect to the development and transformation of rice value chains and the growing interest in cross-border integration and connectivity of agri-food chains in the Greater Mekong Sub-Region (GMS) and further afield.
63
Chapter 4 Rice Value Chain from Rural Jiangxi to Urban
Zhejiang in China
4.1. Introduction
In the upstream section, the results of the farm household survey of paddy in Shangrao, Jiangxi Province, in the People’s Republic of China (PRC) is assessed to ascertain the extent to which the rice farm segment still uses traditional methods, to what extent they have transformed to using new methods, and what are the key characteristics of that transformation. In the first midstream section, we present findings from the mill survey with respect to the structure, conduct, and performance of rice mills in Jiangxi and Zhejiang. Next, we present findings from the trader survey with respect to the structure, conduct, and performance of paddy and rice traders in Jiangxi and Zhejiang. The downstream section focuses on our survey findings regarding traditional and modern rice retail in the cities at the end of the rural-urban supply chain we are studying, in the cities of Zhejiang. We begin with the traditional sub-segment, and finish with the modern retail sub-segment. Finally, the section on the performance of the entire rice value chain presents findings concerning the distribution of costs, rewards, and overall margins across the value chain segments, and the composition of value chain costs in terms of functional categories (suchas labor, transport, and wastage).
4.2. Upstream—Rice Farming
4.2.1. Structure of the Rice Farm Segment
In this section, the results of the farm household survey of paddy in Shangrao, Jiangxi Province, in the People’s Republic of China (PRC) is assessed to ascertain the extent to which the rice farm segment still uses traditional methods, to what extent they have transformed to using new methods, and what are the key characteristics of that transformation. We will discuss rice land distribution and rental, rice farmers’ non-land assets, and rice farmers and non-farm and farm labor markets to describe the structure of the rice farm segment. 4.2.1.1. Rice Land Distribution and Rental In our description of the structure of the rice farm segment, we will begin with a discussion of rice land distribution and rental.
64

Table 4.1a shows paddy farm land distribution by stratum. Several points stand out. First, operational farm size (which comes nearly to being just rice farm size, as these farms are very specialized in rice) for the overall sample jumped from 0.9 in 2007 to 1.5 in 2011. This jump was nearly all due to the sharp increase in land rental; the latter increase was mainly among medium farmers renting more. Note that this average holding is more than three times larger than the official PRC farm average of 0.4 ha. The latter however is close to the 0.47 ha per average farm in the “marginal” farm stratum in the sample. Note however that our sample is a random sample, so this larger average for the sample is indeed representative of the farms in this area. Second, while the rental market is very active, the sample farms rent-out very little land. But most of the rented-in land is in their own village; thus it appears that land is coming from migrant households renting to the remaining farmers. Third, the land rental market is sharply concentrated: 10% of the renters have 80% of the rented-in land. That 10% are the medium (not the marginal or small) farmers. As noted above, that group saw a large jump in their rentals from five years before. Our data show that among the medium farms that are renting-in, seven farms in particular are renting a lot of land. The very large renting-in activity of the medium farmers in the sample, in particular the 7 most active renters, actually mainly is by medium farmers in the plain & lake area (in the third county) and they are renting-in from the land-abundant other villages in the third county (that are not in our sample). In the latter, they go to village heads of villages known to have many out-migrants and work out a deal with the village head to rent-in a number of the farms of migrants at once. The head acts as a kind of broker for the migrants. The distance of the lead rented plot is shown in Table 4.1.c, with the finding that it is quite far (in other village). Fourth, note that the farms are in general very fragmented (into many plots); however, the medium farms are much less fragmented than those of the other strata, and have plots averaging four times larger than the others. This may facilitate their using machinery.
65

Table 4.1.a. Household Level Paddy Farm Land Distribution and Rental, 2011 and 2007; N=325 Farm size strata (measured in all operational or arable land under any crop) Marginal (0,1]ha
N=245 Small (1,2]ha
N=41 Medium (>2ha)
N=39 Total N=325
2011 2007 2011 2007 2011 2007 2011 2007
1. Overall Farm
1.1. Paddy land (in ha) 0.40 0.37 1.34 0.99 7.89 3.37 1.42 0.81
1.2. Paddy land (% of all operational land, derived, =1.1/1.8) 85 83 91 92 97 95 93 90
1.3.1 Horticulture land in ha 0.01 0.00 0.01 0.01
1.3.2 Horticulture land share (% of all operational land, derived, =1.3.1/1.8) 2 0 0 1
1.4.1 Pulses (oilseeds and nuts) land in ha 0.07 0.08 0.07 0.07
1.4. 2 Pulses (oilseeds and nuts) land share (% of all operational land, derived, =1.4.1/1.8) 14 5 1 4
1.5. Land rented-out (in ha) can be by rent or sharecropping 0.00 0.01 0.00 0.00 0.09 0.04 0.02 0.01
1.6.1 Land rented-in (in ha) can be by rent or sharecropping 0.10 0.07 0.90 0.59 7.51 2.92 1.09 0.48
1.6.2 land rented-in by rent or sharecropping for paddy in ha 0.12 0.09 0.97 0.60 7.60 2.96 1.13 0.50
1.7.1 Land rented-in (% of all operational land, derived, =1.6.1/1.8) 20 16 61 54 92 82 71 53
1.7.2 Land rented-in (% of all operational land, derived, =1.6.2/1.8) 26 20 66 56 93 84 74 56
1.8. All operational land (in ha) 0.47 0.44 1.47 1.08 8.17 3.54 1.52 0.90
2. Plots for full farm
2.1. Paddy land: Number of plots 7.3 6.7 19.9 15.0 37.4 22.0 12.5 9.6
2.2. Paddy land: mean plot size in ha (derived, =1.1/2.1) 0.05 0.05 0.07 0.07 0.21 0.15 0.11 0.08
2.3. All operational land: number of plots 9.5 8.7 21.9 17.3 40.4 24.4 14.8 11.7
2.4. All operational land: mean plot size in ha (derived, =1.8/2.3) 0.05 0.05 0.07 0.06 0.20 0.14 0.10 0.08
2.5 Distance to home averaged of all paddy plots (in meters) 858 868 683 733 6291 762 1484 837
2.6 Distance to home averaged of all operational land plots (in meters) 5748 848 3572 5494 5801 918 5479 1469
66

Table 4.1.b shows changes in seasonality between 2007 and 2011. Several points are to note. First, overall, very few farms changed seasonality patterns over the five years before the survey. Very few farms switched number of seasons cropped, between the two years: 2 to 1 seasons, 1%; 3 to 1, 1%; 2 to 3, 5%; 1 to 2 or 3, 3%; hence only 10% of the farms switched seasonality, but there is no pattern (in terms of correlation with farm size). There are 6% of new growers who grew paddy in 2011 but did not grow 5 years before. This surprised us as a reigning hypothesis in the rice research community is that there has been a marked change in seasonality (percentage and area changes), with a shift to a single season (after years of shifting to multiple seasons with the spread of irrigation). Thus the percentage story does not hold from our data set. Second, 26% of the farms cropped three seasons in both years; this was more prevalent among larger farms. This coincides, as we will show, with smaller farms relying more on off-farm activity (due perhaps to their smaller land resources) and thus cropping fewer seasons. By contrast, 50% of the farms, mainly in the marginal and small strata, cropped two seasons. When it comes to net change in paddy area of households with specific seasonality behavior, we see a general growth pattern. For the most important three cropping behavior, 16% growth and 24% growth of net change in paddy area for cropping 3 seasons and 2 seasons, respectively, in both 2007 and 2011, with medium strata contribute a lot, the figure is 25% and 60%, respectively. Though 1% of decrease is been captured for those who grow only 1 season in both years, but it is the marginal strata that did this, we can take this as withdrawal of rice farming and into other non-farm activities. For the 10% of households who shifted crop pattern, mean paddy area rose. 0.8 ha compared with 5.7 ha for farms that shifted from 2 to 1 seasons between 2007 and 2011, 2.7 ha compared with 7.9 ha for farms that shifted from 2 to 3 seasons between 2007 and 2011, and 0.7 ha compared with 3.2 ha for farms that shifted from 1 to 3 seasons between 2007 and 2011. This also confirms the enlargement of paddy land from 2007 to 2011.
67

Table 4.1.b. Seasonality of paddy cropping
Farm size strata (measured in all operational or arable land under any crop)
Marginal (0,1]ha Small (1,2]ha Medium (>2 ha) Total
N=245 N=41 N=39 N=325
3.1. Shifts in seasonality of paddy cropping, % of HHs:
a) 3 seasons of paddy in 2007 and 3 seasons in 2011 24 29 33 26
b) 3 seasons of paddy in 2007 and 2 seasons in 2011 0 0 0 0
c) 3 seasons of paddy in 2007 and 1 season in 2011 1 0 0 1
d) 2 seasons of paddy in 2007 and 3 in 2011 2 15 15 5
e) 2 seasons of paddy in 2007 and 2 in 2011 56 41 33 51
f) 2 seasons of paddy in 2007 and 1 in 2011 1 0 3 1
g) 1 season in 2007 and 3 in 2011 0 2 3 1
h) 1 in 2007 and 2 in 2011 3 2 0 2
i) 1 in 2007 and 1 in 2011 7 5 3 6
j) 0 season in 2007 and 3 in 2011 2 0 8 3
k) 0 in 2007 and 2 in 2011 4 5 0 3
l) 0 in 2007 and 1 in 2011 0 0 0 0
3.2. Of farms who did NOT shift: but stayed 1 and 1 seasons 2007 & 2011:
a) mean paddy area (sum over seasons) in 2007 ha 0.3 1.7 2.9 0.5
b) mean paddy area (sum over seasons) in 2011 ha 0.3 1.7 2.9 0.5
c) net change in paddy area (sum over seasons) in % terms ((2011/2007-1)*100) -1 0 0 -1
3.3. Of farms who did NOT shift: but stayed 2 and 2 seasons 2007 & 2011:
a) mean paddy area (sum over seasons) in 2007 ha 0.7 2.4 5.3 1.2
b) mean paddy area (sum over seasons) in 2011 ha 0.7 3.6 8.4 1.5
c) net change in paddy area (sum over seasons) in % terms((2011/2007-1)*100) 4 49 60 24
68

3.4. Of farms who did NOT shift: but stayed 3 and 3 seasons 2007 & 2011:
a) mean paddy area (sum over seasons) in 2007 ha 0.7 1.8 6.6 1.7
b) mean paddy area (sum over seasons) in 2011 ha 0.7 1.9 8.3 2.0
c) net change in paddy area (sum over seasons) in % terms((2011/2007-1)*100) 3 7 25 16
3.5. Of farms who shifted from 2 to 1 seasons between 2007 & 2011:
a) mean paddy area (sum over seasons) in 2007 ha 0.6 0.0 1.1 0.8
b) mean paddy area (sum over seasons) in 2011 ha 0.3 0.0 22.0 5.7
c) net change in paddy area (sum over seasons) in % terms ((2011/2007-1)*100) -53 0 1962 664
3.6. Of farms who shifted from 2 to 3 seasons between 2007 & 2011:
a) mean paddy area (sum over seasons) in 2007 ha 0.5 0.7 6.4 2.7
b) mean paddy area (sum over seasons) in 2011 ha 0.7 2.3 19.4 7.9
c) net change in paddy area (sum over seasons) in % terms((2011/2007-1)*100) 22 251 203 196
3.7. Of farms who shifted from 1 to 3 seasons between 2007 & 2011:
a) mean paddy area (sum over seasons) in 2007 ha 0.2 0.7 1.3 0.7
b) mean paddy area (sum over seasons) in 2011 ha 0.3 6.7 2.5 3.2
c) net change in paddy area (sum over seasons) in % terms((2011/2007-1)*100) 48 910 90 336
69

Table 4.1.c explores in more detail the subset of plots that we followed/surveyed in detail in the interview with the household – the largest two owned plots and the largest rented plot. The following salient points arose from the survey on their placement and land use. First, around 80% of the lead plots (whether owned or rented) are in the valleys; the other 20% are in the hills. Rented and own plot sizes are similar except among medium farms, for whom the rented plots are far larger than the owned plots, as is explicable from the analysis in Table 4.1.a. about the rented plots being concentrated among a small set of households and sometimes located outside the village. Second, the bigger the farm, the more clustered (less dispersed) are the plots; this again suggests greater ease of mechanization for the larger farms. Rented plots are far more distant than owned plots, due to a number of rented plots being in other villages as noted above. Third, larger farmers have more of their lead plots in demonstration areas (25%), but small and marginal farmers have a lower share (15%). Fourth, the lead owned plots have been in the households for a long time - two decades on average. By contrast, as expected, the lead rented plots have been cropped by the farmers a much shorter time, as one would expect. Finally, irrigation and fertility of soil on owned and rented plots are similar. plots, whether owned or rented, are fallowed one season (usually about four months in the middle season) per year (left to rest without production).
70

Table 4.1.c. Location and land use of plots (Followed-PADDY plots analysis (2 biggest owned and 1 biggest rented-in plot)
Farm size strata (measured in all operational or arable land under any crop)
Marginal (0,1]ha Small (1,2]ha Medium (>2 ha) Total
N=245 N=41 N=39 N=325
Top 2 owned plots: % of plots in hills 17 18 20 18
Top 2 owned plots: % of plots in valley 83 82 80 82
Top rented plot: % of plots in hills 20 28 27 23
Top rented plot: % of plots in valley 80 72 73 77
Top 2 owned plots: mean size in ha 0.1 0.1 0.1 0.1
Top rented plot: mean size in ha 0.1 0.2 3.2 0.8
Top 2 owned plots: share in cluster % 31 44 47 34
Top rented plot: share in cluster % 31 41 65 40
Top 2 owned plots:
a) % of plot land that is cropped 100 100 100 100
b) % of plot land that is fallow 0 0 0 0
c) % of plot land that is pasture 0 0 0 0
For cropped: Mean months that is fallow within that year 4.3 4.4 4.0 4.3
Top rented plot:
a) % of plot land that is cropped 100 100 100 100
b) % of plot land that is fallow 0 0 0 0
c) % of plot land that is pasture 0 0 0 0
For cropped: Mean months that is fallow 4.3 4.3 4.6 4.4
Top 2 owned plots: median distance to home in meter 500.0 500.0 725.0 500.0
Top rented plot: median distance to home in meter 500.0 500.0 1000.0 600.0
71

Top 2 owned plots: mean distance to home in meter 706.5 648.0 754.6 704.3
Top rented plot: mean distance to home in meter 866 808 23,753 5802
Top 2 owned plots: mean distance to the nearest paved road in meter 411.2 1173.6 396.8 506.4
Top rented plot: distance to the nearest paved road in meter 401.9 559.5 635.2 486.6
Top 2 owned plots: % of them in demonstration area 11 17 24 13
Top rented plot: % of it in demonstration area 13 15 27 16
Top 2 owned plots: mean years since started using 20.7 20.9 20.1 20.8
Top rented plot: mean years since started using 6.5 5.4 3.7 5.7
Top 2 owned plots: mean assessment of the soil fertilizer level (5 point assessment, 5= least) 2.8 2.9 2.3 2.7
Top rented plot: mean assessment of the soil fertilizer level (5 point assessment, 5= least) 2.8 2.9 2.4 2.7
Top 2 owned plots: mean assessment of irrigation access level (5 point assessment, 5= least) 2.6 2.6 2.4 2.6
Top rented plot: mean assessment of irrigation access level (5 point assessment, 5= least) 2.6 2.8 2.5 2.6
72

Table 4.1.d. shows irrigation characteristics of the lead lots, owned and rented. Several points stand out. First, rain-fed (non-irrigated) lead plots are rare (only marginal farmers have a few). Recall that the hilly area villages have reservoirs, and the plains area villages have easy access to the lake, so irrigation is ubiquitous. The table shows that nearly all water from reservoir and lake (not from an underground aquifer). Second, 60% of lead plots use canals but this is somewhat negatively correlated with farm size. Third, by contrast, having an irrigation pump is sharply correlated with farm size (33% of marginal farms, 65% of medium), with 40% on averaged. Owned and rented plots patterns are the same in this regard.
73
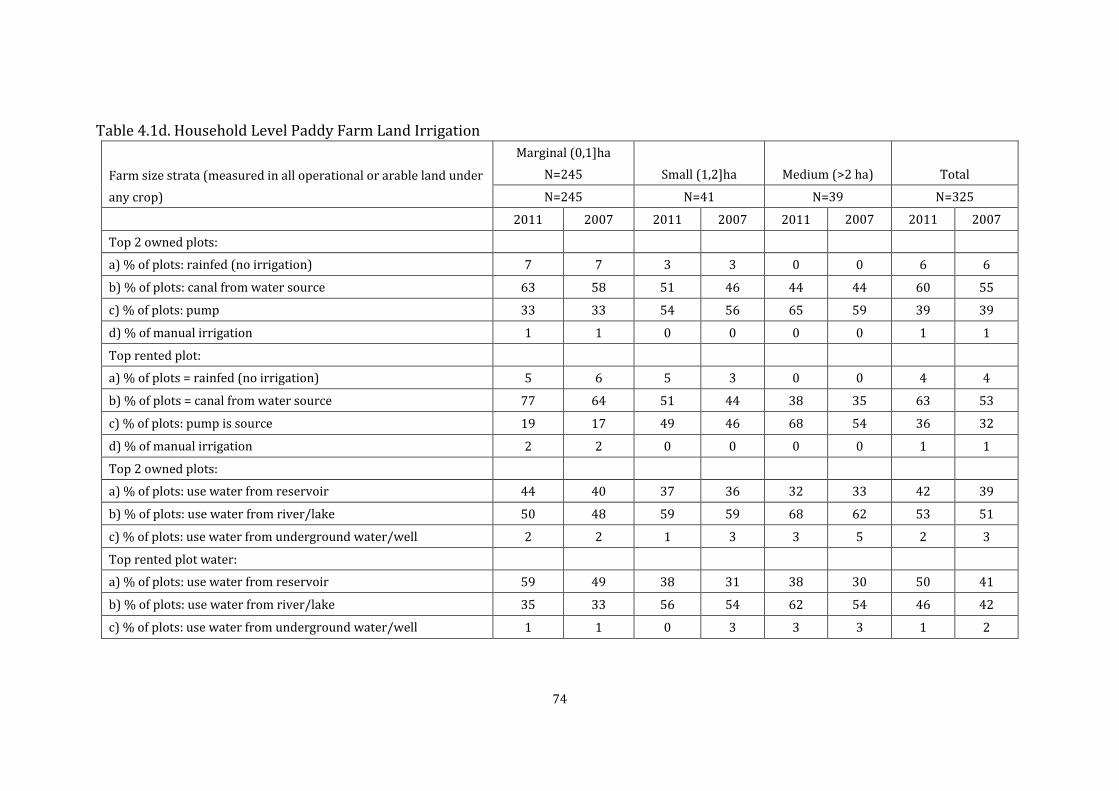
Table 4.1d. Household Level Paddy Farm Land Irrigation
Farm size strata (measured in all operational or arable land under any crop)
Marginal (0,1]ha N=245 Small (1,2]ha Medium (>2 ha) Total
N=245 N=41 N=39 N=325
2011 2007 2011 2007 2011 2007 2011 2007
Top 2 owned plots:
a) % of plots: rainfed (no irrigation) 7 7 3 3 0 0 6 6
b) % of plots: canal from water source 63 58 51 46 44 44 60 55
c) % of plots: pump 33 33 54 56 65 59 39 39
d) % of manual irrigation 1 1 0 0 0 0 1 1
Top rented plot:
a) % of plots = rainfed (no irrigation) 5 6 5 3 0 0 4 4
b) % of plots = canal from water source 77 64 51 44 38 35 63 53
c) % of plots: pump is source 19 17 49 46 68 54 36 32
d) % of manual irrigation 2 2 0 0 0 0 1 1
Top 2 owned plots:
a) % of plots: use water from reservoir 44 40 37 36 32 33 42 39
b) % of plots: use water from river/lake 50 48 59 59 68 62 53 51
c) % of plots: use water from underground water/well 2 2 1 3 3 5 2 3
Top rented plot water:
a) % of plots: use water from reservoir 59 49 38 31 38 30 50 41
b) % of plots: use water from river/lake 35 33 56 54 62 54 46 42
c) % of plots: use water from underground water/well 1 1 0 3 3 3 1 2
74
4.2.1.2. Rice Farmers’ Non-land Assets In our exploration of the structure of the rice farm segment, we will now discuss rice farmers’ non-land assets. Table 4.2.a shows human and social capital of the farm households. Several points are to note. First, the household heads have similar characteristics over the strata: they average 55 years old, almost all are male (despite the importance of migration in the families), and have modest education (5-7 years, correlated with farm size). Second, government direct extension and training is a minor conduit of information about new rice technologies, and tends to be targeted at the larger farmers. Few farms received extension agent visits (only 15% on average); but such visits were correlated with farm size (15%,15%, 28% for the three strata, respectively). Only 11% got training from government: this was strongly correlated with farm size (8%,10%, 33%). Yet two-thirds of farmers want extension (much lower share said heard that extension and training available). 30% said they are willing to pay for extension (a little correlated with farm size but not much). Participation in the shifanhu (lead technology program) is very correlated with farm size (5, 20, and 28% of the farmers over the three strata). Third, rather, farmers tended to use other means to inform themselves on rice technology: 29% used internet for advice and 42% used TV/radio for advice – thus electronic media are much more important than extension agents. Only 10% use input shops for extension.
75

Table 4.2.a. Paddy Farmers and Non-land Assets in Jiangxi: Human and Social Capital
Farm size strata (measured in all operational or arable land under any crop)
Marginal (0,1]ha Small (1,2]ha Medium (>2 ha) Total
N=245 N=41 N=39 N=325
a) Demographic variables
Age of head of household (years) 56.8 53.7 50.9 55.7
Gender of head of household (% male) 97.9 100 97.3 98.1
Household size (adults plus children) 4.8 4.9 4.8 4.8
Dependency ratio (children (below 15) & adults over 65 / total HH size) (%) 28.8 22.3 18.2 26.7
% of HHH nationality Han (major) 100 100 100 100
% of HHH who are Buddhists 12 15 8 11
b) Education & experience
Mean years of HHH education 5.5 5.7 7.4 5.8
% of HHH that are CPC members 14 7 10 13
% of HHH that are Village officials 12 7 13 11
% of the HHH who are ShiFanHu (lead-technology farmer chosen by government) 5 20 28 10
Number of years HHH has grown rice 33.7 29.5 24 32
c) Extension & Training in 2011
% of HHs report learning new paddy technology (learn from any source) 19 20 23 20
% of HHs sought and got (government or private) extension farm/HH-visit in 2011 13 15 28 15
Mean over HHs that used extension: mean number of times used farm/HH-visit extension 1 0.4 1.8 1
% of HHs bought any agricultural books in 2011 9 17 21 11
% of HH ever used the TV or internet to learn some agricultural technology 26 49 28 29
% of HH informed by extension agents that training is available 8 2 21 9
76

% of HH took part in any training (by government or company) for paddy growing 8 10 33 11
If no training already offered, % HH willing to do training 60 71 72 63
If did training, % of HHs that received subsidy for participating 6 0 7 5
% of HH willing to pay for extension 28 32 38 30
Ways that HHs get farming information; % of HHs reporting having used:
a) newspapers or magazines 4 10 13 5
b) TV or radio 41 39 54 42
c) extension agent 8 10 13 9
d) shifanhu (demonstration HH plot) 1 2 8 2
e) village officials 0 0 0 0
f) other farmers 21 22 18 19
g) learn by doing 42 51 41 43
h) input shop or distributor 10 12 13 10
i) instructions on the input bag 1 0 5 1
Subjects treated by extension agents for the HHs, report by % of HHs:
a) what seed variety to use 1 2 3 2
b) sell seeds 0 0 3 1
c) how to grow seedlings 2 10 3 3
d) what soil nutrients to apply 0 2 5 1
e) how to transplant rice 2 2 5 2
f) how to manage field water level, when to apply fertilizer and chemicals, when to harvest 2 0 0 1
g) sell fertilizer 0 0 3 0
h) identify/prevent disease 8 7 21 10
77
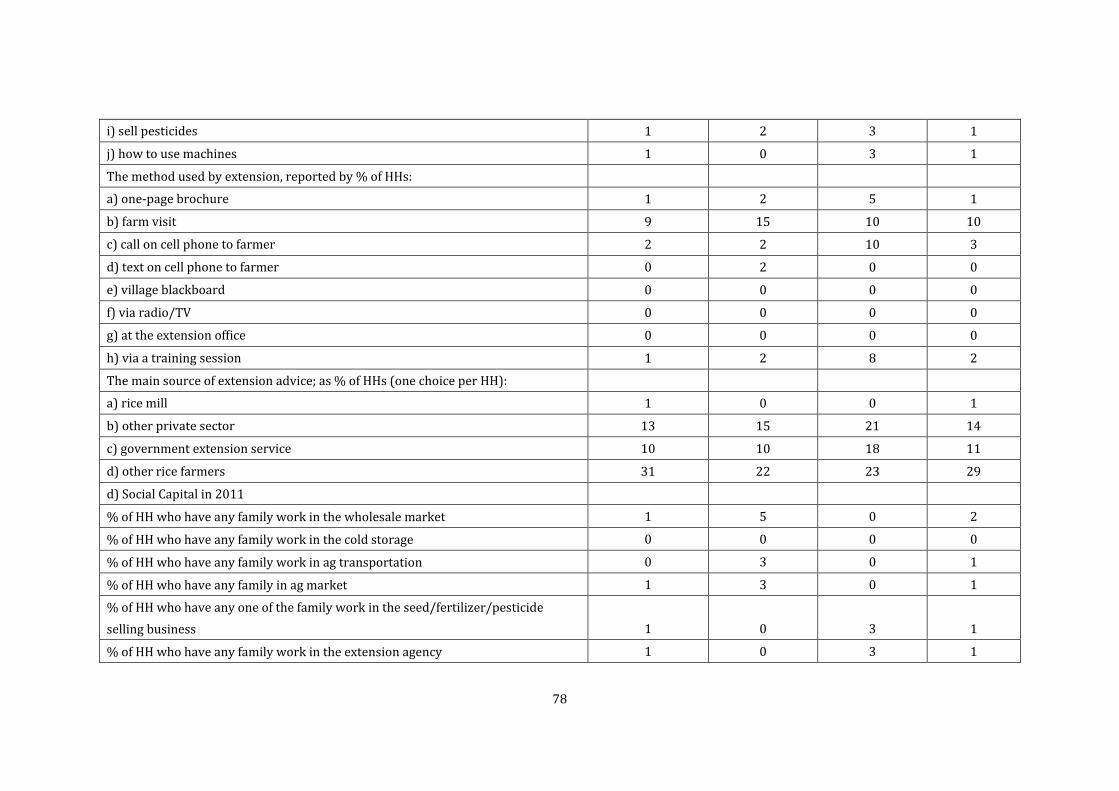
i) sell pesticides 1 2 3 1
j) how to use machines 1 0 3 1
The method used by extension, reported by % of HHs:
a) one-page brochure 1 2 5 1
b) farm visit 9 15 10 10
c) call on cell phone to farmer 2 2 10 3
d) text on cell phone to farmer 0 2 0 0
e) village blackboard 0 0 0 0
f) via radio/TV 0 0 0 0
g) at the extension office 0 0 0 0
h) via a training session 1 2 8 2
The main source of extension advice; as % of HHs (one choice per HH):
a) rice mill 1 0 0 1
b) other private sector 13 15 21 14
c) government extension service 10 10 18 11
d) other rice farmers 31 22 23 29
d) Social Capital in 2011
% of HH who have any family work in the wholesale market 1 5 0 2
% of HH who have any family work in the cold storage 0 0 0 0
% of HH who have any family work in ag transportation 0 3 0 1
% of HH who have any family in ag market 1 3 0 1
% of HH who have any one of the family work in the seed/fertilizer/pesticide selling business 1 0 3 1
% of HH who have any family work in the extension agency 1 0 3 1
78

% of HH who have any family work in the cooperative 0 3 3 1
% of HH who have any family work in the mutual help group 11 5 3 9
e) Social Capital in 2007
% of HH who have any one of the family work in the wholesale market 1 5 0 1
% of HH who have any one of the family work in the cold storage 0 0 0 0
% of HH who have any one of the family work in the agricultural products transportation 0 0 0 0
% of HH who have any one of the family work in the agricultural products retail market 0 3 0 0
% of HH who have any one of the family work in the seed/fertilizer/pesticide selling business 0 0 3 1
% of HH who have any one of the family work in the extension agency 0 0 3 1
% of HH who have any one of the family work in the cooperative 0 3 3 1
% of HH who have any one of the family work in the mutual help group 10 5 3 9
79

Table 4.2.b. shows access to administration centers and holdings of farm equipment. Several points stand out. First, the farms have easy access to the main administrative services, as the farmers are mainly located within 5-12 km of the town and county official buildings, and the government grain purchasing site, and even close to the nearest mill. Second, holdings of consumption durables are similar across farm size strata. This suggests that there are mixed livelihood strategies: nonfarm plus small farming versus larger farming specialization. Third, just as Reardon et al. (2012a) found in the case of potato farmers in Gansu (in the earlier RETA study), in Shangrao there has been a very large jump in livestock holdings. For the average farm household (with even more among smaller farmers) in all strata their holdings of livestock are equivalent in value to the value of owning a tractor. This could be because nonfarm earnings are “saved” in the form of holding livestock, which are also a productive factor. Fourth, just as Reardon et al. (2012a) found in the case of rice farmers in Heilongjiang (in the earlier RETA study), there has been in Shangrao a large jump in non-land assets such as machines and cell phones and motorcycles; these holdings increase 2-3 times in a mere five years for all strata. Fifth, the data show an extreme correlation between land size and tractor ownership, with extreme concentration of tractor ownership; but there is a non-concentration (hence widespread use) of tractors, via tractor services renting (76, 76, 93% of the strata). As only a quarter of the owners of tractors service/rent to other farms, and by the nature of farming they just use the tractor on their own farm for a few days or weeks per year, and few rent out, implies that farmers use tractors for nonfarm activities/multi-functional transport the rest of the year. (This is common among farmers in developing countries everywhere.) 80% of the few tractor owners each received about a 50% subsidy to buy the tractor; thus there is a very strong concentration of subsidy funds among the few, mainly larger farmers that own tractors. Sixth, very few farmers own harvesters: just 13% of larger farmers own them, and other farm strata do not. All those farmers who own them also rent out harvester services (as harvesters are not multi-functional like tractors are). But nearly all farmers use mechanical harvesters, so there is a big rental market for
80

harvesters. It is not clear from the data how much is from outside services (from services outside the village or county (see Jin et al. 2013) and how much of the demand is met from inside the village/county. Seventh, ownership of irrigation pumps (recall that these are used for canals or pipes from lake or reservoir not groundwater) jumped 3 times in 5 years (but only among the small and medium farmers, not marginal farmers. Table 4.2.b. Paddy Farmers and Non-land Assets: Infrastructure access, consumer durables, and Farm Equipment
Farm size strata (measured in all operational or arable land under any crop)
Marginal (0,1]ha
Small (1,2]ha
Medium (>2 ha) Total
N=245 N=41 N=39 N=325
a.1) Location capital in 2011 (km)
Distance from home to the town official building 5.5 6 7 5.7
Distance from home to the county official building 12.5 10.9 13.4 12.4
Distance from home to the Liangzhan (grain purchasing site of government of township) 5.7 6.6 6.6 5.9
Distance from home to the nearest mill 3.3 4 7.1 3.9
a.2) Location capital in 2007 (km)
Distance from home to the town official building 5.5 5.9 7 5.7
Distance from home to the county official building 12.5 10.9 13.4 12.4
Distance from home to the Liangzhan (grain purchasing site of government of township) 5.7 6.6 6.6 5.9
Distance from home to the nearest mill 3.4 4 7.1 3.9
b) Consumer durables
Size of the house in square meters 268 227 292 272
Age in years of the house 11.8 10.7 10.7 11.5
Total building and decorating cost of the house (USD) 11969 14031 15612 12666
% of HHs with multi-story house 80 83 83 81
% of HHs with bathrooms 59 56 67 60
% of HHs with access to tap water 43 29 44 41
% of HHs with access to internet 6 12 10 7
Mean wealth of the HH (seven point scale self-reported, 7=the poorest) in 2011 4.1 4.1 3.9 4.1
Mean wealth of the HH (seven point scale) 2007 4.2 4.2 4.1 4.2
c) Farm capital
Livestock holdings in 2011 (USD) 727 1164 614 768
Livestock holdings in 2007 (USD) 442 443 254 420
Non-land non-livestock farm assets in 2011 (USD) 946 1179 3131 1238
Non-land non-livestock farm assets in 2007 (USD) 422 465 1281 531
81

% of HHs own transplanting machine in 2011 0 0 0 0
% of HHs own tractor in 2011 16 44 82 27
Of HHs that own tractor in 2011:
a) mean number owned in 2011 1 1 1.1 1.1
b) purchase price of the machine owned in 2011 in USD 720 760 679 713
c) how old is the machine 2011 (year) 4.7 4.8 3.7 4.4
d) for 2007 how many of this machine HH had 0.4 0.4 0.7 0.5
e) % of HHs who received subsidy to buy machine 74 78 84 79
f) of HHs that received subsidy, mean USD received 230 239 355 279
g) size of machine proxied by HA machine can prepare per day 0.8 0.5 0.8 0.7
h) % of HHs own machine AND service others’ farms for fee 26 33 28 28
i) fuel cost per day for service in USD 21 16 21 20
j) USD per day for service (ha x charge per ha) 150 92 180 148
% of HHs own harvester machine in 2011 1 2 13 3
Of HHs that own harvester machine in 2011:
a) mean number owned in 2011 1 1 1 1
b) purchase price of machine owned in 2011 in USD 8682 NA 6759 7309
c) how old is the machine 2011 (year) 3.3 3 1.4 2.2
d) for 2007 how many of this machine HH had 0.3 0 0.4 0.3
e) % of HHs received subsidy to buy the machine 33 NA 80 56
f) of those HHs received subsidy, mean USD received 2325 NA 1298 1503
g) HA that machine can prepare per day 1.3 NA 1.2 1.3
h) % of HHs own machine AND service others’ farms 57 100 100 67
i) fuel cost per day for service in USD 62 NA 46 49
j) USD charged per day for service (ha x ha charge) 310 NA 276 282
% of HHs own drying machine in 2011 0 0 0 0
Half-automatic (machine fed manually; power is electricity or pedaling) thresher owned 2011: % HHs 9 19 5 10
Half-automatic thresher in 2007: % of HHs 8 10 3 8
Pesticide/herbicide Sprayer owned in 2011: % of HHs 94 95 97 95
Sprayer in 2007: % of HHs 90 90 92 90
Irrigation Pump owned in 2011: % of HHs 13 37 38 19
Irrigation Pump in 2007: % of HHs 11 20 15 13
Animal traction owned in 2011: % of HHs 27 34 15 26
Animal traction owned in 2007: % of HHs 26 32 15 35
% households using transplanting machines in 2011 0 0 0 0
% households using transplanting machines in 2007 0 0 0 0
82

% of households using machine tractor in 2011 76 76 93 79
% of households using machine tractor in 2007 65 66 86 68
% of households using animal traction in 2011 24 26 8 22
% of households using animal traction in 2007 28 32 13 27
% of households using harvester machines in 2011 80 82 95 83
% of households using harvester machines in 2007 64 70 92 68
% of households using drying machine in 2011 0 0 0 0
% of households using drying machine in 2007 0 0 0 0
% households using half-automatic thresher in 2011 17 23 17 17
% households using half-automatic thresher in 2007 21 22 22 22
4.2.1.3. Rice Farmers and Non-farm and Farm Labor Markets Before moving on to the conduct of the rice farm segment, our focus on the structure of the rice arm segment will conclude with an analysis of rice farmers and non-farm and farm labor markets. Table 4.3. a-b shows income source s of households. Several points stand out. First, fully three-quarters of the farm households have off-farm employment. There is a slight negative correlation with farm size of both local nonfarm wage work and self-employment; yet even medium farms diversify into off-farm jobs, despite their having substantial land. Farm wage labor tends to be high among marginal farmers, as is usual in the international literature. Second, while the farms’ cropping is strongly focused on rice, many of the households undertake on-farm non-cropping, mainly into livestock husbandry. Third, it is interesting that half the farms have migration – and not much difference over farm sizes. That shows that migration is not necessarily in tradeoff with farming. Taking migration “income” of members and remittances (sent from those who moved away from the farm) there is little correlation between farm size and migration/remittances. Moreover, the average is high (and the CV (standard deviation divided by the mean) for this rubric is less than for the other nonfarm rubrics). So migration is important to all the farm sizes, to half the families in all groups. Fourth, because landholdings are highly unequal over strata, so are rice incomes, as shown in row 14, with a 10 fold difference between medium farms (earning 10,000 USD from rice per year. Those able to rent in substantial land became substantial small businesses in growing rice. The marginal and small farms average only a bit over 1000 USD per year from rice.
83

Finally, because of the equalizing impact of off-farm and non-rice farm income, the gap is much smaller over strata for overall income – about 2 to 1, or 15,000 USD for the medium farmers versus around 7000 for the marginal and small farmers. Note that for the latter, rice is only 15% of their incomes, while for the former (the medium farmers), rice is two-thirds of their income.
84

Table 4.3. Paddy Farmers and Off-farm Labor Farm size strata (measured in all operational or arable land under any crop) Marginal
(0,1]ha N=245
Small (1,2]ha N=41
Medium (>2ha) N=39
Total N=325
2011 2007 2011 2007 2011 2007 2011 2007
a) % of HHs with employment off-farm and non-cropping on-farm
% of HHs with member working off—(own)farm 73 73 68 68 77 76 73 73
% of HHs with Local nonfarm workers 25 25 22 15 21 18 24 23
% of HHs with Local farm wage-workers 16 14 2 10 10 26 13 15
% of HHs with Migrants (here migrants means household members migrate out of local county) 49 53 54 44 51 46 50 51
% of HHs with members with local nonfarm self-employment 20 12 17 20 13 13 18 13
% of HHs with member with on-farm non-cropping activity 12 11 27 20 18 10 15 12
% of HHs who do fishery 2 0 2 2 0 3 2 1
b) Earned income from non-paddy sources in 2011 (averaged over all HHs)
mean CV mean CV mean CV Mean CV
(1)Mean income of local wage-employment in 2011 USD 639 240% 390 260% 816 288% 629 255%
(2) among (1), mean income of local non-farm wage employment in 2011 USD 79 726% 72 463% 143 624% 86 695%
(3)Mean income of migrate wage income in 2011 USD (remittances are NOT included) 3876 163% 4348 147% 3478 161% 3888 160%
(4)Mean income of local nonfarm self-employment (USD in 2011) 465 393% 763 353% 232 274% 475 393%
(5)Mean Income of other agriculture products besides paddy, like vegetables (USD in 2011); 167 183% 353 225% 222 201% 197 212%
(6)Income from fishery in 2011USD 62 865% 53 470% 1.4 625% 54 884%
(7)Income from dairy/livestock sales in 2011 USD 279 928% 189 357% 146 397% 252 902%
(8)Rental income of rented-out land in 2011USD 0 NA 0 NA 0 NA 0 NA
85

c) Non-earned incomes and debt in 2011
Mean over HHs of the % of the adults on pension (rural endowment insurance) 30 24 68 34
Mean over HHs of the % of members who have rural cooperative medical service 96 98 94 96
% of the old people get basic living allowance 8 9 13 9
(9)Income from gifts in 2011USD 124 13 229 122
% of HHs got remittances from migrants in 2011 24 15 21 22
Mean amount of money received in remittances of those HH who got some remittances USD in 2011 411 578 854 493
(10)Mean amount of money received in remittances over all households USD in 2011 98 86 179 108
d) summary rows in 2011 USD
(11)Total of all non-cropping (rice) income in 2011 USD(=1+3+4+5+6+7+8+9+10) 5712 6197 5303 5726
(12)Total income from rice over seasons (total gross rice output market value) in 2011 USD (using average price for early/middle/late season paddy, 110, 123, 125 yuan per 50kg) 1681 5471 31428 5729
(13)Total rice inputs in 2011 USD (all costs but own labor and own machine use costs) 1021 3771 21248 3739
(14)Net income from rice over seasons (=total gross rice output marketed-rice input, all but own labor and own machines) in 2011 USD (=12-13) 661 1700 10180 1990
(15)Total income in 2011 USD (=non-cropping (rice) income + cropping (rice) income) (=11+14) 6373 7897 15483 7716
86

4.2.2. Conduct of the Rice Farm Segment
In order to understand the conduct of the rice farm segment, we will inspect farm technology, access to water, access to seed, purchase of fertilizer and crop chemicals, marketing, rice farmers’ accessing value chain credit. 4.2.2.1. Farm Technology Our consideration of the conduct of the rice farm segment will begin with a discussion of farm technology. First, the own-seed use (not purchased) rate averages 44% -- dropping down to 23% for medium farmers only. This is a surprisingly high own-seed rate overall given that this is a commercialized area (compared with rice areas in Heilongjiang, see Reardon et al. 2012). Purchased seed is only 3% of monetary costs. Second, chemical fertilizer cost averages about 14% of all monetary costs, a bit higher for smaller farms. The rate is surprisingly high – roughly 800 kg per hectare; however, this is approximately the same as we found in the survey in Heilongjiang (Reardon et al. 2012). We had expected roughly half the rate found, as 300-400 kg/ha is the typical reported official data for the provinces. The rate may be so high for several reasons, based on key informants explanations: (1) fertilizer bought is thought to be poor quality so farmers feel they have to use more of it; (2) they may overuse due to poor information as to how much to use; (3) it seems that extension agents “push” fertilizer use to excessive levels. Third, crop chemicals (outside fertilizer) are about 6% of farm costs, a little higher share for smaller farms. Herbicides are used by all farms; this makes sense given the high rate of off-farm employment participation, and herbicides are substitute for on-farm labor, just like machine use is. Fourth, as expected, water is a minor cost at about 2% of monetary cost; larger farmers are somewhat more apt to buy from private sources and smaller farmers from the state. Fifth, labor use is far higher among the marginal and small farms than in the medium farm operations; labor intensity is negatively correlated with farm size, a common finding internationally. Own labor use is strongly negative correlated with farm size, as hired labor is sharply positively correlated; poor farm laborers are working on the larger medium farmer plots. This is not surprising. Own labor
87
use among marginal farmers is very high for land preparation, harvesting, and drying. Sixth, interestingly, tractor use is similar across size strata and even somewhat higher for marginal farmers; the latter might be due to the multifunctional use of tractors. Hired harvester use is similar over strata. However, interestingly, animal traction use is still strong among marginal farmers (not pushed out yet by tractor). Thus, the marginal farmers use both tractors/harvesters and animal traction. The data show that this is because the marginal farmers still use animal traction on their smallest plots (which hard for tractor or harvester to work on, as they are on hills or in low areas), and tractors on the bigger plots. Seventh, land rental is minor cost for marginal and small and extremely large for medium – 25 % of their costs. This pattern is expected given the land rental discussion above. Eighth, overall costs are higher for larger farmers, going from 1500 to 1700 to 2000 (similar costs to Heilongjiang study reported in Reardon et al. (2012), even a bit higher). As expected given the importance of use of own labor among smaller farmers, the monetary share is much higher for larger farmers, from 57% to 66% to 86% over strata. Overall, it is interesting that chemical and seed use is not much different over strata; fertilizer somewhat more among medium farmers, as is machine use. But overall, farm technologies used are broadly similar over the farm size strata. Smaller farms are somewhat more intensive (in labor), and larger farms more extensive in land (through rental), with similarity in all else (machine use and non-labor variable inputs use).
88

Table 4.4. Paddy Farmers’ Production Cost Composition in levels (USD/ha) and in % of total cost in 2011 Note: All the costs are calculated based on all paddy land under cultivation for that household, calculated over all farms (even those using zero of given input)
Farm size strata (measured in all operational or arable land under any crop) Marginal (0,1]ha
Small (1,2]ha
Medium (>2 ha) Total
N=245 N=41 N=39 N=325
1. Seed total(USD/ha) 179.3 181.2 161.8 168.9
a) own seeds imputed at market seed price (kg * the market price (USD/kg)) (USD/ha) 79.5 82.6 54.2 64.5
b) purchased seeds (value (money paid (kg * price))) (USD/ha) 99.8 98.6 107.6 104.4
2. Fertilizer total (a+b) (USD/ha) 368.6 359.4 331.3 344.5
a) chemical fertilizer in stages other than seedling production (USD/ha) 342 342.2 315.2 325.6
Chemical fertilizers in kg in stages other than seedling production (as a measure) (kg/ha) 804.4 811.5 788.4 795.6
b) Chemical value in seedling production stage (USD/ha) 26.6 17.2 16.1 18.9
c) organic fertilizer in kg (there is no market price for this so just report volume) (kg/ha) 13.9 26.2 0 7.1
d) Manure in kg (there is no market price so just report volume) (kg/ha) 475.3 67 33.8 149.6
3. Crop chemicals (=a+b+c) (USD/ha) 147.1 151.3 147.5 147.9
a) crop chemicals at seedling production stage (USD/ha) 11.1 5.7 3.7 5.8
b) insecticides and fungicides at stages other than seedling production (USD/ha) 117.2 128.3 131.2 127.3
c) herbicides in stages other than seedling production (USD/ha) 18.8 17.3 12.6 14.8
4. Water (apart from rainfall) total non-labor costs (a+b+c) (USD/ha) 38.5 51 52 48.5
a) outsourcing cost for irrigation (money paid to others to take care of irrigation where the farmer does not need to be involved in irrigation) (USD/ha) 24.9 15.9 37.5 31.4
b) water cost (payment to government or village/community for water used for irrigation ) (USD/ha) 3.6 13.5 0.1 2.8
c) fuel and electricity to pump water (USD/ha) 9.9 21.6 14.5 14.3
89

5. Labor
5.1. Labor total in value for all stages of production (stages as defined in 5.2) broken down into own versus hired (a+b+c+d) (USD/ha) 1120.1 893.5 540.5 653.2
a) Own labor imputed at market wage (days of own labor * wage per day) (USD/ha) 989.8 704.3 188.3 460.3
b) Hired labor at market wage without machine (USD/ha) 41.3 94.4 305.9 129.2
c) Labor component of hired labor plus machine (calculated as time of labor times wage) (USD/ha) 61.1 36.4 14.6 29.3
d) Exchange labor received (assume exchange-out equal) (USD/ha) 27.9 58.3 31.8 34.4
5.2. Labor (same total as 5.1) broken down by task (all types of labor noted in 5.1) (USD/ha) 1120.1 893.5 540.5 653.2
a) seedling production labor (USD/ha) 63.3 50.7 28.2 40.1
b) land preparation labor (USD/ha) 145 109 46.2 79.6
c) seedling transplanting labor (USD/ha) 240.1 223 257.2 167
d) weeding labor (USD/ha) 63 33.9 28.1 37.7
e) chemical fertilizer application labor (USD/ha) 91.4 79.4 64.8 73.5
f) crop chemicals application labor (USD/ha) 45.8 37.1 28 33.7
g) irrigation labor (USD/ha) 67.4 43.6 10.1 29.1
h) harvesting labor (USD/ha) 98.2 109.1 17.5 50.3
i) threshing labor (USD/ha) 60.4 28 5.1 22.1
j) drying labor (USD/ha) 245.4 179.7 55.3 120.1
6.Machine use cost in total (=6.1+6.2+6.3+6.4) (USD/ha) 528.4 544.5 484.9 550.3
6.1 tractor (a+b) (USD/ha) 287 206.7 217.9 291.5
a) hired tractor traction in land preparation (USD/ha) 234.9 141.7 148.5 227.1
b) own tractor used imputed at rental price (USD/ha) 52.1 64.9 69.4 64.4
6.2 harvester (a+b) (USD/ha) 235.4 253.8 256.6 250.6
a) hired harvester (USD/ha) 230.6 253.8 250.7 245.8
90

b) own harvester imputed at rental price (USD/ha) 4.8 0 6 4.9
6.3 other machine cost (pump + sprayer + seedling transplanter +thresher+ dryer) (USD/ha) 5 0 7.1 5.4
6.4 other machine fuel cost (at weeding+crop chemical application+harvesting+threshing stage) (USD/ha) 1 3.7 3.2 2.7
7.Animal Traction cost in total (=a+b) (USD/ha) 160.6 165 14.3 80
a) animal traction in land preparation (own + rental +imputed rental rate) (USD/ha) 160.6 165 14.3 80
b) animal traction in harvesting(own + rental +imputed rental rate) (USD/ha) 0 0 0 0
8. Land rental (=a+b) (USD/ha) 43 179.3 583.8 392.6
a) Rental fee paid in cash (USD/ha) 29.9 159.9 557.6 370.6
b) Rental fee paid by sharecropping imputed at market price of crop given (USD/ha) 13.2 19.4 26.2 22
9. Other cost (at the stage of seedling production, like plastic film to keep seedling warm and grow faster and bamboo stick for plastic film) (USD/ha) 6 10.4 0.9 3.5
10. Total cost (=a+b) (USD/ha) 2591.7 2535.5 2316.9 2389.2
a) total monetary cost (USD/ha) 1465.5 1683.7 1999.1 1795.2
b) total imputed in kind costs (USD/ha) 1126.2 851.8 317.9 594
11. Total cost (cash outlays plus imputed in-kind costs) (100%) 100 100 100 100
a) total monetary cost ( % of total cost) 57 66 86 75
b) total imputed in kind costs ( % of total cost) 44 34 14 25
91

Table 4.5 explores details of mechanization by season and function. The following are the key points. First, there is no market for rice seedlings per the information from the survey. Second, farmers use extensively their own seedlings; the use of hired labor for hand transplanting increases markedly in farm size, as expected. Third, there is a strong negative correlation between farm size and the hiring of machine land preparation; there is however a positive correlation with farm size of use of own machines for preparation, as could be expected, as that coincides with the pattern of tractor ownership discussed above. Fourth, it is interesting that all farmers hire harvesters and nearly all use harvester machines to thresh; only a few smaller farmers still thresh by hand. It is an important finding that this does not differ over strata – all are pressed for labor time in various ways.
92

Table 4.5. Agricultural Practices: Mechanization versus labor usage (USD/ha) Farm size strata (measured in all operational or arable land under any crop) Marginal (0,1]ha
N=245 Small (1,2]ha
N=41 Medium (>2ha)
N=39 Total N=325
2011 2007 2011 2007 2011 2007 2011 2007
1. Diffusion of seedling and seeding practices
Of those grow early indica, % of HH use zhibo (manual seed broadcast) for early indica (during March is seedling production; harvest is early July) 31 27 34 27 64 54 35 30
Of those grow middle indica, % of HH uses zhibo for middle (during may is seedling production) indica 6 4 2 2 10 10 6 5
Of those grow late indica, % of HH use zhibo for late indica (during June is seedling production and transplant early/mid July) 6 3 12 5 8 10 7 4
Of those grow early indica, % of HH grow seedling for early indica 58 57 59 61 31 31 55 54
Of those grow middle indica, % of HH grow seedling middle indica 31 29 37 29 56 28 35 29
Of those grow late indica, % of HH grow seedling late indica 84 80 88 88 85 74 84 80
Of those grow early indica, % of HH buy seedling for early indica 0 0 0 0 0 0 0 0
Of those grow middle indica, % of HH buy seedling for middle indica 0 0 0 0 0 0 0 0
Of those grow late indica, % of HH buy seedling for late indica 0 0 0 0 0 0 0 0
2.Transplanting: diffusion of different practices
Of those grow paddy, % of HH hiring hand-transplanting any season 43 42 73 66 90 62 53 47
Of those grow paddy, % of HH hiring machine-transplanting any season 0 0 0 0 0 0 0 0
Of those grow paddy, % of HH hand-transplant any season 68 69 54 51 49 56 64 65
Of those grow paddy, % of HH own machine-transplant any season 0 0 0 0 0 0 0 0
3.Land preparation: practices diffusion
Of those grow paddy, % of HH hiring hand-land preparation any season 1 1 0 0 0 0 1 1
93

Of those grow paddy, % of HH hiring cattle-land preparation any season 5 4 2 7 0 0 4 4
Of those grow paddy, % of HH hiring tractor-land preparation any season 62 53 41 44 36 31 57 49
Of those grow paddy, % of HH own hand-land preparation any season 11 13 17 15 13 5 12 12
Of those grow paddy, % of HH own cattle-land preparation any season 18 22 27 27 5 10 18 21
Of those grow paddy, % of HH own tractor-land preparation any season 15 11 39 22 72 56 25 18
4. Harvesting: different practices diffusion
Of those grow paddy, % of HH hiring hand-harvesting any season 0 0 2 2 8 3 1 1
Of those grow paddy, % of HH hiring machine-harvesting any season 82 61 88 71 79 72 82 63
Of those grow paddy, % of HH hand-harvesting any season 31 39 29 34 15 13 29 35
Of those grow paddy, % of HH own machine-harvesting any season 1 0 0 0 15 13 2 2
5.Threshing: different ways rice farmers threshing
Of those grow paddy, % of HH threshing at the same stage with harvesting by machine 79 65 85 71 97 90 82 69
Of those grow paddy, % of HH threshing by hand 22 29 7 17 5 8 18 25
Of those grow paddy, % of HH threshing by thresher machine in 11 13 15 15 10 10 11 13
94

4.2.2.2. Access to Water Next we will consider access to water in our discussion of the conduct of the rice farm segment. Table 4.6 shows farms’ accessing water. First, only a third of the small and medium farmers use their own pumps to draw water. However, the share grew quickly over the past 5 years. The share is much lower for marginal farmers. Second, outsourcing water provision (from others) dropped fast over the past 5 years; as of now less than a fifth of the farmers do this. The medium farmers in this case receive a service: they pay others to take care of their irrigation: (1) the water may be itself free (from public source) but require transfer to the fields, done by the service; (2) if the water is from the village reservoir, the village may contract persons to let the water flow from the reservoir through the canal each day during a certain part of the season, and will charge farmers for that service. Third, mainly the marginal farmers receive water free from the state. Table 4.6. Paddy Farmers’ Accessing Water (all figures are %’s of farmers who grow paddy) Farm size strata (measured in all operational or arable land under any crop)
Marginal (0,1]ha N=245
Small (1,2]ha N=41
Medium (>2ha) N=39
Total N=325
2011 2007 2011 2007 2011 2007 2011 2007
1. Own production of water: Own pump action (but can own or rent pump) irrigation (from river or lake) 15 15 34 28 33 20 20 17
2. Buy water: Outsourcing irrigation (paid by farmer) (can be from various sources, such as from village reservoir sent to him/her by someone hired by the village; from a lake/river by canal plus village pump to give him) 17 23 18 26 33 49 18 26
3. Receive water free from public sector (but farmer still needs to use his own labor to place the pipe from public source); not use pump 68 61 45 44 34 31 60 55
95

4.2.2.3. Access to Seed Access to seed provides additional insight into the nature of the conduct of the rice farm segment. Table 4.7 provides details of sourcing of seed by the sample households. Following are the main points. First, 80-90% of the households bought rice seed (not seedlings, as we saw in the table above). In the early season, a third of the medium farmers use retained seed, and a quarter to a fifth of the other strata use retained seed (rather than purchased); but in general retained seed is not used in the late season. Second, the seed market is concentrated among the medium farmers. Third, the great majority of seed that is bought is purchased branded and packaged and in packs of more than 1 kg. Interestingly, these (modern) practices do not differ much over strata. Fourth, most farmers buy seeds near their village; only the larger farmers go a little further afield to buy seeds. The seed market is local. Interestingly, farmers mainly (about half) buy seed from “private farm inputs shops” (that sell a range of inputs). The average farmer buys about 22% from “seed shops” (bigger farmers buy a little more from them). Seed shops act as agents of seed companies, and mainly sell seed. Fifth, government retail sales of seed are minor; village extension sales plus state store sales are only, together, 14% for larger farmers and 6% for the small. Finally, while it is often thought that farmers buy seed on credit from shops, we found instead that only 4% of farmers do this. And it is very concentrated among the larger farmers, where a quarter do it.
96

Table 4.7. Paddy Farmers’ Seeds Acquisition 2011
Farm size strata (measured in all operational or arable land under any crop)
Marginal (0,1]ha
Small (1,2]ha
Medium (>2 ha) Total
N=245 N=41 N=39 N=325
1. Source of Seed in each season (%)
of those who grow early indica, % of HH using retained (from year/s before) seed in early indica season 19 24 35 21
For HH using retained seed in early indica, mean % of all seed used (total early indica seed = retained plus purchased) 59 59 42 49
of those who grow early indica, % of HH buying seed for early indica 83 82 73 81
of those who grow middle or/and late indica, % of HH using retained seed in middle/late indica season 13 20 5 13
For HH using retained seed in middle/late indica, mean % of all seed used (total middle and late indica seed = retained plus purchased) 15 19 16 16
of those who grow middle or/and late indica,% of HH buying seed for middle/late indica 92 90 97 93
2. Seed Market in each season in 2011
2.1. Seed market in early indica season of those who bought early indica seed (N=180; 30; 28; 238)
a) Mean kg per HH of packaged paddy seed bought in early indica season (N=162, 29, 19, 210) 7.1 27.1 74.4 16
b) Mean value (total USD) the rice farmers paid for the packaged paddy seed bought 27.4 129.8 329.8 68.9
c) Mean price (USD/kg) over farmers that bought packaged paddy seed (b/a) 3.8 4.8 4.4 4.3
a) Mean kg per HH of loose paddy seed bought in early indica season (N=13, 1, 7, 21) 32.1 190 605.7 230.8
b) Mean value (total USD) the rice farmers paid for the loose paddy seed bought 25.8 100.8 399.4 153.9
c) Mean price (USD/kg) over farmers that bought loose paddy seed (b/a) 0.8 0.5 0.7 0.7
a) Mean kg per HH of paddy packaged and loose seed bought in early indica season 10.2 32.5 206.2 36.1
b) Mean value (total USD) the rice farmers paid for the packaged and loose paddy seed bought 28.1 128.8 337.3 77.2
c) Mean price (USD/kg) over farmers that bought packaged and loose paddy seed (b/a) 2.7 4 1.6 2.1
97

2.2. Seed market in middle/late indica season of whose who bought middle/late indica seed (N=281; 52; 63; 396)
a) Mean kg per HH of paddy seed bought in middle/late indica season 4.6 15.6 45.9 12.6
b) Mean value (total USD) the rice farmers paid for the paddy seed bought 27.6 95.1 269.9 75
c) Mean price (USD/kg) over farmers that bought paddy seed (b/a) 6 6.1 5.9 5.9
3. Mean satisfaction with seed bought for those who bought seed (1=high;2=on mean;3=low) in 2011 (%)
a) % of HH said “high” 67 60 75 67
b) % of HH said “medium/average” 32 38 23 31
c) % of HH said “low” 1 2 2 2
4. Transaction credit for seeds in 2011 for who bought seed (%)
% of the HH who pay in cash at the spot of the transaction 99 95 77 95
% of the HH who pay on credit 0 4 23 4
5. Seed package characteristics of the seed bought in 2011
a) Brand (%)
% of HHs bought paddy seed with brand 91 94 88 91
% of purchased seed that is branded (as mean share over HH) 88 87 86 87
b) Packaged or not (%)
% of HH bought packaged/bagged paddy seed 93 95 99 94
% of purchased seed that is packaged/bagged (instead of loose) (mean over HH) 83 71 93 87
c) for HH that bought in packages/bags, weights of bags (%)
% of HHs bought smallest bags (500g) 7 1 10 7
% of HH bought 0.9 or 1 kg bags 5 1 4 4
% of HH bought in bigger (than 1 kg) bags 87 98 84 88
98

6. Characteristic of the seed vendors in 2011, over HHs that bought seeds
Mean distance to the seed seller in km 4.9 6 7.4 5.4
The location of the seed seller (%)
% of the sellers = in this village 24 19 24 23
% of the sellers = in other villages of this township area 42 39 30 40
% of the sellers = in other towns & in county 34 39 45 36
The vendor of the seed (in share of the farmers buying) (%)
a) Other farmers 16 21 14 17
b) private agriculture input shops 54 62 40 53
c) State/government input shops 2 0 9 3
d) Farmer specialized cooperatives 0 0 0 0
e) Village extension agents 4 1 5 4
f) Rice mills 0 0 0 0
g) Seed shops 21 15 32 22
h) other 1 0 0 1
The main reason of choosing this seed seller (in shares over HH) (%)
a) Habit, have known the seller for a long time 5 4 7 5
b) Short distance from the seller 31 31 18 29
c) Price is lower compared to others 2 2 0 2
d) Quality is assured 56 55 68 58
e) Can pay later 0 0 5 1
f) Without no other options 6 8 2 6
99

Table 4.8 shows farmers’ (self-reported) use of hybrid rice. Key points follow. First, there is a low share (compared with the national adoption rate of hybrid) of medium sized farms growing hybrid rice in the early season; only 43% grew it (and that had dropped from 45% in 2007); yet more (90%) medium farmers (than other strata) grow hybrid rice in the late season. Second, the diffusion of hybrid rice was actually higher (64% and 77%) among marginal and small farmers in the early (but not in the late season), compared with medium farmers. Third, it is interesting that the share in total seed used is low for hybrid in the early season (only 46% of seed used). Fourth, for the late season, the larger farmers tend to rely somewhat more (than do the other strata) on the seed shops (compared to more general line input shops) for hybrid seed purchase.
100

Table 4.8. Paddy farmers’ SELF-REPORTED shift to non-hybrid and hybrids (% of households) Farm size strata (measured in all operational or arable land under any crop) Marginal (0,1]ha
N=245 Small (1,2]ha
N=41 Medium (>2ha)
N=39 Total N=325
2011 2007 2011 2007 2011 2007 2011 2007
1. Diffusion of hybrid rice
% of HH growing hybrid paddy in early indica season of those who grow early indica 64 63 77 74 43 45 63 63
% of HH growing non-hybrid early indica of those who grow early indica 36 37 23 26 57 55 37 38
% of HH growing hybrid middle and late indica of those who grow middle and late indica 79 78 75 76 90 84 80 79
% of HH growing non-hybrid middle and late indica of those who grow middle and late indica 21 22 25 24 10 16 20 21
2. Importance (as share of total paddy seed sown) of hybrid rice
% of hybrid early indica seed used in total early indica seed used 28 47 6 18
% of hybrid middle and late indica seed used in total middle and late indica seed used 72 56 95 83
3. Importance (as share of total paddy seed bought) of hybrid rice
(1) % of early indica seed bought in total early indica seed used 42 40 59 52
(2) % of hybrid early indica seed bought in total early indica seed bought 47 85 9 26
(3) % of early indica seed bought from seed shop in total early indica seed bought 24 6 50 39
(4) for those early indica seed bought from seed shops, % of hybird early indica seed bought from seed shops rather than others 45 60 5 11
(5) % of hybrid early indica seed bought from seed shop in total early indica seed bought (=(4)*(5)/100) 11 3 3 4
(6) % of middle and late indica seed bought in total middle and late indica seed used 86 86 85 85
(7) % of hybrid middle and late indica seed bought in total middle and late indica seed 79 59 95 85
101

bought
(8) % of middle and late indica seed bought from seed shop in total middle and late indica seed bought 10 7 34 23
(9) for those middle and late indica seed bought from seed shops, % of hybrid middle and late indica seed bought from seed shops rather than others 61 97 100 96
(10) % of hybrid middle and late indica seed bought from seed shop in total middle and late indica seed bought (=(8)*(9)/100) 6 7 34 22
102

4.2.2.4. Purchase of Fertilizer and Crop Chemicals The purchase of fertilizer and crop chemicals further informs our understanding of the conduct of the rice farm segment and is discussed below. Table 4.9 shows farmers’ patterns of use and purchase of fertilizer, pesticides, and herbicides. Several points are salient. First, both in 2011 and 2007, nearly all farmers buy chemical fertilizer, pesticides, and herbicide. This is “intensification with external input use”. It is striking that the different farm strata use about the same amount of fertilizer and pesticide per ha and pay about the same price per kg for them. It may be that small farmers are following lead of large ones; or each responding to similar incentives. This suggests little access constraint for these inputs for all farms. Second, few farmers buy their chemical inputs on credit from the shops. Only 8% of farmers bought fertilizer on credit from the input shops; this is a much lower share than conventional wisdom has it; but that credit is very skewed toward the larger farmers: only 3% of the (great majority of farmers, 75% of our sample, which was randomly chosen so as to be representative). For pesticides and herbicides, the share is even lower, just 1%; by contrast, 33% of the medium farmers (about 12% of the sample and the population) got this credit for chemical fertilizer purchase (with this figure 18% for medium farmers for pesticides and herbicides). This may be shops’ working to attract large clients. Third, most farmers buy their farm chemicals locally, at most stretching (as the medium farmers do) to the local towns. Fourth, importantly, almost all the fertilizers and other farm chemicals bought are from small private shops – with very little being bought from government sales points. As with seeds, the state has little role in chemical input provision.
103

Table 4.9. Paddy Farmers: access to chemical fertilizers and crop chemicals (insecticides/fungicides/herbicides)
Farm size strata (measured in all operational or arable land under any crop) Marginal (0,1]ha
Small (1,2]ha
Medium (>2 ha)
Total
N=245 N=41 N=39 N=325
1. Diffusion of use of chemical fertilizers, pesticides/fungicides, herbicides
a) % of HH buying chemical fertilizers for either season of 2011 98 96 99 98
b) % of HH buying chemical fertilizers for either season of 2007 98 96 99 98
c) % of HH buying pesticides/fungicides for either season of 2011 93 95 94 93
d) % of HH buying pesticides/fungicides for either season of 2007 93 95 94 93
e) % of HH buying herbicides for either season of 2011 98 99 99 99
f) % of HH buying herbicides for either season of 2007 98 99 99 99
2. Expenditure (as proxy for Market size) for fertilizers in 2011
a1) mean expenditure (over ALL HH, whether used fertilizer or not) for the year (sum over all seasons farmed) per HH in 2011 in USD
238.2 766.3 3350.6 678.3
a2) mean expenditure (over area, sum over all seasons farmed) in 2011 USD/ha 342 342.2 315.2 325.6
b) mean volume in kg 604.3 1845.1 9170.8 1788.8
c) mean price paid (USD/kg), of a/b 0.394 0.415 0.365 0.379
Mean satisfaction with chemical fertilizers bought (share of farmers declaring) (%)
a) % of HH saying high satisfaction 65 63 61 64
b) % of HH saying average satisfaction 35 37 38 36
c) % of HH saying low satisfaction 0 0 1 0
% of HH pay in cash on the spot of the transaction (share of farmers declaring) 97 83 67 91
% of HH pay with delay (on credit) (share of farmers declaring) 3 17 33 8
3. Characteristics of the chemical fertilizer vendors (average over HHs buying)
104

Mean distance to the chemical fertilizer seller in km 3 4.5 5 3.5
The location of the chemical fertilizer seller (share of farmers declaring) (%)
a) % of the seller in this village 38 34 31 37
b) % of the seller in other villages of this town 47 44 31 45
c) % of the seller in other towns & in county 14 22 37 19
The vendor of the chemical fertilizer is (share of farmers declaring) (%)
a) Other farmers 2 2 3 2
b) private agriculture input shops 87 88 79 86
c) State/government input shops 2 2 9 3
d) Farmer specialized cooperatives 0 0 0 0
e) Village extension agents 3 1 4 3
f) Rice mills 0 0 0 0
g) Seed shops 6 7 5 6
h) other 0 0 0 0
The main reason of choosing this chemical fertilizer seller (share of HH declaring) (%)
a) Habit, have known the seller for a long time 3 5 8 4
b) Short distance from the seller 51 38 31 46
c) Price is lower compared to others 4 3 0 3
d) Quality is assured 39 42 50 41
e) Can pay later 1 7 8 3
f) Without other options 3 4 2 3
4. Expenditure on crop chemicals
Mean expenditure (in USD) on pesticide/fungicides in 2011 (over ALL HH, whether used or not) 79.1 272.9 1315.3 251.9
Mean expenditure (in USD) on herbicide in 2011 (over ALL HH, whether used or not) 13.1 38.8 134.2 30.9
105

mean expenditure on pesticide/fungicides in 2011 (USD/ha, sum over seasons farmed) 113.6 121.8 123.7 120.9
mean expenditure on herbicides in 2011 (USD/ha, sum over seasons farmed) 18.8 17.3 12.6 14.8
Satisfaction with crop chemicals bought (share of farmers declaring)
a) % of HH with high satisfaction 63 64 76 65
b) with medium satisfaction 36 36 24 35
c) with low satisfaction 1 0 1 1
% of the HH pay in cash at the spot of the transaction (share of farmers declaring) 99 92 82 96
% of the HH pay on credit (pay later) (share of farmers declaring) 1 8 18 4
5. Characteristics of the crop chemical vendors
Mean distance to the crop chemical seller in km (over HH) 2.76 4.13 4.5 3.19
The location of the crop chemical seller (as shares of HHs declaring) (%)
a) % of the seller in this village 40 34 37 39
b) % of the seller in other villages of this town 46 46 29 44
c) % of the seller in other towns & in county 14 20 34 17
The vendor of the crop chemicals is (as shares of HHs declaring) (%)
a) Other farmers 2 1 3 2
b) private agriculture input shops 87 88 83 87
c) State/government input shops 2 4 6 3
d) Farmer specialized cooperatives 0 0 0 0
e) Village extension agents 3 1 4 3
f) Rice mills 0 0 0 0
g) Seed exclusive shops 6 6 5 6
h) other 0 0 0 0
The main reason for choosing this crop chemical seller (as shares of HH declaring) (%)
106
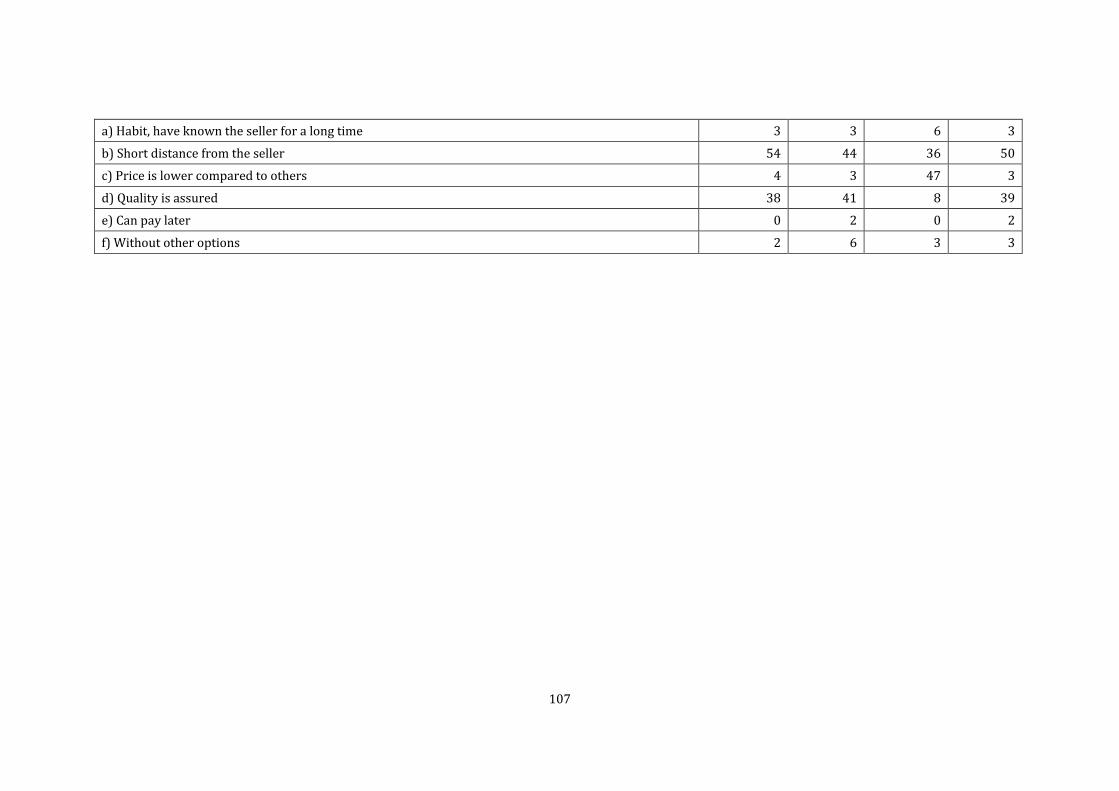
a) Habit, have known the seller for a long time 3 3 6 3
b) Short distance from the seller 54 44 36 50
c) Price is lower compared to others 4 3 47 3
d) Quality is assured 38 41 8 39
e) Can pay later 0 2 0 2
f) Without other options 2 6 3 3
107

4.2.2.5. Marketing In order to understand how the components of the conduct of the rice farm segment come together, we next discuss marketing. Table 4.10 shows output disposal. The following points are most to note. First, there has been a decline in the share in farm output of late indica over the past five years, with a concomitant rise in the share of middle indica (season). This is mainly the effect of more, larger, farmers, growing middle indica. We were told that the reason for this shift is that middle indica has a relatively long growing season, thus increasing the yield, and thus allowing growing of special varieties that require a longer growing period. Moreover, the price for middle indica is almost the same as for late indica. If it is a special variety, then the price might be even higher. Second, even for marginal farmers the marketed surplus rate is about three-quarters; the average marketed surplus rate of 88% is comparable to the rate of 95% we found in Heilongjiang in 2009; these are most small commercial enterprises. Home consumption is about 26% for marginal farmers and a mere 7% for the other strata. Table 4.10. Paddy farmers’ output and marketed surplus rates Farm size strata (measured in all operational or arable land under any crop)
Marginal (0,1]ha
Small (1,2]ha
Medium (>2ha)
Total
N=245 N=41 N=39 N=325
2011 2007 2011 2007 2011 2007 2011 2007
1. Production ( tons/farm, over seasons) of those who grow rice
4.6 4.3 15.5 11.7 83.8 43.2 15.5 9.8
% of early indica in total production 41 41 43 41 24 28 30 34
% of middle indica in total production 12 11 18 15 48 34 36 23
% of late indica in total production 46 48 39 45 28 38 34 42
3. Marketed surplus rate (sales/output) of indica in 2011 (%) 73 93 93 88
Marketed surplus rate early indica 2011 (%) 81 110 97 94
Marketed surplus rate of middle indica in 2011 (%) 70 83 94 91
Marketed surplus rate of late indica 67 79 87 80
108

in 2011 (%)
4. seed retention rate (retain/output) of indica in 2011 (%) 0.3 0.3 0.1 0.2
5. inferred home-consumption/output rate of indica in 2011 (%) (100-marketed surplus rate - seed retention rate) 26 7 7 12
Table 4.11 shows the first-buyers (the immediate buyer of the paddy) from the farmers. The following points are to note. First, it is striking how high the share of the local broker (village trader) is and how low the mill (as first buyer) is for early indica, compared with our findings for Heilongjiang (Reardon et al. 2012a), where direct sales to mill far dominated. The village trader as buyer is the more traditional system. Second, for early indica, while the overall share of sales going to government is low (10%), it is striking how skewed the sales are toward the larger farmers: with the share of farmers’ sales going to government (directly) jumping from 4% to 20% to 23% over the strata. That is, 75% of the farmers (the marginal) just sell 4% of their (sold) crop to the government buyers. Several possible reasons for this, based on what key informants (farmers) told us in the field, is that government and mills pay farmers with delays, while village traders pay in cash on the spot, and get the paddy from the farmgate. That plays well with marginal farmers. Also, it appears that quality standards laid out by the government are stricter than in the village trader segment, as the state requires very dry paddy (and will dry it for the farmer but for a fee), and very clean paddy. Third, it is interesting that for middle/late indica, the marginal and small farmers maintain the (buyers) patterns of sales (that they had in early indica season). By contrast, the medium farmers shift from selling to village traders and government in the early season, to selling more direct to mills in the, traders from other zones, and even some to seed companies, in addition to still selling to the government, in the middle season. However, in the middle/late seasons it is again only the medium farmers who are diversifying from local brokers. It is important to note that our key informant interviews with mills and government before the survey featured both of these actors telling us that many farmers sell on contract to mills and deliver direct, like contract farming. We found zero presence of this arrangement in the actual survey of the farmers. This
109

illustrates the importance of doing farm surveys and not relying only on key informant interviews.
Table 4.11. Paddy Farmers’ Sales: Types of Buyers; shares of farmers and shares of sales (%)
Farm size strata (measured in all operational or arable land under any crop)
Marginal (0,1]ha
Small (1,2]ha
Medium (>2 ha) Total
N=245 N=41 N=39 N=325
1. Farmers selling to following clients (shares of farmers selling to the following; do not have to sum to 100%
1.1. in early indica 2011
a) Local broker 61 66 62 62
b) Broker from other place 3 2 5 3
c) Miller 1 2 3 1
d) Government buyer 4 20 23 8
e) Cooperative 0 0 0 0
f) Seed company 0 2 0 0
g) Other 0 0 0 0
1.2. in middle/late indica 2011
a) Local broker 74 78 67 74
b) Broker from other place 4 2 13 5
c) Miller 1 2 10 2
d) Government buyer 5 15 21 8
e) Cooperative 0 0 0 0
f) Seed company 0 2 3 1
g) Other 0 0 5 1
2. Farmers selling to following clients (shares of total sales): sum to 100%
2.1. in early indica 2011 N=(182, 38, 43, 263))
a) Local broker 91 76 67 85
b) Broker from other place 3 0 7 3
c) Miller 1 3 2 2
d) Government buyer 5 18 23 10
e) Cooperative 0 0 0 0
f) Seed company 0 3 0 0
g) Other 0 0 0 0
2.2. in middle/late indica 2011 N=(274, 57, 79, 410)
a) Local broker 89 84 56 82
b) Broker from other place 4 0 9 5
110

c) Miller 1 2 11 3
d) Government buyer 5 12 16 8
e) Cooperative 0 0 0 0
f) Seed company 0 2 1 0
g) Other 1 0 6 2
Table 4.12 shows sales of paddy by destination location. For all seasons, marginal farms sell nearly 90% at the farmgate or in the field, while for small farms it is around 75% and for medium, around 60%. This averages to roughly 80%. The other 20% is mainly at the town and county levels for the medium and small farmers, and mainly the village and town for the marginal farmers. Very little is sold at the mill (even for medium farmers, whom we had expected would sell directly).
111

Table 4.12. Paddy Farmers’ Sales: Immediate Destinations (%)
Farm size strata (measured in all operational or arable land under any crop)
Marginal (0,1]ha
Small (1,2]ha
Medium (>2 ha) Total
N=245 N=41 N=39 N=325
1. Farmers selling to following clients (shares of farmers selling to the following; do not have to sum to 100%
1.1. in early indica 2011
Own field 2 2 8 3
Village purchasing site 4 5 8 4
Town purchasing site 3 5 13 5
County purchasing site 0 10 8 2
Mill 1 0 3 1
Farmgate 57 63 49 57
Others 0 0 5 1
1.2. in middle/late indica 2011
Own field 3 2 13 4
Village purchasing site 4 7 5 5
Town purchasing site 4 5 15 5
County purchasing site 0 5 8 2
Mill 1 0 5 1
Farmgate 71 73 59 70
Others 0 0 8 1
2. Farmers selling to following clients (shares of total sales): sum to 100%
2.1. in early indica 2011 N=(182, 38, 43, 263)
112

Own field 3 5 9 5
Village purchasing site 7 5 7 6
Town purchasing site 5 8 16 8
County purchasing site 0 11 7 3
Mill 1 0 2 1
Farmgate 84 71 49 76
Others 0 0 9 2
2.2. in middle/late indica 2011 N=(274, 57, 79, 410)
Own field 4 5 9 5
Village purchasing site 7 9 6 7
Town purchasing site 4 5 13 6
County purchasing site 0 4 8 2
Mill 1 0 3 1
Farmgate 84 77 54 77
Others 0 0 8 1
113

Table 4.13 shows sales crossing buyer type with destination location of the sale to first buyer. As expected, the local broker or village trader buys the great majority at the farmgate. Less expected is that the broker from outside the county also mainly buys at the farmgate, competing for product; this is probably why there is not an active paddy wholesale market in the district city. By contrast, the government purchase takes place in the village or town or county; that is one reason it is more of a target buyer for the medium farmers. Note that none of the rice is sold to coops. Table 4.13. Crossing buyer type with where they bought
Types of buyers Own field
Village purchasing
site
Town purchasing
site
County purchasing
site
Mill Farmgate Others Total
a) Local broker 4.5 4.2 1.5 0.2 0.2 71.9 0.6 82.9
b) Broker from other place
0.5 0 0.2 0 0 3 0.5 4
c) Miller 0 0.5 0.3 0.3 1 0 0.5 2.5
d) Government buyer
0 2.2 4.8 1.8 0 0.3 0 9.1
e) Cooperative 0 0 0 0 0 0 0 0
f) Seed company
0 0 0 0 0 0.5 0 0.5
g) Other 0 0 0 0 0 1 0 1
Total 4.9 6.8 6.7 2.2 1.2 76.7 1.5 100
4.2.2.6. Rice Farmers’ Accessing Value Chain Credit Our discussion of the conduct of the rice farm segment concludes with a description of rice farmers’ accessing value chain credit, which helps us to better understand how the practices explored above, are enabled. Table 4.14 has interesting and surprising findings about value chain finance. Contrary to an image that is common in Asia that farmers get advances from traders, and in common with our iconoclastic findings in Heilongjiang as well as in India and Bangladesh (Reardon et al. 2012a), there are no advances paid by the rice traders to the paddy farmers in Shangrao. Rather, the traders pay farmers with a delay and thus de facto derive credit from the farmers, not the other way around. This is so even in the case of brokers buying from the farmgate.
114

Table 4.14. Paddy farmers receipt of credit from and to buyers, in % of farmers in 2011
Farm size strata (measured in all operational or arable land under any crop)
Marginal (0,1]ha
Small (1,2]ha
Medium (>2 ha) Total
N=245 N=41 N=39 N=325
Paid by buyer in cash 100 100 100 100
Advance received from buyer 0 0 4 1
Paid by buyer with delay (de facto credit to buyer from farmer) 11 16 27 15
mean days delayed of those who were paid by buyer with delay (days) 5 7 15 9
Paid by buyer immediately in cash 89 84 73 85
4.2.3. Performance of the Rice Farm Segment
Having discussed the structure and the conduct of the rice farm segment, we now move on to a description of the performance of the rice farm segment covering farm productivity, quality differentiation and evolution among rice farmers and price rice farmers received. 4.2.3.1. Farm Productivity Our exploration of the performance of the rice farm segment will begin with an analysis of farm productivity. Tables 4.15.a. and b. show yields in 2011 and 2007. Several points emerge. First, there is no clear story of changes in yields over the 5 years. Note that middle indica yields higher than other indica in the other seasons. The average indica yield here is 7 tons/ha, about the same as we found in Heilongjiang for japonica in 2009 (Reardon et al. 2012), and the yield all-China from SSB for 2010, at 6.6 tons/ha. Second, despite a common image that yields are inversely correlated with farm size, we find here that the larger farm strata have higher yields.
115

Table 4.15.a. Paddy Farm Productivity in 2011: land-yields in each season, tons/hectare Farm size strata (measured in all operational or arable land under any crop)
Marginal (0,1]ha N=245
Small (1,2]ha N=41 Medium (>2ha) N=39
Total N=325
2011 t1 2011 t2 2011 t3 2011
Yields of 2011
Early indica 6.2 6.4 * 6.8 *** 6.3
a) Hybrid early indica 6 * 6.3 6.6 ** 6.1
b) Traditional early indica 6.5 6.7 6.9 * 6.6
Middle indica 7.1 7.3 ** 8.1 *** 7.3
a) Hybrid middle indica 7.2 7.5 8.1 *** 7.4
b) Traditional middle indica 6.9 6.2 8.3 6.9
Late indica 6.8 6.8 ** 7.4 ** 6.9
a) Hybrid late indica 6.7 6.7 * 7.3 *** 6.8
b) Traditional late indica 7.1 7.1 7.8 7.1
Note: t1 means t test of means between marginal and small; t2 means t test of means between small and medium; t3 means t test of means between medium and marginal; * p<0.1, ** p<0.05, *** p<0.01
Table 4.15.b. Paddy Farm Productivity of 2007: land-yields in each season, tons/hectare Farm size strata (measured in all operational or arable land under any crop)
Marginal (0,1]ha N=245
Small (1,2]ha N=41
Medium (>2ha) N=39
Total N=325
2007 t1 2007 t2 2007 t3 2007
Yields of 2007
Early indica 6 6 * 6.5 ** 6.1
a) Hybrid early indica 5.9 6 * 6.1 ** 6
b) Traditional early indica 6.1 6.1 * 6.8 ** 6.3
Middle indica 6.8 7.1 7.8 ** 7
a) Hybrid middle indica 6.9 7 7.7 ** 7
b) Traditional middle indica 6.6 7.5 8.3 6.9
Late indica 6.6 6.4 *** 7.6 *** 6.7
a) Hybrid late indica 6.5 6.3 *** 7.4 *** 6.6
b) Traditional late indica 6.7 6.8 *** 8.3 *** 6.9
Note: t1 means t test of means between marginal and small; t2 means t test of means between small and medium; t3 means t test of means between medium and marginal; * p<0.1, ** p<0.05, *** p<0.01
116

4.2.3.2. Quality Differentiation and Evolution among Rice Farmers Having covered farm productivity, we will now turn to quality differentiation and evolution among rice farmers in our focus on the performance of the rice farm segment. Table 4.16 shows shift of quality from common to fine indica by the strata over the five years. The general finding is that there was a modest shift toward fine, with the shift strongly correlated with farm size.
Table 4.16. Farmers and paddy quality Farm size strata (measured in all operational or arable land under any crop)
Marginal (0,1]ha N=245
Small (1,2]ha N=41
Medium (>2ha) N=39
Total N=325
2011 2007 2011 2007 2011 2007 2011 2007
1. Early indica (% of output of all three seasons averaged over volumes) 41 41 43 41 24 28 30 34
a) Common early indica (% of output of early indica averaged over volumes) 60 62 54 51 74 84 66 69
b) Fine early indica (% of output of early indica averaged over volumes) 40 38 46 49 26 16 34 31
2. Middle indica (% of output of all three seasons averaged over volumes) 12 11 18 15 48 34 36 23
a) Common middle indica (% of output of middle and late indica averaged over volumes) 34 33 24 18 3 10 7 14
b) Fine middle indica (% of output of middle and late indica averaged over volumes) 66 67 76 82 97 90 93 86
3. Late indica (% of output of all three seasons averaged over volumes) 46 48 39 45 28 38 34 42
a) late indica (% of output of middle and late indica averaged over volumes) 31 31 32 42 33 29 32 31
b) late indica (% of output 69 69 68 58 67 71 68 69
117

of middle and late indica averaged over volumes)
4.2.3.3. Price Rice Farmers Received Our assessment of the performance of the rice farm segment will close with a discussion of the price rice farmers received. Table 4.17. Paddy Farmers and Prices (USD/ton) Farm size strata (measured in all operational or arable land under any crop)
Marginal (0,1]ha
Small (1,2]ha
Medium (>2 ha) Total
N=245 t1 N=41 t2 N=39 t3 N=325
Early indica 338 *** 355.9 338.9 ** 340.7
a) Fine early indica 344 ** 365.7 344.2 347.9
b) Common early indica 333.7 346 336.2 * 335.7
Middle indica 380.5 376.3 382.5 380.4
a) Fine middle indica 383.4 379.5 382.9 382.6
b) Common middle indica 374.2 366.5 380.2 373.9
Late indica 387.6 391.2 389.1 ** 388.3
a) Fine late indica 389.8 392.5 385.6 389.4
b) Common late indica 383.6 387.6 400.6 *** 386
Note: t1 means t test of means between marginal and small; t2 means t test of means between small and medium; t3 means t test of means between medium and marginal; * p<0.1, ** p<0.05, *** p<0.01.
Table 4.17 is fascinating. It shows that fine paddy receives only a very small premium over common grade for the farmer: just 5% in the early season, 3% in the middle, and 1% in the late season. These findings are like those of Minten et al. (2012) for Bangladesh, showing that farmers capture barely or not at all the quality differentiation of rice (which is captured more downstream in the Bangladesh case). Moreover, also contrary to expectation, the smaller farmers do not get a lower price for their paddy than the larger farmers, controlling for quality. Finally, early indica fetches a lower price than middle and late indica. This goes along with our information from key informant interviews that the taste-quality of indica is considered low in the short and cooler early season, and better in the later seasons.
4.3. Midstream—Transformation of the Rice Mill Segment
118

In the first midstream section, we present findings from the mill survey with respect to the structure, conduct, and performance of rice mills in Jiangxi and Zhejiang.
4.3.1. Structure of the Rice Mill Segment of the Value Chain
Our discussion of the structure of the rice mill segment of the value chain, we will cover the characteristics of rice mills, and capacity utilization and seasonality in rice mills. 4.3.1.1. Characteristics of Rice Mills Our exploration of the structure of the rice mill segment of the value chain will begin with the characteristics of rice mills. Tables 4.18.a. and 4.18.b show mill characteristics among mills in Jiangxi and Zhejiang, arranged by capacity strata. Note (not in the table) that there is strong heterogeneity of mill size, measured in tons: (1) for rural mills, small, medium, and large, 2530, 16,016, and 98,075 tons; (2) for urban mills, from small to medium, 4231 and 26,199 tons. The owners are mainly middle aged males with adequate schooling. The larger millers tend to be members of the local grain association. The latter is an association organized by millers and wholesalers, to provide members with information about food policy changes, price changes, and government reserve auctions by the local Grain Bureau.
119

Table 4.18.a. Rice Mills Segment Structure/Characteristics of Jiangxi Province in 2011; all figures are simple averages unless stated Scale Small (Yearly
Rice Capacity<=10000
tons) N=10
Medium (10000 tons<Yearly Rice
Capacity<=40000 tons) N=22
Large (Yearly Rice Capacity >40000
tons) N=6 All N=38
1. Demography of mills owner
Mean age of miller (years) 50.8 43.5 45.0 45.7
Gender of miller (% male) 100 91 100 95
2. Human Capital
Mean years of school the miller has 7.1 8.9 12.5 9.0
3. Social/Organizational Capital
% of miller who are members of the local association for rice or grain
30 50 67 47
Among his/her relatives, number of people do rice milling business
0.4 1.0 0.2 0.7
Among his/her relatives, number of people do rice trading business
0.0 0.5 0.0 0.3
Among his/her relatives, number of traders 0.3 0.1 0.0 0.1
120

Table 4.18.b. Rice Mills Segment Structure/Characteristics of Zhejiang Province (Urban mills) in 2011 Scale Small N=2 Medium N=17 All N=19
1. Demography of mills owner
Mean age of millers (years) 44.5 49.6 49.1
Gender of millers (% male) 100 88 89
2. Human Capital
Mean years of school the miller has 8.5 11.7 11.3
3. Social/Organizational Capital
% of millers who are members of the local association for rice or grain 100 94 94
Among his/her relatives, number of people do rice milling business 1.5 0.2 0.4
Among his/her relatives, number of people do rice trading business 0.0 0.4 0.4
Among his/her relatives, number of traders 0.0 0.3 0.2
121

Tables 4.19.a. and 4.19.b show further mill characteristics among mills in Jiangxi and Zhejiang. The mills were started about a decade ago. Nearly all of the larger mills and a majority of the smaller mills are registered (formal sector). The larger mills in rural and half the larger in urban tend to be “dragon head” companies (government designated “lead firms”, who can receive loan interest subsidies or preferential interest rates from local government banks designated specifically for agricultural loans (zhence xing yinhang)), but the small and medium tend not to be. All the small and medium and the great majority of large mills are private sector, not government owned. Interestingly, about half the rural mills built their own mills from scratch, and half rented factories and installed equipment; none bought an existing state mill. In urban areas, a few medium mills bought state mills, while all the small and half the medium rented. Only a few medium mills built their own mills. The small rural mills cost only 15,000 USD, the medium, 100,000 (in rural and urban), and the large mills, 2 million dollars. All are large investments for any entrepreneur (whether farmer or businessperson), while the investment for the medium and large mills are far above an investment of a normal small business or farm, , and are in the realm of major business-sector investments. Yet most of the mills of any scale were bought with own funds. However, the small and medium mills were mainly rented at startup, and then gradually acquired, while the larger mills tended to be built by the current owners.
122
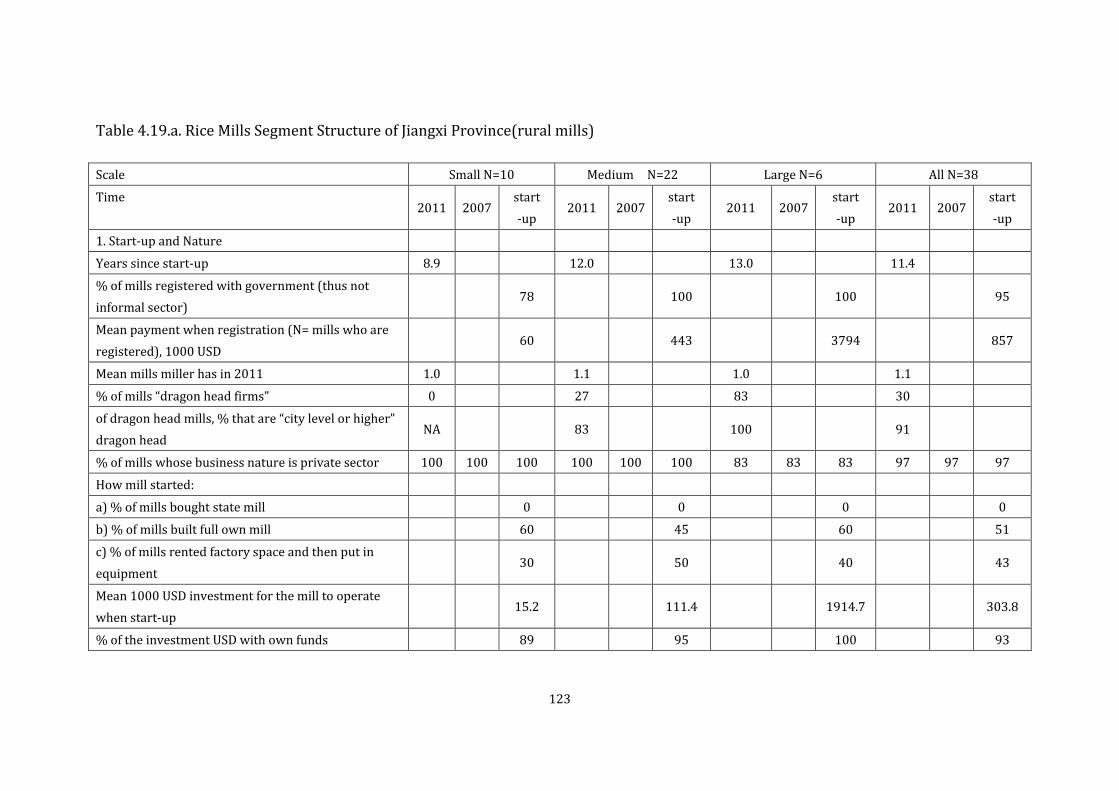
Table 4.19.a. Rice Mills Segment Structure of Jiangxi Province(rural mills)
Scale Small N=10 Medium N=22 Large N=6 All N=38
Time 2011 2007
start -up
2011 2007 start -up
2011 2007 start -up
2011 2007 start -up
1. Start-up and Nature
Years since start-up 8.9 12.0 13.0 11.4
% of mills registered with government (thus not informal sector)
78 100 100 95
Mean payment when registration (N= mills who are registered), 1000 USD
60 443 3794 857
Mean mills miller has in 2011 1.0 1.1 1.0 1.1
% of mills “dragon head firms” 0 27 83 30
of dragon head mills, % that are “city level or higher” dragon head
NA 83 100 91
% of mills whose business nature is private sector 100 100 100 100 100 100 83 83 83 97 97 97
How mill started:
a) % of mills bought state mill 0 0 0 0
b) % of mills built full own mill 60 45 60 51
c) % of mills rented factory space and then put in equipment
30 50 40 43
Mean 1000 USD investment for the mill to operate when start-up
15.2 111.4 1914.7 303.8
% of the investment USD with own funds 89 95 100 93
123
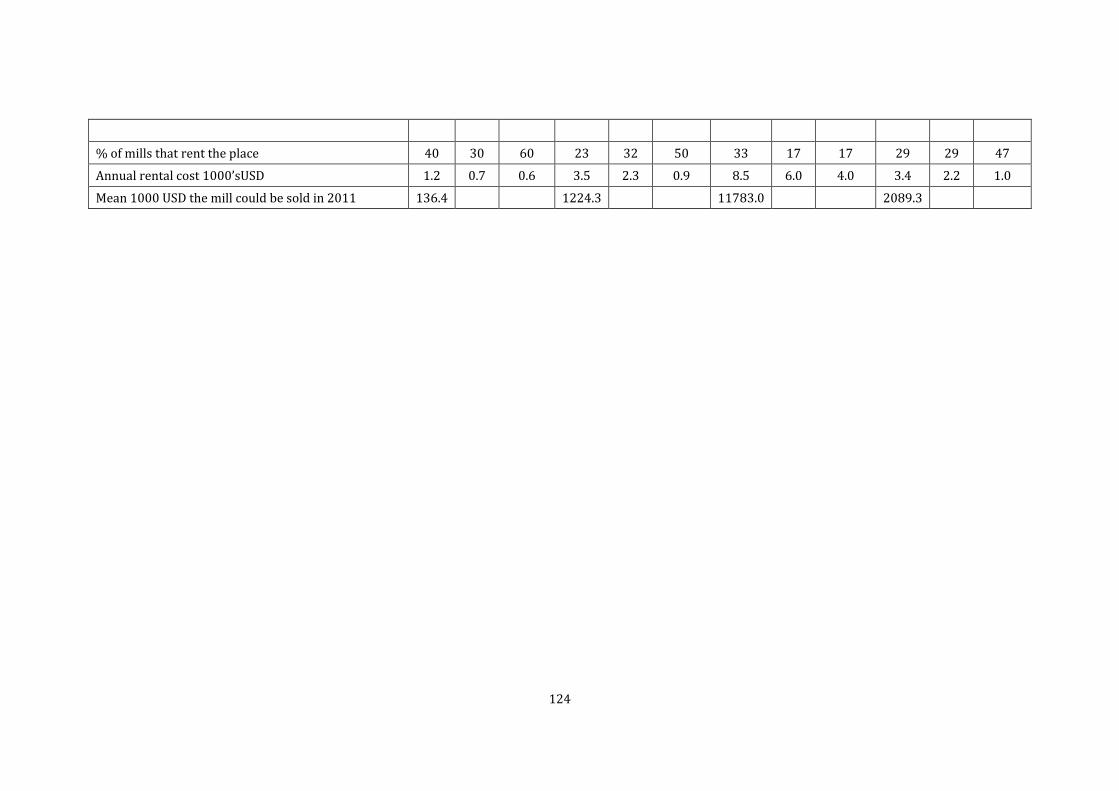
% of mills that rent the place 40 30 60 23 32 50 33 17 17 29 29 47
Annual rental cost 1000’sUSD 1.2 0.7 0.6 3.5 2.3 0.9 8.5 6.0 4.0 3.4 2.2 1.0
Mean 1000 USD the mill could be sold in 2011 136.4 1224.3 11783.0 2089.3
124

Table 4.19.b. Rice Mills Segment Structure of Zhejiang Province (urban mills) Scale Small N=2 Medium N=17 All N=19
Time 2011 2007 start -up 2011 2007 start -up 2011 2007 start -up
1. Start-up and Nature
Years since start-up 8 11.7 11.7
% of mills registered with government 50 88 84
Mean payment for registration (of mills who are registered), 1000 USD 77.5 210.5 202.2
Mean mills miller has in 2011 1 1 1
% of mills “dragon head firms” 0 47 42
of dragon head mills, % that are “city level or higher” NA 38 38
% of mills whose business nature is private sector 100 100 100 88 87 82 89 88 84
How mill started:
a) % of mills bought state mill 0 19 17
b) % of mills built full own mill 0 25 22
c) % of mills rented factory space and then put in equipment 100 44 50
Mean 1000 USD investment for the mill to operate when start-up 46.5 102.4 99.1
% of investment with own funds 100 69 71
% of mills that rent the place 50 50 50 71 59 71 68 58 68
Mean annual rental 1000 USD 4.6 4.7 1.9 10.5 5.5 6.4 10.1 5.4 6.1
Mean 1000 USD the mill could be sold in 2011 46.5 1450.3 1333.3
125

Tables 4.20.a and 4.20b show rural and urban mill working capital, working area, and capacity change, as well as subsidies received over strata. The general finding for all the mills is a substantial increase in capacity, in work area, working capital, and in warehouse area. This tracks with secondary data on mill capacity growth in the provinces. In some cases, the growth in the capacity of the larger mills is quite striking; some mill owners explained that they had moved into industrial parks and had substantially larger facilities there. A portion of the larger mills also enjoyed machinery subsidies and some loan interest subsidies from the government; the smaller mills did not get these. This could be a factor in mill sector consolidation. Mills of all strata relied only about 40% on bank loans for working capital; most of it is self-financed. Finally, like in Beijing, some (about a quarter to third) of big mills in Jiangxi and Zhejiang have their own stall in the wholesale markets, an important act of disintermediation and vertical integration. The working capital is high (especially higher in 2011) because for rural mills, some of the big strata mills relocated at low rental cost into an industrial park (built on the border of the county, organized by the county officials to attract investment to the county) and the mills then expanded to be much larger, and bought a much more modern set of machines.
126

Table 4.20.a. Rice Mills Segment Structure of Jiangxi Province (rural mills) Scale Small N=10 Medium N=22 Large N=6 All N=38
Time 2011 2007
start -up
2011 2007 start -up 2011 2007 start -up 2011 2007 start -up
1. Capital (physical and financial)
Mean working capital in 1000 USD (month)
120.5 68.7 18.9 573.1 602 165.6 954 403.1 197.7 550.5 441.2 131.2
Mean % of the working capital borrowed
26 51 30 45 18 41 33 0 0 39 18 36
Mean area of milling building (square meters)
165 174.4 75.5 539 481.8 342.9 1024 500 400 610.8 393.2 295.6
Area of the warehouse building (square meters)
307.2 293.1 157.2 1876.9 1693.3 1059 5853 5012.3 4562.5 1812.2 1307.1 1024.3
Quantity paddy can be stored (1000 tons)
0.5 0.5 0.2 2.5 2.3 2.7 5.6 5 3.8 4.4 3.2 2.4
Capacity (tons/day) 22.7 22.2 14.9 65.7 60.8 41.2 189.9 120 94 74 53.7 39.7
% mills have website 2011
0 14 67 19
Mean tax paid in 2011, N= all mills, 1000 USD
3 10.9 31.6 12.1
% mills got subsidy from government
0 24 50 22
127
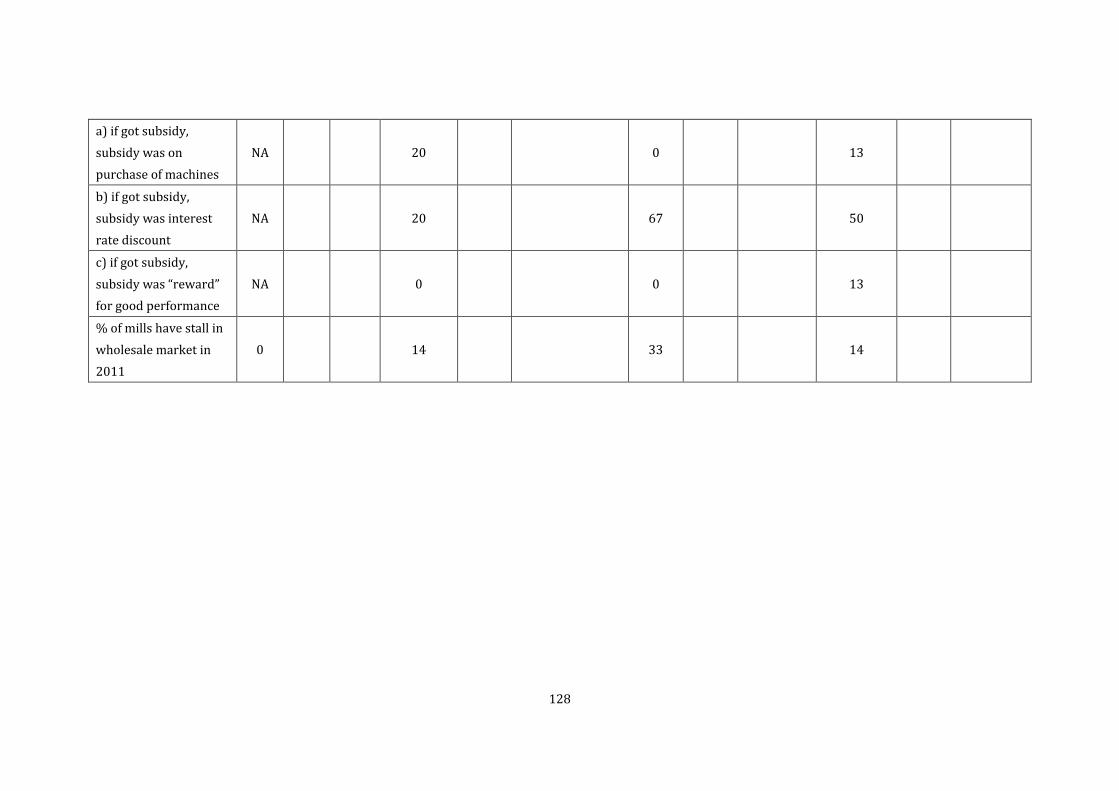
a) if got subsidy, subsidy was on purchase of machines
NA 20 0 13
b) if got subsidy, subsidy was interest rate discount
NA 20 67 50
c) if got subsidy, subsidy was “reward” for good performance
NA 0 0 13
% of mills have stall in wholesale market in 2011
0 14 33 14
128

Table 4.20.b. Rice Mills Segment Structure of Zhejiang Province (Urban mills) Scale Small N=2 Medium N=17 All N=19
Time 2011 2007 start -up 2011 2007 start -up 2011 2007 start -up
2. Capital (physical and financial) Scale and Capacity
Mean working capital in 1000 USD (month) 263.6 155 15.5 862.5 328.6 133.5 825.1 316.2 126.2
Mean % of the working capital borrowed 29 0 0 51 45 33 50 41 31
Mean area of milling building or room (square meters) 300 300 300 407.1 367.5 332.6 395.8 359.5 329.2
Area of the warehouse building (square meters) 800 800 800 1603.8 1477.7 1222 1519.2 1397.9 1177.6
Quantitypaddy can be stored in warehouse (1000 tons) 1.8 1.5 1.2 2 2 1.4 2 2 1.5
Capacity (tons/day) 32 24 20 71.3 56.5 45.3 67.1 52.7 42.4
% of mills have website 2011 0 11.76 10.53
Mean tax paid in 2011, N= all mills, 1000 USD 0 15.7 14.7
% of mills got subsidy from government 0 47.06 42.11
a) if got subsidy, subsidy was on purchase of machines NA 25 25
b) if got subsidy, subsidy was interest rate discount NA 13 13
c) if got subsidy, subsidy was “reward” for good performance NA 25 25
% of mills have stall in wholesale market in 2011 0 24 21
129

4.3.1.2. Capacity Utilization and Seasonality in Rice Mills We will next discuss capacity utilization and seasonality in rice mills in our analysis of the structure of the rice mill segment of the value chain. Tables 4.21a and 4.21b show capacity and capacity utilization, milling rates, seasonality of use, labor intensity (per milled output), and storage. Several points emerge. First, mill capacity nearly doubled over the five years; moreover, the larger mills average some 9 times the capacity of the smaller mills. Second, utilization rates were strongly correlated with mill size, and also all dropped somewhat over the five years; larger mills in rural areas dropped from 91 to 83% utilization of capacity; middle stratum from 43 to 39, and smaller mills from 23 to 19%; this may imply that mills over-expanded in capacity. Utilization rates werehigher in urban millsaveraging 91% and 42% for medium and small mills in 2011. This higher rate in urban mills may be because urban mills have money to keep a smooth cash flow to store enough paddy for milling around the year. Third, we divided the number of permanent staff by output of rice per day by size of mill, in 2007 and 2011, to see differences in labor intensity over strata and time. The larger rural mills use 0.18 worker per rice ton milled, and maintained that over the five years; the middle mills used 0.28 and maintained it; the smallest mills moved from 0.30 to 0.44 permanent staff per ton. Hence, there is a strong negative correlation of mill size and labor intensity. Large mills are more capital intensive. Fourth, as one could expect, seasonality (in hours of use of the mill) is sharp in rural mills, changing by some 30 to 40% over seasons; this seasonality is less sharp in urban areas, presumably because of a wider range of supply sources and enough working capital to keep them going. Fifth, in urban Zhejiang but not in rural Jiangxi, most mills store their own rice and are paid for doing this storage by the Zhejiang (not the national) government, and that rice is called a government reserve. The government pays for this so that it can go buy that rice when they need it, if they need it in an emergency. Normally the stored rice is not bought by the government and the mill just sells it off normally. The scale of storage is correlated with scale of mills. Note that for small mills, on average this is a small share (around 8%) of their storage capacity; for medium mills it is about a third. Note that the fee paid by
130
government for storage is almost the same for one ton regardless of quantity stored. Finally, all mill strata sell by products; none produce second-stage processed products (such as noodles). Tables 4.22a and 4.22b show capital asset holdings of the mills in the two areas. Following are the key points. First, regarding “non-key equipment”, mainly paddy and rice cleaners (separating out the foreign matter, vibrators, dust shakers and stone sorters, roller, etc, except polisher, color sorter, and container for cooling), the larger the rural mill, the more recently it bought/updated these equipment, while the smaller mills still have the set they obtained at the starting of the mill. The outlays for this equipment are extensive. Second, the equipment inventories of the large vs small mills differed extensively, as one could expect given that the larger mills are more capital intensive. Smaller mills are more apt to have the more traditional platform scale than are the larger mills. Nearly all the mills have rubber rollers; note that the large mills have four on average, and the medium mills just have one; also note how recently the large mills acquired equipment, so they are working with newer equipment. Only a few of the mills, and only smaller ones, had the less efficient steel rollers. Also note that few smaller and medium mills have cooling containers, while most of the larger ones do, recently acquired. Surprisingly, nearly all the mills have polishers and color sorters; the small mills are not just dehusking. Again, the larger mills have three or four compared to just two among the others, and bought them more recently so are using newer equipment. While we expected few filling machines, only a third of both small and large mills had these. The urban mills patterns of key equipment holdings are similar to the rural ones for the relevant categories, small and medium mills, but with less pronounced differences in holdings between the two than in rural areas. An exception is that smaller mills have no filling machines in the urban areas. Third, note that none of the rural mills – not even the smaller ones with more need, nor the larger ones with presumably greater contacts received a subsidy for any equipment, despite the expense of these. By contrast, half the small urban mills and a third of the medium ones got equipment subsidies.
131

Table 4.21.a. Rice Mills Segment Structure of Jiangxi Province (rural mills) Scale Small N=10 Medium N=22 Large N=6 All N=38
Time 2011 2007
start –up
2011 2007 start –
up 2011 2007
start -up
2011 2007 start -up
3. Utilization
Capacity (tons/day) (restated from above) 34.9 34.2 22.9 101 93.5 63.4 292.1 184.6 144.6 113.8 82.5 61.1
Actual use of mill in tons (all paddy milled in year divided by all days used in year)
6.3 7.8 3.5 39.7 40 24.3 243.3 167.2 128.5 59.3 50.5 30.8
Implied yearly utilization rate from above two rows (%) 18 23 15 39 43 38 83 91 89 52 61 50
Peak Season
a) Mean hours of operation in peak season in 2011 per day (hour)
8.4 8.4 7.6 10.1 9.7 9.2 13.6 12 15.5 10.2 9.4 9.6
b) mean in tons of paddy milled per hour in peak season in 2011(ton)
5.3 5.3 2.5 37.2 21.4 3.6 11 NA 11 26.3 16 3.6
Slack Time
a) Mean hours of operation in low season in 2011 per day (hour)
5.4 5.1 5.6 7.5 7.3 6.5 9.5 10 9.3 7.1 6.7 6.5
b) mean in tons of paddy milled per hour in low season in 2011 (ton)
5.3 5.3 2.5 37.2 21.4 3.6 11 NA 11 26.3 16 3.6
% of mills operate during day in 2011 (electricity price lower at night)
100 100 100 100
4. Milling rate (%, rice/paddy)
a) early indica: 62 63 64 61 61 63 58 62 62 61 62 63
b) middle indica: 63 64 66 62 62 64 58 60 62 62 62 64
132

c) late indica: 64 65 67 61 61 63 57 60 58 61 62 64
d) japonica: 60 60 60 NA NA NA NA NA NA 60 60 60
5. Labor Stock
Mean number of permanent workers 2.8 2.3 1.6 11.1 10.8 8 42.8 30 16.8 14.1 8.8 7.1
Mean number of family workers 2.2 1.4 1.8 3.4 2.7 1.5 5.3 0 3 3.3 2.2 1.7
Mean number of temporary workers 1.7 1.7 1.8 2.1 2.2 2 1.5 3 1.3 1.9 2.1 1.9
% of mills have employeein wholesale markets in 2011 0 NA NA 5 NA NA 60 NA NA 13 NA NA
6. Mill practices aside from buy/sell
% of mills store rice for government reserve in 2011 0 0 0 0 0 0 0 0 0 0 0 0
% of mills can de-husk + de-bran 20 33 60 0 0 14 0 0 0 5 9 25
% of mills can de-husk+ de-bran + polish 80 67 40 100 100 86 100 100 100 95 91 75
% of mills that do sell bran 90 89 89 100 100 100 100 100 100 97 97 97
% of mills that do sell husk 90 78 56 100 100 85 100 100 100 97 94 79
% of mills have other final rice products (like noodles) in 2011
10 5 0 5
% of mills non-rice based products 2011 0 0 0 0
133

Table 4.21.b. Rice Mills Segment Structure of Zhejiang Province (Urban mills) Scale Small N=2 Medium N=17 All N=19
Time 2011 2007
start –up
2011 2007 start -up 2011 2007 start –up
1. Utilization
Capacity (tons/day) (restated from above) 32 24 20 71.3 56.5 45.3 67.1 52.7 42.4
Actual use of mill in tons (all paddy milled in year divided by all days used in year)
13.4 11.5 3.1 64.7 40.6 25.5 59.3 38.8 24.1
Implied yearly utilization rate from above two rows (%) 42 48 15 91 72 56 88 74 57
Peak Season
a) Mean hours of operation per day in peak season in 2011 (hour)
8 9.7 9.6
b) mean in tons of paddy milled per hour in peak season in 2011 (ton)
2.1 4.1 4
Slack Time
a) Mean hours of operation per day in low season in 2011 (hour)
7.9 9.4 9.3
b) mean in tons of paddy milled per hour in low season in 2011 (ton)
2.1 4.1 4
% mills operate during day in 2011 100 63 67
2. Milling rate (rice/paddy)
a) early indica: 65 65 67 66 66 67 66 66 67
b) middle indica: 66 66 68 60 60 62 60 60 62
c) late indica: 65 64 68 61 61 67 62 61 67
134

d) japonica: NA NA NA 38 37 68 38 37 68
3. Labor Stock
Mean permanent workers 7 10 2 24.1 17 1.8 22.2 16.6 17
Mean number of family workers 2 1 0 1.9 3.7 0 1.9 2.1 0
Mean temporary workers 2 4 0 3.3 2.2 0 3.1 3.8 0
% of mills have employee in wholesale markets in 2011 0 18 15
4. Mill practices aside from buy/sell
% of mills store rice for government reserve in 2011 (store rice as service, for fee)
100 69 72
a) Among mills storing for government, tons of rice stored 2011 (ton)
150 711.9 671.7
b) Among those storing for government, mean total fee, USD, collected from government for that, by miller in 2011 (USD/ton)
31 32.4 32.3
% of mills can de-husk + de-bran 0 50 100 29 31 59 26 33 63
% of mills can de-husk+ de-bran + polishing 50 50 NA 65 69 35 63 67 32
% of mills that do sell bran 100 100 100 100 100 6 100 100 6
% of mills that do sell husk 100 100 NA 100 100 100 100 100 100
% of mills have other final rice products (like noodles) in 2011
0 0 0
% of mills have non-rice products in 2011 0 12 11
135

Table 4.22.a. Rice Mills Segment Structure of Jiangxi Province (rural mills) Scale Small N=10 Medium N=22 Large N=6 All N=38
Time 2011 2007
start -up
2011 2007 start –
up 2011 2007
start -up
2011 2007 start -up
1. Non-key equipment inventory (foreign matter sorters, vibrators, dust shaker and stone sorters)
Years ago mill buys equipment other than polishers and color sorters, roller, etc., except polisher, color sorter, and container for cooling
7.8 5.6 2 5.4
Mean 1000 USD paid for above equipment 24.2 79.5 149.6 97.8
2. Equipment inventory
% of mills had key and expensive equipment
a) % mills had platform scale 70 50 50 60 50 45 33 33 33 55 50 37
If yes, number have 1.9 1.8 1.8 2.5 2.7 2.3 3 3 1 2.4 2.5 2.1
Number of years ago bought 9.5 5.5 NA 7.1
USD paid for one piece NA NA NA NA
b) % mills had rubber roller 80 70 70 100 82 82 83 33 67 92 71 76
If yes, number have 1 1 1 1.2 1.1 1.1 4 1.5 2.5 1.6 1.1 1.3
Number of years ago bought 6.1 5.4 2 5.3
USD paid for one piece 1447 2693.8 NA 2159.5
c) % of mills had steel roller 10 0 0 0 0 0 0 0 0 3 0 0
If yes, number have 1 NA NA NA NA NA NA NA NA 1 NA NA
Number of years ago bought 1 1
USD paid for one piece NA NA
136

d) % mills had container for cooling 20 10 10 27 0 0 67 17 17 32 5 5
If yes, number have 1 1 1 8.2 NA NA 14.3 26 26 9 13.5 13.5
Number of years ago bought NA 1 7 3 5.7
USD paid for one piece NA NA NA NA
e) % of mills had polisher 70 60 10 100 77 68 83 33 67 90 66 53
If yes, number have 1.6 1.2 1 2.2 1.7 1.3 4 2.5 2.5 2.3 1.6 1.6
Number of years ago bought 3.7 4.4 1.3 3.8
1000 USD paid for one piece 37.3 57.3 38 46.6
f) % of mills had color sorter 70 20 0 100 64 27 83 33 50 89 47 24
If yes, number have 1 1 0 1.6 1.2 1.2 2.8 2 1.7 1.7 1.3 1.3
Number of years ago bought 2.9 4.2 1.7 3.6
1000 USD paid for one piece 20.9 39.6 17.7 32.2
g) % of mills had modern filling (for packing) machine 30 20 0 64 45 32 33 NA 33 50 32 24
If yes, number have 1 1 NA 1.1 1 1 4.5 NA 2 1.5 1 1.2
Number of years ago bought 3 5.4 3 4.6
USD (in 1000s) paid for one piece 2.8 4.6 NA 3.8
3. Subsidy
% of mills got subsidy of any kind in buying equipment 0 0 0 0
137

Table 4.22.b. Rice Mills Segment Structure of Zhejiang Province (Urban mills) Scale Small N=2 Medium N=17 All N=19
Time 2011 2007
start -up
2011 2007 start -up
2011 2007 start -up
1. Non-key equipment inventory (foreign matter sorters, vibrators, dust shaker and stone sorters, roller, etc., except polisher, color sorter, and container for cooling)
How many years ago did the mill buy the “non-key equipment” NA 4.4 4.4
Mean 1000 USD paid for above NA 135.5 135.5
2. Equipment inventory
% of mills had key and expensive equipment
a) % of mills had platform scale 100 100 100 88 82 82 89 84 84
If yes, number have 2 2 1.5 2.9 3.1 2.6 2.8 3 2.5
Number of years ago bought NA 6.2 6.2
USD paid for one piece NA NA NA
b) % of mills had rubber roller 100 100 100 94 76 76 95 79 79
If yes, number have 1 1 1 1.2 1.4 1.2 1.2 1.3 1.1
Number of years ago bought 2 3.9 3.6
USD paid for one piece NA NA NA
c) % of mills had steel roller 0 0 0 0 0 0 0 0 0
If yes, number have
Number of years ago bought
USD paid for one piece
d) % of mills had container for cooling 0 0 0 18 0 0 16 0 0
138
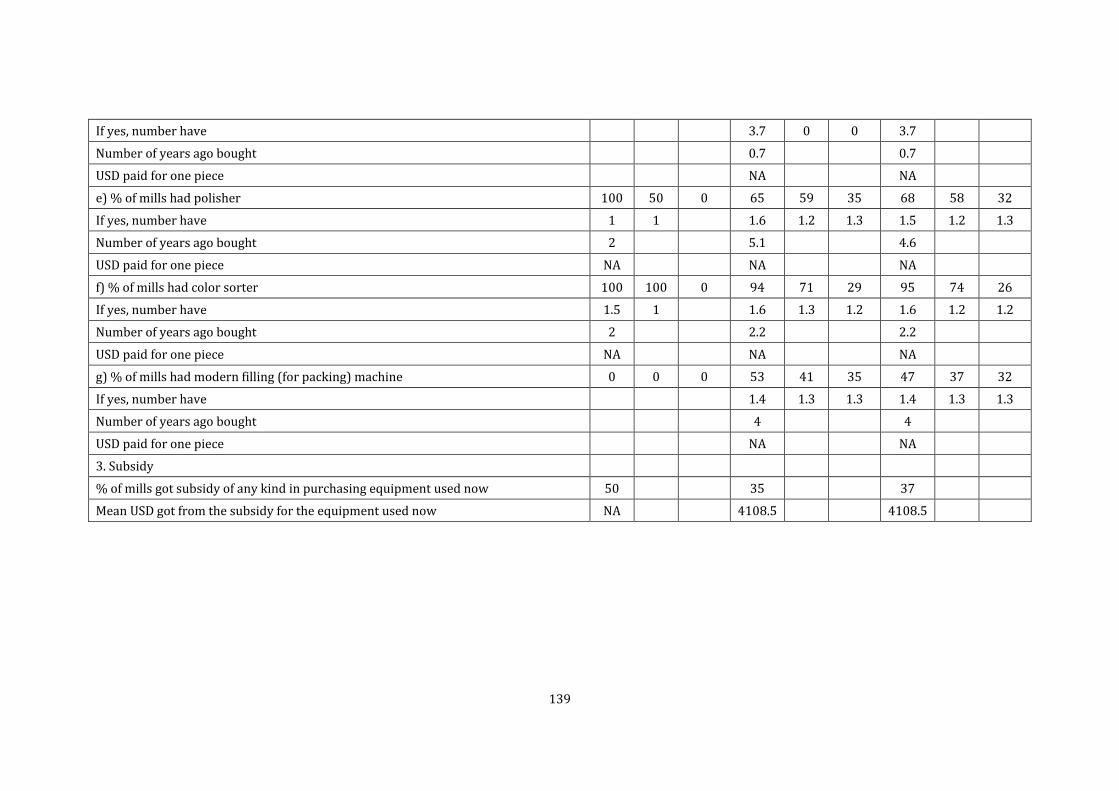
If yes, number have 3.7 0 0 3.7
Number of years ago bought 0.7 0.7
USD paid for one piece NA NA
e) % of mills had polisher 100 50 0 65 59 35 68 58 32
If yes, number have 1 1 1.6 1.2 1.3 1.5 1.2 1.3
Number of years ago bought 2 5.1 4.6
USD paid for one piece NA NA NA
f) % of mills had color sorter 100 100 0 94 71 29 95 74 26
If yes, number have 1.5 1 1.6 1.3 1.2 1.6 1.2 1.2
Number of years ago bought 2 2.2 2.2
USD paid for one piece NA NA NA
g) % of mills had modern filling (for packing) machine 0 0 0 53 41 35 47 37 32
If yes, number have 1.4 1.3 1.3 1.4 1.3 1.3
Number of years ago bought 4 4
USD paid for one piece NA NA
3. Subsidy
% of mills got subsidy of any kind in purchasing equipment used now 50 35 37
Mean USD got from the subsidy for the equipment used now NA 4108.5 4108.5
139

4.3.2. Rice Mill Segment: Procurement, Sales, Finance, and Other Services
Having covered the structure of the rice mill segment, we now move on a discussion of procurement, sales, finance, and other services. 4.3.2.1. Paddy Procurement Before going on to discuss sales, finance and other services in the rice mill segment, we first begin with a description of paddy procurement. Tables 4.23.a and 4.23.b. show practices of testing for humidity, drying, and pricing of the mills. Several points are to note. First, testing and cleaning are common, but not universal. Regarding testing the paddy before purchase, most of the rural mills and the medium urban mills use a machine to test humidity; only the small urban mills do not test before buying, but do test during storage. Around half use a machine to test the head rice rate (the yield of grain from paddy). Larger rural mills (more than smaller) again test humidity during storage and before milling, to reduce mildew and dry before milling if need be. Nearly all the rural mills and all the urban mills clean the paddy before milling. Second, the government does not have a strong or full influence on pricing or grading. It is common for rural mills to at least sometimes pay below the government’s (indicative only, meaning announced but not “enforced”) announced floor price: all of the rural large mills and 81% of the medium mills reported that they did (pay below sometimes). Nearly all the urban mills reported they sometimes pay below the government “indicative” price. Moreover, less than half the mills use the grading standards of the government for the rice.
140

Table 4.23.a. Practices in Purchasing in 2011 of Jiangxi Province (rural mills)
Scale Small N=10
Medium N=22
Large N=6
All N=38
1. Testing paddy before buy
Mean moisture level, below which that the mill will purchase the paddy NA NA NA NA
% of mills testing
a) % of mills use paddy-moisture test machine 71 90 80 81
b) % just look/feel paddy to judge humidity 29 10 20 19
% of mills use machine to test the head rice rate (the yield of grain from paddy; influences price paid) 57 45 60 50
2. After buying but before milling paddy
% of mills who test humidity during the storage period (to ensure safe/correct storage to not get mildew) 50 62 100 66
Before milling the paddy, % of mills test the moisture level of the paddy (decide whether to dry) 13 29 67 31
Before milling the paddy, % of mills take any measure to remove dirt and rocks from the paddy 75 95 80 88
3. Purchase Pricing method
% of mills reporting paying (at least sometimes) below the government’s (guidance only) floor price 43 81 100 76
% of mills report using (in their purchasing/pricing) the quality classification standards of the government (GB-1354-2009); a “no” answer means do not follow OR do not know about it
43 48 40 45
% of mills have specialized employees to supervise buying 100 91 100 94
141

Table 4.23.b. Practices in Purchasing in 2011 of Zhejiang Province (Urban mills)
Scale Small N=2
Medium N=17
All N=19
1. Testing paddy before buy (to help in pricing or to reject/accept) or before mill (as preparation and judgment on drying)
Mean moisture level, below which that the mill will purchase the paddy (the government recommends 14.5% for indica) 14.5 14.7 14.7
% of mills testing
a) % of mills use paddy-moisture test machine 0 88 78
b) % just look/feel paddy to judge humidity 100 12 22
% of mills use related machine to test the head rice rate (the yield of grain from paddy; influences price paid) 0 44 39
2. After buying but before milling paddy
% of mills who test humidity during the storage period 100 50 56
Before milling the paddy, % of mills test the moisture level of the paddy (decide whether to dry) 0 47 42
Before milling the paddy, % of mills take any measure to remove dirt and rocks from the paddy 100 100 100
3. Purchase Pricing method
% of mills reporting paying (at least sometimes) below the government’s (guidance only) floor price 100 94 94
% of mills report using (in their purchasing/pricing) the quality classification standards of the government 0 81 72
% of mills have specialized employees to supervise buying 100 100 100
142

Table 4.24.a shows procurement patterns of the rural mills. Some surprising points emerge. First, among rural mills, only small mills custom mill; however, despite our expectation, from common wisdom, that custom milling is important or dominant for the small mills, we found that only 30% of the paddy milled of small mills is for custom; all of this is from local farmers. It is possible that some years ago custom milling was more common, but now it is a minor part of the milling. This idea is corroborated in the table, showing that while 5 years ago still 30% of the small had (as in 2011) done custom milling, for medium and large mills, quite a number (14% of medium and 50% of large) had custom milled. Hence for the larger scale mills custom milling has been phased out. Second, small and medium rural mills source some direct from farmers; the incidence of this seems higher than reported in the farm survey. The medium mills report about half their purchase from farmers, while about 27% of smaller mills sourced paddy is from farmers. The rest is from traders for the small and medium mills. Surprisingly, while large mills source 56% of their paddy from local traders, they source fully 44% from government grain depots - important for the largest mills but not for the others. Table 4.24.b. shows procurement patterns of the urban mills. First, the small urban mills do not custom mill, and only 18% of the medium do. This is expected as custom milling is associated with farmers who bring their paddy directly to be milled and then home-consumed or sold locally. Second, the urban mills source little from farmers, but still it is not nothing: about 17% (but dropped from five years before) for the small mills, and 7% for the medium (but dropped from five years before). It may be that local direct sourcing is being phased out. Third, small mills have had a large shift in their sourcing from local traders (from the same county) in the past five years; it was fully 80% just five years before and then dropped to 50%; they shifted to further afield, from other counties in the same province (21%) and even traders from other provinces. Fourth, again, the larger urban mills have more diverse sources. Interestingly, they have shifted somewhat away from traders and toward government grain depots as sources: a surprising shift from 52% of their paddy to 67% in five years. Part of the latter (4%) is even from government depots in other provinces.
143
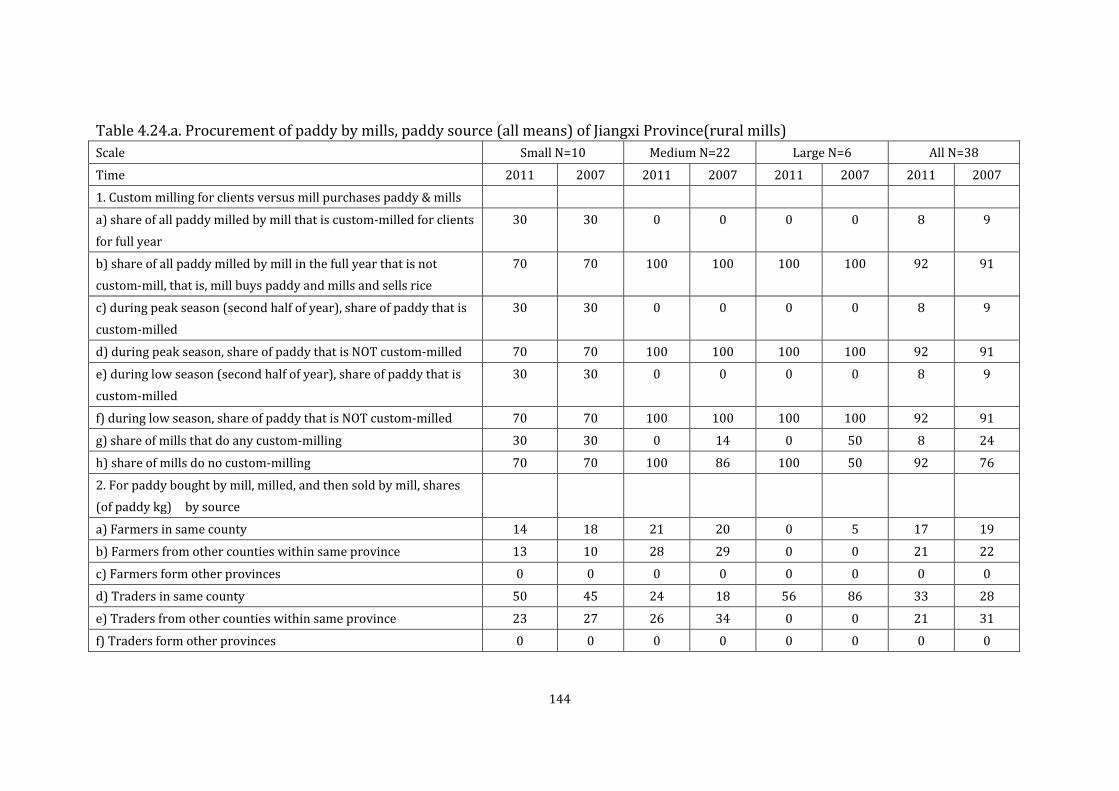
Table 4.24.a. Procurement of paddy by mills, paddy source (all means) of Jiangxi Province(rural mills) Scale Small N=10 Medium N=22 Large N=6 All N=38
Time 2011 2007 2011 2007 2011 2007 2011 2007
1. Custom milling for clients versus mill purchases paddy & mills
a) share of all paddy milled by mill that is custom-milled for clients for full year
30 30 0 0 0 0 8 9
b) share of all paddy milled by mill in the full year that is not custom-mill, that is, mill buys paddy and mills and sells rice
70 70 100 100 100 100 92 91
c) during peak season (second half of year), share of paddy that is custom-milled
30 30 0 0 0 0 8 9
d) during peak season, share of paddy that is NOT custom-milled 70 70 100 100 100 100 92 91
e) during low season (second half of year), share of paddy that is custom-milled
30 30 0 0 0 0 8 9
f) during low season, share of paddy that is NOT custom-milled 70 70 100 100 100 100 92 91
g) share of mills that do any custom-milling 30 30 0 14 0 50 8 24
h) share of mills do no custom-milling 70 70 100 86 100 50 92 76
2. For paddy bought by mill, milled, and then sold by mill, shares (of paddy kg) by source
a) Farmers in same county 14 18 21 20 0 5 17 19
b) Farmers from other counties within same province 13 10 28 29 0 0 21 22
c) Farmers form other provinces 0 0 0 0 0 0 0 0
d) Traders in same county 50 45 24 18 56 86 33 28
e) Traders from other counties within same province 23 27 26 34 0 0 21 31
f) Traders form other provinces 0 0 0 0 0 0 0 0
144

g) Government grain depot in same county 0 0 1 0 44 9 8 0
h) Government grain depot from other counties within same province
0 0 0 0 0 0 0 0
l) Government grain depot from other province 0 0 0 0 0 0 0 0
3. For paddy custom-milled by mill, shares (of paddy kg) by source
a) Farmers in same county 100 100 NA NA NA NA 100 100
b) Farmers from other counties within same province 0 0 NA NA NA NA 0 0
c) Farmers form other provinces 0 0 NA NA NA NA 0 0
d) Traders in same county 0 0 NA NA NA NA 0 0
e) Traders from other counties within same province 0 0 NA NA NA NA 0 0
f) Traders form other provinces 0 0 NA NA NA NA 0 0
g) Government grain depot in same county 0 0 NA NA NA NA 0 0
h) Government grain depot from other counties within same province
0 0 NA NA NA NA 0 0
l) Government grain depot from other province 0 0 NA NA NA NA 0 0
145

Table 4.24.b. Procurement of paddy by mills, paddy source (means) of Zhejiang Province (Urban mills) Scale
Small N=2 Medium
N=17 All N=19
Time 2011 2007 2011 2007 2011 2007
1. Custom milling for clients versus mill purchases paddy & mills
a) share of all paddy milled by mill that is custom-milled for clients for full year 0 NA 7 NA 6 NA
b) share of all paddy milled by mill in the full year that is not custom-mill, that is, mill buys paddy and mills and sells rice
100 NA 93 NA 94 NA
c) during peak season (second half of year), share of paddy that is custom-milled 0 NA 7 NA 6 NA
d) during peak season, share of paddy that is NOT custom-milled 100 NA 93 NA 94 NA
e) during low season (second half of year), share of paddy that is custom-milled 0 NA 7 NA 6 NA
f) during low season, share of paddy that is NOT custom-milled 100 NA 93 NA 94 NA
g) share of mills that do any custom-milling 0 NA 18 NA 16 NA
h) share of mills do no custom-milling 100 NA 82 NA 84 NA
2. For paddy bought by mill, milled, and then sold by mill, shares (of paddy kg) by source
a) Farmers in same county 17 20 7 9 7 9
b) Farmers from other counties within same province 0 0 0 0 0 0
c) Farmers form other provinces 0 0 0 0 0 0
d) Traders in same county 50 80 8 18 8 19
e) Traders from other counties within same province 21 0 4 0 5 0
f) Traders from other provinces 11 0 15 21 15 20
g) Government grain depot in same county 0 0 38 27 38 27
h) Government grain depot from other counties within same province 0 0 25 25 24 24
146

l) Government grain depot from other province 0 0 4 0 4 0
3. For paddy custom-milled by mill, shares (of paddy kg) by source
a) Farmers in same county NA NA 17 NA 17 NA
b) Farmers from other counties within same province NA NA 0 NA 0 NA
c) Farmers form other provinces NA NA 0 NA 0 NA
d) Traders in same county NA NA 0 NA 0 NA
e) Traders from other counties within same province NA NA 0 NA 0 NA
f) Traders form other provinces NA NA 0 NA 0 NA
g) Government grain depot in same county NA NA 83 NA 83 NA
h) Government grain depot from other counties within same province NA NA 0 NA 0 NA
l) Government grain depot from other province NA NA 0 NA 0 NA
147
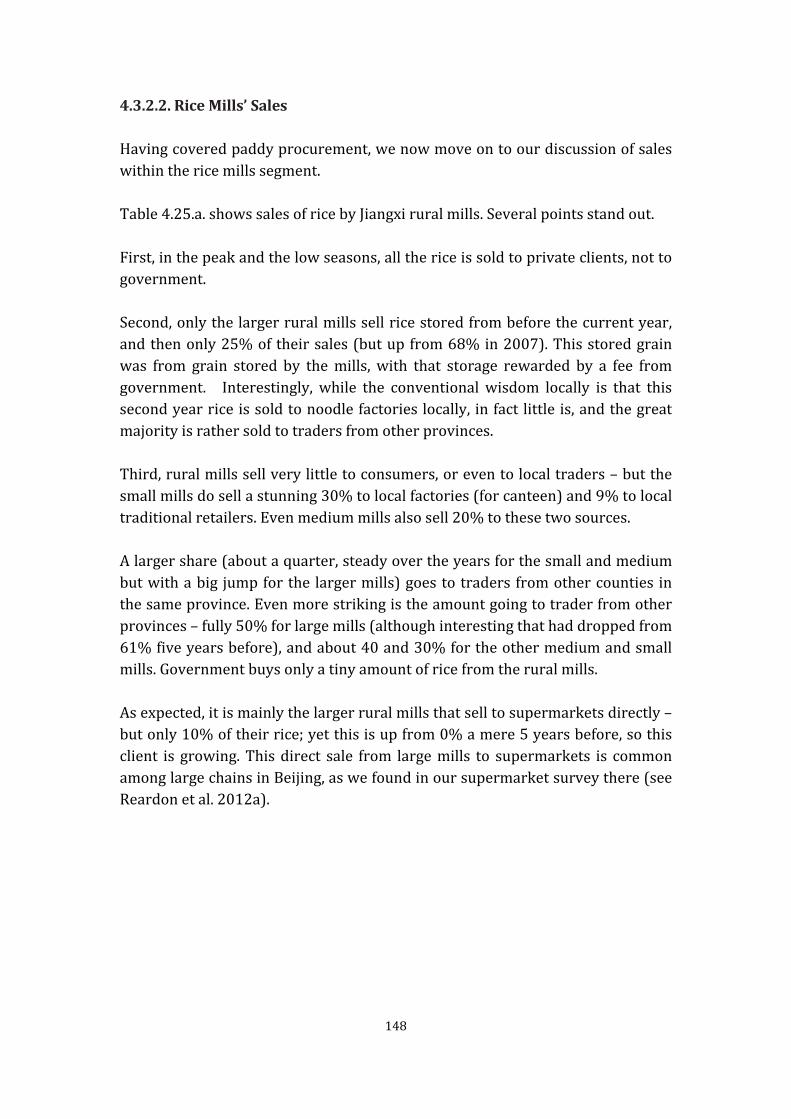
4.3.2.2. Rice Mills’ Sales Having covered paddy procurement, we now move on to our discussion of sales within the rice mills segment. Table 4.25.a. shows sales of rice by Jiangxi rural mills. Several points stand out. First, in the peak and the low seasons, all the rice is sold to private clients, not to government. Second, only the larger rural mills sell rice stored from before the current year, and then only 25% of their sales (but up from 68% in 2007). This stored grain was from grain stored by the mills, with that storage rewarded by a fee from government. Interestingly, while the conventional wisdom locally is that this second year rice is sold to noodle factories locally, in fact little is, and the great majority is rather sold to traders from other provinces. Third, rural mills sell very little to consumers, or even to local traders – but the small mills do sell a stunning 30% to local factories (for canteen) and 9% to local traditional retailers. Even medium mills also sell 20% to these two sources. A larger share (about a quarter, steady over the years for the small and medium but with a big jump for the larger mills) goes to traders from other counties in the same province. Even more striking is the amount going to trader from other provinces – fully 50% for large mills (although interesting that had dropped from 61% five years before), and about 40 and 30% for the other medium and small mills. Government buys only a tiny amount of rice from the rural mills. As expected, it is mainly the larger rural mills that sell to supermarkets directly – but only 10% of their rice; yet this is up from 0% a mere 5 years before, so this client is growing. This direct sale from large mills to supermarkets is common among large chains in Beijing, as we found in our supermarket survey there (see Reardon et al. 2012a).
148
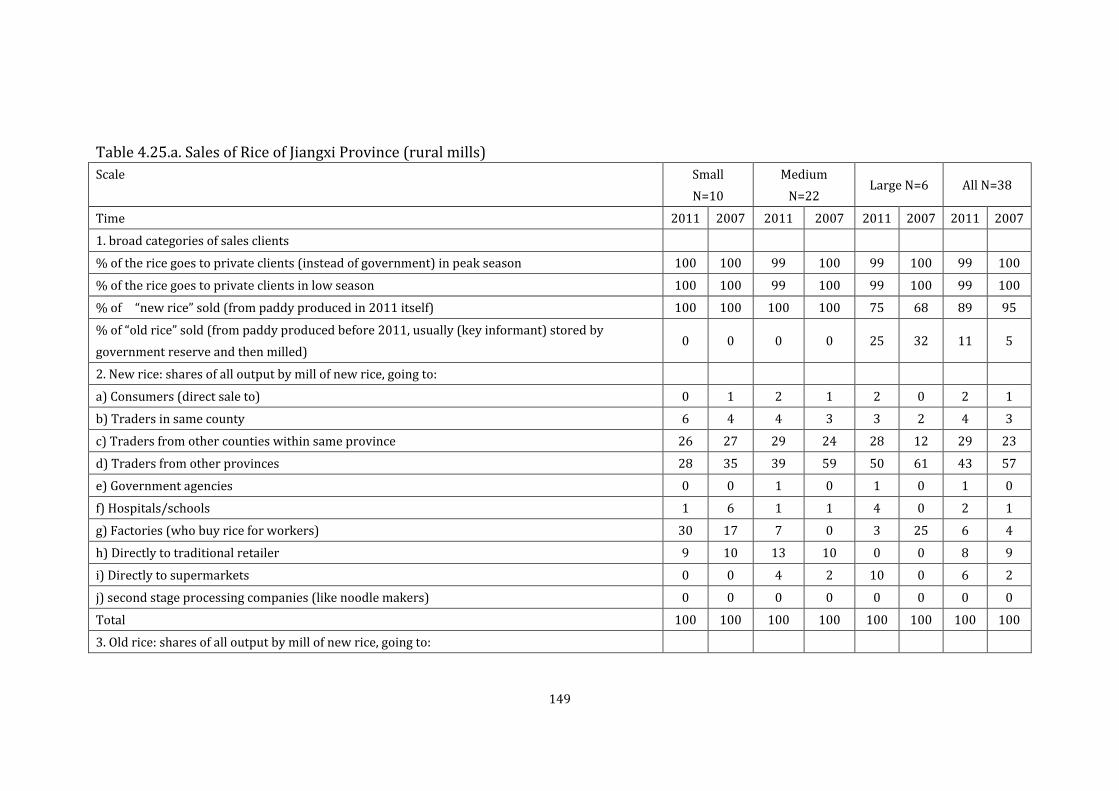
Table 4.25.a. Sales of Rice of Jiangxi Province (rural mills) Scale Small
N=10 Medium
N=22 Large N=6 All N=38
Time 2011 2007 2011 2007 2011 2007 2011 2007
1. broad categories of sales clients
% of the rice goes to private clients (instead of government) in peak season 100 100 99 100 99 100 99 100
% of the rice goes to private clients in low season 100 100 99 100 99 100 99 100
% of “new rice” sold (from paddy produced in 2011 itself) 100 100 100 100 75 68 89 95
% of “old rice” sold (from paddy produced before 2011, usually (key informant) stored by government reserve and then milled)
0 0 0 0 25 32 11 5
2. New rice: shares of all output by mill of new rice, going to:
a) Consumers (direct sale to) 0 1 2 1 2 0 2 1
b) Traders in same county 6 4 4 3 3 2 4 3
c) Traders from other counties within same province 26 27 29 24 28 12 29 23
d) Traders from other provinces 28 35 39 59 50 61 43 57
e) Government agencies 0 0 1 0 1 0 1 0
f) Hospitals/schools 1 6 1 1 4 0 2 1
g) Factories (who buy rice for workers) 30 17 7 0 3 25 6 4
h) Directly to traditional retailer 9 10 13 10 0 0 8 9
i) Directly to supermarkets 0 0 4 2 10 0 6 2
j) second stage processing companies (like noodle makers) 0 0 0 0 0 0 0 0
Total 100 100 100 100 100 100 100 100
3. Old rice: shares of all output by mill of new rice, going to:
149
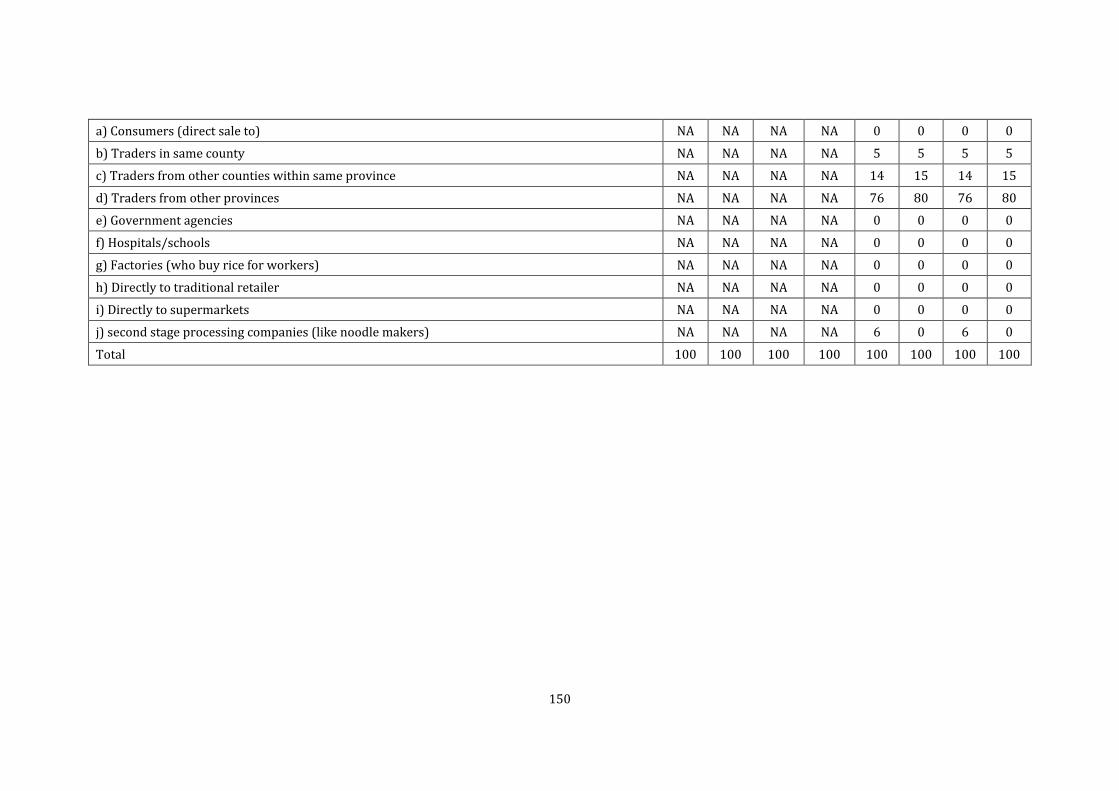
a) Consumers (direct sale to) NA NA NA NA 0 0 0 0
b) Traders in same county NA NA NA NA 5 5 5 5
c) Traders from other counties within same province NA NA NA NA 14 15 14 15
d) Traders from other provinces NA NA NA NA 76 80 76 80
e) Government agencies NA NA NA NA 0 0 0 0
f) Hospitals/schools NA NA NA NA 0 0 0 0
g) Factories (who buy rice for workers) NA NA NA NA 0 0 0 0
h) Directly to traditional retailer NA NA NA NA 0 0 0 0
i) Directly to supermarkets NA NA NA NA 0 0 0 0
j) second stage processing companies (like noodle makers) NA NA NA NA 6 0 6 0
Total 100 100 100 100 100 100 100 100
150

Table 4.25.b. shows sales of rice by Zhejiang urban mills. Several points stand out. First, in the peak and the low seasons, all the rice is sold to private clients, not to government. Second, only the medium urban mills sell rice stored from before the current year, and then only 25% of their sales (but down from 68% in 2007). This stored grain was from the government reserves. For urban mills, we confirm here conventional wisdom that this second year rice is sold to noodle factories locally, as 68% is (although down from 75% five years before – with an increase instead in sales to traders from local and other provinces, as we saw in the rural mills). Third, urban mills do not sell to consumers. Rather, the small ones sell mostly to traders from other counties, and some to traders in the same county. Medium mills sell about 60% to traders in the province, 11% from other provinces (up from 4 in 2007), and then mainly to traditional retailers (24%, but down from 36% in 2007, displaced by a shift to more sales to non-local traders).
151

Table 4.25.b. Sales of Rice of Zhejiang Province (Urban mills) Scale Small N=2 Medium N=17 All N=19
Time 2011 2007 2011 2007 2011 2007
1. broad categories of sales clients
% of the rice goes to private clients (instead of government) in peak season 100 NA 99 100 99 100
% of the rice goes to private clients in low season NA NA 100 100 100 100
% of “new rice” sold (from paddy produced in 2011 itself) 100 NA 48 46 48 46
% of “old rice” sold (from paddy produced before 2011, usually (key informant) stored by government reserve and then milled)
0 NA 52 54 52 54
2. New rice: shares of all output by mill of new rice, going to:
a) Consumers (direct sale to) 0 NA 1 1 1 1
b) Traders in same county 20 NA 27 30 27 30
c) Traders from other counties within same province 80 NA 30 23 31 23
d) Traders from other provinces 0 NA 11 4 11 4
e) Government agencies 0 NA 1 0 1 0
f) Hospitals/schools 0 NA 3 2 3 2
g) Factories (who buy rice for workers) 0 NA 3 3 3 3
h) Directly to traditional retailer 0 NA 24 36 23 36
i) Directly to supermarkets 0 NA 1 0 1 0
j) second stage processing companies (like noodle makers) 0 NA 0 0 0 0
Total 100 100 100 100 100 100
3. Old rice: shares of all output by mill of new rice, going to:
a) Consumers (direct sale to) NA NA 0 0 0 0
b) Traders in same county NA NA 10 10 10 10
152

c) Traders from other counties within same province NA NA 10 10 10 10
d) Traders from other provinces NA NA 11 5 11 5
e) Government agencies NA NA 0 0 0 0
f) Hospitals/schools NA NA 0 0 0 0
g) Factories (who buy rice for workers) NA NA 0 0 0 0
h) Directly to traditional retailer NA NA 0 0 0 0
i) Directly to supermarkets NA NA 0 0 0 0
j) second stage processing companies (like noodle makers) NA NA 68 75 68 75
Total 100 100 100 100 100 100
153

4.3.2.3. Rice Mills and Value Chain Finance As we have already discussed paddy procurement and sales in our discussion of the rice mills segment, we will now explore the issue of value-chain finance. Table 4.26.a. shows credit given or taken by rural rice mills. The key points are as follows. First, mills do not give credit to their suppliers but do get credit from them. Only a very small share (3% of the mills, and that is just 5% of the medium mills and no others) give any advances to their suppliers (recall these are farmers and traders). By contrast, two thirds of the small and medium mills receive (de facto) credit from suppliers, in that the mills pay the suppliers with delay. This is not the case for the large mills. The delay is not lengthy, however, just averaging a week, the time of a cycle of transaction of buying paddy, milling, selling, by the mill. Second, the clients of the mills tend not to give the mill an advance payment; this happens somewhat for the larger mills (17% of these get these advances). By contrast, it is very common for the clients of mills to derive de facto credit from mills, as the clients of many mills pay the mills with delay – overall nearly 80% of the mills, especially for the small and medium mils. The delay averages a few weeks. Table 4.26.b. shows credit given or taken by urban rice mills. The key points are as follows. First, urban mills are more apt than rural mills to give advances to suppliers: half of small mills, but only a tenth of medium mills, do so. About half the small mills also pay with a delay to suppliers, thus de facto receiving credit from them. But the delay is only a few days. Second, the clients of the mills tend not to give the mill an advance payment; this happens somewhat for the larger mills (6% of these get these advances). By contrast, as with rural mills, it is very common for the clients of mills to derive de facto credit from mills, as the clients of many mills pay the mills with delay – overall nearly 75% of the mills, especially for the small and medium mils. The delay averages a few weeks.
154

Table 4.26.a. Rice mills and credit (in %) of Jiangxi Province, all is done by simple average of the strata. Scale Small
N=10 Medium
N=22 Large N=6
All N=38
1. Mills Payment to paddy suppliers (farmers & paddy traders)
% of Mills that pay advance to suppliers (pay before get paddy) 0 5 0 3
If receive advance, Mean days of advance before the transaction (n=subset of mills paying advances) 0 NA 0 NA
% of mills who pay with delay to suppliers (pay for paddy after receive it) 60 64 0 53
If pay with delay, Mean days delayed after the transaction 12 5.3 NA 7.5
% of mills pay in cash (rather than in check) to suppliers 70 100 67 87
% of mills pay by transfer accounts or check to suppliers 10 0 0 3
2. Payment from the rice clients (rice traders & supermarket & hospital/school/factory & government units)
% of mills whose clients pay advances to the mills 0 5 17 5
If mill received advance from client, Mean days before the transaction (n=subset of mills getting advance from client)
1 1 1 1
% of mills whose clients pay with delay 70 91 50 79
For mills having clients paying with delay, Mean days delayed after the transaction (n=subset of mills whose clients pay with delay)
15 15.3 25 16.2
% of mills get paid in cash by clients (instead of check or transfer) 70 82 67 76
% of mills get paid through transfer accounts or check 20 36 17 29
155
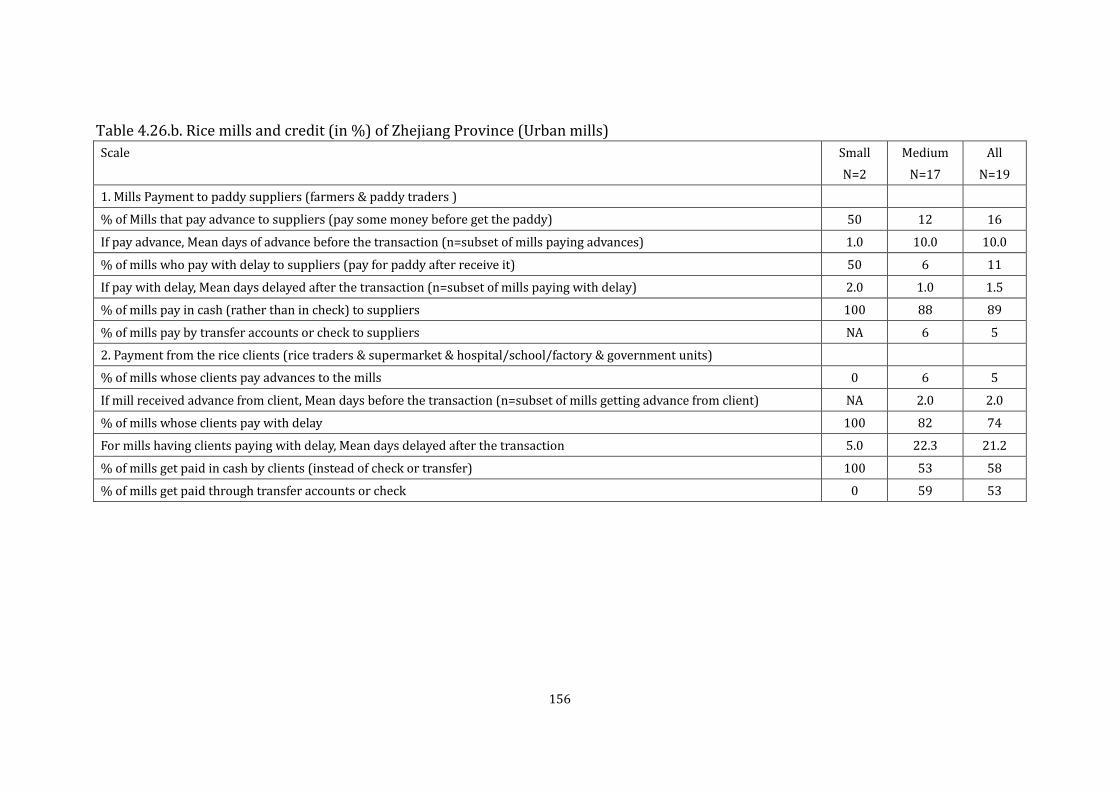
Table 4.26.b. Rice mills and credit (in %) of Zhejiang Province (Urban mills) Scale Small
N=2 Medium
N=17 All
N=19
1. Mills Payment to paddy suppliers (farmers & paddy traders )
% of Mills that pay advance to suppliers (pay some money before get the paddy) 50 12 16
If pay advance, Mean days of advance before the transaction (n=subset of mills paying advances) 1.0 10.0 10.0
% of mills who pay with delay to suppliers (pay for paddy after receive it) 50 6 11
If pay with delay, Mean days delayed after the transaction (n=subset of mills paying with delay) 2.0 1.0 1.5
% of mills pay in cash (rather than in check) to suppliers 100 88 89
% of mills pay by transfer accounts or check to suppliers NA 6 5
2. Payment from the rice clients (rice traders & supermarket & hospital/school/factory & government units)
% of mills whose clients pay advances to the mills 0 6 5
If mill received advance from client, Mean days before the transaction (n=subset of mills getting advance from client) NA 2.0 2.0
% of mills whose clients pay with delay 100 82 74
For mills having clients paying with delay, Mean days delayed after the transaction 5.0 22.3 21.2
% of mills get paid in cash by clients (instead of check or transfer) 100 53 58
% of mills get paid through transfer accounts or check 0 59 53
156
Tables 4.27a and 4.27.b show loans taken by rural and urban mills. Regarding rural mills, the rate of loan taking was substantial in 2011: half of small rural mills, two-thirds of medium, and a third of the large. Most of this is for paddy purchase, thus toward working capital. That more than half the mills took loans shows an active (but still minor in terms of total funds flow) engagement with the credit market. Recall that value-chain finance in the form of advances is relatively modest, so it is the credit market, formal or informal, that appears a bit (but not much) more important. The millers assess credit access ease as middling, neither very easy nor very hard. There is a sharp difference in sources by mill stratum: the largest mills borrow from the formal sector (for which collateral is required), the Agricultural Development Bank; the small and medium mills borrow mainly from informal sources, and a bit from the rural credit coop, and in the case of the medium, a bit from the biggest commercial banks. Note that the officially recommended interest rate for formal banks is 0.87% per month; note that all the rates observed here are below that, especially for the large mills, who borrow at 0.5% per month. The latter get subsidized interest rate; also they will get a subsidy for the interest they pay; that subsidy is correlated with the size of the mill, with a higher rate given to the dragon head companies. Informal sources have high interest rates, but are relatively quick to arrange, and do not require collateral, as the table shows. Regarding urban mills’ taking loans, the rate of loan taking was minor, much less than in rural areas, involving only a quarter of the medium mills, and none of the small mills. All of this was for paddy purchase, thus toward working capital. The medium millers assess credit access ease as relatively easy. These millers mainly got loans from the Agricultural Development Bank, and also from rural credit coops and big commercial banks.
157

Table 4.27.a. Loans taken by mills in 2011 of Jiangxi Province (rural mills) Scale Small N=10 Medium N=22 Large N=6 All N=38
% of mills took loan in 2011 50 64 33 55
% of mills borrowed for paddy purchase 50 59 33 53
Assessment of ease of borrowing (five point scale with five the hardest) 3.2 3.4 3.5 3.3
For mills who borrowed, mean amount of USD borrowed per loan 31,782 466494. 1,240,310 414,330
Sources of the loans (among subset of mills who borrowed)
a) % of mills borrowed from agricultural development bank 0 29 100 29
b) % of mills borrowed from rural credit cooperative 20 15 0 5
c) % of mills borrowed from four biggest commercial banks (Agriculture Bank of China, CBC, ICBC, BOC)
0 15 0 10
d) % of mills borrowed from other commercial banks (regional and local) 0 0 0 0
e) % of mills borrowed from informal sources 80 57 0 58
For those borrowing from formal sources (all but (e) above) characteristics of loans (n= subset)
a) time period of loan (in months) 12.0 10.0 12.0 11.0
b) interest rate percent per month 0.8 0.7 0.5 0.7
c) % of mills asked to give collateral/pledge or guarantee 100 83 100 89
d) Mean days took to go through the procedures to get the loan 10.0 30.0 23.0 26.0
For those borrowing from informal sources ((e) above) characteristics of loans (n= subset)
a) time period of loan (months) 5.0 6.0 NA 6.0
b) interest rate per month (%/month) 0.9 0.7 NA 0.8
c) % of mills asked to give collateral/pledge or guarantee 0 NA NA 0
d) Mean days took to go through the procedures to get the loan (day) 2.0 3.0 NA 2.0
158

Table 4.27.b. Loans taken by mills in 2011 of Zhejiang Province (Urban mills) Scale Small
N=2 Medium
N=17 All
N=19
% of mills took loan in 2011 0 24 21
% of mills borrowed for paddy purchase 0 24 21
Assessment of ease of borrowing (five point scale with five the hardest) NA 2.0 2.0
For mills who borrowed, mean amount of USD borrowed per loan NA 430,888 430,888
Sources of the loans (among subset of mills who borrowed)
a) % of mills borrowed from agricultural development bank NA 50 50
b) % of mills borrowed from rural credit cooperative NA 25 25
c) % of mills borrowed from four biggest commercial banks (Agriculture Bank of China, CBC, ICBC, BOC) NA 25 25
d) % of mills borrowed from other commercial banks (regional and local) NA 0 0
e) % of mills borrowed from informal sources NA 0 0
For those borrowing from formal sources (all but (e) above) characteristics of loans (n= subset)
a) time period of loan (month) NA 9.8 9.8
b) interest rate per month (%/month) NA 0.5 0.5
c) % of mills asked to give collateral/pledge or guarantee NA 75 75
d) Mean days took to go through the procedures to get the loan (day) NA 12.5 12.5
159
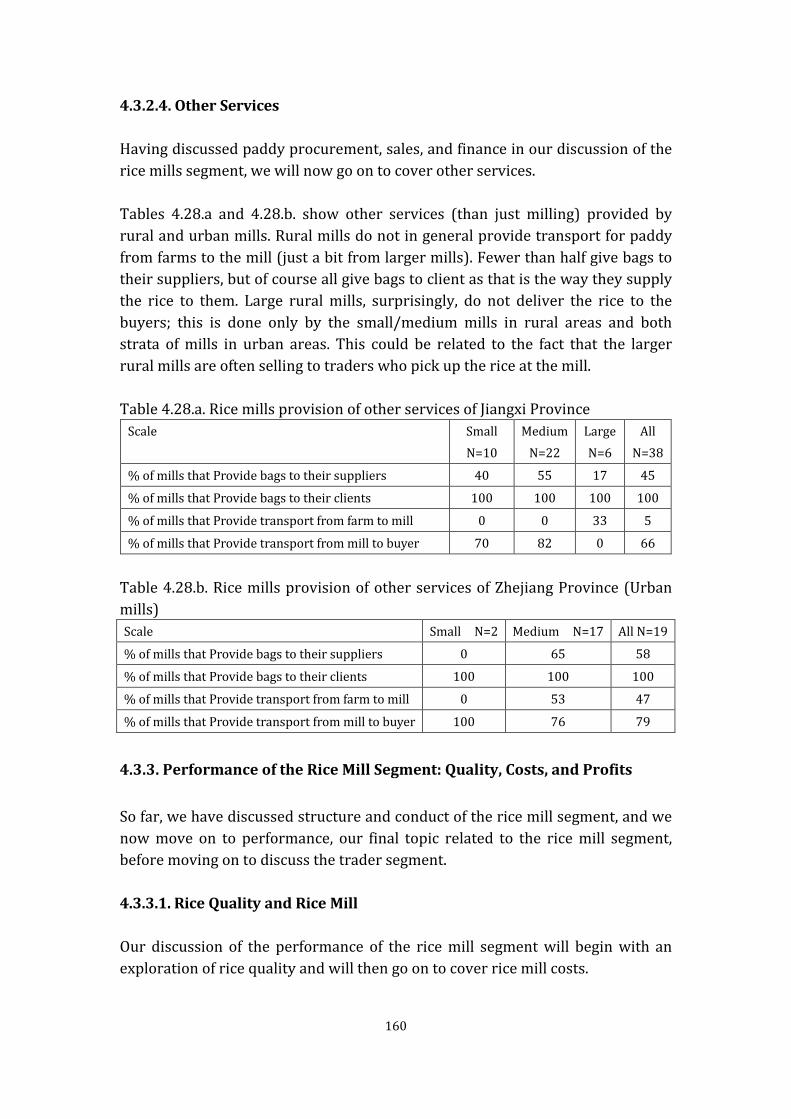
4.3.2.4. Other Services Having discussed paddy procurement, sales, and finance in our discussion of the rice mills segment, we will now go on to cover other services. Tables 4.28.a and 4.28.b. show other services (than just milling) provided by rural and urban mills. Rural mills do not in general provide transport for paddy from farms to the mill (just a bit from larger mills). Fewer than half give bags to their suppliers, but of course all give bags to client as that is the way they supply the rice to them. Large rural mills, surprisingly, do not deliver the rice to the buyers; this is done only by the small/medium mills in rural areas and both strata of mills in urban areas. This could be related to the fact that the larger rural mills are often selling to traders who pick up the rice at the mill. Table 4.28.a. Rice mills provision of other services of Jiangxi Province
Scale Small N=10
Medium N=22
Large N=6
All N=38
% of mills that Provide bags to their suppliers 40 55 17 45
% of mills that Provide bags to their clients 100 100 100 100
% of mills that Provide transport from farm to mill 0 0 33 5
% of mills that Provide transport from mill to buyer 70 82 0 66
Table 4.28.b. Rice mills provision of other services of Zhejiang Province (Urban mills) Scale Small N=2 Medium N=17 All N=19
% of mills that Provide bags to their suppliers 0 65 58
% of mills that Provide bags to their clients 100 100 100
% of mills that Provide transport from farm to mill 0 53 47
% of mills that Provide transport from mill to buyer 100 76 79
4.3.3. Performance of the Rice Mill Segment: Quality, Costs, and Profits
So far, we have discussed structure and conduct of the rice mill segment, and we now move on to performance, our final topic related to the rice mill segment, before moving on to discuss the trader segment. 4.3.3.1. Rice Quality and Rice Mill Our discussion of the performance of the rice mill segment will begin with an exploration of rice quality and will then go on to cover rice mill costs.
160

Table 4.29.a. shows quality characteristics of the paddy milled by rural mills. The quality of paddy bought does not differ much over seasons. But it does over types of mills; medium and large mills spend about 60% on fine paddy, and 40% on common, while small mills spend 86% on common and a mere 14% on fine. Moreover, there is more price differentiation over fine versus common among mills than among farmers (recall for the latter in chapter 3 that the price premium for fine was only 5% in the early season and 3 and 1% in the middle/late season). Here we find for mills about a 5% difference in the early season and about a 10% difference in the middle and late seasons. This may mean that the rural trader is capturing more of the quality differential than is the farmer. Table 4.29.b. shows quality characteristics of the paddy milled by urban mills. The quality of paddy bought does not differ much over seasons, with common highly dominant at 90% in both seasons, and fine, a mere 10%. This contrasts with rural mills of whose paddy purchase, fine figured as 30%. The share of fine differs, as it did among rural mills, over the size strata of urban mills; again, there is a sharp correlation with mill size, with the small buying no fine paddy. Moreover, there is more price differentiation over fine versus common among mills than among farmers. As in the rural areas, in the middle/late season, fine fetches (paid by mill) a 10% higher price than common. This comparison cannot be made in the early season when fine is lacking in urban mills’ purchases. Table 4.30.a. shows the rural mills sales of different grades of rice, whether branded and packaged, and at what prices. The following key points emerge. First, in contrast with buying of paddy, the middle and late indica seasons have a somewhat higher share of fine in the sales of rural mill, about 35% compared with 30% for purchases. The overall shares are also higher, with about 50% share in total indica over the year. It is not clear why the mills report a higher share of fine in sales than in purchases; an explanation might be that they polish some of the common to convert it to fine in shape. As with purchases, there is a bias in the sale of fine among the large and middle stratum mills, and much less among the smaller mills. Second, fully two-thirds of the middle and large mills sell branded rice, although only a minority of the rice the sell is branded. Surprisingly, 40% of the small mills declared selling rice branded. But only the middle and large mills sold rice in vacuum packs (but only about a third of their rice). A further third is sold in plastic bags.
161

Third, comparing for the small and middle sized mills the sales price of fine to common indica, we find that the premium is 10-15% higher; recall for the price premium of fine paddy it was just 10% different for purchase from local traders (mainly), and from the farm survey, a declaration of a lower premium, only about 3%. Hence, the product differentiation premium appears to be mainly captured by the mid-stream actors; this is similar to findings in Bangladesh in Minten, Murshid, and Reardon (2012). Table 4.30.b. shows the urban mills sales of different grades of rice, whether branded and packaged, and at what prices. The following key points emerge. First, in contrast with buying of paddy, there is a stronger positive correlation of the lateness of the season and the share of fine indica (and lower share of common indica), with a phenomenon somewhat like the rural mills, where the share of fine is a little bit higher in sales than in paddy purchases. As with purchases, and as in the rural areas, there is a bias in the sale of fine among the middle stratum mills, and much less among the smaller mills. Very interestingly, there is some milling and sale of japonica by the medium urban mills, mainly common grade japonica, not from local sources. It seems that this would come from close sources of japonica paddy, such as Jiangsu. Second, fully 71% of the middle mills sell branded rice, like in the rural areas, and nearly half of their rice is sold branded. Surprisingly, as in rural areas, half of urban small mills declared selling rice branded. Unlike rural mills that sold some rice in vacuum packs, the urban ones mainly sell in fine plastic bags, with a higher share than from the rural mills. Third, comparing for the middle sized mills the sales price of fine to common indica in the middle/late season (the only category where full information to compare), we find that the premium is 15% higher; recall for the price premium of fine paddy purchased by mills it was just 10% different, when bought from local traders (mainly). So the point about midstream value differentiation being greater than farm side value differentiation by quality, is again confirmed, albeit with modest differences in margins, by the urban mill survey results.
162

Table 4.29.a. Characteristic of the paddy bought by the mills of Jiangxi Province (rural mills) Scale Small N=10 Medium N=22 Large N=6 All N=38
Time 2011 2007 2011 2007 2011 2007 2011 2007
1. quality of the paddy bought, as share of total paddy bought (in volume) in that season
% of fine in total early (season) paddy 10 10 40 30 30 100 30 30
% of common in total early (season) paddy 90 90 60 70 70 0 70 70
% of fine in total middle and late (season) paddy 10 10 40 30 30 30 30 30
% of common in total middle and late (season) paddy 90 90 60 70 70 70 70 70
% of common indica in total paddy bought 84 85 46 43 36 8 50 47
% of fine indica in total paddy bought 16 15 54 57 64 92 50 53
Total 100 100 100 100 100 100 100 100
2. price of the paddy bought (USD/TON)
Mean purchasing price of fine early paddy over all mills who bought it 350 NA 382 NA 372 NA 375 NA
Mean purchasing price of common early paddy over all mills who bought it 344 NA 366 NA 378 NA 362 NA
Mean purchasing price of fine middle and late paddy over all mills who bought it 450 288 438 350 444 310 438 342
Mean purchasing price of common middle and late paddy over all mills who bought it 394 260 412 308 396 NA 404 292
163

Table 4.29.b. Characteristics of the paddy bought by the mills of Zhejiang Province (Urban mills) Scale Small N=2 Medium N=17 All N=19
Time 2011 2007 2011 2007 2011 2007
1. quality of the paddy bought, as share of total paddy bought (in volume) in that season
% of fine in total early (season) paddy 0 0 11 8 10 7
% of common in total early (season) paddy 100 100 89 92 90 93
% of fine in total middle and late (season) paddy 0 0 11 11 10 9
% of common in total middle and late (season) paddy 100 100 89 89 90 91
% of fine in total japonica paddy 0 NA NA NA 0 NA
% of common in total japonica paddy 100 NA NA NA 100 NA
% of common indica in total paddy bought 100 100 84 89 85 90
% of fine indica in total paddy bought 0 0 9 11 8 10
% of common japonica in total paddy bought 0 0 7 0 6 0
% of fine japonica in total paddy bought 0 0 0 0 0 0
Total 100 100 100 100 100 100
2. price of the paddy bought (USD/TON)
Mean purchasing price of fine early paddy over all mills who bought it NA NA NA NA NA NA
Mean purchasing price of common early paddy over all mills who bought it 37.6 31.1 38.8 28.8 38.8 29.2
Mean purchasing price of fine middle and late paddy over all mills who bought it NA NA 45.1 37.2 45 37.2
Mean purchasing price of common middle and late paddy over all mills who bought it 42.4 34.2 41.8 31.4 41.8 31.6
Mean purchasing price of fine japonica paddy over all mills who bought it NA NA NA NA NA NA
Mean purchasing price of common japonica paddy over all mills who bought it NA NA 45.2 NA 45.2 NA
164
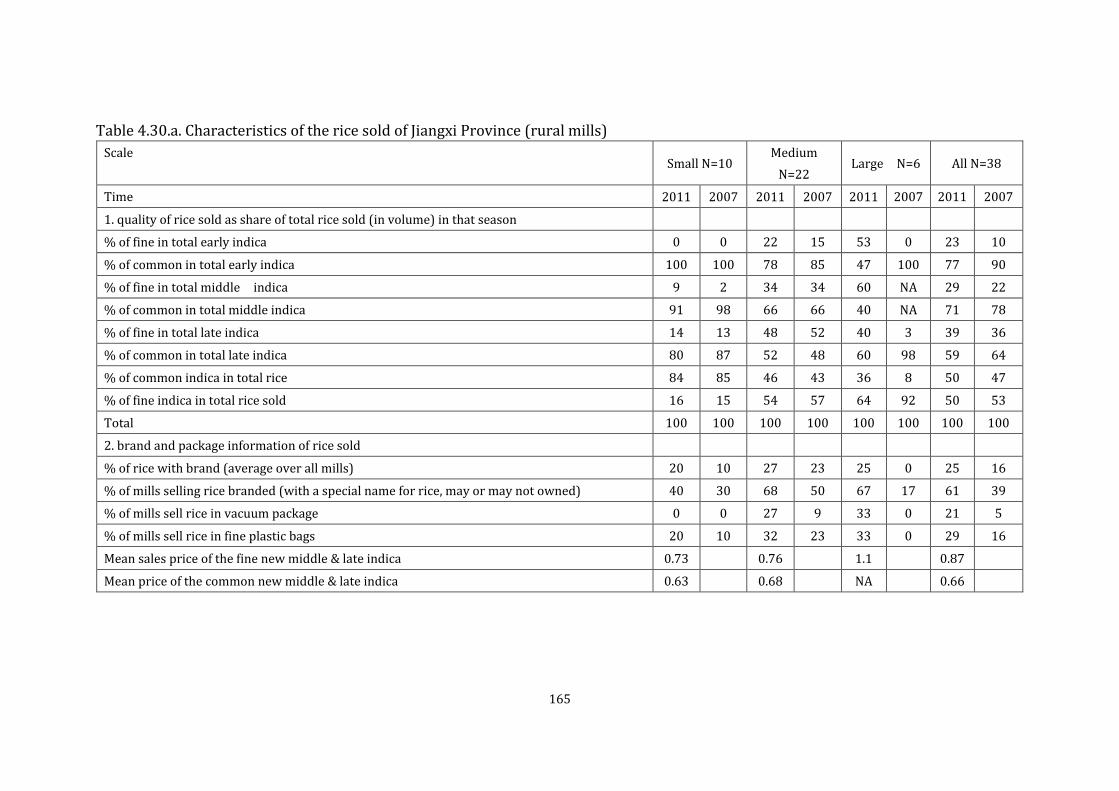
Table 4.30.a. Characteristics of the rice sold of Jiangxi Province (rural mills) Scale
Small N=10 Medium
N=22 Large N=6 All N=38
Time 2011 2007 2011 2007 2011 2007 2011 2007
1. quality of rice sold as share of total rice sold (in volume) in that season
% of fine in total early indica 0 0 22 15 53 0 23 10
% of common in total early indica 100 100 78 85 47 100 77 90
% of fine in total middle indica 9 2 34 34 60 NA 29 22
% of common in total middle indica 91 98 66 66 40 NA 71 78
% of fine in total late indica 14 13 48 52 40 3 39 36
% of common in total late indica 80 87 52 48 60 98 59 64
% of common indica in total rice 84 85 46 43 36 8 50 47
% of fine indica in total rice sold 16 15 54 57 64 92 50 53
Total 100 100 100 100 100 100 100 100
2. brand and package information of rice sold
% of rice with brand (average over all mills) 20 10 27 23 25 0 25 16
% of mills selling rice branded (with a special name for rice, may or may not owned) 40 30 68 50 67 17 61 39
% of mills sell rice in vacuum package 0 0 27 9 33 0 21 5
% of mills sell rice in fine plastic bags 20 10 32 23 33 0 29 16
Mean sales price of the fine new middle & late indica 0.73 0.76 1.1 0.87
Mean price of the common new middle & late indica 0.63 0.68 NA 0.66
165

Table 4.30.b. Characteristics of the rice sold of Zhejiang Province (Urban mills) Scale Small N=2 Medium N=17 All N=19
Time 2011 2007 2011 2007 2011 2007
1. quality of rice sold as share of total rice sold (in volume) in that season
% of fine in total early indica NA NA 7 5 7 5
% of common in total early indica NA NA 93 95 93 95
% of fine in total middle indica 0 0 7 7 6 6
% of common in total middle indica 100 100 93 93 94 94
% of fine late indica in total late indica NA NA 33 18 33 18
% of fine common indica in total late indica NA NA 67 82 67 82
% of fine in total japonica NA NA 18 0 18 0
% of common in total japonica NA NA 82 100 82 100
2. brand and package information of rice sold
% of rice with brand (average over all mills) 50 50 44 36 45 37
% of mills selling rice branded (with a special name for rice, may or may not owned) 50 50 71 53 68 53
% of mills sell rice in vacuum package 0 0 1 6 1 5
% of mills sell rice in fine plastic bags 50 50 71 71 68 68
3. price of the rice sold in March, 2012 (month before the survey) USD/KG
Mean price of old indica rice NA 0.57 0.57
Mean price of the fine new early indica NA NA NA
Mean price of the common new early indica 0.57 0.57 0.57
Mean price of the fine new middle & late indica NA 0.72 0.72
Mean price of the common new middle & late indica 0.59 0.64 0.63
166

4.3.3.2. Rice Mill Costs Finally, we will discuss rice mill costs, which will conclude our discussion of both rice mill performance and the larger section on the rice mill segment. Tables 4.31.a and 4.31.b. show costs or rural and urban mills. Several points stand out. For rural mills, the share of labor costs in total is very high – from 50% of small mills’ costs to 40% of large mills costs; energy in the form of the electricity bill comes in second, and 20% of small and large mills’ costs. Adding diesel as energy source for transport, mainly for the small mills, adds a further 4%. With these two, labor and energy, we have 70% of the mills’ costs. The third main cost, especially for medium and large mills, is the rental of trucks, mainly as we have seen to deliver rice to clients. It is stunning how strongly inversely related is the cost of milling a ton of paddy and the size of mill: there are strong economies of scale, more than a 2 to 1 difference in per unit cost between small and large mills. This appears to be a strong factor driving consolidation. For urban mills, the share of labor costs in total is less high than in rural areas, around 25%; electricity again (as in rural mills) comes in as important, even more important, from 20-30% of costs. The third main cost, for both strata, is the rental of trucks, at a large 44% of costs. Interestingly, in the city, the medium mill is actually more expensive (2x the cost) as the small mill. The rural cost of milling is, however, much lower than the average urban cost (12 versus 17). This will need to be explored in more detail. For electricity, 37% of urban mills operate at night, so they can pay a lower price for electricity, which is half the price of electricity during the day. The transportation cost of paddy purchase will be higher for urban mills, as they will buy farther away, 67% of mill rely on government grain reserve, 29% of mills buy from other counties/cities in same province or other provinces, while for rural mills, 0% of them did this. These two reasons might explain why urban mills have higher cost compared with rural mills. For urban small mills (sample size of which is 2), the cost of casual labor, warehouse, and other items, are zero, so the medium mill is more costly.
167

Table 4.31.a Mean Costs per rural Mill for 2011 (in 1000 USD; in parentheses are % of total costs) of Jiangxi Province Scale Small N=10 Medium N=22 Large N=6 All N=38
USD % USD % USD % USD %
Labor (Permanent) 14.8 33 38.1 28 240.9 33 59.5 33
Labor (casual) 8.5 19 2.7 2 45.5 6 8.1 5
Drivers 0.0 0 0.8 1 0.0 0 0.5 0
Electricity 9.1 20 34.4 25 153.1 21 40.6 23
Water 0.0 0 0.7 1 0.2 0 0.5 0
Communication fee (fax, phones) 0.3 1 0.6 0 0.9 0 0.5 0
Maintenance of equipment and vehicles (other than his/her own hired labor) 1.9 4 2.9 2 18.3 3 3.9 2
Warehouse/ rental 0.4 1 0.0 0 0.0 0 0.1 0
Mill building + land rental 0.0 0 0.7 1 0.0 0 0.5 0
Diesel for own and rented vehicles 1.7 4 2.0 1 0.0 0 1.9 1
Rental of trucks 4.1 9 42.4 31 231.5 32 52.1 29
Taxes 3.7 8 12.0 9 15.8 2 10.0 6
Insurance 0.0 0 0.9 1 19.6 3 1.6 1
Other costs 0.0 0 0.1 0 0.0 0 0.1 0
Total yearly cost 44.5 100 138.3 100 725.8 100 180.0 100
Total days in operation during year 155.5 197.0 285.4 200.1
Daily costs 0.3 0.7 2.5 0.9
Total cost per ton of paddy milled in USD 27.0 13.3 11.4 11.6
168

Table 4.31.b. Mean Costs per urban Mill 2011 (in 1000 USD; parentheses are % of costs) of Zhejiang Scale Small N=2 Medium N=17 All N=19
USD % USD % USD %
Labor (Permanent) 6.3 25.4 72.3 23.6 64.7 24.0
Labor (casual) 0.0 0.0 6.3 2.1 5.7 2.1
Drivers 0.0 0.0 3.4 1.1 3.0 1.1
Electricity 7.0 28.0 55.5 18.1 50.4 18.7
Water 0.1 0.5 0.1 0.0 0.1 0.0
Communication fee (fax, phones) 0.1 0.4 1.4 0.5 1.3 0.5
Maintenance of equipment and vehicles (other than his/her own hired labor)
0.3 1.1 7.8 2.6 7.0 2.6
Warehouse/ rental 0.0 0.0 2.4 0.8 2.2 0.8
Mill building + land rental 0.0 0.0 2.2 0.7 1.9 0.7
Diesel for own and rented vehicles 0.0 0.0 3.1 1.0 2.8 1.0
Rental of trucks 11.1 44.6 133.1 43.5 114.1 42.4
Taxes 0.0 0.0 14.4 4.7 12.9 4.8
Insurance 0.0 0.0 3.9 1.3 3.5 1.3
Other costs 0.0 0.0 0.0 0.0 0.0 0.0
Total yearly cost 24.9 100.0 305.8 100.0 269.3 100.0
Total days in operation during year 99.0 269.2 251.3
Daily costs 0.3 1.1 1.1
Total cost per ton of paddy milled in USD 9.0 18.0 17.3
Tables 4.32.a and 4.32.b show the “last transaction,” from after milling through sale of a lot, for rural and urban mills. The largest costs for rural mills are the bags and the transportation, much of which is fuel cost. Note how low the wastage rate is, very different from conventional wisdom about high wastage. Note that these costs are not the recurrent costs we discuss above, but just for this transaction; in this case the small and large rural mills have similar costs per ton to move the rice after milling. Note that the urban mill costs are very similar in both total (about 10-12 dollars per ton moved, similar to rural mills) and the cost structure (with bag and transport costs the preponderant two costs). The reason that the profit rate is high for medium and large rural mills is that they spent a lot of money to build mills and buy all the equipment, especially those who relocate and have very large mills in industrial parks, but the total cost per ton of paddy milled does not take the amortization into consideration. From the following two tables, it seems that rural mills mill new paddy bought from farmers or paddy traders, however, urban mills mainly mill old paddy bought from government grain deport whose price is low, and the rice milled from old paddy is sold cheap as well.
169

Table 4.32.a. Cost of the last rice selling transaction USD/ton, (with parentheses showing share of that cost in total cost of transaction) of Jiangxi Province (rural mills)
Scale Small N=10 Medium N=22 Large N=6 All N=38
USD % USD % USD % USD %
1. Cost of the bags 5.7 59 6.4 48 4.5 47 6.1 52
2. Bagging and stitching costs of labor 0.0 0 0.3 2 0.0 0 0.2 2
3. Loading and unloading fees 0.2 2 0.2 1 0.0 0 0.2 1
4. Weighing fees 0.0 0 0.0 0 0.0 0 0.0 0
% of the rice that is transported by the mill 30 45 17 37
5.Cost of the transportation (fuel + labor + rental of transport means) 3.9 39 6.3 47 5.1 53 5.1 44
Distance in time to the client 1.4 13.1 14.0 10.2
Distance in km to the client 52.6 251.6 160.0 184.1
6. % of mills uses phone calls for transaction 60 86 33 71
Estimated cost for the phone calls made fortransaction 0.0 0 0.0 0 0.0 0 0.0 0
7. Quantity wasted during the transaction in kg per ton 0.0 0.5 0.0 0.3
Impute value of wastage in USD/ton 0.0 0 0.1 1 0.0 0 0.1 1
8. total Other related cost 0.0 0 0.0 0 0.0 0 0.0 0
9. total cost per ton sold 9.8 100 13.2 100 9.7 100 11.6 100
170

Table 4.32.b. Cost of the last rice selling transaction USD/ton, (with parentheses showing share of that cost in total cost of transaction) of Zhejiang Province (Urban mills) Scale Small N=2 Medium N=13 All N=15
USD % USD % USD %
1. Cost of the bags 6.3 50 5 47 5.2 48
2. Bagging and stitching costs of labor 0 0 0.3 3 0.3 3
3. Loading and unloading fees 0 0 0 0 0 0
4. Weighing fees 0 0 0 0 0 0
5. % of the rice that is transported by the mill 100
62
67
Cost of the transportation (fuel + labor + rental of transport means) 6.2 49 5.3 49 5.4 49
Distance in time to the client (hour) 1.4
1.9
1.9
Distance in km to the client 45
66
62.8
6. % of mills uses phone calls for transaction 100
92
93
Estimated cost for the phone calls made for transaction 0 0 0 0 0 0
7. Quantity wasted in transaction in kg per ton 0
0
0
Impute value of wastage in USD/ton 0 0 0 0 0 0
8. total Other related cost 0 0 0 0 0 0
9. total cost per ton sold 12.6 100 10.7 100 10.9 100
171

Table 4.33.a. Cost of the last paddy purchase transaction in USD/ton (with parentheses showing share of that cost in total cost of transaction) of Jiangxi Province, all is done by simple average of the strata.
Small N=10 Medium N=22 Large N=6 All N=38
Scale
USD % USD % USD % USD %
1. Cost of the bags 0.6 85 0.2 37 0 0 0.3 50
2. Bagging and stitching costs of labor 0 0 0.3 44 0 0 0.2 33
3. Weighing fees (costs) paid to market 0 0 0
0 0 0 0
% of the paddy that is transported by the mill 0 NA 0 NA 17 NA 3 NA
4. Cost of transportation (fuel + labor + rental of transport means) for all
0 0 0 0 0.3 75 0 0
Distance in time from the supplier (hour) 0.4 NA 0.9 NA 2.1 NA 0.9 NA
Distance in km from the supplier 5.6 NA 19.7 NA 0.5 NA 14.1 NA
5. % of mills uses phone calls for the transaction 30 NA 32 NA 50 NA 34 NA
Estimated cost for the phone calls made for the transaction for all 0 0 0 0 0 0 0 0
6. Quantity wasted during the transaction in kg per ton 0.2 NA 0.4 NA 0.2 NA 0.3 NA
Imputed value of the kilograms wasted in USD/ton 0.1 15 0.1 17 0.1 25 0.1 17
7. Other related cost 0 0 0 0 0 0 0 0
8. total cost 1-7 of transaction in per ton terms 0.7 100 0.6 100 0.4 100 0.6 100
172
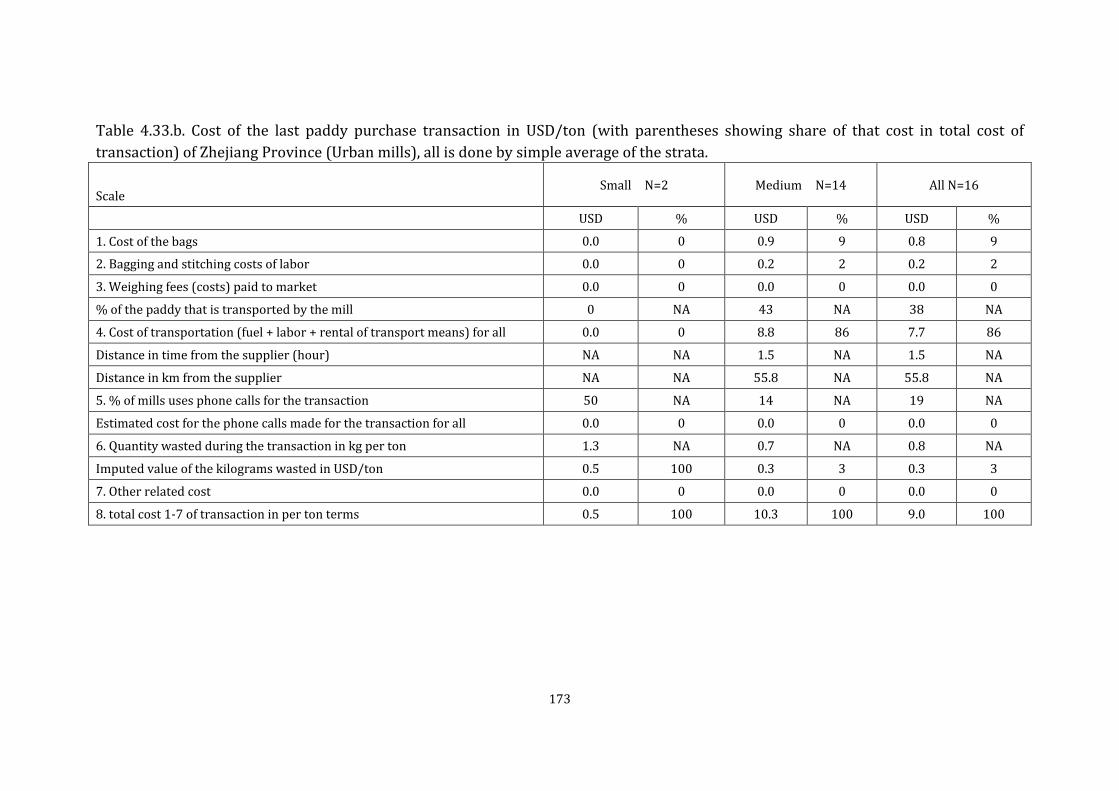
Table 4.33.b. Cost of the last paddy purchase transaction in USD/ton (with parentheses showing share of that cost in total cost of transaction) of Zhejiang Province (Urban mills), all is done by simple average of the strata. Scale
Small N=2 Medium N=14 All N=16
USD % USD % USD %
1. Cost of the bags 0.0 0 0.9 9 0.8 9
2. Bagging and stitching costs of labor 0.0 0 0.2 2 0.2 2
3. Weighing fees (costs) paid to market 0.0 0 0.0 0 0.0 0
% of the paddy that is transported by the mill 0 NA 43 NA 38 NA
4. Cost of transportation (fuel + labor + rental of transport means) for all 0.0 0 8.8 86 7.7 86
Distance in time from the supplier (hour) NA NA 1.5 NA 1.5 NA
Distance in km from the supplier NA NA 55.8 NA 55.8 NA
5. % of mills uses phone calls for the transaction 50 NA 14 NA 19 NA
Estimated cost for the phone calls made for the transaction for all 0.0 0 0.0 0 0.0 0
6. Quantity wasted during the transaction in kg per ton 1.3 NA 0.7 NA 0.8 NA
Imputed value of the kilograms wasted in USD/ton 0.5 100 0.3 3 0.3 3
7. Other related cost 0.0 0 0.0 0 0.0 0
8. total cost 1-7 of transaction in per ton terms 0.5 100 10.3 100 9.0 100
173

Table 4.34.a. Rice Profit Rates (in %) of Jiangxi Province, all is done by simple average of the strata. Scale Small N=10 Medium N=22 Large N=6 All N=38
rice price(USD/ton) 685.2 718.9 919.5 725.8
paddy price(USD/ton) 417.9 432.8 432.0 429.1
paddy imputed into rice (USD/ton) 643.0 665.9 664.7 660.2
Absolute margin (USD/ton) 42.2 53.1 254.8 65.6
Total cost per ton of paddy milled (USD/ton) 27.0 13.3 11.4 11.6
Profit Rates (%) (gross of amortization) 20 61 93 73
Table 4.34.b. Rice Profit Rates (in %) of Zhejiang Province (Urban mills), all is done by simple average of the strata.
Scale Small N=2 Medium N=17 All N=19
rice price(USD/ton) 587.9 610.5 607.9
paddy price(USD/ton) 369.2 373.3 372.9
paddy imputed into rice (USD/ton) 568.0 574.2 573.7
Absolute margin (USD/ton) 19.9 36.3 34.2
Total cost per ton of paddy milled (USD/ton) 9.0 18.0 17.3
Profit Rates (%) 30 24 22
174

4.4. Midstream—Transformation of the Trader Segment
Next, we present findings from the trader survey with respect to the structure, conduct, and performance of paddy and rice traders in Jiangxi and Zhejiang.
4.4.1. Structure: Characteristics and Seasonality in Paddy and Rice Trading
Our discussion of the structure of rice traders will explore the trader characteristics and seasonality in paddy and rice trading. 4.4.1.1. Characteristics of rural paddy traders In order to analyze the structure of rice traders, we will begin with the characteristics of rural paddy traders. Table 4.35.a shows characteristics of rural paddy and rice traders in Jiangxi. These are nearly all middle aged males, few politically involved, and none in the local rice association. They have been in business somewhat longer than the local millers, since the late 1990s. They are all informal sector actors, as none are registered with the government. As they are not in stalls in wholesale markets, they pay no fixed fee to the government. They are also not agents for specific mills. They only trade in paddy or rice, no other product. Their owned assets are modest. They own or rent no stall, no warehouse. A few own trucks, others rent trucks, and the rest use smaller vehicles. Working capital requirements have jumped substantially recently. Yet neither at the start, nor now do the rural traders rely on banks or other credit to finance their business’s rolling capital. The overall picture painted is a small, mobile, informal sector trader operating from a small vehicle and just buying and selling paddy. Table 4.35.a. Characteristics of village paddy traders in Jiangxi Province Sample size 10
1. Demography of the traders
Mean age of trader (years) 50.6
Gender of trader (% male) 100
2. Human & Social Capital
Mean years of education (years) 6.9
% of traders are CPC members in 2011 10
% of traders who are members of the local association for rice or grain in 2011 0
Number of other traders the trader has relation with in 2011 4.9
Number of other traders the trader has relation with when start-up 2.7
Number of retailers the trader has relation with in 2011 2.4
175
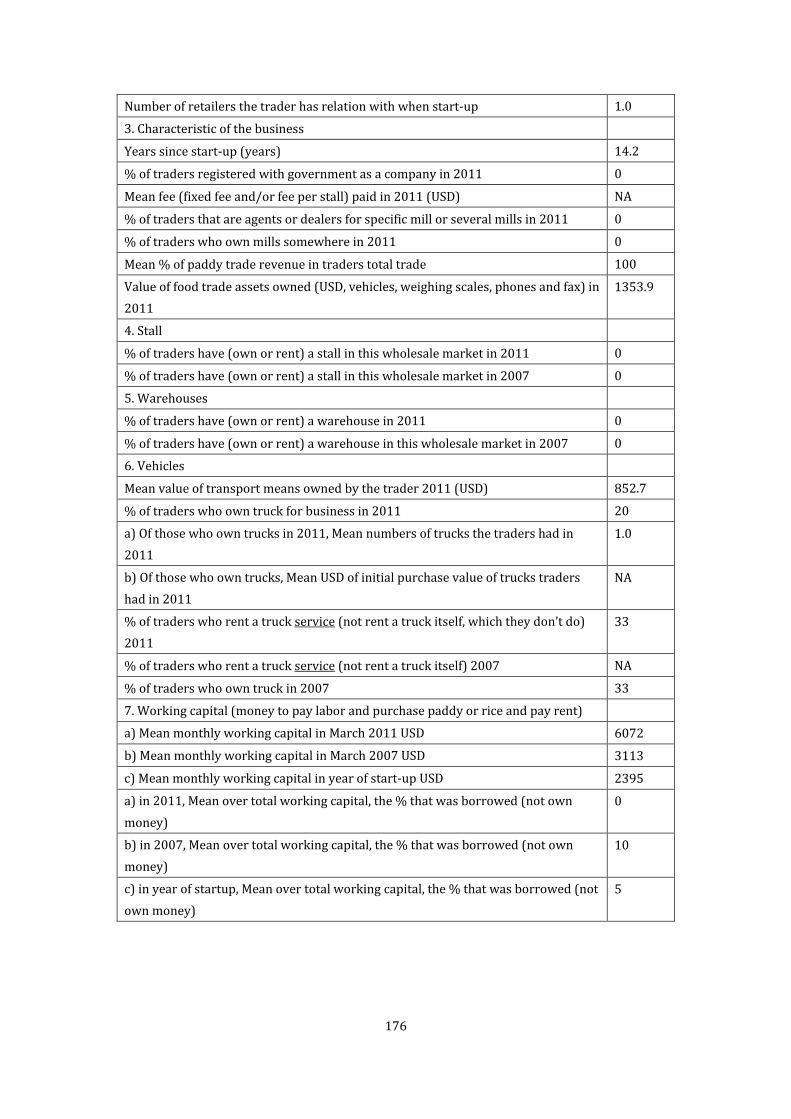
Number of retailers the trader has relation with when start-up 1.0
3. Characteristic of the business
Years since start-up (years) 14.2
% of traders registered with government as a company in 2011 0
Mean fee (fixed fee and/or fee per stall) paid in 2011 (USD) NA
% of traders that are agents or dealers for specific mill or several mills in 2011 0
% of traders who own mills somewhere in 2011 0
Mean % of paddy trade revenue in traders total trade 100
Value of food trade assets owned (USD, vehicles, weighing scales, phones and fax) in 2011
1353.9
4. Stall
% of traders have (own or rent) a stall in this wholesale market in 2011 0
% of traders have (own or rent) a stall in this wholesale market in 2007 0
5. Warehouses
% of traders have (own or rent) a warehouse in 2011 0
% of traders have (own or rent) a warehouse in this wholesale market in 2007 0
6. Vehicles
Mean value of transport means owned by the trader 2011 (USD) 852.7
% of traders who own truck for business in 2011 20
a) Of those who own trucks in 2011, Mean numbers of trucks the traders had in 2011
1.0
b) Of those who own trucks, Mean USD of initial purchase value of trucks traders had in 2011
NA
% of traders who rent a truck service (not rent a truck itself, which they don’t do) 2011
33
% of traders who rent a truck service (not rent a truck itself) 2007 NA
% of traders who own truck in 2007 33
7. Working capital (money to pay labor and purchase paddy or rice and pay rent)
a) Mean monthly working capital in March 2011 USD 6072
b) Mean monthly working capital in March 2007 USD 3113
c) Mean monthly working capital in year of start-up USD 2395
a) in 2011, Mean over total working capital, the % that was borrowed (not own money)
0
b) in 2007, Mean over total working capital, the % that was borrowed (not own money)
10
c) in year of startup, Mean over total working capital, the % that was borrowed (not own money)
5
176
4.4.1.2. Characteristics of urban rice traders Having covered the characteristics of rural paddy traders, we will now also discuss the characteristics of urban rice traders. Table 4.35.b shows characteristics of the urban rice traders in Zhejiang. Different from the rural traders, nearly half of these are women, and are somewhat more educated than the rural traders. Here, a third is in the local rice association. Note that the trader network they possess is substantial (some 17), and the mean number of retail clients, large (some 60). They also (as the rural traders did) started their enterprises around the end of the 1990s. Again, very few (only a tenth) are formal sector, registered with the government. But they pay a substantial fixed fee for their stalls in the wholesale market (2000 dollars a year). Very interestingly, fully 70% of them are agents for specific mills; this is similar to, even more extensive, than the finding in Beijing of the “mill – urban wholesale market” link via agents. But in Beijing the average agent served just 1-2 large mills; here the traders note they represent about a half dozen mills. A tenth of them just has their own mills and sells for those, and about two thirds of their sales are from their own mill. Interestingly, a quarter of the traders store rice for the government, for a fee, as the mills do. But the storage is on average modest, about 150 tons, a small warehouse worth; the fees collected for this just about offset the fees paid as wholesalers. Note that based on their assets (mainly their vehicle, as all their premises are rented), these urban traders are about 5 times larger than the rural traders. 70% own trucks, and of those who own, they own two on average. Few rent transport services. 90% rent (not own) a stall in the wholesale market. The outlay is substantial for the stall, around 7,000 dollars. About a third also rent a warehouse, nearly 500 sq feet worth. Again, the fee is substantial, around 6500 dollars a year. Interestingly, the share of traders renting a warehouse halved over five years. The monthly working capital is substantial – nearly 270,000 dollars - up from 170,000 dollars five years before, and way up from the 70,000 dollars a decade before. This shows rapid growth of the average trader’s business. That revolving fund was funded only 8-9% for the first decade of their businesses, but jumped up to 18% funding from borrowing in 2011. This may due to the fact that two-thirds of their clients pay them with delays of around three weeks in 2011, so they need loans to smooth their cash flow. Table 4.35.b. Characteristics of city rice wholesalers in Zhejiang Province
177

Table 4.36.a. shows characteristics of the paddy sold by rural traders. They sell all in bags, not loose. The purchase and selling price of (middle/late indica) are very close, hence the margin is extremely small: only a 6% difference. Note that for early indicate, we indicate “not available” because no early indica was transacted in March, 2012 by paddy traders. Table 4.36.a. Characteristics of paddy sold by village paddy traders in March 2012 (month before survey)
Sample size 9
Mean of how many kinds of paddy products the trader sold (early indica, middle or late indica)
2.2
1. Package information in March 2012
% of traders who sell loose (not bagged rice) 0
% of traders who sell in burlap bag 100
2. Price information in March 2012
2.1. Selling price
Mean selling price of middle & late indica (USD/ton) 426.3
Mean selling price of early indica (USD/ton) NA
2.2. Purchase price
Mean purchasing price of middle & late indica (USD/ton) 401.0
Mean purchasing price of early indica (USD/Kg) NA
Table 4.36.b shows the characteristics of the urban rice traders. Note that compared with the paddy traders’ two product types, the urban traders deal in nearly six (products differ over type of packaging (loose or packed, and size of package) and variety and origin (types of mills)). All sell packaged, and all sell only packaged rice. It is stunning that fully 77% of the types of rice are branded, all have the mill name, and even a third have the trader information. Thus, the branding is as dense as we found in Beijing, with the addition (not in Beijing) of the trader information. All the packages note “QS” which means above minimum safety level; note that regulation states that packaged rice must have “QS” certification noted on it in order to be legally sold. The certificate must be renewed each three years. Most of the bagging is just the coarse, tight-meshed plastic type, although there is also higher grade retail-oriented packaging of fine plastic. With respect to sales prices of the rice traders, several points are striking. (1) Even though middle/late indica is considered the highest quality local rice, japonica rice (from the north) fetches 42% more: and yet it is a rice type that is quickly climbing in popularity, as it did and does in the north. (2) Middle/late indica fetches a strong quality margin over early indica, 40% more. The hierarchy of quality is clear. Of course even beyond japonica is the fragrant rice
178

from Thailand (still very minor in volumes), fetching again nearly 40% above Japonica itself. (3) The gross margins for the rice traders are, as with the paddy traders, tiny (even smaller than for paddy traders) – only a 3% margin of the middle/late indica price (buy versus sell); luxury does not imply margins: it is just 1% on japonica. Table 4.36.b. Characteristics of all the rice sold by the traders in March 2012 (the month before survey)
Sample size 59
Mean of how many kinds of rice products the trader sold (products differ over type of packaging (loose or packed, and size of package) and variety and origin (types of mills)
5.6
1. Package information in March 2012
% of traders who sell loose (not packed/bagged rice) 0
% of traders who sell packaged 100
% of traders who sell packaged only (not loose) 100
% of types of rice sold by the trader with brand/Trademark on it 77
% of types of rice sold by the trader with mill name and address on it 99
% of types of rice sold by the trader with dealer’ information on it (note: might happen where japonica coming from north is via a dealer to this trader, for example)
32
% of types of rice with above minimum safety level standard (“QS”); noted on the package 100
Types of bags as mean of shares of types over traders (a-c add to 100)
a) % of types of rice with fine plastic vacuum bags 2
b) % of types of rice with fine non-vacuum plastic bags 23
c) % of types of rice with coarse plastic bags 75
Mean KG of the rice package in vacuum bags (KG/bag) 4.2
Mean KG of the rice package with fine plastic bags (KG/bag) 13.6
2. Price information in March 2012
2.1. Selling price
Mean selling price of japonica (USD/ton) 1008
Mean selling price of middle & late indica (USD/ton) 692
Mean selling price of early indica (USD/ton) 500
Mean selling price of fragrant rice from Thailand (USD/ton) 1376
Mean selling price of sticky rice (USD/ton) 710
2.2. Purchase price
Mean purchasing price of japonica (USD/ton) 996
Mean purchasing price of middle & late indica (USD/ton) 672
Mean purchasing price of early indica (USD/ton) 492
Mean purchasing price of fragrant rice from Thailand (USD/ton) 1242
Mean purchasing price of sticky rice (USD/ton) 694
179

4.4.1.3. Seasonality of the traders’ sales Now that we have detailed the characteristics of the rural and urban traders, we will examine the seasonality of the traders’ sales. Table 4.37 shows that even for urban rice traders, where one would expect the least seasonality, there is still fairly pronounced seasonality in volume traded, rising as one goes from the early and middle to late season. Table 4.37. Rice Traders Seasonality: Mean tons/month moved City
wholesaler
Sample size 57
March, 2012, early season 479
November, 2011 late season 571
August, 2011 middle season 467
March, 2007 early season 453
November, 2007 late season 556
4.4.2. Conduct: Procurement and Sales, Value-Chain Financing, and Other
4.4.2.1. Services of the Rice and Paddy Traders Our discussion of the conduct of rice and paddy traders will cover their procurement and sales, financing and other services offered. 4.4.2.2. Procurement and Sales Next in our discussion of paddy and rice trader conduct, we will examine paddy and rice trader procurement and sales. Table 4.38.a shows paddy procurement by rural traders. They bought paddy only in the local district. There was a sharp fall in the quality of paddy: there was a jump in the share of common paddy (in the traders’ purchases), and a fall in the share of fine paddy. This may be because traders pay a slightly lower price than mills for fine paddy: for late indica, the mill’s premium is 10% (over traders), but for early indica the prices are similar.
180

Table 4.38.a. Traders’ Paddy Procurement Sources (% of volume in the year) Time 2011 2007
Sample size 10 10
Share of traders that buy paddy 100 100
1. The location of the sources (% of total volume purchased)
a) In study district Shangrao in Jiangxi 100 100
b) in other areas of Jiangxi 0 0
c) in three study cities in Zhejiang (Quzhou, Wenzhou, Taizhou) 0 0
d) in other areas of Zhejiang 0 0
e) Jiangsu 0 0
f) Anhui 0 0
g) Northeast 0 0
h) Others (specify) 0 0
Total 100 100
2. % of common paddy purchased (% of volume purchased) 42 28
3. % of fine paddy purchased (% of volume purchased) 58 72
Table 4.38.b shows rice procurement by urban traders. Several points stand out. First, in sharp contrast to the local-focus of procurement by the paddy traders, the rice traders procure from far and wide. Only 7% is from Jiangxi province right next (to the west) to the cities. And that even dropped from 13% five years before. As much rice is bought by the traders in their own cities (keep in mind these are the urban areas plus the rural areas where paddy also produced) from mills and other traders. Very interesting is that so little is sourced from other areas of Zhejiang. Rather, the big sources for the rice are Jiangsu and Anhui (bordering Zhejiang on the northwest and north) (together 31%, up from 26% in 2007), the northeast (a key source of japonica rice), at 19 up from 12 % in 2007, and others, falling from 44 to 34%. Common rice rose from 63 to 75% over the five years; that is interesting in two ways: the share of common paddy in paddy sourcing is only 42%, so that it appears that a greater orientation toward common rice is being bought from the other provinces; the shift to common is slower in urban than rural, but the urban area traders source mainly common. Second, it is striking how concentrated the sources are over suppliers for common rice: large and medium mills supply more than 80% of the rice to traders five years ago and now. In a sense, concentration already has occurred as the share is nearly steady over five years, while the share of small mills is but 5%. Moreover, the share of the government reserves as a source of rice is strikingly low – only a tenth of the rice the traders buy; note that these reserves are put into the market via traders, so we are seeing here a reflection of the small importance of the rice reserves.
181

Third, even more striking is the very sharp concentration of supply of fine rice to urban traders – it nearly all from large mills (87%), and large and medium together run to 96%. Overall, it is clear that the cities are being fed rice by large mills, not small mills. And Zhejiang is being fed rice from an increasingly national rather than regional and certainly not local market. Table 4.38.b. Traders’ Rice Procurement Sources (% of volume in the year) Time 2011 2007
Sample size 52 52
Share of traders who sold any rice 100 100
1. The location of the sources (% of total volume purchased)
a) in Jiangxi 7 13
b) in three study cities in Zhejiang (Quzhou, Wenzhou, Taizhou) 7 4
c) in other areas of Zhejiang 1 1
d) Jiangsu 16 14
e) Anhui 15 12
f) Northeast 19 12
g) Others 34 44
Total 100 100
2. % of common rice in total rice purchased (% of volume purchased) 75 63
3. % of fine rice in total rice purchased (% of volume purchased) 25 37
4. Method of procurement (from whom purchased) for common rice (% of common rice volume purchased)
a) trader in wholesale market 1 1
b) trader outside wholesale market but in the city 0 0
c) Government agency (from reserves) 11 10
d) Large mill 56 61
e) Medium size mill 27 24
f) Small mill 5 4
g) Other (specify) 0 0
Total 100 100
5. Method of procurement (from whom purchased) for fine rice (% of fine rice volume purchased)
a) trader in wholesale market 1 1
Table 4.39.a shows that paddy traders do not just source locally, they also sell locally, two-thirds in Shangrao itself, and the rest in other parts of Jiangxi. They are not taking their paddy to mills in Zhejiang. The buyers from the paddy
182

traders are for two-thirds of the paddy sold, both in 2007 and 2011, large and medium mills; it is fascinating that small mills are not among their buyers. Also, the government reserves are very important – 40% of the volume of common paddy sold. The picture is very different for fine paddy – 85% goes to the large and medium mills, while a mere 14% goes to the rice reserves of the government. Note very importantly the big difference between the importance of government rice reserves from local paddy traders in Jiangxi, and the purchases and sales of the rice from traders in Zhejiang, where government reserves play a far smaller role; this appears to indicate that the poorer quality (early indica) rice from Jiangxi is going more to the government reserves than is rice from other seasons. Table 4.39.a. Traders’ Paddy Sales Destinations (% of volume in the year) Time 2011 2007
Sample size 8 8
Share of traders that sell paddy 100 100
1. The location of the destinations (% of total volume sold)
a) in study district Shangrao in Jiangxi 65 57
b) in other areas of Jiangxi 34 43
c ) in Zhejiang 0 0
d) Others (specify) 0 0
Total 100 100
2. % of common paddy sold (% of volume sold) 42 28
3. % of fine paddy sold (% of volume sold) 58 72
4. Method of sale (to whom sold) for common paddy (% of common paddy volume sold)
a) village traders 0 0
b) traders in urban wholesale market 0 0
c) traders off-market in urban areas 0 0
d) large mills 44 23
e) middle mills 25 40
f) small mills 0 0
g) government rice reserve 40 37
h) other 0 0
Total 100 100
5. Method of sale (to whom sold) for fine paddy (% of fine paddy volume sold)
a) village traders 0 0
b) traders in urban wholesale market 0 0
c) traders off-market in urban areas 0 0
d) large mills 57 46
e) middle mills 28 49
183

f) small mills 1 0
g) government rice reserve 14 5
h) other 0 0
Total 100 100
Table 4.39.b shows rice sales by traders in urban Zhejiang. Not surprisingly, nearly all their rice was sold in the cities in which we found them. Interestingly, the share of fine rice in total is climbing, from half to two-thirds over the 5 years, with common rice now just a third of their offer. Given the opposite trend among Jiangxi rural paddy traders, this seems to corroborate that the urban traders are getting their fine rice increasingly from the other provinces. For common rice (a third of their offer), traders are selling their rice decreasingly but still in majority to traditional retailers (from 47% in 2007 dropping to 43% in 2011), while HORECA climbed from 22 to 25, and modern retail and noodle processors each had about 10% of the rice traders’ offer. For fine rice (two-thirds of their offer), it is striking how little they are selling to traditional retailers – only 35%. The share to modern retailers jumped from 6 to 16% of their offer over the past five years; that is still under what we expected, but could be accounted for by larger supermarket chains buying direct from larger mills (if they do the same as in Beijing, as we found in the prior survey). None of the fine rice is sold to noodle factories, as expected. Again, HORECA is about a seventh of their offer – but dropping as supermarkets rise as their product destination. Table 4.39.b. Traders’ Rice Sales Destinations (% of volume in the year) Time 2011 2007
Sample size 59 37
Share of traders who sold any rice 100 82
1. The location of the destinations (% of total volume sold)
a) in Jiangxi 2 0
b) in three study cities in Zhejiang (Quzhou, Wenzhou, Taizhou) 93 92
c) in other areas of Zhejiang 6 7
d) Jiangsu 0 0
e) Anhui 0 0
f) Northeast 0 0
g) Others 1 1
Total 100 100
2. % of common rice in total rice sold (% of volume sold) 33 44
3. % of fine rice in total rice sold (% of volume sold) 67 56
184

4. Method of sale (to whom sold) for common rice (% of common rice volume sold)
a) trader on wholesale market 1 1
b) trader off-market urban 10 7
c) government agencies 0 0
d) traditional retailer 43 47
e) modern retailer 9 10
f) processors of noodles and other processed food 10 10
g) hotel, restaurants, institutions 25 22
h) consumer directly 3 3
Total 100 100
5. Method of marketing (to whom sell) for fine rice ( % of fine rice volume sold)
a) trader on wholesale market 16 13
b) trader off-market urban 14 18
c) government agencies 1 1
d) traditional retailer 35 32
e) modern retailer 16 6
f) processors of noodles and other processed food 0 0
g) hotel, restaurants, institutions 15 21
h) consumer directly 4 10
Total 100 100
4.4.2.2. Rice and Paddy Traders and Value-Chain Finance Having covered paddy and rice trader procurement and sales, we now move on to an examination of traders and value-chain finance. On the one hand, in contrast to conventional wisdom that has traders giving credit (through advances) to farmers, once again (as we also found in the study in Heilongjiang, see Reardon et al. 2012a) we find that nowadays few traders actually do this: in the Jiangxi study area, only 10% of the paddy traders give advances to the farmers. By contrast, a third of traders pay farmers with a delay (albeit only one week). On the other hand, the traders’ clients (mainly the mills) do not pay advances to them. By contrast, all the traders were paid with a delay by their clients – but again, only about a week (a transaction cycle).
185

Table 4.40.a. Paddy traders' use of credit Sample size 10
1. Payment to supplier (farmers, mills)
% of traders who pay advance to suppliers (pay some money before getting the paddy/rice)
10
If provide advance, mean days before the transaction (N=subset of traders paying advance) (day)
12
% of traders who pay with delay to suppliers (pay for rice/paddy after receive it) 30
If pay with delay, mean days delayed after the transaction (day) 8.3
% of traders pay in cash (rather than in check) to suppliers 100
% of traders pay by transfer accounts or check to suppliers 0
2. Payment from the clients
% of traders whose clients pay advance to those traders 0
% of traders whose clients pay with delay to traders 100
For traders having clients paying with delay, mean days delayed after the transaction (day)
7.9
% of traders get paid in cash by clients (instead of check or transfer) 100
% of traders get paid through transfer accounts or check 0
Table 4.40.b. shows rice traders’ use of credit. Recall that they mainly buy direct from mills. Only 23% of the traders give advances to the mills; again, the advance is for a short time, the usual week of the transaction cycle. By contrast, 40% of traders pay mills with a delay, again only about a week. Interestingly, the great majority of payments to suppliers are made by bank transfer, not cash. The array of clients of the traders very seldom pays advances to the traders (only 5%). Yet two-thirds of their clients pay them with delays – and this time, quite substantial (some three weeks). This implies the need for these traders to have financial security to weather these long waits. Traders are usually paid in cas
Table 4.40.b. Rice traders' use of credit Sample size 60
1. Payment to supplier (farmers, mills)
% of traders who pay advance to suppliers (pay some money before getting the rice)
23
If provide advance, mean days before the transaction (day) 6.9
% of traders who pay with delay to suppliers (pay for rice/paddy after receive it) 40
If pay with delay, mean days delayed after the transaction (day) 9.7
% of traders pay in cash (rather than in check) to suppliers 27
% of traders pay by transfer accounts or check to suppliers 78
186

2. Payment from the clients
% of traders whose clients pay advance to those traders 5
If received advance from clients, mean days before the transaction (day) 1.4
% of traders whose clients pay with delay to traders 68
For traders having clients paying with delay, mean days delayed after the transaction (day)
21.5
% of traders get paid in cash by clients (instead of check or transfer) 93
% of traders get paid through transfer accounts or check 47
Few traders took loans, and only half of those (10% in all) were for buying paddy. All the loans were from informal sources, none from banks. Table 4.41.a. Loans taken by village paddy traders in 2011
Sample size 10
% of traders took loan in 2011 20
% of traders borrowed for paddy purchase 10
Sources of the loans (among subset of traders who borrowed)
a) % of traders borrowed from agricultural development bank 0
b) % of traders borrowed from rural credit cooperative 0
c) % of traders borrowed from commercial banks 0
d) % of traders borrowed from informal sources 100
For those borrowing from informal sources ((d) above) characteristics of loans (n= subset)
a) time period of loan (month) 6.3
b) interest rate per month (%/month) 0
c) % of traders asked to give collateral/pledge or guarantee 0
d) Mean days took to go through the procedures to get the loan (day) 1.7
By contrast, more than a third of urban traders took loans (although only a third of those were for paddy or rice purchase). The amounts were substantial,if delete the largest 2 figures, the averaged figure is 61,979 USD. A surprising share was from commercial banks (40%); the great majority had to pledge collateral; however, the procedure was fast, just a few weeks.
187
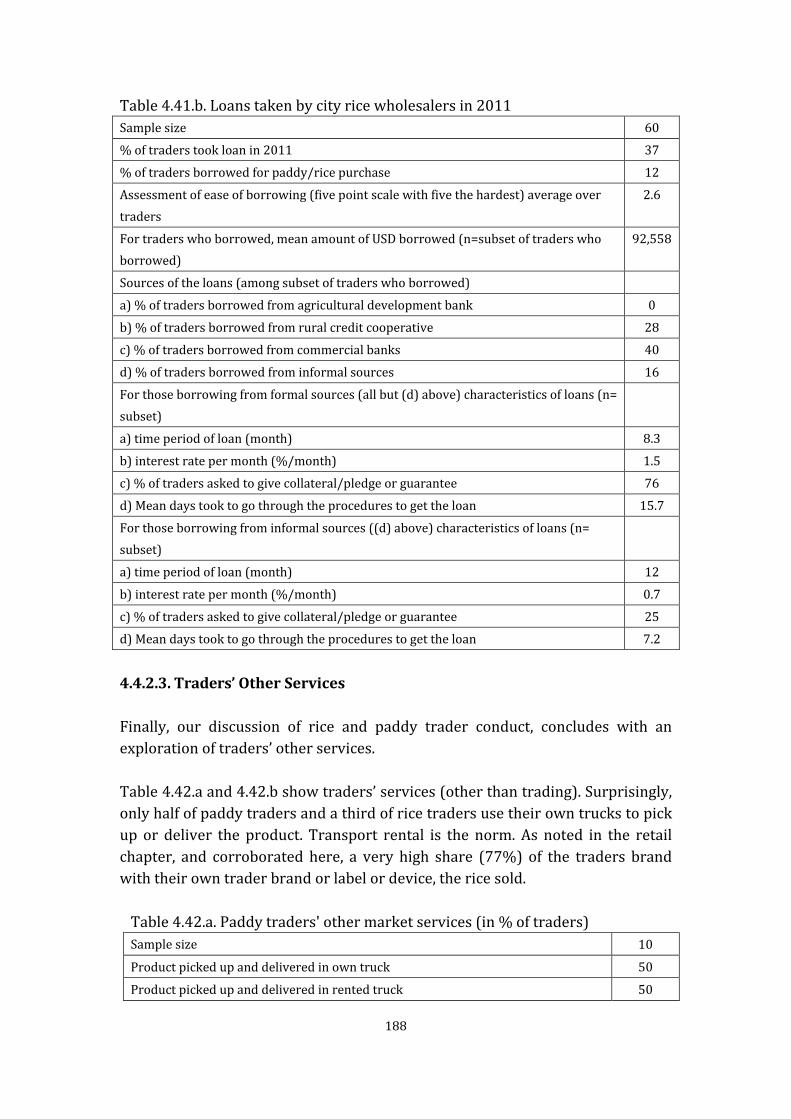
Table 4.41.b. Loans taken by city rice wholesalers in 2011 Sample size 60
% of traders took loan in 2011 37
% of traders borrowed for paddy/rice purchase 12
Assessment of ease of borrowing (five point scale with five the hardest) average over traders
2.6
For traders who borrowed, mean amount of USD borrowed (n=subset of traders who borrowed)
92,558
Sources of the loans (among subset of traders who borrowed)
a) % of traders borrowed from agricultural development bank 0
b) % of traders borrowed from rural credit cooperative 28
c) % of traders borrowed from commercial banks 40
d) % of traders borrowed from informal sources 16
For those borrowing from formal sources (all but (d) above) characteristics of loans (n= subset)
a) time period of loan (month) 8.3
b) interest rate per month (%/month) 1.5
c) % of traders asked to give collateral/pledge or guarantee 76
d) Mean days took to go through the procedures to get the loan 15.7
For those borrowing from informal sources ((d) above) characteristics of loans (n= subset)
a) time period of loan (month) 12
b) interest rate per month (%/month) 0.7
c) % of traders asked to give collateral/pledge or guarantee 25
d) Mean days took to go through the procedures to get the loan 7.2
4.4.2.3. Traders’ Other Services Finally, our discussion of rice and paddy trader conduct, concludes with an exploration of traders’ other services. Table 4.42.a and 4.42.b show traders’ services (other than trading). Surprisingly, only half of paddy traders and a third of rice traders use their own trucks to pick up or deliver the product. Transport rental is the norm. As noted in the retail chapter, and corroborated here, a very high share (77%) of the traders brand with their own trader brand or label or device, the rice sold.
Table 4.42.a. Paddy traders' other market services (in % of traders) Sample size 10
Product picked up and delivered in own truck 50
Product picked up and delivered in rented truck 50
188
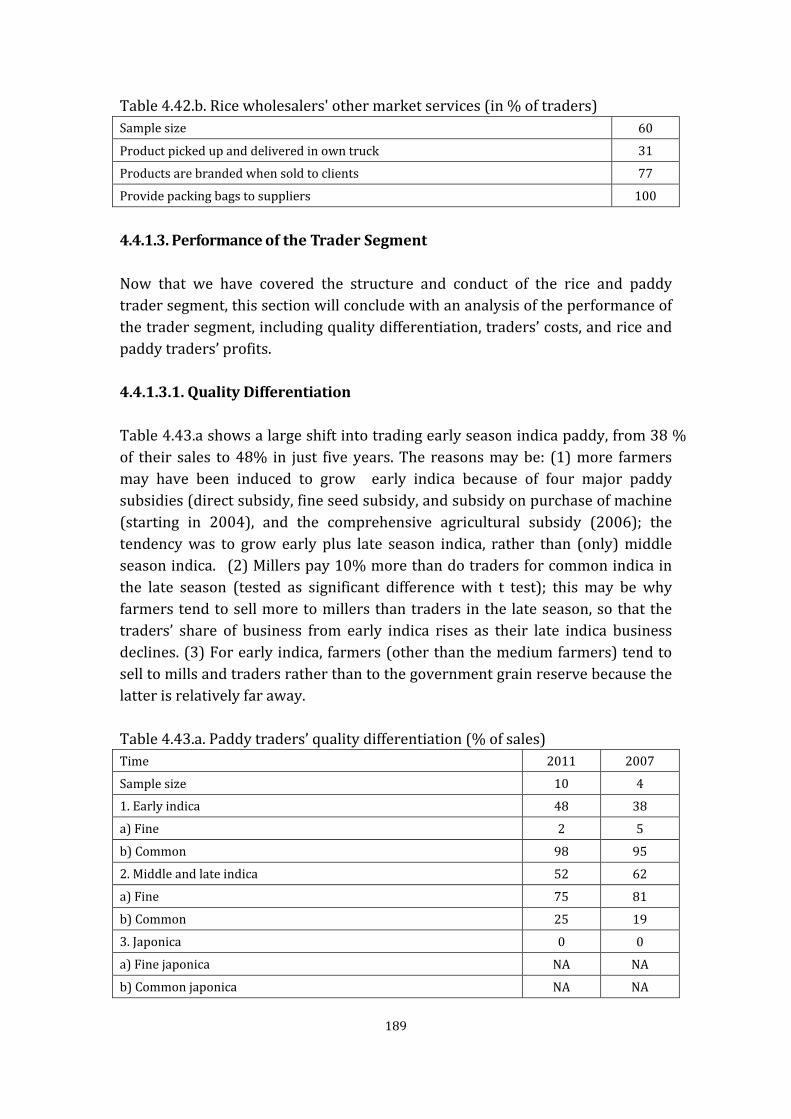
Table 4.42.b. Rice wholesalers' other market services (in % of traders) Sample size 60
Product picked up and delivered in own truck 31
Products are branded when sold to clients 77
Provide packing bags to suppliers 100
4.4.1.3. Performance of the Trader Segment Now that we have covered the structure and conduct of the rice and paddy trader segment, this section will conclude with an analysis of the performance of the trader segment, including quality differentiation, traders’ costs, and rice and paddy traders’ profits. 4.4.1.3.1. Quality Differentiation Table 4.43.a shows a large shift into trading early season indica paddy, from 38 % of their sales to 48% in just five years. The reasons may be: (1) more farmers may have been induced to grow early indica because of four major paddy subsidies (direct subsidy, fine seed subsidy, and subsidy on purchase of machine (starting in 2004), and the comprehensive agricultural subsidy (2006); the tendency was to grow early plus late season indica, rather than (only) middle season indica. (2) Millers pay 10% more than do traders for common indica in the late season (tested as significant difference with t test); this may be why farmers tend to sell more to millers than traders in the late season, so that the traders’ share of business from early indica rises as their late indica business declines. (3) For early indica, farmers (other than the medium farmers) tend to sell to mills and traders rather than to the government grain reserve because the latter is relatively far away. Table 4.43.a. Paddy traders’ quality differentiation (% of sales) Time 2011 2007
Sample size 10 4
1. Early indica 48 38
a) Fine 2 5
b) Common 98 95
2. Middle and late indica 52 62
a) Fine 75 81
b) Common 25 19
3. Japonica 0 0
a) Fine japonica NA NA
b) Common japonica NA NA
189
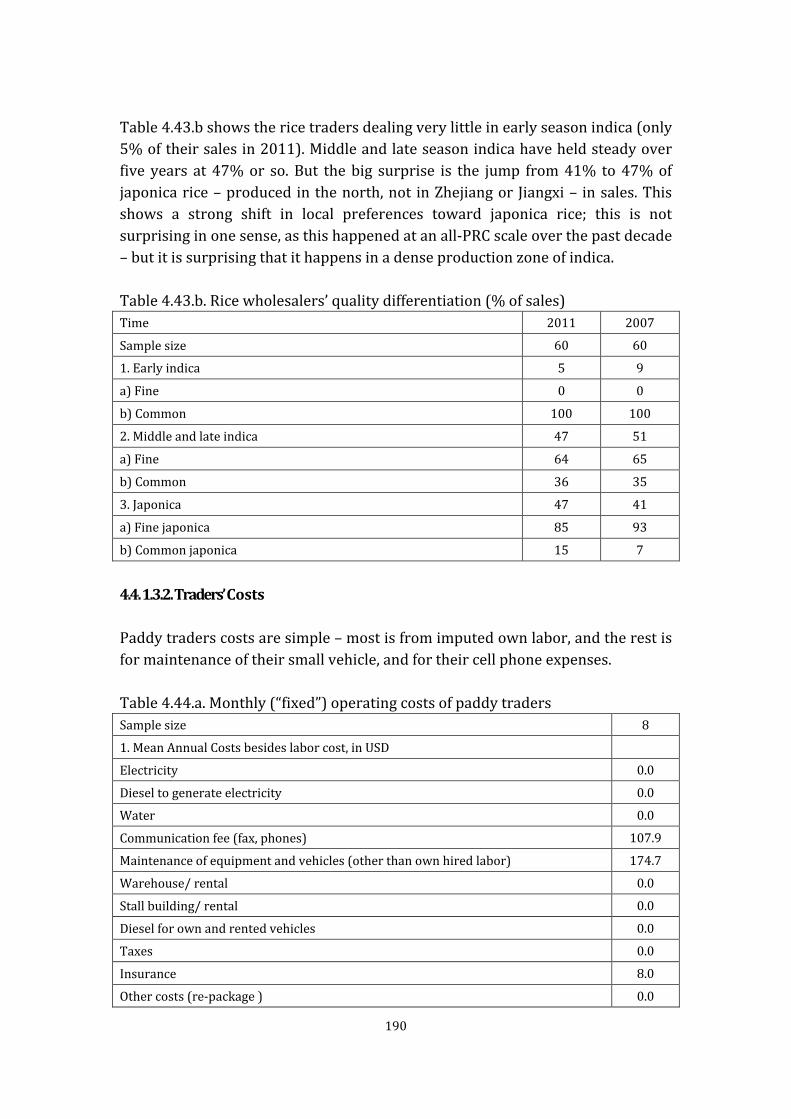
Table 4.43.b shows the rice traders dealing very little in early season indica (only 5% of their sales in 2011). Middle and late season indica have held steady over five years at 47% or so. But the big surprise is the jump from 41% to 47% of japonica rice – produced in the north, not in Zhejiang or Jiangxi – in sales. This shows a strong shift in local preferences toward japonica rice; this is not surprising in one sense, as this happened at an all-PRC scale over the past decade – but it is surprising that it happens in a dense production zone of indica. Table 4.43.b. Rice wholesalers’ quality differentiation (% of sales) Time 2011 2007
Sample size 60 60
1. Early indica 5 9
a) Fine 0 0
b) Common 100 100
2. Middle and late indica 47 51
a) Fine 64 65
b) Common 36 35
3. Japonica 47 41
a) Fine japonica 85 93
b) Common japonica 15 7
4.4. 1.3.2. Traders’ Costs Paddy traders costs are simple – most is from imputed own labor, and the rest is for maintenance of their small vehicle, and for their cell phone expenses. Table 4.44.a. Monthly (“fixed”) operating costs of paddy traders Sample size 8
1. Mean Annual Costs besides labor cost, in USD
Electricity 0.0
Diesel to generate electricity 0.0
Water 0.0
Communication fee (fax, phones) 107.9
Maintenance of equipment and vehicles (other than own hired labor) 174.7
Warehouse/ rental 0.0
Stall building/ rental 0.0
Diesel for own and rented vehicles 0.0
Taxes 0.0
Insurance 8.0
Other costs (re-package ) 0.0
190

2. Labor cost in USD
Own labor imputed at market wage 429.3
Hired temporary workers 12.2
Long-term employees 0.0
administrative staff 0.0
Drivers 0.0
Yearly costs for rice traders in urban areas are vastly greater and more complex than for rural paddy traders. Their costs run some 90,000 USD per year – of which only 12,000 is for their own (imputed) labor. Roughly (rounding) 50,000 is for hired labor, some 60% of their costs. Another 7000 (of which 6000 is fuel) is for transport, 10,000 for warehouse/stalls, 3000 for taxes/insurance, and 2000 for energy for the stall, and a thousand for communications. Thus labor, then buildings, then energy (for stalls and transport), are their main costs. Table 4.44.b. Yearly (“fixed”) operating costs of rice wholesalers in 2011 Sample size 60
1. Mean Annual Costs besides labor cost, in USD
Electricity 1867.1
Diesel to generate electricity 105.4
Water 143.4
Communication fee (fax, phones) 857.2
Maintenance of equipment and vehicles (other than own hired labor) 1161.4
Warehouse/ rental 5284.0
Stall building/ rental 3595.4
Diesel for own and rented vehicles 5557.6
Taxes 1290.6
Insurance 1927.5
Other costs (re-package ) 40.0
2. Labor cost in USD
Own labor imputed at market wage 11838.1
Hired temporary workers 25362.1
Long-term employees 8916.5
Administrative staff 6567.8
Drivers 10531.0
The majority of costs of both buying and selling paddy are about half to labor and half to transport, with a large part of the latter to energy and to rental of the vehicle.
191

Table 4.45.aVariable costs paddy village traders in last transaction in USD/ton Sample size 10
1. Last transaction of paddy purchasing
1.1. costs
a) Cost of the bags 0.0
b) Bagging and stitching costs of labor 0.0
c) Loading and unloading labor costs ( fees or own costs) 1.4
d) Weighing fees (costs) paid to market 0.0
e) Own transport costs of paddy (fuel + labor for your own vehicle) 0.4
f) Cost of hired transportation of the paddy 1.0
g) Cost of personal transportation of the trader (separate from paddy transport) 0.0
h) Imputed cost of quantity wasted (physical waste in kg * paddy price) 0.1
i) Total cost for the transaction in USD 21.7
j) Total cost in USD per ton for the transaction 3.0
1.2. Other information on the transaction
a) Distance in time from the supplier to the trader (hour) 1.3
b) Distance in km from the supplier (km) 23.9
c) % of traders uses phone calls for the transaction 80
2. Paddy selling
2.1. costs in USD
a) Cost of the bags 0.0
b) Bagging and stitching costs of labor 0.0
c) Loading and unloading labor costs ( fees or own costs) 1.0
d) Weighing fees (costs) paid to market 0.0
e) Own transport costs of paddy (fuel + labor for your own vehicle) 0.2
f) Cost of hired transportation of the paddy 0.9
g) Cost of personal transportation of the trader (separate from paddy transport) 0.0
h) Imputed cost of quantity wasted (physical waste in kg * paddy price) 0.0
i) Total cost for the transaction in USD 30.0
j) Total cost in USD per ton for the transaction 2.3
2.2. Other information on the transaction
a) Distance in time from the supplier to the trader (hour) 1.7
b) Distance in km from the supplier (km) 15.0
c) % of traders uses phone calls for the transaction 100
The information on the last transaction of rice traders yields interesting insights. The first point is that again most of the cost is from transport, as expected. The second point is that the variable cost of the last transaction in terms of transactions is 11 USD/ton, buying from almost 900 km away; by contrast, the sales transaction for this rice costs only 7 USD/ton, but is delivered only 41 km.
192
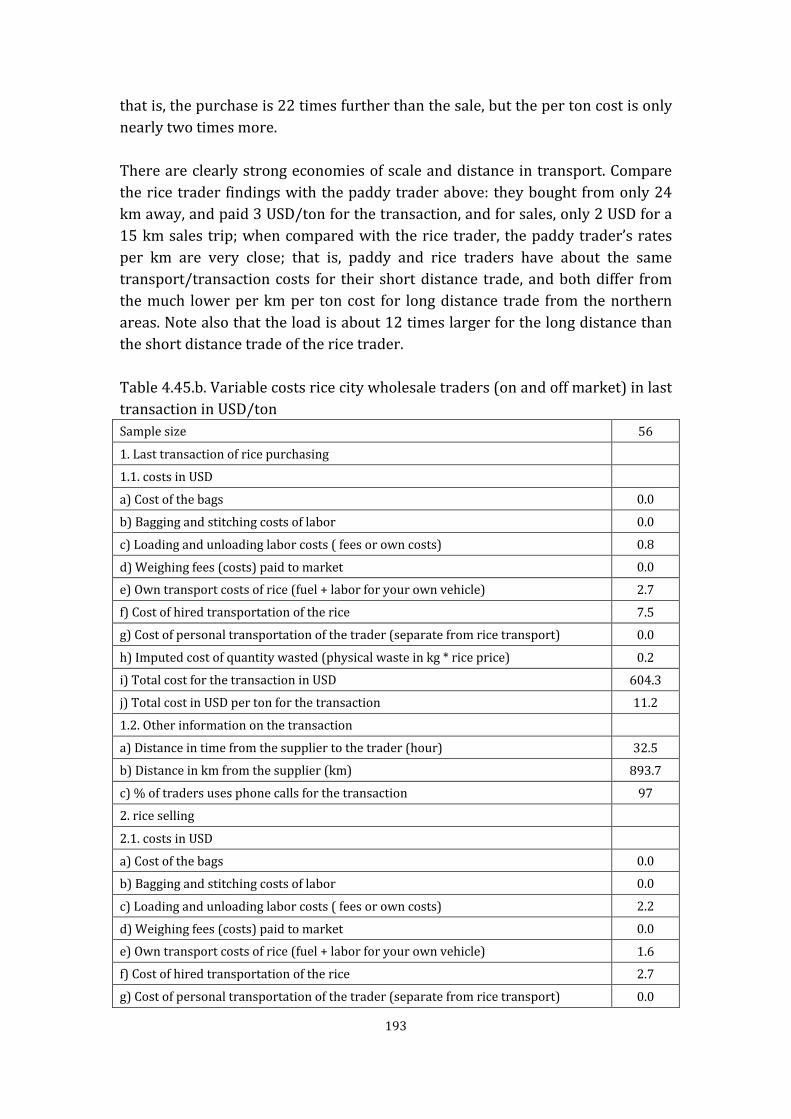
that is, the purchase is 22 times further than the sale, but the per ton cost is only nearly two times more. There are clearly strong economies of scale and distance in transport. Compare the rice trader findings with the paddy trader above: they bought from only 24 km away, and paid 3 USD/ton for the transaction, and for sales, only 2 USD for a 15 km sales trip; when compared with the rice trader, the paddy trader’s rates per km are very close; that is, paddy and rice traders have about the same transport/transaction costs for their short distance trade, and both differ from the much lower per km per ton cost for long distance trade from the northern areas. Note also that the load is about 12 times larger for the long distance than the short distance trade of the rice trader. Table 4.45.b. Variable costs rice city wholesale traders (on and off market) in last transaction in USD/ton Sample size 56
1. Last transaction of rice purchasing
1.1. costs in USD
a) Cost of the bags 0.0
b) Bagging and stitching costs of labor 0.0
c) Loading and unloading labor costs ( fees or own costs) 0.8
d) Weighing fees (costs) paid to market 0.0
e) Own transport costs of rice (fuel + labor for your own vehicle) 2.7
f) Cost of hired transportation of the rice 7.5
g) Cost of personal transportation of the trader (separate from rice transport) 0.0
h) Imputed cost of quantity wasted (physical waste in kg * rice price) 0.2
i) Total cost for the transaction in USD 604.3
j) Total cost in USD per ton for the transaction 11.2
1.2. Other information on the transaction
a) Distance in time from the supplier to the trader (hour) 32.5
b) Distance in km from the supplier (km) 893.7
c) % of traders uses phone calls for the transaction 97
2. rice selling
2.1. costs in USD
a) Cost of the bags 0.0
b) Bagging and stitching costs of labor 0.0
c) Loading and unloading labor costs ( fees or own costs) 2.2
d) Weighing fees (costs) paid to market 0.0
e) Own transport costs of rice (fuel + labor for your own vehicle) 1.6
f) Cost of hired transportation of the rice 2.7
g) Cost of personal transportation of the trader (separate from rice transport) 0.0
193

h) Imputed cost of quantity wasted (physical waste in kg * rice price) 0.1
i) Total cost for the transaction in USD 49.5
j) Total cost in USD per ton for the transaction 6.6
1.2. Other information on the transaction
a) Distance in time from the supplier to the trader (hour) 1.7
b) Distance in km from the supplier (km) 41.1
c) % of traders uses phone calls for the transaction 95
4.4.1.3.3. Rice and Paddy Traders’ Profits The profit rate – gross of amortization as that is not netted out here so these are overestimates of the profit rate – averages about 60% for paddy and 50% for rice. These profit rates are a little above the urban rice trader profit rate of 40% in Beijing and rural paddy traders profit rates of nearly 50% in Bangladesh shown in Reardon et al. (2012a). These seem to be high rates, but are similar to the range found by IFPRI survey in Bangladesh reported in the early 1990s; the figures are high because of return to risk bearing, and that the figures are also gross of amortization in a situation where capital costs from transport are high: Chowdhury (1992), using mill survey data collected by the International Food Policy Research Institute in 1989/90, found trader profit rates of 35%–61%, depending on the type of zone. Table 4.46.a.Paddy Traders' Profit Rates (in %) in 2011 Profit rate = 100 {1- (Total costs*/ absolute margin**); *Total costs= operational costs + marketing costs ; **Absolute margin= Sales price- Purchase price
Sample size 10
1. Early indica 63
a) Fine 48
b) Common 64
2. Middle and late indica 57
a) Fine 61
b) Common 59
All paddy 60
Table 4.46.b. Rice wholesalers' Profit Rates (in %) in 2011 Profit rate = 100 {1- (Total costs*/ absolute margin**); *Total costs= operational costs + marketing costs ; **Absolute margin= Sales price- Purchase price
Sample size 60
1. Early indica -22
a) Fine NA
b) Common -22
194

2. Middle and late indica 57
a) Fine 27
b) Common 76
3. Japonica 44
a) Fine 48
b) Common 27
All rice 50
4.5. Downstream—Rice Retail Transformation
Our analysis of the downstream segment will cover the structure, conduct, and performance of traditional rice retail, as well as the rise of modern food retail in Zhejiang.
4.5.1. Structure of Traditional Rice Retail
Table 4.47 shows characteristics of traditional rice retailers in the study cities in Zhejiang. Several points stand out. The average age is middle aged, and most are born in that city; but interestingly, half are women; that differs from findings in Beijing in the prior study (Reardon et al. 2012) and from other study countries, Viet Nam and India. They have few “social capital relations” in government or in the mill segment, but they tend to have relations and network with traders, a network that is on average, expanding. The businesses are fairly “young”, nearly only a decade on average. Nearly all sell other food products (beside rice), so, contrary to expectations (and the case of Beijing) they are not rice-specialized shops. Interestingly, very few (1%) are “formal sector”, registered with the government. They pay a moderate yearly fee for their stall. The rice wholesale market (which we will show as their source of rice to retail) is very near, only 6 km – as is their competition, the supermarket, at only a half km on average, and even closer, the competition from other traditional retailers in their wet-market, where there averages some 5 others competing with them. Table 4.47. Characteristics of traditional rice retailers 1. Demography of the retailer
Mean age of retailers (years) n=239 43.0
Gender of retailers (% male) n=239 49.4
% of retailers born locally (in that urban city) n=239 79
% of retailers who are Buddhists n=234 9
2. Human and Social Capital
Mean years of education (years) n=238 8.1
% of retailers are CPC members in 2011 7
195

Number of millers the retailer has relation with in 2011 n=121 0.5
Number of millers the retailer has relation with in 2007 n=74 0.8
Number of millers the retailer has relation with when start-up n=109 0.3
Number of traders the retailer has relation with in 2011 n=118 5.2
Number of traders the retailer has relation with in 2007 n=72 3.2
Number of traders the retailer has relation with when start-up n=106 1.7
3. Characteristic of the business
Years since start-up retail business of food products (years) n=94 9.1
Years since start-up rice retail business (years) n=118 8.9
% of retailers also sell other food products in 2011 n=121 93
% of retailers registered with government as a company in 2011 n=130 1
Mean fee (sales tax (yearly) and/or stall tax) paid in 2011 ( USD) n=106 255.0
% of retailers who store rice subsidized by government to keep a certain amount of rice in their warehouse as part of government reserve policy in 2011 n=127
0
The nearest rice wholesale market (km) n=129 5.8
The nearest supermarket that sells rice (km) n=127 0.5
Mean number of retailers in the same wet market in 2011 n=84 4.8
Mean number of retailers in the same wet market you sold rice in 2007 n=68 4.5
Table 4.48 shows labor and capital stocks of the traditional rice retailer. As usual, the retail firms are small and mainly family operated. There are modest assets, mainly small vehicles, a scale, phones, and a small storage space and small stall space. Working capital is likewise modest, at a mere 800 dollars per month, which works out to only about 25-30 dollars a day, or a few hundred per week for the cycling of a small inventory. Note that on average the small enterprises are, however, growing, as can be seen from the expansion of working capital. Importantly, these micro enterprises are not relying on banks or any lenders for working capital, as the low share of borrowing shows. Table 4.48. Labor and Capital Stocks per traditional rice retailer in 2011 Mean number of family members working in the business n=124 1.9
Mean amount spent on hired labor per month in USD: n=133 144.6
Retail assets in USD in 2011 (vehicles only ; other assets we did not value ) n=112 1559.8
Number of scales in 2011 n=133 1.1
Number of scales in 2007 n=93 1.0
Number of phones in 2011 n=133 2.2
Number of phones in 2007 n=93 2.0
Mean Square meters of warehouse space in 2011 n=133 30.4
Mean Square meters of warehouse space in 2007 n=93 36.9
Retail assets in USD in 2007 (vehicles ONLY; other assets we did not value) n=90 1001.1
Mean Square meters of stall/s space in 2011 n=130 44.9
196

Mean Square meters of stall/s space in 2007 n=90 41.2
Working capital (to buy rice and pay for hired labor and rental fee) per month
Mean working capital in 2011 in USD n=120 837.2
Mean working capital in 2007 in USD n=83 651.2
Mean working capital when start-up in USD n=102 372.1
Mean % of the working capital borrowed, in 2011 6
Mean % of the working capital borrowed, in 2007 10
Mean % of the working capital borrowed, during start-up year 13
4.5.2. Conduct of Traditional Rice Retail
Our discussion of the conduct of traditional rice retail will feature the exploration of rice sales transactions and rice purchase methods of traditional rice retailers. 4.5.2.1. Rice sales transactions Table 4.49 corroborates the small size of the enterprise, as noted above. Table 4.49. Sales of Traditional Rice Retailers (Means over retailers)
Sales per day (KG) n=126 309.5
Size of the last transaction’s lot (full lot bought and then retailed) (KG) n=116 598.2
Table 4.50 shows that most small retailers deliver to homes, and for about half their clients (apparently mainly the “regular” ones as the shares coincide). The figures work out to about 40% of all customers of traditional rice retailers in these cities getting home delivery; this is somewhat higher than the share our prior study found in Beijing. Table 4.50. Traditional rice retailers home delivery, N=136 % of retailers that home-deliver n=110 81
Of those that home-deliver, % of turnover of the traditional rice retailers that goes to home delivery n=104
55
Of those that home deliver, share that report that customer pays more for home delivery (% yes)
1
Characteristics (averaged over retailers who home deliver) of the clients who get home deliver n=103 (%)
a) share that are elderly 14
b) share that are group customers (buying in large quantity) 4
c) share of customers live nearby 11
d) share of “regular” customers 56
197
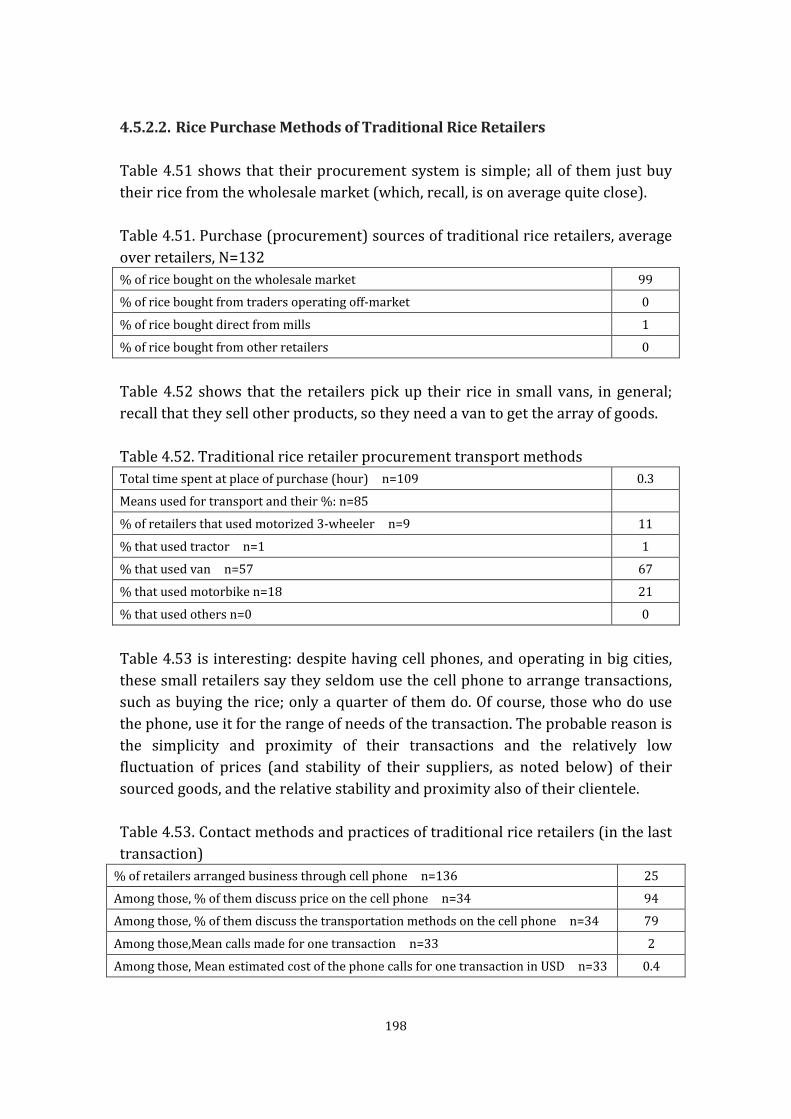
4.5.2.2. Rice Purchase Methods of Traditional Rice Retailers Table 4.51 shows that their procurement system is simple; all of them just buy their rice from the wholesale market (which, recall, is on average quite close). Table 4.51. Purchase (procurement) sources of traditional rice retailers, average over retailers, N=132 % of rice bought on the wholesale market 99
% of rice bought from traders operating off-market 0
% of rice bought direct from mills 1
% of rice bought from other retailers 0
Table 4.52 shows that the retailers pick up their rice in small vans, in general; recall that they sell other products, so they need a van to get the array of goods. Table 4.52. Traditional rice retailer procurement transport methods Total time spent at place of purchase (hour) n=109 0.3
Means used for transport and their %: n=85
% of retailers that used motorized 3-wheeler n=9 11
% that used tractor n=1 1
% that used van n=57 67
% that used motorbike n=18 21
% that used others n=0 0
Table 4.53 is interesting: despite having cell phones, and operating in big cities, these small retailers say they seldom use the cell phone to arrange transactions, such as buying the rice; only a quarter of them do. Of course, those who do use the phone, use it for the range of needs of the transaction. The probable reason is the simplicity and proximity of their transactions and the relatively low fluctuation of prices (and stability of their suppliers, as noted below) of their sourced goods, and the relative stability and proximity also of their clientele. Table 4.53. Contact methods and practices of traditional rice retailers (in the last transaction)
% of retailers arranged business through cell phone n=136 25
Among those, % of them discuss price on the cell phone n=34 94
Among those, % of them discuss the transportation methods on the cell phone n=34 79
Among those,Mean calls made for one transaction n=33 2
Among those, Mean estimated cost of the phone calls for one transaction in USD n=33 0.4
198

Table 4.54 shows that the retailers have relied for most of the life of their business on their regular rice trader. They chose him/her mainly for price and quality; note that value chain finance (from the trader) figures only very slightly in the decision, which might be because the transaction size is so small. Table 4.54. Frequency of traditional retailers’ buying from a seller and reasons for choice of seller (percentages) (most general type of transaction) Years buying from supplier(= 2011 minus the year started buying from this seller) (year) n=128
6.5
Retailer’s reason for buying from this seller, % saying this reason “important”
Always has large quantities 38
Offers better prices 65
Offers higher quality 52
Allows retailer to buy on credit (pay supplier later) 5
Offers loans in case of need (marriage, sickness) 1
Just from habit retailer goes to him 44
Organizes transactions quickly and retailer loses little time 35
Table 4.55 shows that most retailers felt they knew the weight of the rice bag from the trader, and most worked with traders who use electronic scales. Table 4.55. Traditional rice retailers, information, and quantity: assessment of last transaction (% of retailers) Had enough information on quantity of produce in the lot, before buying n=135 5
Knew the exact weight of the lot n=136 62
Lot weighed in front of them n=82 18
Buying from seller using electronic/mechanical scale n=69 71
Table 4.56 contradicts a number of conventional assumptions. On one hand, the retailers do not rely on credit from the traders, such as by paying them with a delay. The transaction is mainly merely a spot transaction. Moreover, only 15% of the retailers sell to customers on credit; the usual assumption is that many consumers buy on credit. Finally, very few retailers take loans, and those that do use very little the formal banks; they just work with informal lending. Table 4.56. Traditional rice retailers credit with suppliers and customers 1. Payment to supplier
% of retailers who pay advance to suppliers (pay some money before getting the rice) n=133
2
If receive advance, mean days before the transaction (N=subset of retailers paying advance) (day) n=133
1.5
199

% of retailers who pay with delay to suppliers (pay for rice after receive it) n=11 8
If pay with delay, mean days delayed after the transaction (=subset of retailers paying with delay) (day) n=6
16.8
2. Payment form the clients
% of retailers whose customers pay advance to retailers (average over retailers) n=133
2
If received advance from clients, mean days before the transaction (N=subset of retailers getting advance form clients) (day) n=2
0.5
% of retailers whose clients pay with delay to retailers (means retailers de facto give consumer credit to clients) n=133
15
For retailers having clients paying with delay, mean days delayed after the transaction(N=subset of retailers whose clients pay with delay) (day) n=20
13.7
3. Loans taken by the retailer in 2011
% of retailers took loan in 2011 n=136 6
% of retailers borrowed for rice purchase n=136 2
Assessment of ease of borrowing (five point scale with five the hardest) n=11 3.0
For retailers who borrowed, mean amount of USD borrowed (n=subset of retailers who borrowed) n=9
17736.4
Sources of the loans (among subset of retailers who borrowed) n=11
a) % of retailers borrowed from agricultural development bank 0
b) % of retailers borrowed from rural credit cooperative 9
c) % of retailers borrowed from four biggest commercial banks (Agriculture Bank of China, CBC, ICBC, BOC)
0
d) % of retailers borrowed from other commercial banks (regional and local) 9
e) % of retailers borrowed from informal sources 82
For those borrowing from formal sources (all but (e) above) characteristics of loans (n= subset) n=2
a) time period of loan (month) 12.0
b) interest rate per month (%/month) 0.0
c) % of retailers asked to give collateral/pledge or guarantee 0
d) Mean days took to go through the procedures to get the loan (day) 2.0
For those borrowing from informal sources ((e) above) characteristics of loans (n= subset)
a) time period of loan (month) n=6 12.2
b) interest rate per month (%/month) n=9 0.2
c) % of retailers asked to give collateral/pledge or guarantee 0
d) Mean days took to go through the procedures to get the loan (day) n=3 2.0
200

4.5.3. Performance of Traditional Rice Retail
Having covered the structure and conduct of traditional rice retailers, we now move on to an examination of their performance, including costs and wastage of traditional rice retailers and rice quality differentiation among traditional retailers. 4.5.3.1. Costs and Wastage of Traditional Rice Retailers Table 4.57 shows the cost structure of a very simple small business. The great majority of operational costs are simply the payment of rent for the stall. Far less than that are the minor costs for electricity and vehicle maintenance. For a given transaction, nearly all the cost is in transport. Labor costs for hired workers are very minor because it is a family-run affair. Commissions and fees are minor. Of interest is that the stall fee, and the electricity fee, climbed substantially over the five years of recall. Table 4.57. Costs of Traditional Rice Retailer 1. Operational costs per year in 2011 (USD), total 6706.5
a) water n=122 35
b) electricity n=121 326.8
c) rental fee for warehouse and stall n=111 5595.2
d) phone calls n=120 180.3
e) maintenance/repair of vehicles n=104 297.1
f) fee to market manager n=111 28.8
g) tax n=115 243.3
2. Operational costs per year in 2007 (USD), total 5608.2
a) water n=84 24.5
b) electricity n=83 238
c) rental fee for warehouse and stall n=75 4566.2
d) phone calls n=85 167.8
e) maintenance/repair of vehicles n=74 227.3
f) fee to market manager n=76 104.6
g) tax n=79 279.8
3. Labor cost in 2011 USD/month
Own labor imputed at market wage (own labor wage rate=432.7 USD/month) 800.5
Hired temporary workers 7.8
Long-term employees 136.7
administrative staff 0.0
Drivers 0.0
4. Variable costs (from the last transaction in 2012) USD/ton 201

Labor costs to load/unload n=136 0.2
Transportation costs from supplier to retailer total=65 2.2
a) own transportation costs (estimate of fuel use and wage of hired driver of own vehicle) n=48
1.2
b) hired transportation service costs (average includes all in the sample) 1.0
Fee at wholesaler in market or to broker that brought from source n=136 0
Commission to wholesaler 0
Fee at retail place 0
Weighing fees n=136 0
Transformation fees (bagging/packaging) NA
Total variable costs of the transaction 2.4
4.5.3.2. Rice Quality Differentiation among Traditional Retailers Table 4.58 shows the array of packaged and loose rices, the seasonality of rice on offer, and the types such as indica and japonica and sticky and jasmine. Several points are of interest. First, the great majority of small retailers sell packaged rice – 92%, up from 86% five years before. Many of these same still also sell loose rice. This is as “modernized” in terms of share of retailers with packaged rice as we found in Beijing (see Reardon et al. 2012a). Most of the packaged rice is middle/late season (not the lower quality early season), season indica or japonica. Second, most of the packaged rice is sold with a brand and nearly all of it with mill information (implying that it is not coming from small mills, but rather from larger mills). A quarter of it actually also has the trader information or mark on it. Third, it is interesting to see how differentiated the rice types are, but more particularly, to note that japonica (from the north) figures in the sales of even these small retailers. Fourth, the prices are sharply differentiated over the seasons, and over rice types, with japonica in first place, followed by indica late and middle season, and the cheapest being early indica (also most likely to be sold loose, perhaps to the poorest clients).
202
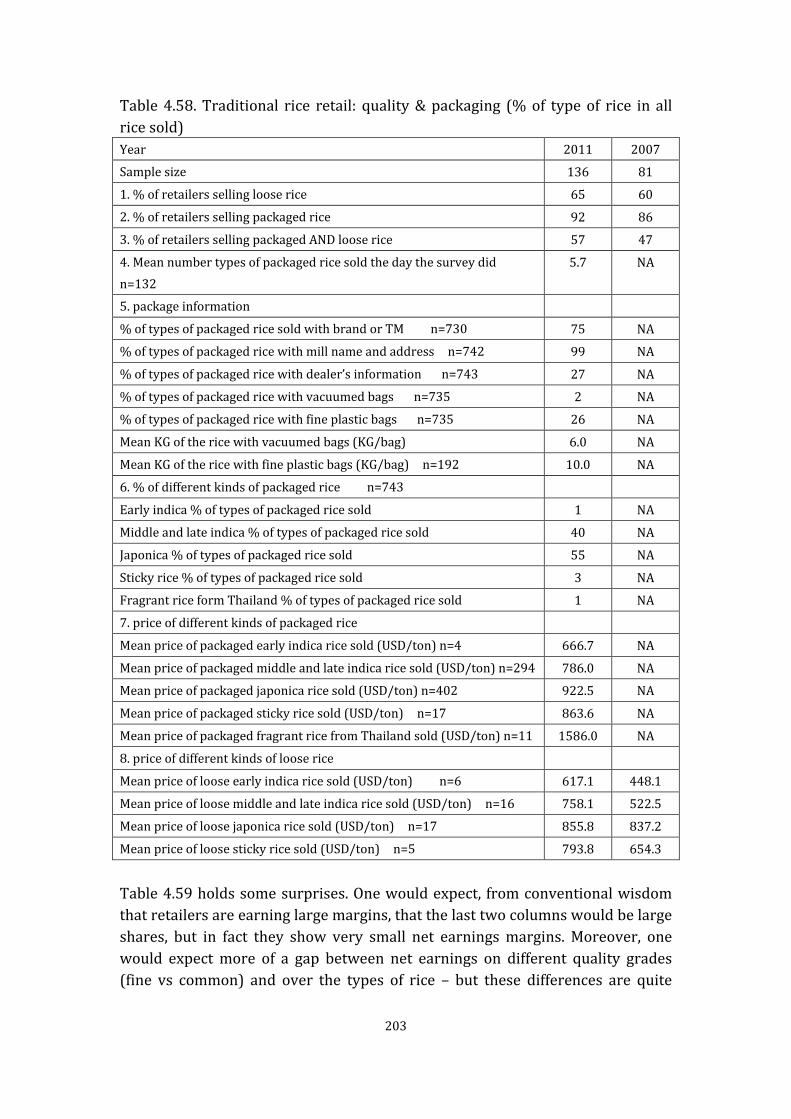
Table 4.58. Traditional rice retail: quality & packaging (% of type of rice in all rice sold) Year 2011 2007
Sample size 136 81
1. % of retailers selling loose rice 65 60
2. % of retailers selling packaged rice 92 86
3. % of retailers selling packaged AND loose rice 57 47
4. Mean number types of packaged rice sold the day the survey did n=132
5.7 NA
5. package information
% of types of packaged rice sold with brand or TM n=730 75 NA
% of types of packaged rice with mill name and address n=742 99 NA
% of types of packaged rice with dealer’s information n=743 27 NA
% of types of packaged rice with vacuumed bags n=735 2 NA
% of types of packaged rice with fine plastic bags n=735 26 NA
Mean KG of the rice with vacuumed bags (KG/bag) 6.0 NA
Mean KG of the rice with fine plastic bags (KG/bag) n=192 10.0 NA
6. % of different kinds of packaged rice n=743
Early indica % of types of packaged rice sold 1 NA
Middle and late indica % of types of packaged rice sold 40 NA
Japonica % of types of packaged rice sold 55 NA
Sticky rice % of types of packaged rice sold 3 NA
Fragrant rice form Thailand % of types of packaged rice sold 1 NA
7. price of different kinds of packaged rice
Mean price of packaged early indica rice sold (USD/ton) n=4 666.7 NA
Mean price of packaged middle and late indica rice sold (USD/ton) n=294 786.0 NA
Mean price of packaged japonica rice sold (USD/ton) n=402 922.5 NA
Mean price of packaged sticky rice sold (USD/ton) n=17 863.6 NA
Mean price of packaged fragrant rice from Thailand sold (USD/ton) n=11 1586.0 NA
8. price of different kinds of loose rice
Mean price of loose early indica rice sold (USD/ton) n=6 617.1 448.1
Mean price of loose middle and late indica rice sold (USD/ton) n=16 758.1 522.5
Mean price of loose japonica rice sold (USD/ton) n=17 855.8 837.2
Mean price of loose sticky rice sold (USD/ton) n=5 793.8 654.3
Table 4.59 holds some surprises. One would expect, from conventional wisdom that retailers are earning large margins, that the last two columns would be large shares, but in fact they show very small net earnings margins. Moreover, one would expect more of a gap between net earnings on different quality grades (fine vs common) and over the types of rice – but these differences are quite
203

small. The retailer does not appear to be capturing much value added earning from product differentiation. Table 4.59. Margins of traditional rice retailers, in USD per ton in March, 2012 Absolute: sales price -
purchase price in USD/ton Relative: (Sales price/purchase
price)* 100-100 in %
Common Fine Common Fine
Early indica 20.8 36.6 6 3
Middle and late indica 38.5 51.2 6 6
Japonica 46.5 65.1 7 6
Sticky rice 62.0 74.4 9 8
Fragrant rice from Thailand NA 112.9 8 5
Table 4.60 shows a surprisingly high profit rate around 38%, given the low net margins noted above. However, this rate is in line with the estimates in the other countries studied. If it were to be net of the imputed value of own labor, it would be nearer break-even, as the enterprise is paying the self-employed family member near minimum wage. Table 4.60. Rice Traditional Retailers’ Profit Rates (%) Profit rate = 100 {1- (Total costs*/ absolute margin**); *Total costs= operational costs + marketing costs ; **Absolute margin= Sales price- Purchase price
Early indica 0
Fine early indica 0
Common Middle and late indica 41
Fine middle and late indica 4
Fine japonica 44
Common japonica 21
Fine sticky rice 51
Common sticky rice 41
Fragrant rice from Thailand 70
All rice 38
4.5.4. The Rise of Modern Food Retail in Zhejiang
Having discussed the performance of traditional rice retail, we now also analyze the rise of modern food retail in Zhejiang. Table 4.61 tells a fascinating story of the product differentiation and packaging transformation that supermarkets, particularly the lead chains (much more than
204

the small local ones) are undertaking in rice retail in Zhejiang cities. Several points are to emphasize. First, the rice volumes and area of a supermarket are substantially bigger than a traditional retailer, as would be expected. The lead chain as twice more area to rice than the local chain, but some seven times higher volume. Second, both lead chains and even local chains have more types of rice than do traditional retailers, and lead have more than local chains. While we do not have the specific composition of volumes, it appears that the share of japonica (not grown locally but adopted by the urban consumers) is higher in the supermarkets than the traditional retailer, judging by the importance of packaged in total, and japonica in packaged, in the chains. Third, interestingly, and this is similar to what we found in Beijing (see Reardon et al. 2012a), the leading chains have a “dual strategy” with sales of cheap loose rice, as well as more expensive (but highly differentiated) packaged rice. This then aims at the different consumer target groups. By contrast, the local chains mainly sell packaged, with more expensive rice; this could account for their much lower volumes of rice sold compared with the leading chains. The chains tend to sell more with fine plastic packages than do the small retailers (in terms of differences in types of packages). Fourth, a higher share of packaged rice is sold branded in the supermarkets; interestingly, the trader label is much more apt to be found on the package in the local chains; this could be because the large chains may buy direct from mills as we found in Beijing (but did not explore in Zhejiang as of yet). Finally, and very interestingly, the supermarket chains are shown in the data to tend to more (compared with traditional small shops) strongly differentiate price over types of rice and between packaged and loose – thus capturing more value and catering perhaps more strategically to different consumer groups. Table 4.61. Zhejiang Supermarkets’ Sales of Rice – Characteristics of stores Stores of
Leading chains
Stores of Local
chains
Overall
Sample size 15 148 163
1. Years since start-up (years) 6.8 6.1 5.7
2. Distance in km to the nearest wet market (km) 1.0 1.8 1.7
3. Mean number of cashiers the supermarket have 10.5 2.0 2.7
4. Mean area for rice selling in the supermarket (square 9.2 5.6 5.9
205

meters)
5. Mean tons of rice purchased by supermarkets (tons/month)
39.6 5.7 8.6
6. Mean types of packaged rice sold in the supermarket the day of survey (a type is by season, variety, size and weight of bag, and province origin)
28.1 9.5 11.4
7. package information
% of stores that sell loose rice 73 35 32
% of stores that sell packaged rice 100 100 100
% of types of packaged rice sold with brand or TM 85 75 69
% of types of packaged rice with mill name and address 100 98 98
% of types of packaged rice with dealer’s information 26 71 67
% of types of packaged rice that are vacuum bags 17 9 10
% of types of packaged rice with fine plastic bags 45 41 41
Mean KG of the rice with vacuum bags (KG/bag) 5.6 5.3 5.4
Mean KG of the rice with fine plastic bags (KG/bag) 7.6 7.6 7.6
8. % of different varieties of packaged rice
Early indica: % of types of packaged rice sold 0 0 0
Middle and late indica: % of types of packaged rice sold 17 31 30
Japonica: % of types of packaged rice sold 79 62 63
Sticky rice: % of types of packaged rice sold 0 0 0
Fragrant rice from Thailand: % of types of packaged rice sold
4 3 3
9. price of different kinds of packaged rice at survey time (March 2012)
Mean price of packaged early indica rice sold (USD/ton) 776.7 792.2 786.0
Mean price of packaged middle and late indica rice sold (USD/ton)
1074.4 910.1 919.4
Mean price of packaged japonica rice sold (USD/ton) 1089.9 1060.5 1063.6
Mean price of packaged sticky rice sold (USD/ton) 1573.6 1651.2 1604.7
Mean price of packaged fragrant rice from Thailand sold (USD/ton)
2065.1 2080.6 2079.1
10. Mean number types of loose rice sold in the supermarket the day the survey
2.73 1.14 1.29
11. % of different kinds of loose rice
Early indica: % of types of loose rice sold 0 0 0
Middle and late indica: % of types of loose rice sold 24 41 37
Japonica: % of types of loose rice sold 56 39 42
Sticky rice: % of types of loose rice sold 17 16 17
12. price of different kinds of loose rice in March 2012
Mean price of loose early indica rice sold (USD/ton) NA NA NA
206

Mean price of loose middle and late indica rice sold (USD/ton)
798.4 765.9 770.5
Mean price of loose japonica rice sold (USD/ton) 731.8 824.8 801.6
Mean price of loose sticky rice sold (USD/ton) 1179.8 965.9 1009.3
This last table tends to corroborate the main points of the earlier table. It adds several points. First, it is fascinating that the share of Jiangxi rice is so low – only about 10%. Second, these data show substantial differentiation into japonica, fragrant rice, sticky rice, and even “no pollution” labeled rice. Table 4.62. Supermarkets’ Sales of Rice – Inventory at the survey visit Leading
chains Local
chains Overall
Sample size 15 148 163
1. Loose rice sales
a) % of stores selling at least some rice - loose 100 35 41
% of all types of loose rice that are indica types (using only the subsample of stores selling loose rice)
24 41 37
% of all types of loose rice that are from the Jiangxi (the survey region)
9 11 11
Price (USD/ton) for loose indica rice (average over stores that sell loose indica rice)
798.4 765.9 770.5
b) % of stores selling at least some sticky rice – loose 47 18 21
Price (USD/ton) for loose sticky rice (average over stores that sell loose sticky rice)
1179.8 965.9 1009.3
c) % of stores selling at least some fragrant rice – loose 7 5 5
Price (USD/ton) for loose fragrant rice (average over stores that sell loose fragrant rice)
2021.2 1212.6 1482.3
d) % of stores selling at least some japonica rice – loose 67 32 35
Price (USD/ton) for loose japonica rice (average over stores that sell loose japonica rice)
731.8 824.8 801.6
2. Packaged rice sales
a) % of stores selling at least some rice – packaged 100 100 100
% of all types of packaged rice that are indica 17 32 30
USD/ton price of packaged indica 1004.4 908.5 910.8
% of all types of packaged rice that are from Jiangxi 9 11 10
b) % of stores selling at least some sticky rice – packaged 0 3 2
USD/ton price of packaged sticky 1573.6 1651.2 1604.7
c) % of stores selling at least some fragrant rice – packaged 27 14 15
207

USD/ton price of packaged fragrant 2065.1 2080.6 2079.1
d) % of stores selling at least some japonica rice – packaged 93 90 90
USD/ton price of packaged japonica 1089.9 1060.5 1063.6
% of all packaged types that are Labeled with rice company name
100 98 98
% of all packaged types that are Labeled with rice brand or TM
85 75 69
% of all packaged types that are Quality labeled with equal or higher than Wugonghai (no pollution standard)
11 20 20
4.6. Performance of the Rice Value Chain
As we have comprehensively discussed all of the segments of the rice value chain above, we are now able to consider the performance of the rice value-chain as a whole, by examining the rewards, costs, and margins involved. Table 4.63 (below) shows rewards, costs, and total margins (the final retail price) accruing to the different value chain actors, from farmers to traders, millers, and retailers. Following are the salient findings. First, the share of farmers rewards, costs, and of the final retail price hovers around two-thirds for both seasons and both grades (common and fine). This can be contrasted with the finding in Reardon et al. (2012) for Heilongjiang of roughly half as the share for farmers. The difference is probably due to the much longer value chain (about four times longer) between the farmer and the retailer in the Heilongjiang-Beijing value chain compared with the Jiangxi-Zhejiang value chain. Note also that, as in Heilongjiang (and as found in Bangladesh, see Minten et al. 2012 as cited above), the share of the farmer is higher in common than in fine rice – indicating that the post-farmgate segments capture more of the value added from quality differentiation. As in Heilongjiang, the difference (in the share of the farmer) is about 10 percentile points between the grades; this is less than the difference found in Bangladesh. This might be due to more variations on polishing practices (to enhance the grade) and perhaps to poorer infrastructure in Bangladesh. The table shows how the rest of the rewards and costs and total margins are divided over the other segments. It is interesting that only 8% of the total margin, in all, goes to the traders (only 1% to the rural traders within that), while roughly 25% goes to the mill segment and 12% to the retailers. This high share to the mills is actually lower than the one-third that mills have in the longer
208
Heilongjiang-Beijing value chain. The low share of the traders could be due to the relatively short distance of the value chain. Note that the village mills in Jiangxi all provide custom milling to paddy growers, while the village mills in HLJ are normal mills, so it may be partially for this reason that the percentage of the total margin goes to Jiangxi mills is lower than that of HLJ mills. Finally, in general, the share to the post-farmgate segments is higher for fine rice, combined with middle/late season (compared with early season). We cannot compare this with the Heilongjiang study simply because in the north there is only one rice season. In Jiangxi, it is not clear why the later season shows higher shares (but modestly higher) for post farmgate segments, once we controlled for the rice quality.
209

Table 4.63. Share of rewards costs and total margins accruing to different players in the rice value chain for early indica, Jiangxi-Zhejiang Seasons Early indica Middle and late indica
Quality Common paddy/rice Fine paddy/rice Common paddy/rice Fine paddy/rice
Average retail price of rice in Zhejiang (in USD/ton) 617.1 666.7 758.1 786.0
Share of rewards, costs and total margins accruing to: USD/kg Rewards Costs
Total margins Rewards Costs
Total margins Rewards Costs
Total margins Rewards Costs
Total margins
Farmers’ (rice equivalent) rewards costs and total margin 66 71 75 58 66 65 64 65 69 47 62 60
Rural paddy wholesalers’ (rice equivalent) rewards costs and total margin 1 2 1 3 1 2 1 2 1 2 1 1
Millers’ rewards costs and total margin 25 14 14 28 17 20 23 15 16 32 19 19
Urban rice wholesalers’ rewards costs and total margin 2 4 3 3 5 3 4 7 5 6 7 7
Urban traditional retailers’ rewards costs and total margin 6 9 7 8 11 10 8 11 10 13 11 12
Total rewards, costs and total margins in the value chain (figures in 100(33) 100(67) 100 100(40) 100(60) 100 100(43) 100(57) 100 100(52) 100(48) 100
210

parentheses show the share in Zhejiang retail price)
Rewards are calculated as the difference between costs and margins. For farmers the total margin is the rice equivalent paddy price received on selling per kg. Paddy, while costs are the sum of the rice equivalent monetary costs of cultivating per kg. Paddy and the rice equivalent marketing costs for per kg. Paddy. For millers, wholesalers (both rural and urban, paddy and rice) and retailers, margins are the difference between the sale price and the purchase price of rice/paddy. Note that for millers and rural paddy wholesalers, margins and costs reported are the rice equivalent margins and costs for handling per kg. Paddy. To convert per kg. Paddy prices, costs and margins to the rice equivalent prices costs and margins we divided the paddy costs, prices and margin by 0.65 (where 0.65 is assumed to be the paddy to rice conversion ratio).
211
Table 4.64 shows total costs and shares of various items in the total costs over the rice value chain (averaging all types of rice (over seasons and grades) together). The following points stand out. First, given the importance of the rental market for land, it is not surprising that the share in costs is high: 13% (versus only 8% in the Heilongjiang study). In Jiangxi, the study zone, the per capita land is only 0.05 ha, far less than 0.28 ha per person in HLJ. Relatively specialized farmers in Jiangxi thus rent in more to get large enough farm. Second, farm input costs (outside land and labor) are also a high share (38%), somewhat comparable with those in Heilongjiang where they form 29% of total costs. Third, the hired farm labor cost share is high in Jiangxi, at fully 11% of all costs in the value chain; this can be contrasted with only 7% in Heilongjiang. That can perhaps be due to high mechanization in the latter, but actually both zones have high mechanization. Also, plots are very fragmented in Jiangxi so that might use up more labor time. Fourth, predictably the shares of transport for the mills and the traders (9% together) are much lower than in the much longer value chain of Heilongjiang (where they are 28% together, nearly proportionate to the difference in lengths). Finally, it is quite striking that the total cost per ton in Jiangxi is a high 394 USD, versus only 268 USD in Heilongjiang. The possible reasons can be: (1) the Jiangxi survey is two years after the HLJ survey, and the price for inputs as well as labor wage are higher in the later survey. The average wage of migrant worker grew from 249.3 USD to 325.6 USD over the period, and farmers in Jiangxi have easy access to Pearl River Delta and Yangtze River Delta, in where large number of migrate workers are needed. (2) Fuel costs rose a lot in the past two years before the survey (due to the increase in world oil prices, transmitted to domestic diesel prices): diesel cost 863 USD/ton in 2009 and 1286 in 2011, 1.5 times more.
212

Table 4.64. Share of various items in the total costs of the rice value chains for indica Jiangxi-Zhejiang Quality Indica
Average retail price of all rice types together 679
Total cost in the rice value chain (USD/Ton), all seasons all rice types averaged 394
Average share of costs in total price 58%
Share of various items in the total cost of per ton rice (100%=total cost) (%)
1. Producer's rental costs (on rented in land) 13
2. Producer's input costs (on all purchased inputs other than land and labor, which include purchased seeds, fertilizers, crop chemicals, purchased irrigation and purchased animal and machine traction) 38
3. Producer's wage costs (on hired labor) 11
4. Operational costs of mills (costs of electricity, diesel, water, telephone and fax usage, rentals for stalls and warehouse) 9
5. Transport costs of mills (rentals on trucks and costs on transport in transaction) 5
6. Wage costs of mills (costs of hired casual and well as permanent labors) 7
7. Operational costs (costs of electricity, telephone and fax usage and rentals for stalls and warehouses, ) of traders (wholesalers + retailers) 5
8. Wage costs (for both casual and permanent labors) of traders ( wholesalers + retailers) 4
9. Fees (includes both marketing and weighing fees, taxes for the entire value chain) 1
10. Transport costs of traders (include costs of hired transport for transactions, rentals on trucks and also expenses on account of personal transport used for transactions, as well as fuel for transportation for both wholesalers and retailers) 4
11. Other trading costs (it comprises of the costs on bagging, stitching, grading, loading and unloading, payments at check points/ road toll taxes incurred by trader during transactions) of traders ( wholesalers + retailers) 1
12. Total cost 100
Note: For producer all costs are calculated in “rice equivalent” terms. For this purpose, we divide the cost of per unit of paddy by 0.65, where 0.65 is assumed to be the paddy to rice conversion ratio.
213

Chapter 5 Rice Value Chain from Eastern Uttar Pradesh to
Urban Madhya Pradesh in India
5.1. Introduction
In this chapter, the results of the farm household survey of paddy in Allahabad, Uttar Pradesh, in India, are assessed to ascertain the extent to which the rice farm segment still uses traditional methods, to what extent they have transformed to using new methods, and what are the key characteristics of that transformation. Then, the results of the mill survey are assessed to ascertain the extent to which the mill segment still uses traditional methods, to what extent they have transformed to using new methods, and what are the key characteristics of that transformation. Next, the results of the rural and urban trader survey are assessed to ascertain the extent to which the mill segment still uses traditional methods, to what extent they have transformed to using new methods, and what are the key characteristics of that transformation. Finally, the results of the urban retail survey are assessed to ascertain the extent to which the retail segment still uses traditional methods, to what extent they have transformed to using new methods, and what are the key characteristics of that transformation. Having assessed the upstream, midstream, and downstream segments, we consider the performance of the rice value chain in terms of the rewards, costs, and margins.
5.2. Upstream—Rice Farming
In order to assess the transformation of the upstream segment in India, we consider its structure and conduct.
5.2.1. Structure of the Rice Farm Segment
Below, we describe the structure of the rice farm segment in terms of rice land distribution and rental, rice farmers’ non-land assets, and rice farmers and non-farm and farm labor markets. 5.2.1.1. Rice Land Distribution and Rental
Table 5.1.a. shows paddy farm land distribution and rental, 2011 and 2007. Several points are salient.
214

First, operated farmland is somewhat concentrated. Marginal farmers form 75% of the sample, but have only 32% of the operated land; medium farmers have 14% of the sample, but have 42% of the operated land. Recall the sample was chosen so as to somewhat over-represent medium farmers so as to make a better comparison. We thus turn to the census to generalize our point: the census shows that 80% of the total farm population is marginal farmers, who operate only 53% of the land. By contrast, the census shows that medium farmers have but 8% of the actual population but operate fully 22% of the land. Thus, while our sample somewhat overstates the concentration, in the actual population there is also considerable concentration.
Second, the survey shows the average operated land rising slightly from 0.72 ha to 0.82 ha over the five years recalled (2007 to 2011); but that small average gain masks the fact that the large mass of the marginal farmers did not increase their operated land at all; all the gains were among the small and especially medium farmers. Third, paddy land actually fell in absolute terms among all strata, and as a share of operated land, from fully half the land in 2007 to just 39% in 2011 – a rapid decline. By 2011, even the paddy land was somewhat concentrated: the 75% of the sample that is marginal farmers grew but 45% of the paddy land, but the 14% that were medium farmers operated 48% of the paddy land. Fourth, farmers shifted into horticulture and wheat to replace that loss in paddy farming. This stood in contrast to the role claimed by key informants for fallowing (they asserted that farmers were abandoning paddy farming and just leaving the land fallow; rather, we found but 3% of the land was under fallow, and that only for marginal farmers). Even few of the marginal farmers felt that fallowing was a response to lack of water. The strongest shifts into horticulture came on the part of the marginal and the medium farmers. While horticulture is vaunted as a small farmers crop (due to labor intensity), in fact, 52% of the horticulture land is farmed by the 14% of the sample that is medium farmers, versus but 35% by the 75% of the sample that is marginal farmers. Fifth, in sharp contrast to what we found in center-west UP, here in eastern UP, the land rental market is very under-developed. Sixth, farms are not fragmented; they only had 2, 4, and 5 plots for the three strata (very consolidated plot composition compared with the Chinese case in a separate report).
215
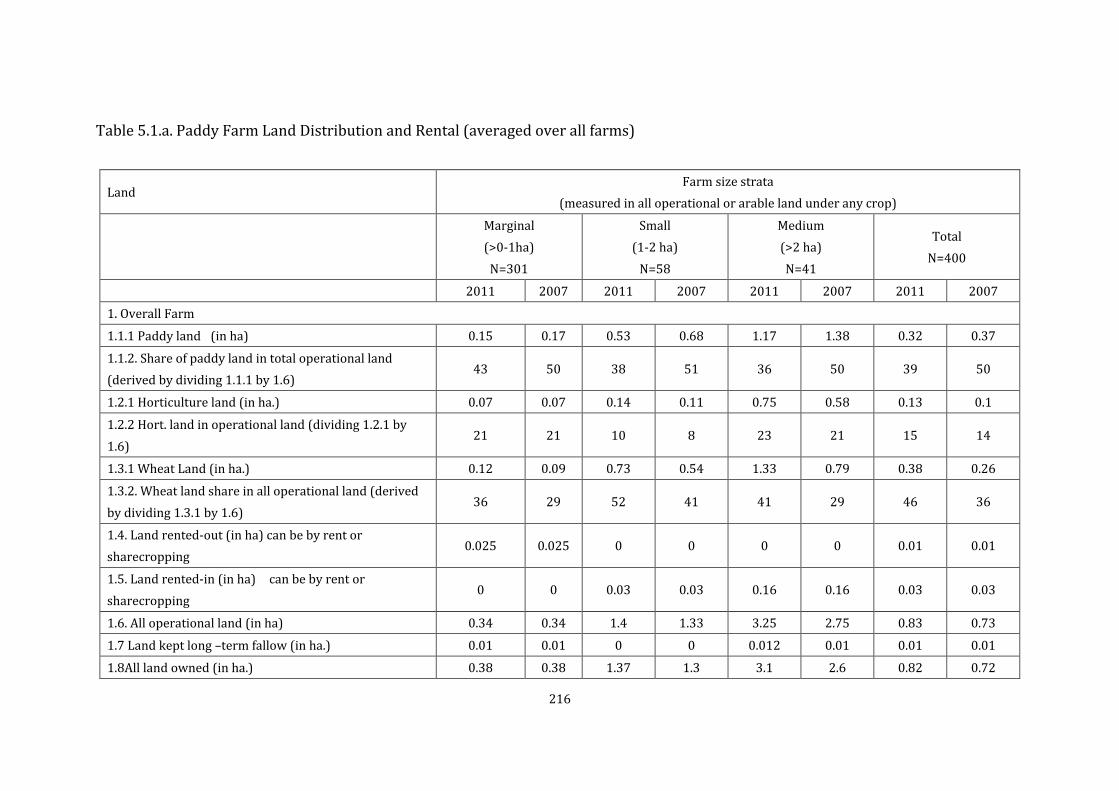
Table 5.1.a. Paddy Farm Land Distribution and Rental (averaged over all farms)
Land Farm size strata
(measured in all operational or arable land under any crop)
Marginal (>0-1ha)
N=301
Small (1-2 ha)
N=58
Medium (>2 ha) N=41
Total N=400
2011 2007 2011 2007 2011 2007 2011 2007
1. Overall Farm
1.1.1 Paddy land (in ha) 0.15 0.17 0.53 0.68 1.17 1.38 0.32 0.37
1.1.2. Share of paddy land in total operational land (derived by dividing 1.1.1 by 1.6)
43 50 38 51 36 50 39 50
1.2.1 Horticulture land (in ha.) 0.07 0.07 0.14 0.11 0.75 0.58 0.13 0.1
1.2.2 Hort. land in operational land (dividing 1.2.1 by 1.6)
21 21 10 8 23 21 15 14
1.3.1 Wheat Land (in ha.) 0.12 0.09 0.73 0.54 1.33 0.79 0.38 0.26
1.3.2. Wheat land share in all operational land (derived by dividing 1.3.1 by 1.6)
36 29 52 41 41 29 46 36
1.4. Land rented-out (in ha) can be by rent or sharecropping
0.025 0.025 0 0 0 0 0.01 0.01
1.5. Land rented-in (in ha) can be by rent or sharecropping
0 0 0.03 0.03 0.16 0.16 0.03 0.03
1.6. All operational land (in ha) 0.34 0.34 1.4 1.33 3.25 2.75 0.83 0.73
1.7 Land kept long –term fallow (in ha.) 0.01 0.01 0 0 0.012 0.01 0.01 0.01
1.8All land owned (in ha.) 0.38 0.38 1.37 1.3 3.1 2.6 0.82 0.72
216

Note: Sum of 1.1.2, 1.2.2 and 1.3.2 may exceed 100% as the same land can be used more than once for various crops.
1.8 Share of land that is kept long-term fallow, in total land owned (derived as (1.7/1.8*100)
3 3 0 0 0.4 0.4 1 1
1.9 % of households who reported lack of access to source of water to be the major reason for land being kept long term fallow(N=400 households)
17
12
10
15
2. Plots for full farm
2.1. Paddy land: Number of plots 1 1 2 2 2 3 1 1
2.2. Paddy land: mean plot size (by dividing 1.1.1 by 2.1) 0.15 0.17 0.27 0.34 0.59 0.46 0.32 0.37
2.3. All operational land: number of plots 2 2 4 4 5 5 3 3
2.4. All operational land: mean plot size (dividing 1.6 by 2.3)
0.17 0.17 0.35 0.33 0.65 0.55 0.28 0.24
2.6. Distance from home to all operational plots (meters) (average over all observations over N=400 households)
800 800 1000 1000 1000 1000 900 900
2.6. Distance from home to all paddy plots (meters) (average over all observations over N=400 households)
875 875 1000 1000 1000 1000 960 960
217

Table 5.1.b. shows paddy farming seasonality. The message of the table is simple: farmers grow but one season of paddy (kharif). Not shown in the table is that for a number of farmers, there is production in a second season – of a mix of horticulture and wheat, often on the same plot in the second season. Table 5.1.c. shows paddy farms’ land use patterns. The picture is simple: as noted above, these small farms have few plots, and are on flat irrigated ground. Here in this table we find these plots are close to the farm household, and close to the road. Most of the farms were started as recently as the late 1990s.
218

Table 5.1.b. Paddy Farming Seasonality
Land
Farm size strata (measured in all operational or arable land under any crop)
Marginal (>0-1ha)
N=301 ta
Small (1-2 ha)
N=58 tb
Medium (>2 ha) N=41
tc Total
N=400
3. Seasonality of Paddy Cropping
3.1. Shifts in seasonality of paddy cropping, % of HHs:
a) 3 seasons of paddy in 2007 and 3 seasons in 2011 0
0
0
0
b) 3 seasons of paddy in 2007 and 2 seasons in 2011 0
0
0
0
c) 3 seasons of paddy in 2007 and 1 season in 2011 0
0
0
0
d) 2 seasons of paddy in 2007 and 3 in 2011 0
0
0
0
e) 2 seasons of paddy in 2007 and 2 in 2011 0
0
0
0
f) 2 seasons of paddy in 2007 and 1 in 2011 0
0
0
0
g) 1 season in 2007 and 3 in 2011 0
0
0
0
h) 1 in 2007 and 2 in 2011 0
0
0
0
i) 1 in 2007 and 1 in 2011 100
100
100
100
3.3. Of farms who did NOT shift: but stayed 1 and 1 seasons 2007 & 2011:
a) mean paddy area (sum over seasons) in 2007 0.17 * 0.68 ** 1.38 * 0.37
b) mean paddy area (sum over seasons) in 2011 0.15 ** 0.53 ** 1.17 * 0.32
c) net change in paddy area (sum over seasons) in % terms (2011/2007) -13%
-28%
-18%
-16%
Note: ta is the t test between marginal and small farms, tb between small and medium/ large and tc between marginal and medium/ large farms. *, ** and *** represent that the t tests are significant at 1%, 5% and 10% level of significance respectively, while blank represents that the t test is insignificant.
219

Table 5.1c Paddy Farms: Land use
Land Farm size strata (measured in all operational or arable land under any crop)
Marginal (>0-1ha)
N=301
ta Small (1-2 ha)
N=58
tb Medium (>2 ha) N=41
tc Total N=400
1. Top 2 owned plots: mean size in Ha. (average over all observations over N=400 households) 0.95 *** 1.58 ** 3.63 ** 2.05
2. Top 2 owned plots:
a) % of plot land that is cropped 100 100 100 100
b) % of plot land that is kept long-term fallow 0 0 0 0
c) % of plot land that is pasture 0 0 0 0
d) % of land that is kept for fallowing 100 100 100 100
e) For fallowing: Mean months that is fallow within that year (average over all observations over N=400 households)
3 3 3 3
f) Mean distance from home in meters (average over all observations over N=400 households) 700 *** 900 ** 850 810
g) Mean distance to the nearest paved road in meters (average over all observations over N=400 households)
500 560 510 529
h) % of plot in demonstration area 0 0 0 0
i) Mean year since started using this plot (average over all observations over N=800 plots) 15 17 *** 12 *** 14
220

Table 5.1d shows paddy farms’ water sources and irrigation for the leading two plots. Roughly 50-60% of the lead fields work from groundwater, via tube-well. Only a tenth are just rainfed. About a third-half use water from reservoirs and lakes, pulled in by pumps and canals. Table 5.1d Paddy Farms’ Water Sources and Irrigation
5.2.1.2. Rice Farmers’ Non-land Assets Table 5.2.a. below shows several key points. First, nearly all the households have a male head. These are large households (compared with the Chinese and Vietnamese households in the other reports): with some 7-8 members. The education is low (compared with that of the other segments of the value chain that are studied), with but 4-6 years of schooling, and that very correlated with land size. Second, access to extension is very slight. Only 2% of the farmers said they learned new technologies from extensionists. Only 3% received any visit from extension agents. Even that was skewed toward medium farmers, among whom the rate was higher but still low, at 5%. Only 1% of the farmers received any training in paddy technology from the government. The farmers appear to not feel receiving more extension would be worth at least their own payment, as few
Land Farm size strata (measured in all operational or arable land under any crop)
Marginal (>0-1ha)
N=301
Small (1-2 ha)
N=58
Medium (>2 ha) N=41
Total N=400
2011 2007 2011 2007 2011 2007 2011 2007
Top 2 owned plots:
a) % of plots: rain fed (no irrigation)
13 15 7 8 12 11 12 11
b) % of plots: deep tube well drawing water from ground water bed
60 59 67 66 54 53 61 60
c) % of plots: pump 27 26 26 26 34 36 28 29
d) % of plots: use water from reservoir
10 10 7 5 3 2 6 6
e) % of plots: use water from river/lake
45 42 34 36 40 38 44 39
f) % of plots: use water from underground water/well
44 48 60 59 58 60 50 55
221

reported willing to pay. Rather, farmers rely on themselves – with their new information coming a quarter from other farmers, and half by learning by doing. Importantly, some get information by radio, and a seventh said they are informed by input shops. The private sector (input shops) counted 2.5 times more important than government extension in providing farmers knowledge.
222

Table 5.2.a. Paddy Farmers and Non-land Assets in 2011, Human & Social Capital Asset Farm size strata (measured in all operational or arable land under any crop)
Marginal
ta
Small
tb
Medium
tc
Total
(>0-1ha) (1-2 ha) (>2 ha) N=400
N=301 N=58 N=41 1) Demographic variables
1.1Average age of head of household (in years) (average over all observations over N=400 households)
50 ** 56 *** 58 ** 55
1.2 % of household with male heads (N=400 households)
97
96
96
97
1.3 Average household size (adults plus children) (average over all observations over N=400 households)
8
7
7
7
1.4 Dependency ratio ((children (below 15) + adults over 65) / total HH size)
0.3
0.4
0.4
0.3
1.5 % of household heads who are Hindu (N=400 households)
99
99
99
99
1.6 % of HHH who are of General caste 35
16
61
36
2) Education & experience
2.1 Average years of education of the household head (average over all observations over N=400 households)
4
5
6
5
2.2 % of HHH who are members of the Panchayat
0
0
16
5
2.3 % of HHH that are Village officials 0
0
1
0
223

2.4 Average number of years since which the household head has grown rice (average over all observations over N=400 households)
22 ** 30
30 ** 30
3.1) Extension & Training
3.1.1 % of HHs report learning new paddy technology (rom any source)
2
2
2
2
3.1.2 % of HH sought & got government or private extension farm/HH-visit in 2011
3
2
5
3
3.1.3 Mean over HHs that used extension: mean number of times used farm/HH-visit extension (non-average over all observations over N=12 households who sought and got any extension)
1
1
1
1
3.1.4 % of HHs bought any agricultural books in 2011
0
0
0
0
3.1.5 % of HH ever used the TV or internet to learn some agricultural technology
0
0
2
1
3.1.6 % of HH informed by extension agents that training is available
0
0
0
0
3.1.7 % of HH took part in any training (by government or company) for paddy growing
1
1
1
1
3.1.8 Mean over HHs that used training: mean number of times used training (non-average over all observations over N=4 households who took part in any training)
1
1
1
1
224
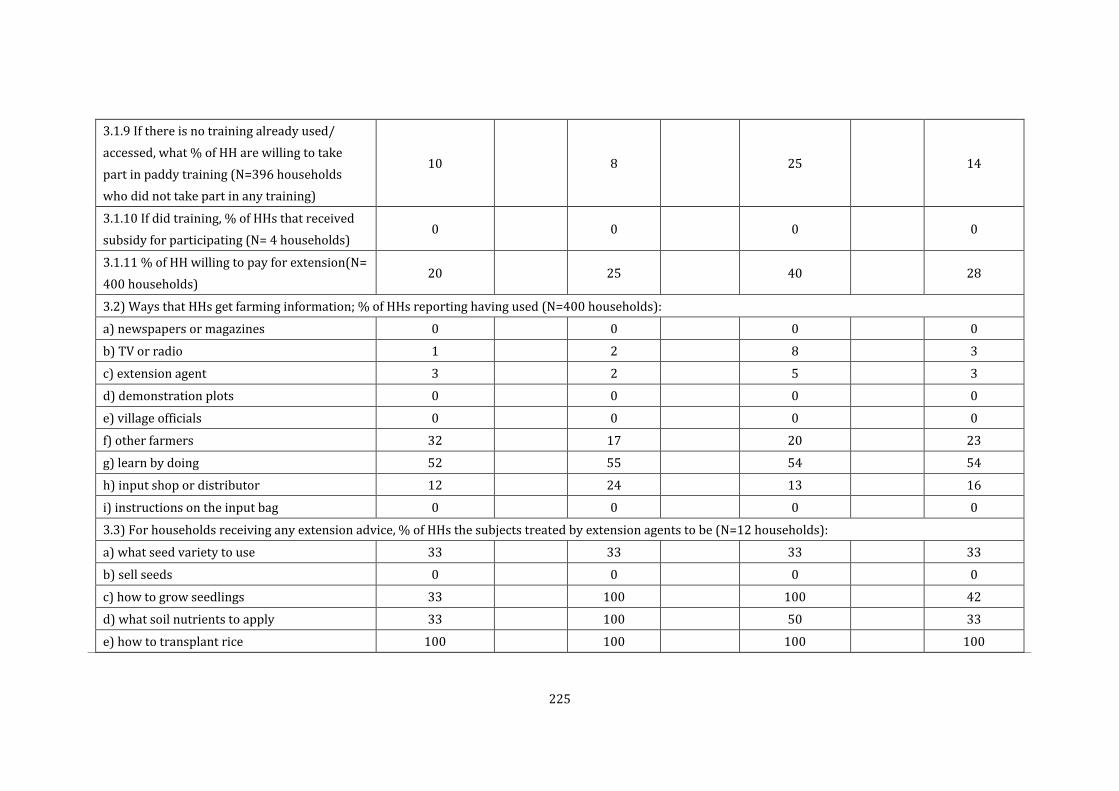
3.1.9 If there is no training already used/ accessed, what % of HH are willing to take part in paddy training (N=396 households who did not take part in any training)
10
8
25
14
3.1.10 If did training, % of HHs that received subsidy for participating (N= 4 households)
0
0
0
0
3.1.11 % of HH willing to pay for extension(N= 400 households)
20
25
40
28
3.2) Ways that HHs get farming information; % of HHs reporting having used (N=400 households):
a) newspapers or magazines 0
0
0
0
b) TV or radio 1
2
8
3
c) extension agent 3
2
5
3
d) demonstration plots 0
0
0
0
e) village officials 0
0
0
0
f) other farmers 32
17
20
23
g) learn by doing 52
55
54
54
h) input shop or distributor 12
24
13
16
i) instructions on the input bag 0
0
0
0
3.3) For households receiving any extension advice, % of HHs the subjects treated by extension agents to be (N=12 households):
a) what seed variety to use 33
33
33
33
b) sell seeds 0
0
0
0
c) how to grow seedlings 33
100
100
42
d) what soil nutrients to apply 33
100
50
33
e) how to transplant rice 100
100
100
100
225

f) how to manage field water level, when to apply fertilizer and chemicals, when to harvest
33
100
50
33
g) sell fertilizer 0
0
0
0
h) identify/prevent disease 0
0
0
0
i) sell pesticides 33
100
50
33
j) how to use machines 0
0
0
0
Total
3.4) For households receiving any extension advice, the % of HH reporting the method of advice dissemination used by extension agent to be (N=12 households):
a) one-page brochure 0
0
0
0
b) farm visit 25
30
30
28
c) call on cell phone to farmer 33
100
50
33
d) text on cell phone to farmer 0
0
0
0
e) village blackboard 0
0
0
0
f) via radio/TV 33
100
50
33
g) at the extension office 0
0
0
0
h) via a training session 10
12
25
15
Total
3.5) For households receiving any extension advice, the % of HH reporting the main source of extension advice as (one choice per HH; so total will add up to 100%):
a) rice mill 33
33
25
30
b) other private sector 34
67
50
50
c) government extension service 33
0
25
20
3.6 Social Capital
226

3.6.1 % of HH who have any member of the family working as a trader in the wholesale market in 2011(N=400 households)
3
5
10
6
3.6.2 Average number of members in the family working as a trader in the wholesale market in 2011 (non-average over all observations over N=24 households)
1
1
1
1
3.6.3 % of HH who have any member of the family working as a trader in the wholesale market in 2007(N=400 households)
3
5
10
6
3.6.4 % of HH who have any member of the family either owning a rice mill or working in a rice mill in 2011 (N=400 households)
10
11
9
10
3.6.5 Average number of members in the family either owning a rice mill or working in a rice mill in 2011 (non-average over all observations over N=40 households)
1
1
1
1
3.6.6 % of HH who have any member of the family either owning a rice mill or working in a rice mill in 2007 (N=400 households)
7
8
9
8
3.6.7 % of HH who have any one of the family work in the seed/fertilizer/pesticide selling business in 2011
0
0
0
0
3.6.8 % of HH who have any one of the family work in the seed/fertilizer/pesticide selling
0
0
0
0
227

business in 2007
3.6.9 % of HH who have any one of the family work in the extension agency in 2011
0
0
0
0
3.6.10 % of HH who have any one of the family work in the extension agency in 2007
0
0
0
0
3.6.11 % of HH who have any one of the family work in the cooperative in 2011
0
0
0
0
3.6.12 % of HH who have any one of the family work in the cooperative in 2007
0
0
0
0
3.6.13 % of HH who have any one of the family work in the self- help group in 2011
0
0
0
0
3.6.14 % of HH who have any one of the family work in the self- help group in 2007
0
0
0
0
228

Table 5.2.b. shows farmers’ livestock and tractor ownership, and paints a picture of low levels of productive wealth and skewedness in distribution (correlated with farm size). The livestock holdings are much lower than we expected – at only 370 USD, with a sharp correlation with farm size – jumping from 329 to 407 and up to 611 for medium farmers. Thus the inequality in landholding is not compensated for, but rather exacerbated (in terms of overall wealth inequality) by the skewed holdings of cattle. The same correlation with farm size is seen in the non-livestock farm assets (such as vehicles): jumping from 45 to 104 and then to 139 USD; this is however still low compared with western UP, emphasizing that the study area is poor. Finally, only 10% of the farmers own tractors; threshers are even fewer, at 2% of the farmers. Table 5.2.b. Paddy farmers’ livestock and tractors
Asset Farm size strata (measured in all operational or arable
land under any crop)
Marginal
ta
Small
tb
Medium
tc
Total
(>0-1ha) (1-2 ha)
(>2 ha) N=400
N=301 N=58 N=41 1. Value of livestock holdings in USD in 2011 ( average over all observations over N=400 households)
329 *** 407 ** 611 ** 370
2.Value of non-livestock non-land farm assets in USD in 2011 ( average over all observations over N=400 households)
45 * 104 *** 139 *** 58
3.Mean value of tractors owned in USD in 2011 ( average over all observations over N=400 households) (parentheses show share of tractor in total value of non-livestock non-land farm assets)
15 (35%)
17
(29%)
18 17 (17%) (12%)
4.Share of farmers who own tractors in 2011 (N=400 farmers)
10 12 10 10
5.Share of farmers who own thresher in 2011 (N=400 farmers)
2 5 2 2
229

5.2.1.3. Rice Farmers and Nonfarm and Farm Labor Markets Table 5.3.a. shows off-farm and migratory activity of the sample households. The off-farm rate (share of households involved) is well below that of the west/center-west of the earlier study. Only a quarter of the farm households are undertaking off-farm employment, with small increase in the share over time for the marginal (from 29 to 34%) while the others are slightly below that. Most of it is local nonfarm employment – which is far more important than local farm hired labor as a labor market. Migration is also limited (about 10% of the households), and far more within UP than outside of UP. Table 5.3.a Paddy Farmers and Off-farm Labor (Farm wage labor & nonfarm labor locally & in migration) Labor Farm size
Marginal Small Medium Total
(>0-1ha) (1-2 ha) (>2 ha) N=400
N=301 N=58 N=41 2011 2007 2011 2007 2011 2007 2011 2007
% of HHs with member working off—(own)farm
34 29 23 22 25 26 27 26
% of HHs with Local nonfarm workers
20 19 13 10 11 9 14 13
% of HHs with Local farm wage-workers
4 3 3 3 4 4 3 3
% of HHs with Migrants among household members to other districts in Uttar Pradesh outside Allahabad
11 9 7 5 14 13 11 9
% of HHs with Migrants to other places outside Uttar Pradesh
3 3 3 2 0 2 2 2
Table 5.3.b. shows paddy farmers and off-farm labor (farm wage labor & nonfarm labor locally & in migration). It is interesting and important that wage income (mainly from local nonfarm sources, not farm labor cash income, nor from migration) is much more important than horticulture and wheat (non-paddy) crop income as well as much more than dairy – for all strata. This flies in the face of conventional wisdom. It is also far more important (10 times) than migration income. Yet rural nonfarm employment is often neglected in the debate in India, or thought to be driven by policies like NREGA; rather we see in zones with little of that that it is the local, endogenous employment that is so important.
230
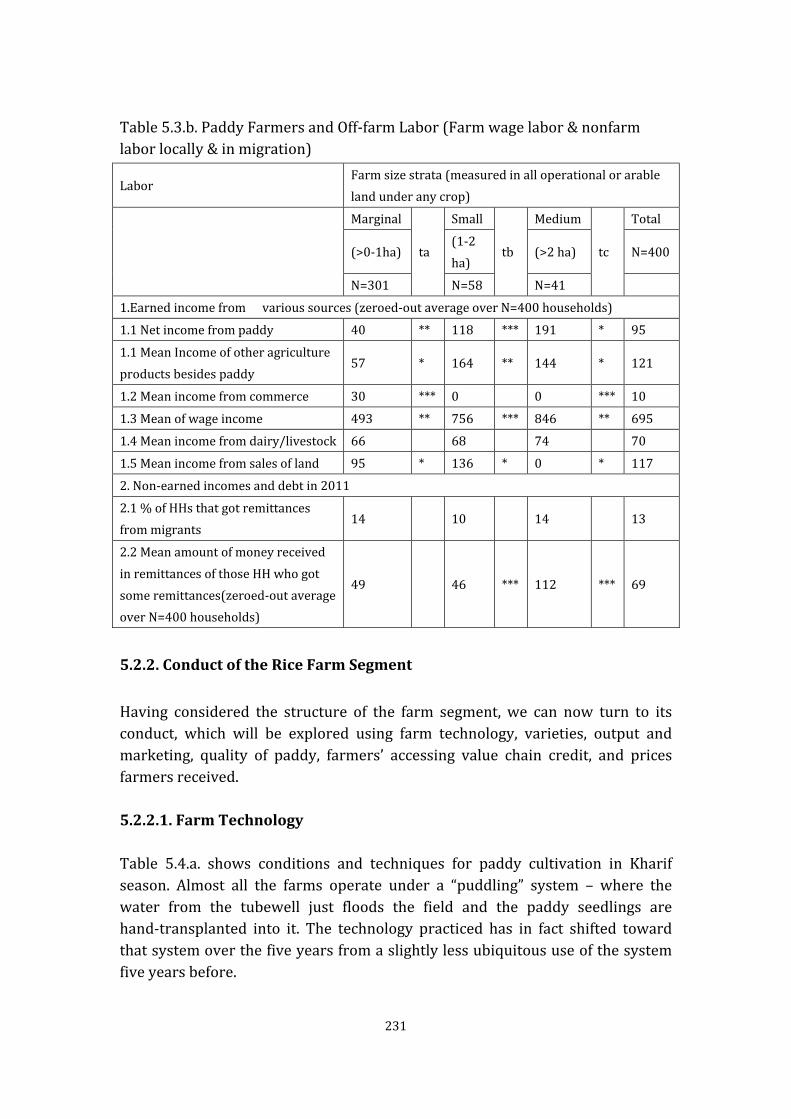
Table 5.3.b. Paddy Farmers and Off-farm Labor (Farm wage labor & nonfarm labor locally & in migration) Labor
Farm size strata (measured in all operational or arable land under any crop)
Marginal
ta
Small
tb
Medium
tc
Total
(>0-1ha) (1-2 ha)
(>2 ha) N=400
N=301 N=58 N=41 1.Earned income from various sources (zeroed-out average over N=400 households)
1.1 Net income from paddy 40 ** 118 *** 191 * 95
1.1 Mean Income of other agriculture products besides paddy
57 * 164 ** 144 * 121
1.2 Mean income from commerce 30 *** 0 0 *** 10
1.3 Mean of wage income 493 ** 756 *** 846 ** 695
1.4 Mean income from dairy/livestock 66 68 74 70
1.5 Mean income from sales of land 95 * 136 * 0 * 117
2. Non-earned incomes and debt in 2011
2.1 % of HHs that got remittances from migrants
14 10 14 13
2.2 Mean amount of money received in remittances of those HH who got some remittances(zeroed-out average over N=400 households)
49 46 *** 112 *** 69
5.2.2. Conduct of the Rice Farm Segment
Having considered the structure of the farm segment, we can now turn to its conduct, which will be explored using farm technology, varieties, output and marketing, quality of paddy, farmers’ accessing value chain credit, and prices farmers received. 5.2.2.1. Farm Technology Table 5.4.a. shows conditions and techniques for paddy cultivation in Kharif season. Almost all the farms operate under a “puddling” system – where the water from the tubewell just floods the field and the paddy seedlings are hand-transplanted into it. The technology practiced has in fact shifted toward that system over the five years from a slightly less ubiquitous use of the system five years before.
231
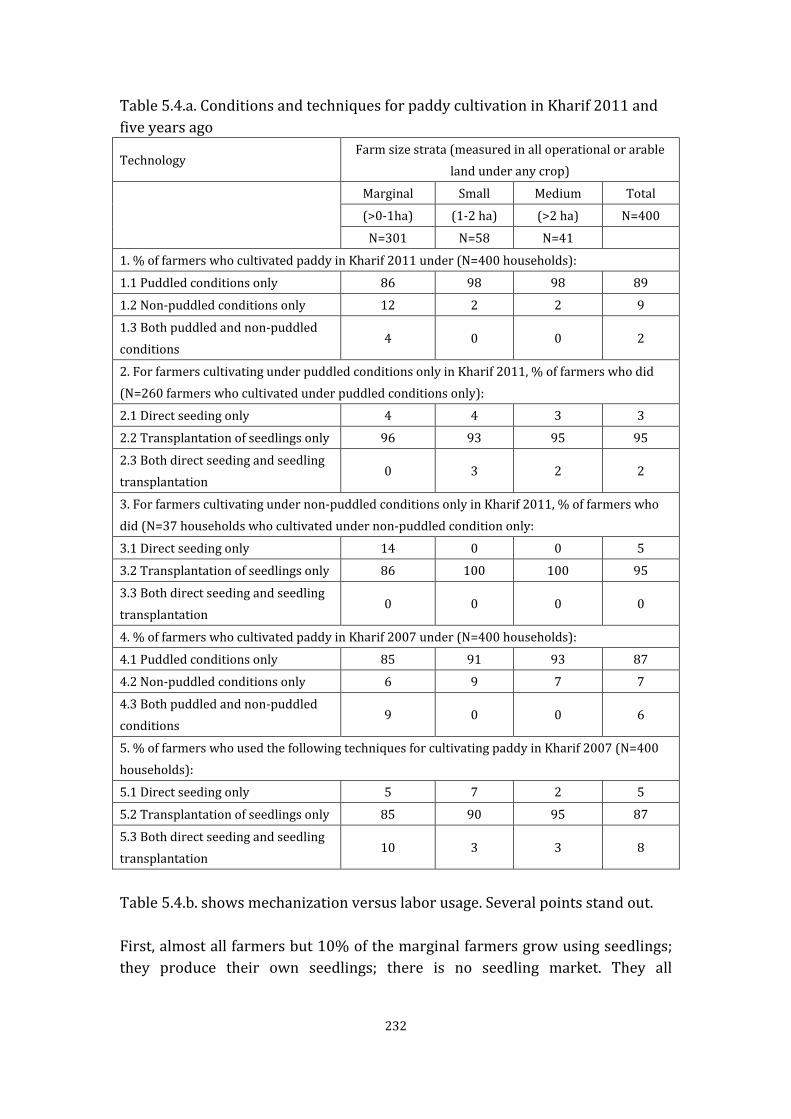
Table 5.4.a. Conditions and techniques for paddy cultivation in Kharif 2011 and five years ago
Technology Farm size strata (measured in all operational or arable
land under any crop)
Marginal Small Medium Total
(>0-1ha) (1-2 ha) (>2 ha) N=400
N=301 N=58 N=41 1. % of farmers who cultivated paddy in Kharif 2011 under (N=400 households):
1.1 Puddled conditions only 86 98 98 89
1.2 Non-puddled conditions only 12 2 2 9
1.3 Both puddled and non-puddled conditions
4 0 0 2
2. For farmers cultivating under puddled conditions only in Kharif 2011, % of farmers who did (N=260 farmers who cultivated under puddled conditions only):
2.1 Direct seeding only 4 4 3 3
2.2 Transplantation of seedlings only 96 93 95 95
2.3 Both direct seeding and seedling transplantation
0 3 2 2
3. For farmers cultivating under non-puddled conditions only in Kharif 2011, % of farmers who did (N=37 households who cultivated under non-puddled condition only:
3.1 Direct seeding only 14 0 0 5
3.2 Transplantation of seedlings only 86 100 100 95
3.3 Both direct seeding and seedling transplantation
0 0 0 0
4. % of farmers who cultivated paddy in Kharif 2007 under (N=400 households):
4.1 Puddled conditions only 85 91 93 87
4.2 Non-puddled conditions only 6 9 7 7
4.3 Both puddled and non-puddled conditions
9 0 0 6
5. % of farmers who used the following techniques for cultivating paddy in Kharif 2007 (N=400 households):
5.1 Direct seeding only 5 7 2 5
5.2 Transplantation of seedlings only 85 90 95 87
5.3 Both direct seeding and seedling transplantation
10 3 3 8
Table 5.4.b. shows mechanization versus labor usage. Several points stand out. First, almost all farmers but 10% of the marginal farmers grow using seedlings; they produce their own seedlings; there is no seedling market. They all
232

transplant by hand; no machines are used to transplant. Half of the labor used to transplant is hired labor. Second, nearly all (88%) farms hire tractors to prepare the land; few use animal traction or human labor for this. Only the medium farmers (and then only 12% of them) use their own tractors. The hired tractor market is very developed (coming with laborers to run machines). Third, by contrast, unlike in China, machine harvesting is not done; it is all done by hand, with heavy use of hired labor. However, like China, some 60% of farmers (with tilt toward the medium farmers) hire threshing machines.
233

Table 5.4.b. Agricultural Practices: Mechanization versus labor usage Practices Farm size strata (measured in all operational or arable land under any crop)
Marginal Small Medium Total
(>0-1ha) (1-2 ha) (>2 ha) N=400
N=301 N=58 N=41
2011 2007 2011 2007 2011 2007 2011 2007
1. Seedling: how the rice farmers get seedlings
1.1. Diffusion of seedling and seeding practices
% of HH use manual seed broadcast for kharif rice 24
19
15
22
% of HH grow seedling for kharif rice 89
100
100
92
% of HH buy seedling for kharif rice 11
0
0
8
1.2. Seedling: cost of seedlings from different ways of acquiring seedling
1.2.1 if own-grow the seedlings, mean area for seedling production (ha) 0.1
1.2
2.4
1.2
1.2.2 Cost of seedling production per Ha (a+b) 20
18
17
19
a) if grow seedlings, mean labor cost (own labor + hired labor + help got) for seedling production ( USD.) in 2011
11
10
9
10
b) if grow seedlings, mean other cost (pesticides + chemical fertilizer + other costs ) for seedling production ( USD) in 2011
9
8
8
9
1.2.3 Price of seedling if the farmers buy: USD./ha. (farmers buy seedlings in plastic trays whereon there are 3 plants/ sq. meter)
118
0
0
89
2. Transplanting
2.1 Transplanting: diffusion of different practices
% of HH hiring hand-transplanting 46 40 48 46 45 45 46 44
% of HH hiring machine-transplanting 0 0 0 0 0 0 0 0
234

% of HH do own hand-transplant any season 54 60 52 54 55 55 54 56
% of HH own machine-transplant any season 0 0 0 0 0 0 0 0
2.2. Transplanting: cost of different ways (in USD/Ha.)
cost of own labor to hand-transplant 43
55
47
56
cost of own labor plus own machine (imputed at rental price) to machine-transplant 0
0
0
0
cost of hiring hand-transplant (hired labor at market wage) 33
40
47
35
cost of machine-transplant (imputed at rental price for machine and market wage for labor with the machine)
0
0
0
0
3. Land preparation practices
3.1 Land preparation: practices diffusion
% of HH hiring hand-land preparation any season 5 8 3 4 2 2 3 4
% of HH hiring cattle-land preparation any season 1 1 0 0 0 0 0 0
% HH hiring tractor without operator for land preparation 2 2 0 0 0 0 0 0
% of HH hiring tractor with operator -land preparation any season 88 87 92 90 85 83 88 86
% of HH own hand-land preparation any season 2 2 1 1 1 1 1 1
% of HH own cattle-land preparation any season 0 0 0 0 0 0 - -
% of HH own tractor-land preparation any season 1 0 4 5 12 14 8 9
3.2. land preparation: cost of different ways (in USD/Ha.)
cost of own labor for hand-land preparation 2.5
5
9
4
cost of own animal traction (imputed at rental price) for cattle-land preparation 0
0
0
0
cost of own machine (imputed at rental price) for machine-land preparation 4
7
13
5
cost of hiring hand-land preparation labor without machine (at market wage) 5
14
15
7
cost of animal traction hired for land preparation (imputed at rental price for cattle and market wage for labor with cattle)
2
0
3
2
235

cost of tractor with operator for land preparation (imputed at rental price and market wage for labor with tractor)
26
33
31
28
4. Harvesting
4.1 Harvesting: different practices diffusion
% of HH hiring hand-harvesting any season 54 49 82 86 90 90 75 75
% of HH hiring machine-harvesting (machine with operator) any season 0 0 0 0 0 0 0 0
% of HH hand-harvesting any season 46 51 18 14 10 10 25 25
% of HH own machine-harvesting ( machine with own labour) any season 0 0 0 0 0 0 0 0
4.2. Harvesting: cost of different ways (in USD/Ha.)
cost of own labor to hand-harvesting 18
4
3
14
cost of own machine (imputed at rental price) to machine-harvesting 0
0
0
0
cost of hiring hand-harvesting (hired labor at market wage) 22
49
103
28
cost of machine-harvesting (imputed at rental price for machine and market wage for labor with the machine)
0
0
0
0
5. Threshing
5.1. Threshing: different ways rice farmers threshing
% of HH threshing by hand 60 62 34 35 30 33 41 43
% of HH threshing by thresher machine 40 38 66 65 70 67 59 57
5.2. Threshing: cost of different ways (in USD/Ha.)
cost of own labor to hand-threshing 16
10
0
13
cost of hiring labor for threshing (hired labor at market wage) 5
14
16
7
cost of own thresher (imputed at rental price) to machine-thresher 7
69
75
51
Cost of hiring thresher (without operator) 7
6
9
7
236

Table 5.4.c. shows input use of paddy farmers. The results are revealing. First, the seed market is somewhat limited, among all strata. Only about a fifth of the farmers buy seeds. Of those that do, about half buy from private shops, and half from government shops; for the latter, there is a slight tilt toward medium farmers, but nothing like the strong tilt we observed in western/central UP. Second, almost all farmers buy fertilizer. In this case, however, the use of the subsidized government shops as the source is strongly tilted toward the medium farmers (at 42%) and away from the marginal farmers (at 22%); this is similar to our finding in western/central UP. It represents a skewing of public services toward the larger farmers. Third, pesticides are also widely used, with two-thirds of the farms buying the (with little difference over the strata). That is like western UP. However, in contrast to the western zone, there is very little herbicide used – only about 10% of the farmers (of all strata) buy it. Instead, they weed manually. This suggests that labor is still relatively cheap in that zone. Fourth, the great majority (near 90%) of the farms are irrigated in 2011, as they were in 2007. Some half of their irrigation is from deep tube-wells, and the other half from shallow wells (with this half/half pattern as in our Bangladesh study). Most of the households are buying irrigation water.
237

Table 5.4.c. Input use of paddy farmers, N=400 unless otherwise stated
Input Farm size strata (measured in all operational or arable land under
any crop)
Marginal Small Medium Total
(>0-1ha) (1-2 ha) (>2 ha) N=400
N=301 N=58 N=41
1. Share of farmers buying paddy seeds in past 12 months 25 20 22 22
2. If purchased seed, share of farmers buying seeds from (N=89 Farmers)
a. Traditional private retailers 52 46 40 46
b. State seed stores 48 54 60 54
3. Share of farmers buying fertilizer in past 12 months (N=400 farmers) 92 96 98 95
4. If purchased fertilizer, share of farmers buying fertilizers from (N=380 Farmers)
a. PACS 22 35 42 33
b. Private retailer 78 65 58 67
5. Share of farmers that bought pesticides in the past 12 months 62 66 72 67
6. Share of farmers that bought herbicides in the past 12 months 12 11 12 11
7. Share of farmers weeding their paddy fields in the past twelve months 72 84 100 77
8. For farmers practicing weeding, share of farmers weeding (N=307 farmers) (multiple answers possible)
a. Manually (by hand) 83 87 88 86
b. By using machine 0 0 0 0
c. By applying herbicides 17 13 12 14
9. Irrigation in 2011 Share of farmers who reported their paddy plots to be irrigated 87 93 88 88
238

b. Share of farmers who reported their paddy plots to be rain-fed 13 7 12 12
c. Share of farmers buying irrigation water for paddy fields 86 72 85 84
Of farmers buying irrigation water, share of farmers buying from (N=336 farmers)
Private sellers 70 69 66 68
Government 30 31 34 32
11. For farmers who reported their paddy plots to be irrigated, share of farmers who obtain irrigation water from (N= 352 farmers)
Rain water harvesting 12 8 3 8
Pond 1 0 0 0
River/canal 40 28 53 40
Well 2 7 0 3
Ground water bed 37 50 41 43
Surface water bed 8 7 3 6
Tank 0 0 0 0
12. For farmers who reported their paddy plots to be irrigated, share of farmers who use the following irrigation means (N= 352 farmers)
Deep tube well 47 54 38 46
Shallow tube well 20 17 19 19
Pump 31 28 40 33
Sprinkler 0 0 0 0
Medium deep tube well 2 0 3 2
13. Of farmers using deep tube well as means of irrigation, share of farmers who own it (N= 162 farmers)
22 41 36 25
14. Of farmers using pump irrigation, share of farmers owning it (N= 116 farmers) 23 33 64 40
15. Irrigation in 2007 a. Share of farmers who reported their paddy plots to be irrigated 86 84 85 86
239

b. Share of farmers who reported their paddy plots to be rain-fed 14 16 15 14
Share of farmers buying irrigation water for paddy fields 83 72 85 82
Of farmers buying irrigation water, share of farmers buying from (N=326 farmers)
Private sellers 69 69 66 69
Government 31 31 34 31
For farmers who reported their paddy plots to be irrigated, share of farmers who obtain irrigation water from (N=343 farmers)
Rain water harvesting 11 4 3 6
Pond 0 0 0 0
River/canal 41 27 57 42
Well 2 8 0 3
Ground water bed 36 49 37 41
Surface water bed 10 12 3 8
Tank 0 0 0 0
For farmers who reported their paddy plots to be irrigated, share of farmers who use the following irrigation means (N=343 farmers)
Deep tube well 48 52 37 46
Shallow tube well 19 16 23 19
Pump 31 32 40 34
Sprinkler 0 0 0 0
Medium deep tube well 2 0 0 1
Of farmers using deep tube well as means of irrigation, share of farmers who own it (N=158 farmers)
19 44 23 29
Of farmers using pump irrigation, share of farmers owning it (N=117 farmers) 14 12 62 29
240

Table 5.4.d. shows paddy farmers’ production cost composition (in USD/ha). The greatest monetary cost (and in kind cost too) is labor, at some 114 USD/ha; note that that is very strongly correlated with farm size, ranging from 103/ha to 217/ha. That correlation is oft observed; somewhat more surprising is the large hired labor bill even among marginal farmers; this could be due to the large importance of non-paddy crops (demanding labor) and nonfarm labor; it would pay to hire labor to weed and harvest paddy while using one’s own labor for the much better paying alternative tasks. The second major cost is for fertilizer, at 104 USD/ha. Two things are surprising here. On the one hand, it is interesting that the fertilizer rate is similar over farm sizes; this is partly surprising because the marginal farmers are so very small and may appear to not be able to afford it (if one forgot that their main income by far is from non-paddy sources); this is also partly surprising because controlling for ability to buy fertilizer, one may expect the smallest farms to use more fertilizer, intensifying to compensate for little land; but the medium farms are not so large as to not also be intensifying production. On the other hand, the rates in kg/ha terms are indeed high, and thus surprising for eastern UP, perceived as a poor zone. The farmers are using around 400kg of fertilizer (urea and DAP) per ha, above the all-India official number. The third cost is that of machine (rental), coming in at nearly 100 USD/ha; not surprisingly, this is strongly correlated with land size, but mainly differs between a low for marginal farmers (of 47) and small and medium farmers around 120). Again, this is actually also somewhat surprising, not in the relative levels of use, but in the fact that the marginal farmers, with truly tiny farms, are also renting machine services; this illustrates that they too want to supplant labor with greater payoff in other things. These three costs are very much the lion’s share of the cost composition. They very surprisingly and interesting paint a picture not far from the technology used (machines, fertilizer, chemicals) in the more developed zone to the west, just at a modestly lesser level of intensity.
241
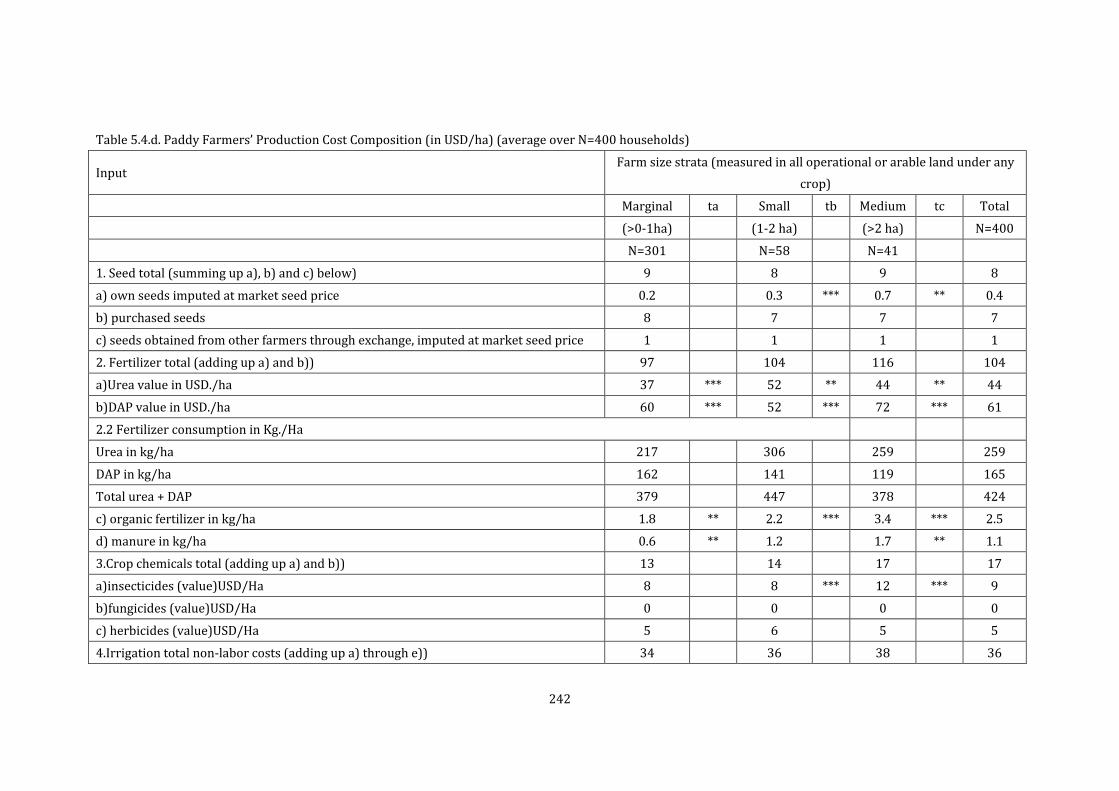
Table 5.4.d. Paddy Farmers’ Production Cost Composition (in USD/ha) (average over N=400 households)
Input Farm size strata (measured in all operational or arable land under any
crop)
Marginal ta Small tb Medium tc Total
(>0-1ha)
(1-2 ha)
(>2 ha)
N=400
N=301
N=58
N=41
1. Seed total (summing up a), b) and c) below) 9
8
9
8
a) own seeds imputed at market seed price 0.2
0.3 *** 0.7 ** 0.4
b) purchased seeds 8
7
7
7
c) seeds obtained from other farmers through exchange, imputed at market seed price 1
1
1
1
2. Fertilizer total (adding up a) and b)) 97
104
116
104
a)Urea value in USD./ha 37 *** 52 ** 44 ** 44
b)DAP value in USD./ha 60 *** 52 *** 72 *** 61
2.2 Fertilizer consumption in Kg./Ha
Urea in kg/ha 217
306
259
259
DAP in kg/ha 162
141
119
165
Total urea + DAP 379
447
378
424
c) organic fertilizer in kg/ha 1.8 ** 2.2 *** 3.4 *** 2.5
d) manure in kg/ha 0.6 ** 1.2
1.7 ** 1.1
3.Crop chemicals total (adding up a) and b)) 13
14
17
17
a)insecticides (value)USD/Ha 8
8 *** 12 *** 9
b)fungicides (value)USD/Ha 0
0
0
0
c) herbicides (value)USD/Ha 5
6
5
5
4.Irrigation total non-labor costs (adding up a) through e)) 34
36
38
36
242

a) outsourcing cost for irrigation (money paid to others to take care of irrigation) 0
0
0
0
b) water cost (payment to government or village/community for water used) 14
14
13
14
c) electricity to pump water 5
6
4
5
d)Diesel to pump water 8
9
9
8
e)Rent for hired pump-set 7
8 ** 12 ** 9
5. Labor
5.1. Labor total in value for all stages of production 232
282
337
241
a) Own labor imputed at market wage(USD/Ha) 129
123
120
127
b) Hired labor at market wage without machine(USD/Ha) 103 ** 159 *** 217 * 114
5.2. Labor (same 5.1) broken down by task
a) seedling production labor (USD/Ha) 12
10
9
10
b) land preparation labor (USD/Ha) 7 *** 19 *** 24 ** 11
c) seedling transplanting labor (USD/Ha) 76 *** 95 *** 103 *** 82
d) weeding labor (USD/Ha) 29
31
22
28
e) chemical fertilizer application labor (USD/Ha) 8
9
9
9
f) crop chemicals application labor (USD/Ha) 6
7
5
5
g) irrigation labor (USD/Ha) 18
16 *** 30 *** 19
h) harvesting labor (USD/Ha) 40 *** 54 *** 107 ** 41
i) threshing labor (USD/Ha) 21
24
16 *** 20
j) drying labor (USD/Ha) 15
16
13
15
6.Animal Traction cost in total
a) animal traction in land preparation (USD/Ha) 2 *** 0 *** 3
2
b) animal traction in harvesting (USD/Ha) 0
0
0
0
7.Machine
243
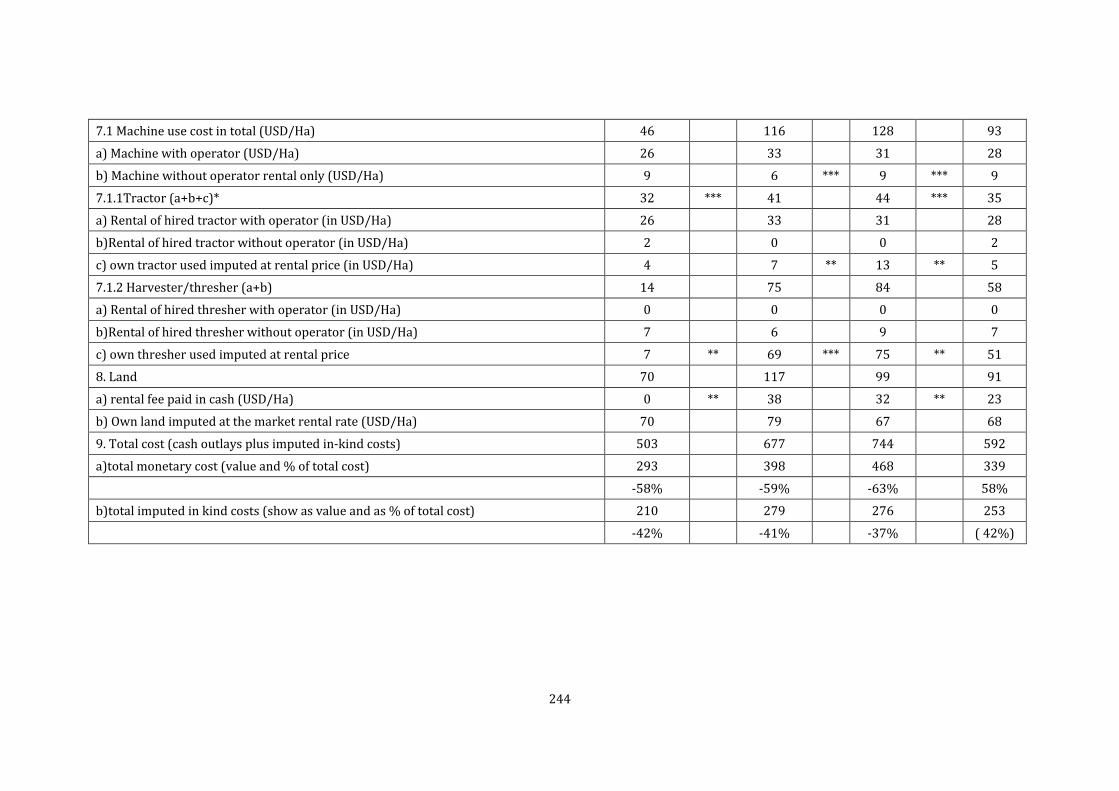
7.1 Machine use cost in total (USD/Ha) 46
116
128
93
a) Machine with operator (USD/Ha) 26
33
31
28
b) Machine without operator rental only (USD/Ha) 9
6 *** 9 *** 9
7.1.1Tractor (a+b+c)* 32 *** 41
44 *** 35
a) Rental of hired tractor with operator (in USD/Ha) 26
33
31
28
b)Rental of hired tractor without operator (in USD/Ha) 2
0
0
2
c) own tractor used imputed at rental price (in USD/Ha) 4
7 ** 13 ** 5
7.1.2 Harvester/thresher (a+b) 14
75
84
58
a) Rental of hired thresher with operator (in USD/Ha) 0
0
0
0
b)Rental of hired thresher without operator (in USD/Ha) 7
6
9
7
c) own thresher used imputed at rental price 7 ** 69 *** 75 ** 51
8. Land 70
117
99
91
a) rental fee paid in cash (USD/Ha) 0 ** 38
32 ** 23
b) Own land imputed at the market rental rate (USD/Ha) 70
79
67
68
9. Total cost (cash outlays plus imputed in-kind costs) 503
677
744
592
a)total monetary cost (value and % of total cost) 293
398
468
339
-58%
-59%
-63%
58%
b)total imputed in kind costs (show as value and as % of total cost) 210
279
276
253
-42%
-41%
-37%
( 42%)
244

5.2.2.2. Varieties Table 5.5 shows paddy farmers’ self-reported shift to HYV. The “Green Revolution,” reflected in HYV adoption, penetrated most of paddy farming in the Allahabad district; it has changed but little in the past five years and so may be at stasis, perhaps at a ceiling where there is not enough water. Table 5.5 Paddy farmers’ SELF-REPORTED shift to HYV paddy in kharif
Hybrid rice Farm size strata (measured in all operational or arable land under
any crop)
Marginal Small Medium Total
2011 2007 2011 2007 2011 2007 2011 2007
1. Diffusion of hybrid rice
1.1 % of HH growing HVY paddy
60 58 65 63 64 62 63 61
1.2 % of HH growing non-HVY
34 33 35 30 36 38 35 34
1.3 % of households who have not specified variety
6 9 0 7 0 0 2 5
2. Importance (as share of total paddy seed sown) of hybrid rice
2.1 % of HVY seed in total seed
73 70 67 65 66 63 71 68
2.2 % of non-HVY seed in total seed
27 30 33 35 34 37 29 32
Table 5.6 shows yields, comparing HYV and traditional varieties. Note that the averages for HYV are in general 5% above traditional varieties; this masks that they are 10% above for marginal farmers, but close together for the other farmers. Moreover, the marginal farmers have slightly higher yields (under HYV) than the other strata, but at best a very modest “inverse correlation” effect. Table 5.6 Paddy Farm Productivity: land-yields in each season, tons/hectare
Yield Farm size strata (measured in all operational or arable land under any
crop)
Marginal Small Medium Total
2011 2007 2011 2007 2011 2007 2011 2007
Yields
Hybrid non-basmati - - - - - - - -
Traditional non-basmati
3.8 3.8 3.9 3.8 3.8 3.8 3.8 3.8
HYV non-basmati 4.2 4.1 3.9 3.9 3.9 3.9 4 3.9
245

5.2.2.3. Output and Marketing Table 5.7 shows output and market surplus rates. Again, as with operated land, one sees the concentration in paddy farming. Moreover, one sees that, as we found in western/central UP, the small farms of UP are really small paddy businesses, more commercial than even semi-subsistence, as 92% of output is sold, and that varies little over the strata. This flies in the face of the conventional vision of eastern UP. Table 5.7 Paddy farmers’ output and marketed surplus for common, non-basmati
Production and Surplus Farm size strata (measured in all operational or arable land
under any crop)
Marginal
ta
Small
tb
Medium tc
Total
(>0-1ha) (1-2 ha) (>2 ha) N=400
N=301 N=58 N=41
1. Production (tons/farm) in 2011
0.52 ** 2.1 * 4.2 ** 1.3
2.Marketed surplus rate (sales/output) in 2011
89
93
94
92
Table 5.8 shows marketing of paddy/ rice by farmers, in terms of shares of farmers to various types of buyers and in various locations. By far the most important location and buyer is the wholesale market at the block level, with some two-thirds of farmers selling there. The second most important is to village traders, mainly in the village, at about 40%. There is a slight negative correlation of farm size and selling in the village/own field, as expected. Very few farmers sell paddy to the government directly (a mere 6%, with a strong positive correlation with farm size), and to mills, around the same, but with no size correlation. Table 5.8 Marketing of paddy by farmers: share of farmers selling to different buyer types
Marketing Farm size strata (measured in all operational or arable land
under any crop)
Marginal Small Medium Total
(>0-1ha) (1-2 ha) (>2 ha) N=400
N=301 N=58 N=41 1. Type of buyer: Share of farmers selling paddy to (multiple answers possible) (N=400 farmers) :
a. village Trader 34 33 46 38
b. Trader at mandi 59 65 67 64
c. Trader at mill 8 9 12 9 246

d. Government agency 4 4 9 6
e. Miller 4 7 3 5
f. other farmer 6 0 3 3
2. Sale location : Share of farmers selling at (multiple answers possible)(N=400 farmers) :
a. Own field or own village 42 48 34 41
b. Wholesale market in District 19 12 20 17
c. Wholesale market in other places of UP
0 0 5 2
d. Wholesale market at block level
59 64 74 66
Table 5.9 shows the shares by volume. Now the role of the village trader is seen to be much smaller: it was 38% of farmers participating, but only 18% of the paddy sold – and sales to the village trader are strongly negatively correlated with farm size. These findings are in fact close to what we found in western UP, to our surprise (as we thought the market system had continued as “more traditional” in eastern UP). The share of the wholesale market in sales was 41%, very strongly correlated with farm size, as it had been in western UP, for the same reasons (smaller farmers sell their small lots at the farm gate as it does not pay to take them to the wholesale market). This shows the coverage and penetration of rural infrastructure in the form of wholesale markets. Moreover, the role of the government becomes more important now measured in share of volumes, as it reaches 13%, and mills, also rise in importance to 15% of direct sales of farmers. This implies that few farmers are selling large shares of their paddy to these non-traditional destinations. Table 5.9 Share of volume of paddy sold by farmers across different buyers and sale locations
Sale volume and location Farm size strata (measured in all operational or arable land
under any crop)
Marginal
ta
Small
tb
Medium
tc
Total
(>0-1ha) (1-2 ha) (>2 ha) Total
N=301 N=58 N=41 N=400
1. Share of total tons sold by farmers to (average over all observations over N=400 households):
a. village trader 26
27 ** 15 ** 18
b. Trader at mandi 29 ** 39 ** 54 * 41
c. Trader at mill 8 ** 3 *** 1 ** 2
d. Government agency 15 * 6 * 15
13
e. Miller 16 *** 25
15
15
f. other farmer 6 * 0
0.2 * 1
2. Share of total tons sold by farmers at ( average over all observations over N=400 households):
247

a. Own field or own village 43 *** 46 * 33 ** 36
b. Wholesale market in District 12 *** 8 *** 12
11
c. Wholesale market in other places of UP
0
0
0.2
0.1
d. Wholesale market at block level 45
46 ** 55 ** 53
5.2.2.4. Quality of Paddy Table 5.10 shows that only common paddy is grown. The farmers told us that fine paddy required more inputs yet the price differential did not justify it. Table 5.10 Paddy quality: in % of output averaged over farms, only non-basmati
Quality of paddy Farm size strata (measured in all operational or arable land under any
crop)
Marginal Small Medium Total
2011 2007 2011 2007 2011 2007 2011 2007
Common 100 100 100 100 100 100 100 100
Fine 0 0 0 0 0 0 0 0
Medium 0 0 0 0 0 0 0 0
5.2.2.5. Farmers’ Accessing Value Chain Credit Table 5.11.a shows paddy farmers receipt of credit from and to buyers. Contrary to conventional wisdom that farmers regularly receive advances from traders as part of a system of “tied output-credit markets”, the data show (as we also found in western UP) that this system is largely defunct; not only do only 5% of the farmers get it, but it is strongly positively correlated with farm size. This may be because traders seek to “lock in” as much as possible the larger suppliers to reduce their transaction costs. By contrast, that most farmers are instead paid with a delay, indicates that the traders use the farmers as a credit source.
Table 5.11.a. Paddy farmers receipt of credit from and to buyers, in % of farmers
Credit Farm size strata (measured in all operational or arable
land under any crop)
% of farmers who (N=400 households)
Marginal Small Medium Total
(>0-1ha) (1-2 ha) (>2 ha) N=400
N=301 N=58 N=41 1.Are paid by buyer in cash 37 39 42 39
2.Received advance from buyer 3 3 10 5
3.Are paid by buyer with delay (de facto credit to buyer from farmer)
63 61 58 61
248

5.2.2.6. Prices Farmers Received Table 5.11.b. shows the paddy price received by the various strata. This price is derived from the transactions of the farmers; as these only sell this grade and type of paddy, there is only the price of common grade non-basmati. Note that the price is about 5% higher for the medium farmers, who tend to sell mainly in the wholesale market. This could be the effect of greater bargaining power based on scale of transaction. Table 5.11.b. Paddy Farmers and Prices
Price Farm size strata (measured in all operational or arable land
under any crop)
Average price received by farmers (average over all observations over N=400 farmers
Marginal
ta
Small
tb
Medium
tc
Total
(>0-1ha) (1-2 ha)
(>2 ha) N=400
N=301 N=58 N=41 Fine non-Basmati na
na
na
na
Common non-Basmati (USD/ton) 168
170 *** 178 *** 174
Medium non-Basmati na
na
na
na
5.3. Midstream—Transformation of the Rice Mill Segment
In this section, the results of the mill survey are assessed to ascertain the extent to which the mill segment still uses traditional methods, to what extent they have transformed to using new methods, and what are the key characteristics of that transformation.
5.3.1. Structure, Conduct, and Performance of Rice Mills
After first studying the structure of the rice mill segment of the value chain, we then go more in depth and discuss rice mill procurement, sales, finance, and other services. 5.3.1.1. Structure of the Rice Mill Segment of the Value Chain Table 5.12.a.shows rice miller characteristics. The millers are nearly all middle aged Hindu males, with twice as much schooling as the farmers. The medium and large millers tend to belong to a rice millers association, a private sector association registered at the level of the state. Some of the smaller millers are also lead farmers and lead citizens in the villages.
249
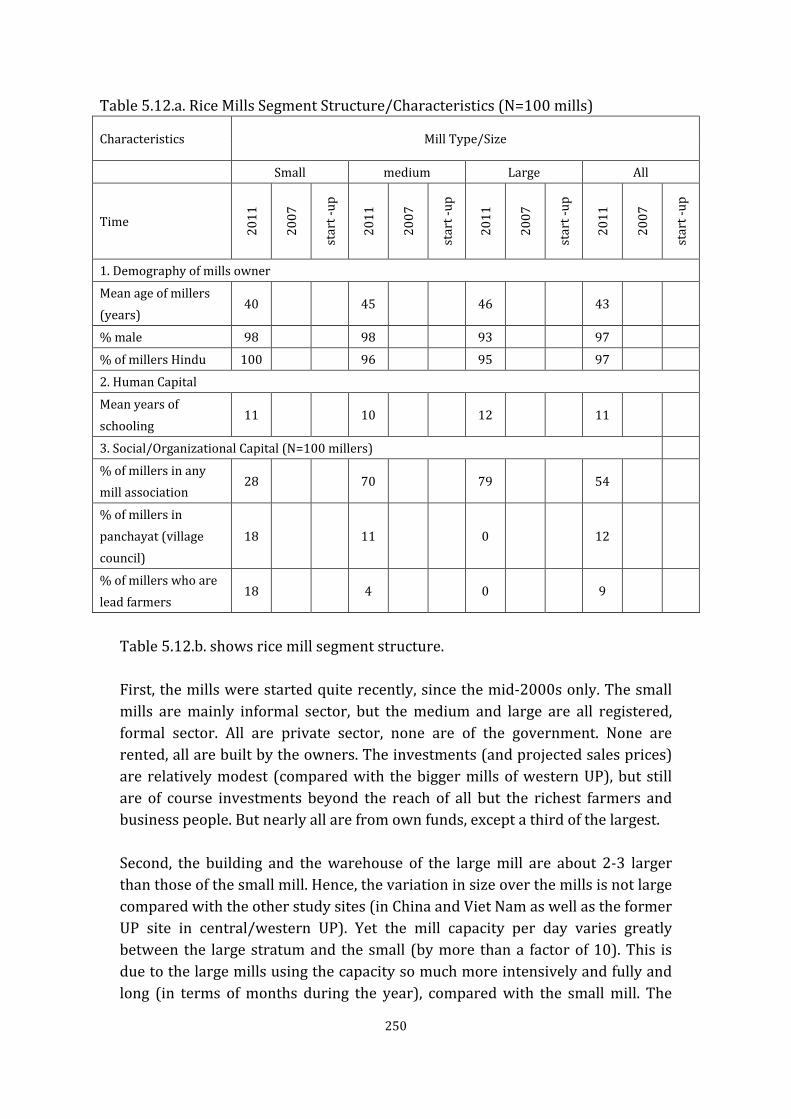
Table 5.12.a. Rice Mills Segment Structure/Characteristics (N=100 mills)
Characteristics Mill Type/Size
Small medium Large All
Time
2011
2007
star
t -up
2011
2007
star
t -up
2011
2007
star
t -up
2011
2007
star
t -up
1. Demography of mills owner
Mean age of millers (years)
40
45
46
43
% male 98
98
93
97
% of millers Hindu 100
96
95
97
2. Human Capital
Mean years of schooling
11
10
12
11
3. Social/Organizational Capital (N=100 millers)
% of millers in any mill association
28
70
79
54
% of millers in panchayat (village council)
18
11
0
12
% of millers who are lead farmers
18
4
0
9
Table 5.12.b. shows rice mill segment structure. First, the mills were started quite recently, since the mid-2000s only. The small mills are mainly informal sector, but the medium and large are all registered, formal sector. All are private sector, none are of the government. None are rented, all are built by the owners. The investments (and projected sales prices) are relatively modest (compared with the bigger mills of western UP), but still are of course investments beyond the reach of all but the richest farmers and business people. But nearly all are from own funds, except a third of the largest. Second, the building and the warehouse of the large mill are about 2-3 larger than those of the small mill. Hence, the variation in size over the mills is not large compared with the other study sites (in China and Viet Nam as well as the former UP site in central/western UP). Yet the mill capacity per day varies greatly between the large stratum and the small (by more than a factor of 10). This is due to the large mills using the capacity so much more intensively and fully and long (in terms of months during the year), compared with the small mill. The
250
table shows that the large and medium mills use around 70% of their capacity versus only 50% for the small. Third, while used capacity is 18 times large for the large mills, their stock of labor (permanent, family, and casual) for the large mills is only 4 times larger than small mills. That implies large mills are much more capital intensive; the latter is despite the fact that government subsidies go to at least a portion of the small and medium mills to buy equipment (but not to the large mills). An aside is of importance regarding the role of subsidies. From our scoping mission before starting the surveys, in interviews with the President of the UP Rice Millers’ Association, with an official at the Regional Food Corporation office in Allahabad, and with an official at the department of food and civil Supplies, Government of UP in Lucknow, we were informed of various government incentives to the mills. Under the state Industrial and Investment Policy of 2004, the following initiatives are perceived to have provided impetus to the development of rice milling industries in Eastern UP: (1) 100% exemption from payment of stamp duty on new small scale units in 24 districts of Eastern UP and 7 districts of Bundelkhand; (2) a 10 per cent capital subsidy on investment in new small scale units in 24 districts of Eastern UP and 7 districts of Bundelkhand, subject to a maximum of about 10,000 USD (500,000 rupees); (3) 5% interest subsidy to new small scale units for five years subject to a maximum of 5,000 USD per annum; (4) power bill subsidy equivalent to trade-tax paid on raw materials; (5) exemption from entry tax on plant and machinery used in establishment of new units; (6) small scale units having less than 25 employees exempted from labor laws. Fourth, unlike in the China case, none of the mills have a stall in the wholesale market. Yet most of the large and medium mills noted that they have an agent in the mandi. Fifth, unlike in the China case, the government does not officially and formally request and pay mills for storing rice in case they should be called on to release it to equilibrate the market. But we found that in practice, informal arrangements existed wherein UP mills reported storing for the government, albeit in limited volumes. Sixth, to our surprise, we found that the small mills were nearly as commercial and full-service oriented as the medium and large mills; this can be seen in the finding that three quarters of the small polish rice (and not just dehusk to on-sell to larger mills, nor just custom mill). Table 5.12c. shows rice mills equipment holdings. Mills of all strata make a substantial outlay on non-key equipment such as sorters and key equipment
251

such as polishers. While this is some 2-4 times higher for the large mills compared with the small, this is further evidence that the small mills are not the simple, traditional small mills of former times in the villages. By contrast, the large mills in this area are somewhat small compared with those in both western UP and in the China and Viet Nam cases; in eastern UP these have but one polisher, no cooler or color sorter, no packing machine. Note as above that only a small portion of the firms got subsidies for equipment and here we show that these subsidies were quite small.
252

Table 5.12.b. Rice Mills Segment Structure (N=100 mills)
Mill Characteristics Mill Type/Size
Small medium Large All
Time 2011 2007 start -up 2011 2007 start -up 2011 2007 start -up 2011 2007 start -up
1. Start-up and Nature
1.1Years since start-up 5
7
8
7
1.2 % of mills registered with government
40
95
100
78
1.3 Cost registration
200
200
250
225
1.4 mills owned 1
1
1
1
1.5 private sector 100 100 100 100 100 100 100 100 100 100 100 100
1.6 built own mill
100
100
100
100
1.7 USD investment
5368
8149
8215
6832
1.8 % investment own funds
95
90
64
88
1.9 % renting 0 0 0 0 0 0 0 0 0 0 0 0
1.11 USD mill could be sold 5,286
7,512
11,111
6,965
2. Capacity
2.1 Mean working capital per year (in thousands USD)
1 1 1 2 2 3 3 3 4 2 2 3
2.2 % working capital borrowed 51 47 47 51 40 52 59 36 55 52 41 51
2.3 square meters mill building 87 81 81 147 127 121 225 225 139 153 145 118
2.4 warehouse (square meters) 188 172 172 230 255 207 290 312 247 223 245 200
253

2.5 warehouse (tons capacity) 194 96 96 278 232 169 504 450 261 291 187 126
2.6 Mill Capacity (tons/day) 4 4 4 19.5 19.5 19.5 51 45 42 24.8 22.8 21.8
2.8 Mean tax paid in 2011 USD 893
2043
3319
1801
2.9 % of mills got subsidy 10
35
0
15
2.9.1 if got subsidy, to buy machine? 100
100
0
100
2.10 % of mills have stall in wholesale market 0
0
0
0
3. Utilization
3.1 Actual milled/day (average over year) 1.92 1.92 1.92 14.04 14.04 14.04 36.72 32.4 29.4 12.5 12.5 11.5
3.2 Derived utilization rate (%) 48 48 48 72 72 72 72 72 70 50 55 53
3.4 Peak Season
3.4.1 hours of operation per day 10 10 10 15 15 15 15 15 14 13 13 13
3.4.2 tons/hour 0.4 0.4 0.4 1.3 1.3 1.3 3.4 3 3 1.25 1.25 1.15
3.5 Slack season
3.5.1 hours per day 6 6 6 8 8 8 8 8 8 7 7.5 7
3.5.2tons/hour 0.4 0.4 0.4 1.3 1.3 1.3 3.4 3 3 1.25 1.25 1.15
3.6. rice/paddy (%) 65 65 65 67 67 67 67 67 67 66 66 66
4. Labor Stock
4.1 permanent 1 1 1 1 2 1 1 1 1 1 1 1
4.2 family workers 2 2 2 2 2 2 2 2 2 2 2 2
4.3 temporary 2 2 2 3 3 3 5 4 5 3 3 3
4.4 % of mills have agent in wholesale market 18
72
93
53
5. Other practices
5.1 % of mills stored rice for government 40
95
100
78
5.2 of those storing, tons 49
126
198
110
254

5.3 fee in USD for storing 392
1009
1586
881
5.4 % mills de-husk + de-bran only 25 25 25 15 15 15 0 0 0 13 13 13
5.5 % mills also polish 75 75 75 85 85 85 100 100 100 87 87 87
5.6. % sell bran 100 100 100 100 100 100 100 100 100 100 100 100
5.7 % sell husk 100 100 100 100 100 100 100 100 100 100 100 100
255

Table 5.12.c. Rice Mills Segment Structure
Mill Characteristics Mill Type/Size
Small medium Large All
Time 2011 2007 start -up
2011 2007 start -up
2011 2007 start –
up 2011 2007
start -up
1. Non-key equipment inventory (foreign matter sorters, vibrators, dust shaker, stone sorters)
Years ago bought “non-key equipment” 5
7
8
6
b) USD paid for the equipment 3,444
6,822
13,444
5,500
2. Key equipment inventory
% of mills had key and expensive equipment 85
100
100
95
a.1) % of mills had electronic scale 58 30 20 98 24 17 100 50 21 82 22 19
a.2) Number of years ago bought 2.5
4
4.5
4
b.1) % of mills had rubber roller 78 58 50 85 79 72 100 99 94 88 79 72
b.2) Number of years ago bought 2
6
3
4
b.3) USD paid for one piece 778
1056
1389
889
c.1) % of mills had steel roller 23 42 50 15 21 28 0 1 16 12 21 28
c.2) Number of years ago bought 5
6
6
6
d) % of mills had container for cooling 0 0 0 0 0 0 0 0 0 0 0 0
e) % of mills that have polishers 75 75 75 85 85 85 100 100 100 87 87 87
e.1) If yes, number have 1 1 1 2 1 1 1 1 1 1 1 1
e.2) Number of years ago bought 4
6
3
5
f) % of mills had color sorter 0 0 0 0 0 0 0 0 0 0 0 0
g) % of mills had filling (for packing) machine 0 0 0 0 0 0 0 0 0 0 0 0
256

h) Total expenditure on key equipment 1832
2223
3221
1966
3. Subsidy
% of mills that reported to have got subsidy in purchasing equipment
10
35
0
15
Mean USD got from the subsidy for the equipment 220 222 - 221
257

5.3.1.2. Rice Mill Segment: Procurement, Sales, Finance, and Other Services Table 5.13.a. shows mills’ practices with respect to paddy buying, in terms of degree of humidity and price paid. All the large and medium mills, and half of the small mills buy only if the paddy is relatively dry (below 10% moisture), and before milling. They determine this with a testing machine. The second half of the small mills are more informal, and just test it by feeling the grain. Moreover, interestingly, while the government officially treats the MSP (minimum support price) as a recommended, indicative price (as in China), also as in China findings, the great majority of the mills say that they at times pay below it; it is thus not enforced over the year. In principal, the MSP is supposed to be the floor price in the market during the limited time (one or two months) when the government does its procurement. In theory (legally), during that time no buyer is supposed to pay a price below the MSP. But once the government withdraws from the market, or before it has started its procurement buyers can pay a price below the MSP. Moreover, it is possible also that if the government refuses to buy a consignment from a farmer on quality grounds farmers might also end up selling to the traders/ mills at a price lower than the MSP. Interestingly many farmers in the course of our survey said that the government rejected their paddy consignment on grounds that it would yield low head ratio, so they had to sell to mills, or traders at lower than MSP price. Of course, it is also possible that the price paid by the mill is below the MSP during the government procurement period simply because the mill violated the rule. Table 5.13.a. Practices in Mill’s Purchasing Purchasing practices Mill Type/Size
Small medium large All
1. Testing paddy before buy
% of mills that purchase the paddy below 10% moisture level 53 100 100 81
a) % of mills use paddy-moisture test machine 50 100 100 80
b) % just look/feel paddy to judge humidity 50 0 0 20
% of mills use related machine to test the head rice rate 50 100 100 80
2. Testing paddy after buying but before milling
% of mills who test humidity during the storage period 30 57 86 50
Before milling the paddy, % of mills test the moisture level of the paddy
50 93 100 77
Before milling the paddy, % of mills who dry paddy 0 0 0 0
Before milling the paddy, % of mills take any measure to remove dirt and rocks from the paddy
0 2 2 1
3. Purchase Pricing method
258

% of mills reporting paying (at least sometimes) below the government’s (guidance only) floor price
50 98 100 79
% of mills have specialized/skilled employees to supervise purchasing activity
50 100 100 80
Table 5.13.b. shows procurement of paddy by mills, by paddy source. The findings show that custom milling is quite limited – at only 13% of volume. Surprisingly, it is more prevalent among the larger mills, having dropped off in the peak season in recent years in the small mills. Moreover, the mills report sourcing half their paddy from farmers - a quarter of from non-PACS farmers and a quarter from PACS farmers. The latter are non-governmental groups of farmers that are managed indirectly by the government to make sure to supply mills with the requisite amount of paddy (as a way of ensuring that the mills can meet their quotas of rice to the government distribution system). Mills procure the other half of their paddy from rural wholesale markets and traders from other counties – with a moderate correlation with mill size.
259

Table 5.13.b. Procurement of paddy by mills, paddy source(Averages for each stratum and overall include all observations, including those with zeroes) Procurement Channel Mill Type/Size
Small Medium large All
Time 2011 2007 2011 2007 2011 2007 2011 2007
1. Custom milling for clients
a) share of paddy custom-milled 8 10 16 13 19 13 13 12
b) peak season, % custom-milled 11 22 27 23 34 25 22 23
e) low season, share of paddy that is custom-milled 2 2 5 2 3 1 4 2
2. Sources of paddy bought (of total tons bought) %
a) Farmers in same county 30 30 12 12 10 10 17 17
b) Farmers from other counties within same province 0 0 9 8 8 10 6 6
c) Traders on the wholesale market in same county 41 39 47 50 51 51 47 47
d) Traders from other counties within same province 0 0 10 10 10 10 6 6
e) PACS 29 31 22 20 21 19 24 24
m) Total 100 100 100 100 100 100 100 100
3. For custom-milled by mill, sourced from farmers same county 100 100 100 100 100 100 100 100
260

Table 5.14 shows mills’ sales by destination and mill size. Mills sell a much larger share of their rice to government in the low season; in the peak season around harvest, only 18% goes to government, but in the low season 60% does. As seen lower in the table, this washes out to about 40% of their rice going to government, which is precisely the required levy amount. The mills are only selling new rice, not stored rice. Mills sell a surprising amount out of state, some 16%. The rest is sold locally within the state as expected. Table 5.14 Rice Mills’ Sales by Destination and Mill Size (average over all mills) Buyer Mill Type/Size
Small Medium large All
Time 2011 2007 2011 2007 2011 2007 2011 2007
1. broad categories of sales clients
a) % of the rice goes to private clients in peak season
75 82 78 80 80 82 76 81
b) % of the rice goes to private clients in low season
45 42 40 40 40 40 42 41
c) % of mills who sell “new rice” (from paddy produced in 2011
100 100 100 100 100 100 100 100
e) % of mills sell de-husked/de-hulled-only
0 0 0 0 0 0 0 0
2. New rice: For all new rice produced by mill, shares of new rice going to ( ALL mills):
a) Consumers (direct sale to) 0 0 0 0 0 0 0 0
b) Traders in same county 24 26 19 23 26 25 23 25
c) Traders from other counties within same state
20 20 21 20 20 20 20 20
d) Traders from other states 16 16 19 17 14 16 16 16
e) Government 40 38 41 40 41 39 41 39
Total 100 100 100 100 100 100 100 100
Table 5.15.a shows rice mills and credit. It is striking that no mill pays an advance to any supplier – whether to farmer or trader. Rather, the great majority pay with a delay and thus derive de facto credit from their suppliers. But that delay is not onerous, being just the transaction cycle of 10 days. Similarly, mills’ clients do not advance the mills payment, but rather also pay with a delay, again 10 days. Thus in a sense financing flows down (from farmers) the supply chains rather than up (from downstream to farmers).
261

Table 5.15.a. Rice mills and credit (in %) Credit Mill Type/Size
Small Medium large All
1. Mills Payment to paddy suppliers (farmers& paddy traders )
% of Mills that pay advance to suppliers 0 0 0 0
% of Mills who pay with delay to suppliers 50 87 86 72
If pay with delay, Mean days delayed 10 10 10 10
% of mills pay in cash (rather than in check) 78 65 64 70
% of mills pay by transfer accounts or check 22 35 36 30
2. Payment from the rice clients
share of clients who pay advances to the mills 0 0 0 0
share of Clients who pay with delay to mill 100 75 78 54
% of mills whose clients pay with delay 48 85 93 71
Days delayed after the transaction 10 11 11 11
% of mills get paid in cash only by clients 55 28 0 35
% mills paid through transfer accounts or check 45 72 100 65
Table 5.15.b. shows loans taken by mills in 2011. There is a fairly substantial reliance on the banking sector. Only a quarter of the mills took out loans in 2011; nearly all did so to buy paddy. The loans were disproportionate to the mills’ capacities, with the smaller mills taking out a larger amount relative to their size. The source was overwhelmingly the commercial banks; the exception is that large mills drew from regional banks as well. It is striking that none noted a loan from informal sources. Unlike in China where we found that the large mills were given special terms for bank loans, the mills in India are paying regular commercial rates, and being required collateral.
Table 5.15.b. Loans taken by mills in 2011 Loans Mill Type/Size
Small Medium large All
% of mills took loan in 2011 (N=100 mills) 30 20 21 24
Of mills who took loan, % who did it to buy paddy 75 89 100 83
For mills who borrowed, mean amount of USD 6111 8222 8889 7778
Sources of the loans (N= 24 mills who borrowed in 2011)
a) % of mills from regional bank 8 0 33 8
b)% of mills borrowed from rural credit cooperative 0 0 0 0
c) % of mills borrowed from commercial banks 92 100 67 92
d) % of mills borrowed from informal sources 0 0 0 0
Characteristics of the formal loans (for n= 24 mills who borrowed from formal source)
262

a) time period of loan (in months) 12 15 17 16
b) interest rate per month 11 10 11.5 11
c)% of mills asked to give collateral/pledge 100 100 100 100
Table 5.16 shows rice mills’ provision of other services; it is plain that these are merely provision of bags, and provision of transport only from mill to buyer (as traders and farmers deliver paddy to the mills).
Table 5.16. Rice mills provision of other services, N = 100 Other services Mill Type/Size
Small Medium large All
% of mills that Arrange farmers’ access to seed 0 0 0 0
% of farmers who get seeds via mills 0 0 0 0
% of farmers who get seeds via mills 0 0 0 0
% of mills that sell chemicals 0 0 0 0
% of mills that Provide agricultural extension 0 0 0 0
% of mills that Provide bags to their suppliers 0 0 0 0
% of mills that Provide bags to their clients 47 100 100 82
% of mills that Provide transport from farm to mill (N=100 mills)
0
0 0 0
% mills that Provide transport from mill to buyer 47 100 100 82
The table shows that the mills in the production area are only buying non-basmati and common grade paddy. This matches the farm production composition noted above. The price of the paddy is very close of the different strata of mills, so there does not appear to be a “bargaining power” effect. Note how steeply the price of paddy climbed over the five years. Table 5.17.a. Characteristic of the paddy bought by the mills, N = 100 Scale Small Medium large All
Time 2011 2007 2011 2007 2011 2007 2011 2007
1. Of the total volume paddy bought by the mill in that season, share of various quality of paddy (average over all observations over N=100 mills)
non-basmati 100 100 100 100 100 100 100 100
2. Of the total volume of non-basmati
a) share of common 100 100 100 100 100 100 100 100
2. Price of the paddy
Mean purchasing price of non-basmati paddy USD/ton
220 166 228 167 225 166 224 166
263

Table 5.17.b. shows characteristics of the rice sold by mills. As expected, the rice is only non-basmati. Interestingly, the larger mills label the rice with the mill name (but not a consumer brand, as we found in China); but the small mills do not label. Again, the rice price does not differ much over the mill strata, indicating any obvious signs of “bargaining power” within the supply chain.
264

Table 5.17.b. Characteristics of the rice sold by mills, N = 100 Characteristics Mill Type/Size
Small Medium large All
Time 2011 2007 2011 2007 2011 2007 2011 2007
1. Of all rice sold:
a) Non-basmati 100% 100 100 100 100 100 100 100
2. Brand and package information of rice sold
a) % of rice packed and labeled with mill name but no branding
50 40 93 90 100 100 81 77
b) Without label information 50 60 7 10 0 0 19 23
c) Total 100% 100 100 100 100 100 100 100
3. price of rice sold in month before the survey USD/ton 359 283 368 310 365 296 365 289
265

Table 5.18.a. shows mill costs. As noted above, the labor/capital ratio declines as the mill size rises, and that is also reflected in the declining share (from 20% to 10%) of labor in mill costs as the mill size rises. By contrast, the share of electricity in total costs jumps fast from 3 to 17% over the mill strata. Diesel for own power generation is about 40%, not much different over the strata. That leads to the surprising finding that 50% of the mills costs are from energy – electricity current or diesel for electricity. A quite stunning finding also is that mills spend 15% of their total costs just on taxes for renewal of registration. This is as high as 19% for large mills. The mills have to renew two types of registrations on the average: 1) registration for the milling business and 2) their trade or dealership license for rice and paddy trading/ handling. Finally, of great importance is the strong negative correlation between mill size and total cost per ton milled, from 18 USD/ton to 7 per ton. This can be a reason for consolidation in the mill sector. Table 5.18.a. Costs per Mill 2011, USD, averages of all mills; parentheses show shares in total costs Cost Mill Type/Size
Small Medium large All
1.Labor (Permanent) 616 (8%)
1067 (4%)
1200 (3%)
970 (5%)
2. Labor (casual) 957 (12%)
1531 (6%)
1333 (4%)
1210 (6%)
3. Drivers 100 (1%)
156 (0.6%)
521 (1%)
175 (0.9%)
4. Electricity 275 (3%)
2438 (9%)
6000 (17%)
1802 (9%)
5. Water 0 (0%)
0 (0%)
0 (0%)
0 (0%)
6. Communication fee(fax, phones) 80 (1%)
107 (0.4%)
120 (0.3%)
98 (0.5%)
7. Maintenance of equipment and vehicles (other than his/her own hired labor)
1467 (19%)
3733 (15%)
4000 (11%)
2667 (14%)
8. Warehouse/ rental 0 (0%)
0 (0%)
0 (0%)
0 (0%)
9. Mill building + land rental 0 (0%)
0 (0%)
0 (0%)
0 (0%)
10. Diesel for generator 3211 11067 12667 7733
266

(41%) (43%) (36%) (41%)
11. Diesel for own and rented vehicles 65 (0.8%)
867 (3%)
1733 (5%)
888 (5%)
12. Rental of trucks 28 (0.4%)
500 (2%)
576 (2%)
368 (2%)
13. Taxes for renewal registration 918 (12%)
4050 (16%)
6638 (19%)
2839 (15%)
14. Insurance 32 (0.4%)
91 (0.3%)
120 (0.3%)
69 (0.3%)
15. Other costs 0 (0%)
0 (0%)
0 (0%)
0 (0%)
16. Total yearly cost 7749 (100%)
25,607 (100%)
34,908 (100%)
18,819 (100%)
17. Total days in operation during year 132 135 135 135
18. Daily costs (row 16 by row 17. ) 59 190 259 139
19. Total cost per ton of paddy milled 18.4 12.7 6.6 10.8
Note: Calculated by dividing row 18 by the average ton of paddy milled per day. Latter is obtained as the product of the average hours of operation per day and the average ton milled per hour
Table 5.18.b. shows the mills’ variable costs (just for the transaction) for paddy purchase in USD/ton, calculated from the last paddy purchase transaction. It is very striking that fully 60% of the cost are the taxes paid during the transaction. These fees comprise several components. Mills here have reported the security fund that they deposit with the government for obtaining the paddy consignment from the PACs; according to them this is equivalent to a fee that one has to pay to transact at the market premise; this security deposit allows them to obtain paddy from the PACs; second, when traders deliver paddy at the mill premise the mill to charges the “cess” (market tax) that the mill would have had to pay at the mandi (and has to render to the government even though the paddy was not bought at the market). Table 5.18.b. Average cost of paddy purchase in USD/ton, calculated from the last paddy purchase transaction (average over all observations) Cost Mill Type/Size
Scale Small Medium large All
1. Cost of the bags 0 (0%) 0 (0%) 0 (0%) 0 (0%)
2. Bagging and stitching costs of labor 0 (0%) 0 (0%) 0 (0%) 0 (0%)
3. Loading and unloading labor costs 0.64 (8%) 0.9 (9%) 1 (11%) 0.87 (10%)
4. Weighing fees(costs) paid to market 0.39 (5%) 0.46 0.96 0.53 (6%)
267
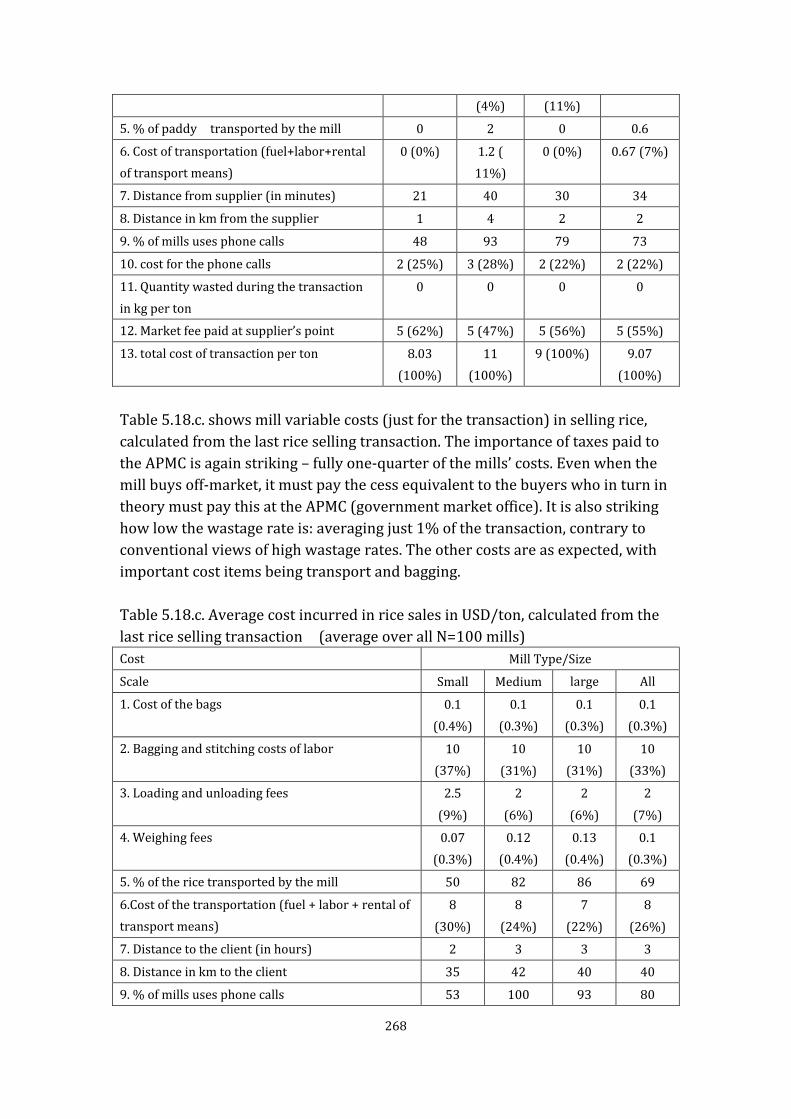
(4%) (11%)
5. % of paddy transported by the mill 0 2 0 0.6
6. Cost of transportation (fuel+labor+rental of transport means)
0 (0%) 1.2 ( 11%)
0 (0%) 0.67 (7%)
7. Distance from supplier (in minutes) 21 40 30 34
8. Distance in km from the supplier 1 4 2 2
9. % of mills uses phone calls 48 93 79 73
10. cost for the phone calls 2 (25%) 3 (28%) 2 (22%) 2 (22%)
11. Quantity wasted during the transaction in kg per ton
0 0 0 0
12. Market fee paid at supplier’s point 5 (62%) 5 (47%) 5 (56%) 5 (55%)
13. total cost of transaction per ton 8.03 (100%)
11 (100%)
9 (100%) 9.07 (100%)
Table 5.18.c. shows mill variable costs (just for the transaction) in selling rice, calculated from the last rice selling transaction. The importance of taxes paid to the APMC is again striking – fully one-quarter of the mills’ costs. Even when the mill buys off-market, it must pay the cess equivalent to the buyers who in turn in theory must pay this at the APMC (government market office). It is also striking how low the wastage rate is: averaging just 1% of the transaction, contrary to conventional views of high wastage rates. The other costs are as expected, with important cost items being transport and bagging.
Table 5.18.c. Average cost incurred in rice sales in USD/ton, calculated from the last rice selling transaction (average over all N=100 mills) Cost Mill Type/Size
Scale Small Medium large All
1. Cost of the bags 0.1 (0.4%)
0.1 (0.3%)
0.1 (0.3%)
0.1 (0.3%)
2. Bagging and stitching costs of labor 10 (37%)
10 (31%)
10 (31%)
10 (33%)
3. Loading and unloading fees 2.5 (9%)
2 (6%)
2 (6%)
2 (7%)
4. Weighing fees 0.07 (0.3%)
0.12 (0.4%)
0.13 (0.4%)
0.1 (0.3%)
5. % of the rice transported by the mill 50 82 86 69
6.Cost of the transportation (fuel + labor + rental of transport means)
8 (30%)
8 (24%)
7 (22%)
8 (26%)
7. Distance to the client (in hours) 2 3 3 3
8. Distance in km to the client 35 42 40 40
9. % of mills uses phone calls 53 100 93 80
268

10. Estimated cost for the phone calls 2 (7%)
4 (12 %)
4 (13%)
3 (10%)
11. Quantity wasted kg per ton 0.1 1.6 0 0.7
12. Imputed cost of wastage 0.04 (0.1%)
0.6 (1.8 %)
0 (0%)
0.3 (1.0 %)
13. market admission fee 4 (15%)
8 (24 %)
9 (28%)
7 (23%)
14. total cost per ton sold USD/ton 27 (100%)
33 (100%)
32 (100%)
30.5 (100%)
Note: Percentages in parentheses show the share of that cost in total cost of transaction.
Table 5.19 shows Rice Profit Rates and Internal Rates of Return shows profit rates; it is interesting that the profit rates are close over the mill strata, at about 60%. This is a high rate, but note that it is gross of amortization, which is a key cost of the mill given its fixed costs.
Table 5.19 Rice Profit Rates and Internal Rates of Return (in %) N = 100 mills Scale Small Medium large All
Profit Rates 59.7 60.7 67.1 62.5
Internal Rates of Return 4 6 6.5 5.5
Note: Profit rate is calculated as (100-(Total costs/Gross benefits)*100), where Gross benefits is calculated as ((Sales price of rice (as in row of table ) + Sales price of bran (average over all observations sales price of bran is calculated to be 140USD/ton from the survey data) +Sales price of husk (average over all observations sales price of bran is calculated to be 38 USD/ton from the survey data)) – the rice equivalent purchase price of paddy). The rice equivalent purchase price of paddy is obtained by dividing the per unit purchase price of paddy as in row of the table by 0.65. Total costs comprise of the costs of selling per ton of rice as in row of table, the rice equivalent cost of purchasing paddy, obtained by dividing the per unit purchase price of paddy as in row of the table , and the rice equivalent costs of milling per unit of paddy, obtained by diving the milling costs of per unit of paddy as in row of table by 0.65. Note that 0.65 is the average paddy to rice conversion ratio. Profit rates are calculated for non basmati common rice/ paddy only, since the mills have not reported of milling any other varieties. To calculate IRR we assume the current utilization of milling capacity by the mills is at 97% as in row 3.3 in table 4.2b. At this rate of capacity utilization we calculate the yearly operating costs of the mills in row 19 of table 4.7c, prorating it at the current capacity. Similarly we calculate the revenue earned by the mill from rice sales, and also the sales of by-products like husk and bran. Then we calculate the net cash flows to the mills by deducting the cost from the total revenue earned. However for the first year we consider the current sales value of the mills, which we assume will proxy the investments made on the mills. This value is obtained from row 1.11 in table 4.2b). We calculate the IRR to be the rate of return for which the net present value of the capital investment is zero. We assume the time period to be equal to 20 years.
269

5.4. Midstream—Transformation of the Trader Segment
In this section, the results of the rural and urban trader survey are assessed to ascertain the extent to which the mill segment still uses traditional methods, to what extent they have transformed to using new methods, and what are the key characteristics of that transformation.
5.4.1. Structure, Conduct, and Performance of Rice and Paddy Traders
In our discussion on the rice and paddy traders, we will describe their structure in terms of the characteristics and seasonality in paddy and rice trading, their conduct in terms of the procurement and sales, value-chain financing, and other services of the rice and paddy traders, and finally, we will assess their performance. 5.4.1.1. Structure: Characteristics and Seasonality in Paddy and Rice Trading Table 5.20 shows characteristics of paddy and rice traders. The results are discussed separately for the two sets of traders, rural in Allahabad district in UP, and urban in Jabalpur city and environs in Madhya Pradesh. For context keep in mind that Jabalpur is a city of 1.4 million of which roughly half live in the city proper (called the “army cantonment”); around that are the peri-urban areas in which operate the mills and the traders. The table shows that the rural and the urban traders are all male, Hindu, and average middle age. Like the millers, they have twice the education of the farmers. Nearly all are in traders associations. Few are farm leaders or village leaders. The rural traders, and especially the urban traders, have large and expanding networks of traders, retailers, and millers. Neither group brands its product, nor exports, nor have web pages. The urban traders started far before the rural traders, as the latter started only in the mid 2000s and the urban, three decades ago. Interestingly, none is formal sector (registered with the government) and nearly none are representatives nor owners of mills (making this situation differ markedly from China’s). Contrary to our expectation, the rural paddy traders are typically not farmers (only a tenth are). Neither group is fully specialized, though the urban traders nearly are.
270

Only two thirds of the rural traders operate from the wholesale market (while all the urban do). They tend to rent, for a modest amount per year. By contrast, it is surprising how few traders (none in rural areas and only a tenth of urban) operate warehouses. Only half the traders own trucks; urban especially tend to rent. The latter has in fact expanded sharply over the past five years. The traders’ working capital needs differ enormously: the urban trader’s is nearly 10 times more than the rural trader, reflecting the scale difference. Moreover, the table shows that since startup the working capital roughly doubled – again showing the expansion and investment of these small firms. Only about a half of the working capital is borrowed by either group.
271

Table 5.20 Characteristics of paddy and rice traders Characteristics Type//Location of Trader
Rural Trader in Allahabad tr Urban trader in Jabalpur Overall
Sample size 70 70 140
1. Demography of the traders
Mean age of trader (years) 45 48 45
Gender of trader (% male) 100 100 100
% of traders who are Hindu 100 97 98
2. Human & Social Capital
Mean years of education (years) 10 *** 12 12
% of traders are member of any traders’ association in 2011 83 100 91
% of traders who are members of any rice miller’s association 2 0 1
% of traders who are village heads 0 0 0
% of traders who are lead farmers in the village 3 0 2
% of traders who are members of the panchayat. 12 0 6
Total 100 100 100
number of paddy and rice wholesalers the trader knows 12 ** 50 30
number of paddy and rice wholesalers the trader knew at start up 4 *** 10 6
number of paddy and rice brokers the trader knows 12 * 50 30
number of paddy and rice brokers the trader knew at start 4 *** 10 7
number of traditional rice retailers the trader knows 10 ** 100 55
number of traditional rice retailers the trader knew at start 4 *** 20 12
number of supermarket buying agents the trader knows 2 ** 10 6
number of supermarket buying agents the trader knew at the start 2 5 3
272

% of traders who have own brand for rice 0 0 0
% of traders who export rice 0 0 0
% of traders who have a web portal for rice business 0 0 0
3. Characteristic of the business
Years since start-up (years) 7 * 30 13
% of traders registered with government as a company in 2011 0 0 0
Mean tax (fixed fee and/or fee per stall) paid in 2011 (USD) nr nr nr
% of traders who is a representative for specific mill companies 1 0 1
% of traders who own mills, other than the one that they represent 0 - 0
% of traders who are also rice/paddy farmers 2.64 0 6
For traders who are paddy farmers, size of the paddy farm in ha. 20 -
For traders who are farmers, % of paddy sold from own production 32 *** 0 16
Mean % of rice/paddy trade revenue in traders total trade 56 75 67
% of traders have (own or rent)a stall in this wholesale market 63 100 82
a) of those who own/rent stall, % of traders own a stall 36 57 47
b) of those who own/rent stall, % of traders rent a stall 64 43 53
Mean size of all the stalls owned/rented (square meters) 200 *** 300 250
Of those who rented stall, Mean USD paid per month 23 30 27
% of traders have (own or rent)a stall in 2007 38 100 69
a) of those who own/rent stall, % of traders own a stall 2007 40 57 49
b) of those who own/rent stall, % of traders rent a stall in 2007 60 43 51
5. Warehouses
% of traders have (own or rent) a warehouse in 2011 0 10 5
a) of those who own/rent warehouse, % of traders own warehouse - 30 30
273

b) of those who own/rent warehouse, % of traders rent - 70 70
Of those who rented warehouse, Mean USD paid 0 ** 741 417
% of traders have (own or rent) warehouse in 2007 0 10 5
a) of those who own/rent warehouse, % of traders own in 2007 - 30 30
b) of those who own/rent warehouse, % of traders rent - 70 70
6.Vehicles
Mean value of transport means owned by the trader 2011 (USD) 500 *** 800 660
% of traders who own truck for business in 2011 60 55 58
% of traders who own truck in 2007 55 52 53
a) Of those who own trucks in 2011, Mean numbers of trucks 1 2 1
b) Of those who own trucks, Mean USD of initial purchase value 617 *** 908 763
% of traders who rent a truck SERVICE 2011 51 84 66
% of traders who rent a truck SERVICE 2007 42 45 43
7. Working capital (money to pay labor and purchase paddy or rice and pay rent)
a) Mean monthly working capital in 2011 156 ** 1200 678
b) Mean monthly working capital in 2007 106 * 920 513
c) Mean monthly working capital in year of start-up 68 * 580 324
a) in 2011, Mean over working capital, % borrowed 57 45 51
b) in 2007, Mean over working capital, % borrowed 35 44 39
c) in year of startup, Mean over working capital, % borrowed 59 *** 35 47
274

Table 5.21.a. shows bagging, labeling, and pricing of paddy by rural and urban traders in March 2012 (the month before survey). The reader will notice that paddy sales are not only done by the rural traders in Allahabad, but also by a few of the peri-urban traders in Jabalpur, buying from various sources for the mills in the peri-urban area. Two-thirds of the rural paddy traders are simply selling loose, not bagged. None of the urban traders sell loose. None of the traders uses a brand, but the urban traders bag and label the bags with the consignment information. This is a number along with the source mentioned, say if this is coming from say the society at the Bara block, and Jasra village, the consignment no. will be something like, PAC BARA JASRA 12345 (say, some serial number of the bag.), or if it is from Regional food corporation Allahabad, it will be RFC Allahabad 3456 (some serial no. assigned to the bag by the RFC office).
Note that there is a rather large price spread between purchase price and sales price of paddy for both sets of traders, at 19%.
Table 5.21.b. shows rice sale characteristics in March 2012 (the month before survey). Note again that there is no sharp divide between rural traders and paddy and urban traders and rice: this time we see that more than half the rural traders also trade in rice from the rural mills, while almost all the urban traders trade in rice. They sell loose and packed. It is interesting that half of both sets sell loose rice, not just bagged rice. Half the traders are selling rice labeled with the mill name on it (as we found to be common practice in China and Bangladesh).
Table 5.21.a. Characteristics of all the paddy sold by the traders in March 2012 (the month before survey) Characteristics Type/Location of Trader
Rural Trader
tr Urban trader
Overall
Sample size 69 5 74
Paddy products sold, bagged or loose 2 2 2
1. Packaging and labeling information
For traders selling paddy (N=74 traders):
% of traders who sell loose (not bagged rice) 68 0 34
% of traders who sell packed, labeled with consignment, but without brand
25 100 63
% of traders who sell packed without information 7 0 3
2. Price information in March 2012
2.1. Selling price, USD/ton
Mean selling price of common non-basmati 170 176 173
2.2. Purchase price
Mean purchasing price of common 130 142 136
275

Moreover, the price spread between buying and selling rice is much less than for paddy: for rice it is only about 4-6% (this is a more “normal” price spread than the large one found for paddy). The spreads are not too different over the different grades (slightly more for medium than for common). Note also that nearly consistently, the Jabalpur rice prices (buy or sell) are 16-17% above those of Allahabad: this can be due to the transport cost differential as well perhaps as demand conditions. Finally, note that both rural and urban traders deal not just in common grade rice, but also in medium. As the sample farmers are not producing the latter, this implies that traders are getting rice from mills sourcing from a wider base than our farm sample. Table 5.21.b. Characteristics of all the rice sold by the traders in March 2012 (the month before survey) Characteristics Type/Location of Trader
Rural trader
Urban wholesaler
Overall
Sample size 43 65 108
Mean of how many kinds of rice products the trader sold (products differ over type of packaging (loose or packed)
2 2 2
1. Packaging and labeling information in March 2012
% of traders who sell loose (not bagged rice) 55 45 50
% of traders who sell paddy packaged and labeled with mill name but without brand
45 50 48
% of traders who sell packed with mill name 0 0 0
% of traders who sell packed without any information 0 5 2
2. Price information in March 2012
2.1. Selling price
Mean selling price of common non basmati (USD/ton) 240 280 270
Mean selling price of medium grade non basmati (USD/ton) 260 310 280
2.2. Purchase price
Mean purchasing price of common non basmati (USD/ton) 230 270 250
Mean purchasing price of medium grade non basmati 250 290 270
Table 5.22 shows rice traders seasonality. In all seasons, the urban trader deals in about three times the volume of rice per day compared with the rural trader. Moreover, interestingly, there is sharp seasonality both among rural traders (expected) and urban traders, with a sharp peak after the harvest (which occurs in about September/October) in December, and a sharp trough in spring. The
276

low capacity in warehouses, along of course with the single production season, may be the cause of this fluctuation. Table 5.22. Rice Traders Seasonality: Mean tons/day (N=140) Seasonality Type/Location of Trader
Rural trader Urban trader Overall
March, 2012 0.7 2.5 1.6
October, 2011 0.4 2.2 1.3
December 2011 1.2 4.3 2.75
March, 2007 0.3 2.0 1.1
December, 2007 2.1 4.5 3.3
5.4.1.2. Conduct: procurement and sales, value-chain financing, and other services of the rice and paddy traders Table 5.23.a. shows traders’ paddy procurement sources. The rural traders in Allahabad buy nearly all their paddy from the Allahabad district. Interestingly, as Allahabad is by far the largest and by far the closest paddy producing district to Jabalpur, even paddy traders in Jabalpur get most of their paddy from UP in general and even Allahabad in particular. Rural traders are buying mainly (80%) common grade paddy, which is the main product of Allahabad; by contrast, as the Jabalpur traders go somewhat further afield, they source half-half, common and medium. Not surprisingly, for common, which dominates the local supply, nearly all the paddy is sourced direct from farmers, with the wholesale market playing only a small role for this in Allahabad district. However, note that for medium grade, the traders have to buy it from wholesale markets, as it must come from further afield. This illustrates the inter-spatial relations in the rice market in India. Table 5.23.a. Traders’ Paddy Procurement Sources (% of volume in the year) Scale Rural Trader in
Allahabad Urban trader
in Jabalpur Overall
Time 2011 2007 2011 2007 2011 2007
Sample size (only traders dealing in paddy)
69 70 5 5 74 75
Share of traders that buy paddy 98 100 7 7 53 54
1. The location of the sources (% of total volume purchased)
a) From the survey villages in UP 18 16 0 0 9 8
b) from other village but in the survey district
80 79 67 67 73 73
c) from other districts in UP 2 5 20 18 11 11
277

d) from other states in India 0 0 13 15 6 7
Total 100 100 100 100 100 100
2. % of common paddy (of total bought) 80 70 50 50 65 60
3. % of medium grade paddy purchased 20 30 50 50 35 40
4. Method of procurement of common paddy (% of volume)
a) From farmer 80 75 100 100 90 88
b) Wholesaler in wholesale market 4 10 0 0 2 5
c) Wholesaler outside wholesale market 16 15 0 0 8 7
d) Brokers in wholesale market 0 0 0 0 0 0
e) Brokers outside wholesale market % 0 0 0 0 0 0
f) Government agency on wholesale market
0 0 0 0 0 0
g) Government agency outside wholesale market
0 0 0 0 0 0
Total 100 100 100 100 100 100
5. Method of procurement (from whom purchased)for medium grade paddy (% of medium grade paddy volume purchased)
a) From farmer 20 10 10 10 15 10
b) Wholesaler in wholesale market 10 10 0 0 5 5
c) Wholesaler outside wholesale market 70 80 90 90 80 85
d) brokers in wholesale market 0 0 0 0 0 0
e) Brokers outside wholesale market % 0 0 0 0 0 0
f) Government agency on wholesale market
0 0 0 0 0 0
g) Government agency outside wholesale market
0 0 0 0 0 0
Total 100 100 100 100 100 100
Table 5.23.b. shows traders’ rice procurement sources. Nearly all the rice procured by the Allahabad traders is bought in the survey district, and the rest from other districts in UP. Striking is the fact that also the Jabalpur traders, which is the closest large city to the production zone, also source more than half their rice from the UP, and even a third from Allahabad itself (confirming what we had been told by key informants before the survey). Moreover, while common grade rice is overwhelmingly the choice of the Allahabad traders, given its dominance in the district, common is only two-thirds of the rice bought by Jabalpur traders, who clearly source their medium grade rice from elsewhere. The table also shows that off-market traders in the cities are important players for both common and medium rice, with about half the market, while traders in wholesale markets have only about a fifth of the market in both places. Finally, for common rice, in both places, traders source common rice direct from the
278

mills, but note that it is only 20% in the rural areas (dominated by medium sized mills) and 13% in the Jabalpur area, again very dominated by medium sized, not small sized mills. For medium rice that is only 3 and 13%, dominated this time by large mills and medium mills. Again, small mills have very little role.
Table 5.23.b. Traders’ Rice Procurement Sources (% of volume in the year) Scale Village trader
in Allahabad Urban
trader in Jabalpur
Overall
Time 2011 2007 2011 2007 2011 2007
Sample size (only traders dealing in rice) 43 44 65 70 108 114
Share of traders who sold any rice 61 62 93 100 77 81
1. Location (% of total volume purchased)
a) From the survey blocks in Allahabad 18 16 0 0 9 8
b) from other blocks in Allahabad 80 79 67 67 73 73
c) from other districts in UP 2 5 20 18 11 11
d) From Madhya Pradesh 0 0 5 6 2 3
d) from other states in India 0 0 8 9 4 4
Total 100 100 100 100 100 100
2. % of common paddy (of total bought) 80 70 50 50 65 60
3. % of medium grade paddy purchased 20 30 50 50 35 40
4. Method of procurement of common rice
a) village trader (% of total volume) 12 10 7 5 10 8
b) trader in wholesale market 16 20 27 29 21 25
c) trader outside wholesale market but in city 52 45 53 55 52 50
d) Government agency (from reserves) 0 1 0 0 0 1
e) Large mill 2 0 0 0 1 0
f) Medium size mill 13 15 12 10 12 12
g) Small mill 5 9 1 1 3 5
Total 100 100 100 100 100 100
5. Method of procurement of medium rice
a) village trader 10 10 1 2 5 6
b) trader in wholesale market 35 30 33 32 34 31
c) trader outside wholesale market but in the city 52 57 53 56 53 56
d) Government agency (from reserves) 0 0 0 0 0 0
e) Large mill 2 2 6 5 4 4
f) Medium size mill 1 1 6 4 3 2
g) Small mill 0 0 1 1 1 1
Total 100 100 100 100 100 100
279

Table 5.24.a. shows traders’ paddy sales destinations. While the paddy traders in Allahabad sell three quarters of their paddy in UP, as expected, it is of interest that they sell not only increasing amounts (over the five years) to Jabalpur, but also to other states (than to MP), together from 20% to 30% of their paddy over the five years. By contrast, nearly all the paddy from the traders in Jabalpur is merely sold locally to the peri-urban mills. Moreover, for common as well as medium paddy, the concentration in the mill sector is clearly seen: traders are selling nearly 40% of their paddy just to the small number of large and medium mills, and the other 40% to small mills; this concentration is even clearer in Jabalpur, where 57% is sold to the large and medium mills. Interestingly, only about 5-8% of the paddy is being sold by the traders to the government; again, the government prefers to buy from the farmers, or just buy rice from the mills after milling and not do the custom milling. Note that the nearest city in MP from Allahabad is Rewa, distant 200 km; but Rewa only has a population of 235,422. Jabalpur, with 1.4 million, is 360 km distant, and is of course a much bigger market. On the other hand, Lucknow, the capital of UP, is close to the Allahabad district; but it is served already mainly by the very important rice belt in the center-west (that we studied in the prior study): the Shahjahanpur, Hardoi, Kheri swath.
Table 5.24.a. Traders’ Paddy Sales Destinations (% of volume in the year) Scale Rural trader in
Allahabad Urban trader
in Jabalpur Overall
Time 2011 2007 2011 2007 2011 2007
Sample size (traders selling paddy) 69 70 5 5 74 75
Share of traders that sell paddy 98 100 7 7 53 54
1. Destination (% of volume)
a) In study district in UP 65
70 0 0 33 35
b) in other districts of UP 10 10 0 0 5 5
c) In Jabalpur 15 10 95 97 54 53
d) In other states in India 15 10 5 3 8 7
Total 100 100 100 100 100 100
2. % of common in total 85 80 50 50 67 65
3. % of medium in total 15 20 50 50 33 35
4. To whom common grade sold
a) to large mill 4 3 25 27 15 10
b) to medium mill 34 36 32 33 33 35
c) to small mill 39 40 33 33 36 37
280

d) to wholesale market 15 12 0 0 7 6
e) to village trader 0 0 5 3 2 2
f) to government 8 5 5 4 7 4
Total 100 100 100 100 100 100
5. To whom medium sold
a) large mill 14 13 25 27 19 20
b) medium mill 34 36 22 23 28 30
c) small mill 39 40 33 33 36 36
d) wholesale market 5 2 0 0 3 1
e) off-market wholesaler 0 0 15 13 8 6
f) government 8 9 5 4 6 6
Total 100 100 100 100 100 100
Table 5.24.b. shows traders’ rice sales destinations. Again, it is not surprising that most of the milled rice sold by traders from Allahabad is to the UP; but it is interesting that the share to Jabalpur, at 320km distant, was rising from 15 to 20% over the five years. By contrast, the rice traders in Jabalpur were quite externally oriented – selling but half of their rice in their district, and as much as a third to states other than MP and UP. Traders in both places sold two-thirds to the traditional retailers and a quarter to consumers – and extremely little to supermarkets. Table 5.24.b. Traders’ Rice Sales Destinations (% of volume in the year) Scale Village trader Urban
traders Overall
Time 2011 2007 2011 2007 2011 2007
Sample size 43 44 65 70 108 114
Share of traders who sold any RICE 61 62 93 100 77 81
1. The location of the destinations (% of total volume sold)
a) In study district in UP 50 55 0 0 25 28
b) in other districts of UP 30 30 5 7 18 19
c) In Jabalpur 20 15 50 49 35 32
d) in other districts in MP - - 15 9 15 9
e) In other states in India 0 0 30 35 7 13
Total 100 100 100 100 100 100
2. % of common rice in total rice sold (% of volume sold)
90 86 65 66 76 76
3. % of medium grade rice in total rice sold (% of volume sold)
10 14 35 36 24 24
4. Method of sale (to whom sold)for common rice (% of common rice volume sold)
a) trader on wholesale market 0 0 0 0 0 0
281

b) trader off-market urban 12 10 7 5 10 8
c) government agencies 0 0 0 0 0 0
d) traditional retailer 65 60 65 65 64 62
e) modern retailer 1 1 1 1 1 1
f) processors of other processed food 0 0 0 0 0 0
g) hotel, restaurants, institutions 0 0 0 0 0 0
h) consumer directly 20 28 27 29 23 29
Total 100 100 100 100 100 100
5. Method of marketing (to whom sell) for medium variety rice ( % of medium variety rice volume sold)
a) trader on wholesale market 0 0 0 0 0 0
b) trader off-market urban 9 6 7 5 7 5
c) government agencies 0 0 0 0 0 0
d) traditional retailer 70 65 67 65 69 65
e) modern retailer 1 1 1 1 1 1
f) processors of noodles and other processed food
0 0 0 0 0 0
g) hotel, restaurants, institutions 0 0 0 0 0 0
h) consumer directly 20 28 27 29 23 29
Total 100 100 100 100 100 100
Table 5.25.a. shows rice and paddy traders value chain finance. In contrast to conventional wisdom, we find that very few traders pay any advance to their suppliers. The few that do, do so for a short transaction cycle of a few weeks. By contrast, as we have usually found in this study, the suppliers are instead paid with a delay, so that the traders derive credit from those upstream. But again, this is only for a week, for a short transaction cycle. Symmetrically, few clients provide an advance to the trader, and if they do, again it is for a short transaction cycle. In short, about 10% of the traders or their clients provide advances, and just for a short time, while late payment is the norm.
Table 5.25.a. Rice and paddy traders’ value chain finance Credit Type/Location of Trader
Rural traders in Allahabad
Urban traders in Jabalpur
Overall
Sample size 70 70 140
1. Payment to supplier (farmers, mills)
% of traders who pay advance to suppliers 5 12 8
If pay advance, mean days before the transaction 10 15 12
282

% of traders who pay with delay to suppliers 65 78 72
If pay with delay, mean days delayed after the transaction 7 10 8
% of traders pay in cash (rather than in check) to suppliers 90 87 89
% of traders pay by transfer accounts or check to suppliers 10 13 11
2. Payment form the clients
% of traders whose clients pay advance to those traders 10 15 12
If received advance from clients, mean days before the transaction
7 7 7
% of traders whose clients pay with delay to traders 72 54 63
For traders having clients paying with delay, mean days delayed
20 15 18
% of traders get paid in cash by clients (instead of check or transfer)
95 97 96
% of traders get paid through transfer accounts or check 5 3 4
Table 5.25.b. shows loans taken by the traders. The survey shows that very few rural traders, and only a minority of urban traders, took loans. Those that did used them to buy rice. The amounts borrowed were quite limited relative to their turnover. For rural traders, they were all from informal sources; for urban traders, they from those as well as cooperative banks. The interest rates of the latter were merely at the lower end of the usual commercial scale, and traders were required to present collateral. The informal rates were several percentage points higher, but it was not necessary to present collateral, and the process was much faster. Table 5.25.b. Loans taken by the trader in 2011 Loan Type/Location of Trader
Rural trader
Urban traders
Overall
Sample size
% of traders took loan in 2011 5 22 14
% of traders borrowed for paddy/rice purchase 100 100 100
For those who borrowed, amount of USD borrowed 238 543 389
Sources of the loans (among those who borrowed)
a) % of traders from regional rural banks 0 0 0
b) from cooperative banks 0 56 28
c) from commercial banks 0 0 0
d) from nationalized commercial banks 0 0 0
e) from informal sources 100 44 72
For those from formal sources (all but (e))
a) time period of loan (in months) - 12 12
283

b) interest rate per month - 8.5 8.5
c) % of traders giving collateral/pledge - 100 100
d) Mean days took to go through the procedures - 30 30
For those borrowing from informal sources (e)
a) time period of loan (in months) 12 12 12
b) interest rate per month 10 10.25 10.13
c) % of traders asked to give collateral/pledge 0 2 1
d) Mean days took to go through the procedures 7 5 6
Table 5.26 shows that the traders provided remarkably few services to suppliers or clients, neither in picking up the product nor branding nor providing bagging to suppliers. Table 5.26 Rice and paddy traders and other market practices and services (in % of traders) Other practices and services Village
trader City
wholesaler All
Sample size 70 70 140
% of traders who picked up product and delivered in own truck 3 5 4
% of traders who branded products when sold to clients 0 0 0
% of traders who provided packing bags to suppliers 9 0 4
5.4.1.3. Performance of the trader segment Table 5.27 shows yearly (“fixed”) operating costs of rice and paddy traders. It is fascinating that just like for mills, there are clear economies of scale, as the cost per ton is twice as high for the much smaller rural trader than for the larger urban based trader. About two-thirds of the cost are labor; the larger urban traders in addition have a portion of costs going to the warehouse rental. Other than that, it is interesting that the structure of the costs is roughly similar between the two sets. Table 5.27 Yearly (“fixed”) operating costs of rice and paddy traders Operating costs Rural
trader Urban trader
Overall
Sample size 70 70 140
1. Mean Annual Costs besides labor cost, in USD
Electricity 18 (2) 26 (1) 22 (1)
Diesel to generate electricity 33 (3) 0 (0) 16 (1)
Water 14 (1) 23 (1) 19 (1)
Communication fee(fax, phones) 48 (5) 120 (6) 83 (6)
284

Maintenance of equipment and vehicles (other than own hired labor)
19 (2) 81 (4) 50 (3)
Warehouse/ rental 69 (7) 282 (14) 176 (12)
Stall building/ rental 7 (1) 9 (1) 8 (1)
Diesel for own and rented vehicles 80 (8) 82 (4) 81 (5)
Taxes 0 (0) 12 (1) 6 (1)
Insurance - - -
Other costs (re-package ) 69 (7) 0 (0) 26 (2)
2. Labor cost
Own labor imputed at market wage 500 600 550
Hired labor besides drivers (both permanent and temporarily)
502 (51)
1041 (51)
772 (52)
Drivers 126 (13)
347 (17)
237 (16)
3.Total costs (summing up all of above, except for own labor imputed at market wage rate) in USD
985 2023 1496
4. Total ton of rice moved annually 207 810 508.5
5. Cost per ton (USD/ton) (obtained by dividing 3 by 4) 4.8 2.5 2.9
6. Cost per ton of paddy equivalent ( obtained by dividing 5 by 1.5, since 1 ton of rice is equal to 1.5 tons of paddy)
3.2 1.7 2.0
Table 5.28 shows the last transaction of paddy, to buy and then sell. The overwhelming portions of the costs are the bagging and the loading and unloading, and of course the transport.
Table 5.28 Variable costs of village traders in last paddy transaction in USD/ton (% of total in parentheses) Cost All
Sample size
1. Last transaction of paddy purchasing
1.1. costs
a) Cost of the bags 0.7 (17%)
b) Bagging and stitching costs of labor 0.8 (20%)
c) Loading and unloading labor costs ( fees or own costs) 1.1 (27%)
d) Weighing fees (costs) paid to market 0.05 (1%)
e) own transport costs of paddy (fuel + labor for your own vehicle) 0.68 (17%)
f) Cost of hired transportation of the paddy 0.7 (17%)
g) cost of personal transportation of the trader (separate from paddy transport) 0.0 (0%)
h) imputed cost of quantity wasted (physical waste in kg * paddy price) 0.0 (0%)
i) total cost in USD per ton for the transaction 4.03
1.2. Other information on the transaction
285

a) distance in time from the supplier to the trader (in mins) 30
b) Distance in km from the supplier 12
c) % of traders uses phone calls for the transaction 34
2. Paddy selling
a) Cost of the bags 0.7 (17%)
b) Bagging and stitching costs of labor 0.8 (19%)
c) Loading and unloading labor costs ( fees or own costs) 1.1 (26%)
d) Weighing fees (costs) paid to market 0.05 (1%)
e) own transport costs of paddy (fuel + labor for your own vehicle) 0.68 (16%)
f) Cost of hired transportation of the paddy 0.7 (17%)
g) cost of personal transportation of the trader (separate from paddy transport) 0.2 (5%)
h) imputed cost of quantity wasted (physical waste in kg * paddy price) 0.0 (0%)
i) total cost in USD per ton for the transaction 4.23
1.2. Other information on the transaction
a) distance in time from the client to the trader (in mins) 90
b) Distance in km from the client 65
c) % of traders uses phone calls for the transaction 56
Table 5.29 shows variable costs rice for wholesale traders (on and off market) in the last transaction. As with paddy, the lion shares of the costs are in the bagging, the loading/unloading, and the transport.
Table 5.29 Variable costs for wholesale rice traders (on & off market) in last transaction in USD/ton (% of total in parentheses) Cost All
Sample size
1. Last transaction of rice purchasing
1.1. costs
a) Cost of the bags 0.0 (0%)
b) Bagging and stitching costs of labor 0.0 (0%)
c) Loading and unloading labor costs ( fees or own costs) 0.8 (30%)
d) Weighing fees (costs) paid to market 0.05 (2%)
e) own transport costs of rice (fuel + labor for your own vehicle) 0.7 (26%)
f) Cost of hired transportation of the rice 0.9 (34%)
g) cost of personal transportation of the trader (separate from rice transport) 0.2 (8%)
h) imputed cost of quantity wasted (physical waste in kg * rice price) 0.0 (0%)
j) total cost in USD per ton for the transaction 2.65
1.2. Other information on the transaction
a) distance in time from the supplier to the trader (in minutes) 123
b) Distance in km from the supplier 80
286

c) % of traders uses phone calls for the transaction 70
2. rice selling
a) Cost of the bags 0.0 (0%)
b) Bagging and stitching costs of labor 0.0 (0%)
c) Loading and unloading labor costs ( fees or own costs) 0.8 (41%)
d) Weighing fees (costs) paid to market 0.05 (3%)
e) own transport costs of rice (fuel + labor for your own vehicle) 0.5 (26%)
f) Cost of hired transportation of the rice 0.6 (31%)
g) cost of personal transportation of the trader (separate from rice transport) 0.0 (0%)
h) imputed cost of quantity wasted (physical waste in kg * rice price) 0.0 (0%)
i) total cost in USD per ton for the transaction 1.95
1.2. Other information on the transaction
a) distance in time from the client to the trader (in mins) 20
b) Distance in km from the client 10
c) % of traders uses phone calls for the transaction 67
Table 5.30 shows rice and paddy trader profit rates (in %) in 2011. Contrary to conventional wisdom, the profit rates are actually quite modest, and would be even more so if amortization of vehicles were counted in. Table 5.30 Rice and Paddy Trader Profit Rates (in %) in 2011 Profit Rate Village
trader City
wholesaler All
Non-Basmati common paddy 18% -1% -
Non-Basmati common rice 7% 22% 15%
5.5. Downstream—Rice Retail Transformation
In this section, the results of the urban retail survey are assessed to ascertain the extent to which the retail segment still uses traditional methods, to what extent they have transformed to using new methods, and what are the key characteristics of that transformation.
5.5.1. Structure of Rice Retail
In our analysis of the structure of rice retail in India, we study both the structure of traditional rice retail and then, that of supermarket rice retail. 5.5.1.1. Structure of Traditional Rice Retail
287

Table 5.31 shows characteristics of traditional rice retailers. The traditional rice retailers are all male, average middle age, not lower caste, and nearly all Hindu, and as all the other off-farm actors in the supply chain, have on average twice the education as the farmers. At least by looking at the low share of firm operators who have a BPL (below poverty line) card, they are not among the urban poor. The firms on average started in the late 1990s. Rice is only a quarter of the food sales of the firms. At present in Jabalpur, supermarkets are not yet densely penetrated, as the nearest supermarket is still at some 5 km from the wetmarkets (compare that with 1-2 km in our Zhejiang study in China). The retailer is however still in competition – with his fellows, as there are on average 15 other small shops also selling rice in the average wetmarket in our sample.
Table 5.31 Characteristics of traditional rice retailers, N= 60 Characteristics
1. Demography of the retailer
Mean age of retailers (years) 43
Gender of retailers (% male) 100%
% of retailers who are members of the schedules caste/ scheduled tribes
8
% of retailers who are Hindu 90
2. Human and Social Capital
Mean years of education (years) 12
% of retailers who possess :
BPL ration card 5
Antodaya ration card 3
Number of traders the retailer has relation with in 2011 4
Number of traders the retailer has relation with in 2007 3
Number of traders the retailer has relation with when start-up 3
3. Characteristic of the business
Years since start-up retail business of food products (years) 17
Years since start-up rice retail business (years) 15
% of retailers also sell other food products in 2011 100
% of rice in his/her total retail sales in 2011 25
The nearest rice wholesale market (km) 4
The nearest supermarket that sells rice (km) 5
Share of traditional retailers in the sample that are located in wetmarket 8
Mean number of retailers in the same wet market in 2011 18
Mean number of retailers in the same wet market you sold rice in 2007 15
The above table shows how small the rice turnover is in the typical shop, and how infrequent is the supply transaction – one time per 20 days. If the retailer
288

operates all the days of the year, this is but around 7-8 tons sold all year; this is what a wholesaler moves in a day.
Table 5.22 Turnover of Traditional Rice Retailers (average over all observations over N=60) Transaction
Sales per day (KG) 23
Size of the last transaction’s lot (full lot bought and then retailed) (tons) 0.5
The small shop/stall has but two family members and one hired person, a bicycle or small cart, a phone, a tiny stall, modest working capital (barely expanding), of which half is borrowed, from informal sources. Table 5.33 Labor and Capital use per traditional rice retailer in 2011 Labor and capital use
Mean number of family members working in the business 2
Mean amount spent on hired labor per month in USD: 60
Retail assets in USD in 2011 (vehicles ONLY; other assets we did not value ) 40
Number of scales in 2011 1
Number of scales in 2007 1
Number of phones in 2011 1
Number of phones in 2007 1
Retail assets in USD in 2007 (vehicles ONLY; other assets we did not value) 40
Mean Square meters of shop in 2011 28
Mean Square meters of shop in 2007 28
Working capital (to buy rice and pay for hired labor and rental fee) per month
Mean working capital in 2011 in USD (for all products not just rice) 5275
Mean working capital in 2007 in USD 4975
Mean working capital when start-up in USD 3600
Mean % of the working capital borrowed, in 2011 50
Mean % of the working capital borrowed, in 2007 60
Mean % of the working capital borrowed, during start up year 60
Table 5.34 shows that the procurement system (for the purchase each 3 weeks, say 15 times a year) is simple: the small retail just goes five km to the nearby wholesale market and provisions. Other methods are minor.
289

Table 5.34 Procurement sources of traditional rice retailers, average over retailers (N=60 retailers) Procurement sources
% of rice bought from broker in the wholesale market 92
% of rice bought direct from mills 4
% of rice bought from other retailers 4
Table 5.35 shows traditional rice retailer procurement transport methods. That the asset holding of the retailer is so small (40 dollars, the cost of a bicycle or tricycle) but he uses mainly a rental of (or his own) pick-up truck or van to go to market, implies that he mainly hires this service.
Table 5.35 Traditional rice retailer procurement transport methods (average over N=60) Transport methods
Total time spent at place of purchase in hours 2
Means used for transport and their %:
% of retailers that used small trucks/ pick ups 35
% that used van 60
% that used motorbike 5
% that used others 0
Table 5.36 shows that in the last transaction, nearly all the retailers used a cell phone to arrange the deal from every aspect.
Table 5.36 Contact methods and practices of traditional rice retailers (in the last transaction), N=60 retailers Contact method
% of retailers arranged business through cell phone 94
Among those, % of them discuss price on the cell phone 100
Among those, Mean number of calls made for one transaction 4
Table 5.7 shows frequency of traditional retailers’ buying from a seller and reasons for choice of seller (percentages) (most general type of transaction). The traditional retailer is very “loyal” to his wholesaler, repeatedly buying from the same one. The reasons range around quality and price.
290

Table 5.37 Frequency of traditional retailers’ buying from a seller and reasons for choice of seller (percentages) (most general type of transaction) Frequency of purchase
% of retailers who buy “always” or “regularly” from this seller 93
Years selling to retailer 5
Retailer’s reason for buying from this seller, % saying this reason “important”
Always has large quantities 60
Offers better prices 98
Offers higher quality 68
Allows retailer to buy on credit (pay supplier later) 67
Offers loans in case of need (marriage, sickness) 0
Just from habit retailer goes to him 0
Organizes transactions quickly and retailer loses little time 0
Table 5.38 shows traditional rice retailers, information, and quantity: assessment of last transaction (% of retailers). The retailer in general felt that he had enough information and knew the weight of the lot sold to him, although it was seldom (but 40%) weighed in front of him. And nearly all the wholesalers from whom he bought, have scales, so he must feel that if there is doubt, immediate verification was possible.
Table 5.38 Traditional rice retailers, information, and quantity: assessment of last transaction (% of retailers), N=60 retailers Quantity and information % of retailers
Had enough information on quantity of produce in the lot, before buying 65
Knew the exact weight of the lot 78
Lot weighed in front of them 42
Buying from seller using electronic/mechanical scale 89
Table 5.39 shows traditional rice retailers credit with suppliers and customers. The interaction of the retailers with the credit market is very minor. Few retailers give traders an advance; after multiplying the share of retailers by the share of traders who receive these advances, one comes to a mere 3% of traders getting those advances. But the advance is only a week. Rather payment with delay is nearly the norm – but again only for the transaction cycle of a week. The consumers also do not pay in advance. And, very in contrast with conventional wisdom, only 7% of the consumers “buy on credit”.
291

Table 5.39 Traditional rice retailers credit with suppliers and customers, N=60 retailers Credit
1. Payment to supplier
% of retailers who pay advance to suppliers (pay some money before getting the rice)
15
% of suppliers who get advance, of average retailer who gives advances 20
If receive advance, mean days before the transaction 7
retailers who pay with delay to suppliers (pay for rice after receive it) 93
If pay with delay, mean days delayed after the transaction 7
% of retailers pay in cash (rather than in check) to suppliers 85
% of retailers pay by transfer accounts or check to suppliers 15
2. Payment from the clients
% of retailers whose customers pay advance to retailers (average over retailers) 7
If received advance from clients, mean days before the transaction 10
% of retailers whose clients pay with delay to retailers (means retailers de facto give consumer credit to clients)
28
% of customers allowed pay with delay, of retailer who allows payment with delay 12
For retailers having clients paying with delay, mean days delayed after the transaction
7
% of retailers get paid in cash by clients (instead of check or transfer) 89
% of retailers get paid through transfer accounts or check 11
3. Loans taken by the retailer in 2011
% of retailers took loan in 2011 1
% of retailers borrowed for rice purchase 0
e) % of retailers borrowed from informal sources 100
Table 5.40 shows traditional rice retailers, against conventional wisdom, nearly do no home delivery of rice.
Table 5.40 Traditional rice retailers home delivery, N=60 retailers Home deliver
% of retailers that home-deliver 2
Of those that home-deliver, % of turnover of the traditional rice retailers that goes to home delivery 5
Of those that home deliver, share that report that customer pays more for home delivery (% yes) 0
Characteristics (averaged over retailers who home deliver) of the clients who get home deliver
a) share that are elderly 0
b) share that are group customers (buying in large quantity) 0
c) share of customers live nearby 2
d) share of “regular” customers 98
292

Table 5.41 shows costs of the traditional rice retailer. The main fees are for transportation, stall fee, and any market fees. The cost structure is simple. Table 5.41 Costs of Traditional Rice Retailer, N=60 traditional retailers Cost
1. Operational costs per month in 2011 (USD), total
a) water 0
b) electricity 5
c) rental fee for shops 10
d) phone calls 3
e) maintenance/repair of vehicles 2
f) fee to market manager 0
g) tax 2
2. Operational costs per month in 2007 (USD), total
a) water 0
b) electricity 4
c) rental fee for shops 8
d) phone calls 3
e) maintenance/repair of vehicles 2
f) fee to market manager 0
g) tax 2
2. Variable costs (from the last transaction in 2012) USD/ton (average over all observations over N=60 retailers)
Labor costs to load/unload 0.8
Transportation costs from supplier to retailer total: 1.53
a) own transportation costs (estimate of fuel use and wage of hired driver of own vehicle) (IMPORTANT: zeroed-out average)
0.03
b) hired transportation service costs (IMPORTANT: zeroed-out average) 1.5
Fee at wholesaler in market or to broker that brought from source 0
Commission to wholesaler 0.6
Fee at retail place 0
Weighing fees 0.5
Transformation fees (bagging/packaging) 0.6
Total variable costs of the transaction 4.03
Note: There is no line for rental of vehicles over year as the retailers do not rent vehicles for the year, but just hire per transaction when need to. There is no line for rental of vehicles over year as the retailers do not rent vehicles for the year, but just hire per transaction when need to.
Table 5.42 shows traditional rice retail: quality & packaging. To satisfy poorer and non-poor clients, rice is sold loose and package by nearly all the stalls. The
293

packaged rice is labeled by the mill. Note that the types/grades of rice well exceed that available just from the Allahabad zone, reflecting that the retail draws from the Jabalpur wholesale markets which in turn source from many sources in various states.
Table 5.42 Traditional rice retail: quality & packaging (% of type of rice in all rice sold) Year 2011 2007
Sample size 60
1. % of retailers selling loose rice only 18
2. % of retailers selling packaged rice only 2
3. % of retailers selling both packaged AND loose rice 80
4. Mean number types of packaged rice sold the day the survey did 4
5. package information
% of rice that is packed and labeled with consignment number, mill name, and date without brand;
0
% of rice that is packed mill name 96
% of rice that is packed without any information 3
% of loose rice 1
6. % of different kinds of packaged rice
% of packaged basmati rice sold 10
% packaged non basmati common rice sold 18
% packaged non basmati medium grade rice sold 48
% packaged non basmati fine grade rice sold 24
7. price of different kinds of packaged rice
Mean price of packaged basmati rice sold (USD/ton) 2200
Mean price of packaged common non basmati rice sold (USD/ton) 400
Mean price of packaged medium grade non basmati sold (USD/ton) 420
Mean price of packaged fine grade non basmati sold (USD/KG) 560
8. Mean number of types of loose rice sold the survey did 3
9. % of different kinds of loose rice
% of basmati rice sold 5
% of non basmati common rice sold 95
% of non basmati medium grade rice sold 0
% of non basmati fine grade rice sold 0
10. price of different kinds of loose rice
Mean price of loose basmati rice sold (USD/KG) 1100
Mean price of loose non basmati common rice sold (USD/ton) 380
294
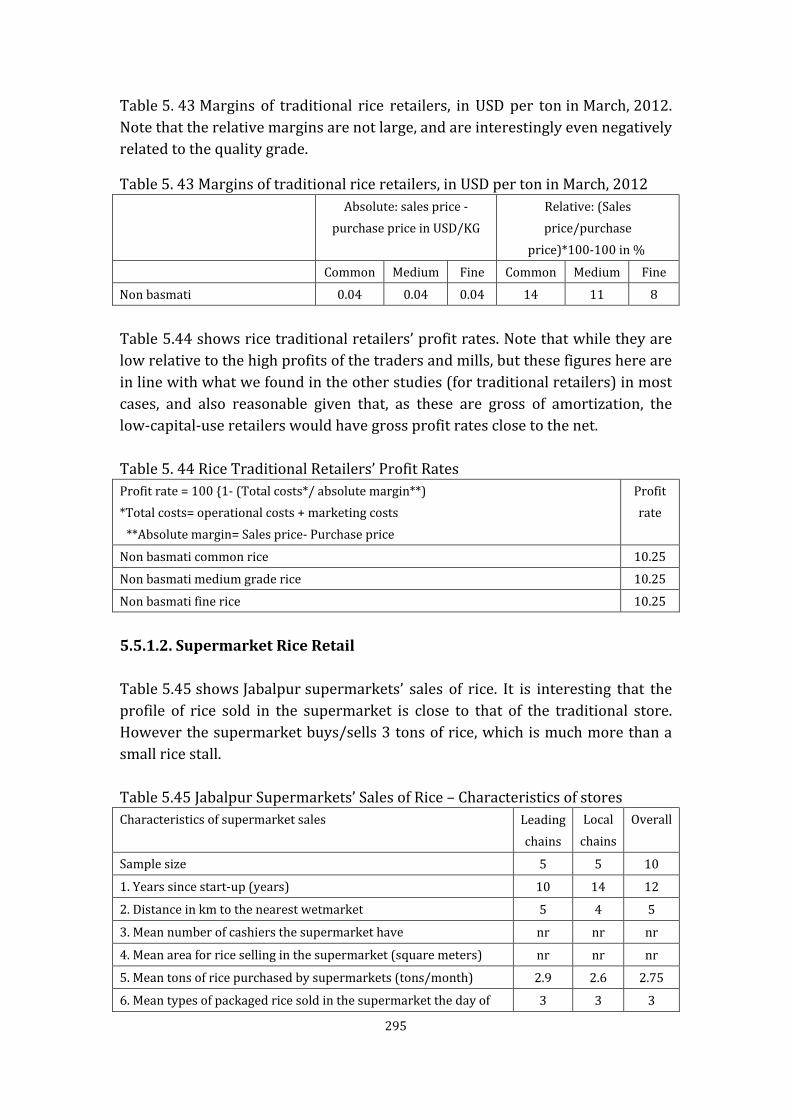
Table 5. 43 Margins of traditional rice retailers, in USD per ton in March, 2012. Note that the relative margins are not large, and are interestingly even negatively related to the quality grade.
Table 5.44 shows rice traditional retailers’ profit rates. Note that while they are low relative to the high profits of the traders and mills, but these figures here are in line with what we found in the other studies (for traditional retailers) in most cases, and also reasonable given that, as these are gross of amortization, the low-capital-use retailers would have gross profit rates close to the net. Table 5. 44 Rice Traditional Retailers’ Profit Rates Profit rate = 100 {1- (Total costs*/ absolute margin**) *Total costs= operational costs + marketing costs **Absolute margin= Sales price- Purchase price
Profit rate
Non basmati common rice 10.25
Non basmati medium grade rice 10.25
Non basmati fine rice 10.25
5.5.1.2. Supermarket Rice Retail Table 5.45 shows Jabalpur supermarkets’ sales of rice. It is interesting that the profile of rice sold in the supermarket is close to that of the traditional store. However the supermarket buys/sells 3 tons of rice, which is much more than a small rice stall. Table 5.45 Jabalpur Supermarkets’ Sales of Rice – Characteristics of stores Characteristics of supermarket sales Leading
chains Local
chains Overall
Sample size 5 5 10
1. Years since start-up (years) 10 14 12
2. Distance in km to the nearest wetmarket 5 4 5
3. Mean number of cashiers the supermarket have nr nr nr
4. Mean area for rice selling in the supermarket (square meters) nr nr nr
5. Mean tons of rice purchased by supermarkets (tons/month) 2.9 2.6 2.75
6. Mean types of packaged rice sold in the supermarket the day of 3 3 3
Table 5. 43 Margins of traditional rice retailers, in USD per ton in March, 2012 Absolute: sales price -
purchase price in USD/KG Relative: (Sales price/purchase
price)*100-100 in %
Common Medium Fine Common Medium Fine
Non basmati 0.04 0.04 0.04 14 11 8
295

survey (a type is by season, variety, size and weight of bag, and province origin)
7. package information
% of stores that sell loose rice only 0 0 0
% of stores that sell packaged rice only 0 100 50
% of stores that sell both packaged and loose rice 100 0 50
% of types of packaged rice sold with mill name 100 100 100
Mean KG of packaged rice sold in packs with mill names (KG/bag) 1 1.5 1.25
8. % of different varieties of packaged rice
Basmati: % of of packaged rice sold 20 25 23
Common non basmati: % of packaged rice sold 15 25 20
Medium non basmati: % of packaged rice sold 35 25 30
Fine grade non basmati: % of packaged rice sold 30 25 27
9. price of different kinds of packaged rice at survey time (March 2012)
Mean price of packaged basmati rice sold (USD/KG) 2.4 2.3 2.3
Mean price of packaged non basmati common rice sold (USD/ton) 360 330 350
Mean price of packaged non basmati medium grade rice sold (USD/KG)
0.56 0.57 0.56
Mean price of packaged non basmati fine grade rice sold (USD/KG) 0.6 0.6 0.6
10. Mean number types of loose rice sold in the supermarket the day the survey
3 0 2
11. % of different kinds of loose rice XX XX XX
Basmati: % of loose rice sold 3 - 3
Common non basmati: % of loose rice sold 90 - 90
Medium grade non basmati: % of loose rice sold 4 - 4
Fine grade non basmati: % of loose rice sold 3 - 3
12. price of different kinds of loose rice in March 2012 XX XX XX
Mean price of loose basmati rice sold (USD/KG) 1.3 - 1.3
Mean price of loose non basmati common rice sold (USD/ton) 600 - 600
Mean price of loose non basmati medium grade rice sold (USD/KG)
0.9 - 0.9
Mean price of loose non basmati fine grade rice sold (USD/KG) 0.94 - 0.94
5.6. Performance of the Rice Value Chain
Having studied the upstream, midstream, and downstream segments of the rice value chain in India, we can now tie these observations together to provide a more holistic picture of the performance of the entire rice value chain in terms of the rewards, costs, and margins.
296

Table 5.46 shows shares of rewards, costs, and total margins accruing to different players in the rice value chain. The table shows that fully 49% of the value chain is from the off-farm components. 22% of the whole value chain is due to distribution (traders and retailers), and fully 27% are due to mills alone. The mills also capture a high share of the rewards in the system. This demonstrates the important but neglected fact that the productivity in the post-farmgate segments of the food chain is as important to overall food security as productivity of farms.
Note: Rewards are calculated as the difference between costs and margins. For farmers the total margin is the rice equivalent paddy price received on selling per kg paddy, while costs are the sum of the rice equivalent monetary costs of cultivating per kg paddy and the rice equivalent marketing costs for per kg paddy. For millers, wholesalers (both rural and urban, paddy and rice) and retailers, margins are the difference between the sale price and the purchase price of rice/paddy. Note that for millers and rural paddy wholesalers, margins and costs reported are the rice equivalent margins and costs for handling per kg paddy. To convert per kg paddy prices, costs and margins to the rice equivalent prices costs and margins we divided the paddy costs, prices and margin by 0.66 (where 0.66 is assumed to be the paddy to rice conversion ratio).
Table 5.47 shows the shares of various items in the total costs of the rice value chains. The input costs at the farm level are dominant, at 69% of costs. Note that
Table 5.46 Share of rewards costs and total margins accruing to different players in the rice value chain in India (From Allahabad, Uttar Pradesh to Jabalpur, Madhya Pradesh) Item Common paddy/rice
Average retail price of rice in Jabalpur (in USD/ton)
400
Share of rewards, costs and total margins accruing to:
Rewards Costs Total margins
Farmers’ (rice equivalent) rewards costs and total margin
4 69 51
Rural paddy wholesalers’ (rice equivalent) rewards costs and total margin
30 6 13
Millers’ rewards costs and total margin 50 19 27
Urban rice wholesalers’ rewards costs and total margin
6 3 4
Urban traditional retailers’ rewards costs and total margin
10 3 5
Total rewards, costs and total margins in the value chain (figures in parentheses show the share in Dhaka retail price)
100 (28) 100 (72) 100 (100)
297

milling costs are about 20% of the chain; recall that about half of those are energy costs, and again for the traders, with the other 10% of costs in the chain, have about 25% of their costs in energy (fuel for vehicles and for their facilities). This means that nearly two thirds of the costs post farm gate are energy related.
298

Table 5.47: Share of various items in the total costs of the rice value chains in India (From Allahabad, Uttar Pradesh to Jabalpur, Madhya Pradesh) Item Common rice
Total cost in the rice value chain (USD/Ton) 287
Share of various items in the total cost of per ton rice (100%=total cost)
1. Producer's rental costs (on rented in land) 6
2. Producer's input costs (on all purchased inputs other than land and labor) which include purchased seeds, fertilizers, crop chemicals, purchased irrigation and purchased animal and machine traction)
43
3. Producer's wage costs (on hired labor) 20
4. Operational costs of mills (costs of electricity, diesel, water, telephone and fax usage, rentals for stalls and warehouse, market admission fee, weighing fees)
11
5. Transport costs of mills (rentals on trucks and costs on transport in transaction) 4
6. Wage costs of mills (costs of hired casual and well as permanent labor) 4
7. Operational costs (costs of electricity, telephone and fax usage and rentals for stalls and warehouses, ) of traders (wholesalers + retailers) 4
8. Wage costs (for both casual and permanent labor) of traders ( wholesalers + retailers) 3
9. Fees (includes both marketing and weighing fees for the wholesalers + retailers) 1
10. Transport costs of traders (includes costs of hired transport for transactions, rentals on trucks and also expenses on account of personal transport use d for transactions, for both wholesalers and retailers)
3
11. Other trading costs (it comprises of the costs on bagging, stitching, grading, loading and unloading, payments at check points/ road toll taxes incurred by trader during transactions) of traders ( wholesalers + retailers)
1
12. Total cost 100
Note: For producer all costs are calculated in “rice equivalent” terms. For this purpose, we divide the cost of per unit of paddy by 0.66, where 0.66 is assumed to be the paddy to rice conversion ratio.
299
Chapter 6 Rice Value Chain in Mekong River Delta, Viet Nam
6.1. Introduction
In this chapter on rice value chain transformation in Viet Nam, we will cover the upstream, midstream and downstream segments of the value chain and also the performance of the chain as a whole.
6.2. Upstream: Rice farming
6.2.1. Structure of rice farms
6.2.1.1. Rice land distribution In the study area, 100% of the production area of all surveyed farms is paddy land, which illustrates the high rice monoculture. The maximum owned farm size policy of Viet Nam complicates efforts at enlarging farm scale, therefore, the average household rice area in the region is 1.89 ha. In the Mekong river delta, small farms are defined as being smaller than 1.25 ha (Jaffee, 2012). The mean farm size of An giang and Hau giang is larger than the typically small farms of the larger Mekong delta. The paddy land area of the farms tends to be differentiated by group. The paddy area can be divided into three groups as shown in Table 6.1. This area includes the owned area and rented area. The big difference in area between the farm strata can be seen, especially with the medium scale farms because they are 4 -5 times larger than small and marginal farms. This shows how uneven land distribution is among rice cultivation farms in the region. The share of medium size households in the surveyed sampling is 30%. Table 6.1 shows that the region is experiencing farmland expansion through land renting. Small farms have the highest share of land area that is rented (47%). Small farms represent the biggest share, 41%, of the surveyed sampling. Marginal farmers, represent 29% of the sample and since they are more constrained by land prices, they have higher participation in land rental and rent 18% of their land area. In addition, temporary migration to the city is increasing, which is expanding the supply for the rental market for rice land and increasing labor market constraints. Medium scale farms have mainly accumulated land over a long time or inherited it from ancestors. The Land Law in 2003 regulated the maximum farm size at 3
300

ha, but recognizes the land ownership that existed before the Law. Also, previous and lower prices of good rice fields are still honored. In table 6.1, a typical farmer has several rice field plots. Generally, rice plots in the locality are highly concentrated geographically. Except for cases when medium farms rent land that is far away (a few tens of kilometers) as shown in table 6.1. In intensive areas such as An giang, the rental of large plots is rare, but in remote areas near the Cambodian border, large plots are more available within the Khmer population. Table 6.1 Distribution of owned and rented paddy land
Farm size strata Marginal Size
<= 1ha Small 1 <Size
<= 2ha Medium
Size> 2ha Overall
Overall Farm 2011 2007 2011 2007 2011 2007 2011 2007
Number of HHs (N) 87 87 124 124 89 89 300 300
Paddy land (In ha) 0.7 0.5 1.4 1.1 5.2 4.4 1.9 1.5
Paddy land (% of all cultivated land)
100 100 100 92 100 100 100 97
Horticulture land (in% of all cultivated land) 0 0 0 0.1 0 0 0 0.05
Land rented-in (In % of cultivated land)
18 10 47 20 9 0.7 25 10
All operational land (In ha)
0.67 0.52 1.42 1.23 5.2 4.4 1.89 1.55
Plots for full farm
Paddy land (number of plots)
1.2 1.2 1.5 1.4 3.2 3.2 1.9 1.9
Paddy land (mean plot size, derived in Ha)
0.6 0.4 0.9 0.8 1.6 1.4 1.0 0.8
All operational land (number of plots) 1.2 1.2 1.5 2.4 3.2 3.2 1.9 1.9
All operational land (mean plot size derived in Ha) 0.6 0.4 0.9 0.5 1.6 1.4 1.0 0.8
Distance to home of rent-in plots (in meters)
0 0 9,053 8,540 20,35
4 20,35
4 9,802 9,631
Distance to home of owned plots (meters)
515 515 1,250 1,040 1,412 1,412 1,059 989
301

The Gini coefficient shows the land differentiation among the households in the sample, which is increasing under the control of the Land Law. The cause for this may lie in land division by new household installation because land concentration is limited by the Law. If we consider the total area of cultivated land, we observe an interesting inverse with land differentiation reducing in the same period. Even in 2011, land differentiation including rented land is lower. Land rental occurs mostly within the marginal and small segments, and to a lesser extent in the medium size. This phenomenon corresponds with the general situation of Gini coefficients descending along with land allocation differentiation. Compared to the Gini coefficient of the Mekong region during French colonization (0.87) and during the Ngo Dinh Diem regime in the 60s (0.80) (Dao 2007), the land area allocation is less differentiated. Table 6.2 Land differentiation by Gini coefficient
2011 2007
Total own agriculture land 0.57 0.47
Total own + rented agriculture land 0.54 0.61
6.2.1.2. Non-land property of the rice farms. Table 6.3 shows the differences in age, labor, training, and capital sources of rice farms by different strata. The average age of the farmers on the marginal and small farms is quite close and fairly old. However, for the medium farm group, the average age is only 35 years old. The small and marginal farms primarily use family labor. The medium farms do not participate in livestock use, they specialize in rice production using bigger areas of rice land. The small farms generate a high level of income from livestock activities, while marginal farms enjoy lower level incomes from livestock activities. The livestock activities in the area mostly consist of cattle production for meat and eel farms. Both small and marginal farms have enjoyed growing livestock incomes during the last five years. Fish aquaculture in the pond is not included here because it is a very specialized form of production. Our survey only focuses on rice farming in the region and doesn’t focus on fish farming.
302

In terms of household assets, one of the features in the study area is that no farms buy tractors for land working and combine harvesters because both types of machines are too costly given the 1.9 ha/farm scale of small rice farms. The collective use of machinery is common and is similar to that which takes place in other countries. However, 100% of the tractor use in the area is enabled by agricultural machinery services provided by the private sector. As seeding by hand is the norm in the region, there is no ownership of seeding machines. The government wanted to promote seeding machine use by financially supporting the purchase of seeding machines, but farmers prefer to continue to seed by hand. Our survey shows that the sprayer is a very important asset that 100% of farms have owned since 2007. As for irrigation, in 2011 about 50% of small and medium farms have their own pumps. Although only 22% of marginal farms own a pump, this is a drastic increase from the 2007 figure of 3%. Furthermore, they have to buy pumping services during the season because irrigation is very crucial for rice production. Table 6.3 Non-land property of rice farms Farm size strata Marginal
Size <= 1ha Small 1 <Size
<= 2ha Medium
Size> 2ha Overall
Number of HHs (N) 87 124 89 300
Demographic variables
Age of Head of Farm (years) 58 54 35 49
Gender of Head of Farm (% male) 100 100 100 100
Household size (adults plus children) 5.3 4 3 4
Number of workers aged 3.2 2.2 1.5 2.3
Dependency ratio (number of children below 15 and adults over 65) 2.1 1.8 1.5 1.7
Education &experience
% Years of education HHH 87 77 65 77
Number of years HHH has grown rice 32 28 12 24
Livestock holdings in 2011 (USD) 218 857 0 358
Livestock holdings in 2007 (USD) 91 269 0 120
Farm assets
Pesticide/herbicide Sprayer owned in 2011: % of HHs 100 100 100 100
Sprayer in 2007: % of HHs 100 100 100 100
Irrigation Pump owned in 2011: 22 52 56 43
303

% of HHs
Irrigation Pump in 2007: % of HHs 3 19 21 14
6.2.1.3. Non-agricultural labor and farm non-rice income The share of households with members participating in off-farm activities is high across all farm types, ranging from 41% (medium) to 53% (marginal), resulting in an overall share of 49%. This is new information about the role of off-farm activities in the rice-based farming system of the Mekong. The majority of other research focuses on the role of rice income in the area. The new opportunity for off-farm employment shows that farming systems in An giang and Hau giang are diversifying. The area and incomes associated with rice production are increasing but off-farm incomes are also increasing. Medium farms with large areas don’t prioritize off-farm employment but concentrate more on other crops, like chili and vegetables, because they have access to cultivatable dry lands. This is another opportunity for livelihood diversification in the area. Table 6.4 Non-agricultural labor and non-rice income Non-agricultural labor and income
Marginal Size <= 1ha
Small 1 <Size <= 2ha
Medium Size> 2ha
Overall
% Of HHs with employment off-farm and on-farm non-cropping
% Of HHs with members working off-(own) farm
53 52 41 49
% Of HHs with Local nonfarm workers 9 11 22 14
% Of HHs with Local farm-wage workers
0 0 0 0
% Of HHs with Migrants to other districts in An giang / Hau giang province
13 13 21 16
% Of HHs with Migrants to other provinces
4 4 0 3
% Of HHs with members with local nonfarm or non-Paddy self-employment
21 20 16 19
Earned income from sources
Mean Income of other crop (USD in 2011)
0 0 739 246
Mean income of local nonfarm self-employment (USD in 2011
963 1,190 0 718
Non-Earned incomes and debt in 2011
Mean over HHs of the% of the adults on 13 25 28 22 304

pension (rural endowment insurance)
Mean over HHs% of members of the rural cooperative, medical service who have
0 0 1.3 0.4
The migration of household members to other provinces is less common than migration within the province. This can help us to confirm that farmers here need a local off-farm activity for income diversification rather than one involving temporary migration, as is the case in the Red River Delta. The policy on income diversification should integrate this information. Local nonfarm activities, like artisanal crafts, small trade in the village, irrigation canal-maintenance, also constitute an important share. Farmers can do this kind of activity at home during the low rice season. This image is very similar to the Red River Delta data, where the craft village model is very interlinked with the small rice field system (Dao, 2004). The ratio of the farms receiving pensions is quite high (22%), so the pension can help households to stabilize incomes and invest in other livelihoods. The share of households participating in local community service is very low. This message confirms the observation that the Mekong delta exports rice but, paradoxically, low social development still persists (Jaffee, at al., 2012). The Gini coefficients of non-crop incomes were calculated by farm strata. The Non-crop income in this area was defined by livestock income and all off-farm incomes. Marginal non-crop income is 0.32, small is 0.48, and medium is 0.85. The Gini coefficient for the overall sample is 0.63. The non-crop income differentiation of households in Hau giang is relatively high. Among the farm types, the medium type has a very high Gini coefficient, which means that off-farm employment is highly developed but not every household can benefit from this income source. If we only calculate Gini coefficients for off-farm activities, the Gini will be: marginal 0.53; small 0.36; and medium 0.81. The general Gini for the overall sample is 0.60. This information shows that, the medium type and the marginal type have greater access to off-farm activities. The small type develops more livestock as a supplemental income for rice.
305

6.2.2. Farm management
6.2.2.1. Farm technology and inputs use Table 6.5 shows that among the production cost components, chemical fertilizer, which contributes 51.7% of the total production cost, is the most important. Intensive investment for triple cropping requires the heavy use of fertilizers to ensure high productivity. On average, 500 kg of fertilizer is used per ha and per crop, and the fertilizers are primarily NPK and DAP. Marginal farms use more fertilizer (562kg/ha). The majority of farmers have access to quality guaranteed fertilizer (88%). In Viet Nam the low quality of fertilizer is a hot policy topic, but this seems not to be the case in An giang and Hau giang, where fertilizers are bought mostly from private shops in the village with payment at harvesting time with interest (and where transport cost can be avoided by purchase from within the district). In the table 6.5, the share of cost for hired labor is 11%. All three types of farms have to hire labor in the high season mostly for harvesting time. The labor mostly comes from other regions or from non-landed farmers working as agricultural workers in the region. These agricultural workers had to sell their land due to its insufficient size and low competitiveness. The cost of the rice seed accounts for only 7% of the production cost, which confirms the good service provided by research for new varieties and the value of public-private partnerships in the seed supply service. Table 6.5 Rice producer cost structure (%)
Producer cost Structure (%)
Purchased seeds 10.8
Chemical Fertilizer 51.7
Crop chemicals 6.8
Water 1.3
Hired labor at market wage 11.0
Machine use in total cost 3.4
Land rental 4.6
Fee for commercialization 10.4
Total Monetary cost (value and% of total cost) 100.0
Regarding land cultivation, the data show that farmers buy tractor services for land working throughout the entire area. The mechanization level is high due to the land consolidation of the land policy and the low number of plots. However,
306

farmers depend on the land preparation services of tractor service providers. In the high season all farmers need the service at the same time. So this kind of service is well organized by the private sector in the region, but is associated with overcharging during the high season. This time constraint can raise the price of this service. In other countries, the collective ownership of tractors exists, but in An giang, Hau giang this form of collective action is not observed. Farmers tend to seed directly by hand because the data shows that no seeding machine service is bought, despite the local authorities’ efforts discussed above. The objective of this policy is to reduce the seed density per ha in order to reduce the production cost. Table 6.6 shows that in general, they use double the quantity of seed per ha (280kg/ha) on marginal farms than on medium farms (150kg/ha). Medium farms clearly followed the extension advisory because the level of fertilizer use was very close to the specifications of the technical guidelines. The marginal group personally performed manual seeding, while small and medium farms hired labor to perform this function. Table 6.6 Rice production cost expenditures
Farm size Marginal Size <=
1ha
Small 1 <Size <=
2ha
Medium Size> 2ha
Overall (with zero include in the average in
all calcul)
Seed total (U.S. $ / ha) 140.5 139.6 127.3 133.4
own seeds seed imputed at market price (kg * the market price (USD / kg))
63 59 56 59
purchased seeds (value (money paid (kg * price))) USD
77.5 80.6 71.3 74.4
Fertilizer total (kg / ha / season) 562.4 516.2 420.5 499.5
Chemical Fertilizer (USD / ha) 402.1 369.1 300.6 357.1
Crop chemicals (USD / ha) 48.97 50.29 42.54 47.26
insecticides (value) USD / ha 32.31 30.76 25.13 29.4
fungicides (value) USD / ha 10.77 13.76 12.38 12.3
herbicides (value) USD /ha 5.89 5.77 5.03 5.56
Water (apart from rainfall) total non-labor Costs (USD / ha)
8.85 9.33 8.62 8.93
Hired labor without machine at market wage (USD / ha)
75.97 89.87 62.03 76.06
Machine use in total cost (USD / ha) 24.17 24.17 21.73 23.36
Tractor (Soil working machine) 10.05 10.05 8.62 9.57
307

Combine harvester 14.12 14.12 13.11 13.78
Land rental (USD / ha) 33.99 32.55 28.72 31.91
Total cost (cash outlays plus imputed in-kind Costs) (100% and total value)
883.5 847.2 685.5 803.5
Total Monetary cost (value and% of total cost) U SD
671.5 655.8 535.5 619
Total Costs imputed in kind (show as value and as% of total cost) USD
135.7 119.9 83.3 113
6.2.2.2. Water Supply Irrigation is conveniently provided naturally by rivers and canals across the region. However, flooding occurs quite often due to the region’s low terrain, so rice growers often have to pay for 2 types of water pumping: pumping of water from the canal to the rice field and pumping water out of the rice fields to avoid flooding. The data in table 6.7 shows that nearly 50% of households have their own pumps, an increase from 2007 because of the initiation of the construction of the dyke system. The water cost is very low due to the good public service provision of the Government. Farmers don’t have to pay water source fees for the use of the canal, but they have to pay for the pumping of water to the field. Table 6.7 shows that 100% of farms pump water from the rivers and canals. The pump ownership rate is relatively high, especially for medium farms (56%) and small farms (52.01%). Previously, the farms simply relied on gravity for water flow. Now they have changed to an intensive triple cropping mode, and the farmers have begun to build local dykes in that area, so the farms use pumping machines to irrigate more often. Table 6.7 Irrigation and water pump ownership ratio
Farm size Marginal Size <= 1ha
Small 1 <Size <= 2ha
Medium Size> 2ha
Overall
Own of water pump for irrigation 100 100 100 100
Irrigation Pump owned in 2011 (% of HHs)
22 52 56 43
Irrigation Pump in 2007 (% of HHs) 3.4 19 21 15
6.2.2.3. Access to seed From table 6.8, it can be seen that, the rice farms in the region retain 63% of the rice seed from the previous season. That means that 37% of their seed is newly bought. The seed distribution system in the region is organized by public- private partnerships. The government and research institute invests in the
308

varieties selection, then cooperates with private companies for dissemination through contract farming with some farmer seed groups. The company then distributes the seed to the farmers by input shops networked in the village. Table 6.8 Seed source and seed supply
Marginal Size <= 1ha
Small 1< Size<=2ha
Medium Size > 2ha
Overall
Source of Seed in each season
% of HH using retained seed (from previous season)
64 61 63 63
Early fragrant indica
% HH using Early fragrant indica 71 74 73 72
% of HH using retained seed for Early fragrant indica 45 45 46 46
% of HH buying seed for Early fragrant indica 26 29 27 27
Early/Middle ordinary indica
% HH using Early/Middle ordinary indica seed in
29 26 27 28
% of HH using retained seed in Early/Middle ordinary indica
19 16 17 18
% of HH buying seed for Early/Middle ordinary indica
10 10 10 10
The vendor of the seed (in share of the farmers buying)
Private agriculture input shops in the village
100 100 100 100
The data show that the share of households using the new varieties like early fragrant indica is around 70% more than those using old varieties like early ordinary indica. Approximately 27% of households buy certified improved seed every season as it can be use for three consecutive seasons without suffering yield decreases. This rate is higher than in other regions like the Red River Delta, with about 15-20%. 6.2.2.4. Fertilizers and farm chemicals Table 6.9 shows that all farms are buying and using these inputs. It is interesting to note that agricultural input shops serve as the major fertilizer source. During the cooperative time all the input services were assured by the state and
309

distributed by the cooperative. This model proved a failure and the role passed to the private sector. In all provinces the input company is of a joint-stock form that is partially owned by the private sector and by the provincial government. The private distribution system can combine with the credit service to allow farmers to pay to input at the end of season. Farmers don’t need to borrow credit from the bank. This system seems to be most appropriate for the Mekong situation, as 100% of farmers use this service. Table 6.9 The ratio of HH’S buying fertilizers and plant protection drugs (%) Marginal Size <=
1ha Small 1 <Size <=
2ha Medium
Size> 2ha Overall
Fertilizers 100 100 100 100
Crop chemicals 100 100 100 100
Table 6.10 shows that the farmers of all three types are highly satisfied with the input services provided by the private sector in the village. Farmers prioritize the minimization of transport costs above all else in choosing the seller. Marginal farms prefer low prices for input services. Table 6.10 Farmers opinion about input service
Content Marginal
Size <= 1ha Small 1
<Size <= 2ha Medium
Size> 2ha Overall
Purchase from private shops near their house
100 100 100 100
Level of satisfaction with input materials
High level (%) 89 86 87 88
Medium level (%) 11 13 13 12
Low level (%) 0 0 0 0
Reason to choose the supplier
Regular supply (%) 15 42 86 48
Short distance (%) 31 31 29 30
Lower price than other places (%) 32 15 11 19
Guaranteed quality (%) 100 100 100 100
Acceptance of late payment (%) 100 100 98 99
In table 6.11, farmers shifted rapidly from hand harvesting plus thresher use in 2007 to the use of combine harvesters in 2011. This phenomenon is due to the introduction of harvesters by the government. During the harvest in 2007, farmers hired labor, but the price of labor has tripled between 2007 and 2011. The mechanization of rice harvesting could provide a response to this constraint and also help farmers to reduce the rental cost of threshing machines. The table
310

showed that the total cost of using combine harvesters is lower than that of using the hand harvester and thresher.
311

Table 6.11 Rice harvesting practices
Farm size
Marginal Size <= 1ha
Small 1 <Size <= 2ha
Medium Size> 2ha
Overall
2011 2007 2011 2007 2011 2007 2011 2007
Harvesting: different practices diffusion
% of HH hiring hand-harvesting any season 0 0 0 0 0 0 0 0
% of HH hiring machine-harvesting any season 100 0 100 0 100 0 100 0
% of HH hand-harvesting any season 0 100 0 100 0 100 0 100
Harvesting: cost of different ways (USD/ha)
cost of own labor to hand-harvesting USD 0 9.6 0 9.6 0 9.6 0 9.6
cost of machine-harvesting (imputed at rental price for machine and market wage for labor with the machine)
14 0 14 0 13 0 14 0
Threshing
Threshing: different ways rice farmers threshing
% of HH threshing at the same stage with harvesting by machine 0 100 0 100 0 100 0 100
Threshing: cost of own labor plus own thresher (imputed at rental price) to machine-thresher USD/ha
0 57 0 57 0 50 0 55
312
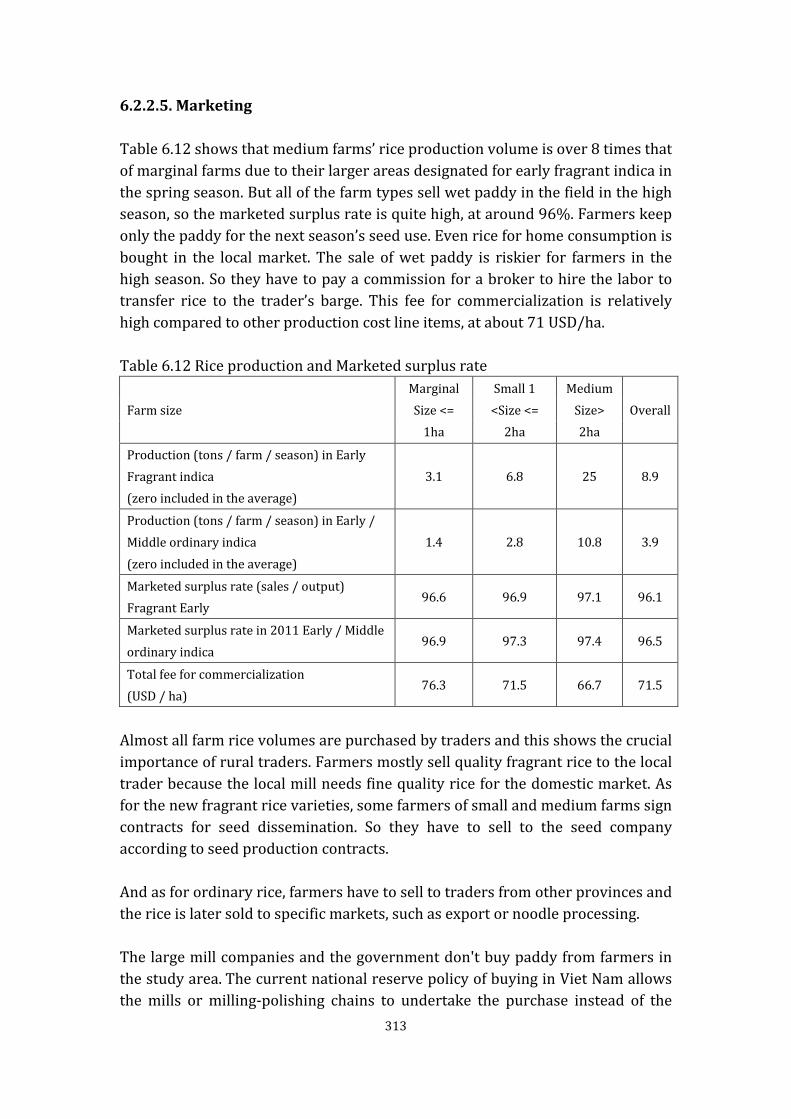
6.2.2.5. Marketing Table 6.12 shows that medium farms’ rice production volume is over 8 times that of marginal farms due to their larger areas designated for early fragrant indica in the spring season. But all of the farm types sell wet paddy in the field in the high season, so the marketed surplus rate is quite high, at around 96%. Farmers keep only the paddy for the next season’s seed use. Even rice for home consumption is bought in the local market. The sale of wet paddy is riskier for farmers in the high season. So they have to pay a commission for a broker to hire the labor to transfer rice to the trader’s barge. This fee for commercialization is relatively high compared to other production cost line items, at about 71 USD/ha. Table 6.12 Rice production and Marketed surplus rate
Farm size Marginal Size <=
1ha
Small 1 <Size <=
2ha
Medium Size> 2ha
Overall
Production (tons / farm / season) in Early Fragrant indica (zero included in the average)
3.1 6.8 25 8.9
Production (tons / farm / season) in Early / Middle ordinary indica (zero included in the average)
1.4 2.8 10.8 3.9
Marketed surplus rate (sales / output) Fragrant Early
96.6 96.9 97.1 96.1
Marketed surplus rate in 2011 Early / Middle ordinary indica
96.9 97.3 97.4 96.5
Total fee for commercialization (USD / ha)
76.3 71.5 66.7 71.5
Almost all farm rice volumes are purchased by traders and this shows the crucial importance of rural traders. Farmers mostly sell quality fragrant rice to the local trader because the local mill needs fine quality rice for the domestic market. As for the new fragrant rice varieties, some farmers of small and medium farms sign contracts for seed dissemination. So they have to sell to the seed company according to seed production contracts. And as for ordinary rice, farmers have to sell to traders from other provinces and the rice is later sold to specific markets, such as export or noodle processing. The large mill companies and the government don't buy paddy from farmers in the study area. The current national reserve policy of buying in Viet Nam allows the mills or milling-polishing chains to undertake the purchase instead of the
313

government. But the survey shows that all transactions with farmers are performed by traders. The operating area of traders is large and the relationship between traders and farmers is not strict, therefore, the rice farms often sell their product to whichever trader pays the highest price, these forms of transaction usually take place directly. There are no contracts at all observed in the study area for paddy buying. Even the pilot of company-farmer contract farming in the rice sector being tested in An giang province seems only to be impacting the region to a limited extent. Table 6.13 Customers of rice farms
Farm size Marginal Size <= 1ha
Small 1 <Size <= 2ha
Medium Size> 2ha
Overall
Fragrant or sticky indica Early 2011
Local trader (%) 100 97 96 97
Seed company (%) 0 3 4 3
Early / Middle ordinary indica 2011
Local trader (%) 13 13 16 14
Trader from other place (%) 87 87 84 86
6.2.2.6. Payment Table 6.14 shows that although the literature says that most farmers get advances from traders, the observed use of advances is very minor, as only 10% of households can get this advance. Farmers get the advance from traders without any written contract. The previous table also shows that farmers have to pay a commission to sell their rice at the right moment in order to avoid post-harvest losses. Table 6.14 Payment to rice farms from customers (% oh HHs)
Farm size Marginal Size <= 1ha
Small 1 <Size <= 2ha
Medium Size> 2ha
Overall
Paid by buyer in cash (%) 100 100 100 100
Advance received from buyer (%)
10 10 11 10
Paid by buyer with delay (%) 0 0 0 0
314

6.2.3. Performance of the rice farms segment
6.2.3.1. Rice productivity The yield level across farm types is not significantly different. This yield of lower varieties such as fragrant is higher than that of the average for rice in Viet nam in 2012 (5.6 tons/ha). This illustrates the intensification occurring in the study area. Old varieties have a higher yield than do fine varieties, as a result, some farmers still prefer to cultivate old varieties. Table 6.15 The yield of the different rice types
Farm size Marginal Size <= 1ha
Small 1 <Size <= 2ha
Medium Size> 2ha
Overall
Yield (tons / ha) in Early Fragrant or sticky indica
6.46 6.55 6.60 6.52
Yield (tons / ha) in Early / Middle ordinary indica
7.03 7.53 7.59 7.38
6.2.3.2. Change in rice varieties grown Table 6.16 shows that high-quality rice production in the region increased markedly, while low-quality rice varieties have fallen out of favor between 2011 and 2007. The production of good-quality rice varieties increased from 58.8% in 2007 to 72.24% in 2011. Along with that, the production of early ordinary indica rice varieties decreased from 41.2% in 2007 to 27.76% in 2011. Although the literature on the Mekong declares that the region’s shift to high-quality rice is gradual, the data in An giang and Hau giang contradicts this. Table 6.16 The change of rice varieties (% of HHs) Farm size Marginal Size
<= 1ha Small 1 <Size
<= 2ha Medium
Size> 2ha Overall
2011 2007 2011 2007 2011 2007 2011 2007
Fine Early Fragrant or sticky indica (%)
71 43 74 68 73 66 72 59
Common Early / Middle ordinary indica (%)
29 57 26 32 27 34 28 41
Total 100 100 100 100 100 100 100 100
315

6.2.3.3. The selling price of paddy Table 6.17 shows the average farm gate prices of different varieties by rice farm strata. This price is surveyed at the moment farmers sell their paddy in the field and convert it to dry paddy. The data show that there is no price difference across the farm segment. The price difference is mostly by the quality of paddy defined by variety. This may be different from price data because the governmental system for price monitoring only involves the average price of each period. Table 6.17 The average selling price of rice varieties(average farm gate price from HHs survey)
Farm size Marginal
Size <= 1ha Small 1 <Size
<= 2ha Medium
Size> 2ha Total
Fine Early Fragrant indica (USD / ton)
299 299 301 299
Common Early / Middle ordinary indica (USD / ton)
254 254 254 254
Table 6.18 shows that the income per ha for the average season is most important for the medium farm size. The marginal farms have the lowest income per ha in 2011-2012. The effect of scale can be observed from this data, and explains why the marginal and small farmers in An giang and Hau giang rent-in land in order to increase the rice area. Table 6.18 Farm rice economic result of average season per ha
Farm size Marginal Size
<= 1ha Small 1 <Size
<= 2ha Medium
Size> 2ha Overall
Common paddy
Turnover (USD/ha) 1,786 1,913 1,928 1,875
Cost (USD/ha) 799 763 618 725
Income (USD/ha) 987 1,150 1,310 1,150
Fine paddy
Turnover (USD/ha) 1932 1958 1987 1949
Cost (USD/ha) 919 877 711 834
Income (USD/ha) 1013 1081 1276 1115
The marginal farm segment has the lowest income from rice per year with 1347 USD and the small farm has about 3122 USD. In An giang in 2010, one average
316

farm could earn about 2000 USD per year from rice (Jaffee, 2012). These results match well. Table 6.19 Household income from rice production
Farm size Marginal
Size <= 1ha Small 1 <Size <=
2ha Medium
Size> 2ha Overall
Production area (ha) 0.67 1.42 5.2 1.89
Total rice income per year (USD) 1,347 3,122 13,362 4,253
Rice income/cap/year (USD) 254 780 4,454 1,063
6.3. Midstream: Transformation of the Rice mill and Trader segments
6.3.1. Rural trader
6.3.1.1. Structure of rural rice traders In table 6.20, the average age of traders is 40.8 years old, while 80% are male. They do not have a high education level, with 8.7-years education on average. Their working capital is 7,150 USD, 72% of which is their own, so traders require a negligible amount of loan capital. Traders from different areas of the Mekong Delta. The local traders come from the provinces of Can tho, An giang, Hau giang with a distance under 100 km. The other traders come from Tien giang, Long an travelling a distance of more than 150 km. They mainly operate in the downstream segment in rural areas. They use barges to go to production areas to purchase paddy from farmers with 100% of the share of household, they assemble shipments in bulk. The rural traders have 3 types of product: paddy, de-husked rice (milled once and the bran is still in the rice grain) and final rice (white rice ready for sale in the domestic retail market). The main milling technology used in the area is two-steps milling. Traders’ principal activity is to purchase paddy, dry the paddy and mill the paddy for the first step then supply brown rice to the mill-polishing factory. The trader works to meet the demands of the mill, so they compose their products, performing a specialization in the supply chain. The most important trader with the share of 48% is paddy and de-husked rice trading. Second is de-husked rice (brown rice) trading. Only 4% of traders specialize in the final product, white rice. The paddy trader type represents only 12% of all traders. They just transport the paddy, dry the paddy at drying service and sell it for the mill. The de-husked trader passes the paddy through the mill and pays the milling fees, they sell the de-husked rice ("raw material rice") to the mill-polishing chain for processing for export. The
317
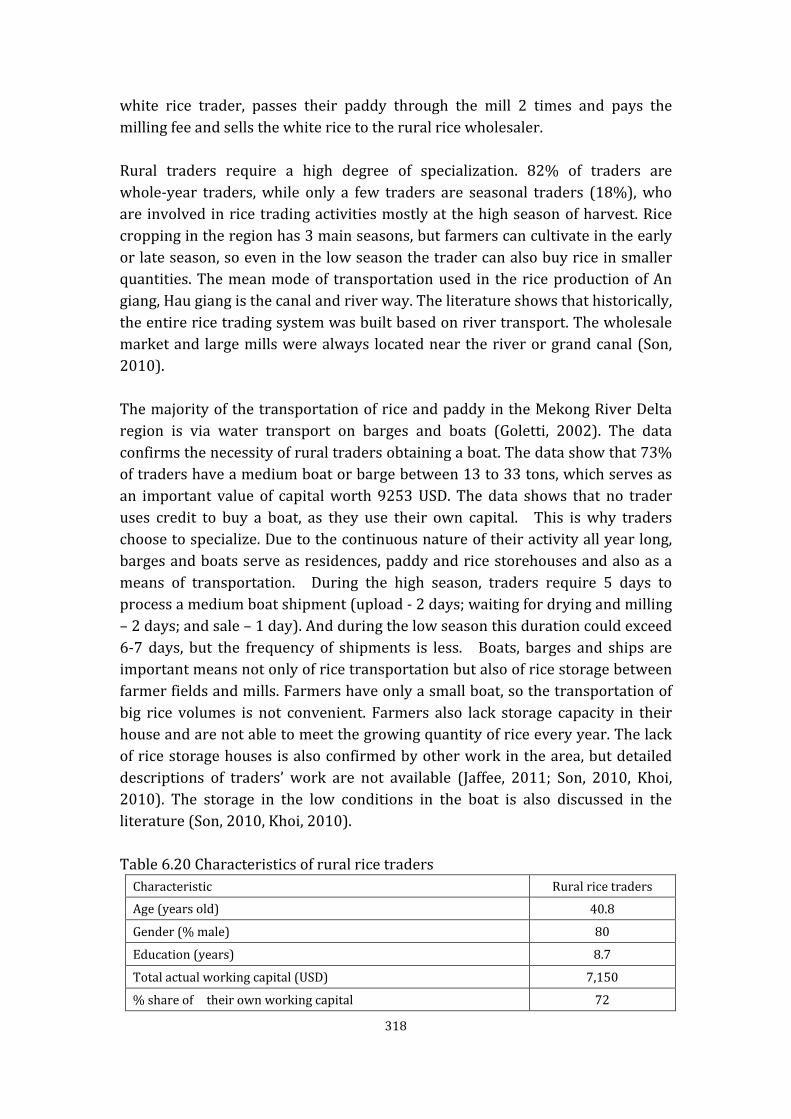
white rice trader, passes their paddy through the mill 2 times and pays the milling fee and sells the white rice to the rural rice wholesaler. Rural traders require a high degree of specialization. 82% of traders are whole-year traders, while only a few traders are seasonal traders (18%), who are involved in rice trading activities mostly at the high season of harvest. Rice cropping in the region has 3 main seasons, but farmers can cultivate in the early or late season, so even in the low season the trader can also buy rice in smaller quantities. The mean mode of transportation used in the rice production of An giang, Hau giang is the canal and river way. The literature shows that historically, the entire rice trading system was built based on river transport. The wholesale market and large mills were always located near the river or grand canal (Son, 2010). The majority of the transportation of rice and paddy in the Mekong River Delta region is via water transport on barges and boats (Goletti, 2002). The data confirms the necessity of rural traders obtaining a boat. The data show that 73% of traders have a medium boat or barge between 13 to 33 tons, which serves as an important value of capital worth 9253 USD. The data shows that no trader uses credit to buy a boat, as they use their own capital. This is why traders choose to specialize. Due to the continuous nature of their activity all year long, barges and boats serve as residences, paddy and rice storehouses and also as a means of transportation. During the high season, traders require 5 days to process a medium boat shipment (upload - 2 days; waiting for drying and milling – 2 days; and sale – 1 day). And during the low season this duration could exceed 6-7 days, but the frequency of shipments is less. Boats, barges and ships are important means not only of rice transportation but also of rice storage between farmer fields and mills. Farmers have only a small boat, so the transportation of big rice volumes is not convenient. Farmers also lack storage capacity in their house and are not able to meet the growing quantity of rice every year. The lack of rice storage houses is also confirmed by other work in the area, but detailed descriptions of traders’ work are not available (Jaffee, 2011; Son, 2010, Khoi, 2010). The storage in the low conditions in the boat is also discussed in the literature (Son, 2010, Khoi, 2010). Table 6.20 Characteristics of rural rice traders
Characteristic Rural rice traders
Age (years old) 40.8
Gender (% male) 80
Education (years) 8.7
Total actual working capital (USD) 7,150
% share of their own working capital 72
318

Working experience (years) 9.7
% Whole-year traders (%) 82
% Seasonal traders (%) 18
% paddy trading only (%) 12
% brown rice (de-husked rice or raw material rice) trading (%) 22
% white rice trading (%) 10
% paddy and brown rice trading (%) 48
% paddy and white rice trading (%) 4
% paddy, de-husked rice and white rice trading (%) 4
% traders owning stalls in wholesale market (%) 2
% traders owning boats and barges (%) 100
% traders owning large boats and barges (>33 tons) (%) 15
Average price of large boats and barges (USD) 11,223
% traders owing medium boats and barges (13-33 tons) (%) 73
Average price of medium boats and barges (USD) 9,253
% traders owning small boats and barges (<13 tons) (%) 20
Average price of small boats and barges (USD) 4,108
% traders purchasing boats and barges by loan capital (%) 0
Table 6.21 shows that, in the rice transaction, the broker plays the role of intermediary between farmers who want to sell paddy and traders who want to buy paddy. Brokers are mostly local people. The broker can receive a commission from the farmer, and some from brokers. 9% of those sampled don’t need working capital. There is a large proportion of rural traders participating in the rice business 91.4%. No traders engage in trading while also serving as intermediaries. They have other names like collectors, assemblers or "hang xao" (the person that historically engages in rice commerce in the rural market) (Luat, 2012). They have to invest about 7000 USD as working capital. The lack of an information system for rice transactions at the local level stimulated the development of the broker system. There is also no representative for enterprises, or rice mills buying rice directly from farmers in our survey. In brief, rice traders operate independently, showing negligible ties to rice mills. The traders serve mills as long term agents. As there are no written contracts, this relationship is built on trust. Even the government promotes the direct purchase from farmers for mills and supports priority credit for this activity, but mills prefer to outsource the task of paddy buying from farmers to rural traders. In order to buy directly from farmers, mills have to invest in a collector system that may be more costly than procuring via a
319

trader, who has a lot of social capital. This assembler is a long standing tradition in the Mekong rice trade system and is known as a "Chanh" (Luat, 2012). Table 6.21 Types of rice traders
Type of rice traders Percentage (of total surveyed traders)
Brokers (agents receiving commission) 9
Traders (only purchasing and selling) 91
Both trading and broker 0
Representatives for rice mills 0
6.3.1.2. Conduct of rural rice traders As we have seen in the household section, farmers sell different varieties of paddy to differentiate quality. Common rice is equivalent to the group of varieties named Early/middle ordinary rice. This group of varieties is not of exportable quality but is used more in the domestic market. The fine rice group includes early fragrant and sticky rice. This type of rice is perfumed and exportable. In the domestic market it is also evaluated as high quality. Table 6.22 shows that, rice types purchased by traders are almost the same for the high and low seasons. Traders purchase common rice (75.8%) much more than they do fine rice (24.2%) in the high season, and a proportion of 75.4% and 24.6%, respectively, in the low season. This share of fine rice bought by traders is lower than the information obtained in the farmer section. This is logical because traders here do not only buy in the An giang, Hau giang area, but also in other provinces, where the share of fine rice is much lower than in the study area. The high season is the main rice harvest period of the different crop seasons. At the end of each season, this period is 15-20 days long in February, June and October, and farmers and traders will work very hard in this season to harvest rice. The low season, between these three periods, is where there is some harvesting by some farmers who cultivate off-season rice, but the area is smaller. There is a significant difference in the purchase of wet harvested paddy and dry rice in the low and high seasons because farmers have a lot of area to harvest, and they have time constraints related to drying rice in the field. In the past, when the rice area and yield were still low, farmers dried in the field using sunlight (Nguyen, 2012). In the high season, having no drying ground or drier, farmers tend to sell freshly harvested wet paddy. Inversely, in the low season, farmers take the initiative to dry rice under the sun or using a drying service in
320

the village. So there is also a noticeable difference in the wet or dry purchased rice form in the low and high seasons. Table 6.22 Types of rice purchased by traders in low and high season
Type rice Common rice
(Early/middle ordinary rice)
Fine rice (Early fragrant and
sticky rice)
High season (main rice harvest period) (% of total purchased rice volume of each rice type)
76 24
Low season (out main rice harvest period, having less harvest) (% of total purchased rice volume of each rice type)
75 25
Table 6.23 shows that, traders are flexible. The data show that traders don’t concentrate on one district, and 45.7% of traders purchase mostly within their province. In some cases of paddy shortage, they can buy in some neighboring provinces: Can tho, Dong thap, Soc trang, Kien giang, and Bac lieu. They assemble paddy and mix paddy from different localities. Because the An giang province is located near Cambodia, the trader can also buy Cambodian rice (about 1.6%) in the low season when Vietnamese rice is insufficient to meet the regular demand of mills. Table 6.23 Purchased rice quantity and origin of rice in high and low seasons (2011)
High season (main rice
harvest period) (%)
Low season (out main rice harvest
period, having less harvest) (%)
Form of paddy that trader buy (% of total bought paddy volume)
100 100
% purchased harvested wet paddy after combine harvester in the field (%)
96 1.8
% purchased dry paddy at farmer home (%) 4.2 98
Purchased rice quantity per month (tons) (zero included in the average)
312 257
Buying locality of trader (% of total bought paddy volume)
100 100
% Purchased from the same district of survey (%) 10 9
% purchased from other districts of survey, but in the province surveyed (%)
46 42
321

% Purchased from An giang (%) 10 11
% Purchased from Hau giang (%) 10 10
% Purchased from Can tho (%) 1 1
% Purchased from Dong thap (%) 2 3
% Purchased from Soc trang (%) 10 11
% Purchased from Kien giang (%) 9 9
% Purchased from Bac lieu (%) 2 2
% Purchased from Cambodia (%) 0 2
Table 6.24 shows that, the rural trader only buys paddy from different sources and sells paddy or brown rice or white rice. The data shows that traders can buy mostly by broker and directly from farmers. There are no local authorities involved in the sale of paddy. There is no difference between the sources across the low and high seasons or rice qualities. There is also no wholesale market for paddy in the region. Table 6.24 Source of purchased paddy in low and high season
Season/type rice
High season Low season
Common rice
(Early/middle
ordinary rice)
Fine rice (Early
fragrant and
sticky rice)
Common rice
(Early/middle
ordinary rice)
Fine rice (Early
fragrant and
sticky rice)
Number of surveyed trader (N) 60 60 60 60
% from farmers (% of total bought paddy volume)
41 46 39 43
% from wholesalers in wholesale market (% of total bought paddy volume)
1 1 2 1.2
% from brokers (% of total bought paddy volume)
58 53 59 56
% from local authorities (% of total bought paddy volume)
0 0 0 0
% from other sources (% of total bought paddy volume)
0 0 0 0
Total 100 100 100 100
Table 6.25 shows that, the trader buys all paddy and sells diverse products to different clients. Firstly, they mainly sell rice of different forms, accounting for 87% of their sales, only 13% of which is paddy. Among the rice forms sold, they
322
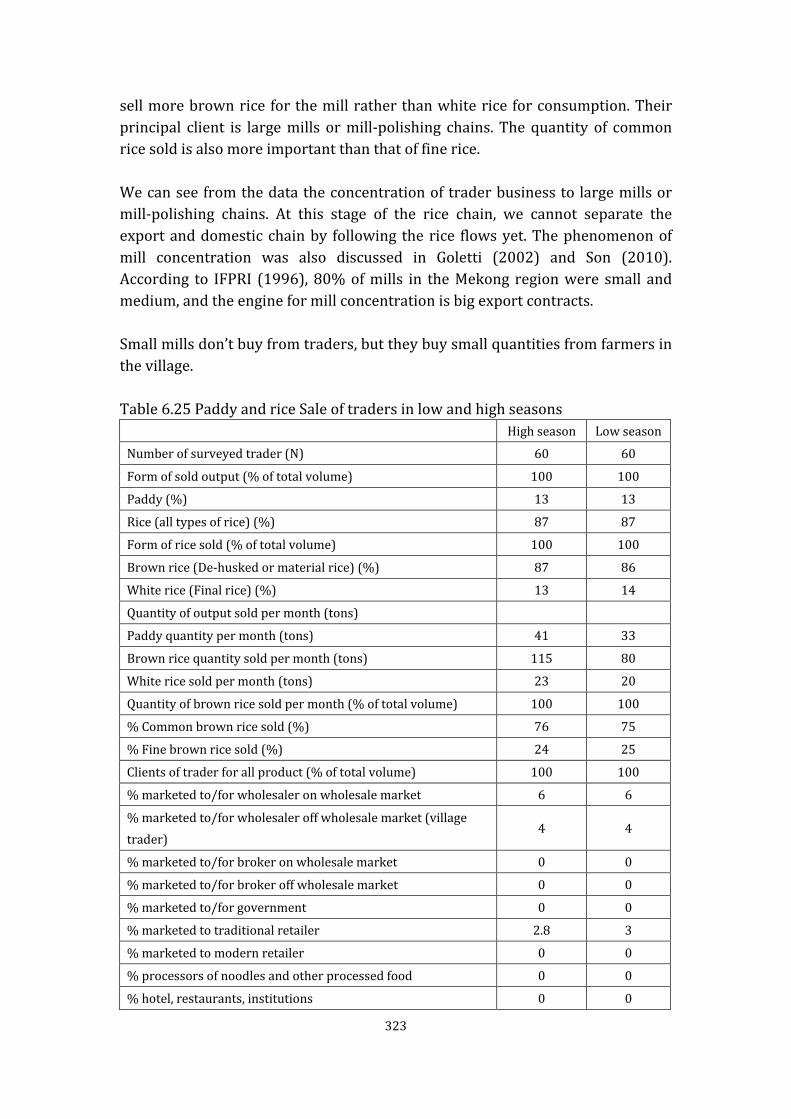
sell more brown rice for the mill rather than white rice for consumption. Their principal client is large mills or mill-polishing chains. The quantity of common rice sold is also more important than that of fine rice. We can see from the data the concentration of trader business to large mills or mill-polishing chains. At this stage of the rice chain, we cannot separate the export and domestic chain by following the rice flows yet. The phenomenon of mill concentration was also discussed in Goletti (2002) and Son (2010). According to IFPRI (1996), 80% of mills in the Mekong region were small and medium, and the engine for mill concentration is big export contracts. Small mills don’t buy from traders, but they buy small quantities from farmers in the village. Table 6.25 Paddy and rice Sale of traders in low and high seasons
High season Low season
Number of surveyed trader (N) 60 60
Form of sold output (% of total volume) 100 100
Paddy (%) 13 13
Rice (all types of rice) (%) 87 87
Form of rice sold (% of total volume) 100 100
Brown rice (De-husked or material rice) (%) 87 86
White rice (Final rice) (%) 13 14
Quantity of output sold per month (tons)
Paddy quantity per month (tons) 41 33
Brown rice quantity sold per month (tons) 115 80
White rice sold per month (tons) 23 20
Quantity of brown rice sold per month (% of total volume) 100 100
% Common brown rice sold (%) 76 75
% Fine brown rice sold (%) 24 25
Clients of trader for all product (% of total volume) 100 100
% marketed to/for wholesaler on wholesale market 6 6
% marketed to/for wholesaler off wholesale market (village trader)
4 4
% marketed to/for broker on wholesale market 0 0
% marketed to/for broker off wholesale market 0 0
% marketed to/for government 0 0
% marketed to traditional retailer 2.8 3
% marketed to modern retailer 0 0
% processors of noodles and other processed food 0 0
% hotel, restaurants, institutions 0 0
323
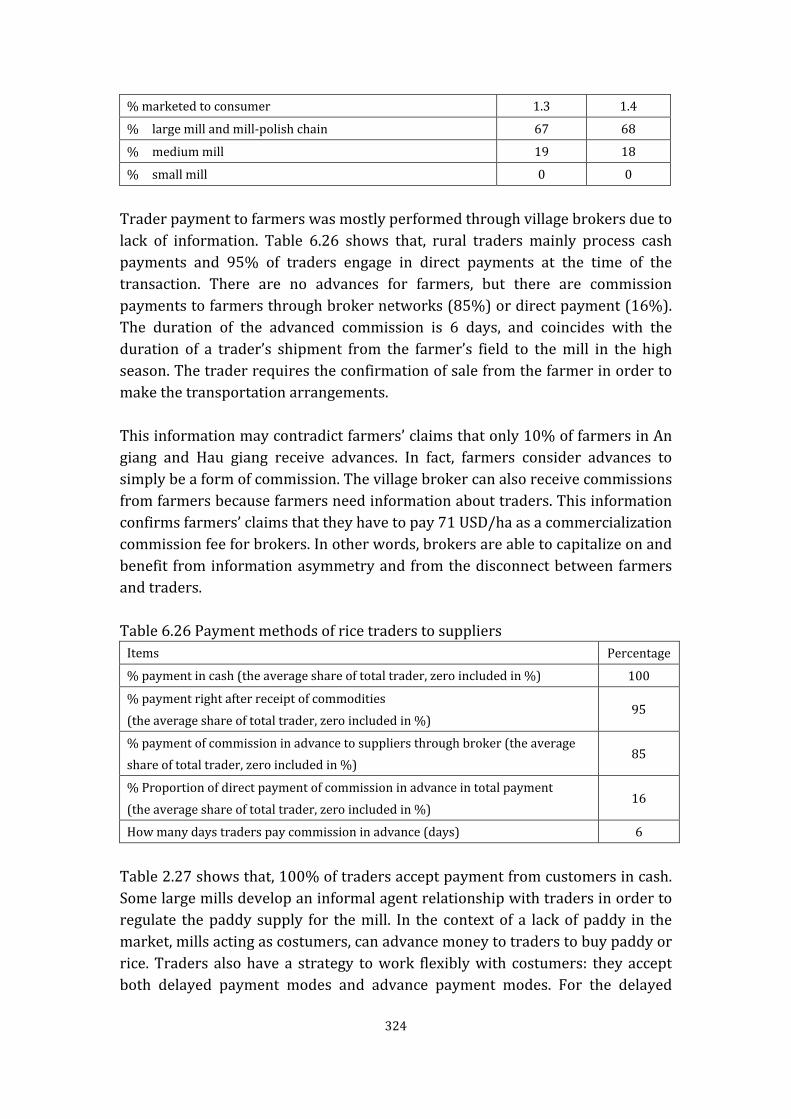
% marketed to consumer 1.3 1.4
% large mill and mill-polish chain 67 68
% medium mill 19 18
% small mill 0 0
Trader payment to farmers was mostly performed through village brokers due to lack of information. Table 6.26 shows that, rural traders mainly process cash payments and 95% of traders engage in direct payments at the time of the transaction. There are no advances for farmers, but there are commission payments to farmers through broker networks (85%) or direct payment (16%). The duration of the advanced commission is 6 days, and coincides with the duration of a trader’s shipment from the farmer’s field to the mill in the high season. The trader requires the confirmation of sale from the farmer in order to make the transportation arrangements. This information may contradict farmers’ claims that only 10% of farmers in An giang and Hau giang receive advances. In fact, farmers consider advances to simply be a form of commission. The village broker can also receive commissions from farmers because farmers need information about traders. This information confirms farmers’ claims that they have to pay 71 USD/ha as a commercialization commission fee for brokers. In other words, brokers are able to capitalize on and benefit from information asymmetry and from the disconnect between farmers and traders. Table 6.26 Payment methods of rice traders to suppliers
Items Percentage
% payment in cash (the average share of total trader, zero included in %) 100
% payment right after receipt of commodities (the average share of total trader, zero included in %)
95
% payment of commission in advance to suppliers through broker (the average share of total trader, zero included in %)
85
% Proportion of direct payment of commission in advance in total payment (the average share of total trader, zero included in %)
16
How many days traders pay commission in advance (days) 6
Table 2.27 shows that, 100% of traders accept payment from customers in cash. Some large mills develop an informal agent relationship with traders in order to regulate the paddy supply for the mill. In the context of a lack of paddy in the market, mills acting as costumers, can advance money to traders to buy paddy or rice. Traders also have a strategy to work flexibly with costumers: they accept both delayed payment modes and advance payment modes. For the delayed
324

payment and advanced payment, around 13 % of traders can benefit from this practice. This is only a small share and thus this is not a popular practice. The duration of delayed payment is 3 days, which is shorter than the advanced duration of 10 days. This practice can help them to reduce the risk of non-payment. Table 6.27 Rice traders’ payment term from customers
Items Percentage
% Delayed payment from customers after rice delivery (average share of trader in %)
13
Average duration of delayed payment decided by customers (Days) 3
% Advance payment from customers (mills) (average share of trader in %)
12.5
% Advance payment amount from customers in total payment (average share of trader in %)
10
Number of days of advance payment from customers (Days) 10
6.3.1.3. Performance of rural rice traders The trader has to transport the paddy or rice to the mill or polish-mill chain, mostly located in Can tho, Long xuyen near the river way. So the rural traders mostly use the boat and barge. Sometimes if they need to use roads to transport their goods, they can hire a truck. The domestic chain uses trucks for transportation in the stage after the mill, and polishing. Table 6.28 shows that, rice traders bear a lot of cost types in their business, in which the highest cost is the petrol cost for barges and boats (516 and 283 USD/month in the high and low seasons, respectively, due to increased busyness in the high season). In addition, the cost of the maintenance and repair of barges and boats is relatively high (50 USD and 34 USD per month in the high and low seasons). The second highest is the short-term labor cost (279 USD and 160 USD per month in the high and low seasons) for the transfer of supplies to barges and boats. Other operation costs are negligible. Table 6.28 Operation cost of rice traders per month (2011)
Items of cost Unit High season
Low season
a) Electricity USD 7.2 5.2
c) Diesel for own boat and rented vehicles (trader don’t own truck)
USD 516 283
e) Communications (fax, phones) USD 23.73.665 16.5
f) Maintenance of equipment and boats USD 50.2 33.8 325

i) Insurance USD 2.7 1.8
j) Market and road fees and taxes USD 26.6 17.9
k) Bags USD 25.3 16.7
d) Hired permanent drivers USD 51.7 28.8
e) Temporary employees for loading & unloading and other product preparation
USD 277 160
Total cost per month USD 982 563
Average cost/ton of paddy transacted USD 3.2 2.2
Cost after buying paddy
Paddy drying cost/ton USD 5.2 -
Paddy de-husked cost/ton USD 4.6 4.4
Milling white rice cost/ton USD 6.2 5.7
Table 6.29 shows that, in the high season, farmers sell mostly wet paddy, so traders need to pay for dryer services. For the milling service, during the high season, the milling cost is higher because the number of traders waiting for milling service is more important. Table 6.29 Price of products sold by trader in March 2012 at An giang-Hau giang
Products Unit
Common rice Fine rice
Buying price
Wet paddy USD/ton 203 209
Dry paddy USD/ton 245 253
Selling price
Wet paddy USD/ton 222 230
Dry paddy USD/ton 255 262
De-husked rice (brown rice) USD/ton 336 349
White rice (final rice) USD/ton 402 416
Table 6.30 shows that, the rural trader profit rate in Mekong is 34-36%. The profit rates for the traders of fragrant and quality rice is a little bit higher than those of common rice. This is not a very high profit for a trade activity in the rural areas. In other countries like Bangladesh (Reardon et al. 2012), the rural rice traders have a profit rate above 34% to 52%. The rural rice trader operates with a reasonable profit rate and can provide a good service to farmers in An giang and Hau giang.
326
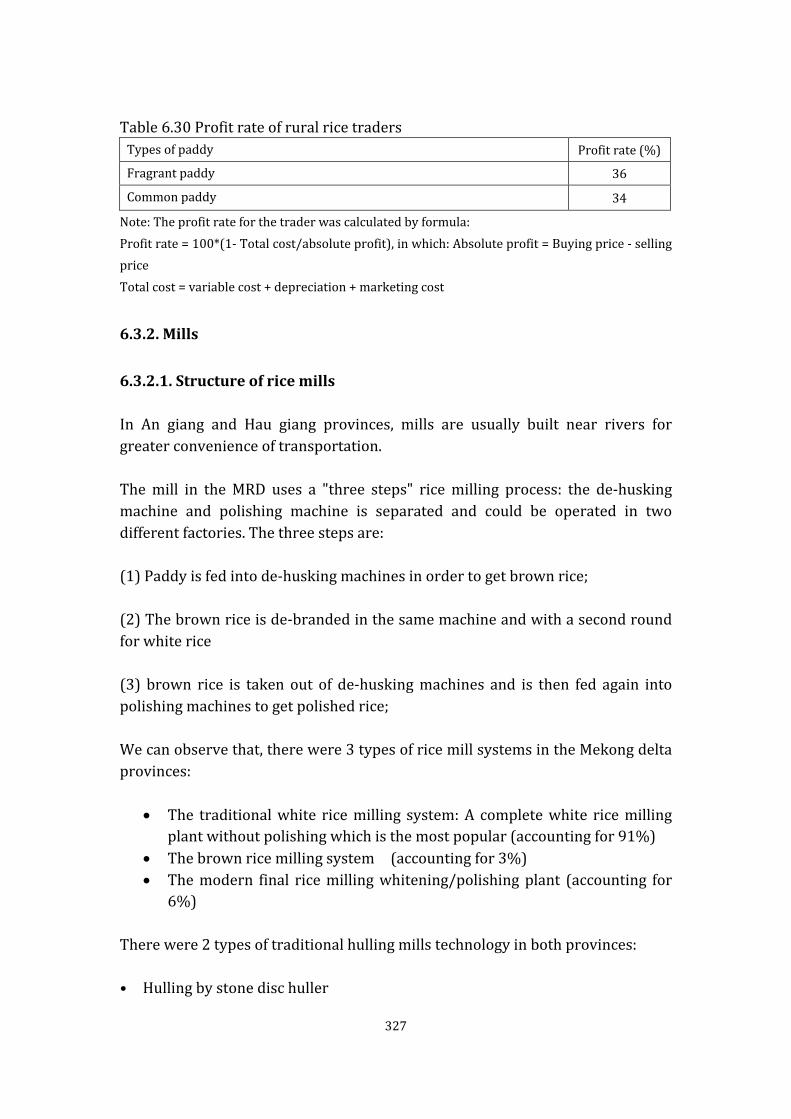
Table 6.30 Profit rate of rural rice traders
Types of paddy Profit rate (%)
Fragrant paddy 36
Common paddy 34
Note: The profit rate for the trader was calculated by formula: Profit rate = 100*(1- Total cost/absolute profit), in which: Absolute profit = Buying price - selling price Total cost = variable cost + depreciation + marketing cost
6.3.2. Mills
6.3.2.1. Structure of rice mills In An giang and Hau giang provinces, mills are usually built near rivers for greater convenience of transportation. The mill in the MRD uses a "three steps" rice milling process: the de-husking machine and polishing machine is separated and could be operated in two different factories. The three steps are: (1) Paddy is fed into de-husking machines in order to get brown rice; (2) The brown rice is de-branded in the same machine and with a second round for white rice (3) brown rice is taken out of de-husking machines and is then fed again into polishing machines to get polished rice; We can observe that, there were 3 types of rice mill systems in the Mekong delta provinces:
• The traditional white rice milling system: A complete white rice milling plant without polishing which is the most popular (accounting for 91%)
• The brown rice milling system (accounting for 3%) • The modern final rice milling whitening/polishing plant (accounting for
6%) There were 2 types of traditional hulling mills technology in both provinces: • Hulling by stone disc huller
327

• Hulling by rubber roll huller A large capacity multiple-pass machine RM uses different machines for each processing step: cleaning, de-husking, separating, bran removing, and grading. These processes are integrated into one system by bucket elevators linking machine to machine to accomplish each stage of processing to the end where the output is in the form of polished rice. A modern multiple-pass milling machine uses about one-half to two thirds of the electricity of a steel huller operating at the same capacity. Modern multiple-pass machines result in much lower losses in milling. Modern multiple-pass machines do exist in Viet Nam. However, they are few and mainly owned by foreign companies or by joint-venture enterprises between foreign and state-owned food companies (like Toyo Dragon Factory in Can tho) (Ninh, 2010). The rice quality and mostly the rice recovery rate differs by technology type. The stone disc huller technology can achieve a rice recovery rate of 47% in a small mill to 50% in a medium mill. The rubber roll huller technology can achieve a rice recovery rate of 51% in a small mill to 54% in a medium mill. The size of the mill is an important factor for the rice recovery rate. The maximum head rice recovery in large plants is still around 55% in Viet Nam, while the ideal level should be 60% (MARD, 2010). Table 6.31 shows that, there are 4 types of mills according to capacity: Table 6.31 Stratification of rice mills
Mill types Capacity (tons of milled rice per hour)
Small mill Capacity < = 1
Medium mill 1< Capacity <=5
Large mill Capacity >5
Modern mill-polish plant max 21 tons/hour
In the study area, about 60% of mills are small mills; 29% are medium mills and 11% are large mills and mill-polishers together (Hau giang Trade and Industry Department, 2012). In terms of investment in the mill sector, the state investment focus is on large scale complete mill-polishing chains, and only 12.2% of mills receive investment from the state under the joint-stock form (table 6.31). Meanwhile 100% of mills have received investment from individuals. The literature mentions the competition of private mills and state-owned mills throughout the 2000s and the disadvantages of private mills (Goletti, 2002). But our research shows that the
328

private sector had an increasing role in the mill sector and now they are quite dominant. The large and medium mills have a tendency to concentrate in some geographical areas near river ways like Long xuyen (in An giang) and Thot not (in Can tho), Cai be (in Tien giang)… The small mills are mostly located in villages. The research shows that there are also differences in investment in equipment. When mills are first founded, owners have to borrow credit to invest, and the loan capital makes up 51% of the total investment required to build milling-polishing chains, due to the large-scale and modern equipment line. While the small mills and even large mills use only small parts of capital from credit. The work on rice value chains by ADI in 2002 discusses the severity of mill credit constraints. The mill can borrow the official credit when they have the rice export contract (Goletti, 2002). The small and large mills don’t have export contracts in the domestic chain, so the hypothesis of low use of credit is explained by constraints to bank credit. It is interesting that the Viet Namese government had a policy to promote low interest credit for rural enterprises, but that this policy doesn’t work in An giang and Hau giang. Most large mills (9% of large mills and 47% of milling-polishing plants) participate in the VFA association because of their interest in the rice exportation quota. Viet Nam Food Association (VFA) is an association managed by the Ministry of Agriculture (MARD). The members are 141 companies working in the food business. VFA coordinates export quotas every year. The association also facilitates the implementation of some governmental policies like the buffer buying of rice at a floor price in order to stabilize the farm gate price during the high season of harvest. From the data we can see also the different strategies for investing in the mill. The complete white rice system for small mills and modern mill-polishing plants use a different technology. For small mills, this involves the traditional white rice milling system without polishing machines. This technology was good for rice sold in the domestic market in the past. For this investment, the mill has to buy the whole system at the same time, but the share of mills doing this is only 20%. For the modern mill-polishing plant, the complete system includes a polishing machine, and they also have to buy the complete chain at the same time. As a result, only 24% of mills in the segment can do this because of the big capital volume and credit constraints involved.
329

The paddy dryer is a new demand in the area. 10% of small and 53% of medium mills invest in paddy dryers, in order to assure the quality of paddy. Large mills have difficulty in investing in new dryers because of space constraints. In the mill-polishing plant, the dryer is a rice dryer, which is different from a paddy dryer. Polishing machines exist in the large mill and mill-polish chain only. This is what’s required to fill big export contracts or contracts with supermarkets in the domestic market. In terms of the application of new technology, rubber rollers enable a higher rice quality than does stone disc technology. Although milling machines with stony rollers produce whiter rice, the grain is often broken. Therefore mills prefer milling machines with rubber rollers. Up to 48.78% of milling-polishing chains, 53.55% of medium mills and 40% of small mills use these machines. So the data shows that mill investment is also oriented towards new technology, and with private ownership as well. Discoloration machines – a very important piece of equipment that is only needed by milling-polishing chains, and are owned by 78% of milling-polishing chains. In brief, the rice mill sector was dominated by private actors. In this context the government needed to build a partnership with the private sector to create a supportive policy environment for the rice value chain.
330

Table 6.32 Characteristics of rice mills Characteristics Unit Small mill Medium mill Large mill Modern mill-polish plant Overall
Number of surveyed mill N 10 15 4 41 70
Average age of mill owner Years old 42 49 45 46 46
Gender (male) % 70 73 100 81 79
Education Years 8.4 9.9 9 12.7 11.3
Business experience Years 6 11 15 12 11
Private mills % 100 100 100 76 95
State joint-stock mills % 0 0 0 12 2.5
Association members mills % 0 0 9.1 47 14
Total mill operation area m2 87 1,550 2,500 4,825 3,344
Average capacity of Mill Ton per hr 0.2 3.8 9.6 20.8 13.4
% Loan capital when starting mill business % 12 0 7.5 51.2 32.1
% Complete white rice mill system % 20 0 0 24 17
Average investment of Complete white rice mill system USD 7,180 0 0 418,062 359,365
% Mills owning dryer % 10 53 0 56 45
% Mills using rubber roll huller % 40 53 75 49 50
% Mills using stone disc huller % 30 40 0 46 40
% Mills owning rice polishing machine % 0 0 25 100 31
% Mills owning discoloration machines % 0 0 0 78 46
Total value of mill USD 5,313 115,845 191,479 355,000 244,453
Operating capital USD 221 64,784 119,674 2,224,561 602,310
% Loan capital in total operating capital % 0 28.57 39.62 16.84 17.02
Raw material used(Paddy/Brown rice) Ton per month 48 2,268 6,768 13,791 7,866
331

6.3.2.2. Conduct of rice mills Table 6.33 shows that different mill segments can produce diverse products in order to respond to the demands of clients. The small mills produce mostly white rice for the domestic market or for local consumption. They can also produce a small share of polished rice to meet the demand for quality rice at the local level. The medium and large mills mostly produce brown rice, but they also produce a small share of white rice (only polished once). The mill-polishers can polish only or completely process the rice to produce polished rice (twice polished) to meet exportation standards. Table 6.33 The share of mills performing different milling operations (%)
Operations in the milling process Small mills
Medium mills
Large mills
Mill-polish plant
% of mills performing de-husking (brown rice) 0 72.7 75 0
% of mills only performing polishing 12.5 0 0 92.5
% of mills performing de-husking and de-branning (white rice)
87.5 27.3 0 0
% of mills performing de-husking, de-branning and polishing (polished rice)
0 0 25 7.5
Total 100 100 100 100
Table 6.34 explains the capacity use time for mill during the year. This is very important for mill efficiency when the rice production has high seasonality. The high season and the low season are detailed in the previous part of the report. The operating duration of rice mills differs between the low and high season. In the high season, where a majority of farmers harvest rice and rural traders have to buy immediately in the field. As a result, dryers and mills also have to work on the same schedule. In the high season most mills work 30 days per month and nearly 24 hours per day. This intensity of work approaches the maximum operating duration for medium, large mills and mill-polish plants. In the high season only small mills don’t work at night, but they work the entire day because they do the mill service more for home consumption rather than to fill a contract. Out of season, as previous parts showed, some farmers still harvest rice and rural traders still go to the field and buy rice in smaller quantities. So the paddy mills need to respond to this demand. In the low season, when the rice mill demand is lower, mills operate about 24 days per month and 10 hours per day only during the day. Small local mills operate 20 days per month and 3.3 hours per day.
332

This mill operating duration in the An giang-Hau giang area is very high compared to that of other cases. Table 6.34 Duration of operation of rice mills
Mill
High season Low season
Smal
l mill
Med
ium
m
ill
Larg
e
mill
Mill
-pol
ish
plan
t
Smal
l mill
Med
ium
m
ill
Larg
e
mill
Mill
-pol
ish
plan
t
Working days per month (days) 28 29.7 30 29.6 20 24.2 24.5 20.3
Working hours per day (hours) 8.4 20.1 23.5 22.4 3.3 10.2 10.3 10.4
Table 6.35 shows the difference in milled and polished rice quantity in the low and high seasons. In the high season, small mills process only 48 tons in order to meet local consumption demand. Milled rice quantity by small mills in the low season is only 7 tons. The main functions of medium and large mills are to mill, to de-husk and to supply rice to milling-polishing plants. The milled rice quantity of medium mills in the high season is more than 2268 tons and of large mills is 3 times more. The large mill has more efficiency than the smaller. The mill-polishing plant has a higher milled rice quantity. Their milled rice quantity in the high season is relatively high (13,791 tons) and in the low season is 4,328 tons. Table 6.35 Milled rice quantity in high and low season Mill size High season (ton) Low season (ton)
Small mill 48 7
Medium mill 2,268 962
Large mill 6,768 1,994
Milling-polishing plant 13,791 4,328
Total 7,840 2,635
Table 6.36 shows the share of input for different mill segments. The mills can do the rice business and provide the mill service. They can also gain income from selling husk and bran that they collect during the milling operation. The data show that farmers can only sell their paddy directly to small mills and medium mills located in the village or nearby. The large mill and mill-polish plant have to buy paddy from rural traders with a larger volume.
333

Table 6.36 The share of rice mills suppliers and mill service users (% of mill’s total bought paddy volume)
Supplier Small mill
Medium mill
Large mill
Mill- polish plant
Overall
Paddy suppliers
Farmers 50 17 0 0 11
Rural trader 50 83 100 100 89
Total 100 100 100 100 100
Brown rice suppliers
Medium mill - - - 11 11
Large mill - - - 19 19
Rural trader through broker - - - 24 24
Rural trader direct - - - 46 46
Total - - - 100 100
User of mill service
Farmers 90 0 0 - 29
Rural traders 10 100 100 - 71
Total 100 100 100 - 100
For the brown rice suppliers, they can sell to mill-polish plants. The most important supplier modality of brown rice is rural trader sales directly to mills. Another rural trader can also sell the brown rice to mill-polish plants but through a mill broker and pay a commission. The large and medium mills could also sell brown rice to mill-polish plants but with a smaller share. The users of mill services offered by small mills are mostly farmers who use them for home consumption because the small mills are located mostly in the village. The rural traders use mostly the mill service at medium and large mills. The mill-polish plants don’t provide the mill service for any client, they only trade rice. The mill in the area trades and mills paddy to produce three type of rice: brown rice, white rice and polished rice. Table 6.37 shows the client type share by product volume sold by the mill per month. The rice products shown in this table include brown rice (as an intermediate product) and white and polished rice (as a final product). 49%o of sales were for export and 51% were marketed domestically. Companies that obtain the quota for exportation and for owning the mill, directly export rice. Other mills who have export quotas indirectly export rice.
334
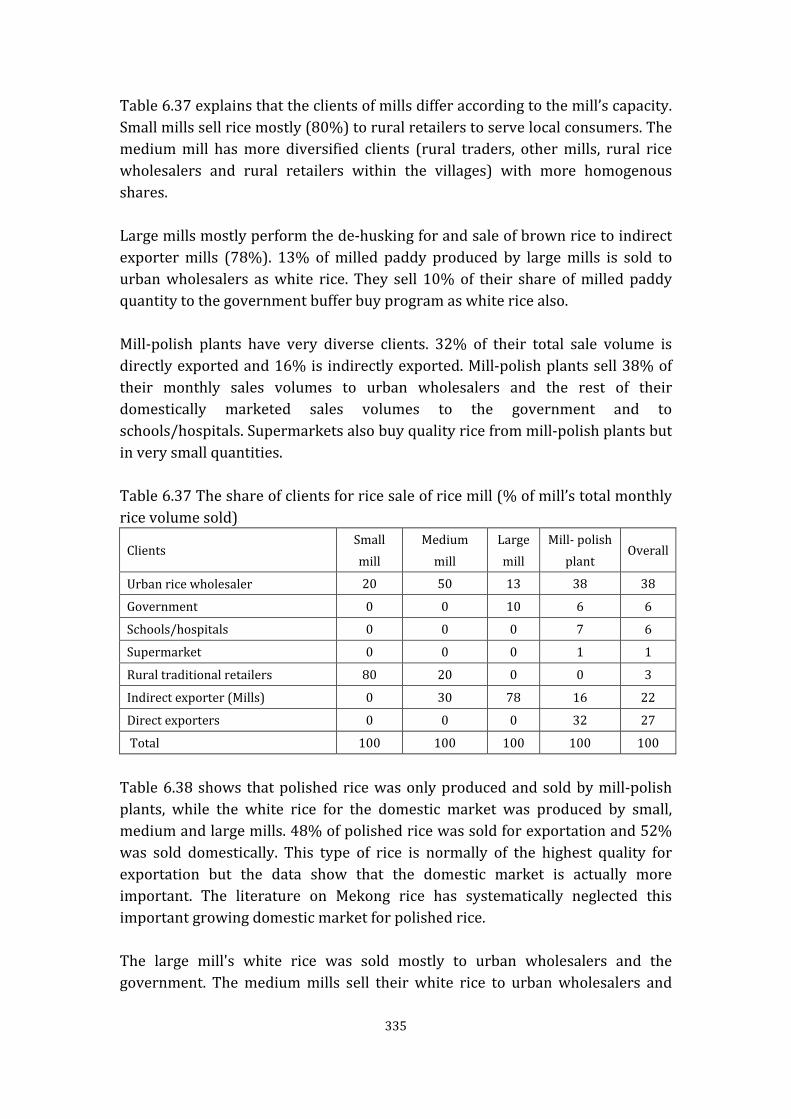
Table 6.37 explains that the clients of mills differ according to the mill’s capacity. Small mills sell rice mostly (80%) to rural retailers to serve local consumers. The medium mill has more diversified clients (rural traders, other mills, rural rice wholesalers and rural retailers within the villages) with more homogenous shares. Large mills mostly perform the de-husking for and sale of brown rice to indirect exporter mills (78%). 13% of milled paddy produced by large mills is sold to urban wholesalers as white rice. They sell 10% of their share of milled paddy quantity to the government buffer buy program as white rice also. Mill-polish plants have very diverse clients. 32% of their total sale volume is directly exported and 16% is indirectly exported. Mill-polish plants sell 38% of their monthly sales volumes to urban wholesalers and the rest of their domestically marketed sales volumes to the government and to schools/hospitals. Supermarkets also buy quality rice from mill-polish plants but in very small quantities. Table 6.37 The share of clients for rice sale of rice mill (% of mill’s total monthly rice volume sold)
Clients Small mill
Medium mill
Large mill
Mill- polish plant
Overall
Urban rice wholesaler 20 50 13 38 38
Government 0 0 10 6 6
Schools/hospitals 0 0 0 7 6
Supermarket 0 0 0 1 1
Rural traditional retailers 80 20 0 0 3
Indirect exporter (Mills) 0 30 78 16 22
Direct exporters 0 0 0 32 27
Total 100 100 100 100 100
Table 6.38 shows that polished rice was only produced and sold by mill-polish plants, while the white rice for the domestic market was produced by small, medium and large mills. 48% of polished rice was sold for exportation and 52% was sold domestically. This type of rice is normally of the highest quality for exportation but the data show that the domestic market is actually more important. The literature on Mekong rice has systematically neglected this important growing domestic market for polished rice. The large mill's white rice was sold mostly to urban wholesalers and the government. The medium mills sell their white rice to urban wholesalers and
335

rural retailers near the mill areas. The small mills mostly sold white rice to rural retailers. Table 6.38 Mills’ final clients (white + polished rice)(% of mills’ total monthly rice volume sold)
Small mill (white rice)
Medium mill (white rice)
Large mill (white rice)
Mill- polish plant
(polished rice)
Overall
Domestic market 100 100 100 52 80
Urban wholesaler 20 71 56 38 48
Government 0 0 44 6 5
Schools/hospitals 0 0 0 7 3
Supermarket 0 0 0 1 1
Rural traditional retailers 80 29 0 0 23
Export market 0 0 0 48 20
Indirect exporter (Mills) 0 0 0 16 7
Direct exporters 0 0 0 32 14
Total 100 100 100 100 100
Table 6.39 shows the final real rice output of each type of mill. Mill capacity is clearly differentiated for mill-polish plants and small mills. Table 6.39 The sold quantity per month of final rice (white + polished rice) of mill (average per mill)
Products Small mill
Medium mill
Large mill
Mill- polish plant
Overall
White rice (ton) 15 40 2,000 0 131
Polished rice (ton) 0 0 0 11,073 4,745
Total (ton) 15 40 2,000 11,073 4,876
Table 6.40 shows the mill activities mills available to different types of mills. Medium mills mostly focus on the provision of mill services (98%). They don’t trade paddy at all. Small and large mills perform about 70% of business related to mill services. Small mills only produce white rice for sale for the local area, while large mills produce 25% white rice and 75% brown rice. Mill-polish plants don’t provide mill services and only produce polished rice.
336
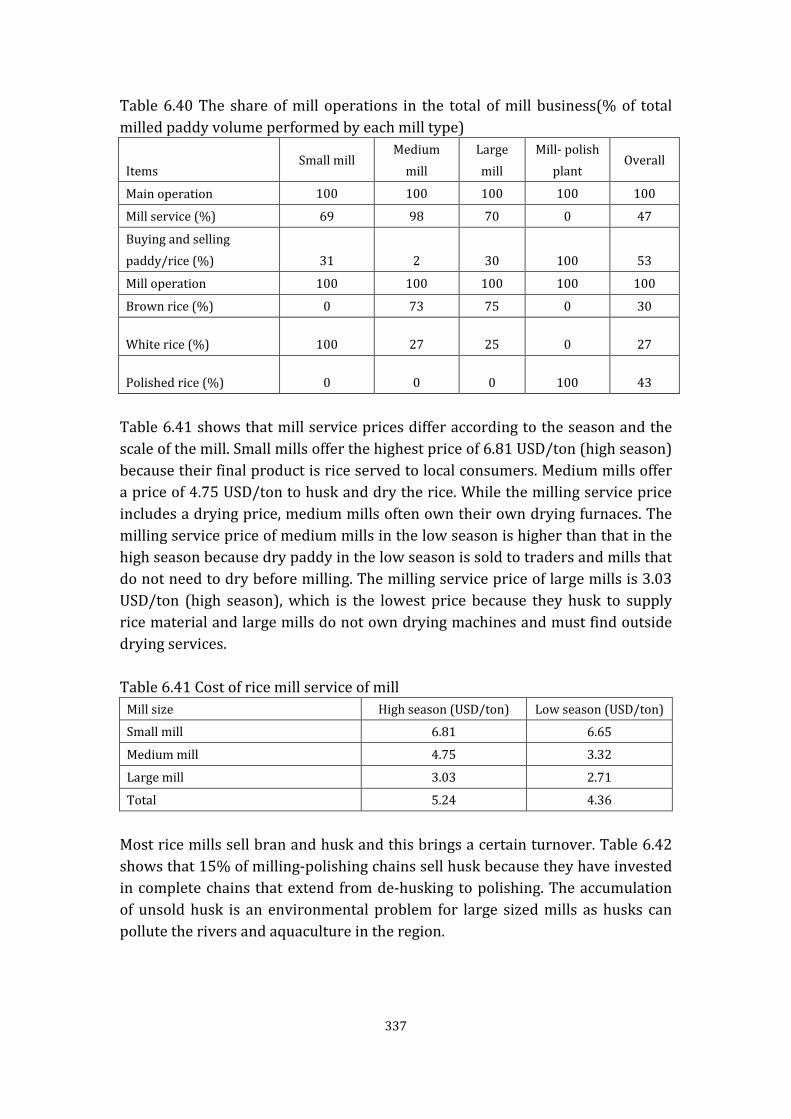
Table 6.40 The share of mill operations in the total of mill business(% of total milled paddy volume performed by each mill type)
Items Small mill
Medium mill
Large mill
Mill- polish plant
Overall
Main operation 100 100 100 100 100
Mill service (%) 69 98 70 0 47
Buying and selling paddy/rice (%) 31 2 30 100 53
Mill operation 100 100 100 100 100
Brown rice (%) 0 73 75 0 30
White rice (%) 100 27 25 0 27
Polished rice (%) 0 0 0 100 43
Table 6.41 shows that mill service prices differ according to the season and the scale of the mill. Small mills offer the highest price of 6.81 USD/ton (high season) because their final product is rice served to local consumers. Medium mills offer a price of 4.75 USD/ton to husk and dry the rice. While the milling service price includes a drying price, medium mills often own their own drying furnaces. The milling service price of medium mills in the low season is higher than that in the high season because dry paddy in the low season is sold to traders and mills that do not need to dry before milling. The milling service price of large mills is 3.03 USD/ton (high season), which is the lowest price because they husk to supply rice material and large mills do not own drying machines and must find outside drying services. Table 6.41 Cost of rice mill service of mill
Mill size High season (USD/ton) Low season (USD/ton)
Small mill 6.81 6.65
Medium mill 4.75 3.32
Large mill 3.03 2.71
Total 5.24 4.36
Most rice mills sell bran and husk and this brings a certain turnover. Table 6.42 shows that 15% of milling-polishing chains sell husk because they have invested in complete chains that extend from de-husking to polishing. The accumulation of unsold husk is an environmental problem for large sized mills as husks can pollute the rivers and aquaculture in the region.
337

Table 6.42 Share of sold sub-product in the total volume of sub-product (% ) % of sold bran volume % of sold husk volume
Small mill 80 70
Medium mill 100 47
Large mill 100 67
Milling-polishing chain 100 15
Table 6.43 shows that mill-polish plant turnover is particularly high, and that mill-polish plants are capable of processing high quality rice and demonstrate a tendency to concentrate and modernize. Large mills also exhibit high turnover. The incomes related to husk and bran are also important for all mills because mill service prices are not high. The husk price is 6.2 USD/ton, while the soft bran from the polish stage is 91 USD/ton. In the de-husking stage, 1 ton of paddy can yield 210 kg of husk. In the polishing stage, 1 ton of brown rice can yield 140 kg of soft bran. Table 6.43 Turnover of rice mills from selling husk and bran (2011)
Mill size Amount (USD)
Small mill 4,624
Medium mill 25,327
Large mill 68,703
Mill-polish plant 1,381,235
Table 6.44 shows that labor use is different across the mill segment. Small mills use mostly family labor. Medium and large mills use more temporary labor in response to the seasonality of mills. In terms of efficacy, we can see the ratio of raw material/long-term labor. The results show that: small = 480; medium = 687; large = 846; mill-polish =676. The large mill has the highest ratio. This information explains the concentration of mills. Table 6.44 Number of laborers in rice mills
Mill size Long-term Labor (persons) Short-term labor (persons)
Small mill 0.1 0.1
Medium mill 3.3 15.9
Large mill 8 24
Mill-polish plant 20.4 46.1
338
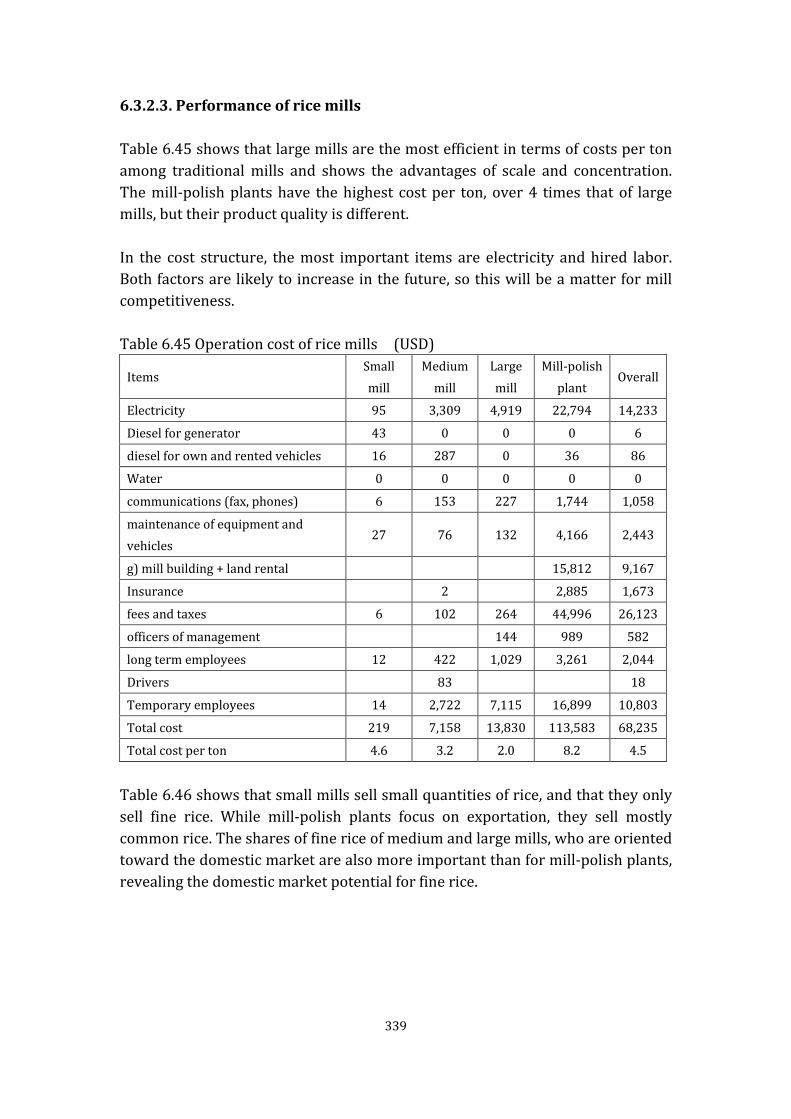
6.3.2.3. Performance of rice mills Table 6.45 shows that large mills are the most efficient in terms of costs per ton among traditional mills and shows the advantages of scale and concentration. The mill-polish plants have the highest cost per ton, over 4 times that of large mills, but their product quality is different. In the cost structure, the most important items are electricity and hired labor. Both factors are likely to increase in the future, so this will be a matter for mill competitiveness. Table 6.45 Operation cost of rice mills (USD)
Items Small mill
Medium mill
Large mill
Mill-polish plant
Overall
Electricity 95 3,309 4,919 22,794 14,233
Diesel for generator 43 0 0 0 6
diesel for own and rented vehicles 16 287 0 36 86
Water 0 0 0 0 0
communications (fax, phones) 6 153 227 1,744 1,058
maintenance of equipment and vehicles
27 76 132 4,166 2,443
g) mill building + land rental 15,812 9,167
Insurance 2 2,885 1,673
fees and taxes 6 102 264 44,996 26,123
officers of management 144 989 582
long term employees 12 422 1,029 3,261 2,044
Drivers 83 18
Temporary employees 14 2,722 7,115 16,899 10,803
Total cost 219 7,158 13,830 113,583 68,235
Total cost per ton 4.6 3.2 2.0 8.2 4.5
Table 6.46 shows that small mills sell small quantities of rice, and that they only sell fine rice. While mill-polish plants focus on exportation, they sell mostly common rice. The shares of fine rice of medium and large mills, who are oriented toward the domestic market are also more important than for mill-polish plants, revealing the domestic market potential for fine rice.
339

Table 6.46 Output and selling price of mill
Items Small mill
Medium mill
Large mill
Mill-polish plant
Overall
Total milled rice per month (tons) 48 2,268 6,768 13,791 7,866
Rice sold (% of the total volume) 31 2 30 100 41
Mill service (% of the total volume) 69 98 70 0 59
Sold quantity in 03/2012 (tons) 15 40 2,000 11,073 9,126
Common rice (% of the total sold volume)
53 48 78 73
Fine rice (% of the total sold volume) 100 47 53 22 27
Rice price (USD/ton)
Common rice
Buying price 267 242 322 277
Selling price 328 323 384 345
Export price 409 409
Fine rice
Buying price 254 274 253 324 276
Selling price 393 347 340 399 370
Export price 436 436
Table 6.47 shows how mill profit rates differ for different types of rice. The fine quality rice profit rate of medium mills is the lowest, 19%. Small mills and mill-polish plants have very high profit rates, 43-46%. While mill-polish plants mainly achieve such high profit rates by focusing on the export market, small mills are only able to achieve these high profit rates for very small quantities. Common rice has lower profit rates for all types of mills. Table 6.47 Profit rate of rice mills
Mills Small mills
Medium mills
Large mills
Mill-polish plant
Common rice
Profit rate 5 36 35
Fine rice
Profit rate 43 19 38 46
Note: The profit rate for the trader was calculated by formula: Profit rate = 100*(1- Total cost/absolute profit), in which: Absolute profit = Buying price - selling price Total cost = variable cost + depreciation + marketing cost
340

6.4. Downstream: Rice retail transformation
6.4.1 Urban traders
6.4.1.1. Structure of urban rice wholesaler Urban rice wholesalers were surveyed only in Ho Chi Minh city. Table 6.48 shows that mostly men were involved in this business (80%). They use mostly their own capital for working capital (97%) and don’t make use of credit. The urban wholesalers don’t trade paddy, only rice. 86% have storehouses and over 33% rent in due to a lack of storage space. In the city, wholesalers use mostly motorbikes as a means of transport because trucks are prohibited in the city during daytime. Table 6.48 Characteristics of urban rice wholesaler Characteristic Rice wholesaler
Number of surveys 50
Age (years old) 42.4
Gender (% male) 80
Education (years) 10.6
Actual working capital (1000 USD) 25.5
Owned working capital (%) 97
Duration of transaction (days) 9.7
% business of paddy only 0
% rice business 100
Rice in total turnover (%) 100
% wholesaler owning storehouse 86
% wholesaler renting storehouse 33
Average area of storehouse (m2) 63
% traders using trucks 8
% traders using motorbikes 100
Average number of employees (persons) 2.1
Table 6.49 shows that the wholesaler segment is mostly (98%) composed of independent wholesalers. The investigation also indicates that large mills also have agencies introducing their rice products, without passing through urban wholesale. 2% of wholesalers are agents of the mill in urban areas. Big mills have a tendency to develop a network of agents and retailer networks in the city in order to sell directly to consumers.
341
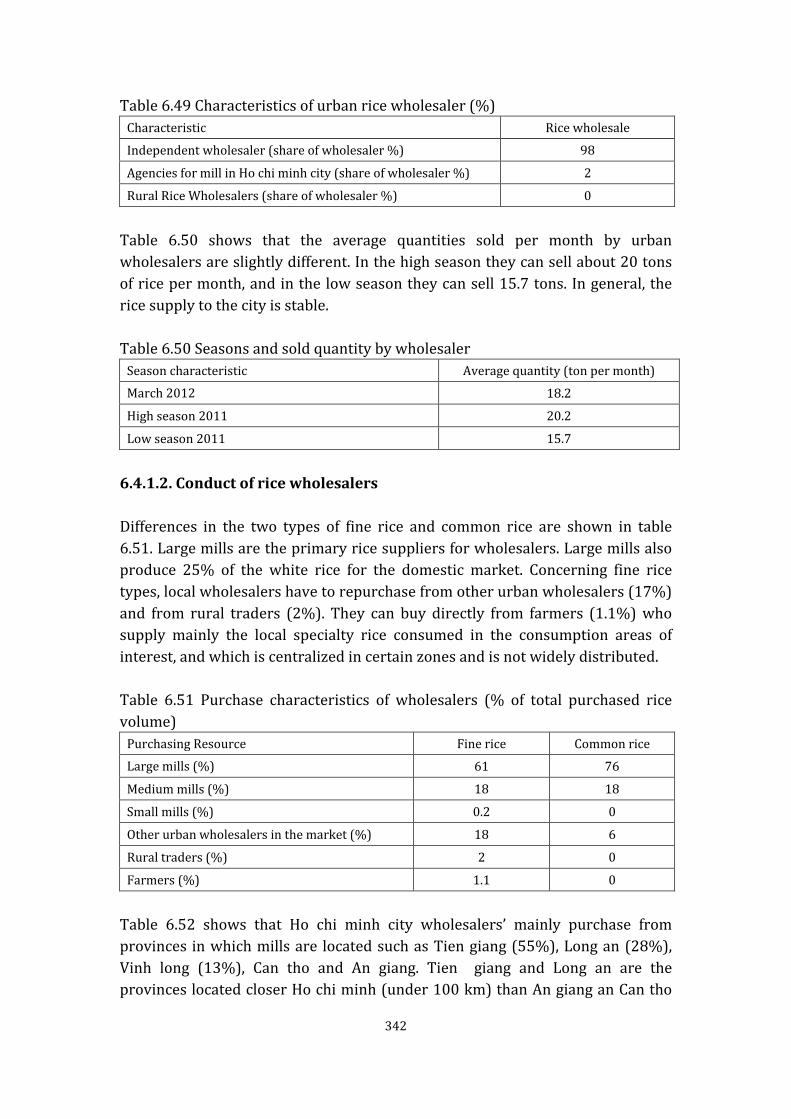
Table 6.49 Characteristics of urban rice wholesaler (%) Characteristic Rice wholesale
Independent wholesaler (share of wholesaler %) 98
Agencies for mill in Ho chi minh city (share of wholesaler %) 2
Rural Rice Wholesalers (share of wholesaler %) 0
Table 6.50 shows that the average quantities sold per month by urban wholesalers are slightly different. In the high season they can sell about 20 tons of rice per month, and in the low season they can sell 15.7 tons. In general, the rice supply to the city is stable. Table 6.50 Seasons and sold quantity by wholesaler
Season characteristic Average quantity (ton per month)
March 2012 18.2
High season 2011 20.2
Low season 2011 15.7
6.4.1.2. Conduct of rice wholesalers Differences in the two types of fine rice and common rice are shown in table 6.51. Large mills are the primary rice suppliers for wholesalers. Large mills also produce 25% of the white rice for the domestic market. Concerning fine rice types, local wholesalers have to repurchase from other urban wholesalers (17%) and from rural traders (2%). They can buy directly from farmers (1.1%) who supply mainly the local specialty rice consumed in the consumption areas of interest, and which is centralized in certain zones and is not widely distributed. Table 6.51 Purchase characteristics of wholesalers (% of total purchased rice volume)
Purchasing Resource Fine rice Common rice
Large mills (%) 61 76
Medium mills (%) 18 18
Small mills (%) 0.2 0
Other urban wholesalers in the market (%) 18 6
Rural traders (%) 2 0
Farmers (%) 1.1 0
Table 6.52 shows that Ho chi minh city wholesalers’ mainly purchase from provinces in which mills are located such as Tien giang (55%), Long an (28%), Vinh long (13%), Can tho and An giang. Tien giang and Long an are the provinces located closer Ho chi minh (under 100 km) than An giang an Can tho
342

(205 km). We can see that the mill in Tien giang also buys rice from An giang and Hau giang, but our sample missed Tien giang mills, so we cannot trace exactly the rice flow from An giang to Ho chi minh city. This is a gap in our survey. Table 6.52 Origin of rice bought by wholesaler in Ho Chi Minh city
Province origins Share of rice bough by wholesaler in Ho Chi Minh city (% of total volume)
Distance to HCM (Km)
An giang 1 205
Can tho 2 146
Vinh long 13 136
Tien giang 55 70
Long an 28 40
Total 100 -
Table 6.53 shows the destination of different types of rice sold by wholesalers in urban areas. Wholesalers’ major customers are traditional retailers, 80.9% of whom purchase fine rice and 97.2 % of whom purchase common rice. Wholesalers also serve as retailers by selling directly to consumers while modern retailers make up only a small proportion of wholesale turnover. Table 6.53 Wholesalers’ customers (% of total rice volume sold) Destination for rice Fine rice Common rice
Other wholesalers 4.7 5
Traditional retailers 81 87
Modern retailers 1.4 0.4
Hotels, restaurants 0.3 0
Direct consumers 9 7
Table 6.54 displays different types of payments made by wholesalers’ suppliers and customers. Payment in cash is the dominant form. There is a small proportion of delayed payment to suppliers (14%) but a large proportion is composed of delayed receipt from customers (up to 98%), which explains the reason for the major capital requirements of wholesale businesses. Customer retention is achieved by accepting delayed payment for a relatively long duration of 9.5 days with overlapping payment (the current order along with the previous purchase). Meanwhile only a few wholesalers can delay payment to their suppliers. Wholesalers can also have a high share of advance payment for suppliers. It’s clear that urban wholesalers have to invest in value chain finance in order to stabilize the chain’s operation.
343
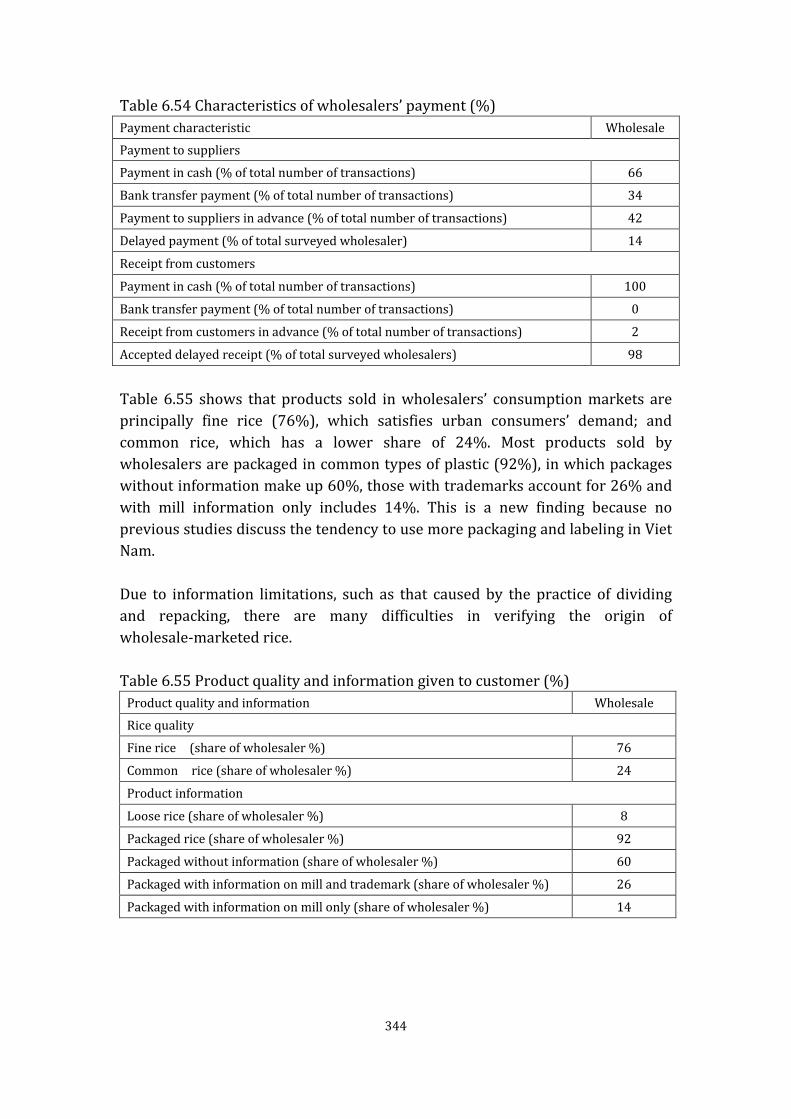
Table 6.54 Characteristics of wholesalers’ payment (%) Payment characteristic Wholesale
Payment to suppliers
Payment in cash (% of total number of transactions) 66
Bank transfer payment (% of total number of transactions) 34
Payment to suppliers in advance (% of total number of transactions) 42
Delayed payment (% of total surveyed wholesaler) 14
Receipt from customers
Payment in cash (% of total number of transactions) 100
Bank transfer payment (% of total number of transactions) 0
Receipt from customers in advance (% of total number of transactions) 2
Accepted delayed receipt (% of total surveyed wholesalers) 98
Table 6.55 shows that products sold in wholesalers’ consumption markets are principally fine rice (76%), which satisfies urban consumers’ demand; and common rice, which has a lower share of 24%. Most products sold by wholesalers are packaged in common types of plastic (92%), in which packages without information make up 60%, those with trademarks account for 26% and with mill information only includes 14%. This is a new finding because no previous studies discuss the tendency to use more packaging and labeling in Viet Nam. Due to information limitations, such as that caused by the practice of dividing and repacking, there are many difficulties in verifying the origin of wholesale-marketed rice. Table 6.55 Product quality and information given to customer (%)
Product quality and information Wholesale
Rice quality
Fine rice (share of wholesaler %) 76
Common rice (share of wholesaler %) 24
Product information
Loose rice (share of wholesaler %) 8
Packaged rice (share of wholesaler %) 92
Packaged without information (share of wholesaler %) 60
Packaged with information on mill and trademark (share of wholesaler %) 26
Packaged with information on mill only (share of wholesaler %) 14
344

6.4.1.3. Performance of urban rice wholesaler Table 6.56 shows that costs associated with rented storage warehousing, administration fees and VAT taxes account for a high proportion of wholesalers’ overall costs. In terms of labor costs, wholesalers usually have to hire labor loading (from suppliers to trucks and from trucks down to their stores), which results in high labor costs, while there is only a relatively small proportion of long-term payment to laborers. Tax also contributes to the high price of rice. Table 6.56 Costs of wholesale activities in urban area (USD/ton)
Cost Wholesale
1. Mean Annual Costs besides labor cost, in USD/TON
Electricity 3.6
Diesel to generate electricity 0.04
Water 0
Communication fee (fax, phones) 2.9
Maintenance of equipment and vehicles (other than own hired labor) 0.8
Warehouse/ rental 2.2
Stall building/ rental 5.4
Diesel for own and rented vehicles 6
Taxes 5.3
Insurance 0
Other costs (re-package ) 1.5
2. Labor cost (USD/ton)
non-hired family labor (people) 2.1
Own labor imputed at market wage (USD/tons) 4.4
temporary employees for loading & unloading and other product preparation like bagging and stitching 3.7
Hired labor besides drivers (both permanent and temporarily) 7.8
Drivers 0.4
Table 6.57 Costs of wholesale activities in urban area (USD/ton)of last transaction
Costs Wholesale
1. Last transaction of rice purchasing
1.1. costs
bags, Bagging and stitching costs of labor 0.5
Loading labor costs ( fees or own costs) 2.2
unloading labor costs ( fees or own costs) 1.5
Weighing fees (costs) paid to market None
own transport costs of rice (fuel + labor for your own vehicle) and hired 11.2
345

cost of Provincial tax for transport office 0.1
imputed cost of quantity wasted (physical waste in kg * rice price) 0.8
total cost for the transaction in USD (average of 18.99 tons/time) 310.4
total cost in USD per ton for the transaction 16.3
1.2. Other information on the transaction
distance in time from the supplier to the trader (hours) 4.1
Distance in km from the supplier (this is closer than our study zone) 119.6
% of traders uses phone calls for the transaction 34
Market admission fee at supplier point (if you bought it from wholesale market) None
2. Rice selling XX
2.1. costs
bags, bagging and stitching costs of labor 0.2
Loading labor costs ( fees or own costs) 0.11
unloading labor costs ( fees or own costs) 0.05
Weighing fees (costs) paid to market None
own transport costs of rice (fuel + labor for your own vehicle) and hired 5.6
cost of Provincial tax for transport office None
imputed cost of quantity wasted (physical waste in kg * rice price) 0.1
total cost for the transaction in USD (average of 1.386 tons/time) 8.4
total cost in USD per ton for the transaction 6.1
1.2. Other information on the transaction
distance in time from the supplier to the trader (hours) 0.9
Distance in km from the supplier 8.2
% of traders uses phone calls for the transaction 50
Market admission fee at supplier point (if you bought it from wholesale market) None
Table 6.58 shows that wholesalers have a more important price influence on fine rice than on common rice. They have to invest in suppliers and customers and they have the power to decide the price. This is just a hypothesis to check, and cannot be confirmed here. Table 6.58 Price of different rice types of wholesaler (USD/ton)
Price Common rice Fine rice
Buying price 383 394
Selling price 484 603
Table 6.59 shows the profit rates of urban wholesalers in Ho chi minh City. Different types of rice are associated with different profit rates for wholesalers. For fine rice, the profit rate (67) is much higher than for common rice (32) because the selling price of fine rice is much higher while the buying price is quite similar. This is the added value created in the value chain.
346

This is the first research on domestic rice value chains in Ho chi Minh, so we don’t have the information necessary to conduct a comparison. The urban wholesale market profit rate in Dhaka is 17-26%, in China 24% and in Delhi 66-72% (Reardon & al., 2012). So the profit rate of urban wholesalers in Ho chi Minh city are only lower than in India, but higher than in China and Bangladesh. Table 6.59 Profit rate of urban wholesaler
Product Profit rate
Fine rice 67
Common rice 32
Note: The profit rate for the trader was calculated by formula: Profit rate = 100*(1- Total cost/absolute profit), in which: Absolute profit = Buying price - selling price Total cost = variable cost + depreciation + marketing cost
6.4.2. Modern and traditional retails
6.4.2.1. The structure of rice retailers 6.4.2.1.1. The structure of traditional retailers The rice in urban Ho chi minh city in the past was mostly sold by a traditional retailer, who was mainly located in the wet market. Also in some high population density areas there are rice shops located in houses, open to the street. There is one big wholesaler market for rice, but now with the new master plan of Ho chi Minh city, this market was relocated to the peri-urban area. Rice retailers specialize in rice trade. Sometimes they can trade other grains like maize, beans, etc. New modern retailers now involve supermarkets for rice selling. But the supermarket still occupies a small share of the rice market due to the few number of stalls in the city. Now supermarkets in Ho Chi Minh city have developed a new food shop system in order to expand the retail network. Supermarkets co-invest with some private traders who have a place favorable for retail sale to develop food shops systems. Food shops sell different foods, including rice supplied by the supermarket. The food shop is now competing with rice retailers. Table 6.60 shows the characteristics of retailers in the study area, there is no difference in ownership by gender. The average age of retailers is relatively young, around 31.8 years old, while their business has generally existed for a short time (8-9 years), and their rice and food product sales only started 7 years ago on average. The survey shows that retailers often sell rice initially and then
347

proceed to diversify to other products but the retailer rate that is involved in selling rice together with other products is low, accounting for around 10%. Traditional retailers sell on a small scale and do not engage in wholesale activity, so the turnover is about 154kg/day or 4.6 tons per month (30 days). The retailers in Can tho can achieve 5.6 tons/month and HCM city retailers, about 3.5 tons/month. However, traditional retail distribution is very large in the survey area, and each traditional market (wet market) has on average 7 retailers, which is an increase from the number of 5-6 retailers from 5 years ago. The growth of retailers increases competition in every area of retail. Table 6.60 shows that the rice retailers in HCM city are more frequently found in the street (62%) than in wet markets. In Can tho, half of rice retailers are in wet markets, and another half are in the street. The volume of each transaction is more important in Can tho than HCM city. Table 6.60 Characteristics of rice retailers in urban areas Characteristics HCMC Can Tho city Total
Age (years) 32.5 31 31.8
Sex (% male) 49.3 52.4 50.8
Business experience in wet market 7 11 9
Business experience outside wet market (years)
8 8 8
Stall in wet market (%) 38 49 42
Shop in the street (%) 62 51 58
Rice selling starting year 7.4 10 8.9
Food selling starting year 7.3 6.3 6.7
Turnover per day (kg) 115 188 154
Last transaction (full of purchase and then selling, kg)
678 1386 1001
Table 6.61 shows the characteristics of employers and capital sources of retailers. On average, each retailer uses 1.62 employees for their business activities. The laborers that retailers use are mainly family labor as only 2 households surveyed hired employees. However, employing laborers in the retailing households was undertaken not only for the purpose of selling rice but also for many other jobs in the retailing households. Retailer operating budgets are not big as trade is carried out on a small scale.
348

Table 6.61 Labor and capital of traditional retailers Characteristics HCMC Can tho city Total
Average number of laborers 1.4 1.8 1.6
Average cost for employing labors (USD / month) - 120 119
Working capital (USD) 1,774 2,000 1,873
6.4.2.1.2. The structure of Modern Retailers Modern retailers are growing fast in Ho chi minh city (HCM city) and are doing so in many different forms, such as supermarkets, and food shops. This is a new direction for the development of rice retail in Viet Nam’s urban areas. Table 6.62 shows that modern retailers sold rice for quite a short time (6.3 year) and the consumption price stabilization policies for rice commodities have mainly supported modern retailers. The average distance between modern retailers and traditional markets is only 0.5 km, modern retail stores consume 4.2 tons/month on average. This turnover of modern retailers is bigger than traditional retailers in HCM city with 3.5 tons/month. However, the rice sale potentiality in each modern retail store is not fully exploited currently, a modern retailer uses only 10.5 m2 for the rice sale because rice is not their main product, even many new supermarkets are not involved in the rice trade. Table 6.62 Characteristics of modern retailers
Characteristics Modern Retail
Years since start-up (years) 6.3
Distance in kilometers to the nearest wet market (km) 0.5
Mean number of workers (persons) 23.8
Mean area for rice stall in the supermarket (square meters) 10.6
Mean tons of rice purchased by Supermarkets (tons /month) 4.2
6.4.2.2. Conduct of rice retailers Table 6.63 shows that the purchase operation of the retailers is different between retailers in Can tho and in the HCM city. In Can tho, the distance between the mill and the consumption regions is very short and this leads retailers to buy rice directly from the mill, while in HCM city, this retailer will buy from wholesalers in the city.
349

Table 6.63 Purchasing activity of the traditional retailers (% of total purchased rice volume)
The source of rice purchasing HCMC Can tho city Overall
Urban wholesale (% of total purchased rice volume)
100 9 63
Broker of mill (% of total purchased rice volume)
0 3 1
Directly at mill (% of total purchased rice volume)
0 88 36
Table 6.64 shows that traditional retailers mainly use motorbikes for the transportation (83%) of small volumes, this is also the main means of transportation in Viet nam. In Can tho, the rate of traditional retailers purchasing at mills is big so they do transactions directly and not through the telephone. However, telephone transactions are the main method of trading in Ho Chi Minh city as the traditional retailers mainly purchase from wholesalers. These traditional retailers do not have to do transactions directly, they only order through the telephone and rice will be delivered to retailers. This also explains how negotiating for transport has a rate lower than 29.63%. The retailing households usually buy rice from a certain supplier and do not often change their supplier. 63% of retailers regularly buy rice from wholesalers and this is mostly the case for retailers in Ho Chi Minh city because retailers do not have much of a choice of suppliers when milling factories are located far from them. 37% of retailers buy rice from the mill, which occurs in the case of the Can tho, where the wholesalers hardly operate and the mill remains located nearby. Table 6.64 Purchasing of traditional retailers: transport and transaction means
Characteristics HCMC Can tho city Overall
Vehicles used
Bus 100 0 8
Motorcycle 0 90 83
Tricycles 0 5 4
Truck 0 5 4
The average time between purchase and selling (day) 23 14 18.8
% of retailers that use telephone for the purpose of transaction 72 70 71
% of retailers that use telephone to negotiate about rice transport
20 37 30
350

Table 6.65 shows that in HCM city, the main determinants of the provider selection are the quality rice source (100%) reasonable price (92%), always large quantity (92%). In Can tho, the main factors are better price (89%), higher quality (84%), large quantities (54%) and pay later (51%). Table 6.65 The purchasing frequency from suppliers and the reason of selection (%)
Frequency and Reason HCMC Can tho city Overall
% Of retailers who buy "always" from wholesaler 100 9 63
% Of retailers who buy "regularly" from Wholesaler 0 67 67
% Of retailers who buy "always" from Broker_of_mill 0 3 1.2
% Of retailers who buy "regularly" from Broker_of_mill 0 0 0
% Of retailers who buy "always" from mill 0 88 37
% Of retailers who buy "regularly" from mill 0 33 33
Number of suppliers with regular relationship with retailer 2.8 2.9 2.8
Years selling to supplier: 2011 minus the year started buying from this seller (year)
3.6 3.5 3.6
Retailer's reason for buying from this seller,% saying this reason the "Important"
Always has large quantities (%) 92 54 75
Offers better prices (%) 92 89 91
Offers higher quality (%) 100 84 93
Allows retailer pay later (%) 35 51 42
Offers loans in case of need (marriage, sickness) (%) 38 14 27
from habit provider (%) 29 8 20
Quick transactions and retailer loses little time (%) 45 16 32
Table 6.66 shows that most traditional retailers clearly know the volume they buy (95%), but only 73% of it is weighed in front of them. 95% of which is weighed on the mechanical scale and only 5% on electronic scale. Table 6.66 Rice purchasing information of traditional retailers (% of total surveyed retailers)
Information on Quantity HCMC Can tho
city Overall
Knowing information about the rice volume of suppliers (%) 20 28 24
Knowing information about input using of suppliers (%) 46 40 43
Knowing exactly the quantity of goods purchased (%) 92 100 95
Rice weighting in front of traditional retailers (%) 70 78 73
Using mechanical scale (%) 100 89 95
351

Table 6.67 shows that the traditional retailers mostly sell rice separately in plastic bags (99%) in both cities, modern retail mainly sells rice that has been packaged with good plastic bags (92%). Modern retailers that sell rice separately account for only 8%. The selling of rice separately makes the products of traditional retailers nearly devoid of any information about the origin, brand name and mill, while modern retailers pay particular attention to the product information and 97% of rice which is sold has a brand name and mill information, 2.8% of rice has the mill information only.
352
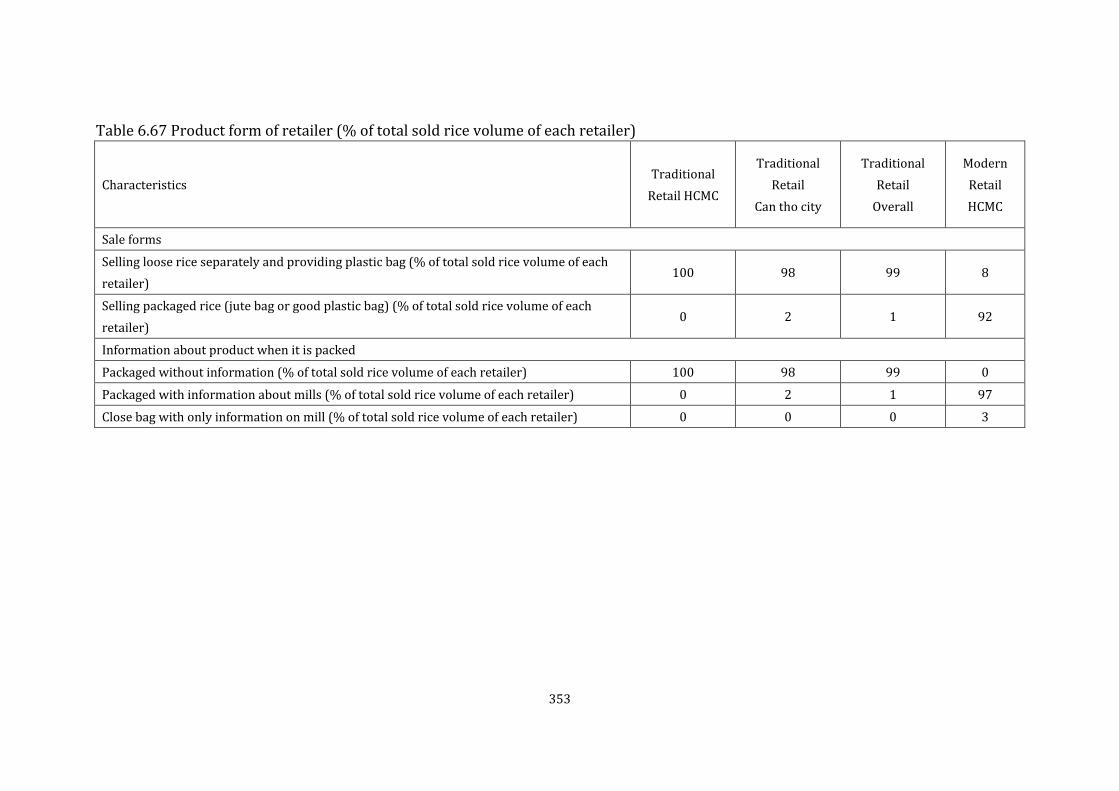
Table 6.67 Product form of retailer (% of total sold rice volume of each retailer)
Characteristics Traditional
Retail HCMC
Traditional Retail
Can tho city
Traditional Retail
Overall
Modern Retail HCMC
Sale forms
Selling loose rice separately and providing plastic bag (% of total sold rice volume of each retailer)
100 98 99 8
Selling packaged rice (jute bag or good plastic bag) (% of total sold rice volume of each retailer)
0 2 1 92
Information about product when it is packed
Packaged without information (% of total sold rice volume of each retailer) 100 98 99 0
Packaged with information about mills (% of total sold rice volume of each retailer) 0 2 1 97
Close bag with only information on mill (% of total sold rice volume of each retailer) 0 0 0 3
353

6.4.2.3. Traditional Retailer and finance value chain Table 6.68 shows that prepayment hardly occurs in the business of traditional retailers, while getting delayed payment to their suppliers (wholesalers, mills) accounts for a high percentage (81%) and this is considered a way to retain customers. Table 6.68 Payment and receiving payment of traditional
Payment and receiving payment of traditional retailers
HCMC city Can tho city Overall
1. Payment to supplier
% Of retailers who pay advance to suppliers (pay some money before getting the rice)
0 22 10
% retailers who pay with delay to suppliers (rice after receive pay for it)
88 72 81
If pay with delay, mean delayed days after the transaction (= subset of retailers paying with delay)
9.8 9.5 9.3
If payable later, % of delayed amount in total payment
60 49 55
% of amount pay immediately at transaction 40 51 45
2. Payment form from the clients
% Retailer allow customer pay after good delivery 0 54 24
% Of Customers allowed to pay with delay, of average retailer who Allows payment with delay
0 29 29
For retailers having paying clients with delay, mean delayed days after the transaction (N = subset of retailers clients pay with delay)
0 6.7 6.7
% Of retailers get paid in cash by clients (instead of check or transfer)
100 100 100
Table 6.69 shows that in comparing Can tho and HCM city, a paradox emerges in that the cost in Can tho is higher than in HCM city. Mostly the location of the shop is the most expensive. The tax in Can tho is also higher than in HCM city. So the total cost per ton of Can tho is higher than in HCM city.
354
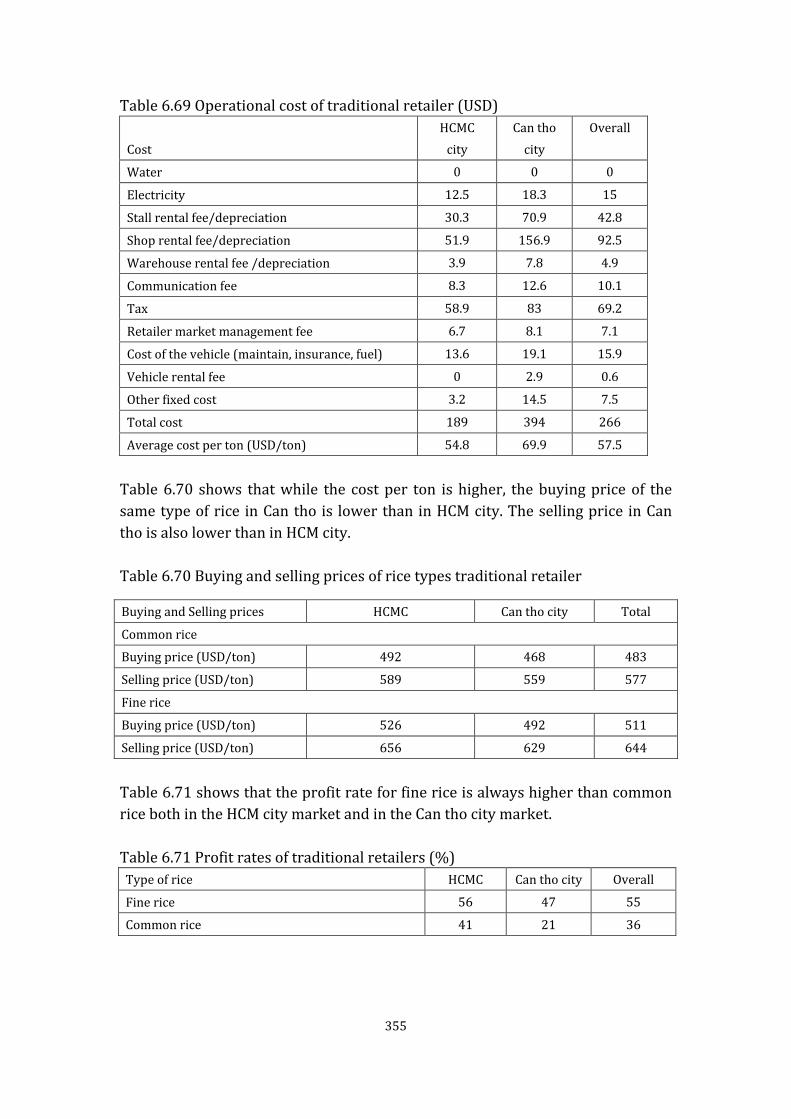
Table 6.69 Operational cost of traditional retailer (USD)
Cost HCMC
city Can tho
city Overall
Water 0 0 0
Electricity 12.5 18.3 15
Stall rental fee/depreciation 30.3 70.9 42.8
Shop rental fee/depreciation 51.9 156.9 92.5
Warehouse rental fee /depreciation 3.9 7.8 4.9
Communication fee 8.3 12.6 10.1
Tax 58.9 83 69.2
Retailer market management fee 6.7 8.1 7.1
Cost of the vehicle (maintain, insurance, fuel) 13.6 19.1 15.9
Vehicle rental fee 0 2.9 0.6
Other fixed cost 3.2 14.5 7.5
Total cost 189 394 266
Average cost per ton (USD/ton) 54.8 69.9 57.5
Table 6.70 shows that while the cost per ton is higher, the buying price of the same type of rice in Can tho is lower than in HCM city. The selling price in Can tho is also lower than in HCM city. Table 6.70 Buying and selling prices of rice types traditional retailer
Table 6.71 shows that the profit rate for fine rice is always higher than common rice both in the HCM city market and in the Can tho city market. Table 6.71 Profit rates of traditional retailers (%)
Type of rice HCMC Can tho city Overall
Fine rice 56 47 55
Common rice 41 21 36
Buying and Selling prices HCMC Can tho city Total
Common rice
Buying price (USD/ton) 492 468 483
Selling price (USD/ton) 589 559 577
Fine rice
Buying price (USD/ton) 526 492 511
Selling price (USD/ton) 656 629 644
355
6.5. Performance of Mekong rice value chain
6.5.1. Costs, Rewards, and Overall Margins in the Rice Value Chain
Table 6.72 shows the structure of Rewards, Costs, and Margins of the actors participating in the domestic rice value chain in Ho Chi Minh city. The common rice here includes early ordinary indica variety group like the famous variety IR 50404. This variety is also mixed in the exportation rice that they qualify as common rice. The retail price is the average from the survey in the traditional retail markets of HCM city at the moment of the survey in March 2012. Farmers participating in the fine rice chain, have a higher cost share, but a lower reward share. The rural traders have a higher cost and reward share for common rice than for fine rice. Millers have the lowest share of reward, but they can gain from the quantity of product. The urban wholesalers have a particularly high reward share for fine rice with 31%. Although their share is near to that of farmers, the volume that they trade is much bigger. The reward share of urban retailers for fine rice is higher than for common rice. The 2009-2010 World Bank study on the Mekong rice value chain shows a slightly different reward share picture for the domestic chain: farmers have 24%; rural traders 1.9%; mills 8.5; urban wholesalers 35% and urban retailers 30% (Loc at al, 2011).
356

Table 6.72 Share of rewards costs and total margins accruing to different players in the rice value chain in Mekong (%)
Common paddy/rice Fine paddy/rice
Average retail price of rice surveyed in retail market HCMC in March 2012 (USD/ton)
577 644
Share of rewards, costs and total margins accruing to: Rewards Costs Total
margins Rewards Costs
Total margins
Farmers’ (rice equivalent) rewards costs and total margin 53 52 52 37 54 46
Rural paddy trader’ (rice equivalent) rewards costs and total margin 12 12 12 8 11 10
Millers’ rewards costs and total margin 7 10 9 8 11 9
Urban rice wholesalers’ rewards costs and total margin 13 14 14 31 13 21
Urban traditional retailers’ rewards costs and total margin 14 12 13 16 11 13
Total rewards, costs and total margins in the value chain (figures in parentheses show the share in Ho Chi Minh retail price)
100 (33) 100 (67)
100 (100) 100 (45) 100 (55)
100 (100)
Note: Rewards are calculated as the difference between costs and margins. For farmers the total margin is the rice equivalent paddy price received on selling per kg. paddy, while costs are the sum of the rice equivalent monetary costs of cultivating per kg. paddy and the rice equivalent marketing costs for per kg. paddy. For millers, wholesalers (both rural and urban, paddy and rice) and retailers, margins are the difference between the sale price and the purchase price of rice/paddy. Note that for millers and rural paddy wholesalers, margins and costs reported are the rice equivalent margins and costs for handling per kg. paddy. To convert per kg. paddy prices, costs and margins to the rice equivalent prices costs and margins we divided the paddy costs, prices and margin by 0.65 (where 0.65 is assumed to be the paddy to rice conversion ratio).
357

6.5.2. Cost Items in the Rice Value Chain
Table 6.73 shows the cost items in the domestic rice value chain. The value chain cost in the above table was calculated using 10 items. The costs of each of the value chain actors were taken from the actor's cost from the previous section and categorized into 10 items. Differences along the whole value chain differ when the production cost of fine rice varieties is higher than that of common rice varieties due to differences in the yield per area unit. The cost of fine rice is higher than that of common rice by about 15% because farmers have to use more insecticide and fertilizer for the same yield level. Fragrant rice more strongly attracts insects but its resistance is lower than that of the common rice variety. The seed price of the new fine rice variety was also higher than that of common rice. Along the chain the producer cost is the most important share from 44-46%. The operating, and transport costs of mills account for a small proportion because the capacity of the mills is big, which reduces the average production cost of labor and energy. The mills pay less for transport because the trader will transport the paddy to the mills and the wholesalers will transport the rice to the consumption market. However, the main costs are associated with the stages involving traders, wholesalers and retailers, which account for an important proportion. Especially, operating costs, which account for 19% - 21% of the total cost of the whole chain.
358

Table 6.73 Share of various items in the total costs of the rice value chains in Viet Nam (%)
Cost Common
rice Fine Rice
Total cost in the rice value chain (USD/Ton) 241 260
Share of various items in the total cost of per ton rice (100%=total cost)
1. Producer's rental costs (on rented in land) 3 3
2. Producer's input costs (on all purchased inputs other than land and labour, which include purchased seeds, fertilizers, crop chemicals, purchased irrigation and purchased animal and machine traction) 44 46
3. Producer's wage costs (on hired labour) 6 7
4. Operational costs of mills (costs of electricity, diesel, water, telephone and fax usage, rentals for stalls and warehouse) 3 3
5. Wage costs of mills (costs of hired casual and well as permanent labours) 1 1
6. Operational costs (costs of electricity, telephone and fax usage and rentals for stalls and warehouses) of traders (wholesalers + retailers) 21 19
7. Wage costs (for both casual and permanent labours) of traders ( wholesalers + retailers) 5 5
8. Fees (includes both marketing and weighing fees for the entire value chain) 9 8
9. Transport costs of traders (includes costs of hired transport for transactions, rentals on trucks and also expenses on account of personal transport use d for transactions, for both wholesalers and retailers) 5 5
10. Other trading costs (it comprises of the costs on bagging, stitching, grading, loading and unloading, payments at check points/ road toll taxes incurred by trader during transactions) of traders ( wholesalers + retailers) 3 3
11. Total cost 100 100
Note: For producer all costs are calculated in “rice equivalent” terms. For this purpose, we divide the cost of per unit of paddy by 0.65, where 0.65 is assumed to be the paddy to rice conversion ratio.
359

Chapter 7 Case Study on Foreign Direct Investment in the Rice
Value Chain: Lao PDR
7.1. Background
The importance of private sector investment, both domestic and foreign direct investment (FDI) for rural development is well recognized, e.g. FAO (2012). FDI in particular is valued for its potential contribution as a source of funding; technology transfer; strategic business linkages; access to large, more lucrative markets; and overall increased productive capacities. However, FDI (and domestic investment) benefits do not flow automatically. What is often needed is a right balance of policies and strategic actions so that investments not only flow to agriculture but also that these investments contribute to priority development goals. Consequently, many Asian governments are increasingly stressing the transformation of rice value chains through domestic and foreign investments at strategic points along the value chain. In recent years, two substantive studies have been conducted on rice value chains in Asia that extensively address various private sector investment issues. Firstly, ‘Trusting Trade and the Private Sector for Food Security in Southeast Asia’ by Alavi, et al, and ‘The Quiet Revolution in Staple Food Value Chains: Enter the Dragon, the Elephant, and the Tiger’ by Reardon et al. Both find that a set of policies will be needed to ensure that private-sector-led rice value chain development will contribute to the achievement of national and regional development goals. In this regard, recent evidence on investment in rice value chains (for example see Wong and Wai, 2013) shows that the mill sector often plays a pivotal role, influencing and transforming many activities in both the upstream and downstream segments. Consequently, FDI/private investments in the mill sector need to receive more attention in studies and policy discussions on investments and the development and transformation of supply chains. This pivotal role of rice mills, including FDI therein, is evident in the major rice exporting countries, including Viet Nam, Cambodia and Myanmar in the CLMV grouping. It will be important to ascertain if this pivotal role and incidence of FDI in the rice mill sector is also true for Lao PDR. Lao PDR is a land-locked country and has a small population of six million and a high land-man ratio. Only 11% of its rice areas are irrigated (potential for two crops a year). Its production (and consumption) is mainly (>90%) glutinous rice and the world trade in glutinous rice averaged 460,000MT over the 2010-2012 period. Only small quantities of rice and paddy are exported and
360
this occurs only intermittently. In addition, only 5% of Lao PDR total rice production (or 110,000MT) is commercially marketed, with the State Enterprise for Food and Crop Promotion (SEFCP) controlling 70% of commercial trade and private trade controlling the remaining 30% (MAF 2006 and Setboonsang et al 2008). Furthermore, the rice milling industry is operating at low efficiency with low margins – net profit rate for large mills is only 9% (Eliste and Santos 2012). However, initial field work revealed that some FDI and local investments in mills have been present since the late 2000s, despite the above constraints. Consequently, besides ascertaining if this pivotal role and incidence of FDI in rice mill sector is also true for Lao PDR, the underlying reasons for these investments despite the above constraints deserves investigation. With this we turn to consider briefly the Lao PDR rice sector and rice value chain. Lao PDR is the only country in Southeast Asia which is land-locked, with 236,800 square kilometres of largely hilly and forested land that is sparsely populated by 6.5 million people. Land under cultivation amounted to only 1,233,250 ha, of which rice accounts for 80%. In terms of irrigated areas, it is the lowest both in terms of physical acreage as well as percentage (only 11% in 2011) of total rice areas amongst the ASEAN rice producing countries. According to the Lao Census of Agriculture conducted in 2012, out of a total rice area of 986,600 ha, the total area of rice planted in 2010/11 was 987,000 ha (714,000 ha of wet season lowland rice, 57,000 ha of dry season rice and 215,000 ha of upland rice) of which 774,963 ha was harvested. The total production was about 2,822,098 tons and average yield was 3.75 tons/ha. Some 77% of total production comes from the wet season lowland system. The most important rice growing provinces are Savannaket (220,000 ha) and Champasak (100,700 ha). In terms of consumption, Lao PDR has one of the highest per capita consumptions of rice in the world, with around 163 kg/person/year. Glutinous rice accounts for more than 90% of rice consumed (Schiller et al. 2006). It is incredible how Lao PDR has managed to develop from a rice importing country in the 1980s, often at the mercy of floods and drought, to one that increasingly enjoys rice surpluses (such as 375,000 MT in 2011) resulting in some formal and informal exports of rice and paddy. Most of Lao PDR’s rice production comes from the ‘7 Plains’ or major granaries. The major rice deficit provinces are in the mountainous areas in the north of the
361
country. On the other hand, the provinces of Savannaket, Khammouan and Vientiane (including the municipality) in the central region and Saravan and Champasak provinces in the southern region account for most (83%) of the rice surplus. Figure 7.1 provides the spatial distribution of the surplus and deficit provinces in 2010 and an indication of the directional flow of rice from surplus to deficit regions. In terms of FDI in land, Schoenweger et al. (2012) found that FDI in land for rice only involved 12 deals covering a total area of 2,273 ha (as compared to about 986,600 ha of rice land in Lao PDR) or an average of 190 ha per deal. In terms of indirect impact, there may be some displacement of shifting cultivation areas involving rice in the upland or hilly areas on account of land leased or concessions given for other crops, but these are insignificant both in terms of the impact on production as well as on the performance or development of the Lao PDR rice value chain. Figure 7.2 shows the location of rice concession areas for rice which are all in the southern provinces of Saravanh and Champasak, while Figure 7.3 shows the relative scale of these rice concessions compared to concessions for other agricultural activities and products.
362

Source: Compiled from NAFRI records
Source: Schoenweger et al, 2012
Figure 7.1: Rice Surplus and Deficit Provinces, 2010 Agriculture Project Location and Products
Figure 7.2: Land Concessions by Investment
363

Figure 7.3: Number and Total Acreage of Land Concessions by Categories and Regions
Source: Schoenweger et al, 2012
7.2. Investment in Rice Value Chain in Lao PDR2
A mapping of the Lao PDR rice supply chain in 2011, as depicted in Figure 7.4, indicates that at the input level, the government is still largely responsible for providing good/certified seeds, agri-support services and infrastructure like irrigation and drainage as well as farm roads. The private sector supplies increasing quantities of good/certified seeds, fertilizers and pesticides as well as machines and mechanization services. Some 724,000 farm families cultivate around 987,000 ha of rice land, as individuals, under a cooperative system or as contract farmers.
2This section draws from the work done by Bounthanom Bouahom and Linkham Douangsavanh on Lao PDR under the author’s supervision for the Developing Supply Chains and Trading Networks component of the on-going ADBI study on ‘Enhancing Agricultural Productivity in CLMV Countries towards Supporting ASEAN Equitable Economic Development’.
364
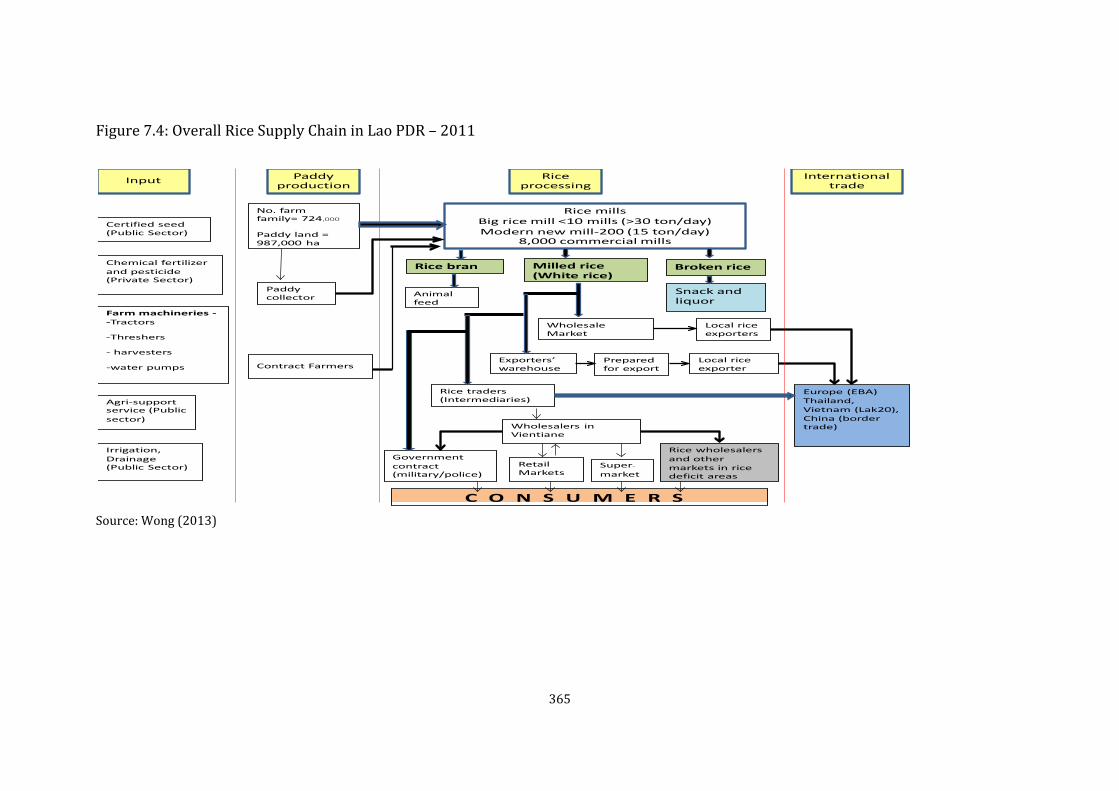
Figure 7.4: Overall Rice Supply Chain in Lao PDR – 2011
Source: Wong (2013)
Rice millsBig rice mill <10 mills (>30 ton/day)Modern new mill-200 (15 ton/day)
8,000 commercial mills
Input Paddy production
Rice processing
International trade
Certified seed(Public Sector)
Chemical fertilizer and pesticide(Private Sector)
Farm machineries --Tractors
-Threshers
- harvesters
-water pumps
Agri-support service (Public sector)
Irrigation, Drainage (Public Sector)
No. farm family= 724,000
Paddy land =987,000 ha
Paddy collector
Milled rice(White rice)
Rice bran Broken rice
Wholesale Market
Local rice exporters
Exporters’ warehouse
Prepared for export
Rice traders (Intermediaries)
Local rice exporter
Europe (EBA)Thailand, Vietnam (Lak20), China (border trade)
Animal feed
Wholesalers in Vientiane
Rice wholesalers and other markets in rice deficit areas
Retail Markets
Super-
market
C O N S U M E R S
Government contract(military/police)
Snack and liquor
Contract Farmers
365
Most of them mill and consume part of their output through custom mills which are small single-pass steel-hullers (<2 MT/day capacity). Their marketable surpluses are sold to collectors or directly to millers operating larger mills (>1 MT/hour capacity). Such larger mills are invariably involved in the collection and trading of rice. Paddy collectors or agents supply to yet larger mills at the district or provincial capital levels, some of which are involved in contract farming by providing seeds, fertilizers and even mechanization services of late. Some of them also distribute rice to deficit areas as well as have contracts to supply the military or police. They then sell their milled rice to wholesalers in 48 or 50 kg bags with increasing numbers of mills being involved in selling packed and branded rice of 12, 5 and 2 kg packs to supermarkets, minimarkets and modern retail outlets. Most of the mills sell off the bran as ingredients for animal feed (including for aquaculture) and their brokens for snacks and wine production as well as vermicelli. Some mills also have supply contracts with Lao Beer while others also produce rice wine and rice drinks. Foreign traders also buy rice direct from some mills to be exported to Thailand and Viet Nam, mostly through informal channels. Some of the mills also act as wholesalers and supply to supermarkets and minimarkets. A small number of mills, notably Lao World Co Ltd, is able to export pre-packed, branded and ready for shelf rice to Europe, via a Thailand ‘transit corridor’ arrangement, under the ‘Everything But Arms’ (EBA) agreement with the EU, whereby they are exempted from import duty. This exemption is equivalent to Euro 175/MT or USD 228/MT in 2013. Overall, it was found that in the case of Lao PDR, the mills and processing plants are also increasingly acting as a pivot linking and driving upstream and downstream development and transformation of the supply chain. They are engaged in upstream activities such as contract farming, the provision of good/certified seeds, fertilizers and mechanization services and in downstream activities such as providing branded packaged rice to modern retailers like supermarkets and minimarkets. Some are also involved in exports, both formal and informal of mainly glutinous rice, fragrant rice and organic rice and in some cases, paddy. There are also imports of mainly non-glutinous and aromatic rice for major cities as well as industrial use and snacks and also some hybrid rice from China to Northern Lao. There are three distinguishable rice sub-chains. Firstly, the most traditional rice value chain involved producers that milled the bulk of their output for their own consumption through custom milling with the excess sold to local small mills or collectors. This form is prevalent in both surplus and deficit provinces, especially those that are far away from district and provincial capitals as well as those in which the infrastructure is still poor. Here, the antiquated and small mills are used to supply the local community and surrounding areas. Secondly, we have
366
those which link rural to urban and/or surplus to deficit areas driven by both spatial and temporal arbitrage. This has evolved from a traditional rice value chain involving small and medium size mills and traders to include larger mills dealing with bigger volumes linking with or operating in distribution hubs and some also supplying rice under contract to the military, police and Beer Lao, who constitute important institutional buyers/consumers in Lao PDR. Some of them are involved in contract farming, providing seeds and fertilizers as well as mechanization services on credit. Some of the mills are incentivised by the government to be part of an emergency seed and rice reserve pilot scheme. Some of them have mechanical dryers, wet polishers and colour sorters and are hence capable of producing high quality rice which is packed and branded and sold to supermarkets and minimarkets. Lastly, there are those focused on supplying modern retailing (supermarkets) as well as exporting. However, the export volume is still small. Before moving on to discuss FDI in mills, we will discuss two examples of FDI in land, that undertaken by Lao Arrowny Corporation and Sithat Road Bridge Construction Co. as well as FDI in modern retailing, supermarkets. Lao Arrowny Corporation3 is a joint venture between Lao (5% share) and Japanese investors registered in December 2002 to produce organic Japanese rice in Vientiane province for export to Japan. MAF approved a concession to farm (own and contract) up to 18,500 ha countrywide. By 2004, the company operated 800 ha in Vientiane Municipality under contract with farmers selected under strict criteria. The rice was marketed as “bio-organic rice” (not certified organic rice) as farmers were allowed to use some fertilizers. The company was met with several obstacles endemic of nascent private sector actors in Lao PDR. The company’s working capital for procurement and processing was not able to keep pace with the rice supply from farmers in 2004. Lacking in-house processing capacity, the company was forced to contend with the high transport costs associated with processing and storing the paddy in Thailand, prior to its export to Japan. As a result, Lao Arrowny exported only 540 tons of rice in 2004 against a projected annual demand of up to 10,000 tons. In 2009, flooding in Laos made production difficult and farmers were unable to repay credit from Lao Arrowny. Political turmoil in Thailand then also changed border policies and exporting to the mill in Thailand became difficult and expensive. As a result, the Japanese partner ran into financial difficulties and was unable to continue financing the project, causing it to stall.
3 This account is based on Ministry of Agriculture and Forestry (2006) and personal communication with Ranjan Shrestha of SNV (Netherlands Development Organization)
367

Sithat Road Bridge Construction Co. 4 applied for a land concession for commercial rice cultivation in Mounlapamok District, Champasak Province in 2008. Out of the 206 ha surveyed by a government technical team, only 100ha was granted to the investor. Now, 100 ha is not viable for commercial rice cultivation. Not surprisingly, there was anecdotal evidence that despite this the investor went ahead and cleared more than 200 ha of land by 2010. However, to date only a small portion of cleared land has been planted with rice. To our knowledge, large scale commercial production of rice by the private sector, especially on new land (i.e. not in areas which have already been provided with irrigation facilities) have largely remained a ‘holy grail’ in Asian countries because of the high cost of investment in infrastructure, logistics and the risks associated with pest and disease outbreaks and the timeliness of the water supply (often, ‘too little too late or too much too soon’) which tends to render such investment highly risky and unlikely to be sustainable. Consequently, it is not surprising that the incidence of sustainable land investment for commercial rice production is rare throughout Asia. In terms of FDI in modern retailing especially supermarkets, besides the first supermarket, the Teng Feres Supermarket, established in 2004 by Peter Chan, there is also now D’Mart Supermarket which was set up by a Chinese investor who also operates the ‘Home Ideal’ house-hold furnishing and accessories chain. U-Express is a supermarket set up in 2012 by a French investor which sells U-Express house branded products from France together with local products. Deluxe Food Supermarket was recently started by a Lao-Canadian investor. Then, there is M-Point Mart owned by a Thai and set up along the 7-Eleven model (24 hour neighbourhood store) of varying sizes and has opened 11 outlets in Vientiane alone, so far. All of the above sell packed and branded rice including some from the selected mills discussed later.
7.3. FDI in the Mill Sector
In considering FDI in rice mills, it would be prudent to examine the current distribution of rice mills in Lao PDR. From Table 7.1, we find that there are 25,854 small rice mills of less than 2 MT/day capacity which cater exclusively to custom milling for home consumption mainly and 8,778 commercial mills of which 7,783 are with less than 5 MT/day capacity, 590 of between 5 to 10 MT/day, and 405 of more than 10 MT/day. As reflected earlier in Figure 7.4, there are about 200 ‘modern’ mills of 15 MT/day and 10 ‘big rice mills’ of 30 MT/day. These modern mills of >15MT/day formed the bulk of the selection of
4 This account is based on Schoenweger et al (2012) and personal communication with Hanna Saarinen, Coordinator of Land Issues Working Group, Lao PDR
368

mills discussed later. It is noted with interest that two of the more dynamic cases were helmed by women. Table 7.1: Distribution of Mills in Lao PDR -2012 No. Province Categories Number of
commercial rice mills
small rice mills (custom milling) I II II
1 Vientiane municipality 132 169 423 724 1,972
2 Phongsaly 43 43 242
3 Luangnamtha 7 20 111 138 88
4 Oudomxay 2 28 90 120 248
5 Bokeo 8 35 175 218 6,676
6 Luangphabang 30 62 90 182 4,805
7 Houaphan 2 21 88 111 4,065
8 Sayyabouly 41 32 220 293 1,726
9 Xiengkhoung 12 13 131 156 439
10 Vientiane province 30 32 148 210 2,846
11 Bolikhamxay 34 52 2,098 2,184 185
12 Khammouan 23 25 1,733 1,781 399
13 Savannaket 23 52 2,058 2,133 228
14 Saravanh 19 14 285 318 441
15 Sekong 14 - - 14 75
16 Champasak 20 11 88 119 1,070
17 Attapuae 8 24 2 34 349
Total 405 590 7,783 8,778 25,854
Source: Ministry of Industry and Commerce records NB. Category I - >10 MT/day, Category II - 5 to 10 MT/day, Category III – < 5 MT/day commercial mills; custom mills < 2 MT/day
Next we turn to consider selected FDI and domestic investments in the Mill Sector Lao World Co. Ltd. is a 100% subsidiary of Lao World Group owned by a leading overseas Laotian, Peter Chan 5 . The group investments in Lao PDR span
5Peter Chan has been referred to in news articles as a Sino-Thai, Sino- Laotian and/or Thai-Laotian tycoon. According to informed sources, he is of Sino-Thai decent and grew up in Southern Lao PDR who has built up a business conglomerate spanning Thailand, Hong Long, US and Europe besides a presence in all the key sectors in Lao PDR, including land concessions. Dwyer (2011) provides an interesting take on Chan’s influence and involvement in Lao PDR in his section on, ‘the curious case of Peter Chan’.
369
agriculture, engineering, ICT, construction, hotel and tourism as well as business interests in Thailand, Hong Kong, US and Europe, including a supermarket chain in France, Spain and Holland. It owns the Tangferes supermarket (the first supermarket to be opened in Lao PDR, in 2004) located in Lao-ITECC (which is also owned by the group). Consequently, it is currently the largest mill with the most integrated downstream segment (both in Lao and in Europe) of the mills studied. It established a 100 MT milled rice/day reprocessing plant in 2010 in Savannakhet and sources pre-milled Jasmine rice from strategically selected local mills for subsequent value-adding/reprocessing (whitening, polishing, colour sorting and length grading and packing) and exports most of the output6 under Champa, Rose and Golden Mekong brands, almost exclusively to Chan Brother’s chain of supermarkets in France, Spain and Holland, leveraging the substantial ‘Everything But Arms’ (EBA) import tax waiver. It exported more than 6,000 MT in 2012 via a ‘transit corridor’ arrangement in Thailand. Sengarthit Development Co. Ltd. established the largest modern mill in Champasak in 2009, averaging 30MT rice/day complete with dryer, husker, polisher and colour sorter, with 49% French and 51% Laotian ownership. The company was initially involved in corn plantation before switching to rice milling. It marketed around 5,000 MT of rice/annum in 2011 and 2012 with insignificant contract farming arrangements, depending more on buying agents. It focuses on the high-end Lao market and export market for its Homchampa brand of Jasmine and glutinous rice. It intends to go into organic rice. It is also targeting the export of glutinous rice to Viet Nam, China and Cambodia in the near future. The company also holds a concession a coffee plantation of 300 ha. Daum Agro Sole Ltd is a Korean company owned and operated by Kim Young Jin (and is a solely owned subsidiary of Daum F&B of Korea). It only has a 5 MT/day Korean made mill which started operation in 2012 by engaging in limited contract farming, buying mainly from agents. Unlike Lao World and Sengarthit its market is all local and involved some 1,200 MT of mainly glutinous rice (TDK8) and some non-glutinous (TDK 11) in 2012. It is currently negotiating with Beer Lao7 to supply non-glutinous RD 203. Interestingly, the owners were involved
6Some packed and branded quantities are sold exclusively in its own Tengferes Supermarket in Lao PDR. 7Beer Lao operates two breweries, one in Vientiane and the other in Pakse, Champasak. Its total annual rice requirement is 9,000MT and still sources some non-glutinous rice from Thailand. However, Lao prefers non-glutinous RD 203 rice and is willing to pay a premium price to contracted Lao mills to ensure consistency of taste. (Personal communication with Ranjan Shrestha of SNV)
370
in mechanized paddy planting (on rented land from farmers - 85 ha in 2009, 250 ha in 2010, and 450 ha in 2011) of Jasmine rice. However, after accumulating significant losses, they gave up rice farming and switched to rice milling which they consider to be less risky, yet reasonably profitable. Fu Teng in strategic alliance with Dao Phet Group: Fu Teng is a Chinese company set up in 2009 which designs and builds/installs complete rice mills as well as sells compact mills and a complete range of milling equipment (from dryers to polishers, length graders and colour sorters) and has been responsible for establishing more than 10 large and medium mills in Lao PDR. It operates the Viengmany mill for the Dao Phet Group and is rumoured in the milling community as having some form of cross-sharing or joint-venture agreement with the latter although nothing is reflected in official documents. Mdm Metkham Loriaya is the President of the Dao Phet (Star Diamond) Group which is the largest group encountered (but very low key), owning 5 mills and another one under construction, giving a combined capacity of 390 MT/day. They comprise Viengmany mill in Vientiane, started in 1995 and upgraded in 2009, with a capacity of 30-40 MT/day with a wet polisher and colour sorter; Thoua mill in Vientiane Province started in 2006 with a capacity of 10 MT/day; Ngern rice mill in Luang Prabang started in 2008 with a capacity of 15 -20 MT/day; Lung Phenmill in Vientiane Province started in 2012, with capacity of 15-20 MT/day; Bounma rice mill in Savannakhet started in 2013 with a capacity of 100 MT/day with a wet polisher and colour sorter; and Dao Phet Rice Mill, which is under construction, with a capacity of 150-200 MT/day, making it probably the largest mill in Lao PDR upon completion. The Group is linked to or sources paddy from 25,000 farmers over 13 provinces. They have started providing seeds, fertilizers, and agro-chemicals to some group farmers in 2012 and expect to step up contract farming in 2013. They produced and marketed 50,000 MT of glutinous, non-glutinous and Jasmine rice to all over Lao PDR and beyond in 12 and 48 kg bags with Dao Phet brand in 2012. It has an existing contract to supply 3,000 MT/annum to the police and is negotiating to supply to the military (which has a total requirement of 30,000 MT per annum). In 2012, the Group exported 500 MT of glutinous rice to Viet Nam and imported 500MT of non-glutinous rice from Viet Nam and is largely a domestic spatial and temporal arbitrage trader so far. It also exported 2,000 MT of paddy (both glutinous and non-glutinous) to Thailand in 2012. It is applying to export glutinous and jasmine rice to China. It is interesting to note that all of its investments in new mills and mill upgrading since 2008 were largely focused on the domestic market and it is only more recently that it is exploring overseas markets, especially China, for glutinous rice. It is the only mill/group that is importing non-glutinous rice from Viet Nam to be blended and sold into the local market, where the non-glutinous rice is priced higher than glutinous rice (the reverse holds in the relative pricing of
371
non-glutinous and glutinous rice, with the later always higher, in the global rice market). For the sake of completeness and to see if there are any differences in motivation and performance between FDI and local investments in the mill sector, we selected two local mills for comparison, namely Lao Agro 2000 Co. Ltd and Suthat Rice Mill. Lao Agro 2000 Co. Ltd was established in 2000 in Vientiane Municipality and is owned by Mrs Bouahom Vongsiprasoam8. The mill has two milling lines, each with a capacity of 10 MT/day. It is building a 25 MT/day Chinese line in 2013. It has huge storage facilities complete with a mechanical dryer and farm machinery workshop in a 6 ha site. It contract farms with more than 1,000 farm families over three provinces by providing seeds, fertilizer and mechanization services, mostly on credit to farmers besides purchasing paddy through agents. It also operates a 400 ha seed farm together with contract seed growers and produces 1,000 MT of seeds a year. It produced and marketed 5,000 MT of both glutinous and non-glutinous rice in 2012 with the bulk of its output (about 80%) being contracted to Beer Lao (200 MT/month), noodle manufacturers (150 MT/month) and institutional buyers. It also stockpiles rice (3,000 MT glutinous rice and 1,000 MT of non-glutinous rice) for the government under a pilot scheme. Under this stockpiling arrangement, the government subsidizes half of the normal interest rate of 14% for loans from Lao Development Bank. The remaining quantity (10 to 20 %) is branded as Lao Agro 2000 and sold in its own shop, minimarkets and supermarkets. Now it is mainly marketing ‘organic quality’ rice (with low agri-chemical usage but without formal organic certification) but has plans to expand into ‘organic rice’ as well as the export of glutinous rice. Here we have a case of a well-connected local investor which has developed linkages to both the upstream segment of the rice value like the production and supply of good/certified seeds, fertilizers and mechanization services and the downstream segment by supplying to institutional buyers, especially Beer Lao as well as branded rice into local modern retail outlets and own shop. It also participated in a stockpiling arrangement with the Government, in return for subsidised credit. Suthat Rice Mill is wholly owned by Southat Keodouangsy who was a former participant in the Enhancing Milled Rice Production in Lao PDR (EMRIP) project funded by the EU and executed by Helvelas and SNV in 2010-2011. There are 3 lines in the mill: an old 2 MT/day line; a 4 MT/day mill; and a new Korean and Chinese equipped line of 10 MT/day operational in 2012. Suthat produces both
8 Her husband is a retired top official in the Ministry of Agriculture. 372

glutinous and non-glutinous rice via contract farming with 750 farmers divided into 15 farmer groups, each comprising 50 farmers and led by a farm leader. It also sources paddy using agents. It supplies seeds (sourced from strategically allied seed growers) and fertilizers to contract farmers as well as provides technical advice to farmer groups by paying allowance to extension worker/researchers for training sessions. His shop in front of the mill sells fertilizers and animal feed as well as veterinary medicine, in addition to branded packed rice in 1kg, 12 kg and 48 kg packages. He produced and marketed more than 3,000 MT of glutinous and non-glutinous rice in 2012. He has a contract of 100 MT per month with both Beer Lao and a noodle manufacturer. Suthat used to supply the government before but no longer does so. Suthat has often been showcased as a success story of EMRIP9. Here again the focus is on supplying the domestic market and has linked the mill to the upstream and downstream segments of the rice supply chain. Table 7.2 shows the key features10 of each of the mills studied as well as a comparison of their respective upstream and downstream linkages. Now, taken together we find that each of them is innovatively seeking out their own niche areas by leveraging on their inherent or strategic strengths. With the exception of Lao World, the rest of them are linking up with the upstream segment to varying degrees via seed growers and contract farmers through the EMRIP modality and some are directly involved in seed production, the provision of fertilizers, mechanization services and technical advice via contract farming. In the course of the study, it was found that ‘contract farming’ in Lao PDR is used to refer to a whole spectrum of arrangements – from dedicated or strategically aligned suppliers to the provision of good seeds (under EMRIP) with or without credit, through to the elaborate provision of range of inputs including mechanization services on credit with buy-back arrangements. As mentioned later, more research is needed in this area as many seem to look to contract
9The Enhancing Milled Rice Production in Lao PDR (EMRIP) project was funded by the EU and implemented by Helvetas and SNV over the 2009 -2011 period. It involved 21 mills in 4 provinces where each mill is linked to 500 to 1,000 farmers. Special features include the linking of good seed producers to these ‘contract farmers’, farmer training and the supply of rice to Beer Lao. Now in its second phase, it is supported by Robobank in 2 provinces and by LEAP in another 2 provinces. A key feature is the building of trust and cooperation between different segments of the rice value chain, especially in coping with common constraints. 10This is done to highlight germane features as well as peculiar ones which make them hard to replicate (e.g. Lao World – exporting branded Jasmine rice almost exclusively to Europe because of the ownership of supermarket chains and distribution network in France, Spain and Holland).
373
farming as a panacea. The arrangements for the provision of good/certified seeds in relation to the development of a nascent rice seed industry is also worthy of further research. On the downstream side, we witness the intentional telescoping of the functions of milling, wholesaling (and even retailing as some of them – Lao World, Lao Agro 2000 and Suthat have their own shop(s) or outlet(s) and all of them are selling branded packed rice to wholesalers as well as into modern retail outlets and supermarkets).
374

Table 7.2: Comparison of Upstream and Downstream Linkages of Selected Rice Mills Company Up Stream Mill Down Stream Remarks
Contract Farming
Agents/ Others
Capacity 2012 Business Volume (MT)
Traditional W/Sale, Retail
S’mart Inst’nal Exports
Lao World allied mills 100MT/day 6,000 Own Almost all Difficult to replicate
Sengarthit Limited mostly agents 30MT/day 5,000 Almost all some
Daum Limited mainly agents 5MT/day 1,200 Almost all
Fu Teng & Dao Phet Group
12,500 contract farmers - seeds,
fertilizers, agro-chemicals
some agents Total of
390MT/day
50,000 Almost all 3,000MT/yr to Police
glut rice Viet Nam; paddy to Thailand
Also imported 500MT Viet Nam
non-glutinous rice
Lao Agro. 2000 Co., Ltd
4,000 contract farmers
some 20MT/day additional 25MT/day
5,000 some Beer Lao 2,400MT/yr,
noodle 1,800/yr
400ha seed farm, stockpiles for
Govt, own shop
Suthat 750 farmers some 6MT/day additional 10MT/day
3,000 some Beer Lao 1,200MT/yr
Noodle 1,200MT/yr
EMRIP, own shop
Source: Compiled by Author
375

7.4. Salient Issues Distilled
Despite the apparent prevailing constraints confronting rice mills in Lao PDR presented in section 7.1, this study suggests that all the selected FDI (and domestic investment) mills examined are, to varying extents, also acting as a pivot in linking with the upstream and downstream segments. Although Lao exports much lower quantities of rice when compared with the other CLMV members, it was observed that the FDI mills, especially Lao World and to a certain extent Sengarthit Development are also geared to the export markets with the others increasingly exploring export markets (except for the small Daum Agro Sole Ltd mill led by the Korean investor), especially to China. In order to be able to generalize this important pivotal role of FDI (and domestic investments) in mills in rice value chain transformation, there is a need to examine whether this holds for rice importing countries like Malaysia, Indonesia and the Philippines as well. As for why there is this observed level of FDI and local investments in the mill sector despite the ‘apparent’ constraints, the study found that there are five plausible reasons or developments which, through their interplay, provided the impetus for such investments. Firstly, there has been a significant rolling back of SEFCP operations to its present minor role in some provinces11. This was accompanied by a freeing up of inter-province trade by the private sector compared to the situation reported by MAF (2006) and Setboonsang (2008). It is the vacuum left by the rolling back of operations of SEFCP that constituted an underlying factor for the spate of investments in rice mills around 2008, especially for those involved in domestic spatial and temporal arbitrage, such as Dao Phet Group, Lao Agro 2000 and Suthat Rice Mill. Secondly, there have been significant increases in harvested area and yields and hence total production since the mid 2000s as a result of the increasing commercialization of rice production (leading to higher marketed surplus), the adoption of new varieties, and increasing use of good/certified seeds. This provided the extra quantity of better raw materials for the mills. Thirdly, as indicated in Figure 7.5, the retail prices have increased significantly since the mid 2000s in real terms. In nominal terms such increases would be more marked. This provided the price incentive to produce and mill more rice to meet increasing demand and changing consumer preferences.
11This was confirmed by personal communication with Dr. Phou Sengxay of MOIC. 376

Figure 7.5: Retail prices of glutinous rice and ordinary white rice, 1990-2011
Source: Eliste and Santos (2012)
Fourthly, and perhaps most importantly, and contrary to Eliste and Santos (2012) stressing the low average margins even for large mills mentioned earlier, the profit margins at selected commercial mills examined by EMC (2011) were about 23% for modern mills (as presented in Figure 7.6 below, together with margins in other segments of the rice value chain). Moreover, the continuing investments in new mills and expansion of processing lines and facilities, even with commercial loans at 14%, by most of the selected rice mills studied would seem to suggest that the margins for such mills are much higher than the ‘unattractive’ average margins reported by Eliste and Santos (2012) as they are probably operating at the profit ‘frontier’ or with ‘niche’ advantages. Furthermore, by linking to and being directly involved in both the upstream and downstream segments, the total returns to the increasingly supply chains anchored around these mills would be much higher than that at the mills alone. Figure 7.6: Profit margins at Farmer, Mill and Retail levels of Rice Value Chain 2011
Source: Emerging Markets Consulting (EMC), 2012
377

Fifthly, there are also various government programmes and initiatives (like seed promotion programs, pilot stockpiling of seeds and rice, institutional purchases for the military and the police) as well as international organization programmes like the EMRIP initiative which have also contributed. Overall, we believe that it is the dynamics and the interplay of the above factors coupled with the innovativeness and entrepreneurial skill of the owners of the selected mills (especially those interviewed) which accounted for this spate of investments. How representative are these selected mills and whether this trend will continue and what the potential pitfalls are provide areas for further research. Next, we contrast the above with FDI experience in other CLMV countries. In Viet Nam, Golden Resources (Hong Kong) and a Kitoku (Japan) JV with Angimex in An Giang province established re-processing plants in the early 2000s largely geared towards export to their respective countries and further afield. More recently, Vinafood (a government linked company) had a JV with an Iraqi company in 2007 for a large rice mill in Cantho. In 2012, Vinafood in a JV with a Singapore party also established a massive rice mill costing USD16 million in Dong Thap. All these mills are also geared towards the export market. Like Viet Nam, all the FDI in rice mills in Cambodia are also largely geared towards export markets. Notable ones include QQ Rice, A JV with a Malaysian company; Gouhong a Guangxi Provincial Government investment and Cambodia China Agri Development (CCAD) a JV with Sinograin & Yunnan Pan Asia Ag Cooperation & Development Co; Long Grain Co. a JV with UK and Indian investors; Batambang Rice Investment Co.(BRIC), a JV with a Singapore investor; and Crystal Rice Kampuchae, a JV with one of the largest Thai rice exporters, Asia Golden Rice in Kampot involving the largest mill complete with port facilities for mid-stream loading at Kampot. There has also been significant domestic investments in rice mill sector driven by the Government as well as an IFC project to expand Cambodia’s exports, currently mainly to Europe, by leveraging EBA arrangements as well as to other Asian markets. In the case of Myanmar, there was a spate of local investments in rice mills by Rice Specialization Companies under the encouragement of the government since 2008 in order to re-establish itself as a major rice exporting country. More recently, with progressive liberalization since 2011 and a new Foreign Investment Law, Myanmar Agribusiness Public Company (MAPCO) has entered into a JV with Mitsui (Japan) for 4 mega Integrated Rice Complexes which will produce high value rice products (rice bran oil) and energy (using gasifier)
378
besides high quality rice and par-boiled rice largely geared towards the export market. There have also been initial soft probes from Thai investors more recently, including CP and Asia Golden Rice. In contrast, we find that only Lao World and to a certain extent Sengarthit Development Co are currently geared towards the export market. The others are largely involved in domestic spatial and temporal arbitrage and linking with and developing economic activities in upstream and downstream segments of rice value chains and only considering the export market more recently. We also note that FDI and domestic investments in the rice mill sector in Lao PDR appear to have minimal direct government support or are less policy driven as in the case of Cambodia and Myanmar. Consequently, these and future investments can possibly drive the further transformation and development of the Lao PDR rice value chain if given the necessary coordinated government support. Lastly, a cautionary note on contract farming is deemed necessary. Despite its loose definition in Lao PDR and the wide range of arrangements encountered under this rubric, one should be careful that this is not seen as a panacea, as seems to be the case in many developing countries, including the other CLMV ones. There have been instances where rice specialization companies in Myanmar, some contract farming up to 15,000 ha, have faced financial difficulties when contract farmers defaulted, or were unable to repay loans due to extreme climate events of droughts and floods and/or pest and disease outbreaks. In fact, this has already been encountered in Lao PDR by Lao Arrowny Corporation as presented earlier. Consequently, a more focused study of the various forms of contract farming that has evolved in Lao PDR and under what circumstances each will work as well as potential pitfalls from the experience of other countries would be vital.
379

Chapter 8 Quiet Revolution in Rice Value Chains in Asia:
Synthesis with Earlier Surveys
8.1. Introduction
The theme of transformation of Asian agrifood systems has surged into the literature each several decades – following the path of change in agriculture and the food economy. In the mid-1950s, fear of failure of the agrifood system gripped Asia. By the mid-1970s, fortune had supplanted failure: the Green Revolution held the Asian policy and research audience spellbound – with its emphasis on rapid increases in rice and wheat productivity driven by “capital-led intensification” (Lele and Stone, 1989; Lipton with Longhurst, 1989) using new seeds, chemical fertilizers and pesticides, and irrigation. By the mid-1990s, a realization emerged that farm technology change was increasingly part of a confluence of changes in the agricultural household economy – with commercialization plus agricultural diversification accompanying intensification, with a shift from subsistence farms using non-traded inputs and producing little surplus, to semi-commercialized farms, buying some traded inputs, and diversifying product composition into non-grains (e.g., Rosegrant and Pingali, 1995), and into rural nonfarm employment as an adjunct to farming (e.g., Hazell and Ramasamy, 1991; Estudillo and Otsuka, 1998). Over the past two decades, public debate and the literature have recognized that the transformation has spread beyond the farm into the off-farm components of the rice value chain (VC): (1) upstream into farm input segments (such as in the rise of the “fee for service outsourcing” farm mechanization services, see Yang et al. 2013), and in markets for irrigation water, land rental, seeds, and farm chemicals; (2) midstream in the supply chains to Asia’s cities in a “Quiet Revolution in food value chains” manifested in the rapid rise of small and, increasingly, medium-scale domestic enterprises in wholesale, logistics, cold storage, and processing, and the demise of the traditional village-dominated brokerage system (with village traders and tied output-credit markets) (cf. the book on the Quiet Revolution, Reardon et al. 2012b); and (3) downstream in the “supermarket revolution” in Asia (Reardon et al. 2012a). The finding of a Quiet Revolution in rice VCs is especially given the importance to Asian food security of the midstream and downstream components of the rice VC: the studies presented in this paper together find that fully 43% of the total
380

value added of the rice VC (reflected in final retail price to the Asian consumer) derives from the midstream and downstream segments – the wholesalers, mills, retailers – and 57% from the farm segment. The performance of the midstream and downstream enterprises is nearly as important to Asian food security as farm yields – yet the food security debate is still overwhelmingly only focused on the farm. The “Quiet Revolution” findings presented in the op. cit. book focused on three dynamic, commercial zones that are the mainstays of rice supply to the three capital cities of Bangladesh, China, and India – to wit: (1) Noagoan district to Dhaka; (2) West Uttar Pradesh (UP) to Delhi; (3) Heilongjiang province to Beijing. To compare with the above three studies, hard on their heels were done four other (as yet unpublished) studies with the same methods so as to be comparable. One was another “major commercial zone” study, in the Mekong River Delta (MDR) of Viet Nam (in An giang and Hau giang provinces near Can tho city), the major zone supply Ho Chi Minh City. To the above four “more-developed zone” studies were added three in less-developed rice zones, relative hinterland areas, for comparison, to see whether rice value chain transformation had diffused further than the commercial zones near the mega cities. The three zones studied were: (1) the Shangrao district of Jiangxi in southern China to cities of Zhejiang province; (2) the Allahabad district of eastern UP to the city of Jabalpur in Madhya Pradesh; (3) the Red River Delta (RRD) zone in northern Viet Nam, to Hanoi. Table 8.1: Study zone Surveys
More advanced rice zone Less advanced rice zone Total
China Bangladesh India Viet Nam
Heilongjiang Noagaon West UP
Mekong River Delta (MDR)
Jiangxi --
East UP Red River Delta (RRD)
Surveys fielded: Farmers Rural traders Mills Urban traders Urban traditional retailer Supermarkets Village heads Total
925 110 162 150 275 170 47
1839
1040 177 135 153 970 182 55
2712
1965 287 297 303
1245 352 102
4551
381

The findings derived from unique “stacked surveys” with representative sample surveys in every segment of the rice VC (not the usual key informant rapid reconnaissance studies usually done of supply chains), from farmers to wholesalers to mills to retailers. These 7 studies of rice VCs together represent the largest recent body of empirical evidence on rice value chains in Asia, all using the same methodology over the studies, and thus serving as a unique base of comparable information. The Table shows a combined sample of 4551 rice VC actors interviewed, using approximately the same formal questionnaire per segment across the zones. A caveat is that these are specific areas, albeit chosen carefully to be representative of their type, but are not nationally representative samples. But there has never been done in Asia, or anywhere else, a nationally representative sample survey of the whole value chain of rice. Even countrywide surveys of rice farmers are rare, and then often not at a level of input and output market detail needed to examine more than a small subset of the broad set of transformation behaviors which we examine. Even far less can one find any surveys, even in the past several decades let alone recently – in specific zones let alone at country level – of the other segments of the VC, including mills, wholesalers, and retailers. In this paper we synthesize the findings of the seven field studies. We focus on the key patterns and trends that relate to evidence of the transformation of both agriculture and the other parts of the agrifood system, upstream and midstream and downstream. The article is organized as follows. Sections 2, 3, and 4 show transformations in three sets of behaviors in the rice VC – technology, marketing, and VC finance. Section 5 shows transformation of the structure of the VC that can be thought to arise from these behaviors and other conditions. Section 6 focuses on the changing role of the government in the rice VC. Section 7 concludes.
8.2. Transformation of the technology of the segments of the rice VC
8.2.1. Farm segment technology transformation
The incipient capital-led intensification of paddy farms noted by Pingali and Rosegrant (1995) has gone very far indeed. The basic paddy intensification technology using improved seeds, chemicals, and irrigation has become nearly ubiquitous (sometimes with the exception of pockets of marginal farmers). Even mechanization has spread over all the farm strata, not just the larger farmers. The salient findings of the surveys are as follows.
382
First, chemical fertilizer use is widespread and differs little over farm size strata or even advanced versus less advanced zones. As a share of the samples using it, we found 100% in Bangladesh, 96% in Heilongjiang/China, 98% in Jiangxi/China, 100% in West UP/India, 95% in Eastern UP/India, and 100% in MRD and RRD, Viet Nam. Striking are the enormous quantities of fertilizer being used – by both small and larger farmers. Keep in mind that around 200 kg/ha of urea plus DAP is more or less the recommended level; but we found the following from the surveys: 340 kg/ha in Bangladesh, 720 kg/ha in Heilongjiang/China, 795 kg/ha in Jiangxi/China, 488 kg/ha in West UP/India, 424 kg/ha in Eastern UP/India, 500 kg/ha in MRD and 505 in RRD in Viet Nam. Farmers are extremely overusing fertilizer; this may be due to perceptions of fraud in quality, or the cheapness of fertilizer given the widespread subsidization, or the lack of extension advice (see below). Second, pesticide/fungicide use is also very widespread – and also does not vary much over farm size strata (except in India where the marginal farmers use less) and zones. We found for the share of farms using these chemicals: 98% in Bangladesh, 96% in Heilongjiang/China, 93% in Jiangxi/China, 89% in West UP/India (but only 69% of the marginal farmers, so that marginal farmers in the dynamic zone are like the average farmer in the hinterland zone), 67% in Eastern UP/India; 100% in MRD and RRD in Viet Nam. With such intensity of production and the easy access to pesticides through private small shops peppered through the rural areas of the study zones, the high use rates are explicable. However, there was far more variation in use of herbicide – a substitute for labor. One can contrast 98-99% using herbicides in both Heilongjiang and Jiangxi/China, but only 9-11% in both Central and Eastern UP/India. We read that difference as due to the greater pressure on wages from rural nonfarm and migration employment in China compared with UP in India. Third, there was variation in the commercialization of the seed sector, correlated with the share of hybrids (and thus the need to buy each year); like 22% buying seed in Eastern UP/India and similar in MRD/Viet Nam, both zones of low hybrid diffusion, versus 81-93% buying seed in Jiangxi/China and 49% in RRD/Viet Nam, both zones of high hybrid diffusion. Fourth, the surveys showed rapid and generalized diffusion of small-farm mechanization. One can contrast the very concentrated ownership of farm machines (correlated with farm size) with the widespread use of farm machines,
383

and see the large importance of the farm machines rental market. For tractors, we present ownership and then in parentheses the share of farmers using tractors: 1% own (93% use) in Bangladesh, 56% own (100% use) in Heilongjiang/China, 27% own (57% use) in Jiangxi/China, 50% own (86% use) in West UP/India, 10% own (86% use) in Eastern UP/India; and 0% own (and 100% use) in MRD/Viet Nam. The pattern is more extreme for harvesters – in all the regions, from none to only about 3% of farmers own harvesters, but rising numbers of farmers are using them, especially in China (for example, in Jiangxi, the share of farmers hiring harvesting services rose from 63% to 82% over the five years recalled); and in the MRD in Viet Nam, where farmers reported having shifted from hand harvesting to hiring machine services over the past five years. Fifth, as machines substitute for labor, the uptake of machine services appears to be correlated with the rise of rural wage rate, which in turn are correlated with rising rural nonfarm employment and migration, tightening rural labor markets (for India, see Lanjouw and Murgai, 2009). Moreover, nonfarm income is a source of funds to buy machines, hire machine services, and rent land. Our surveys showed the importance and rise of rural nonfarm employment in the study zones (in all the countries) and migration employment especially in China.
8.2.2. Mill segment technology transformation
Mills – especially the medium and large mills – have made substantial investments in expanding and upgrading milling equipment. Our surveys in eastern UP, in Jiangxi, and in MRD show that the larger mills have higher capital/labor ratios than the small mills, as well as higher capacity utilization rates of the equipment. These confer cost advantages. Moreover, the larger mills (such as in MRD and Bangladesh) have more extensive equipment lines (compared with the small mills) which means they can polish and double polish, thus also increasing the grade and capturing the value added from quality differentiation (as discussed for Bangladesh in Minten et al. 2013). The equipment needed for upgrades of equipment, such as foreign matter sorters and polishers, implying expensive investment that only large mills can make: this is illustrated in the Viet Nam study where only 24% of the mills can combine own resources and credit to afford the polish machine suite. It is interesting that even in situations like in UP where the government provides mechanization subsidies to small mills, this has not been sufficient to compete with the large mill companies who do not get the subsidies but have “deeper pockets.” By contrast, in China, especially in the Jiangxi/Zhejiang case, we found
384
the government supplying subsidies to large mills, especially those categorized as Dragon Head enterprises, in particular via subsidized loans.
8.3. Transformation of the marketing conduct of the rice VC
8.3.1. Farm Segment marketing transformation
First, the incipient commercialization of paddy farms noted by Pingali and Rosegrant (1995) has gone very far – both in the more-advanced and less-advanced study zones. The share of marketed output in total output was very high, although usually correlated with farm size: averaging 68% of output of paddy sold (but only 57% for marginal farmers) in Bangladesh, 95% (similar over all strata) in Heilongjiang/China, 88% for the sample (but only 73% for marginal farmers) in Jiangxi/China, 92% on average (but only 77% for the marginal) in West UP/India, 92% on average and interestingly similar over all strata in Eastern UP/India; and around 97% in MRD/Viet Nam but only 37% in RRD/Viet Nam. Second, there has been significant “dis-intermediation,” with an “intermediational shortening” of the VC. This is manifested in the reduction of the (traditionally dominant) role of the village trader, and the rise of direct sales from the farmer to the mill. These changes are shown in the studies to be: (1) usually correlated with the degree of development of the zone, implying lower transaction costs for access to mills and wholesale markets; (2) correlated with the farm-size stratum: the smaller farms tend to still sell to the village trader; the larger farm tends to access mills directly and sell to government (with its beneficial floor prices) where this is applicable, and to traders from district or urban wholesale markets who tend to pay better prices than the village traders. Hence, there is a continuum:
a) the most dis-intermediated is Noagoan/Bangladesh (only 7% of paddy
volume is sold to village traders; 30% directly to mills, none to the government, and the rest to wholesale markets); Heilongjiang/China (29% is sold to village traders, 0 to government, and fully 63% direct to mills).
b) Intermediate case: Eastern UP/India (18% to village traders, 13% to government, only 15% to mills, and the rest to wholesale markets); West UP/India (18% to village traders, 14% to government, only 5% to mills, and the rest to wholesale markets); RRD/Viet Nam (only 40% to local traders, 12% to small mills, and 36% to retailers directly). For the UP cases, the APMC regulation (to use licensed traders for commerce in food) in UP may have induced these results, and be impeding modernization/dis-intermediation.
385
c) Least dis-intermediated case: Jiangxi/China (fully 82% is sold to village traders,
9% to government, 2% to mills, and the rest to traders from outside of the villages)"); MRD/Viet Nam (fully 97% of paddy is sold to local brokers, and none to the government or to mills). These extreme cases are somewhat anomalous. The MRD case can be explained by noting that farms are reached by interlaced waterways, and thus by boat; traders make heavy investments in adequate boats to go from farm to farm and collect substantial loads. The Jiangxi case can be explained by noting that small local mills have largely disappeared; farmers sell to larger mills at the district level and also to mills in Zhejiang, all of this facilitated by traders with adequate transport.
8.3.2. Mill segment marketing transformation
First, the paddy procurement by mills has transformed, with significant “dis-intermediation” (cutting out paddy middlemen from farm to mill), but this differs a lot over areas. This “direct purchase from farmers” is reflected in the farmer surveys and corroborated (for reasons we noted in the farmer section) in the mill surveys, mills in Noagoan/Bangladesh and Heilongjiang/China in most advanced way (a third to two-thirds of paddy sourced), and the Indian cases in an intermediate way (a quarter to two-fifth), and the Viet Nam and Jiangxi/China cases in the least way (a tenth or less). In the Indian case, it appears that the APMC regulation in UP has stifled change and biased mills to continue to source from the traders and source from state-organized cooperatives of farmers (PACs), but they still source a quarter direct from farmers not organized by the state. Note that India was the only country in our studies where there was any significant role for paddy cooperatives; in China, Bangladesh, and Viet Nam the cooperative’s role was near zero. Moreover, despite our hearing from “key informants” at government level or private sector organizations that rice mills have moved toward contract-farming, our farm surveys showed nearly zero contracting by mills of farmers; the only exception was a little among large mills in Heilongjiang. Second, mills’ rice marketing practices are undergoing several important transformations. a) In the study of the rice VC of Heilongjiang to Beijing, we surveyed
supermarket chains in Beijing on their rice sourcing, and found that the large chains (domestic or foreign) have gradually shifted to sourcing direct from
386

large milling companies such as the Chinese state owned enterprise “COFCO” and the Singapore firm “Wilmar” mills in China, as well as a number of other large mills, as well as several specialized rice wholesale companies. This vertical coordination of “large retailer with large mill” is a significant transformation.
b) There is also emerging vertical coordination between large mills and large wholesalers in wholesale markets (and outside of wholesale markets). This manifests itself in several ways. On the one hand, we found in most of the studies that urban wholesale market traders source by far the most from medium and large mills, and very little from small mills. On the other hand, large mills erected a system (especially so far in China, especially shown in the Beijing study) of use of large traders as exclusive or near exclusive agents. A weaker form of this is the more general finding (for example in Zhejiang cities) of large wholesaler working with only a handful of large mills in regular, but informal, relations.
c) Aiding the above vertical coordination relations is the emergence of
packaging and branding rice especially by medium and large mills, and especially in China; we found this much less so far in the other countries. This presumably increases the competitiveness of the large mills which can defend a brand.
d) Even where there has not been an emergence of mill brands, mills have been
shifting (at least partially so far) from marketing loose rice to packed rice (which we found in Bangladesh, India, and Viet Nam). On these packs is mill and sometimes trader information, but no brand. This may be an intermediate step before mill brands or retail brands or both. By contrast, in India and Bangladesh, there has been a shift from loose to bagged and packaged, but with only mill information and not yet branding.
e) Mills’ rice marketing transformation is almost nowhere driven by export
markets: rather it is driven by urban food markets. None of the mills in our 7 case study areas sold anything to export markets, with one exception: in MRD/Viet Nam, mills sold some to export markets. The conventional wisdom there is that export markets are the overwhelming “story” with respect to mills in Viet Nam; but our survey data showed that of the total of white rice and polished rice (that is, all “final demand” rice) sold by the mills, only 21% went to the export market; 52% went to urban wholesaler, 5% to the government, and 23% to rural retailers.
387

8.3.3. Trader segment marketing transformation
First, the 7 rural trader surveys showed that paddy traders procure the great majority of their paddy from local farmers, rather than further afield; the sourcing geography remains “traditional.” However, the sales destinations of the paddy show transformations afoot. On the one hand, the surveys show clearly the demise of the small mills, both as buyers of paddy, and custom millers of paddy. In Noagoan/Bangladesh, rural paddy traders sell two-thirds to the medium & large mills, little to the small mills; in Jiangxi/China, this share is 69%-85% (with the range being common versus fine paddy), and none to small mills; in West UP/India, the traders sell none to the small mills and 80% to the medium and large mills; in Eastern UP, 40-50% is sold to medium and large mills, with still 40% sold to small mills; but in Jabalpur (the city at the end of the supply chain), urban paddy traders sell 57% to medium and large mills (simply because the city mills are larger on average than the rural there); in MRD/Viet Nam, paddy traders de-husk paddy to brown rice in custom milling and then sell almost 90% to medium and large mills, not to small mills (now used only for de-husking). The only exceptions to the “demise of small mills as paddy buyers” are in less-developed rice areas - the eastern UP and RRD/Viet Nam (where significant shares go to small mills). On the other hand, the surveys show some paddy moving across districts and across states/provinces. The evidence for this came more from the mill surveys, showing that mills in Zhejiang/China and Jabalpur/MP/India are sourcing paddy from a variety of places, in order to get the needed quality grades and volumes. It is unclear, however, to what extent this trend will continue; it is encouraged by the demise of small local mills and large mills clustering in county and district seats; that at least portends an increasing “market-shed” for clusters of mills near secondary cities. Second, in sharp distinction to the limited movement of paddy, there is substantial movement over districts and provinces/states of rice – and thus modernization in the form of geographic lengthening of rice VCs. The China cases are most striking. The Beijing rice market is mainly supplied from the northeast (e.g. Jiamusi, our study area in Heilongjiang), 1500 km distant. But Zhejiang cities in the south are, per our survey, also buying substantial amounts of japonica rice (bought into a traditionally “indica rice” zone) from the northeast (with Hangzhou being some 2700 km from Jiamusi). Only 16% of the Zhejiang cities’ rice is sourced from local and Jiangxi sources. But we also found (a more moderate version of) this lengthening into Jabalpur in Madhya Pradesh in India, where we expected it less, given the poorer road quality and less developed
388

nature of the supply and demand zones; Jabalpur is drawing rice from a number of states, in a diversified market. Of course, some of the other study sites showed shorter chains – such as in Dhaka’s rice market which is drawing from several dynamic rice zones near Dhaka, and the same for Ho Chi Minh City and Delhi. Third, the rice traders in the urban areas of our studies also mainly source directly from mills – and in particular, medium and large mills, but not the small mills. This manifests two aspects of transformation – dis-intermediation, as the traditional role of the semi-wholesaler selling from mills to urban areas has diminished as mills use their own trucks or hire transport services or urban traders contract that, and consolidation, as the medium and especially the large mills are called upon to feed the cities. Moreover, as noted in the mill section, large mills are establishing contractual or semi-contractual relations with large wholesalers. This is happening in an advanced way in the case of medium and large Heilongjiang rice mills and their wholesale agents in Beijing; either the mill places its own employee in the wholesale market to market its branded rice, or has a close relationship with a wholesaler who handles one or two mills rice from his stall. The rice sold is mill-branded and mill-packed. It is happening in a more informal way, with informal but regular relations between a small set of a large and medium mills and a typical large wholesaler, in the Delhi, Zhejiang, and Ho Chi Minh City. These traders sell the rice mill-packed but not usually mill-branded, although the mill information is typically on the bag along with the type of rice, for the retailer to verify. Finally, the price spread between buying and selling paddy, and same with rice, was traditionally seen as very large, due either to speculation or high transport costs or both (Harriss, 1979; Timmer 1974). However, in our set of recent studies, the spreads were minor – usually from around 3-7% on paddy, and 1-3% on rice (buying versus selling price). This could be due to enhanced competition from a much denser road network and penetration of the system of wholesale markets compared with several decades ago. The exception was again in what appears as the least developed zone in our study, eastern UP, where the price spread was like those found traditionally, at 19%.
8.3.4. Retail segment marketing transformation
First, the procurement systems the largest supermarket chains appear to be starting to source direct from large mills, toward sourcing from off-market rice wholesale companies (for all sizes of chains), but continue to source from large wholesalers in wholesale markets (for small chains and independents). Our
389

survey work only systematically explored this for Beijing with in-depth interviews with 10 chains. This topic needs to be explored further. Second, in Beijing, Zhejiang, and Delhi, supermarkets have a “bimodal” or two-pronged strategy for marketing rice: they are selling some packaged and cheap or loose to appeal to the lower income consumers, and some packaged with higher quality and diversity of types (such as fragrant rice), for the middle class. In China, the leading chains (domestic and foreign) tended to be more advanced than small local chains in implementing the dual strategy. By contrast, in Viet Nam and Bangladesh, the strategy is still in an “early phase” of focusing on the middle class niche. We expect that over time it will develop in the direction of the bimodal path in China now. Third, in China, packaged rice, both supermarkets and small shops, is mainly sold mill-branded. Even small shops now sell mostly mill-branded rice (while a decade ago they sold loose rice packed in poly bags as do small shops still in the other countries). Thus commercial and technological change in mills has spilled over into practices of traders and retailers in China, and only in the modern segment in the other countries. We expect convergence over time.
8.4. Transformation of “value chain finance” in the rice VC
First, various works in the 1960s and 1970s attested to “tied output-credit markets” where traders advanced payments to farmers to “lock them in.” It is our perception that policymakers and many researchers in the region still maintain a believe that this “tying” is the norm; that is, it is still conventional wisdom. It is important because it seems to underlie an assumption that supply chains are traditional and stagnant, held in stasis – in thrall – to this stifling practice. The good news, however, is that all our surveys found that this practice has largely disappeared as between traders and farmers. The share of paddy farmers getting advances from traders was extremely low: 0% in Bangladesh, 0% in Heilongjiang/China, 1% in Jiangxi/China, 3% in West UP/India, 5% in Eastern UP/India; and 10% in RRD and MRD/Viet Nam. We also found it uncommon for mills to provide advances to farmers. Traders explained to us that they had left off giving these advances because farmers had easy access to competitors to sell to because of good roads, cell phones, and farmers having their own funds from nonfarm incomes. Second, advances from clients to mills, and from traders to small retailers, were more commonly found in the surveys, but still a minority. There is substantial variation: only 6% and 7% of Dhaka and Beijing urban traders give advances to
390

suppliers (mainly mills); that share was however 23% for the rice traders of Jabalpur, Madhya Pradesh.
8.5. Structural Transformation in the rice VC
8.5.1. Farm segment structural transformation
First, the surveys often showed stark heterogeneity in farm land holdings, and apparent emergence of concentration in some zones and of land rental market in most zones. These findings interestingly stand in contrast to country level evidence in various Asian countries that farmland is still fragmenting (India) or has reached a plateau of fragmentation and is only starting to reverse at the aggregate level (as in China) (Hazell, 2013). This suggests that underneath the “aggregate umbrella” there are diverse land distribution situations in these countries. In all the study areas there was a disproportion between the share of marginal farmers (below 1 ha) in overall population and their share in landholdings and output in the study area. The correlate to this was that medium farmers, with say (because the definitions differed somewhat over the countries and study areas) more than 2 ha, were usually a minority or even a small minority of farmers, but often controlled the lion’s share of paddy land and paddy output. The findings were as follows. In more-developed rice zones, the heterogeneity was great usually large:
a) In Heilongjiang, China, the 75% of the farms that are marginal/small, with less than 2 ha (and average 1.1 ha), control only 25% of the paddy land. Farms with above 2 ha, the medium and large (average 4 ha), control 75% of the output;
b) In west UP, India, the semi-medium and medium/large farms were but half the farms, but had 75% of the paddy land of the sample; even at overall UP state level, 25% of the farm population that is from the medium/large category controls fully 66% of the farmland.
c) In MRD, the 30% of the (representative) sample that were medium farmers controlled fully 66% of the paddy land.
d) In Noagoan, Bangladesh, the larger farm bicile, while having 45% of the sample, had 67% of the paddy land.
391

Yet we also found strong heterogeneity in most of the less-developed rice zones:
a) In Jianxi, China, the 12% of the farmers that are “medium” farmers, control 65% of the farmland by 2011 (up from 47% in 2007), the jump due to land rental mainly.
b) In eastern UP, India, marginal farmers in our sample formed 75% of the population, but operated only 32% of the land; medium farmers have 14% of the sample, but have 42% of the operated land. In the census for the whole district this pattern carries: 80% of the total farm population is marginal farmers, who operate only 53% of the land.
Second, an important reason for land concentration, as well as in some cases a jump in the average farm size even in the short recall period (5 years) of the survey, was the rapid development of land rental markets. It is surprising how important they have become. We surmise that this is partly due to migration and to the rise of specialized, commercialized small and medium farms. The study findings follow.
a) In the study zone in Jiangxi, China, the share of rented-in land in total farmland jumped from 53% to 71% over the five year period. That drove up the average farm size from 0.9 to 1.4 ha. But that disguises how concentrated the rental market was: medium farmers have 12% of the population but 81% of the rented-in land. Much of that was rented from other villages that organized themselves to rent out migrants’ land.
b) In Heilongjiang, China, we found 36% of the farmland was rented-in. c) In the MRD and RRD, Viet Nam, we found around 25% of the farmland
was rented in (up from 10% five years before). d) In west UP, India, we found 27% was rented-in (and only 8% five years
earlier). e) In eastern UP, India, we found only 4%, and in Noagoan, Bangladesh, only
12% was rented-in.
8.5.2. Mill segment structural change
First, secondary meso data for all four study countries shows the numbers and share of small mills declining over at least the past decade. This appears to be due to factors highlighted in our surveys: (a) large mills have made large investments to expand their plant and equipment, dis-intermediate upstream and downstream, and in the case of China, market mill brands and receive equipment and loan subsidies, and in China and Viet Nam, sometimes had direct state investment; (b) by contrast, small mills lack by definition economies of scale, have not been able to keep up with large mills in key equipment (such as polishers) investments (even as when in India they are helped with subsidies),
392

cannot credibly defend a brand, are being squeezed out of urban markets, and have progressively lost their remaining advantage of custom milling. While there are several large mill companies owned by the governments of China and Viet Nam, the mill sectors in all the study countries are overwhelmingly private sector, at all size strata levels. In short, the concentration is not a result of government decision, and only marginally affected by government subsidies (as we found few mills, even large ones, got these in any country), but is rather the result of private sector decisions and investments.
8.5.3. Structural transformation patterns in the trader segment
The trader segment has transformed from its traditional roots in short distance trade dominated by village traders (for example in India, Lele 1971), into a long stage of the rise of first urban and then rural wholesale markets, and finally the emergence of off-market traders in the towns and cities, owning or renting trucks and warehouses. These structural shifts constitute a gradual consolidation of the segment, and an enlargement of its coverage in space, with longer distance trade, geographically longer value chains. This development was enabled by government investments in roads and by the spread of government-invested and managed wholesale markets into rural zones in the 1990s and the 2000s, and by private investments in trucks and warehouses by thousands of entrepreneurs in the 2000s. Compounding the effects of opening the village trader sector to competition, is the fact that village traders are usually 4-5 times smaller than the urban traders so there may be economies of scale at work as the larger wholesalers and mills use transporters to get the product “from under the noses” of the formerly powerful village traders. The composition of current trader sectors among the representatives of those three stages differs over zones and countries, with the following patterns in general (but with variation over the study zones). First, as implied by the shift in farmer marketing practices noted above, there has been a reduction of the role of the village traders, roughly correlated with the degree of development of the zones, penetration of rural wholesale markets, and ease of access to mills: observed is a lesser role for village traders in Noagoan/Bangladesh, Western UP, and Heilongjiang/China, and a greater/persistent role in Eastern UP, MRD/Viet Nam, and Jiangxi/China. Second, there is a larger role larger role for the traders in rural and urban wholesale markets, and a larger role for inter-state or inter-province traders, off-market trading enterprises with warehouses, and direct sales to mills, and
393
thus the importance of these actors in the structure of the trade segment, in direct negative correlation with the above results for the village traders’ role.
8.5.4. Structural Transformation in the retail segment
First, there is incipient penetration of supermarkets into rice retail, albeit at very different starting times (but all fast paced) over the study countries. The retail segment of the rice value chain has been the most recent to begin transforming. In three of the study countries (Bangladesh, India, and Viet Nam), the transformation has only just begun, as supermarket growth has itself started only recently, although it is emerging quickly, especially in India and Viet Nam (Reardon et al. 2012a). Our estimate for Beijing is that the penetration rate is already roughly one half, around where Hong Kong was in the mid-1990s. By contrast, Delhi is only at about 7% (Minten et al. 2010), but it is likely that the share will rise. As supermarkets can sell rice more cheaply than traditional shops (see Minten et al. 2010 for Delhi), controlling for quality, it is expected that gradually supermarkets will penetrate rice retail. This would follow the path of Hong Kong (Ho, 2005) for example, where small rice stalls/shops dominated in the 1970s and 1980s, and supermarkets gradually took over the rice market in the 1990s and 2000s.
8.6. Transformation of government role in the rice VC
8.6.1. Government role in farm segment
First, the farm surveys showed great variation in the role of the government on extension and input sides. A reasonable generalization is that government extension has at least recently had a modest role (sometimes, as in India, a very small role) in farmers’ technology decisions, as reported in the surveys. Private extension through input shops has an ascendant role. Second, government direct input sales has a very minor role, given that the share of inputs bought from government outlets is everywhere either tiny (China, Bangladesh, Viet Nam) or small (but much debated), as in India. The private sector is by far the main retail provider of inputs to farmers.
394

8.6.2. Government role in Mill and Trader Segments
First, as noted earlier, the governments of the study countries have little direct role in the mill sector, with but a few exceptions. We thus here focus on its direct role as a trader. The key point is that that role is very limited, with only a few exceptions that are specific to a few countries and a few segments of the VC.
a) While mills in Heilongjiang/China and Jiangxi/china source very little paddy from the government, the Jiangxi case the urban mills bought fully 66% of their (early season indica) paddy from government depots (up from 51% in 2007). This is done as a price dampening measure by the government. The Chinese government is then not engaged directly in the other segments.
b) It is only in the Indian case where the government is significantly engaged in buying from the mills, and then only in six states, of which UP is one. We found that in the west and east UP cases there is 59% and 41% of the mills’ rice sold to government. As in China, this is an intervention to dampen prices, this time via the public distribution system at the retail level (which has some 15% of rice retail in Delhi; Minten et al. 2010). The shares of 59 and 41 are very high seen in the overall Asian context, where government buys little from the mills; per our surveys, we found only a 7% share in Bangladesh, 1% in Heilongjiang, 5% in Viet Nam, and 6% in Jiangxi and Zhejiang.
Second, the governments of course had a large indirect role in the changes in the mill and trader segments, especially due to the enabling investments in rural infrastructure and energy.
8.7. Conclusions
First, and most important, the picture painted here of the rice value chains in Asia – nowadays – is sharply different from the traditional image from the literature and policy debate of the 1970s and even 1980s, images which have penetrated to the present still forming conventional wisdom. Several key changes have occurred during the semi-modernization (in most of the study areas) and incipient modernization (in the least advanced of the study areas) of the value chain:
a) Rice value chains have lengthened geographically in order to gather sufficient rice to feed massive and growing cities, urban areas moving toward being dominant in population and already dominant in food expenditure in Asia.
395

b) Rice value chains have shortened intermediationally as the major traditional role of the village trader has been reduced and undermined, superseded by increasing reach and role for mills and urban wholesale markets and supermarkets.
c) Rice value chain segments have changed structurally – with a notable consolidation in the mill segment, wholesale segment, and an incipient consolidation in the retail segment. Even the farm segment is stretched in different ways, fragmenting at the bottom end, but showing signs of concentration in the upper end.
d) The rice value chain has moved from a sleepy traditional and semi-subsistence mechanism to a dynamic, commercialized market economy – with the rapid development of markets for seed, water, land, fertilizers, machine services, and pesticides/herbicides, and rapid and deep commercialization. The surprise is that this is happening right over the whole of the widely disparate set of zones we studied as well as the farm size strata. It is a commercial revolution in the main food staple.
Second, the transformation is overwhelmingly a private sector led transformation. In the whole of the six studies, we only found two “nodes” of government intervention as a buyer – of paddy in Jiangxi China, and of rice in UP, India. In those two instances it was a state running part of the wholesale segment. But even in those, and in all the others, the great majority of input shops, mills, wholesalers, retailers, and of course all the farmers, are private sector. Understanding how all those thousands or millions of private sector actors, modern and traditional, conduct and perform is the essence of understanding the drivers of food security in Asian staple food economies.
Third, the positive – and negative – roles the government – and donors like ADB – can play in the transformation of the system manifested themselves at every turn in our analysis. Successes were strewn over the landscape we studied - the importance of roads, power grids, the price of diesel, technologies for rice farming, liberalization of FDI in retail and processing, ease of interstate movement of rice. Governments also intervened in number of ways with subsidies – such as for farm inputs, mechanization upgrading of mills. Governments also impeded: this was perhaps most noticeable in the interventions of the Indian government in requiring a major levy of rice from mills. That was the only instance we found of “command and control” policies still exercised in the rice sector (except for export bans, not discussed in this piece). The report thus pointed to a number of opportunities and challenges that governments face and enjoy in encouraging further transformation of the rice value chains in Asia.
396

Chapter 9 Major Findings and Implications for Policy and
Investment
This chapter synthesizes the key findings of the report and presents implications for policy and investment.
9.1. Major Findings
This section synthesizes the key points of the report for China, India, Viet Nam and Lao PDR.
9.1.1. China
In this summary for China, we first highlight key points for the upstream, midstream and downstream segments, and then provide the major findings for the overall chain. 9.1.1.1. Farm Segment findings In considering the overall picture of the farm segment in China, 20 findings stand out. The land rental market is extremely active in the area. This was found to have several correlates. On the one hand, the average farm size jumped from 0.8 ha to 1.4 ha in five years (to 2011). The great majority of this jump was from rental by the study villagers of land from other villages some distance away but in the same district. On the other hand, the change was highly uneven over initial farm size strata: the marginal farms increased 35% in size, while the medium farms doubled in size. Medium farmers had the great majority of the very concentrated land rental market - 71% of the rented-in land in 2007, and 81% in 2011 – which led to a rise in overall operated-land concentration – from the medium farmers having 47% of the land in 2007, to 65% in 2011 – despite their only being 12% of the farm population of the study villages. We shall show that these “relatively specialized” (although not completely specialized as they also have some products and activities other than rice production) are different in many ways from the majority of farmers, the marginal and small, who operate the minority of land. The farms in this area are quite fragmented (a farm has many plots) – but the fragmentation is sharply negatively correlated with farm size, and the average
397

plot size goes from 0.05 for the marginal farmers to 0.20 for medium farmers. The smaller farms also tend to have more plots scattered in the hills, while the medium farmers have nearly all theirs in the valley floor. It is easier to use farm machines on larger plots and on valley plots. The consequence is that we found the smaller farms still use animal traction for their hill plots and machines for their valley plots, while the large farms just use machines. Contrary to our expectation (based on a hypothesis in the debate that farmers are shifting from two to one season of rice to leave more time for migration and for horticulture), we found nearly no such switch. Only 10% of the farms switched at all, and with no clear pattern (from one to two seasons, or two to one). The medium farmers, aided by having more land and plots and pumps, tend to farm three seasons, and the marginal and small, two. Moreover, horticulture is extremely minor. By contrast, there was a doubling or tripling of livestock but that is done in parallel with rice farming and not by grazing in dedicated fields. Nearly all the rice farms are irrigated, but the smaller farms tend to use a canal from a reservoir or lake, while the larger farmers are much more likely to have a pump (also to draw from those sources). It is striking how little government extension plays a role directly, and how concentrated it is among the medium few, rather than the small many. Only 15% of the farmers (of any size) reported receiving any extension from either the government or the private sector. That average masks a large degree of variation: 30% of the medium farmers reported getting an extension (versus 5-10% for the marginal and small); also for the medium farmers private sector extension (like information from companies) was twice as common as government extension contact). By contrast, 40% of farmers of all sizes reported that TV and radio were the main ways they got rice technology information. The combination of more land and more nonfarm income provided a big jump in cash – and this was partly converted into a large investment in assets: livestock holdings in value terms jumped 200-300% as did non-land assets like pumps and machines and vehicles. This rate of investment is stunning – and matches the high rates that we found in Heilongjiang. The machine services rental market is extremely active. While actual ownership of tractors is very concentrated (mainly among a subset of medium farmers), and that of harvesters even more so, use of machines is very widespread. The gap is filled by rental – with three-quarters of the farmers renting machines (with labor “attached” to the machine).
398

The nonfarm labor market is extremely active, with three quarters of the farm households participating. This is manifested in two ways. On the one hand, half of the households have members who migrate; a fifth get remittances. Migration is fairly evenly spread over farm size strata – so that even the so called “relatively specialized” farm households also heavily migrate. On the other hand, local rural off-farm employment is about half of nonfarm wage income, and half self-employment income (with the smaller farmers doing that), and only about 15% is from local farm wage income. That is, local nonfarm employment is much more important than local farm wage employment, a common finding in the international literature. In all, migration plus remittance income nears 4500 USD, local nonfarm another 1800, so that total nonfarm income is about 6300 USD per household. By contrast, net rice income on average (over the whole sample) is three times less. – about 2000 USD per household. It is no wonder then that households heavily mechanize – to free farm labor to migrate and work locally off farm. However, rice income varies strongly over the farm size strata – with marginal and small farmers’ averaging about 1000 USD per household of net rice income – versus the medium farmers, who are relatively specialized, who earn 10 times more per household in rice, or about 10,000 USD. As medium farmers also do nonfarm activity, their total incomes average 15,000 USD, putting them perhaps in China’s middle class, while the small farm households average about 6-8000 USD. External input –led intensification is widespread across strata. Seed, fertilizer, and chemical use is ubiquitous, and the markets for these developed. By assigning a market price to own seed use, we can cost it, and find that purchased paddy sees totals about 100 USD to the imputed value of own seed use at 65 (per ha). So purchased seed has partially supplanted the use of own retained seed, the more traditional practice. Moreover, chemical fertilizer is used by nearly all households, and one can say, even over-used: the farmers average some 800 kg per ha (about 325 USD). This is more than twice the all-China rate, but is about the same as was found in our survey in Heilongjiang (see Reardon et al. 2012). Finally, pesticides and herbicides are used by nearly all households, at about 150 USD per ha. Water use costs little as it is subsidized (by being provided free) by the local government, with the cost is mainly the use of one’s own pump or labor for hoses from canals.
399
Labor use per ha is strongly inversely related to farm size – meaning that medium farms have gone much further in supplanting labor with machines. Some 1120 USD (imputing wage to own labor and adding it to hired labor) and 900 USD are spent by marginal and small farmers – versus only 540 by the medium farmers. Moreover, for the marginal and small farmers, only about 15% of their total labor is from hiring workers – compared with 65% by medium farmers. This leads to small farmers’ total monetary costs for rice farming to be 25% below medium farmers, because they replace the hired labor outlays with their own labor. So the small pool of farm workers in the area work mainly for the medium farmers, and much of that is labor running machines, and transplanting seedlings. It is puzzling and interesting that marginal and small farmers use so much labor but also spend about the same amount on machine use as do medium farmers (around 500 USD per ha). Note that the latter is the sum of hired machine and own machine (imputed at hired rate) use. This even understates the puzzle: small and marginal farmers also use about 160 USD worth of animal traction – mainly on smaller plots. One possible explanation, which requires regression analysis subsequent to this report, is that the efficiency of the labor used by smaller farmers is simply much less than that of larger farmers. Mechanization is mainly being used to pump water (by medium farmers) and for land preparation and harvesting (by the great majority of farmers). Very little or no mechanization is used in transplanting seedlings (done by hand), or in weeding (done instead by hand or by herbicide). There has been a sharp increase in mechanization over only five years, in land preparation (jumping from 40% to 60% of farmers) and in harvest (jumping from 60 to 80% of farmers). This jump is nearly all due to the rise of the machine rental market. Nearly all farmers buy seed, fertilizer, and pesticides/herbicides; it is interesting that despite strong farm size differences, all are practicing similar intensification with seeds and chemicals. They these nearly exclusively from private sector sources – and extremely few, at most 3%, from government outlets (either shops or extension). Seed is bought from seed shops, about 22%, and small input shops, about 53%. Some buy from other farmers (about 17%). Fertilizer and chemicals are bought from small input shops, and a little bit from seed shops. Use of hybrid rice is widespread, correlated with season (averaging 90% of farmers in the middle/late season, and 63% in the early season); interestingly, it
400

is modestly correlated negatively with farm size in the early season, and positively with farm size in the middle/late season. Just like land, and production, the sales of rice from the study villages are highly concentrated. Of the 5000 tons grown in 2011 by the sample, two-thirds are grown by the less than one-tenth of the farmers that are medium; the three-quarters of the farmers that are marginal produce only one quarter of the rice. This shows the importance of the “relatively specialized” (medium) farmers in the rice economy of the area. Equally interesting is the fact that yields are about 10% higher on the relatively specialized, medium, farms, compared with the marginal and small farms. This is in contrast to the conventional wisdom that there is an inverse relationship between land productivity and farm size. Of course, the development literature internationally has many cases where that conventional wisdom is not the case – particularly where larger farmers use more capital or have more efficient practices. As the small and larger farmers engage in similar chemical and machine use patterns, the differences might be due to labor practices and lower fragmentation on larger farms. This needs to be explored in more detail. Farmers are very oriented toward market sale – this is a “commercialized small farmer area”. The marketed surplus rate is 88% overall, nearly that of the Heilongjiang case, and only varies from 73% for the marginal farmers to the average 95% for the small and medium farmers. On average over the sample, most of the rice is sold to local brokers, village traders, and mainly at the farm gate. But the behavior differs between marginal and small farmers on one hand, and medium on the other. Medium farmers tend much more to sell in towns, and to government. The latter is still a minority of their sales (only 10%), but enough to make the government rice market very concentrated on the medium farmers, for about 90% of their purchases from farmers. Contrary to our expectation, the composition of the pie of buyers is similar across seasons (even though the late season, with higher quality rice, was thought to be less destined to government). Strikingly in contrast to what we found in Heilongjiang, where most paddy is sold directly to mills mainly in the rural areas, in Jiangxi only 2% of the paddy is sold directly by the farmer to the mill. The mills are further away. This could be because in HLJ mills grew up around earlier large state farms that were parcelized and the mills stayed near them, while this process did not occur in Jiangxi. The exception is that medium farms tend to sell a higher share than other strata and other seasons, direct to mills in the late season.
401

Over the seasons there is also a difference in price due to what key informants described as a consumer perception of better tasting rice in the longer seasons in the middle and later part of the year. Again, as shown in Reardon et al. (2012) for Heilongjiang in China and for the study areas in India and Bangladesh, the conventional image of widespread tying of output-credit markets (via advances to farmers by traders), is no longer the case. Only 1% on average of the sample got any advances from traders. And this average masks the fact that this was a little higher only for medium farmers (that one presumes may have more bargaining power with traders). 9.1.1.2. Mill Segment findings Of our findings for the mill segment in China, two dozen findings stand out. The mills are very heterogeneous in capacity and output; in rural areas, the mill strata average outputs of 2.5 thousand to 98.2 thousand tons of milled rice per year – a 39 fold difference. In urban areas, strata averages range from 4.2 thousand to 26.2 thousand. The mill segment is very concentrated. Taking the rural mill sample as representative (as it was sampled to be so), we calculated that while the small mills are numerous and the large mills few, given the size differences, the large mills (out of the small, medium, and large mill sample) supply fully 63% of the total output of rural milled rice. The medium mills supply 34% of the rice. And the many small mills all together supply but 3% of the rice. In urban areas, the mill segment is even more concentrated, with the medium mill subsegment supplying 95% and the small, but 5%. We think that a number of factors are driving this concentration (with the rise of large mills and the decline of small mills) and point those out throughout this section. The mills are all private sector; the only ones that had any origins as government mills were the urban medium mills, and only a fifth of those started as state mills. Nearly all the mills, small or large, are in the formal sector. The larger mills tend to be “dragon head” firms; these get subsidies on loans to encourage the emergence of large, technically advanced agrifood companies. Mills are large investments – of a level affordable to the business sector rather than the farmer sector. Even a small mill costs 15,000 USD (1 year of income for a medium rice farmer, 2 years for a small farmer); a medium mill costs the equivalent of 7 years of income of a medium farmer, and a large mill, 133 years.
402

Most of the mills are bought without a bank loan; loans are instead mainly used for 40% of the working capital of the large firms (but not the small); that means that business persons were coming in with substantial cash accounts to start the mills a decade ago. Millers have made large investments in the capacity expansion of their mills during the 5 years before the survey – doubling their capacity on average. This was mainly done with their own money, plus loans (subsidized if they were large dragon head firms), but without equipment subsidies (except if they were urban large mills). An important part of the expansion among the larger rural mills occurred when a number of them moved into an “industrial park” in Shangrao in 2009. There was a criterion of a minimum (large) scale to bid to move in; once in, the big mills could operate in even larger premises, and some transitioned to Dragon Head status, and thus in turn were able to access subsidized credit. Being in the industrial park also afforded a prime location near logistics firms and the highway. Millers also made investments in vertical integration, in particular in rental of stalls in urban wholesale markets (owned by a quarter of medium and large rural mills and a third of medium urban mills). This is a similar pattern to that of Beijing (where large mills have agents in stalls in wholesale markets). In both rural and urban areas, there is a very strong positive correlation between mill size and capacity utilization rate. This is probably a key cause of mill segment concentration. Utilization even dropped over the 5 years recalled: from 91 to 83% for rural large mills, 43 to 39% for medium, and 23 to a mere 19% for small rural mills; urban mills by contrast have somewhat higher utilization rates, at 42% for small and 91% by medium mills; that difference is due to the much lower seasonality of the use of urban mills that draw paddy from a broad geographic and multi-seasonal area, compared with rural Jiangxi mills that are mostly bound to the local farm base and its sharper seasonality. Small rural mills are twice as labor intensive as larger mills; put differently, the larger the mill, the more capital intensive is its production. This may make the larger mills more efficient (we did not test this statistically). Larger mills have larger and newer equipment, and a greater assortment of equipment, than do smaller mills. This gives the larger mills various advantages; one is the ability to produce more fine rice, controlling for the quality composition of the paddy they buy. This is because larger mills can polish twice with one machine, while smaller mills can polish but once; polishing allows for the alteration of color and shape that can shift the grade of rice.
403

While rural mills do not store rice with a subsidy from the government to act as a reserve on their behalf, the urban medium (but not small) mills do. The latter dedicate a third of their storage to this. This means they derive a subsidy others do not, which could, again, be a driver of concentration. The government also announces “indicative” (not enforced but suggested) price floors that mills are asked to pay, at a minimum, to farmers and traders. Nearly all the mills reported that when they wanted to they paid below the indicative floor price; that is, the announced price was not heeded. Custom milling is in fast decline. Five years ago it was important for medium and large mills and then was phased out. A third of small mills still do it but this is substantially down from five years before. Rural mills have very different sourcing systems depending on the mill size. Small mills mainly buy from traders; only a quarter of their paddy is bought directly from farmers. By contrast, medium and large mills report that they source some half of their paddy from farmers; the large mills even source 44% of their paddy from the government. Urban mills source very little directly from farmers. Small mills rely mainly (but decreasingly) on local traders (as they shift to sourcing more from outside traders). Medium mills (recall that they control 95% of the rice output) buy 67% from the government (up from 52% in 2007). It is very important to note the high share of the government in a particular segment of the value chain – the transition from the indica paddy trader/farmer to the mills. The government is important in that segment, but we found it is not directly important in any other segment of the whole value chain. The government buys paddy to store it in its own warehouses, then sells it to traders or mills, to stabilize the rice price over the years. We found, based on the survey data and some rough assumptions, that about 38% of the rice sold in the urban Zhejiang sites comes from the government via rural and urban mills. If we note that that government intervention is done mainly for indica but not (or much less) in japonica, and we note that in China 38% of rice consumption is in japonica and 62% is in indica, that yields very roughly about 24% of the share of rice in China that has as part of its supply chain the government’s “storage and release” action. This is of course very rough because it is based on extrapolation from the survey-perceived situation in just Jiangxi and three cities of Zhejiang. This estimate of 25% can be compared with the FAO or USDA range of about 40 to 60 mmt of 200 mmt total in China, or about 30%.
404
Rural mills sell all their rice to private sector buyers, not to the government. Only the large rural mills sell rice taken out of their own storage (about 25% of their sales in 2011, down from 68% in 2007). Half of the large mills’ sales go to traders from other provinces (the share is only 40 and 30% for the medium and small traders). The medium and small mills sell about a quarter of their output to local factories for their canteens. Only 10% of the large rice mills’ output goes directly to supermarkets – but note that this was zero five years before. The overall image is of large mills (recall they have a 65% share of the market) increasingly selling to external traders and supermarkets, and the smaller mills focusing more on the local market. Urban mills also sell all their rice to private sector buyers, and none to the government. Again, the medium mills (who control 95% of the market) sell from their reserves, for a quarter of their sales. But most important is that they sell fully 65% to the noodle companies; note that this fell from 75% five years before. Actually the sales to noodle companies are supplanting sales direct to retailers; five years before, a third of their rice was sold to retailers, and now that is down to one-quarter. Value chain finance of the traditional variety – mills giving advances to farmers or paddy traders – is now very rare; only 3% of the rural mills offered advances, and 15% of the urban mills (but these were only the small mills that have but 5% of the market). Similarly, mill’s clients seldom pay advances. By contrast, paying with a delay (de facto receiving credit from suppliers) is common, mills to farmers and paddy traders (for a week, the transaction cycle), and mill clients such as retailers and factories to mills (for just a few weeks, the transaction cycle). Banks and informal sector lenders are, however, fairly important, at least in terms of how many mills borrow from them. For rural mills, fully half of the small mills, two-thirds of the medium, and a third of the large, take out bank loans. Few of these are for buying the mill; most are for financing working capital; keep in mind however that the loans covered a fairly small share of the working fund. Also note that the large mills borrow from the Agricultural Development Bank and commercial banks, and enjoy a subsidized interest rate when the mills are dragon head firms. By contrast, the small mills just borrow from informal sources at commercial or higher rates. For urban mills, the dependence on bank loans is less than for rural banks, but the pattern is similar in terms of the types of banks and purposes of loans.
405

Quality (common versus fine) of paddy bought and rice sold is sharply correlated with mill size. This can be because of the variety bought but all polishing of the rice to different degrees (with more polished, higher price). An important point is that the price difference between common and fine rice sold by the mills is about 5-10% for rural mills and 10-15% for urban mills – much more than the 3-5% difference at the farm level. This is similar too, but less sharp than, the findings in Bangladesh (Minten et al 2012) that midstream and downstream segments capture more of the quality differentiation premium than do the farmers. In rural areas, two-third of the medium and large mills sell branded rice; surprisingly, even 40% of the small mills report doing so. But for the large and medium mills, those that brand only brand a quarter of their rice. The share of mills branding is similar in urban areas, but the share of the rice that they brand is higher, about half. It is stunning how strongly inversely related is the cost of milling a ton of paddy and the size of the rural mill: there are strong economies of scale, more than a 2 to 1 difference in per unit cost between small and large mills. This appears to be a strong factor driving consolidation among rural mills. About 40% of costs are labor costs, 30% are direct electricity costs, and another 30-40% are transport costs, which are again substantially fuel/energy costs. Urban mills transport costs are on the higher end because of their sourcing from further afield. Wastage in the chain is less than 1% of the rice, from farm to miller and on to client. Profit rates are high for rural millers; some 61% for medium and 93% for large mills; but keep in mind that we figured these gross of amortization, so they would be high; given that a number of the large mills moved into the industrial park and invested heavily in new equipment and plant, this is reasonable. By contrast, the urban medium mills have profit rates of only 24%, a similar finding to that of Heilongjiang study. 9.1.1.3. Trader Segment findings In the trader segment, a dozen findings stand out. The rural paddy trader and the urban rice trader are quite different in their characteristics. The paddy traders are all male, all informal sector, have no place or stall in a wholesale market but operate “off-market” in the villages, have no warehouse, and operate with small trucks or motorized tricycles.
406

By contrast, the urban rice traders are half women, more educated, have large networks of traders and retailers, and while nearly all are still in the informal sector, have to make substantial investments to enter, to grow to compete, and to fund his/her own rotating fund (working capital) for purchases, replenished by sales income (about three weeks after the sale, as there is some delay from clients. They pay substantial fees (7000 USD) to rent a stall in the urban wholesale market, and a number of them also rent warehouses, for about 6500 USD; a tenth even own (and mainly sell from) their own mills. With their warehouses, a quarter even store for the government (for a fee), like the mills. Yet even with warehouses and being in urban areas, their business fluctuates somewhat with the seasons, although less of course than does the rural trading business. Urban traders have one or two trucks, average 5 times the physical capital in vehicles and equipment, compared with a rural trader. 70% of them are agents, averaging representation of a half dozen mills with branded products, each; this even exceeds what we found in Beijing rice markets in terms of the share of agents among wholesalers, but the latter represented but 1-2 mills each. In short, urban rice trading is a substantial business, with apparently significant entry requirements. The working capital for the rural trader is significant compared with a farmer’s cash flow, but much less than an urban rice trader. The rural trader self-finances his working capital funds. By contrast, the urban trader’s working capital is very large, about 270,000 USD per month (like a small/medium retail store), up from 170,000 five years ago, and 70,000 ten years ago. Part of this increase is from inflation of costs, but part is from expansion of the average trader. He/she relies on borrowing for 18% of that capital – up from 9% ten years ago; some of that is drawn from banks, so there is interface with the formal sector, and need for presentation of collateral. The rural trader sells only two types of rice, and the urban, six (qualities, seasons, varieties). All sell in bags, not loose. The rural traders have shifted increasingly into dealing in fine rice, from 50 to 65% of their paddy, according to them. They do not brand their paddy. By contrast, the urban rice traders (to the extent of 77% of them) deal in mill-branded products, and a third even add their own brand to that. Interestingly, they report to have reduced the share of fine rice in total from 37 to 25% over the five years, perhaps because their client profile (shown below) does not require much fine rice. Rural traders work on small gross margins – a spread of only 6% between buy and sell price; urban traders work on an even smaller margin, at a mere 3%. As
407

with many traders the world over, they have to make their money on volume, not on margin. The margins, interestingly, are smaller on fine rice than on common. There is a big spread of prices over rice of different qualities. At the pinnacle is Thai fragrant rice; 40% cheaper is japonica; 42% cheaper is middle/late indica; 40% cheaper is early indica. Note that the spreads are higher than the farmer receives for the latter two; this is more evidence of the midstream segments capturing more of the quality differential than do the farmers, just as we found in the mill sector (and as was found in the Bangladesh study, see Minten et al. 2012, and the Heilongjiang study, Reardon et al. 2012). The procurement profiles of the two types of traders differ a lot. The rural paddy trader is steadfastly local in buying paddy just as he is in selling paddy. By contrast, the urban rice trader is dealing in what appears to be an increasingly national market for rice. Strikingly, the Zhejiang urban rice traders procure only 7% of their rice from Jiangxi, the province right next door. This small share is even in decline – as it was 13% in 2007. They even source less than 10% from Zhejiang itself. Instead, much of their rice instead comes from north of Zhejiang - from Jiangsu and Anhui (producing both indica and japonica), increasing from 26 to 31% over the five years, from the Northeast (such as Heilongjiang; producing only japonica), from 12 to 19% over the period, and from others (mainly Hunan, Hebei, and Henan, all just producing indica), from 44% dropping to 34% over the five years. There is thus a general shift to the north, to longer supply chains, and toward japonica, if only partially. The shift toward japonica is more clearly seen if we control for season: japonica climbed from 41 to 47% of the rice trader sales in middle/late season. 90% of the rice urban traders buy comes from the private sector, and 10% from government reserves. As we noted above with respect to the strong concentration (into large and medium mills) of the rice mill sector, we see here reflected in the profile of suppliers to urban traders: for common rice, they are 80% large and medium mills; for fine rice, 96% from large and medium (with just the large mills having an 87% share), and with small mills only 5%. This is similar to our urban findings in Beijing, Delhi, and Dhaka. Paddy traders sell two-thirds of their paddy locally – in Shangrao itself. Again, among their clients, large and medium mills far dominate (two thirds of their sales) – and small mills are absent. Nearly 40% of their common paddy is sold to the government reserve warehouses, compared with only 14% of their fine paddy.
408

Rice traders sell the third of their offer that is common rice, nearly half to traditional retailers, with another 10% to noodle firms, and 10% to supermarket chains, and a quarter to HORECA. Of the two-thirds of their offer that is fine rice, they sell a third to traditional retailers, 15% to HORECA, and 16% to supermarkets (up from 6% in 2007). What with the mills increasing their sales of rice to supermarkets, and now we see traders doing the same, the trend is clearly converging with Beijing’s (and Hong Kong and of course Tokyo and Seoul) where supermarkets increasingly dominate rice retail. Our findings on value chain finance continue to be iconoclastic. Few (10%) of paddy traders give advances to farmers, and yet a third pay with a delay to farmers (thus deriving de facto credit from the farmers), although the delay is but a week. The clients of paddy traders, the mills, do not provide advances to them (probably in order to pick and choose the cheapest offer from competing traders). But all their clients pay the paddy traders with a modest delay, per the transaction cycle. Very few paddy traders took loans, and then, only from informal sources. By modest contrast, a quarter of rice traders pay advances to the mills, but only for a week; 40% pay with a delay to the mills, and again only for a week. So there is a minor give and take on the credit side between the mills and traders. By contrast, no advances are given by mills to traders, and even two-thirds of the traders clients pay with a long delay of 3 weeks. That is probably why a fair share of traders have to resort to loans to finance their working capital. Also, a third of urban traders took loans, mainly from commercial banks; recall how large the medium mills are, so that they can access these loans. The costs of the paddy trader are modest, being but labor and a truck. The costs for the urban trader are large, at 90,000 USD a year; 60% of that is hired labor, and about 10% are energy costs, with the rest the installations. Interestingly, using data from the last transaction of rice traders, we found that the purchase of rice incurs transport costs 22 times higher than the sale of the rice, but figures on a per ton basis, it is only 2 times more. Recall that the purchases are taking place from far away, and the sales near. There are large economies of scale in rice transport. This is reaffirmed when we find that costs of transport per ton per km are nearly the same for paddy traders (trading at a short distance) and rice sales, and all much less than buying at a large distance in large quantities. Finally, the profit rates – gross of amortization – are around 60% for paddy traders and 50% for rice. This is similar to our findings of about 40% for Beijing and 50% for Dhaka. Should one control for amortization the rates would be lower.
409

9.1.1.4. Retail Segment findings In the retail segment, nine findings stand out. Traditional rice retailers in the Zhejiang cities are, like the rice traders, half women, and nearly all in the informal sector. But the similarity with the urban rice traders ends there. Few are specialized in rice, but rather run shops or stalls with a diversity of dry goods. They are often clustered in a “farmers market” (nongmaoshichang) with stalls of fresh products and even nonfood goods in the same market. They are close to their competition, averaging a half a km from a supermarket, and just 6 km from a wholesale market. They are tiny compared to the rice traders in terms of vehicles, stall, storage, labor, and of course, costs. Their working capital is less than a thousand dollars a month; they self-finance that fund or at most use informal credit. As we found in Beijing, most small rice retailers home-deliver, to about half their clients (the regular ones). Yet only 15% of the retailers let consumers buy on credit, contrary to popular image. The traditional retailer’s procurement system is simple – just go in their own small van some 6 km away and quickly buy each few days the rice (and other products) they retail. They tend to repeatedly go to the same trader, chosen for price and quality (as value chain finance is very limited). The cost level is low and the cost structure simple for these micro-enterprises. Most of the cost is the rent of the stall, and then minor costs for lighting it and maintaining the small vehicle. Labor costs are small because the workers are from the family, usually. Commissions and fees are minor. However, due to real estate pressures, the stall fee climbed a lot over the five years, as did the electricity cost. As we found in Beijing, even traditional retailers are massively shifting into packaged, branded rice, and out of loose rice in poly bags. The share of small retailers selling packaged rice rose from 86 to 92% of stalls/stores over the five years. Most of the packaged rice is middle/late season (high quality) indica and japonica. Most of the packages have the mill brand, and a quarter also have the trader brand. As among rice traders, there is sharp differentiation of prices linked to qualities and types, with japonica in first place, then middle/late indica, followed by early indica (perhaps for poor consumers). It is interesting that not only are net
410

margins small (the retail market is competitive with six rice stalls in one market vying) but there is little margin difference over qualities, to our surprise. This is similar to rice traders – where fine rice even has a slightly lower margin than common. The profit rate for small retailers thus seems surprisingly high – at 38%; however, this is in line with Beijing estimates, as well as those in Dhaka and Delhi (see Reardon et al. 2012). The effective rate would of course be lower should amortization and own labor cost be netted out: after all, these firms are very small and family run and thus a bit like small family farms. Modern retailers, as diverse and large as is there product set, still sell much more rice in their “rice section” than do small retailers – in fact twice more for small chains, and 7 times more for a large chain’s store. This is like Beijing. Moreover, the supermarket in Zhejiang (as in Beijing) has many more types of rice than do traditional shops, and large chains more than small chains. Just judging by our counts of types on offer, it appears that japonica is more important in supermarkets than in traditional stores. But supermarkets offer both “high end packaged quality” rice and “low end loose cheap rice”, to appeal to the different strata of consumers; we found a similar result in Beijing (Reardon et al. 2012). As in Beijing, the local smaller chains actually sell the more expensive packaged rice, and the larger chains stretch to include the cheaper rice for poorer consumers, to broaden their client base, and perhaps use their large scale to buy cheap in order to compete with traditional retailers. The price spread between packaged and loose rice of a given variety is greater in the supermarkets than in the traditional stores, implying that the chains can and are trying to extract differentiated value from market segmentation. As with the traders, the supermarkets also tend to have a low share of Jiangxi rice, despite its proximity. 9.1.1.5. Overview of the VC: Findings There are also a number of interesting findings for the overall value-chain. The share of farmers rewards, costs, and of the final retail price is around two-thirds for both seasons and both grades (common and fine). This can be contrasted with the finding in Reardon et al. (2012) for Heilongjiang of roughly half as the share for farmers. The difference is probably due to the much longer (distance) value chain (about four times longer) between the farmer and the retailer in the Heilongjiang-Beijing value chain compared with the Jiangxi-Zhejiang value chain.
411

As in our findings in Heilongjiang and in Bangladesh, the share of the farmer is higher in common than in fine rice – indicating that the post-farmgate segments capture more of the value added from quality differentiation. Only 8% of the total margin, in all, goes to the traders (only 1% to the rural traders within that), while roughly 25% goes to the mill segment and 12% to the retailers. This high share to the mills is actually lower than the one-third that mills have in the longer Heilongjiang-Beijing value chain. The low share of the traders could be due to the relatively short distance of the value chain. Farm costs are important costs in the whole chain. Given the importance of the rental market for land, it is not surprising that the share in costs is high: 13% (versus only 8% in the Heilongjiang study). Farm input costs (outside land and labor) are also a high share (38%), somewhat comparable with those in Heilongjiang where they form 29% of total costs. The hired farm labor cost share is high in Jiangxi, at fully 11% of all costs in the value chain. The shares of transport for the mills and the traders (9% together) are much lower than in the much longer value chain of Heilongjiang (where they are 28% together, nearly proportionate to the difference in lengths). It is quite striking that the total cost per ton in Jiangxi is a high 394 USD, versus only 268 USD in Heilongjiang. In the report above we explore reasons for this but more analysis is needed on this. Part of this can be due to the 50% jump in diesel prices I in the time between the surveys.
9.1.2. India
In this summary for India, we first highlight key points for the upstream, midstream and downstream segments, and then provide the major findings for the overall chain. 9.1.2.1. Farm Segment findings In the farm segment, 16 findings stand out. While farms average only 0.8 ha, there is significant heterogeneity over farms and concentration of operated farmland. Medium farmers have but 14% of the sample and 42% of the operated land; the census shows they have 8% of the population but 22% of the land. Farm size rose slightly over the study period, 2007 to 2011, from 0.72 to 0.82 ha – but most of this was among the small and
412
medium, with stasis among the great majority, formed by the marginal farmers with less than 1 ha. Water problems and desire to diversify to horticulture diminished paddy, from 50% to 39% of farm land over the five years. Even paddy land was somewhat concentrated, with the 14% of the medium farmers operating 48% of paddy land. Farmers – especially the two poles, the marginal and the medium - shifted into horticulture and wheat to replace some paddy. In fact horticulture is also fairly concentrated, with the 14% of the sample that are medium farmers growing 52% of the horticulture, despite the view that the smallest farmers would dominate these labor intensive crops. Farmers grow paddy in the rainy season and wheat/horticulture in the dry/winter season. In sharp contrast to what we found in center-west UP, here in eastern UP, the land rental market is very under-developed. 90% of the farmland is irrigated, mostly by groundwater via tubewells. Nevertheless the farmers complained about water access. Human capital access is a major challenge. Families are large, and education is very low. Access to government extension is extremely low – with only 3% of the farmers receiving a visit, and 1% receiving any paddy related training. Farmers rely on each other, and somewhat on the radio and the input shop man. Physical capital is also scant. Livestock, vehicle, and tractor holdings are small but sharply correlated with farm size. 10% own tractors, and 2% own threshers, and all these are just among the medium farmers. Rural nonfarm employment – not farm wage labor or migration – is important, and averages well above paddy, horticulture, livestock, and wheat incomes combined for the average farm of any farm size stratum. This is not NREGA, it is local endogenous employment – much neglected in policy debate. Paddy farming is done using own-produced seedlings – for which there is no market. All transplanting is by hand using a lot of hired labor. The seed market is limited; only a fifth of farmers buy seed, from a half-half mix of government shops and private shops. Hybrids have not penetrated this area, but HYV has spread to 60% of the farming.
413

While very few farmers own tractors, nearly 90% hire tractors to prepare land; few use animal traction. Tractor rental markets are important and developed. Machine rental is the third highest outlay for the farmer – but this, unlike other inputs, is strongly correlated with farm size – with medium farmers spending 3 times as much per ha as marginal farmers. This more “extensive” model is to be expected. Almost all farmers buy fertilizer, like western UP; as we found in western UP, in Eastern UP the use of subsidized government shops is strongly tilted toward medium farmers and away from marginal farmers – contrary to the avocation of these shops. Fertilizer use per ha is similar over farm sizes – and the use rate is high, around 400 kg of urea plus DAP. Pesticides are widely used, with two-thirds buying – like western UP. But unlike western UP, few farmers use herbicides yet, and just manually weed. This is a conundrum, given that labor costs are close to those in western UP and nonfarm employment is important. The greatest cost is that of labor; there is extensive farm labor hiring among all strata, to our surprise at first, until we realized that nonfarm employment is so important. While the conventional image sees eastern UP farmers as backward and subsistence, in fact these farms sell 92% of their paddy (and of course nearly all their other crops). The traditional village trader only gets 18% of paddy sold, and as in western UP, this is strongly negatively correlated with farm size. 41% goes to the rural wholesale market (strongly correlated with farm size), the government gets 13%, and direct sales to mills, but 15%. The paddy sold is just of the common grade, not fine or medium, and is only non-basmati; hence there has been little quality or variety differentiation. A key finding is that only 5% of the farmers get advances from the traders – much in opposition to conventional wisdom. As striking is the fact that the advances that are handed out are mainly going to the medium farmers. Also striking is the tight distribution of prices; medium farmers get only about 5% more for their common grade paddy than do the marginal. 9.1.2.2. Mill Segment findings In the mill segment, 16 findings stand out.
414

Millers are twice as educated as farmers, own substantial small-medium enterprises, operate in villages and rur-urban areas, and belong to an association. The mills of eastern UP, even the largest ones, are on average smaller than the mills in western Uttar Pradesh (from our earlier study), and for that matter, well below the size of the rice mills in our studies in China. The mills are all private sector – but differ in that the small firms are in the informal sector and do not register, while the medium and large mills register (incurring costly fees). The investments are substantial, yet the millers report that most of this comes from own funds, with the involvement of bank loans for only a third of just the largest mills. An important finding is that the large and medium mills use around 70% of their capacity, versus only 50% for the small. This can be one reason for the trend of concentration in the mill sector. Large mills are much more capital intensive (and per ton milled, much less labor intensive) than small mills. This is despite an array of government incentives such as subsidies that have helped a portion of the small and medium mills to upgrade their equipment. Small mills do not, as we had expected, just do custom milling for local customers and dehusking for larger mills; in fact few custom mill, and most of them polish rice, just as do the larger mills. The mills do not have a “hub and spoke” system of commercial agents representing them with stalls in the wholesale markets, as we had found in China. Rather, the mills just sell through the traders and a substantial amount (40%) as a levy system sale to the government. Mills source half their paddy directly from farmers (in turn half of that is spot, and the other half is from farmers in “PACS” that are government registered groups selling their paddy in deals at least in principal managed by the government). They source the other half from wholesale markets. Mills sell 40% of their rice to the government; this is both the regulation amount and the amount we actually found in the survey. Surprisingly, about 16% is sold direct to buyers out of state, including from Allahabad to Jabalpur, the supply chain we study. The great majority of the rest is to traditional retailers, and some to rice traders.
415

The mills only have to sell at a government mandated price when they, for 40% of their rice, sell rice direct to the government, or, for 25% of their paddy (de facto, not by law) buy paddy from the PACS in government managed deals. Otherwise mills tend to buy and sell at the price the market will bear. There is thus not, in practice, a tightly enforced official price system toward either the paddy sellers to the mills nor toward the rice buyers. It is striking that no mill pays an advance to any supplier – whether to a farmer or trader. Nor do the clients of mills pay advances to the mills. Rather, the great majority (of mills paying to suppliers, and clients paying to mills) pays with a delay and thus derive de facto credit from their suppliers. But it is just for a transaction cycle of 10 days, so it is not onerous on suppliers. Only a quarter of mills take loans, mainly for paddy purchase, and mainly from commercial banks. Unlike in China where the big mills get special interest rates, the mills in Eastern UP pay regular commercial (high) rates. Mill commercial practices differ with mill size – with the larger mills labeling the bags with their mill name (but not a brand for consumers, as we found in China). However, the price does not differ much over the mills, either for what they pay suppliers or get from clients, so there is little “bargaining power” from scale. That may imply that as concentration proceeds, it will not necessarily imply higher prices for consumers, and could in fact imply lower prices, with increasing efficiencies as larger mills have higher capacity utilization rates. Energy is an important cost for the mills – forming 50% of their costs – from electricity, and from diesel to generate electricity. Energy policies thus affect food prices via the mills, as well as other channels. The taxes and fees mills pay to the government are quite high. This can be as high as 19% for large mills, just for registration. It is not clear that this cost is justified, and may be a transfer from rice consumers to government that could be further examined. There are also substantial fees paid to the government for rice transactions, for wholesale market facilities – but even when the mill does not use the facilities… Finally, of great importance is the strong negative correlation between mill size and total cost per ton milled, from 18 USD/ton to 7 per ton. This can be a reason for consolidation in the mill sector. The gross profit rate is fairly high, at around 60%, but note that this is gross of amortization, and capital costs are a major part of the mills’ long term costs.
416

9.1.2.3. Trader Segment findings In the trader segment, a dozen findings stand out. Our study covered rural paddy traders (in Allahabad in UP) and urban rice traders (in the peri urban areas of Jabalpur in neighboring MP); Allahabad is by far the largest and by far the closest paddy producing district to Jabalpur. The Jabalpur traders, which is the closest large city to the production zone, also source more than half their rice from the UP, and even a third from Allahabad itself. The traders are nearly all middle aged, male, and Hindu, and have several times the education of farmers. Few are members of any association or are leaders in the villages. They have, however, built large networks of other traders and mills and retailers. The enterprises are fairly simple in structure and status. They do not brand or export, and only a few deal with supermarkets. The rural traders started just in the mid-2000s but the urban ones started decades ago. They are all informal sector. None is a representative or agent for a single mill. They are half specialized in rice. If they are on market, they rent a stall. Very few, and only urban ones, own a warehouse. They have a few, modest vehicles, and tend to rent them. However, the trade enterprises differ significantly in scale – with the rural firms doing a third of the business of the urban firms. This is partly due to the much sharper seasonality of the rural firms, as expected. But there is still marked seasonality even among the urban trade business; this may be due to the small warehouse capacity; it appears to us there is underinvestment in warehousing. Their working capital differs a lot due to the difference in scale between rural and urban, by a factor of 8. On average the working capital doubled over the life of these firms, showing investment and expansion as their markets grew. They relied little on the credit market for financing their operations. If they did, it was mainly from informal sources for the rural traders, and coop banks for the urban traders. It is very interesting to note that the trader survey corroborated the “myth busting” findings of the farm survey – showing that very few traders pay any advance to their suppliers. Nor do clients of traders provide them with advances.
417

Rather, both traders and their clients extract credit from the upstream by paying with (modest) delays. The informal sector condition of the paddy trading sector is evident in that two-thirds of the paddy is sold loose, not bagged. The urban paddy traders do bag the rice and label it with consignment information such as from what village it came from. The rural and urban traders in rice sell both loose and bagged; the urban traders tend to put the mill information on the bags, but still do not sell branded rice. (Note that this is a practice emerging in Bangladesh and already well advanced in China.) There seems to be substantial competition in the rice trading segment, with gross margins only around 4 to 6%. The gross margins are far higher, around 19% for the rural paddy segment. Quality and variety differentiation has not advanced far in the rural zone, with all production common grade and non-basmati; that is reflected also in the products traded by the rural paddy and rice traders in Allahabad. By contrast, paddy and rice traders in Jabalpur deal also in basmati (somewhat) and in medium grade rice as well as common grade; this reflects the broad (inter-state) procurement base of the large city rice markets. It is interesting that off-market (not based in the wholesale markets) traders have half the rice market in the urban areas; these are larger traders with their own bases. Moreover, more than half the rice is bought from medium and large mills. These two points together imply that there is structural change away from in-market and village trade based systems, sourcing from small mills, to off-market specialized traders, sourcing from larger mills. This would then mirror the changes we observed in Delhi and in Dhaka and Beijing. Moreover, beside the above noted integration (shown by multi-state sourcing) in the rice market, there is even increasing sale out-of-state of paddy by the Allahabad traders, shifting from 20 to 30% of their sales over five years. They are shipping to peri-urban mills such as those around Jabalpur. This parallels the changes we found in the Jiangxi-Zhejiang study in China. Rice traders in both Allahabad and Jabalpur sold two-thirds of their rice to traditional retailers, and most of the rest to traders and consumers; extremely little was sold to supermarkets or hotels and restaurants (in very sharp distinction to the study results in China). The main costs of the traders are hired labor fees; on a much lower scale are their outlays for fuel, vehicle repair, and stall and warehouse rental. Contrary to conventional wisdom, their profit rates (overestimated as they are gross of
418

amortization) are quite modest compared with findings in western UP, and for that matter, in Bangladesh and China. 9.1.2.4. Retail Segment findings In the retail segment, eight findings stand out. The traditional rice shops are like so many others in Asia, and of course like small shops internationally traditionally – these are in wetmarkets in clusters of twelve or more, are small (with just 1-2 family members and a hired person), and retail some rice among other dry goods. The quantities, only about 25 kg a day (as the shop sells various other goods), or 7-8 tons a year per stall or shop. Their premises are also modest, a rented stall or shop, a small storage space, a small van or truck. The working capital is modest, much smaller than a rice trader, and half borrowed from informal sources. The traditional retailers provision but once each three weeks, and nearly always from a wholesale market nearby, and from a regular set of traders. Value chain finance in all directions is very modest. Few retailers give traders an advance: a mere 3% of the traders supplying the retailers get an advance from the retailers. And few traders advance to retailers. Also flying in the face of conventional wisdom is the fact that only 7% of consumers buy rice on credit from the retailers. Retailers don’t even home-deliver rice. The main fees are for transportation, stall fee, and any market fees. The cost structure is simple. To satisfy poorer and non-poor clients, rice is sold loose and packaged by nearly all the stalls. The packaged rice is labeled by the mill. Note that the types/grades of rice well exceed that available just from the Allahabad zone, reflecting that the retail draws from the Jabalpur wholesale markets which in turn source from many sources in various states. The margins are modest as are the profit rates at only 10% - much lower than observed in the Delhi study. The traditional rice retail segment appears to be quite competitive. The supermarkets in Jabalpur sell rice; in fact an average one sells much more than an average rice shop. Yet interestingly, the composition of rices on sale in both the modern and traditional shops are similar.
419

9.1.2.5. Overview of the VC: Findings A review of the entire value chain also yields a number of interesting findings. Fully 49% of the value chain is from the off-farm components. 22% of the whole value chain is due to distribution (traders and retailers), and fully 27% are due to mills alone. The mills also capture a high share of the rewards in the system. This demonstrates the important but neglected fact that the productivity in the post-farmgate segments of the food chain is as important to overall food security as productivity of farms. Farm input costs are a dominant cost in the chain, at 69% of costs. Thus, input supply chains’ efficiency is a major policy issue. Only a small share of the inputs are bought in the government stores, so the performance of the private sector in manufacture and distribution of inputs is very important. Milling costs are about 20% of the chain; recall that about half of those are energy costs, and again for the traders, with the other 10% of costs in the chain, have about 25% of their costs in energy (fuel for vehicles and for their facilities). This means that nearly two thirds of the costs post farm gate are energy related. Moreover, we found market fees and registration fees to be particularly high, and are not sure of the benefit cost ratio of these.
9.1.3. Viet Nam
In this summary for Viet Nam, we first highlight key points for the upstream, midstream and downstream segments, and then provide the major findings for the overall chain. 9.1.3.1. Farm Segment findings Farm size is a hot topic of debate in the policy literature on Viet Nam. Recent work focuses more on land concentration by transaction and statements that farms are still of a small size (Jaffee et al., 2011). This area includes the owned area and rented area. The big difference in area between the farm strata can be seen, especially with the medium scale farms because they are 4 -5 times larger than small and marginal farms. This shows how uneven land distribution is among rice cultivation farms in the region. The share of medium size households in the surveyed sampling is 30%.
420

The maximum owned farm size policy of Viet Nam complicates efforts at enlarging farm scale, therefore, the average household rice area in the region is 1.89 ha. In the Mekong river delta, small farms are defined as being smaller than 1.25 ha (Jaffee, 2012). The mean farm size of An giang and Hau giang is larger than the typically small farms of the larger Mekong delta. Our research shows that in fact the emergence of the land renting market has taken place and that rental activities happen mostly with marginal and small farms. Small farms have the highest share of land area that is rented (47%). Small farms represent the biggest share, 41%, of the surveyed sampling. Marginal farmers, represent 29% of the sample and since they are more constrained by land prices, they have higher participation in land rental and rent 18% of their land area. This has resulted in the reduction of the Gini coefficient during the last five years. In addition, temporary migration to the city is increasing, which is expanding the supply for the rental market for rice land and increasing labor market constraints. In the study area, 100% of the production area of all surveyed farms is paddy land, which illustrates the high rice monoculture. The research at the farm-level also shows that farmers are undertaking the adoption of new cultivation technologies like using quality varieties and that the adoption of new varieties is 60%, higher than the statement of 42% (Bo, 2010). Our survey shows the high rate and rapid growth of ownership of pumps for irrigation, which is a new finding. In 2011 about 50% of small and medium farms have their own pumps. Although only 22% of marginal farms own a pump, this is a drastic increase from the 2007 figure of 3%. Furthermore, they have to buy pumping services during the season because irrigation is very crucial for rice production. Furthermore, irrigation is conveniently provided naturally by rivers and canals across the region. However, flooding occurs quite often due to the region’s low terrain, so rice growers often have to pay for 2 types of water pumping: pumping of water from the canal to the rice field and drainage - pumping water out of the rice fields to avoid flooding . The data shows that nearly 50% of households have their own pumps, an increase from 2007 because of the initiation of the construction of the dyke system. The water cost is very low due to the good public service provision of the Government. The service cooperative organizes the water supply service to the border of the farmer field and the farmer is in charge of pumping to their fields. Farmers don’t have to pay water source fees for the use of the canal, but they have to pay for the pumping of water to the field. The cooperative is also in charge of drainage service in the case of flooding.
421

100% of farms pump water from the rivers and canals. The pump ownership rate is relatively high, especially for medium farms (56%) and small farms (52.01%). Previously, the farms simply relied on gravity for water flow to crops twice per year, to avoid the flooding season. Now they have changed to an intensive triple cropping mode with one cropping during the flooding season, and the farmers have begun to build local dykes in that area, so the farms use pumping machines to irrigate more often. The share of households with members participating in off-farm activities is high across all farm types, ranging from 41% (medium) to 53% (marginal), resulting in an overall share of 49%. This is new information about the role of off-farm activities in the rice-based farming system of the Mekong as the majority of other research focuses on the role of rice income in the area. The recent significance of off-farm employment shows that farming systems in An giang and Hau giang are diversifying and although the area and incomes associated with rice production are increasing, off-farm incomes are also increasing. Medium farms with large areas, however, don’t prioritize off-farm employment but concentrate more on other crops, like chili and vegetables, because they have access to limited cultivatable dry lands. This is another opportunity for livelihood diversification in the area. The rice field in the area is not allowed to be used to cultivate crops other than rice if there is no authorization from the local government. Our survey also captures new information about the migration behavior of farmers. The literature discusses rural migration to the city (Jaffee, 2011), but our research shows that the migration is mostly local, and a policy to support off-farm activity at the local level will be a very crucial issue for the region. The Gini coefficients of non-crop incomes were calculated by farm strata. The Non-crop income in this area was defined by livestock income and all off-farm incomes. Marginal non-crop income is 0.32, small is 0.48, and medium is 0.85. The Gini coefficient for the overall sample is 0.63. The non-crop income differentiation of households in Hau giang is relatively high. Among the farm types, the medium type has a very high Gini coefficient, which means that off-farm employment is highly developed but not every household can benefit from this income source. If we only calculate Gini coefficients for off-farm activities, the Gini will be: marginal 0.53; small 0.36; and medium 0.81. The general Gini for the overall sample is 0.60. This information shows that, medium and marginal farms have greater access to off-farm activities, while small farms rely more on livestock as a supplemental source of income.
422

Furthermore, the literature claims that An giang is an origin of new initiatives for the reduction of fertilizer and pesticide application (Huan, 2010), but our research confirms that the adoption of fertilizer reduction is limited, and that the use of fertilizer is still high for all farm segments. The observation of seed quantity reduction, however, is confirmed (Huan, 2010). The medium farms do not participate in livestock use, they specialize in rice production using bigger areas of rice land. The small farms generate a high level of income from livestock activities, while marginal farms enjoy lower level incomes from livestock activities. The livestock activities in the area mostly consist of cattle production for meat and eel farms. Both small and marginal farms have enjoyed growing livestock incomes during the last five years. In terms of household assets, one of the features in the study area is that no farms buy tractors for land working and combine harvesters because both types of machines are too costly given the 1.9 ha/farm scale of small rice farms. The collective use of machinery is common and is similar to that which takes place in other countries. However, 100% of the tractor use in the area is enabled by agricultural machinery services provided by the private sector. As seeding by hand is the norm in the region, there is no ownership of seeding machines. The government wanted to promote seeding machine use by financially supporting the purchase of seeding machines, but farmers prefer to continue to seed by hand due to the high demand on labor and some technical constraints. Our survey shows that the sprayer is a very important asset that 100% of farms have owned since 2007. Farmers are rapidly mechanizing, particularly in terms of adopting the use of tractors and combine harvesters. The use of dryers is also popular because farmers practice more and more wet paddy selling when using combine harvesters. But farmers have to buy the services of these two types of machines and cannot own them. There is a need for the testing of an adapted institutional form of collective action for machine management. This is another new finding in the area. Regarding land cultivation, the data show that farmers buy tractor services for land working throughout the entire area. The mechanization level is high due to the land consolidation of the land policy and the low number of plots. However, farmers depend on the land preparation services of tractor service providers. In
423

the high season all farmers need the service at the same time. So this kind of service is well organized by the private sector in the region, but is associated with overcharging during the high season. This time constraint can raise the price of this service. In other countries, the collective ownership of tractors exists, but in An giang, Hau giang this form of collective action is not observed. Among the production cost components, chemical fertilizer, which contributes 51.7% of the total production cost, is the most important. Intensive investment for triple cropping requires the heavy use of fertilizers to ensure high productivity. On average, 500 kg of fertilizer is used per ha and per crop, and the fertilizers are primarily NPK and DAP. Marginal farms use more fertilizer (562kg/ha). The majority of farmers have access to quality guaranteed fertilizer (88%). In Viet Nam the low quality of fertilizer is a hot policy topic, but this seems not to be the case in An giang and Hau giang, where fertilizers are bought mostly from private shops in the village with payment at harvesting time with interest (and where transport cost can be avoided by purchase from within the district). The cost of the rice seed accounts for only 7% of the production cost, which confirms the value of research for new varieties and of public-private partnerships in the seed supply service. Furthermore, all farms are buying and using these inputs. It is interesting to note that agricultural input shops serve as the major fertilizer source. During the cooperative time all the input services were assured by the state and distributed by the cooperative. This model failed and the role passed to the private sector. In all provinces the input company is of a joint-stock form that is partially owned by the private sector and partially by the provincial government. The private distribution system can combine with the credit service to allow farmers to pay to input at the end of the season. Farmers don’t need to borrow credit from the bank. This system seems to be most appropriate for the Mekong situation, as 100% of farmers use this service. Rice farms in the region retain 63% of the rice seed from the previous season. That means that 37% of their seed is newly bought. The seed distribution system in the region is organized by public- private partnerships. The government and research institute invests in the varieties selection, then cooperates with private companies for dissemination through contract farming with some farmer seed clubs or seed service cooperatives. The company then distributes the seed to the farmers by input shops networked in the village.
424

The data show that the share of households using the new varieties like early fragrant indica is around 70% more than those using old varieties like early ordinary indica. Approximately 27% of households buy certified improved seed every season as it can be use for three consecutive seasons without suffering yield decreases. This rate is higher than in other regions like the Red River Delta, with about 15-20%. The share of cost for hired labor is 11%. All three types of farms have to hire labor in the high season mostly for harvesting time. The labor mostly comes from other regions or from non-landed farmers working as agricultural workers in the region. These agricultural workers had to sell their land due to its insufficient size and low competitiveness. Farmers shifted rapidly from hand harvesting plus thresher use in 2007 to the use of combine harvesters in 2011. This phenomenon is due to the introduction of harvesters by the government. During the harvest in 2007, farmers hired labor, but the price of labor has tripled between 2007 and 2011. The mechanization of rice harvesting could provide a response to this constraint and also help farmers to reduce the rental cost of threshing machines. The table showed that the total cost of using combine harvesters is lower than that of using the hand harvester and thresher. Medium farms’ rice production volume is over 8 times that of marginal farms due to their larger areas designated for early fragrant indica in the spring season. But all of the farm types sell wet paddy in the field in the high season because they don’t have the capacity for storage, so the marketed surplus rate is quite high, at around 96%. Farmers keep only the paddy for the next season’s seed use. Even rice for home consumption is bought in the local market. The sale of wet paddy is riskier for farmers in the high season. So they have to pay a commission for a broker to hire the labor to transfer rice to the trader’s barge. This fee for commercialization is relatively high compared to other production cost line items, at about 71 USD/ha. Almost all farm rice volumes are purchased by traders and this shows the crucial importance of rural traders. Farmers mostly sell quality fragrant rice to the local trader because the local mill needs fine quality rice for the domestic market. As for the new fragrant rice varieties, some farmers of small and medium farms sign contracts through seed clubs or cooperatives for seed production. So they have to sell to the seed company according to seed production contracts.
425

And as for ordinary rice, farmers have to sell to traders from other provinces and the rice is later sold to specific markets, such as export or noodle processing. The large mill companies and the government don't buy paddy from farmers in the study area. The current national reserve policy of buying in Viet Nam allows the mills or milling-polishing chains to undertake the purchase instead of the government. But the survey shows that all transactions with farmers are performed by traders. The operating area of traders is large and the relationship between traders and farmers is not strict, therefore, the rice farms often sell their product to whichever trader pays the highest price, these forms of transaction usually take place directly. There are no contracts at all observed in the study area for paddy buying. Even the rice sector company-farmer contract farming pilot being tested in An giang province seems only to be impacting the region to a limited extent. Although the literature says that most farmers get advances from traders, the observed use of advances is very minor, as only 10% of households can get this advance. Farmers get the advance from traders without any written contract. In addition, farmers have to pay a commission to sell their rice at the right moment in order to avoid post-harvest losses. 9.1.3.2. Trader Segment findings The average age of traders is 40.8 years old, while 80% are male. They do not have a high education level, with 8.7-years of education on average. Their working capital is 7,150 USD, 72% of which is their own, so traders require a negligible amount of loan capital. Traders buy all paddy and sells diverse products to different clients. Firstly, they mainly sell rice of different forms, accounting for 87% of their sales, only 13% of which is paddy. Among the rice forms sold, they sell more brown rice for the mill rather than white rice for consumption. Their principal client is large mills or mill-polishing chains. The quantity of common rice sold is also more important than that of fine rice. Rice traders bear a lot of cost types in their business, in which the highest cost is the petrol cost for barges and boats (516 and 283 USD/month in the high and low seasons, respectively, due to increased busyness in the high season). In addition, the cost of the maintenance and repair of barges and boats is relatively high (50 USD and 34 USD per month in the high and low seasons). The second highest is the short-term labor cost (279 USD and 160 USD per month in the high and low seasons) for the transfer of supplies to barges and boats.
426

Rural traders mainly process cash payments and 95% of traders engage in direct payments at the time of the transaction. Advances for farmers is also popular but only in small amounts. This information may contradict the information from farmers saying that only 10% of farmers in An giang and Hau giang receive advances. Traders tend to operate in an area larger than An giang and Hau giang. The hypothesis to check is that they apply this form more frequently in other provinces. 16% of the payment is used for advances for farmers. The duration of the advance is 6 days, and coincides with the duration of one trader shipment from the farmer’s field to the mill in the high season. The rural trader profit rate in Mekong is 34-36%. The profit rates for the traders of fragrant and quality rice is a little bit higher than those of common rice. This is not a very high profit for a trade activity in the rural areas. In other countries like Bangladesh (Reardon et al. 2012), the rural rice traders have a profit rate above 34% to 52%. The rural rice trader operates with a reasonable profit rate and can provide a good service to farmers in An giang and Hau giang. 9.1.3.3. Mill Segment findings The mill sector is now dominated by the private sector and large-scale consolidation is observed. Mill technology is still very backward (in the medium and large mill). There are opportunities for the private sector and FDI to invest in the upgrading of mill technology in the region. In the high season, small mills process only 48 tons in order to meet local consumption demand. Milled rice quantity by small mills in the low season is only 7 tons. The main functions of medium and large mills are to mill, to de-husk and to supply rice to milling-polishing plants. The milled rice quantity of medium mills in the high season is more than 2268 tons and of large mills is 3 times more. The large mill has more efficiency than the smaller. The mill-polishing plant has a higher milled rice quantity. Their milled rice quantity in the high season is relatively high (13,791 tons) and in the low season is 4,328 tons. In terms of investment in the mill sector, the state investment focus is on large scale complete mill-polishing plants, and only 12.2% of mills receive investment from the state under the joint-stock form. Meanwhile 100% of mills have received investment from individuals. The literature mentions the competition of private mills and state-owned mills throughout the 2000s and the disadvantages of private mills (Goletti, 2002). But our research shows that the private sector had an increasing role in the mill sector and that they have become quite dominant. The large and medium mills have a tendency to concentrate in some
427

geographical areas near river ways like Long xuyen (in An giang) and Thot not (in Can tho), Cai be (in Tien giang), etc. The small mills are mostly located in villages. The operating duration of rice mills differs between the low and high season. In the high season, where a majority of farmers harvest rice and rural traders have to buy immediately in the field. As a result, dryers and mills also have to work on the same schedule. In the high season most mills work 30 days per month and nearly 24 hours per day. This intensity of work approaches the maximum operating duration for medium, large mills and mill-polish plants. In the high season only small mills don’t work at night, but they work the entire day because they do the mill service more for home consumption rather than to fill a contract. Out of season, as previous parts showed, some farmers still harvest rice and rural traders still go to the field and buy rice in smaller quantities. So the paddy mills need to respond to this demand. In the low season, when the rice mill demand is lower, mills operate about 24 days per month and 10 hours per day only during the day. Small local mills operate 20 days per month and 3.3 hours per day. This mill operating duration in the An giang-Hau giang area is very high compared to that of other cases. Small mills use mostly family labor. The medium and large mills use more temporary labor in response to the seasonality of mills. In terms of efficacy, we can see the ratio of raw material/long-term labor. The results show that: small = 480; medium = 687; large = 846; mill-polish =676. The large mill has the highest ratio. This information can explain the concentration of mills. Different mill segments can produce diverse products in order to respond to the demands of clients. The small mills produce mostly white rice for the domestic market or for local consumption. They can also produce a small share of polished rice to meet the demand for quality rice at the local level. The medium and large mills produce mostly brown rice, but they also produce a small share of white rice (for medium mills) or polished rice (for large mills). The mill-polishers can polish only or completely process the rice to produce polished rice (twice polished) to meet exportation standards. For the brown rice suppliers, they can sell to mill-polish plants. The most important supplier modality of brown rice is rural trader sales directly to mills.
428

Another rural trader can also sell the brown rice to mill-polish plants but through a mill broker and pay a commission. The large and medium mills could also sell brown rice to mill-polish plants but with a smaller share. The users of mill services offered by small mills are mostly farmers who use them for home consumption because the small mills are located mostly in the village. The rural traders use mostly the mill service at medium and large mills. The medium mill can also provide the drying services for farmers and traders in addition to the milling service. The mill-polish plants don’t provide the mill service for any client, they only trade rice. The clients of mills differ according to the mill’s capacity. Small mills sell rice mostly (80%) to rural retailers to serve local consumers. The medium mill has more diversified clients (rural traders, other mills, rural rice wholesalers and rural retailers within the villages) with more homogenous shares. Large mills mostly perform the de-husking and sale of brown rice, and their most important client in terms of sold volume is other mills which whiten and polish rice. 13% of milled paddy produced by large mills is sold to rural traders as white rice. They sell 10% of their share of milled paddy quantity to the government buffer buy program. Mill-polish plants have very diverse clients. 32% of their total sale volume is directly exported and 16% is indirectly exported. Mill-polish plants sell 38% of their monthly sales volumes to urban wholesalers and the rest of their domestically marketed sales volumes to the government and to schools/hospitals. Supermarkets also buy quality rice from mill-polish plants but in very small quantities. In terms of costs per ton among traditional mills, large mills are the most efficient. This shows the advantage of scale, and explains the concentration trend observed. The mill-polish plants have the highest cost per ton, over 4 times that of large mills, but the product quality is different. In the cost structure, the most important items are electricity and hired labor mostly for uploading and discharging. Both factors have a tendency to increase in the future, so this will be a matter for future mill competitiveness. The fine quality rice profit rate of medium mills is the lowest, 19%. Small mills and mill-polish plants have very high profit rates, 43-46%. While mill-polish plants mainly achieve such high profit rates by focusing on the export market,
429

small mills are only able to achieve these high profit rates for very small quantities. Common rice has lower profit rates for all types of mills. 9.1.3.4. Retail Segment findings New modern retailers now involve supermarkets for rice selling. But the supermarket still occupies a small share of the rice market due to the few number of stalls in the city. Now supermarkets in Ho Chi Minh city have developed a new food shop system in order to expand the retail network. Supermarkets co-invest with some private traders who have a place favorable for retail sale to develop food shops systems. Food shops sell different foods, including rice supplied by the supermarket. The food shop is now competing with rice retailers. There is no difference in ownership by gender. The average age of retailers is relatively young, around 31.8 years old, while their business has generally existed for a short time (8-9 years), and their rice and food product sales only started 7 years ago on average. The survey shows that retailers often sell rice initially and then proceed to diversify to other products but the retailer rate that is involved in selling rice together with other products is low, accounting for around 10%. Traditional retailers sell on a small scale and do not engage in wholesale activity, so the turnover is about 154kg/day or 4.6 tons per month (30 days). The retailers in Can tho can achieve 5.6 tons/month and HCM city retailers, about 3.5 tons/month. However, traditional retail distribution is very large in the survey area, and each traditional market (wet market) has on average 7 retailers, which is an increase from the number of 5-6 retailers from 5 years ago. The growth of retailers increases competition in every area of retail. Rice retailers in HCM city are more frequently found in the street (62%) than in wet markets. In Can tho, half of rice retailers are in wet markets, and another half are in the street. The volume of each transaction is more important in Can tho than HCM city. Modern retailers are growing fast in Ho chi minh city (HCM city) and are doing so in many different forms, such as supermarkets, and food shops. This is a new direction for the development of rice retail in Viet Nam’s urban areas. Modern retailers have sold rice for quite a short time (6.3 years) and the consumption price stabilization policies for rice commodities have mainly supported modern retailers. The average distance between modern retailers and
430

traditional markets is only 0.5 km, modern retail stores consume 4.2 tons/month on average. This turnover of modern retailers is bigger than traditional retailers in HCM city with 3.5 tons/month. However, the rice sale potentiality in each modern retail store is not fully exploited currently, a modern retailer uses only 10.5 m2 for the rice sale because rice is not their main product, even many new supermarkets are not involved in the rice trade. Traditional retailers mainly use motorbikes for the transportation (83%) of small volumes, this is also the main means of transportation in Viet nam. In Can tho, the rate of traditional retailers purchasing at mills is big so they do transactions directly and not through the telephone. However, telephone transactions are the main method of trading in Ho Chi Minh city as the traditional retailers mainly purchase from wholesalers. These traditional retailers do not have to do transactions directly, they only order through the telephone and rice is delivered to retailers. This also explains how negotiating for transport has a rate lower than 29.63%. Prepayment hardly occurs in the business of traditional retailers, while getting delayed payment to their suppliers (wholesalers, mills) accounts for a high percentage (81%) and this is considered a way to retain customers. In comparing Can tho and HCM city, a paradox emerges in that the cost in Can tho is higher than in HCM city. Mostly the location of the shop is the most expensive. The tax in Can tho is also higher than in HCM city. So the total cost per ton of Can tho is higher than in HCM city. The traditional retailers mostly sell rice separately in plastic bags (99%) in both cities, modern retail mainly sells rice that has been packaged with good plastic bags (92%). Modern retailers that sell rice separately account for only 8%. The selling of rice separately makes the products of traditional retailers nearly devoid of any information about the origin, brand name and mill, while modern retailers pay particular attention to the product information and 97% of rice which is sold has a brand name and mill information, 2.8% of rice has the mill information only. The profit rate for fine rice is always higher than common rice both in the HCM city market and in the Can tho city market.
431

9.1.3.5. Overview of the VC: Findings In the whole domestic rice chain, farmers capture a smaller proportion of rewards for fine rice than for common rice, while urban wholesalers generate an important part of the rewards with fine rice. There is a lack of incentives for farmers to produce quality rice. The actual policy on buying 1 million tons of rice at the price floor doesn’t work well in the area because the mills don’t buy directly from the farmer. Also, the volume of 1 million tons is a relatively insignificant sum compared to the total production of the Mekong region, so the impact is limited. Farmers participating in the fine rice chain, have a higher cost share, but a lower reward share. Regarding the cost structure of the domestic rice value chain, input costs constitute nearly half of farmer’s total costs. The tendency of production cost increases is a major constraint for farmers. The rural traders have a higher cost and reward share for common rice than for fine rice. The operational costs of traders, especially electricity and rental warehouse costs, are also an important consideration. The increasing price of those input elements is also a significant influence on rice prices. Millers have the lowest share of reward, but they can gain from the quantity of product. The urban wholesalers have a particularly high reward share for fine rice with 31%. Although their share is near to that of farmers, the volume that they trade is much bigger. In the domestic rice value chain, the urban wholesaler who distributes the majority of the rice in the market is the key actor in the chain. They also invest in value chain finance. The reward share of urban retailers for fine rice is higher than for common rice. Traditional retailers are still dominant with very low investment. Supermarkets are still at the first stage of development, and play a minor role in rice distribution. The food shop initiative is an opportunity to upgrade the retail system.
9.1.4. Lao PDR
In this summary for Lao PDR, we highlight the major findings on FDI in the mill sector. From the discussion of Lao PDR so far we clearly find the driver of rice value chain development not in land (as initially thought) but rather in the FDI and domestic investment in the mill sector. Moreover, we also infer that the
432

investments in the mill sector acts as a pivot in linking both the upstream and downstream segments of the rice value chain and in that process develop increasingly comprehensive supply chains even for a small rice exporting country like Lao PDR and despite the constraints identified by literature reviewed at the beginning of the study. The underlying reason for this spate of investments since the late 2000s stems from an interplay of rapidly increasing rice production and hence marketable surplus; increasing prices for both glutinous and non-glutinous rice; the rolling back of the State Enterprise for Food and Crop Promotion (SEFCP) involvement; high miller’s margins; Tapping into the margins in upstream and downstream segments by direct or indirect involvement and some government and international agencies programme (especially EMRIP). The speed and degree of new, largely private-sector driven investments in mills and the linking and integration of the rice value chain involving a cross-section of stakeholders in a land-locked country of six million, with only 11% of rice areas irrigated, producing almost exclusively glutinous rice, and only exporting small quantities of rice and paddy intermittently, so far, provides an interesting contrast with the FDI in the mill sector in Viet Nam, Cambodia and Myanmar which are largely geared to the export market. Given the limitation of the present study in terms of coverage and dependency on secondary data, personal communication and responses obtained in interviews of the selected mills and hence less quantitative and lacking rigorous analytics, it would be prudent to mount a more structured and empirical research to guide policy, especially the on the respective role of public and private sectors as well as on the future challenges and opportunities in FDI and local investments in the mill as well as other segments of the Lao PDR rice value chain.
9.2. Implications for Policy Dialogues
Below we highlight some of the key policy implications identified in the Investment and Policy Opportunities Matrix (Table 9.1-9.4).
9.2.1. Policy Dialogues for China
China’s policy implications need to take into consideration the pace of its transformation, which is influenced by such factors as the significant migration rate within households, rapid mechanization at certain stages like land preparation and harvesting, consolidation of the mill sector, which means the
433

dying out of small mills and the quick growth of big modern mills, etc, and also key constraints, such as high rent for paddy land, few local off farm jobs at the paddy producing zones, quality transmission along the chain actors, high energy costs, such as high fertilizer cost, fuel cost, etc., access to credit, especially for big specialized rice farmers, access to high value markets, brand profusion (too many) and confusion (some are not certificated and there are only very few famous brands by certain big mills). Policy dialogue should focus on land registration to encourage the development of the land rental market, interactions between off farm employment and rice value chain development, removing pricing distortion along the rice value chain for quality transmission, government rice purchase policy for reserve, South-South cooperation for technology exchange and best practices for rice value chain development with low income countries, and spurring GMS rice value chain clustering.
9.2.2. Policy Dialogues for India
Similar to China, India must incorporate its constraints, related to low seed replacement rate, depletion of ground water, low level of farm mechanization, dearth of extension services, and low penetration of modern traders such as supermarkets, when approaching policy opportunities. Policy opportunities should address the following: the Agriculture Marketing Act’s impeding of growth of the mid and downstream segments, retail market liberalization, reducing barriers on FDI in milling and retailing, rice exports, and evaluating the effectiveness of government subsidy on the milling sector.
9.2.3. Policy Dialogues for Viet Nam
Viet Nam must also consider its constraints and pace of transformation in adopting policy solutions. Farmer mechanization is occurring rapidly via service purchasing. Policy should support farmer ownership of machines, and should adopt financial mechanisms to promote the use of combine harvesters and tractors for land working. There are opportunities for private sector and FDI investment in the production and trade of agricultural machines in the Mekong delta due to the lack of machinery services in the studied area. Policies should promote the development of local drying and storage services. The government should support farmer organization, mill investment in dryer services, and storage services. This provides an opportunity for private investment, including FDI, in appropriate drying and storage technology. The government should enhance the Public-private partnership mechanism (PPP) to attract private investment in this service. The policy for the guarantee of farm gate floor prices should involve greater volumes. Technology upgrades are needed in the milling sector. There are also opportunities for private sector and foreign direct
434

investment in rice milling in the Mekong. There is high demand for quality rice in the domestic market, so the policy should promote improved rice quality in the chain for the domestic market. The rice value chain in this study suffered from weak quality management, due to institutional constraints such as the unorganized nature of rural traders. So policy should support the professional organization of rural traders. The experiences of lead firms - farmer groups should be tested and promoted as an alternative to improve quality management. There are opportunities for private sector and foreign direct investment in this part of the rice value chain. The urban wholesaler plays an important role in the domestic rice chain. So policy to stabilize the domestic rice price should support them, and not only support supermarkets. The use of brand names and packaging is still limited in the domestic value chain. The policy should support the rice branding protection in the domestic market in order to promote the quality of rice and avoid fake branding. The retail system needs to be upgraded. There are opportunities for private sector investment in food safety and rice branding in the Mekong. The policy should invest more in research to identify the quality varieties adopted by the domestic market. There are considerable credit constraints for value chain finance. Favorable credit policies should focus on all actors in the chain. The TVA tax policy should be annulled for traders both for the export and domestic markets.
9.2.4. Policy Dialogues for Lao PDR
Lao PDR’s policy implications need to take into consideration its uneven pace of transformation (mainly happening in the surplus regions, usually with irrigation facilities and power supply, linked to major cities or regional growth centers) which is influenced by such considerations as commercial seeds suppliers (usually also millers), contracting seed growers and many forms of contract farming, selective mechanization (land preparation, crop establishment and harvesting), development and transformation of rice supply chains pivoted around the milling segment (both FDI and domestic investment) and increasing incidence of branded packed rice sold into supermarkets and exported to Europe. Some unique constraints that must be incorporated in policy solutions include: high transportation costs involved for both exports as well as spatial and temporal arbitrage supply flows, land-locked status – imported inputs is more expensive and export cost (transportation and export process/ documentation) is higher. Policy dialogue should focus on whether to emphasize exports of glutinous rice or white rice in the future, strategic targeting of future markets, balanced efforts to export organic or green rice to the EU (taking advantage of duty exemption under “Everything But Arms’) through ‘export corridors’ via Thailand and future export potential to China via border trade, encouraging other end uses of rice (especially exotic colored glutinous rice – rice
435

wine with local herbs, rice bran oil, neutraceuticals), broadening the focus on food security to include farmer incomes and commensurate returns to key stakeholders along the rice supply chain, evaluating, modifying (if necessary) and extending the government’s seeds and rice reserve pilot arrangement with private millers, and linking Lao PDR to GMS rice value chain clustering.
9.3. Implications for Investment Opportunities
Below we highlight some of the key investment opportunities identified in the Investment and Policy Opportunities Matrix (Tables 9.1 to 9.4).
9.3.1. Investment Opportunities for China
Similar to its policy implications discussed above, China must also take note of the key characteristics of its pace of transformation and constraints in approaching investment opportunities. Some such key opportunities are present at the upstream, midstream, and downstream levels. Upstream opportunities involve: providing information or creating an information system for land rental markets, mechanization services, better targeted extension services, and new farm organizations such as cooperative, family farm, etc. At the midstream level, key investment opportunities involve paddy drying machines, energy saving technologies, especially equipment with lower electricity use rates, better equipment to improve milling rates (head rice rates), storage facility or warehouse upgrading, services such as access to credit for SMEs, upgrading of milling technologies, brand approval and management service, and year round paddy supply for milling. Downstream investment opportunities involve multi modal transport system for food, modernizing wholesale markets and make markets acceptable near city center, services such as transportation hubs with modern information sharing system, access to credit, especially for rice wholesalers to weather long waits for money from clients, and providing information connecting mills and rice traders or supermarkets.
9.3.2. Investment Opportunities for India
As with China, India has investment opportunities at the upstream, midstream and downstream levels. Key upstream investment opportunities involve: ICT for weather & market information, water saving technology, services such as water markets, better machinery services for harvesting, land plowing, and transplanting, better irrigation, better government and private extension service, organizing farmers together, and improving farmers’ business skills. India’s midstream investment opportunities involve: exploiting scale of economies for traders, better storage facilities and technologies, encouragement of FDI on
436

milling, and services such as access to credit for SME (traders and millers), and upgrading of milling technologies. Key downstream investment opportunities involve: rice wholesale market development, FDI on retailing such as entry of foreign supermarket chains, alternative marketing channels and improving market linkages, and grades and standards and transmitting along rice value chain.
9.3.3. Investment Opportunities for Viet Nam
Similarly, Viet Nam has investment opportunities at the upstream, midstream and downstream levels. Key upstream investment opportunities involve research on quality varieties response to the domestic market, adoption of quality rice seeds, services such as agricultural machinery (land working and harvest), development of farmer cooperatives, drying services, and farmer storage. Viet Nam’s midstream investment opportunities involve: mills upgrading, reducing post-harvest losses, energy saving technologies, drying-storage systems, river transport systems, lead firms – farmer groups linkage, upgrading and organizing small traders, and processing bran and husk. Key downstream investment opportunities involve: food safety and green production regulations, transportation system, modernizing rice retail sectors, promoting the mill's shop system, fixing the place for rice wholesale markets in the city, packaging production and branding advisory service. Straw processing technology should be explored to avoid straw burning. Climate change adaptation and mitigation require investment in information services and training for farmers. Finally, green production and low carbon rice production should be promoted.
9.3.4. Investment Opportunities for Lao PDR
Lao PDR also has investment opportunities at the upstream, midstream and downstream levels. Key upstream investment opportunities involve the manufacture or local repacking of fertilizers and agro-chemicals, mechanization services, particularly for land preparation, crop establishment and harvesting (combine harvesters), production and distribution of good quality/certified seeds (especially when anchored around mills and comprehensive supply chains), new organization of production units – contract farming (various forms), cooperatives and farmer associations, provision of short and medium term financing/credit, and provision of crop or weather indexed insurance and safety nets. Lao PDR’s midstream investment opportunities involve: improvement in bulk handling/transport of paddy from farm to mill, upgrading or establishment of new mills, gasifiers, especially in areas where electricity supply is not assured, provision of short (for purchasing of paddy), medium (equipment) and long
437

(lumpy investments) term financing/credit, and certification for food safety, traceability, GMO free, organic or green food. Key downstream investment opportunities involve: multi or inter-modal logistics system for rice distribution domestically and for export, storage and distribution centers – including reprocessing plants for export as well as domestic modern outlets – supermarkets – certification for food safety, traceability, GMO free, organic or green food, strategically upgrading and developing specific channels for border trade – with China, Thailand and Viet Nam, and provision of financing/credit and business services.
438

Table 9.1 Investment and Policy Opportunities in Rice Value Chain, PRC Pace of Transformation Constraints Investment Opportunities For Policy Dialogues
Upstream (inputs and Farm)
Midstream (Post Harvest to Mills)
Downstream (wholesale, retail, supermarkets)
Significant migration rate within a household Rapid mechanization Consolidation of mills Supermarkets as outlets for rice Branding and packaging
Few local off farm jobs at the paddy producing zone Poor quality transmission along the chain High rent for paddy land Poor irrigation infrastructure High energy cost, such as high fertilizer cost, fuel cost, etc Labor shortage at peak season, like seedling transplanting, harvesting, etc Access to credit, especially
To provide information or create an information system for land rental markets Mechanization, particularly on transplanting and spraying chemicals Adoption of quality seeds, and training rice farmers in discerning seed quality Water saving technology, especially for non-irrigated paddy area or hard to irrigate areas
Paddy drying machines Energy saving technologies, especially equipment with lower electricity use rates Better equipment to improve milling rate (head rice rate) Storage facility or warehouse upgrading Services:
Multi modal transport system for food Modernizing wholesale markets and making markets acceptable near city center Services: Transportation hub with modern information sharing system Access to credit, especially for rice wholesalers to weather long waits of money from clients Provide information connecting mills and rice
Land registration to encourage the development of land rental markets Interactions between off farm employment and rice value chain development Removing pricing distortion along rice value chain for quality transmission Government rice purchase policy for reserve South-south technology exchanges and best
439

Pace of Transformation Constraints Investment Opportunities For Policy Dialogues
Upstream (inputs and Farm)
Midstream (Post Harvest to Mills)
Downstream (wholesale, retail, supermarkets)
for big specialized rice farmers Access to high value markets Lack of consumer trust
Services: Land transfer center Better transplanting machinery Mechanization services Better targeted extension services New farm organizations such as cooperative, family farm, etc
Access to credit for SME Upgrading of milling technologies Brand approval and management service Year round paddy supply for milling
traders or supermarkets practices for rice value chain development with low income countries Spur GMS rice value chain clustering
440

Table 9.2 Investment and Policy Opportunities in Rice Value Chain, India Pace of Transfor- mation
Constraints Investment Opportunities For Policy Dialogue
Upstream (inputs and Farm) Midstream (Post Harvest to Mills)
Downstream (wholesale, retail, supermarkets)
Slow to median
Low seed replacement rate Lack of water management resulting in late sowing of paddy in Kharif, which in turn leads to late sowing of wheat, thereby resulting in low yield of both crops. Depletion of ground water Poor soil fertility due to salinity, sodicity and alkalinity. Soil erosion causing loss of soil nutrients. Low level of farm mechanization Dearth of extension services Lack of timely information on government intervention in rice markets Low penetration of modern traders such as supermarkets
ICT for weather & market information Water saving technology and better irrigation facilities Promotion of nurseries to ensure timely transplanting. Integrated nutrient management to maintain soil health, balanced fertilizer application based on soil tests, green manuring as an interlude between Kharif and Rabi crop seasons. Better machinery services for harvesting, land plowing, and transplanting Better government and private extension service Alternative marketing channels ensuring timely and adequate supply of agricultural inputs. Organizing farmers together Improving farmers’ business skills
Exploiting scale of economies for traders Better storage facilities (warehouses) Encouragement of FDI on milling Access to credit for SME (traders and millers) Upgrading of milling technologies Reduce market fees.
Rice wholesale market development FDI on retailing such as entry of foreign supermarket chains Alternative marketing channels and improving market linkages Grades and standards and transmitting along rice value chain
Agriculture Marketing Act impeding growth of mid and downstream Retail market liberalization Reducing barriers on FDI in milling and retailing Rice exports Evaluating effectiveness of government subsidy on milling sector Phasing out of levy system in a systematic manner.
441

Table 9.3 Investment and Policy Opportunities in Rice Value Chain, Viet Nam
Pace of Transformation
Constraints Investment Opportunities For Policy Dialogues
Upstream (inputs and Farm)
Midstream (Post Harvest to Mills)
Downstream (wholesale, retail, supermarkets)
Mid to rapid Intensive cultivation Rapid mechanization Input price rising Consolidation of mill sector Rising wages Branding and packaging Retail system modernization Quality demand in
Land use restriction Farm gate price volatility Too many varieties used, but lack of good varieties for branding Lack of quality seeds (certified) Constraints of fertilizer and insecticide quality and high price Limited services of extension, land preparation and harvesting to farmers Climate change negative impact: more drought, flood
Research on quality varieties response to the domestic market Adoption of quality rice seeds Services of agricultural machinery (land working and harvest) Development of farmer cooperatives Drying services Farmer storage Straw processing technology
Mills upgrading, reducing the post-harvest loss Energy saving technologies Drying-Storage system River transport system Lead firm – farmer groups linkage Upgrading and organizing small traders
Food safety and green production regulations Transportation system Modernizing rice retail sectors Promote the mill's shop system Fixing the place for rice wholesale markets in the city Packaging production Branding advisory service
Policy on non conversion of paddy land Buying of buffer stock of 1 million tons Farmer income support Priority credit for all rice value chain actors Preferential taxes to exporters but not domestic traders Export quota Knowledge exchange in GMS on its wide outreach of extension services
442

Pace of Transformation
Constraints Investment Opportunities For Policy Dialogues
Upstream (inputs and Farm)
Midstream (Post Harvest to Mills)
Downstream (wholesale, retail, supermarkets)
domestic market
and salinity Lack of drying and storage capacity The milling technology is backwards Mixing rice varieties, low quality for export Lack of vertical coordination and quality control in the chain Lack of credit, low value chain finance The marketing skills of exporters is still weak Low capacity of policy realization at local level
Climate change adaptation and mitigation: information service and training Green production and low carbon rice production to be promoted
Processing bran and husk
Domestic price stabilization Lead firm-farmer groups contract farming Farmer cooperative development From farm to table food safety and quality management
443

Table 9.4 Investment and Policy Opportunities in Rice Value Chain, Lao PDR Pace of Transformation
Constraints Investment Opportunities For Policy Dialogues
Upstream (inputs and Farm)
Midstream (Post Harvest to Mills)
Downstream (wholesale, retail, supermarkets)
Pace of transformation uneven – mainly happening in the surplus regions, usually with irrigation facilities and power supply, linked to major cities or regional growth centers Commercial seeds suppliers (usually also millers), contract seed growers and many forms of contract farming
Most farmers (especially outside of major rice areas) – low inputs, low yield, low quality output – hence low income Expensive fertilizers and agro-chemicals Low incidence of double cropping (due to lack of reliable irrigation facilities) Threats of extreme weather conditions (floods and drought) Too many varieties grown, lack of good quality/certified seeds
Manufacture or local repacking of fertilizers and agro-chemicals Mechanization services, particularly for land preparation, crop establishment and harvesting (combine harvesters) Production and distribution of good quality/certified seeds (especially
Improvement in bulk handling/transport of paddy from farm to mill Upgrading or establishment of new mills – with some or all of following - dryers, milling equipment, wet polishers, length graders, color sorter, packing machines) Gasifiers, especially in areas where electricity supply is not assured
Multi or inter-modal logistics system for rice distribution domestically and for export Storage and distribution centers – including reprocessing plants for export as well as domestic modern outlets – supermarkets – certification for food safety, traceability, GMO free, organic or green food. Strategically upgrade and develop specific channels for border trade – with China, Thailand and Viet
To emphasize exports of glutinous rice or white rice in future? Strategic targeting of future markets - balanced efforts to export organic or green rice to EU (taking advantage of duty exemption under “Everything But Arms’) through ‘export corridor’ via Thailand and future export potential to China via border trade. Encourage other end uses of rice (especially exotic colored glutinous rice –
444

Pace of Transformation
Constraints Investment Opportunities For Policy Dialogues
Upstream (inputs and Farm)
Midstream (Post Harvest to Mills)
Downstream (wholesale, retail, supermarkets)
Selective mechanization (land preparation, crop establishment and harvesting) Development and transformation of rice supply chains pivoted around milling segment (both FDI and domestic investment) Increasing incidence of branded packed rice sold into supermarkets and exported to Europe
Low level of technology and weak extension service Poor milling and storage facilities(except for evolving supply chains anchored around mills) Labor shortage due to rural-urban migration High transportation costs involved for both exports as well as spatial and temporal arbitrage supply flows Land-locked country – imported inputs more expensive and export cost (transportation and export process/ documentation) higher
when anchored around mills and comprehensive supply chains) New organization of production units – contract farming (various forms), cooperatives and farmer associations Provision of short and medium term financing/credit Provision of crop or weather indexed insurance and safety net
Provision of short (for purchasing of paddy), medium (equipment) and long (lumpy investments) term financing/credit Certification for food safety, traceability, GMO free, organic or green food.
Nam Provision of financing/credit and business services
rice wine with local herbs, rice bran oil, neutraceuticals) Broaden focus of food security to include farmer incomes and commensurate returns to key stakeholders along rice supply chain Evaluate, modify (if necessary) and extend Government’s seeds and rice reserve pilot arrangement with private millers Link Lao PDR to GMS rice value chain clustering
445

References
All India Rice Exporters’ Association. n.d. State-wise Basmati Production. http://www.airea.net/page/60/statistical-data/state-wise-basmati-rice-production (accessed on 25 June 2013).
An giang Statistic Office. 2012. An giang Statistical Yearbook of 2011. Statistical Publishing House. Ha noi.
Bestari, N. J., S. Shrestha, and C.J. Mongcopa. 2006. Lao PDR: An Evaluation Synthesis on Rice. Evaluation Case Studies. Operations Evaluation Department. Manila: Asian Development Bank.
Bui, B.B. 2010. Rice-based food security in Vietnam: Past, Present and Future. In Bui, B.B., V.B. Nguyen, and C.B. Bui, eds. Vietnam: Fifty years of rice research and development. Hanoi: Agriculture Publishing House.
Can tho Statistic Office. 2012. Can Tho Statistical Yearbook, 2011. Statistical Publishing House. Ha noi.
Census of India. 2001. Provisional Population tables. www.censusindia.gov.in (accessed on 25 June 2013).
Chand, R, and S. Raju. 2009. Instability in Indian Agriculture During Different Phases of Technology and Policy. Indian Journal of Agricultural Economics. 64 (2): 187-205.
Cheng, F. 2010. How China Stabilized Grain Prices during the Global Crisis. In Dawe, ed. The Rice Crisis: Markets, Policies and Food Security, London: FAO and Earthscan.
Connell, J.G. 2011. Enhancing Milled Rice Production (EMRIP) in Lao PDR: Final Project Evaluation. Final Report prepared for European Union, SNV and Helvetas, November
Dao, T.A. 2010. The challenge of food security: towards new food policy in Vietnam. Presented at RCSD International Conference "Revisiting Agrarian Transformations in Southeast Asia: Empirical, Theoretical and Applied Perspectives," Chiang Mai, Thailand, 13-15 May.
Dao, T.A. 2010. The rice-based cropping systems in Vietnam. In Bui, B.B., V.B. Nguyen, and C.B. Bui, eds. Vietnam: Fifty years of rice research and development. Hanoi: Agriculture Publishing House.
Dao, T.T. 2001. Vietnam consecutive agrarian reforms and success of family farming. , Presentation at The Peasant Agriculture and Agrarian Reforms Workshop of the World Social Forum. IRAM - APM - CONTAG, Porto Alegre. Brazil. January.
Dao, T. A., and N. Vu. 2010. Rice production and food security policies in Vietnam. Paper presented at International Rice Research Conference (IRRC 28), Hanoi, Vietnam, 9-11 November.
446
Dao, T.H.M., V.A. Nguyen and T.M.L. Vo. 2013. The model of partnership in rice commercialization in Vietnam. Report prepared for JICA.
Dao, T.A., T.H.T. Pham and D. H. Dao. 2005. Quality and parity pricing for the Vietnamese rice market-Post harvest technology handling component under Research & Development Fund for MARD. Report prepared for DANIDA.
Dao, T.A., V.T. Trinh, and T.T. Hoang. 2005. Improvements of transferring post harvest technology and market information to farmers-Post-harvest technology handling component under Research & Development Fund for MARD. Report prepared for DANIDA.
Deininger, K. and D. Byerlee. 2011. Rising Global Interest in Farmland (Can it yield sustainable and equitable benefits?). Washington, DC: The International Bank for Reconstruction and Development/The World Bank.
Dwyer, M.B. 2011. Building the Politics Machine: Tools for Resolving the Global Land. Paper presented at the International Conference on Global Land Grabbing, the University of Sussex, Brighton, U.K., 6-8 April.
Eliste, P. and N. Santos. 2012. Lao People’s Democratic Republic Rice Policy Study. Rome: FAO.
Emerging Markets Consulting. 2011. Lao PDR Rice Sector: Scoping & Design Study of Lao PDR SME Development in Selected Agriculture Sub-sectors and Value Chains. Final Report prepared for IFC, February.
FAO. 2012. The State of Food and Agriculture 2012: Investing in Agriculture for a Better Future. Rome: FAO.
Ganesh Kumar, A., R. Mehta, H. Pullabhotla, K. Ganguly,and A. Gulati. 2011. “Demand and supply of cereals in India: 2010-2025” Draft report, IFPRI, New Delhi Office.
Global Development Solutions. 2005. Integrated Value Chain Analysis of Selected Strategic Sectors in Lao People’s Democratic Republic (prepared for The World Bank).
Goletti, F. 2002. Rice value chain study in Vietnam. Report prepared for the World Bank. Agrifood Consulting International/The World Bank.
Government of India, Central Statistics Office (Industrial Statistics Wings), Ministry of Statistics and Program Implementation, Annual Survey of Industries, 2003-04.
Government of India, Ministry of Agriculture, Indian Council of Agricultural Research, Central Rice Research Institute, Annual report, 2010-11.
Government of India, Ministry of Agriculture, Department of Agriculture and Cooperation, Agricultural Statistics at a Glance, 2012.
Government of India, Ministry of Food Processing Industries. http://mofpi.nic.in (accessed on 25 June 2013).
Government of India, Ministry of Finance, Economic Survey. 2007-08.
447

Government of India, Ministry of Statistics and Program Implementation, National Sample survey Organization, Reports on Household Consumption Expenditure, various rounds.
Government of Uttar Pradesh, Department of Agriculture. 2010. “Strategic Plan for Extending Green Revolution to Eastern Uttar Pradesh.” http://nfsm.gov.in/state_action_plans/greenup.pdf (accessed on 25 June 2013).
Gulati, A. 2010. Learning from Hybrid Rice story of China. Powerpoint presentation at the workshop on Bringing Green Revolution to Eastern India, Kolkata, 9-10 July.
Gupta, N. 2013. Government Intervention in Grain Markets in India: Rethinking the Procurement Policy. Working Paper No. 231. Centre for Development Economics. New Delhi: Delhi School of Economics.
Harriss, B. 1979. "There is Method in My Madness: Or Is It Vice Versa? Measuring Agricultural Market Performance," Food Research Institute Studies 17 (2).
Harris-White, B. 2005. Commercialisation, Commodification and Gender Relations in Post-Harvest Systems for Rice in South Asia. Economic and Political Weekly.40 (25): 2530-2542.
Hau giang Statistic Office. 2012. Hau giang Statistical Yearbook, 2011. Statistical Publishing House. Ha noi.
Hazell, P.B.R. and C. Ramasamy. 1991. The Green Revolution reconsidered: the impact of high-yielding rice varieties in South India, Baltimore: Johns Hopkins University Press.
He, Y. and Wen, C.H. 2009. The State and Development Outlook of China’s Rice Processing Industry. Science, Technology and Economy of Grain. June: 4-6.
Ho, SC. 2005. “Evolution versus tradition in marketing systems: The Hong Kong food-retailing experience.” Journal of Public Policy and Marketing 24(1): 90–99.
Hu, D.H., Reardon, T., Rozelle, S., Timmer, P. and Wang, H.L. 2004. The Emergence of Supermarkets with Chinese Characteristics: Challenges and Opportunities for China's Agricultural Development. Development Policy Review. 22(5), September: 557–586.
IFPRI.2012. ‘Land grabbing and land titling in Laos’ (Mimeo) Jaffee, S., D.A.T. Nguyen, N.Q. Nguyen, T.A. Dao, T.D. Nguyen, N.M. Nguyen, N.
Vu, and A.P. Nguyen. 2011. Moving the Goal Posts: Vietnam’s Evolving Rice Balance and Other Food Security Considerations. Presentation at The 7th ASAE Conference Meeting on the Challenges Facing Asian Agriculture and Agricultural Economics toward a Sustainable Future, Hanoi, Vietnam, 13-15 October.
Jha, S., P.V. Srinivasan, and M. Landes. 2007. Indian Wheat and Rice Sector Policies and the Implications of Reform. Economic Research Report, No. 41. Washington, DC: USDA.
Kenney-Lazar, M. 2011. Dispossession, demi-proletarianization, and enclosure: primitive accumulation and the land grab in Laos. Paper presented at the
448

International Conference on Global Land Grabbing, University of Sussex, Brighton, UK, 6-8 April.
Kumar, B. 2009. “District Model Land Use Plan; District-Allahabad, Uttar Pradesh”, report submitted to the State Land Use Board, Department of Planning, Government of Uttar Pradesh, by G.B Pant Institute of Social Science, Jhunsi, Allahabad.
Land Issues Working Group. 2012. Introduction to Lao Land Issues: Managing land, Forests and natural Resources – Growing Equity or Growing Inequity. Vientiane: Land Issues Working Group.
Le, N.D.K. 2011. Positioning strategy and solution for upgrading rice value chain in Mekong delta, Vietnam. Presentation at Vietnam Rice Symposium. Soc trang.
Le, K.N. 2003. Investment of Rice Mills in Vietnam: The Role of Financial Market Imperfections and Uncertainty. Unpublished PhD Thesis, Centre for Development Studies, University of Groningen. Groningen, forthcoming.
Lee, T. and H. Kim. 2007. An Outlook for China’s Japonica Rice Trade Position: Will It Be an Exporter or an Importer? Paper prepared for presentation at the International Agricultural Trade Research Consortium Annual Meeting, Beijing, 8–9 July.
Lele, U. 1971. Food Grain Marketing in India: Private Performance and Public Policy. Ithaca: Cornell University Press.
Lele, U.J. 1970. Modernization of the Rice Milling Industry Lessons from Past Performance, Economic and Political Weekly. V (28): 1081-1090.
Lele, U. and S. Stone. 1989. Population Pressure, the Environment and Agricultural Intensification: Variations on the Boserup Hypothesis. MADIA Discussion Paper No. 4. Washington, DC: World Bank.
Li, J.M., Y.Y. Xin, and L.P. Yuan. 2009. Pushing the Yield Frontier: Hybrid Rice in China. In D. J. Spielman and R. Pandya-Lorch, eds. Millions Fed: Proven Successes in Agricultural Development. Washington, DC: International Food Policy Research Institute.
MARD. 2010. Project Completion Report 026/05VIE: Investigation of rice kernel cracking and its control in the field and during post-harvest processes in the Mekong Delta of Vietnam-APPENDIX 1 Influence of harvesting time around grain maturity on rice cracking and head rice yield in the Mekong River Delta of Vietnam.
McKee, D. 2010. Companies Race for Rice Market Supremacy. World Grain. May: 70-76.
Mehta, M.P., and M.H. Nguyen. 2010. The rice value chain in Vietnam. Study prepared for ADB RETA 13.
Menon, M. 2001. The grain story. Business Line (Internet Edition) 2 July. http://www.thehindubusinessline.in/2001/07/02/stories/10020309.htm.
449
Ministry of Agriculture and Forestry. 2006. Diagnostic Study of the Agricultural and Agribusiness Sector. Vientiane: Ministry of Agriculture and Forestry, Lao PDR.
Ministry of Industry and Commerce, Lao PDR. 2012, Diagnostic Trade Integration Study 2012: Trade and Private Development Roadmap. Vientiane: Ministry of Commerce and Industry, Lao PDR.
Minten, B., K.A.S. Murshid, and T. Reardon. 2013. Food quality changes and implications: Evidence from the rice value chain of Bangladesh. World Development.42, February: 100-113.
Minten, B., T. Reardon, and R. Sutradhar. 2010. Food Prices and Modern Retail: The Case of Delhi. World Development.38 (12): 1775–1787.
Nguyen, N.V. 2012. Solution to improve the efficient of rice production organization in An giang. Unpublished thesis, Can tho University.
Nguyen, V.L. and D.L. Nguyen. 2012. Rice production oriented to farmer benefit. Vietnam Journal of Science for rural development. 1: 85-92.
Nguyen, H.H., V.C. Ho and V.T. Le. 2010. Evaluation of 3 reduction-3increase program in rice production. In Bui B.B., Nguyen V.B., and Bui, C.B., eds. Vietnam: Fifty years of rice research and development. Hanoi: Agriculture Publishing House.
Nguyen, D.C., H.T. Vo, and V.S. Nguyen. 2011. 4 house linkage in rice production and consumption: case study in An Giang. Science Journal. 220 – 229.
Pingali, P. and M. Rosegrant. 1995. Agricultural Commercialization and Diversification: Processes and Policies. Food Policy. 20: 171–85.
Rashid, S., A. Gulati, and S.M. Dev. 2008. Parastatals and Food Policies: the Indian Case. In Rashid, S., A Gulati, and R. Cummings, Jr., eds. From Parastatals to Private trade, Lessons from Asian Agriculture. New Delhi: Oxford University Press.
Reardon, T., C.P. Timmer, and B. Minten. 2012a. “The Supermarket Revolution in Asia and Emerging Development Strategies to Include Small Farmers,”PNAS: Proceedings of the National Academy of Science of the USA.109(31), July 31: 12332-12337.
Reardon, T., K.Z. Chen, B. Minten, and L. Adriano. 2012. The Quiet Revolution in Staple Food Value Chains in Asia: Enter the Dragon, the Elephant, and the Tiger. Manila: ADB and IFPRI.
Reardon, T. and C.P. Timmer. 2012. The Economics of the Food System Revolution. Annual Review of Resource Economics. 14: 225 -264.
Rice Knowledge Management portal. http://www.rkmp.co.in (accessed on 25 June 2013).
Schiller, J.M., M.B. Chanphengxay, B. Linquis and S.A. Rao, eds. 2006. Rice in Laos. Los Baños: IRRI.
Schoenweger, O. n.d. FDI in land and the need to establish a concession inventory: The case of Lao PDR. (Mimeo)
450

Schoenweger, O., A. Heinimann, M. Epprecht, J. Lu, and P. Thalongsengchan. 2012. Concessions and Leases in the Lao PDR: Taking Stock of Land Investments. Vientiane: Geographica Bernensia
Schoenweger, O., and A. Üllenberg. 2009. Foreign Direct Investment (FDI) in land in the Lao PDR. Eschborn: GTZ.
Setboonsarng, S., P. Leung, and A. Stefan. 2008. Rice contract farming in Lao PDR: Moving from Subsistence to Commercial Agriculture. ADB Institute Discussion paper No. 90. Manila: ADB.
Selvaraj, K.N. and C. Ramaswamy.2006. Drought, Agricultural Risk and Rural Income, Case of A Water Limiting Rice Production Environment, Tamil Nadu. Economic and Political Weekly. 41 (26): 2739-2746.
Shrestha, R. 2012. Building Independence, Income and Empowerment (BIIIE): Bi-Annual Report, 1 January – 30 June 2012. The Hague: SNV, Netherlands Development Organization.
Singh, A. 2012. Bringing Green Revolution to Eastern States of India. Powerpoint presentation at the first meeting of the first meeting of the Committee of Chief Ministers of “Bringing Green Revolution to Eastern States of India” (BGREI) Kolkata, 26 September 2012.
State-wise monthly average consumption of wheat, rice, pulses and sugar per person in rural and urban areas of India (1999-2000). http://www.indiastat.com.libproxy.ifpri.org/table/percapitaavailability/24/fooditems/103/92873/data.aspx (accessed on 25 June, 2013).
Timmer, C. Peter. 1974. "A Model of Rice Marketing Margins in Indonesia."Food Research Institute Studies 13 (2): 145-167.
Timmer, C. and D. Dawe. 2010. Food Crises Past, Present and Future: Will We Ever Learn? In Dawe, ed. The Rice Crisis: Markets, Policies and Food Security, London: FAO and Earthscan.
Tran, T.K. 2010. Export rice policies rice and problems. Proceedings of Workshop on Social Science and Sustainable Development in Mekong Delta Region, Can tho, October 28.
UNCTAD. 2009. World Investment Report 2009: Transnational Corporations, Agricultural Production and Development. Geneva: United Nations.
Vo, T.T.L., and P.S. Nguyen. 2011. Analysis of the rice value chain Mekong Delta. Science Journal. 96 - 108
Vo, T.T.L., and N.D.K. Le. 2011. Analysis of policy and strategy impact upgrading rice industry. Science Journal. 110 – 121
Wilson, A. n.d. New Approaches to Old Problems: Engaging the Private Sector to Develop the Lao Rice Sector. Vientiane: Helvetas, Laos.
The World Bank. 2007. World Development Report 2008: Agriculture for Development. Washington, DC: The International Bank for Reconstruction and Development/The World Bank.
451

Wong, L.C.Y. and E.M.A. Wai. 2013. Rapid Value Chain Assessment: Structure and Dynamics of the Rice Value Chain in Myanmar. Background Paper No. 6, USAID-MSU-MDRI ‘A Strategic Agriculture Sector and Food Security Diagnostic for Myanmar’. Background Paper prepared for USAID, March.
Yang, J., Z. Huang, X. Zhang, T. Reardon. 2013. “The Rapid Rise of Cross-Regional Agricultural Mechanization Services in PRC,” American Journal of Agricultural Economics.95(5), October.doi: 10.1093/ajae/aat027
452