
Case Studies of Rural Development and Clean Agriculture in Lao PDR
Upload
independentCategory
view
3download
0
This article appeared in a journal published by Elsevier. The attachedcopy is furnished to the author for internal non-commercial researchand education use, including for instruction at the authors institution
and sharing with colleagues.
Other uses, including reproduction and distribution, or selling orlicensing copies, or posting to personal, institutional or third party
websites are prohibited.
In most cases authors are permitted to post their version of thearticle (e.g. in Word or Tex form) to their personal website orinstitutional repository. Authors requiring further information
regarding Elsevier’s archiving and manuscript policies areencouraged to visit:
http://www.elsevier.com/copyright

Author's personal copy
Analysis of runoff production at the plot scale during a long-term surveyof a small agricultural catchment in Lao PDR
J. Patin a,⇑, E. Mouche a, O. Ribolzi b, V. Chaplot c,1, O. Sengtahevanghoung c, K.O. Latsachak c,B. Soulileuth c, C. Valentin d
a Laboratoire des Sciences du Climat et de l’ Environnement, UMR 8212, C.E. de Saclay, Orme des Merisiers, F-91190 Gif-sur-Yvette, Franceb Géosciences Environnement Toulouse, UMR 5563, Université Paul Sabatier, 14 Av. Edouard Belin, F-31400 Toulouse, Francec IRD, Ban Sisangvone, BP 5992, Vientiane, Lao PDRd Biogéochimie et écologie des milieux continentaux, UMR 7618, Université Pierre & Marie Curie, 4 Pl. Jussieu, F-75005 Paris, France
a r t i c l e i n f o
Article history:Received 23 September 2011Received in revised form 13 December 2011Accepted 14 January 2012Available online 28 January 2012This manuscript was handled byKonstantine P. Georgakakos, Editor-in-Chief,with the assistance of V. Lakshmi, AssociateEditor
Keywords:InfiltrationLand useTemporal variabilitySpatial variabilitySpatially variable infiltration modelSoil crusting
s u m m a r y
In northern Laos, small agricultural catchments are under high pressure because of the past decades ofland management policies. Although the land degradation is well documented, no clear relationshipshave been established between land use and event scale runoff and erosion. In this study, we use a simpleyet realistic model to obtain a per land use characterisation of small plot runoff production at the eventscale. Runoff produced during 7 years (2003–2009) from 1 m2 plots under different land uses is analyzedwith the spatially variable infiltration (SVI) model. This model has been recently used by different authorsto study infiltration at the plot scale under monsoon climate. It depends on rainfall intensity and a param-eter to be calibrated that we called infiltrability. This parameter is an average infiltration rate during arainfall event for given soil characteristics and a given land use. The analysis and calibration of runoff pro-duction with the SVI model led to a data set of almost 3000 infiltrability values. The statistical analysis ofthis data set with soil parameters, like surface features and slope, land use and the antecedent precipita-tion index (API), which is an indicator of soil moisture content, shows that infiltrability is strongly corre-lated with the percentage of crust and land use type. Except for certain land use like rice, the correlationwith API is not well established and it is clear that minima of infiltration are reached in the rainy seasonafter a close sequence of rainfall events and infiltrability is generally highest at the end of the dry season.Since we could not establish clear relationships between infiltrability, soil and meteorological parame-ters, we propose to consider infiltrability as a random function in space and time described, for each landuse, by a log normal probability density function.
� 2012 Elsevier B.V. All rights reserved.
1. Introduction
Natural resources in Laos have been depleted gradually bymostly human activities, the most common being deforestationthrough slash-and-burn agriculture. Steep-lands of North Laosare the most critical areas undergoing environmental changes,especially through land degradation and soil erosion (Chaplotet al., 2005b). Soil loss was estimated at 30–150 t ha�1 y�1,depending on soil characteristics, land slope, land use, and farming
systems (Chaplot et al., 2007). Soil erosion in Northern Laos hascaused a reduction in on-site fertility, and sedimentation along irri-gation canals and in reservoirs, thus reducing their life-spans(Thothong et al., 2011).
Assessment and prediction of water erosion require an accurateknowledge of runoff generation, runoff volume and rate during arainfall event. These physical processes and characteristics dependon the rainfall intensity variations during the event, land use andmany soil parameters such as soil texture, moisture content, crust-ing and slope (Bryan, 2000; Cerdan et al., 2002; Le Bissonnais et al.,2005; Valentin et al., 2004). Agricultural practices like tillage arealso known to be of importance (Chahinian et al., 2006; Yu et al.,2000).
At the plot-scale, typically 1 m2, runoff is often generated byinfiltration excess: when a rainfall event starts, soil surface isquickly saturated by rainfall infiltration and after surface satura-tion, rainfall that cannot infiltrate ponds and produces runoff. Thisprocess was described originally by Horton (1933) who proposed
0022-1694/$ - see front matter � 2012 Elsevier B.V. All rights reserved.doi:10.1016/j.jhydrol.2012.01.015
⇑ Corresponding author. Present address: Department of IntegrativeEnvironmental Sciences, Graduate School of Life and Environmental Sciences,University of Tsukuba, Tsukuba 305-8572, Japan. Tel.: +81 906 11 97603; fax: +81298 53 4226.
E-mail addresses: [email protected] (J. Patin), [email protected] (E. Mouche), [email protected] (O. Ribolzi), [email protected](V. Chaplot), [email protected] (C. Valentin).
1 Present address: School of Bioresources Engineering and EnvironmentalHydrology, University of Kwazulu-Natal, Box X01, Scottsville 3209, South Africa
Journal of Hydrology 426–427 (2012) 79–92
Contents lists available at SciVerse ScienceDirect
Journal of Hydrology
journal homepage: www.elsevier .com/ locate / jhydrol
Author's personal copy
an empirical expression for the time evolution of the infiltrationrate. Green and Ampt (1911) proposed a simple physically basedequation to describe ponded infiltration which was completed byMein and Larson (1973) for the general case of a prescribed rainfallrate. Now the infiltration excess process is classically simulated bynumerical codes solving Richard’s equation. Such a physicaldescription is adapted to ideal plots (homogeneous soil, plane sur-face, no vegetation and no changes in surface conditions) or homo-geneous soil columns used in laboratory infiltration experimentsbut it assumes that the infiltration rate tends over time to thehydraulic conductivity, whatever the rainfall rate. Field measure-ments of infiltration at the plot-scale under natural or simulatedrainfall often exhibit a dependency upon rainfall intensity, whichis inconsistent with the classical infiltration excess description(Lafforgue, 1977; Langhans et al., 2011; Van Dijk and Bruijnzeel,2004; Yu et al., 1997). Simulated rainfall experiments, for instance,show that steady state infiltration rate increases with rainfallintensity, and may tend to a plateau at high rainfall intensities(Paige et al., 2002).
Two reasons are put forth by authors to explain qualitativelythis dependency. Point infiltration rate variability and microtopog-raphy (see for instance the review by Dunne et al. (1991)). At theplot scale, crusts, vegetation cover, microtopography and theircombined effects generate a heterogeneous soil surface with awide range of infiltrability. Therefore the point infiltration rate var-ies spatially inside the plot, and only a fraction of this plot has aninfiltration rate below the rainfall rate. As a result the apparentinfiltration rate, sum of the point infiltration rates divided by theplot area, is an increasing function of the rainfall rate. Regardingthe impact of microtopography it has been observed that some ofthe rainfall water is stored in microdepressions and when rainfallrate increases this stored water may be released and routed down-slope to others micro-pools where it may infiltrate, be stored again,or routed to the plot outlet, thus producing measurable runoff(Darboux et al., 2002). Moreover, infiltration variability and micro-topography give rise to the well known runoff-runon processwhere runoff generated upslope in a low permeability area mayinfiltrate downslope in a permeable area (Hawkins and Cundy,1987; Karssenberg, 2006; Nahar et al., 2004).
Lafforgue (1977) is one of the first authors who investigatedtheoretically the role of infiltration heterogeneity on runoff pro-duction. Based on field observations made in West-Africa, he pro-posed to model the plot as a statistical set of point infiltrationrates described either by a uniform or a bimodal law. Within thisapproach he showed how the mean infiltration rate over the plotincreases with the rainfall rate. He also discussed qualitativelythe role of runon-runoff inside the plot in the effective infiltrationrate. Hawkins (1982) and Hawkins and Cundy (1987) proposedalso a similar statistical approach considering an exponential dis-tribution for the infiltration rate. Hawkins showed that infiltrationrate increases exponentially with rainfall rate and tends to a max-imum value equal to the mean statistical infiltration rate andcalled the maximum infiltration rate. Taking into account runoff-runon, he also showed how the apparent infiltration rate of anyinfiltration rate distribution is bounded by two particular casesof distribution: the first one, where the infiltration rate decreaseswith the slope, provides the minimum apparent infiltration rateand the second one, where the infiltration rate increases with theslope, provides the maximum apparent infiltration rate. Yu et al.(1997, 1998) applied successfully the model of Hawkins to bareplots under natural rainfall at six sites in tropical and subtropicalregions of Australia and Southeast Asia. They also showed that thisspatially variable infiltration (SVI) model performs better than theGreen and Ampt model (Yu, 1999). Stone et al. (2008) applied theSVI model to plots with different soil-vegetation associations un-der simulated rainfall and located in a watershed in south-eastern
Arizona. They came up with the same conclusion: SVI model per-forms better than Green and Ampt model in the interpretation ofplot hydrographs. Van Dijk and Bruijnzeel (2004) used the SVImodel to study, during a 3 year period, runoff production and ero-sion in bench-terraced agricultural steeplands in West Java. Theyshowed that whatever the rainfall event, type of land cover, mulchcover or soil compaction, the model provides a robust and accuratemethod for predicting runoff at the plot scale. To the authorsknowledge there has been no attempt to correlate, either statisti-cally or physically, the maximum infiltration rate of the SVI model,only parameter to calibrate, to the physical properties of the soiland the type of land use. In the following the term infiltrability willbe preferred to maximum infiltration rate.
The objective of this paper is to model runoff production from1 m2 plots located in a small agricultural catchment of Lao PDR,using the SVI model. Runoff volume has been measured during a7 years period (2003–2009) after each rainfall event of the rainyseason. One of the objectives of the survey was to investigate therole of slope and land use on runoff production and erosion. Someof the collected data have already been compiled to obtain meanannual runoff coefficients and erosion rates at the catchment scale(Valentin et al., 2008). Here we apply for each year, each plot andeach rainfall event the SVI model.
The set of calibrated infiltrabilities, nearly 3000 values, is ana-lyzed, in a first step, qualitatively. The time evolution along therainy season, the dependency with respect to the type of landuse and its maturity, the impact of soil surface conditions and slopeare discussed. Then, statistical relationships between soil parame-ters, like crust cover percentage, and a soil moisture indicator, theantecedent precipitation index, are investigated and established insome cases. Since no clear relationships between infiltrability, soiland meteorological parameters, could be established, we proposeto consider infiltrability as a random variable which fluctuationsin space and time are described, for each land use, by a log normalprobability density function.
2. Study area
The Houay Pano catchment is located in northern Lao PDR(Fig. 1), 10 km at the south of Luang Prabang city. The outlet is lo-cated at GPS coordinates (102�100200E; 19�5005400N). The catchmentcovers an area of 62 ha and is a tributary of the Xon stream, a sub-tributary of the Num Dong river, a Mekong tributary. Elevationranges from 400 m to 720 m and slopes are steep, from 2% to morethan 110% with a mean slope of 52%. The climate is a wet-dry mon-soon climate with an average annual rainfall of 1300 mm of which80% occurs during the rainy season from mid-May to mid-October.The geologic substrate is argillite, siltstone and fine-grained sand-stone from Permian to Upper Carboniferous Periods. The soilsdeveloped on these bedrocks are mainly Entisol, Ultisol and Alfisol(in the US Taxonomy soil classification system) that respectivelycover 20%, 30% and 50% of the catchment. Soil thickness decreasesfrom a few meters (up to 4 m) to a few tens of centimetres in theuphill direction Chaplot et al. (2005b).
The catchment is representative of south-east asia catchmentswith a typical slash and burn cropping system without industrialinputs. Approximatively 80% of the land use is rotating land. An-nual crops, mainly upland rice (Oryza sativa) or Job’s tears (Coixlacrima Jobi) are cultivated for 1 year and followed by a fallow per-iod during which secondary vegetation covers the fields. Since thecatchment was first cleared, in 1960, fallow regrowth periods havediminished from 8.6 y in 1970 to 3.2 y in 2003 (Lestrelin et al.,2005). Cash crops like teak and banana plantation now extend over15% of the catchment. Crops usually occupies back-slope and mid-slope, while the summits are under few remnants of secondary
80 J. Patin et al. / Journal of Hydrology 426–427 (2012) 79–92

Author's personal copy
forest mixed with grass and mixed deciduous and dry Dipterocarpforests. On agricultural plots, slashing generally occurs in Marchand burning in April. The soil is prepared for sowing in May bymanual and shallow tillage (0–2 cm) using a hoe. Plots are manu-ally sowed in early June and weeded throughout the growing sea-son. Full soil coverage by the crops generally occurs in August andthe harvest in September.
The site is one of the benchmark catchments of the Manage-ment of Soil Erosion Consortium (MSEC). The hydrological moni-toring of Houay Pano catchment started in 2001 and is stillongoing. The objective is to assess land use and slope effects onthe catchment hydrology and erosion (Chaplot et al., 2005b,a,2007; Dupin et al., 2009; Rumpel et al., 2006; Valentin et al., 2008).
3. Material and methods
3.1. Natural rainfall plots
From 2003 to 2009, an average of 21 runoff-collecting plots of1 m2 were set each year in the catchment. A wide variety of slopesand land uses were investigated. The plots (Fig. 2) are 1 m2 metalframe inserted into the soil at a depth of approximately 10 cm.Runoff water is collected in a tapped and buried bucket and therunoff amount is measured after each main rainfall event. Avail-able data are summarized in Table 1.
The rainfall rate was recorded by an automatic meteo stationlocated in the watershed (Fig. 1), including a 0.1 mm tipping buck-et raingauge, recording at a time-peace of 6 min. The minimalrecorded intensity is therefore 1 mm h�1.
Soil surface conditions have been characterized by the sameperson along the 7 years on each plot twice a year in July and inSeptember. He used the method proposed by Casenave andValentin (1989) and frequently used since then (Chaplot et al.,2007; Janeau et al., 2003; Podwojewski et al., 2008, 2011; De Rouwet al., 2010; Valentin et al., 2004).
The main surface types included plant residues, charcoal, freeaggregates and free gravel (i.e. not embedded in a crust) and threetypes of crust. In these soils, structural crusts result from the highpacking of highly stable micro-aggregates (Janeau et al., 2003;Ribolzi et al., 2011) and are gradually transformed into erosioncrust as a result of the compacting impact of cumulative kinetic en-ergy of raindrops and the smoothening effect of runoff. Erosioncrusts are characterized by a thin and very compacted smoothplasmic layer (Valentin and Bresson, 1992). Unlike free gravel,gravel crust is made of graved embedded in a structural or erosioncrust (Valentin and Casenave, 1992).
3.2. The spatially variable infiltration model
Following the original idea of Lafforgue (1977) and Hawkins(1982), the point infiltration rate i is distributed over the natural
Fig. 1. Location maps of the study site (Luang Prabang province, Lao PDR), altitudes in the catchment (DEM 10 m � 10 m) and localisation of permanent equipments.
J. Patin et al. / Journal of Hydrology 426–427 (2012) 79–92 81

Author's personal copy
1 m2 plot according to a distribution p(i). If the runoff-runon pro-cess is neglected the space averaged infiltration rate I(R), or appar-ent infiltration rate, can be written:
IðRÞ ¼Z
iPRRpðiÞdiþ
Zi<R
ipðiÞdi ð1Þ
where R is the rainfall intensity and p(i) the infiltration rate spatialdistribution. The first part of Eq. (1) represents infiltration in areaswhere no ponding occurs and all the rainfall flux infiltrate, while thesecond part represents areas where ponding occurs. This model rep-resents conceptually infiltration in a plot made up of parallel stripsaligned along the slope (Paige et al., 2002). Consequently, it doesnot account for the runoff-runon process (Hawkins and Cundy,1987; Nahar et al., 2004) which can be revealed with strips normalto the slope. Following Hawkins and Cundy (1987), Yu et al. (1998)and Van Dijk and Bruijnzeel (2004) p(i) is assumed to beexponential:
pðiÞ ¼ 1Im:e�i=Im ð2Þ
where Im is the mean of the exponential distribution and also themaximum infiltration rate. Im is called in the following infiltrability.This exponential function means that the population of low infiltra-bility pixels of the plot is larger than the population of high infiltra-tion pixels. According to the fact that the investigated type of soil
develops crusts this exponential function has some sense. FromEq. (1) we obtain the infiltration equation of the spatially variableinfiltration model (SVI) (Yu et al., 1997):
IðRÞ ¼ Imð1� e�R=Im Þ ð3Þ
For each rainfall event Im is computed using rainfall data with a6 min resolution. It is the unique solution of the event water bal-ance (Eq. (4)), which is solved by a Newton–Raphson algorithm:
XR2Re
ðR� IðRÞÞDt ¼ Vr ð4Þ
where Re is the rainfall event and Vr is the total runoff volume. Sincerunoff is not collected immediately after each isolated rainfallevent, all the rain falling between two volume collections is consid-ered as potentially generating runoff, within a limit of 4 d. We haveobserved that when the runoff collection interval is more than 4 d,the missed rainfall events do not produce significant runoff volumesor no runoff at all. As the runoff hydrographs are not available, thereis no routing scheme.
3.3. Modeling hypothesis
As plots are oriented in the steepest direction, a plot with a aslope under a R rainfall intensity receives an effective rainfallintensity equal to R � cos(a). Simulated rainfall experiments andfield measurements show that surface water travel times are shortand ponding time is under the 6 min resolution (Janeau et al.,2003; Ribolzi et al., 2011). It is concluded that the time lag betweenthe beginning of rainfall and runoff occurence can be neglected atthe plot-size. Surface water storage is not sizeable for steep slopegradient and was, therefore, neglected (Kirkby et al., 2002).
Canopy storage and wet-canopy-evaporation in a southeasternAsian forest with large leaves was observed to be a few millimetersfor a rainfall event (Chappell et al., 2001). Van Dijk and Bruijnzeel(2001) measured interception losses for maize, cassava and rice.They estimated canopy capacity below 0.3 mm and wet evapora-tion rate below 1 mm h�1. These quantities are not significant
Fig. 2. 1 m2 plot. (a) Design sketch and (b) with rice cover.
Table 1Summary of natural rainfall runoff plots.
Year Plots Events Slopes (%) Land usea
2003 21 34 10–65 JT2004 7 22 10–55 F2005 24 20 10–75 R, B, F, T2006 25 19 23–110 R, G, BA, P, T2007 20 19 18–64 J, PM, T2008 20 24 30–69 R, J, F, T2009 30 20 30–69 R, J, F, T
a B = bare soil, BA = banana, F = fallow, G = grass, J = jatropha, JT = job’s tears,P = bamboo, PM = paper mulberry, R = rice, T = teak.
82 J. Patin et al. / Journal of Hydrology 426–427 (2012) 79–92

Author's personal copy
compared to the measured rainfall rates and runoff volumes, and,consequently, all the associated processes have been neglected.
Computed infiltrability included every obstacle affecting infil-tration such as leaves, surface crusts or residues, as in Stoneet al. (2008) and Van Dijk and Bruijnzeel (2004). Since vegetationgrowth, crust type and crust development are not precisely knownfor each rainfall event, we studied the space and time evolution ofthe plot infiltrability, Im, as affected by these multiple parameters.
As a proxy to the soil water content, we used the antecedentprecipitation index (API) as defined by the equation (Casenaveand Valentin, 1992):
APInþ1 ¼ ðAPIn þ RnÞe�t=s ð5Þ
where APIn is the value of the index before rain n, APIn+1 the value ofthe index before rain n + 1, R the depth of rainfall n and t the num-ber of days separating rain n and rain n + 1. s is the API characteris-tic time. The API can be viewed as an indicator of the soil moistureevolution: API increases during a rainfall event and decreases expo-nentially after.
3.4. Statistical methods
Log normal distribution is common when simulating soil re-lated variables. The probability density function of a log-normaldistribution is:
f ðxÞ ¼ 1ffiffiffiffiffiffiffi2pp
rxexp
�ðlog x� lÞ2
2r2
!ð6Þ
where l and r are the mean and standard deviation of thelogarithm.
To describe the distribution of a random sample from f(x), onesolution is to consider the standard deviation and mean of the log-arithm. Nevertheless, the interpretation of data is easier in the ori-ginal unit, where the significant parameters are the medianlq = exp(l) and the geometrical standard deviation rq = exp(r).For log-normally distributed data, the interval [lq/rq; lq � rq]contains 68.3% of data (as the interval [l � r; l + r] does for nor-mally distributed data) (Limpert et al., 2001). When presenting re-sults, ‘‘±’’ will refer to the usual standard deviation, withunderlying normal or almost normal distribution assumption.When the underlying distribution is supposed to be log-normalor highly skewed ‘‘�/’’ will refer to the median and geometricaldeviation.
In order to compare the space and time evolutions of a variable,i.e. Z(x, t), Gomez et al. (2005), Starr (1990) and Vachaud et al.
(1984) proposed to consider for each position x the time evolutionof the relative deviation of the variable with respect to its spatialaverage: ðZðx; tÞ � ZðtÞÞ=ZðtÞ where ZðtÞ is the spatial average. Fol-lowing these authors, we define a time stability index k based onthe logarithm L of the infiltrability Im and defined as:
kðx; tÞ ¼ Lðx; tÞLðtÞ
� 1 where LðtÞ ¼ ð1=nÞXx¼n
x¼1
Lðx; tÞ ð7Þ
where L(x, t) denotes the value of the logarithm of the infiltrabilityIm at a field location x for a time t. The time stability index requiresthe existence of a value for each time t and location x. For a giventime, it allows to rank plot infiltrabilities and to estimate whetherthe difference of infiltrability between two plots is systematical ornot. If the logarithm L of a plot presents always the same deviationfrom the average, k is constant.
When required, an estimation of the probability density func-tion of a dataset is obtained by fitting a log-normal distributionwith the Maximum Likelihood Estimation method using R software(Ricci, 2005).
4. Experimental results
4.1. Rainfall and runoff
The average cumulated rainfall amount of the 7 years was1200 mm ± 200 mm. The cumulated rainfall in 1 year ranged from834 mm in 2009, which is a particularly dry year, to 1400 mm in2003. Monthly histograms of cumulated rainfall (Fig. 3) show var-iable patterns inside the rainy season.
Various kind of rainfall events were recorded, from short and in-tense to long and gentle. The cumulated rainfall for an event (withrunoff generation) varied from 3.3 mm to 125.9 mm. The averagerainfall intensity ranged from 5.6 mm h�1 to 61.1 mm h�1 with amean of 14.6 mm h�1. The maximum recorded rainfall intensityon a 6 min interval was 145 mm h�1 and the average maximum6 min intensity for a rainfall event was 47 mm h�1.
The runoff coefficient associated with a runoff collection is theratio of runoff and rainfall cumulated volumes. The runoff coeffi-cient is a convenient method to scale and compare runoff volumesof different rainfall events and different plots. Results for each plotand each year are summarized in Fig. 4. Runoff coefficients for fal-low, jatropha are low and with a weak dispersion of valueswhereas the coefficients for bare soil, rice or teaks, for instance,are higher and with also a higher dispersion of values.
0
50
100
150
200
250
300
Cum
ulat
ed R
ainf
all (
mm
)
Jan2003
Jul2003
Jan2004
Jul2004
Jan2005
Jul2005
Jan2006
Jul2006
Jan2007
Jul2007
Jan2008
Jul2008
Jan2009
Jul2009
1400mm 1303mm 1377mm 1235mm 1088mm 1142mm 834mm2003 2004 2005 2006 2007 2008 2009
Fig. 3. Monthly rainfall (solid line) compared with corresponding mean monthly rainfall totals between 2003 and 2009 (dashed line).
J. Patin et al. / Journal of Hydrology 426–427 (2012) 79–92 83

Author's personal copy
For a total of 2944 measurements (number of plots � numberof rainfall events) we removed 109 points with higher runoff vol-umes than rain volumes computed at the meteo station. Thosecases involved missing rainfall data, unexpectedly high rainfall
variability and water intake into the collecting buckets. Thehighest runoff coefficient was observed under teak cover in2009 (99%), while the lowest is observed under grass cover(0.6%).
0.0
0.2
0.4
0.6
0.8
1.0
JT10
JT15
JT20
JT25
JT30
JT35
JT40
JT45
JT50
JT55
JT60
JT65
2003
0.0
0.2
0.4
0.6
0.8
1.0
FA10FA25
FA40FA55
2004
0.0
0.2
0.4
0.6
0.8
1.0
1T10
2T10
3T10
1T45
2T45
3T45 B10 B25 B40 B55 B70 C10 C25 C40
1C45
2C45
3C45 C55 C70 F10 F25 F40 F55 F70
2005
0.0
0.2
0.4
0.6
0.8
1.0
B25 B45 B65 B85B10
5G25 G45 G65 G85
G105
P25 P45 P65 P85P10
5R25 R45 R65 R85
R105
T25 T45 T65 T85T10
5
2006
0.0
0.2
0.4
0.6
0.8
1.0
JP1
JP2
JP3
JP4
JP5
JP6
JP7
JP8
JP9PM1
PM2PM3
PM4PM5
PM6PM7
PM8PM9
YT1YT2
YT3YT4
YT5YT6
OT1OT2
OT3OT4
OT5OT6
2007
0.0
0.2
0.4
0.6
0.8
1.0
FA11FA12
FA13FA21
FA22FA23
FA31FA32
FA33FA41
FA42FA43
JPC1
JPC2
JPC3
JPE1
JPE2
JPE3
JPS1
JPS2
JPS3 R1 R2 R3
OT1OT2
OT3OT4
OT5OT6
2008
0.0
0.2
0.4
0.6
0.8
1.0
FA11FA12
FA13FA21
FA22FA23
FA31FA32
FA41FA42
FA43JP
C1JP
C2JP
C3JP
E1JP
E2JP
E3JP
S1JP
S2JP
S3 R1 R2 R3OT1
OT2OT3
OT4OT5
OT6
2009
22
Fig. 4. Runoff coefficient by plot. The box represents 50% of the data between the 25th and the 75th percentile, the line indicates the median and whiskers the extrema.Names refer to the experimental plot naming convention with R = rice, B = bare soil, F = fallow, OT = old teak, YT = young teak, P = bamboo, BA = banana, J = jatropha,PM = paper mulberry.
84 J. Patin et al. / Journal of Hydrology 426–427 (2012) 79–92

Author's personal copy
4.2. Surface features
All plots together, structural crusts and erosion crusts ac-counted in average for respectively 29% ± 25.6% and 4% ± 1.7% ofplot’s surface. Surface features of each land use are given in Table2. Structural crusts are the most widely observed crusts, they occu-py more than half the ground surface under teak, job’s tears andbare soil plots. Erosion crusts are mainly observed on bare soilplots, where they occupy up to 15% of the surface. Organic residuesare unequally observed because they are partly removed from cul-tivated plots.
5. Statistical analysis of infiltrabilities Im
For each plot and each rainfall event, from 2003 to 2009, thecollected runoff volume together with the rainfall data were usedto solve Eq. (4).
5.1. Yearly values of infiltrability
Infiltrabilities are pooled by land use for each year (Table 3). Thedistributions of Im with a standard deviation higher than the meandid not follow a normal distribution. A Tukey test, performed onthe logarithm of Im, showed that infiltrability values could be clas-sified into at least three groups of land use. The lowest infiltrabil-ities were observed for teak and bare soil plots (around 10 �/4 mm h�1). Fallow and Jatropha plots had the highest infiltrabili-ties (up to 140 �/ 2.5 mm h�1).
Plots were identical in 2008 and 2009 but infiltrability was sig-nificantly higher in 2009 for Rice, Fallow and Jatropha (t test,a = 0.05). This increase of infiltrability, due to a particularly lowrainfall amount in 2009, was not observed for the teak plots.
5.2. Intra-annual temporal variability of infiltrability
Infiltrabilities were pooled by land use for each rainfall event inorder to obtain the temporal evolution of the median value and itsgeometrical deviation (Fig. 5). We observed first that the Im distri-butions for bare soil, job’s tears and rice presented a small geomet-rical deviation for a given rainfall event. Infiltrability for bamboo orbanana plots was highly variable. During certain periods of theyear the variations of infiltrability were synchronous for all theinvestigated land uses. As an illustration, infiltrability in 2005 de-creased in four rainfall events from its highest value on day 200to its smallest value on day 210. Nevertheless, no apparent rainfallcharacteristics (maximum intensity, mean intensity, total volume,duration) was significantly correlated to infiltrabilities.
For most land uses Fig. 5 shows that minima of infiltration werereached during the rainy season after a close sequence of rainfallevents and infiltrability was generally highest at the end of the dryseason. The antecedent precipitation index was partially correlatedto the infiltrabilities of some land uses. For rice plots a significantcorrelation was established between Im and the API20d(log(Im) =10 � 1.52 log(API20d), R2 = 0.4), where API20d means that s = 20 d inEq. (5). Only poor correlations were obtained with the other landuses (second best fit with fallow plots: log(Im) = 11 � 1.5 log(API20d),R2 = 0.2).
The time stability of infiltrability defined by Eq. (7) for a givenland use, relatively to the other ones, has been investigated from2005 to 2009 (Fig. 6) (only one land use was investigated in2003 and 2004). Only rainfall events with no missing values wereselected, which reduce the dataset by 20%.
Infiltrability was stable with time for almost all selected eventsand plots. Nevertheless, we could not distinguish old teaks fromfallow in 2005 although their infiltrability was higher than rice
and bare plots. Grass infiltrated more than bamboo, banana andrice in 2006, and young teaks exhibited the lowest infiltrabilities.All land uses were well discriminated in 2007. Young teaks alwaysinfiltrated more than old teaks. In 2008 and 2009, jatropha and fal-low showed higher infiltrabilities than rice. Old teaks had again thelowest infiltrability. Plots with high vegetation cover like teaks andfallow had the most scattered deviation from the mean.
5.3. Slope effect on infiltrability
There are not enough replicates of plots with the same slopeand the same land use, to decide, in a satisfying statistical manner,whether slope has an impact or not. Therefore we assumed thatrainfall events could be considered as temporal replicates, i.e. thatspatial sampling over replicates for a given rainfall event is equiv-alent to temporal sampling over rainfall events on the same plot.We used the k stability index of each plot (Eq. (7)) to investigatethe effect of slope on infiltration for a given land use. Fig. 7 pre-sents the stability indexes for different land uses from 2003 to
Table 2Soils characteristics by land use in percentage of the plot surface.
Land use STa ± sd EROa ± sd REa ± sd CCa ± sd
Grass 3 ± 5 0 ± 0 72 ± 26 0 ± 0Paper mulberry 10 ± 8 0 ± 1 7 ± 9 1 ± 1Jatropha 14 ± 17 0 ± 0 3 ± 6 19 ± 22Bamboo 18 ± 11 0 ± 1 45 ± 31 42 ± 48Fallow 20 ± 24 1 ± 5 31 ± 34 0 ± 0Banana 29 ± 12 0 ± 0 2 ± 2 30 ± 19Young teak 30 ± 28 1 ± 1 4 ± 6 27 ± 25Rice 45 ± 24 2 ± 3 2 ± 3 5 ± 7Old teak 46 ± 32 2 ± 2 34 ± 36 81 ± 17Job’s tears 49 ± 20 3 ± 3 2 ± 1 2 ± 2Bare soil 62 ± 9 7 ± 4 1 ± 0 0 ± 0
a ST: structural crust, ERO: erosion crust, RE: residue, CC: cultivated cover.
Table 3Computed infiltrability Im by year and by land use.
Year typea Im ± sd (mm/h) Im �/ gd (mm/h) Nb obs
2003 JT 130 ± 309 60.5 �/ 2.81 374
2004 F 23 ± 26 14.3 �/ 2.79 123
2005 R 23 ± 26 15 �/ 2.54 158B 20 ± 31 10.2 �/ 2.97 97F 80 ± 69 52.5 �/ 3.04 123OT 118 ± 180 45.2 �/ 4.78 114
2006 Rb 31 ± 45 14 �/ 4.74 77G 164 ± 179 110 �/ 2.85 95BA 87 ± 181 36.7 �/ 3.67 84Pb 54 ± 129 10.2 �/ 5.82 63YTb 23 ± 25 11.6 �/ 3.54 69
2007 J 172 ± 212 118 �/ 3.31 139PMb 154 ± 338 70.6 �/ 4.28 127OT 41 ± 91 13.1 �/ 4.62 89YTb 89 ± 74 74 �/ 2.29 101
2008 R 24 ± 24 20.8 �/ 2.11 49Jb 138 ± 202 75.7 �/ 3.21 164Fb 119 ± 143 84.6 �/ 2.77 193OT 17 ± 26 8.23 �/ 3.8 90
2009 R 47 ± 51 32.6 �/ 2.86 56Jb 156 ± 172 124 �/ 2.42 141Fb 176 ± 168 144 �/ 2.56 193OT 19 ± 28 9.85 �/ 3.61 90
a B = bare soil, BA = banana, F = fallow, G = grass, J = jatropha, JT = job’s tears,OT = old teak, P = bamboo, PM = paper mulberry, R = rice, YT = young teak.
b Nonsignificantly different means for different land uses on a given year, Tukeytest on log (Im) (a = 0.05).
J. Patin et al. / Journal of Hydrology 426–427 (2012) 79–92 85

Author's personal copy
2009. We considered only the land uses for which the runoffproduction had been measured for all rainfall events and all slopes.Since data used to compute the k index were not issued from
spatial replicates but from time replicates, conclusions should becarefully drawn, because slope effect was mixed with the spatialvariability of infiltrability and rainfall characteristics. We observe
Fig. 5. Mean and standard deviation of the log of Im by land use and by year, as a function of time (day of year).
86 J. Patin et al. / Journal of Hydrology 426–427 (2012) 79–92

Author's personal copy
the following trend: infiltrability decreased when slope increasedup to approximatively 50%, and increased with slope for steeperslopes (>50%). This trend was clearly observed for fallow plots in2008 and 2009, while undetectable for teak plots.
5.4. Effect of surface features on infiltrability
The Pearson correlation coefficient was computed between themain measured surface features, transformed so that their distri-bution was close to a normal distribution, and the computed infil-trability (Table 4). Surface features (percents) were normalizedusing the arcsinus of the square root (Quinn and Keough, 2002).
Infiltrability appeared highly correlated to surface features andthe strongest correlation was observed with the total crust per-centage ðlogðImÞ ¼ �43:31 sin�1ð
ffiffiffiffiffiffiffiffiffiffiffiffiffiffiffiffiffiffiffiffiffiffiffiTotalCrustp
Þ þ 6:66;R2 ¼ 0:53Þ.The total crust percentage was significantly correlated to all theother surface features.
We plot in Fig. 8 the median infiltrability of each land use andthe crust percentage as a function of land use, and in Fig. 9 themedian of infiltrability for all the plots as a function of crust per-centage. Infiltrability clearly decreases when crust percentage in-creases. Fig. 8 allowed a ranking of the land uses as a function ofinfiltrability.
5.5. Infiltrability probability density function per land use
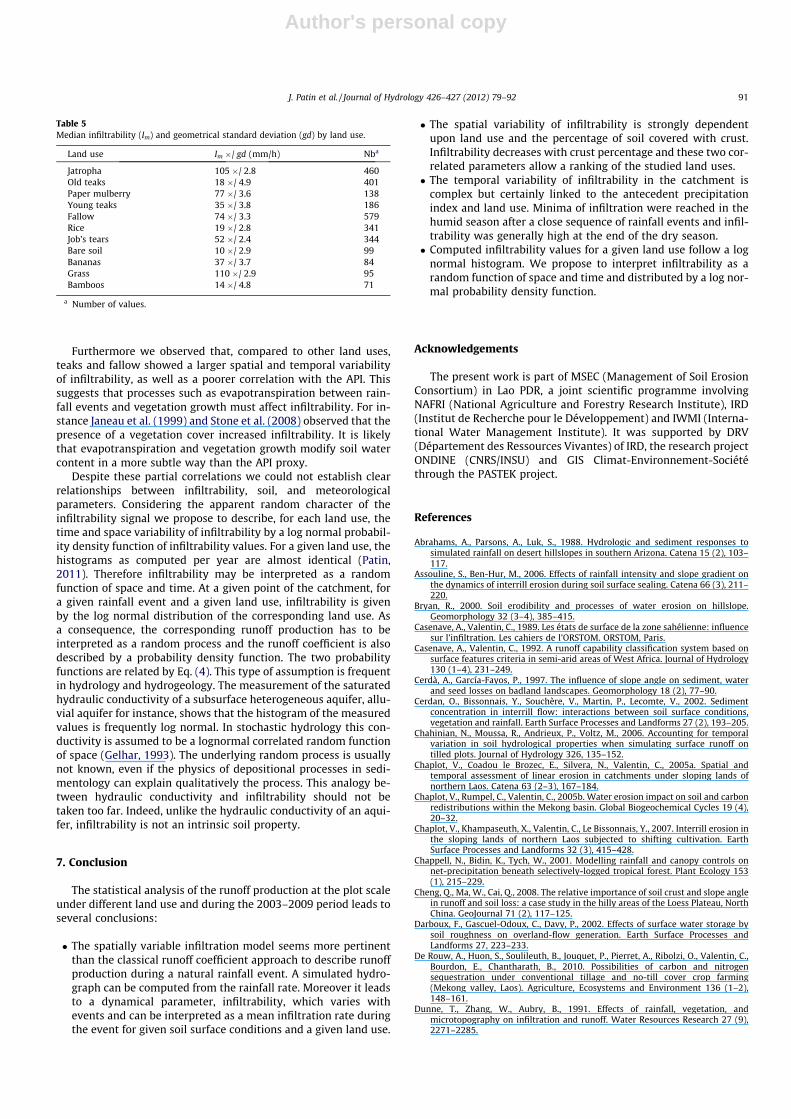
In this catchment, soil crusting appeared as a major controlingfactor of infiltration. This crusting varied with the land use, whichtherefore could be as such used to determine infiltrability. Figs. 10and 11 show for each land use the histogram of the logarithm ofinfiltrability values and the best fit obtained with a log normal dis-tribution. The mean and standard deviation of each distribution isgiven in Table 5. All the 2003–2009 values have been incorporatedin these histograms.
6. Discussion
6.1. Slope
Slope effect on infiltration has mostly been studied for slopes ofless than 30%, with contradictory results. Some authors found no
influence (Cerdà and García-Fayos, 1997; Mah et al., 1992), othersfound that either infiltration decreases with slope (Cheng et al.,2008; Essig et al., 2009; Fox et al., 1997), or infiltration increaseswith slope (Abrahams et al., 1988; Assouline and Ben-Hur, 2006).In the Houay Pano catchment, Ribolzi et al. (2011) showed thatinfiltration on a steep slope (75%) bare soil plot is higher than infil-tration on a lower slope (30%) plot.
Similar results had been obtained in Thailand with 15 plotsinstalled on slopes varying from 16% to 63% (Janeau et al., 2003).This has been ascribed to a lesser development of surface crustson bare soils that received a lower kinetic energy for steep slopesdue to the angle of rainfall impact. We studied a broad band ofslopes and observed for some land uses both a diminution of infil-trability with slope for gentle slopes, and an increase of infiltrabil-ity with slope for slope over 50%. Here, the observed threshold of50% might be due to two opposite trends: when the soil is covered,at least partly, with vegetation, crust cover remains limited andinfiltration can decrease normally with increasing slope. Whenthe soil is bare, the counterintuive relationship is observed dueto lesser development of crust for steep slope. Further multivari-ables analyses should be conducted to analyse the impact of slopemore thoroughly.
6.2. Land uses and crusts
Simulated rainfall experiments conducted in 2007 on differentreplicas of bare soil plots showed that the long term infiltration rateincreased with the rainfall rate (Patin, 2011). Moreover for a givenrainfall rate this infiltration rate was varying from one replica to an-other one, indicating a scale of variability of the soil hydraulic con-ductivity greater than the plot scale. The variability of runoffresponse showed that, for a given land use, one square meter isnot large enough to sample all the infiltrability variability. Thereforerunoff response (and its associated infiltrability) was not stationaryin space at this scale and for a given time in the year. The question ofwhether infiltrability becomes stationary at larger scales or not isdebatable. The infiltrability variability is mainly influenced by soilsurface conditions, particularly crusts percentage which is itselfcontrolled by land use. This is very important because in most cases,infiltrability prediction is based on soil characteristics withoutaccounting for crusting. Since it is difficult to predict crusting using
Fig. 6. Boxplot by land use of the intertemporal relative deviation from the mean spatial value of the log of infiltrability. The box represents 50% of the data between the 25thand the 75th percentile, the line indicates the median and whiskers the extrema, the points indicates outliers. R = rice, B = bare soil, F = fallow, OT = old teak, YT = young teak,P = bamboo, BA = banana, J = jatropha, PM = paper mulberry.
J. Patin et al. / Journal of Hydrology 426–427 (2012) 79–92 87

Author's personal copy
laboratory tests (Chaplot et al., 2007), and because there is a veryclear relationship between land use and crusts, it seems more reli-able to associate infiltrability to land uses. In this respect, Table 5provides useful information for policy makers. Although in northernLaos the farmers are encouraged through a tax policy to convert theirannual crops (upland rice, Job’s tears) and fallow to teak, deciders
should consider that this land use generates high runoff especiallywhen it is over 10 years (what is referred to here as ‘old teaks’).Similarly, bamboo (here Dendrocalamus sp. and Cephalostachiumvirgatum), which is often promoted by Non-Governmental Organi-sations as a good sediment filter (e.g. Schoonover et al., 2006) wasfound in this study as associated with low infiltrability. By far, the
Fig. 7. Stability index k of the log of infiltrability by land use and year as a function of slope (%). Bars indicate confidence interval of the mean at 90%.
88 J. Patin et al. / Journal of Hydrology 426–427 (2012) 79–92

Author's personal copy
highest infiltrability was observed by native grass but it is of loweconomical interest. Cattle would damage land through tramplingin this very steepy environment (Van Lynden and Oldeman, 1997).More promising in terms of infiltrability are paper mulberry andJatropha curcas, but the latter has been deceiving in terms of grainyields and oil production.
6.3. Hydrology
Gomez et al. (2001) demonstrated that 50% of spatial variationin plot infiltration and runoff can be explained by spatial variabilityof the saturated hydraulic conductivity, the surface storage and thedepth to claypan. The remaining 50%, being explained by variabil-ity in rainfall, measurement error in runoff, and simplification intheir model (layered crusting Green and Ampt).
Stability index of infiltrability was mostly stable over time,which means that infiltration increased or decreased synchronical-ly in all plots. Nevertheless, we were not able to determine theexternal factors responsible for this synchronicity. The antecedentprecipitation index, which can be considered as an indicator of soilmoisture content, could not be correlated to this infiltrability var-iability, except in some cases like rice. Runoff volumes were col-lected within an interval of 1 d up to several days and manyshort rainfall sequences could have occured within a day, whereasthe computed infiltrability was a mean infiltrability over the inter-val. Thus, infiltrability may not have reflected the runoff produc-tion during these short events, and as a consequence, could notbe correlated to API.
Table 4Correlation (Pearson r coefficient) between main surface features and infiltrability.
log(Im) Total crust Residues Worm cast Algae Mosses Cultivated cover Weed covers
log(Im)Total crust �0.73⁄⁄⁄
Residues 0.06 �0.34⁄⁄⁄
Worm cast 0.33⁄⁄⁄ �0.43⁄⁄⁄ 0.52⁄⁄⁄
Algae �0.12 0.34⁄⁄⁄ �0.15 0.01Mosses �0.32⁄⁄⁄ 0.24⁄⁄ 0.04 0.20⁄ 0.33⁄⁄⁄
Cultivated cover �0.37⁄⁄⁄ 0.21⁄ 0.33⁄⁄⁄ �0.10 0.12 0.30⁄⁄⁄
Weed cover 0.52⁄⁄⁄ �0.59⁄⁄⁄ 0.14 0.60⁄⁄⁄ �0.15 0.08 �0.48⁄⁄⁄
Pedestal cover �0.43⁄⁄⁄ 0.43⁄⁄⁄ �0.19⁄ �0.18⁄ 0.20⁄ 0.39⁄⁄⁄ 0.19⁄ �0.17
Nothing is added when the correlation coefficient is not statistically significant.⁄ p < 0.05.⁄⁄ p < 0.01.⁄⁄⁄ p < 0.001.
Fig. 8. Infiltrability and crust percentage as a function of land use.
Fig. 9. Median annual infiltrability as a function of the mean crust percentage. Allthe plots are considered.
J. Patin et al. / Journal of Hydrology 426–427 (2012) 79–92 89

Author's personal copy
Fig. 10. Histograms of the infiltrability values and fitted log-normal probability density functions. The black arrow on the infiltrability axis indicates the median value and thegrey arrows the geometrical deviations.
Fig. 11. Histograms of the infiltrability values and fitted log-normal probability density functions. The black arrow on the infiltrability axis indicates the median value and thegrey arrows indicates the interval enclosed by geometrical deviations.
90 J. Patin et al. / Journal of Hydrology 426–427 (2012) 79–92
Author's personal copy
Furthermore we observed that, compared to other land uses,teaks and fallow showed a larger spatial and temporal variabilityof infiltrability, as well as a poorer correlation with the API. Thissuggests that processes such as evapotranspiration between rain-fall events and vegetation growth must affect infiltrability. For in-stance Janeau et al. (1999) and Stone et al. (2008) observed that thepresence of a vegetation cover increased infiltrability. It is likelythat evapotranspiration and vegetation growth modify soil watercontent in a more subtle way than the API proxy.
Despite these partial correlations we could not establish clearrelationships between infiltrability, soil, and meteorologicalparameters. Considering the apparent random character of theinfiltrability signal we propose to describe, for each land use, thetime and space variability of infiltrability by a log normal probabil-ity density function of infiltrability values. For a given land use, thehistograms as computed per year are almost identical (Patin,2011). Therefore infiltrability may be interpreted as a randomfunction of space and time. At a given point of the catchment, fora given rainfall event and a given land use, infiltrability is givenby the log normal distribution of the corresponding land use. Asa consequence, the corresponding runoff production has to beinterpreted as a random process and the runoff coefficient is alsodescribed by a probability density function. The two probabilityfunctions are related by Eq. (4). This type of assumption is frequentin hydrology and hydrogeology. The measurement of the saturatedhydraulic conductivity of a subsurface heterogeneous aquifer, allu-vial aquifer for instance, shows that the histogram of the measuredvalues is frequently log normal. In stochastic hydrology this con-ductivity is assumed to be a lognormal correlated random functionof space (Gelhar, 1993). The underlying random process is usuallynot known, even if the physics of depositional processes in sedi-mentology can explain qualitatively the process. This analogy be-tween hydraulic conductivity and infiltrability should not betaken too far. Indeed, unlike the hydraulic conductivity of an aqui-fer, infiltrability is not an intrinsic soil property.
7. Conclusion
The statistical analysis of the runoff production at the plot scaleunder different land use and during the 2003–2009 period leads toseveral conclusions:
� The spatially variable infiltration model seems more pertinentthan the classical runoff coefficient approach to describe runoffproduction during a natural rainfall event. A simulated hydro-graph can be computed from the rainfall rate. Moreover it leadsto a dynamical parameter, infiltrability, which varies withevents and can be interpreted as a mean infiltration rate duringthe event for given soil surface conditions and a given land use.
� The spatial variability of infiltrability is strongly dependentupon land use and the percentage of soil covered with crust.Infiltrability decreases with crust percentage and these two cor-related parameters allow a ranking of the studied land uses.� The temporal variability of infiltrability in the catchment is
complex but certainly linked to the antecedent precipitationindex and land use. Minima of infiltration were reached in thehumid season after a close sequence of rainfall events and infil-trability was generally high at the end of the dry season.� Computed infiltrability values for a given land use follow a log
normal histogram. We propose to interpret infiltrability as arandom function of space and time and distributed by a log nor-mal probability density function.
Acknowledgements
The present work is part of MSEC (Management of Soil ErosionConsortium) in Lao PDR, a joint scientific programme involvingNAFRI (National Agriculture and Forestry Research Institute), IRD(Institut de Recherche pour le Développement) and IWMI (Interna-tional Water Management Institute). It was supported by DRV(Département des Ressources Vivantes) of IRD, the research projectONDINE (CNRS/INSU) and GIS Climat-Environnement-Sociététhrough the PASTEK project.
References
Abrahams, A., Parsons, A., Luk, S., 1988. Hydrologic and sediment responses tosimulated rainfall on desert hillslopes in southern Arizona. Catena 15 (2), 103–117.
Assouline, S., Ben-Hur, M., 2006. Effects of rainfall intensity and slope gradient onthe dynamics of interrill erosion during soil surface sealing. Catena 66 (3), 211–220.
Bryan, R., 2000. Soil erodibility and processes of water erosion on hillslope.Geomorphology 32 (3–4), 385–415.
Casenave, A., Valentin, C., 1989. Les états de surface de la zone sahélienne: influencesur l’infiltration. Les cahiers de l’ORSTOM. ORSTOM, Paris.
Casenave, A., Valentin, C., 1992. A runoff capability classification system based onsurface features criteria in semi-arid areas of West Africa. Journal of Hydrology130 (1–4), 231–249.
Cerdà, A., García-Fayos, P., 1997. The influence of slope angle on sediment, waterand seed losses on badland landscapes. Geomorphology 18 (2), 77–90.
Cerdan, O., Bissonnais, Y., Souchère, V., Martin, P., Lecomte, V., 2002. Sedimentconcentration in interrill flow: interactions between soil surface conditions,vegetation and rainfall. Earth Surface Processes and Landforms 27 (2), 193–205.
Chahinian, N., Moussa, R., Andrieux, P., Voltz, M., 2006. Accounting for temporalvariation in soil hydrological properties when simulating surface runoff ontilled plots. Journal of Hydrology 326, 135–152.
Chaplot, V., Coadou le Brozec, E., Silvera, N., Valentin, C., 2005a. Spatial andtemporal assessment of linear erosion in catchments under sloping lands ofnorthern Laos. Catena 63 (2–3), 167–184.
Chaplot, V., Rumpel, C., Valentin, C., 2005b. Water erosion impact on soil and carbonredistributions within the Mekong basin. Global Biogeochemical Cycles 19 (4),20–32.
Chaplot, V., Khampaseuth, X., Valentin, C., Le Bissonnais, Y., 2007. Interrill erosion inthe sloping lands of northern Laos subjected to shifting cultivation. EarthSurface Processes and Landforms 32 (3), 415–428.
Chappell, N., Bidin, K., Tych, W., 2001. Modelling rainfall and canopy controls onnet-precipitation beneath selectively-logged tropical forest. Plant Ecology 153(1), 215–229.
Cheng, Q., Ma, W., Cai, Q., 2008. The relative importance of soil crust and slope anglein runoff and soil loss: a case study in the hilly areas of the Loess Plateau, NorthChina. GeoJournal 71 (2), 117–125.
Darboux, F., Gascuel-Odoux, C., Davy, P., 2002. Effects of surface water storage bysoil roughness on overland-flow generation. Earth Surface Processes andLandforms 27, 223–233.
De Rouw, A., Huon, S., Soulileuth, B., Jouquet, P., Pierret, A., Ribolzi, O., Valentin, C.,Bourdon, E., Chantharath, B., 2010. Possibilities of carbon and nitrogensequestration under conventional tillage and no-till cover crop farming(Mekong valley, Laos). Agriculture, Ecosystems and Environment 136 (1–2),148–161.
Dunne, T., Zhang, W., Aubry, B., 1991. Effects of rainfall, vegetation, andmicrotopography on infiltration and runoff. Water Resources Research 27 (9),2271–2285.
Table 5Median infiltrability (Im) and geometrical standard deviation (gd) by land use.
Land use Im �/ gd (mm/h) Nba
Jatropha 105 �/ 2.8 460Old teaks 18 �/ 4.9 401Paper mulberry 77 �/ 3.6 138Young teaks 35 �/ 3.8 186Fallow 74 �/ 3.3 579Rice 19 �/ 2.8 341Job’s tears 52 �/ 2.4 344Bare soil 10 �/ 2.9 99Bananas 37 �/ 3.7 84Grass 110 �/ 2.9 95Bamboos 14 �/ 4.8 71
a Number of values.
J. Patin et al. / Journal of Hydrology 426–427 (2012) 79–92 91

Author's personal copy
Dupin, B., De Rouw, A., Phantahvong, K., Valentin, C., 2009. Assessment of tillageerosion rates on steep slopes in northern laos. Soil and Tillage Research 103 (1),119–126.
Essig, E., Corradini, C., Morbidelli, R., Govindaraju, R., 2009. Infiltration and deepflow over sloping surfaces: comparison of numerical and experimental results.Journal of Hydrology 374 (1–2), 30–42.
Fox, D., Bryan, R., Price, A., 1997. The influence of slope angle on final infiltrationrate for interrill conditions. Geoderma 80 (1–2), 181–194.
Gelhar, L., 1993. Stochastic Subsurface Hydrology. Prentice-Hall Inc., EnglewoodCliffs, NJ.
Gomez, J., Nearing, M., Giraldez, J., Alberts, E., 2001. Analysis of sources of variabilityof runoff volume in a 40 plot experiment using a numerical model. Journal ofHydrology 248 (1–4), 183–197.
Gomez, J., Vanderlinden, K., Nearing, M., 2005. Spatial variability of surfaceroughness and hydraulic conductivity after disk tillage: implications forrunoff variability. Journal of Hydrology 311 (1–4), 143–156.
Green, W., Ampt, G., 1911. Studies on soil physics, 1. The flow of air and waterthrough soils. Journal of Agricultural Science 4 (1), 1–24.
Hawkins, R., 1982. Interpretations of source area variability in rainfall-runoffrelations. In: Singh, V.P. (Ed.), Rainfall-Runoff Relationship. Water ResourcesPublications, Fort Collins, CO, pp. 303–324.
Hawkins, R., Cundy, T., 1987. Steady-state analysis of infiltration and overland flowfor spatially-varied hillslopes. Journal of the American Water ResourcesAssociation 23, 251–256.
Horton, R., 1933. The role of infiltration in the hydrologic cycle. Transactions of theAmerican Geophysical Union 14, 446–460.
Janeau, J., Mauchamp, A., Tarin, G., 1999. The soil surface characteristics ofvegetation stripes in Northern Mexico and their influences on the systemhydrodynamics: an experimental approach. Catena 37 (1–2), 165–173.
Janeau, J., Bricquet, J., Planchon, O., Valentin, C., 2003. Soil crusting and infiltrationon steep slopes in northern Thailand. European Journal of Soil Science 54 (3),543–554.
Karssenberg, D., 2006. Upscaling of saturated conductivity for Hortonian runoffmodelling. Advances in water resources 29 (5), 735–759.
Kirkby, M., Bracken, L., Reaney, S., 2002. The influence of land use, soils andtopography on the delivery of hillslope runoff to channels in SE Spain. EarthSurface Processes and Landforms 27 (13), 1459–1473.
Lafforgue, A., 1977. Inventaire et examen des processusélémentaires deruissellement et d’infiltration sur parcelles: application à une exploitationméthodique des données obtenues sous pluies simulées. Cahiers-ORSTOM.Hydrologie 14, 299–344.
Langhans, C., Govers, G., Diels, J., Leys, A., Clymans, W., Van en Putte, A., Valckx, J.,2011. Experimental rainfall-runoff data: reconsidering the concept ofinfiltration capacity. Journal of Hydrology 399 (3–4), 255–262.
Le Bissonnais, Y., Cerdan, O., Lecomte, V., Benkhadra, H., Souchère, V., Martin, P.,2005. Variability of soil surface characteristics influencing runoff and interrillerosion. Catena 62 (2–3), 111–124.
Lestrelin, G., Giordano, M., Keohavong, G., 2005. Whenconservation’’ Leads to LandDegradation: Lessons from Ban Lak Sip, Laos. IWMI.
Limpert, E., Stahel, W., Abbt, M., 2001. Log-normal distributions across the sciences:keys and clues. BioScience 51 (5), 341–352.
Mah, M., Douglas, L., Ringrose-Voase, A., 1992. Effects of crust development andsurface slope on erosion by rainfall. Soil Science 154 (1), 37.
Mein, R., Larson, C., 1973. Modeling infiltration during a steady rain. WaterResources Research 9 (2), 384–394.
Nahar, N., Govindaraju, R., Corradini, C., Morbidelli, R., 2004. Role of run-on fordescribing field-scale infiltration and overland flow over spatially variable soils.Journal of Hydrology 286 (1–4), 36–51.
Paige, G., Stone, J., Guertin, D., Lane, L., 2002. A strip model approach toparameterize a coupled Green–Ampt kinematic wave model. Journal of theAmerican Water Resources Association 38 (5), 1363–1377.
Patin, J., 2011. Modeling Approaches for Runoff-infiltration Partition at DifferentSpatial and Temporal Scales. The Thies Plot in Sénégal and the Houay PanoCatchment in Lao PDR. Ph.D. Thesis, Institut National Polytechnique de Lorraine,Nancy (in French).
Podwojewski, P., Orange, D., Jouquet, P., Valentin, C., Nguyen, V., Janeau, J., Tran, D.,2008. Land-use impacts on surface runoff and soil detachment withinagricultural sloping lands in Northern Vietnam. Catena 74 (2), 109–118.
Podwojewski, P., Janeau, J., Grellier, S., Valentin, C., Lorentz, S., Chaplot, V., 2011.Influence of grass soil cover on water runoff and soil detachment under rainfallsimulation in a sub-humid south african degraded rangeland. Earth SurfaceProcesses and Landforms.
Quinn, G., Keough, M., 2002. Experimental Design and Data Analysis for Biologists.Cambridge Univ Pr.
Ribolzi, O., Patin, J., Bresson, L., Latsachack, K., Mouche, E., Sengtaheuanghoung, O.,Silvera, N., Thiebaux, J., Valentin, C., 2011. Impact of slope gradient on soilsurface features and infiltration on steep slopes in northern Laos.Geomorphology 127 (1–2), 53–63.
Ricci, V., 2005. Fitting Distributions with R. R Project <http://cran.r-project.org/doc/contrib/Ricci-distributions-en.pdf>.
Rumpel, C., Alexis, M., Chabbi, A., Chaplot, V., Rasse, D., Valentin, C., Mariotti, A.,2006. Black carbon contribution to soil organic matter composition in tropicalsloping land under slash and burn agriculture. Geoderma 130 (1–2), 35–46.
Schoonover, J., Williard, K., Zaczek, J., Mangun, J., Carver, A., 2006. Agriculturalsediment reduction by giant cane and forest riparian buffers. Water, Air, andSoil Pollution 169 (1), 303–315.
Starr, J., 1990. Spatial and temporal variation of ponded infiltration. Soil ScienceSociety of America Journal 54 (3), 629–636.
Stone, J., Paige, G., Hawkins, R., 2008. Rainfall intensity-dependent infiltration rateson rangeland rainfall simulator plots. Transactions of the ASAE 51 (1), 45–53.
Thothong, W., Huon, S., Janeau, J., Boonsaner, A., De Rouw, A., Planchon, O., Bardoux,G., Parkpian, P., 2011. Impact of land use change and rainfall on sediment andcarbon accumulation in a water reservoir of north thailand. Agriculture,Ecosystems and Environment 140 (3–4), 521–533.
Vachaud, G., Balabanis, A., P Vauclin, M., 1984. Temporal stability of spatiallymeasured soil water probability density function1. Soil Science Society ofAmerica Journal 49 (4), 822.
Valentin, C., Bresson, L., 1992. Morphology, genesis and classification of surfacecrusts in loamy and sandy soils. Geoderma 55 (3–4), 225–245.
Valentin, C., Casenave, A., 1992. Infiltration into sealed soils as influenced by gravelcover. Soil Science Society of America Journal 56 (6), 1667–1673.
Valentin, C., Rajot, J., Mitja, D., 2004. Responses of soil crusting, runoff and erosion tofollowing in the sub-humid and semi-arid regions of West Africa. Agriculture,Ecosystems and Environment 104 (2), 287–302.
Valentin, C., Agus, F., Alamban, R., Boosaner, A., Bricquet, J., Chaplot, V., De Guzman,T., De Rouw, A., Janeau, J., Orange, D., et al., 2008. Runoff and sediment lossesfrom 27 upland catchments in Southeast Asia: impact of rapid land use changesand conservation practices. Agriculture, Ecosystems and Environment 128 (4),225–238.
Van Dijk, A., Bruijnzeel, L., 2001. Modelling rainfall interception by vegetation ofvariable density using an adapted analytical model. Part 2. Model validation fora tropical upland mixed cropping system. Journal of Hydrology 247 (3–4), 239–262.
Van Dijk, A., Bruijnzeel, L., 2004. Runoff and soil loss from bench terraces. 1. Anevent-based model of rainfall infiltration and surface runoff. European journalof soil science 55 (2), 299–316.
Van Lynden, G., Oldeman, L., 1997. The Assessment of the Status of Human-inducedSoil Degradation in South and Southeast Asia. International Soil Reference andInformation Centre, Wageningen.
Yu, B., 1999. A comparison of the Green–Ampt and a spatially variable infiltrationmodel for natural storm events. Transactions of the ASAE 42 (1), 89–97.
Yu, B., Rose, C., Coughlan, K., Fentie, B., 1997. Plot-scale rainfall-runoffcharacteristics and modeling at six sites in Australia and Southeast Asia.Transactions of the ASAE 40 (5), 1295–1303.
Yu, B., Cakurs, U., Rose, C., 1998. An assessment of methods for runoff estimation atthe plot scale. Transactions of the ASAE 41 (3), 653–661.
Yu, B., Sombatpanit, S., Rose, C., Ciesiolka, C., Coughlan, K., 2000. Characteristics andmodeling of runoff hydrographs for different tillage treatments. Soil ScienceSociety of America Journal 64 (5), 1763–1770.
92 J. Patin et al. / Journal of Hydrology 426–427 (2012) 79–92
Copyright © 2022 FDOKUMEN