Efficiency assessment of Common Effluent Treatment Plant (CETP) treating tannery effluents
Upload
khangminh22Category
view
6download
0
March, 2017 to May, 2017
10 MLD CETP, AnkleshwarPlot No. U-5 (Utility Plot), Adjacent to existing 22.5 MLD STP, GIDC, Ankleshwar, Di. Bharuch, Gujarat.
ENVIRONMENTAL IMPACT & RISK ASSESMENT REPORT FORPROPOSED 10 MLD CETP AT GIDC, AnkleshwarFILE No. SIA/GJ/IND2/19981/2017

ENVIRONMENTAL IMPACT & RISK
ASSESSMENT REPORT
CLIENT
PROJECT TITLE
PROJECT NO.
:
:
:
NOTIFIED AREA AUTHORITY, ANKLESHWAR
Plot No. : 618-619, AIA Community center,
GIDC, Ankleshwar – 393 002
DIST: BHARUCH, GUJARAT.
10 MLD CETP, ANKLESHWAR
SIA/GJ/IND2/19981/2017
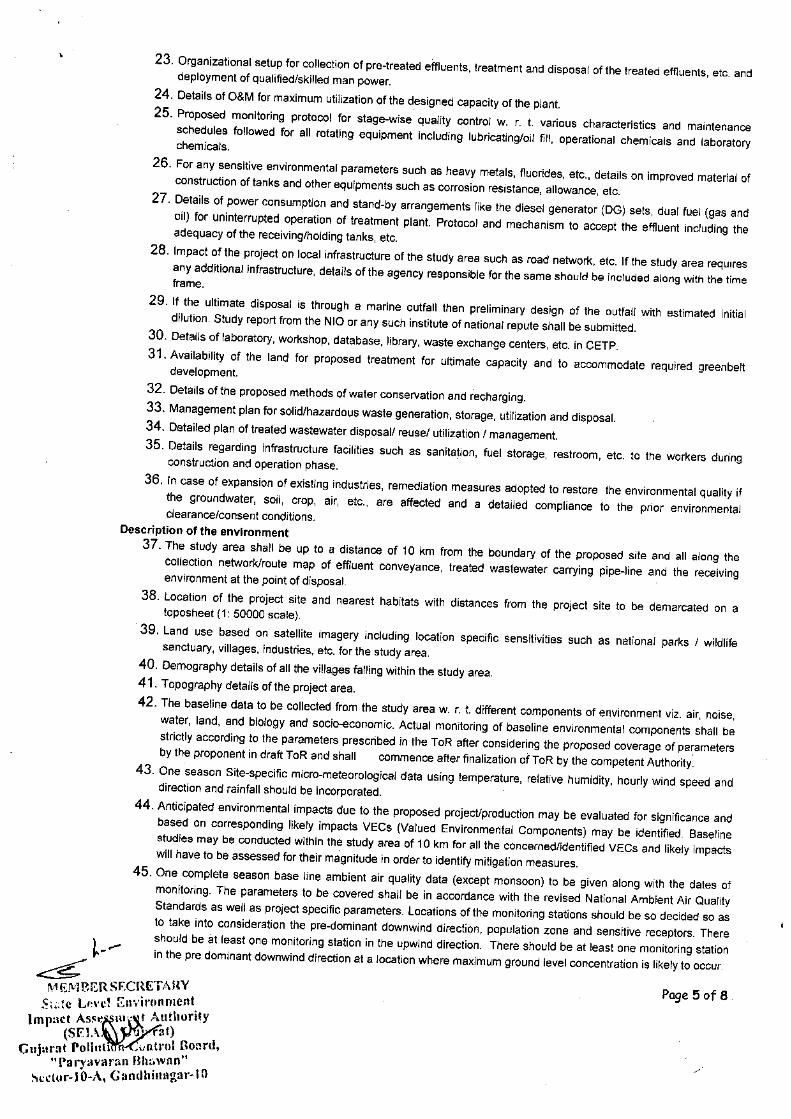
NABL Accredited Testing Laboratory
ISO 9001:2008 Certified Company
Aqua-Air Environmental Engineers P. Ltd.403, Centre Point, Nr. Kadiwala School, Ring Road, Surat - 395002
Prepared By:
NABL Accredited Testing Laboratory
ISO 9001:2008 Certified Company
Aqua-Air Environmental Engineers P. Ltd.403, Centre Point, Nr. Kadiwala School, Ring Road, Surat - 395002
NABL Accredited Testing Laboratory
ISO 9001:2008 Certified Company
Aqua-Air Environmental Engineers P. Ltd.403, Centre Point, Nr. Kadiwala School, Ring Road, Surat - 395002
Prepared By:

INDEX
Sr. No. TITLE PAGE NO.
1 INTRODUCTION 1-1
1.1 BACKGROUND 1-1
1.1.1 GIDC ACTIVITIES 1-1
1.2 PROJECT DETAILS 1-4
1.2.1 Scope 1-4
1.2.2 Need for the proposed CETP 1-4
1.2.3 Collection and distribution network 1-6
1.3 Project setting 1-8
1.3.1 LOCATION 1-8
1.3.2 The salient features of the site 1-10
1.3.3 KEY INFRASTRUCTURE FEATURES AND SETTLEMENTS 1-10
1.4 Study area for the proposed project 1-11
1.5 Purpose of EIA 1-12
1.6 Objectives of EIA 1-12
1.7 Methodologies for EIA 1-12
1.7.1 Baseline Environemental Condition 1-12
1.7.2 Identification of Source of Pollution 1-13
1.7.3 Evaluation of Pollution Control and Environmental Management System 1-14
1.7.4 Evaluation of Impact 1-14
1.8 Structure of report 1-14
2 PROJECT DESCRIPTION AND INFRASTRUCTURAL FACILITIES 2-1
2.1 BACKGROUND 2-1
2.2 Project cost 2-1
2.3 PROJECT ACTIVITIES 2-1
2.3.1 PRE CONSTRUCTION ACTIVITIES 2-1
2.3.2 CONSTRUCTION ACTIVITIES 2-2
2.3.3 RAW MATERIAL HANDLING AND STORAGE 2-2
2.4 PROJECT DESCRIPTION 2-3
2.4.1 DETAILS OF EXISTING INDUSTRIES FOR PROPOSED 10 MLD CETP 2-3
2.4.2 Capacity of proposed CETP 2-14
2.4.3 Collection and distribution network 2-16
2.4.4 PROCESS DESCRIPTION OF CETP 2-21
2.5 DESIGN DETAILS 2-32
2.5.1 CHARACTERISTICS OF UNTREATED & TREATED EFFLUENT 2-32
2.6 INFRASTRUCTURE FACILITIES 2-33
2.6.1 LAND 2-33
2.6.2 TRANSPORTATION FACILITIES 2-33
2.6.3 WATER & WASTE WATER 2-34
2.6.4 ELECTRICITY REQUIREMENT 2-34
2.6.5 FUEL REQUIREMENT 2-34
2.7 POLLUTION POTENTIAL AND ITS CONTROL MEASURE 2-34
2.7.1 AIR POL LUTION AND CONTROL SYSTEM 2-34
2.8 Solid & Hazardous waste Generations and disposal system 2-35
2.9 Noise level and CONTROL SYSTEM 2-36
2.10 DETAILS OF GREENBELT 2-36
2.11 MANPOWER REQUIREMENTS 2-36
2.12 DETAILS OF RAW MATERIAL AND PRODUCTS TO BE MANUFACTURED BY INDUSTRIES
2-37
3 BASELINE ENVIRONMENT STATUS 3-1
3.1 Introduction 3-1
3.2 Meteorology 3-2
3.3 Micro Meteorology of the area 3-2
3.3.1 TEMPERATURE DETAILS 3-2
3.3.2 RELATIVE HUMIDITY 3-3
3.3.3 RAINFALL 3-4
3.3.4 Wind Speed 3-4
3.4 Air Environment: 3-8
3.4.1 DESIGN OF NETWORK FOR AMBIENT AIR QUALITY MONITORING LOCATIONS 3-8
3.4.2 RECONNAISSANCE 3-8
3.4.3 METHODOLOGY FOR AMBIENT AIR QUALITY MONITORING 3-8
3.4.4 SUMMARY 3-12
3.5 NOISE ENVIRONMENT 3-13
3.5.1 RECONNAISSANCE 3-13
3.5.2 METHODOLOGY FOR NOISE MONITORING 3-13
3.5.3 NOISE LEVELS DUE TO TRANSPORTATION 3-15
3.6 WATER ENVIRONMENT 3-15
3.6.1 RECONNAISSANCE 3-15
3.6.2 METHODOLOGY FOR WATER QUALITY MONITORING 3-16
3.6.3 BASELINE GROUND WATER QUALITY 3-27
3.6.4 BASELINE SURFACE WATER QUALITY 3-27
3.7 LAND ENVIRONMENT 3-27
3.7.1 METHODOLOGY FOR SOIL MONITORING 3-27
3.7.2 SUMMARY ON SOIL QUALITY 3-35
3.8 GEOLOGICAL & HYDROLOGICAL DATA 3-35
3.8.1 METHOD OF PREPARATION 3-35
3.8.2 DESCRIPTION OF GEOLOGICAL CLASSIFICATION AND AREA UNDER DIFFERENT FORMATIONS
3-35
3.8.3 GEOLOGICAL MAP 3-35
3.8.4 Hydrology 3-38
3.8.5 DRAINAGE PATTERN 3-40
3.9 LAND USE PATTERN 3-41
3.9.1 METHOD OF DATA PREPARATION 3-41
3.10 ECOLOGICAL INFORMATION 3-44
3.10.1 Introduction 3-44
3.10.2 Climate 3-44
3.10.3 Rainfall 3-44
3.10.4 Biogeography 3-44
3.10.5 PHYSIOGRAPHY 3-45
3.10.6 FOREST 3-45
3.11 SOCIO - ECONOMIC ENVIRONMENT 3-50
3.11.1 DEMOGRAPHY 3-50
3.11.2 Literacy Rate 3-53
3.11.3 Occupational Structure 3-54
3.11.4 AMENITIES 3-57
4 ANTICIPATED ENVIRONMENTAL IMPACTS & MITIGATION MEASURES 4-1
4.1 IDENTIFICATION OF IMPACT 4-1
4.2 EVALUATION AND PREDICTION OF IMPACT 4-1
4.2.1 WATER ENVIRONMENT 4-2
4.2.2 AIR ENVIRONMENT 4-3
4.2.3 NOISE ENVIRONMENT 4-9
4.2.4 LAND USE AND SOIL QUALITY 4-9
4.2.5 HOUSING 4-10
4.2.6 INFRASTRUCTURE AND SERVICES 4-10
4.2.7 ENVIRONMENTAL HAZARDS 4-10
4.2.8 ECOLOGY 4-11
4.3 MATRIX REPRESENTATION 4-14
4.4 CONCLUSION 4-19
5 ENVIRONMENTAL MONITORING PLAN 5-1
5.1 ENVIRONMENTAL MONITORING PLAN 5-1
5.2 POST PROJECT MONITORING 5-2
5.2.1 MONITORING POINTS/LOCATIONS & COMPONENTS 5-2
5.2.2 MONITORING PARAMETERS & FREQUENCY 5-2
5.2.3 REGULAR MONITORING OF MEMBER INDUSTRIES 5-3
5.2.4 METHOD OF ENVIRONMENTAL SAMPLING & ANALYSIS 5-3
5.3 DOCUMETATION & RECORDS 5-4
5.4 BUDGET & PROCUREMENT SCHEDULE 5-4
5.5 MONITORING PLAN FOR MEMBER INDUSTREIS 5-5
6 PROJECT BENEFITS 6-1
6.1 BACKGROUND 6-1
6.2 ENVIRONMENT 6-1
6.3 The advantage of CETP is mostly sought due to following benefits 6-2
6.4 Employment Generation 6-3
6.5 ENTERPRISE SOCIAL RESPONSIBILITY (ESR) PLANT & ACTIVITIES 6-4
7 ENVIRONMENTAL MANAGEMENT PLAN 7-1
7.1 BACKGROUND 7-1
7.2 OBJECTIVES OF ENVIRONMENTAL MANAGEMENT PLAN 7-1
7.3 ENVIRONMENTAL MANAGEMENT CELL 7-2
7.3.1 MANAGEMENT AND MAINTENANCE OF CONVEYANCE SYSTEM 7-3
7.4 ENVIRONMENT MANAGEMENT PLAN 7-4
7.4.1 CONSTRUCTION PHASE MANAGEMENT 7-4
7.4.2 OPERATIONAL PHASE MANAGEMENT 7-4
7.5 SOCIO ECONOMIC ACTIVITIES 7-15
7.6 CAPITALS AND O&M COST FOR ENVIRONMENTAL MANGEMENT 7-18
8 EXECUTIVE SUMMARY 8-1
8.1 Subject 8-1
8.2 Need and Justification of proposed expansion project 8-1
8.3 Project Details 8-2
8.4 Raw Water Consumption 8-2
8.5 Treated Effluent Handling, Treatment and Management 8-2
8.6 Air Pollution Source and Control/Prevention Management 8-3
8.6.1 Flue gas emission 8-3
8.6.2 Process gas emission 8-3
8.7 Solid/Hazardous Waste, Handling and Mode of Disposal 8-3
8.8 Noise Level Control/Prevention Measures 8-4
8.9 POST PROJECT MONITORING PLAN 8-4
8.10 Green Belt 8-5
8.11 Power Requirements 8-5
8.12 Fuel requirement 8-5
8.13 Storage details of Hazardous Chemicals and Control Measures 8-6
8.14 Capital and recurring cost earmarked for environmental protection measures 8-6
8.15 Conclusion 8-6
9 DISCLOSURE OF CONSULTANTS ENGAGED 9-1
10 RISK ANALYSIS & DISASTER MANAGEMENT PLAN 10-1
10.1 BACKGROUND 10-1
10.2 DETAILS OF SAFETY MEASURES 10-1
10.3 STORAGE DETAILS 10-1
10.4 SAFETY PRECAUTIONS IS TAKEN DURING STORAGE OF CHEMICALS 10-2
10.5 HEALTH & SAFETY MEASURES 10-3
10.6 FIRE FIGHTING SYSTEM 10-5
10.7 MAJOR HAZARDS AND DAMAGE CRITERIA 10-5
10.7.1 MAJOR HAZARDS 10-5
10.8 HAZARD IDENTIFICATION 10-7
10.8.1 IDENTIFICATION OF HAZARDOUS AREAS 10-7
10.9 CONSEQUENCE ANALYSIS 10-7
10.9.1 METEOROLOGICAL ASSUMPTIONS FOR CONSEQUENCE ANALYSIS 10-7
10.9.2 SOFTWARE USED FOR CALCULATIONS 10-8

10.9.3 SCENARIOS CONSIDERED FOR CONSEQUENCE ANALYSIS 10-8
10.10 RECOMMANDATIONS TO REDUCE THE RISK OF FIRE, EXPLOSION AND TOXIC RELEASE
10-15
10.10.1 SAFETY PRECAUTIONS FOR CHLORINE GAS 10-15
10.10.2 SAFETY PRECAUTIONS FOR DIESEL 10-16
10.11 SAFETY TRAINING 10-16
10.12 OCCUPATIONAL HEALTH AND SAFETY 10-16
10.12.1 OCCUPATIONAL HEALTH 10-16
10.12.2 CONSTRUCTION AND ERECTION 10-17
10.12.3 OPERATION AND MAINTENANCE 10-17
10.12.4 FIRST AID BOX 10-17
10.12.5 PERIODIC MEDICAL EXAMINATION 10-17
10.12.6 WORKPLACE MONITORING PLAN 10-18

LIST OF TABLES
TABLE NO. TITLE PAGE NO.
Table - 1.1 Types of Industries present in GIDC, Ankleshwar 1-2
Table - 1.2 DISTANCE OF NEAREST KEY INFRASTRUCTURE FEATURES FROM PROJECT SITE
1-11
Table - 2.1 BREAK UP OF PROPOSED PROJECT COST 2-1
Table - 2.2 RAW MATERAIL CONSUMPTION 2-2
Table - 2.3 DETAILS OF MEMBER INDUSTRIES FOR PROPOSED 10 MLD CETP 2-3
Table - 2.4 DESIGN CRITERIA/INLET NORMS OF 10 MLD CETP, ANKLESHWAR 2-21
Table - 2.5 LIST OF ETP UNITS OF 10 MLD CETP, ANKLESHWAR 2-30
Table - 2.6 Expected characteristics of untreated and treated effluent 2-33
Table - 2.7 LAND AREA BREAK UP 2-33
Table - 2.8 TOTAL WATER CONSUMPTION & EFFLUENT GENERATION 2-34
Table - 2.9 THE DETAILS OF FLUE GAS EMISSION 2-35
Table - 2.10 THE DETAILS OF PROCESS GAS EMISSION 2-35
Table - 2.11 SOLID & HAZARDOUS WASTE GENERATION QUANTITY AND CATEGORY 2-36
Table - 2.12 TYPE OF PRODUCTS MANUFACTURED AND RAW MATERIALS CONSUMED 2-37
Table - 3.1 Temperature Details 3-3
Table - 3.2 Relative Humidity (%) Details 3-3
Table - 3.3 Rainfall Details 3-4
Table - 3.4 Wind Speed Details 3-4
Table - 3.5 Site Specific Meteorological Data (Period: Mar., 2017 to May., 2017) 3-5
Table - 3.6 Details of Monitoring Locations 3-9
Table - 3.7 Details of Ambient Air Quality Monitoring Locations 3-10
Table - 3.8 Ambient Air Quality Status (March - 2017 to May - 2017) 3-11
Table - 3.9 Details of Ambient Noise Quality Monitoring Locations 3-13
Table - 3.10 Background Noise Levels 3-14
Table - 3.11 National noise quality STANDARDS (CPCB) 3-15
Table - 3.12 Noise Levels Due to Transportation 3-15
Table - 3.13 Sampling Locations for Monitoring Surface and Ground Water Quality 3-16
Table - 3.14 Water Quality (Ground Water) 3-18
Table - 3.15 Soil Sampling Locations 3-28
Table - 3.16 Physico-Chemicals Characteristics of Soil 3-29
Table - 3.17 Description of geological classification and area under different formations 3-36
Table - 3.18 Areas under Different Land use 3-43
Table - 3.19 List of Flora 3-45
Table - 3.20 List of Fauna 3-49
Table - 3.21 DEMOGRAPHIC DATA 3-50
Table - 3.22 Population density 3-52
Table - 3.23 Literacy rate 3-53
Table - 3.24 Occupational Structure 3-55

Table - 3.25 DETAILS OF AMMENITIES AVAILABLE IN STUDY AREA 3-58
Table - 4.1 DETAILS OF EMISSION 4-6
Table - 4.2 SUMMERY OF ISCST3 MODEL OUTPUT FOR SPM, SO2, Nox 4-7
Table - 4.3 PREDICTED AMBIENT AIR QUALITY FOR SPM, SO2, Nox 4-7
Table - 4.4 Potential Impacts & Mitigative Measures 4-15
Table - 4.5 Environmental Impact Assessment Matrix with Mitigation Measures 4-17
Table - 5.1 MONITORING POINTS/LOCATIONS & COMPONENTS 5-2
Table - 5.2 FREQUENCY OF MONITORING & PARAMETERS 5-2
Table - 5.3 METHOD OF ENVIRONMENTAL SAMPLING & ANALYSIS 5-4
Table - 7.1 MONITORING PLAN 7-9
Table - 7.2 GREEN BELT DEVELOPMENT PLAN 7-14
Table - 8.1 DETAILS OF FLUE GAS EMISSION 8-3
Table - 8.2 DETAILS OF PROCESS GAS EMISSION 8-3
Table - 8.3 SOLID & HAZARDOUS WASTE GENERATION QUANTITY AND CATEGRORY 8-4
Table - 10.1 HAZARDOUS CHEMICALS STORAGE DETAIL 10-2
Table - 10.2 OTHER HAZARDS AND CONTROL 10-3
Table - 10.3 SCENARIOS IDENTIFIED FOR CONSEQUENCE ANALYSIS 10-8

LIST OF FIGURES
FIGURE NO. TITLE PAGE NO.
Figure - 1.1 LOCATION OF THE PROJECT SITE 1-9
Figure - 1.2 STUDY AREA – 10 KM 1-11
Figure - 1.3 E.I.A. PLAN & PROCEDURE 1-16
Figure - 2.1 MAP SHOWING EXISTING PIPELINE NETWORK IN ANKLESHWAR GIDC 2-19
Figure - 2.2 MAP SHOWING PIPELINE NETWORK IN ANKLESHWAR GIDC WITH PROPOSED CETP
2-20
Figure - 2.3 SCHEMATIC DIAGRAM OF TREATED EFFLUENT DISPOSAL 2-32
Figure - 3.1A Wind Rose Diagram 3-6
Figure - 3.1B Stability Class Distribution 3-7
Figure - 3.2 Location of Ambient Air Quality Monitoring Stations 3-10
Figure - 3.3 Location of Noise Level Monitoring Stations 3-14
Figure - 3.4 Locations of Water Sampling Stations 3-17
Figure - 3.5 Locations of Soil Sampling Stations 3-28
Figure - 3.6 Major Geological Features 3-37
Figure - 3.7 HYDROGEOLOGICAL MAP 3-39
Figure - 3.8 Drainage Pattern 3-40
Figure - 3.9 Process Methodology 3-42
Figure - 3.10 Land use / Land cover 3-43
Figure - 3.11 POPULATION DENSITY 3-52
Figure - 3.12 LITERACY DATA 3-54
Figure - 4.1 ISOPLETHS FOR Cl2 4-8
Figure - 7.1 ORGANOGRAM OF Environment Management Cell 7-3
Figure - 7.2 SCHEMATIC DIAGRAM OF TREATED EFFLUENT DISPOSAL 7-5

LIST OF ANNEXURES
Annexure No. Particulars
Annexure - 1 NCTL Permission letter for treated effluent discharge
Annexure - 2 Undertaking for No bore well
Annexure - 3 Action by GPCB and response
Annexure - 4 Performance of FETP
Annexure - 5 Plot allotment from GIDC
Annexure - 6 Plant lay out
Annexure - 7 Schematic flow diagram
Annexure - 8 Treatability study report
Annexure - 9 NIO reports
Annexure - 10 Details of laboratory
Annexure - 11 Monitoring plan
Annexure - 12 Consultant stay order against NABET Accreditation
Annexure - 13 Map of upgraded Effluent conveyance pipeline
Annexure - 14 Copy of MoU
Annexure - 15 Policy of CETP


TOR COMPLIANCE
Sr. No.
TOR Compliance
SPECIFIC TORs
1
Executive summary of the project – giving a prima facie idea of the objectives of the proposal, use of resources, justification, etc. In addition, it should provide a compilation of EIA report, including EMP and post project monitoring plan in brief. Need for the proposed CETP shall be justified in detail.
The Executive Summary of the project is mentioned in Chapter - 8.
2 Justification for selecting the proposed unit size Justification for selecting the proposed unit size is mentioned in Section 2.4.2 of Chapter – 2, Page No. 2-15.
3
Permission letter from competent authority for additional discharge into NCT pipeline including design capacity, actual load and Spare capacity of pipeline for final discharge to FETP
The permission from NCTL for discharge of treated effluent to FETP is attached as Annexure - 1.
4 Permission letter from FETP regarding receiving of 10 MLD waste water.
The permission from NCTL for discharge of treated effluent to FETP is attached as Annexure - 1.
5 Ratio of sewage to be mixed with industrial waste water with technical justification.
Ratio of sewage to be mixed with industrial waste water with technical justification is mentioned in Section 2.4.2 of Chapter – 2, Page No. 2-15.
6 Legal undertaking regarding discharge of waste water to FETP shall not exceed 10 MLD
Legal undertaking regarding discharge of waste water to FETP shall not exceed 10 MLD is attached as Annexure - 2.
7
Compliance of direction under section 18 (1) (b) of the Water (Prevention and Control of Pollution) act, 1974 issued by CPCB dated 31/03/2016 regarding compliance of CETP of FETP. a) Action initiated by GPCB, if any, against proposed unit regarding non-compliance of prescribed standards under the various environmental laws. b) Performance of CETP with respect to current hydraulic load & prescribed standards with No Objection Certificate of CETP regarding incorporation of the proposed unit for acceptance of waste water c) Performance of TSDF site with respect to current load & prescribed standards with No Objection Certificate of TSDF site regarding incorporation of the proposed unit for acceptance of hazardous waste to the common infrastructure.
a) Action initiated by GPCB against FETP of NCTL and response of FETP is attached as Annexure - 3. b) Performance of FETP with respect to current hydraulic load & prescribed standards is attached as Annexure - 4. The permission from NCTL for discharge of treated effluent to FETP is attached as Annexure - 1. c) Membership of TSDF site of BEIL shall be obtained before operation of CETP.

d) Copies of quarterly action report taken for the above points submitted to the CPCB. e) Report of GPCB which have conducted monitoring as per the said direction by CPCB dated 31/03/2016.
8 Land possession documents from the concern authority
Land possession documents are attached as Annexure - 5.
9 Land requirement for the project including its break up for various purposes, its availability and optimization
Land requirement for the project including its break up is mentioned in Section 2.6.1 of Chapter - 2, Page No. 2-33.
10 Details of proposed layout clearly demarcating various units within the plant (CETP LAYOUT+ ENTIRE LAYOUT WHERE CETP PROPOSED)
Details of proposed layout clearly demarcating various units within the plant is attached as Annexure - 6.
11
Complete process flow diagram describing each unit, its processes and operations, along with material and energy inputs and outputs (material and energy balance).
Complete process is mentioned in Section 2.4.4 of Chapter – 2, Page No. 2-21. The schematic flow diagram of CETP is attached as Annexure - 7.
12 Details on improved technologies Details on improved technologies are mentioned in Section 2.4.4.2 of Chapter – 2, Page No. 2-27.
13
Assessment of source of the water supply with adequacy of the same to meet with the requirements for the CETP. Permission obtained from the concerned authority for supply of water. Undertaking stating that no borewell shall be dug within the premises.
The water will be sourced from GIDC. The supplied water is adequate to meet the requirements of CETP. The permission from water supply authority shall be obtained from water supply authority at the earliest.
14
Expected quantity of sewage & wastewater from each industry and justification for selecting the proposed capacity of the treatment plant/modules. Measures to prevent flooding of the CETP in the rainy season
Expected quantity of wastewater from each industry is mentioned in Section 2.4.1 of Chapter – 2, Page No. 2-3. The justification for selecting the proposed capacity of the CETP is mentioned in Section 2.4.2 of Chapter – 2, Page No. 2-15. Storm water drainage line throughout the CETP premises shall be constructed and rain water shall be drained into natural drain.
15 List of member units including its location, type of industry, products, raw materials etc
List of member units including its location, type of industry, products is mentioned in Section 2.4.1 of Chapter – 2, Page No. 2-3.
16 Characteristics of effluent and proposed scheme for segregation of streams from individual member industries.
Expected characteristics of effluent before and after treatment is mentioned in Section 2.5.1 of Chapter – 2, Page No. 2-33. Proposed scheme for segregation of streams from individual member industries is mentioned in Section 7.4.2.2.2 of Chapter – 7, Page No. 7-6.

17 Details of mode of effluent collection system either by tankers and/or above ground pipeline, etc., or proposed trouble-shooting mechanism
Details of mode of effluent collection system is mentioned in Section 1.2.3 of Chapter – 1, Page No. 1-6. Map of upgraded Effluent conveyance pipeline is attached as Annexure - 13.
18 Monitoring protocol for collection of effluent through tankers/ above ground Pipeline
Details of mode of effluent collection system is mentioned in Section 1.2.3 of Chapter – 1, Page No. 1-6.
19 Details on physical, chemical and biological characteristics of the combined effluent and its concentrations and the basis for the same
Details on physical, chemical and biological characteristics of the combined effluent and its concentrations are mentioned in Section 2.5.1 of Chapter – 2, Page No. 2-33 and also mentioned in Annexure - 8, Treatability study, Point No. 5.1.
20 Details of equalization tank at least for 24 hrs; and guard ponds for holding treated wastewater or continuous monitoring facilities, if any
In case of circumstances like maintenance / repairing of effluent conveying pipeline or CETP itself, emergency storage is provided in collection tank, secondary treated effluent sump and tertiary treated effluent sump.
The capacity of collection tank is kept such that in case of emergency situation, it could store 24 hour effluent.
Capacity of equalization tank: capacity 7500 KL, 24 hr storage.
Secondary treated effluent sump: capacity 1250 KL, 3 hr storage
Tertiary treated effluent sump: capacity 1250 KL, 3 hr storage.
21
Details of the proposed treatment schemes supported by the treatability studies including source separation of streams for specific mode of collection and treatment either at individual industry or at CETP (based on economic and operational ease considerations).
Details of the proposed treatment schemes is mentioned in Section 2.4.4 of Chapter – 2, Page No. 2-21. The treatability study for the same is attached as Annexure - 8.
22 Built-in flexibility provisions to deal with quantitative and qualitative fluctuations.
In case of circumstances like maintenance / repairing of effluent conveying pipeline or CETP itself, emergency storage is provided in collection tank, secondary treated effluent sump and tertiary treated effluent sump.
The capacity of collection tank is kept such that in case of emergency situation, it could store 24 hour effluent.
Capacity of equalization tank: capacity 7500 KL, 24 hr storage.

Secondary treated effluent sump: capacity 1250 KL, 3 hr storage
Tertiary treated effluent sump: capacity 1250 KL, 3 hr storage.
23
Organizational setup for collection of pre-treated effluents, treatment and disposal of the treated effluents, etc. and deployment of qualified/skilled man power.
Organizational setup is mentioned in Figure – 7.1, Section 7.3, Chapter – 7, Page No. 7-3.
24 Details of O&M for maximum utilization of the designed capacity of the plant
The details of CETP management and maintenance of the CETP are mentioned in Section 7.4, Chapter – 7, Page No. 7-4.
25
Proposed monitoring protocol for stage-wise quality control w. r. t. various characteristics and maintenance schedules followed for all rotating equipment including lubricating/oil fill, operational chemicals and laboratory chemicals
Proposed monitoring plan is mentioned in Section 5.2.2, Chapter – 5, Page No. 5-2.
26
For any sensitive environmental parameters such as heavy metals, fluorides, etc., details on improved material of construction of tanks and other equipment such as corrosion résistance, allowance, etc
All the sensitive environmental parameters such as heavy metals, fluorides, etc. are considered and material of construction has been selected accordingly at the time of designing stage.
27
Details of power consumption and stand-by arrangements like the diesel generator (DG) sets, dual fuel (gas and oil) for uninterrupted operation of treatment plant. Protocol and mechanism to accept the effluent including the adequacy of the receiving/holding tanks, etc
The power requirement is met through 2500 KW connecting load of DGVCL (GEB) and emergency standby Diesel Generator Set (1 nos.) of 1000 KVA. The details of Power requirement are mentioned in Section 2.6.4 of Chapter – 2, Page No. 2-34. The details of Fuel requirement are mentioned in Section 2.6.5 of Chapter – 2, Page No. 2-34.
28
Impact of the project on local infrastructure of the study area such as road network, etc. If the study area requires any additional infrastructure, details of the agency responsible for the same should be included along with the time frame
Impact of the project on local infrastructure of the study area such as road network, etc. are mentioned in Section 4.2.6, Chapter – 4, Page No. 4-10.
29
If the ultimate disposal is through a marine outfall then preliminary design of the outfall with estimated initial dilution. Study report from the NIO or any such institute of national repute shall be submitted.
Study report from the NIO is attached as Annexure - 9.
30 Details of laboratory, workshop, database, library, waste exchange centers, etc. in CETP
Details of laboratory are attached as Annexure - 10.
31 Availability of the land for proposed treatment for ultimate capacity and to accommodate required greenbelt development
Land requirement for the project including its break up is mentioned in Section 2.6.1 of Chapter - 2, Page No. 2-33. Details of proposed layout clearly

demarcating various units within the plant with green belt is attached as Annexure -6.
32 Details of the proposed methods of water conservation and recharging
Details of the proposed methods of water conservation and recharging are mentioned in Section 7.4.2.2.4, Chapter – 7, Page No. 7-10.
33 Management plan for solid/hazardous waste generation, storage, utilization and disposal
Management plan for solid/hazardous waste generation, storage, utilization and disposal is mentioned in Section 2.8 of Chapter – 2, Page No. 2-35.
34 Detailed plan of treated wastewater disposal/ reuse/ utilization / management
There is option available for reuse and recycle. The possibilities of recycle/reuse of treated effluent to nearby industries are to be explored.
35 Details regarding infrastructure facilities such as sanitation, fuel storage, restroom, etc. to the workers during construction and operation phase
Sufficient Infrastructure facilities such as sanitation, fuel storage, restroom etc. to the workers will be provided.
36
In case of expansion of existing industries, remediation measures adopted to restore the environmental quality if the groundwater, soil, crop, air, etc., are affected and a detailed compliance to the prior environmental clearance/consent conditions
The proposed 10 MLD CETP shall adopt a comprehensive Environmental management plan (EMP), which would cover several environmental protection measures, not only for abatement of environmental pollution resulting from the project, but also for the improvement in the ambient environment. All the conditions in environmental clearance/consent will be complied and compliance reports will be submitted regularly.
37
The study area shall be up to a distance of 10 km from the boundary of the proposed site and all along the collection network/route map of effluent conveyance, treated wastewater carrying pipe-line and the receiving environment at the point of disposal
The study area up to distance of 10 km with monitoring locations mentioned in Section 1.4 of Chapter – 1, Page No. 1-11.
38 Location of the project site and nearest habitats with distances from the project site to be demarcated on a topo sheet (1: 50000 scale).
Location of the project site and nearest locations with distances are mentioned in Section 1.3.2 of Chapter – 1, Page No. 1-10.
39
Land use based on satellite imagery including location specific sensitivities such as national parks / wildlife sanctuary, villages, industries, etc. for the study area
Land use pattern with satellite imagery is mentioned in Section 3.9 of Chapter – 3, Page No. 3-43.
40 Demography details of all the villages falling within the study area
Demography details of all the villages falling within study area are mentioned in Section 3.11.1 of Chapter – 3, Page No. 3-50.
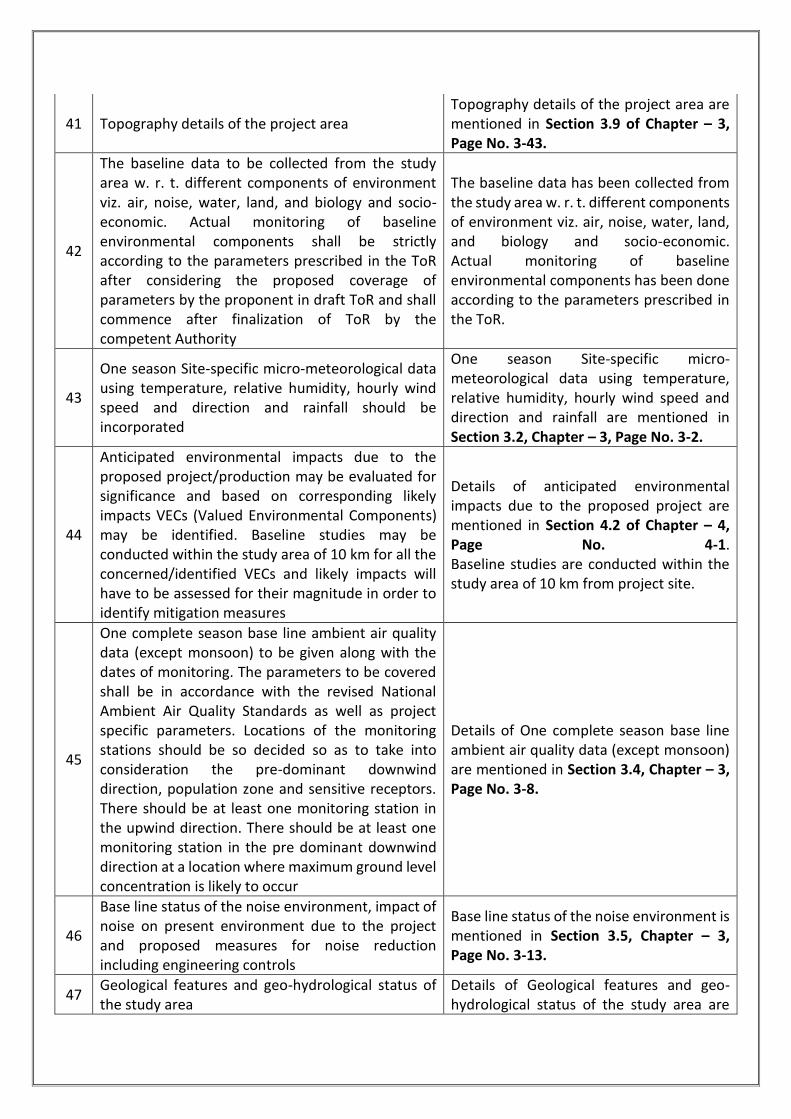
41 Topography details of the project area Topography details of the project area are mentioned in Section 3.9 of Chapter – 3, Page No. 3-43.
42
The baseline data to be collected from the study area w. r. t. different components of environment viz. air, noise, water, land, and biology and socio-economic. Actual monitoring of baseline environmental components shall be strictly according to the parameters prescribed in the ToR after considering the proposed coverage of parameters by the proponent in draft ToR and shall commence after finalization of ToR by the competent Authority
The baseline data has been collected from the study area w. r. t. different components of environment viz. air, noise, water, land, and biology and socio-economic. Actual monitoring of baseline environmental components has been done according to the parameters prescribed in the ToR.
43
One season Site-specific micro-meteorological data using temperature, relative humidity, hourly wind speed and direction and rainfall should be incorporated
One season Site-specific micro-meteorological data using temperature, relative humidity, hourly wind speed and direction and rainfall are mentioned in Section 3.2, Chapter – 3, Page No. 3-2.
44
Anticipated environmental impacts due to the proposed project/production may be evaluated for significance and based on corresponding likely impacts VECs (Valued Environmental Components) may be identified. Baseline studies may be conducted within the study area of 10 km for all the concerned/identified VECs and likely impacts will have to be assessed for their magnitude in order to identify mitigation measures
Details of anticipated environmental impacts due to the proposed project are mentioned in Section 4.2 of Chapter – 4, Page No. 4-1. Baseline studies are conducted within the study area of 10 km from project site.
45
One complete season base line ambient air quality data (except monsoon) to be given along with the dates of monitoring. The parameters to be covered shall be in accordance with the revised National Ambient Air Quality Standards as well as project specific parameters. Locations of the monitoring stations should be so decided so as to take into consideration the pre-dominant downwind direction, population zone and sensitive receptors. There should be at least one monitoring station in the upwind direction. There should be at least one monitoring station in the pre dominant downwind direction at a location where maximum ground level concentration is likely to occur
Details of One complete season base line ambient air quality data (except monsoon) are mentioned in Section 3.4, Chapter – 3, Page No. 3-8.
46
Base line status of the noise environment, impact of noise on present environment due to the project and proposed measures for noise reduction including engineering controls
Base line status of the noise environment is mentioned in Section 3.5, Chapter – 3, Page No. 3-13.
47 Geological features and geo-hydrological status of the study area
Details of Geological features and geo-hydrological status of the study area are
mentioned in Section 3.8, Chapter – 3, Page No. 3-35.
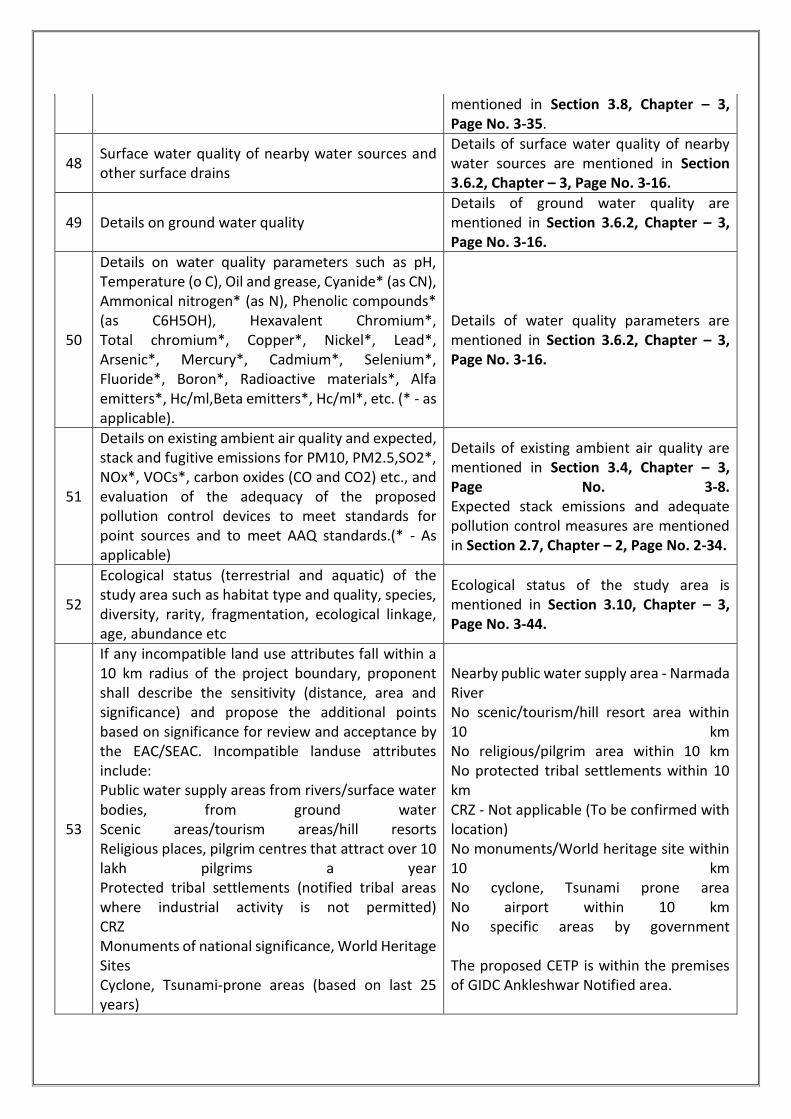
48 Surface water quality of nearby water sources and other surface drains
Details of surface water quality of nearby water sources are mentioned in Section 3.6.2, Chapter – 3, Page No. 3-16.
49 Details on ground water quality Details of ground water quality are mentioned in Section 3.6.2, Chapter – 3, Page No. 3-16.
50
Details on water quality parameters such as pH, Temperature (o C), Oil and grease, Cyanide* (as CN), Ammonical nitrogen* (as N), Phenolic compounds* (as C6H5OH), Hexavalent Chromium*, Total chromium*, Copper*, Nickel*, Lead*, Arsenic*, Mercury*, Cadmium*, Selenium*, Fluoride*, Boron*, Radioactive materials*, Alfa emitters*, Hc/ml,Beta emitters*, Hc/ml*, etc. (* - as applicable).
Details of water quality parameters are mentioned in Section 3.6.2, Chapter – 3, Page No. 3-16.
51
Details on existing ambient air quality and expected, stack and fugitive emissions for PM10, PM2.5,SO2*, NOx*, VOCs*, carbon oxides (CO and CO2) etc., and evaluation of the adequacy of the proposed pollution control devices to meet standards for point sources and to meet AAQ standards.(* - As applicable)
Details of existing ambient air quality are mentioned in Section 3.4, Chapter – 3, Page No. 3-8. Expected stack emissions and adequate pollution control measures are mentioned in Section 2.7, Chapter – 2, Page No. 2-34.
52
Ecological status (terrestrial and aquatic) of the study area such as habitat type and quality, species, diversity, rarity, fragmentation, ecological linkage, age, abundance etc
Ecological status of the study area is mentioned in Section 3.10, Chapter – 3, Page No. 3-44.
53
If any incompatible land use attributes fall within a 10 km radius of the project boundary, proponent shall describe the sensitivity (distance, area and significance) and propose the additional points based on significance for review and acceptance by the EAC/SEAC. Incompatible landuse attributes include: Public water supply areas from rivers/surface water bodies, from ground water Scenic areas/tourism areas/hill resorts Religious places, pilgrim centres that attract over 10 lakh pilgrims a year Protected tribal settlements (notified tribal areas where industrial activity is not permitted) CRZ Monuments of national significance, World Heritage Sites Cyclone, Tsunami-prone areas (based on last 25 years)
Nearby public water supply area - Narmada River No scenic/tourism/hill resort area within 10 km No religious/pilgrim area within 10 km No protected tribal settlements within 10 km CRZ - Not applicable (To be confirmed with location) No monuments/World heritage site within 10 km No cyclone, Tsunami prone area No airport within 10 km No specific areas by government The proposed CETP is within the premises of GIDC Ankleshwar Notified area.

Airport areas Any other feature as specified by the State or local government and other features as locally applicable, including prime agricultural lands, pastures, migratory corridors, etc.
54
If ecologically sensitive attributes fall within a 10 km radius of the project boundary, proponent shall describe the sensitivity (distance, area and significance) and propose the additional points based on significance for review and acceptance by the EAC/SEAC. Ecological sensitive attributes include:
- National parks - Wild life sanctuaries, Game reserve - Tiger reserve/elephant reserve/turtle
nesting ground - Mangrove area - Wetlands - Reserved and Protected forests, etc. - Any other closed/protected area under the
Wild Life (Protection) Act, 1972, any other area locally applicable
No ecologically sensitive attributes fall within a 10 km radius of the project. The proposed CETP is within the premises of GIDC Ankleshwar Notified area.
55
Environmental parameters – Temperature, sea level pressure, wind speed, mean relative humidity, visibility, salinity, density, rainfall, fog, frequency and intensity of cyclones, sediment transport, seismic characteristics, fresh water influx
Environmental parameters monitored are mentioned in Section 3.2, Chapter – 3, Page No. 3-2.
56
Details on marine biological parameters – microbiological population, pathogenic bacteria, plankton distribution, fish spawning grounds in the adjoining waters, commercial fisheries potential, vegetation including inter tidal, flora and fauna in the marine, benthal quality assessment for biological species and heavy metals and estuarine environment
Details of marine biological parameters are mentioned in NIO report attached as Annexure - 9.
57
Anticipated generic environmental impacts due to this project, which may be evaluated for significance and based on corresponding likely impacts VECs may be identified. Baseline studies may be conducted for all the concerned VECs and likely impacts will have to be assessed for their magnitude in order to identify mitigation measures.
Details of anticipated environmental impacts due to the proposed project are mentioned in Section 4.2 of Chapter – 4, Page No. 4-1. Baseline studies are conducted within the study area of 10 km from project site.
58
Modelling indicating the likely impact on ambient air quality due to proposed activities. The details of model used and input parameters used for modelling should be provided. The air quality contours may be shown on location map clearly
Air quality modelling is mentioned in Section 4.2.2.2, Chapter – 4, Page No. 4-4.
indicating the location of sensitive receptors, if any, and the habitation. The wind rose showing pre-dominant wind direction should also be indicated on the map. Impact due to vehicular movement shall also be included into the prediction using suitable model. Results of Air dispersion modelling should be superimposed on satellite Image / geographical area map
59
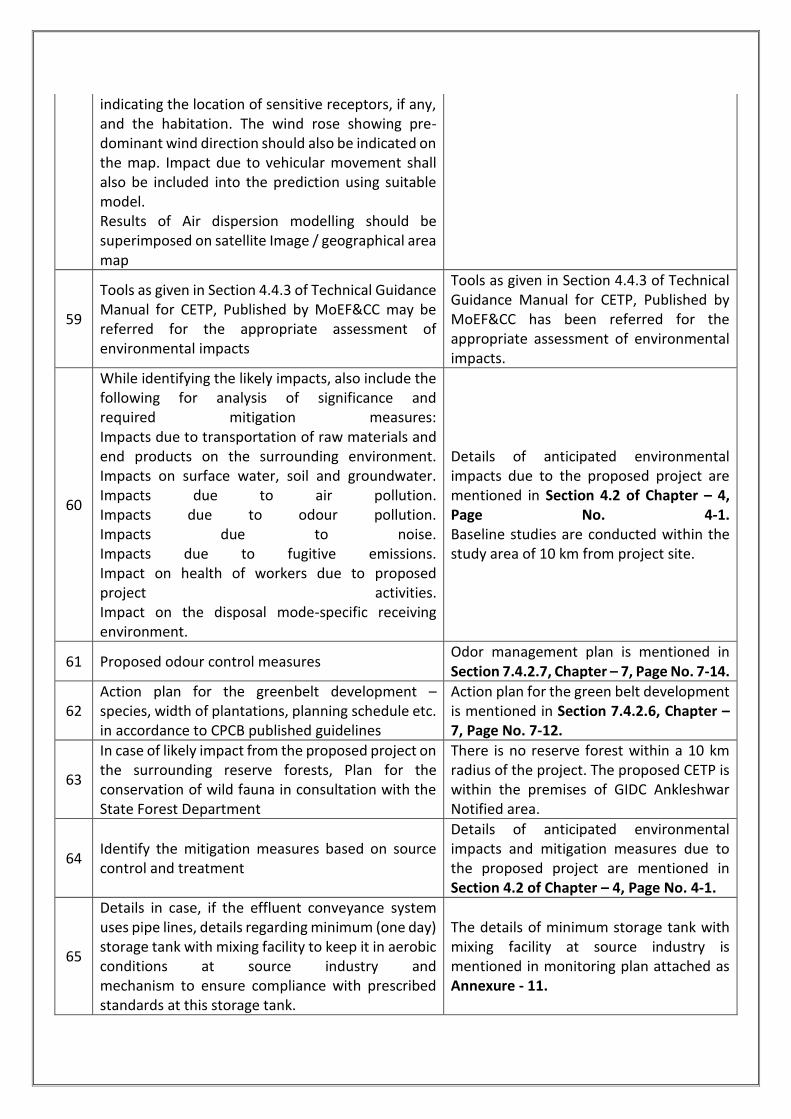
Tools as given in Section 4.4.3 of Technical Guidance Manual for CETP, Published by MoEF&CC may be referred for the appropriate assessment of environmental impacts
Tools as given in Section 4.4.3 of Technical Guidance Manual for CETP, Published by MoEF&CC has been referred for the appropriate assessment of environmental impacts.
60
While identifying the likely impacts, also include the following for analysis of significance and required mitigation measures: Impacts due to transportation of raw materials and end products on the surrounding environment. Impacts on surface water, soil and groundwater. Impacts due to air pollution. Impacts due to odour pollution. Impacts due to noise. Impacts due to fugitive emissions. Impact on health of workers due to proposed project activities. Impact on the disposal mode-specific receiving environment.
Details of anticipated environmental impacts due to the proposed project are mentioned in Section 4.2 of Chapter – 4, Page No. 4-1. Baseline studies are conducted within the study area of 10 km from project site.
61 Proposed odour control measures Odor management plan is mentioned in Section 7.4.2.7, Chapter – 7, Page No. 7-14.
62 Action plan for the greenbelt development – species, width of plantations, planning schedule etc. in accordance to CPCB published guidelines
Action plan for the green belt development is mentioned in Section 7.4.2.6, Chapter – 7, Page No. 7-12.
63
In case of likely impact from the proposed project on the surrounding reserve forests, Plan for the conservation of wild fauna in consultation with the State Forest Department
There is no reserve forest within a 10 km radius of the project. The proposed CETP is within the premises of GIDC Ankleshwar Notified area.
64 Identify the mitigation measures based on source control and treatment
Details of anticipated environmental impacts and mitigation measures due to the proposed project are mentioned in Section 4.2 of Chapter – 4, Page No. 4-1.
65
Details in case, if the effluent conveyance system uses pipe lines, details regarding minimum (one day) storage tank with mixing facility to keep it in aerobic conditions at source industry and mechanism to ensure compliance with prescribed standards at this storage tank.
The details of minimum storage tank with mixing facility at source industry is mentioned in monitoring plan attached as Annexure - 11.

66 Details regarding soil and groundwater impacts and regular monitoring protocols suggested for ensuring no significant impacts, besides preventive measures
Details regarding soil and groundwater impacts are mentioned in Section 4.2.1.2 of Chapter – 4, Page No. 4-3. Monitoring protocols suggested for ensuring no significant impacts are mentioned in Section 5.2.2 of Chapter – 5, Page No. 5-2.
67 Impacts due to laying of pipe lines for effluent collection and for the disposal of the treated wastewaters
Impacts due to laying of pipelines for effluent collection and for the disposal of the treated effluent are mentioned in Section 4.2.2.1 of Chapter – 4, Page No. 4-3.
68
Bathymetric studies need to be conducted and models shall be applied to predict the dispersion patterns to determine the length of the outfall, if disposal is through a marine outfall
Bathymetric studies and dispersion patterns are mentioned in NIO report attached as Annexure - 9.
69 Details of storm water collection network and utilization plan, etc
Storm water drainage line throughout the CETP premises shall be constructed and rain water shall be drained into natural drain.
70 Proposed measures for occupational safety and health of the workers
Health & Safety measures proposed are mentioned in Section 10.5, Chapter 10, Page No. 10-3.
71 Monitoring programme for pollution control at source
Monitoring plan is attached as Annexure - 11.
72
Specific monitoring plan to ascertain that all the CETP member units send their effluent (contracted quantity) to the CETP and the effluent does not in any way find its way to other sources i.e. measures to eliminate by passing of the effluent.
A specific monitoring plan shall be prepared to ascertain that all the CETP member units send their effluent to the CETP. A proposed effluent discharge system at individual member outlet is also shown in monitoring plan. Monitoring plan is attached as Annexure – 11.
73
Monitoring pollutants at receiving environment for the appropriate notified parameters – air quality, groundwater, surface water, etc. during operational phase of the project
Monitoring protocols suggested for ensuring no significant impacts are mentioned in Section 5.2.2 of Chapter – 5, Page No. 5-2.
74 Specific programme to monitor safety and health protection of workers.
Health & Safety measures proposed are mentioned in Section 10.5, Chapter 10, Page No. 10-3.
75 Appropriate monitoring network has to be designed and proposed, to assess the possible residual impacts on VECs
A specific monitoring plan shall be prepared to ascertain that all the CETP member units send their effluent to the CETP. Monitoring plan is attached as Annexure – 11.
76 Details of in-house monitoring capabilities and the recognized agencies if proposed for conducting monitoring
ARAIL (NABL Approved laboratory is already in place which shall be transferred under the management of AWML/AIA in
future. Hence, the available laboratory facilities shall be utilized. However, CETP shall also set own laboratory within premises. Details of laboratory are attached as Annexure - 10.
77 Details on risk assessment and damage control during different phases of the project and proposed safeguard measures
Details on risk assessment and damage control during different phases of the project and proposed safeguard measures are mentioned in Chapter - 10.
78
Details on socio-economic development activities such as commercial property values, generation of jobs, education, social conflicts, cultural status, accidents, etc
Details of socio-economic activities are mentioned in Section 7.5, Chapter - 7, Page No. 7-15.
79 Proposed plan to handle the socio-economic influence on the local community. The plan should include quantitative dimension as far as possible
Details of socio-economic activities are mentioned in Section 7.5, Chapter - 7, Page No. 7-15.
80
Details on compensation package for the people affected by the project, considering the socioeconomic status of the area, homestead oustees, land oustees, and landless labourers
The proposed CETP is within the premises of GIDC Ankleshwar Notified area. No people will be affected by the project.
81
A tabular chartf or the issues raised and addressed during public hearing/consultation and commitment of the project proponent on the same should be provided. An action plan to address the issues raised during public hearing and the necessary allocation of funds for the same should be provided.
The proposed CETP is within the premises of GIDC Ankleshwar Notified area. Ankleshwar GIDC exists since 1978. Hence public hearing is not applicable.
82
Project proponent shall submit detail treatability report with interpretation of residual parameter to ensure further treatment efficiency of FETP of M/s NCT.
The detailed treatability study report is attached as Annexure - 8.
83
Administrative and technical organizational structure to ensure proposed post-project monitoring programme for approved mitigation measures
Organizational setup is mentioned in Figure – 7.1, Section 7.3, Chapter – 7, Page No. 7-3.
84
EMP devised to mitigate the adverse impacts of the project should be provided along with item-wise cost of its implementation (capital and recurring costs).
The total project cost is mentioned in Section 2.2, Chapter - 2, Page No. 2-1. The total capital and recurring costs are mentioned in Section 7.6, Chapter - 7, Page No. 7-18.
85 Allocation of resources and responsibilities for plant implementation
Allocation of resources and responsibilities shall be well planned and executed during the establishment of the CETP.
86 Details of the emergency preparedness plan and on-site and off-site disaster management plan
Details of the emergency preparedness plan and on-site and off-site disaster management plan are mentioned in Chapter - 10.
87 Certificate of accreditation issued by the NABET, QCI to the environmental consultant should be incorporated in the EIA Report
EIA Consultant: M/s. Aqua-Air Environmental Engineers Pvt. Ltd., Consultant has stay order against NABET Accreditation, please refer Annexure - 12.
88
An undertaking by the Project Proponent on the ownership of the EIA report as per the MoEF&CC OM dated 05/10/2011 and an undertaking by the Consultant regarding the prescribed TORs have been complied with and the data submitted is factually correct as per the MoEF&CC OM dated 04/08/2009. (Compliance of OM dated 05/10/2011 & 04/08/2009).
Undertaking by the project proponent and consultant are attached.
89 Project proponent shall submit mitigation plan / action plan for quality or quantity deviation happens during the operation.
All the mitigation plan / action plan for quality or quantity deviation happens during the operation are mentioned in Chapter - 4.
90 Above points shall be adequately addressed in the EIA report at corresponding chapters
91 A tabular chart with index for point-wise compliance of above
GENERAL TORs
1
Reasons for selecting the site with details of alternate sites examined/rejected/selected on merit with comparative statement and reason/basis for selection. The examination should justify site suitability in terms of environmental angle, resources sustainability associated with selected site as compared to rejected sites. The analysis should include parameters considered along with weightage criteria for short-listing selected site.
The location of proposed 10 MLD CETP is within GIDC of Ankleshwar. GIDC has already allotted the proposed land (Plot) for CETP during the planning stage.
2 Details of the land use break-up for the proposed project. Details of land use around 10 km radius of the project site.
The total area acquired for the proposed 10 MLD CETP is 30000 m2. The land area break up for various purposes is mentioned in Section 2.6.1 of Chapter – 2, Page No. 2-34. Present land use pattern of the study area is mentioned in Section 3.9 of Chapter – 3, Page No. 3-43.
3 Details of member units, its production capacity, waste generation, characteristic and details of primary treatment provided by the member units.
Details about the types of the industries that would be covered under the CETP are mentioned in Table – 1.1, Section 1.1.1, Chapter – 1, Page No. 1-2. The quantity of effluent from industries are mentioned in Table - 2.3, Section 2.4.1, Chapter – 2, Page No.2-3. All the industries will commit to achieve the norms to be prescribed by the GPCB.
It is mandatory for the member units to provide a treatment plant based on the quality of their individual effluent to achieve the inlet norms of CETP. The details are mentioned in Section 7.4.2.2.2, Chapter – 7, Page No. 7-6. Policy of CETP shall be framed and all the member industries will have to follow and compliance the policy of CETP. A draft Policy of CETP is attached as Annexure – 15.
4 Details on present treatment and disposal systems
Presently all the effluent from pumping stations – A, B, C drained into Final Pumping Station (FPS). From FPS, entire effluent is pumped to FETP of NCT through underground pipeline.
5 Details of effluent collection system from member units level
Details of mode of effluent collection system is mentioned in Section 1.2.3 of Chapter – 1, Page No. 1-6. Map of upgraded Effluent conveyance pipeline is attached as Annexure - 13.
6 Details of hazardous waste collection. Sill proof arrangement.
Management plan for solid/hazardous waste generation, storage, utilization and disposal is mentioned in Section 2.8 of Chapter – 2, Page No. 2-35.
7 Examine and submit details of inlet characteristics.
Details on physical, chemical and biological characteristics of the combined effluent and its concentrations are mentioned in Section 2.5.1 of Chapter – 2, Page No. 2-32 and also mentioned in Annexure - 8, Treatability study, Point No. 5.1.
8 Details of the CETP with design parameters. Layout plan of CETP. And open spaces.
Complete process is mentioned in Section 2.4.4 of Chapter – 2, Page No. 2-21. The schematic flow diagram of CETP is attached as Annexure - 7. Details of proposed layout clearly demarcating various units within the plant with green belt is attached as Annexure - 6.
9 Details of the adequate power back up facility, to meet the energy requirement in case of power failure from the grid.
The power requirement is met through 2500 KW connecting load of DGVCL (GEB) and emergency standby Diesel Generator Set (1 nos.) of 1000 KVA. The details of Power requirement are mentioned in Section 2.6.4 of Chapter – 2, Page No. 2-34.
10 Details of the usage of treated effluent for green belt development and horticulture.
The treated effluent shall be used for green belt development within CETP premises.

11 Submit a copy of MoU made between the Member units.
A draft of MoU is attached as Annexure – 14.
12 Details of storage facility available at the CETP.
There shall be provision for sufficient water storage all the time for use during emergency situation. All the Raw material shall be stored in dedicated storage area. Solid Hazardous waste shall be stored in dedicated storage area.
13 Examine and submit details of sludge / solid waste generated and method of disposal. MoU in this regard.
Management plan for solid/hazardous waste generation, storage, utilization and disposal is mentioned in Section 2.8 of Chapter – 2, Page No. 2-35. Membership certificate of TSDF of BEIL shall be obtained before the operation of CETP.
14 Details of water requirement, source and water balance chart.
The water will be sourced from GIDC. The supplied water is adequate to meet the requirements of CETP. The details of water requirement and water balance are mentioned in Section 2.6.3, Chapter - 2, Page No. 2-34.
15 Details of green belt Action plan for the green belt development is mentioned in Section 7.4.2.6, Chapter – 7, Page No. 7-12.
16 Details of performance monitoring, lab facility with technical persons.
Details of laboratory are attached as Annexure - 10. Monitoring plan is attached as Annexure - 11.
17 Details of litigation pending against the project, if any, with direction /order passed by any Court of Law against the Project should be given.
No litigation pending against the project.
18 The cost of the Project (capital cost and recurring cost) as well as the cost towards implementation of EMP should be clearly spelt out.
The total project cost is mentioned in Section 2.2, Chapter - 2, Page No. 2-1. The total capital and recurring costs are mentioned in Section 7.6, Chapter - 7, Page No. 7-18.
19 Details of water meters for inflow and outflow monitoring etc.
Flow meter with totalizer shall be provided at inlet and outlet of CETP for monitoring of quantity of effluent on day to day basis.

Declaration by Experts Contributing to the EIA Report of M/s. Gujarat Industrial Development Corporation (GIDC) for 40 MLD CETP, Dahej at Survey No. D-2/14A, Dahej Industrial Estate, PCPIR, Tal: Vagra, Dist: Bharuch, Gujarat.
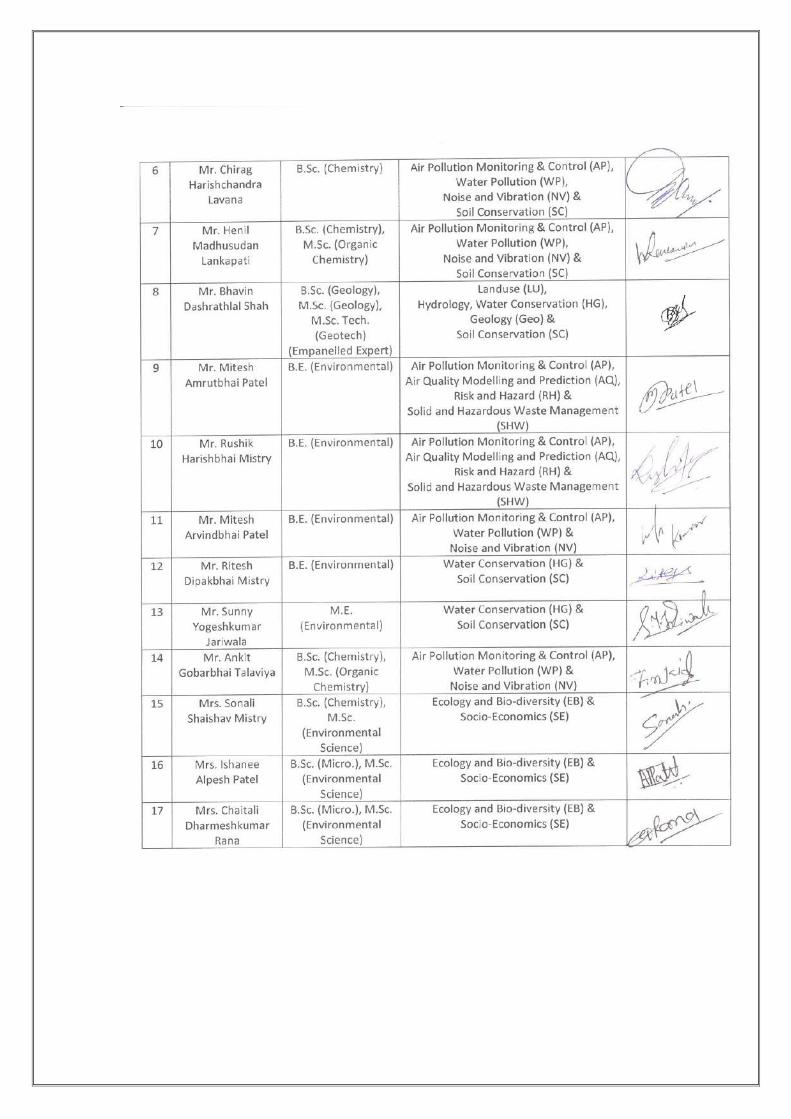

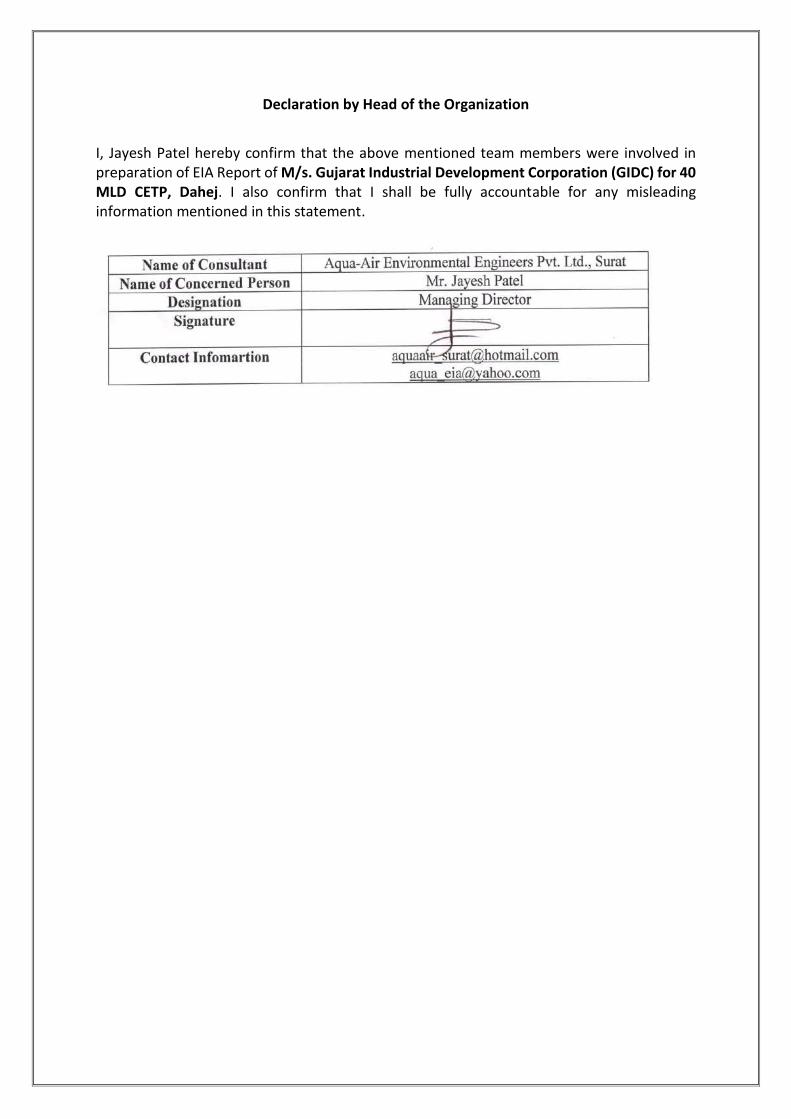
Declaration by Head of the Organization
I, Jayesh Patel hereby confirm that the above mentioned team members were involved in preparation of EIA Report of M/s. Gujarat Industrial Development Corporation (GIDC) for 40 MLD CETP, Dahej. I also confirm that I shall be fully accountable for any misleading information mentioned in this statement.


NOTIFIED AREA AUTHORITY, ANKLESHWAR ENVIRONMENT IMPACT ASSESSMENT REPORT
EIA Report prepared by M/s. Aqua-Air Environmental Engineers Pvt. Ltd. 1- 1
CHAPTER – 1 INTRODUCTION
1.1 BACKGROUND
The Notified Area Authority (NAA) is a functional part of M/s. Gujarat Industrial
Development Corporation (GIDC), an organization undertaken by Government of Gujarat
and a nodal agency of the government of Gujarat for providing Industrial backbone of the
state. GIDC identifies and develops locations suited for Industrial purpose.
The Ankleshwar Industries Association (AIA) was established in 1978 by the industries
located in Ankleshwar GIDC estate.
AIA has promoted Ankleshwar Waste Management Limited (AWML) to carry out
environment related activities in the most efficient manner.
1.1.1 GIDC ACTIVITIES:
o Identification aggregation of land
o Development of land
a. Core infrastructure – developed industrial Plots, Roads, Storm
water Drainage & streetlights, Water supply, Power supply
network, Common facilities like Common Effluent Treatment Plant,
Corridors for amenities – Gas, Telecom, Pipeline etc.
b. Support Infrastructure – Skill up gradation center, Environment
Conservation initiatives, Public amenities, Housing, Commercial
spaces etc.
o Allotment of land
NAA, Ankleshwar located at Notified Area Office, GIDC, Ankleshwar, Di. Bharuch, Gujarat.
NAA, Ankleshwar along with Ankleshwar Waste Management Limited (AWML) proposed
to set up a 10 MLD Common Effluent Treatment Plant (CETP) at Plot No. U-5 (Utility Plot),
adjacent to existing 22.5 MLD STP, GIDC, Ankleshwar.
A team of highly qualified scientists and engineers shall be engaged in this CETP.
NAA/AWML will provide all facilities related to 10 MLD CETP within project premises. The
location of proposed 10 MLD CETP is within GIDC of Ankleshwar. It is located about 0.4
km away from National highway number 8 joining Delhi - Mumbai and about 1.2 km away

NOTIFIED AREA AUTHORITY, ANKLESHWAR ENVIRONMENT IMPACT ASSESSMENT REPORT
EIA Report prepared by M/s. Aqua-Air Environmental Engineers Pvt. Ltd. 1- 2
from railway route from Ahmedabad - Mumbai. The plant is about 1.78 km away from
Ankleshwar city and 350 km away from the commercial capital of India, Mumbai.
The proposed plant is located in a well-developed industrial estate of GIDC Ankleshwar
developed by Gujarat Industrial Development Corporation in early 70s. This industrial
estate is spread over an area of 1600 hectares, which has all essential facilities such as
water, power, fuel, post, telecommunication, bank, etc. It is one of the largest industrial
estates of Asia encompassing number of industries. GIDC Ankleshwar is an Industrial
Estate with more than 1200 industries consisting of Dyes & Chemicals, Chemical,
Pesticides, Pharmaceuticals, Pigment, Textiles and other allied industries.
There are several small, medium and large scale industries in operation in GIDC
Ankleshwar. The types of Industries present in GIDC Ankleshwar are mentioned in Table
– 1.1.
TABLE - 1.1
Types of Industries present in GIDC, Ankleshwar
Sr. No. Type of Industry No.
1 Chemical 294
2 Dyes & Intermediates 169
3 Textiles 17
4 Pulp & Paper 4
5 Pesticides (Technical & Formulation) 46
6 Pharmaceuticals (Technical & Formulation) 85
7 Others 199
Total 814
The Ankleshwar Industries Association (AIA) was established in 1978 by the industries
located in Ankleshwar GIDC estate. Several activities are being undertaken by AIA.
Activities include infrastructure development of estate through member’s participation,
providing guidelines to small scale industries to fulfill various legal requirements, green-
belt development, activities related to environmental preservation and pollution control,
disaster prevention and management, creating awareness among surrounding population
about various issues, etc.
AIA has established industrial and social infrastructure in the area. Today, the estate have
Common Effluent Treatment Plant for treatment and safe disposal if industrial effluent,

NOTIFIED AREA AUTHORITY, ANKLESHWAR ENVIRONMENT IMPACT ASSESSMENT REPORT
EIA Report prepared by M/s. Aqua-Air Environmental Engineers Pvt. Ltd. 1- 3
Secured Landfill site for disposal of hazardous solid waste, Common Incinerator, Effluent
Conveyance Pipeline project for safe conveyance of effluent to deep sea through 55 km
long pipeline, Disaster prevention & Management Center for tackling and controlling
safety hazards, a 60 bed full-fledged hospital for medical facilities, 8 schools for
educational facilities and other social infrastructure.
AIA has promoted Ankleshwar Waste Management Limited (AWML) to carry out
environment related activities in the most efficient manner.
Presently, the effluent generated from the small scale industries within the premises of
GIDC Ankleshwar is either discharged directly into the FETP of NCT through underground
effluent conveyance pipeline or into CETP of ETL through tankers and final pumping
station.
Now AWML along with Notified Area Authority (NAA), Ankleshwar has proposed to set up
a 10 MLD Common Effluent Treatment Plant (CETP) to treat the industrial wastewater
generated from the small scale industries within the premises of GIDC Ankleshwar so that
it meets the inlet standards of the FETP set up by NCT. The treated effluent from the
proposed CETP shall further discharged into FETP of NCT for further treatment and final
disposal into the deep sea through 53 km (Onshore Pipeline: 43.6 km + Offshore Pipeline:
9.4 km) effluent conveyance pipeline.
The proposed CETP falls under the item no. 7(h) i.e. Common Effluent Treatment Plants
(CETPs) and under Category B as per the EIA notification-2006 (as amended timely). Hence
it is required to apply for approval of Terms of Reference (TOR) with Form-I along with
Pre-feasibility Report to the SEAC, Gandhinagar. The EIA study is required to comply with
all the approved ToRs from SEAC. The proposed CETP is located within the premises of
GIDC Ankleshwar. Hence, Public Hearing is exempted for the proposed project. Since this
proposed plant require Environmental Impact Assessment Studies and Environmental
Clearance, the Company has entrusted M/s. Aqua Air Environmental Engineers Pvt. Ltd.,
Surat for carrying out the EIA Studies as per the prevailing rules and regulations.
Company has applied for Environmental Clearance to State Level Expert Appraisal
Committee (SEAC), Gandhinagar on 5th September, 2017. The presentation to State Level
Expert Appraisal Committee (SEAC) was done on 27th September, 2017. ToR has been
finalized in the meeting, including certain additional points. M/s. Aqua Air Environmental

NOTIFIED AREA AUTHORITY, ANKLESHWAR ENVIRONMENT IMPACT ASSESSMENT REPORT
EIA Report prepared by M/s. Aqua-Air Environmental Engineers Pvt. Ltd. 1- 4
Engineers Pvt. Ltd. has carried out the EIA Studies as per the guidelines of Ministry of
Environment & Forests, New Delhi. No alternative has been considered for the proposed
project as GIDC has already reserved the proposed Plot for the CETP. The copy of plot
allotment for CETP is attached as Annexure – 5. However, the suitability of the project
site has been assessed in the report. A mitigation plan has been prepared and a detailed
environmental management plan (EMP) is drawn out to effectively mitigate or minimize
potentially adverse environmental impacts and the details are presented in the following
chapters. This being CETP, there is no manufacturing activity. The total pollution load of
the unit have been tried to evaluate in this report.
1.2 PROJECT DETAILS
The proposed project is a Common Effluent Treatment Plant of capacity 10 MLD located
at Plot No. U-5 (Utility Plot), adjacent to the 22.5 MLD STP, GIDC, Ankleshwar, Di. Bharuch,
Gujarat.
1.2.1 Scope
The scope of the project is to collect and treat the industrial effluent from small scale
industries of GIDC Ankleshwar and after treatment dispose the final treated effluent
into FETP of NCT for further treatment and finally disposed into deep Arabian Sea
through 53 km (Onshore Pipeline: 43.6 km + Offshore Pipeline: 9.4 km) effluent
conveyance pipeline.
1.2.2 Need for the proposed CETP:
At GIDC, Ankleshwar there are several small, medium and large scale industries
in operation. Also so many industries are planning for expansion of their
existing unit by increasing the production capacity or adding the new products.
Also there are new proposed industries to establish their manufacturing
facility.
Looking to the above expansion and new industries scenario the total effluent
generation form the industrial estate going to increase.
The GIDC Ankleshwar is very old GIDC and 70% industrial units are Small Scale
Industries (SSI). The plot area of SSI are small and available space is limited. So
it is difficult to upgrade/modify existing ETP.

NOTIFIED AREA AUTHORITY, ANKLESHWAR ENVIRONMENT IMPACT ASSESSMENT REPORT
EIA Report prepared by M/s. Aqua-Air Environmental Engineers Pvt. Ltd. 1- 5
Presently, the effluent generated from the small scale industries within the
premises of GIDC Ankleshwar is either discharged directly into the FETP of NCT
through underground effluent conveyance pipeline or into CETP of ETL through
tankers and final pumping station. NCT treat the effluent and after achieving
discharge norms, dispose the treated effluent into deep Arabian Sea through
53 km (Onshore Pipeline: 43.6 km + Offshore Pipeline: 9.4 km) effluent
conveyance pipeline.
Now, Medium and Large scale industries are having their own Effluent
Treatment Plant. Such industries are treating their effluent and discharging to
GIDC drainage line to FETP.
Small scale industries (SSI) have limited facilities for effluent treatment.
Hence, to treat the effluent from SSIs of GIDC, Ankleshwar; NAA of Ankleshwar
along with AWML proposed to set up a 10 MLD CETP. Looking to the current
scenario, it is proposed to set up CETP for 7.5 MLD Ind. Effluent + 2.5 MLD
sewage with primary, secondary and tertiary treatment facility. The proposed
CETP shall treat only the effluent from SSIs of GIDC Ankleshwar. The treated
effluent from the proposed CETP shall achieve the FETP norms and discharge
the treated effluent to FETP for further treatment and disposal.
Moreover, there are several advantages of CETP are,
o Professional and trained staff can be made available for operation of
CETP, which is not possible in case of individual plants.
o Disposal of treated wastewater & sludge becomes more organized.
o More organized and ease of monitoring for various regulatory
authorities in ensuring pollution control requirement.
o Small and medium scale industries are not required to treat their
wastewater separately.
o The Common treatment for effluent is cheaper than individual
treatment. Hence, saving in Capital and Operating cost of treatment
plant for individuals.
o Benefits to small scale industries having limited space available for
treatment of effluent.

NOTIFIED AREA AUTHORITY, ANKLESHWAR ENVIRONMENT IMPACT ASSESSMENT REPORT
EIA Report prepared by M/s. Aqua-Air Environmental Engineers Pvt. Ltd. 1- 6
1.2.3 Collection and distribution network:
1.2.3.1 Present scenario of collection and distribution network
GIDC Ankleshwar has modified effluent conveyance system to final pumping station
in last several years.
The drainage system in Ankleshwar GIDC has been upgraded from time to time from
2005 onwards and till 2016 at a cost of more than Rs. 85 crore.
The map showing the various upgraded effluent conveyance pipeline is attached as
Annexure – 13.
The details of such up gradation are given below:
GRP (Glass Fiber Reinforced Plastic) pipeline marked in BROKEN DARK BLUE
color in the map attached as Annexure – 13. This is called IIUS (Industrial
Infrastructure Up gradation Scheme). This is a gravity based line in which the
flow is without any pumping.
GRP (Glass Fiber Reinforced Plastic) pipeline marked in UNBROKEN DARK BLUE
color. This is called CIP (Critical Infrastructure Project) line. This is a gravity
based line in which the flow is without any pumping.
HDPE (High-density polyethylene) pipelines marked in LIGHT BLUE color.
(2015-2016).
HDPE (High-density polyethylene) pipelines marked in LIGHT GREEN color.
(2015-2016).
HDPE pipelines (New Diversion Line) marked in Lighter Orange color (2015-
2016).
Glass Fiber Reinforced Plastics (GRP) pipelines marked in Darker Orange (2015-
2016).
The drainage network in Ankleshwar GIDC consists of a large number of pipelines
which have been laid down in recent years. The pipelines in Ankleshwar GIDC are
working efficiently without any difficulties.
In Ankleshwar GIDC, only about 775 units are chemical industries that
discharge/generate trade effluent. Out of the 775 chemical units, about 245 units send
effluent to CETP by tanker and not by pipeline.
Monitoring mechanism for collection of effluent through pipeline:

NOTIFIED AREA AUTHORITY, ANKLESHWAR ENVIRONMENT IMPACT ASSESSMENT REPORT
EIA Report prepared by M/s. Aqua-Air Environmental Engineers Pvt. Ltd. 1- 7
For monitoring and control purpose, NCT proposed to install Auto sampler and
Flow meter at identified locations.
The process of installing Auto Sampler and Flow Meter has already started in
Ankleshwar GIDC. 2 Meters have already been installed and are functioning. 7
more Meters have already been ordered by NCT. In addition to the 2 Meters
already installed, 18 more Meters are proposed to be installed at identified
locations within the next two to three months. This entire system can be
installed at a cost of about Rs.1 crore.
One is IIUS main line accommodating large scale units(@57) contributing @13 MLD
and second is CIP line accommodating SSI units contributing @10 MLD. With this the
quality and quantity of small scale/large scale units is identified. The auto sampler and
flow meter is provided at final pumping station. Thus, presently approx. 24 MLD
effluent flow is going to FETP through both lines.
Since implementation of underground drainage network, to ensure that a single drop
of waste water is not flowing to the Amravati or other natural creek passing through
the estate by setting up of 3 Pumping Stations – A, B & C and Sewage Treatment Plant
by Ankleshwar Industries Association jointly with the NAA and GIDC. These Pumping
Stations and Sewage Treatment Plant have been fully operating since then.
Presently all the effluent from pumping stations – A, B, C drained into Final Pumping
Station (FPS). From FPS, entire effluent is pumped to FETP of NCT through
underground pipeline.
After completion of proposed 10 MLD CETP the effluent from CIP line accommodating
SSI units contributing @10 MLD shall be treated in proposed 10 MLD CETP. And the
treated effluent confirming the FETP inlet norms shall be drained to FPS for further
treatment in FETP of NCTL.
1.2.3.2 Present scenario of collection and distribution network
GIDC Ankleshwar is already having an underground collection and distribution
network for effluent conveyance as mentioned above.
The existing network is working efficiently without any difficulties.
Presently, the management and maintenance of effluent conveyance system is
maintained by NAA.
NOTIFIED AREA AUTHORITY, ANKLESHWAR ENVIRONMENT IMPACT ASSESSMENT REPORT
EIA Report prepared by M/s. Aqua-Air Environmental Engineers Pvt. Ltd. 1- 8
Only the CIP pipeline network will be utilized for collection of effluent from various
industries in CETP.
Proper Inspection of existing pipeline will be carried out.
Cleaning of pipeline will be carried out as per requirement.
The routine monitoring of entire pipeline shall be carried out.
The entire CETP shall be operated on PLC-SCADA system.
1.2.3.3 Possibilities for above ground pipeline network
GIDC proposed to install aboveground pipeline network for the collection of waste
water generated from industries of GIDC Ankleshwar.
The project for above ground pipeline network is under progress.
Estimated project cost: Rs. 79.22 crores.
1.3 PROJECT SETTING
1.3.1 LOCATION
The proposed CETP will be located adjacent to existing 22.5 MLD STP, GIDC,
Ankleshwar, Di. Bharuch, Gujarat at 21°36'49.87"N Latitude 73°0'12.85"E Longitude.
The location of the proposed project is shown in Figure – 1.1. Detailed layout of the
plant is attached as Annexure – 6.
Important places around GIDC Ankleshwar are:
Ankleshwar city - To the west
Surat City - To the South
Gulf of Khambhat - To the West
The proposed 10 MLD CETP will be located in industrial estate of GIDC Ankleshwar,
which has all important industrial and commercial centers of Gujarat and India.
Location of the Project Site is shown in Figure 1.1.

NOTIFIED AREA AUTHORITY, ANKLESHWAR ENVIRONMENT IMPACT ASSESSMENT REPORT
EIA Report prepared by M/s. Aqua-Air Environmental Engineers Pvt. Ltd. 1- 9
FIGURE - 1.1
LOCATION OF THE PROJECT SITE
he proposed 10 MLD
The location of the proposed location on google map is shown below.
CETP Dahej Project Site
Proposed 10 MLD CETP

NOTIFIED AREA AUTHORITY, ANKLESHWAR ENVIRONMENT IMPACT ASSESSMENT REPORT
EIA Report prepared by M/s. Aqua-Air Environmental Engineers Pvt. Ltd. 1- 10
The nearest city is Ankleshwar located at about 1.8 km. The nearest large city is Surat,
which is about 55 km away and has population of around 44.3 Lac. Natural Gas is
supplied in the estate by Gujarat Gas Co. Ltd. through pipeline for industrial purpose.
Water for industrial purpose is provided by NAA, Ankleshwar. Development of
Communication systems is good in the region due to proximity to Bharuch and Surat.
Sources of water in the region include Canal, river, and ground water resources.
1.3.2 The salient features of the site are as under:
1. Minimum distances:
a. Town : Ankleshwar (1.8 km)
b. Railway station : Ankleshwar (1.3 km)
c. Historical Site : None within 10 km radius area
d. Sanctuaries : None within 10 km radius area
e. Highway : N. H. No – 8 (0.34 km) & S. H. No – 6 (0.35 km)
f. River/Streams : Narmada River (7.2 km)
g. Airport : Surat (60 Km)
2. Use of forest land : None
3. Use of prime agricultural land : None
4. Planned submergence : None
5. Displacement of population : None
1.3.3 KEY INFRASTRUCTURE FEATURES AND SETTLEMENTS
1.3.3.1 METHOD OF DATA PREPARATION
Key infrastructure features have been extracted from Survey of India (SoI) topographical maps
of 1:50,000 scale. The features have been updated using satellite data and have been verified
with ancillary information derived from TTK maps and guide maps. The locations of the
settlement have been extracted from Census of India (CoI) maps and have been verified by
using SoI topographical maps and satellite data.
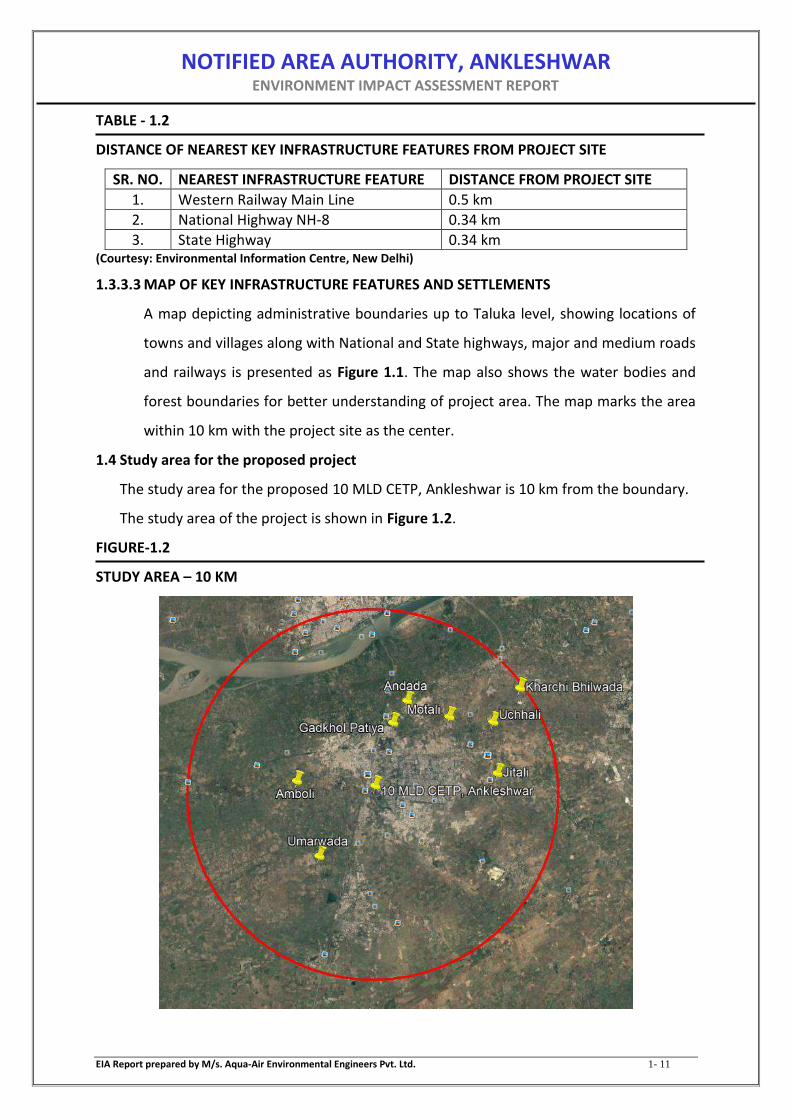
1.3.3.2 DISTANCE OF NEAREST KEY INFRASTRUCTURE FEATURES FROM PROJECT SITE
The distance of railways and National and State highways are presented in Table 1.2 below:
NOTIFIED AREA AUTHORITY, ANKLESHWAR ENVIRONMENT IMPACT ASSESSMENT REPORT
EIA Report prepared by M/s. Aqua-Air Environmental Engineers Pvt. Ltd. 1- 11
TABLE - 1.2
DISTANCE OF NEAREST KEY INFRASTRUCTURE FEATURES FROM PROJECT SITE
SR. NO. NEAREST INFRASTRUCTURE FEATURE DISTANCE FROM PROJECT SITE
1. Western Railway Main Line 0.5 km
2. National Highway NH-8 0.34 km
3. State Highway 0.34 km (Courtesy: Environmental Information Centre, New Delhi)
1.3.3.3 MAP OF KEY INFRASTRUCTURE FEATURES AND SETTLEMENTS
A map depicting administrative boundaries up to Taluka level, showing locations of
towns and villages along with National and State highways, major and medium roads
and railways is presented as Figure 1.1. The map also shows the water bodies and
forest boundaries for better understanding of project area. The map marks the area
within 10 km with the project site as the center.
1.4 Study area for the proposed project
The study area for the proposed 10 MLD CETP, Ankleshwar is 10 km from the boundary.
The study area of the project is shown in Figure 1.2.
FIGURE-1.2
STUDY AREA – 10 KM
NOTIFIED AREA AUTHORITY, ANKLESHWAR ENVIRONMENT IMPACT ASSESSMENT REPORT
EIA Report prepared by M/s. Aqua-Air Environmental Engineers Pvt. Ltd. 1- 12
1.5 Purpose of EIA
The purpose of EIA study is to critically analyzed the construction and operation phase
activity of proposed project activity of CETP with respect to effluent transportation,
operation activities, material consumption, air emission, hazardous waste generation and
control measures to reduce the pollution and to delineate environmental management
plan along with recommendations and suggestions based on the finalized TORs by SEAC,
Gujarat.
1.6 Objectives of EIA
The main objectives of the study are,
1) To assess the background environmental status.
2) To identify potential sources of pollution.
3) To predict and evaluate the impact on environment along with pollution control
measures taken.
4) To prepare a comprehensive Environment and Disaster Management Plan.
1.7 Methodologies For EIA
Taking into consideration proposed project activities, guidelines and TORs, an area of 10
km radius from the center of the project has been selected and is designated as the study
area for the purpose of EIA study. All the components of TORs were studied and
incorporated in this report.
1.7.1 Base Line Environmental Condition
The samples of ambient air, ground and surface water and soil are collected and
analyzed as per the standard methods for establishing the baseline data and to
determine the impact of proposed activity on the same.
1.7.1.1 Ambient Air Environment
The air environment around the plant was studied by setting up ten locations within
the study area of 10 km radius from the project site and collection and monitoring the
site specific meteorological data, viz. wind speed and direction, humidity, rainfall and
ambient temperature. Design of network for ambient air quality monitoring location
is based on guidelines provided by CPCB. The ambient air samples were collected and
analyzed for PM10, PM2.5, SO2 and NOx for prediction, evaluation and assessment of
potential impact on ambient air environment.

NOTIFIED AREA AUTHORITY, ANKLESHWAR ENVIRONMENT IMPACT ASSESSMENT REPORT
EIA Report prepared by M/s. Aqua-Air Environmental Engineers Pvt. Ltd. 1- 13
1.7.1.2 Ground And Surface Water Environment
The water required for domestic and industrial uses is being made available from NAA,
Ankleshwar only. Hence, to assess the Physico-chemical quality of the water, a number
of water samples were collected and analyzed for pollution parameters viz., pH, TDS,
TSS, Turbidity, BOD3, COD, Fluorides, Chlorides, Sulphates, Nitrates, Ammonical
Nitrogen, Hardness, Alkalinity, Iron, Oil & Grease, etc. and heavy metals, in order to
find out the contamination, if any.
1.7.1.3 Noise Environment
Noise pollution survey was conducted in the study zone for evaluating existing status.
The anticipated noise sources were automobile activities, which are likely to be
increased due to proposed activity. Noise levels were also recorded at the noise
generating places and in the surrounding villages for evaluating general scenario of
the study area. Hourly equivalent sound levels (Leq) were also recorded for calculating
Day and Night noise levels in the surrounding villages.
1.7.1.4 Soil Environment
Soil sampling and analysis was carried out to assess physico-chemical characteristics
of the soils and delineate existing cropping pattern, existing land use and topography,
within the study area.
1.7.1.5 Biological Environment
Keeping in view, the importance of biological component of total environment due to
the proposed project, biological characterization of terrestrial and aquatic
environments, changes in species diversity of flora and fauna in terrestrial as well as
aquatic systems were studied for impact analysis due to proposed project activity.
1.7.1.6 Socio-economic Environment
Demographic and related socio-economic data was collected from census handbook
and EIC to assess socio-economic status of study area. Assessment of impact on
significant historical, cultural, and archeological sites/places in the area and economic
and employment benefit arisen out from the project is studied.
1.7.2 Identification of Source of Pollution
CETP operation’s all aspects are evaluated for source of pollution. Also, evaluations
are made about the source of additional effluent and its characteristics.

NOTIFIED AREA AUTHORITY, ANKLESHWAR ENVIRONMENT IMPACT ASSESSMENT REPORT
EIA Report prepared by M/s. Aqua-Air Environmental Engineers Pvt. Ltd. 1- 14
1.7.3 Evaluation of Pollution Control and Environmental Management System
The qualitative and quantitative analyses of various pollution sources as well as
evaluation of pollution control system have been carried out.
1.7.4 Evaluation of Impact
A comprehensive evaluation of environmental impact with reference to proposed
activities are carried out.
1.7.4.1 Preparation of Environmental Management Plan
A comprehensive Environmental Management Plan has been prepared covering all
the aspects of pollution prevention measures, Air and Water Pollution Control
measures, Hazardous Waste Management, Environmental Surveillance and
Environmental Management Plan.
The present EIA report is prepared as per the TORs and monitoring carried out during
post monsoon season of March, 2017 to May, 2017. The baseline environmental
conditions have been established through field monitoring and literature survey. The
contents of EIA report, details of data collection and source of secondary data are
presented in Figure 1.3.
1.8 Structure of report
Environment Impact and Risk Assessment (EIRA) study is carried out as per guidelines
prescribed by MoEF&CC, New Delhi & TORs given by SEAC, Gujarat.
Chapter-1: Introduction
This chapter provides an Introduction of Industry, their premises and surrounding
areas. It is also expressing the basic objectives and methodologies for EIA studies and
work to be covered under each Environment component.
Chapter-2: Project Description and Infrastructural Facilities
This chapter includes Project Description and Infrastructure facilities delineating all
industrial and environmental aspect of GIDC construction and operation phase
activities as well as process details of proposed scenario. This chapter gives
information about storage and handling, water and wastewater quantitative details,
air pollution and control system, sludge storage facility, utilities, greenbelt and safety
measures for proposed project. It also provides information about Environmental
Management facilities to be available at the project site.

NOTIFIED AREA AUTHORITY, ANKLESHWAR ENVIRONMENT IMPACT ASSESSMENT REPORT
EIA Report prepared by M/s. Aqua-Air Environmental Engineers Pvt. Ltd. 1- 15
Chapter-3: Baseline Environmental Status
This chapter provides Base Line Environmental Status delineating meteorological
details and identification of base line status of Environmental components (primary
data) of surrounding area.
Chapter-4: Identification, Prediction and Evaluation of Impact with Environment
Management System
This chapter includes Identification and Prediction of Impact, which provides
quantification of significant impacts of the proposed activities of plant of various
environmental components. Evaluation of the proposed pollution control facilities is
also carried out in this chapter.
Chapter-5: Environmental Monitoring Plan
This chapter includes Environment Monitoring plan with monitoring parameters,
monitoring and analysis methods, monitoring frequency, documentation and records.
Chapter-6: Project benefits
This chapter includes project benefits to environment and society.
Chapter-7: Environmental Management Plan
This chapter includes Environment management, pollution control measures.
Chapter-8: Executive summary
This chapter includes summary of projects giving a prima facie idea of the objectives
of the proposal, use of resources, justification, etc. In addition, it provides a
compilation of EIA report, including EMP and post project monitoring plan in brief.
Chapter-10: Risk Analysis & Disaster Management Plan
This chapter provides details of Risk Analysis and Disaster Management Plan; it
provides basis for what should be type and capacity of its on-site and off-site
emergency plan also what types of safety measures are required.
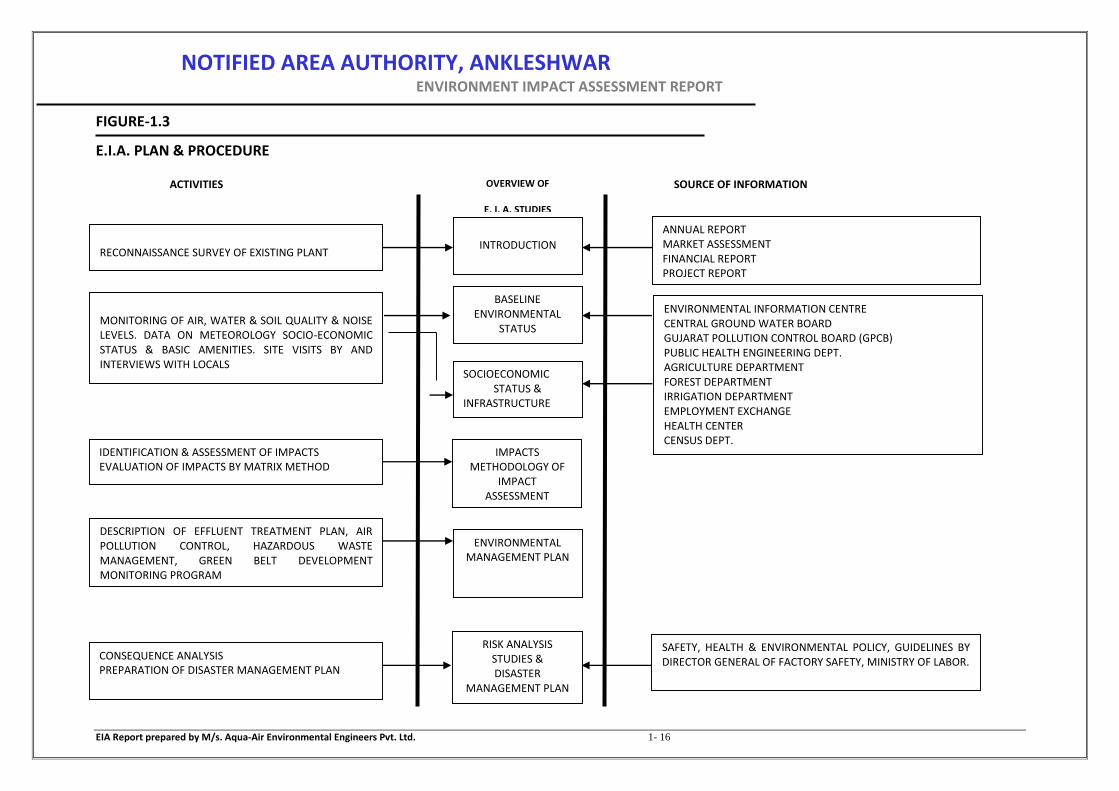
NOTIFIED AREA AUTHORITY, ANKLESHWAR ENVIRONMENT IMPACT ASSESSMENT REPORT
EIA Report prepared by M/s. Aqua-Air Environmental Engineers Pvt. Ltd. 1- 16
FIGURE-1.3
E.I.A. PLAN & PROCEDURE
RECONNAISSANCE SURVEY OF EXISTING PLANT
ANNUAL REPORT MARKET ASSESSMENT FINANCIAL REPORT PROJECT REPORT
INTRODUCTION
MONITORING OF AIR, WATER & SOIL QUALITY & NOISE LEVELS. DATA ON METEOROLOGY SOCIO-ECONOMIC STATUS & BASIC AMENITIES. SITE VISITS BY AND INTERVIEWS WITH LOCALS
BASELINE ENVIRONMENTAL
STATUS
ENVIRONMENTAL INFORMATION CENTRE CENTRAL GROUND WATER BOARD GUJARAT POLLUTION CONTROL BOARD (GPCB) PUBLIC HEALTH ENGINEERING DEPT. AGRICULTURE DEPARTMENT FOREST DEPARTMENT IRRIGATION DEPARTMENT EMPLOYMENT EXCHANGE HEALTH CENTER CENSUS DEPT. INDIAN METEOROLOGICAL DEPT.
SOCIOECONOMIC STATUS &
INFRASTRUCTURE
IMPACTS METHODOLOGY OF
IMPACT ASSESSMENT
IDENTIFICATION & ASSESSMENT OF IMPACTS EVALUATION OF IMPACTS BY MATRIX METHOD
SOURCE OF INFORMATION OVERVIEW OF
E. I. A. STUDIES
ACTIVITIES
ENVIRONMENTAL MANAGEMENT PLAN
DESCRIPTION OF EFFLUENT TREATMENT PLAN, AIR POLLUTION CONTROL, HAZARDOUS WASTE MANAGEMENT, GREEN BELT DEVELOPMENT MONITORING PROGRAM
RISK ANALYSIS STUDIES & DISASTER
MANAGEMENT PLAN
SAFETY, HEALTH & ENVIRONMENTAL POLICY, GUIDELINES BY DIRECTOR GENERAL OF FACTORY SAFETY, MINISTRY OF LABOR.
CONSEQUENCE ANALYSIS PREPARATION OF DISASTER MANAGEMENT PLAN

NOTIFIED AREA AUTHORITY, ANKLESHWAR ENVIRONMENT IMPACT ASSESSMENT REPORT
EIA Report prepared by M/s. Aqua-Air Environmental Engineers Pvt. Ltd. 2- 1
CHAPTER – 2 PROJECT DESCRIPTION AND INFRASTRUCTURAL FACILITIES
2.1. BACKGROUND
The Notified Area Authority (NAA) is a functional part of M/s. Gujarat Industrial
Development Corporation (GIDC), an organization undertaken by Government of Gujarat
and a nodal agency of the government of Gujarat for providing Industrial backbone of the
state. GIDC identifies and develops locations suited for Industrial purpose.
The Ankleshwar Industries Association (AIA) was established in 1978 by the industries
located in Ankleshwar GIDC estate.
AIA has promoted Ankleshwar Waste Management Limited (AWML) to carry out
environment related activities in the most efficient manner.
2.2. Project cost
Total capital investment for the proposed project activities is Rs. 70.54 crores. It includes
site development, building, plant machineries, environment protection measures cost, etc.
Break up of proposed investment is shown in Table-2.1.
TABLE-2.1
BREAK UP OF PROPOSED PROJECT COST
Sr. No.
DESCRIPTION Cost of component
Rs. in corers
1 Civil 33.83
2 Mechanical 21.21
3 Electrical 5.31
4 Process Imstruments 3.21
5 Laboratory equipments 1.15
Cost Of CETP 64.71
PMC charges @5% 3.24
QC charges @1% 0.65
Add 3% contingency 1.94
TOTAL ESTIMATED PROJECT COST 70.54
2.3. PROJECT ACTIVITIES
2.3.1. PRE CONSTRUCTION ACTIVITIES
The proposed project is located within GIDC, Ankleshwar. Since, there is a clear
provision of land for proposed project and proposed project is located on level
ground which does not require any land filling for area granding work and any

NOTIFIED AREA AUTHORITY, ANKLESHWAR ENVIRONMENT IMPACT ASSESSMENT REPORT
EIA Report prepared by M/s. Aqua-Air Environmental Engineers Pvt. Ltd. 2- 2
cutting of the plantation at the site. The site is to be cleaned and leveled in a
way so that there is no additional soil to be brought from out side. Approach
road is readily available to access the site hence no major pre-construction
activities are anticipated.
2.3.2. CONSTRUCTION ACTIVITIES
All Construction and commissioning activities of proposed project activities
shall be carried out after getting Environmental Clearance from SEAC, Gujarat.
Erection of various machineries shall start simultaneously. Since this is
developed area, there is no site development activity.
Minor site clearance activities shll be carried out to clear srubs and weed.
Constuction of CETP units which include excavation.
Construction of internal roads for reaching various sections of units.
Construciton of sheds and other essential utilities shall be carried out.
Construction materials required for the project like steel, cement, crushed
stones, sand, rubble, etc. shall be procured from the local market of the region.
2.3.3. RAW MATERIAL HANDLING AND STORAGE
The major raw materials like hydrate lime, Poly Aluminium Chloride (PAC),
Polyelectrolyte, Phosphoric acid, Sodium busulfite, Activated carbon, Chlorine
etc. used at proposed CETP. All these raw materials shall be received in bags
(lime), drums and rubber lined tankers. All the raw materials shall be stored
within premises in separate storage area. Raw Material consumption details is
given in Table-2.2.
TABLE-2.2
RAW MATERAIL CONSUMPTION
Name of Raw material Consumption of reagent
Kg/m3 Mt/ day Mt/ month
PRIMARY
Lime 1.500 18.750 450.000
12-13 % PAC (Poly Alluminium Chloride) 1.200 15.000 360.000
PE 0.001 0.013 0.399
50 % phosphoric acid 0.040 0.500 12.000
TERTIARY
Lime 1.000 12.500 300.000
Chlorine 0.350 4.375 105.000

NOTIFIED AREA AUTHORITY, ANKLESHWAR ENVIRONMENT IMPACT ASSESSMENT REPORT
EIA Report prepared by M/s. Aqua-Air Environmental Engineers Pvt. Ltd. 2- 3
Sodium bisulfite 0.150 1.875 45.000
Activated carbon 0.066 0.825 19.800
PAC 0.500 6.250 150.000
PE (Polyelectrolyte) 0.001 0.013 0.399
2.4. PROJECT DESCRIPTION
The GIDC, Ankleshwar is occupied by industries involved in manufacturing of Dyes &
Chemicals, Dye intermediates, Pharmaceutical, Pesticide, Pigment, textiles industries,
etc. The proposed designed capacity of the common effluent treatment plant (CETP)
is 10 MLD.
2.4.1. DETAILS OF EXISTING INDUSTRIES FOR PROPOSED 10 MLD CETP
The details of expected member industries for proposed 10 MLD CETP in GIDC,
Ankleshwarin are shown in Table – 2.3.
TABLE-2.3
DETAILS OF MEMBER INDUSTRIES FOR PROPOSED 10 MLD CETP
SR. NO.
NAME OF INDUSTRIES ADRESS/PLOT
NO CATEGORY
Qty. of effluent to CETP,
KLD
1 PARISHI CHEMICALS C1B/6916-17-
18, Dyes 60
2 KASTURI POLYMERS & PIGMENTS ,4517, Pigment 15
3 AKSHAR ASSOCIATES .C1/B/3902 Dyes & Chemical 8
4 SHREE MAHAKALI DYES & CHEMICALS C1/413, Dyes & Chemical 14
5 CARDKEM PHARMA P LTD .2301-02. pharma 50
6 JAY AGRO INDUSTRIES .5805 G Chemical 10
7 ALEX INDUSTRIES 9109/4-5 Chemical 15
8 ALEX life science (UNIT-II) A1-7808 Chemical 10
9 ANADI KRISHNA COLOURS 9113/2 Pigment 35
10 SHREE AMBE COLOR CHEM 729 Pigment 15
11 LAXMI HEALTHCARE 6120/1 pharma 33
12 VARNIRAJ CHEMICALS 6611 Chemical 7
13 SNEHAL DYES INDUSTIRES C-/6819 Dyes 14
14 SHREENATH CHEMICAL INDUSTIRES .6814-18 Chemical 18
15 SHRRENATH CHEMICAL INDUSTIRES (UNIT-II) .5902 /1 Chemical 30
16 SHREE AVANI PHARMA .J/1204. pharma 20
17 PRAGNA CHEMICAL INDUSTIES 2303/A Chemical 35
18 RUDRAAKSH SILK MILL .A-2/2215, Chemical 8
19 VIBHA LIFE SCIENCES P LTD .J-1203 pharma 15
20 CHEM-PACK INDUSTRIES 4707/A/1 Chemical 3

NOTIFIED AREA AUTHORITY, ANKLESHWAR ENVIRONMENT IMPACT ASSESSMENT REPORT
EIA Report prepared by M/s. Aqua-Air Environmental Engineers Pvt. Ltd. 2- 4
21 BHARAT INDUSTIRES 4707/A/2 Chemical 3
22 RAGHUVIR CHEMICALS .6217/4 &5 Chemical 3
23 CHEVRON PHARMA 6505. pharma 30
24 K.K. TEXTILES (UNIT-1) 5063 Chemical 10
25 K.K. TEXTILES (UNIT-2) 5904/2&5905/4 Chemical 50
26 KRISHNA CHEMICALS 6911 Chemical 15
27 KOHINOOR CHEMICALS C-1/7014 Chemical 16
28 KOHINOOR COLURS P LTD (UNIT-1) 7204 & 7205 pigment 15
29 KOHINOOR COLOURS P LTD (UNIT-2) 5107 pigment 7
30 KENOOR DYE CHEM 7210 Dyes 15
31 KENOOR ORGANICS P LTD 5006 Pharma 10
32 MEETA COSMETICS 4315 pharma 4
33 SIGMA CHEMOPHARMA P LTD C-1/B-4755 &
4756 pharma 10
34 RELIANCE CHEMICALS 4794 Chemical 7
35 UNITY CHEMICALS 4801 Chemical 4
36 DANOPHARM CHEMICALS PVT LTD C-1/7131.32.33 Chemical 100
37 V R CHEMICAL 5149 Chemical 70
38 ANJANI INDUSTRIES 7616 Chemical 50
39 KEVAL DYECHEMI 7606 Dyes 50
40 COLOCHEM INDIA C1/4766 Pharma 16
41 AMSAL CHEM P LTD A-1 ,401 TO 403 Pharma 0
42 CAB CHEMICALS 221/222 Chemical 22
43 RISHABH DYE CHEM INDUSTIRES 223 Dyes & chemical 14
44 RUKUL INDUSTIRES 1705 Dyes & chemical 20
45 MARUTI INDUSTRIES 4801/A/1 Chemical 50
46 MICRO TECH INDIA 5046 Chemical 50
47 POOJA INDUSTREIS 317,PANOLI Chemical 50
48 GUJRAT GLYCOLS P LTD 7503 Chemical 50
49 SAHYOG INDUSTRIES 3212,PANOLI pigment 50
50 TECHNO CHEM INDUSTIRES 9102/2 Chemical 50
51 HI-TECH PACKAGING C1B/7106 Chemical 5
52 BLITZKRIG ORAGANICS & BIOCHEMICALS IND 5067 Chemical 10
53 A.S.CHEMICALS 9108/1 Chemical 3
54 WHITEX CHEMICALS 6808 Chemical 40
55 VASANT CHEMICALS 3918 Chemical 10
56 HARISH CHEMICAL ENGG.ENTERPRISE 3903 Chemical 50
57 MANIsH INDUSTRIES 3921 Dyes & chemical 40
58 MAHENDRA DYES AND CHEMICAL C-1/6828 Dyes & chemical 40
59 RIDDHI PHARMA A-2/2509-10-11 Pharma 20
60 JAY LIFESCIENCES P LTD 5184-5185 Pharma 34
61 JAY CHEM INDUSTIRES 6713-14/1 Chemical 44
62 SHREE CHEMOPHARMA ANKLESHWAR P LTD (UNIT-II)
312-323 Pharma 10
63 SHREE CHEMOPHARMA ANKLESHWAR P LTD 313/13,14 Pharma 13

NOTIFIED AREA AUTHORITY, ANKLESHWAR ENVIRONMENT IMPACT ASSESSMENT REPORT
EIA Report prepared by M/s. Aqua-Air Environmental Engineers Pvt. Ltd. 2- 5
64 JIGAR INDUSTRIES 3709/5 &
3710/10/2/A pigments 150
65 FINORNIC CHEMICALS INDIA P LTD 6234 Chemical 20
66 SHREEJI PIGMENT C /1/B/3416 Chemical 22
67 TVISHA IMPEX 501/B pigments 10
68 M.R. ENTERPRISE 502/21 Chemical 10
69 RUSHITOYA INDUSTRIES (UNIT-1) 3459 Pigment 10
70 RUSHITOYA INDUSTREIS (UNIT-2) 3458 Pigment 10
71 RASHDEEP CHEMICALS 3451/A/B,3452 Chemical 15
72 RMG PHARMACHEM 11005 Pharma 12
73 HOLYLAND CORPORATION 3302/D go 15
74 STERLING CHEMICAL INDUSTRIES 113/2 Chemical 15
75 ANJU LIFE SCIENCE 6007/1 Chemical 20
76 MITTOLIA CHEMICAL IND 113/1 Chemical 15
77 SULESHVARI HEALTHCARE 2806/C Pharma 40
78 SULESHVARI PHARMA 6012/1 Pharma 30
79 HEM DEEP ORGANICS P LTD 3801/2 Pharma 30
80 DARSHAN PHARMACHEM P LTD 3609 Pharma 150
81 VISHWA CHEMICALS 4801/A/ A-13 Chemical 3
82 PERFECT CHEMICALS 4801/A/15 Chemical 3
83 EFKAM ORGANICS 4801/A/10 & 11 Chemical 3
84 SHARMIK CHEMICALS 6904 Dyes & Chemical 7
85 SAFFRON EXIM C1-B-7112 Dyes 7
86 SHREE MAHAKALI PHARMACHEM 5106 Pharma 3
87 RADHESHWAR RASAYAN A-2/4004 Chemical 10
88 DWARKESH TRADE LINK 4505 Chemical 10
89 ADJ LINK 5186 Chemical 10
90 M-CHEM CORPORATION 6409 Chemical 10
91 MAMATA CHEMICALS 6704 Chemical 10
92 JAY GANESH CHEMICALS 5733 Chemical 10
93 APEX HEALTHCARE LTD 4710 Pharma 50
94 PALCHIN CHEMICALS 5236 Chemical 1
95 ASTIK DYESTUFF P LTD 707 /B&C Dyes 10
96 JAY PROCESS 5732 Chemical 10
97 JAY COLOURS 285/2 Pigment 10
98 K.D.ENTERPRISE 2900/91 Chemical 4
99 SHIPURA INDUSTIRES L/6219/3 Dyes 4
100 RONAK CHEMICALS 4709/1 Chemical 15
101 POONAM PROCESSORS P LTD A-1/164 Textile 49
102 CHEMET WEST & FLOWS P LTD 129/C/2 Chemical 5
103 CHEMET CHEMICALS P LTD 6230/6231/6215 Chemical 20
104 SYNTHETIC DRUGS & INTERMEDIATES 6503 Pharma 12
105 MAKSONS FINE CHEM P LTD 327,P.B.NO.36 Pharma 60
106 GALAXY DYESTUFF INDUSTIRES 1101/2 Dyes 10
107 GLOBE CORPORATION 1410/C Chemical 7

NOTIFIED AREA AUTHORITY, ANKLESHWAR ENVIRONMENT IMPACT ASSESSMENT REPORT
EIA Report prepared by M/s. Aqua-Air Environmental Engineers Pvt. Ltd. 2- 6
108 SUN WHITE CHEMICALS C1B,3421 Chemical 7
109 SUN WHITE CHEMICALS C1B,3420 Chemical 7
110 SUNIT DYE CHEM INDUSTRIES C1-3430 Dyes 2
111 MEDICARE INDUSTRIES 4734 Pharma 3
112 SURYA LIFE SCIENCES LTD 3606 & 3616 Pharma 25
113 KANGAROO INDUSTIRES A1-4906/10 Pigment 2
114 KANGAROO INDUSTIRES 1806-1807 Pigment 25
115 PAYAL CHEMICALS 5251 Chemical 20
116 BASIC PHARMA LIFE SCIENCE P LTD 146/B Pharma 10
117 ASIATIC GREEN AGRICO P LTD 5056 Chemical 10
118 POONAM INDUSTRIES 7314/5 Chemical 10
119 AKHILESH ENTRPRISE A-1/4012 Chemical 10
120 BHAKTI PRODUCTS J-1714 Chemical 7
121 CHEM STAR CROP SCIENCE 6106/A Chemical 8
122 AGRO CHEM INDUSTRIES J-1715 Chemical 7
123 M J FINE CHEM 9109/6 Chemical 5
124 PARIMAL INDUSTRIES 9109/3 Chemical 3
125 MAHADEV INDUSTIRES 1505 Chemical 10
126 SHREE MAHADEV INTERMEDIATE 1509 Chemical 15
127 SHIV CORPORATION (UNIT-1) 502/22 Chemical 20
128 SHIV CORPORATION (UNIT-2) 502/22 Chemical 7
129 SHIV INTERNATIONAL 712/B Chemical 10
130 SHREEJI ENTERPISE 3002/39 pigment 0
131 SUN INDUSTRIES 7830/2 Pharma 30
132 HEMA PHARMACEUTICALS P LTD 6201/A pharma 105
133 SHREENEEL CHEMICALS 281 Chemical 40
134 JACKSON CHEMICAL INDUSTRIES 502/4,5,6 Chemical 39
135 GOLD STAR CHEMICALS P LTD 5902 Chemical 8
136 NEPTUNE INUSTRIES A-6104/1 &2 Chemical 15
137 J.S.CHEMICALS 4801/A/B Chemical 15
138 PROLIFE HAIR HEALTH CAR P LTD 1106/B pharma 5
139 SHREE RAM CHEMICALS C1-7009 Chemical 5
140 NAVADIA PLAST 5706/2 & 5707 pigment 10
141 SHAI AMBICA ORGANIC CHEMICALS 6721 Chemical 3
142 BHAGAVATI CHEM TECH 6807 Chemical 2
143 REE MAAN RASAYAN 4772 Chemical 3
144 SUPERNOVA INTERMEDIATES PRIVATE LIMITED
1212 Chemical 15
145 DYNEMIC COLOURING LIVES 3710/3 pigment 0
146 DYNEMIC COLOURING LIVES 3709/6 pigment 0
147 DYNEMIC COLOURING LIVES 6401,6402, pigment 0
148 KETIX CHEMICALS 501 Chemical 13
149 RAJJESH CHEMICALS INDUSTIRES 1818 TO 1820 Chemical 16
150 VANDANA CHEMICALS 7409 Chemical 16
151 INNOVATIVE LIFE SCIENCE 9107/02 Pharma 0

NOTIFIED AREA AUTHORITY, ANKLESHWAR ENVIRONMENT IMPACT ASSESSMENT REPORT
EIA Report prepared by M/s. Aqua-Air Environmental Engineers Pvt. Ltd. 2- 7
152 REINE LIFESCIENCE 5901 Pharma 0
153 DOLPHINE CHEM 6506 Chemical 35
154 SHUBH LIFE SCIENCE 703/1 Pharma 3
155 TAO CHEMICALS 6222 Chemical 15
156 INTEGRAL CHEMICAL FACTORY 6226 Chemical 14
157 ACQURATE ENGITECH LTD 147-148 Chemical 0
158 WINGS OSHO COMPONENTS A-1/447 Chemical 25
159 DAYARAM HEALTHCARE A-1/4906/17 Pharma 5
160 HEPRA HEALTHCARE LIMITED 11/10/3809 Pharma 20
161 M.G TRADING 11005 Pharma 12
162 M.G CHEMICALS 1502/1 Chemical 2
163 SIDDHI SAMRAT 6405 Dye& Chemical 20
164 MEHUL DYE-CHEM INDUSTRIES 1803 Dye& Chemical 31
165 DHOLARIA ORGANICS 6207 Chemical 30
166 DHOLARIA INDUSTRIES 6207/1 Chemical 27
167 AKRUTI CHEMICALS 5163 Chemical 21
168 EFFLUX INDUSTRIES C-1/435 Dyes&chemical 9
169 ELEGANT COLOURS C-1/436 Pigment 12
170 SUNBHEM PHOTOCHEM PVT.LTD 4787 Chemical 1
171 ZCL CHEMICALS LTD 3102/B Chemical 155
172 SEJAL CHEM TECH-INDUSTRIES C1 B - 7118 Chemical 40
173 ANMOL MARKETING 5905/4/A CHEMICAL 45
174 NILKANTH DYESTUFF INDUSTRIES C/1-6820 DYES 20
175 MOHAN POLYFAB PRIVATE LIMITED 65,096,510 60
176 NORRIS MEDICINES LIMITED 801/P pharma 2
177 RAJSHREE INDUSTRIES 7515 dyes 5
178 ADVANCE DYE-CHEM INDUSTRIES A2/2214 dyes 26
179 J.S. INDUSTRIES 1517 20
180 UMA ORGANIC & CHEMICALS 3816 CHEMICAL 20
181 HEMANI INDUSTRIES LIMITED UNITT 2 3207/A&B Pharma 40
182 KA MALLE PHARMACEUTICAL LTD 6005 Pharma 91
183 ROCKY CHEMICALS 4729 CHEMICAL 67
184 SURAJ DYE CHEM 1106/C dyes & chemical 20
185 SIDDHI DYES & CHEMICALS C1-B-5406-07 dyes& chemical 7
186 KASA COLOUR CHEM 7517 dyes& chemical 8
187 S.B.CHEM FAB 5217 Chemical 1
188 S.B.CHEM-O-PHARMA C1-B/2015 dyes 1
189 S.B.INDUSTRIES 5217 pigments 1
190 SIDDHARTH INTERCHEM PVT LTD 6232 Dyes&chemical 5
191 PRUDENCE PHRMA CHEM 7407 Pharma 7
192 PGC DRUGS PVT.LTD 6104 dyes 24
193 MUGAT DYE CHEM 1923 pigments 10
194 JAY INDUSTRIES 601 Chemical 15
195 MODEHESHWARI CHEMICALS A-1/1511 Chemical 30
196 MODEHESHWARI CHEMICALS A-1/2402 Chemical 30

NOTIFIED AREA AUTHORITY, ANKLESHWAR ENVIRONMENT IMPACT ASSESSMENT REPORT
EIA Report prepared by M/s. Aqua-Air Environmental Engineers Pvt. Ltd. 2- 8
197 MODEHESHWARI CHEMICALS j/7017 Chemical 30
198 PRAGNA DYECHEM PVT.LTD 1210 Chemical 20
199 SHIVAM PRODUCTS 4797 Chemical 10
200 MAYUR ASSOCIATES 4705 Chemical 10
201 MAYUR COLOUR& CHEMICALS 5148 pigments 10
202 MAYUR DYE CHEM 4705 dyes 5
203 STRIDE INDUSTRIES 7613/1 Pharma 3
204 KRISHNA ENTERPRISE 7612 Chemical 3
205 BRILLIANT COLOURS 1601/5 Pigments 10
206 SHREE HARI CHEMICALS C1B/2518 Chemical 7
207 SHREE SULPHUICS PVT.LTD 2801/A Chemical 0
208 NARUSA INDUSTIES 6724 Chemical 1
209 OCEAN CHEMICAL INDUSTRIES 6810 PIGMENTS 5
210 NILKANTH REFINES C1/5508/9 Chemical 24
211 MANGLAM CHEMICALS 4705/1/5 CHEMICALS 24
212 NAVADIA FINE CHEM 1309 CHEMICALS 24
213 NAVADIA REFINES 1308 CHEMICAL 24
214 SKOVA PHARMACHEMS 6110 Pharma 15
215 ANMOL CHEMICALS PVT LTD. A-2/4006 CHEMICAL 11
216 SHREYAS CHEMICALS 1801 CHEMICAL 4
217 SIDDHI DYES & CHEMICALS UNIT - 2 51583 CHEMICAL 20
218 ADARSH DYE CHEM DYE CHEM 33
219 LAURAL LIFE SCIENCE 6507 PHAEMA 10
220 NIVIKA CHEMO PHARMA 16,021,603 Pharma 33
221 NIVIKA CHEMO PHARMA PVT.LTD 1808,1809/2 Pharma 33
222 SAMIP CHEMICALS PVT LTD 703,704/1 DYES 20
223 OHM SAI INDUSTRIES C-1/B-2017 DYES 13
224 NIRAJAN CHEMICALS 5142 CHEMICAL 15
225 VIBHAO LIFE SCIENCES PVT.LTD J-1203 PHARMA 15
226 SHIVAM ORGANICS 9106/1&2 1
227 MAITRY NANO INDUSTRIES J-
7823,7828/4&5 20
228 GALAXY LIFE SCIENCE 6104/13/A2 PHARMA 23
229 JIYA OVERSEAS 4707,A/15 8
230 KAVYA CORPORATION 4707,,A/14 5
231 PARVATI OVERSEAS 712A/713 5
232 BM PHARMACHEM910PVT LTD 4507 pharma 2
233 S-TECH ENTERPRISE 4707,a/13 5
234 PRAYOSHA HEALTH CAR PVT LTD 6209 7
235 OM SHIV INDUSTRIES 6606 7
236 SHREE CHEMOPHARMA ANKLESHWAR PVT LTD
313/10,11 4
237 K.D ENTERPRISH 2900/91 DYES 1
238 AVINASH INDUSTRIES 2900/3 pigments 25
239 PEARL CHEM 2900/118 pharma 30

NOTIFIED AREA AUTHORITY, ANKLESHWAR ENVIRONMENT IMPACT ASSESSMENT REPORT
EIA Report prepared by M/s. Aqua-Air Environmental Engineers Pvt. Ltd. 2- 9
240 AVI INDUSTRIES 303/A pigments 25
241 ADVANCE DYE STUFF INDUSTRIES 9104/1 2
242 BHUMI TECHNO PACK 4906/A 2
243 RONAK CORPORATION 2513 A/C-1B 10
244 WEST COAST PIGMENTS CORPORATION 2408 10
245 KAYUR CORPORATION 440/C-1 10
246 VIOLET PIGMENT& CHEMICALS INDUSTRY 2521 10
247 JAY OVERSEAS A/2,4002 3
248 MAHAVIR LABORATORIES 3702 4
249 SHRADDHA CHEMICALS (UNIT 2) 6802 6
250 SHRADDHA CHEMICALS 6803 12
251 LAXMI HEALTHCARE 6120/1 15
252 SEMIENITE EXPORTS C1B-3910 3
253 RADAR FINECHEM INDUSTRIES 1501 5
254 DEXTER BIOCHEM PVT LTD A1,5302/03 20
255 S-TECH ENTERPRISE 4707,A/13 5
256 NIRANJAN LABORATORY 313/16/3 5
257 NIRANJAN PETRO CHEM C1B-5230/5229 17
258 OSWAL UDYOG 8006/3 10
259 OSWAL UDYOG 8006/2 10
260 OSWAL UDYOG 8006/1 10
261 KASTURI POLYMERS & PIGMENTS 4517 4
262 PARISHI CHEMICALS 6916-6918 5
263 DIPEN INDUSTRIES 1702&1706/10 120
264 GRO RECLAIM RUBBER 618-619 25
265 ZENI LIFESCIENCES 2806/A 10
266 ZENI BIOTECH A2-7801 5
267 ABHILASHA PHARMA PVT LTD 14,081,409 20
268 SHREE MAHAKALI INDUSTRIES 5404 5
269 SHIV SHAKTI CHLORIDE &CHEMICALS 5018 5
270 SHREE MAHAKALI DYES &CHEMICALS C1/413 14
271 INDOKEM LIMITED 2900 1490
272 OMKAR CHEMICALS 9103/2 10
273 SHREE SATYA SAI INDUSTRIES 20
274 DATTATREY CHEMICALS 5
275 JINESH INDUSTRIES 4728 15
276 ZELIANT INDUSTRIES 2900/25,26,27 30
277 ZELIANT INDUSTRIES 2900/32,33,34 30
278 MAHESH INDUSTRIES C-1-4767 5
279 SUKHA CHEMICAL 4705/1/6,7 5
280 STANDARD CHEMICALS 4506 15
281 BASIC PHARMA LIFE SCIENCE PVT LTD 146/B 20
282 STARLET INDUSTRIES 4314 5
283 ATRI CHEMOPHARMA PVT LTD 5729&30 14
284 BAKUL PHARMA PRIVETE LIMITED 6202 60
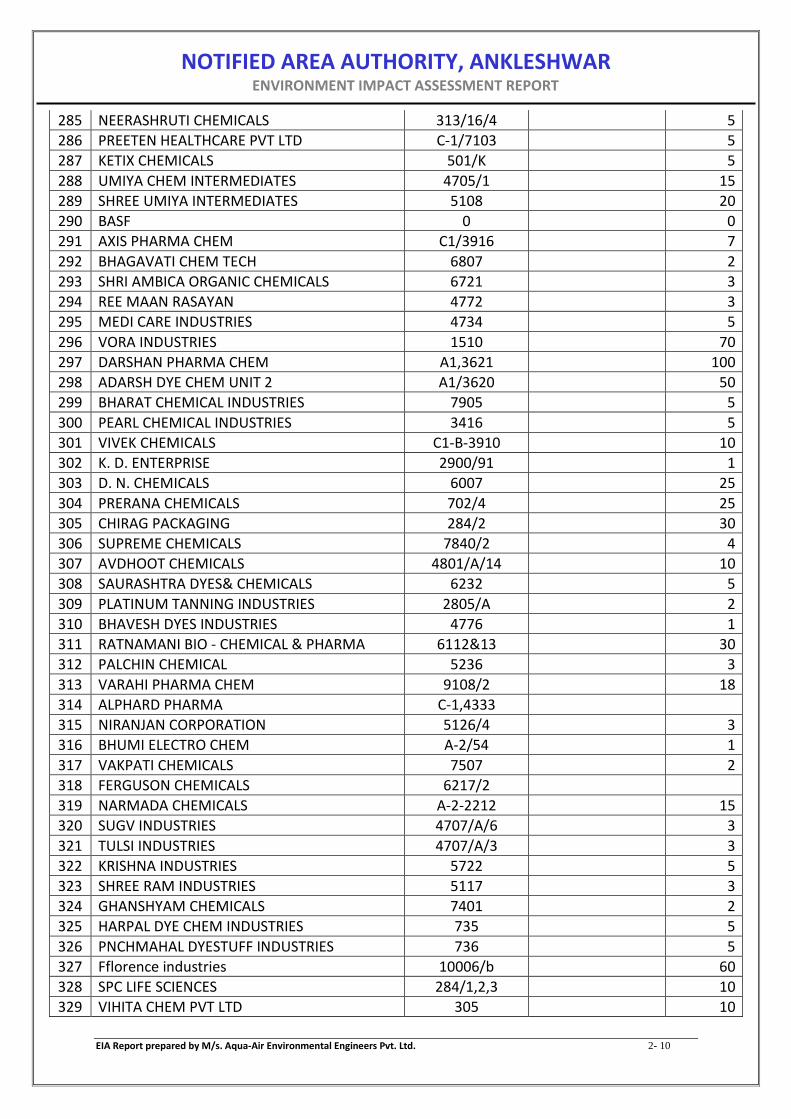
NOTIFIED AREA AUTHORITY, ANKLESHWAR ENVIRONMENT IMPACT ASSESSMENT REPORT
EIA Report prepared by M/s. Aqua-Air Environmental Engineers Pvt. Ltd. 2- 10
285 NEERASHRUTI CHEMICALS 313/16/4 5
286 PREETEN HEALTHCARE PVT LTD C-1/7103 5
287 KETIX CHEMICALS 501/K 5
288 UMIYA CHEM INTERMEDIATES 4705/1 15
289 SHREE UMIYA INTERMEDIATES 5108 20
290 BASF 0 0
291 AXIS PHARMA CHEM C1/3916 7
292 BHAGAVATI CHEM TECH 6807 2
293 SHRI AMBICA ORGANIC CHEMICALS 6721 3
294 REE MAAN RASAYAN 4772 3
295 MEDI CARE INDUSTRIES 4734 5
296 VORA INDUSTRIES 1510 70
297 DARSHAN PHARMA CHEM A1,3621 100
298 ADARSH DYE CHEM UNIT 2 A1/3620 50
299 BHARAT CHEMICAL INDUSTRIES 7905 5
300 PEARL CHEMICAL INDUSTRIES 3416 5
301 VIVEK CHEMICALS C1-B-3910 10
302 K. D. ENTERPRISE 2900/91 1
303 D. N. CHEMICALS 6007 25
304 PRERANA CHEMICALS 702/4 25
305 CHIRAG PACKAGING 284/2 30
306 SUPREME CHEMICALS 7840/2 4
307 AVDHOOT CHEMICALS 4801/A/14 10
308 SAURASHTRA DYES& CHEMICALS 6232 5
309 PLATINUM TANNING INDUSTRIES 2805/A 2
310 BHAVESH DYES INDUSTRIES 4776 1
311 RATNAMANI BIO - CHEMICAL & PHARMA 6112&13 30
312 PALCHIN CHEMICAL 5236 3
313 VARAHI PHARMA CHEM 9108/2 18
314 ALPHARD PHARMA C-1,4333
315 NIRANJAN CORPORATION 5126/4 3
316 BHUMI ELECTRO CHEM A-2/54 1
317 VAKPATI CHEMICALS 7507 2
318 FERGUSON CHEMICALS 6217/2
319 NARMADA CHEMICALS A-2-2212 15
320 SUGV INDUSTRIES 4707/A/6 3
321 TULSI INDUSTRIES 4707/A/3 3
322 KRISHNA INDUSTRIES 5722 5
323 SHREE RAM INDUSTRIES 5117 3
324 GHANSHYAM CHEMICALS 7401 2
325 HARPAL DYE CHEM INDUSTRIES 735 5
326 PNCHMAHAL DYESTUFF INDUSTRIES 736 5
327 Fflorence industries 10006/b 60
328 SPC LIFE SCIENCES 284/1,2,3 10
329 VIHITA CHEM PVT LTD 305 10

NOTIFIED AREA AUTHORITY, ANKLESHWAR ENVIRONMENT IMPACT ASSESSMENT REPORT
EIA Report prepared by M/s. Aqua-Air Environmental Engineers Pvt. Ltd. 2- 11
330 VIHITA CHEM PVT LTD UNIT 2 3709/1&2 5
331 NEPEL CHEMICALS 4763/64 15
332 MONAL COLOUR CHEM PVT 4805 20
333 NANDOSAL INDUSTRIES 30
334 VIHITA DRUGS & INTERMEDIATE C-1B/4754 20
335 VIHITA BIO CHEM PVT LTD 304/A 20
336 SODAR INDUSTRIES 1503 3
337 RAVI CHEM INDUSTRIES 7402 10
338 AMBICA CHEMICALS 702/3 10
339 RANGODADHI CHEMICALS PVT LTD 705 10
340 SUNNY CHEMICALS 6811 8
341 PRO ACTIVE PHARMA A-2/2215 35
342 SKYLARK PHARMACEUTICALS PVT LTD 7910 3
343 SHREENATHJI INDUSTRIES 5188/A 10
344 SHYAM DYE CHEM 69,196,901 10
345 REE ATHARVA LIFE SCIENCES PVT LTD 5178 5
346 RANKE ATHARVA ENTERPRISE PVT LTD 5157,58 5
347 ATHRAVA ENTERPRISE J-5231 10
348 CHEM PACK PVC SHRINK FILM 11012/3 4
349 LEO TEX INDUSTRIES J-1917 15
350 KHWAHISH HELTHCARE 10
351 RAGHUVIR CHEMICALS 6217/4,5 10
352 SURESHBHAI H SHIROYA 708 10
353 SAYONA CROP CARE B/155 10
354 SAYONA CROP CARE 3608 10
355 AGRO PACK 5041-43,48-50 10
356 ASSOCIATED ENTERPRISE 140/1 10
357 AGRO PACK 140/3,141/1 20
358 SHREE SULPHAMIC CHEMICALS 4518 1
359 MADHAV CHEMICAL INDUSTRIES 3450/B 10
360 PRINCE CHEMICALS 9111/3 10
361 DEXO FINE CHEM PVT LTD K1-7707/6 1
362 PLASTO TECH POLYMERS C1B/7107 1
363 ARTI ENTERPRISE 5047 2
364 AQUAL FINE CHEM A/2,4002 5
365 GOLDEN FINECHEM PVT LTD 4801/A/15 2
366 FARBE FIRMA 2900/28,29 20
367 FARBE FIRMA 1508 20
368 GOPAL CHEMICALS 4521 3
369 SHIRIJI CHEMOPHARMA 2900/104 2
370 ASIAN COLOUR CHEM 6106/B/A 40
371 AMIDE INDIA 502/20 3
372 KETUL CHEM PVT LTD 1706/13 2
373 ITALIA INCORPORATION C-1B-7810 5
374 RAVI RAJ CHEMICALS C1B7120/21 5

NOTIFIED AREA AUTHORITY, ANKLESHWAR ENVIRONMENT IMPACT ASSESSMENT REPORT
EIA Report prepared by M/s. Aqua-Air Environmental Engineers Pvt. Ltd. 2- 12
375 MERIT CHEMICALS 6725 8
376 SHREE DHSRAMJIVAN CHEMICALS 3706/A 8
377 ADITYA LIFE SCIENCES 5125 20
378 ADITYA PHARMA CHEM 5124 15
379 SHREE UMIYA TRADELINK 150/A 15
380 DUTT CHEM ENTERPRISE 5904/2/B 10
381 SHREE GANESH CHEMICALS 6711 10
382 SHREE GANESH CHEMICALS 6711 2
383 NIKUNJ CHEMICALS J-7820 4
384 NAVNEET PRODUCTS 5905/8 5
385 SHREE KRISHNA CHEM 1601/2 5
386 SONAL CHEMICALS 4758 45
387 GRP INDUSTRIES 2900/23 10
388 ASHOK PHARMA CHEM 6714-15 3
389 ELEMENT CHEMILINK PVT LTD 85
390 OM MASTERATCHES 1704 2
391 POLE STAR INDUSTERIS 616 15
392 SARJAK PHARMA CHEM 5137 5
393 VISHAL INDUSTRIES 6912/13 10
394 SATYAM INDUSTRIES C-1/7110 10
395 FERRIC ALUM INDUSTRIES 2807/1 25
396 ELEMENT CHEMILINK PVT LTD UNIT 2 313/6,7,8 50
397 VISHAL ORGANICS 7903/A,B 10
398 AMAR CHEMICAL INDUSTRIES C1/B,6830 10
399 BANSI ASSOCIATES 5102/A 20
400 PURE CHEM PVT LTD 4717 10
401 ELAM PHARMA PVT LTD 3709/4 80
402 SAYAN GREENOCHEM P LTD 6001/3,4 134
403 AGRO PACK 902,905 10
404 SAYONA CROP CARE 5008 10
405 SHREE LAXMI ENTYERPRISE 5252 4
406 RADHE CEHMICALS INDUSTRIES 4931 4
407 DEXO CHEM LABORATORIES L-6219-6 1
408 BHARAT PRODUCTS LTD UNIT 2 3206/B 20
409 ELEMENT CHEMILIMK PVT LTD UNIT 1 C1/5504 100
410 MECLIN CHEMICALS 3302/C 16
411 SUYOG DYE CHEMIE P LTD UNIT 2 2404-5 31
412 SNEHAL IMPEX PVT LTD UNIT 1 1108/A 10
413 SUYOG LIFE SCIENCES PVT LTD 145/B 30
414 SAHYOG CHEMICAL INDUSTRIES C1-B/7004 13
415 SUYOG DYE CHEMIE P LTD UNIT 1 6716 14
416 SIDDHARTH INTERCHEM PVT LTD 6905,6914,15 3
417 POOJA CHEMICALS 702/2 7
418 NAVDURGA DYES & CHEMICALS 3
419 SHREE F PRISE 1

NOTIFIED AREA AUTHORITY, ANKLESHWAR ENVIRONMENT IMPACT ASSESSMENT REPORT
EIA Report prepared by M/s. Aqua-Air Environmental Engineers Pvt. Ltd. 2- 13
420 RHYTHAM ENVIRO CARE 25
421 REVA CHEMICALS 3920 4
422 SATYEM CHEMICALS C-1/B-4741 5
423 SHREE RANG CHEMICAL 20
424 ADITYA INFRA 5716 25
425 UMIYA INDUSTRIES 4405 2
426 AMITA CHEMICAL INDUSTRIES 4784 10
427 KING ACID & CHECIMAL CO 313/9 50
428 ADVAITYA DYE CHEM 4785/86 10
429 SHREE DATTATREYA CORPORATION 5129 4
430 KHATU SHREE CHEM 6501 10
431 ABAD CHEMICALS 4774/75 10
432 GAYATRI CHEMSYNTH PVT LTD A-1/1404 4
433 CHANDAN CHEMICALS J-3434 33
434 SHREE MAHAKALI TARDES 4927 4
435 S.B INDUSTRIES 5217 4
436 S.B CHEM O PHARMA C-1-B/2015 4
437 S.B CHEM TECH 254 4
438 HEMAL IMPEX C-1B-7812 3
439 CHANDAN CHEMICALS 3422/23 35
440 CROP LIFE SCIENCES LTD 5151 1
441 CROP LIFE SCIENCES LTD 5165 1
442 ACQUIRE CHEMICALS 7901/D 5
443 APEX PHARMA CHEM 7904/F 5
444 PARAM PHARMACEUTICAL 6001 5
445 BALMUKUND CHEICALS 4765 2
446 HITESH CHEMICALS INDUSTRIES 303/B 10
447 MEET SERVICE STATION 1,2,7,8 4
448 DHANLAXMI CHEMICALS UNIT 2 4801/A/9 10
449 BONNY CHEMICALS J-7016 7
450 SHREE VARDAYINI CHEMICALS INDUSTRIES 17
451 VARDAYINI ENTERPRIESE 10
452 JAYDEV CHEM INDUSTIRES 502/19 5
453 MACSON PRODUCTS UNIT 2 6006/2B 20
454 PROLIFE HAIR AND HEALTH CARE PVT LTD 6,8,10,12 4
455 SKY & SKYLARK INDUSTRIES PRODUCTS 2513/B 33
456 AASHRAY CHEMO PHARMA 6602 2
457 NIMISH CHEMICALS 07/02/4705 4
458 RAJESH CHEMICAL INDUSTRIES 1818,19,20 31
459 RADHE INDUSTRIES 1410/B 3
460 ALLIED CHEMICALS A-1/7309 7
461 KISHAN CORPORATION 285/1 20
462 K.M SHAH & SONS C1B-7123 0
463 BHARAT DRUM SUPPLYING CO. C-1B/,7122 0
464 OM SHANTI INDUSTRIES C1/2525 4
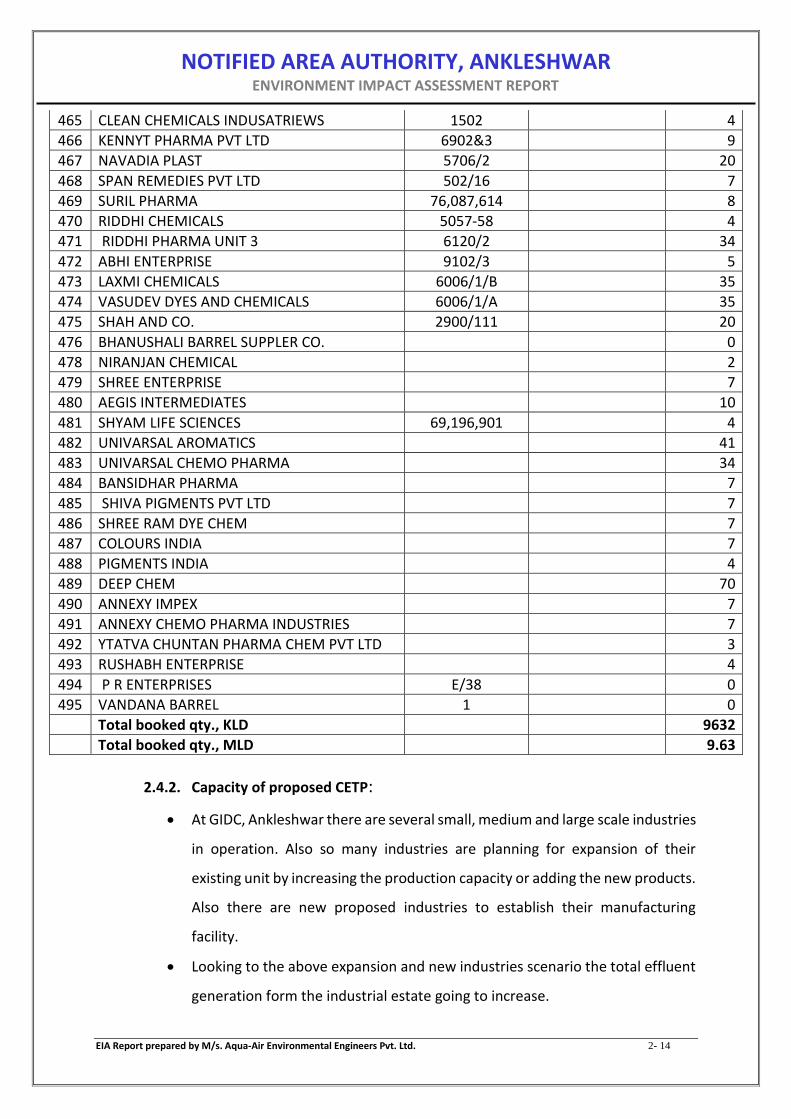
NOTIFIED AREA AUTHORITY, ANKLESHWAR ENVIRONMENT IMPACT ASSESSMENT REPORT
EIA Report prepared by M/s. Aqua-Air Environmental Engineers Pvt. Ltd. 2- 14
465 CLEAN CHEMICALS INDUSATRIEWS 1502 4
466 KENNYT PHARMA PVT LTD 6902&3 9
467 NAVADIA PLAST 5706/2 20
468 SPAN REMEDIES PVT LTD 502/16 7
469 SURIL PHARMA 76,087,614 8
470 RIDDHI CHEMICALS 5057-58 4
471 RIDDHI PHARMA UNIT 3 6120/2 34
472 ABHI ENTERPRISE 9102/3 5
473 LAXMI CHEMICALS 6006/1/B 35
474 VASUDEV DYES AND CHEMICALS 6006/1/A 35
475 SHAH AND CO. 2900/111 20
476 BHANUSHALI BARREL SUPPLER CO. 0
478 NIRANJAN CHEMICAL 2
479 SHREE ENTERPRISE 7
480 AEGIS INTERMEDIATES 10
481 SHYAM LIFE SCIENCES 69,196,901 4
482 UNIVARSAL AROMATICS 41
483 UNIVARSAL CHEMO PHARMA 34
484 BANSIDHAR PHARMA 7
485 SHIVA PIGMENTS PVT LTD 7
486 SHREE RAM DYE CHEM 7
487 COLOURS INDIA 7
488 PIGMENTS INDIA 4
489 DEEP CHEM 70
490 ANNEXY IMPEX 7
491 ANNEXY CHEMO PHARMA INDUSTRIES 7
492 YTATVA CHUNTAN PHARMA CHEM PVT LTD 3
493 RUSHABH ENTERPRISE 4
494 P R ENTERPRISES E/38 0
495 VANDANA BARREL 1 0
Total booked qty., KLD 9632
Total booked qty., MLD 9.63
2.4.2. Capacity of proposed CETP:
At GIDC, Ankleshwar there are several small, medium and large scale industries
in operation. Also so many industries are planning for expansion of their
existing unit by increasing the production capacity or adding the new products.
Also there are new proposed industries to establish their manufacturing
facility.
Looking to the above expansion and new industries scenario the total effluent
generation form the industrial estate going to increase.
NOTIFIED AREA AUTHORITY, ANKLESHWAR ENVIRONMENT IMPACT ASSESSMENT REPORT
EIA Report prepared by M/s. Aqua-Air Environmental Engineers Pvt. Ltd. 2- 15
The GIDC Ankleshwar is very old GIDC and 70% industrial units are Small Scale
Industries (SSI). The plot area of SSI are small and available space is limited. So
it is difficult to upgrade/modify existing ETP.
Presently, the effluent generated from the small scale industries within the
premises of GIDC Ankleshwar is either discharged directly into the FETP of NCT
through underground effluent conveyance pipeline or into CETP of ETL through
tankers and final pumping station. NCT treat the effluent and after achieving
discharge norms, dispose the treated effluent into deep Arabian Sea through
53 km (Onshore Pipeline: 43.6 km + Offshore Pipeline: 9.4 km) effluent
conveyance pipeline.
Now, Medium and Large scale industries are having their own Effluent
Treatment Plant. Such industries are treating their effluent and discharging to
GIDC drainage line to FETP.
GIDC Ankleshwar has modified effluent conveyance system to final pumping
station since Jan 2018.
One is IIUS main line accommodating large scale units(@57) contributing @13
MLD and second is CIP line accommodating SSI units contributing @10 MLD.
With this the quality and quantity of small scale/large scale units is identified.
The auto sampler and flow meter is provided at final pumping station. Thus,
presently approx. 24 MLD effluent flow is going to FETP through both lines.
Small scale industries (SSI) have limited facilities for effluent treatment.
From the Table-2.3, the total expected effluent load for the proposed CETP
shall be 9.6 MLD. The expected effluent load from the GIDC shall be increased
up to 10.0 MLD. To reduce the TDS load and better and easier treatment of
effluent, addition of sewage from the nearby STP shall be provided. The
additional sewage shall be about 2.5 MLD. Hence the total treatment capacity
of proposed CETP shall be 10 MLD.
Ratio of sewage to be mixed with industrial waste water shall be kept
minimum. The mixing ratio of sewage to Industrial waste water shall be from
0.25 to 0.30.

NOTIFIED AREA AUTHORITY, ANKLESHWAR ENVIRONMENT IMPACT ASSESSMENT REPORT
EIA Report prepared by M/s. Aqua-Air Environmental Engineers Pvt. Ltd. 2- 16
Hence, to treat the effluent from SSIs of GIDC, Ankleshwar; NAA of Ankleshwar
along with AWML proposed to set up a 10 MLD CETP. Looking to the current
scenario, it is proposed to set up CETP for 7.5 MLD Ind. Effluent + 2.5 MLD
sewage with primary, secondary and tertiary treatment facility. The proposed
CETP shall treat only the effluent from SSIs of GIDC Ankleshwar. The treated
effluent from the proposed CETP shall achieve the FETP norms and discharge
the treated effluent to FETP for further treatment and disposal.
The proposed 10 MLD CETP shall be design such as that the proposed CETP will
treat all the effluent in above said ratio of sewage to industrial effluent to
achieve the prescribed norms.
2.4.3. Collection and distribution network
2.4.3.1. Present scenario of collection and distribution network
GIDC Ankleshwar has modified effluent conveyance system to final pumping
station in last several years.
The drainage system in Ankleshwar GIDC has been upgraded from time to time
from 2005 onwards and till 2016 at a cost of more than Rs. 85 crore.
The map showing the various upgraded effluent conveyance pipeline is
attached as Annexure – 13.
The details of such up gradation are given below:
GRP (Glass Fiber Reinforced Plastic) pipeline marked in BROKEN DARK BLUE
color in the map attached as Annexure – 13. This is called IIUS (Industrial
Infrastructure Up gradation Scheme). This is a gravity based line in which the
flow is without any pumping.
GRP (Glass Fiber Reinforced Plastic) pipeline marked in UNBROKEN DARK
BLUE color. This is called CIP (Critical Infrastructure Project) line. This is a
gravity based line in which the flow is without any pumping.
HDPE (High-density polyethylene) pipelines marked in light blue color. (2015-
2016).
HDPE (High-density polyethylene) pipelines marked in light GREEN color.
(2015-2016).

NOTIFIED AREA AUTHORITY, ANKLESHWAR ENVIRONMENT IMPACT ASSESSMENT REPORT
EIA Report prepared by M/s. Aqua-Air Environmental Engineers Pvt. Ltd. 2- 17
HDPE pipelines (New Diversion Line) marked in Lighter Orange color (2015-
2016).
Glass Fiber Reinforced Plastics (GRP) pipelines marked in Darker Orange
(2015-2016).
The drainage network in Ankleshwar GIDC consists of a large number of
pipelines which have been laid down in recent years. The pipelines in
Ankleshwar GIDC are working efficiently without any difficulties.
In Ankleshwar GIDC, only about 775 units are chemical industries that
discharge/generate trade effluent. Out of the 775 chemical units, about 245
units send effluent to CETP by tanker and not by pipeline.
Monitoring mechanism for collection of effluent through pipeline:
For monitoring and control purpose, NCT proposed to install Auto sampler
and Flow meter at identified locations.
The process of installing Auto Sampler and Flow Meter has already started in
Ankleshwar GIDC. 2 Meters have already been installed and are functioning.
7 more Meters have already been ordered by NCT. In addition to the 2
Meters already installed, 18 more Meters are proposed to be installed at
identified locations within the next two to three months. This entire system
can be installed at a cost of about Rs.1 crore.
One is IIUS main line accommodating large scale units(@57) contributing @13
MLD and second is CIP line accommodating SSI units contributing @10 MLD.
With this the quality and quantity of small scale/large scale units is identified.
The auto sampler and flow meter is provided at final pumping station. Thus,
presently approx. 24 MLD effluent flow is going to FETP through both lines.
Since implementation of underground drainage network, to ensure that a
single drop of waste water is not flowing to the Amravati or other natural creek
passing through the estate by setting up of 3 Pumping Stations – A, B & C and
Sewage Treatment Plant by Ankleshwar Industries Association jointly with the
NAA and GIDC. These Pumping Stations and Sewage Treatment Plant have
been fully operating since then.

NOTIFIED AREA AUTHORITY, ANKLESHWAR ENVIRONMENT IMPACT ASSESSMENT REPORT
EIA Report prepared by M/s. Aqua-Air Environmental Engineers Pvt. Ltd. 2- 18
Presently all the effluent from pumping stations – A, B, C drained into Final
Pumping Station (FPS). From FPS, entire effluent is pumped to FETP of NCT
through underground pipeline.
After completion of proposed 10 MLD CETP the effluent from CIP line
accommodating SSI units contributing @10 MLD shall be treated in proposed
10 MLD CETP. And the treated effluent confirming the FETP inlet norms shall
be drained to FPS for further treatment in FETP of NCTL.
2.4.3.2. Present scenario of collection and distribution network
GIDC Ankleshwar is already having an underground collection and distribution
network for effluent conveyance as mentioned above.
The existing network is working efficiently without any difficulties.
Presently, the management and maintenance of effluent conveyance system
is maintained by NAA.
Only the CIP pipeline network will be utilized for collection of effluent from
various industries in CETP.
Proper Inspection of existing pipeline will be carried out.
Cleaning of pipeline will be carried out as per requirement.
The routine monitoring of entire pipeline shall be carried out.
The entire CETP shall be operated on PLC-SCADA system.
2.4.3.3. Possibilities for above ground pipeline network
GIDC proposed to install aboveground pipeline network for the collection of
waste water generated from industries of GIDC Ankleshwar.
The project for above ground pipeline network is under progress.
Estimated project cost: Rs. 79.22 crores.
The underground pipeline drainage network is shown in Figure – 2.1.

NOTIFIED AREA AUTHORITY, ANKLESHWAR ENVIRONMENT IMPACT ASSESSMENT REPORT
EIA Report prepared by M/s. Aqua-Air Environmental Engineers Pvt. Ltd. 2- 19
FIGURE – 2.1
MAP SHOWING EXISTING PIPELINE NETWORK IN ANKLESHWAR GIDC
B C
FPSA
IIUS (57#)
CIP (50#)
To FETP
GIDC Ankleshwar boundary

NOTIFIED AREA AUTHORITY, ANKLESHWAR ENVIRONMENT IMPACT ASSESSMENT REPORT
EIA Report prepared by M/s. Aqua-Air Environmental Engineers Pvt. Ltd. 2- 20
FIGURE – 2.2
MAP SHOWING PIPELINE NETWORK IN ANKLESHWAR GIDC WITH PROPOSED CETP
B C
FPS A
IIUS (57#)
CIP (50#)
To FETP
GIDC Ankleshwar boundary
10 MLD CETP

NOTIFIED AREA AUTHORITY, ANKLESHWAR ENVIRONMENT IMPACT ASSESSMENT REPORT
EIA Report prepared by M/s. Aqua-Air Environmental Engineers Pvt. Ltd. 2- 21
2.4.4. PROCESS DESCRIPTION OF CETP
The proposed 10 MLD CETP is a common treatment facility for industries
located within the GIDC, Ankleshwar. The facility will be comprising of
conveyance, collection, treatment and disposal of treated effluent from small
scale industries of GIDC, Ankleshwar. The treatment scheme comprising of
collection, Primary treatment, Secondary treatment, Tertiary treatment and
final treated effluent shall be sent to Final pumping station and further to FETP
of NCT for further treatment and after achieving discharge norms, dispose the
treated effluent into deep Arabian Sea through 53 km (Onshore Pipeline: 43.6
km + Offshore Pipeline: 9.4 km) effluent conveyance pipeline.
The design criteria/inlet norms for proposed CETP are as under.
TABLE – 2.4
DESIGN CRITERIA/INLET NORMS OF 10 MLD CETP, ANKLESHWAR
No. Effluent parameters Unit Inlet norms for CETP
1 pH pH units 6.5-8.5
2 Color Pt.Co. scale 300.00
3 Oil and grease mg/L 10.00
4 Total dissolved solids mg/L 18000.00
5 Suspended solids mg/L 500.00
6 Ammonical Nitrogen (NH3-N) mg/L 500.00
7 COD mg/L 11000.00
8 BOD mg/L 3600.00
9 Cr+ mg/L 2.00
10 Cr+6 mg/L 0.10
11 Cu mg/L 3.00
12 Ni mg/L 3.00
2.4.4.1. BRIEF PROCEE DESCRIPTION OF PROPOSED CETP
A. Preliminary Treatment (Physical Unit Operations)
Common physical unit operations include among other processes screening,
Grit Chamber, Parshall flume, Oil and Grease removal Tank, Flow Equalization
Sedimentation etc.
Screening: A screen with openings of uniform size is used to remove
large solids such as cloths, rags, papers, plastics etc. which may damage
NOTIFIED AREA AUTHORITY, ANKLESHWAR ENVIRONMENT IMPACT ASSESSMENT REPORT
EIA Report prepared by M/s. Aqua-Air Environmental Engineers Pvt. Ltd. 2- 22
process equipment, reduce the effectiveness of the common effluent
treatment plant.
Grit Chamber: Grit includes sand, dust, cinder, bone chips, coffee
grounds, seeds, eggshells and other materials in wastewater that are
non-putrescible and are heavier than organic matter. It is necessary to
remove these materials in order to 1) protect moving mechanical
equipment and pumps from unnecessary wear abrasion, (2) prevent
clogging in pipes and heavy deposits in channels.
Oil and Grease Removal: Oil and grease removal unit removes oil and
grease from the incoming effluent prior to the further biological
process.
Flow Equalization: CETP’s are designed to treat wastewater that has a
more or less constant flow and quality that fluctuates. The equalization
tank overcomes this by collecting and storing the waste, allowing it to
mix and become a regular homogeneous quality before it is pumped to
the treatment units at a constant rate. To determine the require
volume of an equalization tank the hourly variation of flows needs to
be determined. The equalization tank has submersible mixers for
efficient equalization of organic load.
B. Primary Treatment (Chemical Unit Process)
Chemical unit processes are always used with physical operations and
may also be used with biological treatment processes, although it is
possible to have a purely physico-chemical plant with no biological
treatment. Chemical processes use the addition of chemicals to the
wastewater to bring about changes in its quality. They include pH
control, coagulation, chemical precipitation for the removal of heavy
metals and oxidation.
Neutralization Tank (pH control): Effluent from various industries is
rarely pH neutral. It is therefore necessary to adjust the pH in the

NOTIFIED AREA AUTHORITY, ANKLESHWAR ENVIRONMENT IMPACT ASSESSMENT REPORT
EIA Report prepared by M/s. Aqua-Air Environmental Engineers Pvt. Ltd. 2- 23
treatment process to adjust the pH neutral. This is particularly
important if biological treatment is being used, as a microorganisms
used in biological treatment require a pH in the range of 6-8 and will be
killed by highly acidic or alkali wastewater. For the acidic wastes (low
pH) calcium hydroxide is added among other things. For the alkali
wastes (high pH) sulphuric acid or hydrochloric acid may be added. The
equalized volume of flow shall be pumped to the Neutralization tanks
followed by Flash mixer for pH correction where heavy metals will be
removed by maintaining different pH values. The neutralization tanks
shall have air spargers for stripping ammonia at 9.5 pH. In the
neutralization section, pH of the effluent is raised to @ 9.5 by mixing
with lime slurry under agitation for precipitating out heavy metals as
metal hydrauxides. Air is passed through the first two reaction tanks of
neutralization tanks through a sparger, which removes the ammonical
nitrogen upto 35%. Higher removal of ammonical nitrogen is also
possible by further raising the pH to about 10 – 10.5.
Primary Clariflocculator (chemical coagulation and flocculation): In
this system an effluent after flash mixer shall be subjected to Primary
Clariflocculation. Coagulation is a complex process but generally refers
to collecting into a larger mass the minute solids particles dispersed in
a liquid. Chemical coagulants such as poly alumimium chloride or
ferrous Sulphate may be added to waste water to improve the
attraction of fine particles so that they come together and form larger
particles called flocs. A chemical flocculent, usually a polyelectrolyte,
enhances the flocculation process by bringing together particles to
form larger flocs, which settle out more quickly. This also helps in
removal of heavy metals as hydroxides and color. Flocculation is aided
by gentle mixing which causes the particles to collide. The
Clariflocculator shall be provided with flocculator and Clarifier
Mechanism. The sludge from the clariflocculator shall be taken to
Sludge Thickener through Primary Sludge Pumps.

NOTIFIED AREA AUTHORITY, ANKLESHWAR ENVIRONMENT IMPACT ASSESSMENT REPORT
EIA Report prepared by M/s. Aqua-Air Environmental Engineers Pvt. Ltd. 2- 24
C. Biological Unit processes
From the clariflocculator, an effluent shall be sent to single stage
biological treatment called advanced Oxidation ditch based on
extended aeration type activated sludge process. The objective of a
biological treatment of industrial wastewater is to remove or reduce
the concentration of, organic and inorganic compounds. Biological
treatment process can take many forms but are all based around
microorganisms, mainly bacteria. These microorganisms use
component of the effluent as their “food” and in doing so break them
down into less complex and less hazardous compounds. In the process
the microorganisms increase in number.
There are two main type of processes, these involve attached microbial
growth (e.g. fixed film) in biotower, suspended microbial growth (e.g.
activated sludge process). The biotower reduces nearly 35 - 40 % BOD
and COD at very low power consumption. With both approaches large
population of microorganisms are brought into contact with effluent in
the presence of an excess of oxygen. In both systems the microbial
population has to be retained in a tank referred to as the reactor.
With suspended growth systems microbes grow in a small aggregates
or “flocs” (these is known as activated sludge). Activated sludge leaves
the reactor with the treated effluent but is settled out in a clarifier and
returned to the aeration unit to recycle the bacteria. If the amount of
Activated Sludge is excessive some may be disposed of rather than
recycled.
The Design of Oxidation Ditch with Aspirator type Process aerators shall
ensure the better performance of anoxic and aerobic zones which also
enhance and give efficient process of denitrification and nitrification
treatment. The denitrification process shall release the oxygen in the
anoxic zone and hence reduce the overall energy requirement for total
biological nutrient process in the oxidation ditch. The biological

NOTIFIED AREA AUTHORITY, ANKLESHWAR ENVIRONMENT IMPACT ASSESSMENT REPORT
EIA Report prepared by M/s. Aqua-Air Environmental Engineers Pvt. Ltd. 2- 25
reduction of ammonical nitrogen below the guaranteed discharge
standard shall also reduce the chemical cost during operation and
maintenance period
Biological treatment plants must be carefully managed as they use live
microorganisms to digest the pollutants. For example some of the
compounds in the waste water may be toxic to the bacteria used, and
pretreatment with physical operations or chemical processes may be
necessary. It is also important to monitor and control pH as adverse pH
may result in death of microorganisms. The CETP must be properly
aerated and must be operated 24 hours a day, 365 days a year to
ensure that the bacteria are provided with sufficient “food” (i.e.
wastewater) and oxygen to keep them live.
Secondary Clarifier: Biologically treated effluent from ditch shall be
sent to the secondary clarifier for separation and return of activated
sludge back to the aeration tank for maintaining MLSS. Balance
quantity of activated sludge is drained into secondary sludge storage
tank. The overflow from the secondary clarifier shall be sent. The
aeration tank and secondary clarifier units are provided along with the
sludge re-circulation arrangement. From the aeration tanks, the
effluent shall be taken to Secondary Clarifiers wherein the sludge shall
be settled out and overflow shall be taken to secondary treated
effluent collection sump. The biologically treated effluent shall be
subjected to further tertiary treatment. The treated effluent after
tertiary treatment shall be discharged to existing final pumping station
(FPS).
The sludge from the bottom of the secondary clarifier shall be collected
in the Sludge Sump from where it is recirculated back to the inlet of the
aeration tank through Sludge Recirculation Pumps.The excess sludge
along with primary sludge shall be collected in Thickener Unit from
where after thickening the sludge will be collected in the sludge sump
NOTIFIED AREA AUTHORITY, ANKLESHWAR ENVIRONMENT IMPACT ASSESSMENT REPORT
EIA Report prepared by M/s. Aqua-Air Environmental Engineers Pvt. Ltd. 2- 26
and then it will be pumped to the Membrane filter press unit for
dewatering.
The Polyelectrolyte shall be injected from its dosing tanks through
Metering Pumps. The dewatered cake from the Membrane filter press
shall be collected in the Tractor Trolley for disposal.
Overflow of sludge thickener and filtrate from Filter press shall flow by
gravity to the Leachate collection cum backwashed water sump.
D. Tertiary Treatment Scheme:
The untreated effluent contains ammonical nitrogen as one of the
major pollutant and sometimes refractory COD, and residual color,
which cannot be degraded biologically under aerobic conditions and
therefore require tertiary treatment after secondary treatment.
Removal of Ammonical Nitrogen: Balance ammoniacal nitrogen is
removed by super chlorination in the tertiary treatment section. The
treated effluent from secondary section is pumped into a static mixer,
wherein chlorine gas is first measured through a rota-meter, mixed
with lime slurry in a ventuary, and the calcium hypo chlorite so
prepared is mixed with the effluent. pH is controlled by addition of lime
slurry whereas chlorine dozing is monitored by ORP control.
The excess chlorine is treated with sodium bisulfite in static mixer; pH
is controlled by addition of lime slurry. The effluent is further treated
with activated carbon and then the effluent is passed through a
Clariflocculator, wherein PE is dozed to remove suspended solids.
The clarified effluent is passed through decline type gravity sand filter
and activated carbon filter and finally discharged into final pumping
station of GIDC. Any residual color is removed by activated carbon.

NOTIFIED AREA AUTHORITY, ANKLESHWAR ENVIRONMENT IMPACT ASSESSMENT REPORT
EIA Report prepared by M/s. Aqua-Air Environmental Engineers Pvt. Ltd. 2- 27
E. Sludge Dewatering: Advance System:
PLC Scada controlled Automatic Membrane Filter Press shall be
installed.
After the filtration cycle is over, water is filled in membranes
surrounding recessed filter plate at 16 bar pressure, which squeezes
the wet cake to achieve 60 % solid content in wet cake.
The wet cake is transferred to the silo by conveyor belt, for transferring
the wet cake directly into trailer/ truck for direct disposal into approved
landfill site.
All conventional system like belt press, RVF, decanter centrifuge can
achieve 25 - 30 % solid content, which has to be further solar drying to
achieve 55- 60 % streanght before disposal into landfill site, involving
lot of labour cost.
2.4.4.2. COMPARISON BETWEEN CONVENTIONAL AND ADVANCED
OXIDATION DITCH SYSTEM:
Sr. No.
Conventional Advanced Oxidation ditch
1.
Primary Treatment System: Pretreatment, equalization, neutralization, coagulation, flocculation, sedimentation and sludge dewatering.
Primary Treatment System: Pretreatment, equalization, neutralization, coagulation, flocculation, sedimentation and sludge dewatering.
2.
Extended aeration type activate sludge process, at a relatively long hydraulic retention time and sludge age, partially removes ammoniacal nitrogen
Extended aeration type activate sludge process with anoxic (Denitrification) and oxic zone (Nitrification) for simultaneous removal of Ammoniacal Nitrogen
3.
Two stage aeration tank followed by two stage secondary clarifier with RAS sump and pump for recirculation of activated sludge. The whole process is aerobic.
Anoxic/ Oxic / Aerobic Zone with internal sludge recirculation, followed by single stage secondary clarifier with RAS pump.
4. Total retention time for two stage aeration 63 hours (Ist stage 48, 2nd stage 15 hrs)
Total retention time including Anoxic and Oxic zone 63 hours
5.
Aeration Syestem: Alternative 1: Diffused aeration system with diffusers and twin lobe/ tri lobe air blowers.
Aeration Syetm: Aeration with the help of aspirator type aerators. Comparatively less power consumption
NOTIFIED AREA AUTHORITY, ANKLESHWAR ENVIRONMENT IMPACT ASSESSMENT REPORT
EIA Report prepared by M/s. Aqua-Air Environmental Engineers Pvt. Ltd. 2- 28
Alternative 2: Aeration with the help of aspirator type aerators. Comparatively less power consumption
6.
Tertiary treatment system for the removal of NH3-N and residual COD system requires chlorination with pH control, dechlorination with SBS, dozing of coagulants, flocculants and sedimentation, followed by polishing treatment in PSF and ACF. Less chlorine and other chemicals required as NH3-N removed in oxidation ditch.
Tertiary treatment system for the removal of NH3-N and residual COD system requires chlorination with pH control, dechlorination with SBS, dozing of coagulants, flocculants and sedimentation, followed by polishing treatment in PSF and ACF. Full-fledged chlorine treatment rerquired for the removal of NH3-N, color and refractory COD.
ADVANTAGES OF ADVANCED OXIDATION DITCH TECHNOLOGY :
Efficient performance with power saving to the tune of nearly 25%.
Treatment of ammoniacal nitrogen biologically with the help of
nitrification/denitrification.
Design and operational flexibility.
Lower installation and operation costs.
Clean and elegantly simple layout.
Ease of operation and maintenance.
Maximize system redundancy.
Maximize treatment efficiency.
Deep mixing capability.
FINAL DISPOSAL OF TREATED EFFLUENT:
o From CETP the treated effluent shall be pumped to existing Final
pumping station where the effluent from other pumping stations are
mixed and finally pumped into FETP of NCT for further treatment and
finally dispose the treated effluent into deep Arabian Sea through 53
km (Onshore Pipeline: 43.6 km + Offshore Pipeline: 9.4 km) effluent
conveyance pipeline with diffuser approx. 10 km in Sea. Necessary
clearances like CRZ, EC have been already obtained for the said
pipeline.
NOTIFIED AREA AUTHORITY, ANKLESHWAR ENVIRONMENT IMPACT ASSESSMENT REPORT
EIA Report prepared by M/s. Aqua-Air Environmental Engineers Pvt. Ltd. 2- 29
o The schematic diagram of final treated effluent disposal from FETP to
Arabian Sea is shown in Figure 2.3.
o List of units of proposed CETP with their size are given in Table-2.5.
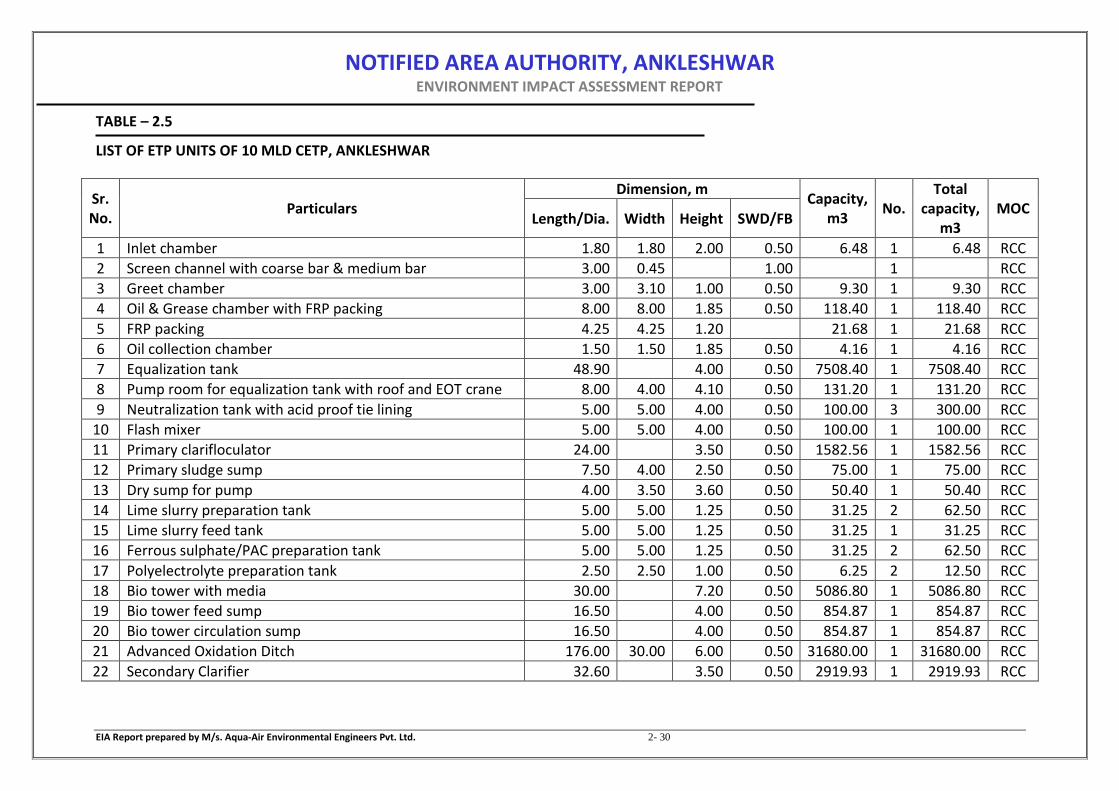
NOTIFIED AREA AUTHORITY, ANKLESHWAR ENVIRONMENT IMPACT ASSESSMENT REPORT
EIA Report prepared by M/s. Aqua-Air Environmental Engineers Pvt. Ltd. 2- 30
TABLE – 2.5
LIST OF ETP UNITS OF 10 MLD CETP, ANKLESHWAR
Sr. No.
Particulars Dimension, m
Capacity, m3
No. Total
capacity, m3
MOC Length/Dia. Width Height SWD/FB
1 Inlet chamber 1.80 1.80 2.00 0.50 6.48 1 6.48 RCC
2 Screen channel with coarse bar & medium bar 3.00 0.45 1.00 1 RCC
3 Greet chamber 3.00 3.10 1.00 0.50 9.30 1 9.30 RCC
4 Oil & Grease chamber with FRP packing 8.00 8.00 1.85 0.50 118.40 1 118.40 RCC
5 FRP packing 4.25 4.25 1.20 21.68 1 21.68 RCC
6 Oil collection chamber 1.50 1.50 1.85 0.50 4.16 1 4.16 RCC
7 Equalization tank 48.90 4.00 0.50 7508.40 1 7508.40 RCC
8 Pump room for equalization tank with roof and EOT crane 8.00 4.00 4.10 0.50 131.20 1 131.20 RCC
9 Neutralization tank with acid proof tie lining 5.00 5.00 4.00 0.50 100.00 3 300.00 RCC
10 Flash mixer 5.00 5.00 4.00 0.50 100.00 1 100.00 RCC
11 Primary clarifloculator 24.00 3.50 0.50 1582.56 1 1582.56 RCC
12 Primary sludge sump 7.50 4.00 2.50 0.50 75.00 1 75.00 RCC
13 Dry sump for pump 4.00 3.50 3.60 0.50 50.40 1 50.40 RCC
14 Lime slurry preparation tank 5.00 5.00 1.25 0.50 31.25 2 62.50 RCC
15 Lime slurry feed tank 5.00 5.00 1.25 0.50 31.25 1 31.25 RCC
16 Ferrous sulphate/PAC preparation tank 5.00 5.00 1.25 0.50 31.25 2 62.50 RCC
17 Polyelectrolyte preparation tank 2.50 2.50 1.00 0.50 6.25 2 12.50 RCC
18 Bio tower with media 30.00 7.20 0.50 5086.80 1 5086.80 RCC
19 Bio tower feed sump 16.50 4.00 0.50 854.87 1 854.87 RCC
20 Bio tower circulation sump 16.50 4.00 0.50 854.87 1 854.87 RCC
21 Advanced Oxidation Ditch 176.00 30.00 6.00 0.50 31680.00 1 31680.00 RCC
22 Secondary Clarifier 32.60 3.50 0.50 2919.93 1 2919.93 RCC

NOTIFIED AREA AUTHORITY, ANKLESHWAR ENVIRONMENT IMPACT ASSESSMENT REPORT
EIA Report prepared by M/s. Aqua-Air Environmental Engineers Pvt. Ltd. 2- 31
23 RAS sludge sump 4.00 4.85 0.50 60.92 1 60.92 RCC
24 Secondary treated effluent sump 21.30 3.50 0.50 1246.51 1 1246.51 RCC
25 Lime slurry preparation tank 5.00 5.00 1.25 0.50 31.25 2 62.50 RCC
26 Lime slurry feed tank 5.00 5.00 1.25 0.50 31.25 1 31.25 RCC
27 Ferrous sulphate/PAC preparation tank 5.00 5.00 1.25 0.50 31.25 1 31.25 RCC
28 Polyelectrolyte preparation tank 2.50 2.50 1.00 0.50 6.25 1 6.25 RCC
29 SBS reagent tank 5.00 5.00 1.00 0.50 25.00 1 25.00 RCC
30 Chlorine shed 15.00 10.00 0.00 1 0.00 RCC
31 Static mixer for lime-hypo mixing with baffles 10.00 1.00 0.75 0.50 7.50 1 7.50 RCC
32 Hypo reaction tank 5.00 5.00 4.00 0.50 100.00 2 200.00 RCC
33 Static mixer for SBS-lime mixing with baffles 10.00 1.00 0.75 0.50 7.50 1 7.50 RCC
34 SBS reaction tank 5.00 5.00 4.00 0.50 100.00 2 200.00 RCC
35 Static mixer for lime-Ferrous mixing with baffles 10.00 1.00 0.75 0.50 7.50 1 7.50 RCC
36 Tertiary clarifloculator 28.30 3.50 0.50 2200.45 1 2200.45 RCC
37 Tertiary sludge sump 5.00 4.00 3.50 0.50 70.00 1 70.00 RCC
38 Tertiary treated effluent collection sump 21.30 3.50 0.50 1246.51 1 1246.51 RCC
39 Tertiary Dual media filter 4.50 10.50 47.25 2 94.50
40 Filter back wash tank 7.00 3.00 0.50 115.40 2 230.79 RCC
41 Activated Carbon Filter 4.00 2.50 31.40 4 125.60
42 Sludge Thickner 24.00 4.50 0.50 2034.72 1 2034.72 RCC
43 Thickened sludge sump with pump house 7.60 6.00 4.50 205.20 1 205.20 RCC
44 Pump house 6.00 5.00 4.50 135.00 1 135.00 RCC
45 Filter press house 20.00 22.00 1 0.00 RCC
46 Membrane Filter press 1.50 1.50 2 0.00
46 Dirty water leachate collection sump 10.00 1.50 117.75 1 117.75 RCC
47 Urea preparation tank 2.00 1 2.00 HDPE
48 Phosphoric acid preparation tank 2.00 1 2 HDPE
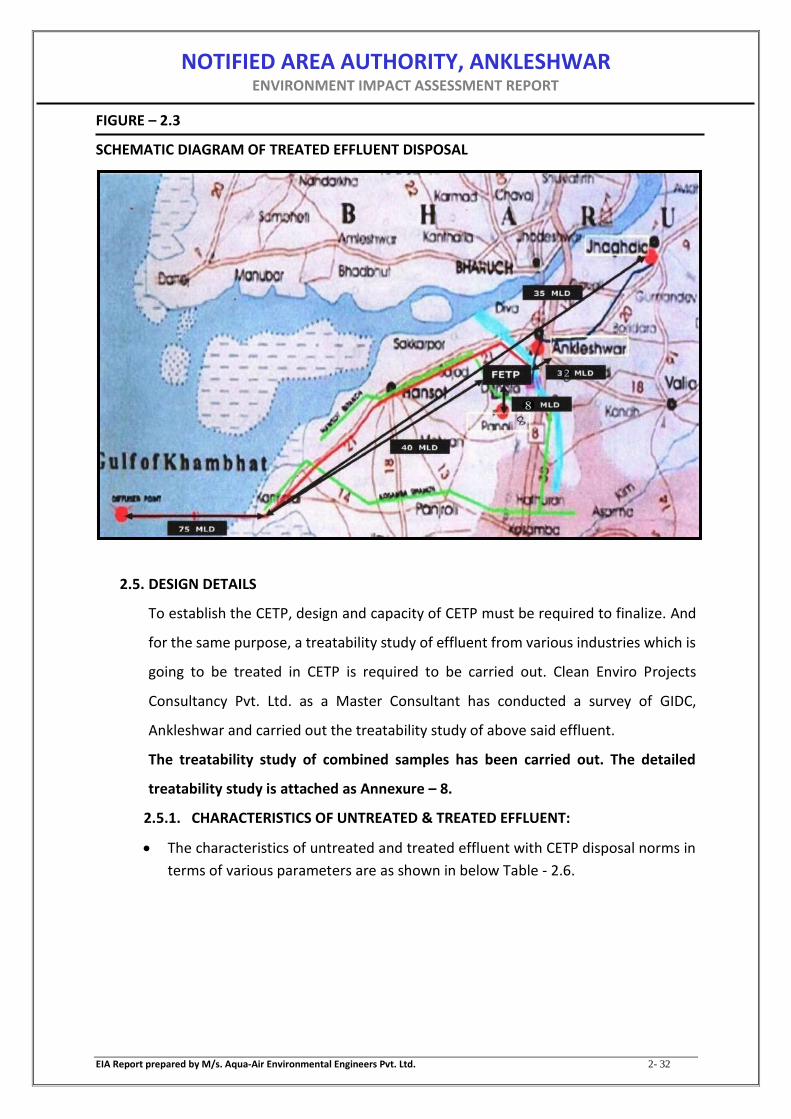
NOTIFIED AREA AUTHORITY, ANKLESHWAR ENVIRONMENT IMPACT ASSESSMENT REPORT
EIA Report prepared by M/s. Aqua-Air Environmental Engineers Pvt. Ltd. 2- 32
FIGURE – 2.3
SCHEMATIC DIAGRAM OF TREATED EFFLUENT DISPOSAL
2.5. DESIGN DETAILS
To establish the CETP, design and capacity of CETP must be required to finalize. And
for the same purpose, a treatability study of effluent from various industries which is
going to be treated in CETP is required to be carried out. Clean Enviro Projects
Consultancy Pvt. Ltd. as a Master Consultant has conducted a survey of GIDC,
Ankleshwar and carried out the treatability study of above said effluent.
The treatability study of combined samples has been carried out. The detailed
treatability study is attached as Annexure – 8.
2.5.1. CHARACTERISTICS OF UNTREATED & TREATED EFFLUENT:
The characteristics of untreated and treated effluent with CETP disposal norms in
terms of various parameters are as shown in below Table - 2.6.

NOTIFIED AREA AUTHORITY, ANKLESHWAR ENVIRONMENT IMPACT ASSESSMENT REPORT
EIA Report prepared by M/s. Aqua-Air Environmental Engineers Pvt. Ltd. 2- 33
TABLE – 2.6
Expected characteristics of untreated and treated effluent
No Parameter Unit Before
Treatment After
Treatment CETP disposal
norms
1 pH pH units 7.80 7.9 6.5 to 8.5
2 Color Pt.Co. scale 380.00 80-90 < 100
3 Oil and grease mg/L 15.80 4 to 5 < 10
4 Total dissolved solids mg/L 19500.00 14000-15000
5 Suspended solids mg/L 540.00 70-80 < 100
6 Ammonical Nitrogen (NH3-N) mg/L 512.00 35-45 < 75
7 COD mg/L 10800.00 400-500 < 500
8 BOD mg/L 5126.00 70-80 < 100
9 Cr+ mg/L 2.20 0.7 < 1
10 Cr+6 mg/L 0.18 0.08 < 0.1
11 Cu mg/L 3.42 0.7 < 1
12 Ni mg/L 1.80 0.6 < 1
2.6. INFRASTRUCTURE FACILITIES
2.6.1. LAND
The total land area allotted by GIDC for proposed CETP is about 30,000 m2.
Provisions are made for administrative building, laboratory, hazardous waste
storage area, chemical storage area, fresh water sump, D.G. Set room, vehical
parking, etc. Land requirement for the project including its break up for various
purposes, its availability and optimization is mentioned in Table 2.7.
TABLE – 2.7
LAND AREA BREAK UP
Sr. No. Particulars Area, m2
1 CETP Process Area 23070.00
2 Administration & Lab 450.00
3 Internal Road 3080.00
4 Green belt 3400.00
Total 30000.00
2.6.2. TRANSPORTATION FACILITIES
Transportation of all major materials shall be primarily by road only.

NOTIFIED AREA AUTHORITY, ANKLESHWAR ENVIRONMENT IMPACT ASSESSMENT REPORT
EIA Report prepared by M/s. Aqua-Air Environmental Engineers Pvt. Ltd. 2- 34
2.6.3. WATER & WASTE WATER
The industrial and domestic water requirement at proposed CETP is met
through NAA water supply. Daily water consumption in proposed CETP is 228
KL/day. Details of water consumption pattern is given in table 2.8.
TABLE – 2.8
TOTAL WATER CONSUMPTION & EFFLUENT GENERATION
Sr. No.
Particular Qty., KL/day
Remarks Water consumption
Effluent generation
1 Construction Phase 6.75 5.5 Septic tank/Soak Pit
2 Operation Phase
I Domestic 30 24 Septic tank and CETP
II Industrial
a Process 130 0 Consumed for chemical preparation and washing and shall be treated in CETP only.
b Washing 50 40
II Total Industrial (I+II) 180 40
III Gardening 18 0
Total (I+II+III) 228 64
2.6.4. ELECTRICITY REQUIREMENT
The power requirement is met through 2500 KW connecting load of DGVCL
(GEB) and emergency standby one Diesel Generator Set of 1000 KVA.
2.6.5. FUEL REQUIREMENT
Diesel is used as fuel at rate of 205 L/hr for D.G. Set which is used in emergency
only.
2.7. POLLUTION POTENTIAL AND ITS CONTROL MEASURE
2.7.1. AIR POL LUTION AND CONTROL SYSTEM
2.7.1.1. The flue gas emission and its control measures are mentioned in Table-
2.9.

NOTIFIED AREA AUTHORITY, ANKLESHWAR ENVIRONMENT IMPACT ASSESSMENT REPORT
EIA Report prepared by M/s. Aqua-Air Environmental Engineers Pvt. Ltd. 2- 35
TABLE – 2.9
THE DETAILS OF FLUE GAS EMISSION
Sr. No.
Stack attached
to
Stack height,
m
Type of
fuel
Fuel Cons., L/Hr
Emission Parameters
Unit Concentration Air Pollution
Control Equipment
1 D. G. Set – 1000 KVA
12.5 HSD 205
PM mg/Nm3 < 150 Stack with 12.5 m Height with Stack Monitoring Facility (SMF)
SO2 ppm < 100
NOx ppm < 50
2.7.1.2. Chlorine gas emission is likely to be generated form chlorine tonner in
case of leakage only. However, to take care of this leakage, caustic
scrubber along with safety hood shall be provided as Air Pollution Control
equipment. Detail is given in Table-2.10.
TABLE – 2.10
THE DETAILS OF PROCESS GAS EMISSION
Sr. No.
Source of Emission
Type of Emission
Scrubber Stack
Height, m
Stack Diameter,
m
Outlet chlorine
conc.
1 Chlorine tonner safety hood
Chlorine gas
750 dia. x 5000 mm FRP common Scrubber with alkali circulation
tank, pump and blower 10 0.1
5 mg/nm3
2.8. Solid & Hazardous waste Generations and disposal system
Four categories of hazardous wastes shall be generated from proposed CETP and shall
be disposed as per Hazardous and Other Wastes (Management and & Transboundary
Movement) Rules, 2016. The hazardous wastes generated are ETP Sludge from
Common Effluent Treatment Plant, Used oil from lubrication of equipment, Discarded
Containers and Oil & Grease from skimming. These Hazardous wastes are stored in
scientifically designed and constructed hazardous waste storage area within the
premises. CETP sludge shall be sent to Common TSDF of M/s. Bharuch Enviro
Infrastructure Ltd. (BEIL), Ankleshwar. Used oil shall be sold to registered refiners.
Discarded Containers shall be sold to GPCB approved recyclers. Oil & Grease from
skimming shall be sent to registered refiners or to Common Incineration of TSDF of

NOTIFIED AREA AUTHORITY, ANKLESHWAR ENVIRONMENT IMPACT ASSESSMENT REPORT
EIA Report prepared by M/s. Aqua-Air Environmental Engineers Pvt. Ltd. 2- 36
M/s. Bharuch Enviro Infrastructure Ltd. (BEIL), Ankleshwar. Proposed hazardous
waste generation quantity and category are given in Table-2.11.
TABLE – 2.11
SOLID & HAZARDOUS WASTE GENERATION QUANTITY AND CATEGORY
Sr. No.
Particulars Unit Category Quantity Hazardous waste
disposal/Management
1 ETP Sludge MT/month I - 35.3 900 Collection, Storage, Transportation & Disposal by TSDF
2 Used Oil Lit/year I - 5.1 100 Collection, Storage, Transportation & Disposal by selling to registered refiners.
3 Discarded Drums kg/month I - 33.3 200 Collection, Storage, Transportation & Disposal by GPCB/CPCB/MoEF approved recyclers.
4 Oil & Graese skimming
MT/month I - 35.4 1.5
Collection, Storage, Transportation & Disposal by selling to registered refiners or to Common Incineration of TSDF.
2.9. Noise level and CONTROL SYSTEM
The source of noise pollution at site will pumps, blowers, D.G. set (standby), etc.
Extensive oiling & lubrication and preventive maintenance will be carried out to
reduce noise generation at source to the permissible limit. However, at place where
noise levels can exceed the permissible limit, Earplugs and Earmuffs will be provided
to those working in such area.
2.10. DETAILS OF GREENBELT
The main objective of the green belt is to provide a barrier between the plant and
surroundings areas. NAA and AWML will develop green belt within CETP premises.
About 3400 m2 of the total land area will be developed as greenbelt and other forms
of greenery. GIDC will plan native places in consultation with the local horticulture.
2.11. MANPOWER REQUIREMENTS
Approx 150 nos. of people will get direct employment during construction phase.
During the operation phase approximately 50 nos. of people will be required to
operate the proposed CETP.

NOTIFIED AREA AUTHORITY, ANKLESHWAR ENVIRONMENT IMPACT ASSESSMENT REPORT
EIA Report prepared by M/s. Aqua-Air Environmental Engineers Pvt. Ltd. 2- 37
2.12. DETAILS OF RAW MATERIAL AND PRODUCTS TO BE MANUFACTURED BY
INDUSTRIES.
Type of products manufactured and Raw materials consumption by Member
industries are mentioned in Table – 2.12.
TABLE – 2.12
TYPE OF PRODUCTS MANUFACTURED AND RAW MATERIALS CONSUMED
TYPE OF PRODUCTS MANUFACTURED RAW MATERIALS CONSUMPTION
Bulk Drugs & Bulk Drugs Intermediates
Specialty Chemicals
Synthetic Organic Chemicals
Pesticides
Dyes and Dyes Intermediated
Solvents Distillation
Formulations
ETC.
HCl (30-32%)
H2SO4 (98%)
Methanol
Toluene
Xylene
n-Hexane
Ammonium Chloride
Chlorine
Acetic Acid
Acetic Anhydride
Formaldehyde
NaOH
Sodium Sulphite
Sodium Bisulphite
ETC.
Acetone
IPA
Sodium Methoxide
Bromine
Thionyl Chloride
MDC
EDC
Activated Carbon
Hyflow
DMF
DMS
Potassium Chloride
Potassium Carbonate
Urea
ETC.

NOTIFIED AREA AUTHORITY, ANKLESHWAR ENVIRONMENT IMPACT ASSESSMENT REPORT
EIA Report prepared by M/s. Aqua-Air Environmental Engineers Pvt. Ltd. 3- 1
CHAPTER – 3 BASELINE ENVIRONMENT STATUS
3.1. Introduction
This chapter describes the description of the existing environmental status of the
study with reference to the prominent environmental attributes. The study area
covers 10 km radius around the project site. The land use and socio-economic aspects
were studied with respect to 10 km radius around the site.
The existing environmental setting is considered to adjudge the baseline conditions
which are described with respect to climate, atmospheric conditions, water quality,
soil quality, ecology, socio-economic profile, land use and places of archaeological
importance.
The baseline status of environmental quality in the vicinity of project site serves as the
basis for identification, prediction and evaluation of impacts.
The baseline environmental quality has been assessed in the summer season (March,
2017 to May, 2017) in a study area of 10 km radial distance from the project site.
Knowledge of baseline environmental status of the study area is useful for Impact
Assessment-Process of assessing and predicting the environmental consequences of
the significant actions. Significant action depicts direct adverse changes caused by the
action and its effect on the health of the biota including flora, fauna and human being,
socio-economic conditions, current use of land and resources, physical and cultural
heritage properties and biophysical surroundings. Baseline data generation of the
following environmental attributes is essential in EIA studies.
1. Meteorology
2. Ambient Air Quality
3. Ambient Noise Quality
4. Surface and Ground water Quality
5. Soil Quality & Geological Features
6. Land use pattern
7. Socio-economic status survey

NOTIFIED AREA AUTHORITY, ANKLESHWAR ENVIRONMENT IMPACT ASSESSMENT REPORT
EIA Report prepared by M/s. Aqua-Air Environmental Engineers Pvt. Ltd. 3- 2
3.2. Meteorology
Air borne pollutants is dispersed by atmosphere motion. Knowledge of these motions,
which range is scale from turbulent diffusion to long-range transport by weather
systems, is essential to simulate such dispersion and quality of impacts of air pollution
on the environment. The purpose of EIA is to determine whether average
concentrations are likely to encounter at fixed locations (Known as the receptor), due
to the given sources (locations and rates of emission known), under idealized
atmospheric conditions. It is imperative that one should work with idealized condition
and all analysis pertaining to air turbulence and ambient air or noise pollution should
be done with meteorological conditions, which can at best be, expected to occur. The
details of measurement technique, instruments, specification of measurement
standards and accuracy of instruments are adopted from the Indian Standard: 8829-
1978 “Guideline for micrometeorological technique in Air Pollution Studies.” Care is
taken to install the anemometer within a distance of six times the height of nearest
vertical terrain elements (house, trees etc.) and height of 10 m from the average
ground level of the fetch area.
3.3. Micro-Meteorology of the area
The climate of Gujarat is varied, as it is moist in the southern districts and dry in the
northern region. The Arabian Sea and the Gulf of Cambay in the west consequently
reducing the temperature and render the climate more pleasant and healthy. Bharuch
lies along the southern part of the state and experiences a climate with aridity index
of 15 to 20 per cent indicating adequate moisture availability in the soils for most part
of the year.
3.3.1. TEMPERATURE DETAILS
Minimum, Maximum and Average Temperatures for Ankleshwar Station of the
year 2016 are given in Table 3.1.
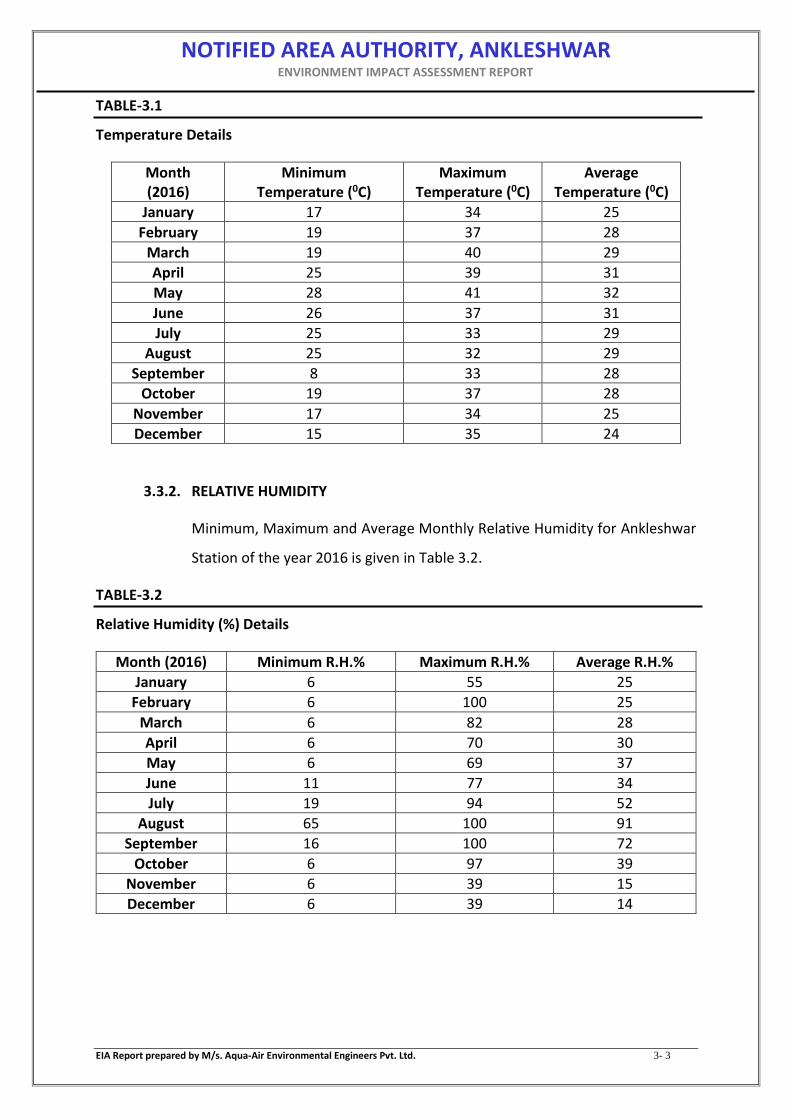
NOTIFIED AREA AUTHORITY, ANKLESHWAR ENVIRONMENT IMPACT ASSESSMENT REPORT
EIA Report prepared by M/s. Aqua-Air Environmental Engineers Pvt. Ltd. 3- 3
TABLE-3.1
Temperature Details
Month (2016)
Minimum Temperature (0C)
Maximum Temperature (0C)
Average Temperature (0C)
January 17 34 25
February 19 37 28
March 19 40 29
April 25 39 31
May 28 41 32
June 26 37 31
July 25 33 29
August 25 32 29
September 8 33 28
October 19 37 28
November 17 34 25
December 15 35 24
3.3.2. RELATIVE HUMIDITY
Minimum, Maximum and Average Monthly Relative Humidity for Ankleshwar
Station of the year 2016 is given in Table 3.2.
TABLE-3.2
Relative Humidity (%) Details
Month (2016) Minimum R.H.% Maximum R.H.% Average R.H.%
January 6 55 25
February 6 100 25
March 6 82 28
April 6 70 30
May 6 69 37
June 11 77 34
July 19 94 52
August 65 100 91
September 16 100 72
October 6 97 39
November 6 39 15
December 6 39 14
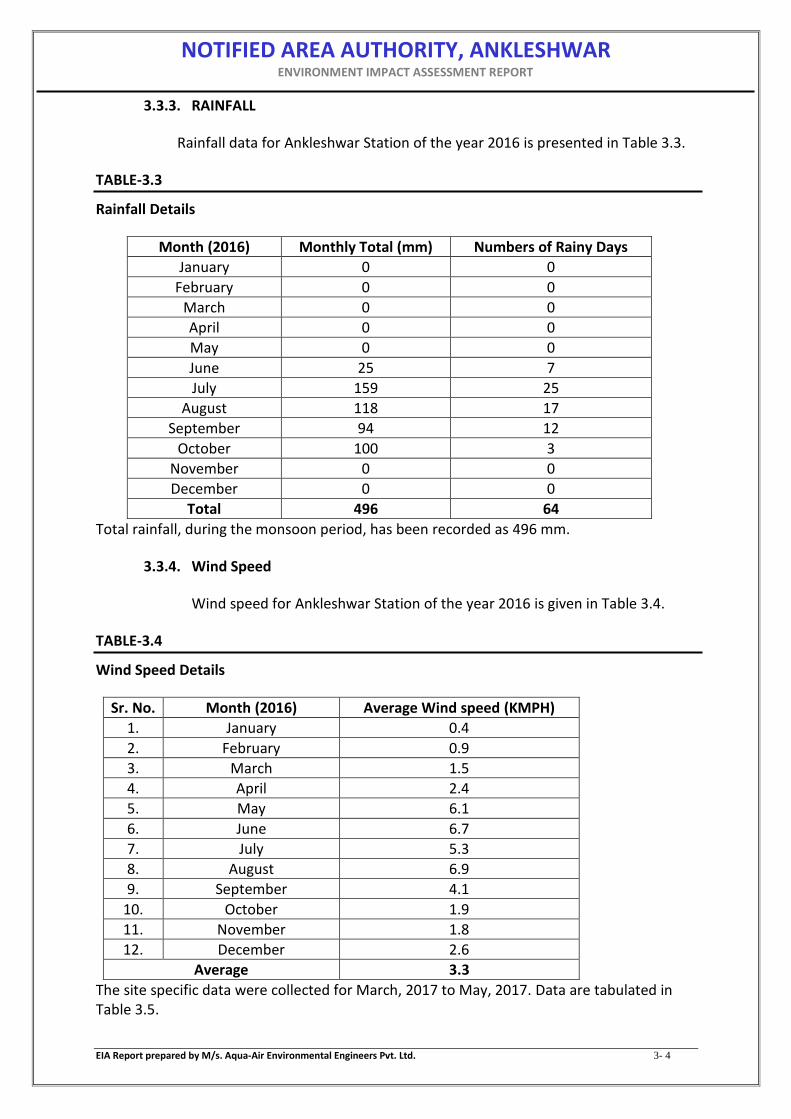
NOTIFIED AREA AUTHORITY, ANKLESHWAR ENVIRONMENT IMPACT ASSESSMENT REPORT
EIA Report prepared by M/s. Aqua-Air Environmental Engineers Pvt. Ltd. 3- 4
3.3.3. RAINFALL
Rainfall data for Ankleshwar Station of the year 2016 is presented in Table 3.3.
TABLE-3.3
Rainfall Details
Month (2016) Monthly Total (mm) Numbers of Rainy Days
January 0 0
February 0 0
March 0 0
April 0 0
May 0 0
June 25 7
July 159 25
August 118 17
September 94 12
October 100 3
November 0 0
December 0 0
Total 496 64
Total rainfall, during the monsoon period, has been recorded as 496 mm.
3.3.4. Wind Speed
Wind speed for Ankleshwar Station of the year 2016 is given in Table 3.4.
TABLE-3.4
Wind Speed Details
Sr. No. Month (2016) Average Wind speed (KMPH)
1. January 0.4
2. February 0.9
3. March 1.5
4. April 2.4
5. May 6.1
6. June 6.7
7. July 5.3
8. August 6.9
9. September 4.1
10. October 1.9
11. November 1.8
12. December 2.6
Average 3.3
The site specific data were collected for March, 2017 to May, 2017. Data are tabulated in Table 3.5.

NOTIFIED AREA AUTHORITY, ANKLESHWAR ENVIRONMENT IMPACT ASSESSMENT REPORT
EIA Report prepared by M/s. Aqua-Air Environmental Engineers Pvt. Ltd. 3- 5
TABLE-3.5
Site Specific Meteorological Data (Period: March - 2017 to May - 2017)
METEOROLOGICAL PARAMETER MONTH
MARCH-2017 APRIL-2017 MAY-2017
Temperature (0C) Min. Max. Avg.
21.1 40.9 30.4
20.6 42.4 27.2
27.5 40.2 30.8
Relative Humidity (%) Min. Max. Avg.
6.0
92.1 26.5
6.9
86.8 28.1
8.1
98.2 39.1
Wind Speed (km/h) Min. Max. Avg.
0
10.2 1.4
0
11.7 2.5
0
13.7 5.7
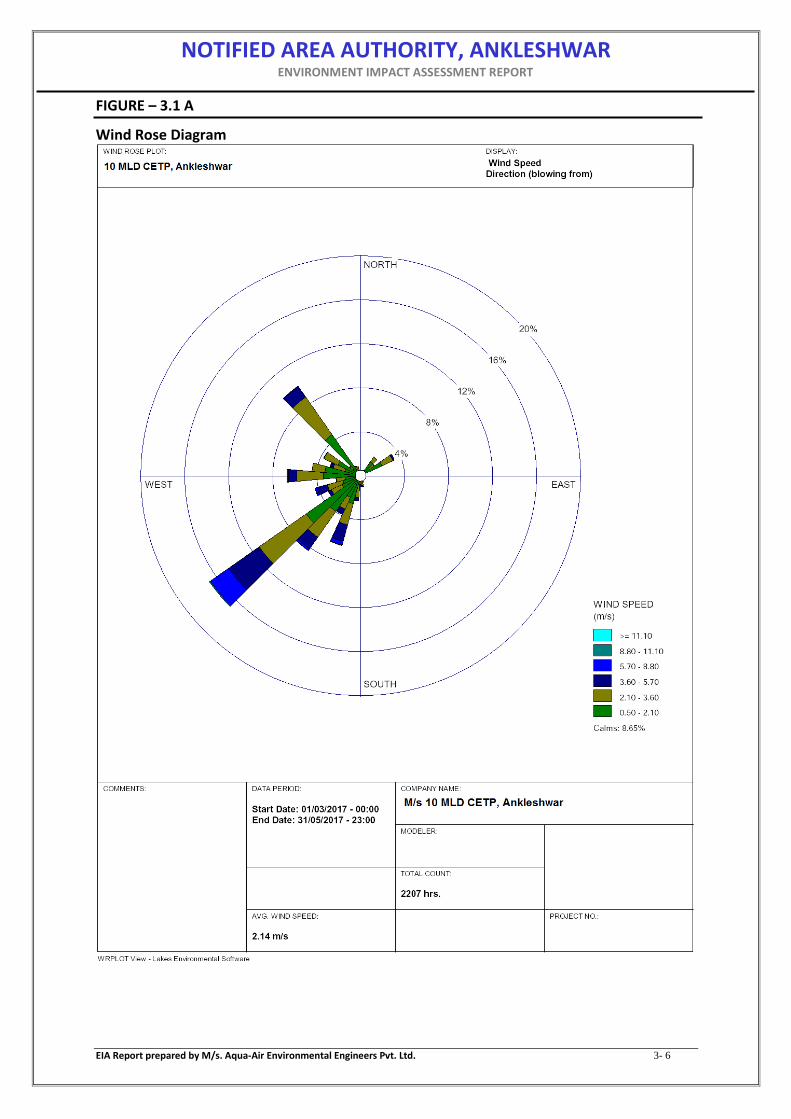
NOTIFIED AREA AUTHORITY, ANKLESHWAR ENVIRONMENT IMPACT ASSESSMENT REPORT
EIA Report prepared by M/s. Aqua-Air Environmental Engineers Pvt. Ltd. 3- 6
FIGURE – 3.1 A
Wind Rose Diagram

NOTIFIED AREA AUTHORITY, ANKLESHWAR ENVIRONMENT IMPACT ASSESSMENT REPORT
EIA Report prepared by M/s. Aqua-Air Environmental Engineers Pvt. Ltd. 3- 7
8.7
60.1
16.6
11.4
3.00.2 0.0
0
10
20
30
40
50
60
70
%
Wind Class Frequency Distribution
Wind Class (m/s)
Calms 0.50 - 2.10 2.10 - 3.60 3.60 - 5.70 5.70 - 8.80 8.80 - 11.10 >= 11.10
9.0
13.9
10.49.9
13.6
23.8
10.8
8
10
12
14
16
18
20
22
24
26
28
%
Stability Class Frequency Distribution
Stability Class
A B C D E F G
FIGURE – 3.1 B
Stability Class Distribution

NOTIFIED AREA AUTHORITY, ANKLESHWAR ENVIRONMENT IMPACT ASSESSMENT REPORT
EIA Report prepared by M/s. Aqua-Air Environmental Engineers Pvt. Ltd. 3- 8
3.4. Air Environment:
3.4.1. DESIGN OF NETWORK FOR AMBIENT AIR QUALITY MONITORING LOCATIONS
The air quality status in the impact zone is assessed through a network of
ambient air quality monitoring locations. The tropical climatic conditions mainly
control the transport and dispersion of air pollutant emissions during various
seasons.
The baseline studies for air environment include identification of specific air
pollutants prior to implement of the project. The Rapid Environmental Impact
Assessment (REIA) study requires monitoring of baseline air quality during one
season. Accordingly, air quality monitoring was carried out in the season from
March - 2017 to May - 2017. The baseline status of the air environment is
assessed through a systematic air quality surveillance program, which is planned
based on the following criteria:
Topography / terrain of the study area
Regional synoptic scale climatologically normal
Densely populated areas within the region
Location of surrounding industries
Representation of regional background
Representation of valid cross-sectional distribution in downwind direction
3.4.2. RECONNAISSANCE
Reconnaissance was undertaken to establish the baseline status of air
environment in the study region. Eight Ambient Air Quality Monitoring
(AAQM) locations were selected based on guidelines of network sitting criteria.
All AAQM locations were selected within the study area of 10 km radial
distance from the project site.
3.4.3. METHODOLOGY FOR AMBIENT AIR QUALITY MONITORING
The ambient air quality monitoring was carried out in accordance with National
Ambient Air Quality Standards (NAAQS). Ambient Air Quality Monitoring
(AAQM) was carried out at eight locations during the study period. SEAC

NOTIFIED AREA AUTHORITY, ANKLESHWAR ENVIRONMENT IMPACT ASSESSMENT REPORT
EIA Report prepared by M/s. Aqua-Air Environmental Engineers Pvt. Ltd. 3- 9
suggested that there should be at least one monitoring station in the pre
dominant downwind direction at a location where maximum ground level
concentration is likely to occur. Accordingly, locations of the different stations
with respect to its distance and direction from project site are shown in Table-
3.7 and Figure-3.2 respectively.
The conventional and project specific parameters such as Particulate Matter
(PM2.5), Particulate Matter (PM10), Sulphur Dioxide (SO2), Oxides of Nitrogen
(NOx), Ozone (as O3), Lead (as Pb), Carbon Monoxide (as CO), Ammonia (as
NH3), Benzene (as C6H6), Benzo (a) Pyrene (BaP) particulate phase only, Arsenic
(as As), Nickel (as Ni), HCl, Cl2, HBr, HF and Volatile Organic Compounds (VOCs)
were monitored at different locations.
The values for mentioned concentrations of various pollutants at all the
monitoring locations were processed for different statistical parameters like
average and percentile values. The existing baseline levels of SPM, PM2.5, PM10,
SO2, NOx, O3, Pb, CO, NH3, C6H6, Benzo (a) Pyrene (BaP) particulate phase only,
As, Ni and VOCs are expressed in average as given in Tables-3.8.
To establish the baseline status around the project site of the study region
monitoring was conducted at 10 Ambient Air Quality Monitoring (AAQM)
Stations in and around the study region during March - 2017 to May - 2017.
TABLE-3.6
Details of Monitoring Locations
Sr. No.
Name of village Bearing
w.r.t. project site
Approximate radial distance from project
site (km)
Ambient Air
Noise water Soil TYPE OF
AREA
1 Project site -- -- A1 N1 GW1 S1 Industrial
2 Andada N 3.95 A2 N2 GW2 S2 Residential
3 Jitali SE 1.75 A3 N3 GW3 S3 Residential
4 Uchhali NE 2.42 A4 N4 GW4 S4 Residential
5 Motali NE 2.24 A5 N5 GW5 S5 Residential
6 Kharchi Bhilwada NE 4.89 A6 N6 GW6 S6 Residential
7 Gadkhol Patiya NW 4.02 A7 N7 GW7 S7 Residential
8 Amboli SW 8.68 A8 N8 GW8 S8 Residential
9 Umarwada SW 8.86 A9 N9 GW9 S9 Residential
10 Umarwada Pond SW 8.87 - - SW11 - -

NOTIFIED AREA AUTHORITY, ANKLESHWAR ENVIRONMENT IMPACT ASSESSMENT REPORT
EIA Report prepared by M/s. Aqua-Air Environmental Engineers Pvt. Ltd. 3- 10
FIGURE – 3.2
Location of Ambient Air Quality Monitoring Stations
TABLE-3.7
Details of Ambient Air Quality Monitoring Locations
Sr. No.
Name of village bearing w.r.t. project
site
Approximate radial distance from project
site (km)
Ambient Air
1 Project site -- -- A1
2 Andada N 3.95 A2
3 Jitali SE 1.75 A3
4 Uchhali NE 2.42 A4
5 Motali NE 2.24 A5
6 Kharchi Bhilwada NE 4.89 A6
7 Gadkhol Patiya NW 4.02 A7
8 Amboli SW 8.68 A8
9 Umarwada SW 8.86 A9

NOTIFIED AREA AUTHORITY, ANKLESHWAR ENVIRONMENT IMPACT ASSESSMENT REPORT
EIA Report prepared by M/s. Aqua-Air Environmental Engineers Pvt. Ltd. 3- 11
TABLE-3.8
Ambient Air Quality Status (March - 2017 to May - 2017) Unit: g/m3
Sr. No.
Sampling Location Sampling duration
SPM PM10 PM2.5 SO2 NOx NH3
g/m3
1 Project site : (A1) 24 hours 118.50 88.40 49.40 16.21 25.31 BDL
2 Andada (A2) 24 hours 136.60 94.63 49.57 16.42 18.16 BDL
3 Jitali(A3) 24 hours 136.40 96.39 48.29 18.31 20.56 BDL
4 Uchhali (A4) 24 hours 123.20 89.54 47.00 17.29 21.02 BDL
5 Motali (A5) 24 hours 122.80 81.34 44.69 16.93 18.25 BDL
6 Kharchi Bhilwada (A6) 24 hours 140.80 97.30 51.72 19.66 23.05 BDL
7 Gadkhol Patiya (A7) 24 hours 122.70 82.13 48.06 18.96 20.33 BDL
8 Amboli (A8) 24 hours 121.10 78.35 43.98 16.87 19.03 BDL
9 Umarwada (A9) 24 hours 143.00 92.40 57.51 20.42 21.64 BDL
NAAQS 200 100 60 80 80 400
Sr. No.
Sampling Location O3 HBr Pb As Ni C6H6
g/m3 ng/m3 ng/m3 g/m3
1 Project site : (A1) 11.22 BDL BDL BDL 11.20 BDL
2 Andada (A2) 10.55 BDL BDL BDL 10.62 BDL
3 Jitali(A3) 11.02 BDL BDL BDL 10.81 BDL
4 Uchhali (A4) 10.85 BDL BDL BDL 10.77 BDL
5 Motali (A5) 10.88 BDL BDL BDL 10.73 BDL
6 Kharchi Bhilwada (A6) 11.19 BDL BDL BDL 10.74 BDL
7 Gadkhol Patiya (A7) 10.76 BDL BDL BDL 10.57 BDL
8 Amboli (A8) 10.65 BDL BDL BDL 10.48 BDL
9 Umarwada (A9) 10.76 BDL BDL BDL 10.56 BDL
NAAQS 180 300 1 6 20 5
Sr. No.
Sampling Location HC CO VOC HCl Cl2 HF
ppm mg/m3 ppm g/m3
1 Project site : (A1) BDL 1.50 1.00 10.48 BDL BDL
2 Andada (A2) BDL 1.27 0.70 9.94 BDL BDL
3 Jitali(A3) BDL 1.90 0.50 9.94 BDL BDL
4 Uchhali (A4) BDL 1.25 0.40 8.43 BDL BDL
5 Motali (A5) BDL 1.22 0.40 6.34 BDL BDL
6 Kharchi Bhilwada (A6) BDL 1.20 0.50 10.45 BDL BDL
7 Gadkhol Patiya (A7) BDL 1.23 0.60 8.24 BDL BDL
8 Amboli (A8) BDL 1.28 0.40 7.76 BDL BDL
9 Umarwada (A9) BDL 1.29 0.50 22.49 BDL BDL
NAAQS -- 5 -- 200 100 60

NOTIFIED AREA AUTHORITY, ANKLESHWAR ENVIRONMENT IMPACT ASSESSMENT REPORT
EIA Report prepared by M/s. Aqua-Air Environmental Engineers Pvt. Ltd. 3- 12
Note: BDL: Below Detectable Limit Detectable Limit of Instrument:
Pb : 0.5 g/m3
CO : 1.14 mg/m3
C6H6 : 2.0 g/m3
BaP : 0.5 ng/m3
As : 2.0 ng/m3
Ni : 10.0 ng/m3
NH3 : 1.0 g/m3
HCl : 1.0 g/m3
HBr: 1.0 g/m3
Cl2: 5.0 g/m3
HF: 1.0 g/m3 VOC : Aeroqual Series 300 (Sensor 0 – 25 ppm) l Minimum Detectable Limit : 0.1 ppm
3.4.4. SUMMARY:
The statistical interpretation of observed ambient air quality concentrations is
presented in Table-3.8. They represent the cross sectional distribution of the
baseline air quality status of the study region.
The maximum concentration of SPM (143 g/m3), PM10 (97.3 g/m3), PM2.5
(57.51 g/m3), SO2 (20.42 g/m3), maximum concentration of NOx (23.05
g/m3), maximum concentration of O3 (11.22 g/m3), maximum concentration
of CO (1.90 g/m3), maximum concentration of VOC (1.0 ppm), was recorded
in study area.
The minimum concentration of SPM (118.5 g/m3), PM10 (78.35 g/m3), PM2.5
(43.98 g/m3), SO2 (16.21 g/m3), minimum concentration of NOx (18.16
g/m3), minimum concentration of O3 (10.55 g/m3), minimum concentration
of CO (1.20 g/m3), minimum concentration of VOC (0.4 ppm), was recorded
in study area.
The PM10 and PM2.5 concentrations at all the AAQM locations were primarily
caused by local phenomena including industrial & vehicular activities and
natural dust getting air borne due to manmade activities and blowing wind.
PM10 and PM2.5 concentrations were observed below stipulated standards of
CPCB for Industrial, Residential, Rural and Other Area at all air quality
NOTIFIED AREA AUTHORITY, ANKLESHWAR ENVIRONMENT IMPACT ASSESSMENT REPORT
EIA Report prepared by M/s. Aqua-Air Environmental Engineers Pvt. Ltd. 3- 13
monitoring locations during the monitoring period.
3.5. NOISE ENVIRONMENT
The objective of the noise pollution survey around the project site was to identify
existing noise sources and to measure background noise levels. The study was carried
out in the following steps:
Reconnaissance
Identification of noise sources and measurement of noise levels
Measurement of noise levels due to transportation
Community noise levels
3.5.1. RECONNAISSANCE
The details of locations are given in Table-3.8 and shown in Figure-3.3.
3.5.2. METHODOLOGY FOR NOISE MONITORING
The noise monitoring was carried out at eight locations in day time and at night
time in the study area covering all the areas i.e. industrial, commercial, and
residential and silence zones as mentioned in Noise (Pollution and Control)
Rules, 2000. Hourly Equivalent noise levels Leq (day) and Leq (night) were
measured at each monitoring locations. The Details of Ambient Noise Quality
Monitoring Locations are given in Table – 3.9. Monitoring from March 2, 2017
during day and night time was carried out at all the locations. The noise level
measured in study area at different locations is given in Table 3.10
TABLE-3.9
Details of Ambient Noise Quality Monitoring Locations
Sr. No.
Name of village bearing w.r.t.
project site Approximate radial distance
from project site (km) Noise
TYPE OF AREA
1 Project site -- -- N1 Industrial
2 Andada N 3.95 N2 Residential
3 Jitali SE 1.75 N3 Residential
4 Uchhali NE 2.42 N4 Residential
5 Motali NE 2.24 N5 Residential
6 Kharchi Bhilwada NE 4.89 N6 Residential
7 Gadkhol Patiya NW 4.02 N7 Residential
8 Amboli SW 8.68 N8 Residential
9 Umarwada SW 8.86 N9 Residential

NOTIFIED AREA AUTHORITY, ANKLESHWAR ENVIRONMENT IMPACT ASSESSMENT REPORT
EIA Report prepared by M/s. Aqua-Air Environmental Engineers Pvt. Ltd. 3- 14
FIGURE – 3.3
Location of Noise Level Monitoring Stations
TABLE-3.10
Background Noise Levels
Sr. No.
Location
Noise Level in dB(A)
Day Night
Min. Max. Min. Max.
Industrial/Residential Area
1 Project site (N1) 65.1 70.1 59.8 63.4
2 Andada (N2) 47.3 51.9 37.3 42.1
3 Jitali (N3) 48.4 53.2 37.2 41.5
4 Uchhali (N4) 47.5 52.7 38.2 42.7
5 Motali (N5) 46.7 51.5 39.1 43.1
6 Kharchi Bhilwada (N6) 47.8 53.1 39.4 44.9
7 Gadkhol Patiya (N7) 49.4 54.6 38.2 44.8
8 Amboli (N8) 47.2 53.2 37.2 43.2
9 Umarwada (N9) 47.1 52.8 38.1 42.5
NOTE: Type of Test : On Site Testing Type of Test : Instrumental Method (SLM/Lutron-4001)
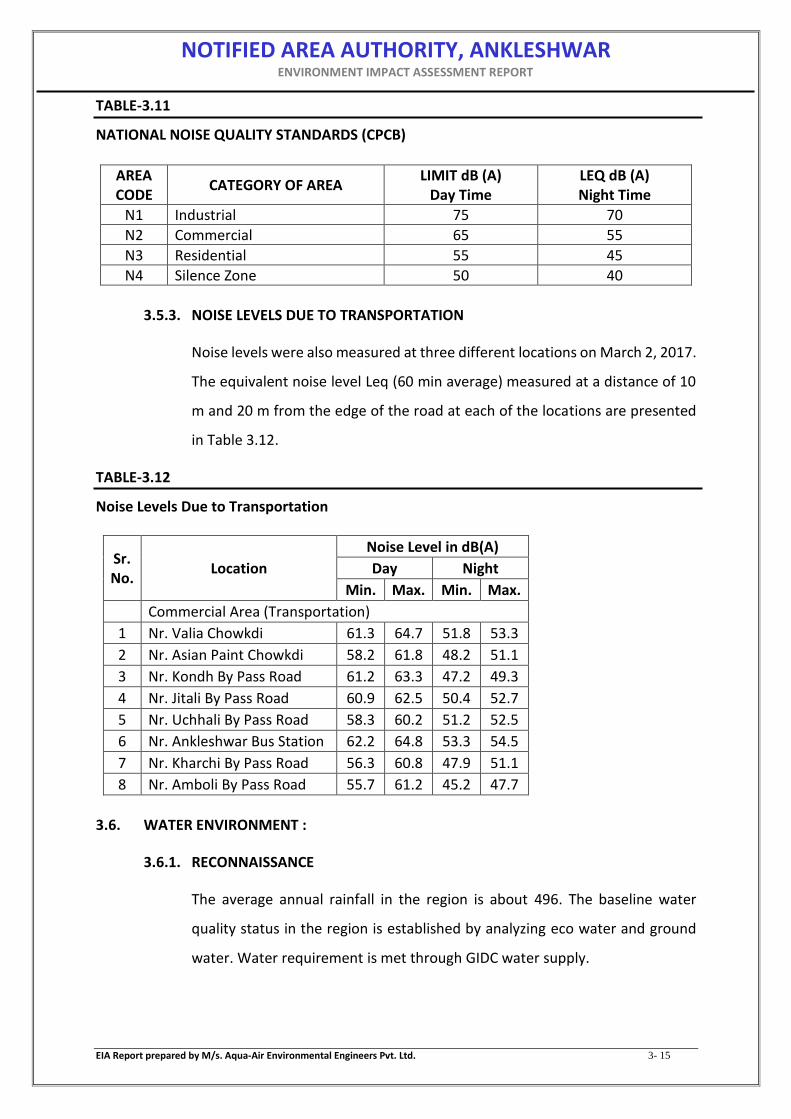
NOTIFIED AREA AUTHORITY, ANKLESHWAR ENVIRONMENT IMPACT ASSESSMENT REPORT
EIA Report prepared by M/s. Aqua-Air Environmental Engineers Pvt. Ltd. 3- 15
TABLE-3.11
NATIONAL NOISE QUALITY STANDARDS (CPCB)
3.5.3. NOISE LEVELS DUE TO TRANSPORTATION
Noise levels were also measured at three different locations on March 2, 2017.
The equivalent noise level Leq (60 min average) measured at a distance of 10
m and 20 m from the edge of the road at each of the locations are presented
in Table 3.12.
TABLE-3.12
Noise Levels Due to Transportation
Sr. No.
Location
Noise Level in dB(A)
Day Night
Min. Max. Min. Max.
Commercial Area (Transportation)
1 Nr. Valia Chowkdi 61.3 64.7 51.8 53.3
2 Nr. Asian Paint Chowkdi 58.2 61.8 48.2 51.1
3 Nr. Kondh By Pass Road 61.2 63.3 47.2 49.3
4 Nr. Jitali By Pass Road 60.9 62.5 50.4 52.7
5 Nr. Uchhali By Pass Road 58.3 60.2 51.2 52.5
6 Nr. Ankleshwar Bus Station 62.2 64.8 53.3 54.5
7 Nr. Kharchi By Pass Road 56.3 60.8 47.9 51.1
8 Nr. Amboli By Pass Road 55.7 61.2 45.2 47.7
3.6. WATER ENVIRONMENT :
3.6.1. RECONNAISSANCE
The average annual rainfall in the region is about 496. The baseline water
quality status in the region is established by analyzing eco water and ground
water. Water requirement is met through GIDC water supply.
AREA CODE
CATEGORY OF AREA LIMIT dB (A)
Day Time LEQ dB (A) Night Time
N1 Industrial 75 70
N2 Commercial 65 55
N3 Residential 55 45
N4 Silence Zone 50 40

NOTIFIED AREA AUTHORITY, ANKLESHWAR ENVIRONMENT IMPACT ASSESSMENT REPORT
EIA Report prepared by M/s. Aqua-Air Environmental Engineers Pvt. Ltd. 3- 16
3.6.2. METHODOLOGY FOR WATER QUALITY MONITORING
Physico-chemical parameters have been analyzed to ascertain the baseline
status of fresh water in the existing surface water and ground water bodies.
Samples were collected during the study period of March 2, 2017 to March 3,
2017 and analyzed as per the Standard Methods of Water and Wastewater
Analysis (APHA).
The details of surface and ground water sampling locations are given in Table
3.13 and sampling locations of water quality monitoring are shown in Figure
3.4.
The Physico-chemical characteristics of the different water samples are
presented in the Tables 3.14.
TABLE-3.13
Sampling Locations for Monitoring Surface and Ground Water Quality
Sr. No.
Name of village bearing w.r.t.
project site
Approximate radial distance from project
site (km) water
1 Project site -- -- GW1
2 Andada N 3.95 GW2
3 Jitali SE 1.75 GW3
4 Uchhali NE 2.42 GW4
5 Motali NE 2.24 GW5
6 Kharchi Bhilwada NE 4.89 GW6
7 Gadkhol Patiya NW 4.02 GW7
8 Amboli SW 8.68 GW8
9 Umarwada SW 8.86 GW9
10 Umarwada Pond SW 8.87 SW1
GW= Ground water SW= Surface water
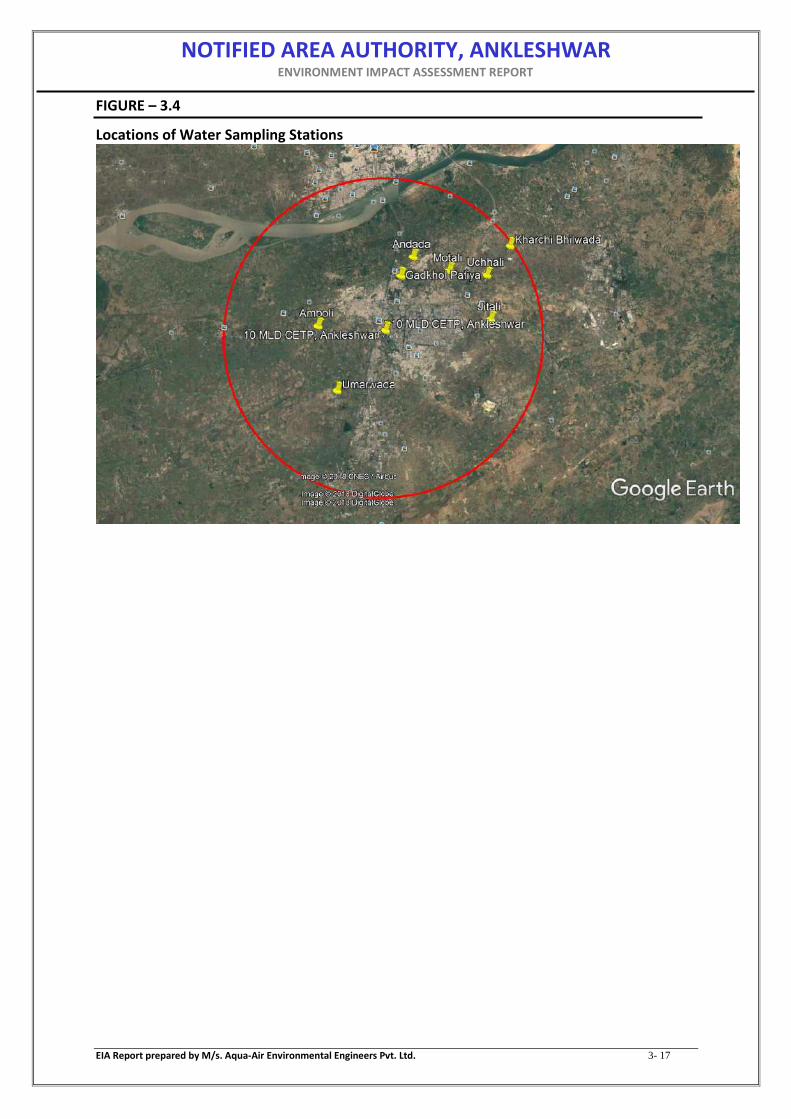
NOTIFIED AREA AUTHORITY, ANKLESHWAR ENVIRONMENT IMPACT ASSESSMENT REPORT
EIA Report prepared by M/s. Aqua-Air Environmental Engineers Pvt. Ltd. 3- 17
FIGURE – 3.4
Locations of Water Sampling Stations

NOTIFIED AREA AUTHORITY, ANKLESHWAR ENVIRONMENT IMPACT ASSESSMENT REPORT
EIA Report prepared by M/s. Aqua-Air Environmental Engineers Pvt. Ltd. 3- 18
TABLE-3.14
Water Quality (Ground Water)
Sr. No.
PARAMETER UNIT
LOCATION/LAB ID
TEST METHOD JITALI UCHHALI MOTALI
KHARCHI BHILWADA
06/EIA/16/GW/V1 06/EIA/16/GW/V2 06/EIA/16/GW/V3 06/EIA/16/GW/V4
RESULTS
1 pH -- 6.91 7.10 7.22 6.92 IS:3025 (P-11):1983
2 Temperature oC 24.80 24.90 25.10 25.00 IS:3025 (P-9):1984
3 Salinity ppt 1.26 1.59 2.33 2.11 Electrometric Method (Instrumental) & Operational Manual
4 Electrical Conductivity mS/cm 2.08 2.62 3.82 3.48 IS:3025 (P-14):1984
5 Turbidity NTU 0.50 0.48 0.86 0.30 IS:3025 (P-10):1984
6 Dissolved Oxygen mg/L 6.41 5.86 5.06 6.27 IS:3025 (P-38):1989
7 Total Dissolved Solids (TDS)
mg/L 1346.00 1460.00 2244.00 2886.00 IS:3025 (P-16):1984
8 Total Suspended Solids (TSS)
mg/L 5.00 28.00 40.00 20.00 IS:3025 (P-17):1984
9 Total Solids (as TS) mg/L 1351.00 1488.00 2284.00 2906.00 IS:3025 (P-15):1984
10 Chemical Oxygen Demand (COD)
mg/L 8.61 6.61 21.82 2.64 APHA & AWWA.22nd
Ed.5220-B.(5-17)
11 Biochemical Oxygen Demand (BOD3
27) mg/L BDL BDL BDL BDL IS:3025 (P-44):1993
12 Chlorides (as Cl-) mg/L 377.20 463.20 857.40 862.30 IS:3025 (P-32):1988
13 Sulphates (as SO4-2) mg/L 67.52 141.00 98.66 101.30
APHA & AWWA. 22nd Ed.-4500-SO4
2--E.(4-190)
14 Total Alkalinity mg/L 392.30 539.60 108.90 IS:3025 (P-23):1986

NOTIFIED AREA AUTHORITY, ANKLESHWAR ENVIRONMENT IMPACT ASSESSMENT REPORT
EIA Report prepared by M/s. Aqua-Air Environmental Engineers Pvt. Ltd. 3- 19
(as CaCO3)
15 Total Hardness
mg/L 535.10 429.40 596.70 1251.90 IS:3025 (P-21):1983 (as CaCO3)
16 Calcium Hardness mg/L 382.50 233.90 191.50 653.20 APHA & AWWA.22nd Ed.3500 Ca-B (3-67)
17 Magnesium (as Mg) mg/L 33.28 47.51 98.46 145.50 APHA & AWWA.22nd Ed. 3500 Mg-B (3-84)
18 Ammonical Nitrogen
mg/L BDL BDL BDL BDL APHA & AWWA.22nd
Ed.4500-NH3 B & C.(4-110,111,112) (as NH3-N)
19 Copper (as Cu) mg/L BDL* BDL* BDL* BDL* APHA & AWWA.22nd
Ed.3500-Cu B.(3-74)
20 Fluoride (as F-) mg/L BDL* BDL* BDL* BDL* APHA & AWWA.22nd Ed.4500-F--B & D.(4-84,87)
21 Total Iron (as Fe) mg/L BDL* 0.14 0.17 0.13 IS:3025 (P-53):2003
22 Phenol (as C6H5OH) mg/L BDL* BDL* BDL* BDL* APHA & AWWA.22nd Ed.5530-B.5-47 & D.(5-49)
23 Oil & Grease mg/L BDL BDL BDL BDL IS:3025 (P-39):1991
24 Hexavalent Chromium
mg/L BDL* BDL* BDL* BDL* APHA & AWWA.22nd
Ed.3500-Cr.-B (3-69) (as Cr+6)
25 Nickel (as Ni) mg/L BDL* BDL* BDL* BDL* IS:3025 (P-54):2003
26 **Total Chromium
mg/L BDL BDL BDL BDL APHA & AWWA. 22nd Ed.3111. B-AAS (as Cr+3)
27 **Zinc (as Zn) mg/L BDL BDL BDL BDL APHA & AWWA. 22nd Ed.-3111. B-AAS
28 **Lead (as Pb) mg/L BDL BDL BDL BDL APHA & AWWA. 22nd Ed.-3111. B-AAS
29 **Sodium (as Na) mg/L 146.31 36.53 71.74 105.20 APHA & AWWA. 22nd Ed.-3111. B-AAS

NOTIFIED AREA AUTHORITY, ANKLESHWAR ENVIRONMENT IMPACT ASSESSMENT REPORT
EIA Report prepared by M/s. Aqua-Air Environmental Engineers Pvt. Ltd. 3- 20
30 **Potassium (as K) mg/L 11.35 3.08 22.46 58.32 APHA & AWWA.22nd Ed.3500 K B- Flame Photometer
31 **Arsenic (as As) mg/L BDL BDL BDL BDL APHA & AWWA. 22nd Ed.-3112. B-AAS
32 **Cadmium (as Cd) mg/L BDL BDL BDL BDL APHA & AWWA. 22nd Ed.-3111. B-AAS
TABLE-3.14
Water Quality (Ground Water) (Cont'd.)
Sr. No.
PARAMETER UNIT
LOCATION/LAB ID
TEST METHOD Gadkhol Patiya Amboli Umarwada
06/EIA/16/GW/V5 06/EIA/16/GW/V6 06/EIA/16/GW/V7
RESULTS
1 pH -- 7.2 7.31 7.15 IS:3025 (P-11):1983
2 Temperature oC 25 24.9 25 IS:3025 (P-9):1984
3 Salinity ppt 1.83 1.84 2.24 Electrometric Method (Instrumental) & Operational Manual
4 Electrical Conductivity mS/cm 3.01 3.02 3.65 IS:3025 (P-14):1984
5 Turbidity NTU 0.07 0.06 0.63 IS:3025 (P-10):1984
6 Dissolved Oxygen mg/L 5.87 6.67 5.6 IS:3025 (P-38):1989
7 Total Dissolved Solids (TDS) mg/L 1984 1564 2536 IS:3025 (P-16):1984
8 Total Suspended Solids (TSS) mg/L 26 20 34 IS:3025 (P-17):1984
9 Total Solids (as TS) mg/L 2010 1584 2570 IS:3025 (P-15):1984
10 Chemical Oxygen Demand (COD)
mg/L 14.54 5.29 10.58 APHA & AWWA.22nd Ed.5220-B.(5-17)
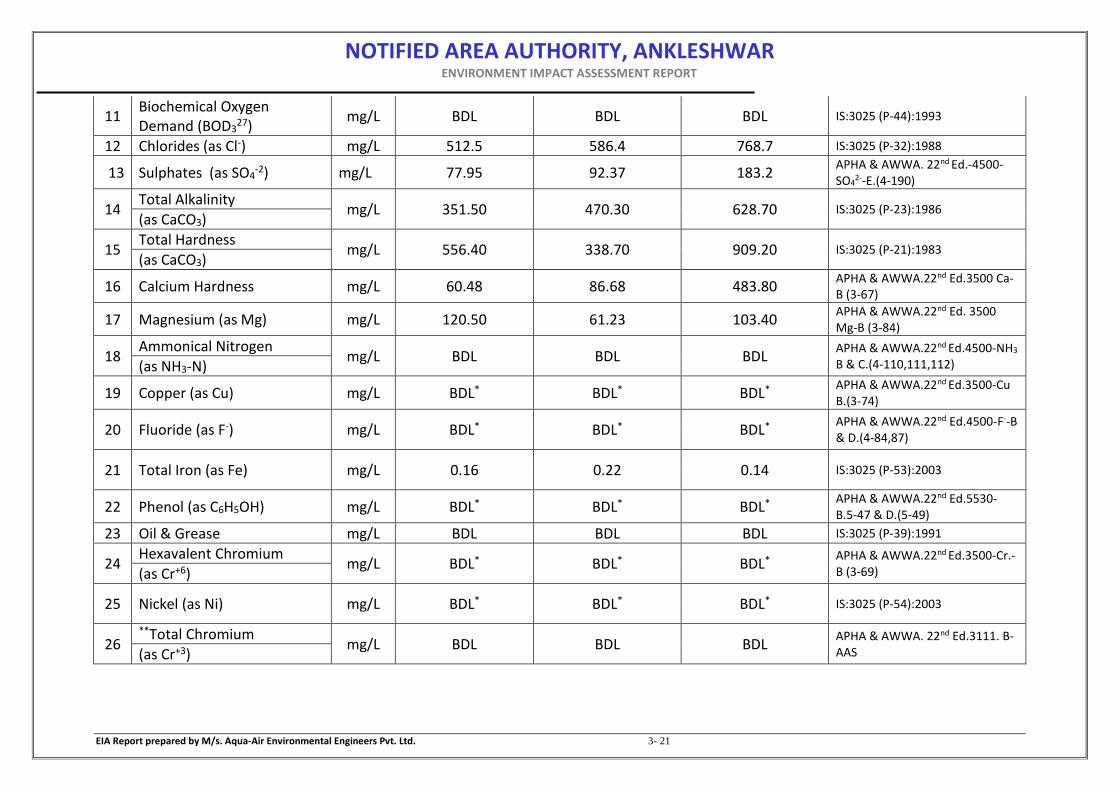
NOTIFIED AREA AUTHORITY, ANKLESHWAR ENVIRONMENT IMPACT ASSESSMENT REPORT
EIA Report prepared by M/s. Aqua-Air Environmental Engineers Pvt. Ltd. 3- 21
11 Biochemical Oxygen Demand (BOD3
27) mg/L BDL BDL BDL IS:3025 (P-44):1993
12 Chlorides (as Cl-) mg/L 512.5 586.4 768.7 IS:3025 (P-32):1988
13 Sulphates (as SO4-2) mg/L 77.95 92.37 183.2
APHA & AWWA. 22nd Ed.-4500-SO4
2--E.(4-190)
14 Total Alkalinity
mg/L 351.50 470.30 628.70 IS:3025 (P-23):1986 (as CaCO3)
15 Total Hardness
mg/L 556.40 338.70 909.20 IS:3025 (P-21):1983 (as CaCO3)
16 Calcium Hardness mg/L 60.48 86.68 483.80 APHA & AWWA.22nd Ed.3500 Ca-B (3-67)
17 Magnesium (as Mg) mg/L 120.50 61.23 103.40 APHA & AWWA.22nd Ed. 3500 Mg-B (3-84)
18 Ammonical Nitrogen
mg/L BDL BDL BDL APHA & AWWA.22nd Ed.4500-NH3 B & C.(4-110,111,112) (as NH3-N)
19 Copper (as Cu) mg/L BDL* BDL* BDL* APHA & AWWA.22nd Ed.3500-Cu B.(3-74)
20 Fluoride (as F-) mg/L BDL* BDL* BDL* APHA & AWWA.22nd Ed.4500-F--B & D.(4-84,87)
21 Total Iron (as Fe) mg/L 0.16 0.22 0.14 IS:3025 (P-53):2003
22 Phenol (as C6H5OH) mg/L BDL* BDL* BDL* APHA & AWWA.22nd Ed.5530-B.5-47 & D.(5-49)
23 Oil & Grease mg/L BDL BDL BDL IS:3025 (P-39):1991
24 Hexavalent Chromium
mg/L BDL* BDL* BDL* APHA & AWWA.22nd Ed.3500-Cr.-B (3-69) (as Cr+6)
25 Nickel (as Ni) mg/L BDL* BDL* BDL* IS:3025 (P-54):2003
26 **Total Chromium
mg/L BDL BDL BDL APHA & AWWA. 22nd Ed.3111. B-AAS (as Cr+3)
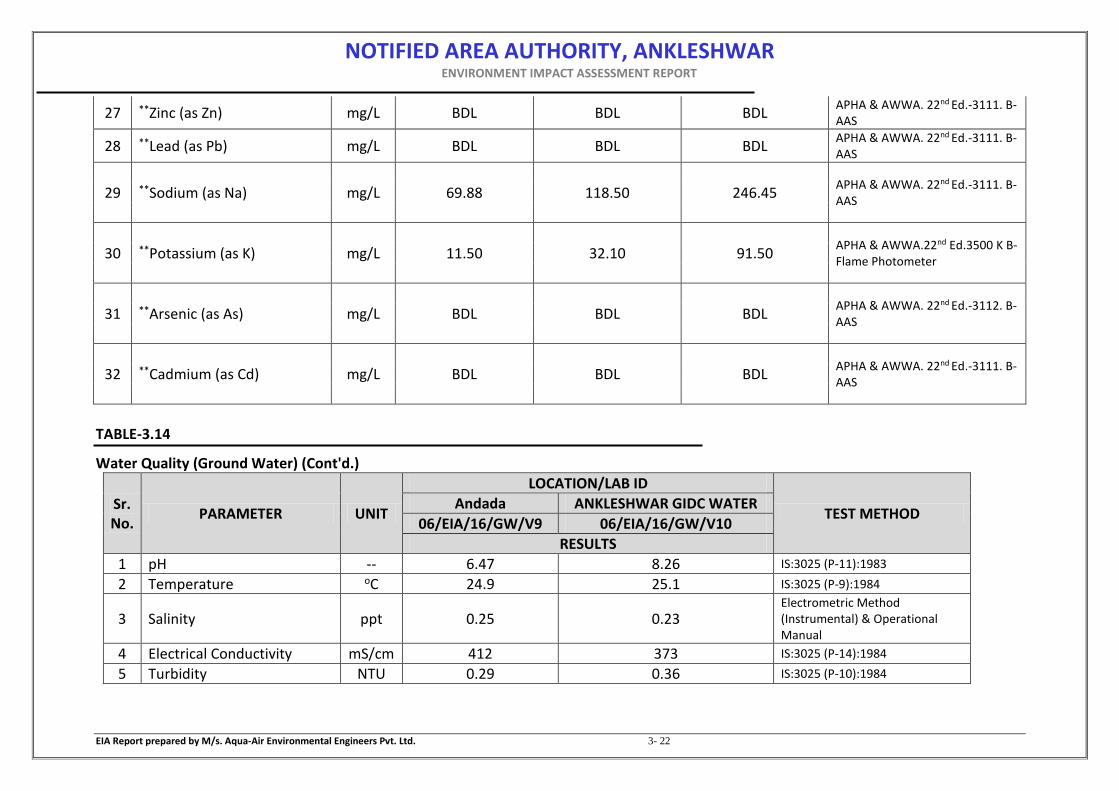
NOTIFIED AREA AUTHORITY, ANKLESHWAR ENVIRONMENT IMPACT ASSESSMENT REPORT
EIA Report prepared by M/s. Aqua-Air Environmental Engineers Pvt. Ltd. 3- 22
27 **Zinc (as Zn) mg/L BDL BDL BDL APHA & AWWA. 22nd Ed.-3111. B-AAS
28 **Lead (as Pb) mg/L BDL BDL BDL APHA & AWWA. 22nd Ed.-3111. B-AAS
29 **Sodium (as Na) mg/L 69.88 118.50 246.45 APHA & AWWA. 22nd Ed.-3111. B-AAS
30 **Potassium (as K) mg/L 11.50 32.10 91.50 APHA & AWWA.22nd Ed.3500 K B- Flame Photometer
31 **Arsenic (as As) mg/L BDL BDL BDL APHA & AWWA. 22nd Ed.-3112. B-AAS
32 **Cadmium (as Cd) mg/L BDL BDL BDL APHA & AWWA. 22nd Ed.-3111. B-AAS
TABLE-3.14
Water Quality (Ground Water) (Cont'd.)
Sr. No.
PARAMETER UNIT
LOCATION/LAB ID
TEST METHOD Andada ANKLESHWAR GIDC WATER
06/EIA/16/GW/V9 06/EIA/16/GW/V10
RESULTS
1 pH -- 6.47 8.26 IS:3025 (P-11):1983
2 Temperature oC 24.9 25.1 IS:3025 (P-9):1984
3 Salinity ppt 0.25 0.23 Electrometric Method (Instrumental) & Operational Manual
4 Electrical Conductivity mS/cm 412 373 IS:3025 (P-14):1984
5 Turbidity NTU 0.29 0.36 IS:3025 (P-10):1984
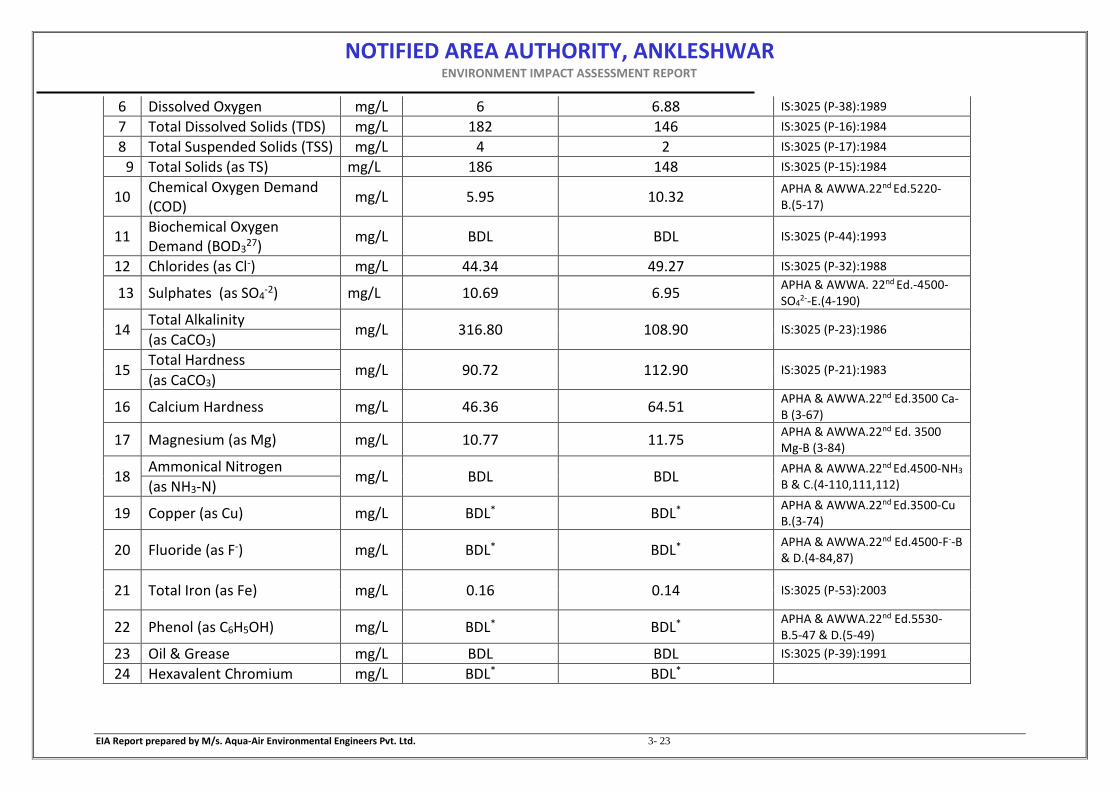
NOTIFIED AREA AUTHORITY, ANKLESHWAR ENVIRONMENT IMPACT ASSESSMENT REPORT
EIA Report prepared by M/s. Aqua-Air Environmental Engineers Pvt. Ltd. 3- 23
6 Dissolved Oxygen mg/L 6 6.88 IS:3025 (P-38):1989
7 Total Dissolved Solids (TDS) mg/L 182 146 IS:3025 (P-16):1984
8 Total Suspended Solids (TSS) mg/L 4 2 IS:3025 (P-17):1984
9 Total Solids (as TS) mg/L 186 148 IS:3025 (P-15):1984
10 Chemical Oxygen Demand (COD)
mg/L 5.95 10.32 APHA & AWWA.22nd Ed.5220-B.(5-17)
11 Biochemical Oxygen Demand (BOD3
27) mg/L BDL BDL IS:3025 (P-44):1993
12 Chlorides (as Cl-) mg/L 44.34 49.27 IS:3025 (P-32):1988
13 Sulphates (as SO4-2) mg/L 10.69 6.95
APHA & AWWA. 22nd Ed.-4500-SO4
2--E.(4-190)
14 Total Alkalinity
mg/L 316.80 108.90 IS:3025 (P-23):1986 (as CaCO3)
15 Total Hardness
mg/L 90.72 112.90 IS:3025 (P-21):1983 (as CaCO3)
16 Calcium Hardness mg/L 46.36 64.51 APHA & AWWA.22nd Ed.3500 Ca-B (3-67)
17 Magnesium (as Mg) mg/L 10.77 11.75 APHA & AWWA.22nd Ed. 3500 Mg-B (3-84)
18 Ammonical Nitrogen
mg/L BDL BDL APHA & AWWA.22nd Ed.4500-NH3 B & C.(4-110,111,112) (as NH3-N)
19 Copper (as Cu) mg/L BDL* BDL* APHA & AWWA.22nd Ed.3500-Cu B.(3-74)
20 Fluoride (as F-) mg/L BDL* BDL* APHA & AWWA.22nd Ed.4500-F--B & D.(4-84,87)
21 Total Iron (as Fe) mg/L 0.16 0.14 IS:3025 (P-53):2003
22 Phenol (as C6H5OH) mg/L BDL* BDL* APHA & AWWA.22nd Ed.5530-B.5-47 & D.(5-49)
23 Oil & Grease mg/L BDL BDL IS:3025 (P-39):1991
24 Hexavalent Chromium mg/L BDL* BDL*
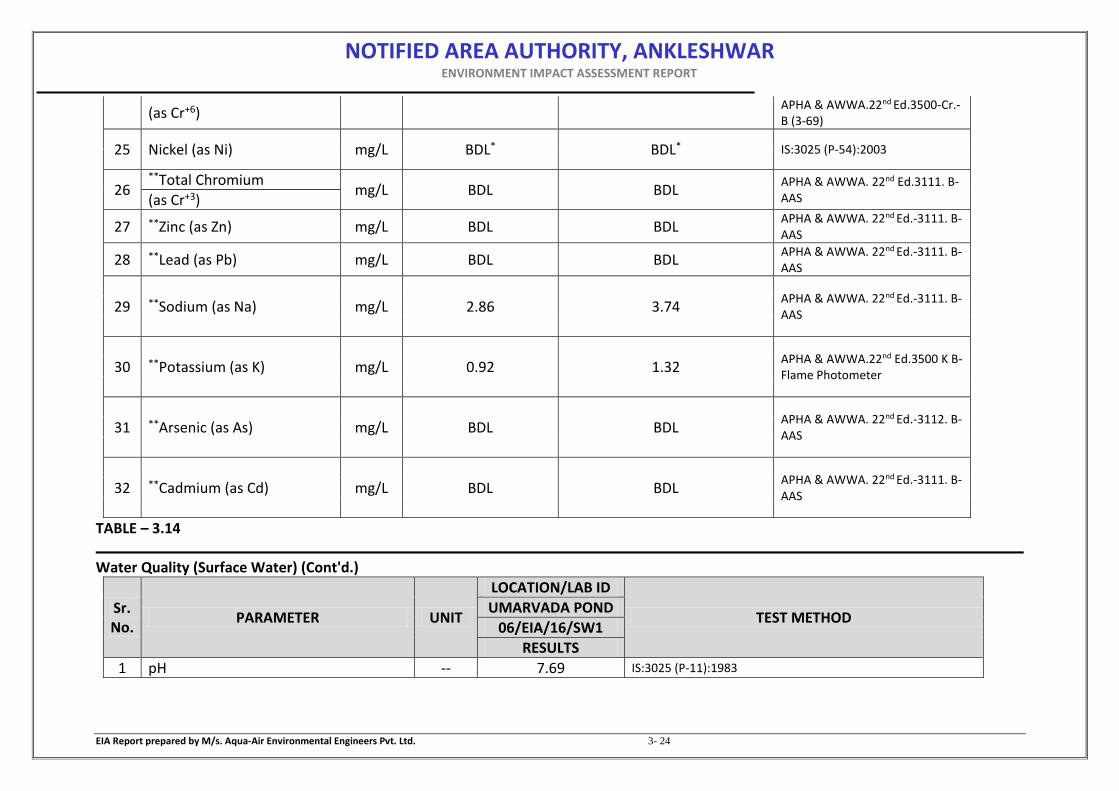
NOTIFIED AREA AUTHORITY, ANKLESHWAR ENVIRONMENT IMPACT ASSESSMENT REPORT
EIA Report prepared by M/s. Aqua-Air Environmental Engineers Pvt. Ltd. 3- 24
(as Cr+6) APHA & AWWA.22nd Ed.3500-Cr.-B (3-69)
25 Nickel (as Ni) mg/L BDL* BDL* IS:3025 (P-54):2003
26 **Total Chromium
mg/L BDL BDL APHA & AWWA. 22nd Ed.3111. B-AAS (as Cr+3)
27 **Zinc (as Zn) mg/L BDL BDL APHA & AWWA. 22nd Ed.-3111. B-AAS
28 **Lead (as Pb) mg/L BDL BDL APHA & AWWA. 22nd Ed.-3111. B-AAS
29 **Sodium (as Na) mg/L 2.86 3.74 APHA & AWWA. 22nd Ed.-3111. B-AAS
30 **Potassium (as K) mg/L 0.92 1.32 APHA & AWWA.22nd Ed.3500 K B- Flame Photometer
31 **Arsenic (as As) mg/L BDL BDL APHA & AWWA. 22nd Ed.-3112. B-AAS
32 **Cadmium (as Cd) mg/L BDL BDL APHA & AWWA. 22nd Ed.-3111. B-AAS
TABLE – 3.14
Water Quality (Surface Water) (Cont'd.)
Sr. No.
PARAMETER UNIT
LOCATION/LAB ID
TEST METHOD UMARVADA POND
06/EIA/16/SW1
RESULTS
1 pH -- 7.69 IS:3025 (P-11):1983

NOTIFIED AREA AUTHORITY, ANKLESHWAR ENVIRONMENT IMPACT ASSESSMENT REPORT
EIA Report prepared by M/s. Aqua-Air Environmental Engineers Pvt. Ltd. 3- 25
2 Temperature oC 25 IS:3025 (P-9):1984
3 Salinity ppt 0.56 Electrometric Method (Instrumental) & Operational Manual
4 Electrical Conductivity mS/cm 906 IS:3025 (P-14):1984
5 Turbidity NTU 0.76 IS:3025 (P-10):1984
6 Dissolved Oxygen mg/L 5.46 IS:3025 (P-38):1989
7 Total Dissolved Solids (TDS) mg/L 248 IS:3025 (P-16):1984
8 Total Suspended Solids (TSS) mg/L 12 IS:3025 (P-17):1984
9 Total Solids (as TS) mg/L 260 IS:3025 (P-15):1984
10 Chemical Oxygen Demand (COD) mg/L 25.13 APHA & AWWA.22nd Ed.5220-B.(5-17)
11 Biochemical Oxygen Demand (BOD327) mg/L BDL IS:3025 (P-44):1993
12 Chlorides (as Cl-) mg/L 19.71 IS:3025 (P-32):1988
13 Sulphates (as SO4-2) mg/L 47.19 APHA & AWWA. 22nd Ed.-4500-SO4
2--E.(4-190)
14 Total Alkalinity
mg/L 222.80 IS:3025 (P-23):1986 (as CaCO3)
15 Total Hardness
mg/L 167.30 IS:3025 (P-21):1983 (as CaCO3)
16 Calcium Hardness mg/L 50.4 APHA & AWWA.22nd Ed.3500 Ca-B (3-67)
17 Magnesium (as Mg) mg/L 28.41 APHA & AWWA.22nd Ed. 3500 Mg-B (3-84)
18 Ammonical Nitrogen
mg/L BDL APHA & AWWA.22nd Ed.4500-NH3 B & C.(4-110,111,112) (as NH3-N)
19 Copper (as Cu) mg/L BDL* APHA & AWWA.22nd Ed.3500-Cu B.(3-74)
20 Fluoride (as F-) mg/L BDL* APHA & AWWA.22nd Ed.4500-F--B & D.(4-84,87)
21 Total Iron (as Fe) mg/L 0.36 IS:3025 (P-53):2003
22 Phenol (as C6H5OH) mg/L BDL* APHA & AWWA.22nd Ed.5530-B.5-47 & D.(5-49)
23 Oil & Grease mg/L BDL IS:3025 (P-39):1991
24 Hexavalent Chromium
mg/L BDL* APHA & AWWA.22nd Ed.3500-Cr.-B (3-69) (as Cr+6)

NOTIFIED AREA AUTHORITY, ANKLESHWAR ENVIRONMENT IMPACT ASSESSMENT REPORT
EIA Report prepared by M/s. Aqua-Air Environmental Engineers Pvt. Ltd. 3- 26
25 Nickel (as Ni) mg/L BDL* IS:3025 (P-54):2003
26 **Total Chromium
mg/L BDL APHA & AWWA. 22nd Ed.3111. B-AAS (as Cr+3)
27 **Zinc (as Zn) mg/L BDL APHA & AWWA. 22nd Ed.-3111. B-AAS
28 **Lead (as Pb) mg/L BDL APHA & AWWA. 22nd Ed.-3111. B-AAS
29 **Sodium (as Na) mg/L 8.09 APHA & AWWA. 22nd Ed.-3111. B-AAS
30 **Potassium (as K) mg/L 2.26 APHA & AWWA.22nd Ed.3500 K B- Flame Photometer
31 **Arsenic (as As) mg/L BDL APHA & AWWA. 22nd Ed.-3112. B-AAS
32 **Cadmium (as Cd) mg/L BDL APHA & AWWA. 22nd Ed.-3111. B-AAS
GW: Ground Water, SW: Surface Water, BDL: Below Detectable Level Detectable Limit of Instrument: Copper : 0.05 mg/L, Sulphate : 2.0 mg/L, Iron : 0.01 mg/L, Phenol : 0.01 mg/L, Total Phosphorus : 0.01 mg/L, Nitrate Nitrogen : 0.01 mg/L

NOTIFIED AREA AUTHORITY, ANKLESHWAR ENVIRONMENT IMPACT ASSESSMENT REPORT
EIA Report prepared by M/s. Aqua-Air Environmental Engineers Pvt. Ltd. 3- 27
SUMMARY
3.6.3. BASELINE GROUND WATER QUALITY
pH of ground water samples varied from 6.47 to 8.26. Turbidity was found 0.06
to 0.86 NTU, Total Dissolved Solids varied in the range of 146.0 to 2244.0 mg/L.
DO and COD are found in range of 5.06 to 6.88 mg/L, and 2.64 to 21.82 mg/L
respectively. BOD3 was found to be BDL. Total Hardness (as CaCO3) varied from
90.72 to 1251.9 mg/L. Total Alkalinity varied from 108.9 to 539.6 mg/L.
Chlorides and Sulfates are found in the range of 44.34 to 862.3 mg/L and 6.95
to 101.3 mg/L respectively.
3.6.4. BASELINE SURFACE WATER QUALITY
pH of surface water samples was found 7.69. Turbidity was found 0.76 NTU,
Total Dissolved Solids was found 248.0 mg/L. DO and COD are found 5.46 and
25.13 mg/L respectively. BOD3 was found to be BDL. Total Hardness (as CaCO3)
are found 167.3 mg/L. Total Alkalinity varied from 222.8 mg/L. Chlorides and
Sulfates are found 19.71 mg/L and 47.19 mg/L respectively.
3.7. LAND ENVIRONMENT
3.7.1. METHODOLOGY FOR SOIL MONITORING
Soil samples were collected from nine locations during March 2 & 3, 2017
within the study area to assess its physico-chemical characteristics. The
locations selected for collection of soil samples are shown in Figure 3.5 and
presented in Table 3.15. The analysis results of soil samples are given in Table
3.16.

NOTIFIED AREA AUTHORITY, ANKLESHWAR ENVIRONMENT IMPACT ASSESSMENT REPORT
EIA Report prepared by M/s. Aqua-Air Environmental Engineers Pvt. Ltd. 3- 28
TABLE – 3.15
Soil Sampling Locations Sr. No.
Name of village bearing w.r.t.
project site
Approximate radial distance from project
site (km) Soil
1 Project site -- -- S1
2 Andada N 3.95 S2
3 Jitali SE 1.75 S3
4 Uchhali NE 2.42 S4
5 Motali NE 2.24 S5
6 Kharchi Bhilwada NE 4.89 S6
7 Gadkhol Patiya NW 4.02 S7
8 Amboli SW 8.68 S8
9 Umarwada SW 8.86 S9
FIGURE – 3.5
Locations of Soil Sampling Stations

NOTIFIED AREA AUTHORITY, ANKLESHWAR ENVIRONMENT IMPACT ASSESSMENT REPORT
EIA Report prepared by M/s. Aqua-Air Environmental Engineers Pvt. Ltd. 3- 29
TABLE – 3.16
Physico-Chemicals Characteristics of Soil
Sr. No.
PARAMETER UNIT
LOCATION/LAB ID
TEST METHOD JITALI UCHHALI MOTALI KHARCHI
BHILWADA
06/EIA/16/SO/V1 06/EIA/16/SO/V2 06/EIA/16/SO/V3 06/EIA/16/SO/V4
1 Moisture Content % 5.37 4.75 4.8 7.11 Handbook of methods in
environmental studies.Vol.2, Edition: 2011, S.K.Maiti-10.5
*Total Solids % 94.63 95.25 95.2 92.89
2 pH -- 7.41 7.34 7.49 7.61 Handbook of methods in environmental studies.Vol.2, Edition: 2011, S.K.Maiti-11.1 3 Temperature oC 24.9 25.2 25.1 25
4 Bulk Density gm/cm3 1.25 1.15 1.25 1.15 Handbook of methods in environmental studies.Vol.2, Edition: 2011, S.K.Maiti-10.4
5 Porosity % 52.83 56.6 52.83 56.6 Handbook of methods in environmental studies.Vol.2, Edition: 2011, S.K.Maiti-10.4
6 Water Holding Capacity (WHC)
% 64.57 69.16 67.31 65.97 Handbook of methods in environmental studies.Vol.2, Edition: 2011, S.K.Maiti-10.7
7 *Specific Gravity -- 2.52 2.84 2.73 2.68 IS:2720 (P-3/S-1):1980
8 *Total Hardness
-- 552 726 714 592 IS:3025 (P-21):2009 (as CaCO3)
9 Calcium (as Ca+2) mg/Kg 210.4 280.6 210.4 220.4 Handbook of methods in environmental studies.Vol.2, Edition: 2011, S.K.Maiti-11.15
10 Magnesium (as Mg+2) mg/Kg 6.05 4.85 44.95 9.7 Handbook of methods in environmental studies.Vol.2, Edition: 2011, S.K.Maiti-11.15
11 Chlorides (as Cl-) mg/Kg 149.9 199.9 149.9 124.9 Handbook of methods in environmental studies.Vol.2, Edition: 2011, S.K.Maiti-11.16

NOTIFIED AREA AUTHORITY, ANKLESHWAR ENVIRONMENT IMPACT ASSESSMENT REPORT
EIA Report prepared by M/s. Aqua-Air Environmental Engineers Pvt. Ltd. 3- 30
12 Total Phosphorus mg/Kg 12 16.75 19.25 14.5 Handbook of methods in environmental studies.Vol.2, Edition: 2011, S.K.Maiti-11.9
13 Available Phosphorus mg/Kg 3.85 4.32 5.02 2.98 Vol.2:, Edition: 2011, S.K.Maiti-11.8, pg no.177
14 Organic Matter (OM) % 6.3 6.87 7.02 6.47 Handbook of methods in environmental studies.Vol.2, Edition: 2011, S.K.Maiti-11.5
15 *Total Alkalinity
mg/Kg 594 1014 668.3 272.3 IS:3025 (P-23):1986 (as CaCO3)
16 Total Nitrogen mg/Kg 122.5 131.7 119.8 98.54 Handbook of methods in environmental studies.Vol.2, Edition: 2011, S.K.Maiti-11.6
17 *Nitrate Nitrogen
mg/Kg 4.05 0.45 0.8 1.8 APHA & AWWA.22nd Ed.4500-NO3
- B. (4-122) (as NO3--N)
18 *Sulphates (as SO4-2) mg/Kg 2.1 8 6.4 4.8 IS:2720(P-27):1977
19 *Total Iron (as Fe) mg/Kg 1.05 0.89 4.37 4.53 IS:3025 (P-53):2003
20 *Copper (as Cu) mg/Kg BDL* BDL* BDL* BDL* APHA & AWWA.22nd Ed.3500-Cu B. (3-74)
21 *Nickel (as Ni) mg/Kg BDL* BDL* BDL* BDL* IS:3025 (P-54):2003
22 **Lead (as Pb) mg/Kg 1.81 2.06 BDL* 0.94 USEPA-3500-B/AAS
23 **Arsenic (as As) mg/Kg BDL* BDL* BDL* BDL* USEPA-3500-B/AAS
24 **TOC mg/Kg 21.48 28.45 18.94 17.68 USEPA-3500-B/AAS
25 **Color -- Blackish brown Light brown Yellowish brown Light brown USEPA-3500-B
26 **Sodium (as Na) mg/Kg 485.6 657.4 814.5 562.8 USEPA-3500-B/AAS 27 **Potassium (as K) mg/Kg 366.2 408.9 576.2 393.5
28 **Cadmium (as Cd) mg/Kg BDL* BDL* BDL* BDL*
29 **Permeability cm/sec 4.28 x 10⁻³ 3.69 x 10⁻⁴ 3.68 x 10⁻³ 4.21 x 10⁻³ IS: 2720 (Part-16):2006
30
**Grain Size Analysis:
Gravel % 2 0 0 34 IS:2720 (Part-4):2006 Coarse Sand % 2 1 1 9
Medium Sand % 5 7 4 4

NOTIFIED AREA AUTHORITY, ANKLESHWAR ENVIRONMENT IMPACT ASSESSMENT REPORT
EIA Report prepared by M/s. Aqua-Air Environmental Engineers Pvt. Ltd. 3- 31
Fine Sand % 51 20 64 31
Silt + Clay % 40 72 31 22
Sr. No.
PARAMETER UNIT
LOCATION/LAB ID
TEST METHOD Gadkhol Patiya Amboli Umarwada Andada Project site
06/EIA/16/SO/V5 06/EIA/16/SO/V6 06/EIA/16/SO/V7 06/EIA/16/SO/V09 06/EIA/16/SO/V10
1
Moisture Content % 4.77 7.04 3.86 2.13 4.65 Handbook of methods in environmental studies.Vol.2, Edition: 2011, S.K.Maiti-10.5
*Total Solids % 95.23 92.96 96.14 97.87 91.45
2 pH -- 7.74 7.72 7.95 7.09 7.58 Handbook of methods in environmental studies.Vol.2, Edition: 2011, S.K.Maiti-11.1
3 Temperature oC 25 25.1 25 25.1 25
4 Bulk Density gm/cm3 1.2 1.24 1.11 1.15 1.21
Handbook of methods in environmental studies.Vol.2, Edition: 2011, S.K.Maiti-10.4
5 Porosity % 54.71 53.2 58.07 56.49 53.27
Handbook of methods in environmental studies.Vol.2, Edition: 2011, S.K.Maiti-10.4
6 Water Holding Capacity (WHC)
% 71.5 58.56 65.57 46.53 69.37
Handbook of methods in environmental studies.Vol.2,

NOTIFIED AREA AUTHORITY, ANKLESHWAR ENVIRONMENT IMPACT ASSESSMENT REPORT
EIA Report prepared by M/s. Aqua-Air Environmental Engineers Pvt. Ltd. 3- 32
Edition: 2011, S.K.Maiti-10.7
7 *Specific Gravity -- 2.88 2.36 2.46 2.66 2.57 IS:2720 (P-3/S-1):1980
8 *Total Hardness
-- 615 512 655 392 583 IS:3025 (P-
21):2009 (as CaCO3)
9 Calcium (as Ca+2) mg/Kg 240.5 200.4 210.4 120.2 234.1
Handbook of methods in environmental studies.Vol.2, Edition: 2011, S.K.Maiti-11.15
10 Magnesium (as Mg+2)
mg/Kg 2.4 2.4 24.3 21.85 2.51
Handbook of methods in environmental studies.Vol.2, Edition: 2011, S.K.Maiti-11.15
11 Chlorides (as Cl-) mg/Kg 125.1 99.95 250 374.9 136.2
Handbook of methods in environmental studies.Vol.2, Edition: 2011, S.K.Maiti-11.16
12 Total Phosphorus mg/Kg 18 18 20.25 17.75 17.5
Handbook of methods in environmental studies.Vol.2, Edition: 2011, S.K.Maiti-11.9

NOTIFIED AREA AUTHORITY, ANKLESHWAR ENVIRONMENT IMPACT ASSESSMENT REPORT
EIA Report prepared by M/s. Aqua-Air Environmental Engineers Pvt. Ltd. 3- 33
13 Available Phosphorus
mg/Kg 3.29 3.73 4.29 4.58 3.31
Vol.2:, Edition: 2011, S.K.Maiti-11.8, pg no.177
14 Organic Matter (OM)
% 6.6 7.22 6.23 3.52 6.38
Handbook of methods in environmental studies.Vol.2, Edition: 2011, S.K.Maiti-11.5
15 *Total Alkalinity
mg/Kg 767.2 519.2 742.5 643.5 742.4 IS:3025 (P-
23):1986 (as CaCO3)
16 Total Nitrogen mg/Kg 156.4 96.28 109.6 96.22 151.3
Handbook of methods in environmental studies.Vol.2, Edition: 2011, S.K.Maiti-11.6
17
*Nitrate Nitrogen
mg/Kg
0.45 9.35 2.45 7.25 0.57 APHA & AWWA.22nd
Ed.4500-NO3-
B. (4-122) (as NO3
--N)
18 *Sulphates (as SO4
-
2) mg/Kg 10.65 4.65 29.4 7.25 11.52
IS:2720(P-27):1977
19 *Total Iron (as Fe) mg/Kg 1.66 2.2 1.97 0.98 1.58 IS:3025 (P-53):2003
20 *Copper (as Cu) mg/Kg BDL* BDL* BDL* BDL* BDL*
APHA & AWWA.22nd
Ed.3500-Cu B. (3-74)
21 *Nickel (as Ni) mg/Kg BDL* BDL* BDL* BDL* BDL* IS:3025 (P-54):2003
22 **Lead (as Pb) mg/Kg BDL* BDL* 1.74 2.13 BDL* USEPA-3500-B/AAS

NOTIFIED AREA AUTHORITY, ANKLESHWAR ENVIRONMENT IMPACT ASSESSMENT REPORT
EIA Report prepared by M/s. Aqua-Air Environmental Engineers Pvt. Ltd. 3- 34
23 **Arsenic (as As) mg/Kg BDL* BDL* BDL* BDL* BDL* USEPA-3500-B/AAS
24 **TOC mg/Kg 25.62 23.84 22.56 18.36 24.71 USEPA-3500-B/AAS
25 **Color -- Light brown Blackish brown Yellowish brown Yellowish brown Light Brown USEPA-3500-B
26 **Sodium (as Na) mg/Kg 680 783 838 1124 692 USEPA-3500-B/AAS
27 **Potassium (as K) mg/Kg 302 562 792 988 382
28 **Cadmium (as Cd) mg/Kg BDL* BDL* BDL* BDL* BDL*
29 **Permeability cm/sec 3.90 x 10⁻³ 4.64 x 10⁻⁴ 7.37x10⁻⁵ 2.17x10⁻⁶ 3.82 x 10⁻³ IS: 2720 (Part-16):2006
30
**Grain Size Analysis:
Gravel % 0 2 2 0 0
IS:2720 (Part-4):2006
Coarse Sand % 0 1 2 3 0
Medium Sand % 2 2 12 5 8
Fine Sand % 56 48 12 10 52
Silt + Clay % 42 47 72 82 40
BDL – Below Detectable Limit Detectable Limit of Instrument: Copper: 0.05 mg/kg Phenol: 0.1 mg/kg Iron: 0.01 mg/kg Phosphorus: 0.1 mg/kg
Nickel: 0.03 mg/kg

NOTIFIED AREA AUTHORITY, ANKLESHWAR ENVIRONMENT IMPACT ASSESSMENT REPORT
EIA Report prepared by M/s. Aqua-Air Environmental Engineers Pvt. Ltd. 3- 35
3.7.2. SUMMARY ON SOIL QUALITY
Parameters like Porosity, Water Holding Capacity, Bulk Density, etc. were considered.
Based on the soil analysis report, the following can be concluded:
The porosity of soils varied from 52.83% to 58.07% and can be considered as
moderate to good for air and water movement in the soil. The Water Holding
Capacity varied from 46.53% to 75.56%. Bulk Density varied from 1.11 to 1.25
g/cm3. The moisture content varied from 2.13% to 8.46%. pH varied from 7.09
to 7.95. Calcium varied from 120.2 to 511.0 mg/kg. Total Hardness varied from
390 to 1540 mg/kg. Magnesium varied from 1.35 to 64.35 mg/kg. Total
Phosphorus varied from 12 to 20.25 mg/kg. Organic Matter varied from 3.52
to 10 mg/kg. Nitrate-Nitrogen varied from 0.45 to 9.35 mg/kg. Total Iron varied
from 0.89 to 8.39 mg/kg.
3.8. GEOLOGICAL & HYDROLOGICAL DATA
3.8.1. METHOD OF PREPARATION
The geological classification map has been prepared by extracting the areas
under different geological classification from the 1:2 million scale maps
prepared by Geological Survey of India (GSI) for the Ankleshwar, District:
Bharuch of Gujarat. The map text has been modified in consultations with the
Department of Geology, University of Delhi. The project area, towns and village
locations have been added for ease of spatial reference. Locations of towns and
villages have been extracted from CoI maps, SoI topographical maps and
confirmed with satellite data.
3.8.2. DESCRIPTION OF GEOLOGICAL CLASSIFICATION AND AREA UNDER DIFFERENT
FORMATIONS
Table 3.17 provides the major geological features and area under different
formations.
3.8.3. GEOLOGICAL MAP
A map depicting the major geological features in the project area is presented
in Figure 3.6. The map also marks the area within 10 km with project site as a

NOTIFIED AREA AUTHORITY, ANKLESHWAR ENVIRONMENT IMPACT ASSESSMENT REPORT
EIA Report prepared by M/s. Aqua-Air Environmental Engineers Pvt. Ltd. 3- 36
center. Town and village locations are also depicted to facilitate ease of
reference.
TABLE – 3.17
Description of geological classification and area under different formations STRATIGRAPHY AREA
(SQ. KM.) AGE DESCRIPTION
Q = Undifferentiated fluvial/ Aeolian/ coastal sediments 212.73
Holocene in Quaternary period (1 million year to recent)
Some gypsum deposits are found in these Quarternary sediments. High potential for yielding significant quantities of ground water.
N1k = Khari Formation 67.83
Miocene (23.8 to 5.3 million years)
Comprises variegated siltstones, and grey gypseous marls deposited in a quiet epi-neritic basin. The upper part of this formation has yielded a rich assemblage of Miocene fossils. It unconformably overlies the Bermoti Formation. Poor potential for ground water.
Pg3b = Bermoti Formation 12.18
Oligocene (33.7 to 23.8 million years)
Comprises greenish grey marl, and argillaceous limestone succession with a basal bed of bouldery clayey marl. This bouldery bed characterizes the unconformity with the lower Berwali Formation. Poor potential for ground water.
Pg2b = Berwali Formation 21.21
Eocene (54.8 to 33.7 million years)
Comprises gypseous and ochreous clays, lignite, oolitic sandstone and marl. Contains fossils of Foraminifera and Molluscs in the lower part, overlain by dense fossiliferous fragmental limestone. Potential for ground water reserves may vary from poor to good, depending on the rock type encountered.
(Courtesy: Environmental Information Centre, New Delhi)

NOTIFIED AREA AUTHORITY, ANKLESHWAR ENVIRONMENT IMPACT ASSESSMENT REPORT
EIA Report prepared by M/s. Aqua-Air Environmental Engineers Pvt. Ltd. 3- 37
FIGURE – 3.6
Major Geological Features

NOTIFIED AREA AUTHORITY, ANKLESHWAR ENVIRONMENT IMPACT ASSESSMENT REPORT
EIA Report prepared by M/s. Aqua-Air Environmental Engineers Pvt. Ltd. 3- 38
3.8.4. Hydrology
The geology of the district with vast area affected by inherent/coastal salinity,
presents a complex hydrogeological pattern. Hydrogeological map is shown. The
hard rocks, the semi-consolidated Cretaceous, and Tertiary formations and
unconsolidated alluvial deposits, all comprise multi – aquifer systems thereby
presenting unconfined as well as confined groundwater conditions in the entire
district. Tertiary formations, are inherently saline and contain poor quality of
groundwater. Groundwater occurs under unconfined conditions in the
limestone and sandstone aquifers of Bagh beds. Occurrence and movement of
groundwater is restricted mainly to the fractures and joints in the limestone and
sandstones. The discharge in dug wells varies from 30 to 50 m3 /day. The bagh
beds, where overlain by Deccan Trap are likely to yield groundwater under
confined conditions. The Deccan Trap have given rise to multi-layered stratified
aquifers. Each individual flow comprises two distinct units, namely the upper
vesicular basalt and the lower massive basalt. The massive basalt is hard and
compact with primary porosity but the vesicular basalts exhibit porosity. The
movement of groundwater is therefore controlled by the secondary porosity
developed by the presence of fractures and joints. The pale weathering which is
invariably observed at depth near the top of every flow, has given rise to good
aquifers at depth. The yield of the dug wells in Deccan traps, which range in
depth from 5 to 25m bgl, sustain pumping from 1/2 hour to 10 hour with
discharge varying from 200 to 1200 litre per minute (LPM) for drawdown of 4 to
7 m. Bore well tapping deeper zones down to 150m below ground level (bgl),
have yielded 100 to 600 LPM for a drawdown of 6 to 15m. The sandstone are
the main aquifers in the Tertiary formations but the limestone also yield
significant quantities of groundwater wherever karstic development have taken
place. Deep tube well tapping the Tertiary formations is capable of yielding 300
to 3000 LPM of water for meager drawdown of 1 to 7m. The alluvium formations
in the western most part of the area do not constitute potential aquifers on
account of inferior quality of water.

NOTIFIED AREA AUTHORITY, ANKLESHWAR ENVIRONMENT IMPACT ASSESSMENT REPORT
EIA Report prepared by M/s. Aqua-Air Environmental Engineers Pvt. Ltd. 3- 39
FIGURE – 3.7
HYDROGEOLOGICAL MAP

NOTIFIED AREA AUTHORITY, ANKLESHWAR ENVIRONMENT IMPACT ASSESSMENT REPORT
EIA Report prepared by M/s. Aqua-Air Environmental Engineers Pvt. Ltd. 3- 40
3.8.5. DRAINAGE PATTERN
FIGURE – 3.8
Drainage Pattern

NOTIFIED AREA AUTHORITY, ANKLESHWAR ENVIRONMENT IMPACT ASSESSMENT REPORT
EIA Report prepared by M/s. Aqua-Air Environmental Engineers Pvt. Ltd. 3- 41
3.9. LAND USE PATTERN
Land use, in general, reflects the human beings activities on land, whereas the word
land cover indicates the vegetation, agricultural and artificial manmade structures
covering the land surfaces. Identification and periodic surveillance of land uses and
vegetation covers, in the vicinity of any developmental activity is one of the most
important components for an environmental impact assessment, which would help
determine the impact of the project development activity on the land use pattern.
3.9.1. METHOD OF DATA PREPARATION
The land use / land cover has been presented in the form of a map prepared
by using IRS P6 LISS-III and procured from the National Remote Sensing Agency
(NRSA), Hyderabad. The satellite data has been processed using ERDAS
Imagine software supported with ground checks and ground truth verification.
Area and distance calculations have been carried out using GIS software after
geo-referencing the interpreted data with the help of Survey of India (SoI)
topographical maps of the scale 1:50,000.
A map depicting major land use/ land cover classes comprising lands under
agriculture, fallow land, open/degraded vegetation; lands falling under water
bodies, scrub and lands under inhabitations is presented at Figure 3.10.
The map also marks the area within 10 km of the project site as the area of
interest. Land use and Land Cover with Towns and Village Locations
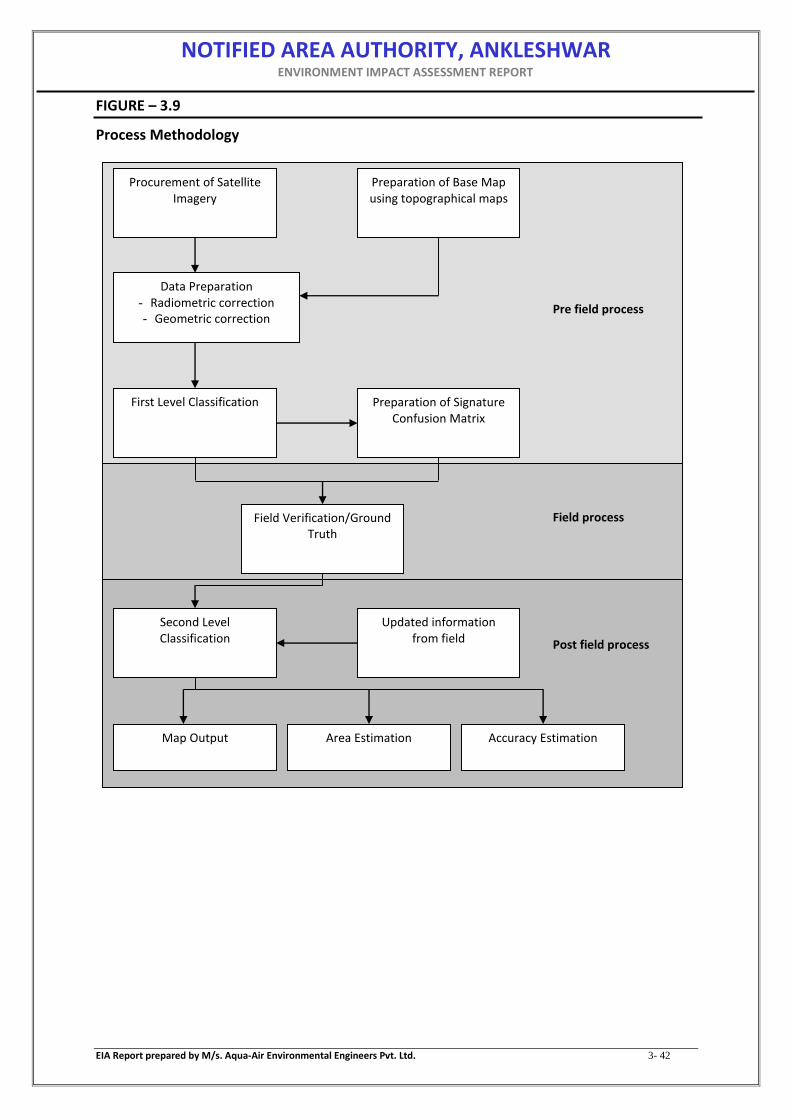
NOTIFIED AREA AUTHORITY, ANKLESHWAR ENVIRONMENT IMPACT ASSESSMENT REPORT
EIA Report prepared by M/s. Aqua-Air Environmental Engineers Pvt. Ltd. 3- 42
FIGURE – 3.9
Process Methodology
Procurement of Satellite Imagery
Preparation of Base Map using topographical maps
Data Preparation - Radiometric correction - Geometric correction
Preparation of Signature Confusion Matrix
First Level Classification
Field Verification/Ground Truth
Updated information from field
Second Level Classification
Accuracy Estimation Area Estimation Map Output
Pre field process
Field process
Post field process
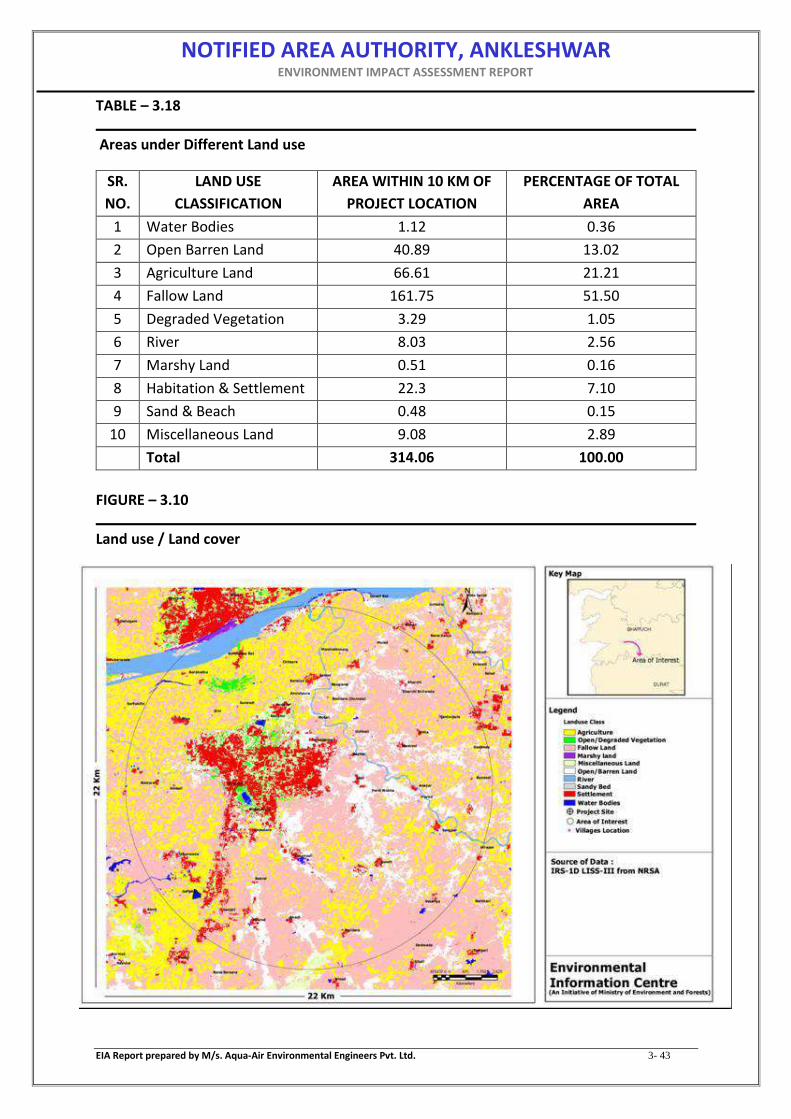
NOTIFIED AREA AUTHORITY, ANKLESHWAR ENVIRONMENT IMPACT ASSESSMENT REPORT
EIA Report prepared by M/s. Aqua-Air Environmental Engineers Pvt. Ltd. 3- 43
TABLE – 3.18
Areas under Different Land use
FIGURE – 3.10
Land use / Land cover
SR.
NO.
LAND USE
CLASSIFICATION
AREA WITHIN 10 KM OF
PROJECT LOCATION
PERCENTAGE OF TOTAL
AREA
1 Water Bodies 1.12 0.36
2 Open Barren Land 40.89 13.02
3 Agriculture Land 66.61 21.21
4 Fallow Land 161.75 51.50
5 Degraded Vegetation 3.29 1.05
6 River 8.03 2.56
7 Marshy Land 0.51 0.16
8 Habitation & Settlement 22.3 7.10
9 Sand & Beach 0.48 0.15
10 Miscellaneous Land 9.08 2.89
Total 314.06 100.00
NOTIFIED AREA AUTHORITY, ANKLESHWAR ENVIRONMENT IMPACT ASSESSMENT REPORT
EIA Report prepared by M/s. Aqua-Air Environmental Engineers Pvt. Ltd. 3- 44
3.10. ECOLOGICAL INFORMATION
3.10.1. Introduction
Bharuch (formerly commonly known as Broach) in India, is a district in the
southern part of the Gujarat peninsula on the west coast of state of Gujarat
with a size and population comparable to that of Greater Boston. The Narmada
River outlets into the Gulf of Khambhat through its lands located in the central
and northern parts of the sub-continent of India. The geographical location of
the district is 21.30° to 22.00° N Latitude and 72.45° to 73.15° E Longitude. The
district has eight Talukas, Bharuch (District Headquarter), Ankleshwar, Valia,
Jhagadia, Vagra, Aamos, Hansot and Jambusar. The total area of the district is
5,253 sq km, as per the census of 2001; the population is 1.3 million, with 261
persons per sq. km. The district is situated at the mouth of River Narmada. The
major rivers flowing through the district are: Narmadha, Dhadhar, Kim and
Kaveri.
3.10.2. Climate
The weather of Bharuch district is hot and dry-starting from mid-march till mid-
June, mid-during summer season weather remains hot and dry. While from
mid-June till end of September weather remains humid and can be considered
pleasant. From October-November weather is bit hot. From December to
February climate remains cool.
3.10.3. Rainfall
The average rainfall of the district is 800 mm.
3.10.4. Biogeography
According to Rodgers and Panwar (1988), Gujarat has parts of four
biogeographic zones:
Zone 3. The Indian Desert Province 3A – Kutch Zone 4. The Semi-arid Zone: Province 4B - Gujarat – Rajputana Zone 5. The Western Ghats: Province 5A - Malabar Coast Province 5B -
Western Ghat Mountains Zone 10. The Coast of India: Province 10A - West Coast

NOTIFIED AREA AUTHORITY, ANKLESHWAR ENVIRONMENT IMPACT ASSESSMENT REPORT
EIA Report prepared by M/s. Aqua-Air Environmental Engineers Pvt. Ltd. 3- 45
The project area falls at Zone 4: The Semi-arid zone, Province 4B – Gujarat-
Rajputana.
3.10.5. PHYSIOGRAPHY
The region provides a combination of most of the geo-environmental features
for the development of favorable ecosystems. The alluvial sediments and
reasonable water resources have provided impetus towards developing
human induced ecosystems of agricultural cropping agro-forestry and
horticulture. The elevation range of the region is about 20 m showing a very
gentle flat gradient of 1:800 to 1:1000. The region shows more or less a flat
topography with a series of sections cut by deeply incised channels of rivers
flowing across the region. The riverbanks are generally marked by levee
deposits, creating a ridge type banks with higher elevations than the general
ground level. The flat topography is dotted by low height sandy mounds of
stabilized dunes. Formation of ravine landscape is quite common on most of
the riverbanks due to deep gully erosion. The rivers are prone to heavy floods
and land erosion.
3.10.6. FOREST
Bharuch area is characterized by tropical dry deciduous forests. The total forest
area of district is 1449.68 sq.m. That accounts for 0.73 % of the total
geographical area of the district. (Courtesy: Environmental Information
Centre, New Delhi)
3.10.7. FLORA
Some of the flora found in Bharuch area is listed below:
TABLE – 3.19
List of Flora Sr. No.
Scientific Name
Common Name Family
I Trees
1 Acacia aurriculifarmis Bangali Babool Mimoceae
2 A. leucopholia Aniar Mimoceae
3 A. catechu Khair Mimoceae
4 A. ferrungula Pandhara Khair Mimoceae

NOTIFIED AREA AUTHORITY, ANKLESHWAR ENVIRONMENT IMPACT ASSESSMENT REPORT
EIA Report prepared by M/s. Aqua-Air Environmental Engineers Pvt. Ltd. 3- 46
5 A. nilotica Babul Leguminoceae
6 A. lebbeck Siris Leguminoceae
7 A. procera Siris Leguminoceae
8 A. polycantha Garad Mimoceae
9 Adina cordifolia Hed Rubiaceae
10 Aegle marmelos Bela Rutaceae
11 Ailanthus excelsa Maharukh Simaroubaceae
12 Alangium salvifolium Ankol Alangiaceas
13 Albizia odoratissimus Siris Leguminoceae
14 Annogeissus latifolia Dhavda Combritaceae
15 Annona squamosa Sitafal Annonaceae
16 Azardirachta indica Nim Moraceae
17 Bahuania purpurea Kachamar Leguminosae
18 Bombax ceiba Semal Verbenaceae
19 Bridelia retusa Asta (Kathmohli) Leguminosae
20 B. squamosa Asan Leguminoceae
21 Buchanania lanzan Charoli Anacardiaceas
22 Butea monospesma Palas Leguminoceae
23 Callistemon lancealatus Bottlebrush Mytraceas
24 Casuarina equisetifoier Sura Casuarineae
25 Careya arborea Kumbh Mytraceae
26 Casearia elliptica Manjo Symydaceae
27 Caesearia graveoiens Dedak manio Samidacea
28 Cassia fistula Sunari Leguminoceae
29 Cestrum noctusnum Ralkirani Solana ceae
30 Cochiospermum religiosun Ganeri Cochlospermaceds
31 Cocas nicifera Nariyal Palmeae
32 Cordia dichotoma Gundi Boranginacea
33 Dalbergia paniculata Dhobin Leguminoceae
34 D. latifolia Sisso Leguminoceae
35 Murraya koenigii Karlilimb Rata ceae
36 Ixora parviflora Kara Rubiaceae
37 I. nigricans Kukeri Rubiaceae
38 Delonix elala Gulmohar Leguminoceae
39 Diosphyros melanoxylon Tendu Ebenaceae
40 Dolichandrone falcate Mallar sing Bignoniaceae
41 Elaeodendron roxburghii Alinar Ceiastracea
42 Eucalyptus globules Safeda Eucalyptaceae
43 Emblica officinalis Aonla Euphobiaceae
44 Erithina uliginosa Pungara Leguminoceae
45 Eramphis uliginosa Almi Rubiaceas
46 Ficus. Religiosa Pipal Moraceae
47 F. rumphii Pilari Moraceae
48 F. benghalensis Bara Moraceae
49 Flacourtia indica Rankdi Bixaceae

NOTIFIED AREA AUTHORITY, ANKLESHWAR ENVIRONMENT IMPACT ASSESSMENT REPORT
EIA Report prepared by M/s. Aqua-Air Environmental Engineers Pvt. Ltd. 3- 47
50 Garua pinnata Kakad Burseraceae
51 Griwia teliaefolia Dhaman Tiliaceae
52 Haidwickia bipinnata Aniar Caesalpiniacea
53 Holoptelia intigrifolia Valva Uticaceae
54 Kydia calycina Bhindi Malvaceae
55 Lagerstroemia lanceolata Nano Leguminoceae
56 L. parviflora Sidha Leguminoceae
57 Michellia champaca Champa Bignoneaceae
58 Lannea caromadalica Modad Anacardiaceae
59 Madhuca indica Mahua Sapotaceae
60 Mangifera indica Amm Anacardiaceae
61 Miliusa tomentosa Gulambh Annonacea
62 Milligntonia hortensis Indian Coral Tree Bignoniaceae
63 Mitragyna parvifolia Kalam Rubiaceae
64 Michelia Champaca Champa Magnoliaceae
65 Moringa oliefera Shevga Moringaceae
66 Musa paradisiacea Kela Musaceae
67 Oroxyium indicum Tetu Bignoniaceae
68 Phoenix sylvestris Shindi Palminae
69 Prosopis juliflora Babul Mimoceae
70 P. cinerarea Babul Mimoceae
71 Pithecelobium ducle Chisbalai Leguminoceae
72 Pongamia pinnata Karanja Leguminoceae
73 Pisidium guajava Guava Mutraceae
74 Pterocarpus marsupium Bija Leguminoceae
75 Punica grantalum Anar Pomegrannatae
76 Sapindus emerginatus Aritha Sapindaceae
77 Soymida febrifuga Rohan Meliaceae
78 Poleathia langifolia Ashok Apoctnaceae
79 Saraca indica Ashok Apoctnaceae
80 Thevetia neirifolia Pilakanton Apoctnaceae
81 Sterculia urens Kodaya Sterculiaceae
82 Syzygium cuminii Jamun Myrtaceae
83 Terminalia crenulata Sadad Leguminoceae
84 T. bellirica Behada Combretaceae
85 T. arjuna Arjun Combretaceae
86 T. caltapa Jangli badam Combretaceae
87 Tamarindus indica Tentuli Leguminoceae
88 Tecoma stans Nellow bell Bisgnonia ceae
89 Tectona grandis Sag Verbanaceae
90 Trema orientalis Gol Ulmaceae
91 Wrightia tinctoria Kudo Apocynacea
92 Zizyphus xylocarpus Ghatbor Rhamnaceae
93 Z. mauritiana Bordi Rhamnaceae
Shrubs

NOTIFIED AREA AUTHORITY, ANKLESHWAR ENVIRONMENT IMPACT ASSESSMENT REPORT
EIA Report prepared by M/s. Aqua-Air Environmental Engineers Pvt. Ltd. 3- 48
1 ARGEMONE MEXICANA Darudi Papaveraceae
2 CARANTHUS RESUS Sudufuli Apocyanaceae
3 C. CALATROPIS Mundar Asclepiadaceae
4 CALATOPIS GIGANTEAN Rui Asclepiadaceae
5 CARRISSA CARANDAS Karvand Apocyaninnae
6 CLERODENDRUM MULTYFOLIUM
Multaiforum Verbenaeae
7 GYMNOSPORIA SPINOSA Spinosa Rekii Leguminoceae
8 LANTANA CAMERA Ghaneri Verbanaceae
9 OPUNTIA DILLENII Nivdang Cactacealea
10 EUPHORBIA NERIFOLIA Wavding Celastraceae
11 OCIUM GRATISSIUM Rantulro Labiateae
12 HELICTERIES ISORA Atai Sterculiaceae
13 FICUS HISPIDA Tet umaro Moraceae
14 DATURA FASTUASA Dhotara Solanaceae
15 VITEX NEGUNDO Nirgudi Verbaceae
16 CASSIA TORA Tarota Leguminoceae
17 ZIZYPHUS NUMMULARIA Beri Rhannaceae
18 EUPHORBIA TIRUCOLLI Thor Euphorbiaceae
Bamboos
1 DENDROCALAMUS STRICTUS Manvel Grammineae
2 ABRUS PRECATORIUS Gunj Leguminoceae
3 CAPPARIS SEPIRARIA Lamtjar Cappariaceae
4 COCCULUS HIRRUTUS Asanwel Menispermaceae
5 COMBRETUM OVALIFOLIUM Jal Combratae
6 CAYRATIA CARNOSA Khatumbo Vitaceae
Grasses
1 ANDROPOGON PUMILUS Kusal Gramineae
2 CENCHRUS SETGERUS Dhramnu Gramineae
3 CYNODON DACTYLON Durva Gramineae
4 CYMBOPOGEN MARINIL Rosha Gramineae
5 HETEROPOGON CONTORTUS Gawat Gramineae
6 SORGHUM HALEPENSE Baru Gramineae
7 THEMEDA TRIANDRA Bhathdu Gramineae
Crops
1 RICINUS COMMUNIS Arand Euphorbiaceae
2 SACCHARUM OFFICINARUM Ganna Gramineae
3 SORGHUM VULGAE Jowar Gramineae
4 ZEA MAYS Makea Gramineae
5 ARACHIS HYPOGAEA Ground nut Logumin
6 ORYZA SATIVA Chawar Gramineae
Macrophytes
1 EICHHORNIA CRASSIPES Jalkumbhi Pontederiace
2 IPOMEA AQUALICA Kalmisay Volvulaceae
3 TRAPA LATIFOLIA Water chestnual Volvulaceae
4 NELUMBO NUCIFERA Lotus Nymphaceae
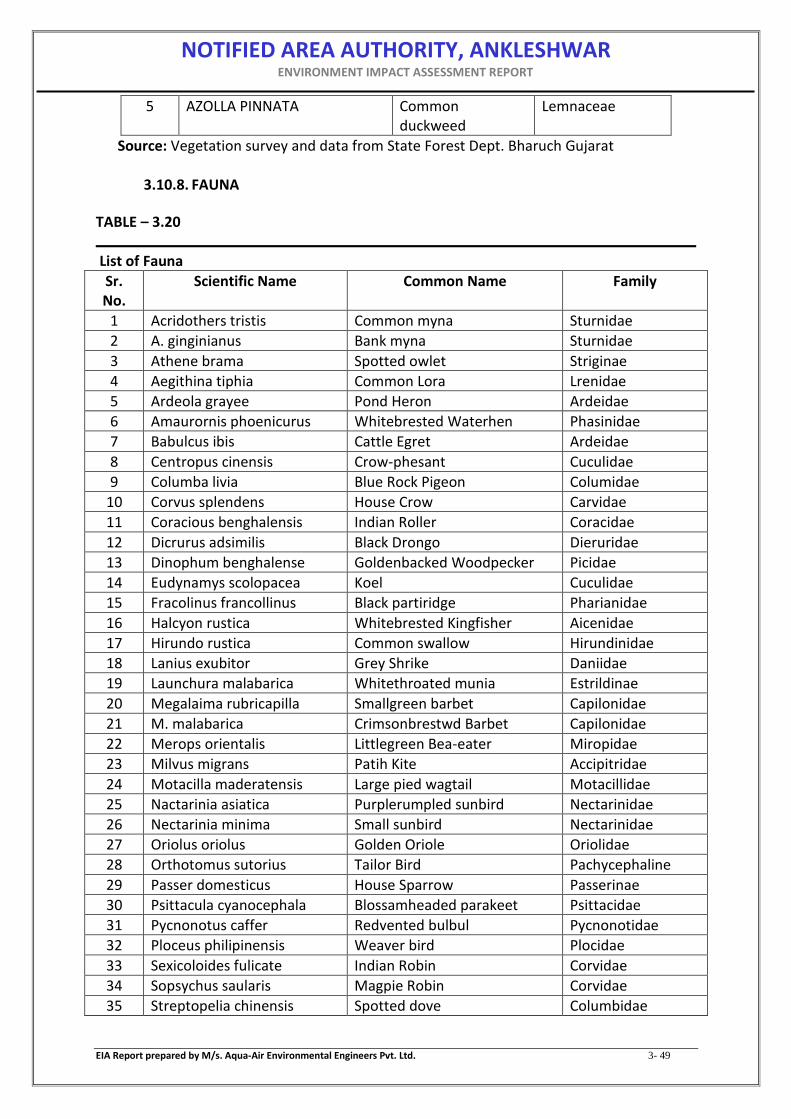
NOTIFIED AREA AUTHORITY, ANKLESHWAR ENVIRONMENT IMPACT ASSESSMENT REPORT
EIA Report prepared by M/s. Aqua-Air Environmental Engineers Pvt. Ltd. 3- 49
5 AZOLLA PINNATA Common duckweed
Lemnaceae
Source: Vegetation survey and data from State Forest Dept. Bharuch Gujarat
3.10.8. FAUNA
TABLE – 3.20
List of Fauna
Sr. No.
Scientific Name Common Name Family
1 Acridothers tristis Common myna Sturnidae
2 A. ginginianus Bank myna Sturnidae
3 Athene brama Spotted owlet Striginae
4 Aegithina tiphia Common Lora Lrenidae
5 Ardeola grayee Pond Heron Ardeidae
6 Amaurornis phoenicurus Whitebrested Waterhen Phasinidae
7 Babulcus ibis Cattle Egret Ardeidae
8 Centropus cinensis Crow-phesant Cuculidae
9 Columba livia Blue Rock Pigeon Columidae
10 Corvus splendens House Crow Carvidae
11 Coracious benghalensis Indian Roller Coracidae
12 Dicrurus adsimilis Black Drongo Dieruridae
13 Dinophum benghalense Goldenbacked Woodpecker Picidae
14 Eudynamys scolopacea Koel Cuculidae
15 Fracolinus francollinus Black partiridge Pharianidae
16 Halcyon rustica Whitebrested Kingfisher Aicenidae
17 Hirundo rustica Common swallow Hirundinidae
18 Lanius exubitor Grey Shrike Daniidae
19 Launchura malabarica Whitethroated munia Estrildinae
20 Megalaima rubricapilla Smallgreen barbet Capilonidae
21 M. malabarica Crimsonbrestwd Barbet Capilonidae
22 Merops orientalis Littlegreen Bea-eater Miropidae
23 Milvus migrans Patih Kite Accipitridae
24 Motacilla maderatensis Large pied wagtail Motacillidae
25 Nactarinia asiatica Purplerumpled sunbird Nectarinidae
26 Nectarinia minima Small sunbird Nectarinidae
27 Oriolus oriolus Golden Oriole Oriolidae
28 Orthotomus sutorius Tailor Bird Pachycephaline
29 Passer domesticus House Sparrow Passerinae
30 Psittacula cyanocephala Blossamheaded parakeet Psittacidae
31 Pycnonotus caffer Redvented bulbul Pycnonotidae
32 Ploceus philipinensis Weaver bird Plocidae
33 Sexicoloides fulicate Indian Robin Corvidae
34 Sopsychus saularis Magpie Robin Corvidae
35 Streptopelia chinensis Spotted dove Columbidae
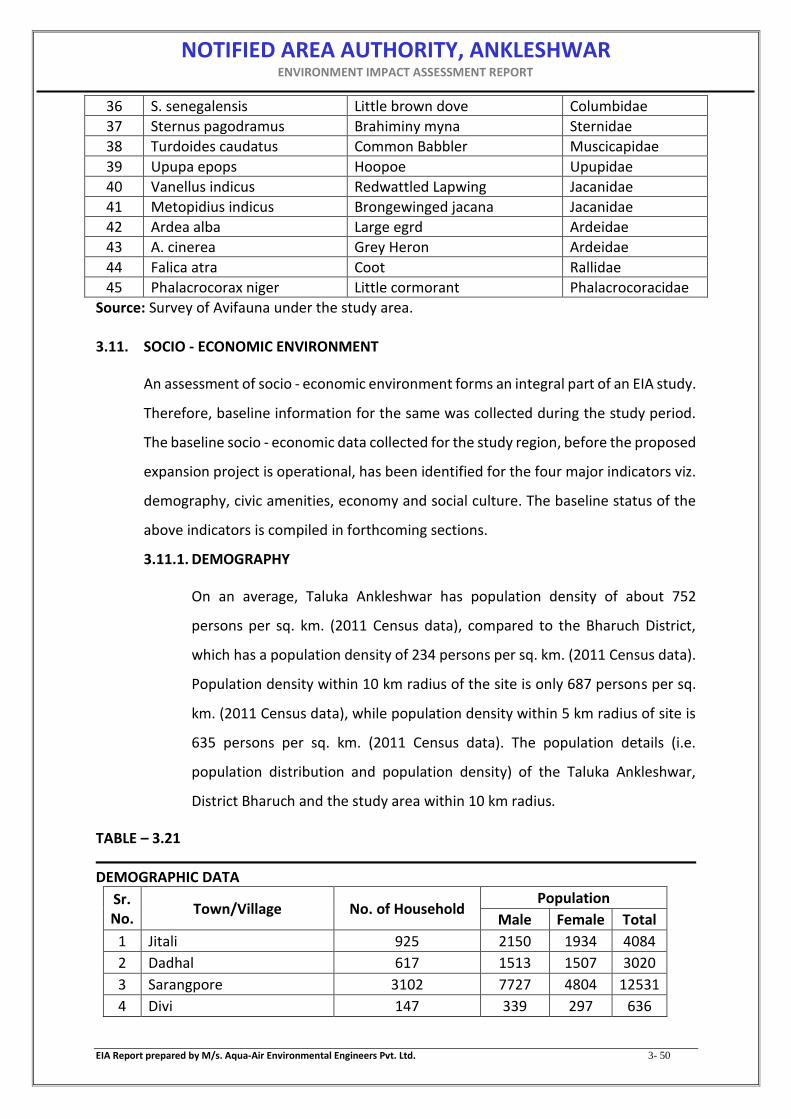
NOTIFIED AREA AUTHORITY, ANKLESHWAR ENVIRONMENT IMPACT ASSESSMENT REPORT
EIA Report prepared by M/s. Aqua-Air Environmental Engineers Pvt. Ltd. 3- 50
36 S. senegalensis Little brown dove Columbidae
37 Sternus pagodramus Brahiminy myna Sternidae
38 Turdoides caudatus Common Babbler Muscicapidae
39 Upupa epops Hoopoe Upupidae
40 Vanellus indicus Redwattled Lapwing Jacanidae
41 Metopidius indicus Brongewinged jacana Jacanidae
42 Ardea alba Large egrd Ardeidae
43 A. cinerea Grey Heron Ardeidae
44 Falica atra Coot Rallidae
45 Phalacrocorax niger Little cormorant Phalacrocoracidae
Source: Survey of Avifauna under the study area. 3.11. SOCIO - ECONOMIC ENVIRONMENT
An assessment of socio - economic environment forms an integral part of an EIA study.
Therefore, baseline information for the same was collected during the study period.
The baseline socio - economic data collected for the study region, before the proposed
expansion project is operational, has been identified for the four major indicators viz.
demography, civic amenities, economy and social culture. The baseline status of the
above indicators is compiled in forthcoming sections.
3.11.1. DEMOGRAPHY
On an average, Taluka Ankleshwar has population density of about 752
persons per sq. km. (2011 Census data), compared to the Bharuch District,
which has a population density of 234 persons per sq. km. (2011 Census data).
Population density within 10 km radius of the site is only 687 persons per sq.
km. (2011 Census data), while population density within 5 km radius of site is
635 persons per sq. km. (2011 Census data). The population details (i.e.
population distribution and population density) of the Taluka Ankleshwar,
District Bharuch and the study area within 10 km radius.
TABLE – 3.21
DEMOGRAPHIC DATA
Sr. No.
Town/Village No. of Household Population
Male Female Total
1 Jitali 925 2150 1934 4084
2 Dadhal 617 1513 1507 3020
3 Sarangpore 3102 7727 4804 12531
4 Divi 147 339 297 636

NOTIFIED AREA AUTHORITY, ANKLESHWAR ENVIRONMENT IMPACT ASSESSMENT REPORT
EIA Report prepared by M/s. Aqua-Air Environmental Engineers Pvt. Ltd. 3- 51
5 Surwadi 545 1132 1040 2172
6 Gadkhol(Part) 235 536 542 1078
7 Piraman (Part) 428 990 923 1913
8 Bhadkodara 2024 5050 3570 8620
9 Kapodara 560 1374 1259 2633
10 Kosamadi 1138 2720 2585 5305
11 Uchhali 160 417 372 789
12 Motali 143 359 324 683
13 Amrutpura 153 443 419 862
14 Samor 232 578 527 1105
15 Bakrol 368 842 662 1504
16 Avadar 251 634 595 1229
17 Kararvel 290 665 621 1286
18 Pardi Mokha 97 250 279 529
19 Piprod 94 243 236 479
20 Chhapra 318 794 726 1520
21 Kansiya 541 1388 1275 2663
22 Naugama 144 371 352 723
23 Kondh 831 2231 2002 4233
24 Untia 133 327 314 641
25 Andada *(CT) 3275 7314 6192 13506
26 Diva 1248 3024 2975 5999
27 Borbhatha 295 703 692 1395
28 Boidara 405 903 884 1787
29 Amboli 223 550 527 1077
30 Umarwada 688 1680 1653 3333
31 Sangpor 530 1252 1184 2436
32 Borbhatha Bet 910 2284 2079 4363
33 Mandvabuzarg 1145 2900 2875 5775
34 Sanjali 1218 3327 1512 4839
35 Kharod 743 2413 1876 4289
36 Bhadi 406 1176 1146 2322
37 Vatariya 544 1400 1105 2505
38 Sardarpura 109 248 248 496
39 Mulad 203 495 533 1028
40 Kharchi Bhilwada 198 519 487 1006
41 Boridara (Dumala) 184 461 423 884
42 Kharchi 217 553 520 1073
43 Dadheda 175 487 450 937
44 Boridara 285 625 610 1234
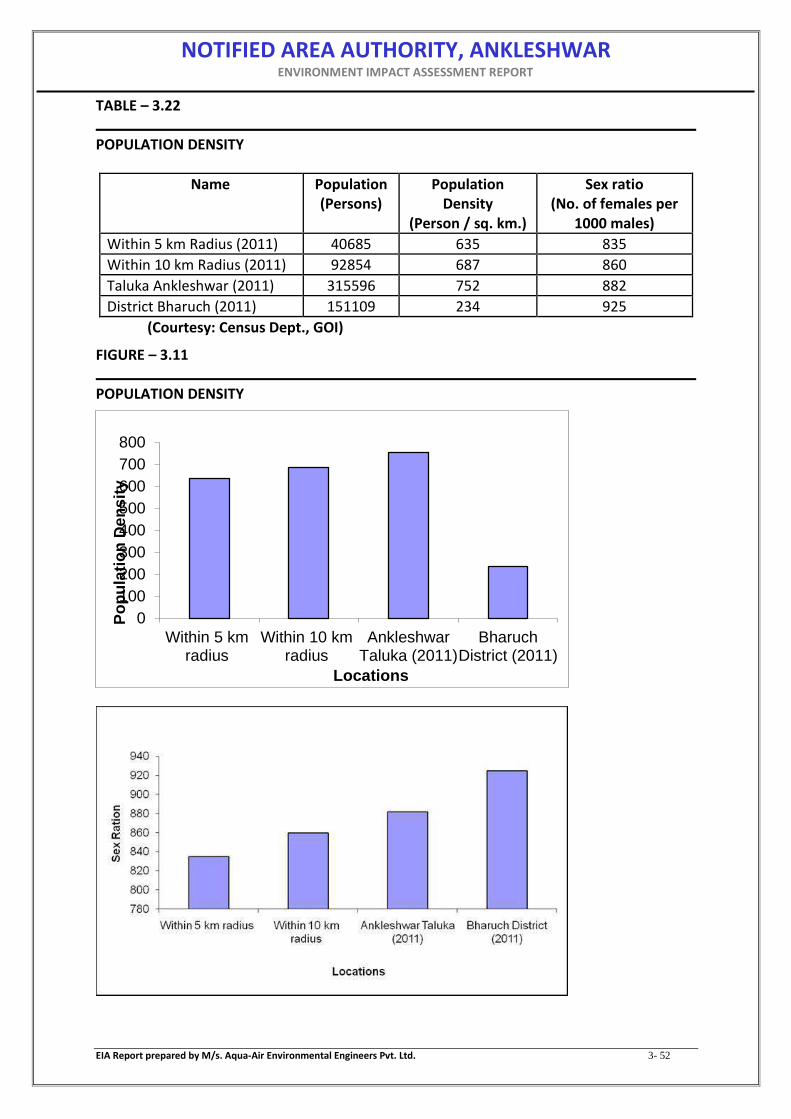
NOTIFIED AREA AUTHORITY, ANKLESHWAR ENVIRONMENT IMPACT ASSESSMENT REPORT
EIA Report prepared by M/s. Aqua-Air Environmental Engineers Pvt. Ltd. 3- 52
TABLE – 3.22
POPULATION DENSITY
(Courtesy: Census Dept., GOI)
FIGURE – 3.11
POPULATION DENSITY
0
100
200
300
400
500
600
700
800
Within 5 kmradius
Within 10 kmradius
AnkleshwarTaluka (2011)
BharuchDistrict (2011)
Po
pu
lati
on
Den
sit
y
Locations
Name Population (Persons)
Population Density
(Person / sq. km.)
Sex ratio (No. of females per
1000 males)
Within 5 km Radius (2011) 40685 635 835
Within 10 km Radius (2011) 92854 687 860
Taluka Ankleshwar (2011) 315596 752 882
District Bharuch (2011) 151109 234 925

NOTIFIED AREA AUTHORITY, ANKLESHWAR ENVIRONMENT IMPACT ASSESSMENT REPORT
EIA Report prepared by M/s. Aqua-Air Environmental Engineers Pvt. Ltd. 3- 53
3.11.2. Literacy Rate
The literacy rate is a major factor, which influences the socio-cultural condition
of a particular place. Details of literacy rate in District Bharuch, Taluka
Ankleshwar and within 10 km radius and 5 km radius of project site are given
in Table 3.14 while their graphical representation is shown in Figure 3.5.
Literacy rate in District Bharuch, as per 2011 Census data is 76.28%, with
85.47% among male and 68.94% among female. Literacy rate in Taluka
Ankleshwar as per 2011 Census data is 81.56 % with 88.28 % among males and
73.54 % among females.
Within 10 km radius of the study area, the literacy rate is observed 71.65 %
having 80.25 % among males and 62.54 % among females, whereas literacy
rate within 5 km radius of study area is 74.84 % having 82.50 % among males
and 63.65 % among females.
TABLE – 3.23
Literacy rate
NAME MALE LITERACY (%) FEMALE LITERACY (%) TOTAL LITERACY (%)
Within 5 km Radius (2011) 82.50 63.65 74.84
Within 10 km Radius (2011) 80.25 62.54 71.65
Ankleshwar Taluka (2101) 88.28 73.54 81.56
Bharuch District (2011) 85.47 68.94 76.28
(Courtesy: Census Dept., GOI)

NOTIFIED AREA AUTHORITY, ANKLESHWAR ENVIRONMENT IMPACT ASSESSMENT REPORT
EIA Report prepared by M/s. Aqua-Air Environmental Engineers Pvt. Ltd. 3- 54
0
10
20
30
40
50
60
70
80
90
100
Within 5 km radius Within 10 km radius Ankleshwar Taluka
(2011)
Bharuch District
(2011)
Lit
erc
y r
ate
(%
)
Locations
TotalLiteracy(%)
MaleLiteracy
FemaleLiteracy
FIGURE – 3.12
LITERACY DATA
3.11.3. Occupational Structure
In economic development of the region its geographical location, natural
resources, business and employment, industries and manpower play vital role.
Table 3.24 provides the occupational patterns in all villages falling within the
area of interest.

NOTIFIED AREA AUTHORITY, ANKLESHWAR ENVIRONMENT IMPACT ASSESSMENT REPORT
EIA Report prepared by M/s. Aqua-Air Environmental Engineers Pvt. Ltd. 3- 55
TABLE – 3.24
Occupational Structure
OCCUPATIONAL PATTERN IN VILLAGES FALLING UNDER AREA OF INTEREST
Sr. No.
Name of Village Occupational Pattern
Total Workers
Main Worker
Cultivator Agriculture Household Industries
Other Services
Marginal Workers
Non Workers
1 Jitali 1444 1402 73 524 4 801 42 2420
2 Dadhal 1033 802 64 230 10 498 231 1987
3 Sarangpore 5450 5269 59 28 117 5065 181 7081
4 Divi 359 313 32 173 0 108 46 277
5 Surwadi 916 903 70 392 0 441 13 1256
6 Gadkhol(Part) 316 292 37 23 0 232 24 762
7 Piraman (Part) 722 706 45 332 11 318 16 1191
8 Bhadkodara 3393 3273 72 168 10 3023 120 5227
9 Kapodara 1040 896 26 185 13 672 144 1593
10 Kosamadi 1872 1608 117 449 11 1031 264 3433
11 Uchhali 288 288 35 148 0 105 0 501
12 Motali 325 273 34 22 0 217 52 358
13 Amrutpura 352 125 74 1 0 50 227 510
14 Samor 420 236 46 77 0 113 184 685
15 Bakrol 855 639 76 112 0 451 216 649
16 Avadar 424 407 75 171 0 161 17 805
17 Kararvel 377 354 43 136 1 174 23 909
18 Pardi Mokha 174 173 28 87 5 53 1 355
19 Piprod 205 200 22 108 1 69 5 274
20 Chhapra 711 636 32 254 2 348 75 809
21 Kansiya 1375 843 314 372 5 152 532 1288

NOTIFIED AREA AUTHORITY, ANKLESHWAR ENVIRONMENT IMPACT ASSESSMENT REPORT
EIA Report prepared by M/s. Aqua-Air Environmental Engineers Pvt. Ltd. 3- 56
22 Naugama 409 234 43 137 0 54 175 314
23 Kondh 1332 1218 104 415 21 678 114 2901
24 Untia 423 307 102 97 3 105 116 218
25 Andada*(CT) 4474 4291 108 358 54 3771 183 9032
26 Diva 2462 2152 500 826 46 780 310 3537
27 Borbhatha 806 573 43 457 1 72 233 589
28 Boidara 734 655 72 283 4 296 79 1053
29 Amboli 555 408 82 137 0 189 147 522
30 Umarwada 1264 946 140 303 23 480 318 2069
31 Sangpor 1066 959 86 694 4 175 107 1370
32 Borbhatha Bet 1507 1441 270 573 11 587 66 2856
33 Mandvabuzarg 2456 1525 466 612 43 404 931 3319
34 Sanjali 2904 2754 28 159 5 2562 150 1935
35 Kharod 1455 1232 119 351 6 756 223 2834
36 Bhadi 1048 987 110 663 0 214 61 1274
37 Vatariya 1026 655 90 19 3 543 371 1479
38 Sardarpura 253 192 32 65 0 95 61 243
39 Mulad 617 425 115 245 7 58 192 411
40 Kharchi Bhilwada 338 333 45 186 1 101 5 668
41 Boridara (Dumala) 413 410 179 153 1 77 3 471
42 Kharchi 424 256 61 69 0 126 168 649
43 Dadheda 329 309 58 149 5 97 20 608
44 Boridara 652 642 124 387 0 131 10 451

NOTIFIED AREA AUTHORITY, ANKLESHWAR ENVIRONMENT IMPACT ASSESSMENT REPORT
EIA Report prepared by M/s. Aqua-Air Environmental Engineers Pvt. Ltd. 3- 57
3.11.4. AMENITIES
Infrastructure resource base of the surveyed villages with reference to
education, medical, water resources, post and telegraph, communication,
power supply is presented in Table. There are 45 villages within study area of
10 km radius of plant site. Significant observations with respect to availability
of amenities in study area are as follows.
Education facilities in study area are quite good because all villages have
primary schools, 7 villages have both primary and secondary education schools
while one village caters to the need of junior college education, 4 villages
provide facilities for adult literacy class, 17 villages have Other Educational
Institute and one village has Training center.
Almost all villages in the impact zone have community health center/workers,
13 villages have primary health sub center, 7 villages have registered private
practitioners while 5 villages have family planning center and 2 villages have
public health center. One village has child welfare center and 3 villages have
dispensary with qualified Doctor.
In the study area drinking water facility is good as tube well, tank and tap water
is available almost in all the villages.
31 villages have post office facility and out of these villages, one village has also
telegraph facility. 21 villages have phone facilities.
All villages are well connected through a network of Pucca road as well as
Kaccha approach road. Bus is the main mode of transportation and is available
in 42 villages, while 5 villages are connected with railways.
All the villages in the study area get electricity for all purposes.
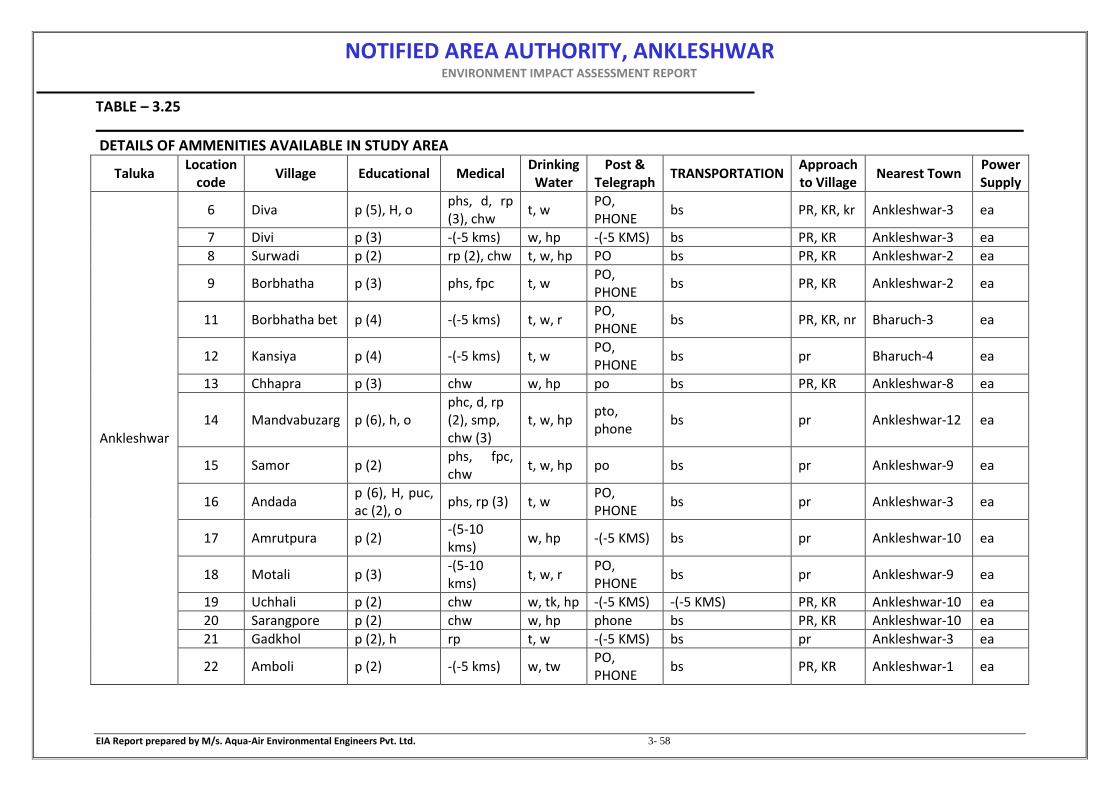
NOTIFIED AREA AUTHORITY, ANKLESHWAR ENVIRONMENT IMPACT ASSESSMENT REPORT
EIA Report prepared by M/s. Aqua-Air Environmental Engineers Pvt. Ltd. 3- 58
TABLE – 3.25
DETAILS OF AMMENITIES AVAILABLE IN STUDY AREA
Taluka Location
code Village Educational Medical
Drinking Water
Post & Telegraph
TRANSPORTATION Approach to Village
Nearest Town Power Supply
Ankleshwar
6 Diva p (5), H, o phs, d, rp (3), chw
t, w PO, PHONE
bs PR, KR, kr Ankleshwar-3 ea
7 Divi p (3) -(-5 kms) w, hp -(-5 KMS) bs PR, KR Ankleshwar-3 ea
8 Surwadi p (2) rp (2), chw t, w, hp PO bs PR, KR Ankleshwar-2 ea
9 Borbhatha p (3) phs, fpc t, w PO, PHONE
bs PR, KR Ankleshwar-2 ea
11 Borbhatha bet p (4) -(-5 kms) t, w, r PO, PHONE
bs PR, KR, nr Bharuch-3 ea
12 Kansiya p (4) -(-5 kms) t, w PO, PHONE
bs pr Bharuch-4 ea
13 Chhapra p (3) chw w, hp po bs PR, KR Ankleshwar-8 ea
14 Mandvabuzarg p (6), h, o phc, d, rp (2), smp, chw (3)
t, w, hp pto, phone
bs pr Ankleshwar-12 ea
15 Samor p (2) phs, fpc, chw
t, w, hp po bs pr Ankleshwar-9 ea
16 Andada p (6), H, puc, ac (2), o
phs, rp (3) t, w PO, PHONE
bs pr Ankleshwar-3 ea
17 Amrutpura p (2) -(5-10 kms)
w, hp -(-5 KMS) bs pr Ankleshwar-10 ea
18 Motali p (3) -(5-10 kms)
t, w, r PO, PHONE
bs pr Ankleshwar-9 ea
19 Uchhali p (2) chw w, tk, hp -(-5 KMS) -(-5 KMS) PR, KR Ankleshwar-10 ea
20 Sarangpore p (2) chw w, hp phone bs PR, KR Ankleshwar-10 ea
21 Gadkhol p (2), h rp t, w -(-5 KMS) bs pr Ankleshwar-3 ea
22 Amboli p (2) -(-5 kms) w, tw PO, PHONE
bs PR, KR Ankleshwar-1 ea

NOTIFIED AREA AUTHORITY, ANKLESHWAR ENVIRONMENT IMPACT ASSESSMENT REPORT
EIA Report prepared by M/s. Aqua-Air Environmental Engineers Pvt. Ltd. 3- 59
23 Boidara p (2) -(-5 kms) t, w PO, PHONE
bs PR, KR Ankleshwar-1 ea
29 Umarwada p (3), o phs, rp t, w, hp PO, PHONE
bs PR, KR Ankleshwar-6 ea
30 Safipura uninhabited
31 Kapodara p (2), o phs, fpc, chw
t, w PO, PHONE
bs pr Ankleshwar-7 ea
32 Bhadkodara p (2) chw t, w PO, PHONE
-(-5 KMS) PR, KR Ankleshwar-7 ea
33 Piraman p (3), Tr, o phs t, w PO, PHONE
bs PR, KR Ankleshwar-1 ea
34 Jitali p (3), h, ac (4), o
phc, rp, smp, chw
t, w, hp PO, PHONE
bs PR, KR Ankleshwar-10 ea
35 Dadhal p (3), o phs, fpc, chw
t, w, hp PO, PHONE
bs, rs PR, KR Ankleshwar-9 ea
36 Kararvel p (2), ac, o chw t, w, tk po bs PR, KR Ankleshwar-12 ea
37 Avadar p (2), ac -(-5 kms) t, w, hp po bs PR, KR Ankleshwar-10 ea
38 Piprod p (2), o chw w, hp po bs PR, KR Ankleshwar-16 ea
39 Pardi mokha p (2), o chw t, w -(-5 KMS) bs PR, KR Ankleshwar-16 ea
40 Sangpor p (3) phs, chw t, w po bs PR, KR Ankleshwar-17 ea
41 Kosamadi p (6), o phs, rp (3) t, w, hp PO, PHONE
bs PR, KR Ankleshwar-12 ea
42 Bakrol p (2) chw t, w, hp -(-5 KMS) bs PR, KR Ankleshwar-8 ea
43 Sanjali p (2), o chw t, w PO, PHONE
bs, rs PR, KR Ankleshwar-10 ea
55 Kharod p (3), h, o (2) chw, phc, cwc
t, w PO, PHONE
bs PR, KR Ankleshwar-10 ea
56 Bhadi p (2), o -(-5 kms) t, w po bs PR, KR Ankleshwar-12 ea
Jhagadia 125 Boridara p (2) chw
w, tk, tw, hp
-(-5 KMS) bs, rs PR, KR Ankleshwar-12 ea
126 Mulad p (2) phs, chw t, w, tk, tw, hp
po bs PR, KR Bharuch-9 ea

NOTIFIED AREA AUTHORITY, ANKLESHWAR ENVIRONMENT IMPACT ASSESSMENT REPORT
EIA Report prepared by M/s. Aqua-Air Environmental Engineers Pvt. Ltd. 3- 60
127 Naugama p (2) chw t, w, tk, hp, r
-(-5 KMS) bs PR, KR Bharuch-8 ea
128 Kharchi Bhilwada
p chw t, w, tk, hp
-(-5 KMS) bs, rs PR, KR Ankleshwar-10 ea
129 Kharchi p (2) phs, fpc, chw
w, tk, hp PO, PHONE
bs, rs PR, KR Ankleshwar-10 ea
158 Sardarpura p (2) chw t, w, tk, hp
-(-5 KMS) bs kr Ankleshwar-14 ea
159 Untia p (2) chw t, w, hp -(-5 KMS) bs kr Ankleshwar-12 ea
160 Dadheda p (2), o -(-5 kms) t, w, tk, hp
po bs pr Ankleshwar-11 ea
Valia 1 Kondh p (4), h, o
phs, d, fpc, rp, chw
t, w po bs PR, KR Ankleshwar-12 ea
2 Vatariya p (2) chw w PO, PHONE
bs PR, KR Ankleshwar-15 ea
Mangrol 9 Boridara p chw t, w, tk po bs kr Kosamba-15 ed, eag
(Courtesy: Census Dept., GOI)

NOTIFIED AREA AUTHORITY, ANKLESHWAR ENVIRONMENT IMPACT ASSESSMENT REPORT
EIA Report prepared by M/s. Aqua-Air Environmental Engineers Pvt. Ltd. 3- 61
ABBREVIATIONS 1. Education P - Primary / Elementary School S - Matriculation or Secondary O - Other Educational Institution PUC - Higher Secondary/Intermediate/pre-University/junior Collage 2. Medical Facilities RP - Registered Private Practitioner PHS - Primary Health Sub-Centre FPC - Family Planning Centre PHC - Primary Health Centre D - Dispensary CHW - Community Health Worker/Health Worker H - Hospital NH - Nursing Home MH - Maternity Home PHC - Public Health Centre CWC - Child Welfare Centre O - Others 3. Drinking Water T - Tap Water HP - Hand Pump TK - Tank Water W - Well Water R - River Water C - Canal N - Nallah S - Spring TW - Tube well Water 4. Post & Telegraph PO - Post Office PTO - Post & Telegraph PH - Telephone Communication 5. Communication BS - Bus Station NW - Navigable Waterway 6. Approaches to Village PR - Pucca Road / Paved Road MR - Kuchcha Road / Mud Road FP - Foot Path 7. Power Supply EA - Electricity for all purposes EAG - Electricity for Agriculture ED - Electricity for Domestic EO - Electricity for other purpose like Industrial, Commercial etc.

NOTIFIED AREA AUTHORITY, ANKLESHWAR
ENVIRONMENT IMPACT ASSESSMENT REPORT
EIA Report prepared by M/s. Aqua-Air Environmental Engineers Pvt. Ltd. 4- 1
CHAPTER – 4 ANTICIPATED ENVIRONMENTAL IMPACTS & MITIGATION MEASURES
4.1. IDENTIFICATION OF IMPACT
Various sources of pollution with respect to wastewater, the flue gas/process
emission, hazardous/solid waste and noise generation along with their qualitative and
quantitative analysis as well as measures taken to control them are discussed herein
with details. The network method will be adopted to identify potential impact, which
involves understanding of cause-condition-effect relationship between an activity and
environmental parameters.
4.2. EVALUATION AND PREDICTION OF IMPACT
Evaluation is an absolute term used for assessment and prediction by means of
numerical expression or value. Assessment is the process of identifying and
interpreting the environmental consequences of the significant actions. Prediction is
a way of mapping the environmental consequences of the significant actions.
Significant Action depicts direct adverse changes caused by the action and its effects
on health of biota including flora, fauna and man, socio-economic conditions,
landforms and resources, physical and cultural heritage properties and quality of bio-
physics surrounds.
Prediction requires scientific skill drawn from many disciplines. Prediction of
ecological components is often uncertain, because their response to environmental
stress cannot be predicted in absolute terms. The assessor (one who does the
assessment) and decision maker (one who take the decision after adequate analysis
of assessment report) is expected to be aware of the degree of uncertainty. The
assessor generally uses the following methods and resources for impact assessment.
Field surveys and monitoring
Guideline and modeling
Literature surveys and interviews
Qualification and experience
An impact can be defined as any change in physical, chemical and biological, cultural
and or socioeconomic environment that can be attributed to activities related to
NOTIFIED AREA AUTHORITY, ANKLESHWAR
ENVIRONMENT IMPACT ASSESSMENT REPORT
EIA Report prepared by M/s. Aqua-Air Environmental Engineers Pvt. Ltd. 4- 2
alternatives under study for meeting the project needs. Impact methodology provides
an organized approach for prediction and assessing these impacts.
Scientific techniques and methodologies based on mathematical modeling are
available for studying impacts of various project activities on environmental
parameters.
The nature of the impacts due to said project activities are discussed here in detail.
Each parameter identified in proceeding chapters, is singularly considered for the
anticipated impact due to various activities listed. The impact is quantified using
numerical scores 0, 1, 2, 3, 4 and 5 in increasing order of activity. In order to assess
the impact accurately, each parameter is discussed in detail covering the following:
1. Project activities like to generate impact.
2. Quantification and prediction of impact
Operation of the project may have potential to affect quality of life, air, noise, water,
land and flora, fauna and human by increase in air, noise and water pollution, by
increase in hazardous waste generation, by pollution from spillage/surface run-off, by
disturbance to flora and fauna, by loss of trees resulting from increased assess, by
increase in land values threatening agriculture, etc.
During the operation phase, the following activities are considered significant.
Air emission (Minor Negative Impact)
Noise generation (No Impact)
Hazardous waste generation (Minor Negative Impact)
Water use and waste water discharge (Minor Negative Impact)
Employment Generation (Marginal Positive Impact)
Socio-economic Environment (Minor Positive Impact)
4.2.1. WATER ENVIRONMENT
With respect to water environment three aspects are generally considered in
EIA, the raw water availability, consumption and wastewater generation that
will be disposed. The first priority in water quality assessment is to maintain
and restore the desirable level of water quality in general (Wholesomeness of
water).

NOTIFIED AREA AUTHORITY, ANKLESHWAR
ENVIRONMENT IMPACT ASSESSMENT REPORT
EIA Report prepared by M/s. Aqua-Air Environmental Engineers Pvt. Ltd. 4- 3
4.2.1.1. Impact during Construction Phase
The peak water requirement during construction will be met from the
GIDC Water supply. Further, the wastewater generation during the
construction period will be basically from construction activities and
the sanitary units provided for the workers. Hence, there will not be
any impact on the water environment.
4.2.1.2. Impact during Operation Phase
Water Consumption & Waste Water Generation is given in Table 2.8 of
Chapter 2. Details of CETP are discussed in Topic 2.4.4 of Chapter 2.
The proposed project is a Common Effluent Treatment Plant to treat
the waste water from industrial area. Overall there won’t be any
significant adverse impact due to proposed activity on the water
environment.
Ground water and soil will not get contaminated, as NAA/AWML will
be providing CETP for the treatment of industrial effluent from various
industrial units located in GIDC, Ankleshwar. The waste water will be
treated in CETP for achieving the specified discharge norms of GPCB for
discharge in FETP and after that disposed in to the Arabian Sea through
pipeline.
With the above, it can be said magnitude of impact will be minor impact
on surface and ground water or soil quality.
4.2.2. AIR ENVIRONMENT
4.2.2.1. Impact during Construction Phase
During construction phase, air emission will be generated due to
construction activities, use of D. G. set and use of construction material.
Construction activities will be limited period of time and D.G. Set will
be used in case of emergency and/or power failure only and
construction material will be used with proper mitigation measures.
There shall be lesser vehicular movement on the road for proposed
project. So there shall be minor impact during construction phase and
these impact will be temporary.

NOTIFIED AREA AUTHORITY, ANKLESHWAR
ENVIRONMENT IMPACT ASSESSMENT REPORT
EIA Report prepared by M/s. Aqua-Air Environmental Engineers Pvt. Ltd. 4- 4
Pipelines for inlet to CETP and treated effluent conveyance:
GIDC Ankleshwar has modified effluent conveyance system to final
pumping station since Jan 2018.
One is IIUS main line accommodating large scale units(@57)
contributing @13 MLD and second is CIP line accommodating SSI units
contributing @10 MLD.
All the effluent is presently collected at FPS and then sent to FETP of
NCT for further treatment.
From FPS, the effluent from CIP line accommodating SSI units
contributing @10 MLD will be diverted to proposed CETP and the
treated effluent from CETP will be sent to FPS only. Hence, only pipeline
from FPS to CETP will be required to install for the proposed CETP. The
route of this pipeline will be adjacent to existing STP.
During construction phase, air emission will be generated due to laying
of this pipeline. Construction activities will be limited period of time
and construction material will be used with proper mitigation
measures. There shall be lesser vehicular movement on the road for
proposed project. So there shall be minor impact during laying of
pipelines and these impact will be temporary.
4.2.2.2. Impact during Operation Phase
With respect to operation phase impact, Air emission from proposed
CETP includes both process and utility emissions. The dispersion of
pollutants in the atmosphere is a function of several meteorological
parameters viz. temperature, wind speed and direction, mixing depths,
inversion level, etc. A number of models have been developed for the
prediction of pollutant concentration at any point from an emitting
source. The Industrial Source Complex – Short Term (ISCST3) dispersion
model is a steady-state Gaussian plume model. It is most widely
accepted for its interpretability. It gives reasonably correct values
because this obeys the equation of continuity and it also takes care of
diffusion, which is a random process. For the present study, this model
NOTIFIED AREA AUTHORITY, ANKLESHWAR
ENVIRONMENT IMPACT ASSESSMENT REPORT
EIA Report prepared by M/s. Aqua-Air Environmental Engineers Pvt. Ltd. 4- 5
is used for the prediction of maximum ground level concentration
(GLC).
The different air emissions at proposed CETP are PM, SO2, NOx from
D.G. Set. & Chlorine gas from chlorine scrubber. The site specific and
monitored details considered for input data for the software “ISC-
AERMOD View” by Lakes Environmental, Canada for prediction of
impact on air environment are given in Table-4.1.

NOTIFIED AREA AUTHORITY, ANKLESHWAR
ENVIRONMENT IMPACT ASSESSMENT REPORT
EIA Report prepared by M/s. Aqua-Air Environmental Engineers Pvt. Ltd. 4- 6
TABLE-4.1
DETAILS OF EMISSION
SR. No.
OPERATING PARAMETER UNIT
SOURCE OF EMISSION
Flue Gas Emission Process Gas Emission
1 2
1 Stack Height Meter 30 15
2 Stack Dia. meter 0.6 0.3
3 Flue Gas Velocity m/s 3.2 1.5
4 Flue Gas Temp. OK 418 303
Emission Concentration Emission Concentration
5 PM mg/Nm3 150* --
(g/s) 0.024 --
SO2 mg/Nm3 100* --
(g/s) 0.016 --
NOX mg/Nm3 50* --
(g/s) 0.001 --
Cl2 mg/Nm3 -- 9
(g/s) -- 0.0002
(*Permissible Limit)
Stack attached to… Flue Gas Emission:
1. D.G. Set (Fuel-Diesel)
Process Gas Emission: 2. Chlorine scrubber
Note: D. G. Set Capacity: 1000 KVA is kept for emergency power back up.

NOTIFIED AREA AUTHORITY, ANKLESHWAR
ENVIRONMENT IMPACT ASSESSMENT REPORT
EIA Report prepared by M/s. Aqua-Air Environmental Engineers Pvt. Ltd. 4- 7
TABLE-4.2
SUMMERY OF ISCST3 MODEL OUTPUT FOR Cl2
SR. NO.
LOCATIONS X, Y
CO-ORDINATES
MAXIMUM CONCENTRATION
Cl2 (g/m3)
1. Project-site (A1) (0,0) 0.00000
2. Andada (A2) (1808,4700) 0.00007
3. Jitali (A3) (6628,843) 0.00002
4. Uchhali (A4) (6386,3494) 0.00004
5. Motali (A5) (3976,3736) 0.00019
6. Kharchi Bhilwada (A6) (7832,5302) 0.00001
7. Gadkol Patiya (A7) (1085,3494) 0.00009
8. Amboli (A8) (-4097,382) 0.00000
9. Umarwada (A9) (-2892, -3856) 0.00005
TABLE-4.3
PREDICTED AMBIENT AIR QUALITY FOR Cl2
SR. No.
LOCATIONS X, Y - MAXIMUM CONCENTRATION
CO-ORDINATES Cl2 (g/m3)
1. Project-site (A1) (0,0) BDL
2. Andada (A2) (1808,4700) BDL
3. Jitali (A3) (6628,843) BDL
4. Uchhali (A4) (6386,3494) BDL
5. Motali (A5) (3976,3736) BDL
6. Kharchi Bhilwada (A6) (7832,5302) BDL
7. Gadkol Patiya (A7) (1085,3494) BDL
8. Amboli (A8) (-4097,382) BDL
9. Umarwada (A9) (-2892, -3856) BDL

NOTIFIED AREA AUTHORITY, ANKLESHWAR
ENVIRONMENT IMPACT ASSESSMENT REPORT
EIA Report prepared by M/s. Aqua-Air Environmental Engineers Pvt. Ltd. 4- 8
FIGURE – 4.1
ISOPLETHS FOR Cl2
NOTIFIED AREA AUTHORITY, ANKLESHWAR
ENVIRONMENT IMPACT ASSESSMENT REPORT
EIA Report prepared by M/s. Aqua-Air Environmental Engineers Pvt. Ltd. 4- 9
4.2.3. NOISE ENVIRONMENT
4.2.3.1. CONSTRUCTION PHASE IMPACTS:
Construction activities are likely to produce noise up to some considerable extent.
During the construction phase of the project, there will be noise generation from
earth moving equipment and material handling traffic. The noise generation level
will be confined within the surrounding area of the project. There will be short
term, localized and reversible impact on ambient noise levels during the
construction activities.
4.2.3.2. OPERATION PHASE IMPACTS
Noise levels in and around the plant site will be measured. These values represent
status of Noise levels. The main source of noise pollution in the plant is D.G. Set
and other noise generating units. Vehicular movements during operation phase
for loading/unloading and other transportation activity may also increase noise
level.
4.2.4. LAND USE AND SOIL QUALITY
4.2.4.1. CONSTRUCTION PHASE IMPACT
Land is provided by NAA to AWML for the proposed CETP in the existing GIDC,
Ankleshwar. Only construction activities will be carried out for the proposed CETP
project and this will be minor impact on the existing land use pattern of the GIDC.
However there will be no significant impact on the land use pattern and soil quality
due to proposed CETP. Hence no significant topographical change is expected due
to proposed project. The plant will be located in a notified industrial estate. The
proposed plant site is suitably located considering availability of transportation,
communication, residence and manpower. The project will not involve
displacement of any population. Electricity, water, roads, all basic amenities and
infrastructure are available for the proposed project.
4.2.4.2. OPERATION PHASE IMPACT
The hazardous wastes generation from proposed project like ETP Sludge from
Common Effluent Treatment Plant, Used oil from lubrication of equipment,
Discarded Containers and Oil & Grease from skimming. These Hazardous wastes
will be stored in scientifically designed and constructed hazardous waste storage
NOTIFIED AREA AUTHORITY, ANKLESHWAR
ENVIRONMENT IMPACT ASSESSMENT REPORT
EIA Report prepared by M/s. Aqua-Air Environmental Engineers Pvt. Ltd. 4- 10
area within the premises with leachate collection system and send for disposal to
secured land fill site, registered recyclers and registered refiners. Hence, there will
be marginal impact on the soil environment.
4.2.5. HOUSING
No township or housing facilities will be required for the proposed project.
Residential facilities for the project will be available in nearby villages and
towns for accommodating workforce. On town or neighboring villages, the
impact on this account is minimal.
4.2.6. INFRASTRUCTURE AND SERVICES
Proposed CETP is identically located in Notified Area of GIDC, Ankleshwar.
Water requirement is fulfilled by GIDC. The power requirement of proposed
CETP will be met through DGVCL.
The transportation of raw materials, fuel and other materials will be
transported by road only. As stated earlier, the site is near to State Highway
and National Highway so that transportation facilities are easily available.
Due to project there are minimal impacts on services such as road transport,
communication facilities, etc. However, looking at the overall volume of
transportation and communication in this area, the impact is marginal.
GIDC will be contributed for development of neighboring areas in terms of
residential and commercial use. The infrastructure services e.g. roads, state
transport, post and telegraph, communication, education and medical
facilities, housing, etc. will be improved in the surrounding areas. The project
would have beneficial impact on infrastructure & services.
4.2.7. ENVIRONMENTAL HAZARDS
Raw materials are transported by road and stored in the plant premises. The
company maintains systems for better performance in Quality, Environment,
Occupational Health and safety. Hence, marginal impacts on this account are
anticipated. The company is committed to adopt and implement all national
and state legislation pertaining to workers safety, occupational health and in-
plant and surrounding environment. NAA/AWML will be committed for
NOTIFIED AREA AUTHORITY, ANKLESHWAR
ENVIRONMENT IMPACT ASSESSMENT REPORT
EIA Report prepared by M/s. Aqua-Air Environmental Engineers Pvt. Ltd. 4- 11
continuous improvement and sustainable development. Hence, NAA/AWML is
able to take care of any environmental hazards within the plant premises.
4.2.8. ECOLOGY
The impact due to proposed project on the ecological parameters like natural
vegetation, cropping pattern, fisheries and aquatic life, forests and species
diversity is as summarized below:
4.2.8.1. NATURAL VEGETATION
The proposed CETP is located GIDC, Ankleshwar and since, there is provision
for space for the proposed project and there will not be any cutting of the
plantation at the site. The adequate green belt will be developed by the
authority, which will lead to beneficial impact.
There shall be emission within limit as per the EMP provisions. Therefore, the
adverse impact over any of the ecological components of the environment will
be negligible.
4.2.8.2. CROPS
Since, the proposed project is located in GIDC, Ankleshwar; it is not likely to
alter the crop production and pattern of the area, either during the
construction phase or the operation phase. Further, the necessary
environmental protection measures would be planned under EMP e.g. air
pollution control systems designed to take care of even emergency releases of
the gaseous pollutants like PM, SO2, NOx and regular environmental
surveillance, etc; so as not to have any short-term or cumulative effect on the
crops and the natural vegetation of the area.
4.2.8.3. FOREST AND SPECIES DIVERSITY
The details of flora / fauna species and the wildlife habitat in the area covering
10 km radius have been collected to determine the existence of rare and / or
endangered species. There is no reserved forest, national park or sanctuary
within 10 km radius of the plant. There was no acquisition of forest land or
parks for the plant.

NOTIFIED AREA AUTHORITY, ANKLESHWAR
ENVIRONMENT IMPACT ASSESSMENT REPORT
EIA Report prepared by M/s. Aqua-Air Environmental Engineers Pvt. Ltd. 4- 12
4.2.8.4. FISHERIES AND AQUATIC LIFE
No commercial fishery activities are observed within 10 Km radius of the
premises, and hence, due to proposed project activities no any adverse effect
on fisheries and aquatic life could be envisaged.
4.2.8.5. AESTHETIC ENVIRONMENT
The proposed project is located at GIDC, Ankleshwar; industrial land with good
landscape and proposed plantation. Any increase in fugitive emission due to
construction activities and increase in the vehicular movement due to the
proposed project may have minimal adverse impact on the visual quality.
However, this impact can be minimized with implementation of environment
management plan.
Thus, adverse impacts are minimized with various EMP measures taken by the
industry on the aesthetic environment.
4.2.8.6. DEMOGRAPHY, ECONOMICS, SOCIOLOGY AND HUMAN SETTLEMENT
There are beneficial effects due to improved communication and that resulted
in economic prosperity, better educational opportunities and access to better
health and family welfare facilities. There will be a beneficial effect on human
settlement due to employment opportunities from various industries in the
area.
The standard & quality of life of local people will be improved due to the
proposed CETP. This factor combined with all other mitigation measures like
proper treatment and disposal of Hazardous and liquid wastes and gaseous
emission will have a beneficial impact on human settlement and employment
opportunities.
There will be no displacement of population in plant area. Any major activity
that may lead to resettlement of the people is considered as permanent
impact. Hence, there is no permanent impact on this account.
4.2.8.7. SOCIO - ECONOMIC IMPACTS
4.2.8.7.1. EMPLOYMENT OPPORTUNITIES
During construction phase, skilled and unskilled manpower will be needed.
This will temporarily increase the employment opportunity. Secondary jobs

NOTIFIED AREA AUTHORITY, ANKLESHWAR
ENVIRONMENT IMPACT ASSESSMENT REPORT
EIA Report prepared by M/s. Aqua-Air Environmental Engineers Pvt. Ltd. 4- 13
will also bound to be generated to provide day-to-day needs and services to
the work force. This will also temporarily increase the demand for essential
daily utilities in the local market.
The manpower requirement for the proposed project is expected to generate
some permanent jobs and secondary jobs for the operation and maintenance
of plant. This will increase direct / indirect employment opportunities and
ancillary business development to some extent for the local population.
This proposed CETP will be expected to create a beneficial impact on the local
socio-economic environment.
4.2.8.7.2. INDUSTRIES
During construction of the project, the required raw materials and skilled and
unskilled laborers will be utilized maximum from the local area. The increase
in industrial activity will boost the commercial and economic status of the
locality, to some extent.
4.2.8.7.3. PUBLIC HEALTH
During construction period, workers will be provided with basic amenities like
safe water supply, low cost sanitation facilities, first aid, required personal
protective equipment, etc. Otherwise, there could be an increase in diseases
related to personal hygiene.
Emission, if uncontrolled from process and utility stacks may cause discomfort,
burning of eyes to the recipients in the down wind direction. This may be
caused due to the failure of control equipment / process.
The company regularly examines, inspects and tests its emission from sources
to make sure that the emission is below the permissible limit.
Hence, there will not be any significant change in the status of sanitation and
the community health of the area, as sufficient measures will be taken and
proposed under the EMP.
4.2.8.7.4. TRANSPORTATION AND COMMUNICATION
Since the project location is having proper linkage for the transport and
communication, the development of this project will not cause any additional
impact.

NOTIFIED AREA AUTHORITY, ANKLESHWAR
ENVIRONMENT IMPACT ASSESSMENT REPORT
EIA Report prepared by M/s. Aqua-Air Environmental Engineers Pvt. Ltd. 4- 14
In brief, as a result of the proposed project there will be no adverse impact on
sanitation, communication and community health, as sufficient measures will
be proposed to be taken under the EMP. The proposed project is not expected
to make any significant change in the existing status of the socio - economic
environment of this region.
4.3. MATRIX REPRESENTATION
The parameters discussed are presented in the form of a matrix. The scores for
various parameters and activities are presented in Table-4.4.
Environmental Impact Assessment matrix with mitigation measures are
presented in Table-4.5.
The quantification of impact is done using numerical scores 0 to 5 as per the
following criteria.
Score Severity criteria
0 No impact
1 No damage
2 Slight/ Short-term effect
3 Occasional reversible effect
4 Irreversible/ Long-term effect
5 Permanent damage

NOTIFIED AREA AUTHORITY, ANKLESHWAR
ENVIRONMENT IMPACT ASSESSMENT REPORT
EIA Report prepared by M/s. Aqua-Air Environmental Engineers Pvt. Ltd. 4- 15
TABLE-4.4
Potential Impacts & Mitigative Measures
ENVIRONMENTAL COMPONENTS
POTENTIAL IMPACTS SOURCES OF
IMPACT MITIGATIVE MEASURE REMARKS
Water Quality Deterioration of water quality Discharge of sewage and utility waste water
Domestic Wastewater will be discharged into septic tank & soak pit. Treated effluent will be disposed through 12 km pipeline into Arabian Sea.
Discharge as per G.P.C.B. Standards. No adverse impact.
Air Quality Increase in SO2, NOX, PM concentrations in ambient air.
Process emissions, fugitive emissions.
Diesel shall be utilized for D.G. Set. Adequate stack height will be provided as APCM for proper dispersion of emission. FRP scrubber will be provided with chlorine tonner to control chlorine gas from process gas emission.
No adverse impacts on ambient air quality.
Socio-Economic Overall growth & development of area, increased employment, improvement in infrastructure.
Project activities. General area planning in advance by Development team of company.
Beneficial change.
Terrestrial Ecology
There is no loss of habitat-flora & fauna, loss of agricultural land as proposed project is located in GIDC, Ankleshwar.
Project activities. Maintain dense Green belt, Proper management of Hazardous waste, disposal of hazardous waste at secured landfill site.
No impact.
Noise Increased noise level Project operation. Noise abatement at generation point by engineering and Administration inputs & receptor Green belt.
No impact.
Infrastructure & Services
Improved communication, transport, housing, educational & medical facilities
Project. Development has been gradual. Beneficial impact.
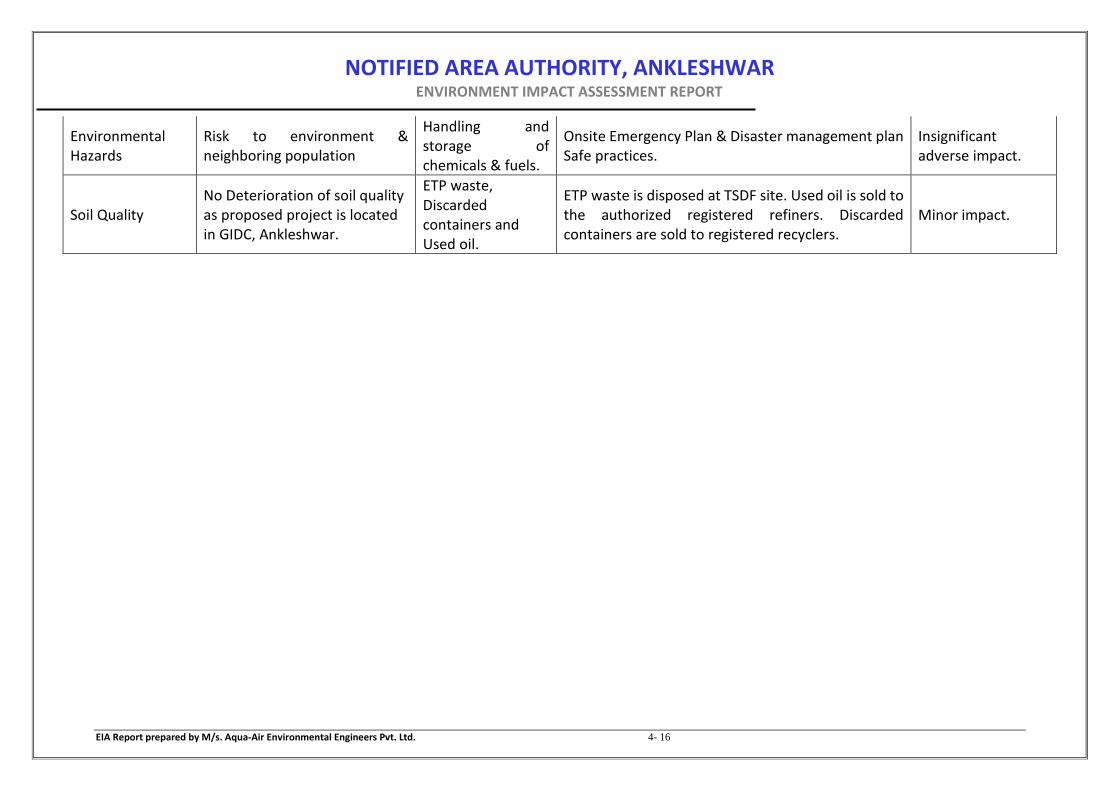
NOTIFIED AREA AUTHORITY, ANKLESHWAR
ENVIRONMENT IMPACT ASSESSMENT REPORT
EIA Report prepared by M/s. Aqua-Air Environmental Engineers Pvt. Ltd. 4- 16
Environmental Hazards
Risk to environment & neighboring population
Handling and storage of chemicals & fuels.
Onsite Emergency Plan & Disaster management plan Safe practices.
Insignificant adverse impact.
Soil Quality No Deterioration of soil quality as proposed project is located in GIDC, Ankleshwar.
ETP waste, Discarded containers and Used oil.
ETP waste is disposed at TSDF site. Used oil is sold to the authorized registered refiners. Discarded containers are sold to registered recyclers.
Minor impact.

NOTIFIED AREA AUTHORITY, ANKLESHWAR
ENVIRONMENT IMPACT ASSESSMENT REPORT
EIA Report prepared by M/s. Aqua-Air Environmental Engineers Pvt. Ltd. 4- 17
TABLE-4.5
Environmental Impact Assessment Matrix with Mitigation Measures (Construction Phase)
PROJECT ACTIVITIES
PARAMETERS
Exca
vati
on
Wat
er R
equ
irem
en
t
Civ
il W
ork
s
Mec
han
ical
Wo
rks
Equ
ipm
ent
&
Mac
hin
e O
per
atio
n
Op
erat
ion
La
nd
scap
ing
Filli
ng
Surf
ace
Pav
ing
Mis
c. H
um
an
Act
ivit
ies
Tran
spo
rtat
ion
acti
viti
es
Dem
and
s o
f P
ub
lic
faci
lity
TOTA
L
PHYSICO-CHEMICAL PARAMETERS:
Surface Water Quality 0 0 0 0 0 0 0 0 0 0 0 0
Ground Water Quality 0 -1 0 0 0 -1 0 0 0 -1 0 -3
Air Quality & Noise -1 0 -1 -1 -1 -1 0 0 0 -1 0 -6
Soil Quality -1 0 0 0 0 1 0 0 0 0 0 0
Land use /land cover -1 0 0 0 0 1 0 0 0 0 0 0
ECOLOGICAL PARAMETERS:
Forest/ Park/ Sant. 0 0 0 0 0 0 0 0 0 0 0 0
Flora & Fauna 0 0 0 0 -1 2 0 0 0 0 0 -1
Aquatic Ecosystem 0 0 0 0 0 0 0 0 0 0 0 0
SOCIAL PARAMETERS:
Aesthetics 0 0 0 0 0 1 0 0 0 0 0 1
Local housing 0 0 0 0 0 0 0 0 0 0 0 0
Services 0 0 0 0 1 0 0 0 1 1 0 3
Health & Safety -1 -1 -1 -1 -1 1 0 0 0 -1 -1 -6
ECONOMIC PARAMETERS:
Agriculture 0 0 0 0 0 0 0 0 0 0 0 0
Industries -1 -1 -2 -1 -1 2 0 0 0 -1 0 -5
Employment 1 -1 1 2 1 1 0 0 1 1 0 7
TOTAL -4 -4 -3 -1 -2 7 0 0 2 -2 -1 -8
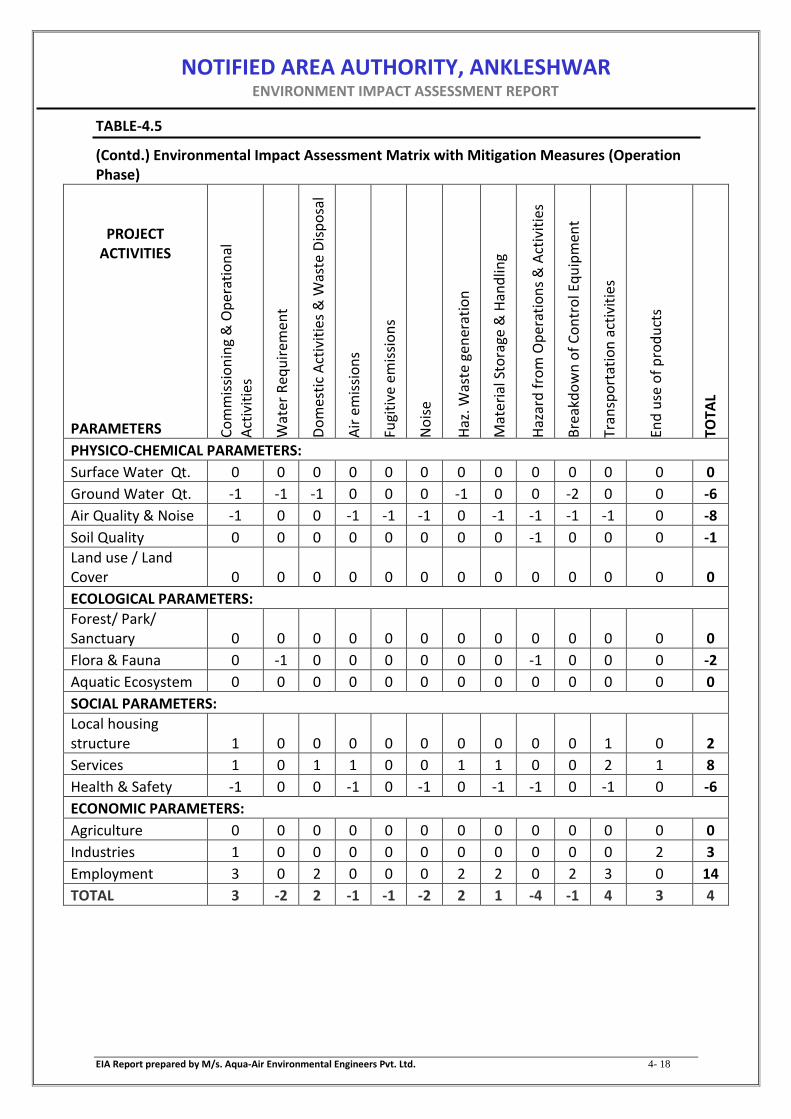
NOTIFIED AREA AUTHORITY, ANKLESHWAR
ENVIRONMENT IMPACT ASSESSMENT REPORT
EIA Report prepared by M/s. Aqua-Air Environmental Engineers Pvt. Ltd. 4- 18
TABLE-4.5
(Contd.) Environmental Impact Assessment Matrix with Mitigation Measures (Operation Phase)
PROJECT ACTIVITIES
PARAMETERS Co
mm
issi
on
ing
& O
per
atio
nal
Act
ivit
ies
Wat
er R
equ
irem
en
t
Do
mes
tic
Act
ivit
ies
& W
aste
Dis
po
sal
Air
em
issi
on
s
Fugi
tive
em
issi
on
s
No
ise
Haz
. Was
te g
ener
atio
n
Mat
eria
l Sto
rage
& H
and
ling
Haz
ard
fro
m O
per
atio
ns
& A
ctiv
itie
s
Bre
akd
ow
n o
f C
on
tro
l Eq
uip
men
t
Tran
spo
rtat
ion
act
ivit
ies
End
use
of
pro
du
cts
TOTA
L
PHYSICO-CHEMICAL PARAMETERS:
Surface Water Qt. 0 0 0 0 0 0 0 0 0 0 0 0 0
Ground Water Qt. -1 -1 -1 0 0 0 -1 0 0 -2 0 0 -6
Air Quality & Noise -1 0 0 -1 -1 -1 0 -1 -1 -1 -1 0 -8
Soil Quality 0 0 0 0 0 0 0 0 -1 0 0 0 -1
Land use / Land Cover 0 0 0 0 0 0 0 0 0 0 0 0 0
ECOLOGICAL PARAMETERS:
Forest/ Park/ Sanctuary 0 0 0 0 0 0 0 0 0 0 0 0 0
Flora & Fauna 0 -1 0 0 0 0 0 0 -1 0 0 0 -2
Aquatic Ecosystem 0 0 0 0 0 0 0 0 0 0 0 0 0
SOCIAL PARAMETERS:
Local housing structure 1 0 0 0 0 0 0 0 0 0 1 0 2
Services 1 0 1 1 0 0 1 1 0 0 2 1 8
Health & Safety -1 0 0 -1 0 -1 0 -1 -1 0 -1 0 -6
ECONOMIC PARAMETERS:
Agriculture 0 0 0 0 0 0 0 0 0 0 0 0 0
Industries 1 0 0 0 0 0 0 0 0 0 0 2 3
Employment 3 0 2 0 0 0 2 2 0 2 3 0 14
TOTAL 3 -2 2 -1 -1 -2 2 1 -4 -1 4 3 4

NOTIFIED AREA AUTHORITY, ANKLESHWAR
ENVIRONMENT IMPACT ASSESSMENT REPORT
EIA Report prepared by M/s. Aqua-Air Environmental Engineers Pvt. Ltd. 4- 19
4.4. CONCLUSION
It can be concluded from the matrices that the resultant impact is beneficial in the
interest of common man, the society, the state and the country as a whole. The
benefits can be summarized as below:
There should be positive impact on the socio-economic condition of the area in
terms of direct and indirect employment due to the proposed project.
Numbers of local trained persons are likely to find jobs.
Country will save valuable foreign exchange as import of these products will
reduce by corresponding amount.
These products also have export potential. Hence, possibility of earning foreign
exchange.
NOTIFIED AREA AUTHORITY, ANKLESHWAR ENVIRONMENT IMPACT ASSESSMENT REPORT
EIA Report prepared by M/s. Aqua-Air Environmental Engineers Pvt. Ltd. 5- 1
CHAPTER – 5 ENVIRONMENTAL MONITORING PLAN
5.1. ENVIRONMENTAL MONITORING PLAN
Environmental Monitoring is an essential tool for sustainable development &
ensuring effective most implementation & monitoring of Environmental
Management Plan & mitigation measures. It is also very essential for keep updating
the Environmental Management System for effective conservation of environment
along with ongoing project activities / operation. The Environment Monitoring Plan
enables Environmental Management System with early sign of need for additional
action and modification of ongoing actions for environment management,
improvement & conservation. It provides exact idea for mitigation measures to be
implemented as it is linked with actual distraction of environmental quality due to
the project activities. Hence, monitoring of critical parameters of environmental
quality is very essential in the routine activity schedule of project operation. An
Environmental Monitoring Programme shall be scheduled for the following major
objectives:
To verify the result of the impact assessment study in particular with
regards to new developments.
To follow the trend of parameters which have been identified as critical.
To check or assess the efficiency of controlling measures.
To ensure that new parameters, other than those identified in the impact
assessment study, do not become critical through the commissioning of
new project.
To monitor effectiveness of Control Measures:
Monitor daily, Assess effectiveness of the Control Measures being
implemented, Explore the need to modify or add new Control Measures
particularly if a violation is observed & Report weekly.
Regular monitoring of environmental parameters will be made to find out
any deterioration in environmental quality.
Monitoring of the proposed project area will be regularly conducted. The
attributes, which merit regular monitoring, are specified underneath.

NOTIFIED AREA AUTHORITY, ANKLESHWAR ENVIRONMENT IMPACT ASSESSMENT REPORT
EIA Report prepared by M/s. Aqua-Air Environmental Engineers Pvt. Ltd. 5- 2
5.2. POST PROJECT MONITORING
5.2.1. MONITORING POINTS/LOCATIONS & COMPONENTS
The monitoring points / location & components of significance shall be as
follows:
TABLE-5.1
MONITORING POINTS/LOCATIONS & COMPONENTS
ENVIRONMENT ISSUE/COMPONENT
REMEDIAL MEASURES
Hazardous waste generation & disposal
Proper collection, Safe Handling, Storage within premises and will be disposed at approved TSDF, re-cyclers, re-processors.
Effluent treatment Effluent treatment plant has been provided for treatment of wastewater generated from various industries and disposal of effluent in 55 km pipeline to Arabian Sea.
Emission from stack Adequate pollution control system will be provided for control of gaseous emission.
Plantation Plantation in and around plant.
Preparedness to handle onsite & offsite emergency
Offsite Emergency Management Plan will be prepared.
Monitoring of Environmental parameters
Regular monitoring of various environmental parameters will be carried out to check the effectiveness of the control system.
5.2.2. MONITORING PARAMETERS & FREQUENCY
The monitoring Parameters & Frequency of significance shall be as following:
TABLE-5.2
FREQUENCY OF MONITORING & PARAMETERS
Environmental Component
Parameters Standards Duration / Frequency
Air Environment
AAQM at plant site SPM, RSPM, SO2, NOx, in Ambient Air Quality
Prescribed by CPCB
Once a week through NABL accredited laboratory.
Stack emission monitoring of emissions sources
Parameters prescribed by CPCB for stack emissions
Prescribed by CPCB
Once in a weekly / fortnightly Once in six months by NABL accredited laboratory.
Fugitive emissions monitoring within the plant side
VOC Prescribed by CPCB
Every Day
Water Environment
Analysis of treated effluent
Parameters prescribed by CPCB
Prescribed by CPCB
Daily by CETP Once in a Quarter by NABL accredited laboratory.

NOTIFIED AREA AUTHORITY, ANKLESHWAR ENVIRONMENT IMPACT ASSESSMENT REPORT
EIA Report prepared by M/s. Aqua-Air Environmental Engineers Pvt. Ltd. 5- 3
Ground water quality - As per drinking water quality Standards
Once in a season
Surface water quality pH, TDS, TSS, Sulphate, Chloride, Colour, BOD3, COD, Oil and Grease
Water use based standards of CPCB
Once in a season
Environmental Component
Parameters Standards Duration / Frequency
Noise Environment
Noise Noise level in db(A) leq As per national noise standards
Once in quarter by Company
Soil Environment
At plant site Analysis of pH, Sulphate, Calcium, Magnesium, Chlorides, Cyanides, Phenolic Compounds
-- Pre and post monsoon season by Company
In surrounding area Analysis of pH, Sulphate, Calcium, Magnesium, Chlorides, Cyanides, Phenolic Compounds
-- Pre and post monsoon season by Company
5.2.3. REGULAR MONITORING OF MEMBER INDUSTRIES
The monitoring plan for member industries is attached as Annexure – 11.
5.2.4. METHOD OF ENVIRONMENTAL SAMPLING & ANALYSIS
Monitoring of environmental samples shall be done as per the guidelines
provide by MoEFCC / CPCB / GPCB. The method followed shall be
recommended / standard method approved / recommended by MoEFCC /
CPCB.

NOTIFIED AREA AUTHORITY, ANKLESHWAR ENVIRONMENT IMPACT ASSESSMENT REPORT
EIA Report prepared by M/s. Aqua-Air Environmental Engineers Pvt. Ltd. 5- 4
TABLE-5.3
METHOD OF ENVIRONMENTAL SAMPLING & ANALYSIS
Attributes METHOD
Sampling / Preservation Analysis
A. Air Environment 1. Micro-meteorological
data 2. Ambient Air Quality
Mechanical / Automatic 1. Spectrum weather station 2. 2.5 Micron dust samplers & RSPM
samplers having the facility to collect the gaseous samples
-----
IS : 5182 & CPCB
B. Noise Instrument : Noise level meter -
C. Water & Waste Water 1. Ground Water 2. Surface Water
Standard methods for examination of water and wastewater analysis published by APHA 22nd edition, 2012
Standard Methods for Examination of Water and Wastewater Analysis published by APHA 22nd edition, 2012
5.3. DOCUMETATION & RECORDS
The company will maintain the following record with respect to routine
monitoring.
Standard method (IS & APHA)
Data Sheets for necessary details
Rough record locations & frequency
Report preparation
Monthly and annual progress reports.
5.4. BUDGET & PROCUREMENT SCHEDULE
On regular basis, Environment Management Cell shall inspect the necessity &
availability of the materials, technologies, services & maintenance works. The Cell
shall prepare appropriate budget for this purpose. Regular record review for change
in financial requirement of environment management shall be done and appropriate
budgetary provisions shall be made.
The budget shall include provisions for:
Environmental Monitoring Program
Operation & Maintenance of Environmental Technologies / Equipments
Emergency Purchase of necessary material, equipments, tools, services, etc.
Greenbelt development
Social & Environmental Welfare & Awareness programs / training.

NOTIFIED AREA AUTHORITY, ANKLESHWAR ENVIRONMENT IMPACT ASSESSMENT REPORT
EIA Report prepared by M/s. Aqua-Air Environmental Engineers Pvt. Ltd. 5- 5
The budget shall include provisions for:
Environmental Monitoring Program & equipment
Operation & Maintenance of Environmental Technologies / Equipment
5.5. MONITORING PLAN FOR MEMBER INDUSTREIS
A detailed Specific monitoring plan for member industries is attached as Annexure
– 11.

NOTIFIED AREA AUTHORITY, ANKLESHWAR ENVIRONMENT IMPACT ASSESSMENT REPORT
EIA Report prepared by M/s. Aqua-Air Environmental Engineers Pvt. Ltd. 6- 1
CHAPTER – 6 PROJECT BENEFITS
6.1 BACKGROUND
NAA and AWML proposed a 10 MLD CETP at GIDC, Ankleshwar for the treatment of
industrial waste water of member industries from GIDC, Ankleshwar. The proposed
project located Plot No. U-5 (Utility Plot), adjacent to existing 22.5 MLD STP, GIDC,
Ankleshwar, Di: Bharuch, Gujarat.
6.2 ENVIRONMENT
The proposed project is a common infrastructure project for treatment of waste water of
member industries of GIDC, Ankleshwar.
At GIDC, Ankleshwar there are several small, medium and large scale
industries in operation. Also so many industries are planning for
expansion of their existing unit by increasing the production capacity
or adding the new products. Also there are new proposed industries to
establish their manufacturing facility.
Looking to the above expansion and new industries scenario the total
effluent generation form the industrial estate going to increase.
The GIDC Ankleshwar is very old GIDC and 70% industrial units are Small
Scale Industries (SSI). The plot area of SSI are small and available space
is limited. So it is difficult to upgrade/modify existing ETP.
Presently, the effluent generated from the small scale industries within
the premises of GIDC Ankleshwar is either discharged directly into the
FETP of NCT through underground effluent conveyance pipeline or into
CETP of ETL through tankers and final pumping station. NCT treat the
effluent and after achieving discharge norms, dispose the treated
effluent into deep Arabian Sea through 53 km (Onshore Pipeline: 43.6
km + Offshore Pipeline: 9.4 km) effluent conveyance pipeline.
Now, Medium and Large scale industries are having their own Effluent
Treatment Plant. Such industries are treating their effluent and
discharging to GIDC drainage line to FETP.
Small scale industries (SSI) have limited facilities for effluent treatment.
NOTIFIED AREA AUTHORITY, ANKLESHWAR ENVIRONMENT IMPACT ASSESSMENT REPORT
EIA Report prepared by M/s. Aqua-Air Environmental Engineers Pvt. Ltd. 6- 2
Hence, to treat the effluent from SSIs of GIDC, Ankleshwar; NAA of
Ankleshwar along with AWML proposed to set up a 10 MLD CETP.
Looking to the current scenario, it is proposed to set up CETP for 7.5
MLD Ind. Effluent + 2.5 MLD sewage with primary, secondary and
tertiary treatment facility. The proposed CETP shall treat only the
effluent from SSIs of GIDC Ankleshwar. The treated effluent from the
proposed CETP shall achieve the FETP norms and discharge the treated
effluent to FETP for further treatment and disposal.
6.3 The advantage of CETP is mostly sought due to following benefits:
Saving in capital cost and operating cost of treatment plant. The common treatment
is always cheaper than small scattered treatment units.
Availability of land which is difficult to be ensured by all individual units in the event
they go for individual treatment plants.
Contribution of nutrient and diluting potential, making the complex industrial waste
more amenable to degradation.
The neutralization and equalization of heterogeneous waste makes its treatment
techno economically viable.
Professional and trained staff can be made available for operation of CETP which is
not possible in case of individual plants.
Looking to the future demand CETP will be constructed with extra capacity.
Disposal of treated wastewater & sludge becomes more organized.
Reduced burden of various regulatory authorities in ensuring pollution control
requirement.
As CETP will be provided after final collection sump, toxic effect of untreated & illegal
dump tankers will be minimized.
The effluent discharge will comply with the guidelines given by SPCB/CPCB and MoEF
and will not be harmful to the ecology of the receiving body.
A peripheral greenbelt/plantation, garden and lawn will be provided which will
improve the aesthetics of the area.
As the proposed site is in the GIDC area which is away from residential area, and all
the required care will be taken to control the pollution levels to minimum as discussed

NOTIFIED AREA AUTHORITY, ANKLESHWAR ENVIRONMENT IMPACT ASSESSMENT REPORT
EIA Report prepared by M/s. Aqua-Air Environmental Engineers Pvt. Ltd. 6- 3
in the relevant sections of this report, no adverse impacts are anticipated due to
construction of CETP during construction and operation phase.
There shall be no displacement of any population as proposed project is in GIDC,
Ankleshwar. Hence, there is no permanent impact or any R&R issues on this account.
The unskilled and skilled manpower requirement during the construction and
operation phases for the CETP will generate permanent jobs and secondary jobs for
the operation and maintenance of plant. This will increase direct/indirect employment
opportunities and ancillary business development to some extent for the local people.
The employment opportunities as described above will create beneficial impact on the
local socio-economic environment.
Adequate mitigation measures will be ensured to reduce odor emissions and disease
vectors from proposed site to eliminate the nuisance of ETP.
Hence the status of sanitation and community will be maintained in good condition at
the project site.
6.4 Employment Generation
The proposed project will have considerable employment. This will increase the
employment opportunity. Secondary jobs will also bind to be generated to provide daily
needs and services to the work force. This will also temporarily increase the demand for
essential daily utilities in the local market. The manpower requirement for the proposed
project will generate permanent and secondary jobs for the operation and maintenance
of plant. The project will benefit the people living in the neighboring villages by giving
preference to them in relation to direct employment associated with the various project
activities. Construction and operation phase of the proposed project will involve a certain
number of laborers. There is a possibility that local people for construction phase as well
as a number of local skilled and unskilled people will be engaged in the employment which
will improve the existing employment scenario of the region.
DEPLOYMENT OF QUALIFIED/SKILLED MAN POWER
Employee’s Nos.
Male 40
Female 10
Total 50

NOTIFIED AREA AUTHORITY, ANKLESHWAR ENVIRONMENT IMPACT ASSESSMENT REPORT
EIA Report prepared by M/s. Aqua-Air Environmental Engineers Pvt. Ltd. 6- 4
6.5 ENTERPRISE SOCIAL RESPONSIBILITY (ESR) PLANT & ACTIVITIES
To carry out above activities in the most efficient manner, Ankleshwar Industries
Association promoted Ankleshwar Industrial Development Society (AIDS), Ankleshwar
Environmental Preservation Society (AEPS), Sanskardeep Trust, Enviro Technology Ltd
(ETL) a common effluent treatment facility mainly for small scale industries, Bharuch
Enviro Infrastructure Ltd (BEIL) a combination of common solid waste disposal facility
(TSDF), common Multi Effect Evaporator (MME) and common incineration facility and
Narmada Clean Tech (formerly Bharuch Eco Aqua Infrastructure Ltd) (NCT) a final
effluent treatment plant for polishing cum disposal of treated effluent in to the deep
sea near Kantiyajal.
Highlights of various initiatives taken and activities carried out by Ankleshwar
Industries Association through these organizations are:
Social Infrastructure:-
1. Ankleshwar Industrial Development Society: This society runs:
(1)
(2)
Shree Gattu Vidyalaya, a school providing education to more than 2500 students from Junior KG to Higher Secondary with instructions in both English and Gujarati languages, is one of the best schools of the District
Smt. Jayaben Mody Hospital, a 80-bed full-fledged hospital is providing efficient health services not only to the industrial community, but also to the rural population.

NOTIFIED AREA AUTHORITY, ANKLESHWAR ENVIRONMENT IMPACT ASSESSMENT REPORT
EIA Report prepared by M/s. Aqua-Air Environmental Engineers Pvt. Ltd. 6- 5
(3)
2. Sanskardeep:
Trust runs a Gujarati Medium School – Sanskardeep Vidyalaya – pre-primary to Secondary
level. More than 1500 students are studying in this school, which is one of the best schools of
the District, this is evident as in Board examinations, and some students regularly secure
position in State topper’s ‘list ten.
Environmental Infrastructure
1. Ankleshwar Environmental Preservation Society:
D. A. Anandpura Sports & Cultural Centre is set up for providing sports, games and recreational activities to the industrial community of the area.
NOTIFIED AREA AUTHORITY, ANKLESHWAR ENVIRONMENT IMPACT ASSESSMENT REPORT
EIA Report prepared by M/s. Aqua-Air Environmental Engineers Pvt. Ltd. 6- 6
- AEPS is running P.G. Diploma course in Environment Management for last
many years. As on date more than 100 P.G. Diploma holders are in Ankleshwar
and they are taking care of Environment Management System of various
industries. This has helped to tackle the environmental related matters
considerably.
- AEPS is organizing Environment Awareness Programs and Seminars regularly.
The overwhelming response of these programs and seminars gives a clear
impression of the industries that ISO 14000 is very important certification for
them. In Ankleshwar GIDC, there are over 50 industries in medium/large scale
category and 100 small scale industries having ISO 14000 certification. Major
Goal of AEPS is to get ISO 14000 certification for the entire GIDC Estate.
- Massive tree plantation is being carried out in and around Ankleshwar GIDC.
All the roads in the GIDC Estate are covered with trees. Each year almost
Rs.5.0 lakhs are being spent for tree plantation & its maintenance activities.
Three Green Belts have been developed within the Estate. There is increase of
almost 14% green belt area compared to 1985 – 1998. This data was obtained
from ISRO through their satellite images.
- Other activities like, running rain water harvesting system, increasing
awareness through programs for use of solar energy, etc. are being conducted
regularly.
- Being the largest cluster of chemical industries in Asia, Ankleshwar industrial
estate is always vulnerable to industrial emergencies due to human errors,
natural calamities and technical failures. Ankleshwar Industrial Association
armed itself to take on such emergencies by setting up Disaster Prevention &
Management Center (DPMC) in 1995 through AEPS. DPMC is fully capable to
control emergencies like fire, explosions, gas leaks and etc. in Ankleshwar,
Panoli, Jhagadia and Valia industrial estates. It is equipped with all necessary
equipment for all types of emergencies and trained personnel.
In view of the valuable services rendered by this organization, the Gujarat State
Disaster Management Authority, a State Government undertaking has
sanctioned a Hazmat Van worth Rs. 1.50 Crores to this organization. This will
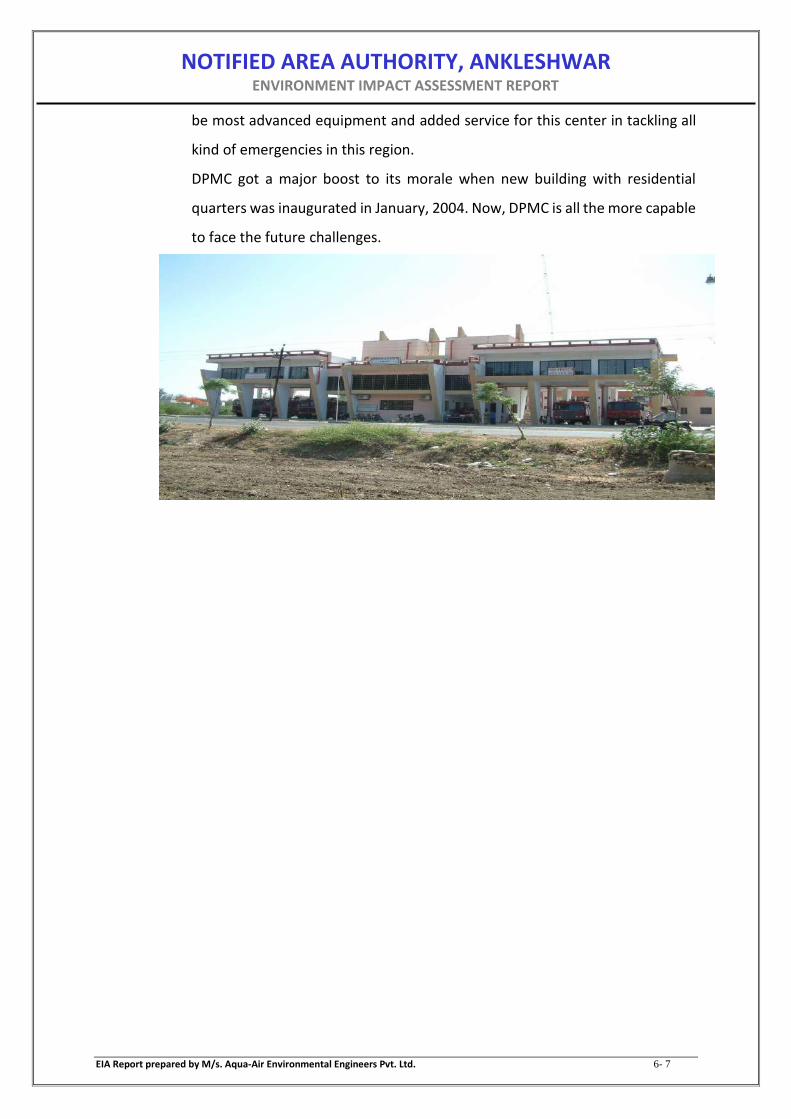
NOTIFIED AREA AUTHORITY, ANKLESHWAR ENVIRONMENT IMPACT ASSESSMENT REPORT
EIA Report prepared by M/s. Aqua-Air Environmental Engineers Pvt. Ltd. 6- 7
be most advanced equipment and added service for this center in tackling all
kind of emergencies in this region.
DPMC got a major boost to its morale when new building with residential
quarters was inaugurated in January, 2004. Now, DPMC is all the more capable
to face the future challenges.

NOTIFIED AREA AUTHORITY, ANKLESHWAR ENVIRONMENT IMPACT ASSESSMENT REPORT
EIA Report prepared by M/s. Aqua-Air Environmental Engineers Pvt. Ltd. 7- 1
CHAPTER – 7 ENVIRONMENTAL MANAGEMENT PLAN
7.1. BACKGROUND
The proposed 10 MLD CETP of GIDC, Ankleshwar shall adopt a comprehensive
Environmental management plan (EMP), which would cover several environmental
protection measures, not only for abatement of environmental pollution resulting
from the project, but also for the improvement in the ambient environment. The
various components of the EMP are outlined in subsequent sections.
7.2. OBJECTIVES OF ENVIRONMENTAL MANAGEMENT PLAN
The main objectives in formulating the environment management plan are,
To treat all the pollutants, i.e. effluent, air emission, noise & hazardous waste etc.
which contribute to the degradation of environment, with appropriate technology.
To comply with all the regulations stipulated by central/state pollution control boards
related to air emission and liquid effluents discharge as per Air & water pollution
control laws.
To handle hazardous waste as per Hazardous Waste (Management, Handling and Trans
boundary Movement) Amendment Rules, 2009 of Environment Protection Act, 1986.
To encourage, support and conduct development work for the purpose of achieving
environment standards and to improve methods of environment management.
To promote further forestation in the surrounding areas of the plant.
To create good working conditions (devoid of air & noise pollution) for employees.
To reduce fire and accidental hazards.
Perspective budgeting and allocation of funds for environment management
expenditure.
Dissemination of technological solution on commercial basis to interested parties.
Continuous development and search for innovative technologies for better
environment.
To adopt cleaner production technology.

NOTIFIED AREA AUTHORITY, ANKLESHWAR ENVIRONMENT IMPACT ASSESSMENT REPORT
EIA Report prepared by M/s. Aqua-Air Environmental Engineers Pvt. Ltd. 7- 2
7.3. ENVIRONMENTAL MANAGEMENT CELL
Apart from having an environmental management plan, it is also necessary to have a
permanent organizational set up charged with the task of ensuring effective
implementation. In this effect, NAA and AWML shall assigned responsibilities to
officers from various disciplines to co-ordinate the activities concerned with
management and implementation of environment control measures. An organogram
of Environment management is shown in Figure – 7.1. Basically, this department
undertake the monitoring of environmental pollution level by measuring stack
emissions, ambient air quality, water and effluent quality, Noise level, etc. either
departmentally or appointing external agency whenever necessary. CETP shall have
its own laboratory equipped with different equipment. The details of laboratory of
CETP are attached as Annexure – 10. In addition to that CETP shall have quality control
laboratory, which shall be equipped with sophisticated equipments. Equipment of
quality control laboratory shall also available for analysis of environment parameters.
CETP will continue the regular monitoring in future to ensure that pollution is limited
below prescribed limits and to take corrective action by either providing new
equipment or improving the performance of existing pollution control equipment. In
case the monitored results of environment pollution are found to exceed the
prescribed limits, remedial actions are taken through the concerned plant authorities.
The actual operation and maintenance of pollution control equipments of each
department is under respective department heads.
The Environmental, Occupational health and Safety department shall also look after
for preparation of environment statement, carrying out environment audit,
preparation of Water Cess Return and various consent applications and renewal under
water (Prevention and Control of Pollution) Act, 1974 and Air (Prevention and Control
of Pollution) Act, 1981 as well as application for authorization and its renewal under
Hazardous Waste (Management, Handling and Trans boundary Movement)
Amendment Rules, 2009 under Environment Protection Act, 1986.

NOTIFIED AREA AUTHORITY, ANKLESHWAR ENVIRONMENT IMPACT ASSESSMENT REPORT
EIA Report prepared by M/s. Aqua-Air Environmental Engineers Pvt. Ltd. 7- 3
FIGURE – 7.1
ORGANOGRAM OF ENVIRONMENT MANAGEMENT CELL
7.3.1. MANAGEMENT AND MAINTENANCE OF CONVEYANCE SYSTEM
Following are the special provisions made in conveyance system to protect the
environment from any malfunction and for smooth conductance.
Presently, the management and maintenance of effluent conveyance
system is maintained by NAA.
Only the CIP pipeline network will be utilized for collection of effluent from
various industries in CCETP.
Proper Inspection of existing pipeline will be carried out.
Cleaning of pipeline will be carried out as per requirement.
The routine monitoring of entire pipeline shall be carried out.
The entire CETP shall be operated on PLC-SCADA system.
BOARD OF DIRECTORS
OPERATIONS MANAGEMENT COMMITTEE
CHIEF EXECUTIVE OFFICER
OPERATIONS
MANAGER
OPERATIONS
MANAGER
LABORATORY
MANAGER
CONVEYENCE
SUPERVISOR
ADMINISTRATION
MANAGER
MAINTENANCE
STAFF PLANT
OPERATORS & HELPERS
HOUSE KEEPING
STAFF
CHEMIST &
ASSISTANCE
SAFETY
STAFF
CONVEYENCE
STAFF
ADMIN. STAFF
ACCOUNT
STAFF
MONITORING TEAM
NOTIFIED AREA AUTHORITY, ANKLESHWAR ENVIRONMENT IMPACT ASSESSMENT REPORT
EIA Report prepared by M/s. Aqua-Air Environmental Engineers Pvt. Ltd. 7- 4
7.4. ENVIRONMENT MANAGEMENT PLAN
7.4.1. CONSTRUCTION PHASE MANAGEMENT
Environment impact during the construction phase can be attributed to the
site preparation, civil works, erection and mechanical fabrication, waste
disposal, welding etc and provision of civic amenities to the construction work
team. The potential for environmental impact during construction phase is
temporary and environment returns back to its previous status on completions
of the construction.
The construction shall be undertaken on open land and topography of the site
is plain. Thus, change in land use and destruction of flora from the construction
area is not involved. The Environmental Management Plan for construction
phase is described below;
During site preparation, the materials shall be stacked at safe place.
To prevent soil erosion, temporary seeding and sedimentation basin shall be
provided.
To control the nuisance created by excavation, leveling and transportation
activities shall be carried out by water sprinkling.
Safety equipments such as ear plugs, ear muffs, helmet and safety goggles etc.
will be provided.
7.4.2. OPERATIONAL PHASE MANAGEMENT
The detail study was carried out for operational phase aspect, impact and their
mitigation measure. Control measures have been incorporated in the process
system to minimize wastes generation and subsequent environment.
7.4.2.1. CONVEYANCE SYSTEM
The effluent from the member industries shall be transported by conveyance
pipeline and pumping stations to CETP site. Within CETP, almost effluent shall
convey through open channel for treatment process so there will be no any
choking and also any leakage shall rectify immediately. But at some where
effluent shall convey through pipeline, at there company will upgrade effluent
conveyance system to prevent choking/overflow/leakage of the effluent
conveyance pipeline which is as follow;

NOTIFIED AREA AUTHORITY, ANKLESHWAR ENVIRONMENT IMPACT ASSESSMENT REPORT
EIA Report prepared by M/s. Aqua-Air Environmental Engineers Pvt. Ltd. 7- 5
Pipeline network will provide with adequate size with screen.
Adequate pipeline capacity will be provided.
To prevent leakage, flange system will be provided to joint the pipes.
Adequate height of pipeline inlet and outlet will be provided.
Proper Inspection will be carried out.
Cleaning will be carried out at per requirement.
The routine monitoring of entire pipeline shall be carried out.
7.4.2.2. WATER ENVIRONMENT
7.4.2.2.1. AT CETP SITE
Neutral effluent from member industries to CETP shall be treated in Effluent
Treatment Plant, which consists of Primary, Secondary and Tertiary treatment
facility and finally sent to Final Pumping station (FPS). From the final pumping
station all the collected effluent pumped to the FETP of NCTL for further
treatment and final disposal into deep Arabian Sea through a 55 km pipeline.
The details of pipeline for final disposal of treated effluent are shown in Figure
7.2.
FIGURE – 7.2
SCHEMATIC DIAGRAM OF TREATED EFFLUENT DISPOSAL

NOTIFIED AREA AUTHORITY, ANKLESHWAR ENVIRONMENT IMPACT ASSESSMENT REPORT
EIA Report prepared by M/s. Aqua-Air Environmental Engineers Pvt. Ltd. 7- 6
Total water requirement will be fulfilled by GIDC water supply system. This will
not put any stress upon the ground water bodies. However, water
conservation practices and process optimization, reduction, reuse and recycle
of water will minimize the impact.
CETP has adopted the following EMP to prevent water environment;
Water conservation measures shall be taken to optimize the fresh water
requirement and record of water consumption shall be maintained.
Record of the inlet waste water quantity and treated water/disposal quantity
shall be maintained.
Record of analysis results of untreated wastewater and treated waste water
shall be maintained.
Annual environmental audit from recognized environmental auditor shall be
conducted.
Proper housekeeping should be adopted to prevent spillages and
contaminated surface runoff going to storm water drains.
Monitoring plan shall be implemented as per schedule.
CETP also has to carry out treatability studies in pilot plant so that treatment
scheme can be further improved.
7.4.2.2.2. RESPONSIBILITIES OF MEMBER INDUSTRIAL UNITS
The member units shall segregate their effluent into following
streams and shall treat each stream according to the quality.
Low TDS low COD effluent:
This will be treated by individual industrial units so as to achieve CETP
inlet norms.
High TDS low COD effluent:
Individual Industries shall segregate effluent having high TDS low COD
and treat that stream separately.
High COD /Low TDS effluent:
Individual Industries shall segregate effluent having high COD Low TDS
and treat that stream separately.

NOTIFIED AREA AUTHORITY, ANKLESHWAR ENVIRONMENT IMPACT ASSESSMENT REPORT
EIA Report prepared by M/s. Aqua-Air Environmental Engineers Pvt. Ltd. 7- 7
Individual industrial units shall have their effluent collection and
effluent treatment plants for the treatment of their effluent to achieve
GPCB prescribed norms for inlet of FETP. After ETP, each industry shall
also install guard pond from which the individual industry will discharge
their partially treated effluent as per FETP inlet norms into effluent
drainage pipeline and the discharge point shall be above the drainage
chamber and the effluent shall have free fall into the chamber with a
sampling point for checking the effluent norms even from outside the
industrial premises. The schematic details of EFFLUENT DISCHARGE
SYSTEM AT INDIVIDUAL MEBER UNIT is shown in Annexure – 11.
The MEMBER shall comply with inlet norms of CETP at the discharge
point at member premises before discharging his raw effluent in the
Conveyance System.
The MEMBER units shall pay the bill raised by the CETP within 7 DAYS
time from the date of bill.
The MEMBER units shall pay any contribution required to fulfill the
economic liabilities of CETP pertaining to waste water, CETP and
related activities; as per the formula, derived and approved by the
Board of Directors, which may be notified from time to time.
The MEMBER shall pay and maintain interest free refundable Security
Deposit of minimum one and half month's billing or based on capital
investment, whichever is higher, until its membership is terminated or
it is decided by CETP to return the same to all MEMBERS.
The MEMBER shall get the consent from the Gujarat Pollution Control
Board directing the MEMBER to send its raw EFFLUENT to the chamber
of Effluent conveyance pipeline of GIDC for the member near its Gate
connected through pipeline up to inlet point of the CETP set up by GIDC
for treatment as per their standard procedure and norms.
MEMBER shall not discharge any effluent treated or untreated outside
his premises leading to any open drain or surface drain or nallah, which
shall be subject to verification and vigilance of CETP or any other

NOTIFIED AREA AUTHORITY, ANKLESHWAR ENVIRONMENT IMPACT ASSESSMENT REPORT
EIA Report prepared by M/s. Aqua-Air Environmental Engineers Pvt. Ltd. 7- 8
regulatory authority. The member shall maintain zero discharge; other
than CETP chamber; throughout the year. They shall provide necessary
provisions/facilities to take care of additional water in rainy seasons.
In the event of CETP break down, the member will immediately close
down its unit and stop discharging the effluents.
The Member shall ensure that chemicals, solvents and other toxic
chemicals giving rise to refractory COD, are not discharged in CETP,
concentrated wastes having high COD and high TDS are separately
treated in either incineration system or MEE or any other suitable
system as per consent condition.
The MEMBER declares that the MEMBER shall make all arrangements
and installations for the measurement of flow of the EFFLUENT and
shall be open to inspection by CETP.
CETP shall reserve its right to amend/change the inlet norms of raw
EFFLUENT from the MEMBER, if the MEMBER'S EFFLUENT is found to
affect the performance of the CETP in achieving the treated effluent
norms prescribed by GPCB or any other regulatory authority.
The MEMBER shall make all proper and adequate arrangements for
keeping accurate and classified daily log book records of production,
daily water consumption and daily waste water generation and daily
waste water discharge to CETP and send the compiled records to the
CETP; for compilation and submission to GPCB. In case of change in
product or manufacturing process/route, the MEMBER shall also
inform CETP in advance and get confirmation for the acceptability of
EFFLUENT for treatment in CETP.
The MEMBER shall make adequate arrangements at its own cost as
approved by and to the satisfaction of the CETP for flow measurement,
collection and storage of its raw EFFLUENT in its premises and shall give
access to the CETP to its storage facility for all 24/48 hours of the day
as the case may be.

NOTIFIED AREA AUTHORITY, ANKLESHWAR ENVIRONMENT IMPACT ASSESSMENT REPORT
EIA Report prepared by M/s. Aqua-Air Environmental Engineers Pvt. Ltd. 7- 9
The member shall stop the production and other activities generating
wastes water during the planned/ accidental shut down of CETP
operations; as per the instructions of CETP.
The member industry will make the MOU regarding the maximum
quantity of effluent to be sent to CETP for treatment along with quality.
The member shall put the metering System for their daily water
consumption from the GIDC/bore well and shall keep the records of
their water consumption.
Member shall not permit to any third party to join their line with
member's chamber inside its premises from which effluent is ultimately
discharged to Effluent Conveyance System. This includes the chamber
outside his gate which is his discharge point.
The member shall not be entitled to seek membership to any other
CETP and that shall consistently and permanently send the effluent to
CETP only.
Hence, the proposed project of 10 MLD CETP will have no significant adverse
impact on the receiving body or water environment of study area.
7.4.2.2.3. EFFLUENT QUALTIY MONITORING PLAN
TABLE-7.1
MONITORING PLAN
WATER ENVIRONMENT
Environmental Component
Sampling Point Parameters Duration/ frequency
Effluent Quality (at CETP)
Inlet Neutral Effluent
pH, COD, etc. Daily
After Primary Treatment
pH, COD, BOD3, TDS, TSS, Chlorides, Sulphates, Ammonical
Nitrogen, etc. i.e. Parameters prescribed by GPCB
Daily & Heavy Metal once in
month
After First Stage Aeration
Treatment
pH, COD, BOD3, TDS, TSS, Chlorides, Sulphates, Ammonical
Nitrogen, etc. i.e. Parameters prescribed by GPCB
Daily & Heavy Metal once in
month
After Second Stage Aeration
Treatment
pH, COD, BOD3, TDS, TSS, Chlorides, Sulphates, Ammonical
Daily & Heavy Metal once in
month

NOTIFIED AREA AUTHORITY, ANKLESHWAR ENVIRONMENT IMPACT ASSESSMENT REPORT
EIA Report prepared by M/s. Aqua-Air Environmental Engineers Pvt. Ltd. 7- 10
Nitrogen, etc. i.e. Parameters prescribed by GPCB
Final Outlet (After Tertiary
Treatment)
pH, COD, BOD3, TDS, TSS, Chlorides, Sulphates, Ammonical
Nitrogen, etc. i.e. Parameters prescribed by GPCB
Daily & Heavy Metal once in
month
7.4.2.2.4. RAIN WATER HARVESTING
7.4.2.2.4.1. During rainy season, the rain water will be collected
from roofs in underground tank having an adequate capacity and
the collected water will be used for process. Proper maintenance
of rainwater harvesting will be carried out. The following basic
details have been worked for the rain water harvesting:
Area of administrative building, m2 450
Total area available for water harvesting, m2 450
Average rain fall, mm 495
Total rain water can be harvested per year, m3 200.48
7.4.2.3. AIR ENVIRONMENT
Emission at 10 MLD CETP shall be in the form of the particulate matter and gases
from stack attached to D.G. Sets. Moreover, regular monitoring of stacks is
carried out to check the emissions. In case emission exceeds, the corrective
measures are immediately taken and records of the same shall be maintained.
Regular ambient air quality monitoring shall be carried out within premises and
nearby area for PM, RSPM, SO2 and NOX.
A greenbelt around the CETP shall be developed for reducing the air pollution
and attenuation of noise.
7.4.2.4. NOISE ENVIRONMENT
The sound pressure level, generated by noise source, decrease with increasing
distance from the source due to wave divergence. The propagation and
attenuation of noise pressure wave is dependent on many parameters amongst
which, the medium of travel and the ambient conditions are the most significant
parameters.

NOTIFIED AREA AUTHORITY, ANKLESHWAR ENVIRONMENT IMPACT ASSESSMENT REPORT
EIA Report prepared by M/s. Aqua-Air Environmental Engineers Pvt. Ltd. 7- 11
As per WHO recommendations, there is no risk of damage in hearing due to the
noise levels up to 75 dB(A) (Leq- 8 hrs), whereas OSHA specifies the same as 90
dB(A). This sound pressure levels are used to describe the exposure to noise in
workplace.
There may be small addition to the ambient noise level, due to the increased
transportation activities. This creates a slight adverse impact over the sound
environment.
Regular oiling, lubrication and maintenance of the equipments is carried out
to minimize noise generation.
However, due to the attenuation of noise level within the CETP no significant
impact is expected. The CETP shall develop a green belt within the premises,
which acts as a barrier to the propagation of noise from the factory premises.
It is recommended to measure and maintain records of noise level at various
places within and outside CETP premises.
Manufacturers/ suppliers of major noise generating equipment/ machines like
compressors, generators should be asked to take required measures for
minimizing the noise levels generated by machines by using noise absorbing
material for various enclosures or using appropriate design/ technology for
fabricating/ assembling the machines.
Audiometric tests should be conducted periodically for the employees working
close to the high noise sources.
7.4.2.5. LAND ENVIRONMENT
7.4.2.5.1. HAZARDOUS WASTE DISPOSAL
Three categories of hazardous wastes are generated from CETP. Mode
of disposal followed is as per HAZARDOUS AND OTHER WASTES
(MANAGEMENT AND & TRANSBOUNDARY MOVEMENT) RULES, 2016.
The hazardous wastes generated are ETP Sludge from Common
Effluent Treatment Plant, Used oil from lubrication of equipment,
Discarded Containers and Oil & Grease from skimming. These
Hazardous wastes are stored in scientifically designed and constructed
hazardous waste storage area within the premises. CETP sludge shall

NOTIFIED AREA AUTHORITY, ANKLESHWAR ENVIRONMENT IMPACT ASSESSMENT REPORT
EIA Report prepared by M/s. Aqua-Air Environmental Engineers Pvt. Ltd. 7- 12
be sent to Common TSDF of M/s. Bharuch Enviro Infrastructure Ltd.
(BEIL), Ankleshwar. Used oil shall be sold to registered refiners.
Discarded Containers shall be sold to GPCB approved recyclers. Oil &
Grease from skimming shall be sent to Common TSDF of M/s. Bharuch
Enviro Infrastructure Ltd. (BEIL), Ankleshwar.
STORAGE OF HAZARDOUS WASTE:
Hazardous waste shall be stored at a designated Onsite-secured area
that offers protection from sun, rain fall, spreading of leachate, mixing
of wastes etc.
Designated storage area with RCC flooring and cover shed shall be
provided for storage of Hazardous waste.
Hazardous waste shall not be stored for a period more than 90 days.
CETP shall maintain records and make them available for inspection.
Transportation of properly packed & labelled waste through dedicated
vehicle to a captive facility/ authorized TSDF facility.
Provision of solid/Hazardous waste collection system & storage area
confirming the guidelines provided by CPCB for Solid/hazardous waste
generation.
Regular Training of employees engaged in solid waste management
works.
7.4.2.6. GREEN BELT DEVELOPMENT
Tree plantation is one of the effective remedial measures to control the Air
pollution and noise pollution. It also causes aesthetics and climatologically
improvement of area as well as sustains and supports the biosphere. It is
an established fact that trees and vegetation acts as a vast natural sink for
the gaseous as well as particulate air pollutants due to enormous surface
area of leaves. It also helps to attenuate the ambient noise level. Plantation
around the pollution sources control the air pollution by filtering the air
particulate and interacting with gaseous pollutant before it reaches to the
ground. Tree plantation also acts as buffer and absorber against accidental
release of pollutants.
NOTIFIED AREA AUTHORITY, ANKLESHWAR ENVIRONMENT IMPACT ASSESSMENT REPORT
EIA Report prepared by M/s. Aqua-Air Environmental Engineers Pvt. Ltd. 7- 13
Each plant shows different air pollution tolerance level depending upon
numbers of factors. Air Pollution Tolerance Index (APTI) is calculated as
under
APTI = A (T + P) + R
10
Where
A Ascorbic Acid content mg/gm of dry weight
T Total chlorophyll in mg/gm of fresh weight
P pH of leaf extract
R Relative water content in %
The plant having more APTI is more tolerant to air pollution and preferred for
plantation.
In Green belt area about 1000 tree per acre of land as prescribed by Gujarat
Pollution Control Board shall be planted.
CETP shall develop 3400 m2 area covered as greenbelt and other forms of
greenery.
The selection of tree species suitable for plantation at the CETP shall be
governed by guiding factors as stated below
The trees should be tolerant to air pollutants present in the area
The trees should be able to grow and thrive on soil of the area, be evergreen,
inhabitant, having minimum of leaf fall.
The trees should be tall in peripheral curtain plantation and with large and
spreading canopy in primary and secondary attenuation zone.
The trees should possess extensive foliar area to provide maximum impinging
surface for continued efficient adsorption and absorption of pollutants.
The trees should be fast growing and indigenous and should maintain
ecological, land and hydrological balance of the region.
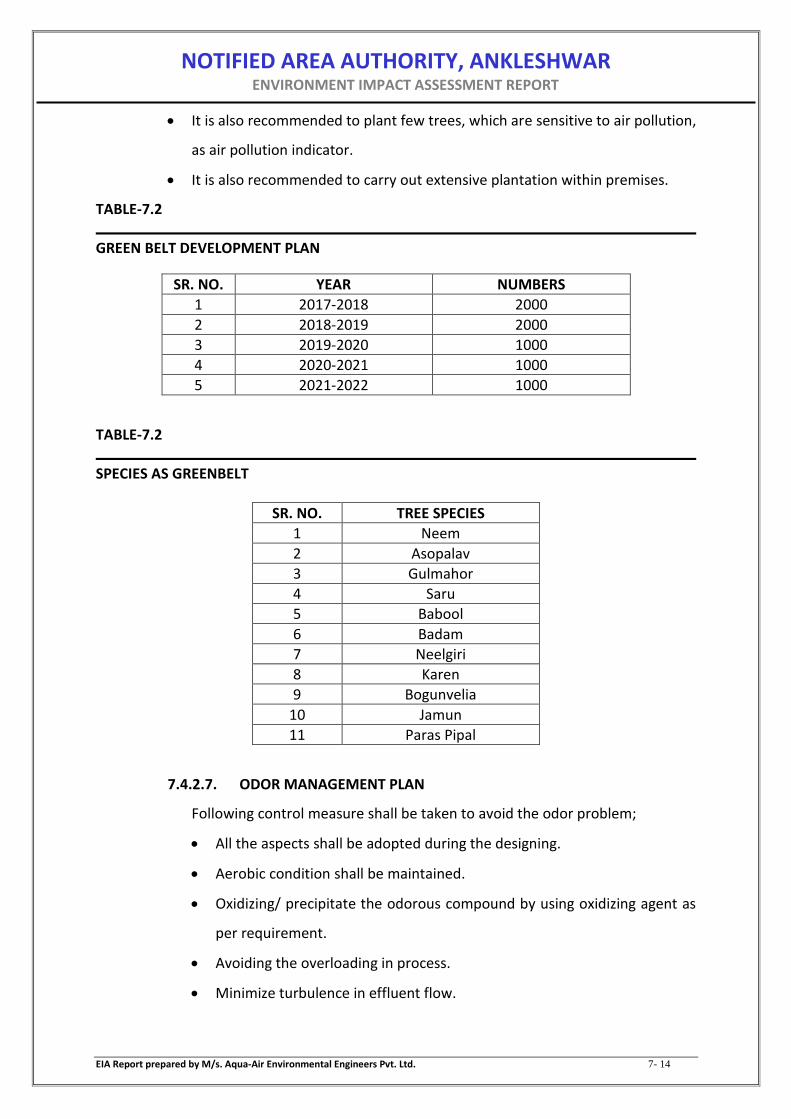
NOTIFIED AREA AUTHORITY, ANKLESHWAR ENVIRONMENT IMPACT ASSESSMENT REPORT
EIA Report prepared by M/s. Aqua-Air Environmental Engineers Pvt. Ltd. 7- 14
It is also recommended to plant few trees, which are sensitive to air pollution,
as air pollution indicator.
It is also recommended to carry out extensive plantation within premises.
TABLE-7.2
GREEN BELT DEVELOPMENT PLAN
SR. NO. YEAR NUMBERS
1 2017-2018 2000
2 2018-2019 2000
3 2019-2020 1000
4 2020-2021 1000
5 2021-2022 1000
TABLE-7.2
SPECIES AS GREENBELT
SR. NO. TREE SPECIES
1 Neem
2 Asopalav
3 Gulmahor
4 Saru
5 Babool
6 Badam
7 Neelgiri
8 Karen
9 Bogunvelia
10 Jamun
11 Paras Pipal
7.4.2.7. ODOR MANAGEMENT PLAN
Following control measure shall be taken to avoid the odor problem;
All the aspects shall be adopted during the designing.
Aerobic condition shall be maintained.
Oxidizing/ precipitate the odorous compound by using oxidizing agent as
per requirement.
Avoiding the overloading in process.
Minimize turbulence in effluent flow.

NOTIFIED AREA AUTHORITY, ANKLESHWAR ENVIRONMENT IMPACT ASSESSMENT REPORT
EIA Report prepared by M/s. Aqua-Air Environmental Engineers Pvt. Ltd. 7- 15
Avoiding the solids inventory and sludge backlog.
Controlling the release of aerosols.
Continuous disposal of sludge.
Proper operating condition is maintained.
Proper housekeeping is done.
Green belt is developed.
7.5. SOCIO ECONOMIC ACTIVITIES
To carry out above activities in the most efficient manner, Ankleshwar Industries
Association promoted Ankleshwar Industrial Development Society (AIDS), Ankleshwar
Environmental Preservation Society (AEPS), Sanskardeep Trust, Enviro Technology Ltd
(ETL) a common effluent treatment facility mainly for small scale industries, Bharuch
Enviro Infrastructure Ltd (BEIL) a combination of common solid waste disposal facility
(TSDF), common Multi Effect Evaporator (MME) and common incineration facility and
Narmada Clean Tech (formerly Bharuch Eco Aqua Infrastructure Ltd) (NCT) a final
effluent treatment plant for polishing cum disposal of treated effluent in to the deep
sea near Kantiyajal.
Highlights of various initiatives taken and activities carried out by Ankleshwar
Industries Association through these organizations are:
Social Infrastructure:-
1. Ankleshwar Industrial Development Society: This society runs:
(1)
Shree Gattu Vidyalaya, a school providing education to more than 2500 students from Junior KG to Higher Secondary with instructions in both English and Gujarati languages, is one of the best schools of the District

NOTIFIED AREA AUTHORITY, ANKLESHWAR ENVIRONMENT IMPACT ASSESSMENT REPORT
EIA Report prepared by M/s. Aqua-Air Environmental Engineers Pvt. Ltd. 7- 16
(2)
(3)
2. Sanskardeep:
Trust runs a Gujarati Medium School – Sanskardeep Vidyalaya – pre-primary to Secondary
level. More than 1500 students are studying in this school, which is one of the best schools of
the District, this is evident as in Board examinations, and some students regularly secure
position in State topper’s ‘list ten.
Smt. Jayaben Mody Hospital, a 80-bed full-fledged hospital is providing efficient health services not only to the industrial community, but also to the rural population.
D. A. Anandpura Sports & Cultural Centre is set up for providing sports, games and recreational activities to the industrial community of the area.
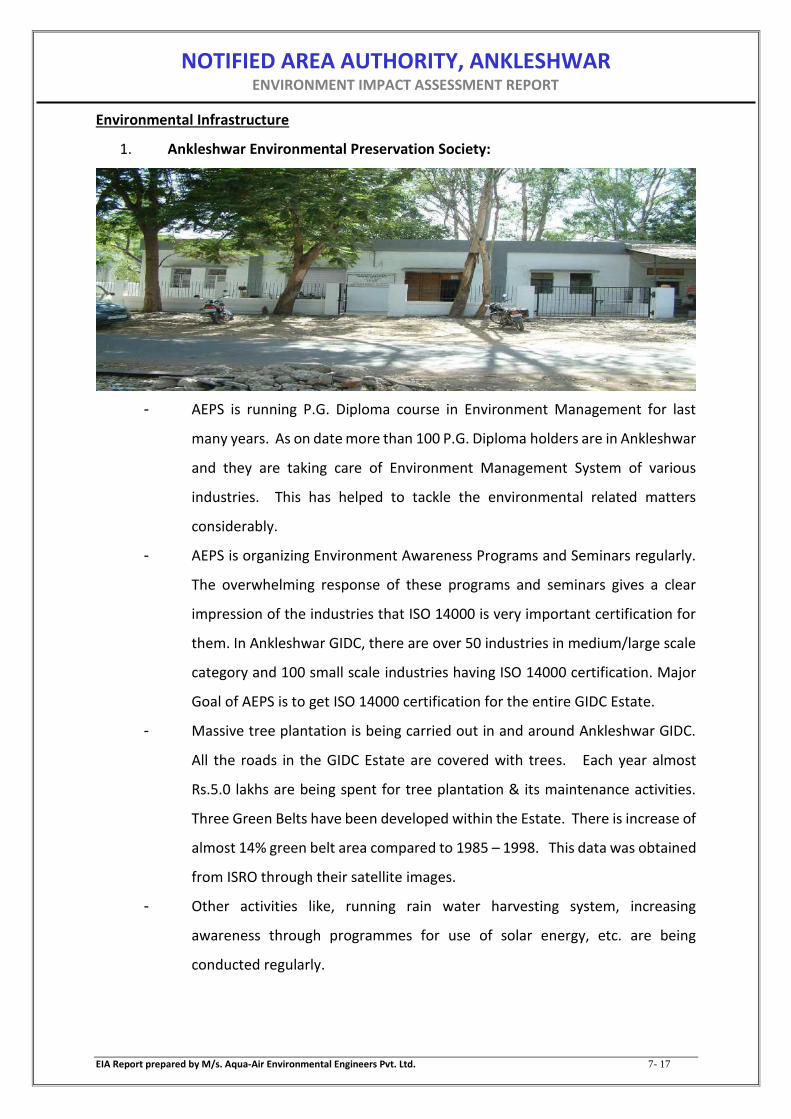
NOTIFIED AREA AUTHORITY, ANKLESHWAR ENVIRONMENT IMPACT ASSESSMENT REPORT
EIA Report prepared by M/s. Aqua-Air Environmental Engineers Pvt. Ltd. 7- 17
Environmental Infrastructure
1. Ankleshwar Environmental Preservation Society:
- AEPS is running P.G. Diploma course in Environment Management for last
many years. As on date more than 100 P.G. Diploma holders are in Ankleshwar
and they are taking care of Environment Management System of various
industries. This has helped to tackle the environmental related matters
considerably.
- AEPS is organizing Environment Awareness Programs and Seminars regularly.
The overwhelming response of these programs and seminars gives a clear
impression of the industries that ISO 14000 is very important certification for
them. In Ankleshwar GIDC, there are over 50 industries in medium/large scale
category and 100 small scale industries having ISO 14000 certification. Major
Goal of AEPS is to get ISO 14000 certification for the entire GIDC Estate.
- Massive tree plantation is being carried out in and around Ankleshwar GIDC.
All the roads in the GIDC Estate are covered with trees. Each year almost
Rs.5.0 lakhs are being spent for tree plantation & its maintenance activities.
Three Green Belts have been developed within the Estate. There is increase of
almost 14% green belt area compared to 1985 – 1998. This data was obtained
from ISRO through their satellite images.
- Other activities like, running rain water harvesting system, increasing
awareness through programmes for use of solar energy, etc. are being
conducted regularly.
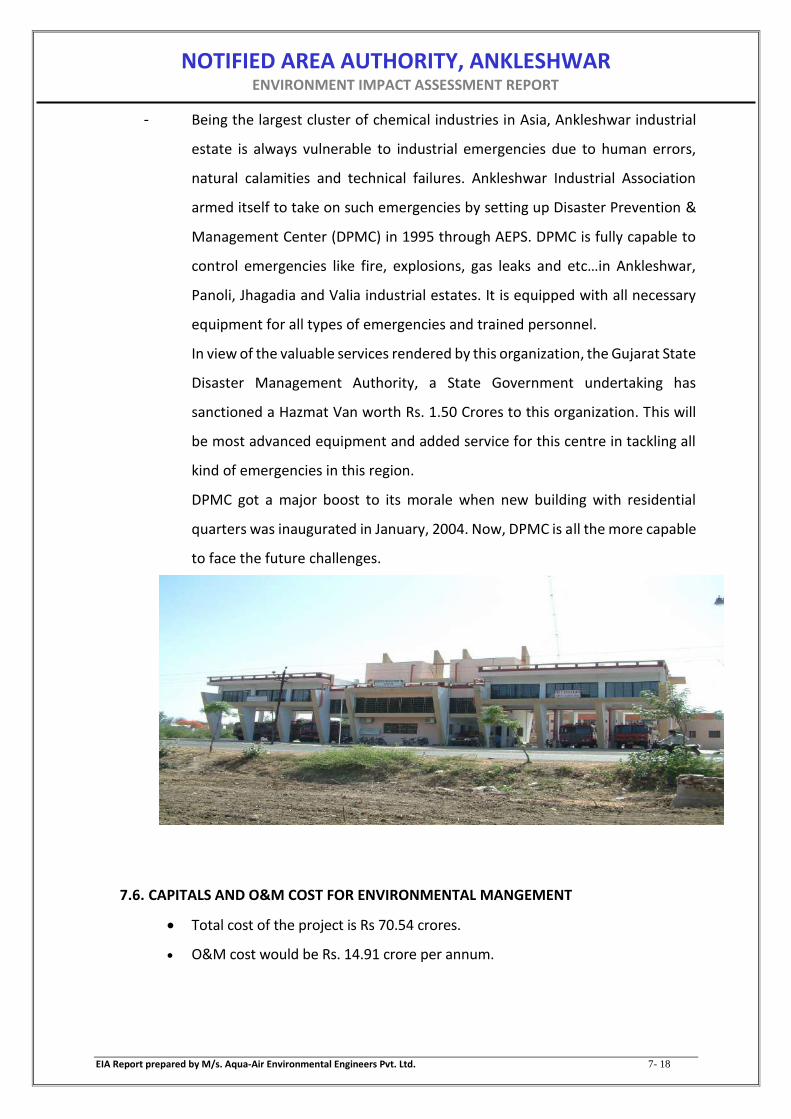
NOTIFIED AREA AUTHORITY, ANKLESHWAR ENVIRONMENT IMPACT ASSESSMENT REPORT
EIA Report prepared by M/s. Aqua-Air Environmental Engineers Pvt. Ltd. 7- 18
- Being the largest cluster of chemical industries in Asia, Ankleshwar industrial
estate is always vulnerable to industrial emergencies due to human errors,
natural calamities and technical failures. Ankleshwar Industrial Association
armed itself to take on such emergencies by setting up Disaster Prevention &
Management Center (DPMC) in 1995 through AEPS. DPMC is fully capable to
control emergencies like fire, explosions, gas leaks and etc…in Ankleshwar,
Panoli, Jhagadia and Valia industrial estates. It is equipped with all necessary
equipment for all types of emergencies and trained personnel.
In view of the valuable services rendered by this organization, the Gujarat State
Disaster Management Authority, a State Government undertaking has
sanctioned a Hazmat Van worth Rs. 1.50 Crores to this organization. This will
be most advanced equipment and added service for this centre in tackling all
kind of emergencies in this region.
DPMC got a major boost to its morale when new building with residential
quarters was inaugurated in January, 2004. Now, DPMC is all the more capable
to face the future challenges.
7.6. CAPITALS AND O&M COST FOR ENVIRONMENTAL MANGEMENT
Total cost of the project is Rs 70.54 crores.
O&M cost would be Rs. 14.91 crore per annum.
NOTIFIED AREA AUTHORITY, ANKLESHWAR ENVIRONMENT IMPACT ASSESSMENT REPORT
EIA Report prepared by M/s. Aqua-Air Environmental Engineers Pvt. Ltd. 8- 1
CHAPTER – 8 EXECUTIVE SUMMARY
8.1. Subject
The proposed 10 MLD CETP will be located at Plot No. U-5 (Utility Plot),
adjacent to existing 22.5 MLD STP, GIDC, Ankleshwar, Di. Bharuch, Gujarat.
Total premises area is 30,000 m2. Total cost of proposed project is Rs. 70.54
Crores.
8.2. Need and Justification of proposed expansion project.
At GIDC, Ankleshwar there are several small, medium and large scale industries in
operation. Also so many industries are planning for expansion of their existing unit
by increasing the production capacity or adding the new products. Also there are
new proposed industries to establish their manufacturing facility.
Looking to the above expansion and new industries scenario the total effluent
generation form the industrial estate going to increase.
The GIDC Ankleshwar is very old GIDC and 70% industrial units are Small Scale
Industries (SSI). The plot area of SSI are small and available space is limited. So it is
difficult to upgrade/modify existing ETP.
Presently, the effluent generated from the small scale industries within the
premises of GIDC Ankleshwar is either discharged directly into the FETP of NCT
through underground effluent conveyance pipeline or into CETP of ETL through
tankers and final pumping station. NCT treat the effluent and after achieving
discharge norms, dispose the treated effluent into deep Arabian Sea through 53 km
(Onshore Pipeline: 43.6 km + Offshore Pipeline: 9.4 km) effluent conveyance
pipeline.
Now, Medium and Large scale industries are having their own Effluent Treatment
Plant. Such industries are treating their effluent and discharging to GIDC drainage
line to FETP.
Small scale industries (SSI) have limited facilities for effluent treatment.
Hence, to treat the effluent from SSIs of GIDC, Ankleshwar; NAA of Ankleshwar
along with AWML proposed to set up a 10 MLD CETP. Looking to the current
scenario, it is proposed to set up CETP for 7.5 MLD Ind. Effluent + 2.5 MLD sewage
NOTIFIED AREA AUTHORITY, ANKLESHWAR ENVIRONMENT IMPACT ASSESSMENT REPORT
EIA Report prepared by M/s. Aqua-Air Environmental Engineers Pvt. Ltd. 8- 2
with primary, secondary and tertiary treatment facility. The proposed CETP shall
treat only the effluent from SSIs of GIDC Ankleshwar. The treated effluent from the
proposed CETP shall achieve the FETP norms and discharge the treated effluent to
FETP for further treatment and disposal.
Moreover, there are several advantages of CETP are,
o Professional and trained staff can be made available for operation of CETP, which
is not possible in case of individual plants.
o Disposal of treated wastewater & sludge becomes more organized.
o More organized and ease of monitoring for various regulatory authorities in
ensuring pollution control requirement.
o Small and medium scale industries are not required to treat their wastewater
separately.
o The Common treatment for effluent is cheaper than individual treatment. Hence,
saving in Capital and Operating cost of treatment plant for individuals.
o Benefits to small scale industries having limited space available for treatment of
effluent.
8.3. Project Details
SR. NO. Treatment Facility Proposed Capacity, MLD
1 Common Effluent Treatment Plant (CETP) 10
8.4. Raw Water Consumption
The total raw water requirement for proposed project of 10 MLD CETP, Ankleshwar
shall be 228 KL/day (Industrial: 180 KL/day + Domestic: 30 KL/day + Gardening: 18
KL/day) which shall be met through GIDC water supply.
8.5. Treated Effluent Handling, Treatment and Management
From CETP the treated effluent shall be pumped to existing Final pumping station
where the effluent from other pumping stations are mixed and finally pumped into
FETP of NCT for further treatment and finally dispose the treated effluent into deep
Arabian Sea through 53 km (Onshore Pipeline: 43.6 km + Offshore Pipeline: 9.4 km)
effluent conveyance pipeline with diffuser approx. 10 km in Sea.

NOTIFIED AREA AUTHORITY, ANKLESHWAR ENVIRONMENT IMPACT ASSESSMENT REPORT
EIA Report prepared by M/s. Aqua-Air Environmental Engineers Pvt. Ltd. 8- 3
8.6. Air Pollution Source and Control/Prevention Management
8.6.1. Flue gas emission:
8.6.1.1. The flue gas emission and its control measures are mentioned in Table-
8.1
TABLE- 8.1
DETAILS OF FLUE GAS EMISSION
Sr. No.
Stack attached
to
Stack height,
m
Type of
fuel
Fuel Cons., L/Hr
Emission Parameters
Unit Concentration Air Pollution
Control Equipment
1 D. G. Set – 1000 KVA
12.5 HSD 205
PM mg/Nm3 < 150 Stack with 12.5 m Height with Stack Monitoring Facility (SMF)
SO2 ppm < 100
NOx ppm < 50
8.6.2. Process gas emission:
8.6.2.1. Chlorine gas emission is likely to be generated form chlorine tonner in
case of leakage only. However, to take care of this leakage, caustic scrubber
along with safety hood shall be provided as Air Pollution Control equipment.
Detail is given in Table - 8.2.
TABLE- 8.2
DETAILS OF PROCESS GAS EMISSION
Sr. No.
Source of Emission
Type of Emission
Scrubber Stack
Height, m
Stack Diameter,
m
Outlet chlorine
conc.
1 Chlorine tonner safety hood
Chlorine gas
750 dia. x 5000 mm FRP common Scrubber with alkali circulation
tank, pump and blower 10 0.1
5 mg/nm3
8.7. Solid/Hazardous Waste, Handling and Mode of Disposal
Handle and management solid/hazardous waste storage and disposal is and will be as
per Hazardous and Other Wastes (Management & Transboundary Movement) Rules,
2016.

NOTIFIED AREA AUTHORITY, ANKLESHWAR ENVIRONMENT IMPACT ASSESSMENT REPORT
EIA Report prepared by M/s. Aqua-Air Environmental Engineers Pvt. Ltd. 8- 4
TABLE- 8.3
SOLID & HAZARDOUS WASTE GENERATION QUANTITY AND CATEGRORY
Sr. No.
Particulars Unit Category Quantity Hazardous waste
disposal/Management
1 ETP Sludge MT/month I - 35.3 900 Collection, Storage, Transportation & Disposal by TSDF
2 Used Oil Lit/year I - 5.1 100 Collection, Storage, Transportation & Disposal by selling to registered refiners.
3 Discarded Drums kg/month I - 33.3 200 Collection, Storage, Transportation & Disposal by GPCB/CPCB/MoEF approved recyclers.
4 Oil & Graese skimming
MT/month I - 35.4 1.5
Collection, Storage, Transportation & Disposal by selling to registered refiners or to Common Incineration of TSDF.
8.8. Noise Level Control/Prevention Measures
Extensive oiling and lubrication and preventive maintenance are carried out to reduce
noise generation at source to the permissible limit. Manufacturers/suppliers of major
noise generating equipment/machines like compressors, generators should be asked
to take required measures for minimizing the noise levels generated by machines by
using noise absorbing material for various enclosures or using appropriate design/
technology for fabricating/ assembling the machines. However, at place where noise
levels can exceed the permissible limit, Earplugs and Earmuffs are provided to those
working in such area. Audiometric tests should be conducted periodically for the
employees working close to the high noise sources. This system will follow after
proposed expansion. Adequate plantation has done to control noise level at site.
8.9. POST PROJECT MONITORING PLAN
Environmental Component
Parameters Standards Duration / Frequency
Air Environment
AAQM at plant site SPM, RSPM, SO2, NOx, in Ambient Air Quality
Prescribed by CPCB
Once a week through NABL accredited laboratory.
Stack emission monitoring of emissions sources
Parameters prescribed by CPCB for stack emissions
Prescribed by CPCB
Once in a weekly / fortnightly Once in six months by NABL accredited laboratory.
NOTIFIED AREA AUTHORITY, ANKLESHWAR ENVIRONMENT IMPACT ASSESSMENT REPORT
EIA Report prepared by M/s. Aqua-Air Environmental Engineers Pvt. Ltd. 8- 5
Fugitive emissions monitoring within the plant side
VOC Prescribed by CPCB
Every Day
Water Environment
Analysis of treated effluent
Parameters prescribed by CPCB
Prescribed by CPCB
Daily by Company Once in a Quarter by NABL accredited laboratory.
Ground water quality - As per drinking water quality Standards
Once in a season
Surface water quality pH, TDS, TSS, Sulphate, Chloride, Colour, BOD3, COD, Oil and Grease
Water use based standards of CPCB
Once in a season
Environmental Component
Parameters Standards Duration / Frequency
Noise Environment
Noise Noise level in db(A) leq As per national noise standards
Once in quarter by Company
Soil Environment
At plant site Analysis of pH, Sulphate, Calcium, Magnesium, Chlorides, Cyanides, Phenolic Compounds
-- Pre and post monsoon season by Company
In surrounding area Analysis of pH, Sulphate, Calcium, Magnesium, Chlorides, Cyanides, Phenolic Compounds
-- Pre and post monsoon season by Company
8.10. Green Belt
Total 30000 m2 land area is available at site; out of this area about 3400 m2
area shall be covered as greenbelt and other forms of greenery.
8.11. Power Requirements
The power requirement is met through 2500 KW connecting load of DGVCL
(GEB) and emergency standby Diesel Generator Set (1 nos.) of 1000 KVA.
8.12. Fuel requirement
Diesel is used as fuel at rate of 205 L/hr for D.G. Set which is used in emergency
only.
NOTIFIED AREA AUTHORITY, ANKLESHWAR ENVIRONMENT IMPACT ASSESSMENT REPORT
EIA Report prepared by M/s. Aqua-Air Environmental Engineers Pvt. Ltd. 8- 6
8.13. Storage details of Hazardous Chemicals and Control Measures.
Sr. No.
Name of the
chemical
Max. qty.
stored
Phase of chemical
Storage condition
Hazard involved
Measures to be taken
1 Chlorine 6 MT liquid Tonners Toxic
Stored at well ventilated cool and dry place, scrubbing facility, external breathing air supply, emergency handling kit
8.14. Capital and recurring cost earmarked for environmental protection measures
Total cost of the project is Rs 70.54 crores.
O&M cost would be Rs. 14.91 crore per annum.
8.15. Conclusion
The Environmental Impact Assessment (EIA) study for proposed 10 MLD CETP
project at Plot No. U-5 (Utility Plot), adjacent to existing 22.5 MLD STP, GIDC,
Ankleshwar, Di. Bharuch, Gujarat of NAA and AWML has been carried out with
respect to the Terms of Reference (TOR) granted by SEIAA, Gandhinagar dated
30/11/2017. All the impacts likely to have an effect on the environment have
been identified and efficient/adequate mitigation measures have been
proposed for the same.
Considering the probability of likely impacts, NAA and AWML has planned
adequate mitigation measures and Environment Management Plan (EMP).
Further, NAA and AWML has also planned CSR activities which will have
beneficial impacts on the socio-economic environment.
Measures like energy conservation and greenbelt development are also
noteworthy. Looking to the overall project scenario, employment potential
and allied development plans; it has been noticed that the proposed project
would significantly help in the improvement of the society and nation at large.
NAA and AWML is committed to implement all the pollution control measures
to protect surrounding environment. Also this project can definitely improve
the regional, state and national economy. Industrial growth is an indication of
socio economic development. The implementation of this project will
definitely improve the physical and social infrastructure of the area.

NOTIFIED AREA AUTHORITY, ANKLESHWAR ENVIRONMENT IMPACT ASSESSMENT REPORT
EIA Report prepared by M/s. Aqua-Air Environmental Engineers Pvt. Ltd. 8- 7
The proposed project will lead to growth in industrialization, development of
many new units as units will avail the combined treatment and disposal
facilities. Thus due to proposed project, safe and environmentally sustainable
mode of effluent treatment and disposal will be generated in GIDC,
Ankleshwar.
The growths in industrialization will in turn generate additional employment
opportunities.

NOTIFIED AREA AUTHORITY, ANKLESHWAR ENVIRONMENT IMPACT ASSESSMENT REPORT
M/S. AQUA – AIR ENVIRONMENTAL ENGINEERS PVT. LTD.
403, CENTER POINT, NR. KADIWALA SCHOOL,
RING ROAD, SURAT – 395002 (GUJARAT)
TEL: +91 (261) 2460854/2461241/3987173/3048586
TELEFAX: +91 (261) 2707273/3987273
EMAIL: [email protected]
WEBSITE: WWW.AQUA-AIR.CO.IN
9- 1
CHAPTER – 9
DISCLOSURE OF CONSULTANTS ENGAGED
Aqua-Air Environmental Engineers Pvt. Ltd.
Environmental Management Consultants & Equipments Supplier
NABL Accredited Testing Laboratory
ISO 9001:2008 Certified Company

NOTIFIED AREA AUTHORITY, ANKLESHWAR ENVIRONMENT IMPACT ASSESSMENT REPORT
M/S. AQUA – AIR ENVIRONMENTAL ENGINEERS PVT. LTD.
403, CENTER POINT, NR. KADIWALA SCHOOL,
RING ROAD, SURAT – 395002 (GUJARAT)
TEL: +91 (261) 2460854/2461241/3987173/3048586
TELEFAX: +91 (261) 2707273/3987273
EMAIL: [email protected]
WEBSITE: WWW.AQUA-AIR.CO.IN
9- 2
COMPANY PROFILE
Aqua-Air Environmental Engineers Pvt. Ltd. is a Surat based company; one of the leading and
multidiscipline Environmental Management Consulting firms of the region.
Aqua-Air Environmental Engineers Pvt. Ltd. was founded by Mr. Jayesh S. Patel & Mrs.
Archana J. Patel on May 7, 2008 and Aqua-Air Environmental Engineers Pvt. Ltd. was
registered under the companies Act on May 7, 2008.
Office having 3756 Sq. Ft. of area covering EC/EIA Department, R & D Centre (Environmental
Laboratory), Consent (NOC/CC&A) Department, ETP/Civil Department and Account
Department, Library, Conference room and Administration Department, etc. with
experienced and qualified staff to render services in the field of Environmental Management
of various types of industries.
Aqua-Air Environmental Engineers Pvt. Ltd. has a well-established track record in monitoring
legislation and developing and implementing strategies for organizations that enable them to
manage the impact of environmental issues on their business.
The company has built a reputation for delivering innovative and practical solutions to
environment related business issues. These solutions help our clients to achieve successful
business outcomes and make sustainable environment serving improvements within their
business operations.
Aqua-Air Environmental Engineers Pvt. Ltd. started the process for ISO/IEC 17025:2005
Accrediation by NABL, New Delhi for the Competence Testing & Calibration Laboratories on
June 24, 2008 and submitted the application (Version No. 10) to NABL, New Delhi for ISO/IEC
17025:2005 registration on October 7, 2008. After final assessment and Non-Conformances
resolved and corrective actions taken against the Non-Conformances, Laboratory Department

NOTIFIED AREA AUTHORITY, ANKLESHWAR ENVIRONMENT IMPACT ASSESSMENT REPORT
M/S. AQUA – AIR ENVIRONMENTAL ENGINEERS PVT. LTD.
403, CENTER POINT, NR. KADIWALA SCHOOL,
RING ROAD, SURAT – 395002 (GUJARAT)
TEL: +91 (261) 2460854/2461241/3987173/3048586
TELEFAX: +91 (261) 2707273/3987273
EMAIL: [email protected]
WEBSITE: WWW.AQUA-AIR.CO.IN
9- 3
- Aqua-Air Environmental Engineers Pvt. Ltd. was accredited with the certification of ISO/IEC
17025:2005 on October 19, 2010.
Aqua-Air Environmental Engineers Pvt. Ltd. started the process for ISO 9001:2008 registration
for Quality Management System on December 1, 2009 and submitted the application for ISO
9001:2008 registration on March 4, 2010. After final assessment, Aqua-Air Environmental
Engineers Pvt. Ltd. was certified from ANAB by M/s. Intertek System Certification on May 4,
2010.
Aqua-Air Environmental Engineers Pvt. Ltd. started the process for “EIA Consultant
Organization” accreditation under National Accreditation Board for Education And Training
(NABET)/Quality Council of India (QCI), New Delhi on January 7, 2010 and submitted the
application (Rev. 06) for “EIA Consultant Organization” accreditation under NABET, New Delhi
on April 8, 2010. Office assessment was done by external NABET/QCI auditors on Feb. 3 & 4,
2011. NABET/QCI closed the application of Aqua-Air Environmental Engineers Pvt. Ltd. on
March 15, 2011. Aqua-Air Environmental Engineers Pvt. Ltd. filed SCA in Hon’ble High Court
of Gujarat against MoEF, QCI & NABET, New Delhi on April 13, 2012. Hon’ble High Court of
Gujarat issued stay order against operation of all OMs (related to NABET/QCI Scheme) of
MoEF, New Delhi for the company on Jan. 24, 2013. MoEFCC, New published Notification
regarding mandatory implementation accreditation scheme of NABET/QCI on March 3, 2016.
Aqua-Air Environmental Engineers P. Ltd. along with 11 EIA Consultants of Gujarat filed SCA
No. 5312 of 2016 in Hon'ble High Court of Gujarat. Hon'ble High Court of Gujarat gave Stay
Order on Apr. 5, 2016 against implementation of Notification dated March 3, 2016 of MoEFCC,
New Delhi till further orders.
Aqua-Air Environmental Engineers Pvt. Ltd. received the Certificate of Registration of Trade
Mark, Section 23 (2), Rule 62 (1) from Trade Marks Registry, Govt. of India on January 18,
2011.
NOTIFIED AREA AUTHORITY, ANKLESHWAR ENVIRONMENT IMPACT ASSESSMENT REPORT
M/S. AQUA – AIR ENVIRONMENTAL ENGINEERS PVT. LTD.
403, CENTER POINT, NR. KADIWALA SCHOOL,
RING ROAD, SURAT – 395002 (GUJARAT)
TEL: +91 (261) 2460854/2461241/3987173/3048586
TELEFAX: +91 (261) 2707273/3987273
EMAIL: [email protected]
WEBSITE: WWW.AQUA-AIR.CO.IN
9- 4
The company’s work is spread all over Gujarat in India & Oman. Company have already
prepared 183 Form-1, 161 EIA & EMP reports, 143 Risk Assessment & DMP reports, conducted
73 Public Hearings and obtained 172 Environmental Clearances so far that includes Water
related Projects / Pesticide Industry Projects / Textile Industry Projects / Sugar Industry
Projects / Chemical Industries / Specialty Chemical Industry Projects / Bulk Drug (API) Industry
Projects / Chemical Fertilizer Industry Projects / Cement Plants / Thermal Power Plants /
Mining Projects / Infrastructure Projects / Construction Projects / Distilleries / Petrochemical
Industry Projects/ SEZ Projects/ CRZ Projects, etc.
Company's NABL Accredited Testing Laboratory has conducted Environmental Monitoring &
Analysis with Environmental Institute and Gujarat Pollution Control Board in Industrial Estates
of Ankleshwar, Panoli & Jhagadia. Company is also doing Turnkey/Consulting Projects for M/s.
BASF (Detail Engineering for Effluent Treatment Plant) & M/s. Reva Proteins Ltd. (Design of
Effluent Treatment Plant, supply of mechanical items, Commissioning and operation of
Effluent Treatment Plant).
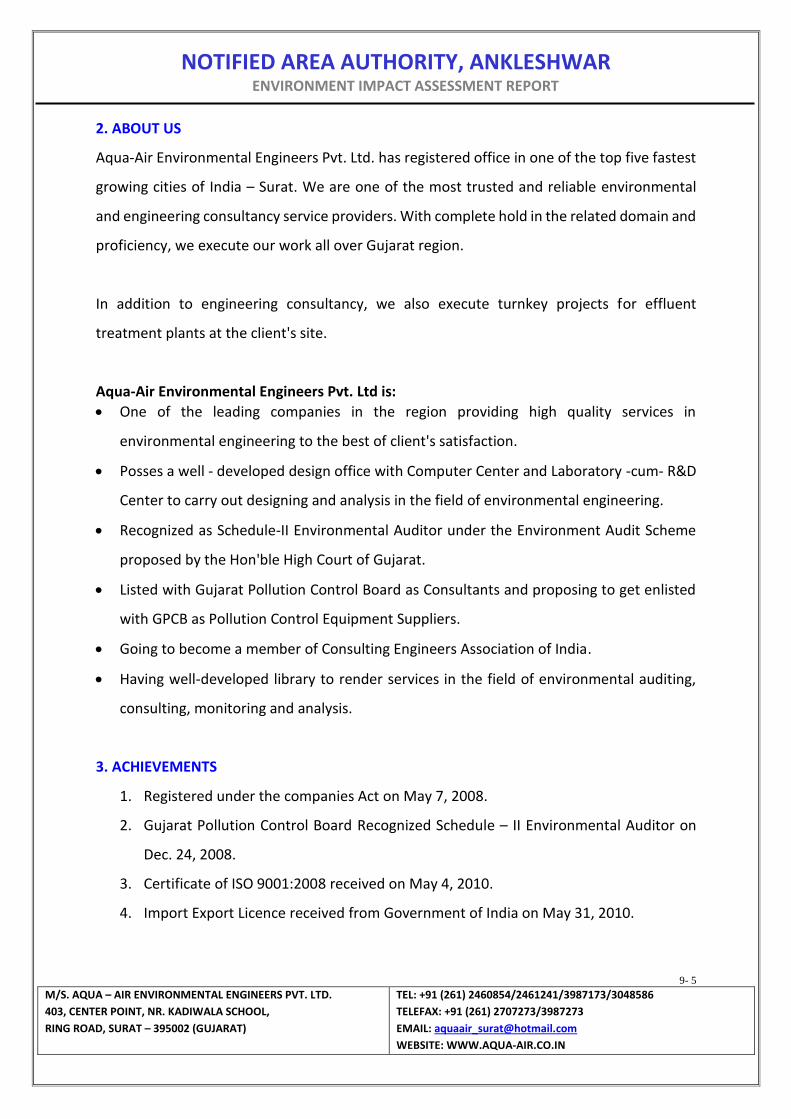
NOTIFIED AREA AUTHORITY, ANKLESHWAR ENVIRONMENT IMPACT ASSESSMENT REPORT
M/S. AQUA – AIR ENVIRONMENTAL ENGINEERS PVT. LTD.
403, CENTER POINT, NR. KADIWALA SCHOOL,
RING ROAD, SURAT – 395002 (GUJARAT)
TEL: +91 (261) 2460854/2461241/3987173/3048586
TELEFAX: +91 (261) 2707273/3987273
EMAIL: [email protected]
WEBSITE: WWW.AQUA-AIR.CO.IN
9- 5
2. ABOUT US
Aqua-Air Environmental Engineers Pvt. Ltd. has registered office in one of the top five fastest
growing cities of India – Surat. We are one of the most trusted and reliable environmental
and engineering consultancy service providers. With complete hold in the related domain and
proficiency, we execute our work all over Gujarat region.
In addition to engineering consultancy, we also execute turnkey projects for effluent
treatment plants at the client's site.
Aqua-Air Environmental Engineers Pvt. Ltd is:
One of the leading companies in the region providing high quality services in
environmental engineering to the best of client's satisfaction.
Posses a well - developed design office with Computer Center and Laboratory -cum- R&D
Center to carry out designing and analysis in the field of environmental engineering.
Recognized as Schedule-II Environmental Auditor under the Environment Audit Scheme
proposed by the Hon'ble High Court of Gujarat.
Listed with Gujarat Pollution Control Board as Consultants and proposing to get enlisted
with GPCB as Pollution Control Equipment Suppliers.
Going to become a member of Consulting Engineers Association of India.
Having well-developed library to render services in the field of environmental auditing,
consulting, monitoring and analysis.
3. ACHIEVEMENTS
1. Registered under the companies Act on May 7, 2008.
2. Gujarat Pollution Control Board Recognized Schedule – II Environmental Auditor on
Dec. 24, 2008.
3. Certificate of ISO 9001:2008 received on May 4, 2010.
4. Import Export Licence received from Government of India on May 31, 2010.

NOTIFIED AREA AUTHORITY, ANKLESHWAR ENVIRONMENT IMPACT ASSESSMENT REPORT
M/S. AQUA – AIR ENVIRONMENTAL ENGINEERS PVT. LTD.
403, CENTER POINT, NR. KADIWALA SCHOOL,
RING ROAD, SURAT – 395002 (GUJARAT)
TEL: +91 (261) 2460854/2461241/3987173/3048586
TELEFAX: +91 (261) 2707273/3987273
EMAIL: [email protected]
WEBSITE: WWW.AQUA-AIR.CO.IN
9- 6
5. Solvency Certificate of Rs. 1,40,00,000/- received from Bank of India, Gopipura branch,
Surat on Sept. 3, 2010.
6. Certificate of National Accreditation Board for Testing and Calibration Laboratories
(NABL) received on Oct. 15, 2010.
7. Certificate of Registration of Trade Mark, Section 23 (2), Rule 62 (1) from Trade Marks
Registry, Govt. of India on Jan. 18, 2011.
8. Certificate of Authorization as dealer in India received from Spectrum Technologies,
Inc., USA on May 1, 2011.
9. Gujarat Pollution Control Board Recognized Schedule – II Environmental Auditor on
May 6, 2011.
4. SERVICE PROVIDE
M/s. AQUA-AIR ENVIRONMENTAL ENGINEERS PVT. LTD. offers following specialized services
in Environmental Engineering, Water Supply Engineering and Civil Engineering.
4.1 TURN KEY/BOOT/BOO PROJECTS
4.1.1 ENVIRONMENTAL ENGINEERING
Detailed design Water Treatment Plants (WTPs) Construction Common Effluent Treatment Plants (CETPs) Fabrication Recycling Plants (RPs) Piping Zero Discharge Plants (ZDPs) Electrification Incineration System Plants (ISPs) Supply Hazardous waste Storage areas (HWSAs) Erection Secured/ Sanitary Landfill Facilities Testing and Commissioning of Effluent Treatment Plants (ETPs)
Bio–Medical Waste (BMW) Treatment Facilities on a turnkey or BOOT/BOO basis.
Sewage Treatment Plants (STPs)
4.1.2 CIVIL ENGINEERING
Construction of
Water Treatment Plan Elevated Service Reservoirs (ESRs) Sewage Treatment plant Underground Reservoirs (UGRs) Industrial Wastewater Treatment plant Sewage Pumping Stations, etc.
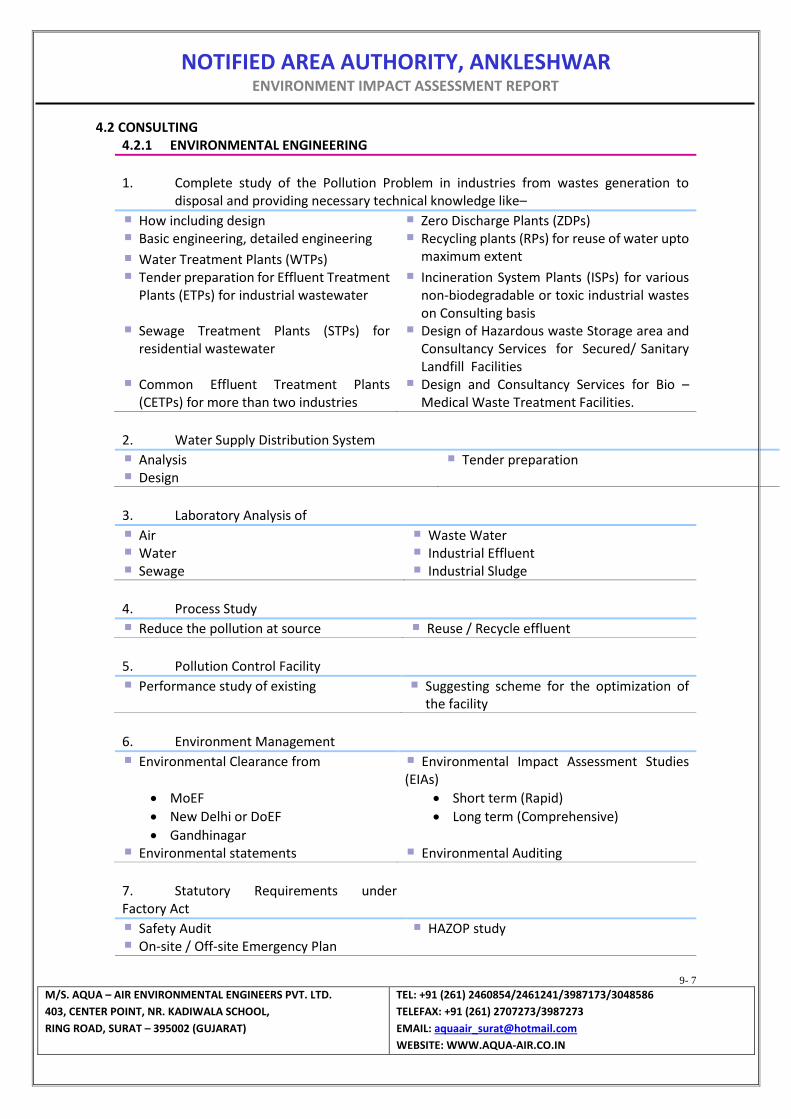
NOTIFIED AREA AUTHORITY, ANKLESHWAR ENVIRONMENT IMPACT ASSESSMENT REPORT
M/S. AQUA – AIR ENVIRONMENTAL ENGINEERS PVT. LTD.
403, CENTER POINT, NR. KADIWALA SCHOOL,
RING ROAD, SURAT – 395002 (GUJARAT)
TEL: +91 (261) 2460854/2461241/3987173/3048586
TELEFAX: +91 (261) 2707273/3987273
EMAIL: [email protected]
WEBSITE: WWW.AQUA-AIR.CO.IN
9- 7
4.2 CONSULTING 4.2.1 ENVIRONMENTAL ENGINEERING
1. Complete study of the Pollution Problem in industries from wastes generation to
disposal and providing necessary technical knowledge like–
How including design Zero Discharge Plants (ZDPs) Basic engineering, detailed engineering Recycling plants (RPs) for reuse of water upto
maximum extent Water Treatment Plants (WTPs) Tender preparation for Effluent Treatment Plants (ETPs) for industrial wastewater
Incineration System Plants (ISPs) for various non-biodegradable or toxic industrial wastes on Consulting basis
Sewage Treatment Plants (STPs) for residential wastewater
Design of Hazardous waste Storage area and Consultancy Services for Secured/ Sanitary Landfill Facilities
Common Effluent Treatment Plants (CETPs) for more than two industries
Design and Consultancy Services for Bio – Medical Waste Treatment Facilities.
2. Water Supply Distribution System
Analysis Tender preparation Design
3. Laboratory Analysis of
Air Waste Water Water Industrial Effluent Sewage Industrial Sludge
4. Process Study
Reduce the pollution at source Reuse / Recycle effluent
5. Pollution Control Facility
Performance study of existing Suggesting scheme for the optimization of the facility
6. Environment Management
Environmental Clearance from Environmental Impact Assessment Studies (EIAs)
MoEF Short term (Rapid)
New Delhi or DoEF Long term (Comprehensive)
Gandhinagar
Environmental statements Environmental Auditing
7. Statutory Requirements under Factory Act
Safety Audit HAZOP study On-site / Off-site Emergency Plan

NOTIFIED AREA AUTHORITY, ANKLESHWAR ENVIRONMENT IMPACT ASSESSMENT REPORT
M/S. AQUA – AIR ENVIRONMENTAL ENGINEERS PVT. LTD.
403, CENTER POINT, NR. KADIWALA SCHOOL,
RING ROAD, SURAT – 395002 (GUJARAT)
TEL: +91 (261) 2460854/2461241/3987173/3048586
TELEFAX: +91 (261) 2707273/3987273
EMAIL: [email protected]
WEBSITE: WWW.AQUA-AIR.CO.IN
9- 8
8. For Various Energy Conservation Schemes
Energy Audit Design
9. Environmental Management System
Preparing Adequacy Report Preparing Efficacy Report
10. Operation and Maintenance (O & M)
Effluent Treatment Plants (ETPs) Water Treatment Plants (WTPs) Sewage Treatment Plants (STPs)
11. Air Monitoring
Ambient Air Stack Vent
12. Design of Pollution Control Equipment
Cyclone Flash mixers Scrubbers Reaction Vessels Bag Filters, fume extraction systems Clariflocculators Blowers Scrapper Mechanisms Aerators Incinerators Agitators Scrubbers, etc.
13. Pollution Control
Effluent Survey Feasibility Studies Environmental review of Pollution control
equipment and systems Laboratory bench scale Treatability studies Pilot Plant studies etc.
14. Consulting Service
NOC Air Consent Water Consent Hazardous Waste Authorization Application,
etc.
15. As per requirements under Factory Act-1948 and Gujarat Factory Rules
Monitoring filling up Form-37 Analysis of Work Area Environment
16. Technical Consultation & assistance to ensure and assure compete Environ-Legal compliance
Liaison with statutory bodies in order to get the required permits
Clearance Consents

NOTIFIED AREA AUTHORITY, ANKLESHWAR ENVIRONMENT IMPACT ASSESSMENT REPORT
M/S. AQUA – AIR ENVIRONMENTAL ENGINEERS PVT. LTD.
403, CENTER POINT, NR. KADIWALA SCHOOL,
RING ROAD, SURAT – 395002 (GUJARAT)
TEL: +91 (261) 2460854/2461241/3987173/3048586
TELEFAX: +91 (261) 2707273/3987273
EMAIL: [email protected]
WEBSITE: WWW.AQUA-AIR.CO.IN
9- 9
4.3 EQUIPMENT MFG. /TRADING
4.3.1 ENVIRONMENTAL ENGINEERING
1. Manufacture and supply of Pollution Control Equipment such as
Incinerators With scrubbers Dissolved Air Flotation (DAF) units Autoclaves Cyclone Hydro-claves Scrubbers Fixed Aerators Bag Filters Floating Aerators Oil Skimmers Submersible Aerators (EOLO2) Deoiler Pipes Submersible Mixers (RIO or BRIO) API separators Cascade Aerators Vacuum Drum filters Clarifier mechanisms Solid bowl centrifuges Agitators Filter presses Clariflocculator Belt filters Clariflocculator mechanism Reaction vessels Flash mixes Reverse Osmosis, etc. Oil skimmers

ANNEXURE – 1
NCTL permission for discharge
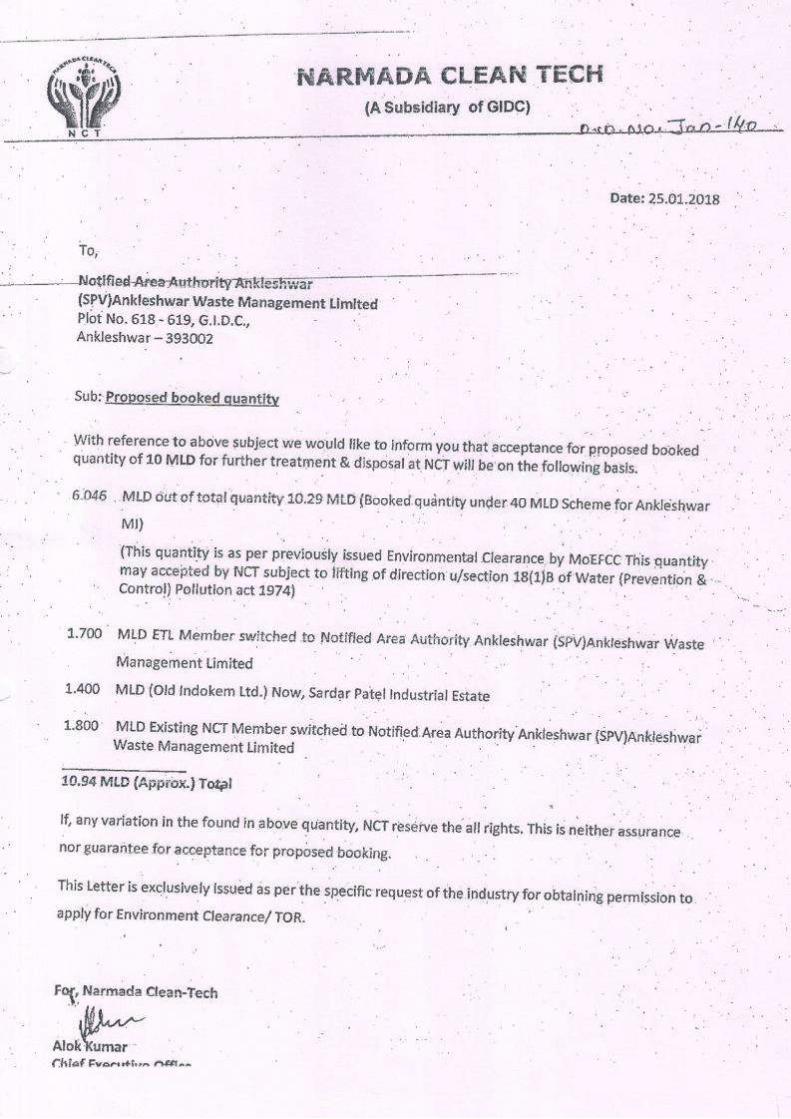

ANNEXURE – 2
Undertaking for No bore well


ANNEXURE – 3
Action by GPCB and response


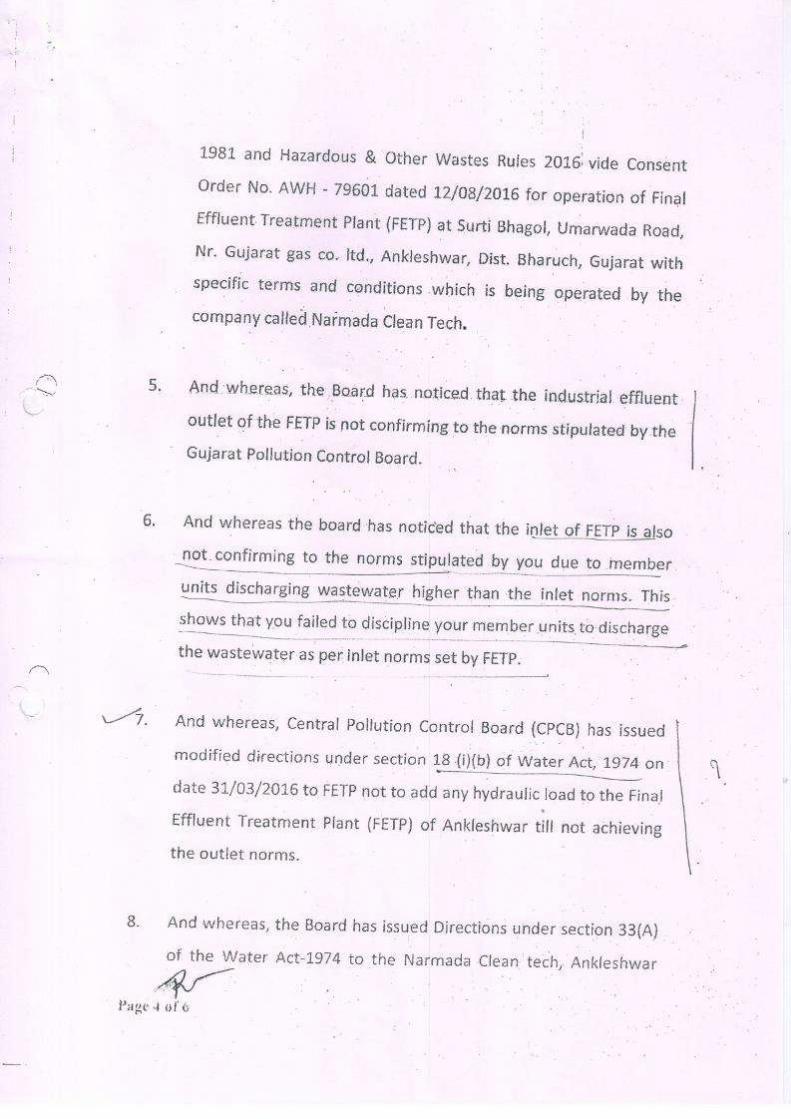
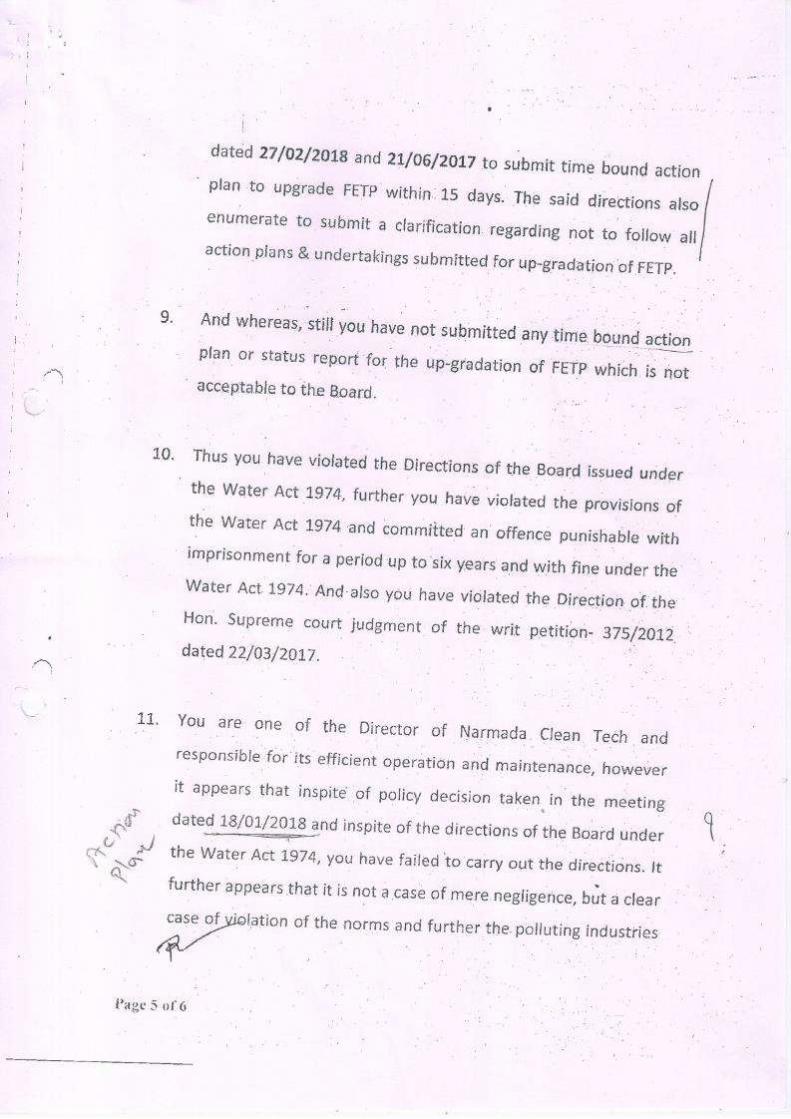


ANNEXURE – 4
Performance of FETP

ANK. PANOLI JHAGADIA INLET OUTLET
1-Oct-17 26.93 7.00 0.00 33.93 29.60 10.00 39.602-Oct-17 28.10 7.00 0.00 35.10 29.30 10.00 39.303-Oct-17 31.63 8.00 0.00 39.63 30.90 10.10 41.004-Oct-17 29.58 7.00 0.00 36.58 37.80 9.92 47.725-Oct-17 30.80 8.00 0.00 38.80 37.90 9.83 48.206-Oct-17 33.30 9.00 0.00 42.30 38.00 9.60 47.607-Oct-17 31.40 8.00 0.00 39.40 35.20 10.76 45.968-Oct-17 29.50 9.00 0.00 38.50 32.70 11.31 44.019-Oct-17 29.30 7.00 0.00 36.30 35.00 9.70 44.7010-Oct-17 32.50 9.00 0.00 41.50 37.30 10.90 48.2011-Oct-17 38.30 8.50 0.00 46.80 36.90 11.73 48.6312-Oct-17 36.90 6.00 0.00 42.90 38.10 11.05 49.1513-Oct-17 35.70 6.00 0.00 41.70 38.10 10.20 48.3014-Oct-17 35.30 7.00 0.00 42.30 38.90 11.30 50.2015-Oct-17 32.70 7.00 0.00 39.70 38.70 11.41 50.1116-Oct-17 32.20 6.00 0.00 38.20 40.20 11.20 51.4017-Oct-17 33.60 6.00 0.00 39.60 38.20 10.90 49.1018-Oct-17 26.50 6.00 0.00 32.50 32.20 10.95 43.1519-Oct-17 22.90 7.00 0.00 29.90 29.30 8.60 37.9020-Oct-17 20.00 6.00 0.00 26.00 24.80 7.10 31.9021-Oct-17 18.70 6.00 0.00 24.70 24.30 7.30 31.6022-Oct-17 20.30 5.00 0.00 25.30 23.10 9.90 33.0023-Oct-17 20.30 7.00 0.00 27.30 26.60 9.40 36.0024-Oct-17 21.80 5.00 0.00 26.80 25.00 9.50 34.5025-Oct-17 22.80 4.00 0.00 26.80 24.00 9.65 33.6526-Oct-17 23.60 5.00 0.00 28.60 24.10 10.27 34.3727-Oct-17 26.00 6.00 0.00 32.00 25.80 8.50 34.3028-Oct-17 23.40 5.00 0.00 28.40 27.30 9.40 36.7029-Oct-17 28.10 7.00 0.00 35.10 31.30 10.35 41.6530-Oct-17 27.80 7.00 0.00 34.80 33.40 10.50 43.9031-Oct-17 29.10 7.00 0.00 36.10 30.50 10.40 40.90
AVG. 28.36 6.73 0.00 35.08 32.08 10.06 42.15
MIN. 18.70 4.00 0.00 24.70 23.10 7.10 31.60MAX. 38.30 9.00 0.00 46.80 40.20 11.73 51.40
Analysis Report of FETP streams.
FLOW REPORT FOR THE MONTH OF OCT. - 2017
DATEFLOW MLD RESULTS JHA
DIRE.BPS
OUTLET

ANK. PANOLI JHAGADIA INLET OUTLET1-Oct-17 7.70 7.38 ~ 7.77 7.28 7.00 7.40
2-Oct-17 8.01 7.33 ~ 7.98 7.17 7.20 7.45
3-Oct-17 7.30 7.01 ~ 7.46 7.01 6.85 7.34
4-Oct-17 6.79 7.14 ~ 7.10 7.17 7.09 7.46
5-Oct-17 7.43 7.16 ~ 7.45 7.15 7.22 7.39
6-Oct-17 7.61 7.29 ~ 7.58 7.20 7.20 7.57
7-Oct-17 7.68 7.32 ~ 7.67 7.19 7.09 7.56
8-Oct-17 7.49 7.38 ~ 7.59 7.24 7.44 7.48
9-Oct-17 7.91 7.50 ~ 7.82 7.12 7.28 7.52
10-Oct-17 7.95 7.48 ~ 7.84 7.12 6.71 7.02
11-Oct-17 8.33 7.60 ~ 8.24 7.39 7.56 7.14
12-Oct-17 8.02 7.33 ~ 7.72 7.08 7.37 7.39
13-Oct-17 7.54 7.22 ~ 7.55 7.18 7.46 7.43
14-Oct-17 7.02 7.15 ~ 7.24 7.23 7.53 7.50
15-Oct-17 7.67 7.16 ~ 7.67 7.14 7.24 7.57
16-Oct-17 8.39 7.52 ~ 8.18 7.46 7.57 7.83
17-Oct-17 7.39 7.09 ~ 7.34 7.11 7.17 7.45
18-Oct-17 7.72 7.11 ~ 7.56 7.13 7.24 7.46
19-Oct-17 7.81 7.39 ~ 7.82 7.18 7.44 7.47
20-Oct-17 7.30 7.20 ~ 7.46 6.98 6.58 7.39
21-Oct-17 8.04 7.58 ~ 8.01 7.15 7.19 7.45
22-Oct-17 8.24 7.37 ~ 8.20 7.09 7.01 7.50
23-Oct-17 8.13 7.42 ~ 8.06 7.22 6.60 7.47
24-Oct-17 7.53 7.00 ~ 7.55 6.91 7.12 7.64
25-Oct-17 7.96 7.19 ~ 7.88 7.05 6.74 7.30
26-Oct-17 8.10 7.39 ~ 7.97 7.08 7.16 7.30
27-Oct-17 7.23 7.11 ~ 7.71 7.10 6.89 7.20
28-Oct-17 7.38 6.98 ~ 7.32 7.00 6.97 7.24
29-Oct-17 7.32 7.13 ~ 7.40 7.09 6.86 7.27
30-Oct-17 7.76 7.34 ~ 7.83 7.14 7.24 7.36
31-Oct-17 7.96 7.20 ~ 7.91 6.88 7.23 7.36
AVG. 7.70 7.27 #DIV/0! 7.71 7.14 7.14 7.42MIN. 6.79 6.98 0.00 7.10 6.88 6.58 7.02MAX. 8.39 7.60 0.00 8.24 7.46 7.57 7.83
JHA DIRE.
BPS OUTLE
pH REPORT FOR THE MONTH OF OCT. - 2017
Analysis Report of FETP streams.
DATEpH RESULTS

ANK. PANOLI JHAGADIA INLET OUTLET1-Oct-17 1609 414 ~ 1354 717 254 5412-Oct-17 2112 304 ~ 1856 656 512 5923-Oct-17 2183 286 ~ 1832 637 254 5414-Oct-17 2473 305 ~ 2056 658 144 5145-Oct-17 2215 254 ~ 1896 685 127 5096-Oct-17 1888 336 ~ 1472 736 144 5607-Oct-17 1824 272 ~ 1536 720 96 5768-Oct-17 2368 320 ~ 1872 800 144 6089-Oct-17 1816 382 ~ 1625 764 430 60510-Oct-17 2560 384 ~ 1840 768 288 62411-Oct-17 1848 462 ~ 1784 748 143 58912-Oct-17 1616 416 ~ 1216 768 144 62413-Oct-17 1571 428 ~ 1412 777 111 61914-Oct-17 1702 481 ~ 1445 771 176 70615-Oct-17 1808 368 ~ 1600 656 112 56016-Oct-17 1872 400 ~ 1792 656 224 54417-Oct-17 2007 302 ~ 1784 557 175 47818-Oct-17 2432 320 ~ 2096 624 144 51219-Oct-17 2470 382 ~ 1976 605 191 50920-Oct-17 1944 366 ~ 1545 653 382 50921-Oct-17 1864 334 ~ 1561 637 605 55722-Oct-17 1744 336 ~ 1312 768 400 57623-Oct-17 2080 320 ~ 1744 704 208 51224-Oct-17 2364 349 ~ 1984 777 222 55525-Oct-17 2072 369 ~ 1911 738 192 54626-Oct-17 2016 384 ~ 1760 704 208 57627-Oct-17 2736 400 ~ 2144 752 640 52828-Oct-17 1768 462 ~ 1577 780 589 50929-Oct-17 2023 398 ~ 1752 828 239 60530-Oct-17 2507 333 ~ 2476 777 190 603
31-Oct-17 2473 546 ~ 2024 771 176 642
AVG. 2063 368 #DIV/0! 1749 716 254 565MIN. 1571 254 0 1216 557 96 478MAX. 2736 546 0 2476 828 640 706
COD REPORT FOR THE MONTH OF OCT. - 2017
Analysis Report of FETP streams.
DATECOD RESULTS JHA
DIRE.BPS
OUTLET

ANK. PANOLI JHAGADIA INLET OUTLET1-Oct-17 765 12 ~ 540 36 10 21
2-Oct-17 780 30 ~ 405 51 19 36
3-Oct-17 795 174 ~ 555 54 97 51
4-Oct-17 600 78 ~ 390 63 58 42
5-Oct-17 765 18 ~ 585 33 94 24
6-Oct-17 600 48 ~ 345 36 57 30
7-Oct-17 795 36 ~ 600 69 16 63
8-Oct-17 615 12 ~ 495 51 12 42
9-Oct-17 510 48 ~ 450 36 7 30
10-Oct-17 750 30 ~ 645 60 6 45
11-Oct-17 840 48 ~ 645 51 6 33
12-Oct-17 555 36 ~ 465 54 93 36
13-Oct-17 735 24 ~ 600 51 93 60
14-Oct-17 660 66 ~ 510 78 10 57
15-Oct-17 585 96 ~ 390 75 12 54
16-Oct-17 585 60 ~ 480 72 12 66
17-Oct-17 585 12 ~ 345 57 3 48
18-Oct-17 780 66 ~ 615 54 12 48
19-Oct-17 645 36 ~ 600 51 42 45
20-Oct-17 720 36 ~ 645 51 7 45
21-Oct-17 870 36 ~ 615 45 15 36
22-Oct-17 735 96 ~ 705 30 55 30
23-Oct-17 420 48 ~ 285 36 63 33
24-Oct-17 660 18 ~ 510 30 240 36
25-Oct-17 465 66 ~ 330 48 111 57
26-Oct-17 825 18 ~ 420 48 36 27
27-Oct-17 885 30 ~ 630 36 6 21
28-Oct-17 810 42 ~ 705 45 13 42
29-Oct-17 720 18 ~ 435 45 36 39
30-Oct-17 975 48 ~ 720 48 216 39
31-Oct-17 645 54 ~ 570 39 198 51
AVG. 699 46 #DIV/0! 524 49 53 42MIN. 420 12 0 285 30 3 21MAX. 975 174 0 720 78 240 66
JHA DIRE.
BPS OUTLET
BOD REPORT FOR THE MONTH OF OCT. - 2017
Analysis Report of FETP streams.
DATEBOD RESULTS

ANK. PANOLI JHAGADIA INLET OUTLET1-Oct-17 427 45 ~ 337 343 11 281
2-Oct-17 540 36 ~ 455 343 13 281
3-Oct-17 427 30 ~ 360 326 5 270
4-Oct-17 343 31 ~ 298 337 4 270
5-Oct-17 507 28 ~ 392 346 6 265
6-Oct-17 542 43 ~ 409 346 11 282
7-Oct-17 409 39 ~ 334 288 6 253
8-Oct-17 519 47 ~ 409 334 6 276
9-Oct-17 467 46 ~ 426 351 14 299
10-Oct-17 530 39 ~ 386 346 11 276
11-Oct-17 403 63 ~ 392 357 11 271
12-Oct-17 461 63 ~ 317 357 8 276
13-Oct-17 265 43 ~ 219 351 11 305
14-Oct-17 328 27 ~ 288 357 11 317
15-Oct-17 392 39 ~ 346 323 6 265
16-Oct-17 415 23 ~ 403 311 6 259
17-Oct-17 409 18 ~ 392 288 8 253
18-Oct-17 496 25 ~ 438 288 5 230
19-Oct-17 496 25 ~ 386 305 11 196
20-Oct-17 542 25 ~ 438 317 6 230
21-Oct-17 576 25 ~ 472 323 5 236
22-Oct-17 622 29 ~ 461 323 16 248
23-Oct-17 715 28 ~ 582 334 16 271
24-Oct-17 576 17 ~ 507 346 14 230
25-Oct-17 547 12 ~ 490 346 12 242
26-Oct-17 715 9 ~ 565 380 13 213
27-Oct-17 588 12 ~ 507 380 20 265
28-Oct-17 496 19 ~ 409 392 19 288
29-Oct-17 445 16 ~ 356 390 15 267
30-Oct-17 506 25 ~ 473 412 18 317
31-Oct-17 423 37 ~ 356 395 17 323
AVG. 488 31 #DIV/0! 407 343 11 266MIN. 265 9 0 219 288 4 196MAX. 715 63 0 582 412 20 323
Analysis Report of FETP streams.
NH3-N RESULTSDATE JHA
DIRE.BPS
OUTLET
NH3-N REPORT FOR THE MONTH OF OCT. - 2017
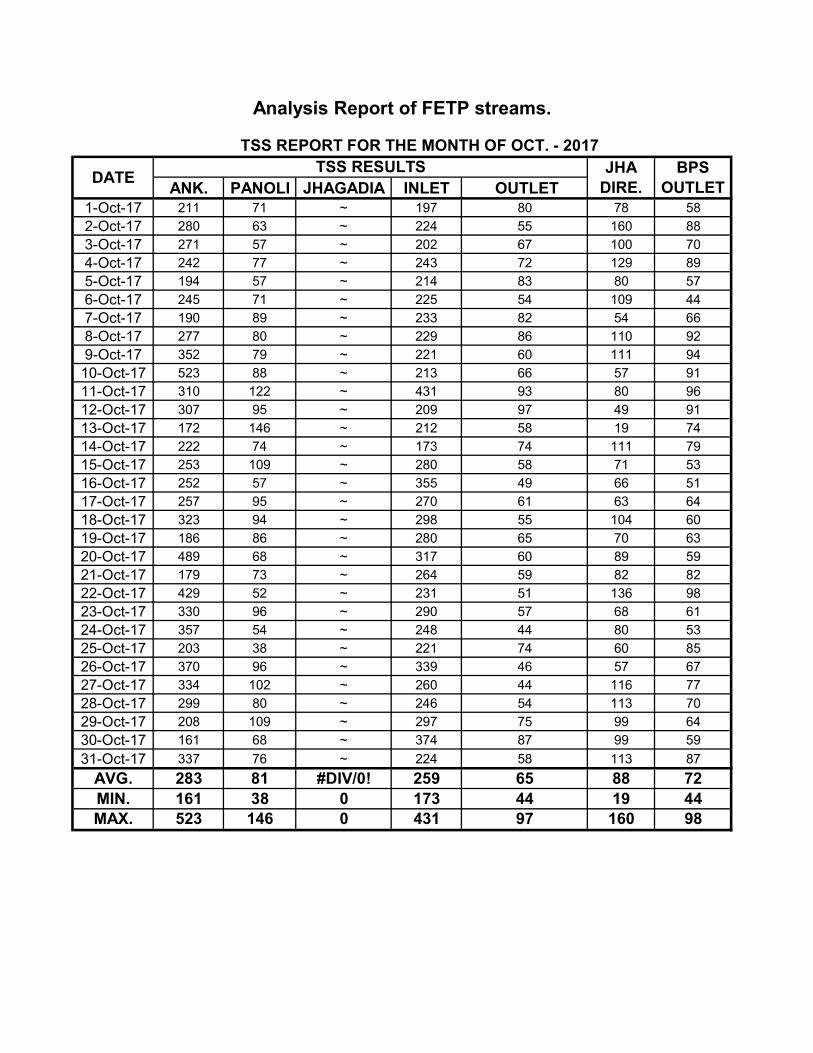
ANK. PANOLI JHAGADIA INLET OUTLET1-Oct-17 211 71 ~ 197 80 78 58
2-Oct-17 280 63 ~ 224 55 160 88
3-Oct-17 271 57 ~ 202 67 100 70
4-Oct-17 242 77 ~ 243 72 129 89
5-Oct-17 194 57 ~ 214 83 80 57
6-Oct-17 245 71 ~ 225 54 109 44
7-Oct-17 190 89 ~ 233 82 54 66
8-Oct-17 277 80 ~ 229 86 110 92
9-Oct-17 352 79 ~ 221 60 111 94
10-Oct-17 523 88 ~ 213 66 57 91
11-Oct-17 310 122 ~ 431 93 80 96
12-Oct-17 307 95 ~ 209 97 49 91
13-Oct-17 172 146 ~ 212 58 19 74
14-Oct-17 222 74 ~ 173 74 111 79
15-Oct-17 253 109 ~ 280 58 71 53
16-Oct-17 252 57 ~ 355 49 66 51
17-Oct-17 257 95 ~ 270 61 63 64
18-Oct-17 323 94 ~ 298 55 104 60
19-Oct-17 186 86 ~ 280 65 70 63
20-Oct-17 489 68 ~ 317 60 89 59
21-Oct-17 179 73 ~ 264 59 82 82
22-Oct-17 429 52 ~ 231 51 136 98
23-Oct-17 330 96 ~ 290 57 68 61
24-Oct-17 357 54 ~ 248 44 80 53
25-Oct-17 203 38 ~ 221 74 60 85
26-Oct-17 370 96 ~ 339 46 57 67
27-Oct-17 334 102 ~ 260 44 116 77
28-Oct-17 299 80 ~ 246 54 113 70
29-Oct-17 208 109 ~ 297 75 99 64
30-Oct-17 161 68 ~ 374 87 99 59
31-Oct-17 337 76 ~ 224 58 113 87
AVG. 283 81 #DIV/0! 259 65 88 72MIN. 161 38 0 173 44 19 44MAX. 523 146 0 431 97 160 98
DATETSS RESULTS JHA
DIRE.BPS
OUTLET
TSS REPORT FOR THE MONTH OF OCT. - 2017
Analysis Report of FETP streams.

ANK. PANOLI JHAGADIA INLET OUTLET1-Oct-17 11110 8920 ~ 10540 10500 7270 9590
2-Oct-17 12190 8710 ~ 11490 10940 8560 9930
3-Oct-17 10960 8860 ~ 10260 10930 8710 9840
4-Oct-17 10310 9330 ~ 10160 10900 8200 9900
5-Oct-17 11910 9310 ~ 11010 10620 7200 9710
6-Oct-17 11190 8640 ~ 10060 10630 7300 10120
7-Oct-17 10050 7760 ~ 9360 10220 8430 9740
8-Oct-17 12310 8900 ~ 11590 10980 8620 10080
9-Oct-17 11060 9700 ~ 11110 10850 8050 9810
10-Oct-17 11940 8470 ~ 10720 10580 6590 9850
11-Oct-17 10990 9030 ~ 10470 10530 6890 9880
12-Oct-17 10610 8590 ~ 9250 10750 7770 10200
13-Oct-17 9260 10080 ~ 9500 10610 8140 9750
14-Oct-17 8910 10010 ~ 9060 10330 8600 9760
15-Oct-17 9350 9530 ~ 9380 10110 8300 9720
16-Oct-17 9250 9550 ~ 9620 9710 8580 9450
17-Oct-17 10070 9190 ~ 9900 9470 8350 9300
18-Oct-17 10600 9760 ~ 10350 9310 9320 9120
19-Oct-17 12300 9180 ~ 11190 9650 9090 9060
20-Oct-17 11380 7760 ~ 10350 9950 8410 9360
21-Oct-17 12080 7000 ~ 10810 10120 6780 9520
22-Oct-17 10450 7100 ~ 9360 10230 8120 7780
23-Oct-17 10860 8100 ~ 10170 9960 8020 9430
24-Oct-17 11700 11240 ~ 11440 10350 8260 9650
25-Oct-17 11440 11590 ~ 11480 10460 8460 9200
26-Oct-17 11330 11410 ~ 11040 9830 8890 9070
27-Oct-17 10800 10230 ~ 10370 9050 7880 8080
28-Oct-17 10110 9426 ~ 9830 10200 7530 9270
29-Oct-17 10750 9070 ~ 10450 10590 7850 9710
30-Oct-17 12190 9350 ~ 11300 10400 7670 10060
31-Oct-17 10540 9890 ~ 10340 10550 7600 9990
AVG. 10903 9216 #DIV/0! 10386 10300 8046 9546MIN. 8910 7000 0 9060 9050 6590 7780MAX. 12310 11590 0 11590 10980 9320 10200
JHA DIRE.
BPS OUTLET
TDS REPORT FOR THE MONTH OF OCT. - 2017
Analysis Report of FETP streams.
DATETDS RESULTS

ANK. PANOLI JHAGADIA INLET OUTLET1-Nov-17 25.50 5.00 0.00 30.50 35.30 10.22 45.522-Nov-17 29.30 8.00 0.00 37.30 31.60 10.25 41.853-Nov-17 29.40 7.00 0.00 36.40 31.00 10.50 41.504-Nov-17 31.10 7.00 0.00 38.10 34.30 9.50 43.805-Nov-17 28.50 8.00 0.00 36.50 34.60 9.98 44.586-Nov-17 31.40 6.00 0.00 37.40 37.30 9.50 46.807-Nov-17 30.20 6.00 0.00 36.20 34.80 9.40 44.208-Nov-17 28.50 4.00 0.00 32.50 35.80 9.39 45.199-Nov-17 30.30 7.00 0.00 37.30 29.90 9.78 39.6810-Nov-17 28.70 5.00 0.00 33.70 32.10 9.60 41.7011-Nov-17 30.80 5.00 0.00 35.80 33.00 9.37 42.3712-Nov-17 30.50 7.00 0.00 37.50 36.10 9.87 45.9713-Nov-17 29.80 6.00 0.00 35.80 37.50 9.10 46.6014-Nov-17 28.30 5.00 0.00 33.30 35.00 9.30 44.3015-Nov-17 25.80 6.00 0.00 31.80 32.70 11.12 43.8216-Nov-17 21.50 8.00 0.00 29.50 27.60 10.57 38.1717-Nov-17 20.60 6.00 0.00 26.60 27.20 9.67 36.8718-Nov-17 22.90 7.00 0.00 29.90 27.00 9.87 36.8719-Nov-17 22.20 7.00 0.00 29.20 27.20 10.27 37.4720-Nov-17 22.70 5.00 0.00 27.70 26.70 10.00 36.7021-Nov-17 27.20 7.00 0.00 34.20 27.30 10.60 37.9022-Nov-17 28.20 4.00 0.00 32.20 32.10 10.08 42.1823-Nov-17 29.00 6.00 0.00 35.00 32.30 10.33 42.6324-Nov-17 25.80 6.00 0.00 31.80 32.70 10.60 43.3025-Nov-17 27.60 6.00 0.00 33.60 32.40 10.40 42.8026-Nov-17 26.30 4.00 0.00 30.30 31.80 10.63 42.4327-Nov-17 29.10 5.00 0.00 34.10 32.10 10.20 42.3028-Nov-17 31.10 5.00 0.00 36.10 31.00 10.49 41.4929-Nov-17 29.20 6.00 0.00 35.20 32.50 10.19 42.6930-Nov-17 28.60 5.00 0.00 33.60 30.30 9.38 39.68
AVG. 27.67 5.97 0.00 33.64 32.04 10.01 42.05MIN. 20.60 4.00 0.00 26.60 26.70 9.10 36.70MAX. 31.40 8.00 0.00 38.10 37.50 11.12 46.80
FLOW REPORT FOR THE MONTH OF NOV. - 2017
Analysis Report of FETP streams.
DATEFLOW MLD RESULTS
JHA DIRE.BPS
OUTLET

ANK. PANOLI JHAGADIA INLET OUTLET1-Nov-17 7.69 7.23 ~ 7.64 7.14 7.31 7.352-Nov-17 7.75 7.01 ~ 7.65 7.30 7.20 7.363-Nov-17 7.31 7.30 ~ 7.34 7.19 7.46 7.504-Nov-17 7.63 7.26 ~ 7.65 6.98 6.91 7.345-Nov-17 7.75 7.22 ~ 7.52 7.11 7.14 7.366-Nov-17 7.58 7.27 ~ 7.58 7.10 7.07 7.197-Nov-17 7.83 7.35 ~ 7.86 7.05 7.14 7.328-Nov-17 7.66 7.34 ~ 7.48 7.07 7.25 7.229-Nov-17 7.73 7.47 ~ 7.73 7.50 7.06 7.3910-Nov-17 7.13 7.18 ~ 7.29 7.05 6.62 7.2311-Nov-17 7.56 7.17 ~ 7.66 7.08 6.86 7.2412-Nov-17 7.00 7.38 ~ 7.64 7.00 6.89 7.2113-Nov-17 7.78 7.16 ~ 7.82 7.27 7.11 7.1314-Nov-17 7.56 7.35 ~ 7.74 7.36 6.86 7.1515-Nov-17 8.39 7.07 ~ 8.35 7.34 7.29 7.3716-Nov-17 8.07 7.66 ~ 8.08 7.54 7.07 7.2617-Nov-17 8.10 7.10 ~ 7.95 7.37 6.95 7.2418-Nov-17 7.66 7.08 ~ 7.49 7.22 7.17 7.4019-Nov-17 7.50 7.14 ~ 7.46 7.10 7.10 7.4320-Nov-17 7.83 7.27 ~ 7.64 7.24 7.09 7.3021-Nov-17 8.20 7.31 ~ 8.14 7.38 6.95 7.1822-Nov-17 8.11 7.13 ~ 8.07 7.43 7.23 7.3023-Nov-17 7.94 7.37 ~ 7.89 7.24 7.22 7.3124-Nov-17 7.32 7.44 ~ 7.50 7.16 7.20 7.2625-Nov-17 8.02 7.27 ~ 7.94 7.29 7.09 7.2026-Nov-17 7.28 7.32 ~ 7.36 7.34 7.08 7.3927-Nov-17 7.36 7.41 ~ 7.52 7.24 7.12 7.3128-Nov-17 7.11 7.25 ~ 7.36 7.23 7.00 7.2729-Nov-17 7.11 7.10 ~ 7.33 7.34 7.23 7.4430-Nov-17 7.03 6.91 ~ 7.13 7.30 7.13 7.44
AVG. 7.63 7.25 #DIV/0! 7.66 7.23 7.09 7.30MIN. 7.00 6.91 0.00 7.13 6.98 6.62 7.13MAX. 8.39 7.66 0.00 8.35 7.54 7.46 7.50
DATE
pH REPORT FOR THE MONTH OF NOV. - 2017
Analysis Report of FETP streams.
pH RESULTS JHA DIRE.
BPS OUTLET
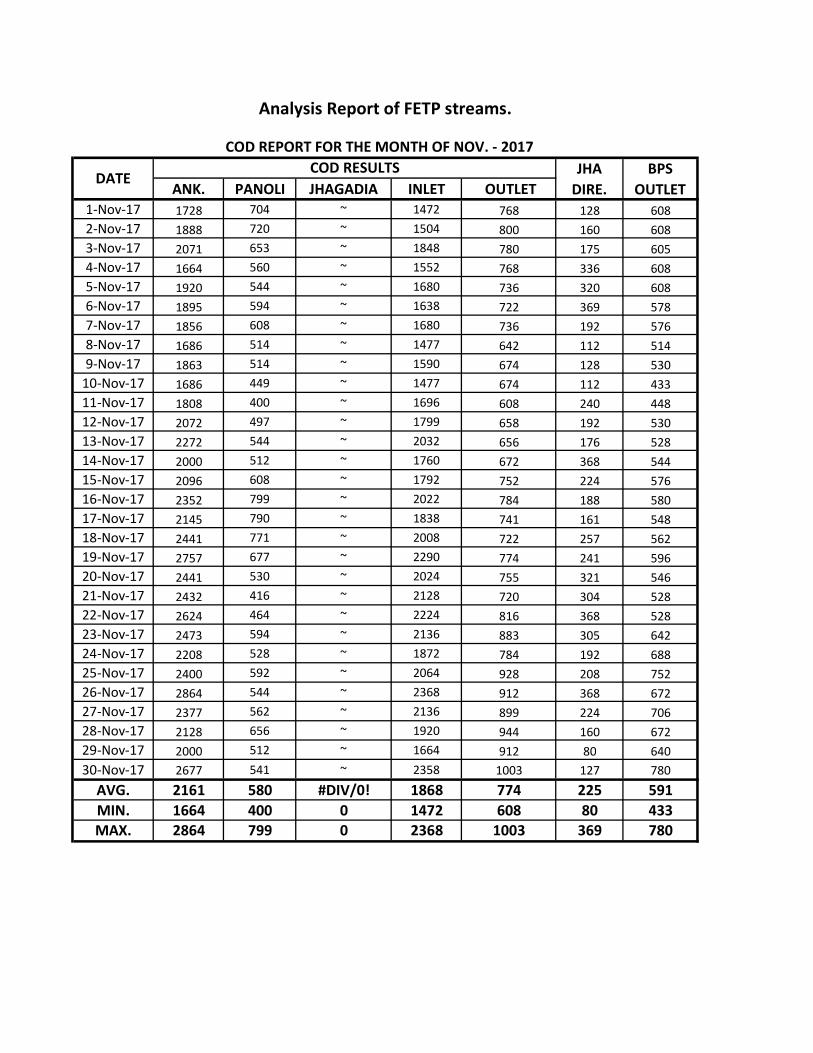
ANK. PANOLI JHAGADIA INLET OUTLET1-Nov-17 1728 704 ~ 1472 768 128 6082-Nov-17 1888 720 ~ 1504 800 160 6083-Nov-17 2071 653 ~ 1848 780 175 6054-Nov-17 1664 560 ~ 1552 768 336 6085-Nov-17 1920 544 ~ 1680 736 320 6086-Nov-17 1895 594 ~ 1638 722 369 5787-Nov-17 1856 608 ~ 1680 736 192 5768-Nov-17 1686 514 ~ 1477 642 112 5149-Nov-17 1863 514 ~ 1590 674 128 53010-Nov-17 1686 449 ~ 1477 674 112 43311-Nov-17 1808 400 ~ 1696 608 240 44812-Nov-17 2072 497 ~ 1799 658 192 53013-Nov-17 2272 544 ~ 2032 656 176 52814-Nov-17 2000 512 ~ 1760 672 368 54415-Nov-17 2096 608 ~ 1792 752 224 57616-Nov-17 2352 799 ~ 2022 784 188 58017-Nov-17 2145 790 ~ 1838 741 161 54818-Nov-17 2441 771 ~ 2008 722 257 56219-Nov-17 2757 677 ~ 2290 774 241 59620-Nov-17 2441 530 ~ 2024 755 321 54621-Nov-17 2432 416 ~ 2128 720 304 52822-Nov-17 2624 464 ~ 2224 816 368 52823-Nov-17 2473 594 ~ 2136 883 305 64224-Nov-17 2208 528 ~ 1872 784 192 68825-Nov-17 2400 592 ~ 2064 928 208 75226-Nov-17 2864 544 ~ 2368 912 368 67227-Nov-17 2377 562 ~ 2136 899 224 70628-Nov-17 2128 656 ~ 1920 944 160 67229-Nov-17 2000 512 ~ 1664 912 80 64030-Nov-17 2677 541 ~ 2358 1003 127 780
AVG. 2161 580 #DIV/0! 1868 774 225 591MIN. 1664 400 0 1472 608 80 433MAX. 2864 799 0 2368 1003 369 780
JHA DIRE.
BPS OUTLET
DATECOD RESULTS
COD REPORT FOR THE MONTH OF NOV. - 2017
Analysis Report of FETP streams.

ANK. PANOLI JHAGADIA INLET OUTLET1-Nov-17 750 66 ~ 465 60 48 392-Nov-17 870 18 ~ 645 69 36 453-Nov-17 870 156 ~ 705 48 6 334-Nov-17 615 216 ~ 495 42 7 425-Nov-17 720 234 ~ 465 39 30 336-Nov-17 645 234 ~ 495 45 12 367-Nov-17 540 156 ~ 465 12 60 368-Nov-17 750 108 ~ 615 27 24 129-Nov-17 645 156 ~ 540 42 97 3310-Nov-17 720 168 ~ 480 33 27 3311-Nov-17 615 96 ~ 465 51 12 4512-Nov-17 615 54 ~ 510 36 6 3013-Nov-17 540 78 ~ 390 48 9 3914-Nov-17 840 66 ~ 660 48 72 3615-Nov-17 870 78 ~ 735 54 27 3016-Nov-17 915 78 ~ 750 45 30 4217-Nov-17 825 96 ~ 675 48 105 3918-Nov-17 585 108 ~ 495 48 36 3919-Nov-17 795 180 ~ 615 45 4 2420-Nov-17 945 258 ~ 645 48 27 4221-Nov-17 840 156 ~ 645 39 60 2122-Nov-17 1050 162 ~ 795 60 54 5423-Nov-17 915 114 ~ 735 63 84 5124-Nov-17 825 48 ~ 570 45 114 3925-Nov-17 840 66 ~ 690 42 126 3026-Nov-17 765 90 ~ 585 54 48 4527-Nov-17 765 108 ~ 525 36 33 4528-Nov-17 780 54 ~ 570 69 30 5729-Nov-17 1005 78 ~ 765 81 114 6330-Nov-17 810 126 ~ 525 75 36 51
AVG. 776 120 #DIV/0! 591 48 46 39MIN. 540 18 0 390 12 4 12MAX. 1050 258 0 795 81 126 63
DATE
BOD REPORT FOR THE MONTH OF NOV. - 2017
Analysis Report of FETP streams.
JHA DIRE.
BPS OUTLET
BOD RESULTS

ANK. PANOLI JHAGADIA INLET OUTLET1-Nov-17 312 33 ~ 267 378 13 2952-Nov-17 373 35 ~ 317 395 11 2953-Nov-17 401 35 ~ 323 345 7 2784-Nov-17 373 79 ~ 323 351 68 2955-Nov-17 412 44 ~ 345 289 11 2566-Nov-17 468 62 ~ 390 295 11 2457-Nov-17 395 44 ~ 345 284 6 2398-Nov-17 479 41 ~ 395 284 5 1899-Nov-17 295 66 ~ 267 295 5 23410-Nov-17 323 42 ~ 267 284 5 23911-Nov-17 334 28 ~ 328 273 5 21712-Nov-17 445 33 ~ 334 261 5 22813-Nov-17 434 31 ~ 401 250 7 22214-Nov-17 406 25 ~ 345 261 11 21115-Nov-17 412 16 ~ 334 261 8 17816-Nov-17 490 27 ~ 378 295 6 21117-Nov-17 490 26 ~ 423 300 5 22818-Nov-17 540 26 ~ 456 306 11 21119-Nov-17 434 30 ~ 373 312 10 21720-Nov-17 445 34 ~ 356 312 13 22221-Nov-17 495 16 ~ 448 314 14 18622-Nov-17 477 20 ~ 396 302 13 23223-Nov-17 361 17 ~ 302 291 11 19824-Nov-17 308 19 ~ 256 326 6 20325-Nov-17 331 20 ~ 279 331 5 20326-Nov-17 413 20 ~ 361 320 11 21527-Nov-17 460 29 ~ 407 314 9 22728-Nov-17 337 27 ~ 308 273 8 20329-Nov-17 273 27 ~ 244 302 5 20330-Nov-17 320 27 ~ 291 326 5 232
AVG. 401 33 #DIV/0! 342 304 10 227MIN. 273 16 0 244 250 5 178MAX. 540 79 0 456 395 68 295
BPS OUTLET
DATENH3-N RESULTS
NH3-N REPORT FOR THE MONTH OF NOV. - 2017
Analysis Report of FETP streams.
JHA DIRE.

ANK. PANOLI JHAGADIA INLET OUTLET1-Nov-17 289 104 ~ 209 59 72 712-Nov-17 270 94 ~ 217 72 71 683-Nov-17 288 99 ~ 201 43 47 374-Nov-17 250 115 ~ 246 68 79 595-Nov-17 317 97 ~ 211 72 102 826-Nov-17 244 132 ~ 279 89 134 647-Nov-17 233 121 ~ 289 72 110 578-Nov-17 296 111 ~ 273 63 70 529-Nov-17 327 148 ~ 288 79 81 8210-Nov-17 203 103 ~ 188 68 89 5911-Nov-17 163 97 ~ 217 60 69 5212-Nov-17 225 91 ~ 199 46 44 5013-Nov-17 216 112 ~ 203 59 60 4814-Nov-17 350 59 ~ 240 51 88 5715-Nov-17 226 92 ~ 222 108 102 8016-Nov-17 267 79 ~ 292 101 89 8117-Nov-17 297 90 ~ 242 59 68 5318-Nov-17 290 89 ~ 197 86 104 9119-Nov-17 336 97 ~ 300 80 110 8720-Nov-17 369 133 ~ 303 96 113 9821-Nov-17 417 91 ~ 303 79 91 6022-Nov-17 415 90 ~ 318 82 102 7123-Nov-17 355 62 ~ 265 97 81 7024-Nov-17 342 70 ~ 293 70 85 7025-Nov-17 330 187 ~ 269 94 133 9826-Nov-17 379 97 ~ 289 89 97 5127-Nov-17 244 113 ~ 285 102 152 19928-Nov-17 259 94 ~ 247 112 127 12229-Nov-17 272 86 ~ 253 105 121 12030-Nov-17 328 108 ~ 269 94 89 150
AVG. 293 102 #DIV/0! 254 79 93 78MIN. 163 59 0 188 43 44 37MAX. 417 187 0 318 112 152 199
JHA DIRE.BPS
OUTLET
TSS REPORT FOR THE MONTH OF NOV. - 2017
Analysis Report of FETP streams.
DATETSS RESULTS

ANK. PANOLI JHAGADIA INLET OUTLET1-Nov-17 9200 9390 ~ 9120 10610 7870 97902-Nov-17 9630 10540 ~ 9590 10330 7650 96203-Nov-17 10070 8530 ~ 9550 10190 8290 92504-Nov-17 9450 7950 ~ 9100 9950 8160 94005-Nov-17 10340 9210 ~ 10100 9670 8420 93806-Nov-17 9920 8050 ~ 9380 9530 6930 91507-Nov-17 10980 8390 ~ 10330 10350 7100 97808-Nov-17 10850 8560 ~ 10290 10300 6910 97109-Nov-17 10140 11250 ~ 10510 10710 6970 1027010-Nov-17 10590 9540 ~ 10200 10540 7910 976011-Nov-17 10850 9630 ~ 10480 10460 7210 947012-Nov-17 12210 8290 ~ 10540 10290 6290 941013-Nov-17 12100 10010 ~ 10930 10380 6910 961014-Nov-17 10590 8550 ~ 10320 10390 6440 981015-Nov-17 9840 7840 ~ 9380 10120 7460 924016-Nov-17 12590 8190 ~ 11140 10440 7530 959017-Nov-17 11740 9320 ~ 11140 10540 7970 924018-Nov-17 12590 9550 ~ 11650 10650 7190 943019-Nov-17 13700 7540 ~ 11960 10650 7640 955020-Nov-17 11650 8260 ~ 10750 10380 8130 938021-Nov-17 11630 9130 ~ 11010 10360 8450 947022-Nov-17 12580 9780 ~ 11940 10860 7690 954023-Nov-17 11420 10640 ~ 11250 11200 9280 1119024-Nov-17 11190 9560 ~ 10810 11400 9230 1081025-Nov-17 11550 12620 ~ 11180 11150 9290 1025026-Nov-17 12130 9770 ~ 11330 11370 9310 1065027-Nov-17 10610 8280 ~ 10100 11180 9230 1049028-Nov-17 10880 8540 ~ 10200 10940 8670 1050029-Nov-17 10470 8100 ~ 10340 11000 8670 1045030-Nov-17 10600 11470 ~ 10650 10840 8550 10620
AVG. 11070 9216 #DIV/0! 10509 10559 7912 9827MIN. 9200 7540 0 9100 9530 6290 9150MAX. 13700 12620 0 11960 11400 9310 11190
TDS RESULTS JHA DIRE.
BPS OUTLET
DATE
TDS REPORT FOR THE MONTH OF NOV. - 2017
Analysis Report of FETP streams.

ANK. PANOLI JHAGADIA INLET OUTLET1-Dec-17 29.60 6.00 0.00 35.60 30.50 8.90 39.402-Dec-17 29.50 5.00 0.00 34.50 34.50 10.40 44.903-Dec-17 30.70 7.00 0.00 37.70 39.00 9.42 48.424-Dec-17 27.40 5.00 0.00 32.40 36.90 9.50 46.405-Dec-17 21.40 5.00 0.00 26.40 33.00 10.20 43.206-Dec-17 34.70 6.00 0.00 40.70 29.40 9.78 39.187-Dec-17 30.40 4.00 0.00 34.40 36.30 9.62 45.928-Dec-17 29.10 4.00 0.00 33.10 33.10 10.20 43.309-Dec-17 29.60 4.00 0.00 33.60 31.60 9.40 41.0010-Dec-17 27.40 4.00 0.00 31.40 31.20 9.42 40.6211-Dec-17 28.30 4.00 0.00 32.30 29.30 9.80 39.1012-Dec-17 30.20 4.00 0.00 34.20 29.40 9.60 39.0013-Dec-17 26.60 3.00 0.00 29.60 30.60 10.28 40.8814-Dec-17 27.30 3.00 0.00 30.30 30.70 9.52 40.2215-Dec-17 25.90 4.00 0.00 29.90 29.80 8.10 37.9016-Dec-17 25.70 4.00 0.00 29.70 28.40 9.30 37.7017-Dec-17 29.20 4.00 0.00 33.20 28.20 9.58 37.7818-Dec-17 27.90 5.00 0.00 32.90 31.10 9.30 40.4019-Dec-17 26.50 4.00 0.00 30.50 30.50 9.30 39.8020-Dec-17 27.90 4.00 0.00 31.90 30.50 5.46 35.9621-Dec-17 26.50 5.00 0.00 31.50 30.50 0.00 30.5022-Dec-17 26.80 3.00 0.00 29.80 29.80 4.40 34.2023-Dec-17 28.60 4.00 0.00 32.60 27.90 2.10 30.0024-Dec-17 28.00 4.00 0.00 32.00 28.80 9.62 38.4225-Dec-17 28.00 4.00 0.00 32.00 29.80 5.70 35.5026-Dec-17 25.10 6.00 0.00 31.10 31.70 0.60 32.3027-Dec-17 22.30 4.00 0.00 26.30 31.90 0.00 31.9028-Dec-17 14.70 6.00 0.00 20.70 17.60 6.58 24.1829-Dec-17 22.90 5.00 0.00 27.90 27.40 10.10 37.5030-Dec-17 24.00 5.00 0.00 29.00 29.40 10.50 39.9031-Dec-17 22.90 5.00 0.00 27.90 27.30 9.45 36.75
AVG. 26.94 4.52 0.00 31.45 30.52 7.94 38.46MIN. 14.70 3.00 0.00 20.70 17.60 0.00 24.18MAX. 34.70 7.00 0.00 40.70 39.00 10.50 48.42
DATE FLOW MLD RESULTS JHA DIRE.
BPS OUTLET
FLOW REPORT FOR THE MONTH OF DEC. - 2017
Analysis Report of FETP streams.

ANK. PANOLI JHAGADIA INLET OUTLET1-Dec-17 7.72 7.34 ~ 7.72 7.47 7.33 7.432-Dec-17 7.02 7.20 ~ 7.06 7.16 7.17 7.303-Dec-17 7.58 7.06 ~ 7.52 7.18 7.20 7.334-Dec-17 7.46 7.02 ~ 7.36 7.30 7.39 7.505-Dec-17 7.96 7.50 ~ 7.80 7.54 7.60 7.546-Dec-17 7.42 7.04 ~ 7.47 7.24 7.40 7.387-Dec-17 7.81 7.08 ~ 7.76 7.35 7.31 7.218-Dec-17 7.56 7.13 ~ 7.63 7.44 7.30 7.409-Dec-17 7.27 7.07 ~ 7.44 7.36 7.30 7.4210-Dec-17 7.12 7.19 ~ 7.38 7.36 7.32 7.3911-Dec-17 7.69 7.11 ~ 7.45 7.33 7.43 7.4112-Dec-17 7.45 7.42 ~ 7.53 7.63 7.59 7.8213-Dec-17 7.26 7.24 ~ 7.38 7.34 7.29 7.4714-Dec-17 7.41 7.59 ~ 7.39 7.72 7.37 7.7515-Dec-17 7.11 7.21 ~ 7.30 7.51 7.26 7.4616-Dec-17 7.80 7.28 ~ 7.74 7.59 7.23 7.5017-Dec-17 7.43 7.29 ~ 7.35 7.28 7.15 7.4618-Dec-17 7.80 7.18 ~ 7.70 7.42 7.28 7.2319-Dec-17 7.74 7.37 ~ 7.71 7.55 7.30 7.2520-Dec-17 7.30 6.99 ~ 7.34 7.39 7.41 7.2621-Dec-17 7.72 7.49 ~ 7.57 7.81 7.46 7.6522-Dec-17 8.16 7.47 ~ 8.09 7.78 ~ 7.6423-Dec-17 7.75 7.16 ~ 7.66 7.72 7.60 7.6624-Dec-17 8.17 7.09 ~ 8.06 7.67 7.83 7.7425-Dec-17 7.88 7.32 ~ 7.77 7.76 7.66 7.7326-Dec-17 8.01 7.18 ~ 7.81 7.68 7.40 7.6727-Dec-17 7.14 7.25 ~ 7.30 7.62 7.90 7.5828-Dec-17 7.96 7.31 ~ 8.05 7.66 ~ 7.6229-Dec-17 7.88 7.30 ~ 8.08 7.78 7.53 7.7530-Dec-17 8.14 7.30 ~ 8.04 7.79 7.31 7.7031-Dec-17 7.51 7.13 ~ 7.58 7.83 7.25 7.65
AVG. 7.62 7.24 #DIV/0! 7.61 7.52 7.40 7.51MIN. 7.02 6.99 0.00 7.06 7.16 7.15 7.21MAX. 8.17 7.59 0.00 8.09 7.83 7.90 7.82
JHA DIRE.DATE
pH RESULTS BPS OUTLET
pH REPORT FOR THE MONTH OF DEC. - 2017
Analysis Report of FETP streams.

ANK. PANOLI JHAGADIA INLET OUTLET1-Dec-17 2176 608 ~ 1904 880 464 7522-Dec-17 2589 621 ~ 2191 860 223 7803-Dec-17 2200 658 ~ 1943 835 144 7384-Dec-17 2457 738 ~ 2152 803 128 6905-Dec-17 2272 832 ~ 2032 816 144 7526-Dec-17 2400 720 ~ 2160 752 208 7207-Dec-17 2320 784 ~ 2128 816 448 6408-Dec-17 2406 780 ~ 2310 908 191 8769-Dec-17 2016 960 ~ 1840 864 272 64010-Dec-17 2501 701 ~ 2294 988 286 70111-Dec-17 2297 626 ~ 2072 915 176 69012-Dec-17 2262 605 ~ 2055 908 223 65313-Dec-17 2288 624 ~ 2032 832 480 64014-Dec-17 2352 768 ~ 2224 864 320 68815-Dec-17 2470 733 ~ 2231 780 175 66916-Dec-17 2450 727 ~ 2228 790 553 66317-Dec-17 2464 688 ~ 2304 864 256 65618-Dec-17 2496 784 ~ 2320 800 176 65619-Dec-17 2730 658 ~ 2377 803 337 61020-Dec-17 2240 848 ~ 2048 928 496 78421-Dec-17 2304 704 ~ 2192 864 400 68822-Dec-17 2768 832 ~ 2416 880 ~ 78423-Dec-17 2800 832 ~ 2432 896 160 84824-Dec-17 2800 720 ~ 2736 912 192 78425-Dec-17 2432 640 ~ 2176 864 384 68826-Dec-17 2784 1008 ~ 2672 928 288 68827-Dec-17 2522 963 ~ 2265 1044 112 85128-Dec-17 2592 976 ~ 2352 1056 ~ 97629-Dec-17 2795 899 ~ 2040 1044 867 94730-Dec-17 2704 800 ~ 2432 1040 864 992
31-Dec-17 2987 819 ~ 2650 931 385 771
AVG. 2480 763 #DIV/0! 2233 886 322 742MIN. 2016 605 0 1840 752 112 610MAX. 2987 1008 0 2736 1056 867 992
JHA DIRE.
BPS OUTLET
DATECOD RESULTS
Analysis Report of FETP streams.
COD REPORT FOR THE MONTH OF DEC. - 2017

ANK. PANOLI JHAGADIA INLET OUTLET1-Dec-17 765 84 ~ 645 57 18 51
2-Dec-17 780 132 ~ 510 102 18 42
3-Dec-17 930 126 ~ 780 129 15 54
4-Dec-17 690 138 ~ 585 108 102 108
5-Dec-17 930 138 ~ 690 96 48 87
6-Dec-17 795 162 ~ 630 105 10 96
7-Dec-17 900 192 ~ 780 90 9 75
8-Dec-17 870 186 ~ 660 93 18 84
9-Dec-17 735 210 ~ 660 90 18 66
10-Dec-17 810 192 ~ 720 93 183 72
11-Dec-17 975 162 ~ 735 105 12 93
12-Dec-17 585 300 ~ 570 87 72 60
13-Dec-17 975 156 ~ 870 87 90 78
14-Dec-17 795 120 ~ 540 102 9 81
15-Dec-17 870 144 ~ 765 87 54 69
16-Dec-17 870 168 ~ 675 69 105 51
17-Dec-17 900 144 ~ 735 72 72 54
18-Dec-17 930 132 ~ 795 63 18 42
19-Dec-17 825 72 ~ 630 63 144 60
20-Dec-17 915 60 ~ 705 69 42 57
21-Dec-17 1020 150 ~ 885 63 12 42
22-Dec-17 1050 132 ~ 885 72 84 66
23-Dec-17 885 192 ~ 165 66 156 63
24-Dec-17 900 138 ~ 870 69 126 54
25-Dec-17 945 204 ~ 765 87 ~ 54
26-Dec-17 1095 186 ~ 870 87 6 84
27-Dec-17 885 156 ~ 750 66 15 45
28-Dec-17 855 126 ~ 720 69 48 57
29-Dec-17 1155 282 ~ 930 108 57 66
30-Dec-17 930 252 ~ 765 105 15 63
31-Dec-17 1020 294 ~ 825 195 ~ 147
AVG. 890 165 #DIV/0! 713 89 54 68MIN. 585 60 0 165 57 6 42MAX. 1155 300 0 930 195 183 147
JHA DIRE.
BPS OUTLET
DATEBOD RESULTS
BOD REPORT FOR THE MONTH OF DEC. - 2017
Analysis Report of FETP streams.

ANK. PANOLI JHAGADIA INLET OUTLET1-Dec-17 262 25 ~ 221 291 69 238
2-Dec-17 297 23 ~ 238 273 6 203
3-Dec-17 442 12 ~ 372 267 5 203
4-Dec-17 361 20 ~ 262 262 BDL 203
5-Dec-17 425 19 ~ 372 267 BDL 186
6-Dec-17 308 20 ~ 221 273 6 198
7-Dec-17 372 19 ~ 337 291 11 174
8-Dec-17 413 19 ~ 361 308 6 232
9-Dec-17 256 17 ~ 256 291 11 244
10-Dec-17 308 17 ~ 238 326 11 250
11-Dec-17 448 19 ~ 331 396 12 244
12-Dec-17 361 19 ~ 343 331 9 256
13-Dec-17 318 17 ~ 272 318 11 210
14-Dec-17 318 22 ~ 306 329 9 238
15-Dec-17 352 17 ~ 312 329 5 227
16-Dec-17 568 19 ~ 386 329 11 250
17-Dec-17 580 20 ~ 329 341 6 261
18-Dec-17 534 20 ~ 466 341 9 215
19-Dec-17 414 25 ~ 352 352 11 272
20-Dec-17 289 34 ~ 215 363 11 272
21-Dec-17 341 29 ~ 312 386 11 284
22-Dec-17 466 23 ~ 403 380 ~ 308
23-Dec-17 568 25 ~ 483 397 BDL 323
24-Dec-17 642 21 ~ 613 358 5 318
25-Dec-17 460 22 ~ 420 352 7 301
26-Dec-17 540 25 ~ 506 398 15 324
27-Dec-17 443 28 ~ 386 431 9 352
28-Dec-17 554 26 ~ 488 409 ~ 397
29-Dec-17 636 20 ~ 386 443 10 409
30-Dec-17 602 20 ~ 460 437 12 352
31-Dec-17 568 20 ~ 477 454 11 346
AVG. 434 21 #DIV/0! 359 346 12 267MIN. 256 12 0 215 262 5 174MAX. 642 34 0 613 454 69 409
DATENH3-N RESULTS JHA
DIRE.BPS
OUTLET
NH3-N REPORT FOR THE MONTH OF DEC. - 2017
Analysis Report of FETP streams.
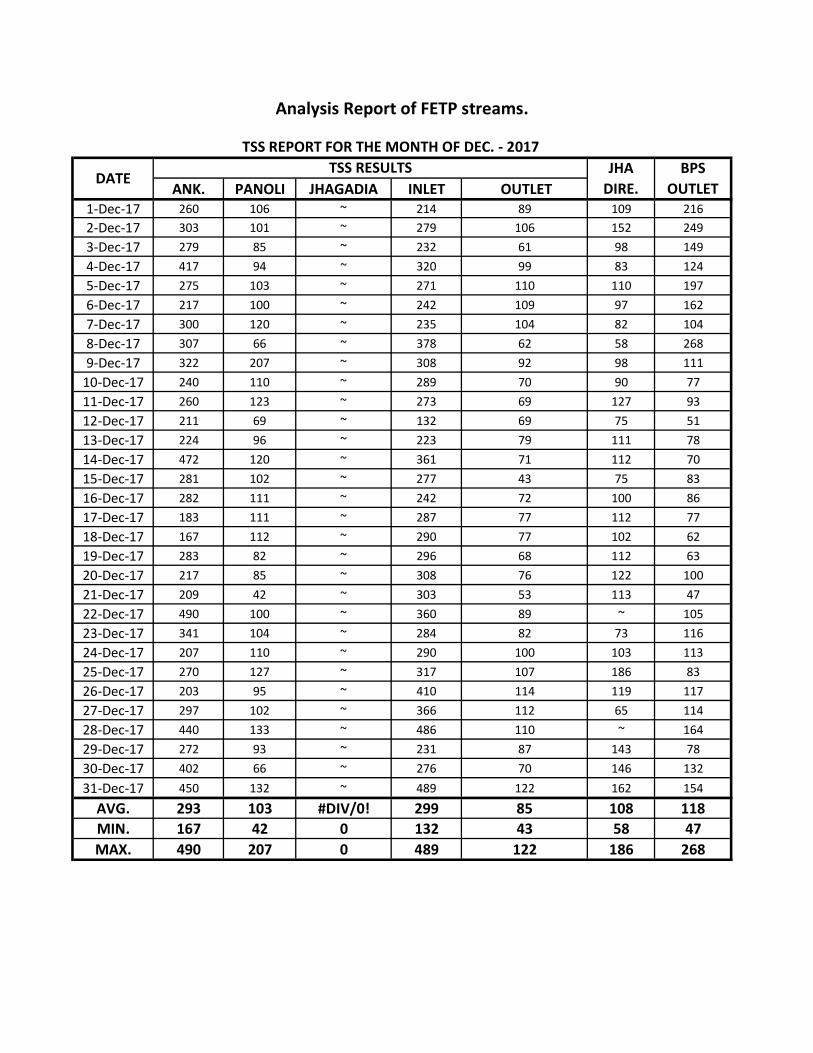
ANK. PANOLI JHAGADIA INLET OUTLET1-Dec-17 260 106 ~ 214 89 109 2162-Dec-17 303 101 ~ 279 106 152 2493-Dec-17 279 85 ~ 232 61 98 1494-Dec-17 417 94 ~ 320 99 83 1245-Dec-17 275 103 ~ 271 110 110 1976-Dec-17 217 100 ~ 242 109 97 1627-Dec-17 300 120 ~ 235 104 82 1048-Dec-17 307 66 ~ 378 62 58 2689-Dec-17 322 207 ~ 308 92 98 11110-Dec-17 240 110 ~ 289 70 90 7711-Dec-17 260 123 ~ 273 69 127 9312-Dec-17 211 69 ~ 132 69 75 5113-Dec-17 224 96 ~ 223 79 111 7814-Dec-17 472 120 ~ 361 71 112 7015-Dec-17 281 102 ~ 277 43 75 8316-Dec-17 282 111 ~ 242 72 100 8617-Dec-17 183 111 ~ 287 77 112 7718-Dec-17 167 112 ~ 290 77 102 6219-Dec-17 283 82 ~ 296 68 112 6320-Dec-17 217 85 ~ 308 76 122 10021-Dec-17 209 42 ~ 303 53 113 4722-Dec-17 490 100 ~ 360 89 ~ 10523-Dec-17 341 104 ~ 284 82 73 11624-Dec-17 207 110 ~ 290 100 103 11325-Dec-17 270 127 ~ 317 107 186 8326-Dec-17 203 95 ~ 410 114 119 11727-Dec-17 297 102 ~ 366 112 65 11428-Dec-17 440 133 ~ 486 110 ~ 16429-Dec-17 272 93 ~ 231 87 143 7830-Dec-17 402 66 ~ 276 70 146 132
31-Dec-17 450 132 ~ 489 122 162 154
AVG. 293 103 #DIV/0! 299 85 108 118MIN. 167 42 0 132 43 58 47MAX. 490 207 0 489 122 186 268
DATETSS RESULTS JHA
DIRE.BPS
OUTLET
TSS REPORT FOR THE MONTH OF DEC. - 2017
Analysis Report of FETP streams.

ANK. PANOLI JHAGADIA INLET OUTLET1-Dec-17 10540 11260 ~ 10540 10910 9220 100302-Dec-17 10370 8120 ~ 9910 10420 5320 99303-Dec-17 11410 9610 ~ 10900 10630 8500 101604-Dec-17 11060 9800 ~ 10590 10520 7960 99905-Dec-17 11140 9740 ~ 10750 10230 8250 98806-Dec-17 9830 10340 ~ 9920 10330 8200 98607-Dec-17 9030 10640 ~ 9890 10370 8300 98008-Dec-17 9960 11810 ~ 10050 10300 8050 95009-Dec-17 9770 13300 ~ 10010 10180 7550 964010-Dec-17 10910 13100 ~ 11110 10470 7190 985011-Dec-17 11020 14300 ~ 11620 10890 7350 1013012-Dec-17 10680 12630 ~ 10900 10650 8030 988013-Dec-17 10440 11080 ~ 10520 10360 8200 937014-Dec-17 10750 9240 ~ 10710 10920 8270 975015-Dec-17 11500 12150 ~ 11570 11360 8570 1026016-Dec-17 11800 11310 ~ 11710 11220 8590 1029017-Dec-17 12410 13040 ~ 12780 12740 9220 1095018-Dec-17 12930 14700 ~ 12860 11920 8460 1059019-Dec-17 11080 9880 ~ 11060 10540 7000 964020-Dec-17 11640 12460 ~ 11660 11920 9930 1085021-Dec-17 11120 11760 ~ 11700 11510 8570 1059022-Dec-17 12010 11680 ~ 11810 12160 ~ 1173023-Dec-17 12140 13000 ~ 12090 12080 8390 1190024-Dec-17 12390 11240 ~ 12550 12150 6750 1184025-Dec-17 11170 11840 ~ 11190 11930 8830 1150026-Dec-17 11730 12870 ~ 11970 12480 9520 1144027-Dec-17 11430 11280 ~ 11650 12420 7370 1229028-Dec-17 13030 11060 ~ 12700 12240 ~ 1213029-Dec-17 12340 11640 ~ 11630 11960 9250 1176030-Dec-17 13030 11860 ~ 12250 11430 8740 10660
31-Dec-17 12550 12300 ~ 12280 11970 9560 10940
AVG. 11329 11582 #DIV/0! 11319 11265 8246 10553MIN. 9030 8120 0 9890 10180 5320 9370MAX. 13030 14700 0 12860 12740 9930 12290
JHA DIRE.
DATETDS RESULTS BPS
OUTLET
Analysis Report of FETP streams.
TDS REPORT FOR THE MONTH OF DEC. - 2017

ANK. PANOLI JHAGADIA INLET OUTLET1-Jan-18 22.50 5.00 0.00 27.50 25.80 9.60 35.402-Jan-18 21.00 5.00 0.00 26.00 25.40 10.30 35.703-Jan-18 22.50 5.00 0.00 27.50 25.80 9.40 35.204-Jan-18 23.40 6.00 0.00 29.40 25.10 9.39 34.495-Jan-18 22.20 6.00 0.00 28.20 26.00 8.31 34.316-Jan-18 21.60 5.00 0.00 26.60 26.00 8.84 34.847-Jan-18 22.10 6.00 0.00 28.10 26.60 9.11 35.718-Jan-18 22.60 6.00 0.00 28.60 25.90 7.50 33.409-Jan-18 22.00 6.00 0.00 28.00 25.80 8.61 34.4110-Jan-18 23.30 5.00 0.00 28.30 26.20 9.43 35.6311-Jan-18 23.60 6.00 0.00 29.60 26.30 8.08 34.3812-Jan-18 24.10 6.00 0.00 30.10 26.90 8.26 35.1613-Jan-18 23.50 6.00 0.00 29.50 27.60 9.02 36.6214-Jan-18 17.70 4.00 0.00 21.70 28.20 6.55 34.7515-Jan-18 20.40 5.00 0.00 25.40 26.10 7.00 33.1016-Jan-18 24.00 4.00 0.00 28.00 26.00 7.60 33.6017-Jan-18 24.60 6.00 0.00 30.60 26.40 8.87 35.2718-Jan-18 24.60 6.00 0.00 30.60 26.40 8.56 34.9619-Jan-18 25.70 5.00 0.00 30.70 26.60 8.65 35.2520-Jan-18 25.20 4.00 0.00 29.20 26.40 0.00 26.4021-Jan-18 25.90 6.00 0.00 31.90 27.30 2.61 29.9122-Jan-18 27.20 6.00 0.00 33.20 32.60 9.90 42.5023-Jan-18 26.60 5.00 0.00 31.60 32.40 9.75 42.1524-Jan-18 24.10 5.00 0.00 29.10 32.80 8.77 41.5725-Jan-18 24.70 5.00 0.00 29.70 28.20 8.48 36.6826-Jan-18 22.80 5.00 0.00 27.80 27.50 7.86 35.3627-Jan-18 25.70 5.00 0.00 30.70 26.90 9.15 36.0528-Jan-18 25.20 5.00 0.00 30.20 26.80 8.49 35.2929-Jan-18 23.10 6.00 0.00 29.10 27.20 7.40 34.6030-Jan-18 23.00 4.00 0.00 27.00 27.10 7.76 34.8631-Jan-18 25.80 5.00 0.00 30.80 27.20 8.34 35.54
AVG. 23.57 5.29 0.00 28.86 27.15 8.12 35.26MIN. 17.70 4.00 0.00 21.70 25.10 0.00 26.40MAX. 27.20 6.00 0.00 33.20 32.80 10.30 42.50
DATEFLOW MLD RESULTS
JHA DIRE.BPS
OUTLET
FLOW REPORT FOR THE MONTH OF JAN. - 2018
Analysis Report of FETP streams.

ANK. PANOLI JHAGADIA INLET OUTLET1-Jan-18 8.21 7.24 ~ 8.13 7.75 7.36 7.552-Jan-18 7.65 7.40 ~ 7.80 7.75 7.26 7.633-Jan-18 7.78 7.34 ~ 7.85 7.69 7.45 7.684-Jan-18 7.75 7.34 ~ 7.78 7.67 7.44 7.565-Jan-18 7.82 7.12 ~ 7.88 7.75 7.50 7.716-Jan-18 7.01 7.09 ~ 7.15 7.67 7.44 7.627-Jan-18 7.83 7.14 ~ 7.81 7.74 7.38 7.688-Jan-18 7.55 7.20 ~ 7.68 7.60 7.31 7.649-Jan-18 7.92 7.31 ~ 8.00 7.74 7.45 7.8410-Jan-18 7.73 7.18 ~ 7.67 7.74 7.40 7.7711-Jan-18 7.88 7.23 ~ 7.98 7.73 7.44 7.7312-Jan-18 7.60 7.31 ~ 7.81 7.73 7.53 7.8313-Jan-18 7.95 7.31 ~ 7.75 7.67 7.30 7.6414-Jan-18 8.08 7.33 ~ 8.08 7.68 7.30 7.7815-Jan-18 7.40 7.22 ~ 7.55 7.70 7.43 7.7716-Jan-18 7.88 7.35 ~ 7.93 7.78 7.59 7.8017-Jan-18 7.82 7.35 ~ 7.90 7.75 7.15 7.9518-Jan-18 8.02 7.50 ~ 8.11 8.00 7.60 7.8319-Jan-18 7.07 7.28 ~ 7.68 7.75 7.52 7.7820-Jan-18 7.78 7.48 ~ 7.92 7.69 7.38 7.8121-Jan-18 7.49 7.35 ~ 7.70 7.59 ~ 7.5722-Jan-18 7.75 7.49 ~ 7.63 7.76 7.88 7.8123-Jan-18 7.89 7.37 ~ 7.96 7.67 7.38 7.6624-Jan-18 8.01 7.49 ~ 8.17 7.82 7.46 7.8325-Jan-18 7.92 7.44 ~ 7.98 7.76 7.39 7.7426-Jan-18 8.02 7.50 ~ 8.11 7.65 7.02 7.6527-Jan-18 7.96 7.56 ~ 7.99 7.74 7.31 7.6928-Jan-18 8.39 7.76 ~ 8.24 7.94 7.32 8.0029-Jan-18 7.87 7.70 ~ 8.01 7.84 7.42 7.8430-Jan-18 8.35 7.75 ~ 8.36 7.90 7.44 7.8731-Jan-18 7.75 7.59 ~ 7.64 7.84 7.15 7.92
AVG. 7.81 7.38 #DIV/0! 7.88 7.74 7.40 7.75MIN. 7.01 7.09 0.00 7.15 7.59 7.02 7.55MAX. 8.39 7.76 0.00 8.36 8.00 7.88 8.00
JHA DIRE.BPS
OUTLETDATE
pH RESULTS pH REPORT FOR THE MONTH OF JAN. - 2018
Analysis Report of FETP streams.

ANK. PANOLI JHAGADIA INLET OUTLET1-Jan-18 3280 736 ~ 2840 1040 400 7522-Jan-18 2931 674 ~ 2530 1060 289 8033-Jan-18 2920 880 ~ 2600 1024 192 8964-Jan-18 2891 722 ~ 2570 1044 514 8355-Jan-18 2880 896 ~ 2400 1056 752 7846-Jan-18 2720 944 ~ 2640 1008 464 7687-Jan-18 2908 844 ~ 2629 1003 159 7338-Jan-18 3413 706 ~ 2811 1028 594 7879-Jan-18 3320 928 ~ 3000 1024 720 81610-Jan-18 3012 867 ~ 2530 1060 465 89911-Jan-18 3293 803 ~ 2449 947 224 77112-Jan-18 2610 690 ~ 2289 995 979 75513-Jan-18 3120 560 ~ 2400 1008 544 78414-Jan-18 3000 560 ~ 2320 1104 400 94415-Jan-18 3360 544 ~ 2760 1024 208 81616-Jan-18 2851 690 ~ 2811 1028 755 81917-Jan-18 2640 576 ~ 2360 992 416 92818-Jan-18 2489 626 ~ 2168 931 176 75519-Jan-18 2960 800 ~ 2600 928 144 73620-Jan-18 2800 768 ~ 2760 960 192 78421-Jan-18 2600 544 ~ 2280 944 ~ 81622-Jan-18 3252 497 ~ 3012 963 112 89923-Jan-18 2840 512 ~ 2560 912 144 86424-Jan-18 2570 481 ~ 1927 963 433 75525-Jan-18 2720 576 ~ 2520 1040 288 80026-Jan-18 2680 528 ~ 2320 1024 304 80027-Jan-18 3200 480 ~ 2840 1024 656 84828-Jan-18 2960 464 ~ 2440 944 512 81629-Jan-18 2720 464 ~ 2400 912 192 75230-Jan-18 2960 496 ~ 2320 880 336 78431-Jan-18 2640 528 ~ 2400 896 560 688
AVG. 2921 658 #DIV/0! 2532 992 404 806MIN. 2489 464 0 1927 880 112 688MAX. 3413 944 0 3012 1104 979 944
DATECOD RESULTS
Analysis Report of FETP streams.
JHA DIRE.BPS
OUTLET
COD REPORT FOR THE MONTH OF JAN. - 2018
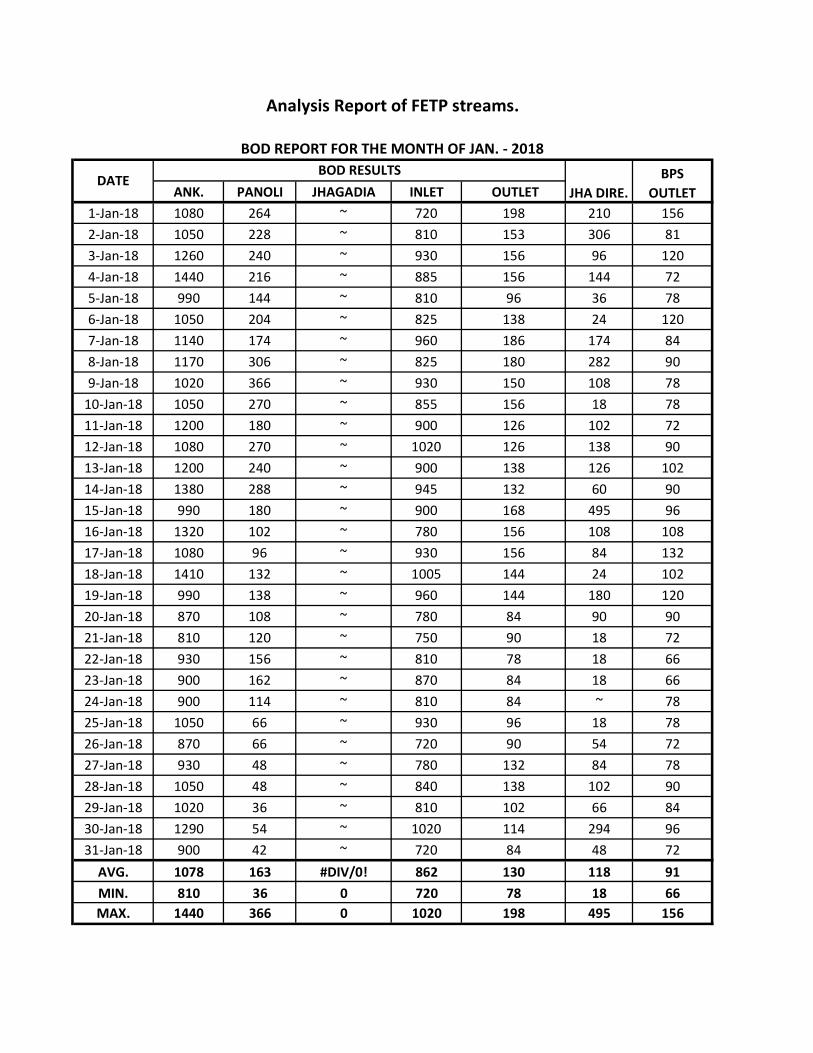
ANK. PANOLI JHAGADIA INLET OUTLET1-Jan-18 1080 264 ~ 720 198 210 1562-Jan-18 1050 228 ~ 810 153 306 813-Jan-18 1260 240 ~ 930 156 96 1204-Jan-18 1440 216 ~ 885 156 144 725-Jan-18 990 144 ~ 810 96 36 786-Jan-18 1050 204 ~ 825 138 24 1207-Jan-18 1140 174 ~ 960 186 174 848-Jan-18 1170 306 ~ 825 180 282 909-Jan-18 1020 366 ~ 930 150 108 7810-Jan-18 1050 270 ~ 855 156 18 7811-Jan-18 1200 180 ~ 900 126 102 7212-Jan-18 1080 270 ~ 1020 126 138 9013-Jan-18 1200 240 ~ 900 138 126 10214-Jan-18 1380 288 ~ 945 132 60 9015-Jan-18 990 180 ~ 900 168 495 9616-Jan-18 1320 102 ~ 780 156 108 10817-Jan-18 1080 96 ~ 930 156 84 13218-Jan-18 1410 132 ~ 1005 144 24 10219-Jan-18 990 138 ~ 960 144 180 12020-Jan-18 870 108 ~ 780 84 90 9021-Jan-18 810 120 ~ 750 90 18 7222-Jan-18 930 156 ~ 810 78 18 6623-Jan-18 900 162 ~ 870 84 18 6624-Jan-18 900 114 ~ 810 84 ~ 7825-Jan-18 1050 66 ~ 930 96 18 7826-Jan-18 870 66 ~ 720 90 54 7227-Jan-18 930 48 ~ 780 132 84 7828-Jan-18 1050 48 ~ 840 138 102 9029-Jan-18 1020 36 ~ 810 102 66 8430-Jan-18 1290 54 ~ 1020 114 294 9631-Jan-18 900 42 ~ 720 84 48 72
AVG. 1078 163 #DIV/0! 862 130 118 91MIN. 810 36 0 720 78 18 66MAX. 1440 366 0 1020 198 495 156
BOD RESULTS
Analysis Report of FETP streams.
JHA DIRE.DATE
BOD REPORT FOR THE MONTH OF JAN. - 2018
BPS OUTLET
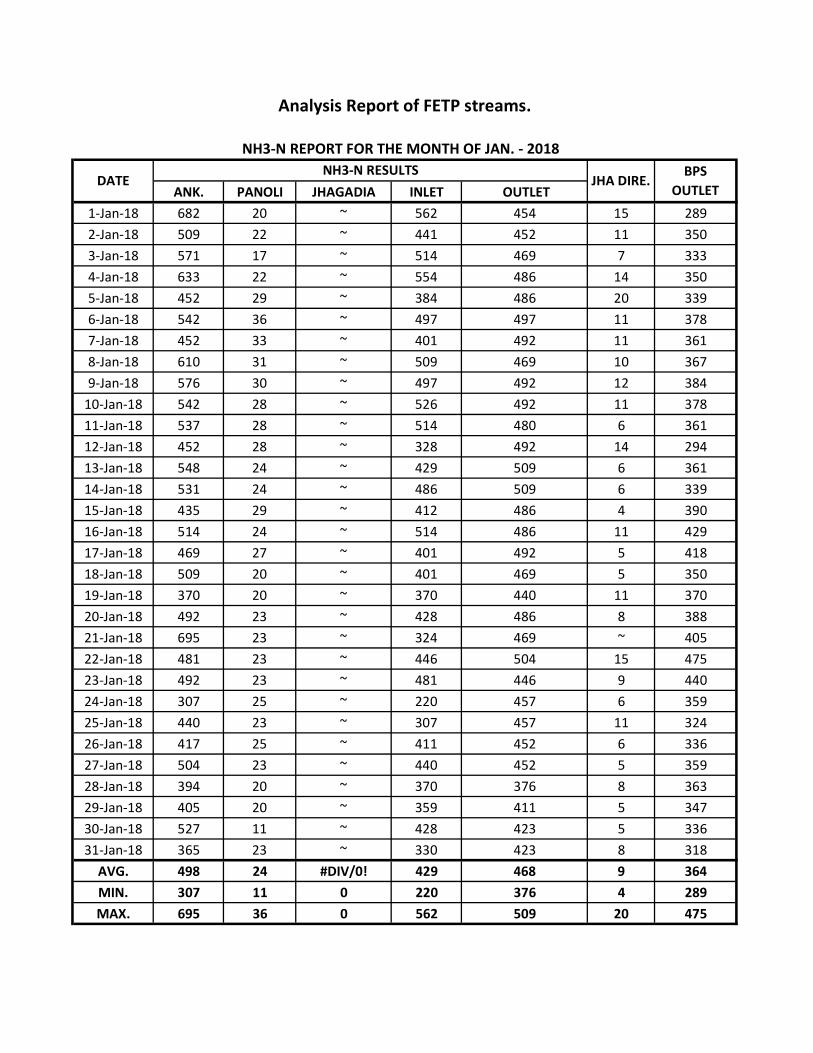
ANK. PANOLI JHAGADIA INLET OUTLET1-Jan-18 682 20 ~ 562 454 15 2892-Jan-18 509 22 ~ 441 452 11 3503-Jan-18 571 17 ~ 514 469 7 3334-Jan-18 633 22 ~ 554 486 14 3505-Jan-18 452 29 ~ 384 486 20 3396-Jan-18 542 36 ~ 497 497 11 3787-Jan-18 452 33 ~ 401 492 11 3618-Jan-18 610 31 ~ 509 469 10 3679-Jan-18 576 30 ~ 497 492 12 38410-Jan-18 542 28 ~ 526 492 11 37811-Jan-18 537 28 ~ 514 480 6 36112-Jan-18 452 28 ~ 328 492 14 29413-Jan-18 548 24 ~ 429 509 6 36114-Jan-18 531 24 ~ 486 509 6 33915-Jan-18 435 29 ~ 412 486 4 39016-Jan-18 514 24 ~ 514 486 11 42917-Jan-18 469 27 ~ 401 492 5 41818-Jan-18 509 20 ~ 401 469 5 35019-Jan-18 370 20 ~ 370 440 11 37020-Jan-18 492 23 ~ 428 486 8 38821-Jan-18 695 23 ~ 324 469 ~ 40522-Jan-18 481 23 ~ 446 504 15 47523-Jan-18 492 23 ~ 481 446 9 44024-Jan-18 307 25 ~ 220 457 6 35925-Jan-18 440 23 ~ 307 457 11 32426-Jan-18 417 25 ~ 411 452 6 33627-Jan-18 504 23 ~ 440 452 5 35928-Jan-18 394 20 ~ 370 376 8 36329-Jan-18 405 20 ~ 359 411 5 34730-Jan-18 527 11 ~ 428 423 5 33631-Jan-18 365 23 ~ 330 423 8 318
AVG. 498 24 #DIV/0! 429 468 9 364MIN. 307 11 0 220 376 4 289MAX. 695 36 0 562 509 20 475
BPS OUTLET
JHA DIRE.
NH3-N REPORT FOR THE MONTH OF JAN. - 2018
Analysis Report of FETP streams.
DATENH3-N RESULTS

ANK. PANOLI JHAGADIA INLET OUTLET1-Jan-18 406 128 ~ 382 121 142 1822-Jan-18 365 150 ~ 289 122 153 1353-Jan-18 356 103 ~ 315 112 149 1144-Jan-18 326 96 ~ 387 124 128 1605-Jan-18 250 60 ~ 204 89 124 776-Jan-18 320 134 ~ 353 90 194 1227-Jan-18 321 117 ~ 459 104 83 1018-Jan-18 323 113 ~ 263 121 139 1669-Jan-18 302 113 ~ 409 115 128 15110-Jan-18 209 127 ~ 237 102 230 9611-Jan-18 534 109 ~ 245 84 143 9812-Jan-18 342 119 ~ 246 141 183 13213-Jan-18 251 82 ~ 334 88 235 13314-Jan-18 326 115 ~ 332 104 105 8815-Jan-18 286 112 ~ 145 84 110 10616-Jan-18 300 82 ~ 399 127 136 13317-Jan-18 374 78 ~ 342 114 150 16818-Jan-18 355 116 ~ 329 120 117 14519-Jan-18 221 134 ~ 286 129 119 12320-Jan-18 330 83 ~ 255 88 113 8421-Jan-18 297 77 ~ 263 95 ~ 8222-Jan-18 387 113 ~ 352 117 67 12523-Jan-18 380 131 ~ 312 114 127 12124-Jan-18 443 120 ~ 270 116 137 15525-Jan-18 423 97 ~ 283 116 84 11126-Jan-18 262 133 ~ 242 111 152 10527-Jan-18 371 117 ~ 353 102 141 17028-Jan-18 379 103 ~ 361 122 169 14229-Jan-18 375 75 ~ 362 94 91 12830-Jan-18 479 100 ~ 460 92 61 16931-Jan-18 459 128 ~ 412 112 94 92
AVG. 347 109 #DIV/0! 319 109 133 126MIN. 209 60 0 145 84 61 77MAX. 534 150 0 460 141 235 182
TSS REPORT FOR THE MONTH OF JAN - 2018
Analysis Report of FETP streams.
DATETSS RESULTS
JHA DIRE.BPS
OUTLET

ANK. PANOLI JHAGADIA INLET OUTLET1-Jan-18 11880 10900 ~ 11600 11010 9020 99902-Jan-18 12340 13100 ~ 12450 11850 9650 107803-Jan-18 12730 10320 ~ 12020 11950 10900 126904-Jan-18 13100 8760 ~ 12310 12270 9760 111005-Jan-18 13500 9020 ~ 11930 12060 6990 116506-Jan-18 11940 9040 ~ 11380 11840 9430 112007-Jan-18 12860 11320 ~ 12550 12210 10140 113708-Jan-18 12700 10640 ~ 12430 12460 9850 116109-Jan-18 13100 10090 ~ 12310 12420 10060 1166010-Jan-18 13300 11470 ~ 13200 12800 10600 1174011-Jan-18 13000 11010 ~ 12280 12360 9970 1159012-Jan-18 11310 9170 ~ 11170 11740 9760 1115013-Jan-18 12510 10500 ~ 11340 12460 9860 1152014-Jan-18 12870 9500 ~ 11910 12180 9960 1126015-Jan-18 12770 10510 ~ 12330 12340 12270 1186016-Jan-18 11030 9580 ~ 11110 11790 9080 1121017-Jan-18 11830 9120 ~ 11010 12250 9830 1169018-Jan-18 12500 10300 ~ 11490 12820 9030 1200019-Jan-18 12250 11170 ~ 12030 12610 8490 1188020-Jan-18 11880 8930 ~ 11480 12580 7270 1178021-Jan-18 12500 9940 ~ 11830 12540 ~ 1240022-Jan-18 13100 11620 ~ 12490 13100 6890 1310023-Jan-18 11630 11400 ~ 11520 12180 8670 1151024-Jan-18 11060 10980 ~ 10490 12380 8790 1151025-Jan-18 12180 12070 ~ 12160 12680 8760 1177026-Jan-18 12180 10950 ~ 12000 12570 8810 1187027-Jan-18 13200 11080 ~ 12750 12630 9370 1163028-Jan-18 12550 11040 ~ 12140 12340 9900 1152029-Jan-18 12960 12520 ~ 12900 12770 10380 1192030-Jan-18 13100 11230 ~ 12750 12470 8840 1135031-Jan-18 11680 11610 ~ 11650 11970 8710 10730
AVG. 12437 10609 #DIV/0! 11968 12311 9368 11582MIN. 11030 8760 0 10490 11010 6890 9990MAX. 13500 13100 0 13200 13100 12270 13100
TDS REPORT FOR THE MONTH OF JAN. - 2018
DATETDS RESULTS
JHA DIRE.
Analysis Report of FETP streams.
BPS OUTLET
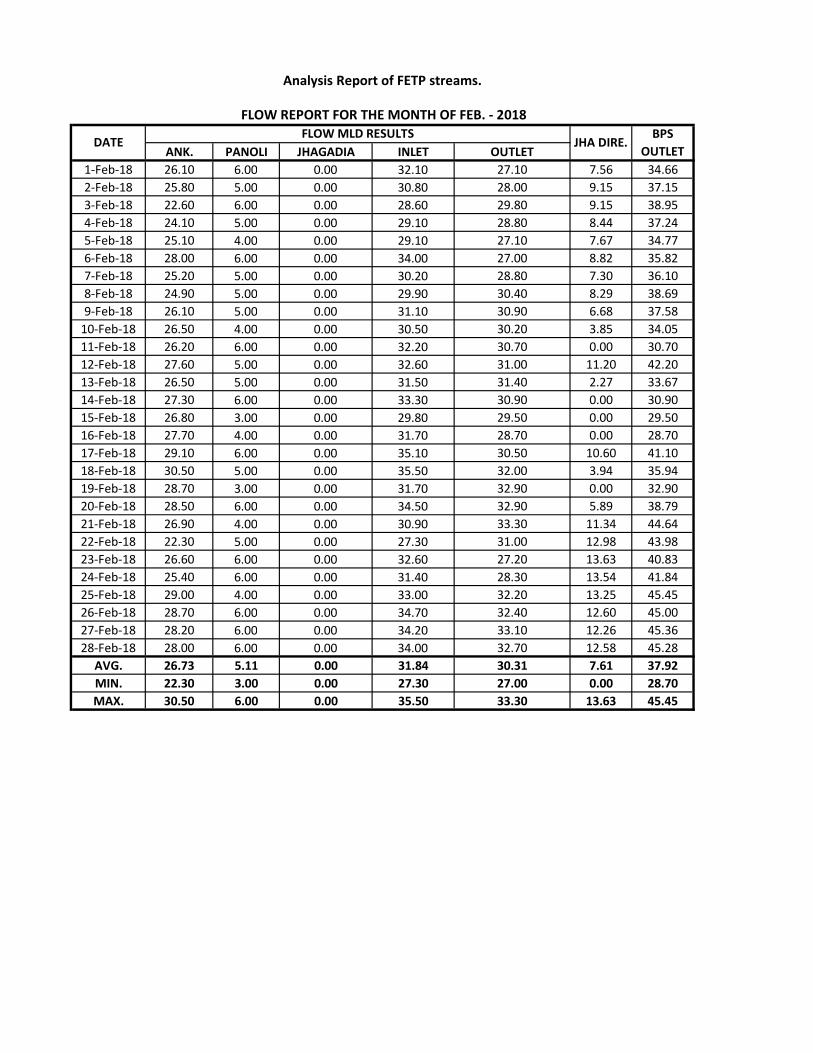
ANK. PANOLI JHAGADIA INLET OUTLET1-Feb-18 26.10 6.00 0.00 32.10 27.10 7.56 34.662-Feb-18 25.80 5.00 0.00 30.80 28.00 9.15 37.153-Feb-18 22.60 6.00 0.00 28.60 29.80 9.15 38.954-Feb-18 24.10 5.00 0.00 29.10 28.80 8.44 37.245-Feb-18 25.10 4.00 0.00 29.10 27.10 7.67 34.776-Feb-18 28.00 6.00 0.00 34.00 27.00 8.82 35.827-Feb-18 25.20 5.00 0.00 30.20 28.80 7.30 36.108-Feb-18 24.90 5.00 0.00 29.90 30.40 8.29 38.699-Feb-18 26.10 5.00 0.00 31.10 30.90 6.68 37.5810-Feb-18 26.50 4.00 0.00 30.50 30.20 3.85 34.0511-Feb-18 26.20 6.00 0.00 32.20 30.70 0.00 30.7012-Feb-18 27.60 5.00 0.00 32.60 31.00 11.20 42.2013-Feb-18 26.50 5.00 0.00 31.50 31.40 2.27 33.6714-Feb-18 27.30 6.00 0.00 33.30 30.90 0.00 30.9015-Feb-18 26.80 3.00 0.00 29.80 29.50 0.00 29.5016-Feb-18 27.70 4.00 0.00 31.70 28.70 0.00 28.7017-Feb-18 29.10 6.00 0.00 35.10 30.50 10.60 41.1018-Feb-18 30.50 5.00 0.00 35.50 32.00 3.94 35.9419-Feb-18 28.70 3.00 0.00 31.70 32.90 0.00 32.9020-Feb-18 28.50 6.00 0.00 34.50 32.90 5.89 38.7921-Feb-18 26.90 4.00 0.00 30.90 33.30 11.34 44.6422-Feb-18 22.30 5.00 0.00 27.30 31.00 12.98 43.9823-Feb-18 26.60 6.00 0.00 32.60 27.20 13.63 40.8324-Feb-18 25.40 6.00 0.00 31.40 28.30 13.54 41.8425-Feb-18 29.00 4.00 0.00 33.00 32.20 13.25 45.4526-Feb-18 28.70 6.00 0.00 34.70 32.40 12.60 45.0027-Feb-18 28.20 6.00 0.00 34.20 33.10 12.26 45.3628-Feb-18 28.00 6.00 0.00 34.00 32.70 12.58 45.28
AVG. 26.73 5.11 0.00 31.84 30.31 7.61 37.92MIN. 22.30 3.00 0.00 27.30 27.00 0.00 28.70MAX. 30.50 6.00 0.00 35.50 33.30 13.63 45.45
JHA DIRE.BPS
OUTLETDATE
FLOW MLD RESULTS FLOW REPORT FOR THE MONTH OF FEB. - 2018
Analysis Report of FETP streams.

ANK. PANOLI JHAGADIA INLET OUTLET1-Feb-18 8.11 7.74 ~ 8.18 7.82 7.20 7.842-Feb-18 7.60 7.65 ~ 7.90 7.89 7.35 7.823-Feb-18 7.88 7.70 ~ 8.29 7.84 7.12 7.924-Feb-18 7.91 7.78 ~ 7.88 7.83 7.22 7.925-Feb-18 7.86 7.72 ~ 7.40 7.80 7.36 7.786-Feb-18 7.36 7.83 ~ 7.73 7.83 7.41 7.867-Feb-18 8.09 7.82 ~ 8.22 7.87 7.31 7.878-Feb-18 7.69 7.78 ~ 8.15 7.85 7.44 7.869-Feb-18 7.84 7.68 ~ 8.27 7.86 7.56 7.8710-Feb-18 7.84 7.69 ~ 7.94 7.80 7.48 7.8911-Feb-18 8.38 7.68 ~ 8.23 7.80 7.64 7.8312-Feb-18 8.34 7.83 ~ 8.26 7.88 ~ 7.9213-Feb-18 7.33 7.71 ~ 7.40 7.80 7.47 7.8314-Feb-18 8.08 7.76 ~ 8.10 7.90 7.82 7.8815-Feb-18 7.83 7.61 ~ 8.37 8.87 ~ 7.8016-Feb-18 7.54 7.65 ~ 7.85 7.92 ~ 7.8117-Feb-18 8.36 7.85 ~ 8.39 7.88 ~ 8.0518-Feb-18 7.97 7.84 ~ 8.33 7.89 7.66 7.9719-Feb-18 8.11 7.80 ~ 8.16 7.89 7.64 7.8320-Feb-18 8.39 7.75 ~ 8.39 7.78 ~ 7.8521-Feb-18 7.85 7.80 ~ 8.15 7.80 7.67 7.8422-Feb-18 8.16 7.78 ~ 8.23 7.81 7.62 7.8923-Feb-18 8.10 7.65 ~ 8.09 7.84 7.56 7.9324-Feb-18 8.11 7.70 ~ 8.11 7.87 7.60 7.8425-Feb-18 8.19 7.72 ~ 8.24 7.89 7.46 7.9426-Feb-18 7.90 7.80 ~ 7.90 7.89 7.17 7.8127-Feb-18 7.99 7.64 ~ 7.94 7.85 7.11 7.9128-Feb-18 8.10 7.70 ~ 8.16 7.92 7.48 7.94
AVG. 7.96 7.74 #DIV/0! 8.08 7.89 7.45 7.88MIN. 7.33 7.61 0.00 7.40 7.78 7.11 7.78MAX. 8.39 7.85 0.00 8.39 8.87 7.82 8.05
JHA DIRE.BPS
OUTLETDATE
pH RESULTS pH REPORT FOR THE MONTH OF FEB. - 2018
Analysis Report of FETP streams.

ANK. PANOLI JHAGADIA INLET OUTLET1-Feb-18 2480 480 ~ 2280 944 672 7842-Feb-18 1960 416 ~ 1920 864 144 6883-Feb-18 2530 465 ~ 2369 947 803 7064-Feb-18 2440 448 ~ 2040 880 416 7045-Feb-18 2505 465 ~ 1911 851 192 7876-Feb-18 2200 464 ~ 2120 768 192 6727-Feb-18 2377 497 ~ 2184 738 497 6428-Feb-18 2432 448 ~ 1808 752 80 5769-Feb-18 2168 465 ~ 1911 738 208 64210-Feb-18 2048 432 ~ 1792 736 144 57611-Feb-18 2432 416 ~ 2336 752 144 60812-Feb-18 2496 384 ~ 2304 816 ~ 72013-Feb-18 2441 497 ~ 2329 899 192 78714-Feb-18 2361 449 ~ 2088 931 128 67415-Feb-18 2586 497 ~ 2265 867 ~ 86716-Feb-18 2720 448 ~ 2512 864 ~ 83217-Feb-18 2265 385 ~ 1927 835 ~ 77118-Feb-18 2368 416 ~ 2272 912 176 81619-Feb-18 2682 369 ~ 2570 867 112 67420-Feb-18 2272 496 ~ 2048 928 ~ 89621-Feb-18 2313 369 ~ 2200 883 128 85122-Feb-18 2112 432 ~ 1808 928 80 78423-Feb-18 2425 417 ~ 2281 899 128 72224-Feb-18 3104 464 ~ 2784 928 160 67225-Feb-18 2680 368 ~ 2480 896 192 60826-Feb-18 2320 400 ~ 1840 896 240 62427-Feb-18 2272 448 ~ 2144 928 160 62428-Feb-18 1872 304 ~ 1744 864 192 688
AVG. 2388 434 #DIV/0! 2152 861 234 714MIN. 1872 304 0 1744 736 80 576MAX. 3104 497 0 2784 947 803 896
Analysis Report of FETP streams.
DATECOD RESULTS
JHA DIRE.BPS
OUTLET
COD REPORT FOR THE MONTH OF FEB. - 2018

ANK. PANOLI JHAGADIA INLET OUTLET1-Feb-18 810 36 ~ 750 84 36 722-Feb-18 870 42 ~ 690 78 36 663-Feb-18 900 48 ~ 750 78 198 664-Feb-18 870 42 ~ 660 78 234 665-Feb-18 540 42 ~ 510 66 12 546-Feb-18 840 18 ~ 600 60 372 487-Feb-18 900 36 ~ 750 72 168 548-Feb-18 810 42 ~ 600 60 12 429-Feb-18 690 30 ~ 630 66 18 5410-Feb-18 780 42 ~ 660 60 192 4211-Feb-18 810 42 ~ 660 66 18 5412-Feb-18 840 42 ~ 660 30 30 2413-Feb-18 810 42 ~ 600 30 18 1814-Feb-18 990 30 ~ 945 48 24 4215-Feb-18 795 30 ~ 645 54 ~ 3616-Feb-18 885 24 ~ 765 93 15 5117-Feb-18 885 24 ~ 780 132 12 4818-Feb-18 705 30 ~ 600 96 ~ 8419-Feb-18 1005 12 ~ 780 108 ~ 7820-Feb-18 750 18 ~ 645 90 ~ 4221-Feb-18 795 12 ~ 645 66 12 5422-Feb-18 945 36 ~ 900 102 30 6023-Feb-18 705 12 ~ 600 84 ~ 4824-Feb-18 705 18 ~ 540 78 12 6025-Feb-18 630 12 ~ 480 60 12 4226-Feb-18 855 48 ~ 570 84 12 7227-Feb-18 1170 60 ~ 660 102 18 6028-Feb-18 675 24 ~ 615 78 12 42
AVG. 820 32 #DIV/0! 668 75 65 53MIN. 540 12 0 480 30 12 18MAX. 1170 60 0 945 132 372 84
BPS OUTLET
DATEBOD RESULTS
Analysis Report of FETP streams.
BOD REPORT FOR THE MONTH OF FEB. - 2018
JHA DIRE.
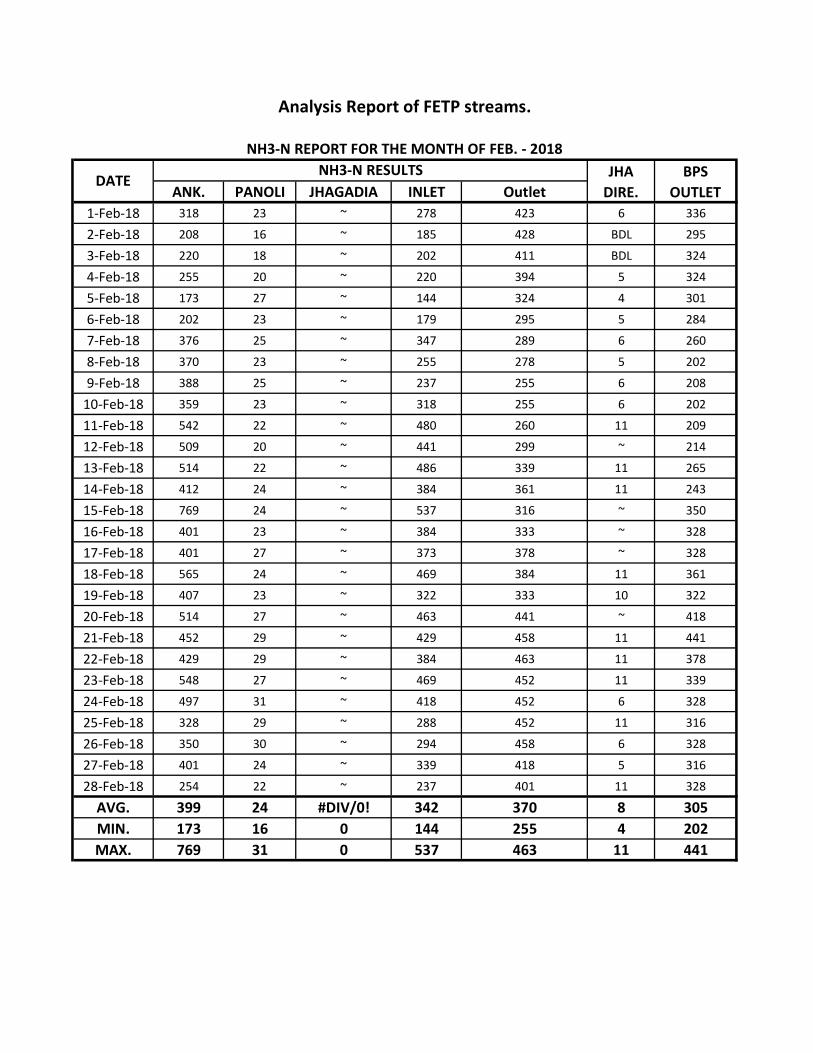
ANK. PANOLI JHAGADIA INLET Outlet1-Feb-18 318 23 ~ 278 423 6 336
2-Feb-18 208 16 ~ 185 428 BDL 295
3-Feb-18 220 18 ~ 202 411 BDL 324
4-Feb-18 255 20 ~ 220 394 5 324
5-Feb-18 173 27 ~ 144 324 4 301
6-Feb-18 202 23 ~ 179 295 5 284
7-Feb-18 376 25 ~ 347 289 6 260
8-Feb-18 370 23 ~ 255 278 5 202
9-Feb-18 388 25 ~ 237 255 6 208
10-Feb-18 359 23 ~ 318 255 6 202
11-Feb-18 542 22 ~ 480 260 11 209
12-Feb-18 509 20 ~ 441 299 ~ 214
13-Feb-18 514 22 ~ 486 339 11 265
14-Feb-18 412 24 ~ 384 361 11 243
15-Feb-18 769 24 ~ 537 316 ~ 350
16-Feb-18 401 23 ~ 384 333 ~ 328
17-Feb-18 401 27 ~ 373 378 ~ 328
18-Feb-18 565 24 ~ 469 384 11 361
19-Feb-18 407 23 ~ 322 333 10 322
20-Feb-18 514 27 ~ 463 441 ~ 418
21-Feb-18 452 29 ~ 429 458 11 441
22-Feb-18 429 29 ~ 384 463 11 378
23-Feb-18 548 27 ~ 469 452 11 339
24-Feb-18 497 31 ~ 418 452 6 328
25-Feb-18 328 29 ~ 288 452 11 316
26-Feb-18 350 30 ~ 294 458 6 328
27-Feb-18 401 24 ~ 339 418 5 316
28-Feb-18 254 22 ~ 237 401 11 328
AVG. 399 24 #DIV/0! 342 370 8 305MIN. 173 16 0 144 255 4 202MAX. 769 31 0 537 463 11 441
NH3-N REPORT FOR THE MONTH OF FEB. - 2018
Analysis Report of FETP streams.
DATE JHA DIRE.
BPS OUTLET
NH3-N RESULTS

ANK. PANOLI JHAGADIA INLET Outlet1-Feb-18 366 123 ~ 298 111 144 1092-Feb-18 287 126 ~ 252 104 120 1223-Feb-18 426 101 ~ 202 112 144 924-Feb-18 271 67 ~ 236 106 115 835-Feb-18 493 90 ~ 274 77 158 1066-Feb-18 396 102 ~ 426 133 123 1157-Feb-18 504 165 ~ 490 83 187 978-Feb-18 322 127 ~ 329 96 114 889-Feb-18 283 84 ~ 273 66 91 6210-Feb-18 163 117 ~ 197 78 119 7911-Feb-18 257 122 ~ 374 102 88 10012-Feb-18 384 96 ~ 409 68 ~ 8113-Feb-18 310 102 ~ 321 101 106 9214-Feb-18 351 114 ~ 370 102 97 14115-Feb-18 264 112 ~ 308 129 ~ 14916-Feb-18 375 101 ~ 364 91 ~ 15417-Feb-18 275 114 ~ 381 103 ~ 9318-Feb-18 269 90 ~ 471 115 77 10019-Feb-18 252 133 ~ 383 127 87 11820-Feb-18 378 85 ~ 334 129 ~ 10121-Feb-18 237 80 ~ 393 123 86 10522-Feb-18 358 94 ~ 241 98 85 8723-Feb-18 306 117 ~ 433 80 49 7824-Feb-18 396 79 ~ 468 102 84 16025-Feb-18 342 89 ~ 393 90 98 14626-Feb-18 383 91 ~ 219 112 99 11927-Feb-18 297 90 ~ 400 117 117 152
28-Feb-18 210 88 ~ 373 87 81 110
AVG. 327 104 #DIV/0! 343 102 107 109MIN. 163 67 0 197 66 49 62MAX. 504 165 0 490 133 187 160
DATETSS RESULTS JHA
DIRE.BPS
OUTLET
TSS REPORT FOR THE MONTH OF FEB - 2018
Analysis Report of FETP streams.
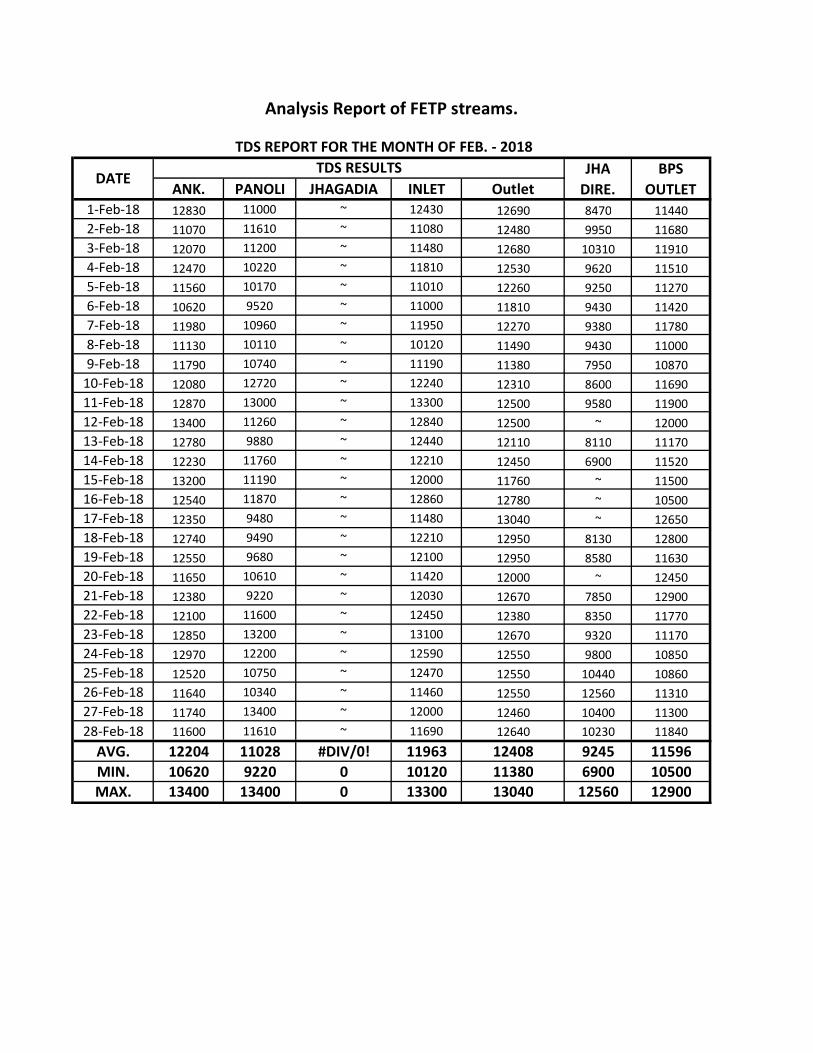
ANK. PANOLI JHAGADIA INLET Outlet1-Feb-18 12830 11000 ~ 12430 12690 8470 114402-Feb-18 11070 11610 ~ 11080 12480 9950 116803-Feb-18 12070 11200 ~ 11480 12680 10310 119104-Feb-18 12470 10220 ~ 11810 12530 9620 115105-Feb-18 11560 10170 ~ 11010 12260 9250 112706-Feb-18 10620 9520 ~ 11000 11810 9430 114207-Feb-18 11980 10960 ~ 11950 12270 9380 117808-Feb-18 11130 10110 ~ 10120 11490 9430 110009-Feb-18 11790 10740 ~ 11190 11380 7950 1087010-Feb-18 12080 12720 ~ 12240 12310 8600 1169011-Feb-18 12870 13000 ~ 13300 12500 9580 1190012-Feb-18 13400 11260 ~ 12840 12500 ~ 1200013-Feb-18 12780 9880 ~ 12440 12110 8110 1117014-Feb-18 12230 11760 ~ 12210 12450 6900 1152015-Feb-18 13200 11190 ~ 12000 11760 ~ 1150016-Feb-18 12540 11870 ~ 12860 12780 ~ 1050017-Feb-18 12350 9480 ~ 11480 13040 ~ 1265018-Feb-18 12740 9490 ~ 12210 12950 8130 1280019-Feb-18 12550 9680 ~ 12100 12950 8580 1163020-Feb-18 11650 10610 ~ 11420 12000 ~ 1245021-Feb-18 12380 9220 ~ 12030 12670 7850 1290022-Feb-18 12100 11600 ~ 12450 12380 8350 1177023-Feb-18 12850 13200 ~ 13100 12670 9320 1117024-Feb-18 12970 12200 ~ 12590 12550 9800 1085025-Feb-18 12520 10750 ~ 12470 12550 10440 1086026-Feb-18 11640 10340 ~ 11460 12550 12560 1131027-Feb-18 11740 13400 ~ 12000 12460 10400 1130028-Feb-18 11600 11610 ~ 11690 12640 10230 11840
AVG. 12204 11028 #DIV/0! 11963 12408 9245 11596MIN. 10620 9220 0 10120 11380 6900 10500MAX. 13400 13400 0 13300 13040 12560 12900
TDS REPORT FOR THE MONTH OF FEB. - 2018
Analysis Report of FETP streams.
BPS OUTLET
JHA DIRE.
DATETDS RESULTS
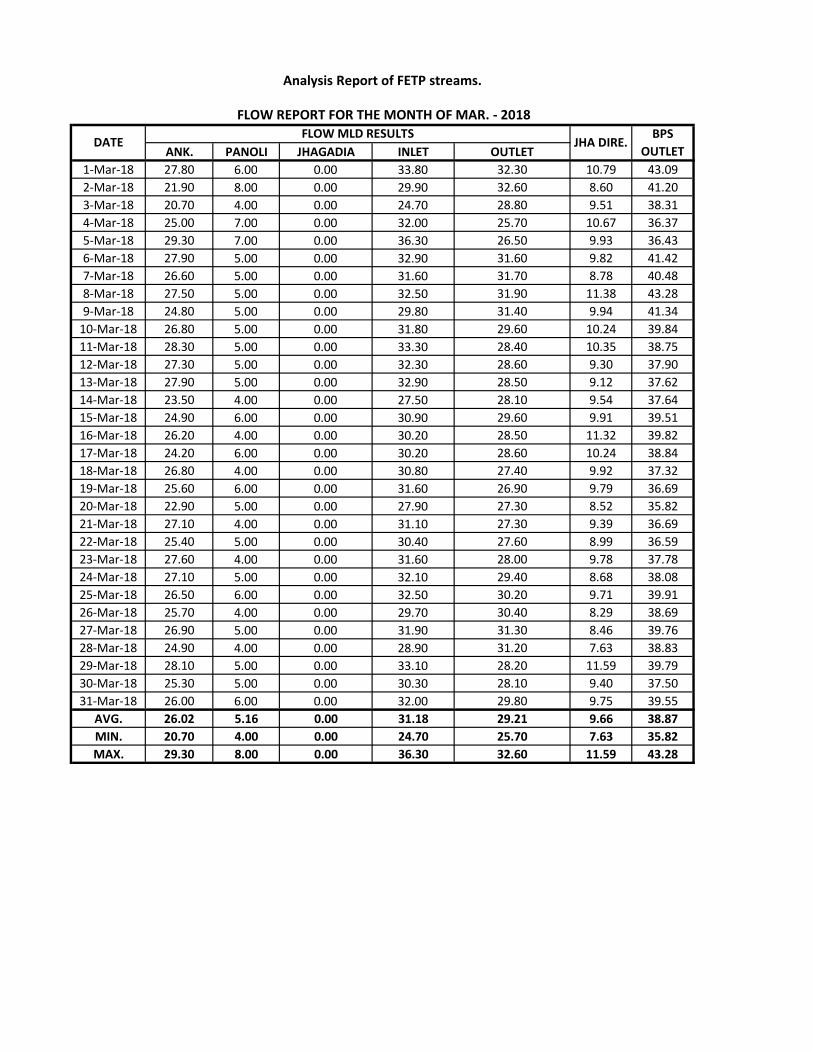
ANK. PANOLI JHAGADIA INLET OUTLET1-Mar-18 27.80 6.00 0.00 33.80 32.30 10.79 43.092-Mar-18 21.90 8.00 0.00 29.90 32.60 8.60 41.203-Mar-18 20.70 4.00 0.00 24.70 28.80 9.51 38.314-Mar-18 25.00 7.00 0.00 32.00 25.70 10.67 36.375-Mar-18 29.30 7.00 0.00 36.30 26.50 9.93 36.436-Mar-18 27.90 5.00 0.00 32.90 31.60 9.82 41.427-Mar-18 26.60 5.00 0.00 31.60 31.70 8.78 40.488-Mar-18 27.50 5.00 0.00 32.50 31.90 11.38 43.289-Mar-18 24.80 5.00 0.00 29.80 31.40 9.94 41.3410-Mar-18 26.80 5.00 0.00 31.80 29.60 10.24 39.8411-Mar-18 28.30 5.00 0.00 33.30 28.40 10.35 38.7512-Mar-18 27.30 5.00 0.00 32.30 28.60 9.30 37.9013-Mar-18 27.90 5.00 0.00 32.90 28.50 9.12 37.6214-Mar-18 23.50 4.00 0.00 27.50 28.10 9.54 37.6415-Mar-18 24.90 6.00 0.00 30.90 29.60 9.91 39.5116-Mar-18 26.20 4.00 0.00 30.20 28.50 11.32 39.8217-Mar-18 24.20 6.00 0.00 30.20 28.60 10.24 38.8418-Mar-18 26.80 4.00 0.00 30.80 27.40 9.92 37.3219-Mar-18 25.60 6.00 0.00 31.60 26.90 9.79 36.6920-Mar-18 22.90 5.00 0.00 27.90 27.30 8.52 35.8221-Mar-18 27.10 4.00 0.00 31.10 27.30 9.39 36.6922-Mar-18 25.40 5.00 0.00 30.40 27.60 8.99 36.5923-Mar-18 27.60 4.00 0.00 31.60 28.00 9.78 37.7824-Mar-18 27.10 5.00 0.00 32.10 29.40 8.68 38.0825-Mar-18 26.50 6.00 0.00 32.50 30.20 9.71 39.9126-Mar-18 25.70 4.00 0.00 29.70 30.40 8.29 38.6927-Mar-18 26.90 5.00 0.00 31.90 31.30 8.46 39.7628-Mar-18 24.90 4.00 0.00 28.90 31.20 7.63 38.8329-Mar-18 28.10 5.00 0.00 33.10 28.20 11.59 39.7930-Mar-18 25.30 5.00 0.00 30.30 28.10 9.40 37.5031-Mar-18 26.00 6.00 0.00 32.00 29.80 9.75 39.55
AVG. 26.02 5.16 0.00 31.18 29.21 9.66 38.87MIN. 20.70 4.00 0.00 24.70 25.70 7.63 35.82MAX. 29.30 8.00 0.00 36.30 32.60 11.59 43.28
DATEFLOW MLD RESULTS
FLOW REPORT FOR THE MONTH OF MAR. - 2018
Analysis Report of FETP streams.
JHA DIRE.BPS
OUTLET

ANK. PANOLI JHAGADIA INLET OUTLET1-Mar-18 8.12 7.75 ~ 8.06 7.84 7.55 7.812-Mar-18 8.00 7.68 ~ 8.12 7.86 7.40 7.803-Mar-18 7.51 7.70 ~ 8.07 7.71 7.28 7.684-Mar-18 7.77 7.69 ~ 7.86 7.78 7.37 7.855-Mar-18 8.10 7.58 ~ 8.23 7.62 7.33 7.646-Mar-18 8.08 7.61 ~ 7.98 7.62 7.29 7.727-Mar-18 7.73 7.52 ~ 8.05 7.60 7.29 7.548-Mar-18 7.90 7.64 ~ 7.87 7.61 7.40 7.619-Mar-18 8.21 7.70 ~ 8.05 7.52 7.23 7.6610-Mar-18 8.10 7.73 ~ 7.99 7.52 7.30 7.5811-Mar-18 7.92 7.76 ~ 7.94 7.53 7.27 7.6112-Mar-18 7.32 7.82 ~ 7.55 7.44 7.41 7.6013-Mar-18 8.07 7.81 ~ 8.14 7.54 7.37 7.6414-Mar-18 6.74 7.86 ~ 6.89 7.29 7.33 7.4815-Mar-18 6.85 7.63 ~ 7.11 7.31 7.26 7.6016-Mar-18 7.12 7.70 ~ 7.44 7.37 7.37 7.6217-Mar-18 7.20 7.81 ~ 7.57 7.34 7.24 7.5118-Mar-18 8.01 7.98 ~ 8.14 7.75 7.48 7.7319-Mar-18 7.80 7.95 ~ 7.87 7.50 7.47 7.7220-Mar-18 7.85 8.04 ~ 8.01 7.38 7.23 7.4421-Mar-18 7.81 7.84 ~ 7.90 7.46 7.41 7.4722-Mar-18 8.07 7.85 ~ 8.11 7.40 7.44 7.4823-Mar-18 7.89 7.74 ~ 7.90 7.41 7.70 7.6024-Mar-18 7.73 7.64 ~ 7.88 7.29 7.31 7.3325-Mar-18 8.02 7.74 ~ 8.16 7.33 7.31 7.5326-Mar-18 7.45 7.53 ~ 7.72 7.12 7.29 7.3327-Mar-18 7.53 7.38 ~ 7.88 7.11 7.10 7.3028-Mar-18 7.18 7.67 ~ 7.54 7.22 7.37 7.3529-Mar-18 7.70 7.64 ~ 7.90 7.20 7.30 7.2230-Mar-18 7.94 7.71 ~ 8.03 7.20 7.39 7.4031-Mar-18 7.49 7.72 ~ 7.86 7.34 7.34 7.27
AVG. 7.72 7.72 #DIV/0! 7.87 7.46 7.35 7.55MIN. 6.74 7.38 0.00 6.89 7.11 7.10 7.22MAX. 8.21 8.04 0.00 8.23 7.86 7.70 7.85
pH REPORT FOR THE MONTH OF MAR. - 2018
Analysis Report of FETP streams.
JHA DIRE.BPS
OUTLETDATE
pH RESULTS

ANK. PANOLI JHAGADIA INLET OUTLET1-Mar-18 1984 384 ~ 1968 896 128 7202-Mar-18 1808 320 ~ 1792 912 192 7203-Mar-18 2354 451 ~ 1774 822 225 7414-Mar-18 2064 464 ~ 1856 848 400 6245-Mar-18 1847 433 ~ 1558 738 240 5786-Mar-18 2240 496 ~ 2096 768 160 5447-Mar-18 2024 706 ~ 1975 738 257 5948-Mar-18 1840 512 ~ 1968 784 800 6249-Mar-18 1693 451 ~ 1854 725 193 56410-Mar-18 1440 496 ~ 1728 768 160 54411-Mar-18 1856 448 ~ 1712 800 160 65612-Mar-18 2048 464 ~ 1888 784 160 64013-Mar-18 2120 481 ~ 2008 738 176 64214-Mar-18 2152 481 ~ 1959 706 385 51415-Mar-18 2008 514 ~ 1911 690 385 53016-Mar-18 1696 448 ~ 1536 720 144 48017-Mar-18 1863 465 ~ 1606 722 192 65818-Mar-18 2000 416 ~ 1856 640 128 54419-Mar-18 2499 387 ~ 2628 628 209 49920-Mar-18 1848 478 ~ 1673 637 366 55721-Mar-18 1686 385 ~ 1654 610 176 41722-Mar-18 1590 449 ~ 1526 594 176 43323-Mar-18 1296 336 ~ 1168 576 112 38424-Mar-18 1408 384 ~ 1296 576 160 46425-Mar-18 1440 480 ~ 1424 624 368 43226-Mar-18 1792 528 ~ 1568 544 176 43227-Mar-18 1808 480 ~ 1776 624 256 38428-Mar-18 1450 462 ~ 1322 509 223 41429-Mar-18 1606 401 ~ 1429 481 192 41730-Mar-18 1536 336 ~ 1520 464 160 41631-Mar-18 1760 416 ~ 1760 448 560 400
AVG. 1831 450 #DIV/0! 1735 681 246 534MIN. 1296 320 0 1168 448 112 384MAX. 2499 706 0 2628 912 800 741
JHA DIRE.BPS
OUTLET
COD REPORT FOR THE MONTH OF MAR. - 2018
Analysis Report of FETP streams.
DATECOD RESULTS
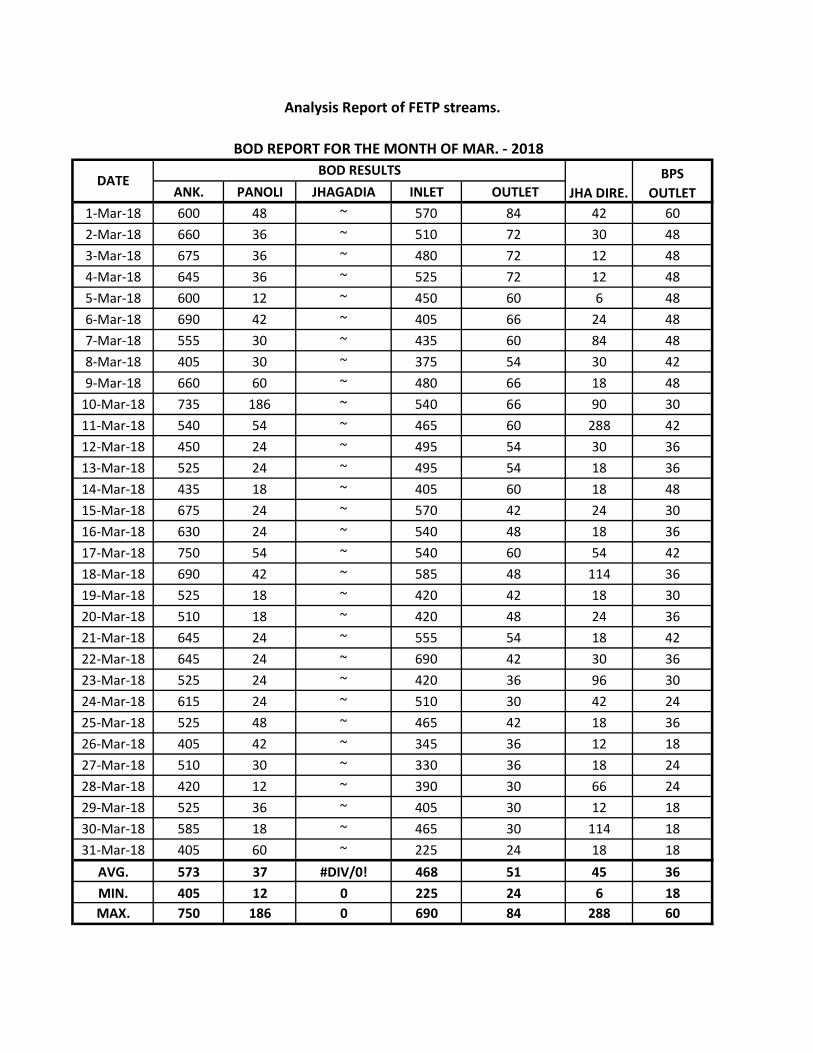
ANK. PANOLI JHAGADIA INLET OUTLET1-Mar-18 600 48 ~ 570 84 42 602-Mar-18 660 36 ~ 510 72 30 483-Mar-18 675 36 ~ 480 72 12 484-Mar-18 645 36 ~ 525 72 12 485-Mar-18 600 12 ~ 450 60 6 486-Mar-18 690 42 ~ 405 66 24 487-Mar-18 555 30 ~ 435 60 84 488-Mar-18 405 30 ~ 375 54 30 429-Mar-18 660 60 ~ 480 66 18 4810-Mar-18 735 186 ~ 540 66 90 3011-Mar-18 540 54 ~ 465 60 288 4212-Mar-18 450 24 ~ 495 54 30 3613-Mar-18 525 24 ~ 495 54 18 3614-Mar-18 435 18 ~ 405 60 18 4815-Mar-18 675 24 ~ 570 42 24 3016-Mar-18 630 24 ~ 540 48 18 3617-Mar-18 750 54 ~ 540 60 54 4218-Mar-18 690 42 ~ 585 48 114 3619-Mar-18 525 18 ~ 420 42 18 3020-Mar-18 510 18 ~ 420 48 24 3621-Mar-18 645 24 ~ 555 54 18 4222-Mar-18 645 24 ~ 690 42 30 3623-Mar-18 525 24 ~ 420 36 96 3024-Mar-18 615 24 ~ 510 30 42 2425-Mar-18 525 48 ~ 465 42 18 3626-Mar-18 405 42 ~ 345 36 12 1827-Mar-18 510 30 ~ 330 36 18 2428-Mar-18 420 12 ~ 390 30 66 2429-Mar-18 525 36 ~ 405 30 12 1830-Mar-18 585 18 ~ 465 30 114 1831-Mar-18 405 60 ~ 225 24 18 18
AVG. 573 37 #DIV/0! 468 51 45 36MIN. 405 12 0 225 24 6 18MAX. 750 186 0 690 84 288 60
DATEBOD RESULTS
JHA DIRE.BPS
OUTLET
BOD REPORT FOR THE MONTH OF MAR. - 2018
Analysis Report of FETP streams.
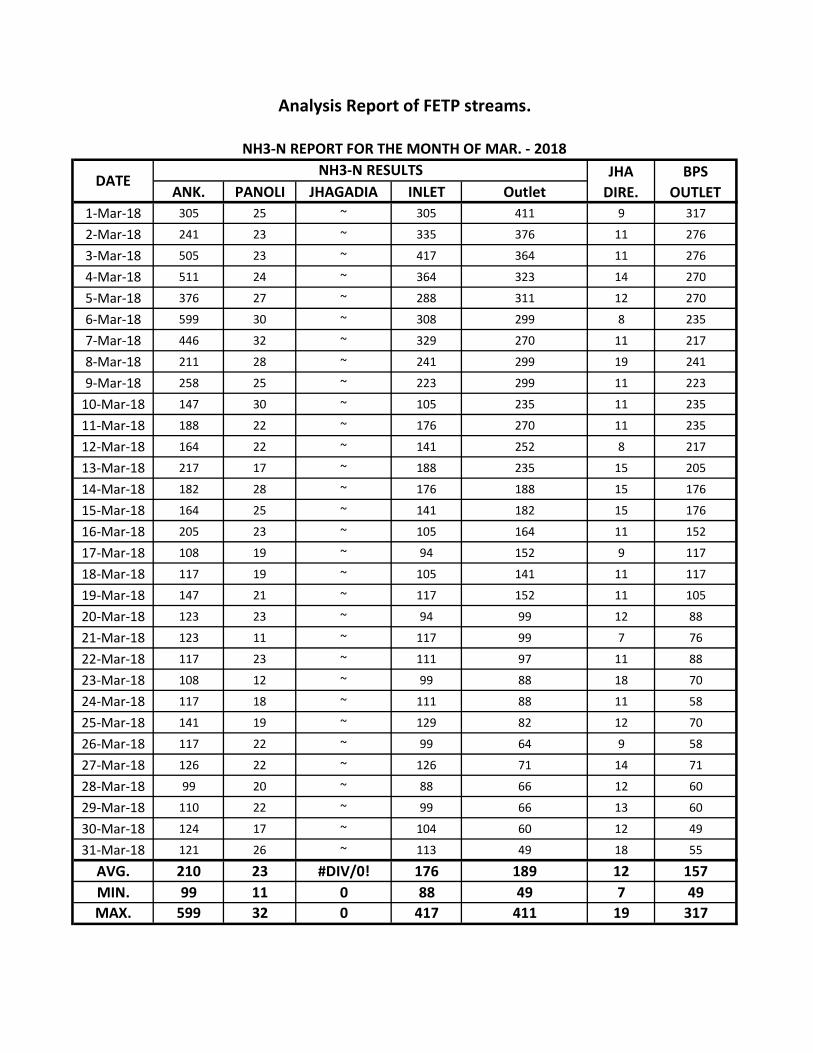
ANK. PANOLI JHAGADIA INLET Outlet1-Mar-18 305 25 ~ 305 411 9 317
2-Mar-18 241 23 ~ 335 376 11 276
3-Mar-18 505 23 ~ 417 364 11 276
4-Mar-18 511 24 ~ 364 323 14 270
5-Mar-18 376 27 ~ 288 311 12 270
6-Mar-18 599 30 ~ 308 299 8 235
7-Mar-18 446 32 ~ 329 270 11 217
8-Mar-18 211 28 ~ 241 299 19 241
9-Mar-18 258 25 ~ 223 299 11 223
10-Mar-18 147 30 ~ 105 235 11 235
11-Mar-18 188 22 ~ 176 270 11 235
12-Mar-18 164 22 ~ 141 252 8 217
13-Mar-18 217 17 ~ 188 235 15 205
14-Mar-18 182 28 ~ 176 188 15 176
15-Mar-18 164 25 ~ 141 182 15 176
16-Mar-18 205 23 ~ 105 164 11 152
17-Mar-18 108 19 ~ 94 152 9 117
18-Mar-18 117 19 ~ 105 141 11 117
19-Mar-18 147 21 ~ 117 152 11 105
20-Mar-18 123 23 ~ 94 99 12 88
21-Mar-18 123 11 ~ 117 99 7 76
22-Mar-18 117 23 ~ 111 97 11 88
23-Mar-18 108 12 ~ 99 88 18 70
24-Mar-18 117 18 ~ 111 88 11 58
25-Mar-18 141 19 ~ 129 82 12 70
26-Mar-18 117 22 ~ 99 64 9 58
27-Mar-18 126 22 ~ 126 71 14 71
28-Mar-18 99 20 ~ 88 66 12 60
29-Mar-18 110 22 ~ 99 66 13 60
30-Mar-18 124 17 ~ 104 60 12 49
31-Mar-18 121 26 ~ 113 49 18 55
AVG. 210 23 #DIV/0! 176 189 12 157MIN. 99 11 0 88 49 7 49MAX. 599 32 0 417 411 19 317
NH3-N REPORT FOR THE MONTH OF MAR. - 2018JHA
DIRE.BPS
OUTLET
Analysis Report of FETP streams.
NH3-N RESULTSDATE

ANK. PANOLI JHAGADIA INLET Outlet1-Mar-18 249 154 ~ 461 122 103 1512-Mar-18 116 126 ~ 369 76 59 1753-Mar-18 118 102 ~ 276 98 66 1574-Mar-18 139 156 ~ 316 90 68 725-Mar-18 256 187 ~ 390 90 80 956-Mar-18 125 102 ~ 377 65 50 747-Mar-18 123 94 ~ 302 71 80 688-Mar-18 212 113 ~ 307 65 114 709-Mar-18 209 83 ~ 360 72 68 5110-Mar-18 226 110 ~ 333 68 67 5711-Mar-18 247 109 ~ 244 97 62 9712-Mar-18 240 122 ~ 270 61 92 5913-Mar-18 282 173 ~ 283 96 78 8214-Mar-18 172 84 ~ 257 83 50 8015-Mar-18 196 128 ~ 252 97 57 7216-Mar-18 182 86 ~ 222 102 52 6917-Mar-18 234 80 ~ 229 99 121 15318-Mar-18 254 97 ~ 310 67 66 8719-Mar-18 261 159 ~ 357 90 77 10320-Mar-18 167 95 ~ 210 103 82 12121-Mar-18 265 102 ~ 299 90 89 12422-Mar-18 288 121 ~ 256 106 82 10123-Mar-18 221 90 ~ 208 50 42 4124-Mar-18 214 137 ~ 239 55 59 6325-Mar-18 158 61 ~ 216 61 72 6226-Mar-18 161 112 ~ 247 59 92 7727-Mar-18 219 103 ~ 332 60 84 7128-Mar-18 360 104 ~ 536 86 94 7329-Mar-18 239 102 ~ 353 94 83 8130-Mar-18 208 114 ~ 298 55 70 122
31-Mar-18 280 117 ~ 343 86 92 72
AVG. 214 114 #DIV/0! 305 81 76 90MIN. 116 61 0 208 50 42 41MAX. 360 187 0 536 122 121 175
JHA DIRE.
BPS OUTLET
TSS REPORT FOR THE MONTH OF MAR - 2018
Analysis Report of FETP streams.
DATETSS RESULTS

ANK. PANOLI JHAGADIA INLET Outlet1-Mar-18 11110 10720 ~ 10820 12320 9990 119002-Mar-18 9890 11160 ~ 11750 12290 8590 115703-Mar-18 12920 8910 ~ 10520 11740 8720 110004-Mar-18 13300 9830 ~ 11570 11870 7740 114905-Mar-18 9590 9800 ~ 10440 11370 7970 105406-Mar-18 12740 11110 ~ 11690 11550 7610 104107-Mar-18 11780 11160 ~ 11540 11220 7600 105808-Mar-18 9850 11760 ~ 10770 11310 8820 102709-Mar-18 10380 11950 ~ 10900 11210 9590 1026010-Mar-18 9620 11310 ~ 10260 10970 9210 1001011-Mar-18 10440 12160 ~ 10560 10960 8870 1002012-Mar-18 10240 11250 ~ 10240 10910 8780 1040013-Mar-18 10480 13100 ~ 10760 10880 7740 1029014-Mar-18 10080 11300 ~ 10130 10550 7810 999015-Mar-18 9420 11720 ~ 9840 10410 8490 982016-Mar-18 11340 12820 ~ 11490 11140 9220 1045017-Mar-18 10910 9910 ~ 10740 11020 8360 1012018-Mar-18 10790 10940 ~ 10860 11550 8570 1075019-Mar-18 11080 11520 ~ 11630 10910 8380 1019020-Mar-18 10670 9610 ~ 10470 11130 9850 1033021-Mar-18 11160 10280 ~ 11120 11310 9910 1047022-Mar-18 10640 14100 ~ 11290 11180 7880 1033023-Mar-18 10160 13900 ~ 10880 11070 9000 1041024-Mar-18 10460 14200 ~ 10890 10940 8110 1049025-Mar-18 10490 14700 ~ 11100 11090 9470 1065026-Mar-18 10360 12770 ~ 11040 10910 8600 985027-Mar-18 10760 13900 ~ 11690 10860 9260 1023028-Mar-18 10140 10120 ~ 9940 10660 8860 985029-Mar-18 9760 11630 ~ 9990 10740 7830 992030-Mar-18 9700 12280 ~ 10590 10850 8560 981031-Mar-18 10210 11710 ~ 10420 10230 8380 9850
AVG. 10660 11665 #DIV/0! 10836 11134 8638 10395MIN. 9420 8910 0 9840 10230 7600 9810MAX. 13300 14700 0 11750 12320 9990 11900
DATETDS RESULTS
TDS REPORT FOR THE MONTH OF MAR. - 2018 BPS
OUTLETJHA
DIRE.
Analysis Report of FETP streams.
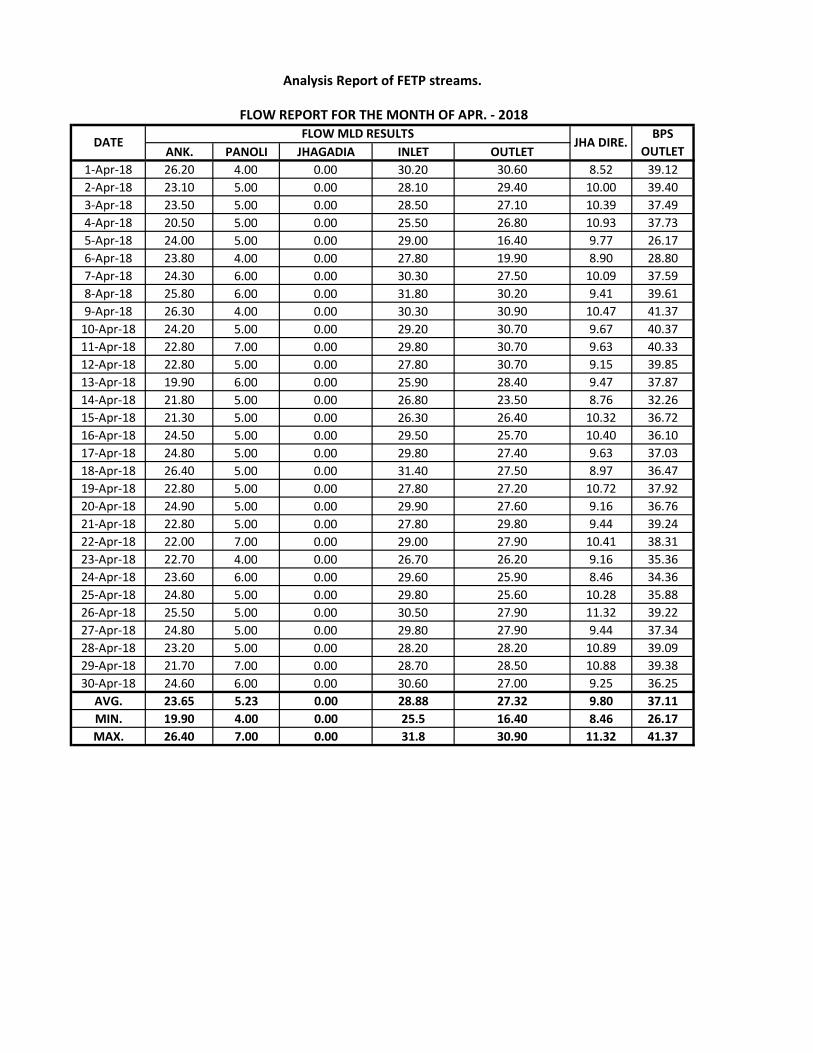
ANK. PANOLI JHAGADIA INLET OUTLET1-Apr-18 26.20 4.00 0.00 30.20 30.60 8.52 39.122-Apr-18 23.10 5.00 0.00 28.10 29.40 10.00 39.403-Apr-18 23.50 5.00 0.00 28.50 27.10 10.39 37.494-Apr-18 20.50 5.00 0.00 25.50 26.80 10.93 37.735-Apr-18 24.00 5.00 0.00 29.00 16.40 9.77 26.176-Apr-18 23.80 4.00 0.00 27.80 19.90 8.90 28.807-Apr-18 24.30 6.00 0.00 30.30 27.50 10.09 37.598-Apr-18 25.80 6.00 0.00 31.80 30.20 9.41 39.619-Apr-18 26.30 4.00 0.00 30.30 30.90 10.47 41.3710-Apr-18 24.20 5.00 0.00 29.20 30.70 9.67 40.3711-Apr-18 22.80 7.00 0.00 29.80 30.70 9.63 40.3312-Apr-18 22.80 5.00 0.00 27.80 30.70 9.15 39.8513-Apr-18 19.90 6.00 0.00 25.90 28.40 9.47 37.8714-Apr-18 21.80 5.00 0.00 26.80 23.50 8.76 32.2615-Apr-18 21.30 5.00 0.00 26.30 26.40 10.32 36.7216-Apr-18 24.50 5.00 0.00 29.50 25.70 10.40 36.1017-Apr-18 24.80 5.00 0.00 29.80 27.40 9.63 37.0318-Apr-18 26.40 5.00 0.00 31.40 27.50 8.97 36.4719-Apr-18 22.80 5.00 0.00 27.80 27.20 10.72 37.9220-Apr-18 24.90 5.00 0.00 29.90 27.60 9.16 36.7621-Apr-18 22.80 5.00 0.00 27.80 29.80 9.44 39.2422-Apr-18 22.00 7.00 0.00 29.00 27.90 10.41 38.3123-Apr-18 22.70 4.00 0.00 26.70 26.20 9.16 35.3624-Apr-18 23.60 6.00 0.00 29.60 25.90 8.46 34.3625-Apr-18 24.80 5.00 0.00 29.80 25.60 10.28 35.8826-Apr-18 25.50 5.00 0.00 30.50 27.90 11.32 39.2227-Apr-18 24.80 5.00 0.00 29.80 27.90 9.44 37.3428-Apr-18 23.20 5.00 0.00 28.20 28.20 10.89 39.0929-Apr-18 21.70 7.00 0.00 28.70 28.50 10.88 39.3830-Apr-18 24.60 6.00 0.00 30.60 27.00 9.25 36.25
AVG. 23.65 5.23 0.00 28.88 27.32 9.80 37.11MIN. 19.90 4.00 0.00 25.5 16.40 8.46 26.17MAX. 26.40 7.00 0.00 31.8 30.90 11.32 41.37
DATEFLOW MLD RESULTS
JHA DIRE.BPS
OUTLET
Analysis Report of FETP streams.
FLOW REPORT FOR THE MONTH OF APR. - 2018

ANK. PANOLI JHAGADIA INLET OUTLET1-Apr-18 7.37 7.88 ~ 7.37 7.13 7.70 7.402-Apr-18 7.54 7.71 ~ 8.09 8.24 7.29 7.313-Apr-18 6.89 7.70 ~ 8.03 7.19 7.32 7.204-Apr-18 7.83 7.71 ~ 7.65 7.10 7.22 7.255-Apr-18 8.30 7.83 ~ 8.25 7.19 7.50 7.476-Apr-18 7.73 7.73 ~ 8.14 7.27 7.20 7.277-Apr-18 7.53 7.65 ~ 7.90 7.04 7.35 7.378-Apr-18 7.73 7.80 ~ 7.85 7.29 7.50 7.439-Apr-18 7.55 7.52 ~ 7.93 7.29 7.47 7.0710-Apr-18 7.54 7.56 ~ 7.80 7.12 7.36 7.2211-Apr-18 7.97 7.50 ~ 8.12 7.05 7.02 7.1512-Apr-18 8.00 7.68 ~ 8.12 7.06 7.33 7.2813-Apr-18 7.86 7.62 ~ 7.99 7.15 7.16 7.0014-Apr-18 7.60 7.41 ~ 8.11 7.10 7.34 7.5015-Apr-18 7.39 7.52 ~ 7.45 7.04 7.42 7.2116-Apr-18 7.60 7.33 ~ 7.67 6.90 7.24 7.0717-Apr-18 7.84 7.66 ~ 8.07 7.20 7.38 7.2918-Apr-18 8.25 7.65 ~ 8.37 7.06 7.43 7.2219-Apr-18 7.71 7.67 ~ 8.01 7.08 7.50 7.0620-Apr-18 7.40 7.69 ~ 6.71 7.15 7.36 7.3521-Apr-18 8.04 7.77 ~ 8.14 7.60 7.31 7.3622-Apr-18 5.41 7.75 ~ 7.15 7.00 7.31 7.2523-Apr-18 6.65 7.70 ~ 7.23 7.18 7.47 7.4524-Apr-18 7.97 7.70 ~ 8.14 7.20 7.58 7.1225-Apr-18 7.08 7.62 ~ 8.01 7.23 7.35 7.1426-Apr-18 7.73 7.70 ~ 8.13 7.22 7.40 7.3427-Apr-18 7.90 7.52 ~ 8.38 7.27 7.19 7.1328-Apr-18 7.39 7.74 ~ 7.89 7.21 7.37 7.3829-Apr-18 7.71 7.70 ~ 7.81 7.22 7.42 7.4130-Apr-18 7.94 7.38 ~ 7.93 6.70 7.34 6.97
AVG. 7.58 7.65 #DIV/0! 7.88 7.18 7.36 7.26MIN. 5.41 7.33 0.00 6.71 6.70 7.02 6.97MAX. 8.30 7.88 0.00 8.38 8.24 7.70 7.50
JHA DIRE.BPS
OUTLET
pH REPORT FOR THE MONTH OF APR. - 2018
Analysis Report of FETP streams.
DATEpH RESULTS

ANK. PANOLI JHAGADIA INLET OUTLET1-Apr-18 1561 450 ~ 1306 462 385 3182-Apr-18 1493 497 ~ 1493 433 224 3853-Apr-18 1584 544 ~ 1344 432 160 3204-Apr-18 1269 433 ~ 1252 417 160 3535-Apr-18 2624 480 ~ 1632 480 208 3046-Apr-18 1728 432 ~ 1712 496 176 3687-Apr-18 1504 400 ~ 1296 432 176 3528-Apr-18 1526 433 ~ 1333 417 96 3699-Apr-18 1912 605 ~ 1561 446 143 38210-Apr-18 1429 674 ~ 1381 465 144 38511-Apr-18 1248 608 ~ 1216 416 112 35212-Apr-18 1840 544 ~ 1152 400 96 35213-Apr-18 1476 555 ~ 1650 476 190 34914-Apr-18 1888 512 ~ 1632 448 160 35215-Apr-18 1666 571 ~ 1555 507 888 34916-Apr-18 1718 530 ~ 1654 457 329 37717-Apr-18 1536 416 ~ 1408 496 200 38418-Apr-18 1412 444 ~ 1364 492 261 42019-Apr-18 1253 444 ~ 984 460 555 36520-Apr-18 1381 401 ~ 1076 457 481 36121-Apr-18 1488 464 ~ 1376 456 208 38422-Apr-18 2096 368 ~ 1632 416 272 33623-Apr-18 1648 368 ~ 1520 424 168 39224-Apr-18 1808 448 ~ 1392 448 176 36825-Apr-18 1296 352 ~ 1216 432 184 37626-Apr-18 1317 385 ~ 1108 473 216 36127-Apr-18 1312 400 ~ 976 480 280 46428-Apr-18 1204 385 ~ 1028 433 168 34529-Apr-18 1216 352 ~ 1040 440 240 38430-Apr-18 1440 384 ~ 1264 456 192 368
AVG. 1562 463 #DIV/0! 1352 452 242 366MIN. 1204 352 0 976 400 96 304MAX. 2624 674 0 1712 507 888 464
DATE
COD REPORT FOR THE MONTH OF APR. - 2018
Analysis Report of FETP streams.
COD RESULTSJHA DIRE.
BPS OUTLET
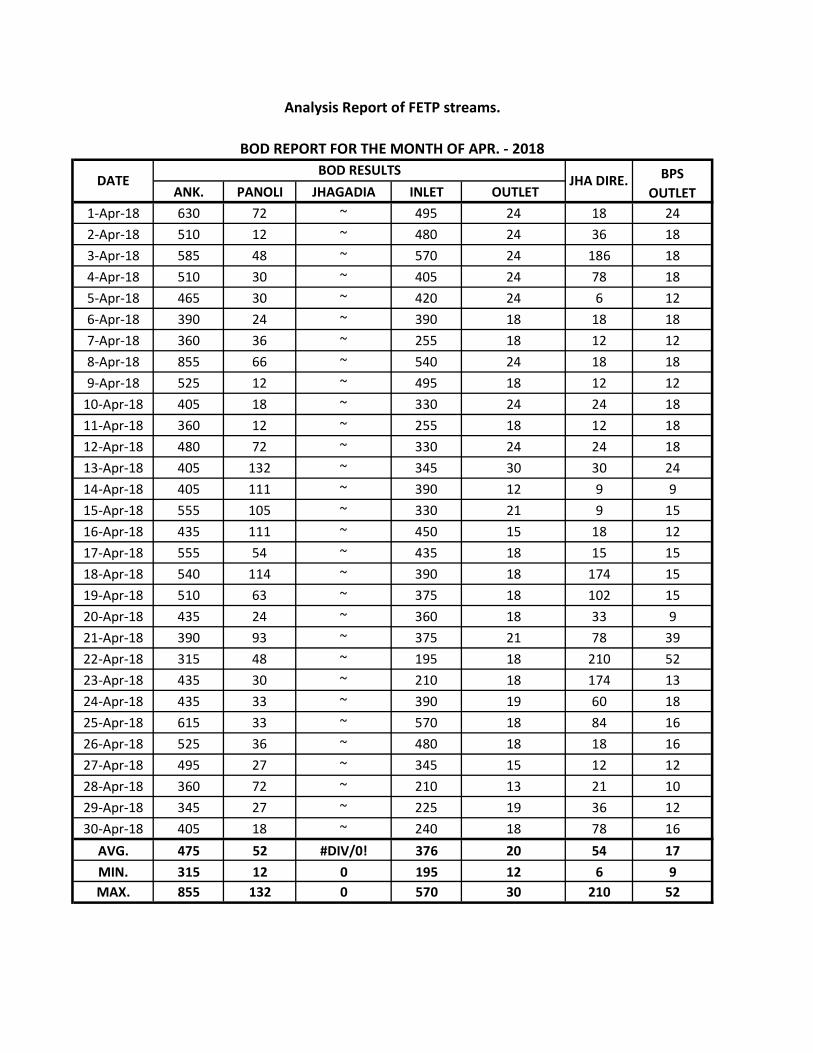
ANK. PANOLI JHAGADIA INLET OUTLET1-Apr-18 630 72 ~ 495 24 18 242-Apr-18 510 12 ~ 480 24 36 183-Apr-18 585 48 ~ 570 24 186 184-Apr-18 510 30 ~ 405 24 78 185-Apr-18 465 30 ~ 420 24 6 126-Apr-18 390 24 ~ 390 18 18 187-Apr-18 360 36 ~ 255 18 12 128-Apr-18 855 66 ~ 540 24 18 189-Apr-18 525 12 ~ 495 18 12 1210-Apr-18 405 18 ~ 330 24 24 1811-Apr-18 360 12 ~ 255 18 12 1812-Apr-18 480 72 ~ 330 24 24 1813-Apr-18 405 132 ~ 345 30 30 2414-Apr-18 405 111 ~ 390 12 9 915-Apr-18 555 105 ~ 330 21 9 1516-Apr-18 435 111 ~ 450 15 18 1217-Apr-18 555 54 ~ 435 18 15 1518-Apr-18 540 114 ~ 390 18 174 1519-Apr-18 510 63 ~ 375 18 102 1520-Apr-18 435 24 ~ 360 18 33 921-Apr-18 390 93 ~ 375 21 78 3922-Apr-18 315 48 ~ 195 18 210 5223-Apr-18 435 30 ~ 210 18 174 1324-Apr-18 435 33 ~ 390 19 60 1825-Apr-18 615 33 ~ 570 18 84 1626-Apr-18 525 36 ~ 480 18 18 1627-Apr-18 495 27 ~ 345 15 12 1228-Apr-18 360 72 ~ 210 13 21 1029-Apr-18 345 27 ~ 225 19 36 1230-Apr-18 405 18 ~ 240 18 78 16
AVG. 475 52 #DIV/0! 376 20 54 17MIN. 315 12 0 195 12 6 9MAX. 855 132 0 570 30 210 52
Analysis Report of FETP streams.
BOD REPORT FOR THE MONTH OF APR. - 2018
DATEBOD RESULTS
JHA DIRE. BPS OUTLET

ANK. PANOLI JHAGADIA INLET Outlet1-Apr-18 110 17 ~ 99 55 14 492-Apr-18 137 29 ~ 115 44 18 383-Apr-18 121 44 ~ 104 46 8 384-Apr-18 99 27 ~ 88 44 5 385-Apr-18 121 28 ~ 121 49 8 356-Apr-18 93 27 ~ 85 35 7 307-Apr-18 132 31 ~ 113 38 7 308-Apr-18 93 27 ~ 82 38 11 309-Apr-18 140 25 ~ 132 38 8 3010-Apr-18 129 30 ~ 113 35 7 2711-Apr-18 99 31 ~ 90 38 7 3312-Apr-18 147 29 ~ 111 36 5 4813-Apr-18 103 31 ~ 102 40 12 3314-Apr-18 102 30 ~ 90 39 13 3415-Apr-18 108 28 ~ 93 36 22 3016-Apr-18 119 25 ~ 103 38 19 3417-Apr-18 76 25 ~ 76 38 19 3418-Apr-18 108 27 ~ 97 38 18 3019-Apr-18 104 29 ~ 61 37 22 3420-Apr-18 97 30 ~ 78 37 22 3521-Apr-18 155 33 ~ 108 34 22 3322-Apr-18 184 25 ~ 137 34 17 3323-Apr-18 118 24 ~ 108 30 14 2924-Apr-18 189 22 ~ 121 35 11 2725-Apr-18 95 22 ~ 60 44 11 2926-Apr-18 110 22 ~ 94 51 12 3727-Apr-18 108 22 ~ 83 55 11 4428-Apr-18 101 24 ~ 83 51 8 4529-Apr-18 129 28 ~ 97 49 16 4830-Apr-18 156 24 ~ 132 44 14 38
AVG. 119 27 #DIV/0! 99 41 13 35MIN. 76 17 0 60 30 5 27MAX. 189 44 0 137 55 22 49
NH3-N RESULTSDATE JHA DIRE.
NH3-N REPORT FOR THE MONTH OF APR. - 2018 BPS
OUTLET
Analysis Report of FETP streams.

ANK. PANOLI JHAGADIA INLET Outlet1-Apr-18 250 102 ~ 307 95 68 882-Apr-18 216 127 ~ 322 97 100 833-Apr-18 230 130 ~ 317 114 82 884-Apr-18 287 139 ~ 331 109 112 975-Apr-18 365 111 ~ 448 80 73 726-Apr-18 215 98 ~ 328 61 83 917-Apr-18 281 89 ~ 382 82 150 818-Apr-18 257 61 ~ 241 103 99 1119-Apr-18 452 95 ~ 387 92 94 10610-Apr-18 289 161 ~ 368 98 80 9011-Apr-18 225 157 ~ 404 79 74 11412-Apr-18 260 95 ~ 180 72 77 7113-Apr-18 339 92 ~ 440 60 42 5314-Apr-18 507 123 ~ 452 120 93 11415-Apr-18 196 67 ~ 439 99 70 7216-Apr-18 263 90 ~ 287 79 59 8017-Apr-18 229 43 ~ 267 94 69 7718-Apr-18 183 70 ~ 361 98 56 6619-Apr-18 225 82 ~ 292 90 71 6820-Apr-18 256 63 ~ 203 59 55 9321-Apr-18 187 63 ~ 232 76 47 8222-Apr-18 290 88 ~ 274 63 51 8823-Apr-18 186 41 ~ 269 59 62 5924-Apr-18 178 76 ~ 258 71 74 7525-Apr-18 196 81 ~ 225 53 79 6726-Apr-18 230 72 ~ 184 78 73 9127-Apr-18 200 74 ~ 325 75 71 9528-Apr-18 375 66 ~ 452 54 53 6429-Apr-18 136 63 ~ 121 51 71 5430-Apr-18 269 95 ~ 329 69 82 57
AVG. 259 90 #DIV/0! 314 81 76 82MIN. 136 41 0 121 51 42 53MAX. 507 161 0 452 120 150 114
Analysis Report of FETP streams.
TSS REPORT FOR THE MONTH OF APR - 2018
JHA DIRE.BPS
OUTLETDATE
TSS RESULTS
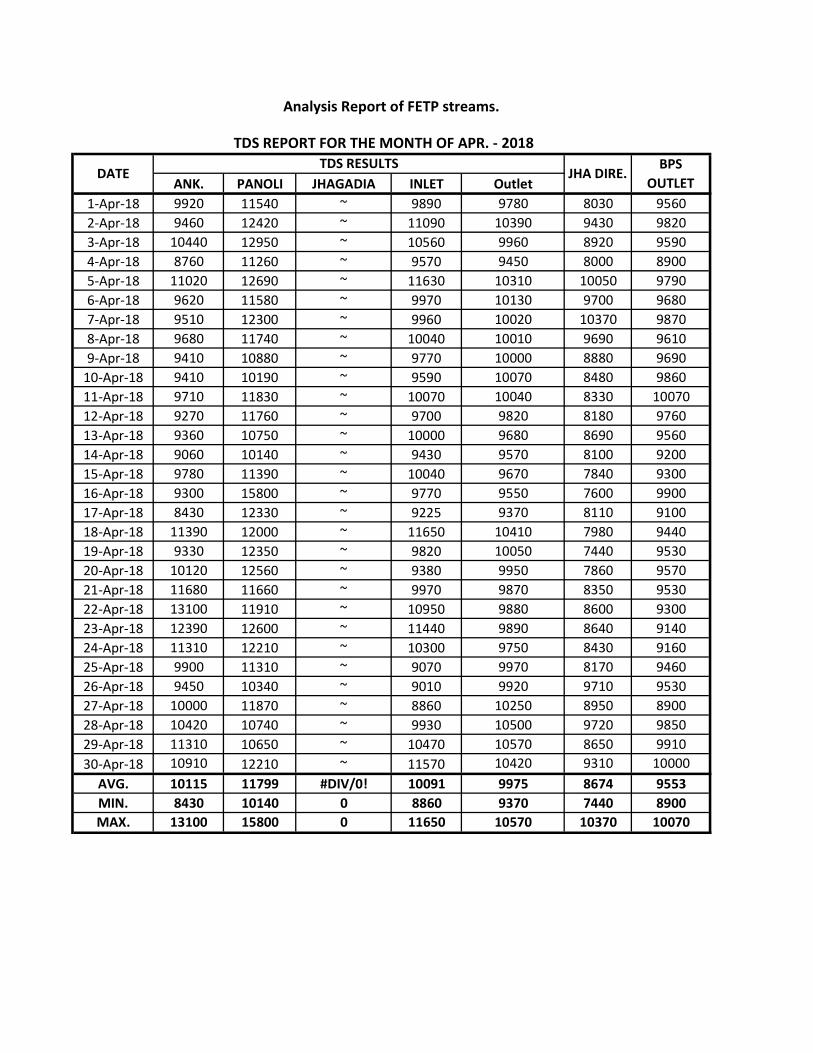
ANK. PANOLI JHAGADIA INLET Outlet1-Apr-18 9920 11540 ~ 9890 9780 8030 95602-Apr-18 9460 12420 ~ 11090 10390 9430 98203-Apr-18 10440 12950 ~ 10560 9960 8920 95904-Apr-18 8760 11260 ~ 9570 9450 8000 89005-Apr-18 11020 12690 ~ 11630 10310 10050 97906-Apr-18 9620 11580 ~ 9970 10130 9700 96807-Apr-18 9510 12300 ~ 9960 10020 10370 98708-Apr-18 9680 11740 ~ 10040 10010 9690 96109-Apr-18 9410 10880 ~ 9770 10000 8880 969010-Apr-18 9410 10190 ~ 9590 10070 8480 986011-Apr-18 9710 11830 ~ 10070 10040 8330 1007012-Apr-18 9270 11760 ~ 9700 9820 8180 976013-Apr-18 9360 10750 ~ 10000 9680 8690 956014-Apr-18 9060 10140 ~ 9430 9570 8100 920015-Apr-18 9780 11390 ~ 10040 9670 7840 930016-Apr-18 9300 15800 ~ 9770 9550 7600 990017-Apr-18 8430 12330 ~ 9225 9370 8110 910018-Apr-18 11390 12000 ~ 11650 10410 7980 944019-Apr-18 9330 12350 ~ 9820 10050 7440 953020-Apr-18 10120 12560 ~ 9380 9950 7860 957021-Apr-18 11680 11660 ~ 9970 9870 8350 953022-Apr-18 13100 11910 ~ 10950 9880 8600 930023-Apr-18 12390 12600 ~ 11440 9890 8640 914024-Apr-18 11310 12210 ~ 10300 9750 8430 916025-Apr-18 9900 11310 ~ 9070 9970 8170 946026-Apr-18 9450 10340 ~ 9010 9920 9710 953027-Apr-18 10000 11870 ~ 8860 10250 8950 890028-Apr-18 10420 10740 ~ 9930 10500 9720 985029-Apr-18 11310 10650 ~ 10470 10570 8650 991030-Apr-18 10910 12210 ~ 11570 10420 9310 10000
AVG. 10115 11799 #DIV/0! 10091 9975 8674 9553MIN. 8430 10140 0 8860 9370 7440 8900MAX. 13100 15800 0 11650 10570 10370 10070
JHA DIRE.
Analysis Report of FETP streams.
TDS REPORT FOR THE MONTH OF APR. - 2018
DATETDS RESULTS BPS
OUTLET

ANNEXURE – 5
Plot allotment from GIDC

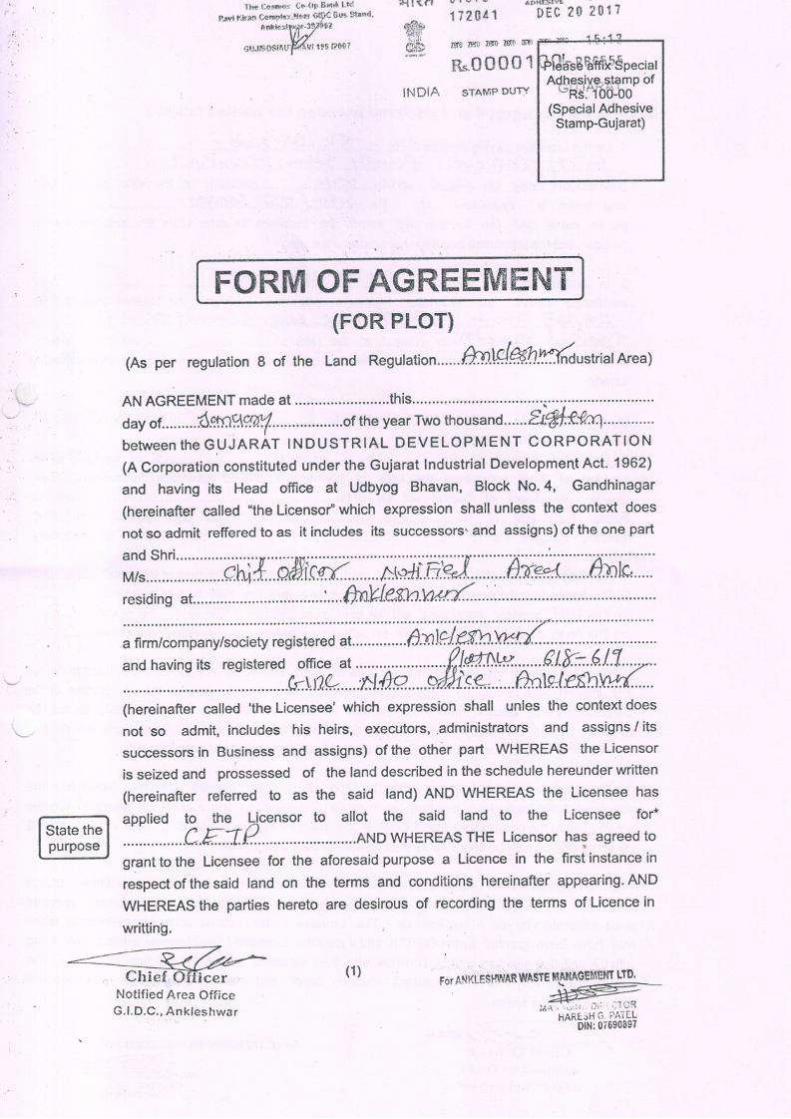


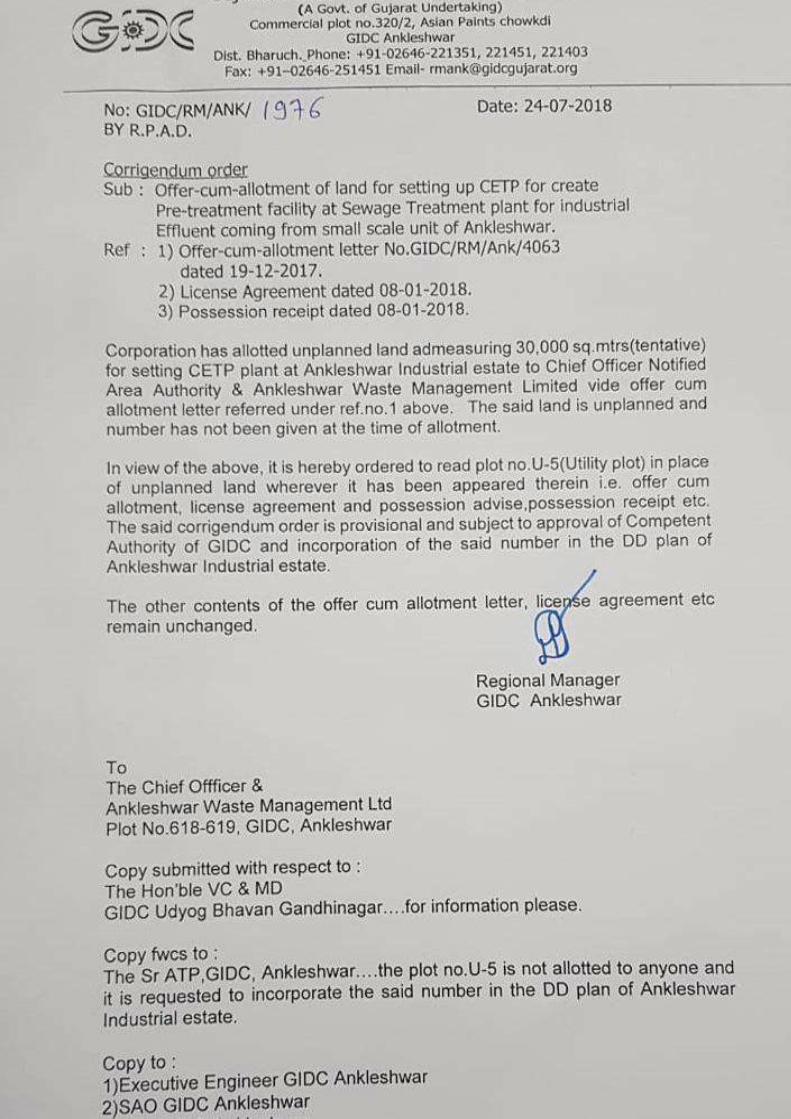

ANNEXURE – 6
Plant lay out
Approved
CHD.BY
TITLE :-DRG. NO :- DRN.BY
REV. NO :- ScaleDATE TOTAL SHEET :-
SHEET NO :-
CEP-ANKC-001Layout Drawing For C.E.T.P.
All Dimensions Are In meter
N.T.S.7 May 2018
CLIENT :- ANKLESHWAR C.E.T.P.
2
1
DO NOT SCALE IF ANY DOUBT PLEASE ASK. CAD GENERATED DRAWING DO NOT MANUALLY UPDATE OR SCALE
SIZE- A3FILE NAME :-CEP-ANKC-001 Layout Drawing.dwg
STP PLANT
AN
KLESW
ER TO
VA
LIYA
RO
AD
1
4
8
7
9
10
11
12
13
14
15 16
17
18
19
20
21
22
23
24
30
36
38
42
45
47
40
41
43
44
45
25
26
29
37
39
50
51
53
30
.5
176
20
22
4
8
.
9
2
4
.
6
3
2
.
6
2
8
.
3
2
1
.
9
15
10
2
1
.
9
2
4
2
0
2
2
3
0
.
6
1
6
.
5
1
6
.
5
10
10
Garden
20
10
15
Proposed C.E.T.P.Plot :- 30207.7877 Area Sq.m
7
8
.
7
1
8
2
.
2
1
0
3
.
3
10
7.5
264
1
0
54
54
54
54
2.5m Wide Green Belt
2.5m Wide Green Belt
2.5m Wide Green Belt
8
1
0
5
1
0
10
5
5m Wide Road
TOTAL AREA = 30207.7877 Sq MetreE.T.P. Area = 23364.7877 Sq MetreGreen Belt Area = 1800 Sq MetreGarden Area = 1600 Sq MetreInternal Road Area = 3080 Sq MetreAdm. Bulding + Parking = 450 Sq Metre
5
4

SIZE- A4DRG.NO :-
Approved
CHD.BY
TITLE :-DRG. NO :- DRN.BY
REV. NO :- ScaleDATE TOTAL SHEET :-
SHEET NO :-
CEP-ANKC-001Layout Drawing For C.E.T.P.
All Dimensions Are In meter
N.T.S.7 May 2018
CLIENT :- ANKLESHWAR C.E.T.P.
2
2
DO NOT SCALE IF ANY DOUBT PLEASE ASK. CAD GENERATED DRAWING DO NOT MANUALLY UPDATE OR SCALE

ANNEXURE – 7
Schematic flow diagram
Approved
CHD.BY
TITLE :-DRG. NO :- DRN.BY
REV. NO :- ScaleDATE TOTAL SHEET :-
SHEET NO :-
CEP-ANKC-002Flow Diagram
N.T.S.7 May 2018
CLIENT :- ANKLESHWAR C.E.T.P.
2
1
DO NOT SCALE IF ANY DOUBT PLEASE ASK. CAD GENERATED DRAWING DO NOT MANUALLY UPDATE OR SCALE
SIZE- A3FILE NAME :-CEP-ANKC-002 Flow Diagram.dwg
A.C.F A.C.F
TO ---F
CETP F.P.S.
S
S
Inlet SumpPartial Flunce
Grit Chamber
Grit Screw
Conveyor
Oil & Gress
Equalization
Tank
SCR
Oil
S S
S S
Lime
S S
PE
PAC
P.G
P.G
P.G
P.G
Raw
Water Raw
Water
Raw
Water
P.G
Primary
Clariflayar
S
S
P.G
Thickener
S
S
FeSO4
S
S
S
S
PE
SBS
S
Lime
Tertiary Clerifier
PE
SBS
Lime
CL2 Gas
CL2 Gas Cylinder
Rotameter
CLV1A / 1B
S S
P.G
P.G
P.G
P.G
Static Mixer-1
Static Mixer-2
Static Mixer-3
Hypo Reaction
Tank
S.B.S. Reaction
Tank
S
S
P.G
S
S
P.G
Raw Water
PAC
PAC
Lime
Neutralization
Tank
P.G
S
S
Secondary
Clarifier
1 1 1
1
1
7
9 9
23
24
42
43
38 37
36
41
45
39
Air Inlet
Lachate / Dirty Water
Sump & Pump
Aeration Tank /
Oxidation Ditch
18
19
Bio Tower
Bio Tower Feed
Sump & Pump
Bio Tower
Recalculation Sump &
Pump
47
20
A.C.F A.C.F
Cack Cack
10 11
12
21
22
31
33
35
14
15
16
17
29
32
34

ANNEXURE – 8
Treatability study report

CLEAN ENVIRO PROJECTS CONSULTANCY PVT. LTD.
HEAD OFFICE
9/10, 1ST floor, B.D.C.A. Shopping Center No. 5, Stadium Road, VALSAD – 396 001, Gujarat, India. Phone: (02632)243702, 254080. Telefax: (02632)249824
E-mail: [email protected] , [email protected] BRANCH OFFICE
C-5/14, 2nd floor, Vikas Chamber, Behind G.I.D.C. Office, G.I.D.C., Vapi – 396 195, Di. Valsad Telefax: (0260) 2432883/2428335/6531788
Treatability Study
1.0 Introduction:
The Notified Area Authority, GIDC, Ankleshwar has proposed to set up a 10 MLD Common
Effluent Treatment Plant (CETP) at GIDC, Ankleshwar, Di. Bharuch for Small Scale Industries
located within GIDC, Ankleshwar. Looking to the pace of development, there is a need of
Common Effluent Treatment Plant (CETP) of capacity 10 MLD. The treated effluent from the
proposed 10 MLD CETP shall be sent to Narmada Clean Tech (NCT) for further treatment
and final disposal into Arabian Sea through a 44 km long onshore & 10 km long offshore
pipe line through scientifically designed diffuser. The proposed plant is to be designed to
meet the inlet norms for FETP of NCT.
To establish the CETP, design and capacity of CETP must be required to finalize. And for the
same purpose, a treatability study of effluent from various industries which is going to be
treated in CETP is required to be carried out. Clean Enviro Projects Consultancy Pvt. Ltd. as a
Master consultant has conducted a survey of member industries of Ankleshwar GIDC estate
and carried out the Treatability study of above said effluent.
GIDC Ankleshwar consists of many types of industries as mentioned in below Table -1.
Table – 1: Nature of Industries
Sr. No. Type of Industry No.
1 Chemical 294
2 Dyes & Intermediates 169
3 Textiles 17
4 Pulp & Paper 4
5 Pesticides (Technical & Formulation) 46
6 Pharmaceuticals (Technical & Formulation) 85
7 Others 199
Total 814

CLEAN ENVIRO PROJECTS CONSULTANCY PVT. LTD.
HEAD OFFICE
9/10, 1ST floor, B.D.C.A. Shopping Center No. 5, Stadium Road, VALSAD – 396 001, Gujarat, India. Phone: (02632)243702, 254080. Telefax: (02632)249824
E-mail: [email protected] , [email protected] BRANCH OFFICE
C-5/14, 2nd floor, Vikas Chamber, Behind G.I.D.C. Office, G.I.D.C., Vapi – 396 195, Di. Valsad Telefax: (0260) 2432883/2428335/6531788
2.0 Water consumption and effluent generation data.
Table – 2: Water consumption & effluent generation, KL/day
Sr. No.
Particular Qty., KL/day
Remarks Water consumption
Effluent generation
I Domestic 30.0 24.0 Septic tank and CETP
II Industrial
a Process + washing 180.0 40.0 Consumed for chemical preparation and washing and shall be treated in CETP only. II Total Industrial 180.0 40.0
III Gardening 18.0 0.0
Total (I+II+III) 228.0 64.0
3.0 Sampling and preparation of sample for treatability study:
To carry out the Treatability study of effluent, samples from various different
types of industries, pumping stations are collected and made composite samples.
This composite sample is then analyzed at laboratory and various treatments has
been given to the samples to carry out the treatability of the effluent to achieve
prescribed norms for inlet to FETP of NCTL.
4.0 Characteristics of Untreated Effluent:
A complete analysis of composite sample has been carried out and the analysis
results of various parameters are as shown in below Table: 3.
Table – 3: Analysis results of composite untreated sample
No. Effluent parameters Unit Untreated effluent
1 pH pH units 7.80
2 Color Pt.Co. scale 380.00
3 Oil and grease mg/L 15.80
4 Total dissolved solids mg/L 19500.00
5 Suspended solids mg/L 540.00
6 Ammonical Nitrogen (NH3-N) mg/L 512.00
7 COD mg/L 10800.00
8 BOD mg/L 5126.00
9 Cr+ mg/L 2.20
10 Cr+6 mg/L 0.18
11 Cu mg/L 3.42
12 Ni mg/L 1.80

CLEAN ENVIRO PROJECTS CONSULTANCY PVT. LTD.
HEAD OFFICE
9/10, 1ST floor, B.D.C.A. Shopping Center No. 5, Stadium Road, VALSAD – 396 001, Gujarat, India. Phone: (02632)243702, 254080. Telefax: (02632)249824
E-mail: [email protected] , [email protected] BRANCH OFFICE
C-5/14, 2nd floor, Vikas Chamber, Behind G.I.D.C. Office, G.I.D.C., Vapi – 396 195, Di. Valsad Telefax: (0260) 2432883/2428335/6531788
5.0 TREATMENT FOR COMPOSITE SAMPLE:
5.1 Physico Chemical (Primary Treatment):
As indicated by characteristics of the untreated effluent in Table - 1, the effluent
needs treatment for the removal of color, s/s, oil & grease, COD, BOD,
Ammonical Nitrogen, Sulphates, Chlorides, Phosphate, metals etc.
It was decided to give normal physico chemical treatment to the effluent
followed by the secondary biological treatment under aerobic condition.
For treatability study, 1 L of the raw effluent sample was treated with 1200
mg/lit lime, passed air for one hour at 9.5 pH for reduction in ammoniacal
nitrogen, then added 50 mg/lit PAC, 500 mg/lit ferrous sulfate and 1.5 mg/lit PE,
so as to obtain good settlable floccs. The clear effluent was obtained after
sedimentation for about 15 minutes and the clear effluent was tested for the
effectiveness of the treatment scheme.
The results of the experiments were recorded in the below Table – 4.
Table – 4: Results after Primary treatment
No Effluent Parameter Unit Combined
sample
After primary
treatment Reagent
1 pH pH units 7.80 7.60 lime
2 Color Pt.Co. scale 380.00 210.00
3 Oil and grease mg/L 15.80 7.20
4 Total dissolved solids mg/L 19500.00 18790.00
5 Suspended solids mg/L 540.00 80.50 Alum, Ferrous sulfate, PE
6 Ammonical Nitrogen (NH3-N) mg/L 512.00 342.00
7 COD mg/L 10800.00 5940.00 45% reduction
8 BOD mg/L 5126.00 1860.00
9 Cr+ mg/L 2.20 0.70
10 Cr+6 mg/L 0.18 0.08
11 Cu mg/L 3.42 0.70
12 Ni mg/L 1.80 0.60
Results: Reasonably good reduction of 45 % in COD value is obtained. Other
parameters also showed good reduction.
The clear effluent sample was further treated by biological treatment under
aerobic conditions after proper acclimatization and stabilization of active
biomass.

CLEAN ENVIRO PROJECTS CONSULTANCY PVT. LTD.
HEAD OFFICE
9/10, 1ST floor, B.D.C.A. Shopping Center No. 5, Stadium Road, VALSAD – 396 001, Gujarat, India. Phone: (02632)243702, 254080. Telefax: (02632)249824
E-mail: [email protected] , [email protected] BRANCH OFFICE
C-5/14, 2nd floor, Vikas Chamber, Behind G.I.D.C. Office, G.I.D.C., Vapi – 396 195, Di. Valsad Telefax: (0260) 2432883/2428335/6531788
After sedimentation, the sludge was collected, filtered and dried. The results of
the experiments were recorded in the below Table – 5.
Table – 5: Sludge generation
No Dry sludge,
mg/L Dry sludge,
kg/KL Sludge slurry,
m3/KL Sludge after
filtration, kg/KL Sludge after drying, kg/KL
1 2290 2.29 45.8 7.63 5.73
5.2 Biological Treatment under Aerobic Conditions:
Next 25 % sewage was added to the effluent for improving treatability and to
control TDS to reasonable level.
Fresh biomass was prepared using cow dung slurry in the laboratory scale
experiment. The biomass was acclimatized over a period of 96 hours by slowly
increasing the concentration of the effluent as per the details given in the
following Table - 5.
The dissolved oxygen was maintained by operating aquarium aerator. Nutrient
level was also maintained carefully at desired level.
Table – 5: Preparation of bio mass
No. Time in hours % effluent MLSS DO Remarks
1 0 20 1900 2.1
2 24 40 2600 2.2
3 48 60 3400 2.0
4 72 75 3800 1.8
5 96 95 4200 1.9
Next the effluent was treated with active biomass under aerobic condition and
the results were recorded in Table - 6.

CLEAN ENVIRO PROJECTS CONSULTANCY PVT. LTD.
HEAD OFFICE
9/10, 1ST floor, B.D.C.A. Shopping Center No. 5, Stadium Road, VALSAD – 396 001, Gujarat, India. Phone: (02632)243702, 254080. Telefax: (02632)249824
E-mail: [email protected] , [email protected] BRANCH OFFICE
C-5/14, 2nd floor, Vikas Chamber, Behind G.I.D.C. Office, G.I.D.C., Vapi – 396 195, Di. Valsad Telefax: (0260) 2432883/2428335/6531788
Addition of 25 % sewage to the effluent:
No Effluent Parameter Unit After
primary treatment
Sewage analysis
Combined mixed sample
1 pH pH units 7.60 6.80 7.20
2 Color Pt.Co. scale 210.00 240.00 230.00
3 Oil and grease mg/L 7.20 6.80 7.20
4 Total dissolved solids mg/L 18790.00 457.20 14168.00
5 Suspended solids mg/L 80.50 210.40 112.00
6 Ammonical Nitrogen (NH3-N) mg/L 342.00 24.00 262.00
7 COD mg/L 5940.00 470.60 4572.00
8 BOD mg/L 1860.00 211.50 1447.87
Table – 6: Analysis results after biological treatment
No. Time
in hours
Unit COD MLSS DO BOD NH3-N Remarks
1 0 mg/L 4572.00 4200.00 1.80 1447.87 262.00 1 mg/lit enzyme added
2 24 mg/L 3801.40 3800.00 2.00 1 mg/lit enzyme added
3 48 mg/L 1012.00 4200.00 2.10 1 mg/lit enzyme added, bacteria taken
out washed and again continued
4 72 mg/L 740.00 3000.00 2.58 1 mg/lit enzyme added
5 96 mg/L 525.60 2100.00 3.00 120.20 65.00
Enzyme was added to the effluent whenever the biological process became
sluggish.
The aeration experiment was stopped as MLSS started decreasing and no further
reduction in COD value could be achieved.
The analysis results after Secondary biological treatment are as shown in Table –
7.

CLEAN ENVIRO PROJECTS CONSULTANCY PVT. LTD.
HEAD OFFICE
9/10, 1ST floor, B.D.C.A. Shopping Center No. 5, Stadium Road, VALSAD – 396 001, Gujarat, India. Phone: (02632)243702, 254080. Telefax: (02632)249824
E-mail: [email protected] , [email protected] BRANCH OFFICE
C-5/14, 2nd floor, Vikas Chamber, Behind G.I.D.C. Office, G.I.D.C., Vapi – 396 195, Di. Valsad Telefax: (0260) 2432883/2428335/6531788
Table – 7: Analysis results after biological treatment
No Effluent Parameter Unit After Secondary
treatment
1 pH pH units 7.24
2 Color Pt.Co. scale 210.00
3 Oil and grease mg/L 6.90
4 Total dissolved solids mg/L 14196.20
5 Suspended solids mg/L 75.60
6 Ammonical Nitrogen (NH3-N) mg/L 65.00
7 COD mg/L 525.60
8 BOD mg/L 120.20
5.3 Tertiary Polishing Treatment:
Looking to the analysis results of Secondary biological treatment, it is decided to
give polishing tertiary treatment for the removal of any residual color, COD,
Ammonical Nitrogen and other pollutants by chlorination followed by SMBS
dosing, Neutralization, clarifloculation and clarification.
Effluent sample was given treatment with sodium hypochlorite for 1 hour to
achieve 2 -3 mgl residual chlorine. (chlorotex reagent)
This excess chlorine was treated with sodium bisulfite solution till excess chloride
disappeared as per chlorotex reagent.
The effluent was further neutralized with lime, treated with PAC and flocculated
with 1 mg/lit PE.
And after clarification the treated effluent is passed through sand and finally
through a column fitted with granular activated carbon. The results were
recorded in the following Table - 8.

CLEAN ENVIRO PROJECTS CONSULTANCY PVT. LTD.
HEAD OFFICE
9/10, 1ST floor, B.D.C.A. Shopping Center No. 5, Stadium Road, VALSAD – 396 001, Gujarat, India. Phone: (02632)243702, 254080. Telefax: (02632)249824
E-mail: [email protected] , [email protected] BRANCH OFFICE
C-5/14, 2nd floor, Vikas Chamber, Behind G.I.D.C. Office, G.I.D.C., Vapi – 396 195, Di. Valsad Telefax: (0260) 2432883/2428335/6531788
Table – 8: Analysis results after Tertiary polishing treatment
No. Effluent Parameter Unit After
Secondary treatment
After Chlorination
and Neutralization
After first Carbon & sand filter
1 pH pH units 7.80 7.80 7.90
2 Color Pt.Co. scale 210.00 92.00 80.00
3 Oil and grease mg/L 6.90 5.40 4.10
4 Total dissolved solids mg/L 14196.20 14508.10 14515.20
5 Suspended solids mg/L 75.60 71.54 48.42
6 Ammonical Nitrogen (NH3-N) mg/L 65.00 36.42 35.64
7 COD mg/L 525.60 396.80 354.10
8 BOD mg/L 120.20 78.20 62.30
Conclusions:
1. The effluent becomes biodegradable, sometimes sluggish, enhanced with addition of
enzyme, only after very careful acclimatization and stabilization of active biomass.
2. Polishing treatment reduces all the pollutants to a desirable level.
6.0 Disposal norms for treated effluent:
The GPCB prescribed CETP disposal norms for the treated effluent are shown in
below Table – 9.
Table – 9: CETP disposal norms for the treated effluent
No. Effluent Parameter Unit Expected result CETP norms
1 pH pH units 7.9 6.5 to 8.5
2 Color Pt.Co. scale 80 < 100
3 Oil and grease mg/L 4.10 < 10
4 Total dissolved solids mg/L 14000-15000
5 Suspended solids mg/L 70-80 < 100
6 Ammonical Nitrogen (NH3-N) mg/L 35-45 < 75
7 COD mg/L 400-500 < 500
8 BOD mg/L 70-80 < 100

CLEAN ENVIRO PROJECTS CONSULTANCY PVT. LTD.
HEAD OFFICE
9/10, 1ST floor, B.D.C.A. Shopping Center No. 5, Stadium Road, VALSAD – 396 001, Gujarat, India. Phone: (02632)243702, 254080. Telefax: (02632)249824
E-mail: [email protected] , [email protected] BRANCH OFFICE
C-5/14, 2nd floor, Vikas Chamber, Behind G.I.D.C. Office, G.I.D.C., Vapi – 396 195, Di. Valsad Telefax: (0260) 2432883/2428335/6531788
7.0 Characteristics of untreated and treated effluent:
The characteristics of untreated and treated effluent are shown in below Table –
10.
Table – 10: Characteristics of untreated and treated effluent
No Parameter Unit Before
Treatment After
Treatment CETP disposal
norms
1 pH pH units 7.80 7.9 6.5 to 8.5
2 Color Pt.Co. scale
380.00 80-90 < 100
3 Oil and grease mg/L 15.80 4 to 5 < 10
4 Total dissolved solids mg/L 19500.00 14000-15000
5 Suspended solids mg/L 540.00 70-80 < 100
6 Ammonical Nitrogen (NH3-N) mg/L 512.00 35-45 < 75
7 COD mg/L 10800.00 400-500 < 500
8 BOD mg/L 5126.00 70-80 < 100
9 Cr+ mg/L 2.20 0.7 < 1
10 Cr+6 mg/L 0.18 0.08 < 0.1
11 Cu mg/L 3.42 0.7 < 1
12 Ni mg/L 1.80 0.6 < 1
8.0 Disposal of treated effluent:
The treated effluent meeting the FETP of NCTL norms can be safely drained into
GIDC effluent drainage pipeline to NCT for further treatment and final disposal in
Arabian Sea through a 44 km long onshore & 10 km long offshore pipe line
through scientifically designed diffuser.
Note: Extensive trials were taken on two stage 10 lit aeration assembly to establish the
treatment parameters.
Note:
1. Sample for treatability was a composite sample of three different samples. The
samples were provided by AWML.
2. Nature of sample: Heterogeneous/cocktail.
3. Sample was collected for lab study as well as pilot study.

CLEAN ENVIRO PROJECTS CONSULTANCY PVT. LTD.
HEAD OFFICE
9/10, 1ST floor, B.D.C.A. Shopping Center No. 5, Stadium Road, VALSAD – 396 001, Gujarat, India. Phone: (02632)243702, 254080. Telefax: (02632)249824
E-mail: [email protected] , [email protected] BRANCH OFFICE
C-5/14, 2nd floor, Vikas Chamber, Behind G.I.D.C. Office, G.I.D.C., Vapi – 396 195, Di. Valsad Telefax: (0260) 2432883/2428335/6531788
4. Presently, this is a continuous process and final treatability report will be prepared
based our detailed study, individual/Estate survey/Pilot plant and actual
requirement for the project.
5. It can be concluded that the effluent is treatable with proposed above scheme.
However, other advanced technology may explore for final treatment scheme
considering below factors.
Easy operation and feasibility.
Cost benefit.
Date: 08.05.2018 FOR Clean Enviro Projects Consultancy Pvt Ltd.
Place: VAPI
N. C. Patel.
(Sc II Environmental auditor)

ANNEXURE – 9
NIO reports


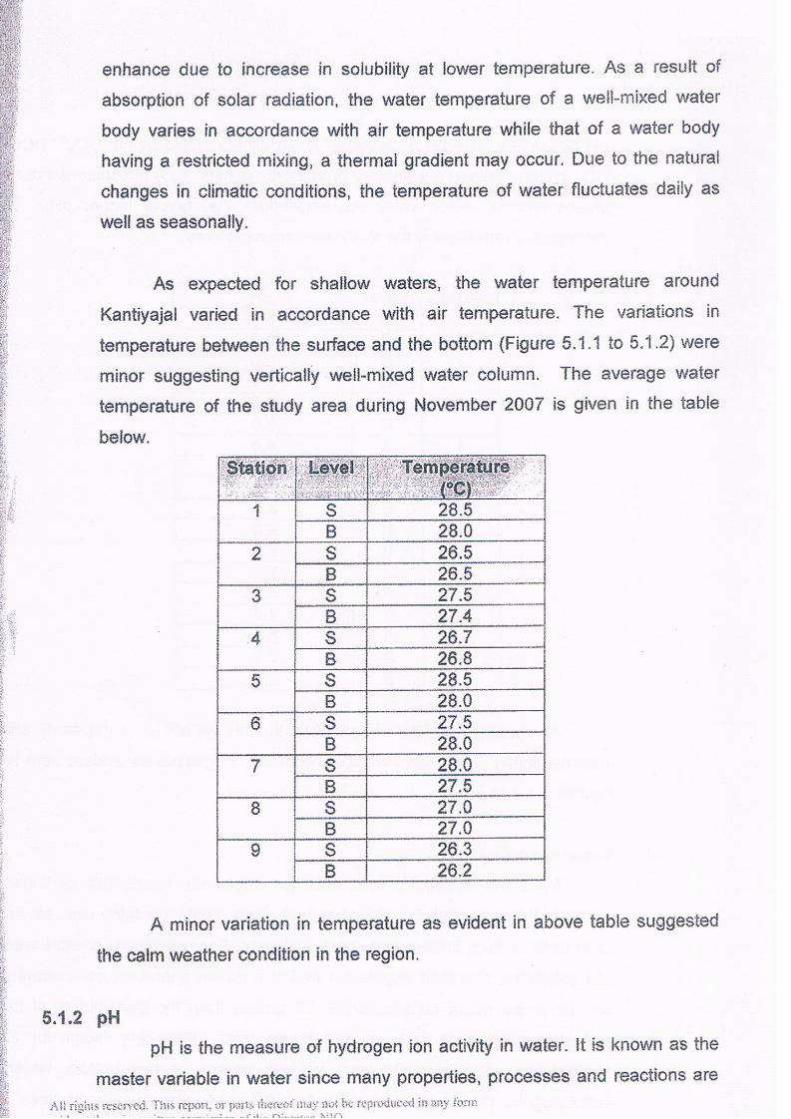


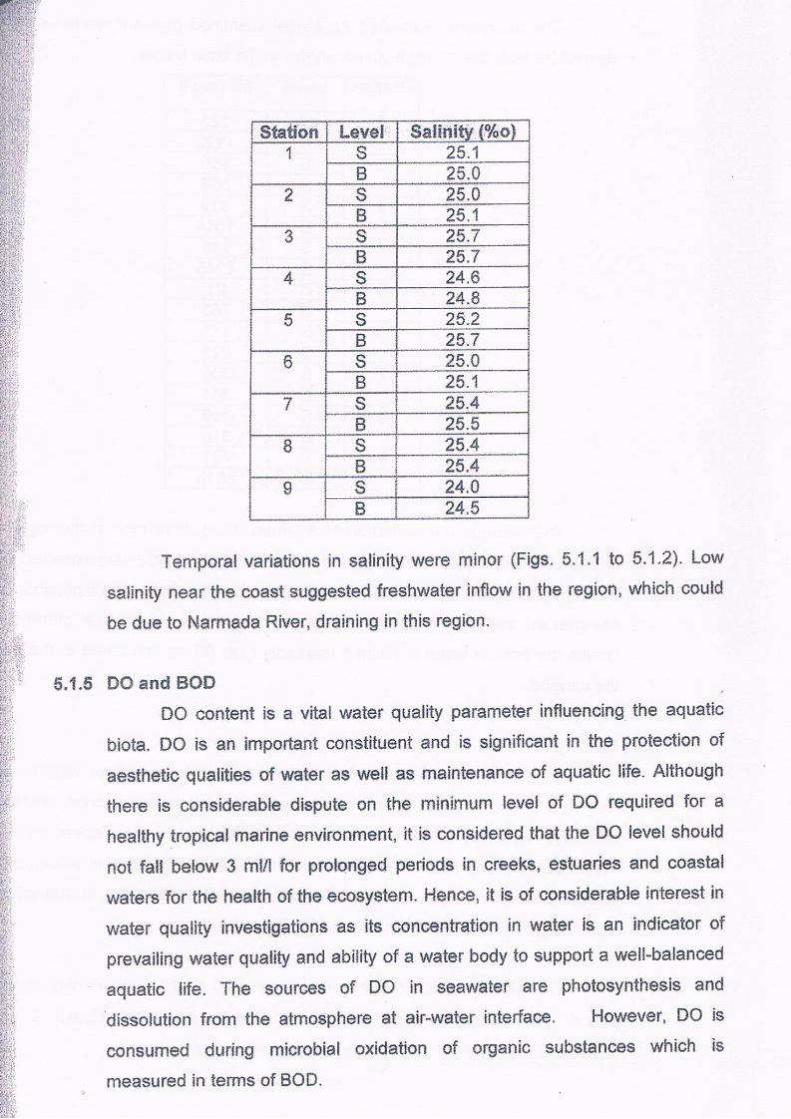


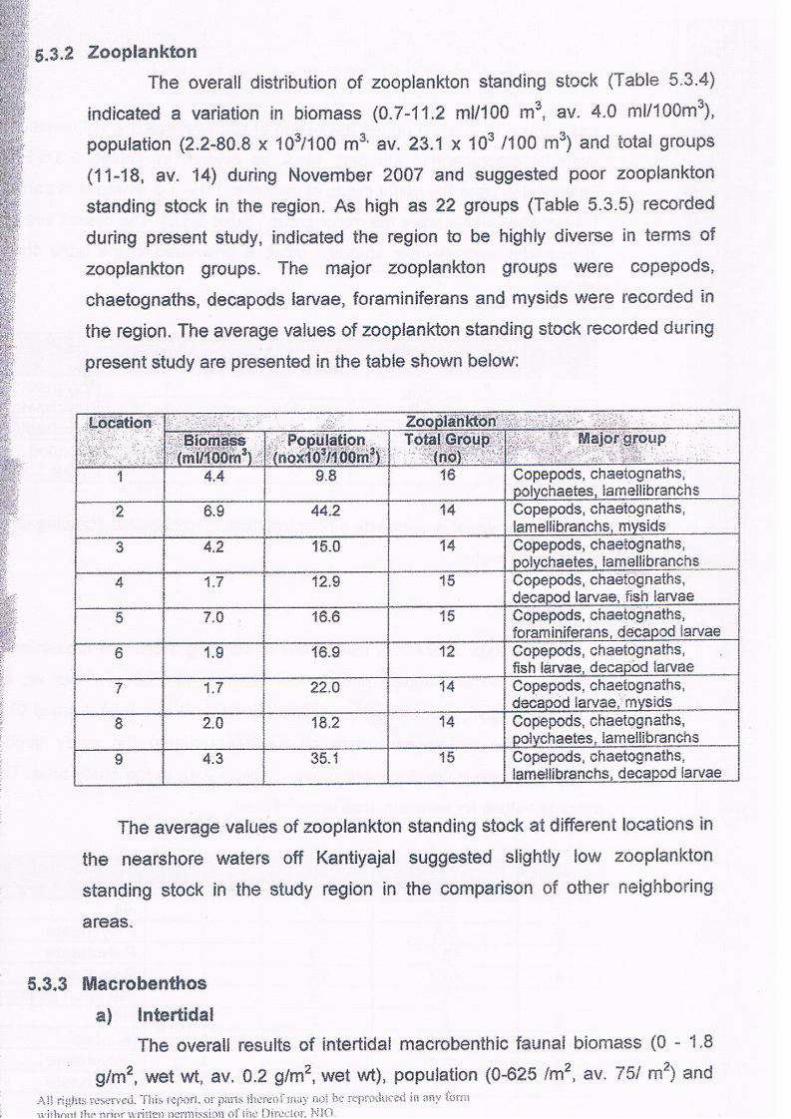


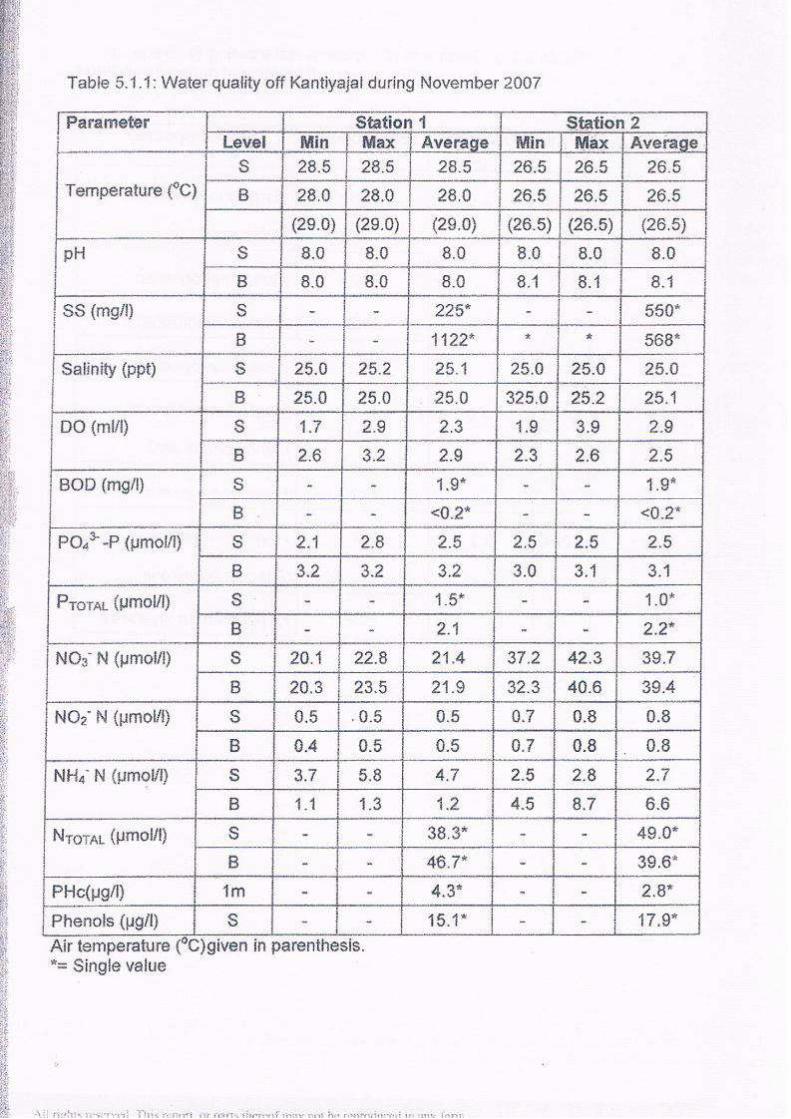


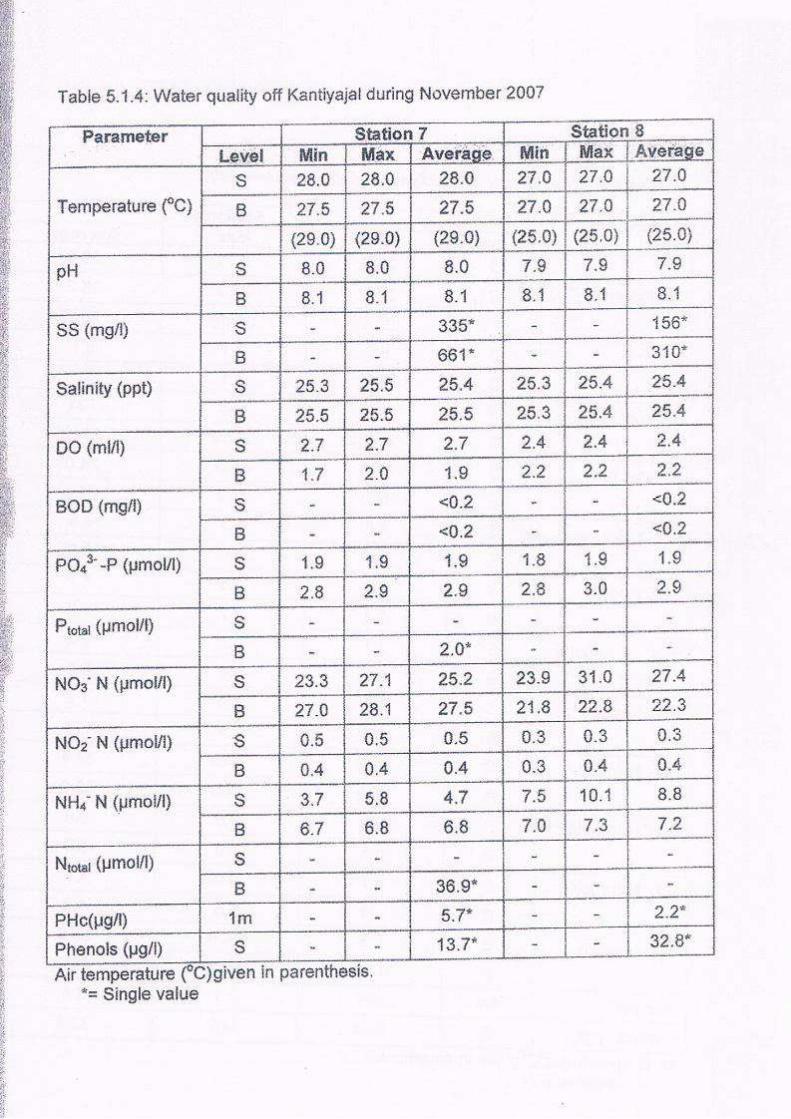
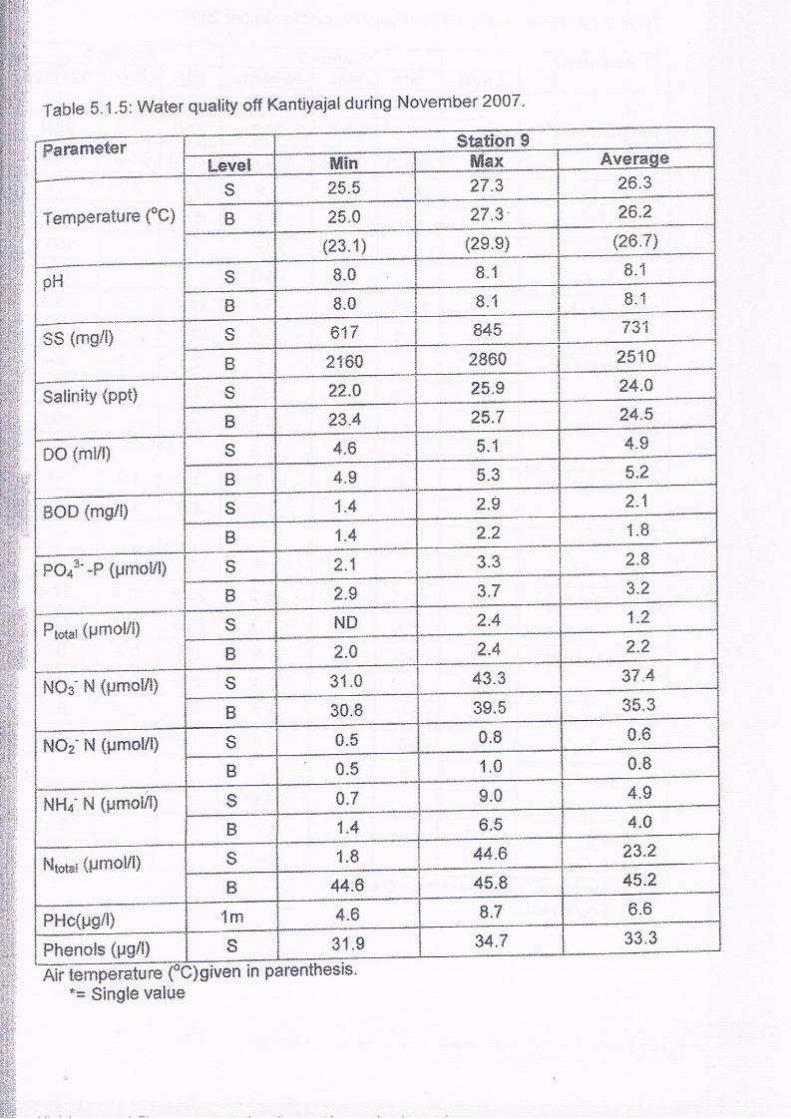


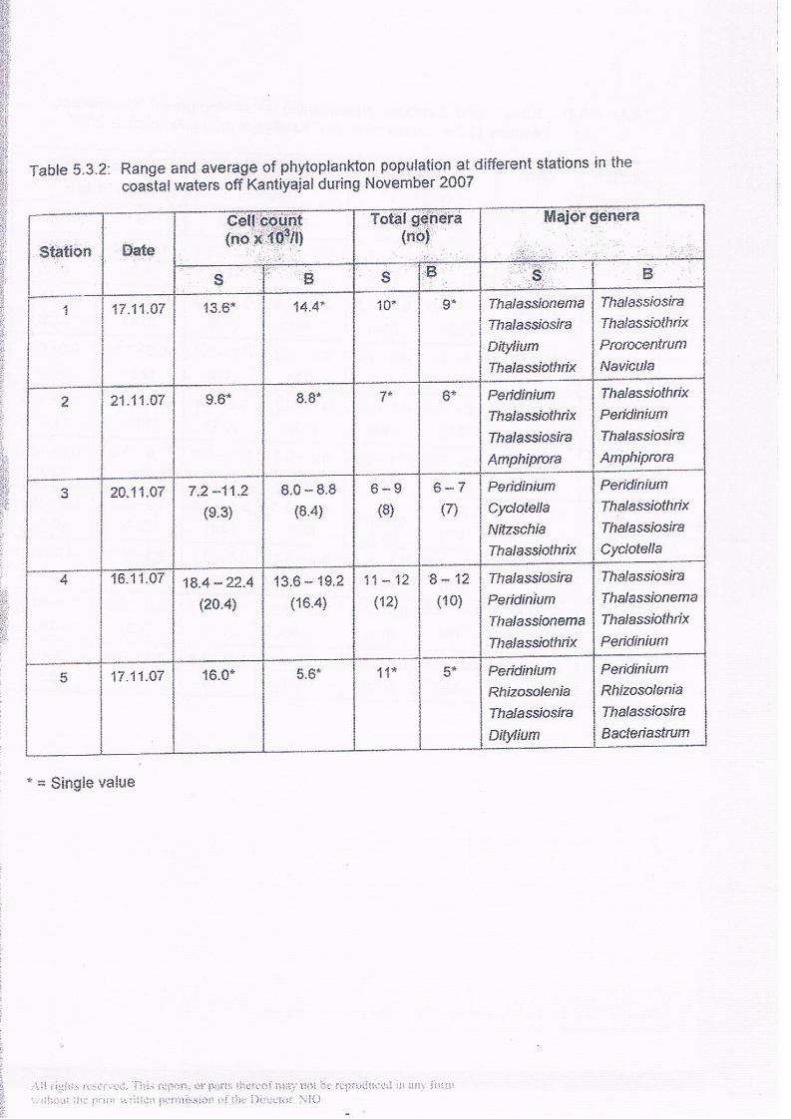

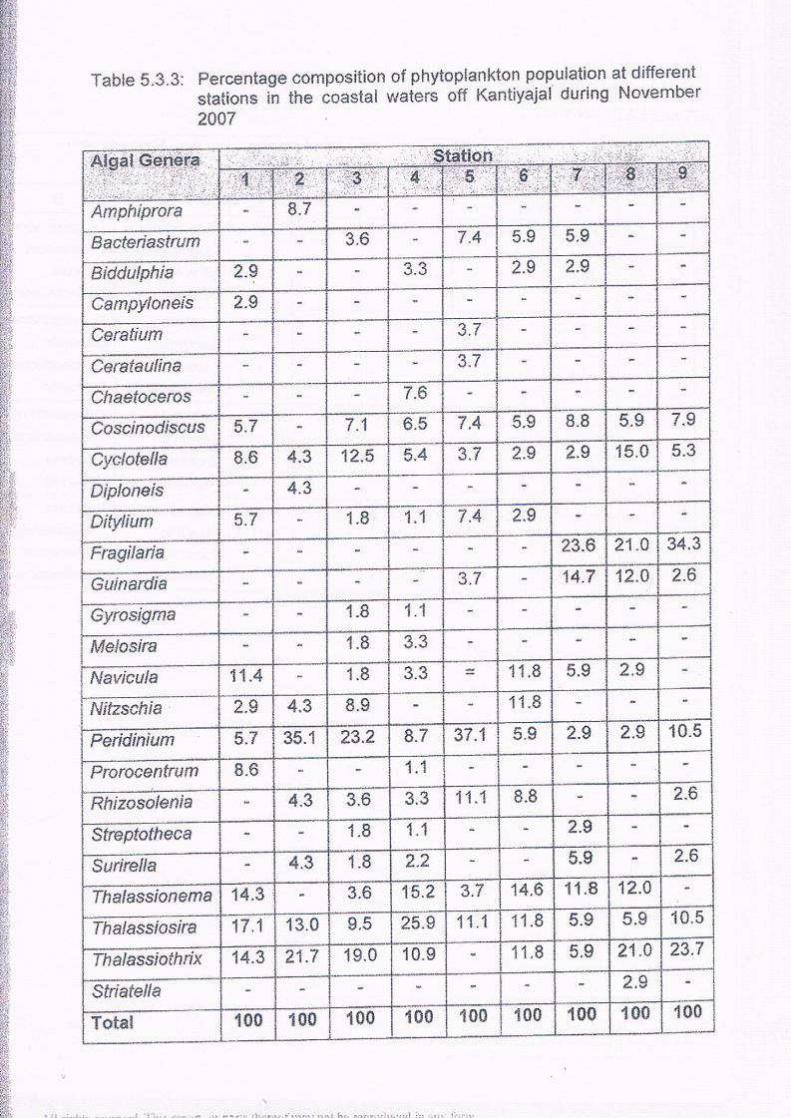


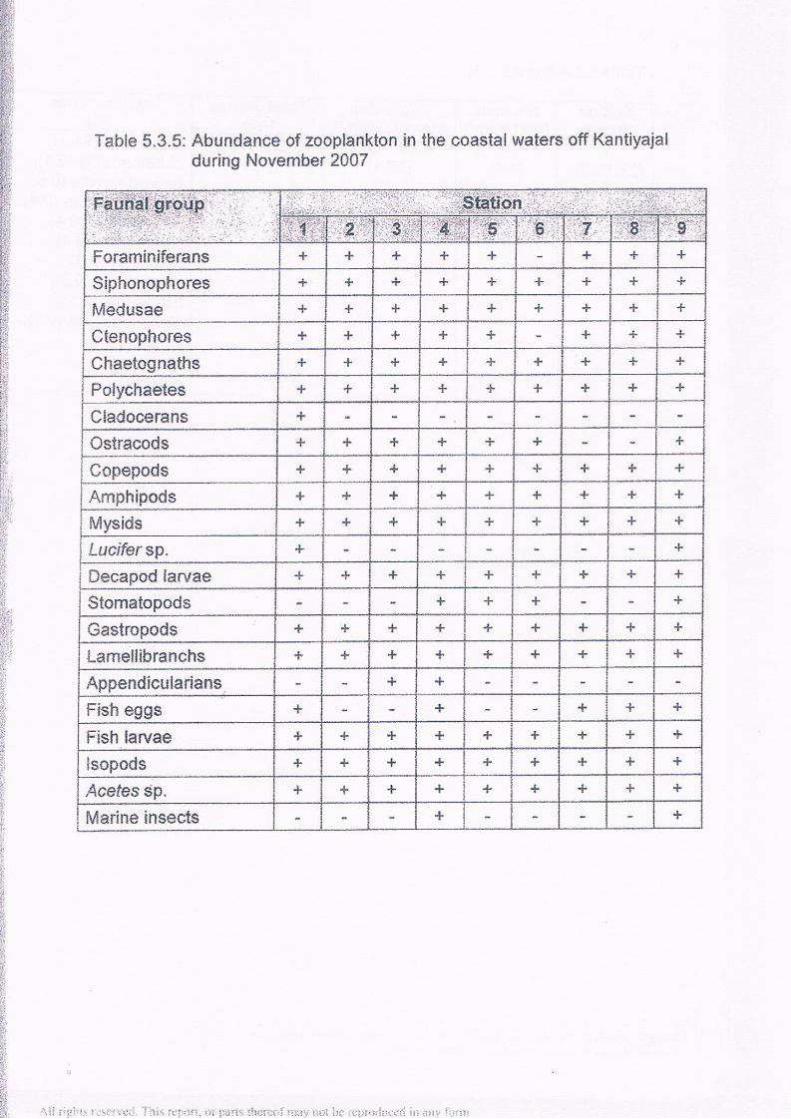


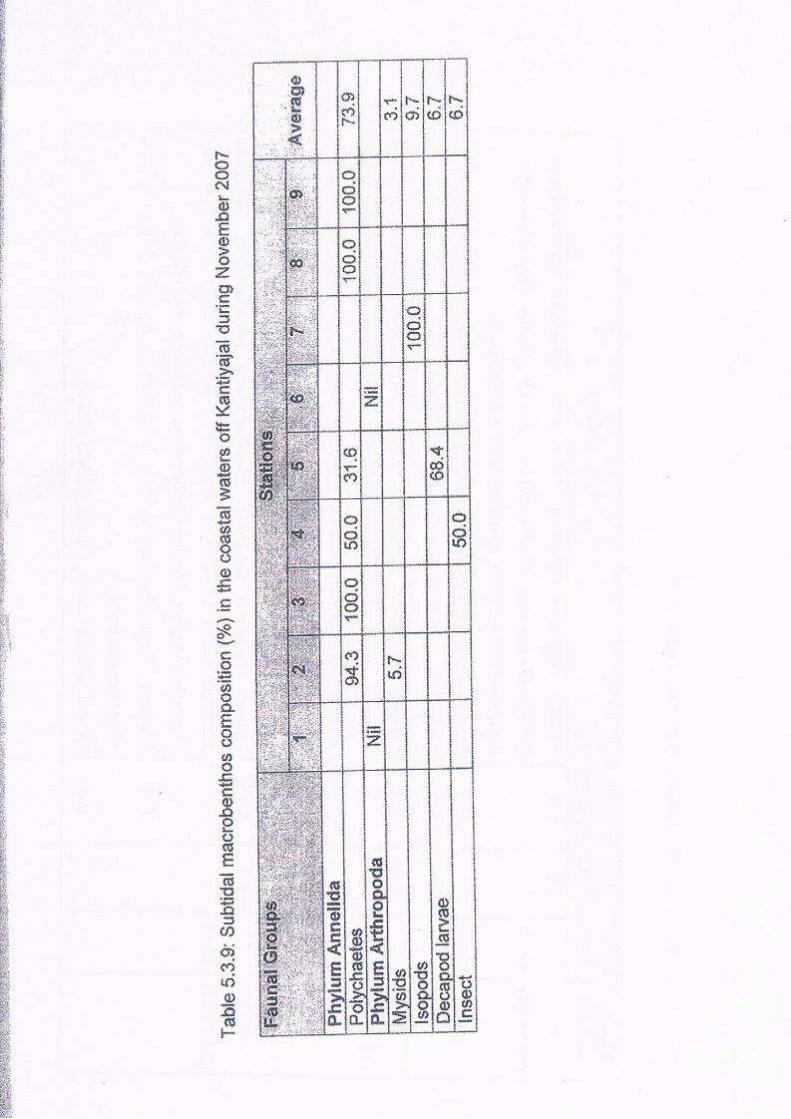


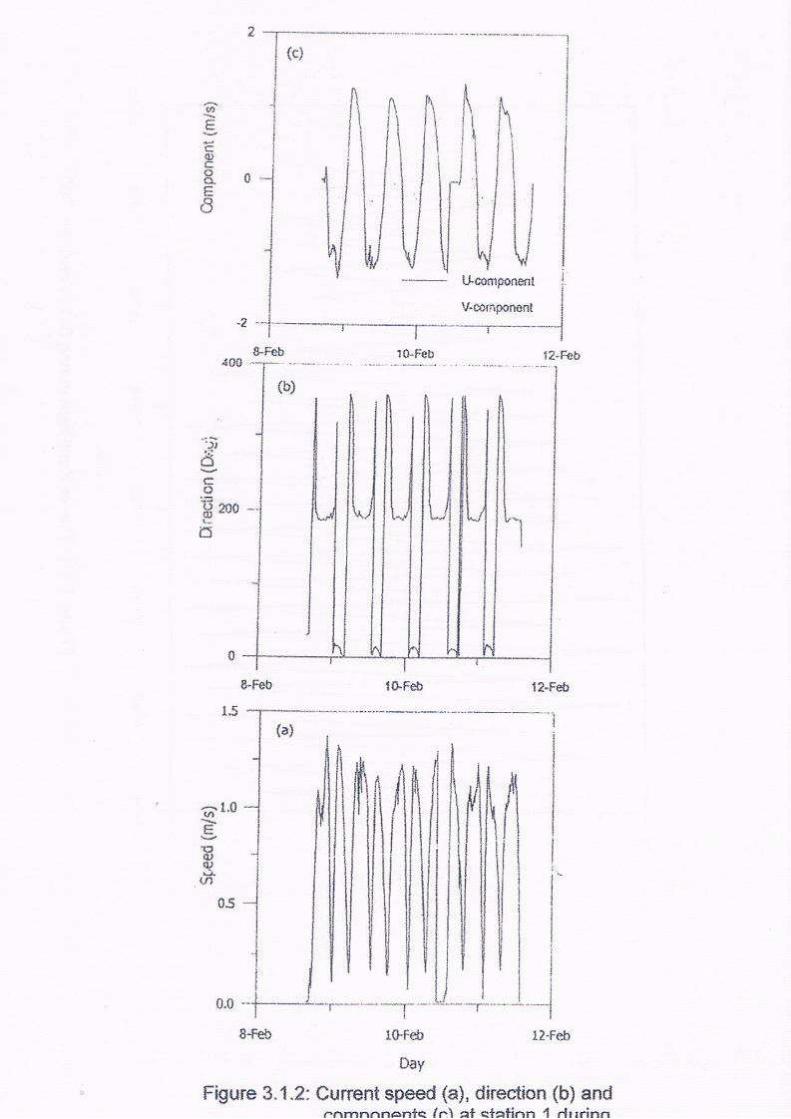


ANNEXURE – 10
Details of laboratory
DETAILS OF LABORATORY
GIDC proposed to establish an analytical laboratory for 10 MLD CETP at Ankleshwar.
NABL accreditation shall also be obtained for proposed laboratory.
Well experienced staff shall be deployed for laboratory.
The laboratory shall also have a specific role for the regular monitoring of member
industries.
Laboratory shall have following equipment/instruments.
SR. NO.
NAME OF MACHINE / EQPT. / TOOL QTY.
1 pH / ORP Meter 2
2 Conductivity Meter 2
3 Thermometer 6
4 D.O. meter 2
5 Digital Weighing Balance ( 5 Digit ) 2
6 Muffle Furnace 2
7 Digital Thermometer & Hygrometer 2
8 COD Digester 3
9 Water Bath 2
10 Oven 2
11 BOD Incubator 2
12 GAS CHROMATOGRAPH 1
13 KARL FISHER TITRATION APPARATUS 1
14 AAS 1
15 FLAME PHOTOMETER 1
16 UV Spectrophotometer 1
17 AIR COMPRESSOR 1
18 MAGNETIC STIRRER 2
19 HOT PLATE 4
20 HEATING MENTAL 6
21 TOC meter 1
22 OIL FREE VACUUM PUMP 2
23 Glassware( Burette, Pipette, Conical Flask, Volumetric Flask, Round Bottom Flask, Beaker, Ammonia Assembly, Phenol Assembly, BOD Bottle, Reagent
1
23 Bioassay test jar system 1
24 Lab furniture including hot chamber, fume chamber, other relevant furniture as per annexure for NABL accreditation
1
25 Extra Items as deemed fit to Qualify for NABL Accreditation 1
26 Water still 1
27 CENTRIFUGE 1
28 AUTOCLAVE 1
29 Refrigerator 1
30 Distilled Water Plant 1
31 Kjehldal Digester unit 1
32 Atomic Absorption Spectrophotometer 1
33 Incubator (1 No) for bacteriological tests 1
34 Analytical Balance 1
35 Vacuum pump single (with suction flask/Litre capacity) 1
1.0 PART E2
1 Guch crucibles disc dia. 40mm porosity G-3, Borosil R. 2
2 Vacuum flask i.e. filtration flask cap. 500 ml. with side tabular Borsil R. 2
3 Evaporating dishes. 50
4 Desiccators large with cover size 250mm Borosil R. 1
5 Buchner Funnel cap. 80 ml. disc dia. 40 mm porosity G-3. 2
6 Measuring cylinder graduated Borosil R.
10000 ml capacity 2
500 ml capacity 4
100 ml capacity 6
7 Burette with straight bore stop cock Borosil R.
100 ml capacity 2
50 ml capacity 2
8 Conical flask Borosil R.
1000 ml capacity 2
500 ml capacity 10
100 ml capacity 15
50 ml capacity 8
9 Volumetric flask
1000 ml capacity 4
500 ml capacity 8
100 ml capacity 8
50 ml capacity 4
10 Reflux flask i.e. COD flask cap. 250 ml with B-24 joint BorosilR. 12
11 Volumetric pipettes i.e. Bulb pipette borosil R.
50 ml capacity 2
20 ml capacity 2
10 ml capacity 2
5 ml capacity 2
2 ml capacity 2
12 Ammonia distillation assembly 5
13 Phenol distillation assembly 5
14 COD assembly 25
15 EXTRA GLASSWARE ITEMS AS DEEMED FIT LS Note:
ARAIL (NABL Approved laboratory is already in place which shall be transferred under the
management of AWML/AIA in future. Hence, the available laboratory facilities shall be utilized
AS THIRD PARTY MONITORING SYSTEM.
However, CETP shall also set its own laboratory within premises.

ANNEXURE – 11
Monitoring plan
MONITORING PLAN FOR MEMBER UNITS OF CETP
NAA/AWML proposed 10 MLD CETP for treatment of effluent from SSIs of GIDC
Ankleshwar.
An MOU will be signed between NAA/AWML and the member of GIDC Ankleshwar for
the treatment of effluent of members in the proposed CETP.
The draft of MOU is attached as Annexure – 14.
The compliance of MOU and CETP conditions has to be monitored regularly.
NAA/AWML will form a monitoring team of CETP for regular monitoring.
TEAM:
The monitoring team consists of Sr. chemist, Jr. Chemist, Helper and driver.
MONITORING PLAN:
Monitoring of each industries and pumping stations shall be carried out during the
month.
Each industry will be monitored minimum twice a month.
All the pumping stations will be monitored daily.
Samples of treated effluent discharged from each industry will be collected and
analysed in the CETP laboratory.
The flow meter reading will be noted during each visit and daily record will be
collected from each industry at the time of sampling.
Any non-compliance of industry shall be noted and informed to member unit for the
same.
Major non-compliance of industry will be noted seriously and the member unit will be
asked for the same and will be visited if required.
For the first non-compliance, the technical committee will have discussion with the
member industry and to visit if required for improving the EMS of the defaulting unit.
Also such unit shall be monitored at least twice a week including night monitoring.
If the non-compliance found second time, the discharge connection shall be
disconnected for a period of seven days till the unit make necessary amendment for
compliance.
If the non-compliance found third time, the discharge connection shall be
disconnected for a period of one month till the unit make necessary amendment for
compliance. The governing authority like GPCB, GIDC shall be informed to take
necessary action against defaulter industry.
All the members have to comply the conditions in MOU as well as Consent from GPCB.
All the members have to provide an effluent discharge system at their discharge point.
The schematic diagram of the effluent discharge system is shown in Figure – A.

FIGURE - A
EFFLEUNT DISCHARGE SYSTEM AT INDIVIDUAL MEMBER UNIT
Quantity Monitoring:
All the Pumping stations shall be equipped with SCADA-PLC system for controlling
quantity of the effluent discharged by member units.
All the member units are given the discharge schedule for their registered effluent
quantity to CETP. The quantity of effluent discharged by member units to sump room
is governed by SCADA-PLC system.
No member unit can discharge the effluent to CETP more than their booking quantity,
as either the discharge time or registered quantity is over, the valve provided in SCADA
PLC will be automatically closed.
Quality Monitoring:
All the pumping stations shall be equipped with Auto samplers for controlling quality
of the effluent discharged by member units.
2 Litres of composite effluent sample shall be collected in the bottle of specific
member, which is equipped in the Auto sampler. The collected composite sample is
irrespective of that member units’ discharge time and volume.

Every day, member of monitoring team of CETP, empty the collected sample into the
sample bottles and make 3 parts of the same. Then all 3 sample bottles shall be sealed
at a time. Then immediately one bottle shall be given to the specific member unit, one
bottle to CETP laboratory for analysis and 3rd one is preserved for joint testing (if
member unit wants to test after getting the result from our CETP lab). In laboratory,
barcode shall be generated for each bottle and then analysis shall be performed.
Result of the same shall be sent to the member unit through software based SMS
system. If any member unit have query on the provided result then they have to
intimate to the CETP within 48 hours of SMS. After 48 hours bill is generated through
software based system.
If the analysis of sample collected from member industry not confirm the prescribed
norms of discharge into CETP, the final discharge valve won’t be operated to discharge
the effluent from effluent discharge system at their discharge point. The member
industry have to retreat the effluent to achieve the prescribed norms of discharge into
CETP and then only will be allowed to discharge their effluent in to drainage to CETP.
DETAILS OF ONLINE MONITORING SYSTEM TO BE INSTALLED AT PROPOESED CETP
Specification Details of the REAL Time Monitoring system:
The unit includes servers and combinations of Hardware and software for following
parameters:
1. Shimadzu TOC analyser
2. Online TSS analyser
3. Online pH meter
4. Magnetic Flow meter
Hardware Features:
Total channels: 12 Nos Input: RS 485 2 Nos. Memory: 2 GB. For Data Recovery. Output
2 – Ethernet Connection: With Mail Server Connectivity. Power: 230 V AC Housing:
ABS IP protected Protocol Support: TCPIP/232/ Modbus 232 or 485/422/Ethernet
Modbus / Profibus/ Can open.
Software Features:
Server/Client Connectivity.

Flexible System can add as many monitoring nodes. Like Temp. TOC/PH Flow
and stack gases.
Alarm messaging
Measured value recording and archiving.
Different Report generation
On line /off line trending (graph) facility with Auto dial mailing facility
Remote hooter announcing facility for abnormality.(Hi Low Set point)
Data logging facility with different type of sheets (shift wise report Etc.)
Software to see real data from Black Box to PC Features:
1. Trend Graph.
2. Data logger.
3. Historical Chart.
4. Data connecting to your LCD screen
Technical Details for Data Transmission (Effluent Parameters)
Through the real time data transmission unit, the data of TOC and equivalent
COD & equivalent BOD can be transmitted from TOC to GPCB/CPCB server.
Similarly the data of TN (Total Nitrogen) and AN (Ammonical Nitrogen) can also
be transmitted to GPCB/CPCB server.
Also through real time data transmission unit you can transmit data of TSS,
Flow, pH etc. to GPCB/CPCB server.
We’ll also providing facility of local software through the same you could see
all data which transfer to GPCB/CPCB at your PC.

Diagram explaining the Real Time monitoring system
Note: Provision of multiple facilities for internet connectivity like Wireless, broadband, leased line, dongle etc…. as per latest guidelines of CPCB, shall be provided.

Details of online monitoring instruments to be installed at CETP
No Name of the instrument
Parameter monitored
Installation at Remarks
1 Ultrasonic Level Transmitters on Parshall Flume for Inlet to CETP
Flow Rate inlet to CETP
Inlet Parshall Flume Connected to PLC SCADA
2 Online Magnetic flow meter
Flow rate to CETP Equalized Effluent Transfer Pump, Outlet to CETP
Connected to PLC SCADA
3 Online TOC meter TOC, NH3-N Inlet/ outlet to CETP Connected to PLC SCADA
4 Online pH meter pH Inlet to CETP/ outlet to CETP
Connected to PLC SCADA
5 pH control meters pH Inlet / outlet to neutralization tanks
Connected to PLC SCADA
6 DO meters DO Oxidation Ditch Connected to PLC SCADA
7 pH + ORP Analyser ORP Anoxic Zone of Oxidation Ditch, inlet outlet of hypo treatment unit
Connected to PLC SCADA
8 MLSS analyser MLSS Oxidation Ditch Connected to PLC SCADA
9 TSS analyser TSS Return Activated Sludge Sump
Connected to PLC SCADA
10 Auto Sampler All parameters Inlet / outlet of CETP -
11 Residual chlorine analyser
Residual chlorine Outlet of hypo treatment unit.
Connected to PLC SCADA

ANNEXURE – 12
Consultant stay order against NABET Accreditation

ANNEXURE – 13
CERTIFIED COPY OF HON'BLE HIGH COURT OF GUJARAT'S STAY ORDER AGAINST IMPLEMENTATION OF NOTIFICATION DATED MARCH 3, 2016 OF MoEFCC, NEW
DELHI


ANNEXURE – 13
Map of upgraded Effluent conveyance pipeline
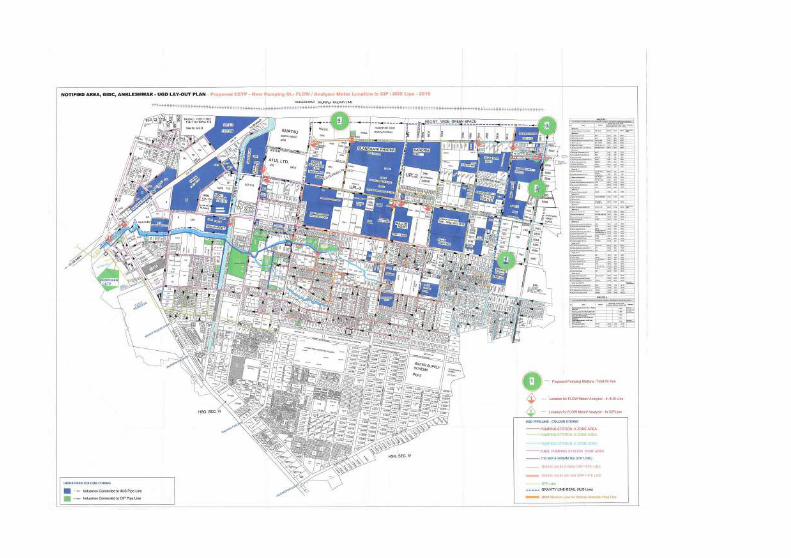

ANNEXURE – 14
Copy of MoU
USER AGREEMENT DOCUMENT FOR MEMBERS OF CETP
CONVEYANCE, COMMON TREATMENT, REUSE/RECYCLE AND DISCHARGE OF EFFLUENT
This AGREEMENT is made on this _____________ between Ankleshwar Waste Management
Ltd. (hereinafter referred to as 'AWML') (a Special Purpose Vehicle- SPV promoted by M/s
Ankleshwar Industries Association) a company incorporated and registered under the
Companies Act, 1956, having its registered office at Plot No. : 618-619, AIA Community
centre, GIDC, Ankleshwar – 393 002 Dist. Bharuch, Gujarat, hereinafter referred to as "The
Party of the First Part" which expression shall where the context so requires or admits of,
be deemed to include its successors or assigns of on FIRST PART
________________________ Partnership firm/proprietorship firm/ Private Limited
Company/ Public Limited Company/Co-Operative Society/Association Company of person
registered under the ________________________________ and having its registered office
at _______________________________________ (Hereinafter referred to as "MEMBER" or
Party of the Second Part which expression shall where the context so requires or admits of,
be deemed to include its successors or assigns of the SECOND PART.
WHEREAS:-
The Party of the First Part a Special Purpose Vehicle has established Common Effluent
Treatment Plant for Acceptance and treatment of raw effluent water received from the
Members of AWML. The said AWML has been formed in terms of Memorandum of
Understanding executed between Gujarat Industrial Development Corporation (GIDC) and
AIA on __________________ and subsequent ADDENDUMS _____________ for executing
project of Common Effluent treatment Plant with Underground Drainage System in
Ankleshwar GIDC. Accordingly, AIA and GIDC devolved all the rights, obligations and powers
in favor of AWML to discharge all the obligations of GIDC in MOU's executed between GIDC
and AIA referred hereinabove. This was further substantiated by Tripartite MOU between
AWML, AIA and GIDC executed on ___________. Therefore GIDC having necessary
permissions from GPCB has authorized AWML to use this approval for its operations in
compliance of GPCB norms for treatment, and discharge EFFLUENT after treatment as per
GPCB norms and discharge values
AND THEREFORE, the party of the Second Part is:

a member of AIA & has participated and contributed in promotion and formation of AWML
for the purpose of setting up of Common Effluent Treatment Plant for the requirements of
the member units of AIA.
The Member is having a factory at Ankleshwar G.I.D.C., Industrial Estate at ___________
______________________ For the purpose of manufacturing
___________________________________________________________________________
The manufacturing activity of the Member is governed by the provisions of the Environment
Act and accordingly the Member is required to maintain the standards of the effluents
discharged by it in the Common Drainage of Gujarat Industrial Development Corporation
(hereinafter referred to as "GIDC") as per the standards prescribed by the Gujarat Pollution
Control Board (hereinafter referred to as "GPCB") from time to time as well as those
mentioned in the Consent Letter issued by GPCB to the Member.
The manufacturing unit Generates polluted waste water from the unit which requires
specific treatment before discharging it into the underground drainage line connected with
CETP of AWML but do not have the treatment facilities and desires to send its untreated /
partly treated effluent to AWML (hereinafter referred to as "EFFLUENT") for treatment, final
discharge.
To meet with the standards so prescribed, it is necessary to treat the effluent and the member
has no such Effluent Treatment Plant, which can treat the effluent to meet with the standards.
The Company is incorporated for the purpose of establishing the Common Effluent Treatment
Plant (CETP) and to treat the effluents received from various Members of Ankleshwar GIDC
Industrial Estate for the control of pollution and violation of the standards.
The Party of the First Part has agreed to receive the EFFLUENT at its CETP sent by the
MEMBER on the terms and conditions stated hereunder, which have been mutually agreed
to between the AWML and the Member unit.

THIS AGREEMENT WITNESS AS FOLLOWS:
DEFINITIONS AND INTERPRETATIONS
1. 'TIME' shall be stated in 'Hours' and shall mean Indian Standard Time.
2. 'DAY' means period of twenty four (24) consecutive hours beginning and ending at
00 hours.
3. 'WEEK' means a period of seven (7) consecutive days beginning from a day.
4. 'FORTNIGHT' means a period of fifteen (15) consecutive days beginning from a day.
Considering different number of days of each calendar month of a year, it is clarified
that 'FIRST FORTNIGHT' would commence from the first day to the fifteenth day of
the month and 'SECOND FORTNIGHT' from sixteenth day to the last day of the
month.
5. 'MONTH' means a period beginning at 00.00 hours on the first day of the calendar
month and ending at 00.00 hrs on the first day of the succeeding calendar month.
6. "FINANCIAL YEAR” means a period of three hundred and sixty five (365) consecutive
days or three hundred and sixty six (366) consecutive days when such period includes
a twenty ninth (29th) day of February beginning at 00.00 hours from a day. It starts
from 1st day of April month of the year and ending on 31st day of March month of
next year.
7. AIA means Ankleshwar Industries Association.
8. AWML means Ankleshwar Waste Management Limited.
9. GIDC means Gujarat Industrial Development Corporation
10. The headings of or title to the Clauses in this AGREEMENT shall not be deemed to be
a part thereof or be taken into consideration in the interpretation of construction
thereof of the AGREEMENT.
11. Words imparting the singular only also include the plural and vice versa where the
contexts so require.
12. The present agreement is entered into between AWML and its members for
collection, conveyance, treatment, and final discharge of treated effluent generated
by its Members.
13. GPCB means Gujarat Pollution Control Board.
14. Inlet norms mean the maximum permissible limits of waste water quality
parameters specified by AWML to Its members for the effluent discharged by
members at the outlet of the doorstep of the member into conveyance system.
15. Outlet norms means the maximum permissible limits of treated waste water
parameters specified by GPCB to AWML for the discharge.
16. CC & A means Consolidated consents and authorization granted by GPCB to AWML
under Water Act, Air Act and Hazardous Wastes (Management & Handling)
amended rules'2008.
17. EFFLUENT PIPELINE means underground drainage line or effluent conveyance system
through which effluent is conveyed from doorsteps of member unit up to CETP.
18. MEMBER means the industrial unit registered as member of AIA as well as AWML.
19. CETP means Common Effluent Treatment Plant designed, developed, by GIDC,
operated and maintained by AWML.
20. CUT OFF VALVE means the disconnection of flow of effluent by operating cut off
valve to the point of authorized chamber at the doorstep of member unit
A. COMMENCEMENT OF AGREEMENT
This Agreement comes into force from the date member unit pays all money to
AWML, submit all the documents along with application including No dues certificate
of AIA, AWML, GIDC. AWML issues NO OBJECTION to GIDC to give connection in
Effluent Conveyance line and on application or receipt of CC & A by AWML.
B. ADDITIONAL QUANTITY DURING PERIOD OF AGREEMENT
1. If the member desires to send its additional quantity of raw effluent in addition to
committed under this present agreement it shall give 3 months advance notice to
AWML of its desire of increase in effluent quantity, AWML shall, subject to availability
of capacity, consider the request and may in its absolute discretion, offer terms for
the Fresh agreement. Both the parties here to shall after reaching an agreement on
the offered terms, execute a fresh agreement at least three months before accepting
the additional effluent quantity.
2. Both the parties here to agree that the present agreement shall automatically come
to an end in any of the following circumstances:

On expiry of CCA granted to the member & the same having not been renewed by the
member of the same having been not granted by GPCB.
On expiry of CCA issued to AWML, Promoted by AIA and if the same is cancelled,
refused, or not granted by GPCB.
3. Both the parties here to further agree, in case of present agreement coming to end
owing to any of the aforesaid eventualities, it will be the sole responsibility of the
member to handle, treat & dispose off its raw / treated effluent.
C. MEMBERSHIP AND OTHER CHARGES:
1. The AWML shall provide Membership Certificate of CETP to the MEMBER on receipt
of Security Deposit/ capital contribution or any other amount as may be decided by
the Board from time to time towards Share Capital Contribution and NO DUE
CERTIFICATE issued by AIA/ AWML GIDC that Member has paid ail other contributions.
The membership Certificate shall specify the committed quantity of raw Effluent water
for treatment.
2. The Membership Application Form submitted by the member on 01st __________ of
__________ declaring various information forms part of this agreement.
3. After having become the member, if the membership is terminated, because of any
reason stated in this agreement, then in that event, the membership can be restored
on the payment of required fees which shall be non- refundable.
4. The member undertakes to pay a minimum guarantee charge equivalent to 65% of
charges payable of declared effluent load per month. This is subject to change which
may be notified from time to time.
In case the member wants to take closure of the unit, the member shall inform ONE
WEEK in advance to AWML in writing mentioning the period of closure. If the closure
is for more than 30 days, Member shall pay minimum guarantee charge as stated
above.
5. EXCESS/ PENALTY CHARGE: If member do not comply with the inlet norms OR release
effluent in excess of contracted quantity, he undertakes to pay extra/additional
charges as may be decided by AWML from time to time. AWML has right to refuse to
accept such effluent including additional quantity if inlet norms are not met with or
plant capacity is not sufficient to accept additional quantity.

D. OBLIGATION OF THF AWML
1. The AWML is obliged to accept effluent; complying with the inlet norms and specified
quantity; from the MEMBER through underground pipeline to CETP, treat the effluent
at CETP, recycle/reuse to the extent possible and finally discharge treated EFFLUENT
as per the outlet norms, prescribed by GPCB to the approved effluent discharge point.
2. AWML is obliged to ensure proper collection, storage and disposal of solid hazardous
wastes generated from CETP; as per the regulatory requirements and conditions of
CC&A granted by GPCB.
3. AWML shall be responsible for all the activities starting from the effluent collection
chamber situated at the entrance of premises of every member, its conveyance,
receipt, treatment, reuses / recycles to the extent possible and final discharge of
treated effluent as per GPCB norms.
4. AWML shall maintain daily records of waste water flow at inlet and outlet of CETP,
consumption of Energy and chemicals, solid wastes generated and all other relevant
information.
5. AWML shall ensure adequate power back up facility for ensuring smooth functioning
of CETP during power failure.
E. OBLIGATIONS OF THE MEMBER
1. The MEMBER has to establish an EFFLUENT DISCHARGE SYSTEM as proposed by
AWML, for the discharge of its effluent into CETP drainage line.
2. The Final discharge of effluent through final discharge valve shall be as per policy of
CETP only.
3. The MEMBER who has installed Auto sampler on effluent discharge point should
arrange for minimum 24 hours of holding capacity for storage of its effluent to meet
with the emergency situation or during maintenance of CETP Plant or pipeline or for
any other unforeseen situation as per its declared load of EFFLUENT.
4. The MEMBER who has not installed Auto sampler on effluent discharge point should
arrange for minimum 48 hours of holding capacity for storage of its effluent, with a
lock arrangement on discharge valve to enable testing of the effluent by CETP
authorities before discharge of effluent into GIDC pipeline and also to meet with the
emergency situation or during maintenance of CETP Plant or pipeline or for any other
unforeseen situation as per Its declared load of EFFLUENT

5. The MEMBER shall also agree to comply with inlet norms of AWML at the discharge
point at member premises before discharging his raw EFFLUENT in the Conveyance
System.
6. The MEMBER is obliged to maintain discharge limits like heavy metals and other
toxicants as may be intimated by the AWML from time to time.
7. The MEMBER is obliged to pay the bill raised by the AWML within 7 DAYS time from
the date of bill.
8. The MEMBER is obliged to pay any contribution required to fulfil the economic
liabilities of AWML pertaining to waste water, CETP and related activities; as per the
formula, derived and approved by the Board of Directors, which may be notified from
time to time.
9. Of the party of the Second Part disconnect, dismantle or reduce or sell off any plant
machineries in existence resulting into reduction / stoppage of effluent as declared by
the party while entering into this agreement, than in such situation the party of the
Second Part shall do so after obtaining prior written approval of AWML and payment
of transfer fees prevailing at the time of giving approval. Thereafter it is entitled to sell
the proportionate shares in reference to declared effluent load to any other member
of AWML who wants to buy the shares or has to comply with the condition of
shareholding with reference to installing new plant and machineries in its unit.
However party of Second Part will not be entitled to ask for any refund of its initial or
subsequent contributions of whatsoever nature made by it to the party of the First
Part. Both the Parties to the contract (i.e. transferor & transferee) are required to clear
all the dues before the transfer of shares is executed
10. The MEMBER is obliged to pay and maintain interest free refundable Security Deposit
of minimum one and half month's billing or based on capital investment as mentioned
in annexure 1, whichever is higher, until its membership is terminated or it is decided
by AWML to return the same to all MEMBERS.
11. Subject to review from time to time as per the prevailing monthly charges per m3 of
effluent/ water consumption, and member shall be liable to make good the deficit in
the required deposit amount.
12. The MEMBER shall get the consent from the Gujarat Pollution Control Board directing
the MEMBER to send its raw EFFLUENT to the chamber of Effluent conveyance

pipeline of GIDC for the member near its Gate connected through pipeline up to inlet
point of the CETP set up by AWML/ GIDC for treatment as per their standard
procedure and norms.
13. MEMBER shall not discharge any effluent treated or untreated outside his premises
leading to any open drain or surface drain or nallah, which shall be subject to
verification and vigilance of AWML or any other regulatory authority. The member
shall maintain zero discharge; other than CETP chamber; throughout the year. They
shall provide necessary provisions/facilities to take care of additional water in rainy
seasons.
14. In the event of CETP break down, the member will immediately close down its unit
and stop discharging the effluents.
15. The Member shall ensure that chemicals, solvents and other toxic chemicals giving
rise to refractory COD, are not discharged in CETP. The member have to segregate the
concentrated wastes having high COD and high TDS and have to treat individually in
either incineration system or MEE or any other suitable system as per consent
condition.
16. The MEMBER declares that the MEMBER shall make all arrangements and installations
for the measurement of flow of the EFFLUENT and shall be open to inspection by
AWML or competent authorized agency appointed by AWML.
17. AWML shall reserve its right to amend/change the inlet norms of raw EFFLUENT from
the MEMBER, if the MEMBER'S EFFLUENT is found to affect the performance of the
CETP in achieving the treated effluent norms prescribed by GPCB or any other
regulatory authority.
18. The MEMBER shall make all proper and adequate arrangements for keeping accurate
and classified daily log book records of production, daily water consumption and daily
waste water generation and daily waste water discharge to CETP and send the
compiled records to the AWML; for compilation and submission to GPCB. In case of
change in product or manufacturing process/route, the MEMBER shall also inform
AWML in advance and get confirmation for the acceptability of EFFLUENT for
treatment in AWML. AWML shall submit above information/data to GPCB or any other
regulatory authority up on their request.

19. The AWML or its Authorized Representative(s) shall have right of entry at all hours for
the purpose of monitoring the Effluent Collection Facilities, quality and quantity of
effluent, to inspect plant and machineries and manufacturing facilities inside the
MEMBER'S premises.
20. The MEMBER shall make adequate arrangements at its own cost as approved by and
to the satisfaction of the AWML for flow measurement, collection and storage of its
raw EFFLUENT in its premises and shall give access to the AWML to its storage facility
for all 24/48 hours of the day as the case may be.
21. The member shall stop the production and other activities generating wastes water
during the planned/ accidental shut down of CETP operations; as per the instructions
of AWML.
22. The member shall put the metering System for their daily water consumption from
the GIDC/ borewell and shall keep the records of their water consumption.
23. Member shall not permit to any third party to join their line with member's chamber
inside its premises from which effluent is ultimately discharged to Effluent
Conveyance System. This includes the chamber outside his gate which is his discharge
point.
24. The member shall not be entitled to seek membership to any other CETP and that shall
consistently and permanently send the effluent to CETP of AWML only.
F. CONVEYANCE
The MEMBER shall at its own cost discharge its EFFLUENT in Conveyance System
maintained by AWML/ GIDC complying with the inlet norms of CETP.
The MEMBER for avoiding pollution from the discharge of its EFFLUENT has examined
possibilities of having its EFFLUENT treated at its site and it has found that it is not
going to be economically viable. The MEMBER states that this is the reason, which
prompted him to enter into AGREEMENT with the AWML by which it undertakes to
send its EFFLUENT to be treated and processed by the AWML.
G. Quantity and Quality of Effluent
1. The quality and quantity of EFFLUENT shall not exceed to that declared in Application
Form without written consent from AWML.
2. The MEMBER shall have to bear all the costs for the calibration of the flow meter as
per the instructions of AWML. If the MEMBER on its own decides to carry out

calibration of flow meter, he has to inform the same to AWML in advance and
calibration of flow meter shall be carried out in presence of AWML authorized person.
The calibration of flow meter shall be carried out only by competent agency
authorized by AWML.
3. The AWML may disconnect the effluent drainage connection after giving prior notice
to the MEMBER, if the effluent is found not in consonance with the conditions
mentioned in this AGREEMENT.
4. The decision of the AWML in disconnecting the EFFLUENT drainage connection of the
MEMBER for noncompliance with various clauses shall be final and it will not be called
in question and the MEMBER shall have to pay the AWML the extra cost which shall
be charged by the AWML for the expenditure incurred in analysing, and extra
treatment charges and related other expenditures.
5. Any non-compliance of industry shall be noted and informed to member unit for the
same.
6. Major non-compliance of industry will be noted seriously and the member unit will be
asked for the same and will be visited if required.
7. For the first non-compliance, the technical committee will have discussion with the
member industry and to visit if required for improving the EMS of the defaulting unit.
8. Also such unit shall be monitored at least twice a week including night monitoring.
9. If the non-compliance found second time, the discharge connection shall be
disconnected for a period of seven days till the unit make necessary amendment for
compliance.
10. If the non-compliance found third time, the discharge connection shall be
disconnected for a period of one month till the unit make necessary amendment for
compliance. The governing authority like GPCB, GIDC shall be informed to take
necessary action against defaulter industry.
11. All the members have to comply the conditions in MOU as well as Consent from GPCB.
12. The member shall be liable to pay cost of any damage directly or indirectly caused to
Effluent conveyance system and Common Effluent Treatment Plant of AWML as a
result of change in quality of effluent discharged by member in conveyance system.
13. The MEMBER shall be bound to accept the said disconnection and reconnection shall
be given only after the AWML is satisfied that the member has made adequate
arrangement for the pre-treatment of effluent to the acceptable inlet norms, and if it
fails to do so, its membership will be suspended. The MEMBER shall have to pay to
AWML charges for the disconnection and reconnection as decided by the Board of
Directors.
H. Billing and Payment of Treatment Charges:
1. The MEMBER shall pay to the AWML the charges as mentioned in Schedule of Charges
plus applicable taxes as may be notified/made effective from time to time for treating
its industrial EFFLUENT. The AWML shall raise monthly bill for treatment to the
MEMBER. The MEMBER shall make payment of the bill within 7 days from the date of
the bill.
2. The applicability of service tax for the services in the form of treatment of effluents is
not clearly defined in the relevant Act and Rules and therefore shall not be recovered
in the bill. However, if it is established by the department at a later date that service
tax is attracted on such charges, the member undertakes to pay the same from the
date the department raises its demand along with penalties and interest for the period
covered by the department in Demand Notice.
3. The member shall be liable to pay any taxes or levies or cess if imposed by any
authority from the date it is made effective.
4. In case there is any dispute regarding billing, the MEMBER shall not withhold payment.
After making full payment of such Invoices, the MEMBER shall lodge the claims to the
AWML giving full particulars within a period of TEN (10) DAYS from the date of making
the payment, and such claims if found correct, the AWML shall give adjustment for
the same in the next bill.
5. The MEMBER shall pay interest on all delayed payments @18/%. Delayed payment
means any payment not received within the stipulated due date of any invoice raised
against the MEMBER by the PIL. The PIL reserves right to disconnect and stop
treatment of effluent on account of non-payment, till payment is received against the
said invoice.
6. In case of dishonour of cheque, the member has to pay the amount by way of Pay
Order or Demand Draft and shall have to pay the charges for dishonour of cheque and
allied costs as may be fixed by AWML from time to time.
7. The MEMBER shall be bound by the analysis of the AWML for levy of treatment
charges and shall not call it in question for any reason whatsoever. In case of dispute,

joint testing may be carried out at AWML or any Approved accredited laboratory at
the MEMBER'S cost.
8. The MEMBER shall be bound to pay Extra Treatment Charges and cost of damage as
may be fixed for the quality and quantity of effluent treated by PIL, which does not
meet the inlet norms of CETP.
9. The AWML shall impose penalty and / or disconnect the effluent drainage connection
/ after giving 3 days prior notice to the MEMBER, if it is found that the MEMBER has
carried out tampering with flow meter/ TOC / pH meter and / or declared false
effluent/ water consumption data.
10. Charges are subject to revision from time to time due to escalation in operations and
Maintenance cost or for any other reasons not within the control of AWML during
currency period of this agreement as may be decided by the board.
11. AWML shall impose additional charges to the member in any forms in case the change
in legal requirements/ directions etc. result in any treatments/ discharge/ collection/
conveyance/ operation & maintenance requirements and therefore the cost of
treatment.
12. AWML shall inform member in advance for any planned shutdown of conveyance or
treatment infrastructure and may direct the member to close down/slow down its
production and related activities generating waste water. The member has to follow
the directions without questioning the same, what so ever.
13. In case of any accidental/unplanned breakdown of treatment and/or conveyance
facilities; member is obliged to stop its activities; strictly in line with AWML’s
directives.
I. DEFAULT
1. If the MEMBER defaults in the discharge of any of the obligation under the present
agreement, and in the event of default by the MEMBER in payment of treatment
recovery/service charges due from the MEMBER, the AWML shall
i. Refuse to accept EFFLUENT from the MEMBER for treatment and
disconnect.
ii. Notify to Gujarat Pollution Control Board AND/OR appropriate authorities
the name of the MEMBER committed such default and that it’s EFFLUENT
would not be taken for treatment by the AWML on account of such
defaults.
iii. Inform the MEMBER that its EFFLUENT would be deemed to cause
pollution and the MEMBER shall be liable as polluter under the
Environmental Act/laws/Regulations and
iv. Notify to GPCB to take such action as may be deemed necessary under
Environmental Act/laws/Regulations against such MEMBER.
2. The MEMBER declares that the MEMBER alone shall be liable for any action initiated
against the MEMBER by the Gujarat Pollution Control Board or any other regulatory
authority under the Water (Prevention and Control of Pollution) Act, 1974 or any other
applicable Environmental laws.
3. AWML reserves the right to accept or refuse membership, in the event of member
committing any breach / violation of the condition of the present agreement or any
provision of law /Act/ Rules for the timing being in force, AWML reserves its right to
suspend / cancel the membership for such period as it deem fit without giving any
reason or prior notice.
4. Where an offence under the Environment Protection Act or under the rules framed
there under, has been committed by the member or is attributed to any negligence
on the part of the member which shall include its Directors, partner, proprietor,
manager, secretary, officer, partner, etc. and if such member is guilty to the offence
or is liable to be prosecuted against and punished accordingly, no suit, prosecution or
legal proceeding (s) shall lie against AWML for the offence committed by its member
and member shall be solely responsible to bear the cost of damage including
compensating towards any damage to AWML.
5. It is also agreed by the MEMBER that the AWML is not and shall not be liable in any
manner whatsoever, due to any negligence and for any reason or otherwise of the
MEMBER, the untreated EFFLUENT is discharged by the MEMBER at a place other than
that authorized by GPCB.
J. TRANSFER OF RIGHTS
1. The AWML may at any time transfer or assign its rights and obligation under the
AGREEMENT to any other company or business concern. Upon such transfer or
assignment, only the transferee or assignee shall be liable for the obligations herein
contained.
2. The MEMBER may, subject to approval of the AWML obtained in advance in writing,
transfer and assign its rights and obligations under this AGREEMENT to any other Firm
or company. Upon such transfer and / or assignment, only the transferee and / or
assignee shall be liable for the obligations herein contained. The MEMBER shall
produce satisfactorily evidence and documents as required by the AWML at the time
of transfer of rights. No part transfer of rights shall be approved.
3. Provided further that the MEMBER shall first make payments of all bills issued by the
AWML for the EFFLUENT treatment in full including interest, if any, thereon for
delayed payments before applying for the approval of transfer and / or assignment as
aforesaid to the AWML. The member shall pay the transfer fees along with application
of Transfer of effluent quantity/ water consumption rights to other member as may
be decided by Board from time to time. In the event of the failure on the part of the
MEMBER to comply with the provisions of this agreement, the PIL reserves its rights
to discontinue accepting EFFLUENT either to the MEMBER or to its transferee and / or
assignee and without prejudice to any other rights, which the AWML may be having
under the terms of the AGREEMENT or otherwise.
4. The incoming member OR existing shall have to pay the transfer and other charges as
may be fixed by AWML from time to time.
K. PENALTIES
1. The MEMBER undertakes to pay penalties as may be notified by the AWML for
noncompliance of Clauses of this AGREEMENT as decided by the Board from time to
time.
L. FORFEITURE
1. In case of failure of the MEMBER to pay charges as notified by the AWML and as
specified in various Clauses of this AGREEMENT, the AWML shall be at the liberty to
adjust the amount from deposit of the MEMBER and AWML have right to use spare
capacity to other prospective MEMBER.
M. SUSPENSION OF MEMBERSHIP
1. The MEMBER shall be suspended for noncompliance with the Clauses of this
AGREEMENT at the sole discretion of the AWML without assigning any reason

whatsoever. The PIL shall not receive any EFFLUENT from the MEMBER during the
period of suspension.
2. The AWML shall inform the GPCB about the suspension of any MEMBER. The
suspension shall be revoked only at the sole discretion of the AWML after it is satisfied
that its conditions have been met.
N. FORCE MAJEURE
1. In case of any force majeure, AWML shall not be saddled with any liability contingent
otherwise but in that case, and it shall be the sole liability of the MEMBER.
2. Statuesque neither party.
3. Both the parties hereto agree that due to change in any laws related to pollution or
due to any directive of any court or Authority, if AWML is to incur any additional
financial burden consequent upon any alteration and/ or modification on the site or
because of any other reason, then, in that case the MEMBER shall be liable to
contribute for the same proportion to its disposal of raw effluent quantity in AWML’s
chamber provided at the gate of the member.
4. The term FORCE MAJEURE in this AGREEMENT means act of God, war, revolt, riot, fire,
tempest, flood, earthquake, lightening, direct or indirect consequences of war
(declared / undeclared), sabotage, hostilities, national emergencies, civil disturbances,
commotion, embargo or any law of promulgation, regulation or ordinance whether
Central or State or Municipal, breakage, bursting or freezing of pipeline, break down
in plant. Upon occurrence of such cause and on its termination, the parties rendered
unable as aforesaid shall notify other party within TWENTY FOUR (24) HOURS of the
beginning and the ending, giving full particulars and satisfactory evidence thereof. Any
action of labor employed by the MEMBER shall not be considered as FORCE MAJEURE.
O. PREVIOUS CORRESPONDENCE
All discussions and meetings held and correspondence exchanged between the Pit and
the MEMBER in respect of the AGREEMENT and any decisions arrived at therein, in
the past and before the coming into force of the AGREEMENT and no reference of
such discussions or meetings or past correspondence shall be entertained by either
the AWML or the MEMBER for interpreting the AGREEMENT or otherwise.
P. LAWS GOVERNING THE AGREEMENT

The present AGREEMENT shall be subject to Indian laws and rules and regulations,
notifications etc. issued under such laws.
Q. AMENDMENTS
Any amendments to any of the clause of the AGREEMENT shall be proposed and sent
in writing to the other party by the party proposing such amendment and if both the
AWML and the MEMBER agree to such amendment, then same shall be incorporated
in the AGREEMENT
R. INDEMNITIES
1. The MEMBER shall be deemed to be in exclusive possession and control of the said
EFFLUENT and fully liable and responsible for its arrangements, appurtenances and
properties before the effluent leave the premises of the MEMBER through drainage
connection into Effluent Drainage Line, of AWML.
2. Accordingly the MEMBER agrees to fully protect, indemnify and hold the AWML or its
employees, agents & successors and assigns harmless against any and all claims,
demands, actions, suits, proceedings and judgments and any and all liabilities, costs,
expenses, damages or losses arising out of or resulting from or incidental to or in
connection therewith, which may be made out against the AWML, whether by the
MEMBER, its employees, agents or successors and assigns or by third parties on
account of damages or injury to property or person or loss of life resulting from or
arising out of the installation, presence, maintenance or operation of the intake
arrangements, appurtenances and properties of the MEMBER.
S. ARBITRATION
In case of any disputes or difference of opinion arising out of the present agreement
the matter shall be referred to an Arbitrator mutually agreed upon by the member
and AWML whose decision on the issue shall be final and binding on both the parties
T. TERMINATION OF AGREEMENT
1. The AWML has the unrestricted right to terminate this AGREEMENT and deduct it’s all
pending claims from the amount of contribution paid by the MEMBER.
2. This AGREEMENT can be terminated by either party, by giving a written notice of at
least 120 days to the other. If the MEMBER requests cancellation, the provision
relating to minimum charges shall be applicable, also during the notice period.
U. JURISDICTION

1. The PIL and the MEMBER mutually agree that only the local civil court shall have
jurisdiction for all the disputes/ differences arising out of this agreement.
2. The addresses of parties hereto unless changed by written notification to be given at
least 15 days in advance by registered letter prior to proposed date of change, IN
WITNESS WHEREOF the parties hereto acting through their properly constituted
representatives have set their hands to cause this AGREEMENT signed and executed
in their respective names and on their behalf.
For and Behalf of AWML
Name
Designation Address
For and behalf of MEMBER
Name
Designation Address

ANNEXURE – 15
POLICY OF CETP

POLICY OF CETP FOR CONVEYENCE, ACCEPTANCE, TREATMENT & DISPOSAL OF EFFLUENT
FROM MEMBER INDUSTRIES
1. Member must have CC&A from GPCB to discharge their effluent in CETP conveyance
pipeline.
2. All the prescribed norms in CC&A for discharge of effluent from member industry to
CETP must be achieved by member.
3. Member must obtain CETP membership for the discharge of effluent into CETP by
signing the agreement with CETP management and must follow the CETP policy.
4. Each Member industry will be monitored minimum twice a month. If required,
frequency shall be increased.
5. Samples of treated effluent discharged from each industry will be collected and
analysed in the CETP laboratory.
6. The flow meter reading will be noted during each visit and daily record will be
collected from each industry at the time of sampling.
7. Any non-compliance of industry shall be noted and informed to member unit for the
same.
8. Major non-compliance of industry will be noted seriously and the member unit will be
asked for the same and will be visited if required.
9. For the first non-compliance, the technical committee will have discussion with the
member industry and to visit if required for improving the EMS of the defaulting unit.
10. Also such unit shall be monitored at least twice a week including night monitoring.
11. If the non-compliance found second time, the discharge connection shall be
disconnected for a period of seven days till the unit make necessary amendment for
compliance.
12. If the non-compliance found third time, the discharge connection shall be
disconnected for a period of one month till the unit make necessary amendment for
compliance. The governing authority like GPCB, GIDC shall be informed to take
necessary action against defaulter industry.
13. The MEMBER has to establish an EFFLUENT DISCHARGE SYSTEM as proposed by
AWML, for the discharge of its effluent into CETP drainage line.
14. The Final discharge of effluent through final discharge valve shall be as under.
a. For Industry having discharge less than 25 KLD, the final discharge valve shall
be operated manually.
b. For Industry having discharge more than 25 KLD, the final discharge valve shall
be operated automatically which shall be connected with automization system
of CETP.
15. All the commercial and financial terms mentioned in agreement with CETP must be
followed by member industry.
Copyright © 2022 FDOKUMEN