REDD Working Papers: REDD and sustainable development - perspective from Viet Nam
38
Tim Holland and Richard McNally REDD and Sustainable Development – Perspective from Viet Nam REDD WORKING PAPERS REDD Viet Nam.indd 1 9/9/10 15:56:25
-
Upload
ucberkeley -
Category
Documents
-
view
0 -
download
0
Transcript of REDD Working Papers: REDD and sustainable development - perspective from Viet Nam

Tim Holland and Richard McNally
REDD and Sustainable Development– Perspective from Viet Nam
RED
D W
OR
KIN
G P
APE
RS
REDD Viet Nam.indd 1 9/9/10 15:56:25

First published by the International Institute for Environment and Development (UK) in 2010Copyright © Copyright Netherlands Development Organisation (SNV) and International Institute for Environment and DevelopmentAll rights reserved
For a full list of publications please contact:International Institute for Environment and Development (IIED)3 Endsleigh Street, London WC1H 0DD, United KingdomTel: +44 (0)20 7388 2117Fax: +44 (0)20 7388 [email protected] www.iied.org/pubs
Citation: Holland, Tim & McNally, Richard (2010) REDD Working Papers: REDD and sustainable development – perspective from Viet Nam IIED, London.
All omissions and inaccuracies in this document are the responsibility of the authors. The views expressed do not necessarily represent those of the institutions involved, nor do they necessarily represent official policies of Norad.
Design by: Eileen Higgins, email: [email protected] photo: iStockphoto.com/Zocha_K
REDD Viet Nam.indd 2 9/9/10 15:56:25

Poverty and sustainable development impacts of REDD architecture; options for equity growth and the environment
About this project...Poverty and sustainable development impacts of REDD architecture is a multi-country project led by the International Institute for Environment and Development (IIED, UK) and the University of Life Sciences (Aas, Norway). It started in July 2009 and will continue to May 2013. The project is funded by the Norwegian Agency for Development Cooperation (Norad) as part of the Norwegian Government’s Climate and Forest Initiative. The first phase of the project (July 2009 to May 2010) has been in partnership with Fundação Amazonas Sustentável (Brazil); Civic Response (Ghana); SNV (Viet Nam); Sokoine University of Agriculture, Faculty of Forestry and Nature Conservation (Tanzania); and Makerere University, Faculty of Forestry and Nature Conservation (Uganda).
The project aims to increase understanding of how different options for REDD design and policy at international, national and sub-national level will affect achievement of greenhouse gas emission reduction and co-benefits of sustainable development and poverty reduction. As well as examining the internal distribution and allocation of REDD payments under different design option scenarios at both international and national level, the project will work with selected REDD pilot projects in each of the five countries to generate evidence and improve understanding on the poverty impacts of REDD pilot activities, the relative merits of different types of payment mechanisms and the transaction costs.
In the first phase of the project, exploratory studies of different aspects of the design of REDD mechanisms were conducted to lay the foundation for the work in Phase 2. These Working Papers are designed to share the preliminary findings of research undertaken during the first phase of this project. They have not been subject to a full peer review process and are being made available online to stimulate discussion and feedback.
...in Viet NamThe following report from Viet Nam surveys priority areas with the most potential for REDD projects in Viet Nam. Through looking at the forest cover change and associated carbon density at district, province and national level, this report unmasks the patterns of afforestation and deforestation behind the net deforestation rate nationally in Viet Nam, which is close to zero. Following this analysis, the established priority areas are considered in terms of their opportunity costs for REDD against their likely alternative use for agricultural development.
REDD Viet Nam.indd 3 9/9/10 15:56:25
This report has been produced under the project Poverty and sustainable development impacts of REDD architecture, with generous support from the Norwegian Agency for Development Cooperation (NORAD).
We would like to thank our consultants Mr. Vu Tien Dien and Mr. Tran Hieu Minh for their assistance in collecting data for the opportunity costs section of the report. Holly Gibbs at the University of Wisconsin and Aaron Ruesch at the University of Washington provided helpful comments on the use of their dataset on land-cover carbon density. The Global Land Cover Facility at the University of Maryland provided a great service to many by making their global forest cover data free and publicly available.
REDD Viet Nam.indd 4 9/9/10 15:56:26

Contents
1 Summary
2 Overview of mapping
3 Forest cover maps for Viet Nam: 2000 and 2005 3.1 MAPS: Forest cover in 2000 and 2005 3.2 Consistency between VCF forest cover and other data sources
4 Forest cover change: 2000 to 2005 4.1 MAPS: Forest cover change from 2000 to 2005 4.2 Variation in rates of forest cover change 4.3 Comparison between sources of forest cover change results
5 Mapping carbon density 5.1 MAPS: Land cover carbon density in 2000
6 Prioritising areas for REDD and next steps 6.1 MAPS: Prioritising areas for REDD 6.2 Next steps
7 Opportunity costs – preliminary results 7.1 Opportunity cost of carbon
Annexes Annex 1: Forest cover data by province from VCF and MARDAnnex 2: VCF forest cover data by district for five selected provincesAnnex 3: Summary of eco-floristic zones and IPCC Tier 1 carbon estimates for Viet NamAnnex 4: Data sources and mapping details
1
3
556
9101112
1314
151618
1922
2323262830
REDD Viet Nam.indd 5 9/9/10 15:56:26

FiguresFigure 1: Comparison of estimates from different sources of total national forest coverFigure 2: Comparison of estimates from different sources of forest cover in regions and provincesFigure 3: Hypothetical pixels showing different levels of change in forest coverFigure 4: Variation in rates of forest cover change among districtsFigure 5: Comparison between sources of data on forest cover change at the scale of regions and provincesFigure 6: Prioritising provinces for REDD based on total forest cover and rate of forest cover changeFigure 7: Prioritising districts for REDD based on total forest cover and rate of forest cover changeFigure 8: Prioritising provinces for REDD based on carbon density and rate of forest cover changeFigure 9: Prioritising districts for REDD based on carbon density and rate of forest cover change Figure 10: Change in area of different crop types in target districts in each of three provinces. Figure 11: Forest cover change for two time periods in the target districts of Dak Nong (top third of the map) and Lam DongFigure 12: The relationship between the rate of expansion and the NPV of crop types in target districts of the three provinces
MapsForest cover by province 2000 Forest cover by province 2005 Forest cover by district 2000 Forest cover by district 2005Forest cover change by province: 2000–2005 Forest cover change by district: 2000–2005 Forest cover change by commune: 2000–2005 Forest cover change by pixel (scale of original VCF data): 2000–2005 FAO eco-floristic zones Average land cover carbon density in 2000 by 1km pixel Average land cover carbon density in 2000 by province Average land cover carbon density in 2000 by district Priority provinces for REDD based on total forest cover and rate of forest cover change Priority districts for REDD based on total forest cover and rate of forest cover change Priority provinces for REDD based on carbon density and rate of forest cover change Priority districts for REDD based on carbon density and rate of forest cover changePrioritising communes for REDD in Lam Dong province
REDD Viet Nam.indd 6 9/9/10 15:56:26

1
REDD and Sustainable Development – Perspective from Viet Nam
This report provides preliminary information on the potential for REDD in Viet Nam by surveying, on the one hand, forest cover change and carbon density and on the other hand, opportunity costs relative to the agricultural potential. The methods used in this report were to first study forest cover change and carbon density using coarse-resolution forest cover data available in the Vegetation Continuous Fields data product. This information was used to prioritise certain areas as having good potential for REDD. Based on that information, SNV Viet Nam selected areas within three provinces to undertake an initial study of opportunity costs based on government agricultural statistics at the district level.
The mapping shows a mixed pattern of deforestation in Viet Nam. The results are broadly consistent with government statistics indicating that Viet Nam has a net rate of forest change very close to zero. However, what is brought to light by these maps are the pronounced differences from one area to the next. The low net rate of forest change at national level masks patterns of significant afforestation in some areas, particularly in the north, and rapid deforestation in other areas. The central highlands area shows particularly extensive deforestation.
IPCC Tier 1 estimates of carbon density are somewhat low in Viet Nam when compared to areas of richer forest elsewhere in southeast Asia. However, there are patches of forest with higher density, especially in the central highlands and north central region. When these values are compared with government agricultural data, the results suggest a wide range in the potential opportunity cost of reducing a tonne of carbon dioxide emissions. In some cases, this value may be less than $1 USD; however, in others it may rise well above $10 USD.
Summary1
REDD Viet Nam.indd 1 9/9/10 15:56:26

2
REDD Working Papers
REDD Viet Nam.indd 2 9/9/10 15:56:26

3
REDD and Sustainable Development – Perspective from Viet Nam
As Reducing Emissions from Deforestation and Degradation (REDD) moves forward internationally and in Viet Nam, an essential requirement will be data on forest cover and forest quality that is consistent, spatially explicit, and transparent to outside scrutiny. The maps and data contained in this report were assembled in the hopes of contributing a basic overview of forestry and carbon data in Viet Nam. These maps and data are at coarse scales and are in some cases based on global averages rather than on Viet Nam-specific information. However, they are a useful first compilation of the data required for REDD that can assist planning processes as more precise estimates are developed.
This report introduces maps and data on forest cover generated using the Vegetation Continuous Fields (VCF) remote sensing product. The VCF product is relatively coarse resolution (500 million pixels), and as such cannot offer the same level of precision as can inventories based on higher resolution images (for example, Landsat or SPOT) or on field surveys. As such, it is not appropriate for the development of national or project REDD baselines. Nevertheless, the VCF does have two important advantages. First, because it is lower resolution, it is quicker and less expensive to do a nation-wide comparison of rates of forest change than it would be using higher resolution imagery. Second, its quality and consistency, having been produced by one of the world’s leading institutions on land cover change monitoring1, makes comparisons between areas using the VCF very reliable. This is particularly important as it provides a cross-check for official data which sometimes exhibits inconsistencies among agencies and among provinces in situations where data collection at provincial and national levels is dependent on upwards reporting by commune or district government officials.2
Other data sources for forest cover are also examined here to provide some perspective on how the VCF data compares. We examine the Forest Sector Support Partnership (FSSP)’s Forest Sector Monitoring and Information Systems (FOMIS) 2005 report3 as it provides estimates of forest cover at the regional level in 2005. In addition, a recent publication by RECOFTC4 has synthesized official data from the Ministry of Agriculture and Rural Development (MARD) and Forest Protection Departments (FPD) on forest cover at provincial level in 1999 and 2004. Both the FOMIS and RECOFTC reports are used as points of comparison for the VCF data. The most comprehensive source of data on forests in Viet Nam, however, is not included here: the Viet Nam Forest Inventory (VFI) is based on remote sensing imagery and has been collected every five years since 1995. Much of the VFI has not been processed to the point where the data is easily useable, however, and it is not publicly accessible. As such, the main points of comparison will be the two sources first mentioned.
Overview of mapping2
1. The Global Land Cover Facility, based in the University of Maryland. http://glcfapp.umiacs.umd.edu/2. Nguyen Ba Ngai, Nguyen Quang Tan, William D. Sunderlin, Yurdi Yasmi. 2009. Forestry and Poverty Data in Viet Nam: Status, Gaps, and Potential Uses. RECOFTC. Available from http://www.recoftc.org/site/fileadmin/docs/publications/The_Grey_Zone/2009/Forestry_and_Poverty_Data_in_Vietn_Nam_web.pdf. 3. Doan Diem, Nguyen Ba Ngai, Nguyen Hong Quang and Le Van Ly. (2008). Viet Nam FOMIS Sector Indicators and Baseline Data Report 2005, Ministry of Agriculture and Rural Development and Forest Sector Support Partnership. Available (in part) from http://www.Viet Namforestry.org.vn/ list_news.aspx?ncid=36.4. RECOFTC 2009. Forestry and Poverty Data in Viet Nam.
REDD Viet Nam.indd 3 9/9/10 15:56:26

4
REDD Working Papers
In addition to information on forest cover, this report provides maps of estimated carbon density at a resolution of 1km by 1km across Viet Nam. These maps were created using data from the Carbon Dioxide Information and Analysis Centre which is based on the Intergovernmental Panel on Climate Change (IPCC)’s “Tier 1” estimates for carbon density for particular land cover types in particular eco-regions.5 These data are again quite coarse-resolution but are currently the best data available at a global scale.
One of the central goals of this report – in addition to simply making this data easily accessible to REDD stakeholders – is to identify priority areas for REDD in Viet Nam. To do this, we operate on the assumption that for an area to be interesting for REDD, it needs to face a threat of deforestation while still having a relatively significant standing stock of carbon. Here, the threat of deforestation is estimated based on historical rates of forest cover change between 2000 and 2005. Assuming that past rates from 2000 to 2005 will be a good indicator of rates after 2009 is certainly an oversimplification, but is a starting point for planning purposes. The stock of carbon is assessed either based on forest cover in 2005, or on the Tier 1 carbon density estimates. How different areas of Viet Nam measure relative to these two characteristics and relative to each other provides a useful indicator for determining which parts of the country should receive the most attention for REDD.
5. Ruesch, Aaron, and Holly K. Gibbs. 2008. New IPCC Tier 1 Global Biomass Carbon Map For the Year 2000. Available online from the Carbon Dioxide Information Analysis Center http://cdiac.ornl.gov
REDD Viet Nam.indd 4 9/9/10 15:56:26

5
REDD and Sustainable Development – Perspective from Viet Nam
Forest cover maps for Viet Nam: 2000 and 2005The following pages have a series of maps representing forest cover in Viet Nam in 2000 and 2005. The original data from the VCF is at a scale of 500 million (m) pixels, with each pixel having a value in terms of its percentage forest cover. It many cases, it is helpful to see patterns at different administrative levels; for this reason, additional maps were created that show average values of pixels within each district and each province6. More details on mapping procedures are provided in Annex 4, while data tables showing percentage cover at province and district level are provided in Annexes 1 and 2.
3.1 MAPS: Forest cover in 2000 and 2005
3
6. In most cases, we have also produced maps at commune-level, but here we have left these out for the sake of brevity. Anyone interested in these additional maps should contact the authors.
REDD Viet Nam.indd 5 9/9/10 15:56:28

6
REDD Working Papers
3.2 Consistency between VCF forest cover and other data sourcesAt national scale, the VCF provides an estimate of average forest cover that is broadly consistent with both FOMIS data and MARD/FPD data reported by RECOFTC (Figure 1). One difference of note is that although estimates were almost exactly the same around the year 2000, they diverged some between there and 2005, with VCF showing a stable or slightly declining rate of national forest cover and other sources showing a slightly increasing rate.
At regional and provincial scales, the results are again broadly consistent between the MARD/FPD data from RECOFTC and the VCF data, although certain areas do show some variation. For example, the central highlands, north central coast, and the northeast are reported as having higher cover by MARD/FPD than they are by VCF, while the VCF indicates higher cover than RECOFTC for the Mekong delta, the southeast, and the northwest (Figure 2; left). Most provinces are shown as having similar forest cover by the two sources, although there are a few individual provinces where the values are strikingly different (Figure 2; right). For example, a few provinces in the Mekong Delta, Ben Tre (BTr), Hau Giang (HauG), and Tien Giang (TG), show significantly higher forest cover on VCF than they do with official data (19.46%, 18.16%, and 13.81% respectively from VCF, but only 1.66%, 4.19%, and 1.26% from MARD/FPD data reported by RECOFTC). It may be that there is a particular land cover prevalent in the delta that is being counted as forest by VCF but not counted as such by official statistics.
REDD Viet Nam.indd 6 9/9/10 15:56:30

7
REDD and Sustainable Development – Perspective from Viet Nam
Figure 1. Comparison of estimates from different sources of total national forest cover
There is a certain amount of variation between data sources when looking at national-scale data. This difference seems to be increasing through time, as reports based on MARD and FPD offical data (both RECOFTC and FOMIS) report increasing forest cover, while VCF reports stable or slightly declining forest cover.
Figure 2. Comparison of estimates from different sources of forest cover in regions and provinces
Percentage cover in 2004 as given by the VCF (bottom axis) is plotted against percentage cover in 2004 as given by MARD/FPD data presented in RECOFTC 2009. Regional data is on the left, and provincial data on the right (letter codes for provinces given in Annex 1). The blue dashed line in each graph represents the line of equality where both datasets provide the same result. The correlation between the two data sources is quite strong at regional level (Pearson correlation = 0.94), but a bit less so when information is broken down further by provinces (Pearson = 0.89).
REDD Viet Nam.indd 7 9/9/10 15:56:33

8
REDD Working Papers
Another striking example is Bac Giang (BG), which is shown as having 19.60% forest cover by VCF, but more than double that (40.57%) by official data. Looking further into that one province, only 19.25% of the 40.57% is said to be natural forest. In addition, Bac Giang is only listed as having 25.63% forest cover for 1999, indicating that 15% of the province is likely planted forest less than 5 years old. Some of these plantations may be too young or too low-quality to have been counted as forest by VCF.
REDD Viet Nam.indd 8 9/9/10 15:56:33

9
REDD and Sustainable Development – Perspective from Viet Nam
Forest cover change: 2000 to 2005
Using the VCF forest cover data presented above, we created a map of forest cover change between 2000 and 2005. As above, we then aggregated this map to different administrative levels.
The forest change map was calculated by a simple subtraction of the percentage cover in 2000 from the percentage cover in 2005. This means that the change in cover is presented in absolute terms, rather than relative ones. That is to say that the change is expressed as a percentage of total area, not as a percentage of the original forest area. Therefore, if one area has 20% forest cover in 2000 and 10% forest cover in 2005, that will be presented as a reduction in forest cover of 10% (20% minus 10%), not as a reduction of 50% (10% being half of 20%). This is appropriate for an analysis of REDD potential because REDD is concerned with absolute amounts of carbon sequestered and emitted, not with the amount relative to the starting forest cover (Figure 3).
4
Figure 3. Hypothetical pixels showing different levels of change in forest cover
On the top row, the area changes from being 100% covered in forest to being 90% covered. On the bottom row the change in the same period is from 20% to 10%. In both cases, the change between 2000 and 2005 will be presented as 10% in the following maps – as this is the absolute amount of land that saw its forest cover lost – even though the relative amount of forest change is much greater in the bottom row (where half of the original 20% forest cover disappears).
2000
100% forest cover 90% forest cover
20% forest cover
10% forest cover
2000 2005
2005
REDD Viet Nam.indd 9 9/9/10 15:56:33

10
REDD Working Papers
4.1 MAPS: Forest cover change from 2000 to 2005
REDD Viet Nam.indd 10 9/9/10 15:56:36

11
REDD and Sustainable Development – Perspective from Viet Nam
4.2 Variation in rates of forest cover changeOne thing that is clear from the data is that although all sources agree that the net rate of forest change in Viet Nam between 2000 and 2005 was relatively close to zero, there is a large degree of variation throughout the country. Forest cover changed significantly in parts of Viet Nam, even though increases in some places mask decreases in others when national averages are examined. In some areas, forest loss was quite drastic between 2000 and 2005. For example, three provinces saw more than 50% of the forest cover they had in 2000 lost by 2005: An Giang saw its cover decline from 18.48% to 7.68% (a 58% loss), Tra Vinh from 15.16% to 7.04% (54% loss) Dong Thap from 18.17% to 8.74% (52% loss). Looking at districts, as would be expected from the low national deforestation rate, most have a relatively low net rate of forest change (around 0 on the plots below). However, some have quite pronounced rates of forest cover loss. As the red bars below indicate, 38 districts (out of 674) saw more than 10% of their total area deforested from 2000 to 2005 (Figure 4A), while 51 districts lost more than 50% of their original 2000 forest cover in the same five year period (Figure 4B).
Figure 4. Variation in rates of forest cover change among districts
Percentage change in tree cover between 2000 and 2005 as distributed among districts. Although the majority of districts have seen relatively small changes in their total forest area, there are some that have seen large losses. Out of 674 districts, 38 saw more than 10% of the total district area deforested between 2000 and 2005 (red bars in A), while 51 lost more than 50% of the forest that was standing in 2000 during the same period.
REDD Viet Nam.indd 11 9/9/10 15:56:38

12
REDD Working Papers
4.3 Comparison between sources of forest cover change resultsLooking at forest cover change results from VCF data and from official sources shows that the latter consistently provides estimates of forest cover change that are more positive than estimates from the VCF (Figure 5). This is true in all regions and in all but eight provinces. It is possible that this is an effect of certain incentives to over-report reforestation success.
Figure 5. Comparison between sources of data on forest cover change at the scale of regions and provinces
Both plots show the stated rate of forest cover change (1999 to 2004) from MARD / FPD data reported by RECOFTC 2009 as compared with the rate of change calculated from VCF data (2000 to 2004). The dotted line is the line of equality where both sources give the same result. The plots show that both at the scale of regions (left) and provinces (right) the official data is almost universally more optimistic about the rate of forest cover change than is the VCF data.
REDD Viet Nam.indd 12 9/9/10 15:56:39

13
REDD and Sustainable Development – Perspective from Viet Nam
Mapping carbon density
More central to REDD than forest cover alone is the carbon content of the forests in question. Forests of different types and ages can have vastly different volumes of carbon per hectare. The carbon content of forests has a direct relationship with the volume of emissions averted – and therefore the credits generated – if deforestation or degradation of those forests can be prevented. As such, carbon is the primary interest of REDD project developers or national planners; however, it is much more challenging to measure and monitor than forest cover alone. In its Guidelines for National Greenhouse Gas Inventories (2006)7, the Intergovernmental Panel on Climate Change (IPCC) identifies three levels of accuracy for land use related greenhouse gas (GHG) accounting. These are referred to as Tier 1, Tier 2 and Tier 3. Tier 1 involves using global average values and has the highest level of uncertainty; Tier 2 uses data generated from field work within country but is not necessarily site-specific beyond that; and finally, Tier 3 is the most precise, generally derived from systematic and extensive field sampling at regular time intervals.
According to both the IPCC’s GHG inventory guidelines and the UNFCCC guidelines for the Clean Development Mechanism (CDM), any one of the three tiers of accuracy is acceptable to use for carbon accounting and for the crediting of emissions reductions. However, both bodies cite the principle of conservativeness, meaning that if there is uncertainty in an estimate, credits should only be allocated for the lowest possible amount. As a result, although the use of Tier 1 estimates is permitted, using them effectively penalizes a project or country because the large range of uncertainty will always result in the allocation of fewer credits.
Generating national Tier 2 estimates of forest carbon content is an important next step for the development of REDD in Viet Nam. This can be accomplished with a more detailed forest inventory, including nationally specific forest sub-classes, and nationally specific measurements of carbon density for each forest type. A detailed forest inventory of this type is currently underway as an initiative of the Japan International Cooperation Agency (JICA) and the Department of Forests; this is expected to be completed by 2011. In addition, much work has already been done on the carbon content of certain forest types in Viet Nam, particularly of plantations. To our knowledge, however, this information on carbon density has not been collected anywhere in a central database that can help inform national accounting. Simply gathering and synthesizing existing information would be an important first step in creating a national Tier 2 database. Once existing information has been identified, steps can be taken to address gaps needed to be filled through field measurements.
As an interim source of information before more nationally specific data is available, we have created a set of maps (following pages) and data tables (annex 3) summarizing Tier 1 estimates of land cover carbon in Viet Nam. These are based on a global dataset at 1km resolution made available by the Carbon Dioxide Analysis Information Centre8. This dataset is created by combining three sets of information: (1) eco-floristic zones from the FAO indicating what natural vegetation
5
7. IPCC 2006. Guidelines for National Greenhouse Gas Inventories; Volume 4 – Agriculture, Forestry, and Other Land Use. Chapter 1 – Introduction. Available from http://www.ipcc-nggip.iges.or.jp/public/2006gl/vol4.html. 8. Ruesch, Aaron, and Holly K. Gibbs. 2008. New IPCC Tier 1 Global Biomass Carbon Map For the Year 2000. Available online from the Carbon Dioxide Information Analysis Center http://cdiac.ornl.gov/epubs/ndp/global_carbon/carbon_documentation.html.
REDD Viet Nam.indd 13 9/9/10 15:56:39

14
REDD Working Papers
in the area would be in the absence of human disturbance (for example, tropical rainforest, sub-tropical mountain system, and so on); (2) actual land cover in 2000 as determined from remote sensing (such as closed broadleaf forest, forest-agriculture mosaic, grassland, for example); and (3) carbon estimates for each land cover type in each zone as provided by the IPCC.9
5.1 MAPS: Land cover carbon density in 2000
9. Tables in Chapter 4 – Forest Land of the IPCC 2006 guidelines referenced above
REDD Viet Nam.indd 14 9/9/10 15:56:43

15
REDD and Sustainable Development – Perspective from Viet Nam
Prioritising areas for REDD and next steps
6
As we stated earlier, one of the goals of this report was to identify priority areas for REDD in Viet Nam. The choice of areas for the focus of REDD activities should be based on two simple criteria: (1) that those areas have significant remaining stocks of forest carbon, and (2) that they are under threat of deforestation or degradation. Regarding the second criteria, we use historical trends of deforestation as a proxy for future threat. Despite it being an oversimplification to assume that past trends will predict future patterns, this is the most straightforward way to generate an initial idea of threat before more in-depth studies of deforestation drivers are completed.
In terms of an area’s carbon stocks, we can estimate this from two different sources. Either directly from the carbon density maps based on Ruesch and Gibbs (2008) data, or indirectly from maps of VCF forest cover. The VCF data has the advantages that it is more current (2005 as opposed to 2000 for the Ruesch and Gibbs data) and that it is higher resolution (500m instead of 1km); however, on the whole it is likely to be better to use the carbon density information, as this reflects differences in carbon content between forest types and is therefore more tailored to the requirements of REDD.
On the following pages are maps and graphs reflecting possible ways of prioritising areas for REDD. We give four examples of this selection process, two each at district level, and two each at province level. We also provide results based on both forest cover and on carbon density. As discussed above, it is recommended to look at the carbon density prioritisation, but we provide the other for comparison. The results from these two are broadly similar, with the distinction that the carbon density maps tend to prioritise the northwest less than the forest cover maps because of the lower average carbon content of forests in eco-regions to the north of the country.
REDD Viet Nam.indd 15 9/9/10 15:56:44

16
REDD Working Papers
Figure 6. Prioritising provinces for REDD based on total forest cover and rate of forest cover change
Figure 7. Prioritising districts for REDD based on total forest cover and rate of forest cover change
6.1 MAPS: Prioritising areas for REDD
REDD Viet Nam.indd 16 9/9/10 15:56:47

17
REDD and Sustainable Development – Perspective from Viet Nam
Figure 8. Prioritising provinces for REDD based on carbon density and rate of forest cover change
Figure 9. Prioritising districts for REDD based on carbon density and rate of forest cover change
REDD Viet Nam.indd 17 9/9/10 15:56:51

18
REDD Working Papers
The plots at province level show broadly similar results between the carbon density comparison and the forest cover one. In both cases, a similar group of provinces is identified as being of highest priority for REDD. The provinces of Dak Nong, Quang Binh, Lam Dong, Quang Nam, and Dak Lak are of particular interest and should be an initial focus of national REDD activities.
6.2 Next stepsOnce general target regions for REDD have been identified, finer-scale planning can be done to direct sub-national activities. As an example, the following is a map of REDD prioritisation among communes in Lam Dong province. This follows a similar method to the national maps, just at commune scale. It is worth noting that for Lam Dong we used a different threshold (90 tonnes per hectare) for the distinction between ‘high’ vs. ‘low’ carbon density than we did for Viet Nam as a whole (50 tonnes per hectare). This is because Lam Dong as a whole has high land cover carbon density relative to the Viet Nam average, so the higher threshold allows for more differences to be seen within the province itself.
Comparisons among communes are likely to be about the finest-resolution analysis for which VCF data on forest cover are well suited. Finer scale activities will require more detailed mapping of the sort that is being undertaken at a national scale by the JICA / DoF initiative, or at a project level by SNV’s Cat Tien REDD Project in Lam Dong. As these activities progress, they can provide important support to national level REDD progress, provided information from them is shared effectively. This can be further supported by the development of a national database of field studies on the carbon content of forests. This will enable the development of national Tier 2 estimates of forest carbon and will greatly facilitate progress on REDD in Viet Nam.
Prioritising communes for REDD in Lam Dong province
REDD Viet Nam.indd 18 9/9/10 15:56:52

19
REDD and Sustainable Development – Perspective from Viet Nam
Opportunity costs – preliminary resultsIn order to study opportunity costs, SNV Viet Nam selected three potential “hotspot” provinces for REDD (Quang Binh, Dak Nong, Lam Dong), and three districts within each of these provinces. This selection was based on the mapping discussed above and particularly the “REDD prioritisation” exercise (pages 18-22). In each of the nine districts, a preliminary socio-economic assessment was undertaken. In each province and district, consultants met with officials from the Departments of Agriculture and Rural Development (DARDs), the DARD agriculture and forestry divisions, the Forest Protection Departments (FPDs), the Forest Inventory and Planning Institute (FIPI), and statistical offices in order to collect agricultural and economic data and information on the drivers of deforestation.
The result is multi-year data on crop areas for specific crop types (and therefore rates of expansion for individual crops); total crop productivity; change in forest cover and forest type from 2000-2008; and the relative importance of different drivers of forest loss, such as conversion to agriculture, fire, or harvesting. Regarding the drivers of deforestation, there is both ‘official’ data, which is of somewhat low quality, and lists of drivers as ranked by officials at local levels; which is less quantitative, in that it does not include specific area totals, but which is otherwise more detailed. We also have some data on the costs of production, which can be used to estimate net present value of different crop types.
The composition of crops varies greatly between the three provinces (Figure 10). In the target districts of Dak Nong, the largest single crop is coffee; however, coffee saw a significant decline in area planted from 2000 to 2007 due to low coffee prices. The crops in Dak Nong that have actually seen the greatest expansion are cashew, maize, and cassava. In the target districts of Lam Dong, cashew was both the most common crop after paddy rice and the crop that saw the greatest expansion. It nearly doubled in extent in the seven-year period, and in 2007 occupied more than half of the upland agricultural land in the target districts. Lastly, Quang Binh sees a more even distribution between different crop types, with relatively large areas of all of paddy rice, rubber, cassava, peanut, and maize. However, while most crops only expanded slightly in the seven-year period, rubber in Quang Binh expanded to more than double of its original extent.
7
REDD Viet Nam.indd 19 9/9/10 15:56:52

20
REDD Working Papers
Figure 10. Change in area of different crop types in target districts in each of three provinces
In terms of the overall extent of crops, Dak Nong is noticeable in that the crop area in the target districts nearly doubled between 2000 and 2007. This is consistent with remote sensing (SPOT) analysis undertaken by SNV that indicates particularly extensive deforestation in the target districts of Dak Nong (Figure 11).
Figure 11. Forest cover change for two time periods in the target districts of Dak Nong (top third of the map) and Lam Dong
REDD Viet Nam.indd 20 9/9/10 15:56:55

21
REDD and Sustainable Development – Perspective from Viet Nam
Using official government data on total productivity and area coverage for each crop type, as well as information from interviews on average market prices, we calculated the average gross income per hectare for each of the main crop types in the target districts of each of the three provinces. These results are in Table 1.
Table 1. Gross production value (USD/ha*year) for each major crop type in the target districts of three provinces
Lam Dong Dak Nong Quang Binh
Paddy 1902 1773 2097
Maize 905 1091 886
Cassava 660 935 864
Sugar cane 1741 2295 908
Peanut 1204 1423
Coffee* 1599 2085
Cashew* 283 354
Rubber* 192 1141
*Production per area for these perennial crops is for harvested area only, and so does not include an average across all of the area covered by this crop type (which will include young plantations)
Net present value for these crop types was calculated assuming a 15 per cent rate of return relative to gross income, the value used by the Stern review. NPV was calculated with a ten per cent discount rate and 30 year time horizon. Initially, estimates of costs of production were taken from interviews but these values did not match well with previous estimates and had unequal degrees of certainty, so the 15 per cent value was used for better consistency. Cost of production estimates will be improved in future stages of the study. For the perennial crops – rubber, cashew, and coffee – incomes of zero were assumed for the first seven, four, and four years respectively, followed by incomes based on the average return per productive hectare. This will overestimate NPV to some extent as it ignores the costs of production for the initial years which cannot be estimated at this point. These results show rice paddy generally having the highest net present value in all three provinces, with sugar cane not far behind (Table 2).
Table 2. Net present value (USD/ha) for each of the major crop types in the target districts of three provinces
Lam Dong Dak Nong Quang Binh
Paddy 2955 2758 3266
Maize 1410 1701 1379
Cassava 1026 1452 1358
Sugar cane 2706 3567 1410
Peanut 1876 2209
Coffee* 1652 2154
Cashew* 289 365
Rubber* 145 857
*NPV for these perennial crops is calculated using zero income for the first four years of cashew and coffee, and the first seven years in the case of rubber.
REDD Viet Nam.indd 21 9/9/10 15:56:55

22
REDD Working Papers
7.1 Opportunity cost of carbonWe compared the NPV information with data on expansion rates of different crop types in order to highlight crop types that would be particularly important targets for REDD. In general, crops that are expanding fast but which provide relatively low economic returns are those that are most interesting for REDD. In the below illustration (Figure 12), this equates to those crop types towards the bottom right of the figure. As an example, it can be seen that cashew as it is cultivated in Lam Dong and Dak Nong is particularly interesting, both because of generally high rates of expansion, and relatively low returns.
Figure 12. The relationship between the rate of expansion and the NPV of crop types in target districts of the three provinces
This wide range in NPV suggests a similarly large range in the opportunity cost per tonne of carbon as REDD is implemented. Mature forests in Viet Nam are generally in the range of 80 to 180 tonnes of above ground biomass per hectare, which equates roughly to 52 to 117 tonnes of carbon in the above and belowground biomass stocks (using 0.5 carbon fraction of biomass and a 0.3 root to shoot ratio, both of which are in an appropriate range for Viet Nam). Ignoring soil and litter carbon pools, that is a range of 191 to 429 tonnes of potential carbon dioixide emissions (mass of carbon dioxide being 3.66 times greater than equivalent amount of carbon). Using these values, the opportunity cost of reducing one tonne of carbon dioxide emissions may be less then $1 USD in some areas where lower value crops (such as cashew) are expanding into high quality forest. However, in areas of lower forest quality, or compared against more profitable crops (for example, sugar cane or coffee), the opportunity cost of reducing one tonne of carbon dioxide emissions may rise to well over $10 USD.
The results presented here provide some indication of opportunity costs of REDD activities in three areas of Viet Nam. However, this information is only preliminary, and will be greatly improved by further field work, particularly through direct interviews with farmers. This will provide better estimates of the costs of production than were attainable through interviews with government officials and official data sources, and will allow better planning of REDD interventions in the target areas and elsewhere in Viet Nam.
REDD Viet Nam.indd 22 9/9/10 15:56:57

23
REDD and Sustainable Development – Perspective from Viet Nam
Ann
exes
FPD
and
MA
RD o
ffic
ial d
ata
for
2004
(RE
COFT
C 20
09)
Vege
tatio
n Co
ntin
uous
Fie
lds
– Pe
rcen
tage
Tre
e Co
ver
Prov
ince
Figu
re c
ode
Are
a (h
a)Fo
rest
ed a
rea
Nat
ural
for
est
area
Plan
tatio
n ar
ea20
0020
05Ch
ange
200
0 –
2005
(as
pe
rcen
tage
of
2000
cov
er)
An
Gia
ngAG
3406
233.
760.
173.
5918
.48
7.68
-10.
80 (
-58)
Ba R
ia-V
ung
Tau
BR_V
T19
7514
15.3
17.
308.
0123
.88
22.0
9-1
.79
(-7.5
)
Bac
Gia
ngBG
3822
0040
.57
19.2
521
.32
19.2
021
.61
2.41
(13
)
Bac
Kan
BK48
5721
53.8
046
.12
7.67
42.2
645
.77
3.51
(8.
3)
Bac
Lieu
BL25
4190
2.18
0.97
1.21
10.8
87.
13-3
.75
(-34
)
Bac
Nin
hBN
8048
00.
870.
000.
876.
255.
11-1
.14
(-18)
Ben
Tre
BTr
2315
011.
660.
431.
2424
.14
12.8
1-1
1.33
(-4
7)
Binh
Din
hBD
i60
2506
38.0
427
.73
10.3
138
.88
35.1
2-3
.76
(-10)
Binh
Duo
ngBD
u26
8347
5.94
0.39
5.54
24.3
019
.65
-4.6
5 (-1
9)
Binh
Phu
ocBP
6855
9925
.27
18.0
07.
2736
.30
34.9
1-1
.40
(-3.
8)
Binh
Thu
anBT
h78
2230
40.7
637
.42
3.34
32.7
128
.85
-3.8
6 (-1
2)
Ca M
auCM
5199
7018
.68
1.79
16.9
019
.73
14.0
7-5
.65
(-29)
Can
Tho
CT13
8960
0.
000.
0011
.59
8.72
-2.8
7 (-2
5)
Cao
Bang
CB66
9072
45.4
343
.68
1.76
29.6
534
.84
5.19
(18
)
Da
Nan
gD
N12
5624
41.8
029
.50
12.3
046
.59
43.0
1-3
.58
(-7.7
)
Dak
Lak
DL
1306
201
46.3
045
.00
1.30
39.7
735
.29
-4.4
8 (-1
1)
Dak
Non
gD
No
6514
4256
.88
55.4
41.
4451
.49
44.5
4-6
.95
(-14)
Die
n Bi
enD
B95
5411
38.4
837
.29
1.20
47.9
745
.96
-2.0
1 (-
4.2)
Don
g N
aiD
Nai
5860
3026
.43
18.7
97.
6434
.41
33.4
9-0
.92
(-2.7
)
Don
g Th
apDT
3238
003.
400.
003.
4018
.17
8.74
-9.4
3 (-
52)
Gia
Lai
GT
1549
571
49.0
646
.95
2.12
44.8
540
.86
-4.0
0 (-
8.9)
Ha
Gia
ngH
aG78
8437
42.3
336
.66
5.68
33.3
132
.46
-0.8
5 (-2
.6)
Anne
x 1
Fore
st c
over
dat
a by
pro
vinc
e fr
om V
CF a
nd M
ARD.
REDD Viet Nam.indd 23 9/9/10 15:56:57

24
REDD Working Papers
FPD
and
MA
RD o
ffic
ial d
ata
for
2004
(RE
COFT
C 20
09)
Vege
tatio
n Co
ntin
uous
Fie
lds
– Pe
rcen
tage
Tre
e Co
ver
Prov
ince
Figu
re C
ode
Are
a (h
a)Fo
rest
ed A
rea
Nat
ural
For
est
Are
aPl
anta
tion
Are
a20
0020
05Ch
ange
20
00
– 20
05 (
as
perc
enta
ge o
f 20
00 c
over
)
Ha
Nam
HN
a84
953
10.4
07.
752.
657.
488.
991.
51 (
20)
Ha
Noi
HN
o91
846
6.36
0.00
6.36
5.78
6.66
0.89
(15
)
Ha
Tay
HTa
2192
967.
592.
025.
577.
418.
320.
91 (
12)
Hai
Duo
ngH
D16
4772
5.86
1.88
3.97
7.61
7.47
-0.1
3 (-1
.7)
Hai
Pho
ngH
P15
1919
9.58
7.09
2.49
13.4
09.
90-3
.50
(-26)
Hau
Gia
ngH
auG
1578
501.
270.
001.
2711
.29
9.74
-1.5
5 (-1
4)
Ho
Chi M
inh
City
HCM
C29
8500
11.8
24.
637.
1922
.59
13.3
9-9
.19
(-41
)
Hoa
Bin
hH
B46
6253
42.9
432
.23
10.7
128
.59
31.6
13.
02 (
11)
Hun
g Ye
nH
Y89
084
0.
000.
005.
666.
510.
86 (
15)
Khan
h H
oaKH
4693
4341
.79
34.8
46.
9541
.05
38.2
8-2
.77
(-6.
8)
Kien
Gia
ngKG
6284
9714
.25
7.79
6.46
19.5
116
.08
-3.4
3 (-1
8)
Kon
Tum
KT96
1450
65.6
162
.19
3.42
56.4
255
.32
-1.1
0 (-2
.0)
Lai C
hau
LCh
9065
1235
.13
33.5
11.
6251
.37
49.8
6-1
.51
(-2.9
)
Lam
Don
gLD
9762
2063
.11
58.7
84.
3351
.28
48.8
3-2
.45
(-4.
8)
Lang
Son
LS83
0524
40.1
826
.77
13.4
030
.12
34.6
94.
57 (
15)
Lao
Cai
LCa
6357
0843
.20
35.3
77.
8335
.40
36.3
10.
92 (
2.6)
Long
An
LA44
9187
15.6
70.
1815
.49
21.2
315
.78
-5.4
5 (-2
6)
Nam
Din
hN
D16
7631
3.46
0.67
2.78
7.58
6.34
-1.2
4 (-1
6)
Ngh
e A
nN
A16
4872
945
.22
40.2
15.
0138
.45
38.6
20.
18 (
0.5)
Nin
h Bi
nhN
B13
8272
19.8
717
.14
2.73
14.5
413
.60
-0.9
4 (-
6.4)
Nin
h Th
uan
NT
3360
0645
.10
41.9
13.
1935
.39
27.4
7-7
.91
(-22)
Phu
Tho
PT35
1957
43.8
219
.76
24.0
619
.61
23.1
13.
50 (
18)
Phu
Yen
PY50
3506
31.0
025
.55
5.45
35.4
430
.54
-4.9
0 (-1
4)
REDD Viet Nam.indd 24 9/9/10 15:56:57

25
REDD and Sustainable Development – Perspective from Viet Nam
FPD
and
MA
RD o
ffic
ial d
ata
for
2004
(RE
COFT
C 20
09)
Vege
tatio
n Co
ntin
uous
Fie
lds
– Pe
rcen
tage
Tre
e Co
ver
Prov
ince
Figu
re c
ode
Are
a (h
a)Fo
rest
ed a
rea
Nat
ural
for
est
area
Plan
tatio
n ar
ea20
0020
05Ch
ange
20
00
– 20
05 (
as
perc
enta
ge o
f 20
00 c
over
)
Qua
ng B
inh
QB
8051
8663
.21
55.7
77.
4446
.22
41.5
1-4
.71
(-10)
Qua
ng N
amQ
Na
1040
514
42.8
037
.31
5.49
53.2
450
.97
-2.2
7 (-
4.3)
Qua
ng N
gai
QN
g51
3603
31.6
319
.49
12.1
436
.01
33.6
3-2
.38
(-6.
6)
Qua
ng N
inh
QN
i60
6428
43.0
827
.68
15.4
032
.82
29.5
0-3
.32
(-10)
Qua
ng T
riQ
T47
4573
40.3
424
.74
15.6
033
.90
35.0
01.
10 (
3.2)
Son
LaSL
1405
500
37.4
835
.39
2.08
34.6
035
.74
1.14
(3.
3)
Tay
Nin
hTN
i40
2923
11.4
68.
612.
8521
.48
18.6
2-2
.86
(-13)
Thai
Bin
hTB
1537
804.
530.
004.
536.
795.
30-1
.49
(-22)
Thai
Ngu
yen
TNg
3541
1043
.87
29.6
014
.26
25.6
527
.18
1.52
(5.
9)
Than
h H
oaTH
1111
660
42.3
532
.10
10.2
528
.85
29.7
90.
94 (
3.2)
Thua
Thi
en –
Hue
TTH
5053
9948
.19
35.4
112
.78
43.9
945
.82
1.83
(4.
2)
Tien
Gia
ngTG
2866
634.
200.
114.
0921
.44
15.9
8-5
.45
(-25)
Tra
Vinh
TV23
6585
2.40
0.52
1.88
15.1
67.
04-8
.11
(-54
)
Tuye
n Q
uang
TQ58
6800
56.6
944
.15
12.5
436
.38
37.3
40.
96 (
2.6)
Vinh
Lon
gVL
1473
74
0.00
0.00
11.1
69.
80-1
.36
(-12)
Vinh
Phu
cVP
1371
4820
.28
6.86
13.4
212
.89
14.2
01.
31 (
10)
Yen
Bai
YB68
8292
47.7
831
.16
16.6
238
.75
37.3
5-1
.40
(-3.
6)
REDD Viet Nam.indd 25 9/9/10 15:56:58

26
REDD Working Papers
Annex 2. VCF forest cover data by district for five selected provinces (Dak Lak, Dak Nong, Lam Dong, Son La, Quang Binh)Data given here for districts is similar to the data given in Annex 1 for provinces, just at a different scale. Including all districts in Viet Nam in this table would be overly long, and so data is only given for districts in five provinces that have particularly high potential for REDD as judged by their rate of forest change and their remaining tree cover/forest carbon density. Data for districts not included in this table is available from the authors upon request.
Vegetation Continuous Fields – Percent Tree Cover
Province District 2000 2005 Change 2000-2005
Change 2000-2005 as % of 2000 cover
Dak Lak Buon Don 37.65 30.92 -6.73 -17.88
Buon Ma Thuot 31.37 25.37 -6 -19.13
Cu M’gar 34.64 33.28 -1.36 -3.93
Ea H’leo 36.83 30.12 -6.72 -18.25
Ea Kar 34.86 26.7 -8.15 -23.38
Ea Sup 33.6 26.71 -6.89 -20.51
Krong Ana 32.88 27.89 -4.99 -15.18
Krong Bong 57.9 54.5 -3.4 -5.87
Krong Buk 30.49 29.96 -0.53 -1.74
Krong Nang 29.79 30.95 1.17 3.93
Krong Pak 27.29 21.69 -5.6 -20.52
Lak 60.22 55.22 -5 -8.3
M’Drak 44.5 44.93 0.43 0.97
Dak Nong Cu Jut 43.36 33.33 -10.04 -23.15
Dak Mil 37.64 29.15 -8.49 -22.56
Dak Rlap 45.37 38.81 -6.57 -14.48
Krong No 48.75 42.3 -6.45 -13.23
Tuy _?c 62.42 53.64 -8.77 -14.05
Dak Song 47.82 42.56 -5.26 -11
Dak Glong 60.12 54.89 -5.23 -8.7
Lam Dong Bao Lam 52.98 54.19 1.22 2.3
Bao Loc 26.51 27.33 0.82 3.09
Cat Tien 55.02 50.25 -4.77 -8.67
Da Huoai 67.31 59.75 -7.56 -11.23
Da Lat 34.85 32.29 -2.57 -7.37
Da Teh 60.57 58.1 -2.47 -4.08
Dam Rong 61.14 58.89 -2.25 -3.68
Don Duong 47.5 39.35 -8.14 -17.14
Duc Trong 34.43 29.58 -4.85 -14.09
Lac Duong 62.3 63.63 1.32 2.12
Lam Ha 40.38 37.13 -3.26 -8.07
Di Linh 52 48.9 -3.1 -5.96
Quang Binh Bo Trach 52.62 46.79 -5.83 -11.08
Dong Hoi 18.89 15.41 -3.47 -18.37
Le Thuy 36.52 32.34 -4.18 -11.45
Minh Hoa 55.25 51.8 -3.45 -6.24
REDD Viet Nam.indd 26 9/9/10 15:56:58

27
REDD and Sustainable Development – Perspective from Viet Nam
Quang Ninh 53.83 43.67 -10.16 -18.87
Quang Trach 18.82 19.38 0.56 2.98
Tuyen Hoa 47.69 45.22 -2.47 -5.18
Son La Bac Yen 31.88 34.96 3.08 9.66
Mai Son 28.26 31.75 3.49 12.35
Moc Chau 35.04 36.8 1.76 5.02
Muong La 40.28 42.19 1.92 4.77
Phu Yen 34.42 34.46 0.04 0.12
Quynh Nhai 37.81 37.12 -0.69 -1.82
Son La 22.98 31.58 8.6 37.42
Song Ma 29.28 30.12 0.84 2.87
Sop Cop 44.67 42.39 -2.29 -5.13
Thuan Chau 33.75 33.7 -0.05 -0.15
Yen Chau 33.21 34.74 1.53 4.61
REDD Viet Nam.indd 27 9/9/10 15:56:58
28
REDD Working Papers
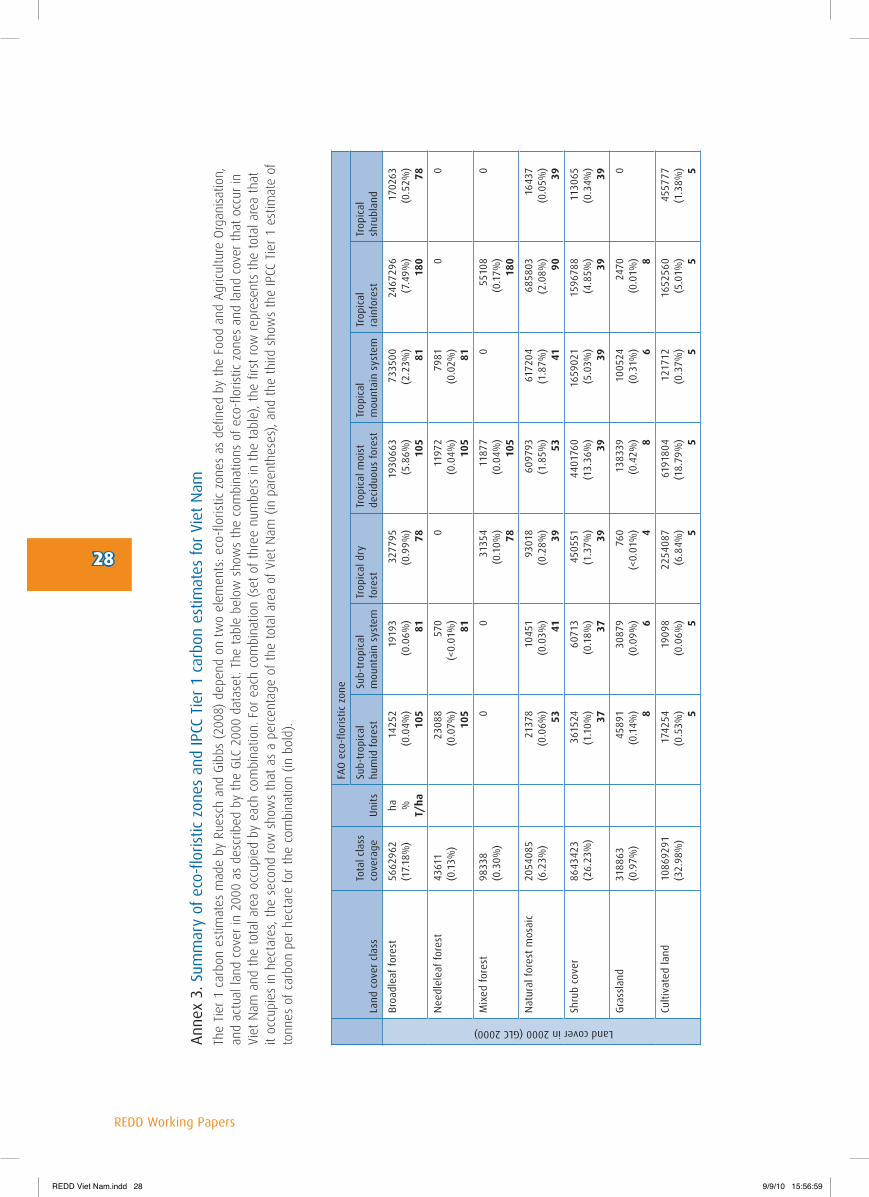
Anne
x 3.
Sum
mar
y of
eco
-flo
ristic
zon
es a
nd IP
CC T
ier
1 ca
rbon
est
imat
es fo
r Vi
et N
amTh
e Ti
er 1
car
bon
estim
ates
mad
e by
Rue
sch
and
Gibb
s (2
008)
dep
end
on t
wo
elem
ents
: eco
-flo
ristic
zon
es a
s de
fined
by
the
Food
and
Agr
icul
ture
Org
anis
atio
n,
and
actu
al la
nd c
over
in 2
000
as d
escr
ibed
by
the
GLC
2000
dat
aset
. The
tab
le b
elow
sho
ws
the
com
bina
tions
of
eco-
floris
tic z
ones
and
land
cov
er t
hat
occu
r in
Vi
et N
am a
nd t
he t
otal
are
a oc
cupi
ed b
y ea
ch c
ombi
natio
n. F
or e
ach
com
bina
tion
(set
of
thre
e nu
mbe
rs in
the
tab
le),
the
first
row
rep
rese
nts
the
tota
l are
a th
at
it oc
cupi
es in
hec
tare
s, t
he s
econ
d ro
w s
how
s th
at a
s a
perc
enta
ge o
f th
e to
tal a
rea
of V
iet
Nam
(in
par
enth
eses
), an
d th
e th
ird s
how
s th
e IP
CC T
ier
1 es
timat
e of
to
nnes
of
carb
on p
er h
ecta
re fo
r th
e co
mbi
natio
n (in
bol
d).
La
nd c
over
cla
ssTo
tal c
lass
co
vera
geU
nits
FAO
eco
-flo
ristic
zon
e
Sub-
trop
ical
hu
mid
for
est
Sub-
trop
ical
m
ount
ain
syst
emTr
opic
al d
ry
fore
stTr
opic
al m
oist
de
cidu
ous
fore
stTr
opic
al
mou
ntai
n sy
stem
Trop
ical
ra
info
rest
Trop
ical
sh
rubl
and
Broa
dlea
f fo
rest
5662
962
(17.
18%
)ha
%
T/ha
1425
2(0
.04%
)10
5
1919
3(0
.06%
)81
3277
95(0
.99%
)78
1930
663
(5.8
6%)
105
7335
00(2
.23%
)81
2467
296
(7.4
9%)
180
1702
63(0
.52%
)78
Nee
dlel
eaf
fore
st43
611
(0.1
3%)
2308
8(0
.07%
)10
5
570
(<0.
01%
)81
011
972
(0.0
4%)
105
7981
(0.0
2%)
81
00
Mix
ed f
ores
t98
338
(0.3
0%)
00
3135
4(0
.10%
)78
1187
7(0
.04%
)10
5
055
108
(0.1
7%)
180
0
Nat
ural
for
est
mos
aic
2054
085
(6.2
3%)
2137
8(0
.06%
)53
1045
1(0
.03%
)41
9301
8(0
.28%
)39
6097
93(1
.85%
)53
6172
04(1
.87%
)41
6858
03(2
.08%
)90
1643
7(0
.05%
)39
Shru
b co
ver
8643
423
(26.
23%
)36
1524
(1.1
0%)
37
6071
3(0
.18%
)37
4505
51(1
.37%
)39
4401
760
(13.
36%
)39
1659
021
(5.0
3%)
39
1596
788
(4.8
5%)
39
1130
65(0
.34%
)39
Gra
ssla
nd31
8863
(0.9
7%)
4589
1(0
.14%
) 8
3087
9(0
.09%
) 6
760
(<0.
01%
) 4
1383
39(0
.42%
) 8
1005
24(0
.31%
) 6
2470
(0.0
1%) 8
0
Culti
vate
d la
nd10
8692
91(3
2.98
%)
1742
54(0
.53%
) 5
1909
8(0
.06%
) 5
2254
087
(6.8
4%) 5
6191
804
(18.
79%
) 5
1217
12(0
.37%
) 5
1652
560
(5.0
1%) 5
4557
77(1
.38%
) 5
Land cover in 2000 (GLC 2000)
REDD Viet Nam.indd 28 9/9/10 15:56:59

29
REDD and Sustainable Development – Perspective from Viet Nam
La
nd c
over
cla
ssTo
tal c
lass
co
vera
geU
nits
FAO
eco
-flo
ristic
zon
e
Sub-
trop
ical
hu
mid
for
est
Sub-
trop
ical
m
ount
ain
syst
emTr
opic
al d
ry
fore
stTr
opic
al m
oist
de
cidu
ous
fore
stTr
opic
al
mou
ntai
n sy
stem
Trop
ical
ra
info
rest
Trop
ical
sh
rubl
and
Fore
st /
cro
plan
d m
osai
c47
9672
9(1
4.55
%)
ha
%T/
ha
3608
59(1
.09%
)53
6166
3(0
.19%
)41
1695
03(0
.51%
)39
3124
406
(9.4
8%)
53
5308
37(1
.61%
)41
4550
17(1
.38%
)90
9444
3(0
.29%
)39
Spar
se g
rass
land
or
gras
slan
d m
osai
c56
06(0
.02%
)49
41(0
.01%
) 4
00
475
(<0.
01%
) 4
95(<
0.01
%) 3
95(<
0.01
%) 4
0
Wat
er40
9791
(1.2
4%)
1140
(<0.
01%
) 0
022
803
(0.0
7%) 0
1948
72(0
.59%
) 0
1805
(0.0
1%) 0
1528
76(0
.46%
) 0
3629
5(0
.11%
) 0
Art
ifici
al s
urfa
ce99
76(0
.03%
)0
047
5(<
0.01
%) 0
7506
(90.
02%
) 0
014
25(<
0.01
%) 0
570
(<0.
01%
) 0
Tota
l (al
l cla
sses
)32
9126
74(9
9.87
%)
1007
327
(3.0
6%)
2025
68(0
.61%
)33
5034
6(1
0.17
%)
1662
3465
(50.
44%
)37
7267
9(1
1.45
%)
7069
438
(21.
45%
)88
6851
(2.6
9%)
Land cover in 2000 (GLC 2000)
REDD Viet Nam.indd 29 9/9/10 15:56:59

30
REDD Working Papers
Annex 4. Data sources and mapping details
Data sourcesThese maps were created using two freely-available, international datasets. In addition, as discussed further below, all processing and statistics were done using free, open source software. All analyses presented in this report are therefore inexpensive to replicate should any readers wish to check the accuracy of any component.
Forest cover dataForest cover data for Viet Nam is taken from the Vegetation Continuous Fields (VCF) Percent Tree Cover Product. This is a global dataset generated using imagery from the MODIS sensor on NASA’s Terra satellite, and is made available by the Global Land Cover Facility (http://glcf.umiacs.umd.edu/data/vcf/).
Authors: Hansen, M., R. DeFries, J.R. Townshend, M. Carroll, C. Dimiceli, and R. Sohlberg Publication Date: 2007 Collection Name: Vegetation Continuous Fields MOD44B Product Names: 2000 Percent Tree Cover and 2005 Percent Tree Cover Version: Collection 4, Version 3 Publisher: University of Maryland, USA. Product Coverage Date: 2000 and 2005.
Carbon densityCarbon density data is from a dataset generated by Aaron Reusch and Holly Gibbs for the Carbon Dioxide Information and Analysis Centre. It is based on IPCC Tier 1 carbon estimates, global land cover maps, and FAO ecoregion classifications. Resolution is 1km by 1km. Available from http://cdiac.ornl.gov/epubs/ndp/ global_carbon/carbon_documentation.html.
Authors: Reusch, A., and H. Gibbs. Publication Date: 2008 Publisher: Carbon Dioxide Information and Analysis Centre Product Coverage Date: 2000
Viet Nam Administrative BoundariesAdministrative boundaries for Viet Nam (provinces, districts, and communes) is taken from the Global Administrative Areas Database (GADM). Available from http://biogeo.berkeley.edu/bgm/gdata.php.
Authors: Hijmans, R., N. Garcia, R. Kapoor, A. Rala, A. Maunahan, and J. Wieczorek. Publication Date: Product continuously updated; downloaded August 2009. Version 1.0. Publisher: Museum of Vertebrate Zoology, University of California at Berkeley and International Rice Research Institute.
Technical details of processing SoftwareAll data processing and most map creation was performed using GRASS (version 6.4), an open source, freely available Geographic Information System (GIS) (available from http://grass.itc.it/download/index.php). REDD prioritisation maps were printed using QGIS (version 1.3.0), another open source GIS programme. Graphs and basic statistics which are also included in this package were generated using R (version 2.9.2), a free and open source statistics package (http://www.r-project.org/).
REDD Viet Nam.indd 30 9/9/10 15:56:59
31
REDD and Sustainable Development – Perspective from Viet Nam
As this report has been produced using only free, open source software and with freely available data, these analyses are inexpensive to reproduce should any users wish to check the accuracy of any element.
WorkflowTwo base maps were used for tree cover; TREE_2000 and TREE_2005. These both have 500m pixel resolution, cover all of Viet Nam and have cell values which correspond to the estimated percentage of tree cover within the cell. There were created using four tiles each downloaded from the GLCF. The relevant tiles for Viet Nam are PN4748, PN4950, RQ4748, and RQ4950. Tiles were joined together using r.patch module in GRASS.
>r.patch input=PN4748_2000,PN4950_2000,RQ4748_2000,RQ4950_2000 ouput=TREE_2000
A third base map was generated from the original two maps. This was a map of change in percentage tree cover (“TreeCoverChange_2000_2005”). It was created using a simple subtraction of the two tree cover maps using r.mapcalc module. Also, before any calculations, the GIS region must be set to match the imported data using g.region module.
>g.region rast=TREE_2000>r.mapcalc TreeCoverChange_2000_2005=TREE_2005-TREE_2000
These three base maps (tree cover 2000, tree cover 2005, and tree cover change) were then aggregated to the level of province, district, and commune using vector files of those administrative boundaries and the v.rast.stats module (note: be sure to use a short – 2 or 3 letter – output prefix). A similar process was followed for carbon density data.
>v.rast.stats vector=Viet Nam_province raster=TREE_2000 colprefix=”T00” >v.rast.stats vector=Viet Nam_district raster=TreeCoverChange_2000_2005 colprefix=”Chg”etc.
Alternately, a raster file displaying the same information (v.rast.stats returns data in vector form) can be used with module r.average using the VCF data and raster versions of administrative boundaries created using module v.to.rast:
>v.to.rast input=Viet Nam_province output=Viet Nam_province_raster>r.average base=Viet Nam_province_raster cover=TREE_2000 output=TREE_2000_province_raster
REDD Viet Nam.indd 31 9/9/10 15:56:59

REDD Viet Nam.indd 32 9/9/10 15:57:00