
Smith & Williamson Managed Portfolio Service
13
Smith & Williamson Managed Portfolio Service James Hay platform Investment Review Q2 2016 For professional advisers’ use only – not for use by or distribution to retail clients
-
Upload
khangminh22 -
Category
Documents
-
view
2 -
download
0
Transcript of Smith & Williamson Managed Portfolio Service
Smith & Williamson Managed Portfolio Service
James Hay platform
Investment Review
Q2 2016
For professional advisers’ use only – not for use by or distribution to retail clients
2 Smith & Williamson Investment Management
MPS Q2 2016 – Investment Review
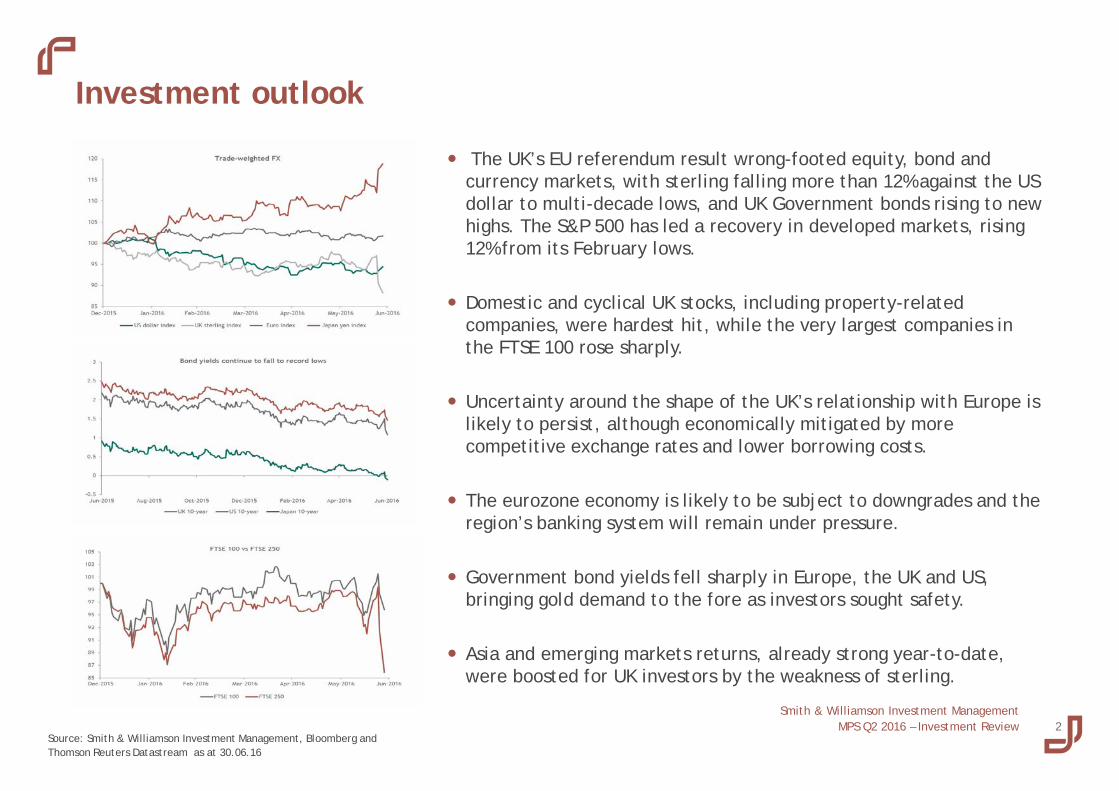
Investment outlook
The UK’s EU referendum result wrong-footed equity, bond and currency markets, with sterling falling more than 12% against the US dollar to multi-decade lows, and UK Government bonds rising to new highs. The S&P 500 has led a recovery in developed markets, rising 12% from its February lows.
Domestic and cyclical UK stocks, including property-related companies, were hardest hit, while the very largest companies in the FTSE 100 rose sharply.
Uncertainty around the shape of the UK’s relationship with Europe is likely to persist, although economically mitigated by more competitive exchange rates and lower borrowing costs.
The eurozone economy is likely to be subject to downgrades and the region’s banking system will remain under pressure.
Government bond yields fell sharply in Europe, the UK and US, bringing gold demand to the fore as investors sought safety.
Asia and emerging markets returns, already strong year-to-date, were boosted for UK investors by the weakness of sterling.
Source: Smith & Williamson Investment Management, Bloomberg and Thomson Reuters Datastream as at 30.06.16
3 Smith & Williamson Investment Management
MPS Q2 2016 – Investment Review
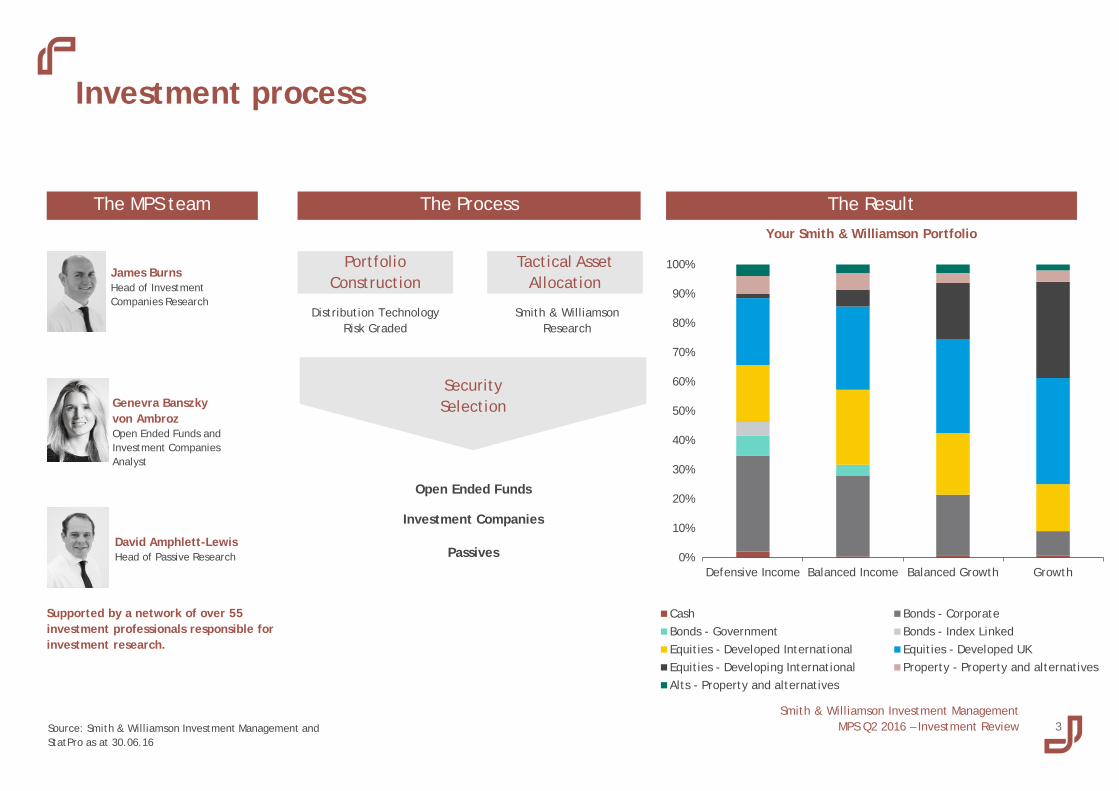
Investment process
Source: Smith & Williamson Investment Management and StatPro as at 30.06.16
David Amphlett-Lewis Head of Passive Research
James Burns Head of Investment Companies Research
Genevra Banszky von Ambroz Open Ended Funds and Investment Companies Analyst
The MPS team
Open Ended Funds
Investment Companies
Distribution Technology Risk Graded
Portfolio Construction
Smith & Williamson Research
Tactical Asset Allocation
Security Selection
Passives
The Process Your Smith & Williamson Portfolio
The Result
Supported by a network of over 55 investment professionals responsible for investment research.
0%
10%
20%
30%
40%
50%
60%
70%
80%
90%
100%
Defensive Income Balanced Income Balanced Growth Growth
Cash Bonds - CorporateBonds - Government Bonds - Index LinkedEquities - Developed International Equities - Developed UKEquities - Developing International Property - Property and alternativesAlts - Property and alternatives
4 Smith & Williamson Investment Management
MPS Q2 2016 – Investment Review
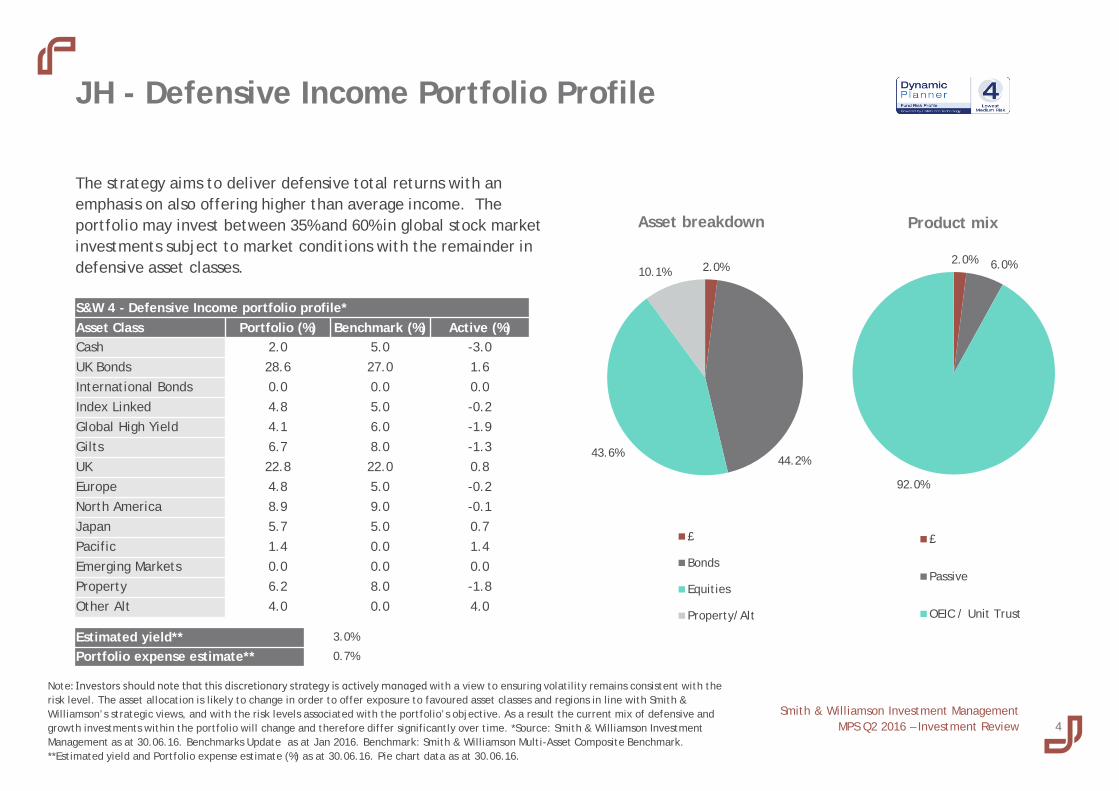
The strategy aims to deliver defensive total returns with an emphasis on also offering higher than average income. The portfolio may invest between 35% and 60% in global stock market investments subject to market conditions with the remainder in defensive asset classes.
JH - Defensive Income Portfolio Profile
S&W 4 - Defensive Income portfolio profile* Asset Class Portfolio (%) Benchmark (%) Active (%) Cash 2.0 5.0 -3.0 UK Bonds 28.6 27.0 1.6 International Bonds 0.0 0.0 0.0 Index Linked 4.8 5.0 -0.2 Global High Yield 4.1 6.0 -1.9 Gilts 6.7 8.0 -1.3 UK 22.8 22.0 0.8 Europe 4.8 5.0 -0.2 North America 8.9 9.0 -0.1 Japan 5.7 5.0 0.7 Pacific 1.4 0.0 1.4 Emerging Markets 0.0 0.0 0.0 Property 6.2 8.0 -1.8 Other Alt 4.0 0.0 4.0
Estimated yield** 3.0%
Portfolio expense estimate** 0.7%
Product mix Asset breakdown
Note: Investors should note that this discretionary strategy is actively managed with a view to ensuring volatility remains consistent with the risk level. The asset allocation is likely to change in order to offer exposure to favoured asset classes and regions in line with Smith & Williamson’s strategic views, and with the risk levels associated with the portfolio’s objective. As a result the current mix of defensive and growth investments within the portfolio will change and therefore differ significantly over time. *Source: Smith & Williamson Investment Management as at 30.06.16. Benchmarks Update as at Jan 2016. Benchmark: Smith & Williamson Multi-Asset Composite Benchmark. **Estimated yield and Portfolio expense estimate (%) as at 30.06.16. Pie chart data as at 30.06.16.
2.0%
44.2% 43.6%
10.1%
£
Bonds
Equities
Property/Alt
2.0% 6.0%
92.0%
£
Passive
OEIC / Unit Trust
5 Smith & Williamson Investment Management
MPS Q2 2016 – Investment Review
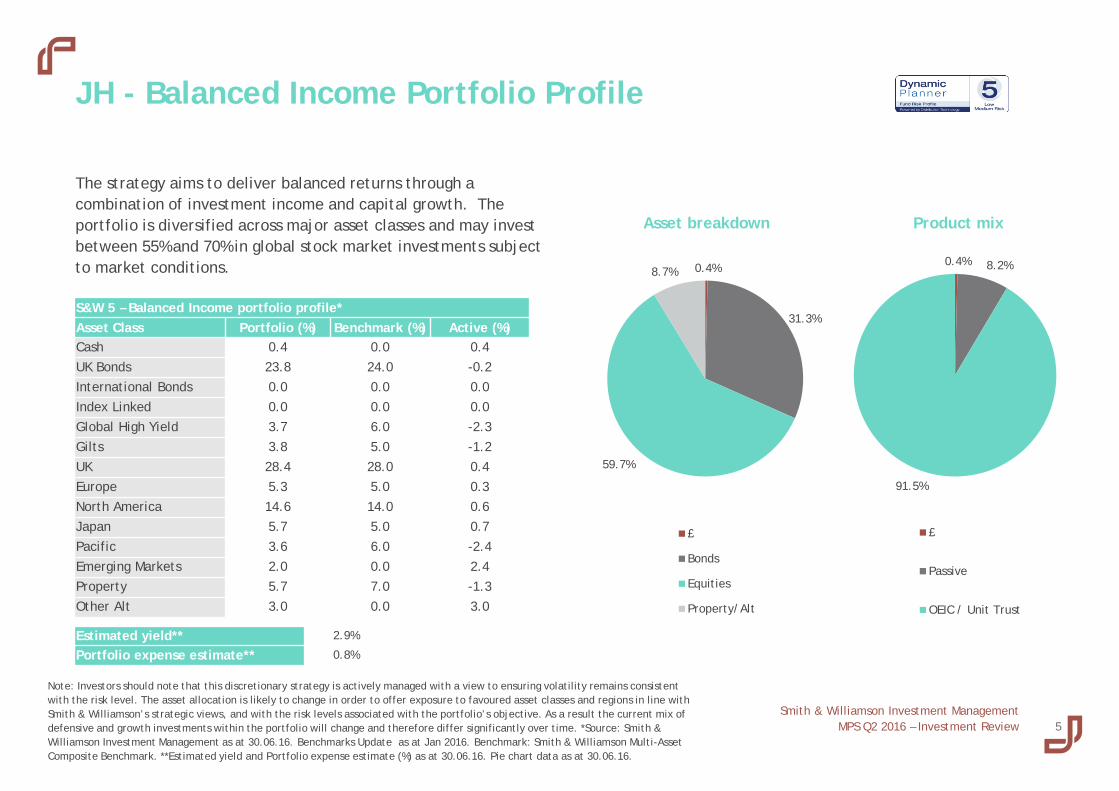
The strategy aims to deliver balanced returns through a combination of investment income and capital growth. The portfolio is diversified across major asset classes and may invest between 55% and 70% in global stock market investments subject to market conditions.
JH - Balanced Income Portfolio Profile
S&W 5 – Balanced Income portfolio profile* Asset Class Portfolio (%) Benchmark (%) Active (%) Cash 0.4 0.0 0.4 UK Bonds 23.8 24.0 -0.2 International Bonds 0.0 0.0 0.0 Index Linked 0.0 0.0 0.0 Global High Yield 3.7 6.0 -2.3 Gilts 3.8 5.0 -1.2 UK 28.4 28.0 0.4 Europe 5.3 5.0 0.3 North America 14.6 14.0 0.6 Japan 5.7 5.0 0.7 Pacific 3.6 6.0 -2.4 Emerging Markets 2.0 0.0 2.4 Property 5.7 7.0 -1.3 Other Alt 3.0 0.0 3.0
Estimated yield** 2.9%
Portfolio expense estimate** 0.8%
Product mix Asset breakdown
Note: Investors should note that this discretionary strategy is actively managed with a view to ensuring volatility remains consistent with the risk level. The asset allocation is likely to change in order to offer exposure to favoured asset classes and regions in line with Smith & Williamson’s strategic views, and with the risk levels associated with the portfolio’s objective. As a result the current mix of defensive and growth investments within the portfolio will change and therefore differ significantly over time. *Source: Smith & Williamson Investment Management as at 30.06.16. Benchmarks Update as at Jan 2016. Benchmark: Smith & Williamson Multi-Asset Composite Benchmark. **Estimated yield and Portfolio expense estimate (%) as at 30.06.16. Pie chart data as at 30.06.16.
0.4% 8.2%
91.5%
£
Passive
OEIC / Unit Trust
0.4%
31.3%
59.7%
8.7%
£
Bonds
Equities
Property/Alt
6 Smith & Williamson Investment Management
MPS Q2 2016 – Investment Review
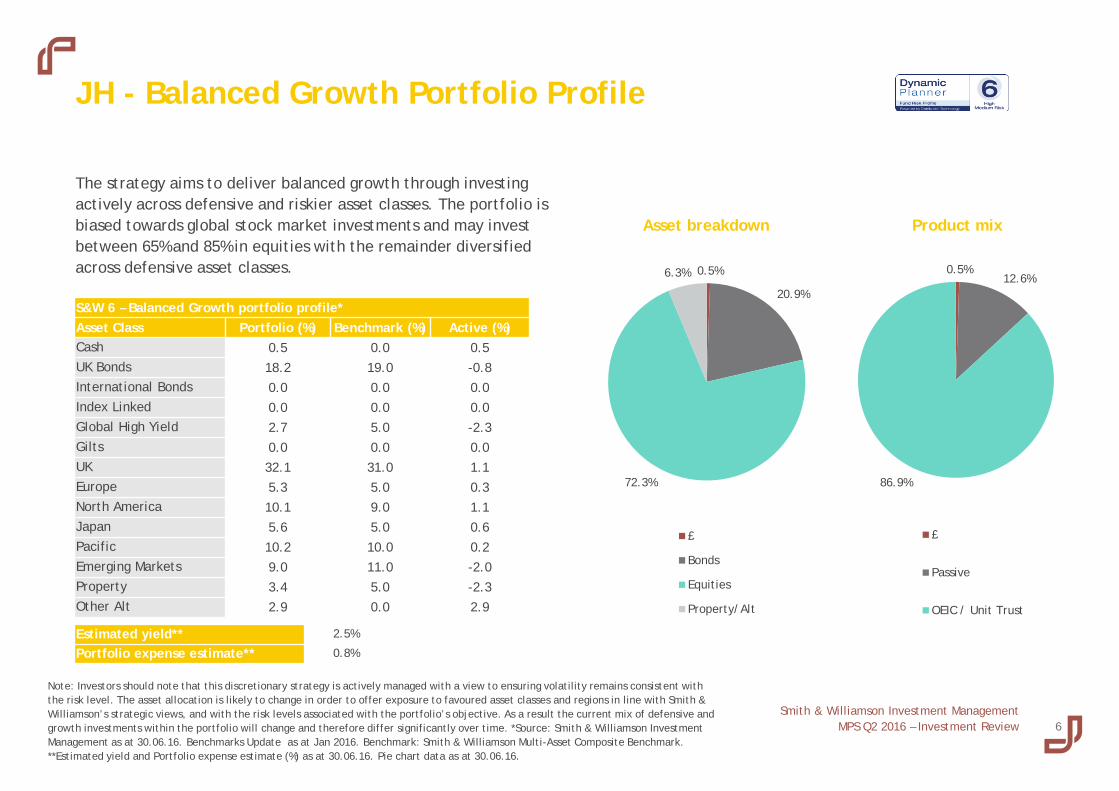
The strategy aims to deliver balanced growth through investing actively across defensive and riskier asset classes. The portfolio is biased towards global stock market investments and may invest between 65% and 85% in equities with the remainder diversified across defensive asset classes.
JH - Balanced Growth Portfolio Profile
S&W 6 – Balanced Growth portfolio profile* Asset Class Portfolio (%) Benchmark (%) Active (%) Cash 0.5 0.0 0.5 UK Bonds 18.2 19.0 -0.8 International Bonds 0.0 0.0 0.0 Index Linked 0.0 0.0 0.0 Global High Yield 2.7 5.0 -2.3 Gilts 0.0 0.0 0.0 UK 32.1 31.0 1.1 Europe 5.3 5.0 0.3 North America 10.1 9.0 1.1 Japan 5.6 5.0 0.6 Pacific 10.2 10.0 0.2 Emerging Markets 9.0 11.0 -2.0 Property 3.4 5.0 -2.3 Other Alt 2.9 0.0 2.9
Estimated yield** 2.5%
Portfolio expense estimate** 0.8%
Product mix Asset breakdown
Note: Investors should note that this discretionary strategy is actively managed with a view to ensuring volatility remains consistent with the risk level. The asset allocation is likely to change in order to offer exposure to favoured asset classes and regions in line with Smith & Williamson’s strategic views, and with the risk levels associated with the portfolio’s objective. As a result the current mix of defensive and growth investments within the portfolio will change and therefore differ significantly over time. *Source: Smith & Williamson Investment Management as at 30.06.16. Benchmarks Update as at Jan 2016. Benchmark: Smith & Williamson Multi-Asset Composite Benchmark. **Estimated yield and Portfolio expense estimate (%) as at 30.06.16. Pie chart data as at 30.06.16.
0.5%
20.9%
72.3%
6.3%
£
Bonds
Equities
Property/Alt
0.5% 12.6%
86.9%
£
Passive
OEIC / Unit Trust

7 Smith & Williamson Investment Management
MPS Q2 2016 – Investment Review
The strategy aims to deliver long-term growth by investing predominantly in stock markets across a wide range of geographic regions. The portfolio will always retain an emphasis on developed markets, and in particular investments in UK company shares. The portfolio will normally be more than 90% invested in stock markets but may be up to 15% in defensive asset classes.
JH - Growth Portfolio Profile
S&W 7 –Growth portfolio profile* Asset Class Portfolio (%) Benchmark (%) Active (%) Cash 0.6 0.0 0.6 UK Bonds 5.8 5.0 0.8 International Bonds 0.0 0.0 0.0 Index Linked 0.0 0.0 0.0 Global High Yield 2.2 5.0 -2.8 Gilts 0.0 0.0 0.0 UK 34.7 35.0 -0.3 Europe 5.2 5.0 0.2 North America 8.9 7.0 1.9 Japan 5.5 5.0 0.5 Pacific 15.4 16.0 -0.6 Emerging Markets 16.1 17.0 -0.9 Property 3.7 5.0 -1.3 Other Alt 1.9 0.0 1.9
Estimated yield** 2.0%
Portfolio expense estimate** 0.9%
Product mix Asset breakdown
Note: Investors should note that this discretionary strategy is actively managed with a view to ensuring volatility remains consistent with the risk level. The asset allocation is likely to change in order to offer exposure to favoured asset classes and regions in line with Smith & Williamson’s strategic views, and with the risk levels associated with the portfolio’s objective. As a result the current mix of defensive and growth investments within the portfolio will change and therefore differ significantly over time. *Source: Smith & Williamson Investment Management as at 30.06.16. Benchmarks Update as at Jan 2016. Benchmark: Smith & Williamson Multi-Asset Composite Benchmark. **Estimated yield and Portfolio expense estimate (%) as at 30.006.16. Pie chart data as at 30.06.16. Pie chart data as at 30.06.16.
0.6% 8.0%
85.7%
5.7%
£
Bonds
Equities
Property/Alt
0.6% 11.4%
88.1%
£
Passive
OEIC / Unit Trust

8 Smith & Williamson Investment Management
MPS Q2 2016 – Investment Review
S&W Range activity highlights – since inception
Note: The above is representative of transactions widely executed across the S&W range and should not be construed as comprehensive of all transactions in all models. Individual holdings changes in specific S&W strategies may therefore not be detailed. Those shown will be those which have been applied across more than one of the S&W strategies and seek to capture the direction of travel of asset allocation of the S&W range over the period shown. Source: Smith & Williamson Investment Management as at 30.06.16
Name Reasons for trade Rationale Driver
Sept Sold Henderson UK Absolute Return Introduction of higher beta UK exposure Switch style
Valuation Sept Bought Man GLG Undervalued Assets Increasing UK long only exposure following market sell off
Nov Bought Alliance Trust Monthly Income Increasing exposure to UK high yield bonds following pullback in the market Allocation Macro
Nov Bought AXA US Short Duration High Yield Increasing exposure to US high yield bonds following pullback in the market
Nov Reduced Marlborough Special Situations Reducing small cap exposure in UK equity allocation Switch style
Valuation Nov Increased MAN GLG Undervalued Assets Increasing large cap exposure in UK equity allocation
Jan Sold Malborough Special Situations Reducing mid & small cap shares, in favour of larger companies on sterlings falls Switch style
Macro Jan Sold Vanguard FTSE All Share Reducing mid & small cap shares, in favour of larger companies on sterlings falls
Jan Bought HSBC FTSE 100 Index Increasing large company shares following falls in sterling
Jan Sold Polar Capital Japan (Hedged) Disposal following weak performance, and reduction in Japanese exposure overall Switch style
Manager Jan Bought JP Morgan Japan (Hedged) Introducing reduced exposure to favoured Japanese manager
Mar Bought AXA US Short Duration High Yield Increasing exposure to high yield bonds offering higher yields following price falls Allocation Macro
Mar Reduced Invesco UK Strategic Reducing UK stock market sensitivity using long/short UK manager Switch style
Macro Mar Bought Henderson UK Absolute Return Re-introducing long/short manager reducing stock market sensitivity
Jun Sold Vanguard Long Duration Gilt Selling out of long duration gilts as now riskier at lower yields Allocation Macro
Jun Bought Royal London Short Duration Gilt Moving shorter duration in gilt allocation as protection from long end has reduced Allocation Macro
Jun Sold Kames High Yield Reducing high yield due to its higher correlation to equities Allocation Valuation
Jun Bought Royal London Corporate Bond Switching into investment grade at expense of high yield Allocation Valuation
9 Smith & Williamson Investment Management
MPS Q2 2016 – Investment Review
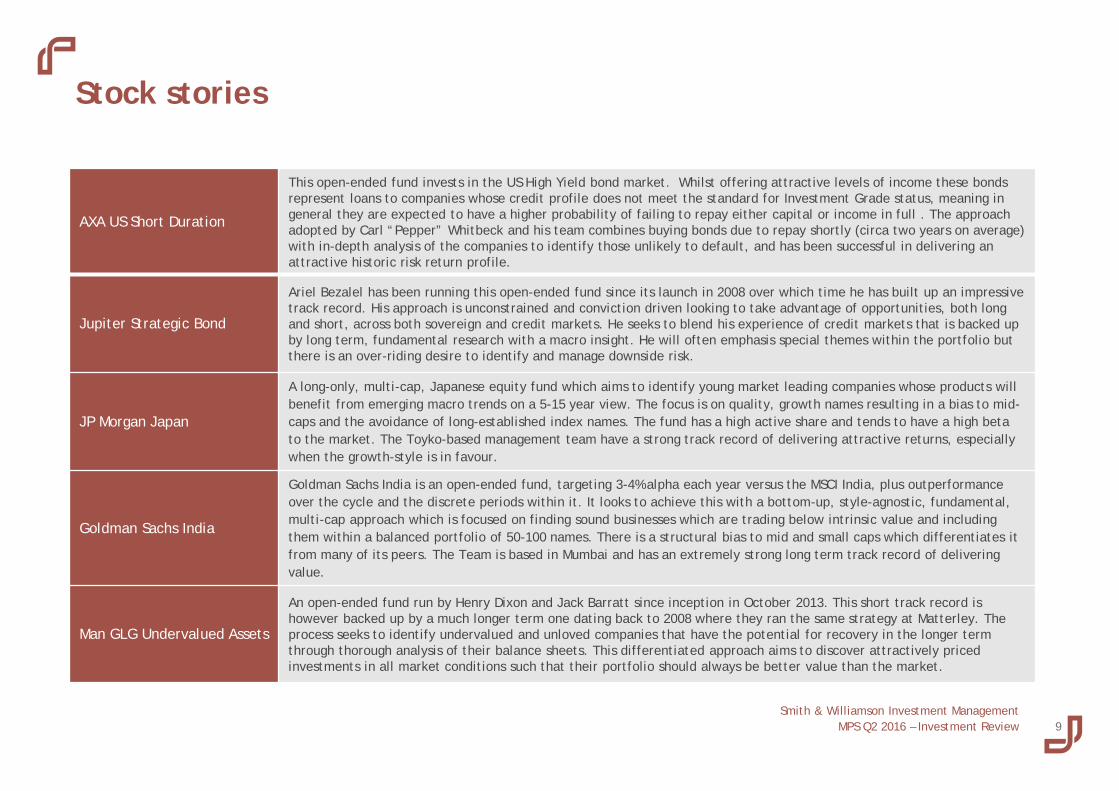
Stock stories
AXA US Short Duration
This open-ended fund invests in the US High Yield bond market. Whilst offering attractive levels of income these bonds represent loans to companies whose credit profile does not meet the standard for Investment Grade status, meaning in general they are expected to have a higher probability of failing to repay either capital or income in full . The approach adopted by Carl “Pepper” Whitbeck and his team combines buying bonds due to repay shortly (circa two years on average) with in-depth analysis of the companies to identify those unlikely to default, and has been successful in delivering an attractive historic risk return profile.
Jupiter Strategic Bond
Ariel Bezalel has been running this open-ended fund since its launch in 2008 over which time he has built up an impressive track record. His approach is unconstrained and conviction driven looking to take advantage of opportunities, both long and short, across both sovereign and credit markets. He seeks to blend his experience of credit markets that is backed up by long term, fundamental research with a macro insight. He will often emphasis special themes within the portfolio but there is an over-riding desire to identify and manage downside risk.
JP Morgan Japan
A long-only, multi-cap, Japanese equity fund which aims to identify young market leading companies whose products will benefit from emerging macro trends on a 5-15 year view. The focus is on quality, growth names resulting in a bias to mid-caps and the avoidance of long-established index names. The fund has a high active share and tends to have a high beta to the market. The Toyko-based management team have a strong track record of delivering attractive returns, especially when the growth-style is in favour.
Goldman Sachs India
Goldman Sachs India is an open-ended fund, targeting 3-4% alpha each year versus the MSCI India, plus outperformance over the cycle and the discrete periods within it. It looks to achieve this with a bottom-up, style-agnostic, fundamental, multi-cap approach which is focused on finding sound businesses which are trading below intrinsic value and including them within a balanced portfolio of 50-100 names. There is a structural bias to mid and small caps which differentiates it from many of its peers. The Team is based in Mumbai and has an extremely strong long term track record of delivering value.
Man GLG Undervalued Assets
An open-ended fund run by Henry Dixon and Jack Barratt since inception in October 2013. This short track record is however backed up by a much longer term one dating back to 2008 where they ran the same strategy at Matterley. The process seeks to identify undervalued and unloved companies that have the potential for recovery in the longer term through thorough analysis of their balance sheets. This differentiated approach aims to discover attractively priced investments in all market conditions such that their portfolio should always be better value than the market.

Appendix
11 Smith & Williamson Investment Management
MPS Q2 2016 – Investment Review
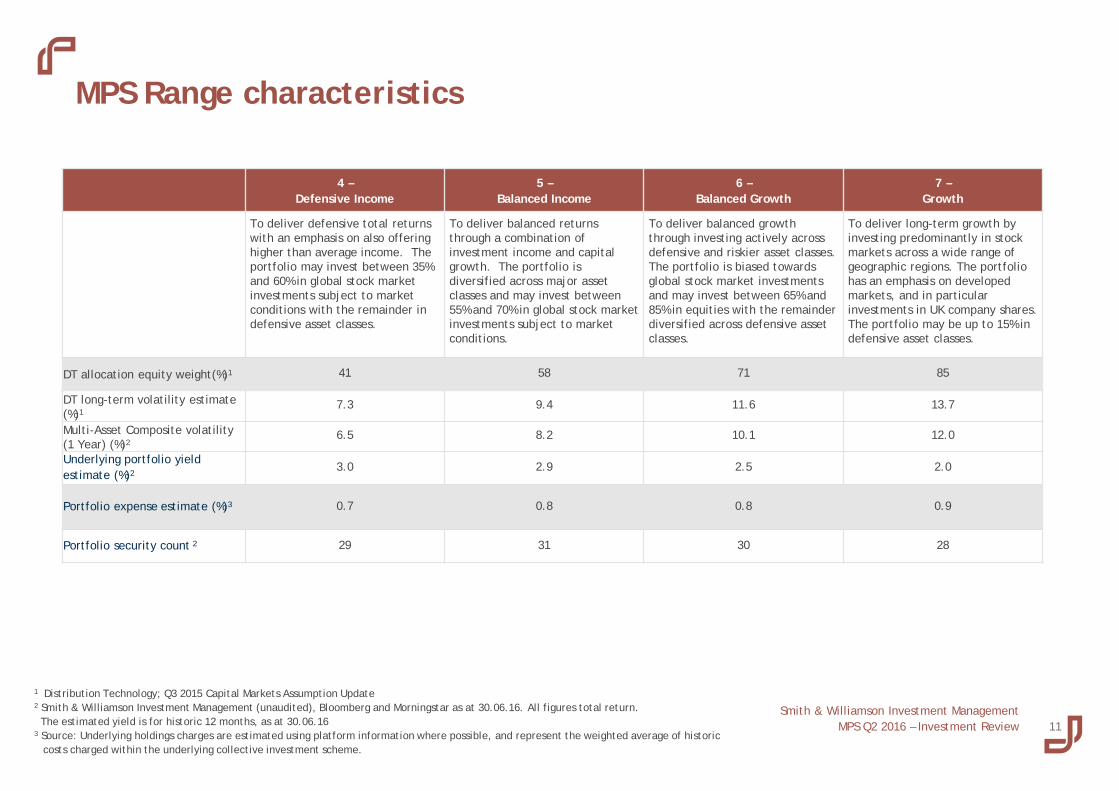
MPS Range characteristics
1 Distribution Technology; Q3 2015 Capital Markets Assumption Update 2 Smith & Williamson Investment Management (unaudited), Bloomberg and Morningstar as at 30.06.16. All figures total return. The estimated yield is for historic 12 months, as at 30.06.16 3 Source: Underlying holdings charges are estimated using platform information where possible, and represent the weighted average of historic
costs charged within the underlying collective investment scheme.
4 – Defensive Income
5 – Balanced Income
6 – Balanced Growth
7 – Growth
To deliver defensive total returns with an emphasis on also offering higher than average income. The portfolio may invest between 35% and 60% in global stock market investments subject to market conditions with the remainder in defensive asset classes.
To deliver balanced returns through a combination of investment income and capital growth. The portfolio is diversified across major asset classes and may invest between 55% and 70% in global stock market investments subject to market conditions.
To deliver balanced growth through investing actively across defensive and riskier asset classes. The portfolio is biased towards global stock market investments and may invest between 65% and 85% in equities with the remainder diversified across defensive asset classes.
To deliver long-term growth by investing predominantly in stock markets across a wide range of geographic regions. The portfolio has an emphasis on developed markets, and in particular investments in UK company shares. The portfolio may be up to 15% in defensive asset classes.
DT allocation equity weight(%)1 41 58 71 85
DT long-term volatility estimate (%)1
7.3 9.4 11.6 13.7
Multi-Asset Composite volatility (1 Year) (%)2
6.5 8.2 10.1 12.0
Underlying portfolio yield estimate (%)2
3.0 2.9 2.5 2.0
Portfolio expense estimate (%)3 0.7 0.8 0.8 0.9
Portfolio security count 2 29 31 30 28

12 Smith & Williamson Investment Management
MPS Q2 2016 – Investment Review
Lucy Mitchell Associate Director t: 020 7131 4811 e: [email protected] Lucy joined Smith & Williamson in April 2015 as Associate Director primarily to develop further the Managed Portfolio Service via platforms as well as the Bespoke DFM offering for the intermediary market. Lucy graduated from the University of Birmingham with a BSc in Economics and Political Science. She has also completed the IMC and Investment Advice Diploma (IAD).
Contact us
Mickey Morrissey Partner, Head of UK Retail Sales t: 020 7131 4693 e: [email protected] Mickey joined Smith & Williamson in December 2012 as Head of UK IFA Sales and was appointed Head of Distribution in July 2014. He is responsible for growing intermediated sales into the DFM, Managed Portfolio Service and MultiManager business lines. Previously, Mickey was Head of Distribution at Liontrust Asset Management for ten years and prior to that worked at Merrill Lynch Investment Managers for twelve years.
Julian Polnik DFM Business Development t: 020 7131 4628 e: [email protected] Julian joined Smith and Williamson Investment Management in November 2011 as Head of Broker Desk. Julian has a BA Honours degree in Politics and Social Psychology from Loughborough University and a Diploma in Management Studies from the University of Westminster. He is a Chartered Fellow of the Chartered Institute for Securities and Investment.
13 Smith & Williamson Investment Management
MPS Q2 2016 – Investment Review
The value of investments can go down as well as up and investors may not receive back the original amount invested.
Past performance is not a guide to future performance.
There can be no assurance that any portfolio will achieve its investment objective, the target return or any volatility target. Any target return or volatility target shown is neither guaranteed nor binding on the Manager.
When investments are made in overseas securities, movements in exchange rates may have an effect on the value of that investment. The effect may be favourable or unfavourable.
Investing in alternative assets involves higher risks than traditional investments and may also be highly leveraged and engage in speculative investment techniques, which can magnify the potential for investment loss or gain.
Investments in emerging markets may involve a higher element of risk due to political and economic instability and underdeveloped markets and systems.
Please note that bond funds may not behave like direct investments in the underlying bonds themselves. By investing in bond funds the certainty of a fixed income for a fixed period with a fixed return of capital are lost.
These profiles are tailored to the output of a Distribution Technology (DT) risk profiling process which is complex and not for use without assistance from a financial adviser. Performance outcomes will depend on the rebalancing and timing of entry and exit to the strategy on the platform.
This document contains information believed to be reliable but no guarantee, warranty or representation, express or implied, is given as to their accuracy or completeness. This is neither an offer nor a solicitation to buy or sell any investment referred to in this document. Smith & Williamson Investment Management documents may contain future statements which are based on our current opinions, expectations and projections. Smith & Williamson Investment Management does not undertake any obligation to update or revise any future statements. Actual results could differ materially from those anticipated. Appropriate advice should be taken before entering into transactions. No responsibility can be accepted for any loss arising from action taken or refrained from based on this publication. In relation to these Smith & Williamson’s portfolio profiles, Smith & Williamson Investment Management is unable to assess or provide advice on the suitability of this profile for individual circumstances. No consideration has been given to the suitability of any investment profile for the particular needs of any recipient. SWIM will not be responsible to any other person for providing the protections afforded to retail investors or for advising on any investment, as a result of using this information.
Issued by Smith & Williamson Investment Management which is a trading name of Smith & Williamson Investment Management LLP. Authorised and regulated by the Financial Conduct Authority (registration number is 580531).
Ref: xxx16
Disclaimer