Criteria and Thresholds for U.S. Navy Acoustic and Explosive ...
194
Criteria and Thresholds for U.S. Navy Acoustic and Explosive Effects Analysis (Phase III) June 2017 TECHNICAL REPORT June 2017 Criteria and Thresholds for U.S. Navy Acoustic and Explosive Effects Analysis (Phase III) SSC Pacific
-
Upload
khangminh22 -
Category
Documents
-
view
2 -
download
0
Transcript of Criteria and Thresholds for U.S. Navy Acoustic and Explosive ...
Criteria and Thresholds for U.S. Navy Acoustic and Explosive Effects Analysis (Phase III) June 2017
TECHNICAL REPORT
June 2017
Criteria and Thresholds for U.S. Navy Acoustic and
Explosive Effects Analysis (Phase III)
SSC Pacific
Criteria and Thresholds for U.S. Navy Acoustic and Explosive Effects Analysis (Phase III) June 2017
Table of Contents
1 INTRODUCTION .............................................................................................................1
2 AUDITORY WEIGHTING FUNCTIONS AND TTS/PTS EXPOSURE FUNCTIONS .......................2 2.1 Introduction ..........................................................................................................2
2.1.1 Impulsive vs. non-impulsive noise ............................................................................. 2 2.1.2 Noise-induced threshold shifts .................................................................................. 2 2.1.3 Auditory weighting functions .................................................................................... 2 2.1.4 Phase III weighting functions and TTS/PTS thresholds .............................................. 3
2.2 Weighting functions and exposure functions ..........................................................3 2.3 Methodology to Derive Function Parameters ..........................................................8 2.4 Marine Animal Species Groups ...............................................................................9
2.4.1 Low-frequency (LF) cetaceans ................................................................................... 9 2.4.2 Mid-frequency (MF) cetaceans .................................................................................. 9 2.4.3 High-frequency (HF) cetaceans ................................................................................ 10 2.4.4 Sirenians .................................................................................................................. 10 2.4.5 Phocids ..................................................................................................................... 10 2.4.6 Otariids and other non-phocid marine carnivores .................................................. 10 2.4.7 Sea turtles ................................................................................................................ 10
2.5 Composite Audiograms ........................................................................................ 13 2.6 Equal Loudness Data ............................................................................................ 21 2.7 Equal Latency Data............................................................................................... 21 2.8 TTS Data .............................................................................................................. 23
2.8.1 Non-impulsive (steady-state) exposures - TTS ........................................................ 23 2.8.2 Non-impulsive (steady-state) exposures - PTS ........................................................ 25 2.8.3 Impulsive exposures ................................................................................................ 25
2.9 TTS Exposure Functions for Sonar ......................................................................... 34 2.9.1 Low- and high-frequency exponents (a, b) .............................................................. 34 2.9.2 Frequency cutoffs (f1, f2) .......................................................................................... 34 2.9.3 Gain parameters K and C ......................................................................................... 36
2.10 PTS Exposure Functions for Sonar ......................................................................... 42 2.11 TTS/PTS Exposure Functions for Explosives ........................................................... 43
3 NAVY PHASE III BEHAVIORAL RESPONSE CRITERIA FOR MARINE SPECIES ....................... 46 3.1 Sonar and Other Transducers ............................................................................... 46
3.1.1 Introduction ............................................................................................................. 46 3.1.2 Significant Behavioral Responses ............................................................................ 46 3.1.3 Review of Phase II Behavioral Criteria ..................................................................... 48 3.1.4 Overview of the approach for Phase III ................................................................... 49 3.1.5 Review of Data Considered...................................................................................... 49 3.1.6 Marine Mammal Species Groups ............................................................................ 61 3.1.7 Dose and Contextual responses .............................................................................. 62 3.1.8 Behavioral Response Functions and Thresholds for Sonar and Other Transducers 64 3.1.9 Application of Contextual Factors - Distance Cutoffs .............................................. 81
3.2 Behavioral Response Thresholds for Air Guns ....................................................... 84 3.2.1 Marine Mammals..................................................................................................... 84 3.2.2 Sea Turtles ............................................................................................................... 84
3.3 Behavioral Response Thresholds for Pile Driving ................................................... 85
Criteria and Thresholds for U.S. Navy Acoustic and Explosive Effects Analysis (Phase III) June 2017
3.3.1 Marine Mammals..................................................................................................... 85 3.3.2 Sea Turtles ............................................................................................................... 85
3.4 Behavioral Response Thresholds of Explosives ...................................................... 85 3.4.1 Marine Mammals..................................................................................................... 85 3.4.2 Sea Turtles ............................................................................................................... 86
4 EXPLOSIVE NON-AUDITORY INJURY CRITERIA ............................................................... 87 4.1 Introduction ........................................................................................................ 87 4.2 Data on underwater blast injury to marine mammals and sea turtles .................... 87 4.3 Data on underwater blast injury to terrestrial mammals ....................................... 88 4.4 Goertner Lung injury model ................................................................................. 90
4.4.1 Impulse Duration for Injury ..................................................................................... 90 4.4.2 Impulse Scaling for Animal Size and Depth ............................................................. 91 4.4.3 Impulse-based Injury Threshold Equations ............................................................. 92
4.5 Peak Pressure criterion ........................................................................................ 94 4.6 Comparison to Human Diver Exposure Data.......................................................... 95
5 References ................................................................................................................... 98
APPENDIX A. ESTIMATING A LOW-FREQUENCY CETACEAN AUDIOGRAM ......................... 120 A.1. Background ....................................................................................................... 120 A.2. Audiogram functional form and required parameters ......................................... 121 A.3. Estimating audiogram parameters ...................................................................... 123
APPENDIX B. DESCRIPTIONS OF BEHAVIORAL RESPONSES, RECEIVED LEVELS, DISTANCES, AND SEVERITY SCORING FOR DATA USED IN THE DEVELOPMENT OF THE PHASE III NAVY BRFS. …………………………………………………………………………………………………………………..125
APPENDIX C. PHASE III SUMMARY OF CRITERIA FOR DETERMINING ACOUSTIC AND EXPLOSIVE EFFECTS TO MARINE SPECIES FROM NAVY SOUND SOURCES ............................. 158
C.1. Introduction ...................................................................................................... 158 C.2. General.............................................................................................................. 158 C.3. Marine Species Hearing Groups .......................................................................... 159 C.4. Auditory Weighting Functions and Temporary & PTS For all Analyzed Navy Sound Sources …………………………………………………………………………………………………………………………..160 C.5. Behavioral Response for Sonar & Other Transducers........................................... 166 C.6. Behavioral Response for Multiple Impulses from Explosives ................................ 172 C.7. Behavioral Criteria for Pile Driving and Air guns for Marine Mammals and Sea Turtles 173 C.8. Mortality and Injury (Non-Auditory) for Explosives ............................................. 173
LIST OF PREPARERS ............................................................................................................ 180
Criteria and Thresholds for U.S. Navy Acoustic and Explosive Effects Analysis (Phase III) June 2017
List of Figures
Figure 2-1. Examples of weighting function amplitude (left) described by Eq. (1) and exposure function (right) described by Eq. (2) above. The parameters f1 and f2 specify the extent of the filter pass-band, while the exponents a and b control the rate of amplitude change below f1 and above f2, respectively. As the frequency decreases below f1 or above f2, the amplitude approaches linear-log behavior with a slope magnitude of 20a or 20b dB/decade, respectively. The constants C and K determine the vertical positions of the curves. .......................................... 5
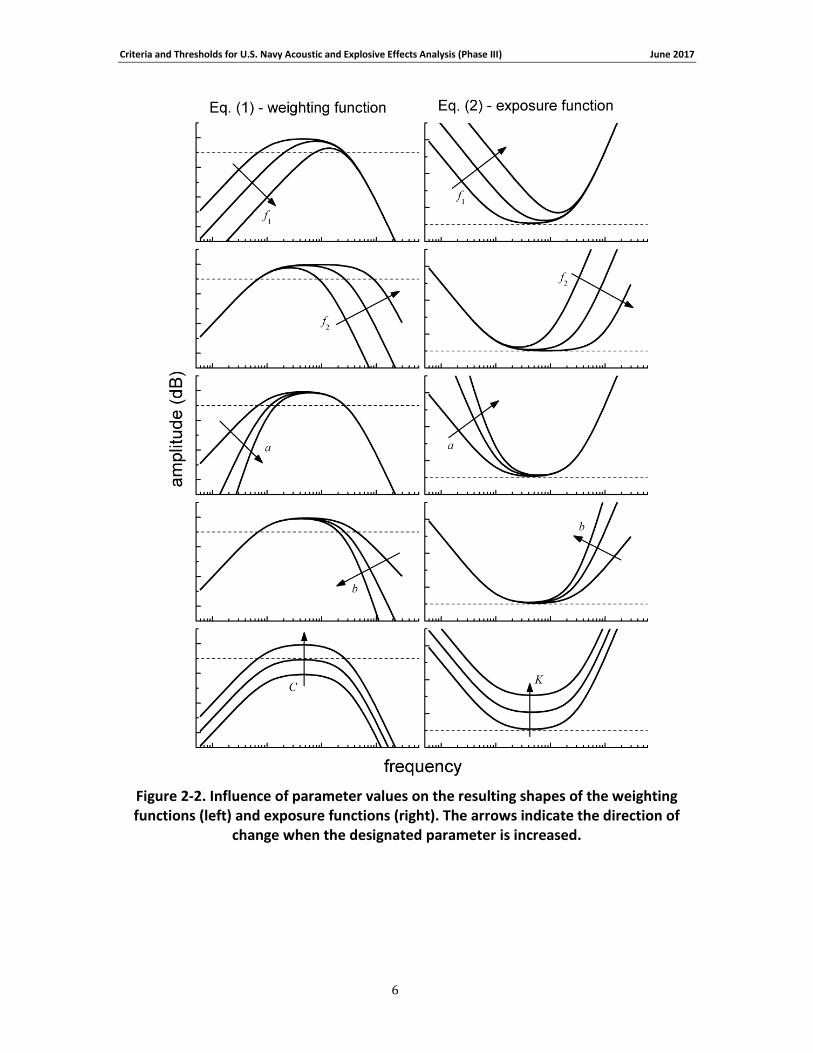
Figure 2-2. Influence of parameter values on the resulting shapes of the weighting functions (left) and exposure functions (right). The arrows indicate the direction of change when the designated parameter is increased. ................................................................................................ 6
Figure 2-3. (left panel) Navy Phase II weighting function for the mid-frequency cetacean group. This function was used in conjunction with a weighted TTS threshold of 178 dB re 1 μPa2s. For narrowband signals, the effective, weighted TTS threshold at a particular frequency is calculated by adding the weighting function amplitude at that frequency to the weighted TTS threshold (178 dB re 1 μPa2s). To visualize the frequency-dependent nature of the TTS threshold, the weighting function is inverted and the minimum value set equal to the weighted TTS threshold. This is illustrated in the right panel, which shows the SEL required for TTS onset as a function of frequency. The advantage of this representation is that it may be directly compared to TTS onset data at different exposure frequencies. .......................................................................................... 7
Figure 2-4. Comparison of Otariid, Mustelid, Odobenid, and Ursid psychophysical hearing thresholds measured underwater (left) and in-air (right). The thick, solid line is the composite audiogram based on data for all species. The thick, dashed line is the composite audiogram based on the otariids only. ............................................................................................................ 11
Figure 2-5. Thresholds and composite audiograms for the nine species groups. Thin lines represent the threshold data from individual animals. Thick lines represent either the median threshold at each frequency (sea turtles), predicted threshold curve (LF cetaceans), or the best fit of Eq. (9) to experimental data (all other groups). Thresholds are expressed in dB re 1 μPa for underwater data and dB re 20 μPa for in-air data (groups OA and PA only). Derivation of the LF cetacean curve is described in Appendix A. The minimum threshold for the LF cetaceans was estimated to be 54 dB re 1 μPa, based on the median of the lowest thresholds for the marine mammal groups in water (groups MF, HF, SI, OW, PW). .............................................................. 18
Figure 2-6. Normalized thresholds and composite audiograms for the nine species groups. Thin lines represent the threshold data from individual animals. Thick lines represent either the median threshold at each frequency (sea turtles), predicted threshold curve (LF cetaceans), or the best fit of Eq. (9) to experimental data (all other groups). Thresholds were normalized by subtracting the lowest value for each individual data set (i.e., within-subject). Composite audiograms were then derived from the individually normalized thresholds (i.e., the composite audiograms were not normalized and may have a minimum value ≠ 0). Derivation of the LF cetacean curve is described in Appendix A. .................................................................................. 19
Figure 2-7. Composite audiograms for the various species groups underwater (left) and in-air (right), derived with the original data (upper) and normalized data (lower). Thresholds in upper panels are expressed in dB re 1 μPa for underwater data and dB re 20 μPa for in-air data. The gray lines in the upper left panel represent ambient noise spectral density levels (referenced to
Criteria and Thresholds for U.S. Navy Acoustic and Explosive Effects Analysis (Phase III) June 2017
the left ordinate, in dB re 1 μPa2/Hz) corresponding to the limits of prevailing noise and various sea-state conditions, from 0.5 to 6 (National Research Council, 2003). ....................................... 20
Figure 2-8. Marine mammal equal latency contours are available for Phocoena phocoena (Wensveen et al., 2014), Tursiops truncatus (Mulsow et al., 2015), Phoca vitulina (Reichmuth et al., 2013), and Zalophus californianus (Mulsow et al., 2015). The slopes for the contours at low frequencies were obtained from the literature (Phocoena phocoena) or calculated from the best linear-log fits to the lower frequency data. The slope of the contour passing through an SPL approximately 40 dB above the threshold at f0 was selected as the most appropriate based on: (1) human A-weighting, (2) observations that the relationship between equal latency and loudness can break down at higher sensation levels, and (3) for many data sets the slopes increase at higher SPLs rather than decrease as expected. The resulting slopes are listed in Table 2-5. ................................................................................................................................................. 22
Figure 2-9. TTS measured using behavioral and AEP methods do not necessarily agree, with marine mammal studies reporting larger TTS obtained using AEP methods. For the data above, thresholds were determined using both techniques before and after the same noise exposure. Hearing thresholds were measured at 30 kHz. Behavioral thresholds utilized FM tones with 10% bandwidth. AEP thresholds were based on AM tones with a modulation frequency of 1.05 kHz. Noise exposures consisted of (a) a single, 20-kHz tone with duration of 64 s and SPL of 185 dB re 1 μPa (SEL = 203 dB re 1 μPa2s) and (b) three 16-s tones at 20 kHz, with mean SPL = 193 dB re 1 μPa (cumulative SEL = 210 dB re 1 μPa2s). Data from Finneran et al. (2007). .............................. 23
Figure 2-10. TTS growth data for mid-frequency cetaceans obtained using behavioral methods. Growth curves were obtained by fitting Eq. (10) to the TTS data as a function of SEL. Onset TTS was defined as the SEL value from the fitted curve at a TTS = 6 dB, for only those datasets that bracketed 6 dB of TTS. Onset PTS was defined as the SEL value from the fitted curve at a TTS = 40 dB, for only those datasets with maximum TTS > 20 dB. Frequency values within the panels indicate the exposure frequencies. Solid lines are fit to the filled symbols; dashed lines are fit to the open symbols. See Table 2-6 for explanation of the datasets in each panel. Frequencies listed in each panel denote the exposure frequency. ................................................................... 27
Figure 2-11. TTS growth data for mid-frequency cetaceans obtained using AEP methods. Growth curves were obtained by fitting Eq. (10) to the TTS data as a function of SEL. Onset TTS was defined as the SEL value from the fitted curve at a TTS = 6 dB, for only those datasets that bracketed 6 dB of TTS. Onset PTS was defined as the SEL value from the fitted curve at a TTS = 40 dB, for only those datasets with maximum TTS > 20 dB. Frequency values within the panels indicate the exposure frequencies. Solid lines are fit to the filled symbols; dashed lines are fit to the open symbols. See Table 2-6 for explanation of the datasets in each panel.......................... 28
Figure 2-12. TTS growth data for high-frequency cetaceans obtained using behavioral and AEP methods. Growth curves were obtained by fitting Eq. (10) to the TTS data as a function of SEL. Onset TTS was defined as the SEL value from the fitted curve at a TTS = 6 dB, for only those datasets that bracketed 6 dB of TTS. Onset PTS was defined as the SEL value from the fitted curve at a TTS = 40 dB, for only those datasets with maximum TTS > 20 dB. The exposure frequency is specified in normal font; italics indicate the hearing test frequency. Percentages in panels (b), (d) indicate exposure duty cycle (duty cycle was 100% for all others). Solid lines are fit to the filled symbols; dashed lines are fit to the open symbols. See Table 2-6 for explanation of the datasets in each panel............................................................................................................. 29
Criteria and Thresholds for U.S. Navy Acoustic and Explosive Effects Analysis (Phase III) June 2017
Figure 2-13. TTS growth data for pinnipeds obtained using behavioral methods. Growth curves were obtained by fitting Eq. (10) to the TTS data as a function of SEL. Onset TTS was defined as the SEL value from the fitted curve at a TTS = 6 dB, for only those datasets that bracketed 6 dB of TTS. Onset PTS was defined as the SEL value from the fitted curve at a TTS = 40 dB, for only those datasets with maximum TTS > 20 dB. Frequency values within the panels indicate the exposure frequencies. Numeric values in panel (c) indicate subjects 01 and 02. Solid lines are fit to the filled symbols; dashed lines are fit to the open symbols. See for Table 2-6 explanation of the datasets in each panel............................................................................................................. 30
Figure 2-14. The cutoff frequencies f1 and f2 were defined as the frequencies below and above f0 at which the composite audiogram values were ΔT-dB above the threshold at f0 (the lowest threshold). ..................................................................................................................................... 35
Figure 2-15. Effect of ΔT adjustment on the TTS exposure functions for the mid-frequency cetaceans (left) and high-frequency cetaceans (right). To calculate the exposure functions, a and b were defined as a = s0/20 and b = 2. ΔT was then varied from 0 to 20. At each value of ΔT, K was adjusted to minimize the squared error between the exposure function and the onset TTS data (symbols). As ΔT increases, f1 decreases and f2 increases, causing the pass-band of the function to increase and the function to “flatten”........................................................................ 35
Figure 2-16. Relationship between ΔT and the resulting mean-squared error (MSE) between the exposure functions and onset TTS data. The MSE was calculated by adding the squared errors between the exposure functions and TTS data for the MF and HF cetacean groups, then dividing by the total number of TTS data points. This process was performed using the composite audiograms based on original and normalized threshold data and ΔT values from 0 to 20. The lowest MSE value was obtained using the audiograms based on normalized thresholds with ΔT = 9 dB (arrow). .................................................................................................................................. 36
Figure 2-17. Exposure functions (solid lines) generated from Eq. (2) with the parameters specified in Table 2-7. Dashed lines — (normalized) composite audiograms used for definition of parameters a, f1, and f2. A constant value was added to each audiogram to equate the minimum audiogram value with the exposure function minimum. Short dashed line — Navy Phase II exposure functions for TTS onset for each group. Filled symbols — onset TTS exposure data (in dB SEL) used to define exposure function shape and vertical position. Open symbols — estimated TTS onset for species for which no TTS data exist. ...................................................... 39
Figure 2-18. Mid-frequency cetacean exposure function, (normalized) composite audiogram, and Phase II exposure functions compared to mid-frequency cetacean TTS data. Large symbols with no numeric values indicate onset TTS exposures. Smaller symbols represent specific amounts of TTS observed, with numeric values giving the amount (or range) or measured TTS. Filled and half-filled symbols — behavioral data. Open symbols — AEP data. ............................ 40
Figure 2-19. High-frequency cetacean TTS exposure function, (normalized) composite audiogram, and Phase II exposure functions compared to high-frequency cetacean TTS data. Large symbols with no numeric values indicate onset TTS exposures. Smaller symbols represent specific amounts of TTS observed, with numeric values giving the amount (or range) or measured TTS. Filled and half-filled symbols — behavioral data. Open symbols — AEP data. .... 41
Figure 2-20. Phocid (underwater) exposure function, (normalized) composite audiogram, and Phase II exposure functions compared to phocid TTS data. Large symbols with no numeric values indicate onset TTS exposures. Smaller symbols represent specific amounts of TTS observed, with numeric values giving the amount (or range) or measured TTS. .................................................. 42
Criteria and Thresholds for U.S. Navy Acoustic and Explosive Effects Analysis (Phase III) June 2017
Figure 3-1. Phase II Navy Behavioral Response Functions. ........................................................... 48
Figure 3-2. Conceptual framework for dividing behavioral responses due to acoustic disturbance into context- based and level-based responses (Ellison et al., 2011). .......................................... 63
Figure 3-3. Received levels at the time of Odontocete responses (in circles) or maximum received levels when there was no response (in squares). 3S killer whales are shown in blue, 3S pilot whales are shown in orange, 3S sperm whales are shown in green, and CES bottlenose dolphins are shown in yellow. ....................................................................................................... 68
Figure 3-4. The Bayesian biphasic dose-response BRF for Odontocetes. The blue solid line represents the Bayesian Posterior median values, the green dashed line represents the biphasic fit, and the gray represents the variance. [X-Axis: Received Level (dB re 1 μPa), Y-Axis: Probability of Response] .................................................................................................................................. 69
Figure 3-5. Received levels at the time of Pinniped responses (in circles) or maximum received levels when there was no response (in squares). CES California sea lions are shown in yellow, CESa gray seals are shown in blue, CESb gray seals are shown in green, and CES hooded seals are shown in red. ................................................................................................................................. 71
Figure 3-6. The Bayesian biphasic dose-response BRF for Pinnipeds. The blue solid line represents the Bayesian Posterior median values, the green dashed line represents the biphasic fit, and the gray represents the variance. [X-Axis: Received Level (dB re 1 μPa), Y-Axis: Probability of Response] .................................................................................................................................. 72
Figure 3-7. Received levels at the time of Mysticete responses (in circles) or maximum received levels when there was no response (in squares). 3S humpbacks are shown in dark blue, the 3S minke whale is shown in red, BRS blue whales are shown in brown, North Atlantic right whales are shown in gray, LFA fin whales are shown in yellow, the LFA blue whale is shown in light blue, and LFA humpback whales are shown in green. ........................................................................... 75
Figure 3-8. The Bayesian biphasic dose-response BRF for Mysticetes. The blue solid line represents the Bayesian Posterior median values, the green dashed line represents the biphasic fit, and the gray represents the variance. [X-Axis: Received Level (dB re 1 μPa), Y-Axis: Probability of Response] .................................................................................................................................. 76
Figure 3-9. Received levels of Beaked Whale responses (in circles) or maximum received levels when there was no response (in squares). BRS Cuvier’s and Baird’s beaked whales are in orange, 3S bottlenose whale is in light blue, AUTEC Blainville’s beaked whales are in yellow. ................ 79
Figure 3-10. The Bayesian biphasic dose-response BRF for Beaked Whales. The blue solid line represents the Bayesian Posterior median values, the green dashed line represents the biphasic fit, and the gray represents the variance. [X-Axis: Received Level (dB re 1 μPa), Y-Axis: Probability of Response] .................................................................................................................................. 80
Figure 4-1. Relationships between impulse threshold for effect and body mass as derived in Yelverton & Richmond (1981) based on the Lovelace Foundation test results for terrestrial animals exposed to underwater detonations. .............................................................................. 90
Criteria and Thresholds for U.S. Navy Acoustic and Explosive Effects Analysis (Phase III) June 2017
List of Tables
Table 2-1. Species group designations for Navy Phase III auditory weighting functions. ............. 12
Table 2-2. References, species, and individual subjects used to derive the composite audiograms. ................................................................................................................................... 15
Table 2-3. Composite audiogram parameters values for use in Eq. (9). For all groups except LF cetaceans, values represent the best-fit parameters from fitting Eq. (9) to experimental threshold data. For the low-frequency cetaceans, parameter values for Eq. (9) were estimated as described in Appendix A. Fits to the sea turtle data were unsuccessful. ...................................... 17
Table 2-4. Normalized composite audiogram parameters values for use in Eq. (9). For all groups except LF cetaceans, values represent the best-fit parameters after fitting Eq. (9) to normalized threshold data. For the low-frequency cetaceans, parameter values for Eq. (9) were estimated as described in Appendix A. Fits to the sea turtle data were unsuccessful. ...................................... 17
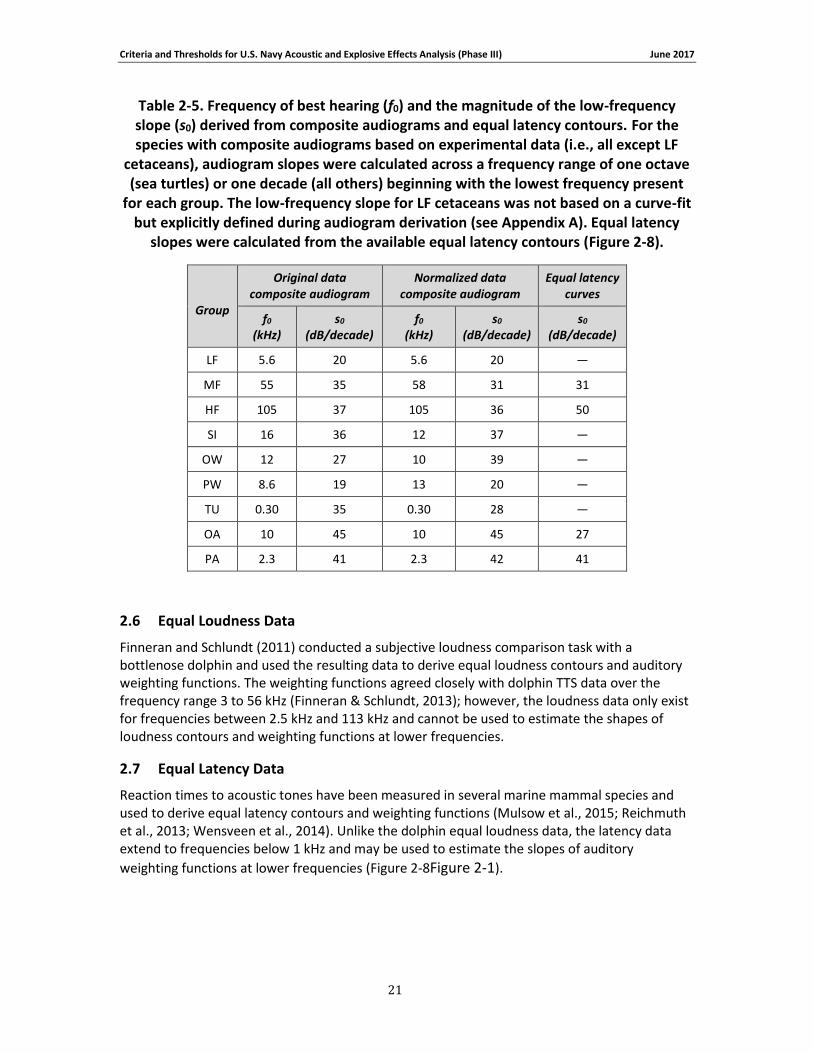
Table 2-5. Frequency of best hearing (f0) and the magnitude of the low-frequency slope (s0) derived from composite audiograms and equal latency contours. For the species with composite audiograms based on experimental data (i.e., all except LF cetaceans), audiogram slopes were calculated across a frequency range of one octave (sea turtles) or one decade (all others) beginning with the lowest frequency present for each group. The low-frequency slope for LF cetaceans was not based on a curve-fit but explicitly defined during audiogram derivation (see Appendix A). Equal latency slopes were calculated from the available equal latency contours (Figure 2-8). ................................................................................................................................... 21
Table 2-6. Summary of marine mammal TTS growth data and onset exposure levels. Only those data from which growth curves could be generated are included. TTS onset values are expressed in SEL, in dB re 1 μPa2s underwater and dB re (20 μPa)2s in air (groups OA and PA only). Tests featured continuous exposure to steady-state noise and behavioral threshold measurements unless otherwise indicated. ........................................................................................................... 31
Table 2-7. Differences between composite threshold values (Figure 2-5) and TTS onset values at the frequency of best hearing (f0) for the in-water marine mammal species groups. The values for the low-frequency cetaceans and sirenians were estimated using the median difference (126) from the MF, HF, OW, and PW groups. ............................................................................... 37
Table 2-8. Weighting function and TTS exposure function parameters for use in Eqs. (1) and (2) for steady-state exposures. R2 values represent goodness of fit between exposure function and TTS onset data (Table 2-6). ............................................................................................................ 38
Table 2-9. TTS and PTS thresholds for explosives and other impulsive sources. SEL thresholds in dB re 1 μPa2s underwater and dB re (20 μPa)2s in air (groups OA and PA only). Peak SPL thresholds in dB re 1 μPa underwater and dB re 20 μPa in air (groups OA and PA only). ............ 45
Table 3-1. Description of experimental conditions used in behavioral response field studies included in the derivation of Phase III behavioral response thresholds. ...................................... 51
Table 3-2: Description of experimental conditions used in captive animal behavioral studies.... 58
Table 3-3. Odontocete data relied upon for quantitative assessment of behavioral response. .. 67
Table 3-4: Pinniped data relied upon for quantitative assessment of behavioral response. ....... 69
Table 3-5: Mysticete data relied upon for quantitative assessment of behavioral response....... 74
Criteria and Thresholds for U.S. Navy Acoustic and Explosive Effects Analysis (Phase III) June 2017
Table 3-6: Beaked whale data relied upon for quantitative assessment of behavioral response. 77
Table 3-7: Individual beaked whale exposure data and associated received levels (RL) and distances. ....................................................................................................................................... 78
Table 3-8. Pile Driving Level B Thresholds Used in this Analysis to Predict Behavioral Responses from Marine Mammals. ................................................................................................................ 85
Table 4-1. Lowest test impulse exposure for injurious effects (Richmond et al., 1973). .............. 93
Table 4-2. Environmental constants. ............................................................................................. 93
Table 4-3. Human diver blast exposure for 1.25-lb charge at 15-ft. depth, diver on bottom in 20 ft. water depth Wright et al. 1950 (as cited in Cudahy & Parvin, 2001). ...................................... 96
Table 4-4. Human diver blast exposure for 5-lb charge at 15-ft. depth, diver on bottom in 20 ft. water depth Wright et al. 1950 (as cited in Cudahy & Parvin, 2001). ........................................... 96
Table 4-5: Criteria to Quantitatively Predict Non-Auditory Injuries due to Underwater Explosions ....................................................................................................................................................... 97
Table 4-6: Onset of Effect Threshold for Estimating Ranges to Potential Effect........................... 97
Criteria and Thresholds for U.S. Navy Acoustic and Explosive Effects Analysis (Phase III) June 2017
ACRONYMS AND ABBREVIATIONS
ASW anti-submarine warfare AUTEC Atlantic Underwater Test and Evaluation Center BRF behavioral response function CDF cumulative truncated normal distribution function CES controlled exposure study dB decibel dB re 1 µPa decibels referenced to 1 microPascal dB re 1 µPa²·s decibels referenced to 1 microPascal—squared—seconds EIS environmental impact statement GAM Generalized Additive Model GLM Generalized Linear Model GI gastrointestinal HF high-frequency Hz hertz kHz kilohertz LF low-frequency MF mid-frequency NAEMO Navy Acoustic Effects Model PRN pseudorandom noise psi pounds per square inch PTS permanent threshold shift SEL sound exposure level SLI slight lung injury

Criteria and Thresholds for U.S. Navy Acoustic and Explosive Effects Analysis (Phase III) June 2017
SOCAL Southern California SPL sound pressure level TM tympanic membrane TTS temporary threshold shift
Criteria and Thresholds for U.S. Navy Acoustic and Explosive Effects Analysis (Phase III) June 2017
1
1 INTRODUCTION
The Navy is required to assess the potential impacts on marine mammals and sea turtles from
training and testing activities to maintain compliance with a suite of Federal environmental laws
and regulations. These regulations include, but are not limited to, the Marine Mammal
Protection Act (MMPA), Endangered Species Act (ESA), and the National Environmental Policy
Act (NEPA). In cases where these activities introduce sound or explosive energy into the marine
environment, an acoustic effects analysis must be conducted.
The effects analysis begins with mathematical modeling to predict the sound transmission
patterns from Navy sources. Navy activities that involve sonar and other transducers, air guns,
pile driving, and explosives are modeled. These data are then coupled with marine species
distribution and abundance data to determine the sound levels likely to be received by various
marine species. Finally, criteria and thresholds are applied to estimate specific effects that
animals exposed to Navy-generated sound may experience.
This technical report supersedes the 2012 Phase II report Criteria and Thresholds for U.S. Navy
Acoustic and Explosives Effects Analysis, and is comprised of three distinct sections that describe
the derivation of criteria and thresholds used to predict specific effects to animals exposed to
Navy-generated sounds. Specifically, these effects include potential auditory effects (see Section
2, Auditory Weighting Functions and TTS/PTS Exposure Functions), behavioral responses to
underwater anthropogenic sounds (see Section 3, Navy Phase III Behavioral Response Criteria
for Marine Species), and non-auditory physiological impacts (see Section 4, Navy Phase III
Explosive Non-Auditory Injury Criteria).
Appendix A describes the methods for estimating a low-frequency cetacean audiogram. A
description of data used to develop the Phase III Navy behavioral response functions can be
found in Appendix B. A summary of these criteria for determining acoustic and explosive effects
to marine mammals and sea turtles from Navy sound sources is located in Appendix C.
Research on the impacts of anthropogenic sound on marine species has increased dramatically
in the past decade. Since the methodology for deriving composite audiograms and associated
marine mammal auditory weighting functions, as well as TTS thresholds is data driven, any new
information that becomes available has the potential to cause some amount of change for a
specific hearing group, but also other hearing groups, if they rely on surrogate data. As such, the
reported criteria and thresholds for marine mammals and sea turtles are anticipated to change
over time; however, it is not feasible to make changes with the publication of each new data
point. Instead, SSC Pacific will periodically examine the best available science and consider the
impacts of those studies on its report (with an anticipated revision cycle of three to five years);
however, there may be special circumstances that merit evaluation of data on a more
accelerated timeline (e.g., the measurement of mysticete hearing thresholds).

Criteria and Thresholds for U.S. Navy Acoustic and Explosive Effects Analysis (Phase III) June 2017
2
2 AUDITORY WEIGHTING FUNCTIONS AND TTS/PTS EXPOSURE FUNCTIONS
2.1 Introduction
This chapter describes the rationale and steps used to define proposed numeric thresholds for predicting auditory effects on marine mammals and sea turtles exposed to sonar and other transducers, explosives, pile driving, and air guns. The weighted threshold values and auditory weighting function shapes are summarized in Appendix C.
2.1.1 Impulsive vs. non-impulsive noise
When analyzing the auditory effects of noise exposure, it is often helpful to broadly categorize noise as either impulsive noise — noise with high peak sound pressure, short duration, fast rise-time, and broad frequency content — or non-impulsive (i.e., steady-state) noise. When considering auditory effects, sonar, other coherent active sources, and vibratory pile driving are considered to be non-impulsive sources, while explosives, impact pile driving, and air guns are treated as impulsive sources. Note that the terms non-impulsive or steady-state do not necessarily imply long duration signals, only that the acoustic signal has sufficient duration to overcome starting transients and reach a steady-state condition. For harmonic signals, sounds with duration greater than approximately 5 to 10 cycles are generally considered to be steady-state.
2.1.2 Noise-induced threshold shifts
Exposure to sound with sufficient duration and sound pressure level (SPL) may result in an elevated hearing threshold (i.e., a loss of hearing sensitivity), called a noise-induced threshold shift (NITS). If the hearing threshold eventually returns to normal, the NITS is called a temporary threshold shift (TTS); otherwise, if thresholds remain elevated after some extended period of time, the remaining NITS is called a permanent threshold shift (PTS). TTS and PTS data have been used to guide the development of safe exposure guidelines for people working in noisy environments. Similarly, TTS and PTS criteria and thresholds form the cornerstone of Navy analyses to predict auditory effects in marine mammals and sea turtles incidentally exposed to intense sound during naval activities.
2.1.3 Auditory weighting functions
Animals are not equally sensitive to noise at all frequencies. To capture the frequency-dependent nature of the effects of noise, auditory weighting functions are used. Auditory weighting functions are mathematical functions used to emphasize frequencies where animals are more susceptible to noise exposure and de-emphasize frequencies where animals are less susceptible. The functions may be thought of as frequency-dependent filters that are applied to a noise exposure before a single, weighted SPL or sound exposure level (SEL) is calculated. The filter shapes are normally “band-pass” in nature; i.e., the function amplitude resembles an inverted “U” when plotted versus frequency. The weighting function amplitude is approximately flat within a limited range of frequencies, called the “pass-band,” and declines at frequencies below and above the pass-band.
Auditory weighting functions for humans were based on equal loudness contours — curves that show the combinations of SPL and frequency that result in a sensation of equal loudness in a human listener. Equal loudness contours are in turn created from data collected during loudness comparison tasks. Analogous tasks are difficult to perform with non-verbal animals; as a result,
Criteria and Thresholds for U.S. Navy Acoustic and Explosive Effects Analysis (Phase III) June 2017
3
equal loudness contours are available for only a single marine mammal (a dolphin) across a limited range of frequencies (2.5 to 113 kHz) (Finneran & Schlundt, 2011). In lieu of performing loudness comparison tests, reaction times to tones can be measured, under the assumption that reaction time is correlated with subjective loudness (Pfingst et al., 1975; Stebbins, 1966).. From the reaction time vs. SPL data, curves of equal response latency can be created and used as proxies for equal loudness contours.
Just as human damage risk criteria use auditory weighting functions to capture the frequency-dependent aspects of noise, U.S. Navy acoustic impact analyses use weighting functions to capture the frequency-dependency of TTS and PTS in marine mammals and sea turtles.
2.1.4 Phase III weighting functions and TTS/PTS thresholds
Navy weighting functions for Phase II (Finneran & Jenkins, 2012a) were based on the “M-weighting” curves defined by (Southall et al., 2007), with additional high-frequency emphasis for cetaceans based on equal loudness contours for a bottlenose dolphin (Finneran & Schlundt, 2011). Phase II TTS/PTS thresholds also relied heavily on the recommendations of Southall et al. (2007), with modifications based on preliminary data for the effects of exposure frequency on dolphin TTS (Finneran, 2010; Finneran & Schlundt, 2010) and limited TTS data for harbor porpoises (Kastelein et al., 2012b; Lucke et al., 2009).
Since the derivation of Phase II acoustic criteria and thresholds, new data have been obtained regarding marine mammal and sea turtle hearing (Dow Piniak et al., 2012; Ghoul & Reichmuth, 2014; Martin et al., 2012; Sills et al., 2014, 2015), marine mammal equal latency contours (Mulsow et al., 2015; Reichmuth et al., 2013; Wensveen et al., 2014), and the effects of noise on marine mammal hearing (Finneran & Schlundt, 2013; Finneran et al., 2015; Kastelein et al., 2012a; Kastelein et al., 2012b; Kastelein et al., 2013a; Kastelein et al., 2013b; Kastelein et al., 2014b; Kastelein et al., 2014c; Kastelein et al., 2015a; Kastelein et al., 2015b; Popov et al., 2013; Popov et al., 2014; Popov et al., 2015b). As a result, new weighting functions and TTS/PTS thresholds have been developed for Phase III. The new criteria and thresholds are based on all relevant data and feature a consistent approach for all species of interest.
Marine mammals and sea turtles were divided into nine groups for analysis. For each group, a frequency-dependent weighting function and numeric thresholds for the onset of TTS and PTS were derived from available data describing hearing abilities and effects of noise on marine mammals and sea turtles. Measured or predicted auditory threshold data, as well as measured equal latency contours, were used to influence the weighting function shape for each group. For species groups for which TTS data are available, the weighting function parameters were adjusted to provide the best fit to the experimental data. The same methods were then applied to other groups for which TTS data did not exist.
2.2 Weighting functions and exposure functions
The shapes of the Phase III auditory weighting functions are based on a generic band-pass filter described by
Criteria and Thresholds for U.S. Navy Acoustic and Explosive Effects Analysis (Phase III) June 2017
4
W ( f ) = C +10log10
f / f1( )
2a
1+ f / f1( )
2éëê
ùûú
a
1+ f / f2( )
2éëê
ùûú
b
ì
íï
îïï
ü
ýï
þïï
, (1)
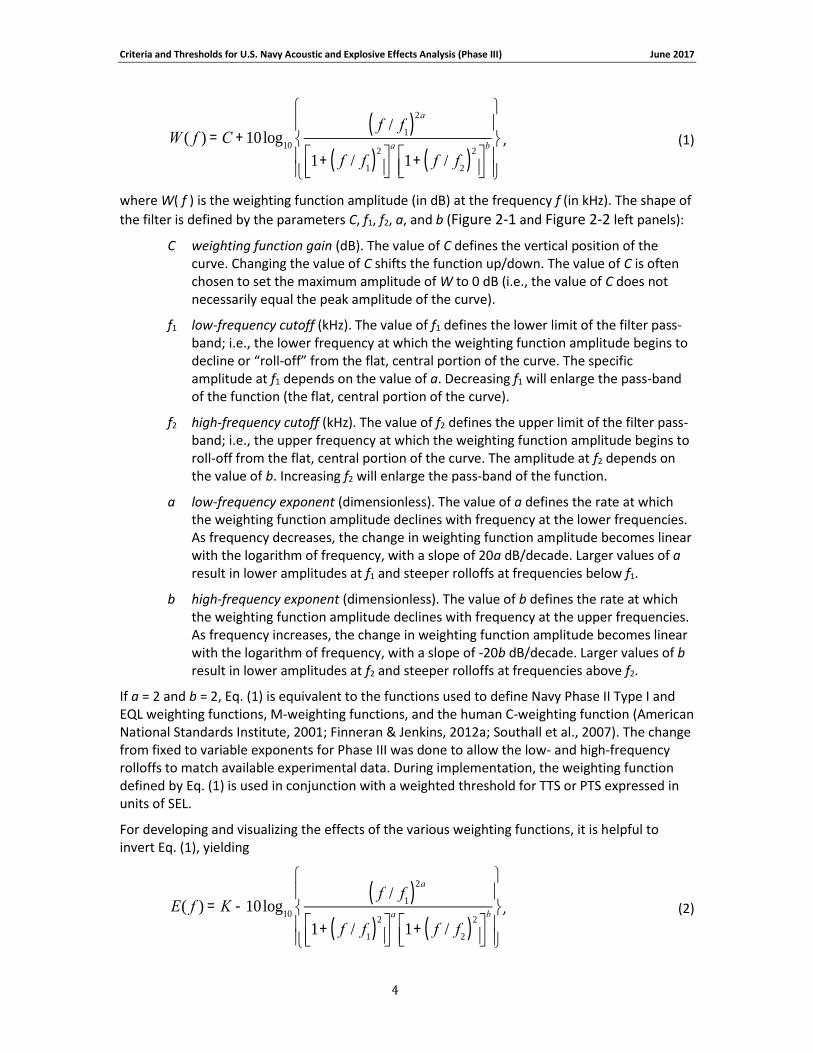
where W( f ) is the weighting function amplitude (in dB) at the frequency f (in kHz). The shape of
the filter is defined by the parameters C, f1, f2, a, and b (Figure 2-1 and Figure 2-2 left panels):
C weighting function gain (dB). The value of C defines the vertical position of the curve. Changing the value of C shifts the function up/down. The value of C is often chosen to set the maximum amplitude of W to 0 dB (i.e., the value of C does not necessarily equal the peak amplitude of the curve).
f1 low-frequency cutoff (kHz). The value of f1 defines the lower limit of the filter pass-band; i.e., the lower frequency at which the weighting function amplitude begins to decline or “roll-off” from the flat, central portion of the curve. The specific amplitude at f1 depends on the value of a. Decreasing f1 will enlarge the pass-band of the function (the flat, central portion of the curve).
f2 high-frequency cutoff (kHz). The value of f2 defines the upper limit of the filter pass-band; i.e., the upper frequency at which the weighting function amplitude begins to roll-off from the flat, central portion of the curve. The amplitude at f2 depends on the value of b. Increasing f2 will enlarge the pass-band of the function.
a low-frequency exponent (dimensionless). The value of a defines the rate at which the weighting function amplitude declines with frequency at the lower frequencies. As frequency decreases, the change in weighting function amplitude becomes linear with the logarithm of frequency, with a slope of 20a dB/decade. Larger values of a result in lower amplitudes at f1 and steeper rolloffs at frequencies below f1.
b high-frequency exponent (dimensionless). The value of b defines the rate at which the weighting function amplitude declines with frequency at the upper frequencies. As frequency increases, the change in weighting function amplitude becomes linear with the logarithm of frequency, with a slope of -20b dB/decade. Larger values of b result in lower amplitudes at f2 and steeper rolloffs at frequencies above f2.
If a = 2 and b = 2, Eq. (1) is equivalent to the functions used to define Navy Phase II Type I and EQL weighting functions, M-weighting functions, and the human C-weighting function (American National Standards Institute, 2001; Finneran & Jenkins, 2012a; Southall et al., 2007). The change from fixed to variable exponents for Phase III was done to allow the low- and high-frequency rolloffs to match available experimental data. During implementation, the weighting function defined by Eq. (1) is used in conjunction with a weighted threshold for TTS or PTS expressed in units of SEL.
For developing and visualizing the effects of the various weighting functions, it is helpful to invert Eq. (1), yielding
E( f ) = K -10log10
f / f1( )
2a
1+ f / f1( )
2éëê
ùûú
a
1+ f / f2( )
2éëê
ùûú
b
ì
íï
îïï
ü
ýï
þïï
, (2)
Criteria and Thresholds for U.S. Navy Acoustic and Explosive Effects Analysis (Phase III) June 2017
5
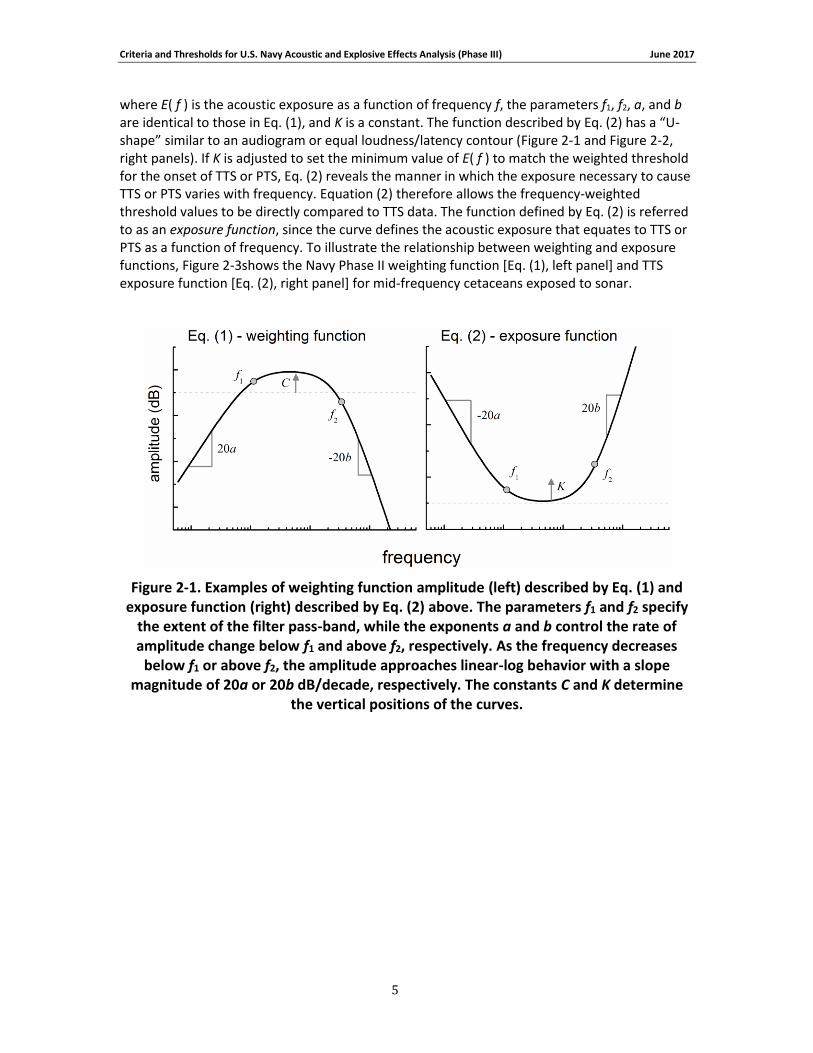
where E( f ) is the acoustic exposure as a function of frequency f, the parameters f1, f2, a, and b are identical to those in Eq. (1), and K is a constant. The function described by Eq. (2) has a “U-shape” similar to an audiogram or equal loudness/latency contour (Figure 2-1 and Figure 2-2, right panels). If K is adjusted to set the minimum value of E( f ) to match the weighted threshold for the onset of TTS or PTS, Eq. (2) reveals the manner in which the exposure necessary to cause TTS or PTS varies with frequency. Equation (2) therefore allows the frequency-weighted threshold values to be directly compared to TTS data. The function defined by Eq. (2) is referred to as an exposure function, since the curve defines the acoustic exposure that equates to TTS or PTS as a function of frequency. To illustrate the relationship between weighting and exposure functions, Figure 2-3shows the Navy Phase II weighting function [Eq. (1), left panel] and TTS exposure function [Eq. (2), right panel] for mid-frequency cetaceans exposed to sonar.
Figure 2-1. Examples of weighting function amplitude (left) described by Eq. (1) and exposure function (right) described by Eq. (2) above. The parameters f1 and f2 specify
the extent of the filter pass-band, while the exponents a and b control the rate of amplitude change below f1 and above f2, respectively. As the frequency decreases
below f1 or above f2, the amplitude approaches linear-log behavior with a slope magnitude of 20a or 20b dB/decade, respectively. The constants C and K determine
the vertical positions of the curves.
Criteria and Thresholds for U.S. Navy Acoustic and Explosive Effects Analysis (Phase III) June 2017
6
Figure 2-2. Influence of parameter values on the resulting shapes of the weighting functions (left) and exposure functions (right). The arrows indicate the direction of
change when the designated parameter is increased.

Criteria and Thresholds for U.S. Navy Acoustic and Explosive Effects Analysis (Phase III) June 2017
7
Figure 2-3. (left panel) Navy Phase II weighting function for the mid-frequency cetacean group. This function was used in conjunction with a weighted TTS threshold of 178 dB re 1 μPa2s. For narrowband signals, the effective, weighted TTS threshold at a particular frequency is calculated by adding the weighting function amplitude at that
frequency to the weighted TTS threshold (178 dB re 1 μPa2s). To visualize the frequency-dependent nature of the TTS threshold, the weighting function is inverted and the minimum value set equal to the weighted TTS threshold. This is illustrated in
the right panel, which shows the SEL required for TTS onset as a function of frequency. The advantage of this representation is that it may be directly compared to TTS onset
data at different exposure frequencies.
The relationships between Eqs. (1) and (2) may be highlighted by defining the function X( f ) as
X ( f ) = 10log10
f / f1( )
2a
1+ f / f1( )
2éëê
ùûú
a
1+ f / f2( )
2éëê
ùûú
b
ì
íï
îïï
ü
ýï
þïï
. (3)
The peak value of X( f ) depends on the specific values of f1, f2, a, and b and will not necessarily equal zero. Substituting Eq. (3) into Eqs. (1) and (2) results in
W ( f ) = C + X ( f ) (4)
and
E( f ) = K - X ( f ) , (5)
respectively. The maximum of the weighting function and the minimum of the exposure function occur at the same frequency, denoted fp. The constant C is defined so the weighting function maximum value is 0 dB; i.e., W( fp ) = 0, so
W ( f
p) = 0 = C + X ( f
p). (6)
Criteria and Thresholds for U.S. Navy Acoustic and Explosive Effects Analysis (Phase III) June 2017
8
The constant K is defined so that the minimum of the exposure function [i.e., the value of E( f ) when f = fp ] equals the weighted TTS or PTS threshold, Twgt, so
E( f
p) = T
wgt= K - X ( f
p) . (7)
Adding Eqs. (6) and (7) results in
T
wgt= C + K . (8)
The constants C, K, and the weighted threshold are therefore not independent and any one of these parameters can be calculated if the other two are known.
2.3 Methodology to Derive Function Parameters
Weighting and exposure functions are defined by selecting appropriate values for the parameters C, K, f1, f2, a, and b in Eqs. (1) and (2). Ideally, these parameters would be based on experimental data describing the manner in which the onset of TTS or PTS varied as a function of exposure frequency. In other words, a weighting function for TTS should ideally be based on TTS data obtained using a range of exposure frequencies, species, and individual subjects within each species group. However, at present, there are only limited data for the frequency-dependency of TTS in marine mammals and no TTS or PTS data for sea turtles. Therefore, weighting and exposure function derivations relied upon auditory threshold measurements (audiograms), equal latency contours, anatomical data, and TTS data when available.
Although the weighting function shapes are heavily influenced by the shape of the auditory sensitivity curve, the two are not identical. Essentially, the auditory sensitivity curves are adjusted to match the existing TTS data in the frequency region near best sensitivity (step 4 below). This results in “compression” of the auditory sensitivity curve in the region near best sensitivity to allow the weighting function shape to match the TTS data, which show less change with frequency compared to hearing sensitivity curves in the frequency region near best sensitivity.
Weighting and exposure function derivation consisted of the following steps:
1. Marine species were divided into nine groups based on auditory, ecological, and phylogenetic relationships among species and the medium (air or water) in which they could be exposed.
2. For each species group, a representative, composite audiogram (a graph of hearing threshold vs. frequency) was estimated.
3. The exponent a was defined using the smaller of the low-frequency slope from the composite audiogram or the low-frequency slope of equal latency contours. The exponent b was set equal to two.
4. The frequencies f1 and f2 were defined as the frequencies at which the composite threshold values are ΔT-dB above the lowest threshold value. The value of ΔT was chosen to minimize the mean-squared error between Eq. (2) and the non-impulsive TTS data for the mid- and high-frequency cetacean groups.
5. For species groups for which TTS onset data exist, K was adjusted to minimize the squared error between Eq. (2) and the steady-state (non-impulsive) TTS
Criteria and Thresholds for U.S. Navy Acoustic and Explosive Effects Analysis (Phase III) June 2017
9
onset data. For other species, K was defined to provide the best estimate for TTS onset at a representative frequency. The minimum value of the TTS exposure function (which is not necessarily equal to K) was then defined as the weighted TTS threshold.
6. The constant C was defined to set the peak amplitude of the function defined by Eq. (1) to zero. This is mathematically equivalent to setting C equal to the difference between the weighted threshold and K [see Eq. (8)].
7. The weighted threshold for PTS was derived for each group by adding a constant value (20 dB) to the weighted TTS thresholds. The constant was based on estimates of the difference in exposure levels between TTS onset and PTS onset (i.e., 40 dB of TTS) obtained from the marine mammal TTS growth curves.
8. For the mid- and high-frequency cetaceans, weighted TTS and PTS thresholds for explosives and other impulsive sources were obtained from the available impulsive TTS data. For other groups, the weighted SEL thresholds were estimated using the relationship between the steady-state TTS weighted threshold and the impulsive TTS weighted threshold for the mid- and high-frequency cetaceans. Peak SPL thresholds were estimated using the relationship between hearing thresholds and the impulsive TTS peak SPL thresholds for the mid- and high-frequency cetaceans.
The remainder of this document addresses these steps in detail.
2.4 Marine Animal Species Groups
Marine mammal and sea turtles were divided into nine groups (Table 2-1), with the same weighting function and TTS/PTS thresholds used for all species within a group. Species were grouped by considering their known or suspected audible frequency range, auditory sensitivity, ear anatomy, and acoustic ecology (i.e., how they use sound), as has been done previously (Finneran & Jenkins, 2012a; Ketten, 2000; Southall et al., 2007).
2.4.1 Low-frequency (LF) cetaceans
The LF cetacean group contains all of the mysticetes (baleen whales). Although there have been no direct measurements of hearing sensitivity in any mysticete, an audible frequency range of approximately 10 Hz to 30 kHz has been estimated from observed vocalization frequencies, observed reactions to playback of sounds, and anatomical analyses of the auditory system. A natural division may exist within the mysticetes, with some species (e.g., blue, fin) having better low-frequency sensitivity and others (e.g., humpback, minke) having better sensitivity to higher frequencies; however, at present there is insufficient knowledge to justify separating species into multiple groups. Therefore, a single species group is used for all mysticetes.
2.4.2 Mid-frequency (MF) cetaceans
The MF cetacean group contains most delphinid species (e.g., bottlenose dolphin, common dolphin, killer whale, pilot whale), beaked whales, and sperm whales (but not pygmy and dwarf
Criteria and Thresholds for U.S. Navy Acoustic and Explosive Effects Analysis (Phase III) June 2017
10
sperm whales of the genus Kogia, which are treated as high-frequency species). Hearing sensitivity has been directly measured for a number of species within this group using psychophysical (behavioral) or auditory evoked potential (AEP) measurements.
2.4.3 High-frequency (HF) cetaceans
The HF cetacean group contains the porpoises, river dolphins, pygmy/dwarf sperm whales, Cephalorhynchus species, and some Lagenorhynchus species. Hearing sensitivity has been measured for several species within this group using behavioral or AEP measurements. High-frequency cetaceans generally possess a higher upper-frequency limit and better sensitivity at high frequencies compared to the mid-frequency cetacean species.
2.4.4 Sirenians
The sirenian group contains manatees and dugongs. Behavioral and AEP threshold measurements for manatees have revealed lower upper cutoff frequencies and sensitivities compared to the mid-frequency cetaceans.
2.4.5 Phocids
This group contains all earless seals or “true seals,” including all Arctic and Antarctic ice seals, harbor or common seals, gray seals and inland seals, elephant seals, and monk seals. Since these animals are amphibious, weighting functions and TTS/PTS thresholds are included for both airborne and underwater exposure. Aerial and underwater hearing thresholds exist for some Northern Hemisphere species in this group.
2.4.6 Otariids and other non-phocid marine carnivores
This group contains all eared seals (fur seals and sea lions), walruses, sea otters, and polar bears. The division of marine carnivores by placing phocids in one group and all others into a second group was made after considering auditory anatomy and measured audiograms for the various species and noting the similarities between the non-phocid audiograms (Figure 2-4). Aerial and underwater hearing thresholds exist for some Northern Hemisphere species in this group. Separate weighting functions and TTS/PTS thresholds are included for airborne and underwater exposure.
2.4.7 Sea turtles
This group contains all sea turtles (families Cheloniidae and Dermochelyidae). Most audiometric information has been obtained via AEP measurements, though some behavioral data exist. Sea turtle functional hearing is restricted to relatively low frequencies, below approximately 2 kHz, and they have relatively poor auditory sensitivity.

Criteria and Thresholds for U.S. Navy Acoustic and Explosive Effects Analysis (Phase III) June 2017
11
Figure 2-4. Comparison of Otariid, Mustelid, Odobenid, and Ursid psychophysical hearing thresholds measured underwater (left) and in-air (right). The thick, solid line is
the composite audiogram based on data for all species. The thick, dashed line is the composite audiogram based on the otariids only.

Criteria and Thresholds for U.S. Navy Acoustic and Explosive Effects Analysis (Phase III) June 2017
12
Table 2-1. Species group designations for Navy Phase III auditory weighting functions.
Code Name Members
LF Low-frequency cetaceans
Family Balaenidae (right and bowhead whales)
Family Balaenopteridae (rorquals)
Family Eschrichtiidae (gray whale)
Family Neobalaenidae (pygmy right whale)
MF Mid-frequency cetaceans
Family Ziphiidae (beaked whales)
Family Physeteridae (Sperm whale)
Family Monodontidae (Irrawaddy dolphin, beluga, narwhal)
Subfamily Delphininae (white-beaked/white-sided/ Risso’s/bottlenose/spotted/spinner/striped/common dolphins)
Subfamily Orcininae (melon-headed whales, false/pygmy killer whale, killer whale, pilot whales)
Subfamily Stenoninae (rough-toothed/humpback dolphins)
Genus Lissodelphis (right whale dolphins)
Lagenorhynchus albirostris (white-beaked dolphin)
Lagenorhynchus acutus (Atlantic white-sided dolphin)
Lagenorhynchus obliquidens (Pacific white-sided dolphin)
Lagenorhynchus obscurus (dusky dolphin)
HF High-frequency cetaceans
Family Phocoenidae (porpoises)
Family Platanistidae (Indus/Ganges river dolphins)
Family Iniidae (Amazon river dolphins)
Family Pontoporiidae (Baiji/ La Plata river dolphins)
Family Kogiidae (Pygmy/dwarf sperm whales)
Genus Cephalorhynchus (Commerson’s, Chilean, Heaviside’s, Hector’s dolphins)
Lagenorhynchus australis (Peale’s or black-chinned dolphin)
Lagenorhynchus cruciger (hourglass dolphin)
OW Otariids and other non-phocid marine carnivores (water)
Family Otariidae (eared seals and sea lions)
Family Odobenidae (walrus)
Enhydra lutris (sea otter)
Ursus maritimus (polar bear)
PW Phocids (water) Family Phocidae (true seals)
SI Sirenians Family Trichechidae (manatees)
Family Dugongidae (dugongs)
TU Sea turtles Family Cheloniidae (loggerhead, green, hawksbill, Kemp's ridley, olive ridley, flatback sea turtle)
Family Dermochelyidae (leatherback sea turtle)
OA Otariids and other non-phocid marine carnivores (air)
Family Otariidae (eared seals and sea lions)
Family Odobenidae (walrus)
Enhydra lutris (sea otter)
Ursus maritimus (polar bear)
PA Phocids (air) Family Phocidae (true seals)
Criteria and Thresholds for U.S. Navy Acoustic and Explosive Effects Analysis (Phase III) June 2017
13
2.5 Composite Audiograms
Composite audiograms for each species group were determined by first searching the available literature for threshold data for the species of interest. For each group, all available AEP and psychophysical (behavioral) threshold data were initially examined. To derive the composite audiograms, the following rules were applied:
1. For marine mammal species groups with three or more behavioral audiograms (all groups except LF cetaceans), only behavioral (no AEP) data were used. Mammalian AEP thresholds are typically elevated from behavioral thresholds in a frequency-dependent manner, with increasing discrepancy between AEP and behavioral thresholds at the lower frequencies where there is a loss of phase synchrony in the neurological responses and a concomitant increase in measured AEP thresholds. The frequency-dependent relationship between the AEP and behavioral data is problematic for defining the audiogram slope at low frequencies, since the AEP data will systematically over-estimate thresholds and therefore over-estimate the low-frequency slope of the audiogram. As a result of this rule, behavioral data were used for all marine mammal groups. For sea turtles, the relationships between AEP and behavioral threshold data are less clear and there were insufficient data to rely on behavioral thresholds alone, therefore both behavioral and AEP data were used for sea turtles. Note that for all species groups, AEP threshold data were still used for interpreting the hearing ability of various species and determining the group to which they should belong.
For the low-frequency cetaceans, for which no behavioral or AEP threshold data exist, hearing thresholds were estimated by synthesizing information from anatomical measurements, mathematical models of hearing, and animal vocalization frequencies (see Appendix A).
2. Data from an individual animal were included only once at a particular frequency. If data from the same individual were available from multiple studies, data at overlapping frequencies were averaged.
3. Individuals with obvious high-frequency hearing loss for their species or aberrant audiograms (e.g., obvious notches or thresholds known to be elevated for that species due to masking or hearing loss) were excluded.
4. Linear interpolation was performed within the threshold data for each individual to estimate a threshold value at each unique frequency present in any of the data for that species group. This was necessary to calculate descriptive statistics at each frequency without excluding data from any individual subject.
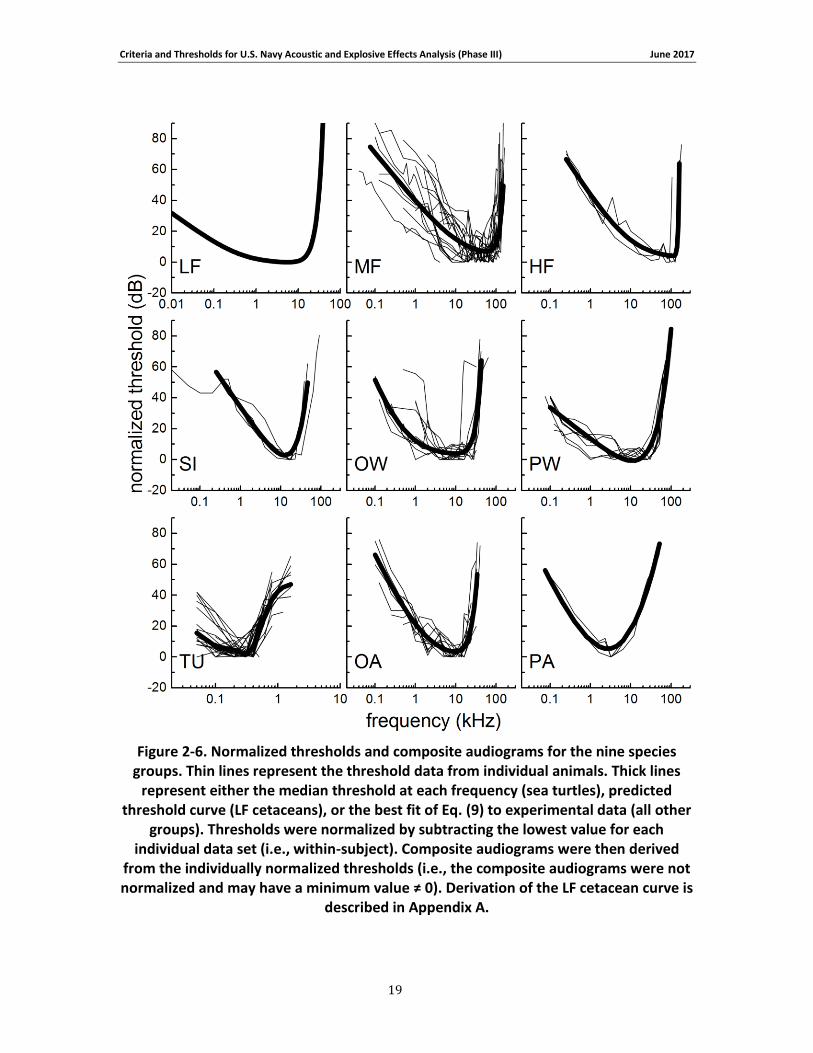
5. Composite audiograms were determined using both the original threshold values from each individual (in dB re 1 μPa or dB re 20 μPa) and normalized thresholds obtained by subtracting the lowest threshold value for that subject.
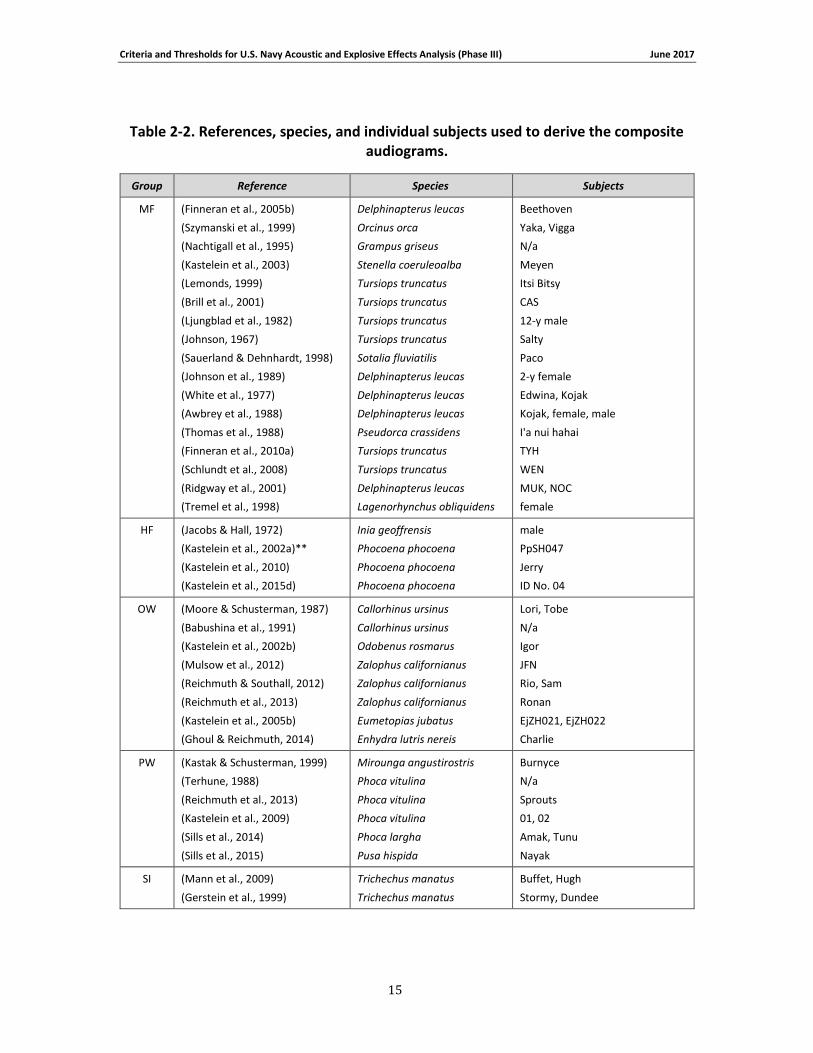
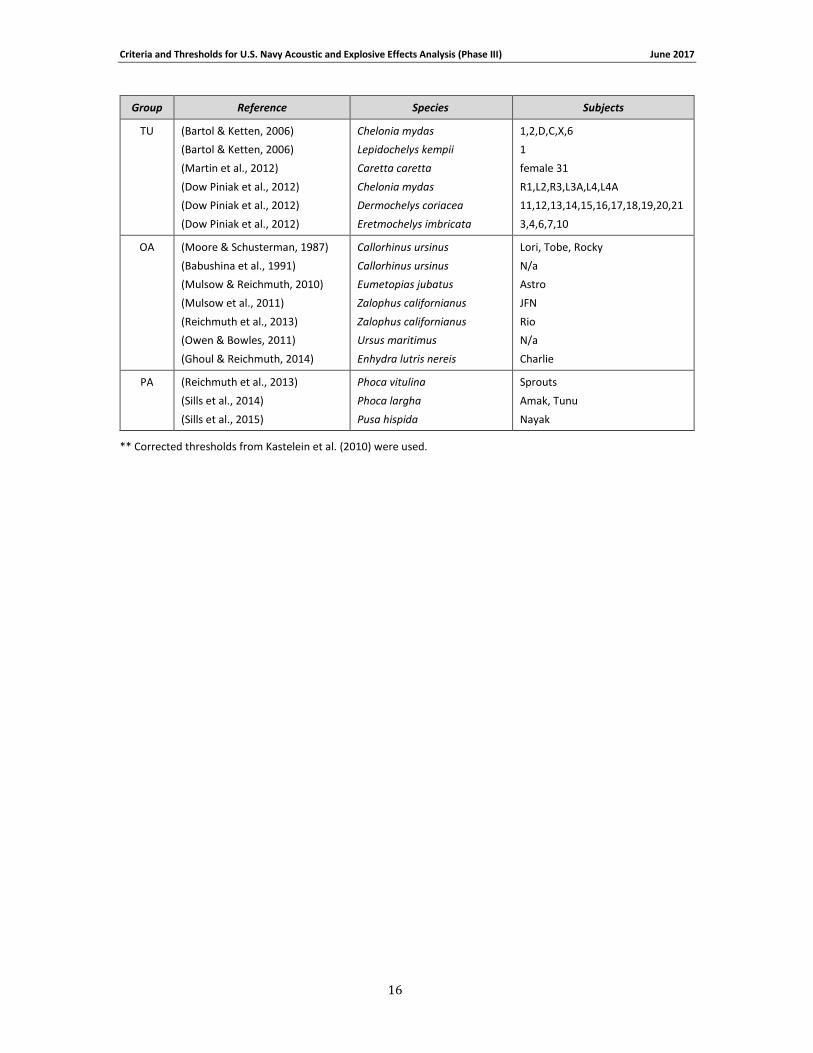
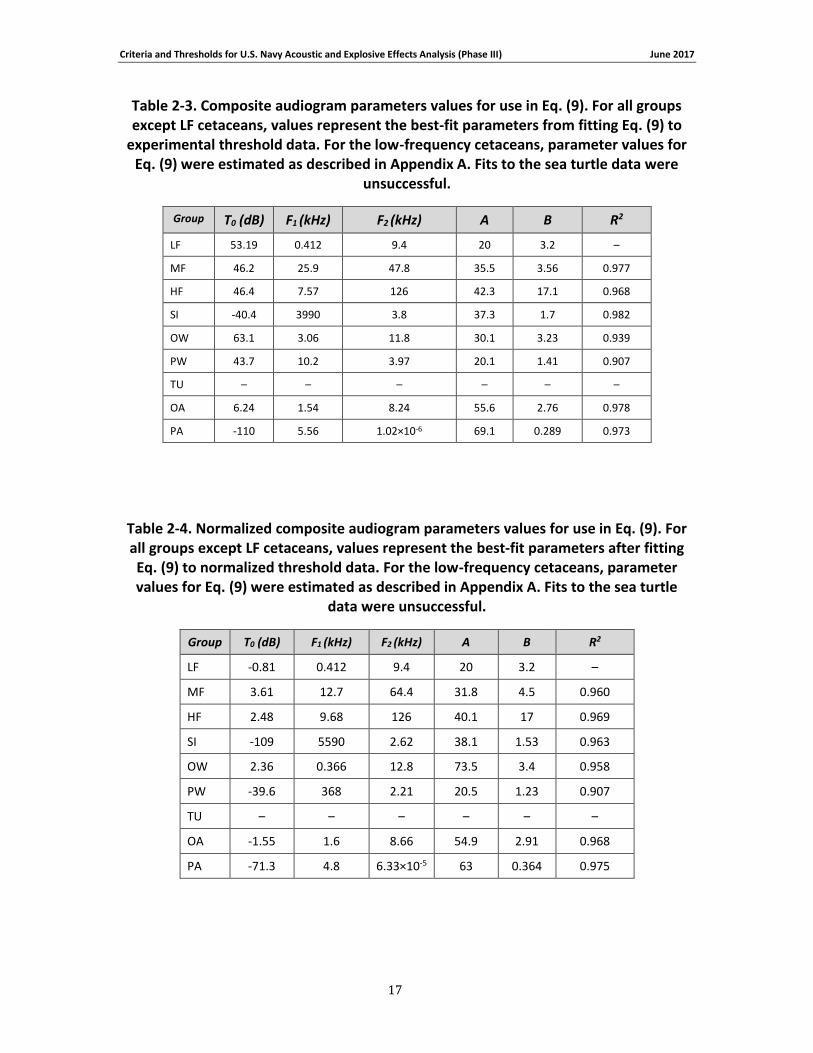
Table 2-2 lists the individual references for the data ultimately used to construct the composite audiograms (for all species groups except the LF cetaceans). From these data, the median (50th percentile) threshold value was calculated at each frequency and fit by the function
Criteria and Thresholds for U.S. Navy Acoustic and Explosive Effects Analysis (Phase III) June 2017
14
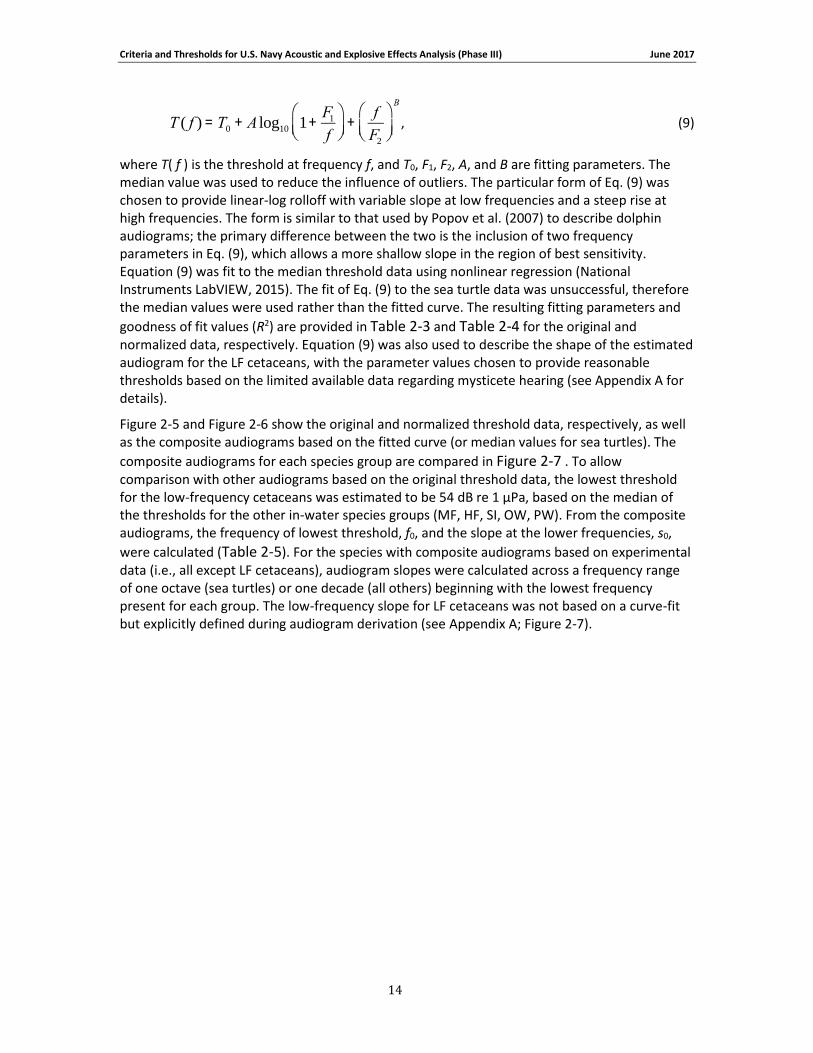
, (9)
where T( f ) is the threshold at frequency f, and T0, F1, F2, A, and B are fitting parameters. The median value was used to reduce the influence of outliers. The particular form of Eq. (9) was chosen to provide linear-log rolloff with variable slope at low frequencies and a steep rise at high frequencies. The form is similar to that used by Popov et al. (2007) to describe dolphin audiograms; the primary difference between the two is the inclusion of two frequency parameters in Eq. (9), which allows a more shallow slope in the region of best sensitivity. Equation (9) was fit to the median threshold data using nonlinear regression (National Instruments LabVIEW, 2015). The fit of Eq. (9) to the sea turtle data was unsuccessful, therefore the median values were used rather than the fitted curve. The resulting fitting parameters and
goodness of fit values (R2) are provided in Table 2-3 and Table 2-4 for the original and normalized data, respectively. Equation (9) was also used to describe the shape of the estimated audiogram for the LF cetaceans, with the parameter values chosen to provide reasonable thresholds based on the limited available data regarding mysticete hearing (see Appendix A for details).
Figure 2-5 and Figure 2-6 show the original and normalized threshold data, respectively, as well as the composite audiograms based on the fitted curve (or median values for sea turtles). The
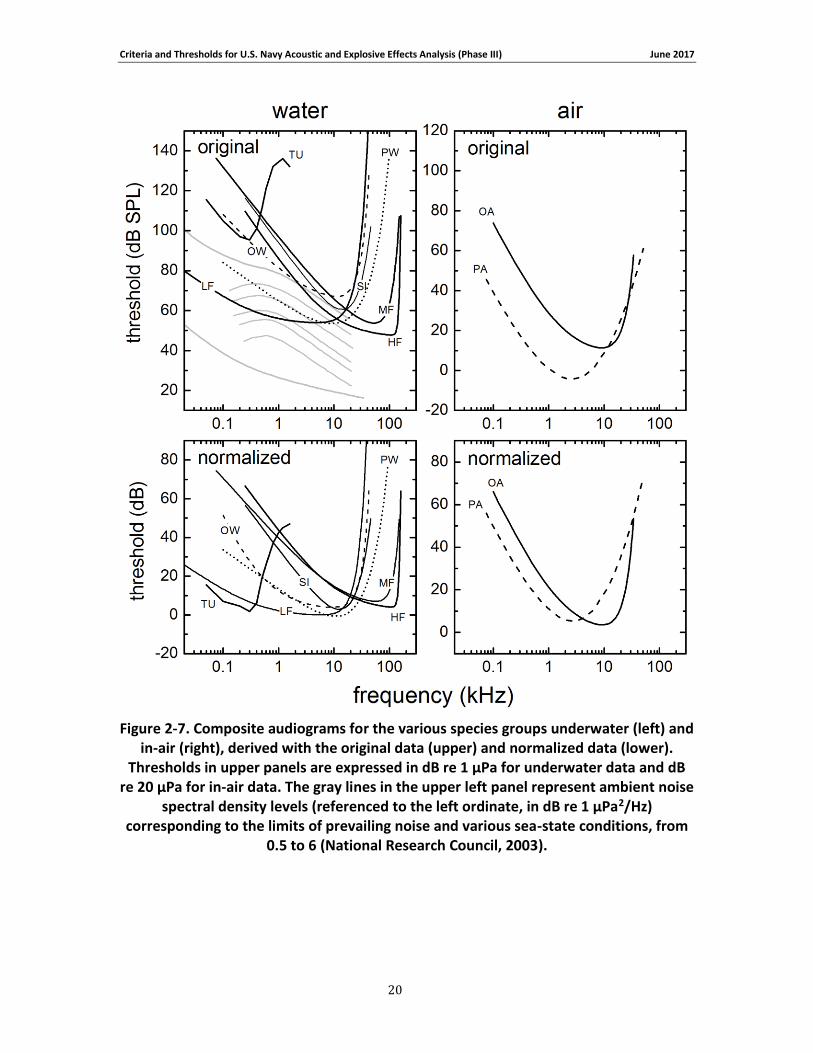
composite audiograms for each species group are compared in Figure 2-7 . To allow comparison with other audiograms based on the original threshold data, the lowest threshold for the low-frequency cetaceans was estimated to be 54 dB re 1 μPa, based on the median of the thresholds for the other in-water species groups (MF, HF, SI, OW, PW). From the composite audiograms, the frequency of lowest threshold, f0, and the slope at the lower frequencies, s0,
were calculated (Table 2-5). For the species with composite audiograms based on experimental data (i.e., all except LF cetaceans), audiogram slopes were calculated across a frequency range of one octave (sea turtles) or one decade (all others) beginning with the lowest frequency present for each group. The low-frequency slope for LF cetaceans was not based on a curve-fit but explicitly defined during audiogram derivation (see Appendix A; Figure 2-7).
T ( f ) = T0 + A log10 1+F1
f
æ
èçö
ø÷+
f
F2
æ
èçö
ø÷
B
Criteria and Thresholds for U.S. Navy Acoustic and Explosive Effects Analysis (Phase III) June 2017
15
Table 2-2. References, species, and individual subjects used to derive the composite audiograms.
Group Reference Species Subjects
MF (Finneran et al., 2005b)
(Szymanski et al., 1999)
(Nachtigall et al., 1995)
(Kastelein et al., 2003)
(Lemonds, 1999)
(Brill et al., 2001)
(Ljungblad et al., 1982)
(Johnson, 1967)
(Sauerland & Dehnhardt, 1998)
(Johnson et al., 1989)
(White et al., 1977)
(Awbrey et al., 1988)
(Thomas et al., 1988)
(Finneran et al., 2010a)
(Schlundt et al., 2008)
(Ridgway et al., 2001)
(Tremel et al., 1998)
Delphinapterus leucas
Orcinus orca
Grampus griseus
Stenella coeruleoalba
Tursiops truncatus
Tursiops truncatus
Tursiops truncatus
Tursiops truncatus
Sotalia fluviatilis
Delphinapterus leucas
Delphinapterus leucas
Delphinapterus leucas
Pseudorca crassidens
Tursiops truncatus
Tursiops truncatus
Delphinapterus leucas
Lagenorhynchus obliquidens
Beethoven
Yaka, Vigga
N/a
Meyen
Itsi Bitsy
CAS
12-y male
Salty
Paco
2-y female
Edwina, Kojak
Kojak, female, male
I'a nui hahai
TYH
WEN
MUK, NOC
female
HF (Jacobs & Hall, 1972)
(Kastelein et al., 2002a)**
(Kastelein et al., 2010)
(Kastelein et al., 2015d)
Inia geoffrensis
Phocoena phocoena
Phocoena phocoena
Phocoena phocoena
male
PpSH047
Jerry
ID No. 04
OW (Moore & Schusterman, 1987)
(Babushina et al., 1991)
(Kastelein et al., 2002b)
(Mulsow et al., 2012)
(Reichmuth & Southall, 2012)
(Reichmuth et al., 2013)
(Kastelein et al., 2005b)
(Ghoul & Reichmuth, 2014)
Callorhinus ursinus
Callorhinus ursinus
Odobenus rosmarus
Zalophus californianus
Zalophus californianus
Zalophus californianus
Eumetopias jubatus
Enhydra lutris nereis
Lori, Tobe
N/a
Igor
JFN
Rio, Sam
Ronan
EjZH021, EjZH022
Charlie
PW (Kastak & Schusterman, 1999)
(Terhune, 1988)
(Reichmuth et al., 2013)
(Kastelein et al., 2009)
(Sills et al., 2014)
(Sills et al., 2015)
Mirounga angustirostris
Phoca vitulina
Phoca vitulina
Phoca vitulina
Phoca largha
Pusa hispida
Burnyce
N/a
Sprouts
01, 02
Amak, Tunu
Nayak
SI (Mann et al., 2009)
(Gerstein et al., 1999)
Trichechus manatus
Trichechus manatus
Buffet, Hugh
Stormy, Dundee
Criteria and Thresholds for U.S. Navy Acoustic and Explosive Effects Analysis (Phase III) June 2017
16
Group Reference Species Subjects
TU (Bartol & Ketten, 2006)
(Bartol & Ketten, 2006)
(Martin et al., 2012)
(Dow Piniak et al., 2012)
(Dow Piniak et al., 2012)
(Dow Piniak et al., 2012)
Chelonia mydas
Lepidochelys kempii
Caretta caretta
Chelonia mydas
Dermochelys coriacea
Eretmochelys imbricata
1,2,D,C,X,6
1
female 31
R1,L2,R3,L3A,L4,L4A
11,12,13,14,15,16,17,18,19,20,21
3,4,6,7,10
OA (Moore & Schusterman, 1987)
(Babushina et al., 1991)
(Mulsow & Reichmuth, 2010)
(Mulsow et al., 2011)
(Reichmuth et al., 2013)
(Owen & Bowles, 2011)
(Ghoul & Reichmuth, 2014)
Callorhinus ursinus
Callorhinus ursinus
Eumetopias jubatus
Zalophus californianus
Zalophus californianus
Ursus maritimus
Enhydra lutris nereis
Lori, Tobe, Rocky
N/a
Astro
JFN
Rio
N/a
Charlie
PA (Reichmuth et al., 2013)
(Sills et al., 2014)
(Sills et al., 2015)
Phoca vitulina
Phoca largha
Pusa hispida
Sprouts
Amak, Tunu
Nayak
** Corrected thresholds from Kastelein et al. (2010) were used.
Criteria and Thresholds for U.S. Navy Acoustic and Explosive Effects Analysis (Phase III) June 2017
17
Table 2-3. Composite audiogram parameters values for use in Eq. (9). For all groups except LF cetaceans, values represent the best-fit parameters from fitting Eq. (9) to
experimental threshold data. For the low-frequency cetaceans, parameter values for Eq. (9) were estimated as described in Appendix A. Fits to the sea turtle data were
unsuccessful.
Group T0 (dB) F1 (kHz) F2 (kHz) A B R2
LF 53.19 0.412 9.4 20 3.2 –
MF 46.2 25.9 47.8 35.5 3.56 0.977
HF 46.4 7.57 126 42.3 17.1 0.968
SI -40.4 3990 3.8 37.3 1.7 0.982
OW 63.1 3.06 11.8 30.1 3.23 0.939
PW 43.7 10.2 3.97 20.1 1.41 0.907
TU – – – – – –
OA 6.24 1.54 8.24 55.6 2.76 0.978
PA -110 5.56 1.02×10⁻⁶ 69.1 0.289 0.973
Table 2-4. Normalized composite audiogram parameters values for use in Eq. (9). For all groups except LF cetaceans, values represent the best-fit parameters after fitting Eq. (9) to normalized threshold data. For the low-frequency cetaceans, parameter values for Eq. (9) were estimated as described in Appendix A. Fits to the sea turtle
data were unsuccessful.
Group T0 (dB) F1 (kHz) F2 (kHz) A B R2
LF -0.81 0.412 9.4 20 3.2 –
MF 3.61 12.7 64.4 31.8 4.5 0.960
HF 2.48 9.68 126 40.1 17 0.969
SI -109 5590 2.62 38.1 1.53 0.963
OW 2.36 0.366 12.8 73.5 3.4 0.958
PW -39.6 368 2.21 20.5 1.23 0.907
TU – – – – – –
OA -1.55 1.6 8.66 54.9 2.91 0.968
PA -71.3 4.8 6.33×10⁻⁵ 63 0.364 0.975
Criteria and Thresholds for U.S. Navy Acoustic and Explosive Effects Analysis (Phase III) June 2017
18
Figure 2-5. Thresholds and composite audiograms for the nine species groups. Thin lines represent the threshold data from individual animals. Thick lines represent either
the median threshold at each frequency (sea turtles), predicted threshold curve (LF cetaceans), or the best fit of Eq. (9) to experimental data (all other groups). Thresholds
are expressed in dB re 1 μPa for underwater data and dB re 20 μPa for in-air data (groups OA and PA only). Derivation of the LF cetacean curve is described in Appendix A. The minimum threshold for the LF cetaceans was estimated to be 54 dB re 1 μPa,
based on the median of the lowest thresholds for the marine mammal groups in water (groups MF, HF, SI, OW, PW).
Criteria and Thresholds for U.S. Navy Acoustic and Explosive Effects Analysis (Phase III) June 2017
19
Figure 2-6. Normalized thresholds and composite audiograms for the nine species groups. Thin lines represent the threshold data from individual animals. Thick lines
represent either the median threshold at each frequency (sea turtles), predicted threshold curve (LF cetaceans), or the best fit of Eq. (9) to experimental data (all other
groups). Thresholds were normalized by subtracting the lowest value for each individual data set (i.e., within-subject). Composite audiograms were then derived
from the individually normalized thresholds (i.e., the composite audiograms were not normalized and may have a minimum value ≠ 0). Derivation of the LF cetacean curve is
described in Appendix A.
Criteria and Thresholds for U.S. Navy Acoustic and Explosive Effects Analysis (Phase III) June 2017
20
Figure 2-7. Composite audiograms for the various species groups underwater (left) and in-air (right), derived with the original data (upper) and normalized data (lower).
Thresholds in upper panels are expressed in dB re 1 μPa for underwater data and dB re 20 μPa for in-air data. The gray lines in the upper left panel represent ambient noise
spectral density levels (referenced to the left ordinate, in dB re 1 μPa2/Hz) corresponding to the limits of prevailing noise and various sea-state conditions, from
0.5 to 6 (National Research Council, 2003).
Criteria and Thresholds for U.S. Navy Acoustic and Explosive Effects Analysis (Phase III) June 2017
21
Table 2-5. Frequency of best hearing (f0) and the magnitude of the low-frequency slope (s0) derived from composite audiograms and equal latency contours. For the species with composite audiograms based on experimental data (i.e., all except LF
cetaceans), audiogram slopes were calculated across a frequency range of one octave (sea turtles) or one decade (all others) beginning with the lowest frequency present
for each group. The low-frequency slope for LF cetaceans was not based on a curve-fit but explicitly defined during audiogram derivation (see Appendix A). Equal latency
slopes were calculated from the available equal latency contours (Figure 2-8).
Group
Original data composite audiogram
Normalized data composite audiogram
Equal latency curves
f0 (kHz)
s0
(dB/decade) f0
(kHz) s0
(dB/decade) s0
(dB/decade)
LF 5.6 20 5.6 20 —
MF 55 35 58 31 31
HF 105 37 105 36 50
SI 16 36 12 37 —
OW 12 27 10 39 —
PW 8.6 19 13 20 —
TU 0.30 35 0.30 28 —
OA 10 45 10 45 27
PA 2.3 41 2.3 42 41
2.6 Equal Loudness Data
Finneran and Schlundt (2011) conducted a subjective loudness comparison task with a bottlenose dolphin and used the resulting data to derive equal loudness contours and auditory weighting functions. The weighting functions agreed closely with dolphin TTS data over the frequency range 3 to 56 kHz (Finneran & Schlundt, 2013); however, the loudness data only exist for frequencies between 2.5 kHz and 113 kHz and cannot be used to estimate the shapes of loudness contours and weighting functions at lower frequencies.
2.7 Equal Latency Data
Reaction times to acoustic tones have been measured in several marine mammal species and used to derive equal latency contours and weighting functions (Mulsow et al., 2015; Reichmuth et al., 2013; Wensveen et al., 2014). Unlike the dolphin equal loudness data, the latency data extend to frequencies below 1 kHz and may be used to estimate the slopes of auditory
weighting functions at lower frequencies (Figure 2-8Figure 2-1).
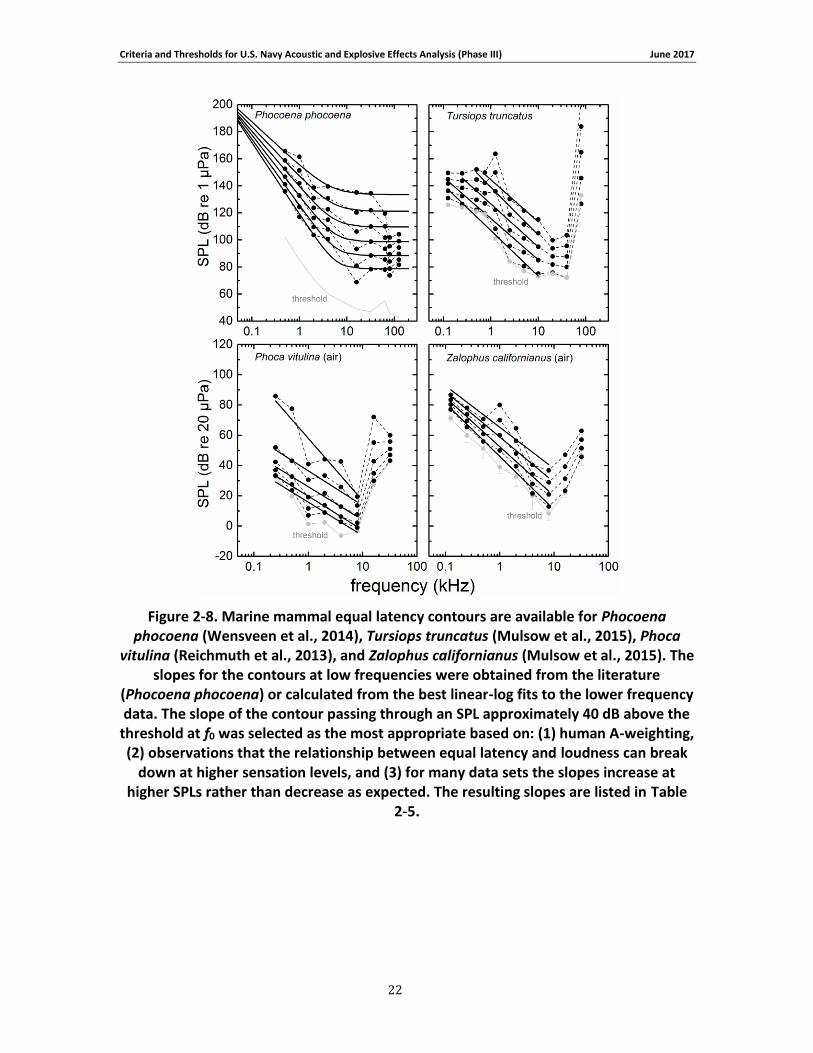
Criteria and Thresholds for U.S. Navy Acoustic and Explosive Effects Analysis (Phase III) June 2017
22
Figure 2-8. Marine mammal equal latency contours are available for Phocoena phocoena (Wensveen et al., 2014), Tursiops truncatus (Mulsow et al., 2015), Phoca
vitulina (Reichmuth et al., 2013), and Zalophus californianus (Mulsow et al., 2015). The slopes for the contours at low frequencies were obtained from the literature
(Phocoena phocoena) or calculated from the best linear-log fits to the lower frequency data. The slope of the contour passing through an SPL approximately 40 dB above the
threshold at f0 was selected as the most appropriate based on: (1) human A-weighting, (2) observations that the relationship between equal latency and loudness can break
down at higher sensation levels, and (3) for many data sets the slopes increase at higher SPLs rather than decrease as expected. The resulting slopes are listed in Table
2-5.
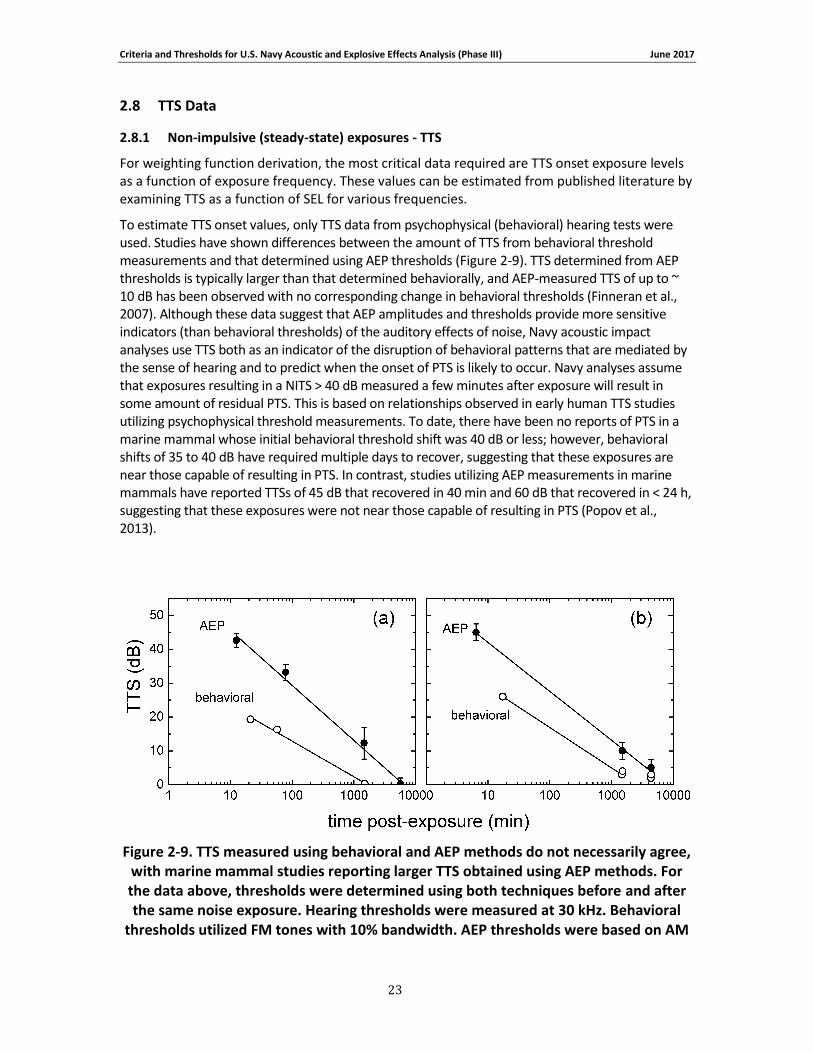
Criteria and Thresholds for U.S. Navy Acoustic and Explosive Effects Analysis (Phase III) June 2017
23
2.8 TTS Data
2.8.1 Non-impulsive (steady-state) exposures - TTS
For weighting function derivation, the most critical data required are TTS onset exposure levels as a function of exposure frequency. These values can be estimated from published literature by examining TTS as a function of SEL for various frequencies.
To estimate TTS onset values, only TTS data from psychophysical (behavioral) hearing tests were used. Studies have shown differences between the amount of TTS from behavioral threshold measurements and that determined using AEP thresholds (Figure 2-9). TTS determined from AEP thresholds is typically larger than that determined behaviorally, and AEP-measured TTS of up to ~ 10 dB has been observed with no corresponding change in behavioral thresholds (Finneran et al., 2007). Although these data suggest that AEP amplitudes and thresholds provide more sensitive indicators (than behavioral thresholds) of the auditory effects of noise, Navy acoustic impact analyses use TTS both as an indicator of the disruption of behavioral patterns that are mediated by the sense of hearing and to predict when the onset of PTS is likely to occur. Navy analyses assume that exposures resulting in a NITS > 40 dB measured a few minutes after exposure will result in some amount of residual PTS. This is based on relationships observed in early human TTS studies utilizing psychophysical threshold measurements. To date, there have been no reports of PTS in a marine mammal whose initial behavioral threshold shift was 40 dB or less; however, behavioral shifts of 35 to 40 dB have required multiple days to recover, suggesting that these exposures are near those capable of resulting in PTS. In contrast, studies utilizing AEP measurements in marine mammals have reported TTSs of 45 dB that recovered in 40 min and 60 dB that recovered in < 24 h, suggesting that these exposures were not near those capable of resulting in PTS (Popov et al., 2013).
Figure 2-9. TTS measured using behavioral and AEP methods do not necessarily agree, with marine mammal studies reporting larger TTS obtained using AEP methods. For the data above, thresholds were determined using both techniques before and after the same noise exposure. Hearing thresholds were measured at 30 kHz. Behavioral
thresholds utilized FM tones with 10% bandwidth. AEP thresholds were based on AM
Criteria and Thresholds for U.S. Navy Acoustic and Explosive Effects Analysis (Phase III) June 2017
24
tones with a modulation frequency of 1.05 kHz. Noise exposures consisted of (a) a single, 20-kHz tone with duration of 64 s and SPL of 185 dB re 1 μPa (SEL = 203 dB re 1
μPa2s) and (b) three 16-s tones at 20 kHz, with mean SPL = 193 dB re 1 μPa (cumulative SEL = 210 dB re 1 μPa2s). Data from Finneran et al. (2007).
To determine TTS onset for each subject, the amount of TTS observed after exposures with different SPLs and durations were combined to create a single TTS growth curve as a function of SEL. The use of (cumulative) SEL is a simplifying assumption to accommodate sounds of various SPLs, durations, and duty cycles. This is referred to as an “equal energy” approach, since SEL is related to the energy of the sound and this approach assumes exposures with equal SEL result in equal effects, regardless of the duration or duty cycle of the sound. It is well-known that the equal energy rule will over-estimate the effects of intermittent noise, since the quiet periods between noise exposures will allow some recovery of hearing compared to noise that is continuously present with the same total SEL (Ward, 1997). For continuous exposures with the same SEL but different durations, the exposure with the longer duration will also tend to produce more TTS (Finneran et al., 2010a; Kastak et al., 2007; Mooney et al., 2009). Despite these limitations, however, the equal energy rule is still a useful concept, since it includes the effects of both noise amplitude and duration when predicting auditory effects. SEL is a simple metric, allows the effects of multiple noise sources to be combined in a meaningful way, has physical significance, and is correlated with most TTS growth data reasonably well — in some cases even across relatively large ranges of exposure duration see (Finneran, 2015). The use of cumulative SEL for Navy sources will always over-estimate the effects of intermittent or interrupted sources, and the majority of Navy sources feature durations shorter than the exposure durations typically utilized in marine mammal TTS studies, therefore the use of (cumulative) SEL will tend to over-estimate the effects of many Navy sound sources.
Marine mammal studies have shown that the amount of TTS increases with SEL in an accelerating fashion: At low exposure SELs, the amount of TTS is small and the growth curves have shallow slopes. At higher SELs, the growth curves become steeper and approach linear relationships with the noise SEL. Accordingly, TTS growth data were fit with the function
, (10)
where t is the amount of TTS, L is the SEL, and m1 and m2 are fitting parameters. This particular function has an increasing slope when L < m2 and approaches a linear relationship for L > m2 (Maslen, 1981). The linear portion of the curve has a slope of m1/10 and an x-intercept of m2. After fitting Eq. (10) to the TTS growth data, interpolation was used to estimate the SEL necessary to induce 6 dB of TTS — defined as the “onset of TTS” for Navy acoustic impact analyses. The value of 6 dB has been historically used to distinguish non-trivial amounts of TTS from fluctuations in threshold measurements that typically occur across test sessions. Extrapolation was not performed when estimating TTS onset; this means only data sets with exposures producing TTS both above and below 6 dB were used.
Figure 2-10 through Figure 2-13 show all behavioral and AEP TTS data to which growth curves defined by Eq. (10) could be fit. The TTS onset exposure values, growth rates, and references to
these data are provided in Table 2-6.
t(L) = m1 log10 1+10(L-m2 )/10éë ùû
Criteria and Thresholds for U.S. Navy Acoustic and Explosive Effects Analysis (Phase III) June 2017
25
2.8.2 Non-impulsive (steady-state) exposures - PTS
Since no studies have been designed to intentionally induce PTS in marine mammals (but see Kastak et al., 2008), onset-PTS levels for marine mammals must be estimated. Differences in auditory structures and sound propagation and interaction with tissues prevent direct application of numerical thresholds for PTS in terrestrial mammals to marine mammals; however, the inner ears of marine and terrestrial mammals are analogous and certain relationships are expected to hold for both groups. Experiments with marine mammals have revealed similarities between marine and terrestrial mammals with respect to features such as TTS, age-related hearing loss, ototoxic drug-induced hearing loss, masking, and frequency selectivity (Finneran et al., 2005a) Nachtigall et al. 2000. For this reason, relationships between TTS and PTS from marine and terrestrial mammals can be used, along with TTS onset values for marine mammals, to estimate exposures likely to produce PTS in marine mammals (Southall et al., 2007).
A variety of terrestrial and marine mammal data sources (Kryter et al., 1965; Miller et al., 1963; Ward, 1960; Ward et al., 1958, 1959) indicate that threshold shifts up to 40 to 50 dB may be induced without PTS, and that 40 dB is a conservative upper limit for threshold shift to prevent PTS; i.e., for impact analysis, 40 dB of NITS is an upper limit for reversibility and that any additional exposure will result in some PTS. This means that 40 dB of TTS, measured a few minutes after exposure, can be used as a conservative estimate for the onset of PTS. An exposure causing 40 dB of TTS is therefore considered equivalent to PTS onset.
To estimate PTS onset, TTS growth curves based on more than 20 dB of measured TTS were extrapolated to determine the SEL required for a TTS of 40 dB. The SEL difference between TTS onset and PTS onset was then calculated. The requirement that the maximum amount of TTS must be at least 20 dB was made to avoid over-estimating PTS onset by using growth curves based on small amounts of TTS, where the growth rates are shallower than at higher amounts of TTS.
2.8.3 Impulsive exposures
Marine mammal TTS data from impulsive sources are limited to two studies with measured TTS of 6 dB or more: Finneran et al. (2002) reported behaviorally-measured TTSs of 6 and 7 dB in a beluga exposed to single impulses from a seismic water gun (unweighted SEL = 186 dB re 1 μPa2s, peak SPL = 224 dB re 1 μPa) and Lucke et al. (2009) reported AEP-measured TTS of 7 to 20 dB in a harbor porpoise exposed to single impulses from a seismic air gun (Figure 2-12 (g), TTS onset = unweighted SEL of 162 dB re 1 μPa2s or peak SPL of 195 dB re 1 μPa). The small reported amounts of TTS and/or the limited distribution of exposures prevent these data from being used to estimate PTS onset.
In addition to these data, Kastelein et al. (2015a) reported behaviorally-measured mean TTS of 4 dB at 8 kHz and 2 dB at 4 kHz after a harbor porpoise was exposed to a series of impulsive sounds produced by broadcasting underwater recordings of impact pile driving strikes through underwater sound projectors. The exposure contained 2760 individual impulses presented at an interval of 1.3 s (total exposure time was 1 h). The average single-strike, unweighted SEL was approximately 146 dB re 1 μPa2s and the cumulative (unweighted) SEL was approximately 180 dB re 1 μPa2s. The pressure waveforms for the simulated pile strikes exhibited significant “ringing” not present in the original recordings and most of the energy in the broadcasts was between 500 and 800 Hz, near the resonance of the underwater sound projector used to
Criteria and Thresholds for U.S. Navy Acoustic and Explosive Effects Analysis (Phase III) June 2017
26
broadcast the signal. As a result, some questions exist regarding whether the fatiguing signals were representative of underwater pressure signatures from impact pile driving.
Several impulsive noise exposure studies have also been conducted without measurable (behavioral) TTS. Finneran et al. (2000) exposed dolphins and belugas to single impulses from an “explosion simulator” (maximum unweighted SEL = 179 dB re 1 μPa2s, peak SPL = 217 dB re 1 μPa) and Finneran et al. (2015) exposed three dolphins to sequences of 10 impulses from a seismic airgun (maximum unweighted cumulative SEL = 193 to 195 dB re 1 μPa2s, peak SPL =196 to 210 dB re 1 μPa) without measurable TTS. Finneran et al. (2003b) exposed two sea lions to single impulses from an arc-gap transducer with no measurable TTS (maximum unweighted SEL = 163 dB re 1 μPa2s, peak SPL = 203 dB re 1 μPa). Reichmuth et al. (2016) exposed two spotted seals (Phoca largha) and two ringed seals (Pusa hispida) to single impulses from a 10 in3 sleeve airgun with no measurable TTS (maximum unweighted SEL = 181 dB re 1 μPa2s, peak SPL ~ 203 dB re 1 μPa).
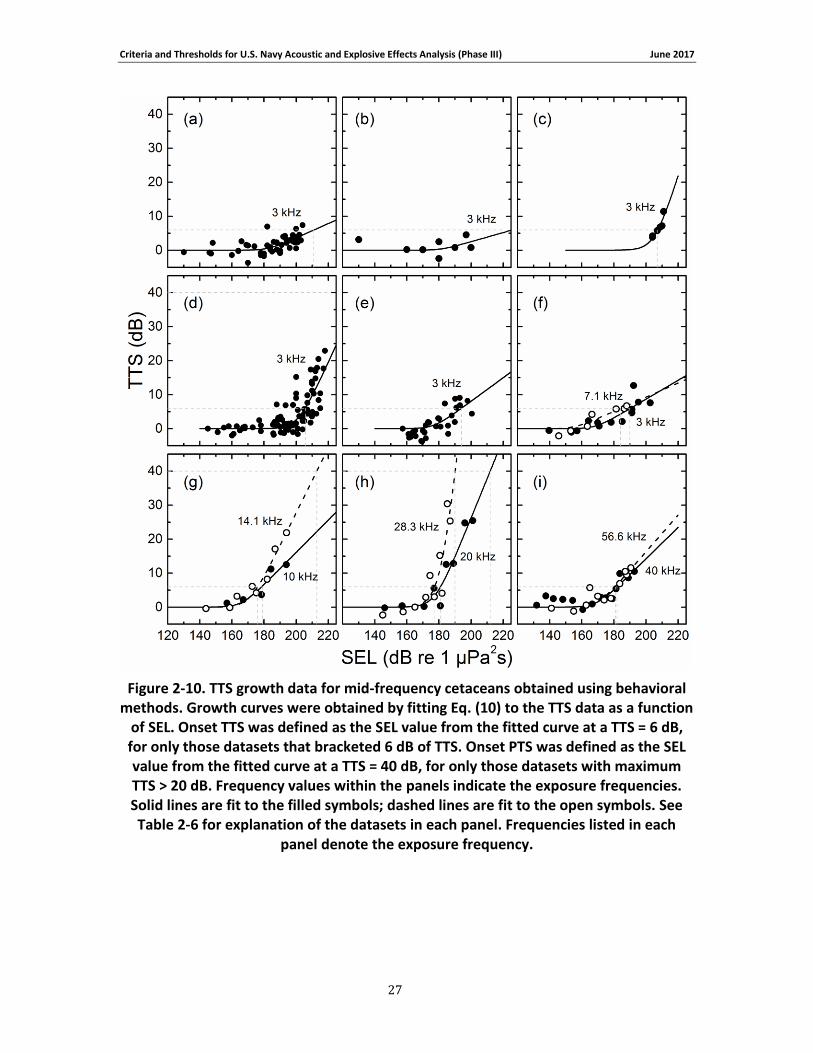
Criteria and Thresholds for U.S. Navy Acoustic and Explosive Effects Analysis (Phase III) June 2017
27
Figure 2-10. TTS growth data for mid-frequency cetaceans obtained using behavioral methods. Growth curves were obtained by fitting Eq. (10) to the TTS data as a function
of SEL. Onset TTS was defined as the SEL value from the fitted curve at a TTS = 6 dB, for only those datasets that bracketed 6 dB of TTS. Onset PTS was defined as the SEL value from the fitted curve at a TTS = 40 dB, for only those datasets with maximum TTS > 20 dB. Frequency values within the panels indicate the exposure frequencies. Solid lines are fit to the filled symbols; dashed lines are fit to the open symbols. See Table 2-6 for explanation of the datasets in each panel. Frequencies listed in each
panel denote the exposure frequency.
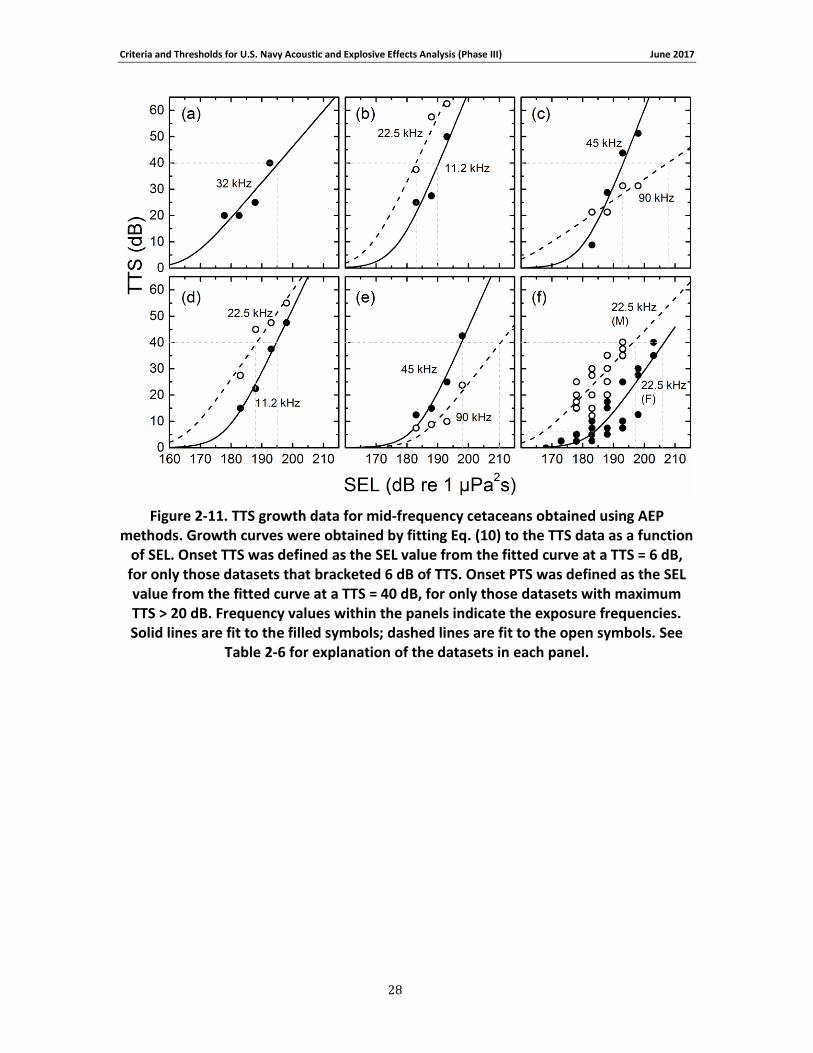
Criteria and Thresholds for U.S. Navy Acoustic and Explosive Effects Analysis (Phase III) June 2017
28
Figure 2-11. TTS growth data for mid-frequency cetaceans obtained using AEP methods. Growth curves were obtained by fitting Eq. (10) to the TTS data as a function
of SEL. Onset TTS was defined as the SEL value from the fitted curve at a TTS = 6 dB, for only those datasets that bracketed 6 dB of TTS. Onset PTS was defined as the SEL value from the fitted curve at a TTS = 40 dB, for only those datasets with maximum TTS > 20 dB. Frequency values within the panels indicate the exposure frequencies. Solid lines are fit to the filled symbols; dashed lines are fit to the open symbols. See
Table 2-6 for explanation of the datasets in each panel.
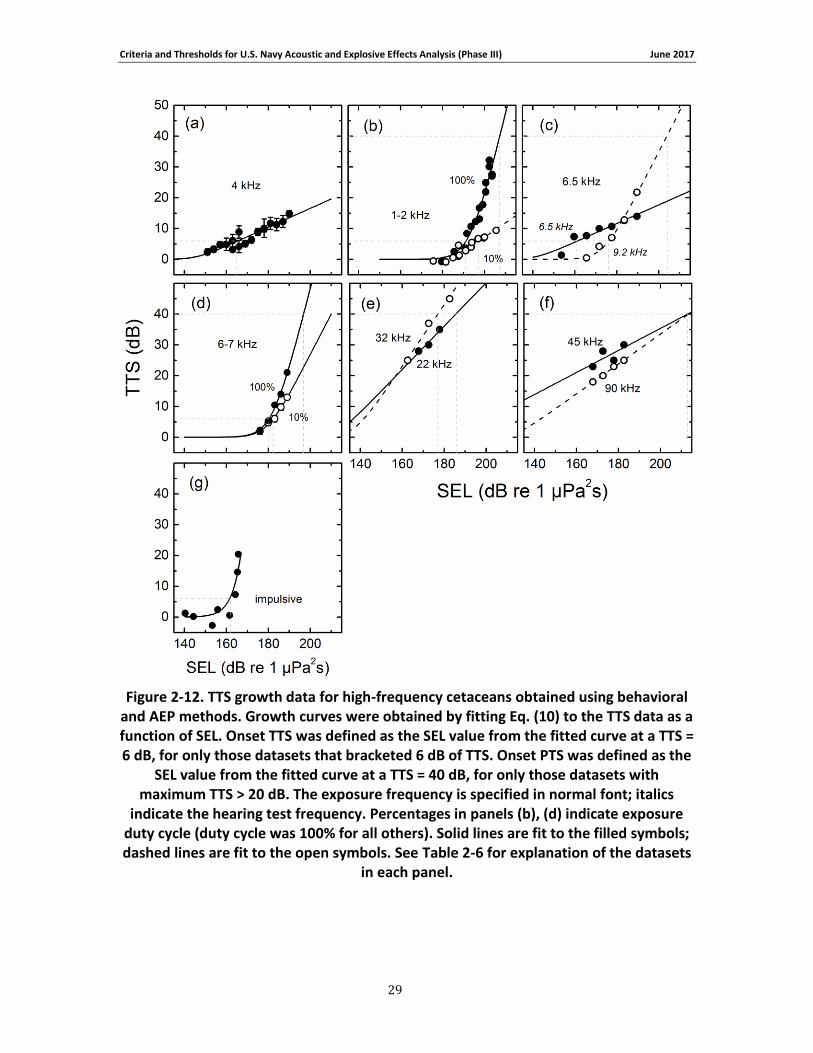
Criteria and Thresholds for U.S. Navy Acoustic and Explosive Effects Analysis (Phase III) June 2017
29
Figure 2-12. TTS growth data for high-frequency cetaceans obtained using behavioral and AEP methods. Growth curves were obtained by fitting Eq. (10) to the TTS data as a function of SEL. Onset TTS was defined as the SEL value from the fitted curve at a TTS = 6 dB, for only those datasets that bracketed 6 dB of TTS. Onset PTS was defined as the
SEL value from the fitted curve at a TTS = 40 dB, for only those datasets with maximum TTS > 20 dB. The exposure frequency is specified in normal font; italics
indicate the hearing test frequency. Percentages in panels (b), (d) indicate exposure duty cycle (duty cycle was 100% for all others). Solid lines are fit to the filled symbols; dashed lines are fit to the open symbols. See Table 2-6 for explanation of the datasets
in each panel.

Criteria and Thresholds for U.S. Navy Acoustic and Explosive Effects Analysis (Phase III) June 2017
30
Figure 2-13. TTS growth data for pinnipeds obtained using behavioral methods. Growth curves were obtained by fitting Eq. (10) to the TTS data as a function of SEL. Onset TTS was defined as the SEL value from the fitted curve at a TTS = 6 dB, for only
those datasets that bracketed 6 dB of TTS. Onset PTS was defined as the SEL value from the fitted curve at a TTS = 40 dB, for only those datasets with maximum TTS > 20
dB. Frequency values within the panels indicate the exposure frequencies. Numeric values in panel (c) indicate subjects 01 and 02. Solid lines are fit to the filled symbols; dashed lines are fit to the open symbols. See for Table 2-6 explanation of the datasets
in each panel.
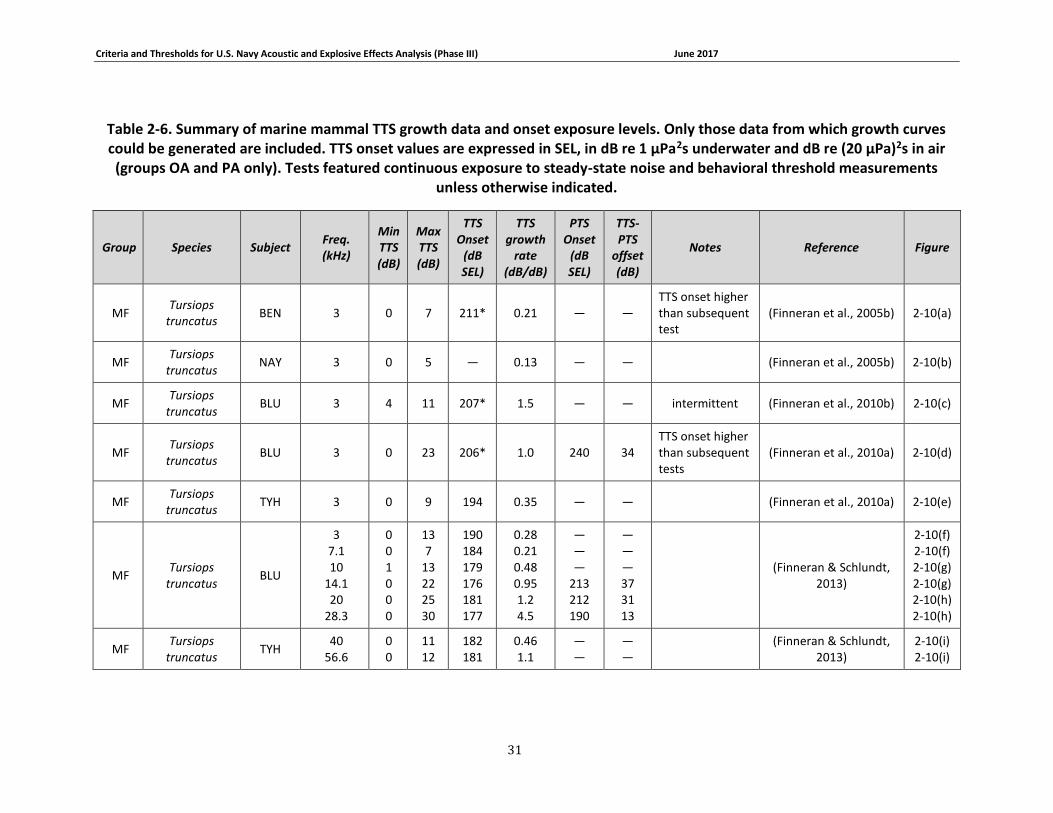
Criteria and Thresholds for U.S. Navy Acoustic and Explosive Effects Analysis (Phase III) June 2017
31
Table 2-6. Summary of marine mammal TTS growth data and onset exposure levels. Only those data from which growth curves could be generated are included. TTS onset values are expressed in SEL, in dB re 1 μPa2s underwater and dB re (20 μPa)2s in air
(groups OA and PA only). Tests featured continuous exposure to steady-state noise and behavioral threshold measurements unless otherwise indicated.
Group Species Subject Freq. (kHz)
Min TTS (dB)
Max TTS (dB)
TTS Onset
(dB SEL)
TTS growth
rate (dB/dB)
PTS Onset
(dB SEL)
TTS-PTS
offset (dB)
Notes Reference Figure
MF Tursiops
truncatus BEN 3 0 7 211* 0.21 — —
TTS onset higher than subsequent test
(Finneran et al., 2005b) 2-10(a)
MF Tursiops
truncatus NAY 3 0 5 — 0.13 — — (Finneran et al., 2005b) 2-10(b)
MF Tursiops
truncatus BLU 3 4 11 207* 1.5 — — intermittent (Finneran et al., 2010b) 2-10(c)
MF Tursiops
truncatus BLU 3 0 23 206* 1.0 240 34
TTS onset higher than subsequent tests
(Finneran et al., 2010a) 2-10(d)
MF Tursiops
truncatus TYH 3 0 9 194 0.35 — — (Finneran et al., 2010a) 2-10(e)
MF Tursiops
truncatus BLU
3 7.1 10
14.1 20
28.3
0 0 1 0 0 0
13 7
13 22 25 30
190 184 179 176 181 177
0.28 0.21 0.48 0.95 1.2 4.5
— — —
213 212 190
— — — 37 31 13
(Finneran & Schlundt,
2013)
2-10(f) 2-10(f) 2-10(g) 2-10(g) 2-10(h) 2-10(h)
MF Tursiops
truncatus TYH
40 56.6
0 0
11 12
182 181
0.46 1.1
— —
— —
(Finneran & Schlundt,
2013) 2-10(i) 2-10(i)
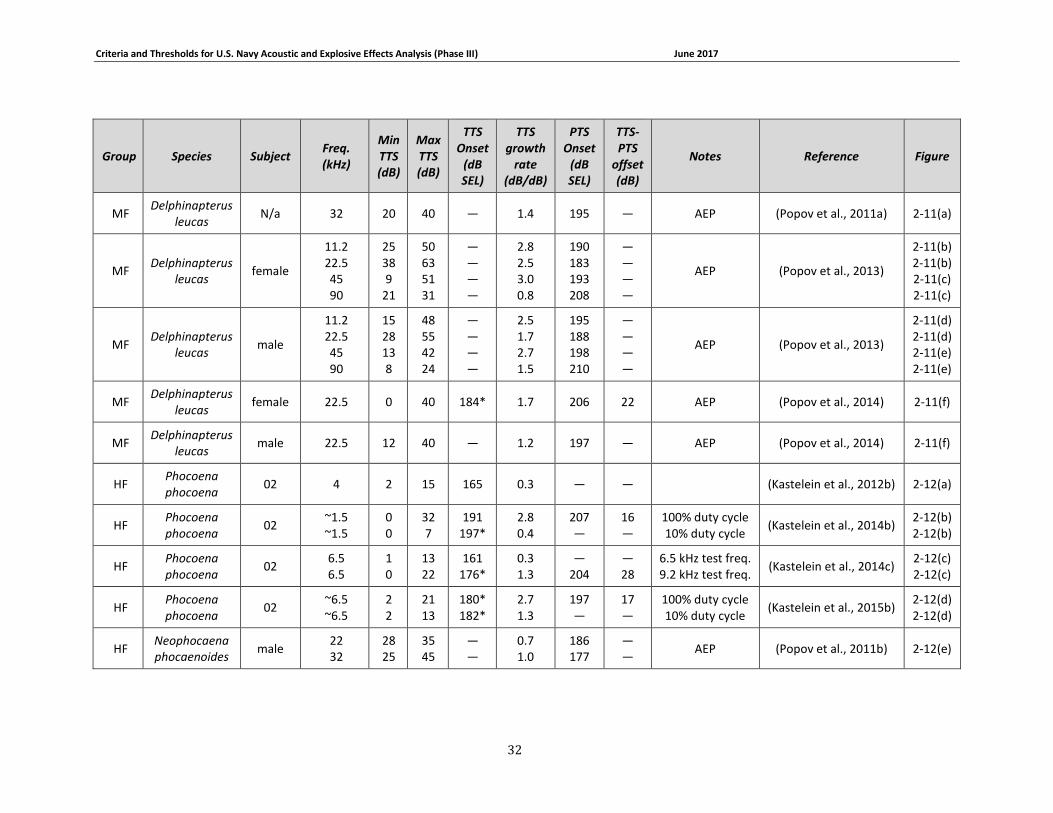
Criteria and Thresholds for U.S. Navy Acoustic and Explosive Effects Analysis (Phase III) June 2017
32
Group Species Subject Freq. (kHz)
Min TTS (dB)
Max TTS (dB)
TTS Onset
(dB SEL)
TTS growth
rate (dB/dB)
PTS Onset
(dB SEL)
TTS-PTS
offset (dB)
Notes Reference Figure
MF Delphinapterus
leucas N/a 32 20 40 — 1.4 195 — AEP (Popov et al., 2011a) 2-11(a)
MF Delphinapterus
leucas female
11.2 22.5 45 90
25 38 9
21
50 63 51 31
— — — —
2.8 2.5 3.0 0.8
190 183 193 208
— — — —
AEP (Popov et al., 2013)
2-11(b) 2-11(b) 2-11(c) 2-11(c)
MF Delphinapterus
leucas male
11.2 22.5 45 90
15 28 13 8
48 55 42 24
— — — —
2.5 1.7 2.7 1.5
195 188 198 210
— — — —
AEP (Popov et al., 2013)
2-11(d) 2-11(d) 2-11(e) 2-11(e)
MF Delphinapterus
leucas female 22.5 0 40 184* 1.7 206 22 AEP (Popov et al., 2014) 2-11(f)
MF Delphinapterus
leucas male 22.5 12 40 — 1.2 197 — AEP (Popov et al., 2014) 2-11(f)
HF Phocoena phocoena
02 4 2 15 165 0.3 — — (Kastelein et al., 2012b) 2-12(a)
HF Phocoena phocoena
02 ~1.5 ~1.5
0 0
32 7
191 197*
2.8 0.4
207 —
16 —
100% duty cycle 10% duty cycle
(Kastelein et al., 2014b) 2-12(b) 2-12(b)
HF Phocoena phocoena
02 6.5 6.5
1 0
13 22
161 176*
0.3 1.3
— 204
— 28
6.5 kHz test freq. 9.2 kHz test freq.
(Kastelein et al., 2014c) 2-12(c) 2-12(c)
HF Phocoena phocoena
02 ~6.5 ~6.5
2 2
21 13
180* 182*
2.7 1.3
197 —
17 —
100% duty cycle 10% duty cycle
(Kastelein et al., 2015b) 2-12(d) 2-12(d)
HF Neophocaena phocaenoides
male 22 32
28 25
35 45
— —
0.7 1.0
186 177
— —
AEP (Popov et al., 2011b) 2-12(e)
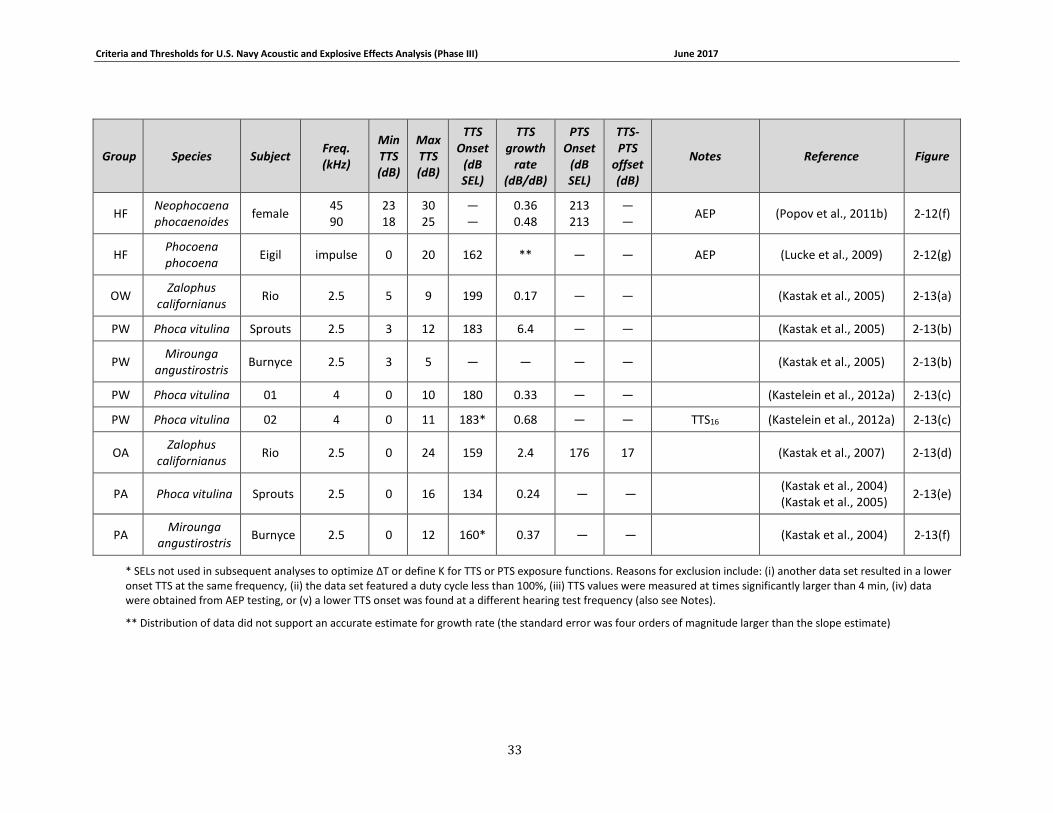
Criteria and Thresholds for U.S. Navy Acoustic and Explosive Effects Analysis (Phase III) June 2017
33
Group Species Subject Freq. (kHz)
Min TTS (dB)
Max TTS (dB)
TTS Onset
(dB SEL)
TTS growth
rate (dB/dB)
PTS Onset
(dB SEL)
TTS-PTS
offset (dB)
Notes Reference Figure
HF Neophocaena phocaenoides
female 45 90
23 18
30 25
— —
0.36 0.48
213 213
— —
AEP (Popov et al., 2011b) 2-12(f)
HF Phocoena phocoena
Eigil impulse 0 20 162 ** — — AEP (Lucke et al., 2009) 2-12(g)
OW Zalophus
californianus Rio 2.5 5 9 199 0.17 — — (Kastak et al., 2005) 2-13(a)
PW Phoca vitulina Sprouts 2.5 3 12 183 6.4 — — (Kastak et al., 2005) 2-13(b)
PW Mirounga
angustirostris Burnyce 2.5 3 5 — — — — (Kastak et al., 2005) 2-13(b)
PW Phoca vitulina 01 4 0 10 180 0.33 — — (Kastelein et al., 2012a) 2-13(c)
PW Phoca vitulina 02 4 0 11 183* 0.68 — — TTS16 (Kastelein et al., 2012a) 2-13(c)
OA Zalophus
californianus Rio 2.5 0 24 159 2.4 176 17 (Kastak et al., 2007) 2-13(d)
PA Phoca vitulina Sprouts 2.5 0 16 134 0.24 — — (Kastak et al., 2004) (Kastak et al., 2005)
2-13(e)
PA Mirounga
angustirostris Burnyce 2.5 0 12 160* 0.37 — — (Kastak et al., 2004) 2-13(f)
* SELs not used in subsequent analyses to optimize ΔT or define K for TTS or PTS exposure functions. Reasons for exclusion include: (i) another data set resulted in a lower onset TTS at the same frequency, (ii) the data set featured a duty cycle less than 100%, (iii) TTS values were measured at times significantly larger than 4 min, (iv) data were obtained from AEP testing, or (v) a lower TTS onset was found at a different hearing test frequency (also see Notes).
** Distribution of data did not support an accurate estimate for growth rate (the standard error was four orders of magnitude larger than the slope estimate)
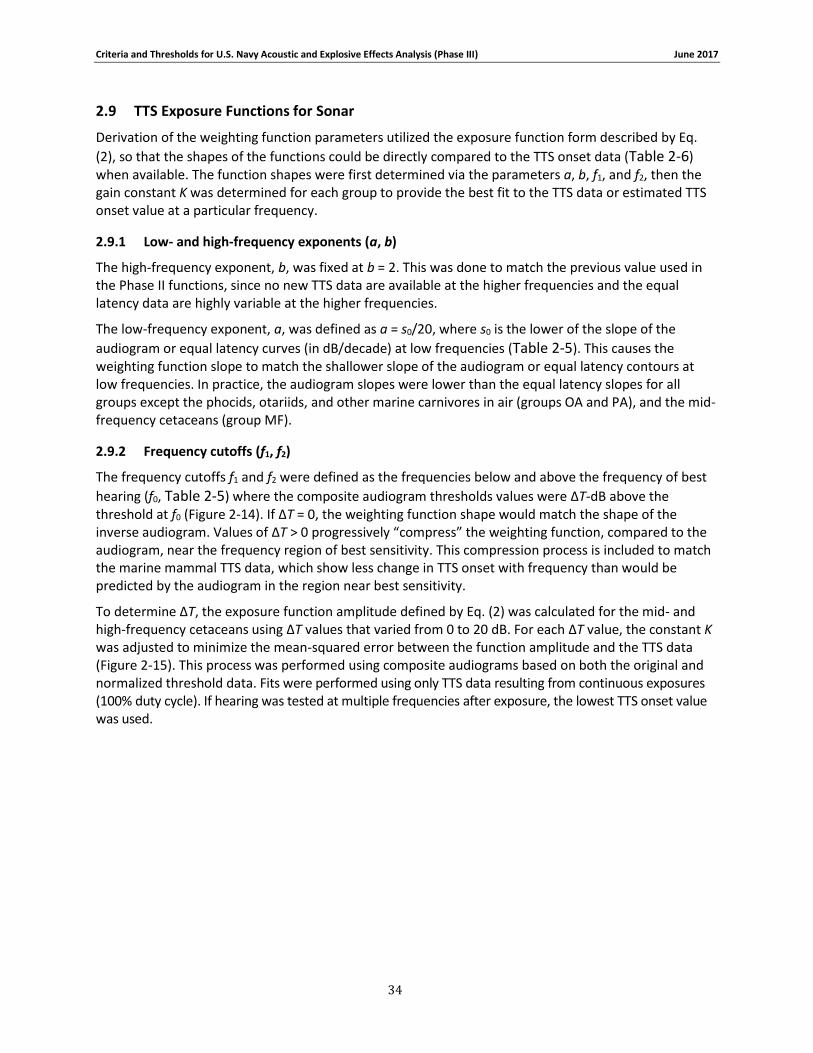
Criteria and Thresholds for U.S. Navy Acoustic and Explosive Effects Analysis (Phase III) June 2017
34
2.9 TTS Exposure Functions for Sonar
Derivation of the weighting function parameters utilized the exposure function form described by Eq.
(2), so that the shapes of the functions could be directly compared to the TTS onset data (Table 2-6) when available. The function shapes were first determined via the parameters a, b, f1, and f2, then the gain constant K was determined for each group to provide the best fit to the TTS data or estimated TTS onset value at a particular frequency.
2.9.1 Low- and high-frequency exponents (a, b)
The high-frequency exponent, b, was fixed at b = 2. This was done to match the previous value used in the Phase II functions, since no new TTS data are available at the higher frequencies and the equal latency data are highly variable at the higher frequencies.
The low-frequency exponent, a, was defined as a = s0/20, where s0 is the lower of the slope of the
audiogram or equal latency curves (in dB/decade) at low frequencies (Table 2-5). This causes the weighting function slope to match the shallower slope of the audiogram or equal latency contours at low frequencies. In practice, the audiogram slopes were lower than the equal latency slopes for all groups except the phocids, otariids, and other marine carnivores in air (groups OA and PA), and the mid-frequency cetaceans (group MF).
2.9.2 Frequency cutoffs (f1, f2)
The frequency cutoffs f1 and f2 were defined as the frequencies below and above the frequency of best
hearing (f0, Table 2-5) where the composite audiogram thresholds values were ΔT-dB above the threshold at f0 (Figure 2-14). If ΔT = 0, the weighting function shape would match the shape of the inverse audiogram. Values of ΔT > 0 progressively “compress” the weighting function, compared to the audiogram, near the frequency region of best sensitivity. This compression process is included to match the marine mammal TTS data, which show less change in TTS onset with frequency than would be predicted by the audiogram in the region near best sensitivity.
To determine ΔT, the exposure function amplitude defined by Eq. (2) was calculated for the mid- and high-frequency cetaceans using ΔT values that varied from 0 to 20 dB. For each ΔT value, the constant K was adjusted to minimize the mean-squared error between the function amplitude and the TTS data (Figure 2-15). This process was performed using composite audiograms based on both the original and normalized threshold data. Fits were performed using only TTS data resulting from continuous exposures (100% duty cycle). If hearing was tested at multiple frequencies after exposure, the lowest TTS onset value was used.
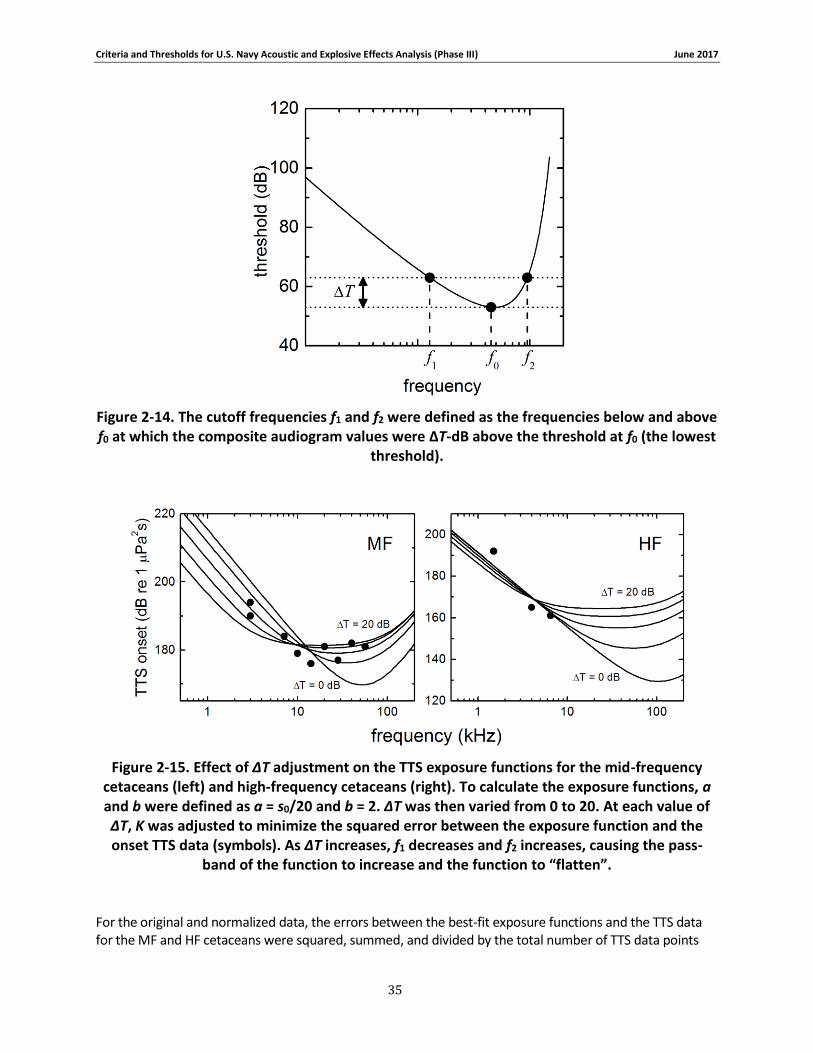
Criteria and Thresholds for U.S. Navy Acoustic and Explosive Effects Analysis (Phase III) June 2017
35
Figure 2-14. The cutoff frequencies f1 and f2 were defined as the frequencies below and above f0 at which the composite audiogram values were ΔT-dB above the threshold at f0 (the lowest
threshold).
Figure 2-15. Effect of ΔT adjustment on the TTS exposure functions for the mid-frequency cetaceans (left) and high-frequency cetaceans (right). To calculate the exposure functions, a and b were defined as a = s0/20 and b = 2. ΔT was then varied from 0 to 20. At each value of ΔT, K was adjusted to minimize the squared error between the exposure function and the onset TTS data (symbols). As ΔT increases, f1 decreases and f2 increases, causing the pass-
band of the function to increase and the function to “flatten”.
For the original and normalized data, the errors between the best-fit exposure functions and the TTS data for the MF and HF cetaceans were squared, summed, and divided by the total number of TTS data points
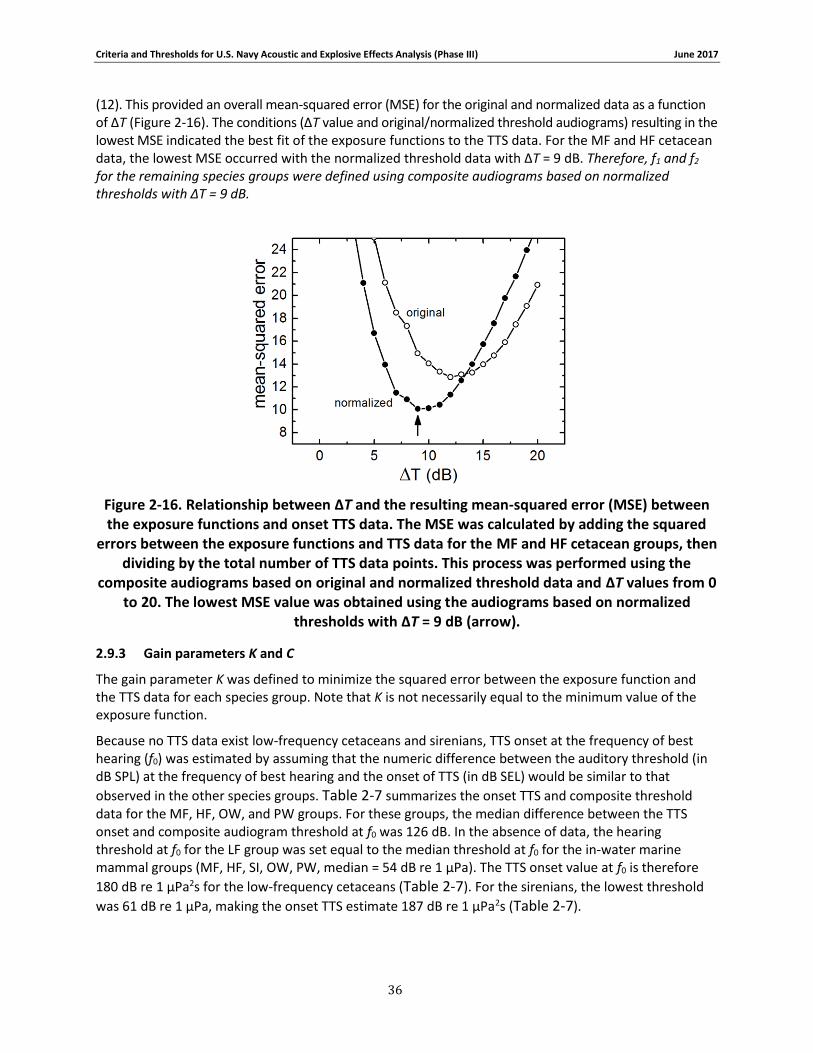
Criteria and Thresholds for U.S. Navy Acoustic and Explosive Effects Analysis (Phase III) June 2017
36
(12). This provided an overall mean-squared error (MSE) for the original and normalized data as a function of ΔT (Figure 2-16). The conditions (ΔT value and original/normalized threshold audiograms) resulting in the lowest MSE indicated the best fit of the exposure functions to the TTS data. For the MF and HF cetacean data, the lowest MSE occurred with the normalized threshold data with ΔT = 9 dB. Therefore, f1 and f2 for the remaining species groups were defined using composite audiograms based on normalized thresholds with ΔT = 9 dB.
Figure 2-16. Relationship between ΔT and the resulting mean-squared error (MSE) between the exposure functions and onset TTS data. The MSE was calculated by adding the squared
errors between the exposure functions and TTS data for the MF and HF cetacean groups, then dividing by the total number of TTS data points. This process was performed using the
composite audiograms based on original and normalized threshold data and ΔT values from 0 to 20. The lowest MSE value was obtained using the audiograms based on normalized
thresholds with ΔT = 9 dB (arrow).
2.9.3 Gain parameters K and C
The gain parameter K was defined to minimize the squared error between the exposure function and the TTS data for each species group. Note that K is not necessarily equal to the minimum value of the exposure function.
Because no TTS data exist low-frequency cetaceans and sirenians, TTS onset at the frequency of best hearing (f0) was estimated by assuming that the numeric difference between the auditory threshold (in dB SPL) at the frequency of best hearing and the onset of TTS (in dB SEL) would be similar to that
observed in the other species groups. Table 2-7 summarizes the onset TTS and composite threshold data for the MF, HF, OW, and PW groups. For these groups, the median difference between the TTS onset and composite audiogram threshold at f0 was 126 dB. In the absence of data, the hearing threshold at f0 for the LF group was set equal to the median threshold at f0 for the in-water marine mammal groups (MF, HF, SI, OW, PW, median = 54 dB re 1 μPa). The TTS onset value at f0 is therefore
180 dB re 1 μPa2s for the low-frequency cetaceans (Table 2-7). For the sirenians, the lowest threshold
was 61 dB re 1 μPa, making the onset TTS estimate 187 dB re 1 μPa2s (Table 2-7).

Criteria and Thresholds for U.S. Navy Acoustic and Explosive Effects Analysis (Phase III) June 2017
37
Table 2-7. Differences between composite threshold values (Figure 2-5) and TTS onset values at the frequency of best hearing (f0) for the in-water marine mammal species groups. The values for the low-frequency cetaceans and sirenians were estimated using the median
difference (126) from the MF, HF, OW, and PW groups.
Group f0
(kHz)
Threshold at f0
(dB re 1 μPa)
TTS onset at f0
(dB re 1 μPa2s) Difference
Estimated difference
Estimated TTS onset at f0 (dB re 1 μPa2s)
LF 5.6 54 126 180
MF 55 54 179 125
HF 105 48 156 108
SI 16 61 126 187
OW 12 67 199 132
PW 8.6 53 181 128
In contrast to the low-frequency cetaceans and sirenians, which are mammals and possess inner ears that are functionally analogous to those of the other marine mammals, sea turtle ears are anatomically different. Even within their best hearing range, sea turtles have low sensitivity, with lowest thresholds about 40 dB higher than those for mid-frequency cetaceans and audiograms more similar to those of fishes without specialized auditory adaptations for higher frequency hearing than to marine mammals. Considering these relationships, a working group (WG) established to determine sound exposure guidelines for fishes and sea turtles concluded (Popper et al., 2014):
Though there has been some discussion of using data from marine mammals to predict turtle responses, it is the view of the WG that, while still unsatisfactory, data from fishes provide a better analogy at this time. The rationale is that the hearing range for turtles much more approximates that of fishes than of any marine mammal, and the functioning of the basilar papilla in the turtle ear is dissimilar to the functioning of the cochlea in mammals.
For these reasons, the gain factor K for sea turtles was estimated using TTS data for fish rather than marine mammals. Using acoustic signals representative of low- and mid-frequency active sonar, Halvorsen et al. (2012; 2013) reported TTS in some, but not all, species of fish exposed to cumulative SELs of approximately 220 dB re 1 μPa2s between 2 and 3 kHz and 210 to 215 dB re 1 μPa2s between 170 and 320 Hz, respectively. Based on these data, Navy Phase III analyses used an SEL of 200 dB re 1 μPa2s as an estimate for TTS onset in sea turtles at an exposure frequency of 200 Hz. Accordingly, the gain factor K was adjusted to set the minimum value of the TTS exposure function for sea turtles to 200 dB re 1 μPa2s.
Once K was determined, the weighted threshold for onset TTS was determined from the minimum value of the exposure function. Finally, the constant C was determined by substituting parameters a, b, f1, and f2 into Eq. (1), then adjusting C so the maximum amplitude of the weighting function was 0 dB; this is equivalent to the difference between the weighted TTS threshold and K [see Eqs. (3)–(8)].
Table 2-8 summarizes the various function parameters, the weighted TTS thresholds, and the goodness of fit values between the TTS exposure functions and the onset TTS data. The various TTS exposure
functions are presented in Figure 2-17Figure 2-20.
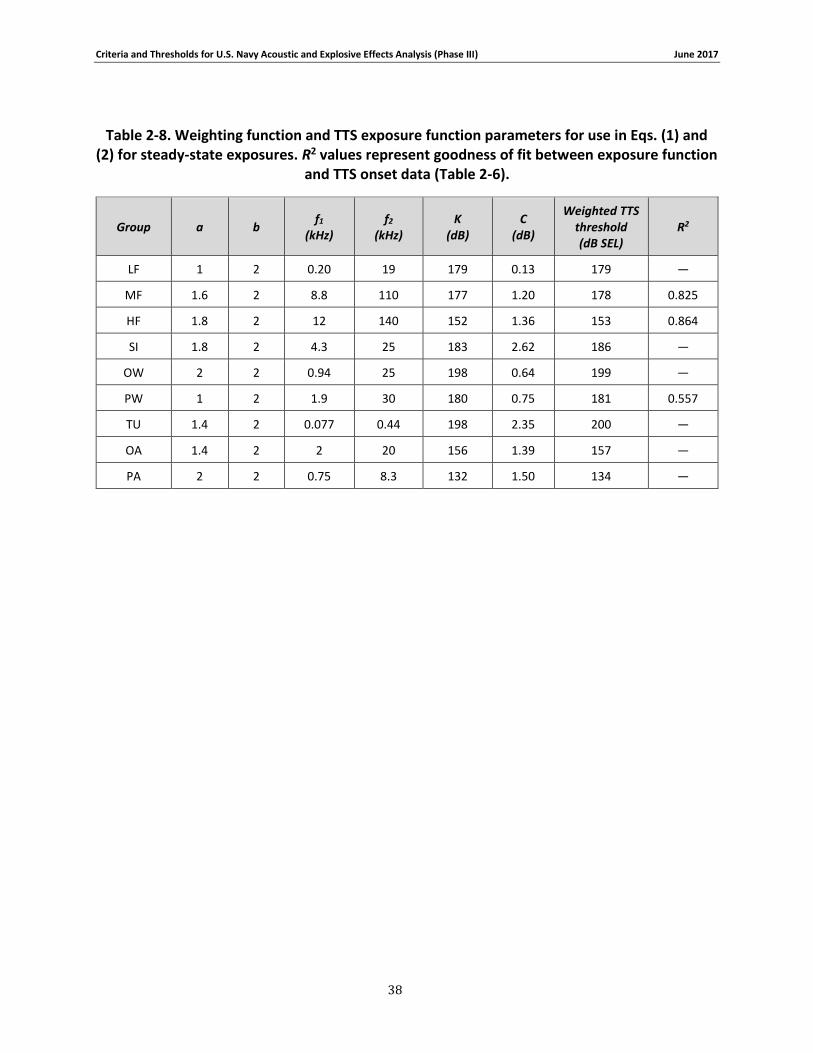
Criteria and Thresholds for U.S. Navy Acoustic and Explosive Effects Analysis (Phase III) June 2017
38
Table 2-8. Weighting function and TTS exposure function parameters for use in Eqs. (1) and (2) for steady-state exposures. R2 values represent goodness of fit between exposure function
and TTS onset data (Table 2-6).
Group a b f1
(kHz) f2
(kHz) K
(dB) C
(dB)
Weighted TTS threshold (dB SEL)
R2
LF 1 2 0.20 19 179 0.13 179 —
MF 1.6 2 8.8 110 177 1.20 178 0.825
HF 1.8 2 12 140 152 1.36 153 0.864
SI 1.8 2 4.3 25 183 2.62 186 —
OW 2 2 0.94 25 198 0.64 199 —
PW 1 2 1.9 30 180 0.75 181 0.557
TU 1.4 2 0.077 0.44 198 2.35 200 —
OA 1.4 2 2 20 156 1.39 157 —
PA 2 2 0.75 8.3 132 1.50 134 —

Criteria and Thresholds for U.S. Navy Acoustic and Explosive Effects Analysis (Phase III) June 2017
39
Figure 2-17. Exposure functions (solid lines) generated from Eq. (2) with the parameters specified in Table 2-7. Dashed lines — (normalized) composite audiograms used for definition
of parameters a, f1, and f2. A constant value was added to each audiogram to equate the minimum audiogram value with the exposure function minimum. Short dashed line — Navy
Phase II exposure functions for TTS onset for each group. Filled symbols — onset TTS exposure data (in dB SEL) used to define exposure function shape and vertical position. Open
symbols — estimated TTS onset for species for which no TTS data exist.
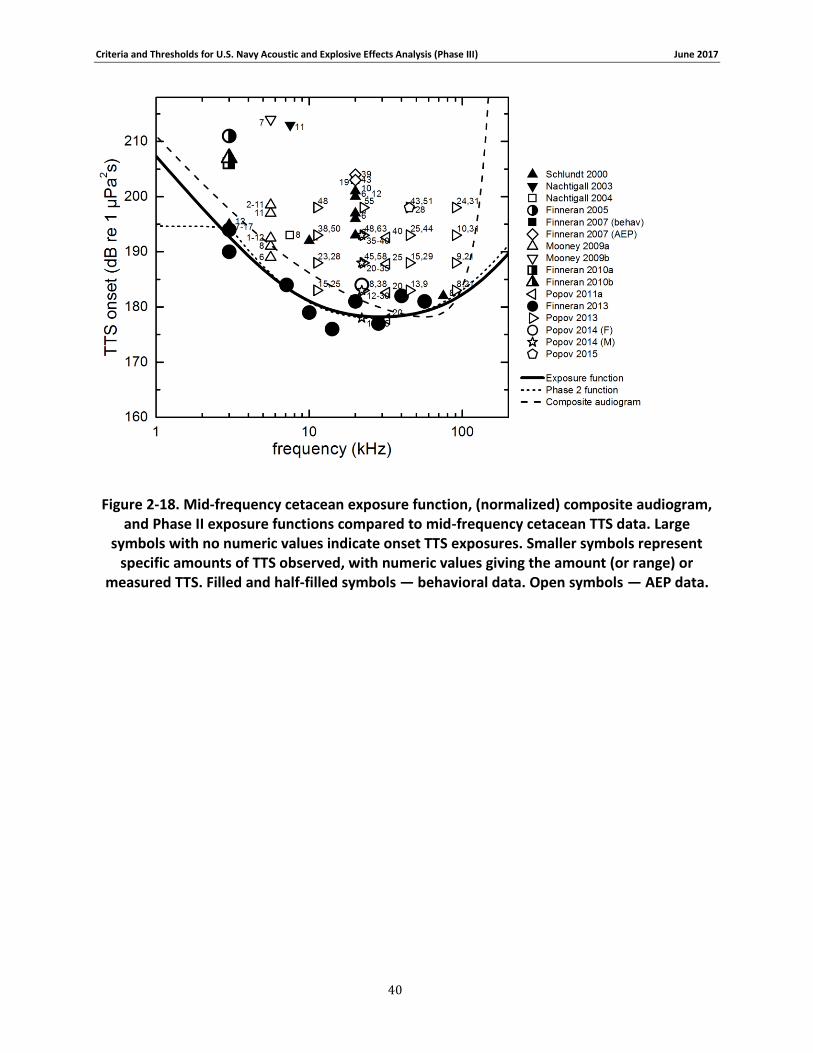
Criteria and Thresholds for U.S. Navy Acoustic and Explosive Effects Analysis (Phase III) June 2017
40
Figure 2-18. Mid-frequency cetacean exposure function, (normalized) composite audiogram, and Phase II exposure functions compared to mid-frequency cetacean TTS data. Large
symbols with no numeric values indicate onset TTS exposures. Smaller symbols represent specific amounts of TTS observed, with numeric values giving the amount (or range) or
measured TTS. Filled and half-filled symbols — behavioral data. Open symbols — AEP data.
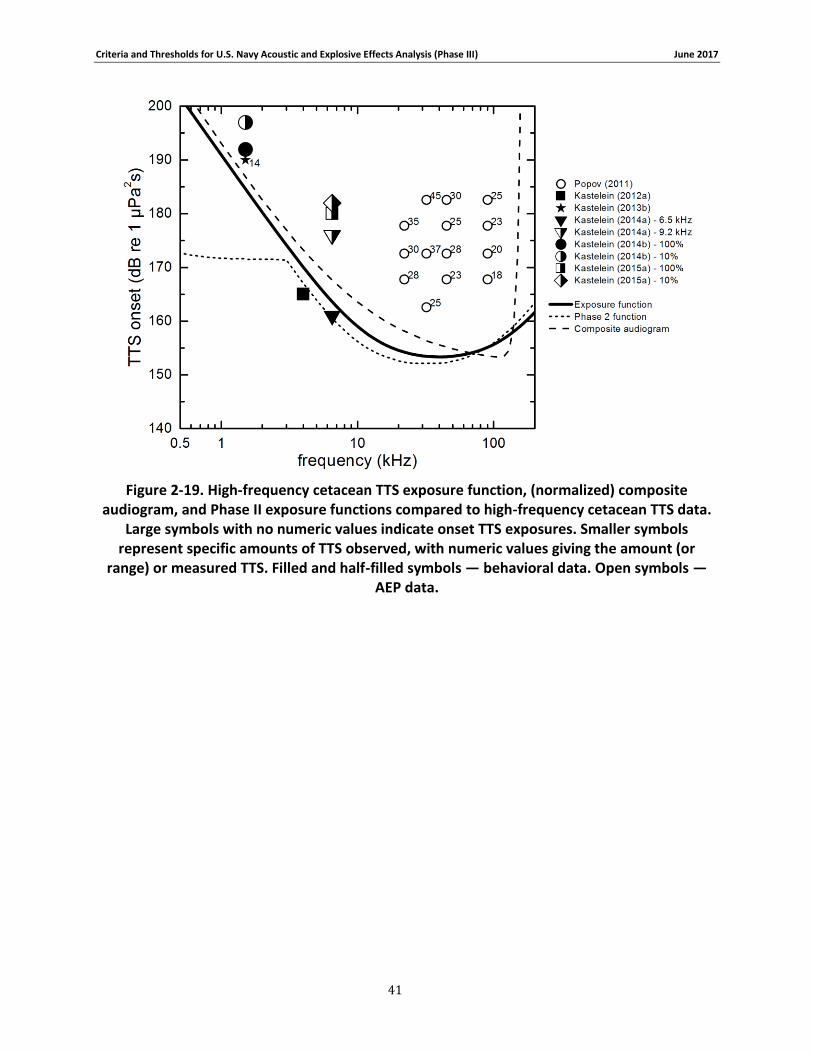
Criteria and Thresholds for U.S. Navy Acoustic and Explosive Effects Analysis (Phase III) June 2017
41
Figure 2-19. High-frequency cetacean TTS exposure function, (normalized) composite audiogram, and Phase II exposure functions compared to high-frequency cetacean TTS data.
Large symbols with no numeric values indicate onset TTS exposures. Smaller symbols represent specific amounts of TTS observed, with numeric values giving the amount (or
range) or measured TTS. Filled and half-filled symbols — behavioral data. Open symbols — AEP data.

Criteria and Thresholds for U.S. Navy Acoustic and Explosive Effects Analysis (Phase III) June 2017
42
Figure 2-20. Phocid (underwater) exposure function, (normalized) composite audiogram, and Phase II exposure functions compared to phocid TTS data. Large symbols with no numeric values indicate onset TTS exposures. Smaller symbols represent specific amounts of TTS
observed, with numeric values giving the amount (or range) or measured TTS.
2.10 PTS Exposure Functions for Sonar
As in previous acoustic effects analyses (Finneran & Jenkins, 2012a; Southall et al., 2007), the shape of the PTS exposure function for each species group is assumed to be identical to the TTS exposure function for that group. Thus, definition of the PTS function only requires the value for the constant K to be determined. This equates to identifying the increase in noise exposure between the onset of TTS and the onset of PTS.
For Phase II, Navy used a 20-dB difference between TTS onset and PTS onset for cetaceans and sea turtles and a 14-dB difference for phocids, otariids, odobenids, mustelids, ursids, and sirenians (Finneran & Jenkins, 2012a). The 20-dB value was based on human data (Ward et al., 1958) and the available marine mammal data, essentially following the extrapolation process proposed by Southall et al. (2007). The 14-dB value was based on a 2.5 dB/dB growth rate reported by Kastak et al. (2007) for a California sea lion tested in air.
For Phase III, a difference of 20 dB between TTS onset and PTS onset is used for all species groups. This is based on estimates of exposure levels actually required for PTS (i.e., 40 dB of TTS) from the marine
mammal TTS growth curves (Table 2-6), which show differences of 13 to 37 dB (mean = 24, median = 22, n = 9) between TTS onset and PTS onset in marine mammals. These data show most differences between TTS onset and PTS onset are larger than 20 dB and all but one value are larger than 14 dB.

Criteria and Thresholds for U.S. Navy Acoustic and Explosive Effects Analysis (Phase III) June 2017
43
The value of K for each PTS exposure function and the weighted PTS threshold are therefore determined by adding 20 dB to the K-value for the TTS exposure function or the TTS weighted threshold, respectively (see Table C.2 in Appendix C).
2.11 TTS/PTS Exposure Functions for Explosives
The shapes of the TTS and PTS exposure functions for explosives and other impulsive sources are identical to those used for sonar and other transducers (i.e., steady-state or non-impulsive noise sources). Thus, defining the TTS and PTS functions only requires the values for the constant K to be determined.
Phase III analyses for TTS and PTS from underwater detonations and other impulsive sources follow the approach proposed by Southall et al. (2007) and used in Phase II analyses (Finneran & Jenkins, 2012a), where a weighted SEL threshold is used in conjunction with an unweighted peak SPL threshold. The threshold producing the greater range for effect is used for estimating the effects of the noise exposure.
Peak SPL and SEL thresholds for TTS were based on TTS data from impulsive sound exposures that produced 6 dB or more TTS for the mid- and high-frequency cetaceans (the only groups for which data are available). The peak SPL thresholds were taken directly from the literature: 224 and 196 dB re 1 μPa,
for the mid- and high-frequency cetaceans, respectively (Table 2-9). The SEL-based thresholds were determined by applying the Phase III weighting functions for the appropriate species groups to the exposure waveforms that produced TTS, then calculating the resulting weighted SELs. When this method is applied to the exposure data from Finneran et al. (2002) and Lucke et al.(2009), the SEL-based weighted TTS thresholds are 170 and 140 dB re 1 μPa2s for the mid- and high-frequency cetaceans,
respectively (Table 2-9). Note that the data from Lucke et al. (2009) are based on AEP measurements and may thus under-estimate TTS onset; however, they are used here because of the very limited nature of the impulse TTS data for marine mammals and the likelihood that the high-frequency cetaceans are more susceptible than the mid-frequency cetaceans (i.e., use of the mid-frequency cetacean value is not appropriate). Based on the limited available data, it is reasonable to assume that the exposures described by Lucke et al.(2009), which produced AEP-measured TTS of up to 20 dB, would have resulted in a behavioral TTS of at least 6 dB.
The harbor porpoise data from Kastelein et al. (2015a) were not used to derive the high-frequency cetacean TTS threshold, since the largest observed TTS was only 4 dB. However, these data provide an opportunity to check the TTS onset proposed for the high-frequency cetacean group. Kastelein et al. (2015a) provide a representative frequency spectrum for a single, simulated pile driving strike at a specific measurement location. When the high-frequency cetacean weighting function is applied to this spectrum and the 1/3-octave SELs combined across frequency, the total weighted SEL for a single strike is found to be 114 dB re 1 μPa2s. For 2760 impulses, the cumulative, weighted SEL would then be 148 dB re 1 μPa2s. The average SEL in the pool was reported to be 9 dB lower than the SEL at the measurement position, thus the average, cumulative weighted SEL would be approximately 139 dB re 1 μPa2s, which compares favorably to the high-frequency cetacean TTS threshold of 140 dB re 1 μPa2s derived from the Lucke et al. (2009) airgun data.
For species groups for which no impulse TTS data exist, the weighted SEL thresholds were estimated using the relationship between the steady-state TTS weighted threshold and the impulse TTS weighted threshold for the groups for which data exist (the mid- and high-frequency cetaceans):
Gs -Gi = Cs -Ci , (11)
Criteria and Thresholds for U.S. Navy Acoustic and Explosive Effects Analysis (Phase III) June 2017
44
where G indicates thresholds for a species group for which impulse TTS data are not available, C indicates the median threshold for the groups for which data exist, the subscript s indicates a steady-state threshold, and the subscript i indicates an impulse threshold (note that since data are only available for the mid- and high-frequency cetaceans the median and mean are identical). Equation (11) is equivalent to the relationship used by Southall et al. (2007), who expressed the relationship as
Cs -Gs = Ci -Gi . For the mid- and high-frequency cetaceans, the steady-state TTS thresholds are 178
and 153 dB re 1 μPa2s (Table 2-8), respectively, and the impulse TTS thresholds are 170 and 140 dB re 1
μPa2s (Table 2-9), respectively, making is CC = 11 dB. Therefore, for each of the remaining groups
the SEL-based impulse TTS threshold is 11 dB below the steady-state TTS threshold (Table 2-9).
To estimate peak SPL-based thresholds, Southall et al. (2007) used Eq. (11) with peak-SPL values for the impulse thresholds and SEL-based values for the steady-state thresholds. For the mid- and high-frequency cetaceans, the steady-state (SEL) TTS thresholds are 178 and 153 dB re 1 μPa2s, respectively,
and the peak SPL, impulse TTS thresholds are 224 and 196 dB re 1 μPa, respectively, making Cs -Ci = -
44 dB. Based on this relationship, the peak SPL-based impulse TTS threshold (in dB re 1 μPa) would be 44 dB above the steady-state TTS threshold (in dB re 1 μPa2s), making the peak SPL thresholds vary from 222 to 243 dB re 1 μPa. Given the limited nature of the underlying data, and the relatively high values for some of these predictions, for Phase III analyses impulsive peak SPL thresholds are estimated using a “dynamic range” estimate based on the difference (in dB) between the impulsive noise, peak SPL TTS onset (in dB re 1 μPa) and the hearing threshold at f0 (in dB re 1 μPa) for the groups for which data are available (the mid- and high-frequency cetaceans). For the mid-frequency cetaceans, the hearing threshold at f0 is 54 dB re 1 μPa and the peak SPL TTS threshold is 224 dB re 1 μPa, resulting in a dynamic range of 170 dB. For the high-frequency cetaceans, the hearing threshold at f0 is 48 dB re 1 μPa and the peak SPL-based TTS threshold is 196 dB re 1 μPa, resulting in a dynamic range of 148 dB. The median dynamic range for the mid- and high-frequency cetaceans is therefore 159 dB (since there are only two values, the mean and median are equal). For the remaining species groups, the impulsive peak SPL-based TTS thresholds are estimated by adding 159 dB to the hearing threshold at f0 (Table 2-9). ).
There are no published data regarding TTS in sea turtles exposed to underwater explosions or other impulsive noise sources. As a conservative approach, Popper et al. (2014) recommended applying impact thresholds developed for fishes without swim bladders to sea turtles. For fish without swim bladders, Popper et al. (2014) recommended SEL-based thresholds >> 186 dB re 1 μPa2s for TTS after exposure to impact pile driving or seismic airgun impulses. For marine mammals, an 11-dB difference was found between the SEL-based non-impulsive TTS threshold and the SEL-based impulsive TTS threshold. If this same rule is applied to sea turtles, the SEL-based, impulse TTS threshold would be 189 dB re 1 μPa2s (non-impulsive TTS threshold of 200 dB re 1 μPa2s less 11 dB) — slightly higher than the fish threshold of 186 dB re 1 μPa2s. Popper et al. (2014) make no recommendations for peak SPL-based TTS thresholds for sea turtles. Given the high hearing thresholds measured for sea turtles and the relatively high SEL-based TTS thresholds, it seems likely that the peak SPL-based threshold for sea turtles would be higher than that for marine mammals. Based on this, the Phase III sea turtle peak SPL-based TTS threshold for impulse noise is set to 226 dB re 1 μPa, to match the highest marine mammal value.
Since marine mammal and sea turtle PTS data from impulsive noise exposures do not exist, onset-PTS levels for these animals were estimated by adding 15 dB to the SEL-based TTS threshold and adding 6 dB to the peak pressure based thresholds. These relationships were derived by Southall et al. (2007) from impulse noise TTS growth rates in chinchillas. The appropriate frequency weighting function for each functional hearing group is applied only when using the SEL-based thresholds to predict PTS.
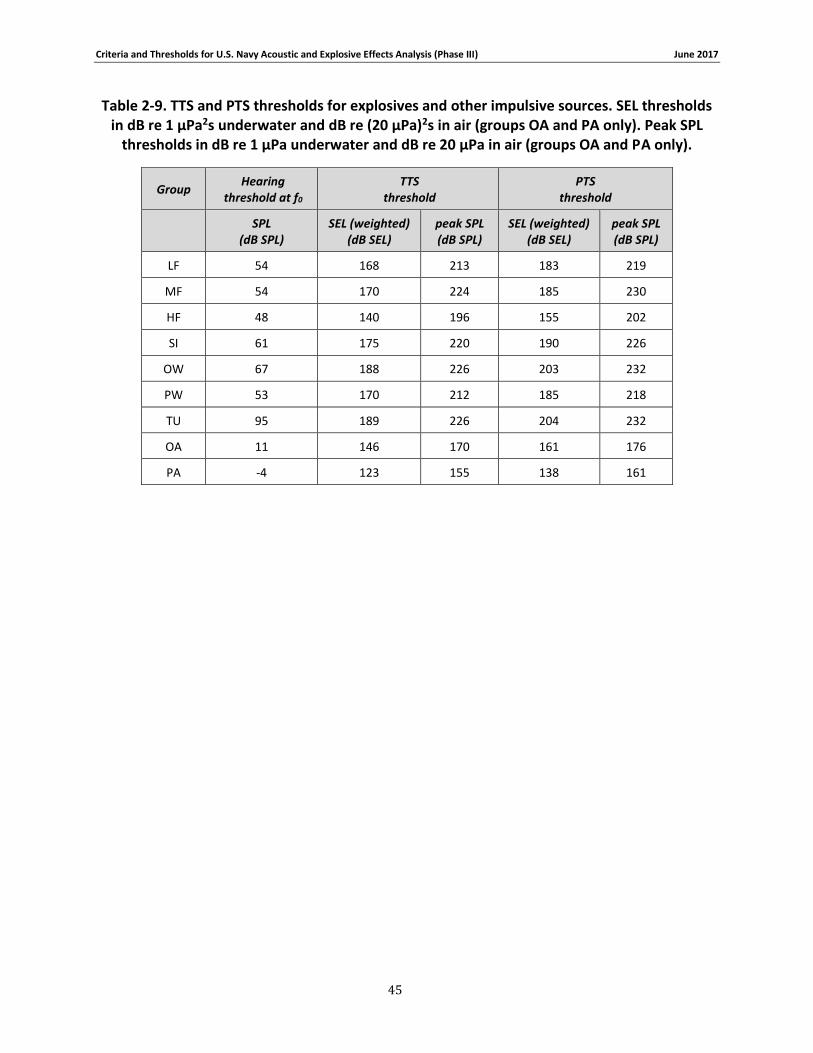
Criteria and Thresholds for U.S. Navy Acoustic and Explosive Effects Analysis (Phase III) June 2017
45
Table 2-9. TTS and PTS thresholds for explosives and other impulsive sources. SEL thresholds in dB re 1 μPa2s underwater and dB re (20 μPa)2s in air (groups OA and PA only). Peak SPL
thresholds in dB re 1 μPa underwater and dB re 20 μPa in air (groups OA and PA only).
Group Hearing
threshold at f0 TTS
threshold PTS
threshold
SPL
(dB SPL) SEL (weighted)
(dB SEL) peak SPL (dB SPL)
SEL (weighted) (dB SEL)
peak SPL (dB SPL)
LF 54 168 213 183 219
MF 54 170 224 185 230
HF 48 140 196 155 202
SI 61 175 220 190 226
OW 67 188 226 203 232
PW 53 170 212 185 218
TU 95 189 226 204 232
OA 11 146 170 161 176
PA -4 123 155 138 161
Criteria and Thresholds for U.S. Navy Acoustic and Explosive Effects Analysis (Phase III) June 2017
46
3 NAVY PHASE III BEHAVIORAL RESPONSE CRITERIA FOR MARINE SPECIES
3.1 Sonar and Other Transducers
3.1.1 Introduction
This section outlines the criteria used in Navy Phase III analyses to predict behavioral effects to marine mammals from sonar and other transducers. Recent behavioral studies have provided new data on how some species of marine mammals react to activities utilizing sonar and similar sound sources. Multi-year research efforts in the United States and Norway have conducted sonar exposure studies in the field on wild odontocetes and mysticetes (DeRuiter et al., 2013; Goldbogen et al., 2013; Miller et al., 2012; Sivle et al., 2012). Several studies with captive animals have provided data under controlled circumstances for odontocetes and pinnipeds (Houser et al., 2013a, 2013b). Finally, Moretti et al. (2014) published a beaked whale dose-response curve based on passive acoustic monitoring of beaked whales during U.S. Navy training activity at Atlantic Underwater Test and Evaluation Center (AUTEC) during actual Anti-Submarine Warfare exercises. This new information has necessitated the update of the Navy’s behavioral response criteria.
Sea turtle behavioral criteria was developed with the National Marine Fisheries Service (NMFS), and is briefly discussed in Section 3.1.8.9 (Sea Turtles under Behavioral Response Functions and Thresholds for Sonar and Other Transducers) and Section 3.1.9.7 (Sea Turtles under the Application of Contextual Factors – Distance Cutoffs).
3.1.2 Significant Behavioral Responses
In this report, the terms ‘significant response’ or ‘significant behavioral response’ are used in describing behavioral observations from field or captive animal research that may rise to the level of ‘harassment’ under the MMPA for military readiness activities. Due to the nature of behavioral response research to date, it is not currently possible to ascertain the number of these observed significant reactions that would lead to an abandonment or significant alteration of a natural behavior pattern as a result of naval activities.
Behavioral response severity is described herein as low, moderate, or high. These are derived from the Southall et al. (2007) severity scale.
Low severity responses are within an animal’s range of typical (baseline) behaviors and are unlikely to disrupt an individual to a point where natural behavior patterns are significantly altered or abandoned. Low severity responses include:
Orientation response
Startle response
Change in respiration
Change in heart rate
Change in group spacing or synchrony
Moderate severity responses could become significant if sustained over a longer duration. What constitutes a long-duration response is different for each situation and species, although it is likely
Under the Marine Mammal Protection Act, for military readiness activities, such as Navy training and testing, behavioral ‘harassment’ is:
“any act that disturbs or is likely to disturb a marine mammal or marine mammal stock in the wild by causing disruption of natural behavioral patterns, including, but not limited to, migration, surfacing, nursing, breeding, feeding, or sheltering, to a point where such behavioral patterns are abandoned or significantly altered.” (Section 315(f) of Public Law 107–314; 16 U.S.C. 703 note)
Criteria and Thresholds for U.S. Navy Acoustic and Explosive Effects Analysis (Phase III) June 2017
47
dependent upon the magnitude of the response and species characteristics such as body size, feeding strategy, and behavioral state at the time of the exposure. In general, a response would be considered ‘long-duration’ if it lasted for a few tens of minutes to a few hours, or enough time to significantly disrupt an animal’s daily routine.
Moderate severity responses include:
Alter migration path
Alter locomotion (speed, heading)
Alter dive profiles
Stop/alter nursing
Stop/alter breeding
Stop/alter feeding/foraging
Stop/alter sheltering/resting
Stop/alter vocal behavior
Avoidance of area near sound source
Displays of aggression or annoyance (e.g., tail slapping)
Moderate severity responses would not be considered significant behavioral responses if they lasted for a short duration and the animal immediately returned to their pre-response behavior. Moderate severity responses would be considered significant behavioral responses if they were sustained for a long duration. For the derivation of behavioral criteria in this report, a long duration was defined as a response that lasted for the duration of exposure or longer, regardless of how long that may have been. This assumption was made because examination of behavioral response data suggests that had the exposure continued, the behavioral responses would have continued as well.
High severity responses are those with possible immediate consequences to growth, survivability, or reproduction:
Long-term or permanent abandonment of area
Prolonged separation of females and dependent offspring
Panic, flight, or stampede
Stranding
High severity responses include those with immediate consequences (e.g., stranding) and those affecting animals in vulnerable life stages (i.e., calf, pup, or cub), and are therefore always considered to be a significant behavioral reaction.
A number of behavioral experiments have been conducted with animals under human care to estimate received sound levels that lead to disturbance of either normal or trained behaviors. Equating behavioral responses of animals under human care to those in the wild is inherently difficult as the context of the experiment, history of behavioral conditioning, and the nature of the environment cannot be easily equated to natural settings, nor can it be easily determined if these conditions make animals more or less sensitive to the disturbance imposed. Nevertheless, studies with captive animals provide greater control over the sound exposure context and greater opportunity for observation. Thus, alignments between the severity of reaction between wild animals and those under human care have been proposed (Southall et al., 2007). The proposed alignment of reaction severities has been modified for this analysis. General examples of low severity behavioral responses in captive animals include:
Brief changes in swim direction or orientation relative to sound source
Small changes in respiration rates
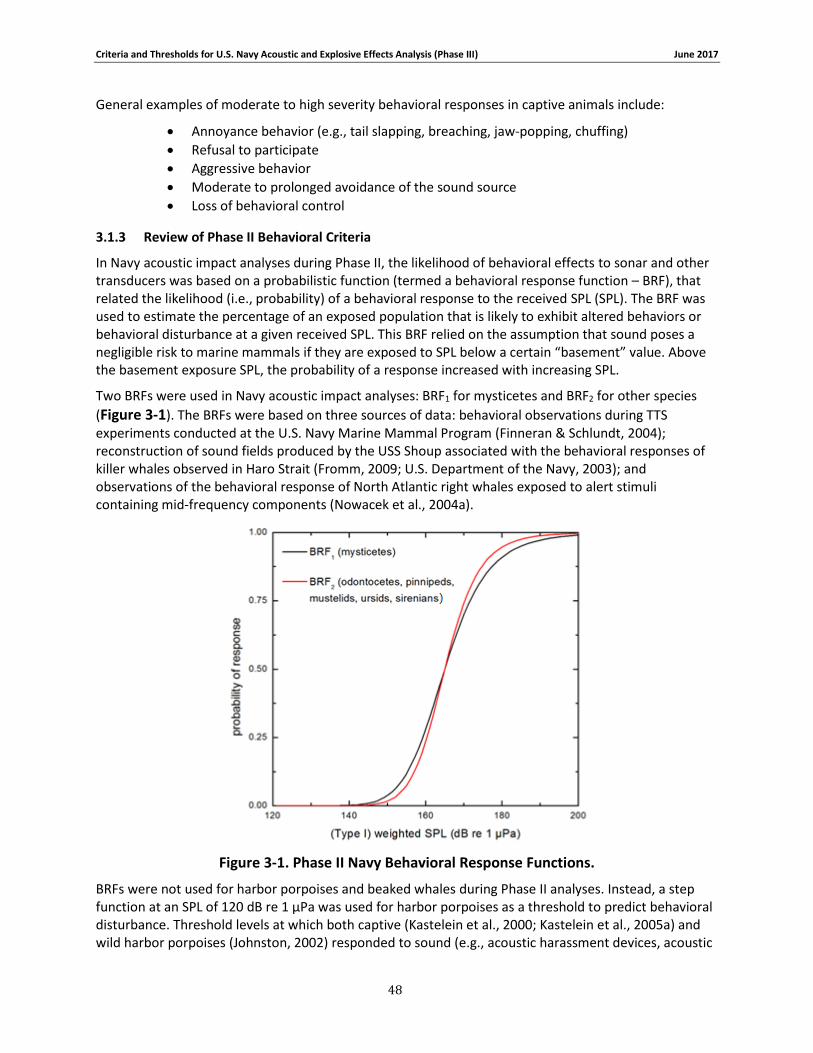
Criteria and Thresholds for U.S. Navy Acoustic and Explosive Effects Analysis (Phase III) June 2017
48
General examples of moderate to high severity behavioral responses in captive animals include:
Annoyance behavior (e.g., tail slapping, breaching, jaw-popping, chuffing)
Refusal to participate
Aggressive behavior
Moderate to prolonged avoidance of the sound source
Loss of behavioral control
3.1.3 Review of Phase II Behavioral Criteria
In Navy acoustic impact analyses during Phase II, the likelihood of behavioral effects to sonar and other transducers was based on a probabilistic function (termed a behavioral response function – BRF), that related the likelihood (i.e., probability) of a behavioral response to the received SPL (SPL). The BRF was used to estimate the percentage of an exposed population that is likely to exhibit altered behaviors or behavioral disturbance at a given received SPL. This BRF relied on the assumption that sound poses a negligible risk to marine mammals if they are exposed to SPL below a certain “basement” value. Above the basement exposure SPL, the probability of a response increased with increasing SPL.
Two BRFs were used in Navy acoustic impact analyses: BRF1 for mysticetes and BRF2 for other species
(Figure 3-1). The BRFs were based on three sources of data: behavioral observations during TTS experiments conducted at the U.S. Navy Marine Mammal Program (Finneran & Schlundt, 2004); reconstruction of sound fields produced by the USS Shoup associated with the behavioral responses of killer whales observed in Haro Strait (Fromm, 2009; U.S. Department of the Navy, 2003); and observations of the behavioral response of North Atlantic right whales exposed to alert stimuli containing mid-frequency components (Nowacek et al., 2004a).
Figure 3-1. Phase II Navy Behavioral Response Functions.
BRFs were not used for harbor porpoises and beaked whales during Phase II analyses. Instead, a step function at an SPL of 120 dB re 1 µPa was used for harbor porpoises as a threshold to predict behavioral disturbance. Threshold levels at which both captive (Kastelein et al., 2000; Kastelein et al., 2005a) and wild harbor porpoises (Johnston, 2002) responded to sound (e.g., acoustic harassment devices, acoustic
Criteria and Thresholds for U.S. Navy Acoustic and Explosive Effects Analysis (Phase III) June 2017
49
deterrent devices, or other non-impulsive sound sources) was very low, ranging between 100 and 145 dB re 1 µPa.
Results from Blainville’s beaked whale monitoring and experimental exposure studies on the instrumented Atlantic Undersea Test and Evaluation Center range in the Bahamas (McCarthy et al., 2011; Tyack et al., 2011) suggested that beaked whales tended to avoid both actual naval mid-frequency sonar in real anti-submarine training scenarios as well as sonar-like signals and other signals used during controlled sound exposure studies in the same area. During an exercise using mid-frequency sonar, beaked whales avoided the area at a distance from the sonar where the received level was “around 140 dB” [dB re 1 µPa] and once the exercise ended, beaked whales returned to the center of exercise area within 2-3 days (Tyack et al., 2011). The Navy therefore adopted a 140 dB re 1 µPa SPL threshold for behavioral effects for all beaked whales (family: Ziphiidae) for the Phase II analysis.
3.1.4 Overview of the approach for Phase III
The Navy’s at-sea environmental compliance program assesses training and testing activities over multi-year periods for each Fleet Area of Operations (AO), which can cover several hundred thousand square miles of ocean. Training and testing activities are numerous, with thousands of events per year for the Navy Study Areas. These events are analyzed over multiple areas and seasons to predict the potential impact of Navy testing and training activities on the marine environment. Criteria are developed to provide an estimate of potentially significant behavioral impacts using available data.
Developing the new behavioral criteria for Phase III involved multiple steps:
All available behavioral response studies conducted both in the field and on captive animals were examined in order to understand the breadth of behavioral responses of marine mammals to sonar and other transducers. An overview of the literature considered for analysis is given in Section 3.1.5, along with details on the various sound sources used in each study.
Marine mammal species were placed into behavioral criteria groups based on their known or suspected behavioral sensitivities to sound. In most cases these divisions are driven by taxonomic classifications (e.g., mysticetes, pinnipeds), as described in Section 3.1.6.
Section 3.1.7 describes the differences between level-based and context-based behavioral responses to anthropogenic noise.
The data from the behavioral studies were analyzed by looking for significant responses, or lack thereof, for each experimental session following definitions in Section 3.1.2. For groups that did not have adequate behavioral response data (i.e., sirenians), a surrogate BRF based on behavioral characteristics and taxonomy was assigned. Details are in Section 3.1.8.
Distances beyond which significant behavioral responses to sonar and other transducers are unlikely to occur, denoted as “cutoff distances,” were defined based on the existing data (see Section 3.1.8.9).
Section 3.2 presents a summary of the behavioral criteria, examples of the effect of using cutoff distances, and a comparison of Phase II and Phase III behavioral criteria.
3.1.5 Review of Data Considered
A number of papers on behavioral responses of marine mammals to sonar or sonar-like sound sources have been published over the last few years. These recent studies, along with several previously published reports with behavioral response observations (Fromm, 2009) were considered when deriving the Navy’s behavioral response criteria.
Criteria and Thresholds for U.S. Navy Acoustic and Explosive Effects Analysis (Phase III) June 2017
50
3.1.5.1 Behavioral Response Field Studies
Behavioral response field studies seek data under more realistic scenarios (as compared to a controlled laboratory setting); however, field experiments are unable to control all variables that are likely mediating behavioral responses. These other variables are often referred to as contextual factors (see Section 3.1.7 for more details). At moderate to lower received levels the correlation between probability of reaction and received level is very poor and it appears that other variables are mediating behavioral reactions. Contextual factors that are likely to have mediated responses during the behavioral response studies discussed below include: close proximity of the vessel and sound source, physical contact (i.e., tagging), repeated close approaches (within a few hundred meters), multiple vessels, and confined areas (i.e., fjords). Table 3-1describes the experimental conditions for each study in which data were used for the derivation of the Navy’s Phase III behavioral response criteria.
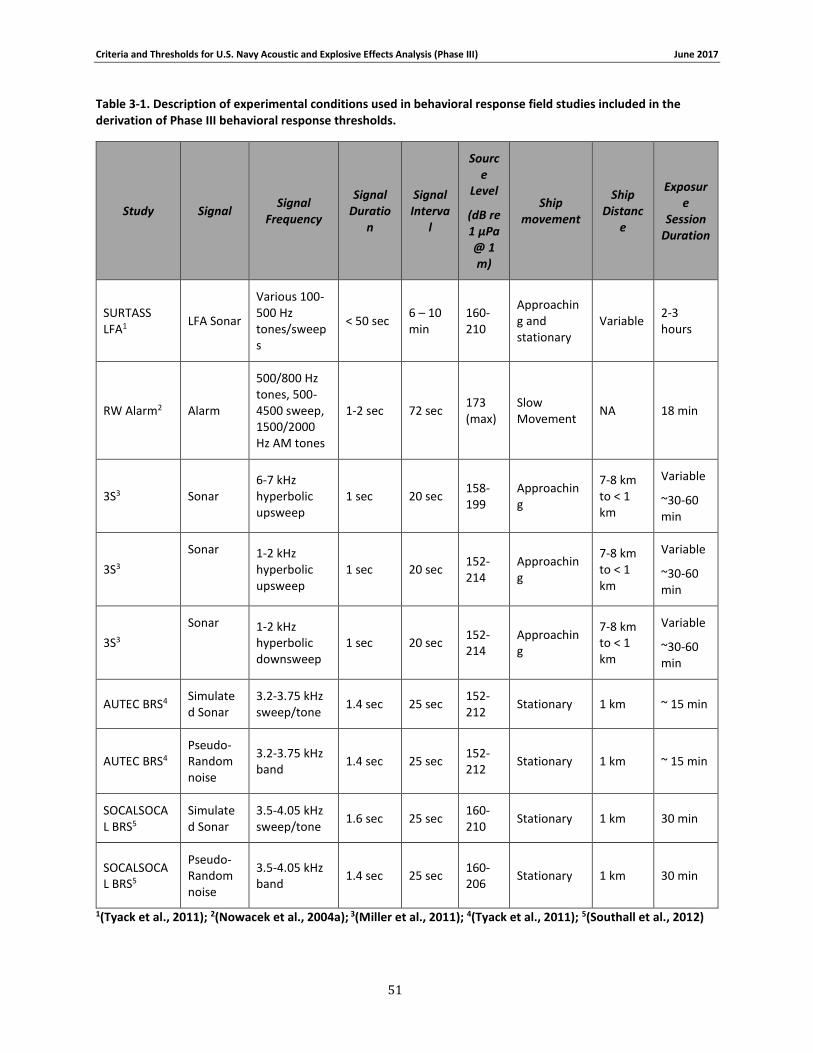
Criteria and Thresholds for U.S. Navy Acoustic and Explosive Effects Analysis (Phase III) June 2017
51
Table 3-1. Description of experimental conditions used in behavioral response field studies included in the derivation of Phase III behavioral response thresholds.
Study Signal Signal
Frequency
Signal Duratio
n
Signal Interva
l
Source
Level
(dB re 1 µPa @ 1 m)
Ship movement
Ship Distanc
e
Exposure
Session Duration
SURTASS LFA1
LFA Sonar
Various 100-500 Hz tones/sweeps
< 50 sec 6 – 10 min
160-210
Approaching and stationary
Variable 2-3 hours
RW Alarm2 Alarm
500/800 Hz tones, 500-4500 sweep, 1500/2000 Hz AM tones
1-2 sec 72 sec 173 (max)
Slow Movement
NA 18 min
3S3 Sonar 6-7 kHz hyperbolic upsweep
1 sec 20 sec 158-199
Approaching
7-8 km to < 1 km
Variable
~30-60 min
3S3
Sonar 1-2 kHz hyperbolic upsweep
1 sec 20 sec 152-214
Approaching
7-8 km to < 1 km
Variable
~30-60 min
3S3
Sonar 1-2 kHz hyperbolic downsweep
1 sec 20 sec 152-214
Approaching
7-8 km to < 1 km
Variable
~30-60 min
AUTEC BRS4 Simulated Sonar
3.2-3.75 kHz sweep/tone
1.4 sec 25 sec 152- 212
Stationary 1 km ~ 15 min
AUTEC BRS4 Pseudo-Random noise
3.2-3.75 kHz band
1.4 sec 25 sec 152- 212
Stationary 1 km ~ 15 min
SOCALSOCAL BRS5
Simulated Sonar
3.5-4.05 kHz sweep/tone
1.6 sec 25 sec 160- 210
Stationary 1 km 30 min
SOCALSOCAL BRS5
Pseudo-Random noise
3.5-4.05 kHz band
1.4 sec 25 sec 160-206
Stationary 1 km 30 min
1(Tyack et al., 2011); 2(Nowacek et al., 2004a); 3(Miller et al., 2011); 4(Tyack et al., 2011); 5(Southall et al., 2012)
Criteria and Thresholds for U.S. Navy Acoustic and Explosive Effects Analysis (Phase III) June 2017
52
3.1.5.1.1 SURTASS LFA SRP
Studies of behavioral responses to low frequency sonar were undertaken in 1997–98 as part of the Navy’s Low-Frequency Sound Scientific Research Program. The SURTASS LFA exposure studies on blue (Balaenoptera musculus), fin (Balaenoptera physalus), gray (Eschrichtius robustus), and humpback whales (Megaptera novaeangliae) (Croll et al., 2001; Tyack, 1999) were conducted in three phases. These studies found only short-term responses to low-frequency sound by these mysticetes, including changes in vocal activity and avoidance of the source vessel (Clark & Fristrup, 2001; Croll et al., 2001; Fristrup et al., 2003; Miller et al., 2000; Nowacek et al., 2007).
The first phase of the study consisted of both “bottom-bounce” and “direct-path” exposures of LFA sonar on blue and fin whales in the SOCAL Bight. Focal follows on six fin whales and one blue whale were conducted during LFA exposures, and none showed a discernible response or variation in foraging activity (Croll et al., 2001). Croll et al. (2001) also reported on results looking at changes in distribution to look for large-scale avoidance effects. They concluded that changes in distribution were due to changes in food distribution not the occurrence of the LFA source.
During the second phase of the study, a stationary ship transmitting LFA sonar was positioned in the path of migrating gray whales along the coast of California; the ship was positioned either 2 km from shore (directly in the path of the migrating whales) or 4 km offshore. Many animals were observed avoiding the sound source by altering their route 500 – 2000 m around the sound source vessel when the vessel was directly in the path at the 2 km position, but far fewer avoidance responses were observed when the vessel was 4 km offshore. Responses were relatively short-term, low impact avoidance responses, which were not significant behavioral responses (see Section 3.1.2 for more details). This exemplifies a contextually driven response that appears to be mediated by the location of the source in the middle or edge of the animal’s migration path as opposed to the received level. Researchers also noted that the whales showed a very strong and obvious avoidance response to the small boat attempting to tag the animals, including some animals that turned and swam away at high speed, thwarting all attempts at tagging this species during the study.
During the third part of the SURTASS LFA study, the LFA sonar was played in the vicinity of humpback whales on their breeding grounds in Hawaii. Singing males were the primary target, but all whales in the vicinity of the sonar were observed from ship- and land-based platforms to monitor non-acoustic responses. No responses were observed visually; of the 17 singing humpbacks that were exposed to the sonar, seven did not respond at all while ten ceased their vocalizations. However, only six of the ten cessations of song were attributable as responses to the LFA sonar; the other four singers stopped singing but then joined another singer or group of whales, which is a common behavior by singers in Hawaiian waters. Even the responses by the six whales that may have responded to LFA were considered to be within the standard deviation of all behavior, and were therefore not confidently scored as actual responses. Researchers also noted that some humpbacks singers that were approached with a small boat as possible focal-follow subjects avoided the vessel, or stopped singing.
Data from the first and third phases of the LFA study were used in the quantitative derivation of new behavioral response criteria. There was no received level data paired with individual behavioral observations available for the second phase of the LFA study; therefore, these data were not used in the quantitative derivation of new behavioral response criteria.
3.1.5.1.2 Reactions of right whales to alarm sounds
Nowacek et al. (2004a) developed an alarm signal to be deployed from ships in order to alert north Atlantic right whales (Eubalaena glacialis) to their presence and help avoid ship strikes. The alarm signal
Criteria and Thresholds for U.S. Navy Acoustic and Explosive Effects Analysis (Phase III) June 2017
53
was 18 minute long with a 60% duty cycle and designed to “pique the mammalian auditory system with disharmonic signals spanning the whale’s estimated hearing range” (Nowacek et al., 2004a). Digital acoustic recording tags (DTAGs) were first attached to animals to record received sounds and animal movement. Whales were allowed a recovery period of two dives. Playback commenced on the third foraging dive from the animal’s last dive location and the boat slowly followed the animals based on their last known heading. Six whales were exposed to the alert stimulus, five whales were exposed to a silent control, seven whales were exposed to playbacks of right whale social vocalizations, and five whales were exposed to a vessel approach stimulus. Five of the six whales exposed to the alert signal responded, while none of the whales exposed to other scenarios responded. Animals that reacted prematurely ended foraging dives, swam at a shallow angle to the surface, and remained there exhibiting abnormal diving behavior for the duration of the exposure. The authors point out that this was a response to the signal itself and not to varying received levels; the levels from the vessel approach playbacks were similar with no observed reactions (Nowacek et al., 2004a).
This shows that the qualities of a sound besides received level (e.g., disharmonic frequency content) can mediate behavioral reactions. Prior encroachment and tagging, as well as the proximity of the sound source located presumably almost directly above the animal upon initial exposure could also have caused animals to react at lower received levels than in the absence of these additional stimuli.
These data were included in the derivation of the behavioral criteria.
3.1.5.1.3 Haro Strait killer whales
In May 2003, killer whales in Haro Strait, Washington exhibited behavioral reactions while the USS Shoup was in the vicinity and engaged in MFAS training. Sound fields modeled for the USS Shoup transmissions (Fromm, 2009; National Marine Fisheries Service, 2005; U.S. Department of the Navy, 2003) estimated a brief maximum mean received SPL of approximately 169 dB re 1 µPa (modeled maximum values ranged from 150 to 180 dB re 1 µPa) at the location of the killer whales during the closest point of approach between the animals and the vessel (2.5 km). The mean received level in the minutes prior to the closest point of approach was 144 dB re 1 µPa. The killer whales had been traveling north, parallel to the path of the USS Shoup but ahead of the vessel. As the vessel approached, the whales first turned south and began heading towards the ship, then moved closer to shore and began milling. After the USS Shoup passed and the sonar was turned off, the killer whales resumed their northward travel. During this exposure there were up to six whale watching vessels surrounding the whales; at the time they turned south, most of the vessels were ahead of the group and possibly blocked their path. In addition, the estimated source levels of the surrounding whale watching vessels were between 145 and 169 dB re 1 µPa. The received levels of the whale watch boats’ engine noise may have been high enough to mask the initial sound of the sonar as the USS Shoup approached the group of whales. Additionally, other research has shown that resident killer whales behaviorally respond to whale watching vessels at close ranges (Erbe, 2002; Williams et al., 2014). Finally, observers at the time of the exposure felt that the killer whales’ behavior was not normal; however, researchers that later reviewed the video of the animals determined that their behavior during the exposure was within their normal behavioral range.
Data from this incidental exposure of resident killer whales were used in the development of the Phase II BRFs. However, due to a lack of paired data on observed reactions at specific received sound levels, these data were not used in the quantitative derivations of the new behavioral response criteria. Additionally, the 3S behavioral response study recorded detailed observations of killer whales reactions to sonar and therefore provides a better data set for the derivation of behavioral response criteria.
Criteria and Thresholds for U.S. Navy Acoustic and Explosive Effects Analysis (Phase III) June 2017
54
3.1.5.1.4 3S study
Miller et al. (2011) reported on behavioral responses of pilot whales (Globicephala melas), killer whales (Orcinus orca), and sperm whales (Physeter macrocephalus) off Norway to a Norwegian Navy sonar (Sea Mammals, Sonar, and Safety Project [3S]) (Antunes et al., 2014; Kuningas et al., 2013; Miller et al., 2014; Miller et al., 2012; Sivle et al., 2012). The sonar outputs included 1 - 2 kHz up- and down-sweeps and 6 - 7 kHz up-sweeps; source levels were ramped-up from 152 - 158 dB re 1µPa @ 1m to a maximum of 198 - 214 dB re 1µPa @ 1m.
After an initial observation period, but prior to sound exposure, researchers attached DTAGs to one or two of the animals in a selected group. Researchers spent up to one hour attaching recording tags to the animal(s), and multiple attempts at tag attachment were made during that period. Agitated behaviors from some animals were observed during the tagging process (Miller et al., 2011). After a period of twenty minutes to several hours following tag attachment, during which an observation vessel remained with the tagged animal(s), researchers began playbacks of sonar signals, playbacks of sounds made by feeding killer whales, or conducted silent “control” passes of the sonar vessel. At the start of an exposure session, the vessel with the active sonar source began approaching the group from 6 - 8 km and continued to vector towards the group until within approximately 1 km. The source vessel would then continue upon a straight course until it passed the animal group, often to within a few hundred meters. Many of the observed behavioral responses were of a prolonged duration, as the animals continued moving to avoid the oncoming vessel as it corrected course toward the animals. At the onset of each sonar exposure session, the signal amplitude was ramped-up over several pings while the vessel approached the animals. This rapid increase in received levels of subsequent sonar pings during ramp-up could have been perceived by the animals as a rapidly approaching source.
Three of the four exposed killer whale groups were foraging prior to the initial sonar exposure; they all ceased to feed and began avoiding the vessel during the first exposure session. Received SPLs corresponding to observed significant behavioral reactions varied from approximately 94 dB re 1 µPa at 8.9 km to 164 dB re 1 µPa at 3.2 km. The killer whale group that was not foraging was in a shallow part of the fjord and could only be approached to within about 2 km by the vessel towing the sonar source. Received SPLs in that case were as high as 166 dB re 1µPa with no observed reactions. This group did not respond to any of the exposures until the final approach, when the group had moved out of the shallow part of the fjord and a young calf became separated from the rest of the group.
Pilot whale behavioral responses occurred at received SPLs between approximately 152 to 175 dB re 1 µPa corresponding to distances of 3.1 km to 90 m, respectively; although during exposures as high as approximately 172 dB re 1 µPa corresponding to a distance of 350 m, no more than minor and brief reactions were observed.
Sperm whales responded at received levels between 116 to 156 dB re 1 µPa, corresponding to distances of around 9.0 to 1.8 km, respectively. However, sperm whales exposed to higher levels (up to 166 dB re 1 µPa at 0.9 km) showed no response, or no more than a brief and minor response. These counterintuitive results with respect to received SPL demonstrate some of the issues that must be addressed when interpreting behavioral response data for marine mammals in different contextual conditions.
The 3S study included some control passes of ships with the sonar off to discern the behavioral responses of the animals to vessel presence alone versus active sonar. A single control pass was conducted on killer whales, which was insufficient to rule out vessel presence as a factor in behavioral response. During four control passes on pilot whales, Miller et al. (2011) described similar responses for two of the groups to those observed when the vessels approached with active sonar. In some cases, it is

Criteria and Thresholds for U.S. Navy Acoustic and Explosive Effects Analysis (Phase III) June 2017
55
difficult to ascertain if the received SPL alone caused the reactions, or whether the repeated passes of the research vessel contributed to the observed behavioral reactions.
These data were included in the derivation of the behavioral criteria.
3.1.5.1.5 3S2 study
A follow-on Norwegian 3S study (3S2) studied behavioral reactions to sonar sources from humpback whales (Megaptera novaeangliae), minke whales (Balaenoptera acutorostrata), and bottlenose whales (Hyperoodon ampullatus). Similar methods were used as in the first 3S study, including the use of the Norwegian Navy sound source, additional smaller vessels for tagging and behavioral observations, a post-tagging baseline observation period, and the approach of the focal animal by the source vessel during the exposure periods. One difference was that while the initial course of the source vessel was set to approach the animals during the exposures, the vessel would only make small course corrections during the approach and would not change heading to continue vectoring directly at the animals.
During the minke and bottlenose whale exposures, of which there was only one each, the source vessel approached from a distance of 8 and 5 km respectively. However, during the bottlenose whale exposure the source vessel drove in a 2x2 km box around the last known position of the whale, rather than making a continuous approach, in order to acoustically track the whale as it could not be visually tracked during its long duration foraging dives. Both the minke whale and bottlenose whale showed very strong, prolonged responses to the sonar exposures, including avoidance and cessation of feeding that lasted well beyond the period of exposure. These responses began at 138 and 122 dB re 1 µPa, respectively. Since both of these whales only had a single exposure pass, it is unknown what additional contextual cues may have caused them to respond at lower received levels. However, in the case of the bottlenose whale, the number of other bottlenose whales foraging in the area during and after the exposure also decreased, indicating that these whales may be highly sensitive to noise in this region (Miller et al., 2015; Sivle et al., 2015).
One confounding factor in assessing behavioral responses found in some studies was the use of the ramp-up protocol; therefore, in this 3S2 study they approached humpback whales both with and without the use of ramp-up, to determine if the response differed. During the humpback whale exposures, the source vessel began its approach from a closer distance of approximately 1.3 km. In this case, the source vessel tried to approach each humpback whale five times: first, using a 5-min ramp up protocol; second, as a controlled silent pass with no sonar; third, using sonar but with no ramp-up; fourth, playing back killer whale vocalizations; and fifth, playing broadband noise.
The responses of the humpback whales were far more varied, and were similar to the responses by the blue whales in the SOCAL BRS (discussed below) in that they often didn’t respond to exposures that reached SPLs of up to 182 dB re 1 µPa, but those that did respond often responded at lower received levels by avoiding the sound source, changing their dive profile, and ceasing to forage. There was no apparent difference in response during the ramp-up vs. no-ramp-up trials. Of the four animals with significant behavioral responses, two animals responded to the ramp-up trials (at 125 and 132 dB re 1 µPa) but not to the no-ramp-up trials, and one animal responded to both trials (at 127 and 165 dB re 1 µPa, respectively).
These data were included in the derivation of the behavioral criteria.
3.1.5.1.6 AUTEC BRS
Tyack et al. (2011) used the suite of 82 seafloor-mounted hydrophones at the Atlantic Undersea Test and Evaluation Center in the Bahamas to acoustically detect Blainville’s beaked whales’ (Mesoplodon
Criteria and Thresholds for U.S. Navy Acoustic and Explosive Effects Analysis (Phase III) June 2017
56
densirostris) foraging dives before, during and after Navy mid-frequency active sonar activities. The authors found a significant reduction in foraging dives during periods of sonar operation, and found that whales that continued to dive concurrently with sonar were 2.2 – 28.9 km away from the source, with SPLs of 101 to 157 dB re 1 µPa. Moretti et al. (2014) also used the seafloor-mounted hydrophones to estimate foraging dives before, during, and after Navy sonar exercises. They developed a generalized additive model of the probability of a beaked whale dive occurring anywhere on the range, and then determined the probability of a dive occurring in the presence of sonar. The enumeration of foraging dives that occur in the presence or absence of sonar only captures a single type of response – a decrease in dives when sonar is present – and does not provide any additional information about how animals may otherwise be responding, or if they leave the range or stay on range without vocalizing.
To determine whether animals remain on the range or leave the area during sonar activities, an individual beaked whale was also tagged with a satellite tracking tag prior to an exercise (Tyack et al., 2011). During sonar, the animal moved ~17 km further from the center of the range than it was before the sonar period, and received a maximum SPL of 146 dB re 1 µPa. The animal returned to the range within 2 to 3 days after the cessation of sonar operations. This indicates movement off the range during sonar activity, but not a long-term abandonment of the area.
Two other beaked whales were tagged with DTAGs and exposed to playbacks of mid-frequency active
sonar, pseudorandom noise (PRN), and killer whale calls (Tyack et al., 2011). A simulated sonar signal of
~3.5 kHz was used that had similar frequency characteristics to U.S. Navy tactical sonar (see
Criteria and Thresholds for U.S. Navy Acoustic and Explosive Effects Analysis (Phase III) June 2017
57
Table 3-1), but at lower source levels (up to 212 dB re 1 µPa @ 1 m). A PRN sound was also used to
determine whether animals would respond to any sound in the mid-frequency band or if they were
specifically responding to a sonar-type signal. These sources were deployed from a stationary vessel
positioned about 1 km from where a beaked whale had begun a foraging dive. The signals were ramped
up, from source levels of 152-160 dB re 1 µPa and increasing 3 dB every 25 seconds. The first exposed
whale was exposed to MFAS in the middle of a foraging dive; it stopped clicking at an SPL of 138 dB re 1
µPa, and began a slow ascent while moving away from the sound source. A second beaked whale was
tagged and exposed to pseudo-random noise during a foraging dive. This animal stopped clicking just
after the last ping, with an SPL of 142 dB re 1 µPa, and also made a slow ascent to 600 m where it
appeared to stop. Beaked whales have shown an increased sensitivity to sound exposure when
compared to most other marine mammals, however, other factors such as prior tagging, repeated
exposures, and proximity of the sound source vessel to the animal could play a strong role in mediating
the observed behavioral responses.
These data were included in the derivation of the behavioral criteria.
3.1.5.1.7 SOCAL BRS
A behavioral response study conducted on and around the Navy range in SOCAL (SOCAL BRS) observed
reactions to sonar and similar sound sources on a number of species: Cuvier’s beaked whales (Ziphius
cavisrostrus), a Baird’s beaked whale (Berardius bairdii), blue whales, fin whales, and Risso’s dolphins
(Grampus griseus) (DeRuiter et al., 2013; Goldbogen et al., 2013; Southall et al., 2011; Southall et al.,
2012; Southall et al., 2013; Southall et al., 2014). During most of the SOCAL BRS experiments, both
simulated mid-frequency sonar and PRN were used, with the same frequency bands and source levels as
in AUTEC (see
Criteria and Thresholds for U.S. Navy Acoustic and Explosive Effects Analysis (Phase III) June 2017
58
Table 3-1). The source was deployed from either a 22-m recreational dive vessel or a 35-m research vessel: this vessel was accompanied by two smaller rigid hulled inflatable boats that operated independently of the source vessel. In 2013, a few animals were also exposed using actual mid-frequency active sonar (MFAS) from U.S. Navy vessels. Tagging efforts were conducted from the rigid hulled inflatable boats, as well as photo-identification and tracking of the whales before, during, and after the exposures. One or two animals were tagged with data-recording tags, and then an observation period from 45 minutes (for mysticetes) up to 2 hours (for odontocetes) was conducted to obtain baseline behavioral data. The source vessel then positioned itself about 1 km from the tagged focal animal and deployed the sound source. Similarly to the 3S studies, the SOCAL BRS implemented a ramp-up protocol in which they started the exposure with a source level of 160 dB re 1 µPa @ 1 m and increased rapidly over a 5-10 minute period, up to 210 dB re 1 µPa @ 1 m for the simulated sonar signal and 206 dB re 1µPa @ 1 m for the PRN. However, unlike the 3S study, the source vessel did not approach the focal animal; once it was positioned, small adjustments were made to keep the sound source vertical in the water column, but otherwise it remained stationary.
Behavioral responses during the SOCAL BRS varied widely both within and across species. Many of the blue whales did not respond, even at received SPLs up to 165 dB re 1 µPa. However, those that did respond often responded at lower received SPLs (mean = 123 dB re 1 μPa). There seemed to be some behavioral context associated with whether or not animals responded; for example, deep feeding blue whales were more likely to respond than shallow feeding or traveling animals (Goldbogen et al., 2013). All beaked whales exposed to the simulated sonar responded by avoiding the source, ceasing their foraging dives, and otherwise changing their dive behavior (DeRuiter et al., 2013; Stimpert et al., 2014). However, none of the beaked whales exposed to real Navy sonar at greater distances (whether intentionally or incidentally) responded, even when the received levels were similar to the levels from the simulated sonar. In preliminary analyses, none of the Risso’s dolphins or fin whales exposed to simulated or real mid-frequency sonar demonstrated any overt or obvious responses (Southall et al., 2012; Southall et al., 2013). In general, although the responses to the simulated sonar were varied across individuals and species, none of the animals exposed to real Navy sonar responded; these exposures occurred at distances beyond 10 km, and were up to 60 – 100+ km away (DeRuiter et al., 2013; B. Southall pers. comm.).
These data were included in the derivation of the behavioral criteria.
3.1.5.2 Captive Animal Behavioral Studies
Captive animal studies examine behavioral responses under controlled conditions. These studies give researchers the ability to vary the factor of interest while holding other factors stable. The received level of sound is the primary factor of interest in most of the experiments conducted to date. Within captive animal studies, the probability of behavioral response seems to be well correlated with received level indicating a primarily level-based response.
Table 3-2 describes the experimental conditions for each study in which data were used for the derivation of the Navy’s Phase III behavioral response criteria.
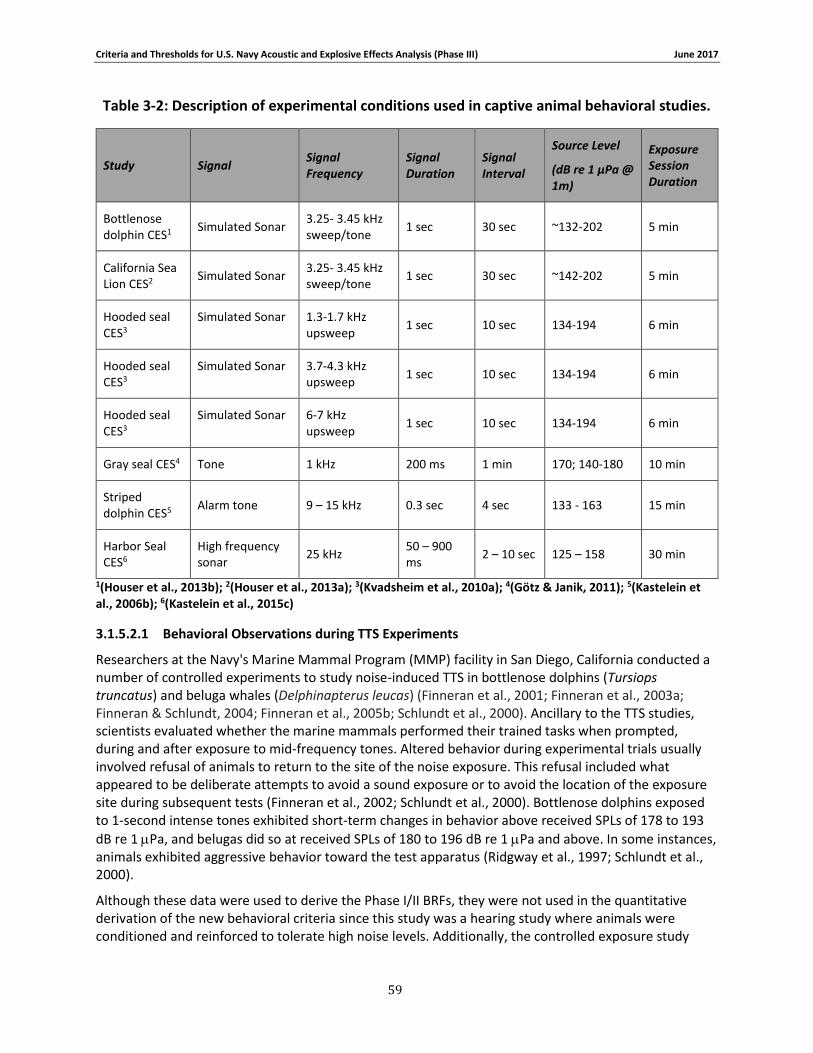
Criteria and Thresholds for U.S. Navy Acoustic and Explosive Effects Analysis (Phase III) June 2017
59
Table 3-2: Description of experimental conditions used in captive animal behavioral studies.
Study Signal Signal Frequency
Signal Duration
Signal Interval
Source Level
(dB re 1 µPa @ 1m)
Exposure Session Duration
Bottlenose dolphin CES1 Simulated Sonar
3.25- 3.45 kHz sweep/tone
1 sec 30 sec ~132-202 5 min
California Sea Lion CES2 Simulated Sonar
3.25- 3.45 kHz sweep/tone
1 sec 30 sec ~142-202 5 min
Hooded seal CES3
Simulated Sonar 1.3-1.7 kHz upsweep
1 sec 10 sec 134-194 6 min
Hooded seal CES3
Simulated Sonar 3.7-4.3 kHz upsweep
1 sec 10 sec 134-194 6 min
Hooded seal CES3
Simulated Sonar 6-7 kHz upsweep
1 sec 10 sec 134-194 6 min
Gray seal CES4 Tone 1 kHz 200 ms 1 min 170; 140-180 10 min
Striped dolphin CES5 Alarm tone 9 – 15 kHz 0.3 sec 4 sec 133 - 163 15 min
Harbor Seal CES6
High frequency sonar
25 kHz 50 – 900 ms
2 – 10 sec 125 – 158 30 min
1(Houser et al., 2013b); 2(Houser et al., 2013a); 3(Kvadsheim et al., 2010a); 4(Götz & Janik, 2011); 5(Kastelein et al., 2006b); 6(Kastelein et al., 2015c)
3.1.5.2.1 Behavioral Observations during TTS Experiments
Researchers at the Navy's Marine Mammal Program (MMP) facility in San Diego, California conducted a number of controlled experiments to study noise-induced TTS in bottlenose dolphins (Tursiops truncatus) and beluga whales (Delphinapterus leucas) (Finneran et al., 2001; Finneran et al., 2003a; Finneran & Schlundt, 2004; Finneran et al., 2005b; Schlundt et al., 2000). Ancillary to the TTS studies, scientists evaluated whether the marine mammals performed their trained tasks when prompted, during and after exposure to mid-frequency tones. Altered behavior during experimental trials usually involved refusal of animals to return to the site of the noise exposure. This refusal included what appeared to be deliberate attempts to avoid a sound exposure or to avoid the location of the exposure site during subsequent tests (Finneran et al., 2002; Schlundt et al., 2000). Bottlenose dolphins exposed to 1-second intense tones exhibited short-term changes in behavior above received SPLs of 178 to 193
dB re 1 Pa, and belugas did so at received SPLs of 180 to 196 dB re 1 Pa and above. In some instances, animals exhibited aggressive behavior toward the test apparatus (Ridgway et al., 1997; Schlundt et al., 2000).
Although these data were used to derive the Phase I/II BRFs, they were not used in the quantitative derivation of the new behavioral criteria since this study was a hearing study where animals were conditioned and reinforced to tolerate high noise levels. Additionally, the controlled exposure study
Criteria and Thresholds for U.S. Navy Acoustic and Explosive Effects Analysis (Phase III) June 2017
60
discussed below observed reactions of 30 bottlenose dolphins to simulated mid-frequency sonar signals and is therefore a more appropriate data set from which to derive behavioral criteria.
3.1.5.2.2 Dolphin and Sea Lion Controlled Exposure Studies
Controlled-exposure studies (CESs) have been conducted with U.S. Navy bottlenose dolphins and California sea lions (Zalophus californianus) at the Navy MMP facility specifically to study behavioral reactions (Houser et al. 2013a; Houser et al. 2013b). These studies were designed to expose animals at a wide variety of received levels with the specific intent of building behavioral dose-response functions with the data. Researchers noted that the sea lions and dolphins used in both studies had probably not been exposed to intense sounds such as nearby tactical sonar in the past; however, due to their training and food reinforcement, Navy animals are potentially less sensitive to noise exposure than wild animals. In both studies, animals were trained to swim across a pen, touch a target paddle, and return to the starting location. During transit, a simulated mid-frequency sonar signal was played at an SPL previously assigned to each animal. Dolphins received six different exposure levels ranging from 115-185 dB re 1 µPa (rms) and sea lions received five different exposure levels ranging from 125-185 dB re 1 µPa (rms). The transducer was located 1 m behind the target paddle so that the subject animal would have to close their distance to within 1 m of the transducer that emitted the simulated sonar signal a few seconds before. Video and audio were recorded of the session and observers that subsequently scored the sessions for behavioral responses were made blind to the exposure conditions.
Behavioral reactions included increased respiration rates, fluke or pectoral fin slapping (dolphins), prolonged submergence (sea lions), and refusal to participate, among others. Twenty dolphins that received exposures of 115 – 160 dB re 1 µPa (rms) had significant behavioral reactions on only 5 out of 200 trials. It was determined that bottlenose dolphins were more likely to respond to the initial trials, but habituated to the sound over the course of 10 trials except at the highest received levels (175 and 185 dB re 1 µPa [rms]). One out of three California sea lions exposed to the 125 dB re 1 µPa (rms) treatment and one out of three exposed to the 155 dB re 1 µPa (rms) treatment showed significant reactions on all ten exposure trials, while the other four individuals at the same levels did not show a significant response on any trial. Sea lions showed consistent significant responses on almost all trials at the 170 and 185 dB re 1 µPa (rms) levels. Unlike dolphins, sea lions did not habituate over the course of ten exposure trials and younger animals were more likely to respond than older animals. This indicates that age or life experience may play a large role in mediating responses to noise exposure in sea lions. In both the sea lion and dolphin controlled exposure studies, the probability of behavioral reactions was well correlated with received level indicating a primarily level-based response.
These data were included in the derivation of the behavioral criteria. They are also used indicate the sound levels at which level-based responses are more likely to occur.
3.1.5.2.3 Hooded Seal Controlled Exposure Study
Captive hooded seals (Cystophora cristata) were exposed to tonal signals in the 1 to 7 kHz band to determine the received SPL at which these animals would respond (Götz & Janik, 2010; Kvadsheim et al., 2010b). Hooded seals were exposed to three different mid-frequency upsweeps (1.2 – 1.7 kHz, 3.7 – 4.3 kHz, and 6 – 7 kHz) that started at a source level of 134 dB re 1 µPa @ 1 m and increased to 194 dB re 1 µPa @ 1 m; received levels were 10 – 27 dB lower depending on the animal’s position in the netted enclosure. The animals’ dive frequency and time spent at surface were monitored during the exposures, and changes to these were used as metrics of response. The seals showed no responses to received SPLs below about 160 dB re 1 µPa; once SPLs were between 160 – 170 dB re 1 µPa, the seals began actively
Criteria and Thresholds for U.S. Navy Acoustic and Explosive Effects Analysis (Phase III) June 2017
61
avoiding the sound source (at 5 m depth) by reducing their dive activity, rapidly swimming at the surface, and floating with their heads out of the water (Kvadsheim et al., 2010b).
These data were included were included in the quantitative derivation of the behavioral criteria.
3.1.5.2.4 Gray Seal Controlled Exposure Studies
Gotz and Janik (2011) exposed wild-caught gray seals (Halichoerus grypus) to a 1 kHz “startle” sound to investigate the signal characteristics associated with the triggering of the startle response. Animals were kept for a short time at the Sea Mammal Research Unit (SMRU) of St. Andrews, Scotland before being released. The seals were first exposed to received SPLs of 170 dB re 1 µPa, then to increasing SPLs from 140 to 180 dB re 1 µPa in 5 dB increments. Five out of the seven exposed animals responded initially at 170 dB re 1 µPa, then with a mean of 159 dB re 1 µPa, while two did not respond at all. During the course of the study, the animals that responded began sensitizing to the sound and their responses included cessation of feeding and avoidance of the sound source.
Götz (2008) also conducted boat-based playbacks of a variety of signals, including the startle stimuli used for the captive study. While he did observe that the number of animals close to the boat (e.g., within ~ 80 m) decreased and the number of animals further from the boat (~80-100 m) increased from the pre-exposure period to the during-exposure period, there was no way of knowing if the same animals were observed during each period.
Due to the types of responses obtained, some of the results of Gotz and Janik (2011) were included in the quantitative derivation of the behavioral criteria. While the results from Götz (2008) likely demonstrate avoidance of the sound source, the data could not be used for the quantitative derivation of the behavioral criteria because observed responses of individuals could not be correlated with specific received levels.
3.1.5.2.5 Striped Dolphin and Harbor Porpoise Alarm Study
Kastelein et al. (2006a) exposed a striped dolphin (Stenella coeruleoalba) and a harbor porpoise to an experimental acoustic alarm with a set of 16 tones with fundamental frequencies between 9 and 15 kHz. SPLs in the pen ranging from 116 dB re 1 µPa (for the fundamental 11 kHz tone) to 138 dB re 1 µPa (for the third harmonic of the 11 kHz tone). While the harbor porpoise responded by increasing its distance from the source (e.g., remaining on the opposite side of the pen) and increasing its respiration rate, the striped dolphin did not significantly change its distance to the source or respiration rate.
Since there is no data available that pairs the animals’ received level with behavioral response, these data were not used in the quantitative derivation of the behavioral criteria.
3.1.5.2.6 Harbor Seal High Frequency Sonar Study
Kastelein et al. (2015c) exposed two harbor seals (Phoca vitulina) to three different sonar signals around 25 kHz, with three averaged received levels across the pool (125 – 135, 137 – 147, and 156-158 dB re 1 µPa, depending on the sonar type). For two of the three signals, behavior did not change even at the highest average received levels. For the third, frequency modulated sonar signal, the seals swam faster, swam with their heads out of the water 2-4% more, and hauled out 1-2% more frequently at the intermediate and highest average received levels than during baseline periods. However, these responses were not tested statistically for significance, and at such low increments of increase were deemed not to rise to the level of a significant behavioral response under military readiness and were therefore not used in the derivation of the behavioral criteria.
Criteria and Thresholds for U.S. Navy Acoustic and Explosive Effects Analysis (Phase III) June 2017
62
3.1.6 Marine Mammal Species Groups
Data on behavioral responses to sonar and other transducers exist for relatively few species, which necessitates that species be divided into groups of related animals, either phylogenetically or by known species sensitivities and responses. The six primary groups for application of the Phase III criteria are Odontocetes (not including beaked whales or harbor porpoise), Pinnipeds, Mysticetes, Beaked Whales, and Harbor Porpoises. Little to no behavioral response data exists for manatees; as such, they are assigned to a surrogate behavioral criteria group.
The Odontocete group includes all oceanic toothed whales, with the exclusion of beaked whales and harbor porpoises. Behaviorally, odontocetes tend to have strong and complex social bonds, forming groups that range from a few to thousands of animals (Reeves et al., 2002). In many odontocete species these groups are comprised of related animals, and these join with other groups for mating and breeding. In other odontocetes, particularly the smaller delphinids, their social structure is more fission-fusion, with groups forming and reforming on timelines ranging from hours to days. This gregariousness often leads dolphins and porpoises to approach and swim within the pressure wave generated by moving ships and boats, a behavior known as bow riding. Not all species join in this behavior, and some appear to actively avoid vessels rather than approach (Henderson et al., 2014). All odontocetes use echolocation to navigate and hunt for prey, and in some cases for communication as well. Many odontocetes also vocalize using whistles and burst pulses, and these can range from simple flat whistles to complex, multi-part vocalizations that may be pod- or even individually-specific (Ford & Fisher, 1982; Lammers et al., 2003; Richardson et al., 1995). Due to similarities in behavioral traits and close taxonomic links, odontocetes (excluding beaked whales and harbor porpoises) are assigned to a single behavioral criteria group.
The Pinniped group is comprised of all phocids, otariids, and odobenids. Animals within this group spend their time both on land and at sea, although in varying degrees for different species (Reeves et al., 2002). While some species are found in remote locations, the dependence on land causes many pinniped species to be in close association with humans. Pinnipeds produce vocalizations in air and under water; these include calls between mothers and pups, alarm calls, mating displays, and aggressive exchanges between males, among others (Schusterman et al., 2001). Due to similarities in behavioral traits and close taxonomic links, pinnipeds are assigned to a single behavioral criteria group.
The Mysticete group contains all the baleen whales. Mysticetes are unique among marine mammals in that they have developed the use of baleen plates to filter fish, krill, zooplankton, and amphipods out of the water, although each family of mysticete has developed a different foraging specialization (Reeves et al., 2002). Baleen whales are the largest mammals, ranging from 20 to over 100 feet in length, and they produce low- and mid-frequency vocalizations, from 20 Hz up to 20-30 kHz (Richardson et al., 1995). These calls range from simple sweeps and moans to complex songs, and due to their lower frequency and high amplitude (120-190 dB re 1 µPa @ 1 m) they can be detected for hundreds of kilometers in the ocean. There is some evidence that baleen whale calls are increasing in amplitude (Parks et al., 2007a; Parks et al., 2011) or changing frequency (McDonald et al., 2009) in order to compete with the increasing background noise in the world’s oceans. Due to similarities in behavioral traits and close taxonomic links, mysticetes are assigned to a single behavioral criteria group.
Beaked Whales (family Ziphiidae) are a generally cryptic group, difficult to observe at the surface and tending to avoid vessels and underwater noise (Barlow & Gisiner, 2006). Beaked whales are deep divers, diving to depths of over 1-2 km to forage on squid and mesopelagic fish (Reeves et al., 2002; Schorr et al., 2014). Due to several mass stranding events of beaked whales in proximity to Navy training events (D'Amico et al., 2009), this group has been deemed highly sensitive to sonar and other active acoustics and they are considered separately from the other odontocetes.

Criteria and Thresholds for U.S. Navy Acoustic and Explosive Effects Analysis (Phase III) June 2017
63
Similarly, Harbor Porpoise have been shown to be highly sensitive to underwater noise, including acoustic pingers (Kastelein et al., 2000; Teilmann et al., 2006), pile driving (Kastelein et al., 2013d; Tougaard et al., 2009), and impulsive sounds (Kastelein et al., 2013c). The harbor porpoise is one of the smallest marine mammal species, and has a history of being hunted or incidentally caught by fisheries (Reeves et al., 2002). They are coastally distributed, further bringing them into contact with human activity. Due to these noted sensitivities, harbor porpoises are considered separately from the other odontocetes.
Manatees are another coastally distributed species that have a history of negative interaction with people; however, unlike harbor porpoise they may not be sensitive to noise. Rather, due to their slow swimming speeds and low profile at the surface, their main issue has been with vessel strikes, particularly by small watercraft (Jett et al., 2013; Nowacek et al., 2004b). Vessel noise may also be a concern (Miksis-Olds et al., 2007), but there is little other information available about manatee responses to other noise sources, including active sonar. Mysticetes, although distant, are the most closely related group of marine mammals taxonomically and share important behavioral traits (e.g., grazing); therefore, manatees are assigned to the mysticetes behavioral criteria group.
No data can be found on polar bear or sea otter reactions to underwater sounds, especially those from sonar or other transducers. Polar bears spend a good deal of their time on land or ice and little time with their heads submerged below the surface when they are swimming or hunting. Sea otters live in shallow coastal areas and spend a great deal of time floating at the surface, or conducting short foraging dives. Navy at-sea training and testing activities have little to no overlap with the range of these species, and therefore will not be analyzed further.
3.1.7 Dose and Contextual responses
The received level of sound may not always be the best predictor of a marine mammal’s behavioral reaction to a sound exposure. The context, including the animal’s behavioral state, animal’s previous experience with the sound, sound source speed and heading (either toward or away), and sound source distance, can all affect an animal’s reaction (Southall et al., 2007; Wartzok et al., 2003). Ellison et al. (2011) proposed dividing behavioral reactions into level-based responses and context-based responses
(see Figure 3-2). At higher amplitudes, a level-based response relates the received sound level to the probability of a behavioral response which is probably caused by auditory masking or annoyance (Ellison et al., 2011). At lower amplitudes, sound can cue the presence, proximity and approach of a sound source and stimulate a context-based response based on factors other than received sound level (e.g., the animal’s previous experience, sound source-animal separation distance, behavioral state [e.g., feeding, traveling]). It is highly probable based on evolutionary pressures for sound source localization in marine mammals (e.g., for mate localization, predator avoidance) that animals can distinguish the proximity of a sound source based on other characteristics of the received signal besides amplitude (e.g., multipath characteristics, frequency content, signal distortion).
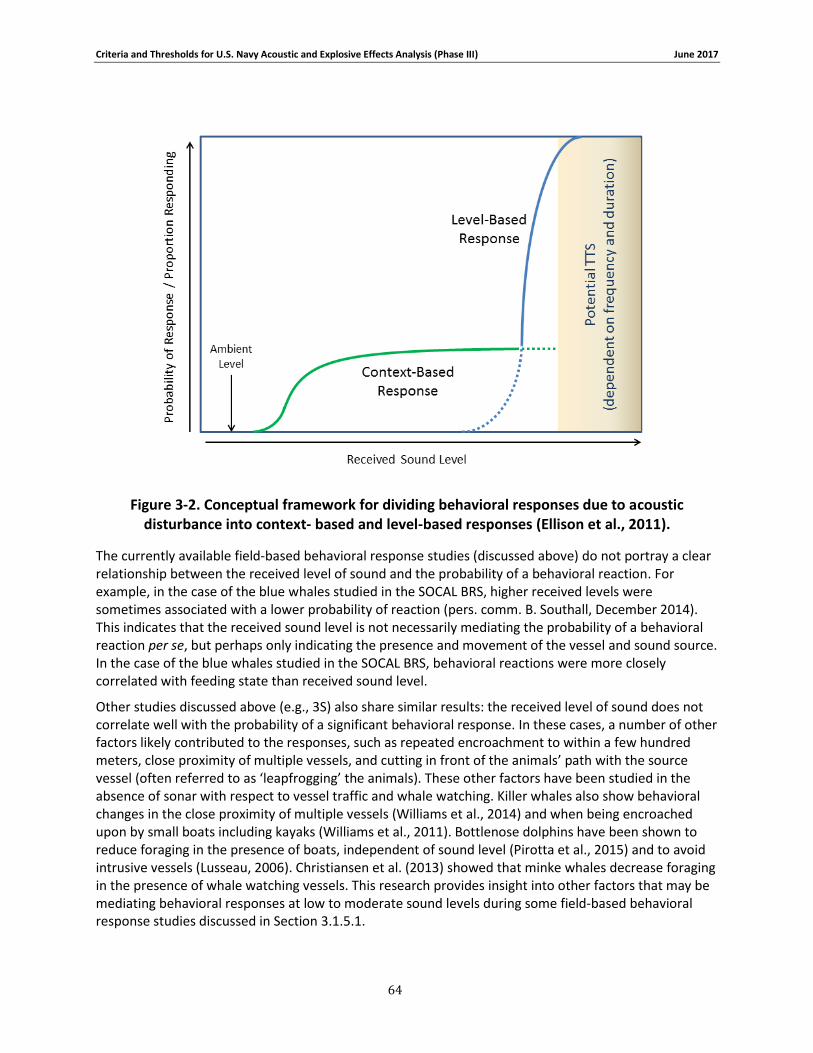
Criteria and Thresholds for U.S. Navy Acoustic and Explosive Effects Analysis (Phase III) June 2017
64
Figure 3-2. Conceptual framework for dividing behavioral responses due to acoustic disturbance into context- based and level-based responses (Ellison et al., 2011).
The currently available field-based behavioral response studies (discussed above) do not portray a clear relationship between the received level of sound and the probability of a behavioral reaction. For example, in the case of the blue whales studied in the SOCAL BRS, higher received levels were sometimes associated with a lower probability of reaction (pers. comm. B. Southall, December 2014). This indicates that the received sound level is not necessarily mediating the probability of a behavioral reaction per se, but perhaps only indicating the presence and movement of the vessel and sound source. In the case of the blue whales studied in the SOCAL BRS, behavioral reactions were more closely correlated with feeding state than received sound level.
Other studies discussed above (e.g., 3S) also share similar results: the received level of sound does not correlate well with the probability of a significant behavioral response. In these cases, a number of other factors likely contributed to the responses, such as repeated encroachment to within a few hundred meters, close proximity of multiple vessels, and cutting in front of the animals’ path with the source vessel (often referred to as ‘leapfrogging’ the animals). These other factors have been studied in the absence of sonar with respect to vessel traffic and whale watching. Killer whales also show behavioral changes in the close proximity of multiple vessels (Williams et al., 2014) and when being encroached upon by small boats including kayaks (Williams et al., 2011). Bottlenose dolphins have been shown to reduce foraging in the presence of boats, independent of sound level (Pirotta et al., 2015) and to avoid intrusive vessels (Lusseau, 2006). Christiansen et al. (2013) showed that minke whales decrease foraging in the presence of whale watching vessels. This research provides insight into other factors that may be mediating behavioral responses at low to moderate sound levels during some field-based behavioral response studies discussed in Section 3.1.5.1.
Criteria and Thresholds for U.S. Navy Acoustic and Explosive Effects Analysis (Phase III) June 2017
65
In relation to the conceptual model shown in Figure 3-2, many of the responses from field-based behavioral studies occur at moderate to low sound levels, in several cases close to the ambient noise level (Miller et al., 2012). As mentioned previously, these reactions do not show an increased probability with increasing received sound level; therefore, it is likely that these reactions are primarily mediated by
contextual factors and would fall under the “Context-Based Response” (green curve) on Figure 3-2. In contrast, results from the controlled exposure sessions using Navy dolphins and sea lions represent reactions that are primarily mediated by the sound level and therefore fall under the “Level-Based
Response” (blue curve) in Figure 3-2. This is an important distinction because within the region of context-based response, factors other than sound level, such as proximity and motion of the sound source, are likely to be more important factors in predicting a significant behavioral response.
As discussed below in the Section 3.1.8, a biphasic curve provided the best fit to the existing behavioral response data when received level alone is used as the independent variable dictating the probability of a significant response. The biphasic curve is actually a series of two sigmoidal curves that approximates
the shape of the illustration in Figure 3-2. As discussed above significant reactions at lower to moderate received levels are mediated by factors other than sound level; but nevertheless, data that relates received level to behavioral reaction is what is currently available. The Navy will take into consideration other factors besides received level when available at low to moderate sound levels when estimating significant behavioral responses to sonar and other transducers during training and testing activities.
3.1.8 Behavioral Response Functions and Thresholds for Sonar and Other Transducers
Behavioral response studies that were designed to record behavioral observations and contained detailed data on reactions at specific received sound levels were used quantitatively in the derivation of the Phase III behavioral criteria. Specifically, data needed to meet both of the following criteria to be used in the quantitative derivation:
Observations of individual/group animal behavior were related to known or estimable received levels.
The study was primarily designed to observe behavioral changes during controlled exposures or actual Navy activities (i.e., monitoring).
Data from the applicable studies (see Table 3-3 through Table 3-7 below) were obtained from published materials. Exposure and behavioral response data for the 3S and BRS studies were also directly discussed with the researchers (P. Miller, P. Wensveen, P. Kvadsheim, F.P. Lam, B. Southall, J. Goldbogen, and J. Calambokidis). In addition, D. Houser (Dolphin and Sea Lion CES) is a contributor to this report. Finally, L. Thomas and P. Wensveen contributed significantly to the Bayesian methodology from which the Navy derived response functions.
Limited data exist for behavioral responses of harbor porpoises, sirenians, and sea turtles to sonar and other transducers. For harbor porpoises, the information currently available suggests a very low threshold level of response for both captive and wild animals, and the mysticete BRF will be used as a proxy for sirenians. Existing behavioral data to air gun exposures (See McCauley et al., 2000) was applied for sea turtles.
3.1.8.1 Bayesian Biphasic Model
A Bayesian biphasic dose response function was developed that was a generalization of the monophasic function previously developed and applied to BRS data (Antunes et al., 2014; Miller et al., 2014). As
Criteria and Thresholds for U.S. Navy Acoustic and Explosive Effects Analysis (Phase III) June 2017
66
discussed in Section 3.1.5, individual animals in these data may have undergone multiple controlled exposure sessions (one or more consecutive, replicate trials); for each session the animal had some threshold, t, at which it did or did not respond. There were generally two types of data used for this analysis. The first was received levels taken from tagged animals during behavioral response studies on wild animals exposed to an escalating level of sonar (Section 3.1.5.1). In that case either the received level at the time of the first significant response (as described in Section 3.1.2) or the maximum received level of that exposure if no response occurred was used. Multiple exposures could have occurred per animal, but only one received level per session was used in the model. The second type of data was from controlled exposure studies on captive animals (Section 3.1.5.2). In some of these, an animal was only exposed to a single received level, which was the level input into the model, whereas in others an animal may have been exposed to an escalating received level, for which the level at the time of the response or the maximum level exposed was used in the model.
In the monophasic approach previously used (Miller et al., 2014), this threshold was sampled from a truncated normal distribution; this normal distribution had an overall mean, a between-whale standard deviation and a between-trial within-whale standard deviation. Because each threshold was sampled from a truncated normal distribution, the overall dose response function can be thought of (approximately) as coming from a cumulative truncated normal distribution function (CDF), giving the characteristic “S”-shape. It is approximate because each trial has its own CDF and the overall function is a mixture of these CDFs.
Here, we generalized by allowing the threshold to come from one of two truncated normal distributions, one with lower exposure values than the other. Following the logic of Ellison et al. (2011), the lower distribution is referred to as context-dependent, while the upper is dose-dependent (although note that both distributions are, in fact, dose-dependent). The upper function could also be thought to be driven by uncomfortable loudness, or perhaps, annoyance (Ellison et al., 2011). One may expect the standard deviation of the context-dependent function to be larger than the dose-response function, leading to a “flatter” CDF, and also to have the probability for each animal and trial of the threshold being sampled from the lower function being dependent on context-related covariates (so “context-dependent”)
(Figure 3-2Figure 3-2).
The generalized marine mammal Bayesian biphasic dose response function is made up of two truncated cumulative normal distribution functions (CDF) with separate mean (nu1 and nu2) and standard deviation (tau1 and tau2) values, as well as upper (U) and lower (L) bounds. The upper bound of the lower CDF, or the context-dependent response portion, has the same value as the lower bound of the upper CDF, or the dose-response response portion (e.g., U1 = L2). This value is another parameter determined by the model, with the bounds falling between 120 and 160 dB. The model assumes all animals have the same mean and standard deviation parameters (and hence the same context-dependent response function and dose-dependent response functions), but that they differ in how likely they are to display the context-dependent function as opposed to the dose-dependent function in a given exposure session. The probability of whale i displaying the context-dependent response in a particular exposure session is given in the model by the value of pii – for example, if pii = 0.7 then there is a 70% chance that the context-dependent function will be used in determining whether there is a response and a 30% chance that the dose-dependent function will be used. The value for pi for each whale is determined by two parameters – a mean, mu, and a standard deviation, phi. As is common when modelling probabilities (in this case, the probability of having a context-dependent as opposed to dose-dependent function), pi is modeled on the probit scale – in other words pi comes from a normal CDF with mean (mu) and standard deviation (phi). Mu should, realistically, stay in the range -2 to 2 if the biphasic pattern is present in the data: when mu is -2, the expected value of pi is 0.02 – i.e., we expect
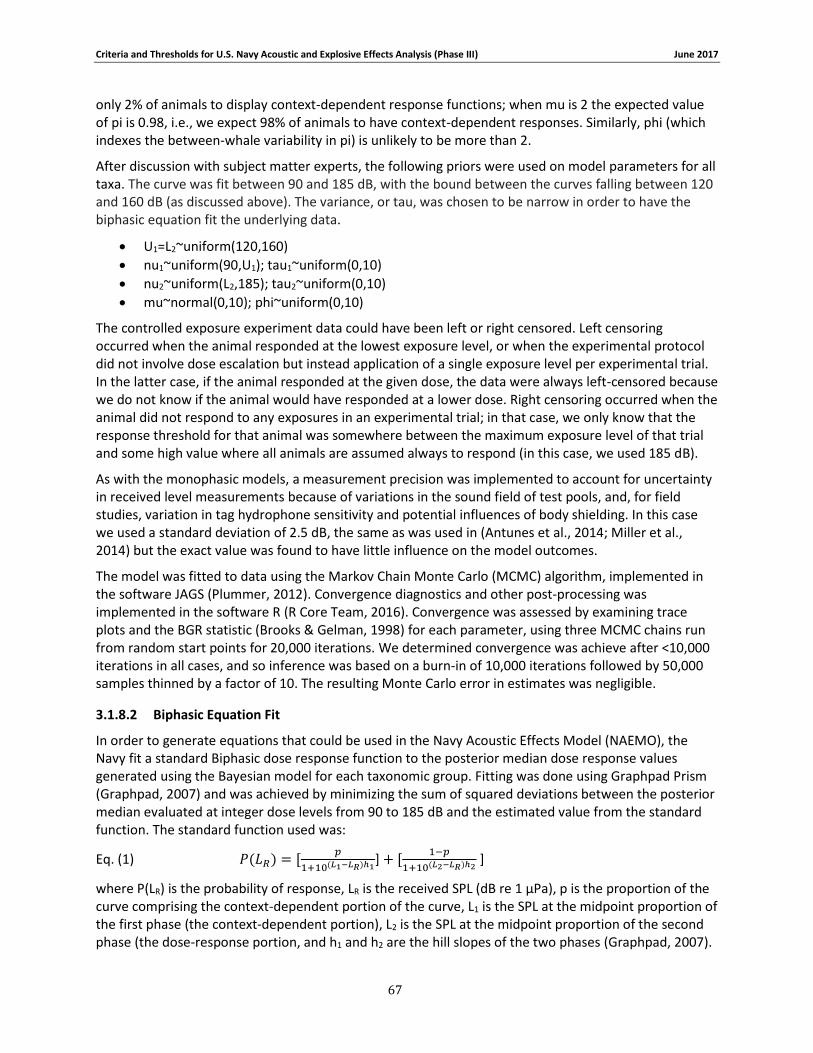
Criteria and Thresholds for U.S. Navy Acoustic and Explosive Effects Analysis (Phase III) June 2017
67
only 2% of animals to display context-dependent response functions; when mu is 2 the expected value of pi is 0.98, i.e., we expect 98% of animals to have context-dependent responses. Similarly, phi (which indexes the between-whale variability in pi) is unlikely to be more than 2.
After discussion with subject matter experts, the following priors were used on model parameters for all taxa. The curve was fit between 90 and 185 dB, with the bound between the curves falling between 120 and 160 dB (as discussed above). The variance, or tau, was chosen to be narrow in order to have the biphasic equation fit the underlying data.
U1=L2~uniform(120,160)
nu1~uniform(90,U1); tau1~uniform(0,10)
nu2~uniform(L2,185); tau2~uniform(0,10)
mu~normal(0,10); phi~uniform(0,10)
The controlled exposure experiment data could have been left or right censored. Left censoring occurred when the animal responded at the lowest exposure level, or when the experimental protocol did not involve dose escalation but instead application of a single exposure level per experimental trial. In the latter case, if the animal responded at the given dose, the data were always left-censored because we do not know if the animal would have responded at a lower dose. Right censoring occurred when the animal did not respond to any exposures in an experimental trial; in that case, we only know that the response threshold for that animal was somewhere between the maximum exposure level of that trial and some high value where all animals are assumed always to respond (in this case, we used 185 dB).
As with the monophasic models, a measurement precision was implemented to account for uncertainty in received level measurements because of variations in the sound field of test pools, and, for field studies, variation in tag hydrophone sensitivity and potential influences of body shielding. In this case we used a standard deviation of 2.5 dB, the same as was used in (Antunes et al., 2014; Miller et al., 2014) but the exact value was found to have little influence on the model outcomes.
The model was fitted to data using the Markov Chain Monte Carlo (MCMC) algorithm, implemented in the software JAGS (Plummer, 2012). Convergence diagnostics and other post-processing was implemented in the software R (R Core Team, 2016). Convergence was assessed by examining trace plots and the BGR statistic (Brooks & Gelman, 1998) for each parameter, using three MCMC chains run from random start points for 20,000 iterations. We determined convergence was achieve after <10,000 iterations in all cases, and so inference was based on a burn-in of 10,000 iterations followed by 50,000 samples thinned by a factor of 10. The resulting Monte Carlo error in estimates was negligible.
3.1.8.2 Biphasic Equation Fit
In order to generate equations that could be used in the Navy Acoustic Effects Model (NAEMO), the Navy fit a standard Biphasic dose response function to the posterior median dose response values generated using the Bayesian model for each taxonomic group. Fitting was done using Graphpad Prism (Graphpad, 2007) and was achieved by minimizing the sum of squared deviations between the posterior median evaluated at integer dose levels from 90 to 185 dB and the estimated value from the standard function. The standard function used was:
Eq. (1) 𝑃(𝐿𝑅) = [𝑝
1+10(𝐿1−𝐿𝑅)ℎ1] + [
1−𝑝
1+10(𝐿2−𝐿𝑅)ℎ2 ]
where P(LR) is the probability of response, LR is the received SPL (dB re 1 µPa), p is the proportion of the curve comprising the context-dependent portion of the curve, L1 is the SPL at the midpoint proportion of the first phase (the context-dependent portion), L2 is the SPL at the midpoint proportion of the second phase (the dose-response portion, and h1 and h2 are the hill slopes of the two phases (Graphpad, 2007).
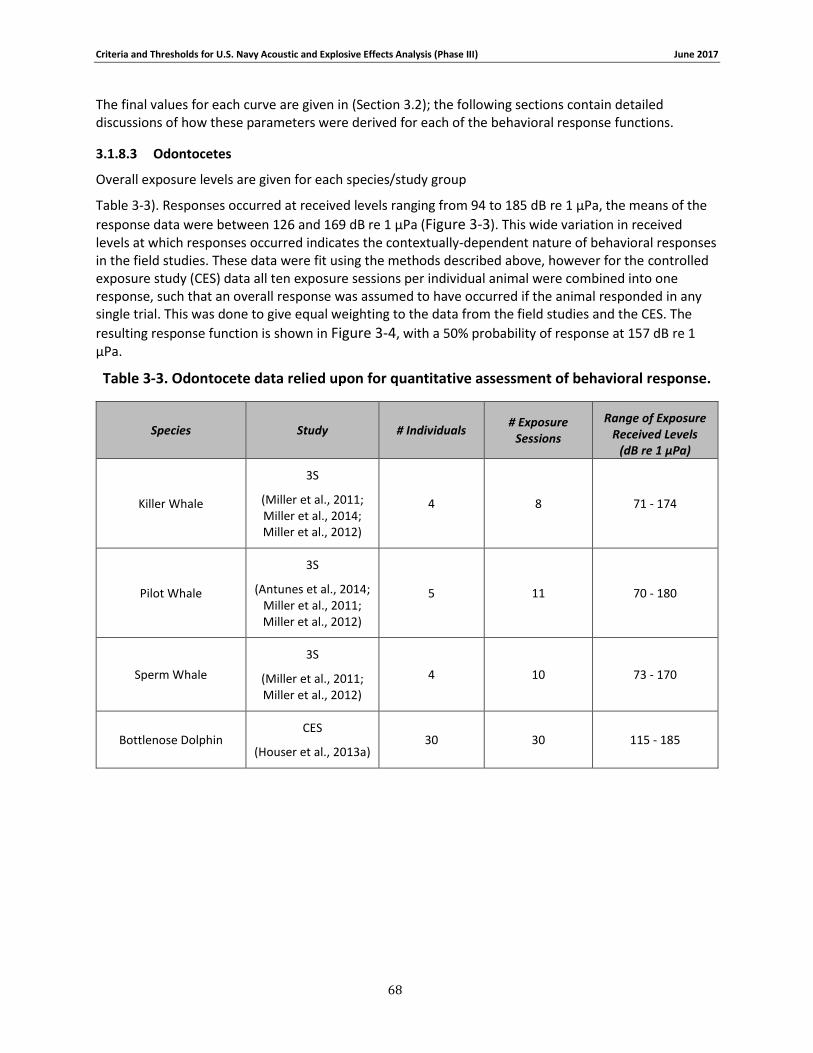
Criteria and Thresholds for U.S. Navy Acoustic and Explosive Effects Analysis (Phase III) June 2017
68
The final values for each curve are given in (Section 3.2); the following sections contain detailed discussions of how these parameters were derived for each of the behavioral response functions.
3.1.8.3 Odontocetes
Overall exposure levels are given for each species/study group
Table 3-3). Responses occurred at received levels ranging from 94 to 185 dB re 1 µPa, the means of the
response data were between 126 and 169 dB re 1 µPa (Figure 3-3). This wide variation in received levels at which responses occurred indicates the contextually-dependent nature of behavioral responses in the field studies. These data were fit using the methods described above, however for the controlled exposure study (CES) data all ten exposure sessions per individual animal were combined into one response, such that an overall response was assumed to have occurred if the animal responded in any single trial. This was done to give equal weighting to the data from the field studies and the CES. The
resulting response function is shown in Figure 3-4, with a 50% probability of response at 157 dB re 1 µPa.
Table 3-3. Odontocete data relied upon for quantitative assessment of behavioral response.
Species Study # Individuals # Exposure
Sessions
Range of Exposure Received Levels
(dB re 1 µPa)
Killer Whale
3S
(Miller et al., 2011; Miller et al., 2014; Miller et al., 2012)
4 8 71 - 174
Pilot Whale
3S
(Antunes et al., 2014; Miller et al., 2011; Miller et al., 2012)
5 11
70 - 180
Sperm Whale
3S
(Miller et al., 2011; Miller et al., 2012)
4 10 73 - 170
Bottlenose Dolphin CES
(Houser et al., 2013a) 30 30 115 - 185

Criteria and Thresholds for U.S. Navy Acoustic and Explosive Effects Analysis (Phase III) June 2017
69
Figure 3-3. Received levels at the time of Odontocete responses (in circles) or maximum received levels when there was no response (in squares). 3S killer whales are shown in blue,
3S pilot whales are shown in orange, 3S sperm whales are shown in green, and CES bottlenose dolphins are shown in yellow.
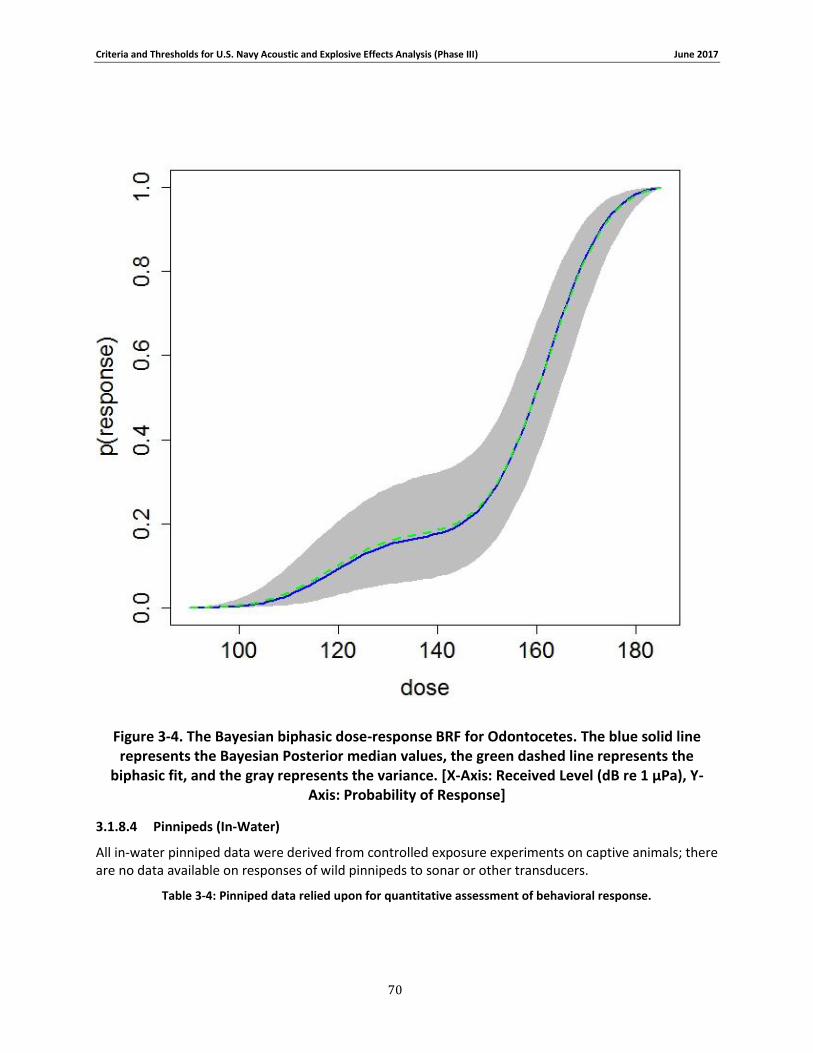
Criteria and Thresholds for U.S. Navy Acoustic and Explosive Effects Analysis (Phase III) June 2017
70
Figure 3-4. The Bayesian biphasic dose-response BRF for Odontocetes. The blue solid line represents the Bayesian Posterior median values, the green dashed line represents the
biphasic fit, and the gray represents the variance. [X-Axis: Received Level (dB re 1 μPa), Y-Axis: Probability of Response]
3.1.8.4 Pinnipeds (In-Water)
All in-water pinniped data were derived from controlled exposure experiments on captive animals; there are no data available on responses of wild pinnipeds to sonar or other transducers.
Table 3-4: Pinniped data relied upon for quantitative assessment of behavioral response.
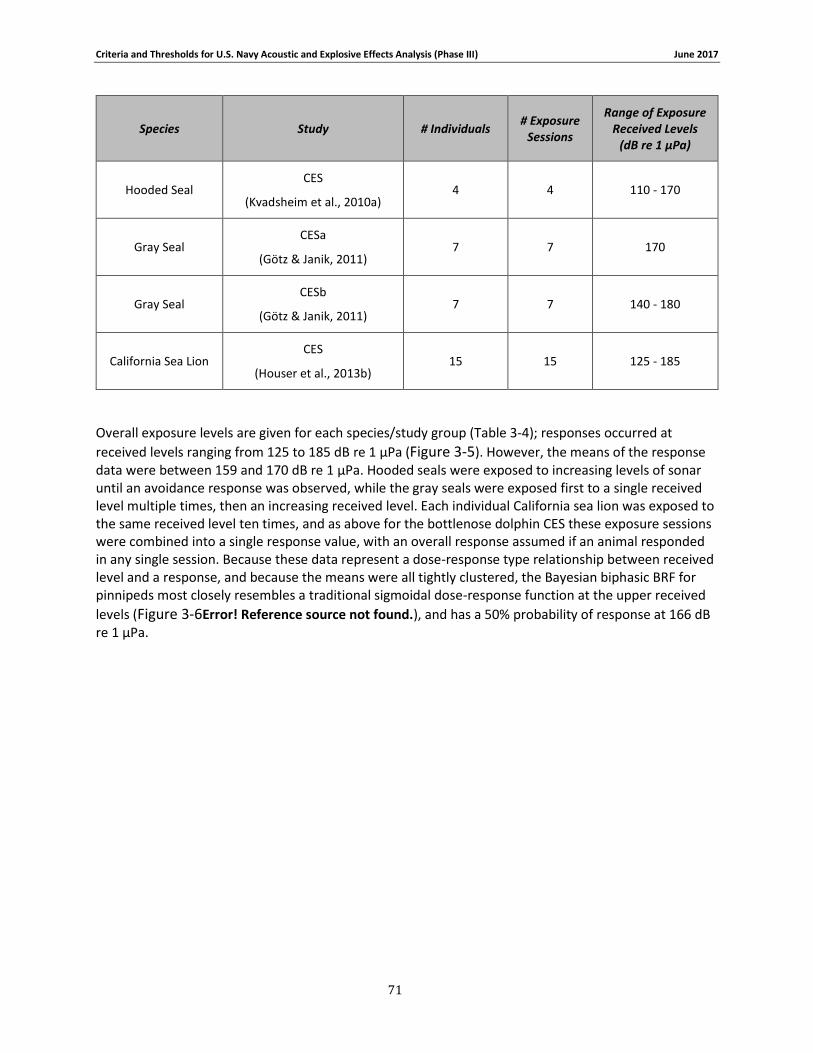
Criteria and Thresholds for U.S. Navy Acoustic and Explosive Effects Analysis (Phase III) June 2017
71
Species Study # Individuals # Exposure
Sessions
Range of Exposure Received Levels
(dB re 1 µPa)
Hooded Seal CES
(Kvadsheim et al., 2010a) 4 4 110 - 170
Gray Seal CESa
(Götz & Janik, 2011) 7 7 170
Gray Seal CESb
(Götz & Janik, 2011) 7 7 140 - 180
California Sea Lion CES
(Houser et al., 2013b) 15 15 125 - 185
Overall exposure levels are given for each species/study group (Table 3-4); responses occurred at
received levels ranging from 125 to 185 dB re 1 µPa (Figure 3-5). However, the means of the response data were between 159 and 170 dB re 1 µPa. Hooded seals were exposed to increasing levels of sonar until an avoidance response was observed, while the gray seals were exposed first to a single received level multiple times, then an increasing received level. Each individual California sea lion was exposed to the same received level ten times, and as above for the bottlenose dolphin CES these exposure sessions were combined into a single response value, with an overall response assumed if an animal responded in any single session. Because these data represent a dose-response type relationship between received level and a response, and because the means were all tightly clustered, the Bayesian biphasic BRF for pinnipeds most closely resembles a traditional sigmoidal dose-response function at the upper received
levels (Figure 3-6Error! Reference source not found.), and has a 50% probability of response at 166 dB re 1 µPa.
Criteria and Thresholds for U.S. Navy Acoustic and Explosive Effects Analysis (Phase III) June 2017
72
Figure 3-5. Received levels at the time of Pinniped responses (in circles) or maximum received levels when there was no response (in squares). CES California sea lions are shown in yellow, CESa gray seals are shown in blue, CESb gray seals are shown in green, and CES hooded seals
are shown in red.
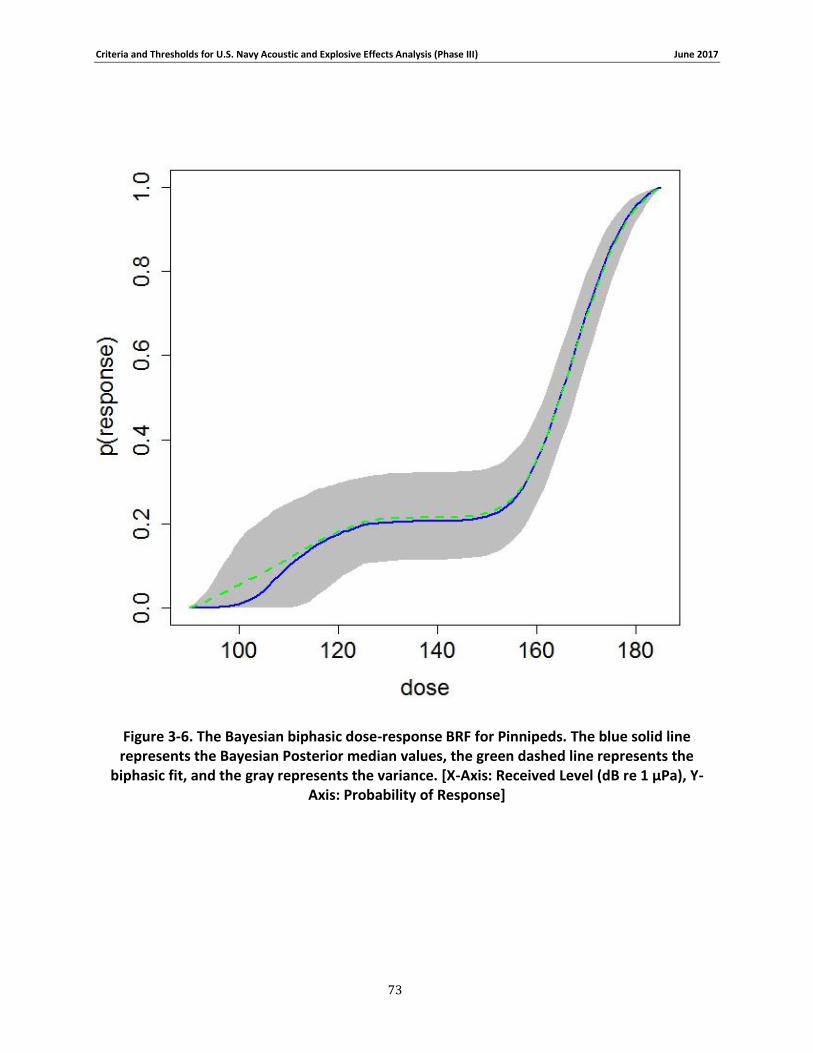
Criteria and Thresholds for U.S. Navy Acoustic and Explosive Effects Analysis (Phase III) June 2017
73
Figure 3-6. The Bayesian biphasic dose-response BRF for Pinnipeds. The blue solid line represents the Bayesian Posterior median values, the green dashed line represents the
biphasic fit, and the gray represents the variance. [X-Axis: Received Level (dB re 1 μPa), Y-Axis: Probability of Response]
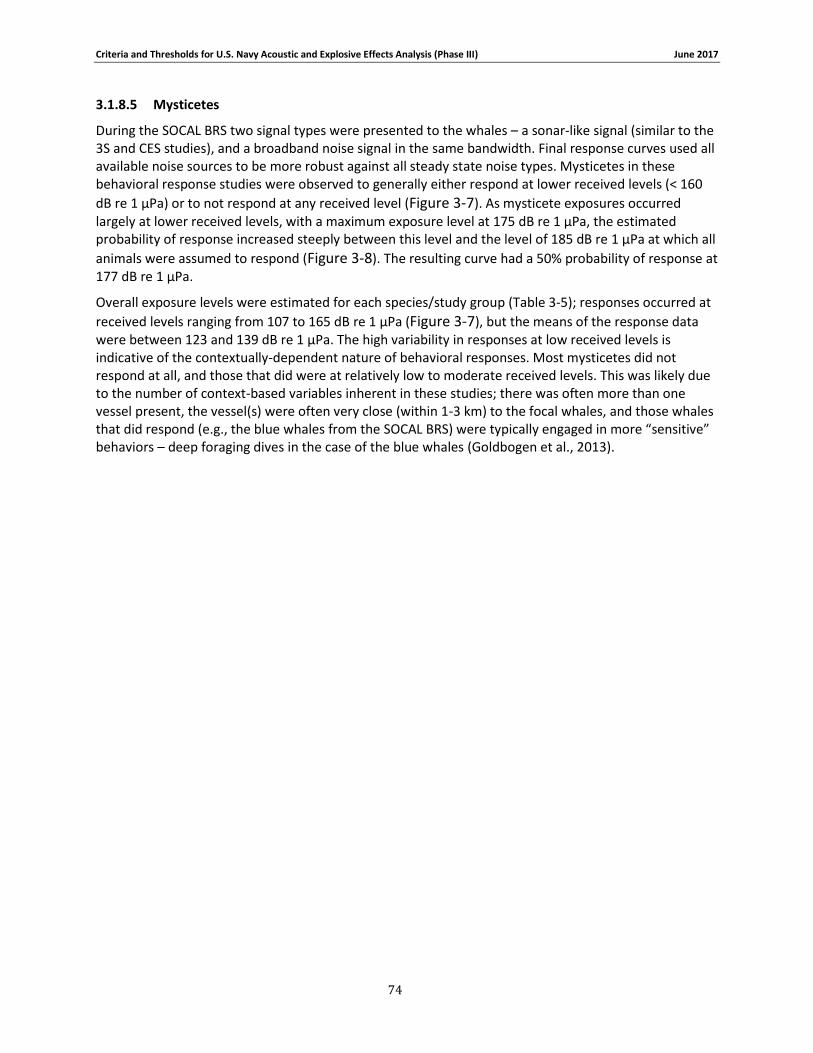
Criteria and Thresholds for U.S. Navy Acoustic and Explosive Effects Analysis (Phase III) June 2017
74
3.1.8.5 Mysticetes
During the SOCAL BRS two signal types were presented to the whales – a sonar-like signal (similar to the 3S and CES studies), and a broadband noise signal in the same bandwidth. Final response curves used all available noise sources to be more robust against all steady state noise types. Mysticetes in these behavioral response studies were observed to generally either respond at lower received levels (< 160
dB re 1 μPa) or to not respond at any received level (Figure 3-7). As mysticete exposures occurred largely at lower received levels, with a maximum exposure level at 175 dB re 1 μPa, the estimated probability of response increased steeply between this level and the level of 185 dB re 1 µPa at which all
animals were assumed to respond (Figure 3-8). The resulting curve had a 50% probability of response at 177 dB re 1 µPa.
Overall exposure levels were estimated for each species/study group (Table 3-5); responses occurred at
received levels ranging from 107 to 165 dB re 1 µPa (Figure 3-7), but the means of the response data were between 123 and 139 dB re 1 µPa. The high variability in responses at low received levels is indicative of the contextually-dependent nature of behavioral responses. Most mysticetes did not respond at all, and those that did were at relatively low to moderate received levels. This was likely due to the number of context-based variables inherent in these studies; there was often more than one vessel present, the vessel(s) were often very close (within 1-3 km) to the focal whales, and those whales that did respond (e.g., the blue whales from the SOCAL BRS) were typically engaged in more “sensitive” behaviors – deep foraging dives in the case of the blue whales (Goldbogen et al., 2013).

Criteria and Thresholds for U.S. Navy Acoustic and Explosive Effects Analysis (Phase III) June 2017
75
Table 3-5: Mysticete data relied upon for quantitative assessment of behavioral response.
Species Study # Individuals # Exposures Range of Exposure
Received Levels (dB re 1 µPa)
Blue Whale
SOCAL BRS
(Goldbogen et al., 2013; Southall pers.
Comm.)
16 30 94 - 165
Humpback Whale 3S
(Sivle et al., 2015) 10 20 85 - 182
Minke Whale 3S
(Sivle et al., 2015) 1 1 83 - 158
North Atlantic Right Whale
Ship Alarm
(Nowacek et al., 2004a)
6 6 133 - 148
Fin Whale LFA Playbacks
(Clark et al., 1999) 6 6 115 - 148
Blue Whale LFA Playbacks
(Clark et al., 1999) 1 1 95 - 150
Humpback Whale LFA Playbacks (Clark et
al., 1999) 17 17 121 - 150

Criteria and Thresholds for U.S. Navy Acoustic and Explosive Effects Analysis (Phase III) June 2017
76
Figure 3-7. Received levels at the time of Mysticete responses (in circles) or maximum received levels when there was no response (in squares). 3S humpbacks are shown in dark
blue, the 3S minke whale is shown in red, BRS blue whales are shown in brown, North Atlantic right whales are shown in gray, LFA fin whales are shown in yellow, the LFA blue
whale is shown in light blue, and LFA humpback whales are shown in green.
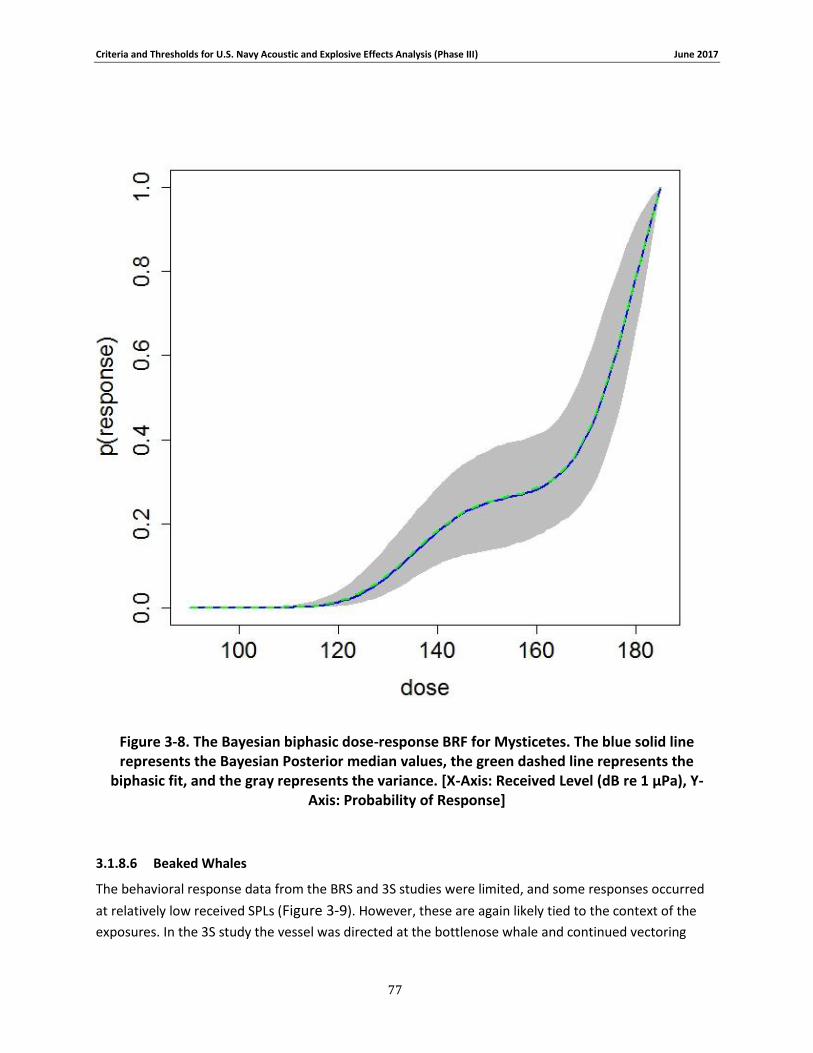
Criteria and Thresholds for U.S. Navy Acoustic and Explosive Effects Analysis (Phase III) June 2017
77
Figure 3-8. The Bayesian biphasic dose-response BRF for Mysticetes. The blue solid line represents the Bayesian Posterior median values, the green dashed line represents the
biphasic fit, and the gray represents the variance. [X-Axis: Received Level (dB re 1 μPa), Y-Axis: Probability of Response]
3.1.8.6 Beaked Whales
The behavioral response data from the BRS and 3S studies were limited, and some responses occurred
at relatively low received SPLs (Figure 3-9). However, these are again likely tied to the context of the
exposures. In the 3S study the vessel was directed at the bottlenose whale and continued vectoring
Criteria and Thresholds for U.S. Navy Acoustic and Explosive Effects Analysis (Phase III) June 2017
78
around the animal, while in the SOCAL BRS there were multiple vessels within 1-3 km of the animals. It
should be pointed out that the third SOCAL BRS beaked whale that did not respond (
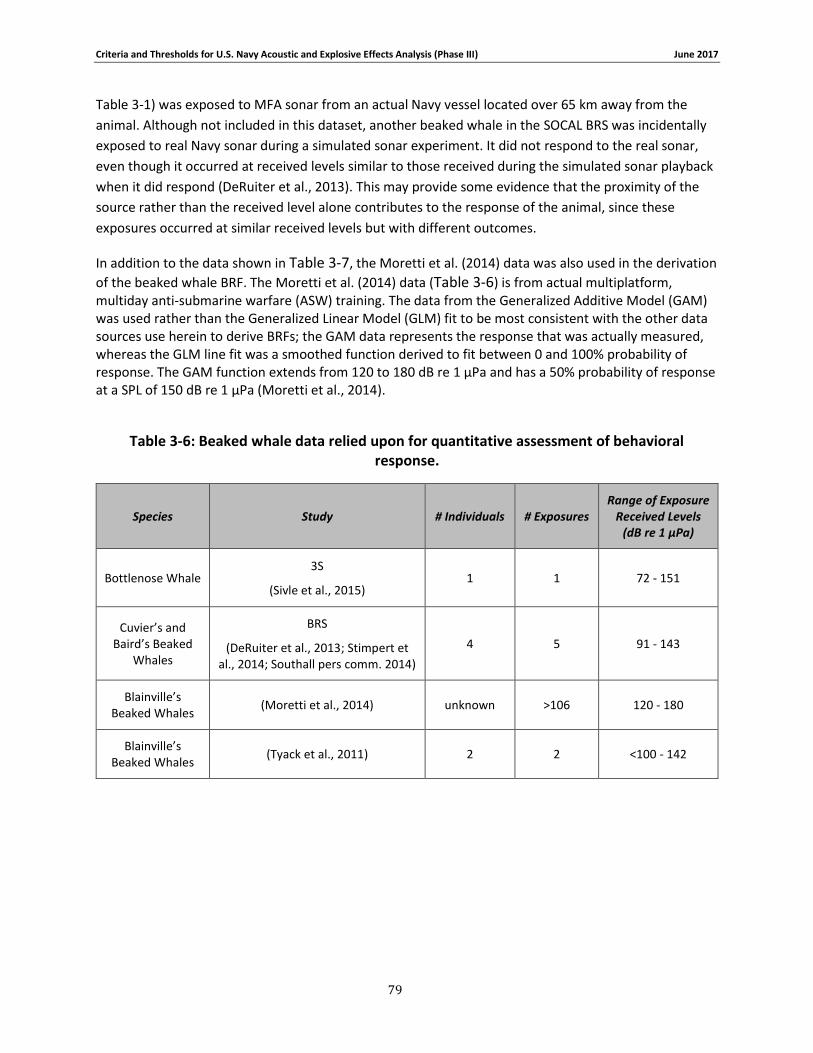
Criteria and Thresholds for U.S. Navy Acoustic and Explosive Effects Analysis (Phase III) June 2017
79
Table 3-1) was exposed to MFA sonar from an actual Navy vessel located over 65 km away from the
animal. Although not included in this dataset, another beaked whale in the SOCAL BRS was incidentally
exposed to real Navy sonar during a simulated sonar experiment. It did not respond to the real sonar,
even though it occurred at received levels similar to those received during the simulated sonar playback
when it did respond (DeRuiter et al., 2013). This may provide some evidence that the proximity of the
source rather than the received level alone contributes to the response of the animal, since these
exposures occurred at similar received levels but with different outcomes.
In addition to the data shown in Table 3-7, the Moretti et al. (2014) data was also used in the derivation
of the beaked whale BRF. The Moretti et al. (2014) data (Table 3-6) is from actual multiplatform, multiday anti-submarine warfare (ASW) training. The data from the Generalized Additive Model (GAM) was used rather than the Generalized Linear Model (GLM) fit to be most consistent with the other data sources use herein to derive BRFs; the GAM data represents the response that was actually measured, whereas the GLM line fit was a smoothed function derived to fit between 0 and 100% probability of response. The GAM function extends from 120 to 180 dB re 1 µPa and has a 50% probability of response at a SPL of 150 dB re 1 µPa (Moretti et al., 2014).
Table 3-6: Beaked whale data relied upon for quantitative assessment of behavioral response.
Species Study # Individuals # Exposures Range of Exposure
Received Levels (dB re 1 µPa)
Bottlenose Whale 3S
(Sivle et al., 2015) 1 1 72 - 151
Cuvier’s and Baird’s Beaked
Whales
BRS
(DeRuiter et al., 2013; Stimpert et al., 2014; Southall pers comm. 2014)
4 5 91 - 143
Blainville’s Beaked Whales
(Moretti et al., 2014) unknown >106 120 - 180
Blainville’s Beaked Whales
(Tyack et al., 2011) 2 2 <100 - 142
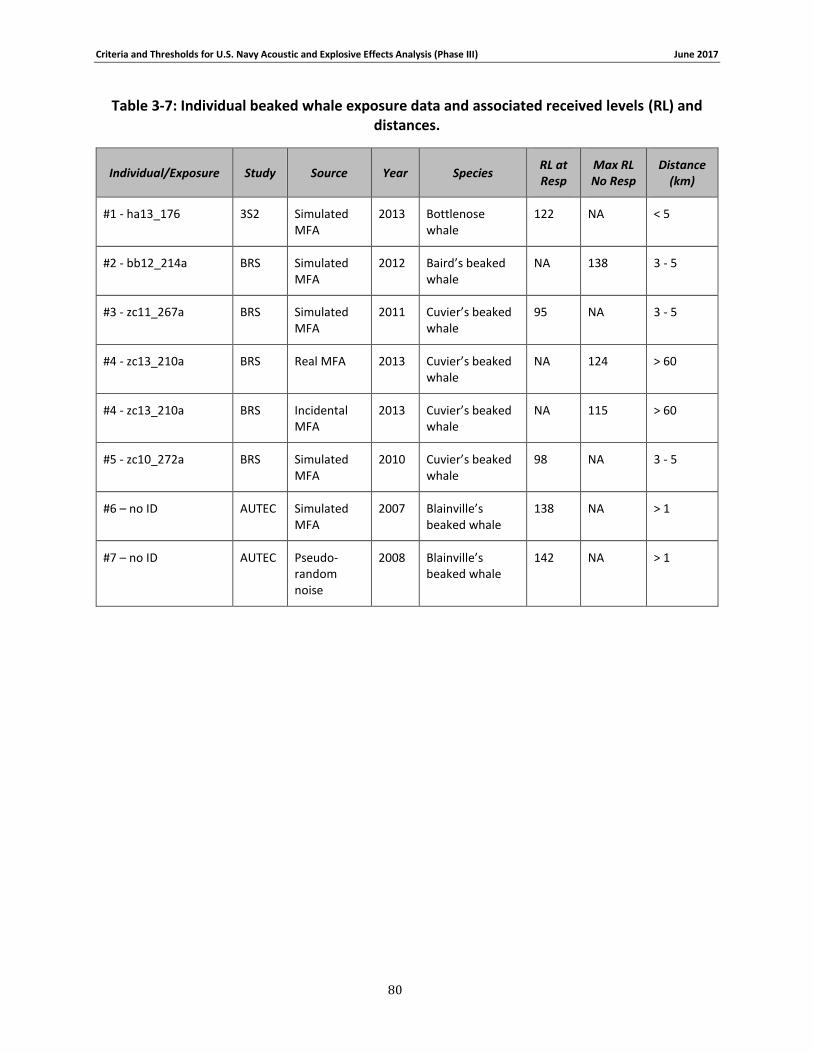
Criteria and Thresholds for U.S. Navy Acoustic and Explosive Effects Analysis (Phase III) June 2017
80
Table 3-7: Individual beaked whale exposure data and associated received levels (RL) and distances.
Individual/Exposure Study Source Year Species RL at Resp
Max RL No Resp
Distance (km)
#1 - ha13_176 3S2 Simulated MFA
2013 Bottlenose whale
122 NA < 5
#2 - bb12_214a BRS Simulated MFA
2012 Baird’s beaked whale
NA 138 3 - 5
#3 - zc11_267a BRS Simulated MFA
2011 Cuvier’s beaked whale
95 NA 3 - 5
#4 - zc13_210a BRS Real MFA 2013 Cuvier’s beaked whale
NA 124 > 60
#4 - zc13_210a BRS Incidental MFA
2013 Cuvier’s beaked whale
NA 115 > 60
#5 - zc10_272a BRS Simulated MFA
2010 Cuvier’s beaked whale
98 NA 3 - 5
#6 – no ID AUTEC Simulated MFA
2007 Blainville’s beaked whale
138 NA > 1
#7 – no ID AUTEC Pseudo-random noise
2008 Blainville’s beaked whale
142 NA > 1
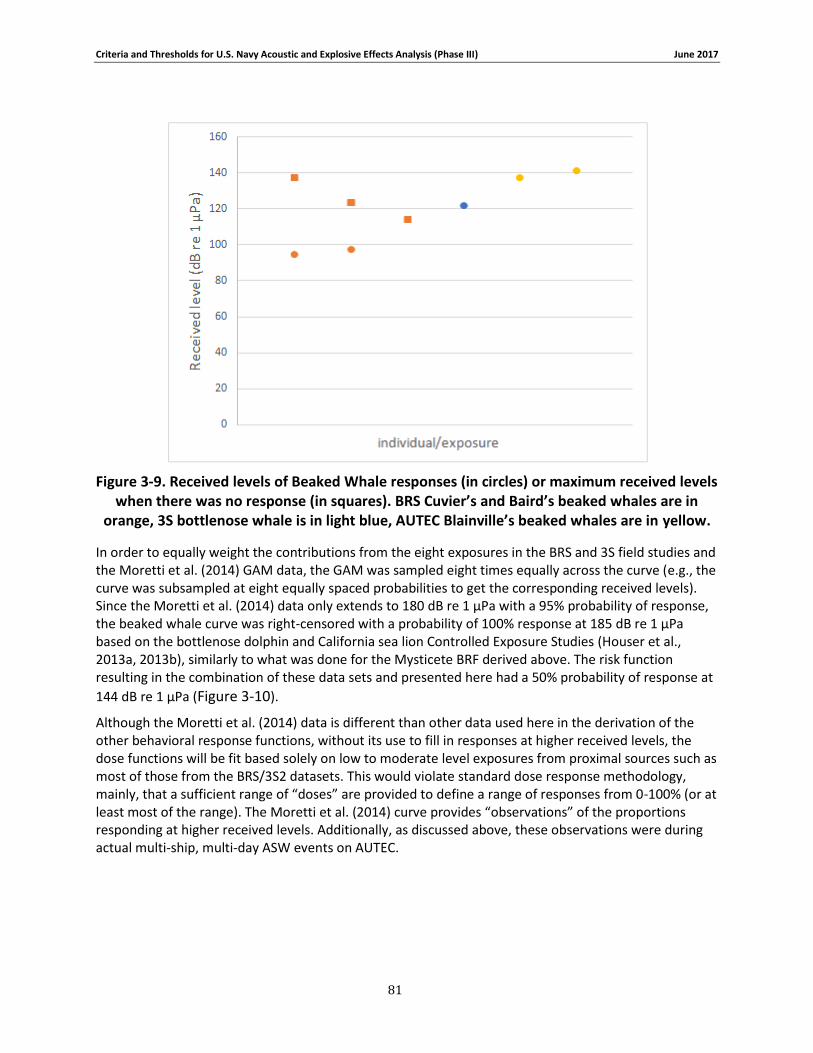
Criteria and Thresholds for U.S. Navy Acoustic and Explosive Effects Analysis (Phase III) June 2017
81
Figure 3-9. Received levels of Beaked Whale responses (in circles) or maximum received levels when there was no response (in squares). BRS Cuvier’s and Baird’s beaked whales are in
orange, 3S bottlenose whale is in light blue, AUTEC Blainville’s beaked whales are in yellow.
In order to equally weight the contributions from the eight exposures in the BRS and 3S field studies and the Moretti et al. (2014) GAM data, the GAM was sampled eight times equally across the curve (e.g., the curve was subsampled at eight equally spaced probabilities to get the corresponding received levels). Since the Moretti et al. (2014) data only extends to 180 dB re 1 µPa with a 95% probability of response, the beaked whale curve was right-censored with a probability of 100% response at 185 dB re 1 µPa based on the bottlenose dolphin and California sea lion Controlled Exposure Studies (Houser et al., 2013a, 2013b), similarly to what was done for the Mysticete BRF derived above. The risk function resulting in the combination of these data sets and presented here had a 50% probability of response at
144 dB re 1 µPa (Figure 3-10).
Although the Moretti et al. (2014) data is different than other data used here in the derivation of the other behavioral response functions, without its use to fill in responses at higher received levels, the dose functions will be fit based solely on low to moderate level exposures from proximal sources such as most of those from the BRS/3S2 datasets. This would violate standard dose response methodology, mainly, that a sufficient range of “doses” are provided to define a range of responses from 0-100% (or at least most of the range). The Moretti et al. (2014) curve provides “observations” of the proportions responding at higher received levels. Additionally, as discussed above, these observations were during actual multi-ship, multi-day ASW events on AUTEC.
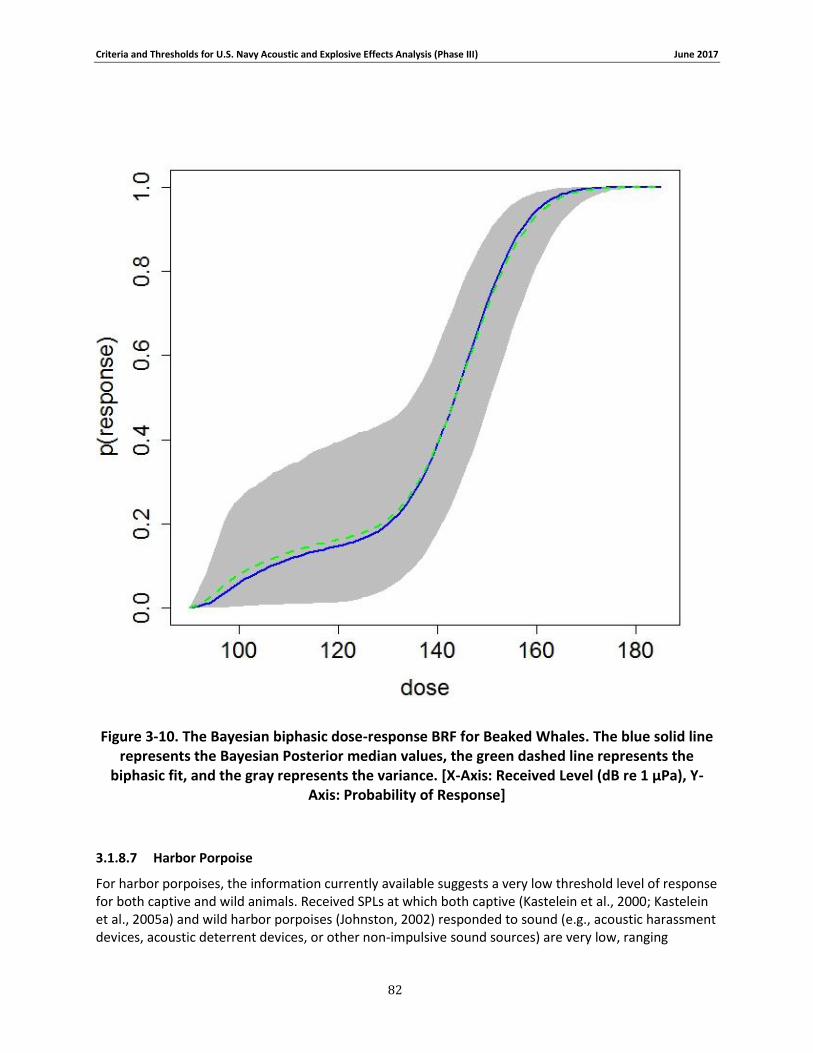
Criteria and Thresholds for U.S. Navy Acoustic and Explosive Effects Analysis (Phase III) June 2017
82
Figure 3-10. The Bayesian biphasic dose-response BRF for Beaked Whales. The blue solid line represents the Bayesian Posterior median values, the green dashed line represents the
biphasic fit, and the gray represents the variance. [X-Axis: Received Level (dB re 1 μPa), Y-Axis: Probability of Response]
3.1.8.7 Harbor Porpoise
For harbor porpoises, the information currently available suggests a very low threshold level of response for both captive and wild animals. Received SPLs at which both captive (Kastelein et al., 2000; Kastelein et al., 2005a) and wild harbor porpoises (Johnston, 2002) responded to sound (e.g., acoustic harassment devices, acoustic deterrent devices, or other non-impulsive sound sources) are very low, ranging
Criteria and Thresholds for U.S. Navy Acoustic and Explosive Effects Analysis (Phase III) June 2017
83
between 100 and 148 dB re 1 µPa (Cox et al., 2001; Culik et al., 2001; Kastelein et al., 1995; Kastelein et al., 2000; Kastelein et al., 2006b; Kastelein et al., 2008; Kastelein et al., 2012c; Kastelein et al., 2014a; Kastelein et al., 2014b; Kastelein et al., 2015c; Kastelein et al., 2015e; Kastelein et al., 2015f; Olesiuk et al., 2002; Teilmann et al., 2006). Kastelein et al. (2013c) investigated harbor porpoise behavioral responses to helicopter dipping sonar (1.33 – 1.43 kHz) with a 1.25 second pulse duration. They noted brief behavioral responses with a 50% point between 124 and 140 dB re 1 µPa. From the study, it is difficult to ascertain if these sound levels would elicit significant responses in wild harbor porpoises; although it is an indication that these animals are likely sensitive to lower levels of sound.
Thus, as in prior Navy analysis, a step function at an SPL of 120 dB re 1 µPa is used for harbor porpoises as a threshold to predict potential significant behavioral responses. This would be coupled with the cutoff distances for harbor porpoises discussed below in Section 0.
3.1.8.8 Sirenians (Manatees and Dugongs)
Due to a lack of specific data regarding sirenian reactions to sonar and other transducers, the mysticete BRF will be used as a proxy. Both mysticetes and manatees have demonstrated similar reactions to vessel noise and although distant, mysticetes are the most closely related marine mammal group. The Navy believes that the mysticetes behavioral response function is likely to capture the vast majority of potential significant behavioral responses in sirenians.
3.1.8.9 Sea Turtles
Sea turtle behavioral criteria for sonar and other transducers was developed with NMFS based on exposure to air guns (See McCauley et al., 2000). In addition, the working group that prepared the ANSI Sound Exposure Guidelines (Popper et al., 2014) provide parametric descriptors of sea turtle behavioral responses to sonar and other transducers.
Per discussions with NMFS, the received sound level at which sea turtles are expected to actively avoid air gun exposures, 175 dB re 1 µPa SPL rms (McCauley et al., 2000), is also expected to be the received sound level at which sea turtles would actively avoid exposure to sonar and other transducers during Navy training and testing activities. This behavioral threshold will be applied to sources up to 2 kHz.
3.1.9 Application of Contextual Factors - Distance Cutoffs
During the Phase I and II analysis, propagation loss estimates to the BRFs basement level of 120 dB re 1 µPa sometimes extended to over 150 km from the most powerful sonar sources (e.g., AN/SQS-53). At these distances, it is likely that the context of the exposure is more important than the amplitude; in other words, the context-based response dominates the level-based response. As discussed above, an important contextual factor is the distance between the animal and the sound source.
In the Phase III analyses, the Navy will use distance cutoffs beyond which the potential of significant behavioral responses is considered to be unlikely. For animals located beyond the distance cutoff, no significant behavioral responses will be predicted. For animals within the distance cutoff, a behavioral response function based on a received SPL as presented in Section 3.1.0 is used to predict the probability of a potential significant behavioral response. For training and testing events that contain multiple platforms or tactical sonar sources that exceed 215 dB re 1 µPa @ 1 m, this cutoff distance is substantially increased (i.e., doubled) from values derived from the literature. The use of multiple platforms and intense sound sources are factors that probably increase responsiveness in marine mammals overall. There are currently few behavioral observations under these circumstances; therefore, the Navy will conservatively predict significant behavioral responses at further ranges for these more intense events.
Criteria and Thresholds for U.S. Navy Acoustic and Explosive Effects Analysis (Phase III) June 2017
84
3.1.9.1 Odontocetes (excluding beaked whales and harbor porpoises)
When reviewing sonar and seismic survey marine mammal monitoring literature, no significant behavioral reactions have been observed beyond a few kilometers. Weir (2008) reports on a large scale seismic survey (5,085 cu. in. and 3,147 cu. in. arrays) conducted over a 10 month period off the African coast, in which spotted dolphins (Stenella frontalis) avoided the source by 0.5 to 1 km during firings. In contrast, when the air guns were not firing, dolphins were seen near vessels often to bowride.Similarly Stone and Tasker (2006) reported the median sighting distance increased for all species except sperm whales from about 0.5–1.0 km without shooting to about 1.0 – 2.0 km with shooting; sperm whales tended to decrease their median distance from about 2 km with no shooting to under 1.5 km with shooting underway. These data covered observations for over 200 surveys (over 45,000 hours of survey effort) with seismic airgun arrays ranging from 180 – 3,000 cu. in.
The 3S and BRS sonar playback studies were largely conducted within about 8 km, so it is difficult to extrapolate to the distance at which odontocetes are not likely to respond. However, during the most recent BRS field seasons, researchers were able to coordinate with Navy ships to expose tagged Risso’s dolphins (Grampus griseus) to actual mid-frequency sonar. These distances were on the order of tens of kilometers, and no responses were observed (Southall et al., 2014; Southall pers. comm. 2014).
These data suggest that most odontocetes (not including beaked whales and harbor porpoises) likely do not exhibit significant behavioral reactions to sonar and other transducers beyond approximately 10 km; therefore, the distance cutoff for odontocetes will be 10 km for moderate source level, single platform training and testing events; and 20 km for all other events with multiple sonar platforms or sonar with source levels at or exceeding 215 dB re 1 µPa @ 1 m.
3.1.9.2 Mysticetes
During 3S exposures to humpback whales (pers. comm. P. Miller, Dec 2014) animals that reacted were within about 1 km, although most of the sonar exposures began at 1-2 km from the whale. Similarly, during BRS exposures to blue whales, responses occurred when the source was within 2 km (pers. Comm. B. Southall, Dec 2014). During Phase I of LFA playbacks, no responses by either blue or fin whales were observed; in one case a whale swam past the transmitting vessel in the direct path of the playback at a range of 200 - 300 m. During Phase II of LFA playbacks, migrating gray whales avoided the source by 500 - 2000 m when it was placed near the center of their migratory path; however, when the source was moved approximately 2 km further offshore, the animals no longer altered their paths (Buck & Tyack, 2000; Clark et al., 1999; Ellison et al., 2011).
Preliminary results from passive acoustic monitoring on the Pacific Missile Range Facility found three interactions between Navy ships and minke whales. The first minke whale was 15 km away when a ship began transmitting sonar, and was about 9 km away when it stopped vocalizing (~15 min later). The ship was heading directly towards the minke's position in that case. A second whale was about 17 km away from a ship, and rather than being in the ship’s path was off to the side; in this case the ship moved away from the whale and the whale kept vocalizing. Finally, a third whale was about 9 km from a ship that was not transmitting sonar but was approaching the whale, and the whale stopped calling (Martin et al., 2015). It should be noted that a change in vocalization is not necessarily a significant behavioral response by itself, although it could be indicative of moderate severity responses such as interrupting feeding or mating behavior. In this case it is an indicator that reactions beyond 10 km have not been acoustically detected in these very limited results.
It is important to note that these are the distances within which behavioral responses have been observed, which is decoupled from the acoustic habitat or communication space that these large whales
Criteria and Thresholds for U.S. Navy Acoustic and Explosive Effects Analysis (Phase III) June 2017
85
likely utilize. While their low frequency vocalizations may be detected across tens to hundreds of kilometers, their behavioral responses to low- and mid-frequency active sonar seem to be limited to within 10 km.
The available data suggest that mysticetes likely do not exhibit significant behavioral reactions to sonar and other transducers beyond about 10 km; therefore, the distance cutoff for mysticetes will be 10 km for moderate source level, single platform training and testing events; and 20 km for all other events with multiple sonar platforms or sonar with source levels at or exceeding 215 dB re 1 µPa @ 1 m.
3.1.9.3 Pinnipeds
Southall et al. (2007) report that pinnipeds do not exhibit strong reactions to SPLs up to 140 dB re 1 µPa from steady state (non-impulsive) sources. In some cases, pinnipeds tolerate impulsive exposures up to 180 dB re 1 µPa with limited avoidance noted (Southall et al., 2007), and no avoidance noted at distances as close as 42 m (Jacobs & Terhune, 2002). There are still limited data on pinniped behavioral responses beyond about 3 km in the water.
The available data suggest that most pinnipeds likely do not exhibit significant behavioral reactions to sonar and other transducers beyond a few kilometers, independent of received levels of sound; therefore, the distance cutoff for pinnipeds will be 5 km for moderate source level, single platform training and testing events; and 10 km for all other events with multiple sonar platforms or sonar with source levels at or exceeding 215 dB re 1 µPa @ 1 m.
3.1.9.4 Beaked Whales
During an actual Navy training event at AUTEC in Andros Bahamas, Blainville’s beaked whales moved an average of 16 km from the sonar transmissions (Tyack et al., 2011). During sonar and pseudorandom noise playbacks at AUTEC, a Blainville’s beaked whale responded by breaking off a feeding dive and ascending slowly. This animal received SPLs of approximately 140 dB re 1 µPa from a projector located about 1 km from its dive location (Boyd et al., 2009; Tyack et al., 2011). During playback experiments of simulated sonar and pseudorandom noise off the coast of SOCAL, Cuvier’s beaked whales reacted to SPLs between 89 and 127 dB re 1 µPa by swimming rapidly and silently away from the source. The sound projector was located within 3 km of the whales diving location. In contrast, actual sonar exercises at a distance of approximately 118 km with SPLs at the whales of 78 to 106 dB re 1 µPa did not elicit the same reactions (DeRuiter et al., 2013). Likewise, in recent observations during the SOCAL behavioral response study, beaked whales showed no observable response to actual hull-mounted ASW sonar at distances of 60 to 75 km (pers. comm. B. Southall 2014). Recent analyses of possible Blainville’s beaked whale behavioral responses to Navy sonar at the Pacific Missile Range Facility found cessation of clicks to occur when ships were between 10 to 35 km and typically approaching the location of the group. Groups continued to click when ships were between 25 and 40 km and typically heading away from the location of the group (Henderson et al., 2016).
These data suggest that most beaked whales likely do not exhibit significant behavioral reactions to sonar and other transducers beyond approximately 20 km; therefore, the distance cutoff for beaked whales will be 25 km for moderate source level, single platform training and testing events; and 50 km for all other events with multiple sonar platforms or sonar with source levels at or exceeding 215 dB re 1 µPa @ 1 m.
3.1.9.5 Harbor Porpoises
There are no data available on the reaction distances of harbor porpoises to sonar or other transducers; however, movement patterns of harbor porpoises have been studied during pile driving to install wind

Criteria and Thresholds for U.S. Navy Acoustic and Explosive Effects Analysis (Phase III) June 2017
86
turbines in European waters (Dähne et al., 2014; Tougaard et al., 2009). These studies have shown that harbor porpoises are displaced within about 20 km of the activity area.
These data suggest that most harbor porpoises likely do not exhibit significant behavioral reactions to sonar and other transducers beyond approximately 20 km; therefore, the distance cutoff for harbor porpoises will be 20 km for moderate source level, single platform training and testing events; and 40 km for all other events with multiple platforms or sonar with source levels at or exceeding 215 dB re 1 µPa @ 1 m.
3.1.9.6 Sirenians
No applicable data on reaction distances for manatees or dugongs from sonar or other transducers is available. Manatees responded to boat approaches at 25 - 50 m (Nowacek et al., 2004b) and during playback of vessel approaches, showed a higher probability of reaction with increased speed of approach (Miksis-Olds et al., 2007). There is limited overlap between sirenian habitat and areas where the Navy would train and test. Many of these areas are confined inland waterways (e.g., Naval Station Mayport) where cutoff distances would exceed the size of the ensonified area. Therefore, cutoff distances for manatees would be difficult to ascertain and are not really applicable in smaller inland areas. Therefore, as there were no data available from which to develop cutoff distances, mysticete distances will be used in place.
As with mysticetes, the distance cutoff for sirenians will be 10 km for moderate source level, single platform training and testing events; and 20 km for all other events with multiple platforms or sonar with source levels at or exceeding 215 dB re 1 µPa @ 1 m.
3.2 Behavioral Response Thresholds for Air Guns
3.2.1 Marine Mammals
Existing National Marine Fisheries Service risk criteria are applied to the unique sounds generated by air
guns at 160 dB re 1 µPa (rms). The root mean square calculation for air guns driving is based on the
duration defined by 90 percent of the cumulative energy in the impulse.
3.2.2 Sea Turtles
Sea turtle behavioral criteria was developed with NMFS based on exposure to air guns (See McCauley et al., 2000). In addition, the working group that prepared the ANSI Sound Exposure Guidelines (Popper et al., 2014) provide parametric descriptors of sea turtle behavioral responses to air guns.
During two air gun exposure studies (McCauley et al., 2000; O'Hara & Wilcox, 1990), sea turtles were exposed to air gun shots over long durations (approximately 30 minutes of a traveling air gun and greater than 20 hours of a stationary air gun, respectively). From these studies, (McCauley et al., 2000) hypothesized that sea turtles would actively avoid repeated air gun shots at received levels of 175-176 dB re 1 µPa rms.
Per discussions with NMFS, a threshold of 175 dB re 1 µPa SPL(rms) is applied to estimate sea turtle behavioral reactions to repeated air gun firing during Navy testing activities. The root mean square calculation for air guns is based on the duration defined by 90 percent of the cumulative energy in the impulse.
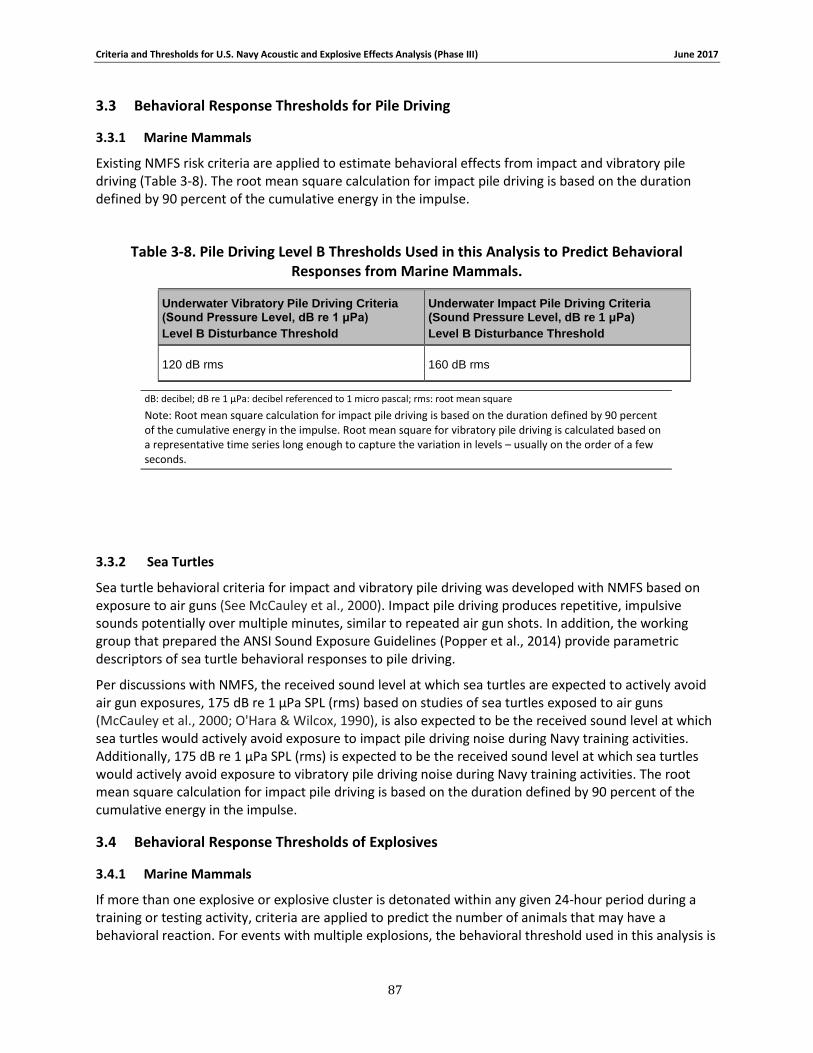
Criteria and Thresholds for U.S. Navy Acoustic and Explosive Effects Analysis (Phase III) June 2017
87
3.3 Behavioral Response Thresholds for Pile Driving
3.3.1 Marine Mammals
Existing NMFS risk criteria are applied to estimate behavioral effects from impact and vibratory pile driving (Table 3-8). The root mean square calculation for impact pile driving is based on the duration defined by 90 percent of the cumulative energy in the impulse.
Table 3-8. Pile Driving Level B Thresholds Used in this Analysis to Predict Behavioral Responses from Marine Mammals.
Underwater Vibratory Pile Driving Criteria (Sound Pressure Level, dB re 1 μPa)
Level B Disturbance Threshold
Underwater Impact Pile Driving Criteria (Sound Pressure Level, dB re 1 μPa)
Level B Disturbance Threshold
120 dB rms 160 dB rms
dB: decibel; dB re 1 µPa: decibel referenced to 1 micro pascal; rms: root mean square
Note: Root mean square calculation for impact pile driving is based on the duration defined by 90 percent of the cumulative energy in the impulse. Root mean square for vibratory pile driving is calculated based on a representative time series long enough to capture the variation in levels – usually on the order of a few seconds.
3.3.2 Sea Turtles
Sea turtle behavioral criteria for impact and vibratory pile driving was developed with NMFS based on exposure to air guns (See McCauley et al., 2000). Impact pile driving produces repetitive, impulsive sounds potentially over multiple minutes, similar to repeated air gun shots. In addition, the working group that prepared the ANSI Sound Exposure Guidelines (Popper et al., 2014) provide parametric descriptors of sea turtle behavioral responses to pile driving.
Per discussions with NMFS, the received sound level at which sea turtles are expected to actively avoid air gun exposures, 175 dB re 1 µPa SPL (rms) based on studies of sea turtles exposed to air guns (McCauley et al., 2000; O'Hara & Wilcox, 1990), is also expected to be the received sound level at which sea turtles would actively avoid exposure to impact pile driving noise during Navy training activities. Additionally, 175 dB re 1 µPa SPL (rms) is expected to be the received sound level at which sea turtles would actively avoid exposure to vibratory pile driving noise during Navy training activities. The root mean square calculation for impact pile driving is based on the duration defined by 90 percent of the cumulative energy in the impulse.
3.4 Behavioral Response Thresholds of Explosives
3.4.1 Marine Mammals
If more than one explosive or explosive cluster is detonated within any given 24-hour period during a training or testing activity, criteria are applied to predict the number of animals that may have a behavioral reaction. For events with multiple explosions, the behavioral threshold used in this analysis is
Criteria and Thresholds for U.S. Navy Acoustic and Explosive Effects Analysis (Phase III) June 2017
88
5 dB less than the TTS onset threshold (See Table C.6 in Appendix C). This value is derived from observed onsets of behavioral response by test subjects (bottlenose dolphins) during non-impulse TTS testing (Schlundt et al., 2000).
Some multiple explosive events, such as certain naval gunnery exercises, may be treated as a single event because a few explosions occur closely spaced within a very short time (a few seconds). For single explosions at received sound levels below hearing loss thresholds, the most likely behavioral response is a brief alerting or orienting response. Since no further sounds follow the initial brief impulses, significant behavioral reactions would not be expected to occur. This reasoning was applied to previous shock trials (63 FR 230; 66 FR 87; 73 FR 143) and is extended to the criteria used in this analysis.
3.4.2 Sea Turtles
Sea turtle behavioral criteria for explosives was developed with NMFS based on exposure to air guns (See McCauley et al., 2000). In addition, the working group that prepared the ANSI Sound Exposure Guidelines (Popper et al., 2014) provide parametric descriptors of sea turtle behavioral responses to explosives.
Sea turtles are assumed to exhibit no more than a brief startle response to any individual explosive or explosive cluster. If an event has longer duration use of explosives, such as some gunfire events with multiple clusters of explosive shells, a sea turtle is may exhibit a response beyond an initial startle, such as actively avoiding the area. Unlike long duration air gun exposures described in Section 3.2.2 (Air guns - Sea Turtles) in which sea turtles were exposed to many regular, repeated firings (number of firings equal to about 100 or much greater), most explosive events do not consist of a high number of regular, repeated shots. Rather, they consist of irregularly spaced detonations (in space and time) that, on their own, may only result in startle responses.
Per discussions with NMFS, the received sound level at which sea turtles are expected to actively avoid air gun exposures, 175 dB re 1 µPa SPL rms based on studies of sea turtles exposed to air guns (McCauley et al., 2000), is also expected to be the received sound level at which sea turtles would actively avoid events with multiple explosions during Navy training and testing activities.
Criteria and Thresholds for U.S. Navy Acoustic and Explosive Effects Analysis (Phase III) June 2017
89
4 EXPLOSIVE NON-AUDITORY INJURY CRITERIA
4.1 Introduction
This section describes the criteria for estimating non-auditory physiological impacts on marine mammals
and sea turtles due to naval underwater explosions. These criteria follow a similar methodology as past
Navy explosive impact analyses (Finneran & Jenkins, 2012b; U.S. Department of the Navy, 2001, 2008),
while refining the approach to take advantage of current modeling capabilities. Impact thresholds are
defined for both the estimate of quantitative effects for impact analyses (i.e., 50 % effect) and the
estimate of onset of effect for analysis of mitigation zones (e.g., 1% effect).
The effects of underwater explosions on marine mammals and sea turtles depend on a variety of factors
including animal size and depth; charge size and depth; depth of the water column; and distance
between the animal and the charge. The gas-containing organs (lungs and gastrointestinal tract) are
most vulnerable to primary blast injury. Severe injuries to these organs are presumed to result in
mortality (e.g., severe lung damage may introduce air into the cardiopulmonary vascular system,
resulting in lethal air emboli).
Because gas-containing organs are more vulnerable to primary blast injury, adaptations for diving that
allow for collapse of lung tissues with depth may make animals less vulnerable to lung injury with depth.
Adaptations for diving include a flexible thoracic cavity, distensible veins that can fill space as air
compresses, elastic lung tissue, and resilient tracheas with interlocking cartilaginous rings that provide
strength and flexibility (Ridgway, 1972). Older literature suggested complete lung collapse depths at
approximately 70 m for dolphins (Ridgway & Howard, 1979) and 20-50 m for phocid seals (Falke et al.,
1985; Kooyman et al., 1972). Follow-on work by (Kooyman & Sinnett, 1982), in which pulmonary
shunting was studied in harbor seals and sea lions, suggested that complete lung collapse for these
species would be about 170 m and about 180 m, respectively. More recently, evidence in sea lions
suggests that complete collapse might not occur until depths as great as 225 m; although the depth of
collapse and depth of the dive are related, sea lions can affect the depth of lung collapse by varying the
amount of air inhaled on a dive (McDonald & Ponganis, 2012) This is an important consideration for all
divers which can modulate lung volume and gas exchange prior to diving via the degree of inhalation
and during diving via exhalation (Fahlman et al., 2009). Indeed, there are noted differences in pre-dive
respiratory behavior with some marine mammals exhibiting pre-dive exhalation to reduce the lung
volume [e.g., phocid seals (Kooyman et al., 1973)].
4.2 Data on underwater blast injury to marine mammals and sea turtles
Data on blast injury to marine mammals and sea turtles is limited. Richardson et al. (1995) summarized
past exposures and evidence of mortality or injury to wild marine mammals; animal proximity to
explosions was generally not available, and the amount of data was overall insufficient to define injury
criteria.
Since Richardson et al.’s (1995) summary, there has been one documented incident of mortalities to
marine mammals after exposure to an explosion during Navy training. In 2011, three long-beaked
common dolphins were immediately killed by exposure to a 3.97-kg net explosive weight charge placed
on the seafloor in 48 feet (15 m) of water during an underwater detonation training activity at the Silver
Criteria and Thresholds for U.S. Navy Acoustic and Explosive Effects Analysis (Phase III) June 2017
90
Strand Training Complex near San Diego, CA [for additional information, see Danil & St. Ledger (2011)]. A
fourth long-beaked common dolphin was found on-shore dead three days after the detonation with
injuries consistent with blast exposure. The dolphins were in a pod of about 100-150 dolphins that swam
into the mitigation zone preceding the detonation. The explosive device was set on a time-delay fuse,
and attempts to deter the animals’ travel toward the detonation site were unsuccessful. Although the
animals were seen approaching the blast area, the actual locations of the injured animals relative to the
charge at the time of detonation are unknown. Upon necropsy, all four animals were found to have
sustained typical mammalian primary blast injuries (Danil & St. Ledger, 2011).
Incidental impacts on sea turtles were documented for exposure to a single 1200-lb (540 kg) underwater
charge off Panama City, FL in 1981. The charge was detonated at mid-depth in water 120 feet (37 m)
deep. Although details are limited, the following were recorded: at a distance of 500-700 ft. (150-200
m), a 400 lb. (180 kg) sea turtle was killed; at 1200 ft. (370 m), a 200-300 lb. (90-140 kg) sea turtle
experienced “minor” injury; and at 2000 ft. (600 m) a 200-300 lb. (90-140 kg) sea turtle was not injured
(O'Keeffe & Young, 1984).
4.3 Data on underwater blast injury to terrestrial mammals
Due to the scarcity of marine mammal data, development of explosive impact criteria relies on data
from exposures of terrestrial animals to controlled underwater blasts. In the early 1970s, the Lovelace
Foundation for Medical Education and Research conducted a series of tests in an artificial pond at
Kirtland Air Force Base, NM to determine the effects of underwater explosions on mammals, with the
goal of determining safe ranges for human divers. During the tests, sheep, dogs, and monkeys were
positioned at or near the water surface at 1, 2, and 10 ft. (0.3, 0.6, and 3 m) depths and at varying
distance from charges in a large pool. Animals at 10 ft. depth were attached to a pressurized underwater
breathing apparatus. Charges ranged from 0.5 to 8 lb. (0.23 to 6.3 kg) of pentolite and/or TNT placed at
10 ft. (3 m) depth. No deaths were observed from blast injuries. Mammals were sacrificed two hours
after exposure, and damage to the lungs and gastrointestinal (GI) tract were examined. Acoustic impulse
was found to be the metric most related to degree of injury, and size of an animal’s gas-containing
cavities was thought to play a role in blast injury susceptibility (Richmond et al., 1973; Yelverton et al.,
1973). The subject animals were exposed near the water surface; therefore, depth effects were not
discernible in this data set. The resulting data were summarized in two reports (Richmond et al., 1973;
Yelverton et al., 1973). For these shallow exposures of dogs, sheep, and monkeys (masses ranging from
3.4 to 50 kg) to underwater detonations, Richmond et al., 1973 (1973) reported that:
An impulse of 34 psi-ms (230 Pa-s) resulted in about 50% incidence of slight lung
hemorrhage. Below 20 psi-ms (140 Pa-s) there were no instances of slight lung
hemorrhage.
Some exposures at higher levels (up to 40 psi-ms [280 Pa-s]) resulted in no observable
lung damage.
About half of the animals had gastrointestinal tract contusions (with slight ulceration,
i.e., some perforation of the mucosal layer) at exposures of 25-27 psi-ms (170-190 Pa-s).
Lung injuries were found to be slightly more prevalent than GI tract injuries for the same
exposure level.
Criteria and Thresholds for U.S. Navy Acoustic and Explosive Effects Analysis (Phase III) June 2017
91
Specific physiological observations for each test animal are documented in Richmond et al. (1973).Some
limitations of this dataset are (Richardson et al., 1995):
Subjects were held at shallow depths or at the surface.
Test animals were small compared to the range of marine mammal sizes.
Only injuries evident at sacrifice/necropsy at two hours after exposure were considered
(i.e., longer term survival rates were not considered).
Lungs were expanded at depth because the animals were actively breathing air (unlike
breath-hold divers).
Additionally, some control animals connected to the underwater breathing apparatus but not exposed
to detonations exhibited lung damage or died. It is reasonable to assume that in some instances lung
damage observed in animals exposed to detonations may have been exacerbated by animal handling
procedures or the underwater life support system.
While the above study was conducted to assess safe ranges for human swimmers, it is the best available
data set for assessing non-auditory physiological impacts on marine mammals and sea turtles from
explosives. The lungs of marine mammals are grossly similar in proportion to overall body size as those
of terrestrial mammals, so the magnitude of lung damage in the tests may approximate the magnitude
of injury to marine mammals when scaled for body size. However, within the marine mammals,
(Piscitelli et al., 2010) observed that mysticetes and deeper divers (e.g., Kogiidae, Physeteridae,
Ziphiidae) tend to have lung to body size ratios that are smaller and more similar to terrestrial animal
ratios than shallow diving odontocetes (e.g., Phocoenidae, Delphinidae). Measurements of some
shallower diving sea turtles (Hochscheid et al., 2007) and pinnipeds (Fahlman et al. 2014) show lung to
body size ratios that are similar to shallow diving odontocetes, whereas the lung to body mass ratio of
the deeper diving leatherback sea turtle is smaller (Lutcavage et al., 1992). The use of test data with
smaller lung to body ratios results in a more conservative estimate of potential for damaging effects
(i.e., lower thresholds).
Yelverton & Richmond (1981) conducted probit analyses of the Lovelace Foundation injury data and
mortality data (i.e., extensive lung injury discovered after animals were sacrificed and necropsied, as no
mortalities were observed in two-hour observation period post exposure) (Richmond et al., 1973;
Yelverton et al., 1973), relating likelihood of injury to impulse. The probit analyses were used to develop
regression equations for 50% mortality and 1% mortality relating impulse to body mass for shallow
water exposures (see Figure 4-1):
50% mortality: ln (I) = 4.938 + 0.386 ln (M) (1)
1% mortality: ln (I) = 4.507 + 0.386 ln (M) (2)
where: I = impulse threshold for effect (Pa-s)
M = animal mass (kg)
A parallel No Injury equation was developed based on the highest impulse below which no injuries were
observed:
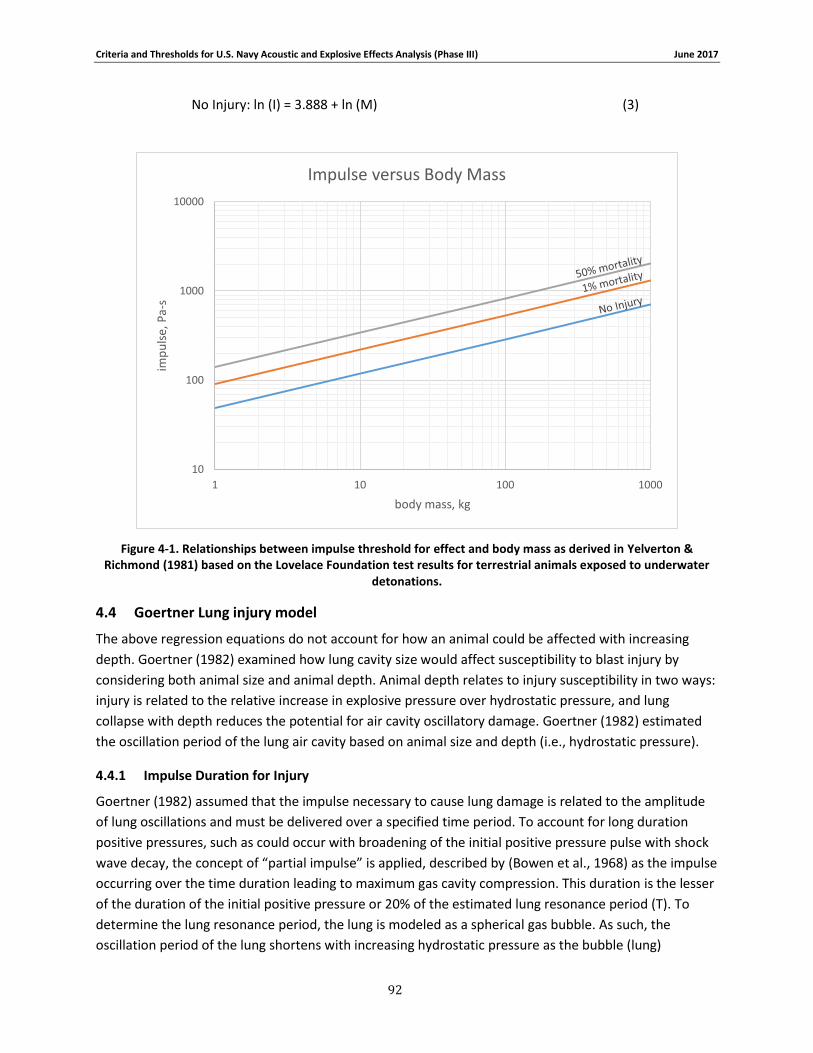
Criteria and Thresholds for U.S. Navy Acoustic and Explosive Effects Analysis (Phase III) June 2017
92
No Injury: ln (I) = 3.888 + ln (M) (3)
Figure 4-1. Relationships between impulse threshold for effect and body mass as derived in Yelverton & Richmond (1981) based on the Lovelace Foundation test results for terrestrial animals exposed to underwater
detonations.
4.4 Goertner Lung injury model
The above regression equations do not account for how an animal could be affected with increasing
depth. Goertner (1982) examined how lung cavity size would affect susceptibility to blast injury by
considering both animal size and animal depth. Animal depth relates to injury susceptibility in two ways:
injury is related to the relative increase in explosive pressure over hydrostatic pressure, and lung
collapse with depth reduces the potential for air cavity oscillatory damage. Goertner (1982) estimated
the oscillation period of the lung air cavity based on animal size and depth (i.e., hydrostatic pressure).
4.4.1 Impulse Duration for Injury
Goertner (1982) assumed that the impulse necessary to cause lung damage is related to the amplitude
of lung oscillations and must be delivered over a specified time period. To account for long duration
positive pressures, such as could occur with broadening of the initial positive pressure pulse with shock
wave decay, the concept of “partial impulse” is applied, described by (Bowen et al., 1968) as the impulse
occurring over the time duration leading to maximum gas cavity compression. This duration is the lesser
of the duration of the initial positive pressure or 20% of the estimated lung resonance period (T). To
determine the lung resonance period, the lung is modeled as a spherical gas bubble. As such, the
oscillation period of the lung shortens with increasing hydrostatic pressure as the bubble (lung)
10
100
1000
10000
1 10 100 1000
imp
uls
e, P
a-s
body mass, kg
Impulse versus Body Mass

Criteria and Thresholds for U.S. Navy Acoustic and Explosive Effects Analysis (Phase III) June 2017
93
collapses. Ultimately, a depth is reached where sufficient impulse cannot be delivered during the
shortened period to result in an injurious effect. Because this model does not account for damping of
lung response by the surrounding tissues, it considers a maximum lung compressive response.
The derivation of the equation to estimate lung resonance period is described in Goertner (1982). When
all substitutions are made, the reduced equation is:
𝑇 = 22.5 𝑀1
3⁄ 𝑝𝑎𝑡𝑚
13⁄
𝑝ℎ𝑦𝑑
56⁄
(4)
where: M = animal mass (kg) phyd = hydrostatic pressure (psi)= patm + (γwD/144) patm = atmospheric pressure (psi) γw = specific weight of water (lb/ft3) D = depth of animal (ft)
The steep-front, high-amplitude shock wave is the initial positive pressure amplitude used to calculate
impulse exposure for damaging effect. The shock wave caused by an explosion in deeper water may be
followed by several bubble pulses with lower peak pressures (about one-fifth the initial peak pressure
for the first follow-on pulse) and lacking the steep pressure front of the initial explosive pulse (Urick,
1983). These bubble pulses are not considered when analyzing injury potential due to peak pressure or
impulse, as these values are inherently lower for bubble pulse exposure than for initial exposure.
The impulse exposure would be affected by the depth of the charge and the depth of the receiving
animal. If a charge is detonated closer to the surface or if an animal is closer to the surface, the time
between the initial direct path arrival and the surface-reflected tension wave arrival is reduced, resulting
in a steep negative pressure cut-off of the initial direct path impulse exposure. Two animals at similar
distance from a charge, therefore, may experience the same peak pressure but different impulse at
different depths.
4.4.2 Impulse Scaling for Animal Size and Depth
Goertner (1982) also developed a scaling parameter for impulse-based lung damage that relates impulse
associated with an observed effect to animal size and ambient pressure (hydrostatic and atmospheric).
Equation 2.9 in Goertner (1982) shows this relationship as follows (note that water density in the
denominator is later dropped as a constant, so it is not shown here):
𝐼
𝐴𝐷𝑝ℎ𝑦𝑑
12⁄
(5)
where: I = impulse for onset of injury effect AD = lung (bubble) radius at depth, D
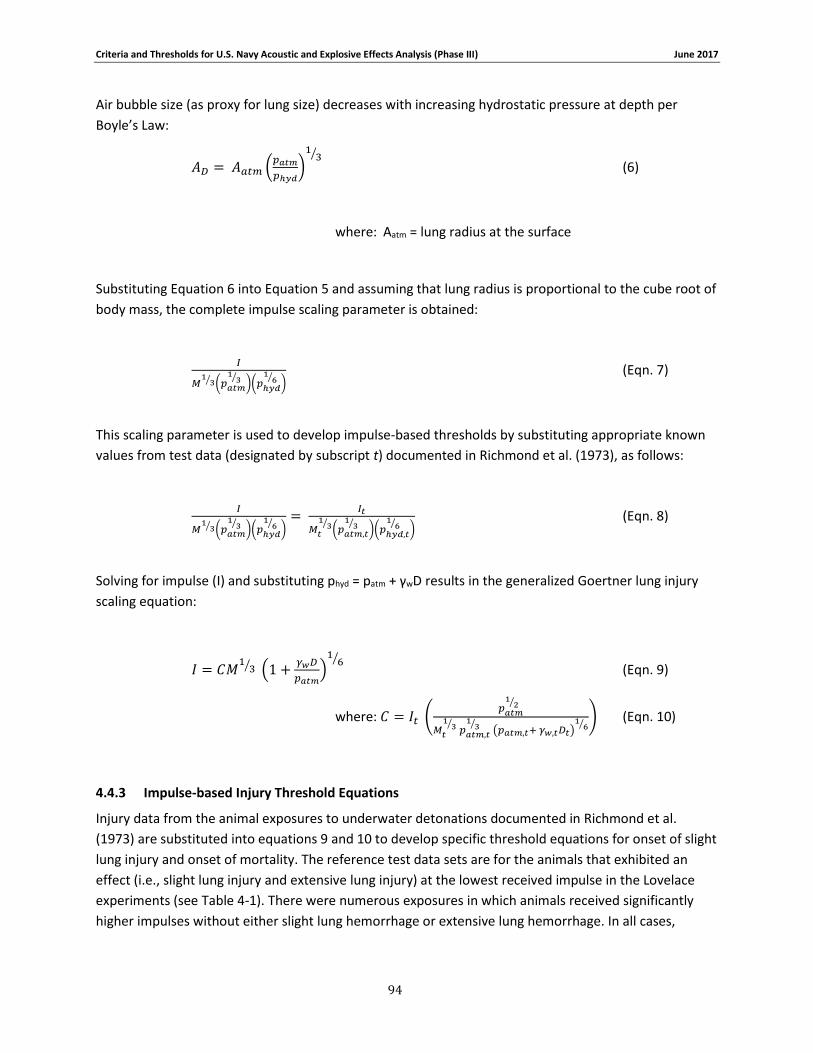
Criteria and Thresholds for U.S. Navy Acoustic and Explosive Effects Analysis (Phase III) June 2017
94
Air bubble size (as proxy for lung size) decreases with increasing hydrostatic pressure at depth per
Boyle’s Law:
𝐴𝐷 = 𝐴𝑎𝑡𝑚 (𝑝𝑎𝑡𝑚
𝑝ℎ𝑦𝑑)
13⁄
(6)
where: Aatm = lung radius at the surface
Substituting Equation 6 into Equation 5 and assuming that lung radius is proportional to the cube root of
body mass, the complete impulse scaling parameter is obtained:
𝐼
𝑀1
3⁄ (𝑝𝑎𝑡𝑚
13⁄
)(𝑝ℎ𝑦𝑑
16⁄
) (Eqn. 7)
This scaling parameter is used to develop impulse-based thresholds by substituting appropriate known
values from test data (designated by subscript t) documented in Richmond et al. (1973), as follows:
𝐼
𝑀1
3⁄ (𝑝𝑎𝑡𝑚
13⁄
)(𝑝ℎ𝑦𝑑
16⁄
)=
𝐼𝑡
𝑀𝑡
13⁄
(𝑝𝑎𝑡𝑚,𝑡
13⁄
)(𝑝ℎ𝑦𝑑,𝑡
16⁄
) (Eqn. 8)
Solving for impulse (I) and substituting phyd = patm + γwD results in the generalized Goertner lung injury
scaling equation:
𝐼 = 𝐶𝑀1
3⁄ (1 +𝛾𝑤𝐷
𝑝𝑎𝑡𝑚)
16⁄
(Eqn. 9)
where: 𝐶 = 𝐼𝑡 (𝑝𝑎𝑡𝑚
12⁄
𝑀𝑡
13⁄
𝑝𝑎𝑡𝑚,𝑡
13⁄
(𝑝𝑎𝑡𝑚,𝑡+ 𝛾𝑤,𝑡𝐷𝑡)1
6⁄) (Eqn. 10)
4.4.3 Impulse-based Injury Threshold Equations
Injury data from the animal exposures to underwater detonations documented in Richmond et al.
(1973) are substituted into equations 9 and 10 to develop specific threshold equations for onset of slight
lung injury and onset of mortality. The reference test data sets are for the animals that exhibited an
effect (i.e., slight lung injury and extensive lung injury) at the lowest received impulse in the Lovelace
experiments (see Table 4-1). There were numerous exposures in which animals received significantly
higher impulses without either slight lung hemorrhage or extensive lung hemorrhage. In all cases,

Criteria and Thresholds for U.S. Navy Acoustic and Explosive Effects Analysis (Phase III) June 2017
95
impulses at the test animals were received over a duration that was less than 20% of the lung resonance
period.
Although no test animals died within two hours of blast exposure, longer-term survival rates were not
studied. It is reasonable to assume for impact analysis that extensive lung hemorrhage is a level of injury
that would result in wild animal mortality. Slight lung injuries, such as slight hemorrhage, are injuries
from which an animal would be expected to survive.
The values for other environmental constants for the test and analysis conditions are shown in Table
4-2.
Table 4-1. Lowest test impulse exposure for injurious effects (Richmond et al., 1973).
Observed Effect extensive lung hemorrhage (representative of onset mortality)
slight lung hemorrhage (i.e., onset slight lung injury)
Impulse, It 44.4 psi-ms (306 Pa-s) 22.8 psi-ms (157 Pa-s)
Animal Depth, Dt 2 ft. 10 ft.
Animal Mass, Mt 34 kg 42 kg
Table 4-2. Environmental constants.
Constant Value
Atmospheric pressure at test site1, patm,t 12 psi
Atmospheric pressure at sea level, patm 14.7 psi
Specific weight of fresh water1, ɣw,t 62.4 lb/ft3
Specific weight of sea water, ɣw 64 lb/ft3
1 Tests were conducted in a freshwater man-made pond. Richmond et al. (1973) reported the atmospheric pressure at the test site to be 12 psi.
Use of the above values results in threshold equations for onset mortality and onset slight lung injury
(SLI) as follows:
𝐼𝑜𝑛𝑠𝑒𝑡 𝑆𝐿𝐼 = 47.5𝑀1
3⁄ (1 + 𝐷
10.1)
16⁄ Pa-s (Eqn. 11)
𝐼𝑜𝑛𝑠𝑒𝑡 𝑚𝑜𝑟𝑡𝑎𝑙𝑖𝑡𝑦 = 103𝑀1
3⁄ (1 + 𝐷
10.1)
16⁄
Pa-s (Eqn. 12)
where I = Impulse threshold (Pa-s)
D = depth of animal (m)
Criteria and Thresholds for U.S. Navy Acoustic and Explosive Effects Analysis (Phase III) June 2017
96
M = animal mass (kg)
Equation 1 is used as a starting point for developing a 50% mortality threshold equation that accounts
for animal depth using the Goertner lung injury model. Using Equation 1, the near-surface threshold for
50% mortality would be 544 Pa-s for 34 kg animals.
A comparison between the test exposure with the lowest impulse associated with onset severe lung
injury (i.e., onset mortality) shown in Table 4-1(M = 34 kg, I = 306 Pa-s) and the 1% mortality impulse
threshold predicted by Equation 2 (the 1% mortality regression equation for the Lovelace shallow water
explosive exposures) for a 34-kg animal (I = 354 Pa-s) shows that the test value is 14% lower than the
value predicted using the regression equation. The 50% mortality threshold value predicted for a 34-kg
animal using Equation 1, the 50% mortality regression equation for the Lovelace shallow water explosive
exposures, is 544 Pa-s. To develop an impulse reference value to estimate a lower bound for 50%
mortality consistent with the value for onset mortality, this prediction is lowered by 14% to 468 Pa-s.
Using these reference values (It = 468 Pa-s, Mt = 34 kg) and the environmental values in Table 4-2, the
Goertner lung injury threshold equation for 50% mortality is:
𝐼50% 𝑚𝑜𝑟𝑡𝑎𝑙𝑖𝑡𝑦 = 144𝑀1
3⁄ (1 + 𝐷
10.1)
16⁄ Pa-s (Eqn. 13)
Where: I = Impulse threshold (Pa-s)
D= depth of animal (m)
M = animal mass (kg)
To estimate the 50% slight lung injury impulse threshold using the Lovelace Foundation test data, a
probit analysis was conducted using the sheep lung injury data (Mavg = 41 kg). The 50% response for lung
injury corresponded to an exposure of 251 Pa-s. Following the procedure to conservatively estimate the
50% mortality reference point above, the 50% slight lung injury impulse threshold is reduced by 14% to
estimate a lower bound of 216 Pa-s. Using these reference values (It = 216 Pa-s, Mt = 41 kg) and the
environmental constants in Table 4-2, the Goertner lung injury threshold equation for 50% slight lung
injury is:
𝐼50% 𝑠𝑙𝑖𝑔ℎ𝑡 𝑙𝑢𝑛𝑔 𝑖𝑛𝑗𝑢𝑟𝑦 = 65.8𝑀1
3⁄ (1 + 𝐷
10.1)
16⁄
Pa-s (Eqn. 14)
4.5 Peak Pressure criterion
Peak pressure contributes to the “crack” or “stinging” sensation of a blast wave, compared to the
“thump” associated with received impulse. High peak pressures can cause damaging instantaneous
tissue distortion. Older military reports documenting exposure of human divers to blast exposure
generally describe peak pressure exposures around 100 psi (237 dB re 1 µPa peak) to feel like slight
pressure or stinging sensation on skin, with no enduring effects (Christian & Gaspin, 1974).
Criteria and Thresholds for U.S. Navy Acoustic and Explosive Effects Analysis (Phase III) June 2017
97
Goertner (1982) suggested a peak overpressure GI tract injury criterion because the size of gas bubbles
in the GI tract are variable, and their oscillation period could be short relative to primary blast wave
exposure. The potential for GI tract injury, therefore, may not be adequately modeled by the single
oscillation bubble methodology used to estimate lung injury due to impulse. Like impulse, however, high
instantaneous pressures may damage many parts of the body, but damage to the GI tract is used as an
indicator of any peak pressure-induced injury due to its vulnerability.
In previous analyses, the peak pressure criterion was called the GI tract injury criterion because it is
based on injury data for the vulnerable gas-containing organs of the gastrointestinal tract. Data from the
Lovelace Foundation experiments show instances of GI tract contusions after exposures up to 1147 psi
peak pressure, while exposures of up to 588 psi peak pressure resulted in many instances of no
observed GI tract effects. As a vulnerable gas-containing organ, the GI tract is vulnerable to both high
peak pressure and high impulse, which may vary to differing extents due to blast exposure conditions
(i.e., animal depth, distance from the charge). This likely explains the range of effects seen at similar
peak pressure exposure levels and shows the utility of dual injury criteria for explosives.
Examination of the GI tract contusion data versus peak pressure yields a 50% risk at 296 psi peak
pressure (dose response fit, R2 =0.56). To reasonably estimate the number of animals that could be
injured due to exposure to high peak pressures, and taking into account human diver exposures (see
below), a peak pressure injury threshold of 200 psi (243 dB re 1 µPa peak) is used to quantify potential
injuries. To account for injuries seen at some lower level exposures in the Lovelace data set, a peak
pressure threshold of 104 psi (237 dB re 1 µPa peak) is used to inform mitigation.
4.6 Comparison to Human Diver Exposure Data
Data from human divers are informative as they provide subjective descriptions of sensations
experienced during blast exposures. Human divers were voluntarily exposed to underwater detonations
in order to develop safety standards for human divers. For a 165 lb. (75kg) human at 20 ft. (6 m) depth,
the impulse thresholds for quantitatively assessing mortality and injury are 728 Pa-s and 333 Pa-s,
respectively, using the impulse criteria described in this report. The peak pressure threshold for
quantifying injury is 243 dB re 1 µPa peak (200 psi). The human diver exposures and impacts are
described in

Criteria and Thresholds for U.S. Navy Acoustic and Explosive Effects Analysis (Phase III) June 2017
98
Table 4-3 and Table 4-4 below. The exposures that exceed the thresholds for quantifying injury are
italicized. The exposures that exceed the threshold for quantifying mortality are bold. In these examples,
the explosive injury criteria in no instance underestimate the potential for effect.
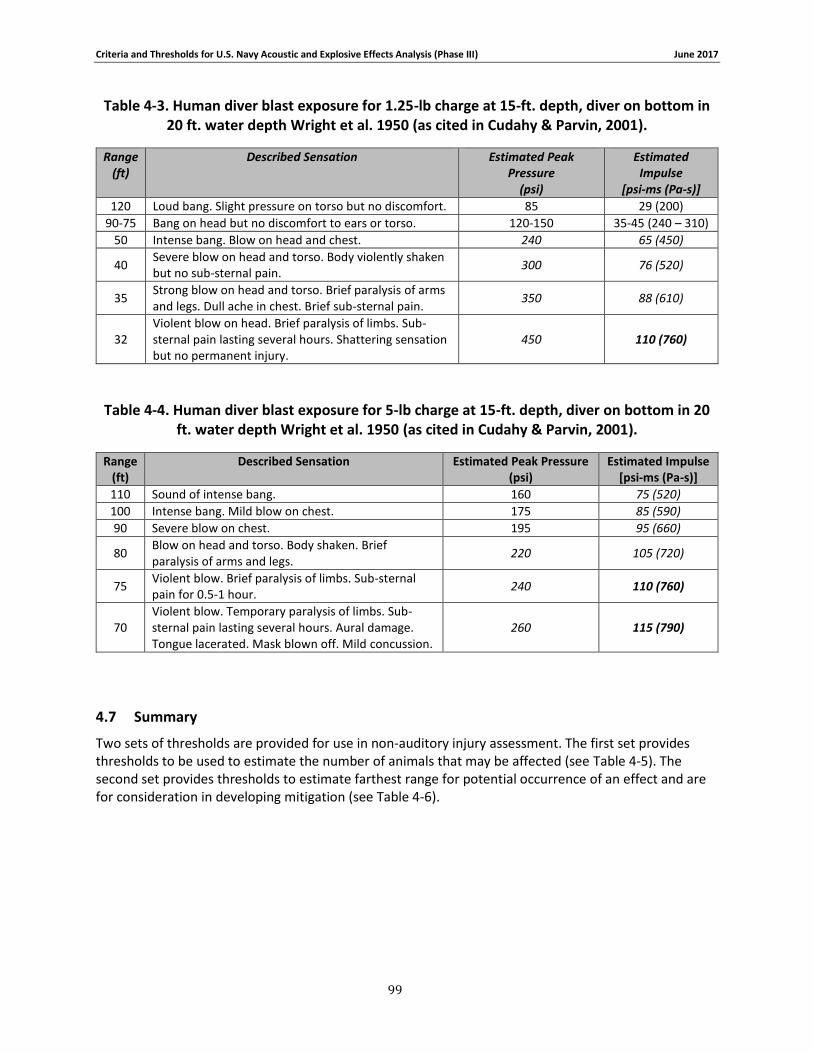
Criteria and Thresholds for U.S. Navy Acoustic and Explosive Effects Analysis (Phase III) June 2017
99
Table 4-3. Human diver blast exposure for 1.25-lb charge at 15-ft. depth, diver on bottom in 20 ft. water depth Wright et al. 1950 (as cited in Cudahy & Parvin, 2001).
Range (ft)
Described Sensation Estimated Peak Pressure
(psi)
Estimated Impulse
[psi-ms (Pa-s)]
120 Loud bang. Slight pressure on torso but no discomfort. 85 29 (200)
90-75 Bang on head but no discomfort to ears or torso. 120-150 35-45 (240 – 310)
50 Intense bang. Blow on head and chest. 240 65 (450)
40 Severe blow on head and torso. Body violently shaken but no sub-sternal pain.
300 76 (520)
35 Strong blow on head and torso. Brief paralysis of arms and legs. Dull ache in chest. Brief sub-sternal pain.
350 88 (610)
32 Violent blow on head. Brief paralysis of limbs. Sub-sternal pain lasting several hours. Shattering sensation but no permanent injury.
450 110 (760)
Table 4-4. Human diver blast exposure for 5-lb charge at 15-ft. depth, diver on bottom in 20 ft. water depth Wright et al. 1950 (as cited in Cudahy & Parvin, 2001).
Range (ft)
Described Sensation Estimated Peak Pressure (psi)
Estimated Impulse [psi-ms (Pa-s)]
110 Sound of intense bang. 160 75 (520)
100 Intense bang. Mild blow on chest. 175 85 (590)
90 Severe blow on chest. 195 95 (660)
80 Blow on head and torso. Body shaken. Brief paralysis of arms and legs.
220 105 (720)
75 Violent blow. Brief paralysis of limbs. Sub-sternal pain for 0.5-1 hour.
240 110 (760)
70 Violent blow. Temporary paralysis of limbs. Sub-sternal pain lasting several hours. Aural damage. Tongue lacerated. Mask blown off. Mild concussion.
260 115 (790)
4.7 Summary
Two sets of thresholds are provided for use in non-auditory injury assessment. The first set provides thresholds to be used to estimate the number of animals that may be affected (see Table 4-5). The second set provides thresholds to estimate farthest range for potential occurrence of an effect and are for consideration in developing mitigation (see Table 4-6).

Criteria and Thresholds for U.S. Navy Acoustic and Explosive Effects Analysis (Phase III) June 2017
100
Table 4-5: Criteria to Quantitatively Predict Non-Auditory Injuries due to Underwater Explosions
Impact Assessment Criterion Threshold
Mortality - Impulse 144𝑀
13⁄ (1 +
𝐷
10.1)
16⁄ Pa-s
Injury - Impulse 65.8𝑀
13⁄ (1 +
𝐷
10.1)
16⁄ Pa-s
Injury – Peak Pressure 243 dB re 1 µPa peak
Table 4-6: Onset of Effect Threshold for Estimating Ranges to Potential Effect
Onset effect for mitigation consideration Threshold
Onset Mortality - Impulse 103𝑀
13⁄ (1 +
𝐷
10.1)
16⁄ Pa-s
Onset Injury (Non-auditory) - Impulse 47.5𝑀
13⁄ (1 +
𝐷
10.1)
16⁄ Pa-s
Onset Injury (Non-auditory) – Peak Pressure 237 dB re 1 µPa peak
Criteria and Thresholds for U.S. Navy Acoustic and Explosive Effects Analysis (Phase III) June 2017
101
5 REFERENCES
. (2015). Sea Turtle Conservancy. Retrieved from https://conserveturtles.org/
American National Standards Institute. (2001). Design Response of Weighting Networks for Acoustical Measurements (Vol. ANSI S1.42-2001, pp. 14): Acoustical Society of America.
Andersen, M., A. M. Hjelset, I. Gjertz, C. Lydersen, & B. Gulliksen. (1999). Growth, age at sexual maturity and condition in bearded seals (Erignathus barbatus) from Svalbard, Norway. Polar Biology, 21(3), 179–185.
Antonelis, G. A., J. D. Baker, & J. J. Polovina. (2003). Improved body condition of weaned Hawaiian monk seal pups associated with El Niño events: potential benefits to an endangered species. Marine Mammal Science, 19(3), 590–598.
Antunes, R., P. H. Kvadsheim, F. P. Lam, P. L. Tyack, L. Thomas, P. J. Wensveen, & P. J. Miller. (2014). High thresholds for avoidance of sonar by free-ranging long-finned pilot whales (Globicephala melas). Marine Pollution Bulletin, 83(1), 165–180.
Awbrey, F. T., J. A. Thomas, & R. A. Kastelein. (1988). Low-frequency underwater hearing sensitivity in belugas, Delphinapterus leucas. Journal of the Acoustical Society of America, 84(6), 2273-2275.
Babushina, E. S., G. L. Zaslausky, & L. I. Yurkevich. (1991). Air and underwater hearing of the northern fur seal audiograms and auditory frequency discrimination. Biofizika, 36(5), 904–907.
Barlow, J., & R. Gisiner. (2006). Mitigating, monitoring and assessing the effects of anthropogenic sound on beaked whales. Journal of Cetacean Research and Management, 7(3), 239–249.
Bartol, S. M., & D. R. Ketten. (2006). Turtle and Tuna Hearing (Sea Turtle and Pelagic Fish Sensory Biology: Developing Techniques to Reduce Sea Turtle Bycatch in Longline Fisheries: NOAA Technical Memorandum NMFS-PIFSC-7). Honolulu, HI: Pacific Islands Fisheries Science Center.
Bonner, N. W. (1981). Southern Fur Seals Arctocephalus. In R. J. Harrison & S. H. Ridgway (Eds.), Handbook of Marine Mammals (Vol. 1, pp. 161–208).
Boveng, P. L., J. L. Bengtson, T. W. Buckley, M. F. Cameron, S. P. Dahle, B. P. Kelly, B. A. Megrey, J. E. Overland, & N. J. Williamson. (2009). Status Review of the Spotted Seal (Phoca largha). US Department of Commerce, NOAA Technical Memorandum NMFS-AFSC-200.
Bowen, I. G., E. R. Fletcher, D. R. Richmond, F. G. Hirsch, & C. S. White. (1968). Biophysical mechanisms and scaling procedures applicable in assessing responses of the thorax energized by air-blast overpressures or by non-penetrating missiles. Annals of the New York Academy of Sciences, 152(1), 122–146.
Bowen, W. D., O. T. Oftedal, & D. J. Boness. (1985). Birth to weaning in 4 days: Remarkable growth in the hooded seal, Cystophora cristata. Canadian Journal of Zoology, 63(12), 2841–2846.

Criteria and Thresholds for U.S. Navy Acoustic and Explosive Effects Analysis (Phase III) June 2017
102
Bowen, W. D., J. I. McMillan, & W. Blanchard. (2007). Reduced population growth of gray seals at Sable Island: Evidence from pup production and age of primiparity. Marine Mammal Science, 23(1), 48–64.
Boyd, I. L., P. L. Tyack, D. Claridge, C. Clark, D. Moretti, & B. L. Southall. (2009, December 7-10, 2009). Behavioural Response Study. Paper presented at the 2009 ONR Marine Mammal Program Review, Alexandria, VA.
Brill, R. L., P. W. B. Moore, & L. A. Dankiewicz. (2001). Assessment of dolphin (Tursiops truncatus) auditory sensitivity and hearing loss using jawphones. Journal of the Acoustical Society of America, 109(4), 1717–1722.
Brooks, S. P., & A. Gelman. (1998). General methods for monitoring convergence of iterative simulations. Journal of Computational and Graphical Statistics, 7, 434-455.
Buck, J. R., & P. L. Tyack. (2000). Response of gray whales to low-frequency sounds. Journal of the Acoustical Society of America, 107(5), 2774.
Burns, J. J. (1981). Ribbon Seal, Phoca fasciata. In S. H. Ridgway & R. J. Harrison (Eds.), Handbook of Marine Mammals (Vol. 1, pp. 89–109).
Caillouet, C. W., D. B. Koi, C. T. Fontaine, T. D. Williams, W. J. Browning, & R. M. Harris. (1986). Growth and survival of Kemp's Ridley sea turtle, Lepidochelys kempi, in captivity. National Oceanic of Atmospheric Administration.
Caldwell, D. K., & M. C. Caldwell. (1985). Manatees (pp. 33–66).
Christian, E. A., & J. B. Gaspin. (1974). Swimmer Safe Standards from Underwater Explosions. Navy Science Assistance Program Project No. PHP-11-73. White Oak, MD: Naval Ordnance Laboratory.
Christiansen, F., M. Rasmussen, & D. Lusseau. (2013). Whale watching disrupts feeding activities of minke whales on a feeding ground. Marine Ecology Progress Series, 478, 239–251.
Clark, C. W., P. L. Tyack, & W. T. Ellison. (1999). Technical Report 1: Low Frequency Sound Scientific Research Program Technical Report on Responses for Four Species of Whales to Sounds of SURTASS LFA Sonar Transmissions (Overseas Environmental Impact Statement and Environmental Impact Statement for Surveillance Towed Array Sensor System Low Frequency Active (SURTASS LFA) Sonar).
Clark, C. W., & K. M. Fristrup. (2001). Baleen whale responses to low-frequency human-made underwater sounds. Journal of the Acoustical Society of America, 110(5), 2751.
Cox, T. M., A. J. Read, A. Solow, & N. Tregenza. (2001). Will harbour porpoises (Phocoena phocoena) habituate to pingers? Journal of Cetacean Research and Management, 3(1), 81–86.
Cranford, T. W., & P. Krysl. (2015). Fin whale sound reception mechanisms: skull vibration enables low-frequency hearing. PLoS ONE, 10(1), e0116222.
Criteria and Thresholds for U.S. Navy Acoustic and Explosive Effects Analysis (Phase III) June 2017
103
Croll, D. A., C. W. Clark, J. Calambokidis, W. T. Ellison, & B. R. Tershy. (2001). Effect of anthropogenic low-frequency noise on the foraging ecology of Balaenoptera whales. Animal Conservation, 4, 13–27.
Cudahy, E., & S. Parvin. (2001). The Effects of Underwater Blast on Divers. Groton, CT.
Culik, B. M., S. Koschinski, N. Tregenza, & G. M. Ellis. (2001). Reactions of harbor porpoises Phocoena phocoena and herring Clupea harengus to acoustic alarms. Marine Ecological Progress Series, 211, 255–260.
D'Amico, A., R. C. Gisiner, D. R. Ketten, J. A. Hammock, C. Johnson, P. L. Tyack, & J. Mead. (2009). Beaked whale strandings and naval exercises. Aquatic Mammals, 35(4), 452–472.
Dähne, M., V. Peschko, A. Gilles, K. Lucke, S. Adler, K. Ronnenberg, & U. Siebert. (2014). Marine mammals and windfarms: effects of alpha ventus on harbour porpoises Ecological Research at the Offshore Windfarm alpha ventus (pp. 133–149). Springer.
Dalebout, M. L., G. J. B. Ross, C. S. Baker, R. C. Anderson, P. B. Best, V. G. Cockcroft, H. L. Hinsz, V. Peddemors, & R. L. Pitman. (2003). Appearance, distribution and genetic distinctiveness of Longman's beaked whale, Indopacetus pacificus. Marine Mammal Science, 19(3), 421–461.
Danil, K., & J. A. St. Ledger. (2011). Seabird and dolphin mortality associated with underwater detonation exercises. Marine Technology Society Journal, 45(6), 63–87.
DeRuiter, S. L., S. B. L., J. Calambokidis, W. M. X. Zimmer, D. Sadykova, E. A. Falcone, A. S. Friedlaender, J. E. Joseph, D. Moretti, G. S. Schorr, L. Thomas, & P. L. Tyack. (2013). First direct measurements of behavioural responses by Cuvier’s beaked whales to mid-frequency active sonar. Biology Letters, 9, 201–223.
Dow Piniak, W. E., S. A. Eckert, C. A. Harms, & E. M. Stringer. (2012). Underwater Hearing Sensitivity of the Leatherback Sea Turtle (Dermochelys coriacea): Assessing the Potential Effect of Anthropogenic Noise. Herndon, VA.
Drescher, H. E. (1979). Biology, ecology and conservation of harbour seals in the tidelands of Schleswig-Holstein. Fisheries and Aquatic Sciences, 1–73.
Ellison, W. T., B. L. Southall, C. W. Clark, & A. S. Frankel. (2011). A new context-based approach to assess marine mammal behavioral responses to anthropogenic sounds. Conservation Biology, 26(1), 21–28.
Erbe, C. (2002). Underwater noise of whale-watching boats and potential effects on killer whales (Orcinus Orca), based on an acoustic impact model. Marine Mammal Science, 18(2), 394–418.
Fahlman, A., S. K. Hooker, A. Olszowka, B. L. Bostrom, & D. R. Jones. (2009). Estimating the effect of lung collapse and pulmonary shunt on gas exchange during breath-hold diving: the Scholander and Kooyman legacy. Respiratory Physiology & Neurobiology, 165(1), 28–39.
Criteria and Thresholds for U.S. Navy Acoustic and Explosive Effects Analysis (Phase III) June 2017
104
Falke, K. J., R. D. Hill, J. Qvist, R. C. Schneider, M. Guppy, G. C. Liggins, P. W. Hochachka, R. E. Elliott, & W. M. Zapol. (1985). Seal lungs collapse during free diving: evidence from arterial nitrogen tensions. Science, 229, 556–558.
Ferrero, R. C., & W. A. Walker. (1999). Age, growth, and reproductive patterns of Dall's porpoise (Phocoenoides dalli) in the central north Pacific Ocean. Marine Mammal Science, 15(2).
Finneran, J. J., C. E. Schlundt, D. A. Carder, J. A. Clark, J. A. Young, J. B. Gaspin, & S. H. Ridgway. (2000). Auditory and behavioral responses of bottlenose dolphins (Tursiops truncatus) and a beluga whale (Delphinapterus leucas) to impulsive sounds resembling distant signatures of underwater explosions. Journal of Acoustical Society of America, 108(1), 417–431.
Finneran, J. J., D. A. Carder, & S. H. Ridgway. (2001). Temporary threshold shift (TTS) in bottlenose dolphins (Tursiops truncatus) exposed to tonal signals. The Journal of Acoustical Society of America, 110(5), 2749(A).
Finneran, J. J., C. E. Schlundt, R. Dear, D. A. Carder, & S. H. Ridgway. (2002). Temporary shift in masked hearing thresholds in odontocetes after exposure to single underwater impulses from a seismic watergun. The Journal of Acoustical Society of America, 111(6), 2929–2940.
Finneran, J. J., D. A. Carder, R. Dear, T. Belting, & S. H. Ridgway. (2003a). Pure-tone audiograms and hearing loss in the white whale (Delphinapterus leucas). The Journal of Acoustical Society of America, 114, 2434(A).
Finneran, J. J., R. Dear, D. A. Carder, & S. H. Ridgway. (2003b). Auditory and behavioral responses of California sea lions (Zalophus californianus) to single underwater impulses from an arc-gap transducer. The Journal of Acoustical Society of America, 114(3), 1667–1677.
Finneran, J. J., & C. E. Schlundt. (2004). Effects of intense pure tones on the behavior of trained odontocetes. San Diego, CA: SSC San Diego.
Finneran, J. J., D. A. Carder, R. Dear, T. Belting, J. McBain, L. Dalton, & S. H. Ridgway. (2005a). Pure tone audiograms and possible aminoglycoside-induced hearing loss in belugas (Delphinapterus leucas). Journal of the Acoustic Society of America, 117, 3936–3943.
Finneran, J. J., D. A. Carder, C. E. Schlundt, & S. H. Ridgway. (2005b). Temporary threshold shift in bottlenose dolphins (Tursiops truncatus) exposed to mid-frequency tones. The Journal of Acoustical Society of America, 118(4), 2696–2705.
Finneran, J. J., C. E. Schlundt, B. Branstetter, & R. L. Dear. (2007). Assessing temporary threshold shift in a bottlenose dolphin (Tursiops truncatus) using multiple simultaneous auditory evoked potentials. The Journal of Acoustical Society of America, 122(2), 1249–1264.
Finneran, J. J. (2010). Auditory weighting functions and frequency-dependent effects of sound in bottlenose dolphins (Tursiops truncatus) (Marine Mammals & Biological Oceanography Annual Reports: FY10). Washington, DC: Office of Naval Research.
Criteria and Thresholds for U.S. Navy Acoustic and Explosive Effects Analysis (Phase III) June 2017
105
Finneran, J. J., D. A. Carder, C. E. Schlundt, & R. L. Dear. (2010a). Growth and recovery of temporary threshold shift at 3 kHz in bottlenose dolphins: Experimental data and mathematical models. The Journal of Acoustical Society of America, 127(5), 3256–3266.
Finneran, J. J., D. A. Carder, C. E. Schlundt, & R. L. Dear. (2010b). Temporary threshold shift in a bottlenose dolphin (Tursiops truncatus) exposed to intermittent tones. The Journal of Acoustical Society of America, 127(5), 3267–3272.
Finneran, J. J., & C. E. Schlundt. (2010). Frequency-dependent and longitudinal changes in noise-induced hearing loss in a bottlenose dolphin (Tursiops truncatus). The Journal of Acoustical Society of America, 128(2), 567–570.
Finneran, J. J., & C. E. Schlundt. (2011). Subjective loudness level measurements and equal loudness contours in a bottlenose dolphin (Tursiops truncatus). The Journal of Acoustical Society of America (in review), 130(5), 3124–3136.
Finneran, J. J., & A. K. Jenkins. (2012a). Criteria and Thresholds for U.S. Navy Acoustic and Explosive Effects Analysis. San Diego, CA: Department of Navy.
Finneran, J. J., & A. K. Jenkins. (2012b). Criteria and Thresholds for Navy Acoustic Effects Analysis Technical Report. SPAWAR Marine Mammal Program.
Finneran, J. J., & C. E. Schlundt. (2013). Effects of fatiguing tone frequency on temporary threshold shift in bottlenose dolphins (Tursiops truncatus). The Journal of Acoustical Society of America, 133(3), 1819–1826.
Finneran, J. J. (2015). Noise-induced hearing loss in marine mammals: a review of temporary threshold shift studies from 1996 to 2015. The Journal of Acoustical Society of America, 138(3), 1702–1726.
Finneran, J. J., C. E. Schlundt, B. K. Branstetter, J. S. Trickey, V. Bowman, & K. Jenkins. (2015). Effects of multiple impulses from a seismic air gun on bottlenose dolphin hearing and behavior. The Journal of Acoustical Society of America, 137(4), 1634–1646.
Ford, J. K. B., & H. D. Fisher. (1982). Killer whale (Orcinus orca) dialects as an indicator of stocks in British Columbia. Reports of the International Whaling Commission, 32, 671-679.
Fristrup, K. M., L. T. Hatch, & C. W. Clark. (2003). Variation in humpback whale (Megaptera novaeangliae) song length in relation to low-frequency sound broadcasts. The Journal of Acoustical Society of America, 113(6), 3411–3424.
Fromm, D. M. (2009). Reconstruction of Acoustic Exposure on Orcas in Haro Strait (Acoustics).
Gallo-Reynoso, J. P., & A. L. Figueroa-Carranza. (2010). Pup growth of the guadalupe fur seal, Arctocephalus townsendi. Therya, 1(1), 75–90.
Gambell, R. (1985). Sei Whale Balaenoptera borealis (Lesson, 1828) Handbook of Marine Mammals (Vol. 3, pp. 155–170).
Gerstein, E. R., L. Gerstein, S. E. Forsythe, & J. E. Blue. (1999). The underwater audiogram of the West Indian manatee (Trichechus manatus). The Journal of Acoustical Society of America, 105(6), 3575–3583.
Criteria and Thresholds for U.S. Navy Acoustic and Explosive Effects Analysis (Phase III) June 2017
106
Ghoul, A., & C. Reichmuth. (2014). Hearing in the sea otter (Enhydra lutris): auditory profiles for an amphibious marine carnivore. J Comp Physiol A Neuroethol Sens Neural Behav Physiol, 200(11), 967–981.
Goertner, J. F. (1982). Prediction of Underwater Explosion Safe Ranges for Sea Mammals. Dahlgren, VA: Naval Surface Weapons Center.
Goldbogen, J. A., B. L. Southall, S. L. DeRuiter, J. Calambokidis, A. S. Friedlaender, E. L. Hazen, E. A. Falcone, G. S. Schorr, A. Douglas, D. J. Moretti, C. Kyburg, M. F. McKenna, & P. L. Tyack. (2013). Blue whales respond to simulated mid-frequency military sonar. Proc Biol Sci, 280(1765), 20130657.
Götz, T. (2008). Aversiveness of sound in marine mammals: Psycho-physiological basis, behavioural correlates and potential applications. (PhD dissertation). University of St Andrews.
Götz, T., & V. M. Janik. (2010). Aversiveness of sounds in phocid seals: Psycho-physiological factors, learning processes and motivation. The Journal of Experimental Biology, 213, 1536–1548.
Götz, T., & V. M. Janik. (2011). Repeated elicitation of the acoustic startle reflex leads to sensation in subsequent avoidance behaviour and induces fear conditioning. BMC Neuroscience, 12(30), 13.
Graphpad, I. (2007). Graphpad Prism Software Version 5.0. Retrieved from Equation: Biphasic dose-response http://www.graphpad.com/guides/prism/5/user-guide/prism5help.html?reg_biphasic_dose_response.htm
Haller, M. A., K. M. Kovacs, & M. O. Hammill. (1996). Maternal behavior and energy investment by grey seals (Halichoerus grypus) breeding on land-fast ice. Canadian Journal of Zoology, 74(8), 1531–1541.
Halvorsen, M. B., D. A. Zeddies, W. T. Ellison, D. R. Chicoine, & A. N. Popper. (2012). Effects of mid-frequency active sonar on hearing in fish. The Journal of Acoustical Society of America, 131(1), 599–607.
Halvorsen, M. B., D. G. Zeddies, D. Chicoine, & A. N. Popper. (2013). Effects of low-frequency naval sonar exposure on three species of fish. The Journal of Acoustical Society of America, 134(2), EL205–210.
Heffner, R. S., & H. E. Heffner. (1982). Hearing in the elephant (Elephas maximus): absolute sensitivity, frequency discrimination, and sound localization. Journal of Comparative and Physiological Psychology, 96(6), 926–944.
Heise, K. (1997). Life history and population parameters of Pacific white-sided dolphins (Lagenorhynchus obliquidens). Reports of the International Whaling Commission, 47, 817–826.
Henderson, E. E., M. H. Smith, M. Gassmann, S. M. Wiggins, A. B. Douglas, & J. A. Hildebrand. (2014). Delphinid behavioral responses to incidental mid-frequency active sonar. The Journal of Acoustical Society of America, 136(4), 2003–2014.
Criteria and Thresholds for U.S. Navy Acoustic and Explosive Effects Analysis (Phase III) June 2017
107
Henderson, E. E., S. W. Martin, R. Manzano-Roth, & B. M. Matsuyama. (2016). Occurrence and habitat use of foraging Blainville's beaked whales (Mesoplodon densirostris) on a U.S. Navy range in Hawai'i. Aquatic Mammals, 42(4).
Hochscheid, S., C. R. McMahon, C. J. A. Bradshaw, F. Maffucci, F. Bentivegna, & G. C. Hays. (2007). Allometric scaling of lung volume and its consequences for marine turtle diving performance. Comparative Biochemistry and Physiology Part A: Molecular & Integrative Physiology, 148(2), 360–367.
Houser, D. S., D. A. Helweg, & P. W. B. Moore. (2001). A bandpass filter-bank model of auditory sensitivity in the humpback whale. Aquatic Mammals, 27(2), 82–91.
Houser, D. S., S. W. Martin, & J. J. Finneran. (2013a). Exposure amplitude and repetition affect bottlenose dolphin behavioral responses to simulated mid-frequency sonar signals. Journal of Experimental Marine Biology and Ecology, 443, 123–133.
Houser, D. S., S. W. Martin, & J. J. Finneran. (2013b). Behavioral responses of California sea lions to mid-frequency (3250-3450 Hz) sonar signals. Marine Environmental Researcgh, 92, 268–278.
Iverson, S. J., W. D. Bowen, D. J. Boness, & O. T. Oftedal. (1993). The Effect of Maternal Size and Milk Energy Output on Pup Growth in Grey Seals (Halichoerus grypus). Physiological Zoology, 68(1), 61–88.
Jacobs, D. W., & J. D. Hall. (1972). Auditory thresholds of a fresh water dolphin, Inia geoffrensis Blainville. Journal of the Acoustical Society of America, 51(2B), 530–533.
Jacobs, S. R., & J. M. Terhune. (2002). The effectiveness of acoustic harassment devices in the Bay of Fundy, Canada: seal reactions and a noise exposure model. Aquatic Mammals, 28(2), 147–158.
Jefferson, T. A., M. A. Webber, & R. L. Pitman. (2008). Marine Mammals of the World: A Comprehensive Guide to their Identification. London, UK: Elsevier.
Jett, J., B. Thapa, & R. Sweet. (2013). Boater speed compliance in manatee zones: examining a proposed predictive model. Society and Natural Resources, 26, 95–104.
Johnson, C. S. (1967). Sound Detection Thresholds in Marine Mammals. In W. N. Tavolga (Ed.), Marine Bioacoustics (pp. 247–260). Oxford, UK: Pergamon Press.
Johnson, C. S., M. W. McManus, & D. Skaar. (1989). Masked tonal hearing thresholds in the beluga whale. Journal of the Acoustical Society of America, 85(6), 2651–2654.
Johnston, D. W. (2002). The effect of acoustic harassment devices on harbour porpoises (Phocoena phocoena) in the Bay of Fundy, Canada. Biological Conservation, 108, 113–118.
Jones, T. T. (2009). Energetics of the leatherback turtle (Dermochelys coriacea). (Doctor of Philosophy). University of British Columbia.
Criteria and Thresholds for U.S. Navy Acoustic and Explosive Effects Analysis (Phase III) June 2017
108
Kastak, D., & R. J. Schusterman. (1999). In-air and underwater hearing sensitivity of a northern elephant seal (Mirounga angustirostris). Canadian Journal of Zoology, 77(11), 1751–1758.
Kastak, D., B. Southall, M. Holt, C. R. Kastak, & R. Schusterman. (2004). Noise‐induced temporary threshold shifts in pinnipeds: Effects of noise energy. Journal of Acoustical Society of America, 116(4), 2531-2532(A).
Kastak, D., B. L. Southall, R. J. Schusterman, & C. R. Kastak. (2005). Underwater temporary threshold shift in pinnipeds: Effects of noise level and duration. The Journal of Acoustical Society of America, 118(5), 3154–3163.
Kastak, D., C. Reichmuth, M. M. Holt, J. Mulsow, B. L. Southall, & R. J. Schusterman. (2007). Onset, growth, and recovery of in-air temporary threshold shift in a California sea lion (Zalophus californianus). The Journal of Acoustical Society of America, 122(5), 2916–2924.
Kastak, D., J. Mulsow, A. Ghoul, & C. Reichmuth. (2008). Noise-induced permanent threshold shift in a harbor seal. The Journal of the Acoustical Society of America, 123(5), 2986(A).
Kastelein, R., N. Jennings, W. Verboom, D. de Haan, & N. M. Schooneman. (2006a). Differences in the response of a striped dolphin (Stenella coeruleoalba) and a harbor porpoise (Phocoena phocoena) to an acoustic alarm. Marine Environmental Research, 61, 363–378.
Kastelein, R. A., A. D. Goodson, D. de Haan, & J. Lien. (1995). The Effects of Acoustic Alarms on Harbour Porpoise (Phocoena phocoena) Behaviour. In P. E. Nachtigall, J. Lien, W. W. L. Au & A. J. Read (Eds.), Harbour porpoises: Laboratory Studies to Reduce Bycatch (pp. 157–167). Woerden, The Netherlands: De Spil Publishers.
Kastelein, R. A., H. T. Rippe, N. Vaughan, N. M. Schooneman, W. C. Verboom, & D. de Haan. (2000). The effects of acoustic alarms on the behavior of harbor porpoises (Phocoena phocoena) in a floating pen. Marine Mammal Science, 16(1), 46–64.
Kastelein, R. A., P. Bunskoek, M. Hagedoorn, W. L. A. Whitlow, & D. de Haan. (2002a). Audiogram of a harbor porpoise (Phocoena phocoena) measured with narrow-band frequency-modulated signals. The Journal of Acoustical Society of America, 112(1), 334.
Kastelein, R. A., P. Mosterd, B. van Santen, M. Hagedoorn, & D. de Haan. (2002b). Underwater audiogram of a Pacific walrus (Odobenus rosmarus divergens) measured with narrow-band frequency-modulated signals. The Journal of Acoustical Society of America, 112(5), 2173–2182.
Kastelein, R. A., M. Hagedoorn, W. W. L. Au, & D. de Haan. (2003). Audiogram of a striped dolphin (Stenella coeruleoabla). The Journal of Acoustical Society of America, 113(2), 1130–1137.
Kastelein, R. A., M. Janssen, W. C. Verboom, & D. de Haan. (2005a). Receiving beam patterns in the horizontal plane of a harbor porpoise (Phocoena phocoena). The Journal of Acoustical Society of America, 118(2), 1172–1179.
Criteria and Thresholds for U.S. Navy Acoustic and Explosive Effects Analysis (Phase III) June 2017
109
Kastelein, R. A., R. van Schie, W. C. Verboom, & D. de Haan. (2005b). Underwater hearing sensitivity of a male and a female Steller sea lion (Eumetopias jubatus). The Journal of Acoustical Society of America, 118(3), 1820–1829.
Kastelein, R. A., S. van der Heul, J. M. Terhune, W. C. Verboom, & R. J. V. Triesscheijn. (2006b). Deterring effects of 8-45 kHz tone pulses on harbour seals (Phoca vitulina) in a large pool. Marine Environmental Research, 62, 356–373.
Kastelein, R. A., W. C. Verboom, N. Jennings, & D. de Haan. (2008). Behavioral avoidance threshold level of a harbor porpoise (Phocoena phocoena) for a continuous 50 kHz pure tone (L). Journal of the Acoustical Society of America, 123(4), 1858–1861.
Kastelein, R. A., P. Wensveen, L. Hoek, & J. M. Terhune. (2009). Underwater hearing sensitivity of harbor seals (Phoca vitulina) for narrow noise bands between 0.2 and 80 kHz. The Journal of Acoustical Society of America, 126(1), 476–483.
Kastelein, R. A., L. Hoek, C. A. F. de Jong, & P. J. Wensveen. (2010). The effect of signal duration on the underwater detection thresholds of a harbor porpoise (Phocoena phocoena) for single frequency-modulated tonal signals between 0.25 and 160 kHz. Journal of the Acoustical Society of America, 128(5), 3211–3222.
Kastelein, R. A., R. Gransier, L. Hoek, A. Macleod, & J. M. Terhune. (2012a). Hearing threshold shifts and recovery in harbor seals (Phoca vitulina) after octave-band noise exposure at 4 kHz. The Journal of Acoustical Society of America, 132(4), 2745–2761.
Kastelein, R. A., R. Gransier, L. Hoek, & J. Olthuis. (2012b). Temporary threshold shifts and recovery in a harbor porpoise (Phocoena phocoena) after octave-band noise at 4 kHz. The Journal of Acoustical Society of America, 132(5), 3525–3537.
Kastelein, R. A., N. Steen, R. Gransier, P. J. Wensveen, & C. A. F. de Jong. (2012c). Threshold received sound pressure levels of single 1-2 kHz and 6-7 kHz up-sweeps and down-sweeps causing startle responses in a harbor porpoise (Phocoena phocoena). The Journal of the Acoustical Society of America, 131(3), 2325–2333.
Kastelein, R. A., R. Gransier, & L. Hoek. (2013a). Comparative temporary threshold shifts in a harbor porpoise and harbor seal, and severe shift in a seal. The Journal of Acoustical Society of America, 134(1), 13–16.
Kastelein, R. A., R. Gransier, L. Hoek, & M. Rambags. (2013b). Hearing frequency thresholds of a harbor porpoise (Phocoena phocoena) temporarily affected by a continuous 1.5 kHz tone. Journal of the Acoustical Society of America, 134(3), 2286–2292.
Kastelein, R. A., R. Gransier, M. van den Hoogen, & L. Hoek. (2013c). Brief behavioral response threshold levels of a harbor porpoise (Phocoena phocoena) to five helicopter dipping sonar signals (1.33 to 1.43 kHz). Aquatic Mammals, 39(2), 162–173.
Kastelein, R. A., D. van Heerden, R. Gransier, & L. Hoek. (2013d). Behavioral responses of a harbor porpoise (Phoceoena phocoena) to playbakcs of broadband pile driving sounds. Marine Environmental Research, 92, 206–214.
Criteria and Thresholds for U.S. Navy Acoustic and Explosive Effects Analysis (Phase III) June 2017
110
Kastelein, R. A., L. Hoek, R. Gransier, C. A. F. de Jong, J. M. Terhune, & N. Jennings. (2014a). Hearing thresholds of a harbor porpoise (Phocoena phocoena) for playbacks of seal scarer signals, and effects of the signals on behavior. Hydrobiologia, 756(1), 89–103.
Kastelein, R. A., L. Hoek, R. Gransier, M. Rambags, & N. Claeys. (2014b). Effect of level, duration, and inter-pulse interval of 1–2 kHz sonar signal exposures on harbor porpoise hearing. Journal of Acoustical Society of America, 136(1), 412–422.
Kastelein, R. A., J. Schop, R. Gransier, & L. Hoek. (2014c). Frequency of greatest temporary hearing threshold shift in harbor porpoises (Phocoena phocoena) depends on the noise level. The Journal of the Acoustical Society of America, 136(3), 1410–1418.
Kastelein, R. A., R. Gransier, M. A. T. Marijt, & L. Hoek. (2015a). Hearing frequency thresholds of harbor porpoises (Phocoena phocoena) temporarily affected by played back offshore pile driving sounds. The Journal of Acoustical Society of America, 137(2), 556–564.
Kastelein, R. A., R. Gransier, J. Schop, & L. Hoek. (2015b). Effects of exposure to intermittent and continuous 6–7 kHz sonar sweeps on harbor porpoise (Phocoena phocoena) hearing. The Journal of Acoustical Society of America, 137(4), 1623–1633.
Kastelein, R. A., L. Helder-Hoek, G. Janssens, R. Gransier, & T. Johansson. (2015c). Behavioral responses of harbor seals (Phoca vitulina) to sonar signals in the 25-kHz range. Aquatic Mammals, 41(4), 388–399.
Kastelein, R. A., J. Schop, L. Hoek, & J. Covi. (2015d). Hearing thresholds of a harbor porpoise (Phocoena phocoena) for narrow-band sweeps. The Journal of the Acoustical Society of America, 138(4), 2508–2512.
Kastelein, R. A., I. van den Belt, R. Gransier, & T. Johansson. (2015e). Behavioral responses of a harbor porpoise (Phocoena phocoena) to 25.5- to 24.5-kHz sonar down-sweeps with and without side bands. Aquatic Mammals, 41(4), 400–411.
Kastelein, R. A., I. van den Belt, L. Helder-Hoek, R. Gransier, & T. Johansson. (2015f). Behavioral responses of a harbor porpoise (Phocoena phocoena) to 25-kHz FM sonar signals. Aquatic Mammals, 41(3), 311–326.
Kenyon, K. W. (1981). Monk Seals Monachus Fleming, 1822. In S. H. Ridgway & R. J. Harrison (Eds.), Handbook of Marine Mammals: Seals (Vol. 2, pp. 195 –220).
Ketten, D. R. (1994). Functional analyses of whale ears: adaptations for underwater hearing. Paper presented at the IEEE Proceedings in Underwater Acoustics.
Ketten, D. R. (2000). Cetacean Ears. In W. Au, A. N. Popper & R. R. Fay (Eds.), Hearing by Whales and Dolphins (1st ed., pp. 43–108). New York, NY: Springer-Verlag.
Ketten, D. R., & D. Mountain. (2009). Final Report: Modeling Minke Whale Hearing. submitted to E&P Sound and Marine Life Programme.
Kooyman, G. L., J. P. Schroeder, D. M. Denison, D. D. Hammond, J. J. Wright, & W. P. Bergman. (1972). Blood nitrogen tensions of seals during simulated deep dives. American Journal of Physiology, 223(5), 1016–1020.
Criteria and Thresholds for U.S. Navy Acoustic and Explosive Effects Analysis (Phase III) June 2017
111
Kooyman, G. L., D. H. Kerem, W. B. Campbell, & J. J. Wright. (1973). Pulmonary gas exchange in freely diving weddell seals, Leptonychotes weddelli. Respiration Physiology, 17, 283–290.
Kooyman, G. L., & E. E. Sinnett. (1982). Pulmonary shunts in harbor seals and sea lions during simulated dives to depth. Physiological Zoology, 55(1), 105–111.
Kovacs, K. M., & D. M. Lavigne. (1985). Neonatal growth and organ allometry of Northwest Atlantic harp seals (Phoca groenlandica). Canadian Journal of Zoology, 63, 2793–2799.
Kovacs, K. M. (1987). Maternal behaviour and early behavioural ontogeny of grey seals (Hafichoerus grypus) on the Isle of May, UK. Journal of Zoology, 213, 697–715.
Kovacs, K. M., D. M. Lavigne, & S. Innes. (1991). Mass transfer efficiency between harp seal (Phoca groenlandica) mothers and their pups during lactation. Journal of Zoology, 223, 213–221.
Kovacs, K. M., & D. M. Lavigne. (1992). Mass-transfer efficiency between hooded seal (Cystophora cristata) mothers and their pups in the Gulf of St. Lawerence. Canadian Journal of Zoology, 70, 1315–1320.
Kovacs, K. M. (2002). Bearded seal: Erignathus barbatus. Tromsø, Norway: Norwegian Ministry of Environment.
Kryter, K. D., W. D. Ward, J. D. Miller, & D. H. Eldredge. (1965). Hazardous exposure to intermittent and steady-state noise. The Journal of Acoustical Society of America, 39(3), 451–464.
Kuningas, S., P. H. Kvadsheim, F. P. A. Lam, & P. J. O. Miller. (2013). Killer whale presence in relation to naval sonar activity and prey abundance in northern Norway. ICES Journal of Marine Science, 70(7), 1287–1293.
Kvadsheim, P. H., E. M. Sevaldsen, L. P. Folkow, & A. S. Blix. (2010a). Behavioural and physiological responses of hooded seals (Cytophora cristata) to 1 to 7 kHz sonar signals. Aquatic Mammals, 36(3), 239–247.
Kvadsheim, P. H., E. M. Sevaldsen, D. Scheie, L. P. Folkow, & A. S. Blix. (2010b). Effects of naval sonar on seals. Norwegian Defense Research Establishment (FFI).
Lammers, M. O., A. A. Pack, & L. Davis. (2003). Historical evidence of whale/vessel collisions in Hawaiian waters (1975—Present).
Lemonds, D. W. (1999). Auditory Filter Shapes in an Atlantic Bottlenose Dolphin (Tursiops truncatus). (PhD). University of Hawaii.
Ljungblad, D. K., P. D. Scroggins, & W. G. Gilmartin. (1982). Auditory thresholds of a captive Eastern Pacific bottle-nosed dolphin, Tursiops spp. Journal of the Acoustical Society of America, 72(6), 1726–1729.
Loughlin, T. R. (2009). Steller Sea Lion: Eumetopias jubatus. In W. F. Perrin & B. Wursig (Eds.), Encyclopedia of Marine Mammals (pp. 1107–1110). Academic Press.
Criteria and Thresholds for U.S. Navy Acoustic and Explosive Effects Analysis (Phase III) June 2017
112
Lucke, K., U. Siebert, P. A. Lepper, & M. A. Blanchet. (2009). Temporary shift in masked hearing thresholds in a harbor porpoise (Phocoena phocoena) after exposure to seismic airgun stimuli. Journal of Acoustical Society of America, 125(6), 4060–4070.
Lusseau, D. (2006). The short-term behavioral reactions of bottlenose dolphins to interactions with boats in Doubtful Sound, New Zealand. Marine Mammal Science, 22(4), 802–818.
Lutcavage, M. E., P. G. Bushnell, & D. R. Jones. (1992). Oxygen stores and aerobic metabolism in the leatherback sea turtle. Canadian Journal of Zoology, 70(2), 348–351.
Lydersen, C., M. O. Hammill, & K. M. Kovacs. (1994). Diving activity in nursing bearded seal (Erignathus barbatus) pups. Canadian Journal of Zoology, 72, 96–103.
Lydersen, C., & K. M. Kovacs. (1996). Energetics of lactation in harp seals (Phoca groenlandica) from the Gulf of St. Lawrence, Canada. Journal of Comparative Physiology B, 166, 295–304.
Lydersen, C., K. M. Kovacs, & M. O. Hammill. (1997). Energetics during nursing and early postweaning fasting in hooded seal (Cystophora cristata) pups from the Gulf of St Lawrence, Canada. Journal of Comparative Physiology B, 167, 81–88.
Lydersen, C., & K. M. Kovacs. (1999). Behaviour and energetics of ice-breeding, North Atlantic phocid seals during the lactation period. Marine Ecology Progress Series, 187, 265–281.
Lydersen, C., K. M. Kovacs, S. Ries, & M. Knauth. (2002). Precocial diving and patent foramen ovale in bearded seal (Erignathus barbatus) pups. Journal of Comparative Physiology B, 172(8), 713–717.
Mann, D., G. Bauer, R. Reep, J. Gaspard, K. Dziuk, & L. Read. (2009). Auditory and Tactile Detection by the West Indian Manatee. St. Petersburg, FL: Fish and Wildlife Research Institute.
Martin, K. J., S. C. Alessi, J. C. Gaspard, A. D. Tucker, G. B. Bauer, & D. A. Mann. (2012). Underwater hearing in the loggerhead turtle (Caretta caretta): A comparison of behavioral and auditory evoked potential audiograms. Journal of Experimental Biology, 215(17), 3001–3009.
Martin, S. W., C. R. Martin, B. M. Matsuyama, & E. E. Henderson. (2015). Minke whales (Balaenoptera acutorostrata) respond to navy training. The Journal of the Acoustical Society of America, 137(5), 2533–2541.
Maslen, K. R. (1981). Towards a better understanding of temporary threshold shift of hearing. Applied Acoustics, 14, 281–318.
McCarthy, E., D. Moretti, L. Thomas, N. DiMarzio, R. Morrissey, S. Jarvis, J. Ward, A. Izzi, & A. Dilley. (2011). Changes in spatial and temporal distribution and vocal behavior of Blainville's beaked whales (Mesoplodon densirostris) during multiship exercises with mid-frequency sonar. Marine Mammal Science, 27(3), E206–E226.
McCauley, R. D., J. Fewtrell, A. J. Duncan, C. Jenner, M. N. Jenner, J. D. Penrose, R. I. T. Prince, A. Adhitya, J. Murdoch, & K. McCabe. (2000). Marine seismic surveys—A study of

Criteria and Thresholds for U.S. Navy Acoustic and Explosive Effects Analysis (Phase III) June 2017
113
environmental implications. Australian Petroleum Production Exploration Association Journal, 692–708.
McDonald, B. I., & P. J. Ponganis. (2012). Lung collapse in the diving sea lion: hold the nitrogen and save the oxygen. Biology Letters, 8, 1047–1049.
McDonald, M. A., J. A. Hildebrand, S. M. Wiggins, D. W. Johnston, & J. J. Polovina. (2009). An acoustic survey of beaked whales at Cross Seamount near Hawaii. The Journal of the Acoustical Society of America, 125(2), 624–627.
McVey, J. P., & T. Wibbles. (1984). The Growth and Movements of Cap-Tive-Reared Kemp’s Ridley Sea Turtles, Lepidochelys kempi, Following their Release in the Gulf of Mexico (NOAA Technical Memorandum).
Mellish, J. E., S. J. Iverson, W. D. Bowen, & M. O. Hammill. (1999). Fat transfer and energetics during lactation in the hooded seal: The roles of tissue lipoprotein lipase in milk fat secretion and pup blubber deposition. Journal of Comparative Physiology B, 169, 377–390.
Miksis-Olds, J. L., P. L. Donaghay, J. H. Miller, P. L. Tyack, & J. E. Reynolds, III. (2007). Simulated vessel approaches elicit differential responses from manatees. Marine Mammal Science, 23(3), 629–649.
Miller, J. D., C. S. Watson, & W. P. Covell. (1963). Deafening effects of noise on the cat. Acta Oto-Laryngologica, Supplement 176, 1–88.
Miller, P., R. Antunes, A. C. Alves, P. Wensveen, P. Kvadsheim, L. Kleivane, N. Nordlund, F.-P. Lam, S. van IJsselmuide, F. Visser, & P. Tyack. (2011). The 3S experiments: studying the behavioural effects of naval sonar on killer whales (Orcinus orca), sperm whales (Physeter macrocephalus), and long-finned pilot whales (Globicephala melas) in Norwegian waters (Scottish Oceans Inst. Tech. Rept., SOI-2011-001).
Miller, P. J., R. N. Antunes, P. J. Wensveen, F. I. Samarra, A. C. Alves, P. L. Tyack, P. H. Kvadsheim, L. Kleivane, F. P. Lam, M. A. Ainslie, & L. Thomas. (2014). Dose-response relationships for the onset of avoidance of sonar by free-ranging killer whales. The Journal of Acoustical Society of America, 135(2), 975–993.
Miller, P. J., P. H. Kvadsheim, F. P. Lam, P. L. Tyack, C. Cure, S. L. DeRuiter, L. Kleivane, L. D. Sivle, I. S. P. van, F. Visser, P. J. Wensveen, A. M. von Benda-Beckmann, L. M. Martin Lopez, T. Narazaki, & S. K. Hooker. (2015). First indications that northern bottlenose whales are sensitive to behavioural disturbance from anthropogenic noise. Royal Society Open Science, 2(6), 140484.
Miller, P. J. O., N. Biassoni, A. Samuels, & P. L. Tyack. (2000). Whale songs lengthen in response to sonar. Nature, 405(6789), 903.
Miller, P. J. O., P. H. Kvadsheim, F.-P. A. Lam, P. J. Wensveen, R. Antunes, A. C. Alves, F. Visser, L. Kleivane, P. L. Tyack, & L. D. Sivle. (2012). The severity of behavioral changes observed during experimental exposures of killer (Orcinus orca), long-finned pilot (Globicephala
Criteria and Thresholds for U.S. Navy Acoustic and Explosive Effects Analysis (Phase III) June 2017
114
melas), and sperm (Physeter macrocephalus) whales to naval sonar. Aquatic Mammals, 38(4), 362–401.
Mooney, T. A., P. E. Nachtigall, M. Breese, S. Vlachos, & W. W. L. Au. (2009). Predicting temporary threshold shifts in a bottlenose dolphin (Tursiops truncatus): The effects of noise level and duration. Journal of Acoustical Society of America, 125(3), 1816–1826.
Moore, P. W. B., & R. J. Schusterman. (1987). Audiometric assessment of northern fur seals, Callorhinus ursinus. Marine Mammal Science, 3(1), 31–53.
Moretti, D., L. Thomas, T. Marques, J. Harwood, A. Dilley, B. Neales, J. Shaffer, E. McCarthy, L. New, S. Jarvis, & R. Morrissey. (2014). A risk function for behavioral disruption of Blainville's beaked whales (Mesoplodon densirostris) from mid-frequency active sonar. PLoS ONE, 9(1), e85064.
Mulsow, J., & C. Reichmuth. (2010). Psychophysical and electrophysiological aerial audiograms of a Steller sea lion (Eumetopias jubatus). Journal of the Acoustical Society of America, 127(4), 2692–2701.
Mulsow, J., D. S. Houser, & J. J. Finneran. (2012). Underwater psychophysical audiogram of a young male California sea lion (Zalophus californianus). Journal of the Acoustical Society of America, 131(5), 4182–4187.
Mulsow, J., C. E. Schlundt, L. Brandt, & J. J. Finneran. (2015). Equal latency contours for bottlenose dolphins (Tursiops truncatus) and California sea lions (Zalophus californianus). The Journal of Acoustical Society of America, 138(5), 2678.
Mulsow, J. L., J. J. Finneran, & D. S. Houser. (2011). California sea lion (Zalophus californianus) aerial hearing sensitivity measured using auditory steady-state response and psychophysical methods. Journal of the Acoustical Society of America, 129(4), 2298–2306.
Nachtigall, P. E., W. W. L. Au, J. Pawloski, & P. W. B. Moore. (1995). Risso’s dolphin (Grampus griseus) hearing thresholds in Kaneohe Bay, Hawaii. In R. A. Kastelein, J. A. Thomas & P. E. Nachtigall (Eds.), Sensory Systems of Aquatic Mammals (pp. 49-53). Woerden, The Netherlands: DeSpil.
Nachtigall, P. E., M. M. L. Yuen, T. A. Mooney, & K. A. Taylor. (2005). Hearing measurements from a stranded infant Risso's dolphin, Grampus griseus. Journal of Experimental Biology, 208, 4181–4188.
National Marine Fisheries Service. (2005). Assessment of Acoustic Exposures on Marine Mammals in Conjunction with USS Shoup Active Sonar Transmissions in the Eastern Strait of Juan de Fuca and Haro Strait, Washington, 5 May 2003. National Marine Fisheries Service, Office of Protected Resources,.
National Research Council. (2003). Ocean Noise and Marine Mammals. Washington, DC: National Academies Press.
Criteria and Thresholds for U.S. Navy Acoustic and Explosive Effects Analysis (Phase III) June 2017
115
Newsome, S. D., P. L. Koch, M. A. Etnier, & D. Aurioles-Gamboa. (2006). Using carbon and nitrogen isotope values to investigate maternal strategies in northeast Pacific otariids. Marine Mammal Science, 22(3), 556–572.
Noren, S. R., D. J. Boness, S. J. Iverson, J. McMillan, & W. D. Bowen. (2008). Body condition at weaning affects the duration of the postweaning fast in gray seal pups (Halichoerus grypus). Physiological and Biochemical Zoology, 81(3), 269–277.
Nowacek, D. P., M. P. Johnson, & P. L. Tyack. (2004a). North Atlantic right whales (Eubalaena glacialis) ignore ships but respond to alerting stimuli. Proceedings of the Royal Society of London, 271(B), 227–231.
Nowacek, D. P., L. H. Thorne, D. W. Johnston, & P. L. Tyack. (2007). Responses of cetaceans to anthropogenic noise. Mammal Review, 37(2), 81–115.
Nowacek, S. M., R. S. Wells, E. C. G. Owen, T. R. Speakman, R. O. Flamm, & D. P. Nowacek. (2004b). Florida manatees, Trichechus manatus latirostris, respond to approaching vessels. Biological Conservation, 119, 517–523.
O'Hara, J., & J. R. Wilcox. (1990). Avoidance responses of loggerhead turtles, Caretta caretta, to low frequency sound. Copeia, 1990(2), 564–567.
O'Keeffe, D. J., & G. A. Young. (1984). Handbook on the Environmental Effects of Underwater Explosions. Silver Spring, MD: U.S. Navy, Naval Surface Weapons Center (Code R14).
Okuyama, J., T. Shimizu, O. Abe, K. Yoseda, & N. Arai. (2010). Wild versus head-started hawksbill turtles Eretmochelys imbricata: Post-release behavior and feeding adaptions. Endangered Species Research, 10, 181–190.
Olesiuk, P. F., L. M. Nichol, M. J. Sowden, & J. K. B. Ford. (2002). Effect of the sound generated by an acoustic harassment device on the relative abundance and distribution of harbor porpoises (Phocoena phocoena) in retreat passage, British Columbia. Marine Mammal Science, 18(4), 843–862.
Owen, M. A., & A. E. Bowles. (2011). In-air auditory psychophysics and the management of a threatened carnivore, the polar bear (Ursus maritimus). International Journal of Comparative Psychology, 24, 244–254.
Parks, S. E., C. W. Clark, & P. L. Tyack. (2007a). Short- and long-term changes in right whale calling behavior: The potential effects of noise on acoustic communication. The Journal of Acoustical Society of America, 122(6), 3725–3731.
Parks, S. E., D. R. Ketten, J. T. O’Malley, & J. Arruda. (2007b). Anatomical predictions of hearing in the North Atlantic right whale. The Anatomical Record, 290, 734–744.
Parks, S. E., M. Johnson, D. Nowacek, & P. L. Tyack. (2011). Individual right whales call louder in increased environmental noise. Biology Letters, 7, 33–35.
Perrin, W. F., B. Wursig, & J. G. M. Thewissen. (2002). Encyclopedia of Marine Mammals: Academic Press.
Criteria and Thresholds for U.S. Navy Acoustic and Explosive Effects Analysis (Phase III) June 2017
116
Perrin, W. F., B. Würsig, & J. G. M. E. Thewissen. (2009). Encyclopedia of Marine Mammals (2nd ed.). San Diego, CA: Academic Press.
Pfingst, B. E., R. Hienz, J. Kimm, & J. Miller. (1975). Reaction-time procedure for measurement of hearing. I. Suprathreshold functions. Journal of the Acoustical Society of America, 57(2), 421–430.
Pirotta, E., N. D. Merchant, P. M. Thompson, T. R. Barton, & D. Lusseau. (2015). Quantifying the effect of boat disturbance on bottlenose dolphin foraging activity. Biological Conservation, 181, 82–89.
Piscitelli, M. A., W. A. McLellan, A. S. Rommel, J. E. Blum, S. G. Barco, & D. A. Pabst. (2010). Lung size and thoracic morphology in shallow and deep-diving cetaceans. Journal of morphology, 271, 654–673.
Plon, S. (2004). The status and natural history of pygmy (Kogia breviceps) and dwark (K. sima) sperm whales off Southern Africa. (Doctorate). Rhodes University, Grahamstown, South Africa.
Plummer, M. (2012). JAGS version 3.3.0 User Manual. Retrieved
Popov, V. V., A. Y. Supin, M. G. Pletenko, M. B. Tarakanov, V. O. Klishin, T. N. Bulgakova, & E. I. Rosanova. (2007). Audiogram variability in normal bottlenose dolphins (Tursiops truncatus). Aquatic Mammals, 33(1), 24–33.
Popov, V. V., V. O. Klishin, D. I. Nechaev, M. G. Pletenko, V. V. Rozhnov, A. Y. Supin, E. V. Sysueva, & M. B. Tarakanov. (2011a). Influence of acoustic noises on the white whale hearing thresholds. Doklady Biological Sciences, 440, 332–334.
Popov, V. V., A. Y. Supin, D. Wang, K. Wang, L. Dong, & S. Wang. (2011b). Noise-induced temporary threshold shift and recovery in Yangtze finless porpoises, Neophocaena phocaenoides asiaeorientalis. The Journal of Acoustical Society of America, 130(1), 574–584.
Popov, V. V., A. Y. Supin, V. V. Rozhnov, D. I. Nechaev, E. V. Sysuyeva, V. O. Klishin, M. G. Pletenko, & M. B. Tarakanov. (2013). Hearing threshold shifts and recovery after noise exposure in beluga whales, Delphinapterus leucas. Journal of Experimental Biology, 216(9), 1587–1596.
Popov, V. V., A. Y. Supin, V. V. Rozhnov, D. I. Nechaev, & E. V. Sysueva. (2014). The limits of applicability of the sound exposure level (SEL) metric to temporal threshold shifts (TTS) in beluga whales, Delphinapterus leucas. Journal of Experimental Biology, 217(Pt 10), 1804–1810.
Popov, V. V., D. I. Nechaev, E. V. Sysueva, V. V. Rozhnov, & A. Y. Supin. (2015a). Spectrum pattern resolution after noise exposure in a beluga whale, Delphinapterus leucas: Evoked potential study. The Journal of the Acoustical Society of America, 138(1), 377-388.
Criteria and Thresholds for U.S. Navy Acoustic and Explosive Effects Analysis (Phase III) June 2017
117
Popov, V. V., D. I. Nechaev, E. V. Sysueva, V. V. Rozhnov, & A. Y. Supin. (2015b). Spectrum pattern resolution after noise exposure in a beluga whale, Delphinapterus leucas: evoked potential study. The Journal of Acoustical Society of America, 138(1), 377–388.
Popper, A. N., A. D. Hawkins, R. R. Fay, D. A. Mann, S. M. Bartol, T. J. Carlson, S. Coombs, W. T. Ellison, R. L. Gentry, M. B. Halvorsen, S. Løkkeborg, P. H. Rogers, B. L. Southall, D. G. Zeddies, & W. N. Tavolga. (2014). Sound Exposure Guidelines for Fishes and Sea Turtles.
R Core Team, R. (2016). R: A language and environment for statistical computing. Retrieved from https://www.R-project.org/
Rajagopalan, M., M. Vijayakumaran, & A. B. Fernando. (1984). Some health problems observed in the hatchlings and juveniles of sea turtles in captivity. CMFRI Bulletin Sea Turtle Research, 35.
Reeves, R. R., B. S. Stewart, P. J. Clapham, & J. A. Powell. (2002). National Audubon Society Guide to Marine Mammals of the World. New York, NY: Alfred A. Knopf.
Reichmuth, C., & B. L. Southall. (2012). Underwater hearing in California sea lions (Zalophus californianus): expansion and interpretation of existing data. Marine Mammal Science, 28(2), 358–363.
Reichmuth, C., M. M. Holt, J. Mulsow, J. M. Sills, & B. L. Southall. (2013). Comparative assessment of amphibious hearing in pinnipeds. J Comp Physiol A Neuroethol Sens Neural Behav Physiol, 199(6), 491–507.
Reichmuth, C., A. Ghoul, A. Rouse, J. Sills, & B. Southall. (2016). Temporary threshold shift not measured in spotted or ringed seals exposed to single airgun impulses. The Journal of the Acoustical Society of America, (in review).
Reiter, J., N. L. Stinson, & B. J. Le Boeuf. (1978). Northern elephant seal development: The transition from weaning to nutritional independence. Behavioral Ecology and Sociobiology, 3, 337–367.
Richardson, W. J., C. R. Greene, Jr., C. I. Malme, & D. H. Thomson. (1995). Marine Mammals and Noise. San Diego, CA: Academic Press.
Richmond, D. R., J. T. Yelverton, & E. R. Fletcher. (1973). Far-field underwater-blast injuries produced by small charges. Washington, DC: Lovelace Foundation for Medical Education and Research, Defense Nuclear Agency.
Ridgway, S. H. (1972). Homeostasis in the Aquatic Environment. In S. H. Ridgway (Ed.), Mammals of the Sea: Biology and Medicine (pp. 590–747). Springfield, IL: Charles C. Thomas.
Ridgway, S. H., & R. Howard. (1979). Dolphin lung collapse and intramuscular circulation during free diving: Evidence from nitrogen washout. Science, 206, 1182–1183.
Ridgway, S. H., D. A. Carder, R. R. Smith, T. Kamolnick, C. E. Schlundt, & W. R. Elsberry. (1997). Behavioral Responses and Temporary Shift in Masked Hearing Threshold of Bottlenose Dolphins, Tursiops truncatus, to 1-second Tones of 141 to 201 dB re 1 µPa. (Technical

Criteria and Thresholds for U.S. Navy Acoustic and Explosive Effects Analysis (Phase III) June 2017
118
Report 1751, Revision 1). San Diego, CA: U.S. Department of Navy, Naval Command, Control and Ocean Surveillance Center, RDT&E Division.
Ridgway, S. H., D. A. Carder, T. Kamolnick, R. R. Smith, C. E. Schlundt, & W. R. Elsberry. (2001). Hearing and whistling in the deep sea: depth influences whistle spectra but does not attenuate hearing by white whales (Delphinapterus leucas). Journal of Experimental Biology, 204, 3829–3841.
Sauerland, M., & G. Dehnhardt. (1998). Underwater audiogram of a tucuxi (Sotalia fluviatilis guianensis). Journal of the Acoustical Society of America, 103(2), 1199–1204.
Schlundt, C. E., J. J. Finneran, D. A. Carder, & S. H. Ridgway. (2000). Temporary shift in masked hearing thresholds of bottlenose dolphins, Tursiops truncatus, and white whales, Delphinapterus leucas, after exposure to intense tones. The Journal of Acoustical Society of America, 107(6), 3496–3508.
Schlundt, C. E., J. J. Finneran, B. K. Branstetter, R. L. Dear, D. S. Houser, & E. Hernandez. (2008). Evoked potential and behavioral hearing thresholds in nine bottlenose dolphins (Tursiops truncatus). Journal of the Acoustical Society of America, 123, 3506(A).
Schorr, G. S., E. A. Falcone, D. J. Moretti, & R. D. Andrews. (2014). First long-term behavioral records from Cuvier's beaked whales (Ziphius cavirostris) reveal record-breaking dives. PLoS ONE, 9(3), e92633.
Schusterman, R. J., B. L. Southall, D. Kastak, & C. R. Kastak. (2001, 2001). Pinniped Vocal Communication: Form and Function. Paper presented at the Proceedings of the International Congress on Acoustics, Rome, Italy.
Sills, J. M., B. L. Southall, & C. Reichmuth. (2014). Amphibious hearing in spotted seals (Phoca largha): underwater audiograms, aerial audiograms and critical ratio measurements. The Journal of Experimental Biology, 217(Pt 5), 726–734.
Sills, J. M., B. L. Southall, & C. Reichmuth. (2015). Amphibious hearing in ringed seals (Pusa hispida): underwater audiograms, aerial audiograms and critical ratio measurements. The Journal of Experimental Biology, 218(Pt 14), 2250–2259.
Sivle, L. D., P. H. Kvadsheim, A. Fahlman, F. P. Lam, P. L. Tyack, & P. J. Miller. (2012). Changes in dive behavior during naval sonar exposure in killer whales, long-finned pilot whales, and sperm whales. Frontiers in Physiolology, 3, 400.
Sivle, L. D., P. H. Kvadsheim, C. Curé, S. Isojunno, P. J. Wensveen, F. A. Lam, F. Visser, L. Kleivane, P. L. Tyack, C. M. Harris, & P. J. O. Miller. (2015). Severity of expert-identified behavioural responses of humpback whale, minke whale, and northern bottlenose whale to naval sonar. Aquatic Mammals, 41(4), 469–502.
Southall, B., J. Calambokidis, P. Tyack, D. Moretti, J. Hildebrand, C. Kyburg, R. Carson, A. Friedlaender, E. Falcone, G. Schorr, A. Douglas, S. DeRuiter, J. Goldbogen, & J. Barlow. (2011). Biological and Behavioral Response Studies of Marine Mammals in Southern California, 2010 (“SOCAL-10”). Pearl Harbor, HI: U.S. Navy Pacific Fleet.
Criteria and Thresholds for U.S. Navy Acoustic and Explosive Effects Analysis (Phase III) June 2017
119
Southall, B., J. Calambokidis, P. Tyack, D. Moretti, A. Friedlaender, S. DeRuiter, J. Goldbogen, E. Falcone, G. Schorr, A. Douglas, A. Stimpert, J. Hildebrand, C. Kyburg, R. Carlson, T. Yack, & J. Barlow. (2012). Biological and Behavioral Response Studies of Marine Mammals in Southern California, 2011 ("SOCAL-11") Final Project Report (SOCAL-11 Project Report).
Southall, B., J. Calambokidis, J. Barlow, D. Moretti, A. Friedlaender, A. Stimpert, A. Douglas, K. Southall, S. Arranz, S. DeRuiter, E. Hazen, J. Goldbogen, E. Falcone, & G. Schorr. (2013). Biological and Behavioral Response Studies of Marine Mammals in Southern California, 2012 (“SOCAL‐12”).
Southall, B., J. Calambokidis, J. Barlow, D. Moretti, A. Friedlaender, A. Stimpert, A. Douglas, K. Southall, P. Arranz, S. DeRuiter, J. Goldbogen, E. Falcone, & G. Schorr. (2014). Biological and Behavioral Response Studies of Marine Mammals in Southern California, 2013 (“SOCAL‐13”). Pearl Harbor, HI: U.S. Navy Pacific Fleet.
Southall, B. L., A. E. Bowles, W. T. Ellison, J. J. Finneran, R. L. Gentry, C. R. Greene, Jr., D. Kastak, D. R. Ketten, J. H. Miller, P. E. Nachtigall, W. J. Richardson, J. A. Thomas, & P. L. Tyack. (2007). Marine mammal noise exposure criteria: Initial scientific recommendations. Aquatic Mammals, 33(4), 411–521.
Southwood, A., B. Higgins, R. Brill, & Y. Swimmer. (2007). Chemoreception in Loggerhead sea turtles: an assessment of the feasibility of using chemical deterrents to prevent sea turtle interactions with longline fishing gear. National Oceanic and Atmospheric Administration.
Stebbins, W. C. (1966). Auditory reaction time and the derivation of equal loudness contours for the monkey. Journal of the Experimental Analysis of Behavior, 9(2), 135–142.
Stimpert, A. K., S. L. DeRuiter, B. L. Southall, D. J. Moretti, E. A. Falcone, J. A. Goldbogen, A. Friedlaender, G. S. Schorr, & J. Calambokidis. (2014). Acoustic and foraging behavior of a Baird's beaked whale, Berardius bairdii, exposed to simulated sonar. Scientific Reports, 4, 7031.
Stone, C. J., & M. L. Tasker. (2006). The effects of seismic airguns on cetaceans in UK waters. Journal of Cetacean Research Management, 8(3), 255-263.
Szymanski, M. D., D. E. Bain, K. Kiehl, S. Pennington, S. Wong, & K. R. Henry. (1999). Killer whale (Orcinus orca) hearing: Auditory brainstem response and behavioral audiograms. The Journal of Acoustical Society of America, 106(2), 1134–1141.
Teilmann, J., J. Tougaard, L. A. Miller, T. Kirketerp, K. Hansen, & S. Brando. (2006). Reactions of captive harbor porpoises (Phocoena phocoena) to pinger-like sounds. Marine Mammal Science, 22(2), 240–260.
Terhune, J. M. (1988). Detection thresholds of a harbour seal to repeated underwater high-frequency, short-duration sinusoidal pulses. Canadian Journal of Zoology, 66.
Testa, J. W. (2012). Fur seal investigations, 2010–2011 (NOAA Technical Memorandum NMFS-AFSC-241). La Jolla, CA: Southwest Fisheries Science Center.
Criteria and Thresholds for U.S. Navy Acoustic and Explosive Effects Analysis (Phase III) June 2017
120
Thomas, J. A., N. Chun, W. W. L. Au, & K. Pugh. (1988). Underwater audiogram of a false killer whale (Pseudorca crassidens). Journal of the Acoustical Society of America, 84, 936–940.
Tikhomirov, E. A. (1971). Body Growth and Development of Reproductive Organs of the North Pacific Phocids. Pacific Research Institute of Fisheries and Oceanography.
Tougaard, J., J. Carstensen, J. Teilmann, H. Skov, & P. Rasmussen. (2009). Pile driving zone of responsiveness extends beyond 20 km for harbor porpoises (Phocoena phocoena (L.)). Journal of the Acoustical Society of America, 126(1), 11.
Tremel, D. P., J. A. Thomas, K. T. Ramierez, G. S. Dye, W. A. Bachman, A. N. Orban, & K. K. Grimm. (1998). Underwater hearing sensitivity of a Pacific white-sided dolphin, Lagenorhynchus obliquidens. Aquatic Mammals, 24(2), 63–69.
Tubelli, A. A., A. Zosuls, D. R. Ketten, M. Yamato, & D. C. Mountain. (2012). A prediction of the minke whale (Balaenoptera acutorostrata) middle-ear transfer function. The Journal of Acoustical Society of America, 132(5), 3263–3272.
Tyack, P. L. (1999). Responses of baleen whales to controlled exposures of low‐frequency sounds from a naval sonar. Journal of the Acoustical Society of America, 106(4), 2280.
Tyack, P. L., & C. W. Clark. (2000). Communication and acoustic behavior of dolphins and whales. In W. W. L. Au, A. N. Popper & R. R. Fay (Eds.), Hearing by Whales and Dolphins (pp. 156–224). New York, NY: Springer.
Tyack, P. L., W. M. X. Zimmer, D. Moretti, B. L. Southall, D. E. Claridge, J. W. Durban, C. W. Clark, A. D'Amico, N. DiMarzio, S. Jarvis, E. McCarthy, R. Morrissey, J. Ward, & I. L. Boyd. (2011). Beaked whales respond to simulated and actual Navy sonar. PLoS ONE, 6(3), 15.
U.S. Department of the Navy. (2001). Final Environmental Impact Statement (EIS)/Overseas Environmental Impact Statement (OEIS) for the Shock Trial of the USS WINSTON S. CHURCHILL (DDG 81). Washington, DC: U.S. Department of the Navy.
U.S. Department of the Navy. (2003). Report on the Results of the Inquiry into Allegations of Marine Mammal Impacts Surrounding the Use of Active Sonar by USS SHOUP (DDG 86) in the Haro Strait on or about 5 May 2003.
U.S. Department of the Navy. (2008). Final Environmental Impact Statement (EIS)/Overseas Environmental Impact Statement (OEIS) for the Shock Trial of the MESA VERDE (LPD 19). Washington, DC: U.S. Department of the Navy.
Urick, R. J. (1983). Principles of Underwater Sound, Principles of Underwater Sound for Engineers (3rd ed.). Los Altos Hills, CA: Peninsula Publishing.
Ward, D. W. (1960). Recovery from high values of temporary threshold shift. Journal of the Acoustical Society of America, 32(4), 497–500.
Ward, W. D., A. Glorig, & D. L. Sklar. (1958). Dependence of temporary threshold shift at 4 kc on intensity and time. The Journal of Acoustical Society of America, 30(10), 944–954.

Criteria and Thresholds for U.S. Navy Acoustic and Explosive Effects Analysis (Phase III) June 2017
121
Ward, W. D., A. Glorig, & D. L. Sklar. (1959). Temporary threshold shift from octave-band noise: Applications to damage-risk criteria. The Journal of Acoustical Society of America, 31(4), 522–528.
Ward, W. D. (1997). Effects of high-intensity sound. In M. J. Crocker (Ed.), Encyclopedia of Acoustics (pp. 1497–1507). New York, NY: Wiley.
Wartzok, D., & D. R. Ketten. (1999). Marine Mammal Sensory Systems. In J. E. Reynolds, III & S. A. Rommel (Eds.), Biology of Marine Mammals (pp. 117–175). Washington, DC: Smithsonian Institution Press.
Wartzok, D., A. N. Popper, J. Gordon, & J. Merrill. (2003). Factors affecting the responses of marine mammals to acoustic disturbance. Marine Technology Society Journal, 37(4), 6–15.
Weir, C. R. (2008). Overt responses of humpback whales (Megaptera novaeangliae), sperm whales (Physeter macrocephalus), and Atlantic spotted dolphins (Stenella frontalis) to seismic exploration off Angola. Aquatic Mammals, 34(1), 71–83.
Wensveen, P. J., L. A. Huijser, L. Hoek, & R. A. Kastelein. (2014). Equal latency contours and auditory weighting functions for the harbour porpoise (Phocoena phocoena). The Journal of Experimental Biology, 217(Pt 3), 359–369.
Westgate, A. J., & A. J. Read. (2006). Reproduction in short-beaked common dolphins (Delphinus delphis) from the western North Atlantic. Marine Biology, 150(5), 1011–1024.
White, M. J., Jr., J. Norris, D. Ljungblad, K. Baron, & G. di Sciara. (1977). Auditory thresholds of two beluga whales, Delphinapterus leucas. San Diego, CA.
Williams, R., E. Ashe, D. Sandilands, & D. Lusseau. (2011). Stimulus-dependent response to disturbance affecting the activity of killer whales. The Scientific Committee of the International Whaling Commission, Document SC/63/WW5, 1-27.
Williams, R., C. Erbe, E. Ashe, A. Beerman, & J. Smith. (2014). Severity of killer whale behavioral responses to ship noise: a dose-response study. Marine Pollution Bulletin, 79(1-2), 254–260.
Wood, F., & J. Wood. (1993). Release and recapture of captive-reared green sea turtles, Chelonia mydas, in the waters surrounding the Cayman Islands. Herpetological Journal, 3, 84–89.
Yelverton, J. T., D. R. Richmond, E. R. Fletcher, & R. K. Jones. (1973). Safe distances from underwater explosions for mammals and birds. Albuquerque, NM: Lovelace Foundation for Medical Education and Research.
Yelverton, J. T., & D. R. Richmond. (1981, 30 November—4 December 1981). Underwater explosion damage risk criteria for fish, birds, and mammals. Paper presented at the 102nd Meeting of the Acoustical Society of America Miami Beach, FL.

Criteria and Thresholds for U.S. Navy Acoustic and Explosive Effects Analysis (Phase III) June 2017
122
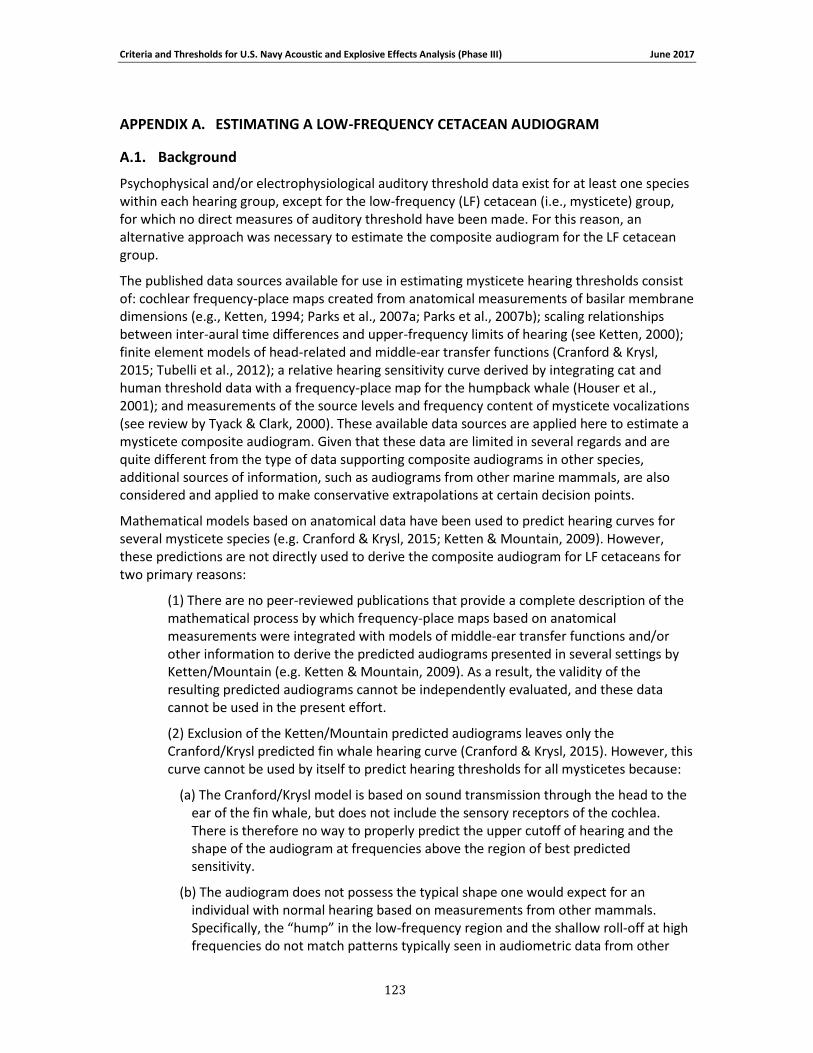
Criteria and Thresholds for U.S. Navy Acoustic and Explosive Effects Analysis (Phase III) June 2017
123
APPENDIX A. ESTIMATING A LOW-FREQUENCY CETACEAN AUDIOGRAM
A.1. Background
Psychophysical and/or electrophysiological auditory threshold data exist for at least one species within each hearing group, except for the low-frequency (LF) cetacean (i.e., mysticete) group, for which no direct measures of auditory threshold have been made. For this reason, an alternative approach was necessary to estimate the composite audiogram for the LF cetacean group.
The published data sources available for use in estimating mysticete hearing thresholds consist of: cochlear frequency-place maps created from anatomical measurements of basilar membrane dimensions (e.g., Ketten, 1994; Parks et al., 2007a; Parks et al., 2007b); scaling relationships between inter-aural time differences and upper-frequency limits of hearing (see Ketten, 2000); finite element models of head-related and middle-ear transfer functions (Cranford & Krysl, 2015; Tubelli et al., 2012); a relative hearing sensitivity curve derived by integrating cat and human threshold data with a frequency-place map for the humpback whale (Houser et al., 2001); and measurements of the source levels and frequency content of mysticete vocalizations (see review by Tyack & Clark, 2000). These available data sources are applied here to estimate a mysticete composite audiogram. Given that these data are limited in several regards and are quite different from the type of data supporting composite audiograms in other species, additional sources of information, such as audiograms from other marine mammals, are also considered and applied to make conservative extrapolations at certain decision points.
Mathematical models based on anatomical data have been used to predict hearing curves for several mysticete species (e.g. Cranford & Krysl, 2015; Ketten & Mountain, 2009). However, these predictions are not directly used to derive the composite audiogram for LF cetaceans for two primary reasons:
(1) There are no peer-reviewed publications that provide a complete description of the mathematical process by which frequency-place maps based on anatomical measurements were integrated with models of middle-ear transfer functions and/or other information to derive the predicted audiograms presented in several settings by Ketten/Mountain (e.g. Ketten & Mountain, 2009). As a result, the validity of the resulting predicted audiograms cannot be independently evaluated, and these data cannot be used in the present effort.
(2) Exclusion of the Ketten/Mountain predicted audiograms leaves only the Cranford/Krysl predicted fin whale hearing curve (Cranford & Krysl, 2015). However, this curve cannot be used by itself to predict hearing thresholds for all mysticetes because:
(a) The Cranford/Krysl model is based on sound transmission through the head to the ear of the fin whale, but does not include the sensory receptors of the cochlea. There is therefore no way to properly predict the upper cutoff of hearing and the shape of the audiogram at frequencies above the region of best predicted sensitivity.
(b) The audiogram does not possess the typical shape one would expect for an individual with normal hearing based on measurements from other mammals. Specifically, the “hump” in the low-frequency region and the shallow roll-off at high frequencies do not match patterns typically seen in audiometric data from other
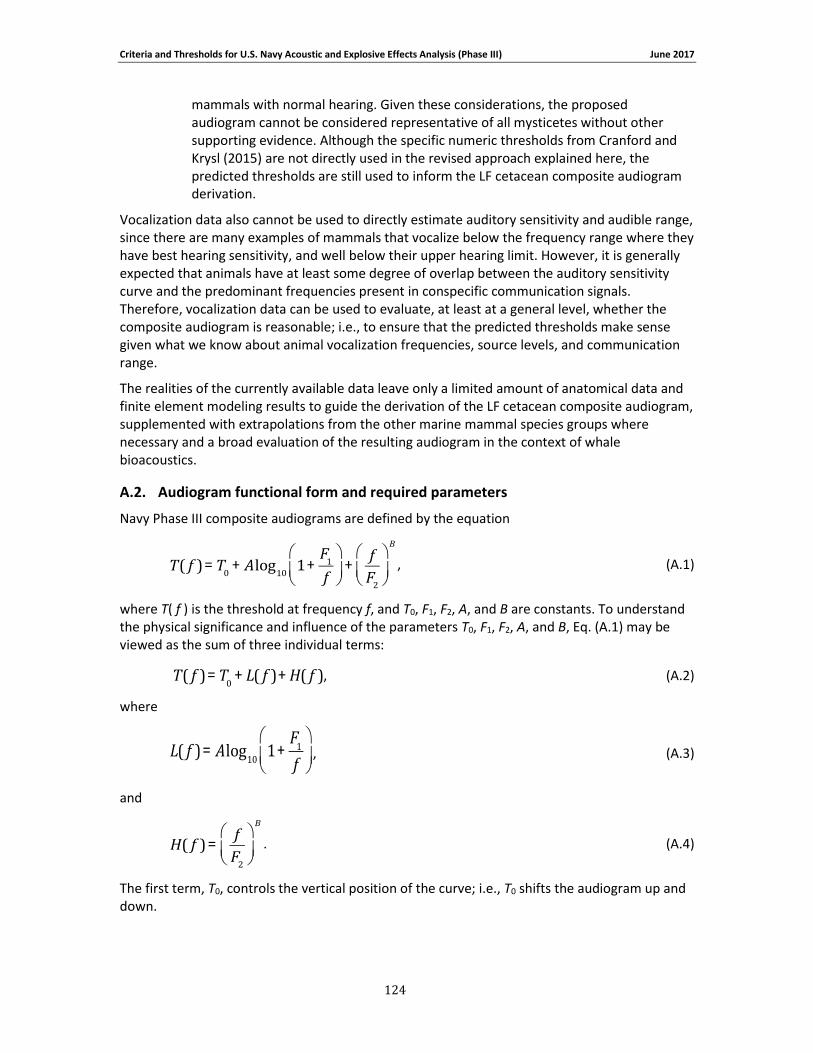
Criteria and Thresholds for U.S. Navy Acoustic and Explosive Effects Analysis (Phase III) June 2017
124
mammals with normal hearing. Given these considerations, the proposed audiogram cannot be considered representative of all mysticetes without other supporting evidence. Although the specific numeric thresholds from Cranford and Krysl (2015) are not directly used in the revised approach explained here, the predicted thresholds are still used to inform the LF cetacean composite audiogram derivation.
Vocalization data also cannot be used to directly estimate auditory sensitivity and audible range, since there are many examples of mammals that vocalize below the frequency range where they have best hearing sensitivity, and well below their upper hearing limit. However, it is generally expected that animals have at least some degree of overlap between the auditory sensitivity curve and the predominant frequencies present in conspecific communication signals. Therefore, vocalization data can be used to evaluate, at least at a general level, whether the composite audiogram is reasonable; i.e., to ensure that the predicted thresholds make sense given what we know about animal vocalization frequencies, source levels, and communication range.
The realities of the currently available data leave only a limited amount of anatomical data and finite element modeling results to guide the derivation of the LF cetacean composite audiogram, supplemented with extrapolations from the other marine mammal species groups where necessary and a broad evaluation of the resulting audiogram in the context of whale bioacoustics.
A.2. Audiogram functional form and required parameters
Navy Phase III composite audiograms are defined by the equation
T( f )=T0+ Alog
101+
F1
f
æ
èç
ö
ø÷ +
f
F2
æ
èç
ö
ø÷
B
, (A.1)
where T( f ) is the threshold at frequency f, and T0, F1, F2, A, and B are constants. To understand the physical significance and influence of the parameters T0, F1, F2, A, and B, Eq. (A.1) may be viewed as the sum of three individual terms:
T( f )=T
0+ L( f )+ H( f ), (A.2)
where
L( f )= Alog10
1+F
1
f
æ
èç
ö
ø÷ , (A.3)
and
H( f )=f
F2
æ
èç
ö
ø÷
B
. (A.4)
The first term, T0, controls the vertical position of the curve; i.e., T0 shifts the audiogram up and down.
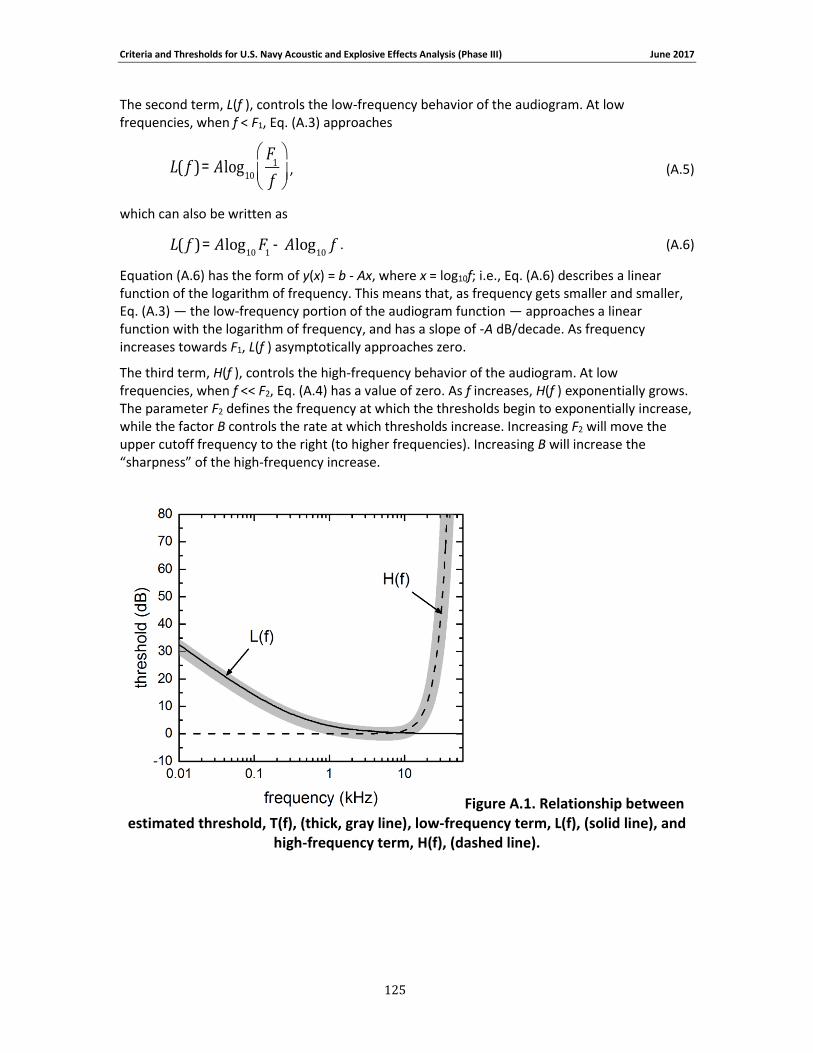
Criteria and Thresholds for U.S. Navy Acoustic and Explosive Effects Analysis (Phase III) June 2017
125
The second term, L(f ), controls the low-frequency behavior of the audiogram. At low frequencies, when f < F1, Eq. (A.3) approaches
L( f )= Alog10
F1
f
æ
èç
ö
ø÷ , (A.5)
which can also be written as
L( f )= Alog
10F
1- Alog
10f . (A.6)
Equation (A.6) has the form of y(x) = b - Ax, where x = log10f; i.e., Eq. (A.6) describes a linear function of the logarithm of frequency. This means that, as frequency gets smaller and smaller, Eq. (A.3) — the low-frequency portion of the audiogram function — approaches a linear function with the logarithm of frequency, and has a slope of ‑A dB/decade. As frequency increases towards F1, L(f ) asymptotically approaches zero.
The third term, H(f ), controls the high-frequency behavior of the audiogram. At low frequencies, when f << F2, Eq. (A.4) has a value of zero. As f increases, H(f ) exponentially grows. The parameter F2 defines the frequency at which the thresholds begin to exponentially increase, while the factor B controls the rate at which thresholds increase. Increasing F2 will move the upper cutoff frequency to the right (to higher frequencies). Increasing B will increase the “sharpness” of the high-frequency increase.
Figure A.1. Relationship between estimated threshold, T(f), (thick, gray line), low-frequency term, L(f), (solid line), and
high-frequency term, H(f), (dashed line).
Criteria and Thresholds for U.S. Navy Acoustic and Explosive Effects Analysis (Phase III) June 2017
126
A.3. Estimating audiogram parameters
To derive a composite mysticete audiogram using Eq. (A.1), the values of T0, F1, F2, A, and B must be defined. The value for T0 is determined by either adjusting T0 to place the lowest threshold value to zero (to obtain a normalized audiogram), or to place the lowest expected threshold at a specific SPL (in dB re 1 μPa). For Navy Phase III analyses, the lowest LF cetacean threshold is defined to match the median threshold of the in-water marine mammal species groups (MF cetaceans, HF cetaceans, sirenians, otariids and other marine carnivores in water, and phocids in water; median = 54 dB re 1 μPa). The choices for the other parameters are informed by the published information regarding mysticete hearing.
The constant A is defined by assuming a value for the low-frequency slope of the audiogram, in dB/decade. Most mammals for which thresholds have been measured have low-frequency slopes ~30 to 40 dB/decade. However, finite element models of middle ear function in fin whales (Cranford & Krysl, 2015) and minke whales (Tubelli et al., 2012) suggest lower slopes, of ~25 or 20 dB/decade, respectively. We therefore conservatively assume that A = 20 dB/decade.
To define F1, we first define the variable T′ as the maximum threshold tolerance within the frequency region of best sensitivity (i.e., within the frequency range of best sensitivity, thresholds are within T′ dB of the lowest threshold). Further, let f ′ be the lower frequency bound of the region of best sensitivity. When f = f ′, L(f ) = T′, and Eq. (A.3) can then be solved for F1 as a function of f ′, T′, and A:
F
1= ¢f 10 ¢T /A -1( ) . (A.7)
Anatomically-based models of mysticete hearing have resulted in various estimates for audible frequency ranges and frequencies of best sensitivity. Houser et al. (2001) estimated best sensitivity in humpback whales to occur in the range of 2 to 6 kHz, with thresholds within 3 dB of best sensitivity from ~1.4 to 7.8 kHz. For right whales, (Parks et al., 2007b) estimated the audible frequency range to be 10 Hz to 22 kHz. For minke whales, Tubelli et al. (2012) estimated the most sensitive hearing range, defined as the region with thresholds within 40 dB of best sensitivity, to extend from 30 to 100 Hz up to 7.5 to 25 kHz, depending on the specific model used. Cranford and Krysl (2015) predicted best sensitivity in fin whales to occur at 1.2 kHz, with thresholds within 3-dB of best sensitivity from ~1 to 1.5 kHz. Together, these model results broadly suggest best sensitivity (thresholds within ~3 dB of the lowest threshold) from ~1 to 8 kHz, and thresholds within ~40 dB of best sensitivity as low as ~30 Hz and up to ~25 kHz.
Based on this information, we assume LF cetacean thresholds are within 3 dB of the lowest threshold over a frequency range of 1 to 8 kHz, therefore T′ = 3 dB and f ′= 1 kHz, resulting in F1 = 0.41 kHz [Eq. (A.7)]. In other words, we define F1 so that thresholds are ≤ 3 dB relative to the lowest threshold when the frequency is within the region of best sensitivity (1 to 8 kHz).
To define the high-frequency portion of the audiogram, the values of B and F2 must be estimated. To estimate B for LF cetaceans, we take the median of the B values from the composite audiograms for the other in-water marine mammal species groups (MF cetaceans, HF cetaceans, sirenians, otariids and other marine carnivores in water, and phocids in water). This results in B = 3.2 for the LF cetaceans. Once B is defined, F2 is adjusted to achieve a threshold value at 30 kHz of 40 dB relative to the lowest threshold. This results in F2 = 9.4 kHz. Finally, T0 is adjusted to set the lowest threshold value to 0 dB for the normalized curve, or 54 dB re 1 μPa for the non-normalized curve; this results in T0 = -0.81 and 53.19 for the normalized and non-normalized curves, respectively.

Criteria and Thresholds for U.S. Navy Acoustic and Explosive Effects Analysis (Phase III) June 2017
127
The resulting composite audiogram is shown in Figure A.2. For comparison, predicted audiograms for the fin whale (Cranford & Krysl, 2015), and humpback whale (Houser et al., 2001) are included. The LF cetacean composite audiogram has lowest threshold at 5.6 kHz, but the audiogram is fairly shallow in the region of best sensitivity, and thresholds are within 1 dB of the lowest threshold from ~1.8 to 11 kHz, and within 3 dB of the lowest threshold from ~0.75 to 14 kHz. Low-frequency (< ~500 Hz) thresholds are considerably lower than those predicted by Cranford and Krysl (2015). High-frequency thresholds are also substantially lower than those predicted for the fin whale, with thresholds at 30 kHz only 40 dB above best hearing thresholds, and those at 40 kHz approximately 90 dB above best threshold. The resulting LF composite audiogram appears reasonable in a general sense relative the predominant frequencies present in mysticete conspecific vocal communication signals. While some species (e.g., blue whales) produce some extremely low (e.g., 10 Hz) frequency call components, the majority of mysticete social calls occur in the few tens of Hz to few kHz range, overlapping reasonably well with the predicted auditory sensitivity shown in the composite audiogram (within ~0 to 30 dB of predicted best sensitivity). A general pattern of some social calls containing energy shifted below the region of best hearing sensitivity is well-documented in other low-frequency species including many phocid seals (Wartzok & Ketten, 1999) and some terrestrial mammals, notably the Indian elephant (Heffner & Heffner, 1982).
Figure A.2. Comparison of proposed LF cetacean thresholds to those predicted by anatomical and finite-element models.
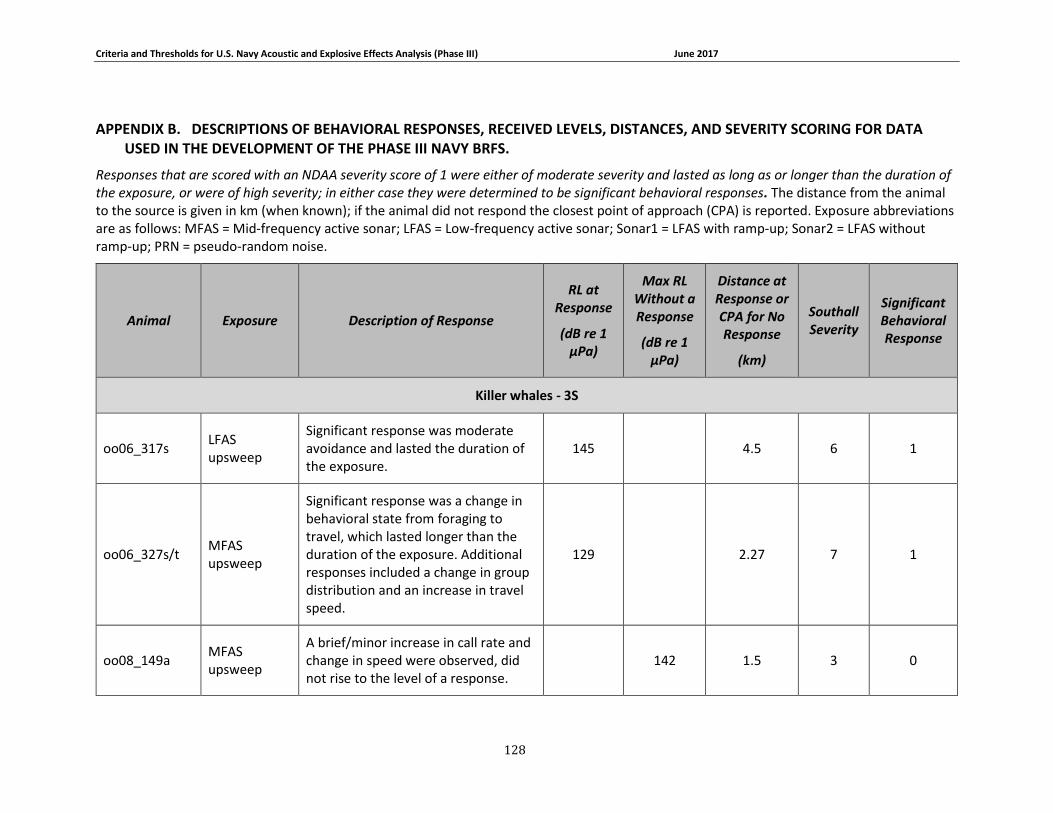
Criteria and Thresholds for U.S. Navy Acoustic and Explosive Effects Analysis (Phase III) June 2017
128
APPENDIX B. DESCRIPTIONS OF BEHAVIORAL RESPONSES, RECEIVED LEVELS, DISTANCES, AND SEVERITY SCORING FOR DATA USED IN THE DEVELOPMENT OF THE PHASE III NAVY BRFS.
Responses that are scored with an NDAA severity score of 1 were either of moderate severity and lasted as long as or longer than the duration of the exposure, or were of high severity; in either case they were determined to be significant behavioral responses. The distance from the animal to the source is given in km (when known); if the animal did not respond the closest point of approach (CPA) is reported. Exposure abbreviations are as follows: MFAS = Mid-frequency active sonar; LFAS = Low-frequency active sonar; Sonar1 = LFAS with ramp-up; Sonar2 = LFAS without ramp-up; PRN = pseudo-random noise.
Animal Exposure Description of Response
RL at Response
(dB re 1 µPa)
Max RL Without a Response
(dB re 1 µPa)
Distance at Response or CPA for No Response
(km)
Southall Severity
Significant Behavioral Response
Killer whales - 3S
oo06_317s LFAS upsweep
Significant response was moderate avoidance and lasted the duration of the exposure.
145 4.5 6 1
oo06_327s/t MFAS upsweep
Significant response was a change in behavioral state from foraging to travel, which lasted longer than the duration of the exposure. Additional responses included a change in group distribution and an increase in travel speed.
129 2.27 7 1
oo08_149a MFAS upsweep
A brief/minor increase in call rate and change in speed were observed, did not rise to the level of a response.
142 1.5 3 0
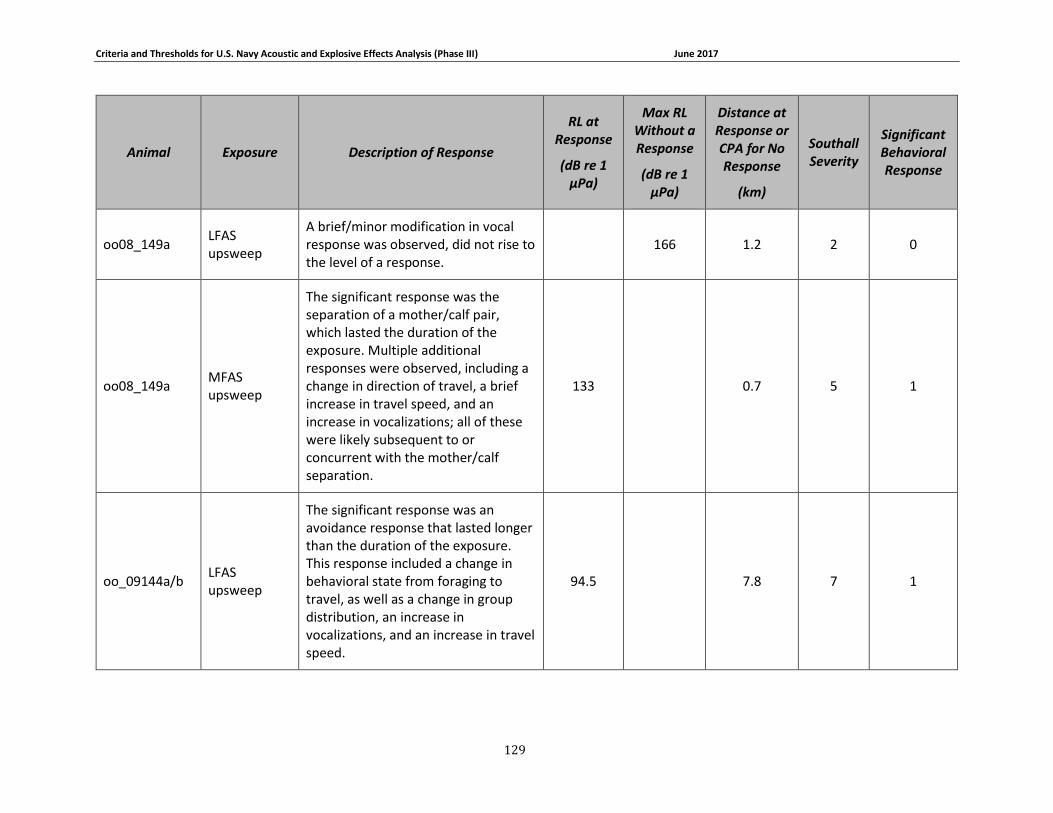
Criteria and Thresholds for U.S. Navy Acoustic and Explosive Effects Analysis (Phase III) June 2017
129
Animal Exposure Description of Response
RL at Response
(dB re 1 µPa)
Max RL Without a Response
(dB re 1 µPa)
Distance at Response or CPA for No Response
(km)
Southall Severity
Significant Behavioral Response
oo08_149a LFAS upsweep
A brief/minor modification in vocal response was observed, did not rise to the level of a response.
166 1.2 2 0
oo08_149a MFAS upsweep
The significant response was the separation of a mother/calf pair, which lasted the duration of the exposure. Multiple additional responses were observed, including a change in direction of travel, a brief increase in travel speed, and an increase in vocalizations; all of these were likely subsequent to or concurrent with the mother/calf separation.
133 0.7 5 1
oo_09144a/b LFAS upsweep
The significant response was an avoidance response that lasted longer than the duration of the exposure. This response included a change in behavioral state from foraging to travel, as well as a change in group distribution, an increase in vocalizations, and an increase in travel speed.
94.5 7.8 7 1
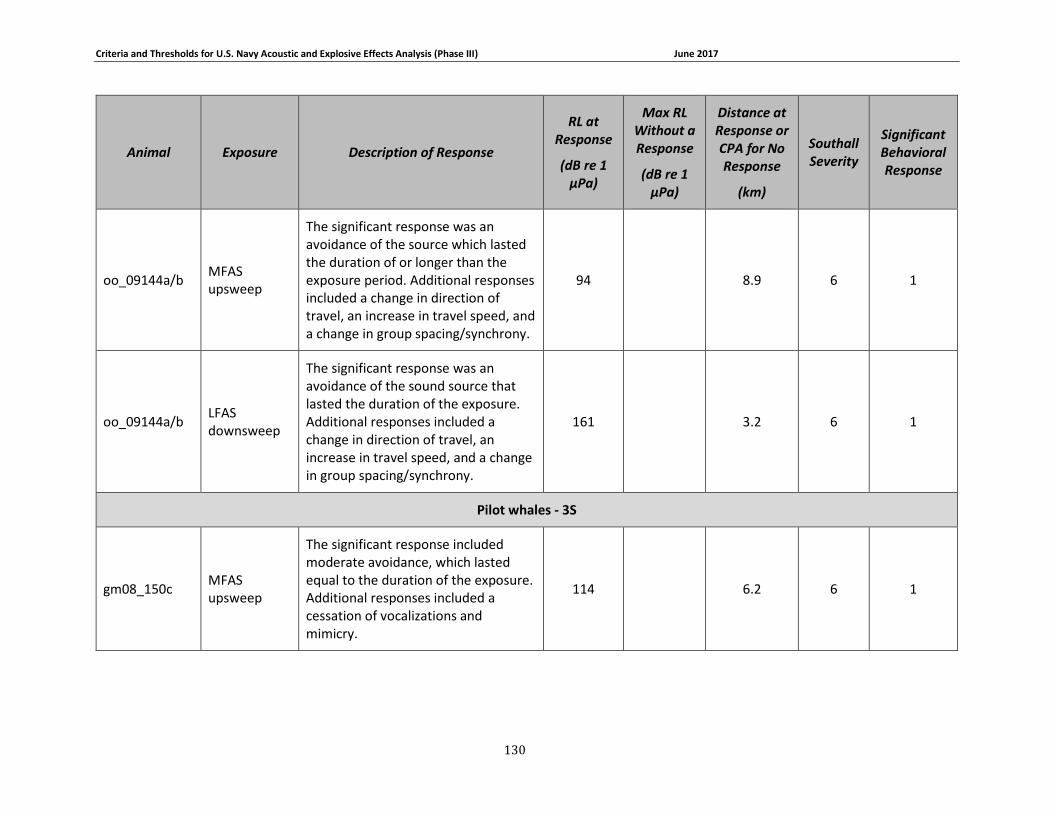
Criteria and Thresholds for U.S. Navy Acoustic and Explosive Effects Analysis (Phase III) June 2017
130
Animal Exposure Description of Response
RL at Response
(dB re 1 µPa)
Max RL Without a Response
(dB re 1 µPa)
Distance at Response or CPA for No Response
(km)
Southall Severity
Significant Behavioral Response
oo_09144a/b MFAS upsweep
The significant response was an avoidance of the source which lasted the duration of or longer than the exposure period. Additional responses included a change in direction of travel, an increase in travel speed, and a change in group spacing/synchrony.
94 8.9 6 1
oo_09144a/b LFAS downsweep
The significant response was an avoidance of the sound source that lasted the duration of the exposure. Additional responses included a change in direction of travel, an increase in travel speed, and a change in group spacing/synchrony.
161 3.2 6 1
Pilot whales - 3S
gm08_150c MFAS upsweep
The significant response included moderate avoidance, which lasted equal to the duration of the exposure. Additional responses included a cessation of vocalizations and mimicry.
114 6.2 6 1
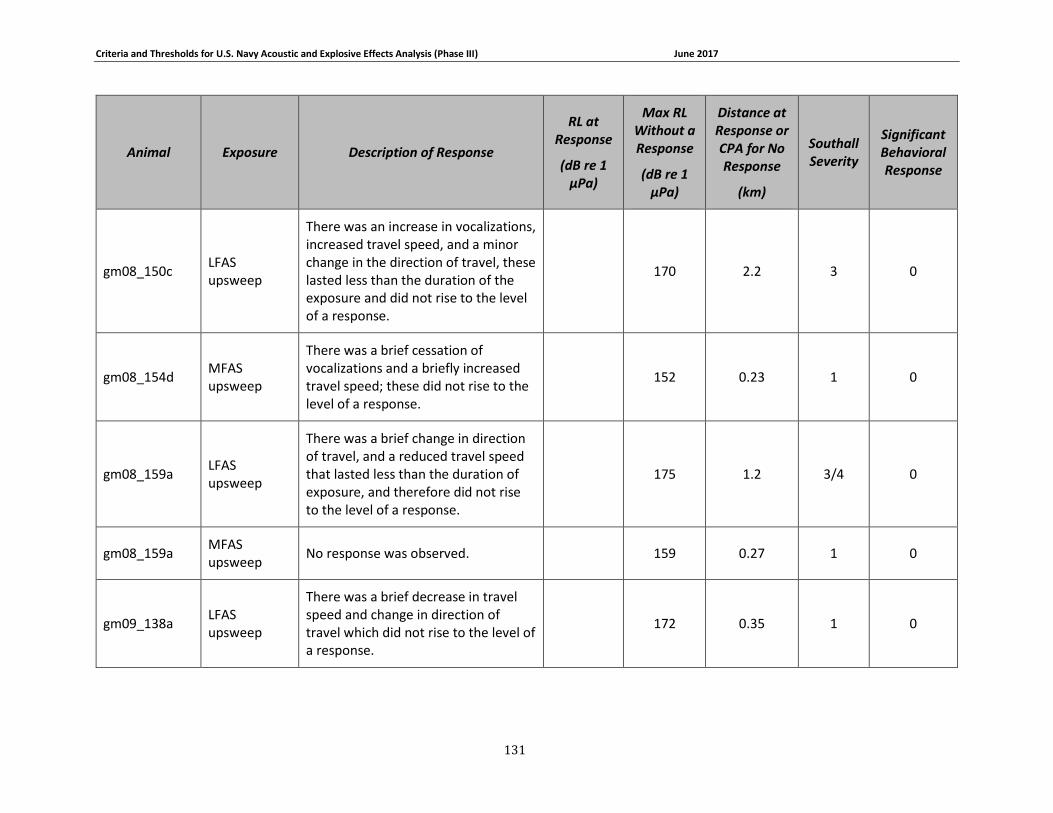
Criteria and Thresholds for U.S. Navy Acoustic and Explosive Effects Analysis (Phase III) June 2017
131
Animal Exposure Description of Response
RL at Response
(dB re 1 µPa)
Max RL Without a Response
(dB re 1 µPa)
Distance at Response or CPA for No Response
(km)
Southall Severity
Significant Behavioral Response
gm08_150c LFAS upsweep
There was an increase in vocalizations, increased travel speed, and a minor change in the direction of travel, these lasted less than the duration of the exposure and did not rise to the level of a response.
170 2.2 3 0
gm08_154d MFAS upsweep
There was a brief cessation of vocalizations and a briefly increased travel speed; these did not rise to the level of a response.
152 0.23 1 0
gm08_159a LFAS upsweep
There was a brief change in direction of travel, and a reduced travel speed that lasted less than the duration of exposure, and therefore did not rise to the level of a response.
175 1.2 3/4 0
gm08_159a MFAS upsweep
No response was observed. 159 0.27 1 0
gm09_138a LFAS upsweep
There was a brief decrease in travel speed and change in direction of travel which did not rise to the level of a response.
172 0.35 1 0
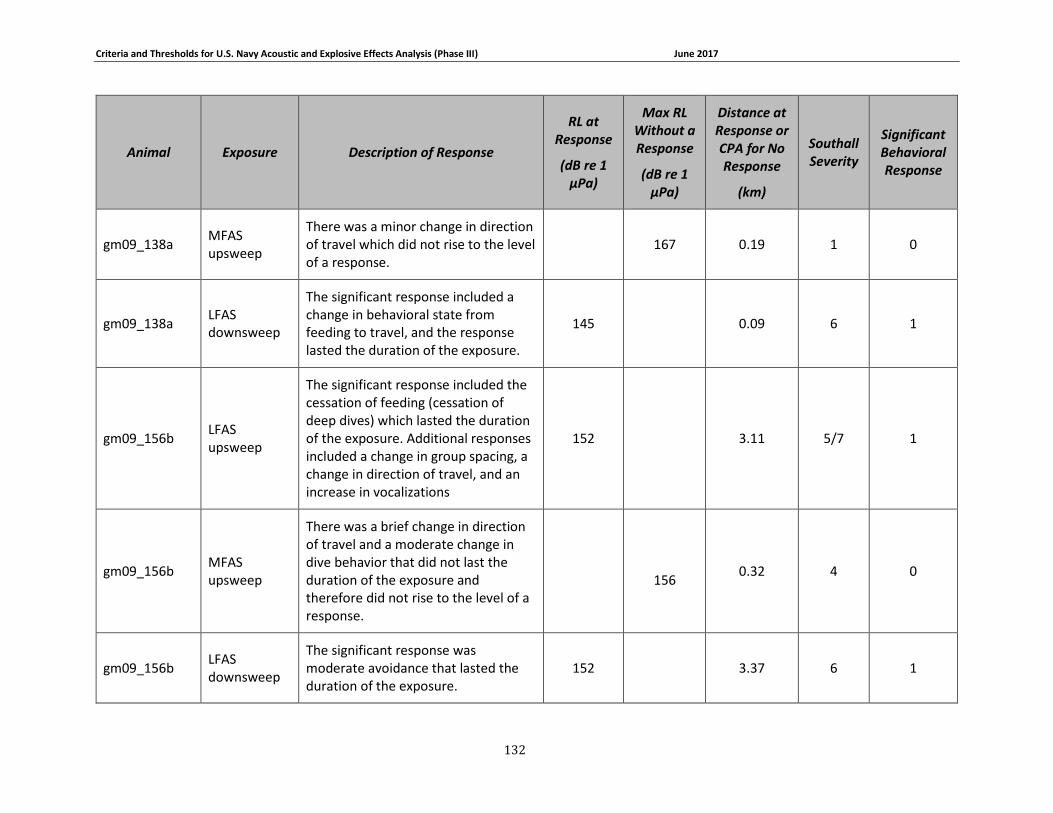
Criteria and Thresholds for U.S. Navy Acoustic and Explosive Effects Analysis (Phase III) June 2017
132
Animal Exposure Description of Response
RL at Response
(dB re 1 µPa)
Max RL Without a Response
(dB re 1 µPa)
Distance at Response or CPA for No Response
(km)
Southall Severity
Significant Behavioral Response
gm09_138a MFAS upsweep
There was a minor change in direction of travel which did not rise to the level of a response.
167 0.19 1 0
gm09_138a LFAS downsweep
The significant response included a change in behavioral state from feeding to travel, and the response lasted the duration of the exposure.
145 0.09 6 1
gm09_156b LFAS upsweep
The significant response included the cessation of feeding (cessation of deep dives) which lasted the duration of the exposure. Additional responses included a change in group spacing, a change in direction of travel, and an increase in vocalizations
152 3.11 5/7 1
gm09_156b MFAS upsweep
There was a brief change in direction of travel and a moderate change in dive behavior that did not last the duration of the exposure and therefore did not rise to the level of a response.
156 0.32 4 0
gm09_156b LFAS downsweep
The significant response was moderate avoidance that lasted the duration of the exposure.
152 3.37 6 1
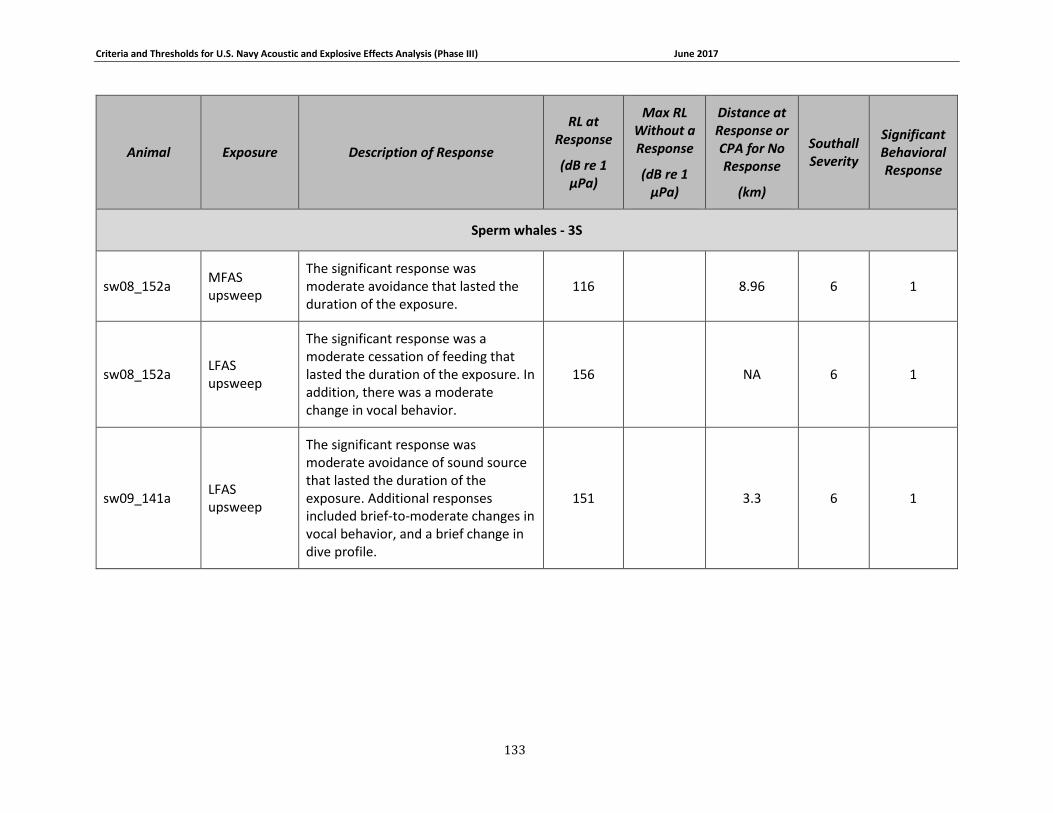
Criteria and Thresholds for U.S. Navy Acoustic and Explosive Effects Analysis (Phase III) June 2017
133
Animal Exposure Description of Response
RL at Response
(dB re 1 µPa)
Max RL Without a Response
(dB re 1 µPa)
Distance at Response or CPA for No Response
(km)
Southall Severity
Significant Behavioral Response
Sperm whales - 3S
sw08_152a MFAS upsweep
The significant response was moderate avoidance that lasted the duration of the exposure.
116 8.96 6 1
sw08_152a LFAS upsweep
The significant response was a moderate cessation of feeding that lasted the duration of the exposure. In addition, there was a moderate change in vocal behavior.
156 NA 6 1
sw09_141a LFAS upsweep
The significant response was moderate avoidance of sound source that lasted the duration of the exposure. Additional responses included brief-to-moderate changes in vocal behavior, and a brief change in dive profile.
151 3.3 6 1
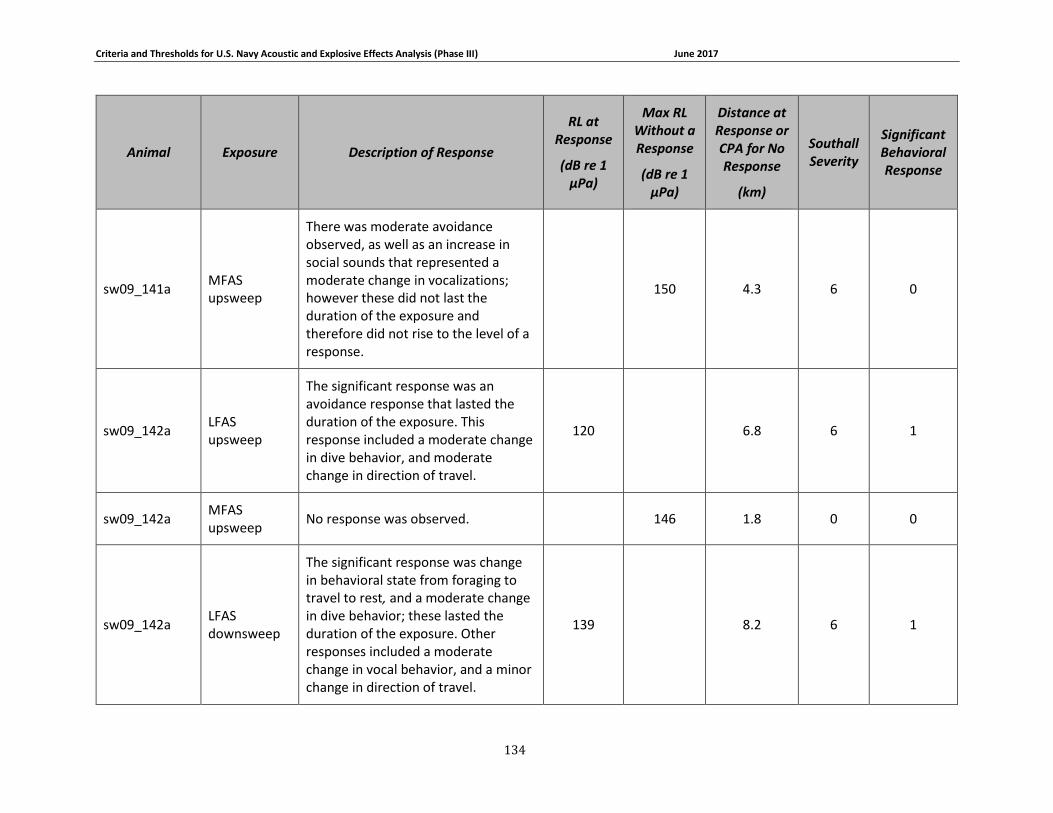
Criteria and Thresholds for U.S. Navy Acoustic and Explosive Effects Analysis (Phase III) June 2017
134
Animal Exposure Description of Response
RL at Response
(dB re 1 µPa)
Max RL Without a Response
(dB re 1 µPa)
Distance at Response or CPA for No Response
(km)
Southall Severity
Significant Behavioral Response
sw09_141a MFAS upsweep
There was moderate avoidance observed, as well as an increase in social sounds that represented a moderate change in vocalizations; however these did not last the duration of the exposure and therefore did not rise to the level of a response.
150 4.3 6 0
sw09_142a LFAS upsweep
The significant response was an avoidance response that lasted the duration of the exposure. This response included a moderate change in dive behavior, and moderate change in direction of travel.
120 6.8 6 1
sw09_142a MFAS upsweep
No response was observed. 146 1.8 0 0
sw09_142a LFAS downsweep
The significant response was change in behavioral state from foraging to travel to rest, and a moderate change in dive behavior; these lasted the duration of the exposure. Other responses included a moderate change in vocal behavior, and a minor change in direction of travel.
139 8.2 6 1
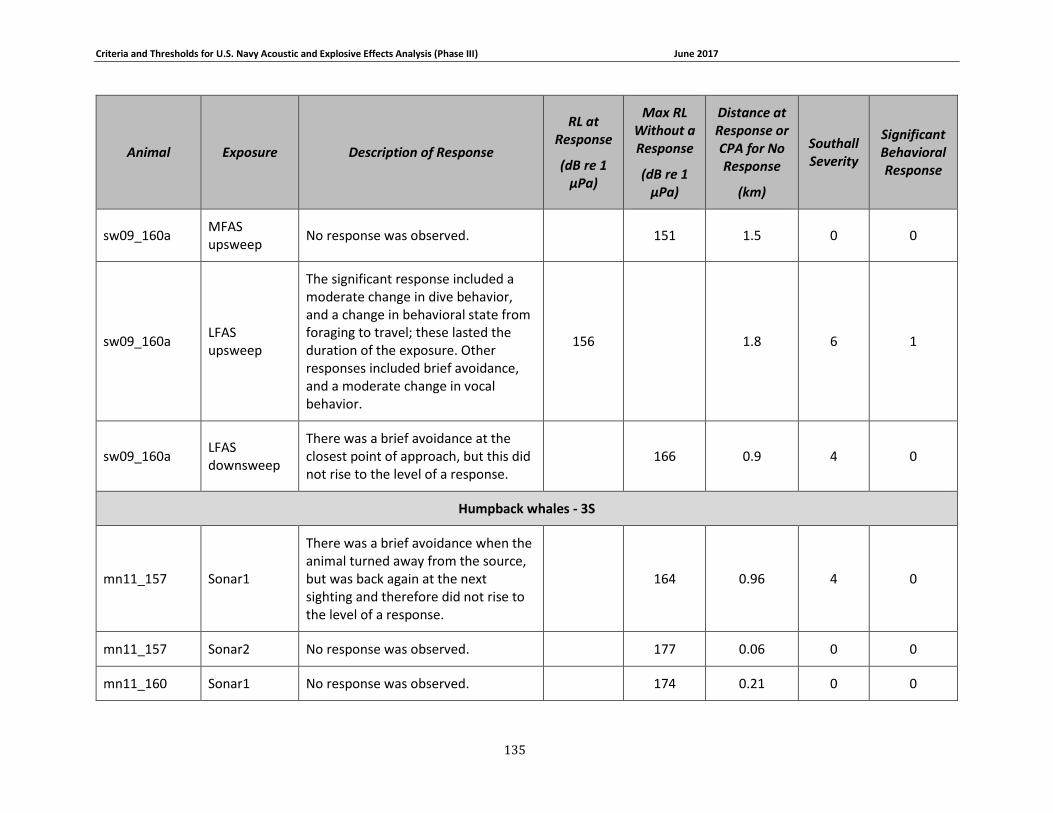
Criteria and Thresholds for U.S. Navy Acoustic and Explosive Effects Analysis (Phase III) June 2017
135
Animal Exposure Description of Response
RL at Response
(dB re 1 µPa)
Max RL Without a Response
(dB re 1 µPa)
Distance at Response or CPA for No Response
(km)
Southall Severity
Significant Behavioral Response
sw09_160a MFAS upsweep
No response was observed. 151 1.5 0 0
sw09_160a LFAS upsweep
The significant response included a moderate change in dive behavior, and a change in behavioral state from foraging to travel; these lasted the duration of the exposure. Other responses included brief avoidance, and a moderate change in vocal behavior.
156 1.8 6 1
sw09_160a LFAS downsweep
There was a brief avoidance at the closest point of approach, but this did not rise to the level of a response.
166 0.9 4 0
Humpback whales - 3S
mn11_157 Sonar1
There was a brief avoidance when the animal turned away from the source, but was back again at the next sighting and therefore did not rise to the level of a response.
164 0.96 4 0
mn11_157 Sonar2 No response was observed. 177 0.06 0 0
mn11_160 Sonar1 No response was observed. 174 0.21 0 0
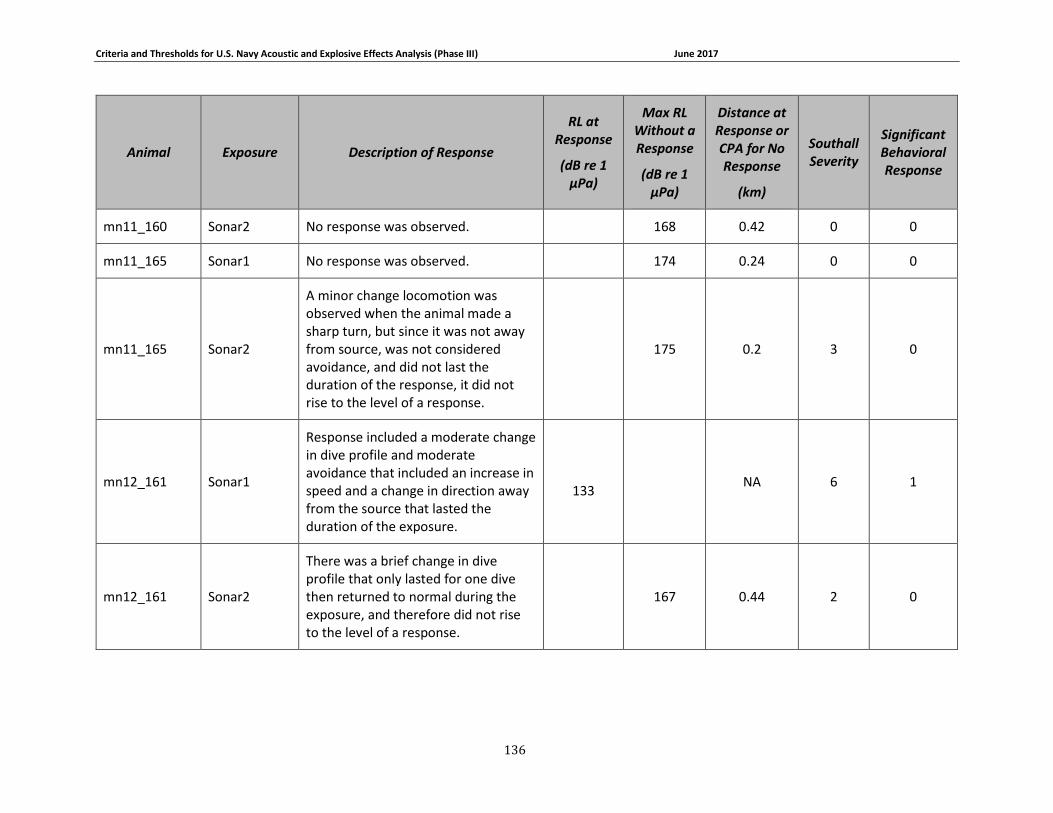
Criteria and Thresholds for U.S. Navy Acoustic and Explosive Effects Analysis (Phase III) June 2017
136
Animal Exposure Description of Response
RL at Response
(dB re 1 µPa)
Max RL Without a Response
(dB re 1 µPa)
Distance at Response or CPA for No Response
(km)
Southall Severity
Significant Behavioral Response
mn11_160 Sonar2 No response was observed. 168 0.42 0 0
mn11_165 Sonar1 No response was observed. 174 0.24 0 0
mn11_165 Sonar2
A minor change locomotion was observed when the animal made a sharp turn, but since it was not away from source, was not considered avoidance, and did not last the duration of the response, it did not rise to the level of a response.
175 0.2 3 0
mn12_161 Sonar1
Response included a moderate change in dive profile and moderate avoidance that included an increase in speed and a change in direction away from the source that lasted the duration of the exposure.
133
NA 6 1
mn12_161 Sonar2
There was a brief change in dive profile that only lasted for one dive then returned to normal during the exposure, and therefore did not rise to the level of a response.
167 0.44 2 0
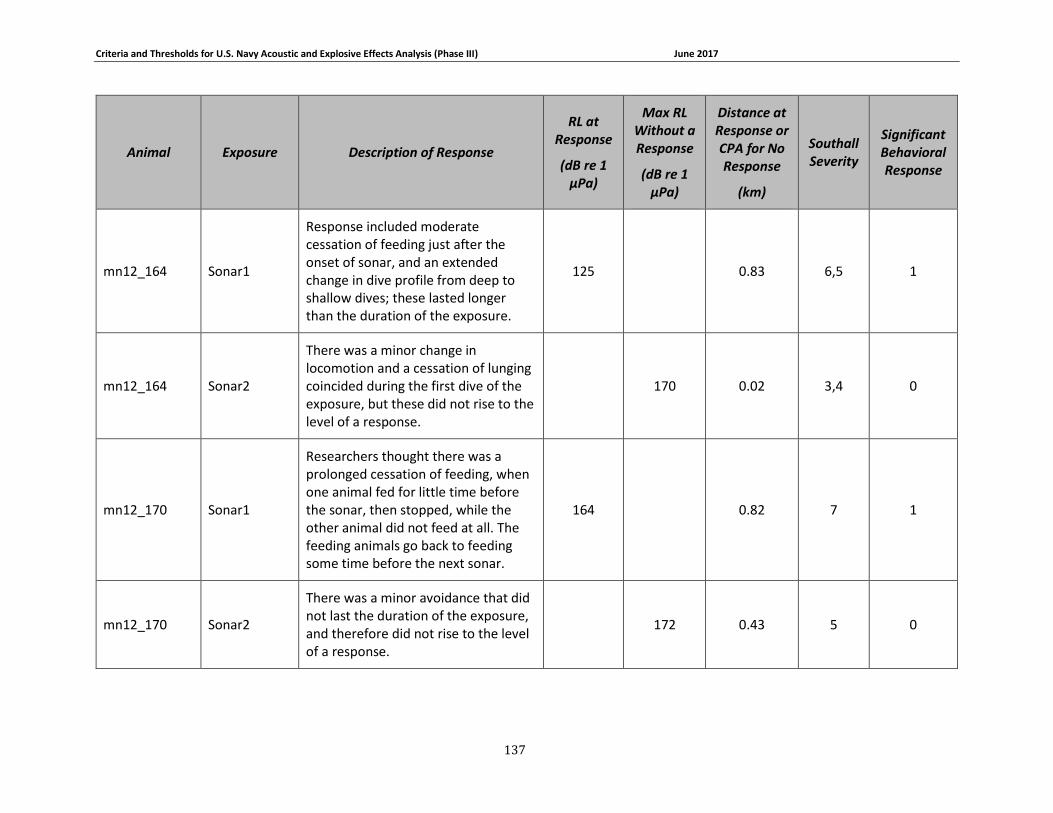
Criteria and Thresholds for U.S. Navy Acoustic and Explosive Effects Analysis (Phase III) June 2017
137
Animal Exposure Description of Response
RL at Response
(dB re 1 µPa)
Max RL Without a Response
(dB re 1 µPa)
Distance at Response or CPA for No Response
(km)
Southall Severity
Significant Behavioral Response
mn12_164 Sonar1
Response included moderate cessation of feeding just after the onset of sonar, and an extended change in dive profile from deep to shallow dives; these lasted longer than the duration of the exposure.
125 0.83 6,5 1
mn12_164 Sonar2
There was a minor change in locomotion and a cessation of lunging coincided during the first dive of the exposure, but these did not rise to the level of a response.
170 0.02 3,4 0
mn12_170 Sonar1
Researchers thought there was a prolonged cessation of feeding, when one animal fed for little time before the sonar, then stopped, while the other animal did not feed at all. The feeding animals go back to feeding some time before the next sonar.
164 0.82 7 1
mn12_170 Sonar2
There was a minor avoidance that did not last the duration of the exposure, and therefore did not rise to the level of a response.
172 0.43 5 0
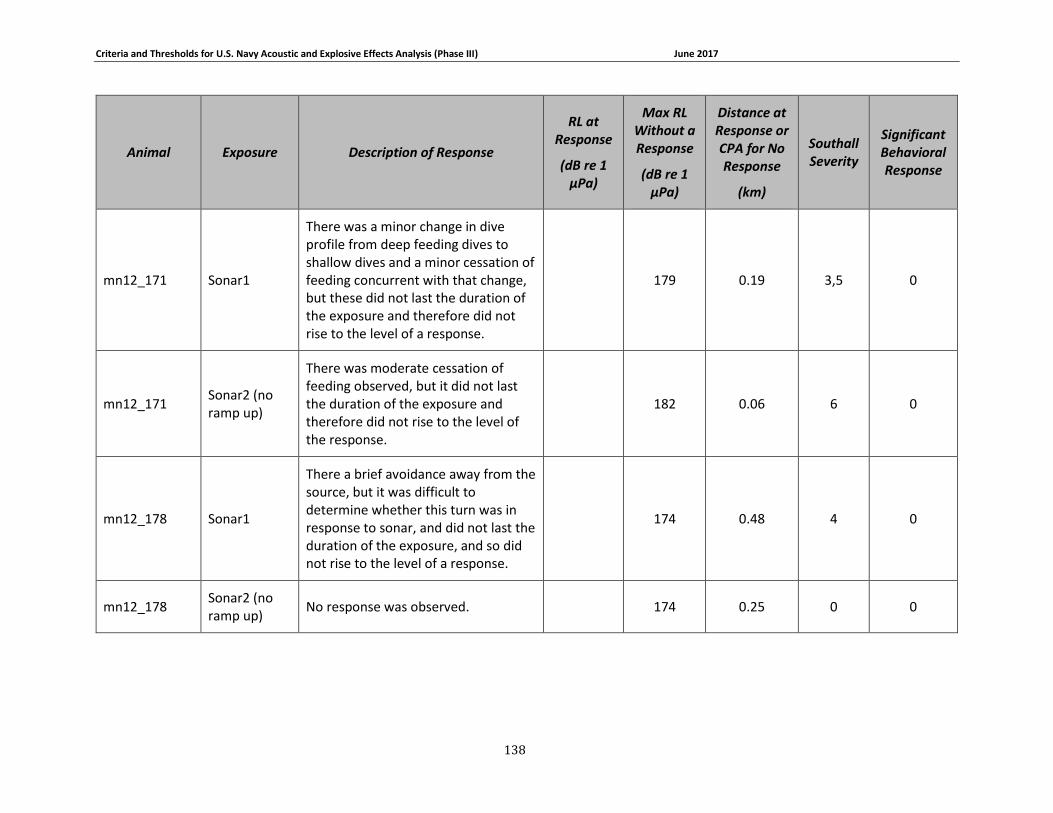
Criteria and Thresholds for U.S. Navy Acoustic and Explosive Effects Analysis (Phase III) June 2017
138
Animal Exposure Description of Response
RL at Response
(dB re 1 µPa)
Max RL Without a Response
(dB re 1 µPa)
Distance at Response or CPA for No Response
(km)
Southall Severity
Significant Behavioral Response
mn12_171 Sonar1
There was a minor change in dive profile from deep feeding dives to shallow dives and a minor cessation of feeding concurrent with that change, but these did not last the duration of the exposure and therefore did not rise to the level of a response.
179 0.19 3,5 0
mn12_171 Sonar2 (no ramp up)
There was moderate cessation of feeding observed, but it did not last the duration of the exposure and therefore did not rise to the level of the response.
182 0.06 6 0
mn12_178 Sonar1
There a brief avoidance away from the source, but it was difficult to determine whether this turn was in response to sonar, and did not last the duration of the exposure, and so did not rise to the level of a response.
174 0.48 4 0
mn12_178 Sonar2 (no ramp up)
No response was observed. 174 0.25 0 0
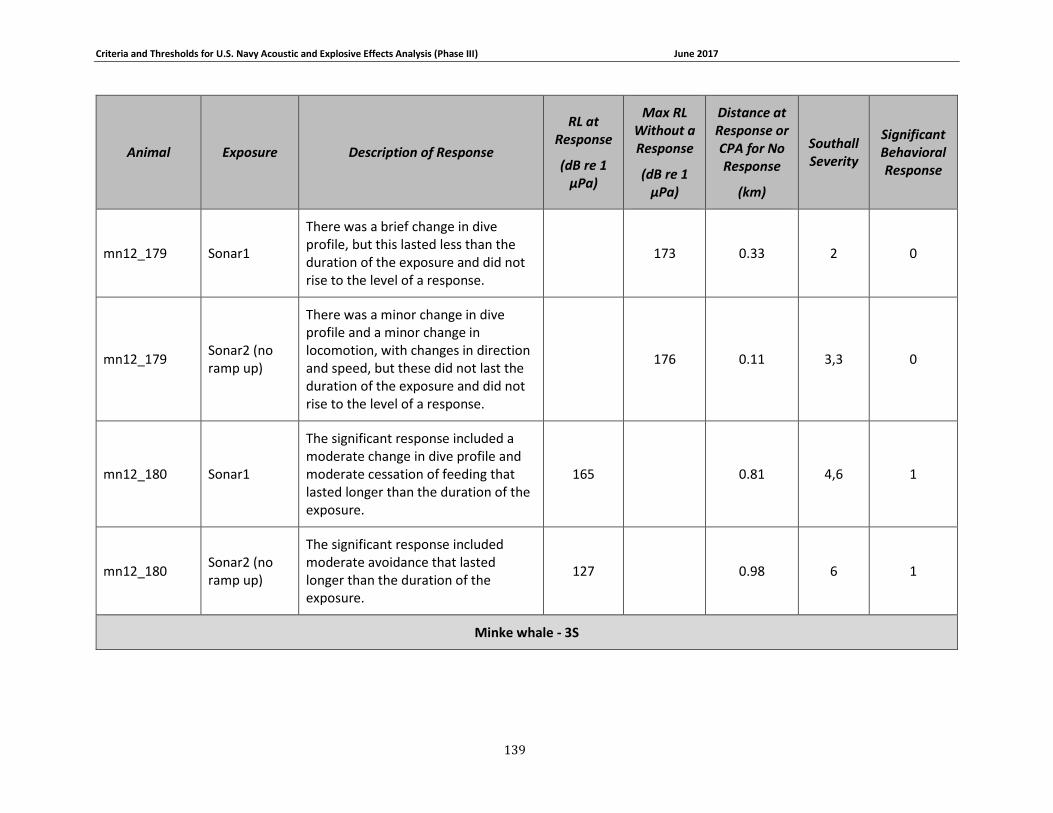
Criteria and Thresholds for U.S. Navy Acoustic and Explosive Effects Analysis (Phase III) June 2017
139
Animal Exposure Description of Response
RL at Response
(dB re 1 µPa)
Max RL Without a Response
(dB re 1 µPa)
Distance at Response or CPA for No Response
(km)
Southall Severity
Significant Behavioral Response
mn12_179 Sonar1
There was a brief change in dive profile, but this lasted less than the duration of the exposure and did not rise to the level of a response.
173 0.33 2 0
mn12_179 Sonar2 (no ramp up)
There was a minor change in dive profile and a minor change in locomotion, with changes in direction and speed, but these did not last the duration of the exposure and did not rise to the level of a response.
176 0.11 3,3 0
mn12_180 Sonar1
The significant response included a moderate change in dive profile and moderate cessation of feeding that lasted longer than the duration of the exposure.
165 0.81 4,6 1
mn12_180 Sonar2 (no ramp up)
The significant response included moderate avoidance that lasted longer than the duration of the exposure.
127 0.98 6 1
Minke whale - 3S
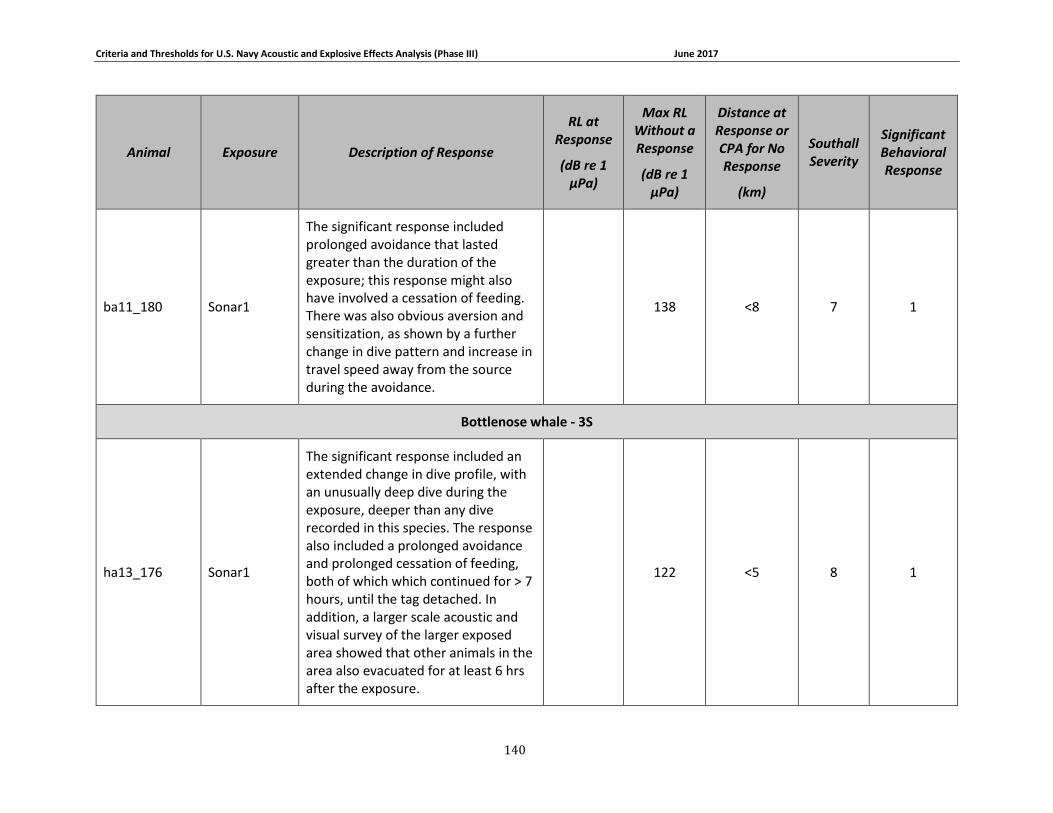
Criteria and Thresholds for U.S. Navy Acoustic and Explosive Effects Analysis (Phase III) June 2017
140
Animal Exposure Description of Response
RL at Response
(dB re 1 µPa)
Max RL Without a Response
(dB re 1 µPa)
Distance at Response or CPA for No Response
(km)
Southall Severity
Significant Behavioral Response
ba11_180 Sonar1
The significant response included prolonged avoidance that lasted greater than the duration of the exposure; this response might also have involved a cessation of feeding. There was also obvious aversion and sensitization, as shown by a further change in dive pattern and increase in travel speed away from the source during the avoidance.
138 <8 7 1
Bottlenose whale - 3S
ha13_176 Sonar1
The significant response included an extended change in dive profile, with an unusually deep dive during the exposure, deeper than any dive recorded in this species. The response also included a prolonged avoidance and prolonged cessation of feeding, both of which which continued for > 7 hours, until the tag detached. In addition, a larger scale acoustic and visual survey of the larger exposed area showed that other animals in the area also evacuated for at least 6 hrs after the exposure.
122 <5 8 1

Criteria and Thresholds for U.S. Navy Acoustic and Explosive Effects Analysis (Phase III) June 2017
141
Animal Exposure Description of Response
RL at Response
(dB re 1 µPa)
Max RL Without a Response
(dB re 1 µPa)
Distance at Response or CPA for No Response
(km)
Southall Severity
Significant Behavioral Response
Blue whales - BRS
bw10_235a MFAS
There was a decrease in body acceleration, but this was not outside normal behavior for this animal so did not rise to the level of a response.
165 1.1 3 0
bw10_235b MFAS No response was observed. 143 1.7 0 0
bw10_238a MFAS No response was observed. 143 4.5 0 0
bw10_239b MFAS
There was a change in feeding behavior, a minor cessation of feeding, and an increase in speed but not avoidance, and none of these responses lasted the duration of the exposure so this did not rise to the level of a response for this analysis.
159 2.8 6/5 0
bw10_240a MFAS No response was observed. 163 0.5 0 0
bw10_240b MFAS No response was observed. 154 3.7 0 0
bw10_243a PRN No response was observed. 148 4.6 0 0
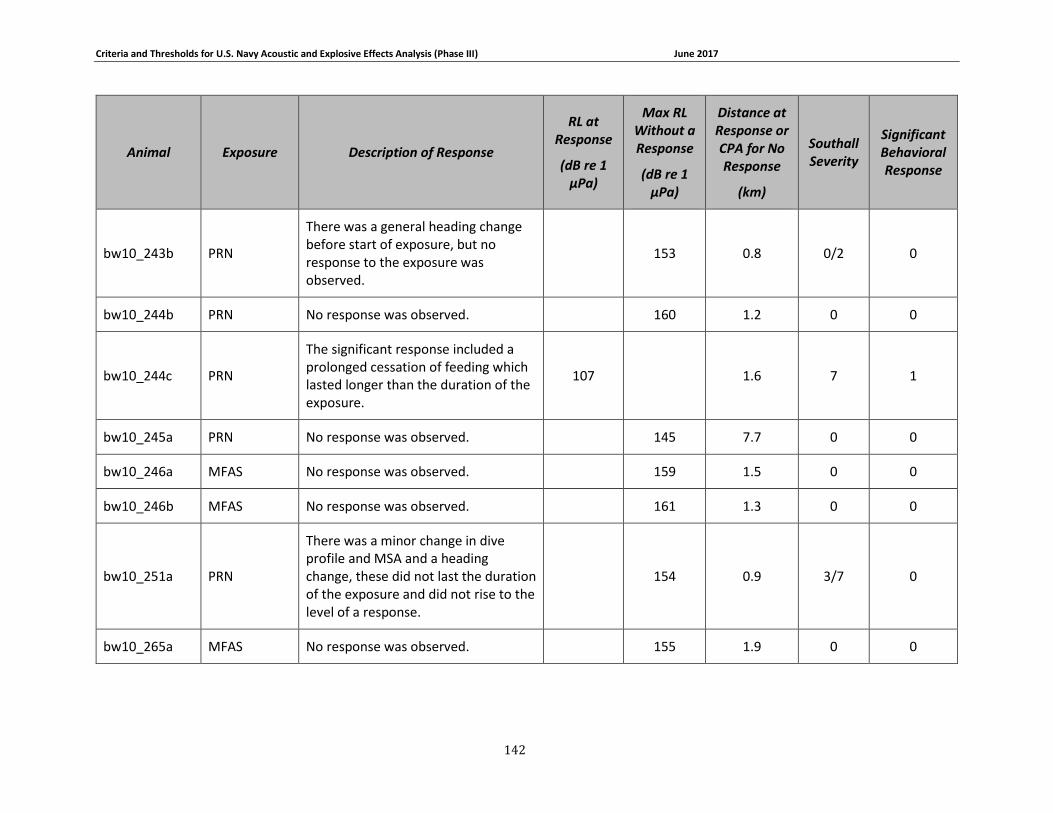
Criteria and Thresholds for U.S. Navy Acoustic and Explosive Effects Analysis (Phase III) June 2017
142
Animal Exposure Description of Response
RL at Response
(dB re 1 µPa)
Max RL Without a Response
(dB re 1 µPa)
Distance at Response or CPA for No Response
(km)
Southall Severity
Significant Behavioral Response
bw10_243b PRN
There was a general heading change before start of exposure, but no response to the exposure was observed.
153 0.8 0/2 0
bw10_244b PRN No response was observed. 160 1.2 0 0
bw10_244c PRN
The significant response included a prolonged cessation of feeding which lasted longer than the duration of the exposure.
107 1.6 7 1
bw10_245a PRN No response was observed. 145 7.7 0 0
bw10_246a MFAS No response was observed. 159 1.5 0 0
bw10_246b MFAS No response was observed. 161 1.3 0 0
bw10_251a PRN
There was a minor change in dive profile and MSA and a heading change, these did not last the duration of the exposure and did not rise to the level of a response.
154 0.9 3/7 0
bw10_265a MFAS No response was observed. 155 1.9 0 0
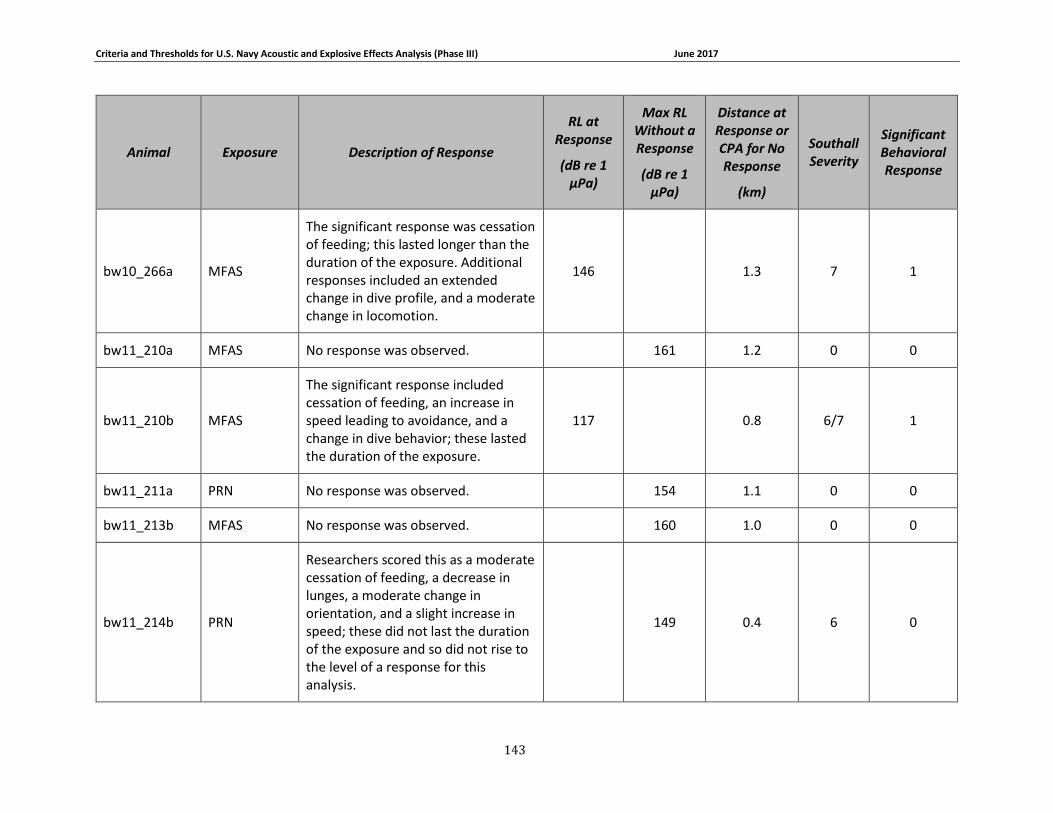
Criteria and Thresholds for U.S. Navy Acoustic and Explosive Effects Analysis (Phase III) June 2017
143
Animal Exposure Description of Response
RL at Response
(dB re 1 µPa)
Max RL Without a Response
(dB re 1 µPa)
Distance at Response or CPA for No Response
(km)
Southall Severity
Significant Behavioral Response
bw10_266a MFAS
The significant response was cessation of feeding; this lasted longer than the duration of the exposure. Additional responses included an extended change in dive profile, and a moderate change in locomotion.
146 1.3 7 1
bw11_210a MFAS No response was observed. 161 1.2 0 0
bw11_210b MFAS
The significant response included cessation of feeding, an increase in speed leading to avoidance, and a change in dive behavior; these lasted the duration of the exposure.
117 0.8 6/7 1
bw11_211a PRN No response was observed. 154 1.1 0 0
bw11_213b MFAS No response was observed. 160 1.0 0 0
bw11_214b PRN
Researchers scored this as a moderate cessation of feeding, a decrease in lunges, a moderate change in orientation, and a slight increase in speed; these did not last the duration of the exposure and so did not rise to the level of a response for this analysis.
149 0.4 6 0
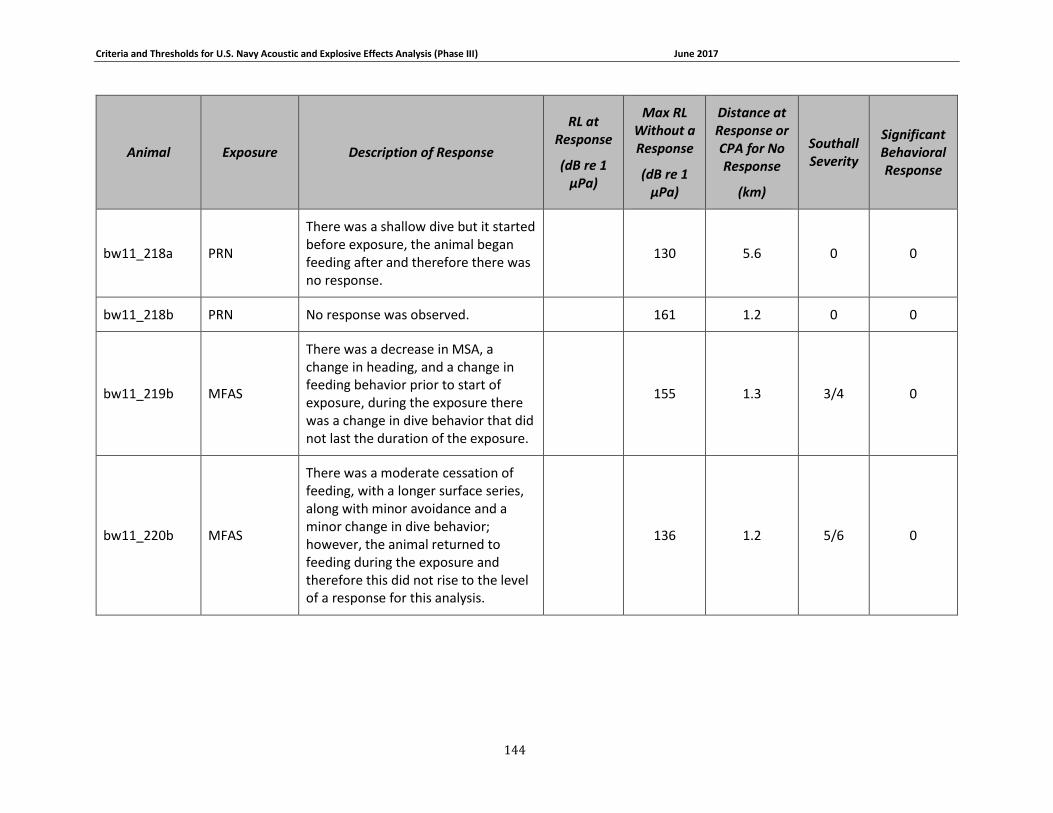
Criteria and Thresholds for U.S. Navy Acoustic and Explosive Effects Analysis (Phase III) June 2017
144
Animal Exposure Description of Response
RL at Response
(dB re 1 µPa)
Max RL Without a Response
(dB re 1 µPa)
Distance at Response or CPA for No Response
(km)
Southall Severity
Significant Behavioral Response
bw11_218a PRN
There was a shallow dive but it started before exposure, the animal began feeding after and therefore there was no response.
130 5.6 0 0
bw11_218b PRN No response was observed. 161 1.2 0 0
bw11_219b MFAS
There was a decrease in MSA, a change in heading, and a change in feeding behavior prior to start of exposure, during the exposure there was a change in dive behavior that did not last the duration of the exposure.
155 1.3 3/4 0
bw11_220b MFAS
There was a moderate cessation of feeding, with a longer surface series, along with minor avoidance and a minor change in dive behavior; however, the animal returned to feeding during the exposure and therefore this did not rise to the level of a response for this analysis.
136 1.2 5/6 0
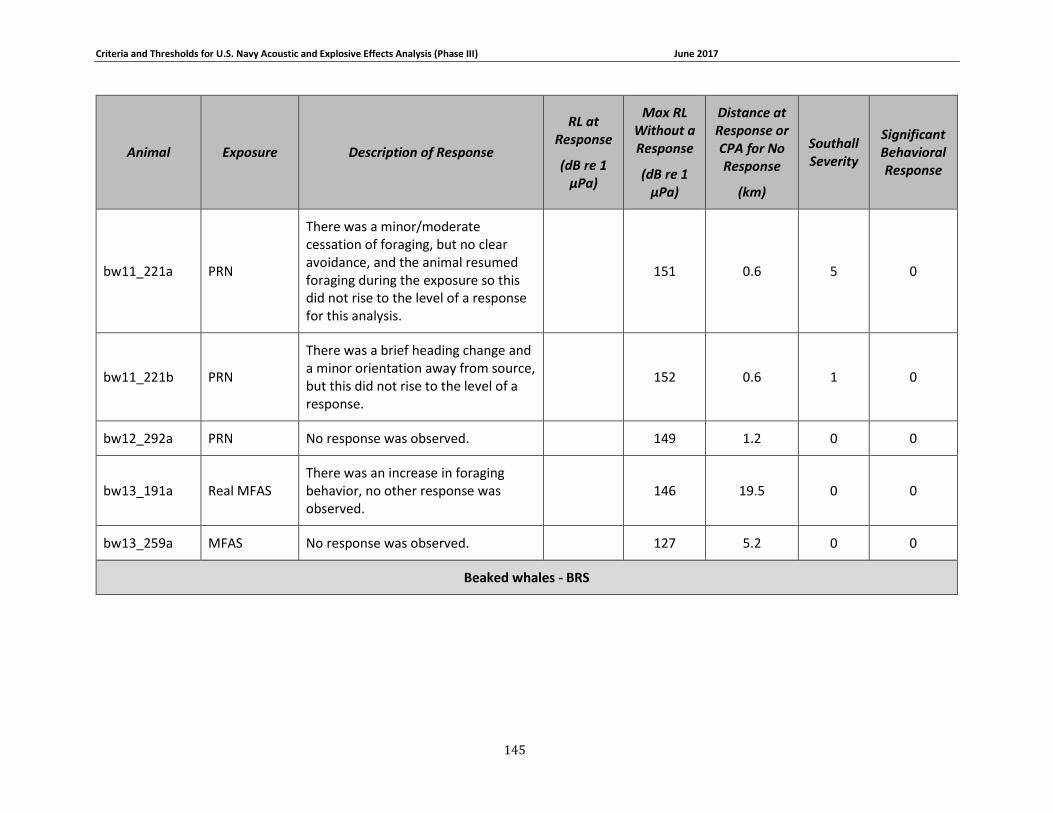
Criteria and Thresholds for U.S. Navy Acoustic and Explosive Effects Analysis (Phase III) June 2017
145
Animal Exposure Description of Response
RL at Response
(dB re 1 µPa)
Max RL Without a Response
(dB re 1 µPa)
Distance at Response or CPA for No Response
(km)
Southall Severity
Significant Behavioral Response
bw11_221a PRN
There was a minor/moderate cessation of foraging, but no clear avoidance, and the animal resumed foraging during the exposure so this did not rise to the level of a response for this analysis.
151 0.6 5 0
bw11_221b PRN
There was a brief heading change and a minor orientation away from source, but this did not rise to the level of a response.
152 0.6 1 0
bw12_292a PRN No response was observed. 149 1.2 0 0
bw13_191a Real MFAS There was an increase in foraging behavior, no other response was observed.
146 19.5 0 0
bw13_259a MFAS No response was observed. 127 5.2 0 0
Beaked whales - BRS
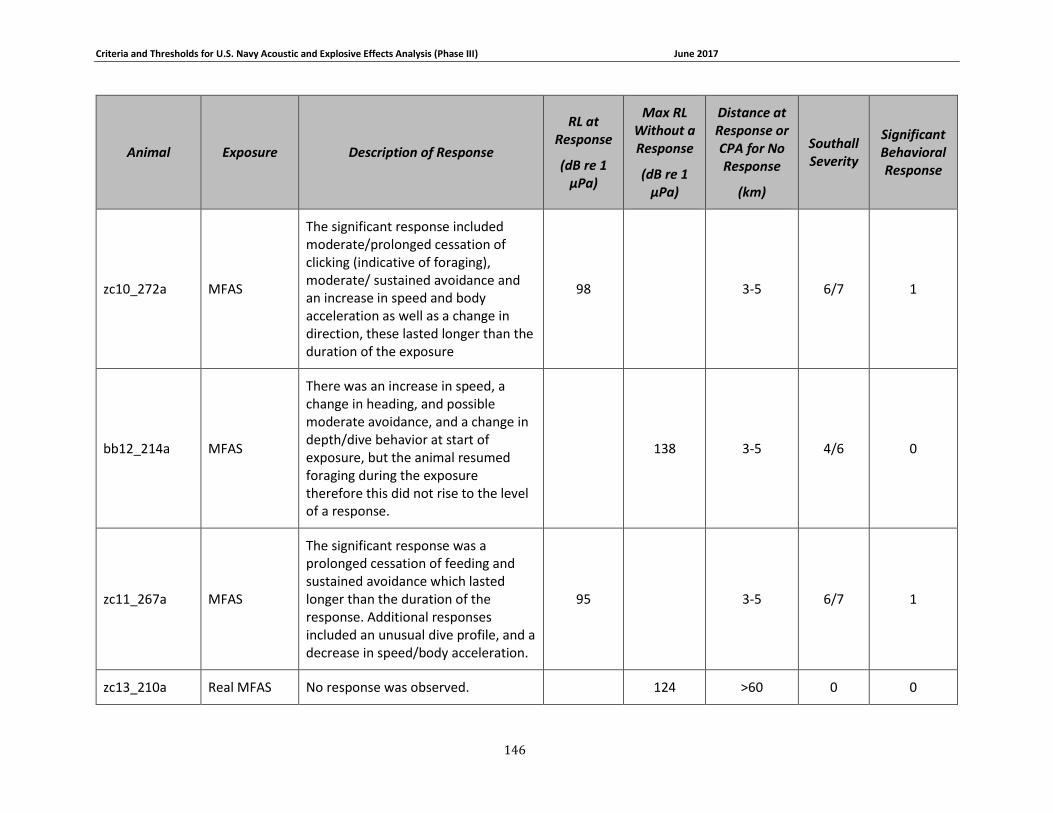
Criteria and Thresholds for U.S. Navy Acoustic and Explosive Effects Analysis (Phase III) June 2017
146
Animal Exposure Description of Response
RL at Response
(dB re 1 µPa)
Max RL Without a Response
(dB re 1 µPa)
Distance at Response or CPA for No Response
(km)
Southall Severity
Significant Behavioral Response
zc10_272a MFAS
The significant response included moderate/prolonged cessation of clicking (indicative of foraging), moderate/ sustained avoidance and an increase in speed and body acceleration as well as a change in direction, these lasted longer than the duration of the exposure
98 3-5 6/7 1
bb12_214a MFAS
There was an increase in speed, a change in heading, and possible moderate avoidance, and a change in depth/dive behavior at start of exposure, but the animal resumed foraging during the exposure therefore this did not rise to the level of a response.
138 3-5 4/6 0
zc11_267a MFAS
The significant response was a prolonged cessation of feeding and sustained avoidance which lasted longer than the duration of the response. Additional responses included an unusual dive profile, and a decrease in speed/body acceleration.
95 3-5 6/7 1
zc13_210a Real MFAS No response was observed. 124 >60 0 0
Criteria and Thresholds for U.S. Navy Acoustic and Explosive Effects Analysis (Phase III) June 2017
147
Animal Exposure Description of Response
RL at Response
(dB re 1 µPa)
Max RL Without a Response
(dB re 1 µPa)
Distance at Response or CPA for No Response
(km)
Southall Severity
Significant Behavioral Response
North Atlantic right whale - Alarm signal
NARW_1 Alarm
Response included cessation of dive, rapid ascent, an abnormally long surface interval, and more time spent at subsurface depths.
148 Estimated: within one kilometer
5 1
NARW_2 Alarm
Response included cessation of dive, rapid ascent, an abnormally long surface interval, and more time spent at subsurface depths.
143 Estimated: within one kilometer
5 1
NARW_3 Alarm
Response included cessation of dive, rapid ascent, an abnormally long surface interval, and more time spent at subsurface depths.
137 Estimated: within one kilometer
5 1
NARW_4 Alarm
Response included cessation of dive, rapid ascent, an abnormally long surface interval, and more time spent at subsurface depths.
135 Estimated: within one kilometer
5 1
NARW_5 Alarm
Response included cessation of dive, rapid ascent, an abnormally long surface interval, and more time spent at subsurface depths.
133 Estimated: within one kilometer
5 1
Criteria and Thresholds for U.S. Navy Acoustic and Explosive Effects Analysis (Phase III) June 2017
148
Animal Exposure Description of Response
RL at Response
(dB re 1 µPa)
Max RL Without a Response
(dB re 1 µPa)
Distance at Response or CPA for No Response
(km)
Southall Severity
Significant Behavioral Response
NARW_6 Alarm No response was observed.
134 Estimated: within one kilometer
0 0
Fin whales - SURTASS LFA
Fin whale 1 LFAS No response was observed. 148 NA 0 0
Fin whale 2 LFAS No response was observed. 148 NA 0 0
Fin whale 3 LFAS No response was observed. 148 NA 0 0
Fin whale 4 LFAS No response was observed. 148 NA 0 0
Fin whale 5 LFAS No response was observed. 148 NA 0 0
Blue whale - SURTASS LFA
Blue whale 1 LFAS No response was observed. 150 NA 0 0
Humpback whales - SURTASS LFA
Singer 1 LFAS
Response was cessation of song vocalizations; this lasted as long as or longer than the duration of the exposure.
132 4.3 5 0

Criteria and Thresholds for U.S. Navy Acoustic and Explosive Effects Analysis (Phase III) June 2017
149
Animal Exposure Description of Response
RL at Response
(dB re 1 µPa)
Max RL Without a Response
(dB re 1 µPa)
Distance at Response or CPA for No Response
(km)
Southall Severity
Significant Behavioral Response
Singer 2 LFAS
Response was cessation of song vocalizations; this lasted as long as or longer than the duration of the exposure.
142 0.5 5 0
Singer 3 LFAS
Response was cessation of song vocalizations; this lasted as long as or longer than the duration of the exposure.
121 <11.3 5 0
Singer 4 LFAS
Response was cessation of song vocalizations; this lasted as long as or longer than the duration of the exposure.
126 <6.7 5 0
Singer 5 LFAS
Response was cessation of song vocalizations; this lasted as long as or longer than the duration of the exposure.
122 4.5 5 0
Singer 6 LFAS
Response was cessation of song vocalizations; this lasted as long as or longer than the duration of the exposure.
138 0.5 5 0
Criteria and Thresholds for U.S. Navy Acoustic and Explosive Effects Analysis (Phase III) June 2017
150
Animal Exposure Description of Response
RL at Response
(dB re 1 µPa)
Max RL Without a Response
(dB re 1 µPa)
Distance at Response or CPA for No Response
(km)
Southall Severity
Significant Behavioral Response
Singer 7 LFAS
The singer stopped vocalizing during the sonar playback, however they joined with other animals and therefore the change was not in response to sonar.
124 5.2 0 0
Singer 8 LFAS
The singer stopped vocalizing during the sonar playback, however they joined with other animals and therefore the change was not in response to sonar.
133 1 0 0
Singer 9 LFAS
The singer stopped vocalizing during the sonar playback, however they joined with other animals and therefore the change was not in response to sonar.
137 1.2 0 0
Singer 10 LFAS
The singer stopped vocalizing during the sonar playback, however they joined with other animals and therefore the change was not in response to sonar.
122 8.0 0 0
Singer 11 LFAS The singer did not stop vocalizing during the sonar playback, therefore no response was observed.
124 6.7 0 0

Criteria and Thresholds for U.S. Navy Acoustic and Explosive Effects Analysis (Phase III) June 2017
151
Animal Exposure Description of Response
RL at Response
(dB re 1 µPa)
Max RL Without a Response
(dB re 1 µPa)
Distance at Response or CPA for No Response
(km)
Southall Severity
Significant Behavioral Response
Singer 12 LFAS The singer did not stop vocalizing during the sonar playback, therefore no response was observed.
150 1.3 0 0
Singer 13 LFAS The singer did not stop vocalizing during the sonar playback, therefore no response was observed.
150 0.4 0 0
Singer 14 LFAS The singer did not stop vocalizing during the sonar playback, therefore no response was observed.
140 7.4 0 0
Singer 15 LFAS The singer did not stop vocalizing during the sonar playback, therefore no response was observed.
129 3.8 0 0
Singer 16 LFAS The singer did not stop vocalizing during the sonar playback, therefore no response was observed.
132 16.6 0 0
Singer 17 LFAS The singer did not stop vocalizing during the sonar playback, therefore no response was observed.
133 7.3 0 0
Bottlenose dolphins - CES
Dolphin 1 MFAS No response. 115 0.01 0 0
Criteria and Thresholds for U.S. Navy Acoustic and Explosive Effects Analysis (Phase III) June 2017
152
Animal Exposure Description of Response
RL at Response
(dB re 1 µPa)
Max RL Without a Response
(dB re 1 µPa)
Distance at Response or CPA for No Response
(km)
Southall Severity
Significant Behavioral Response
Dolphin 2 MFAS
Minor change in respiration rate on one trial.
115 0.01 3 0
Dolphin 3 MFAS
Minor change in respiration rate on one trial.
115 0.01 3 0
Dolphin 4 MFAS No response. 115 0.01 0 0
Dolphin 5 MFAS No response. 115 0.01 0 0
Dolphin 6 MFAS No response. 130 0.01 0 0
Dolphin 7 MFAS
Minor change in respiration rate on two trials.
130
0.01 3 0
Dolphin 8 MFAS Significant response was refusal to participate on tenth trial. Minor change in respiration on one trial.
130
0.01 7 1
Dolphin 9 MFAS Minor change in respiration rate on nine trials.
130
0.01 3 0
Dolphin 10 MFAS No response. 130 0.01 0 0
Dolphin 11 MFAS Minor change in respiration rate on one trial.
145 0.01 3 0
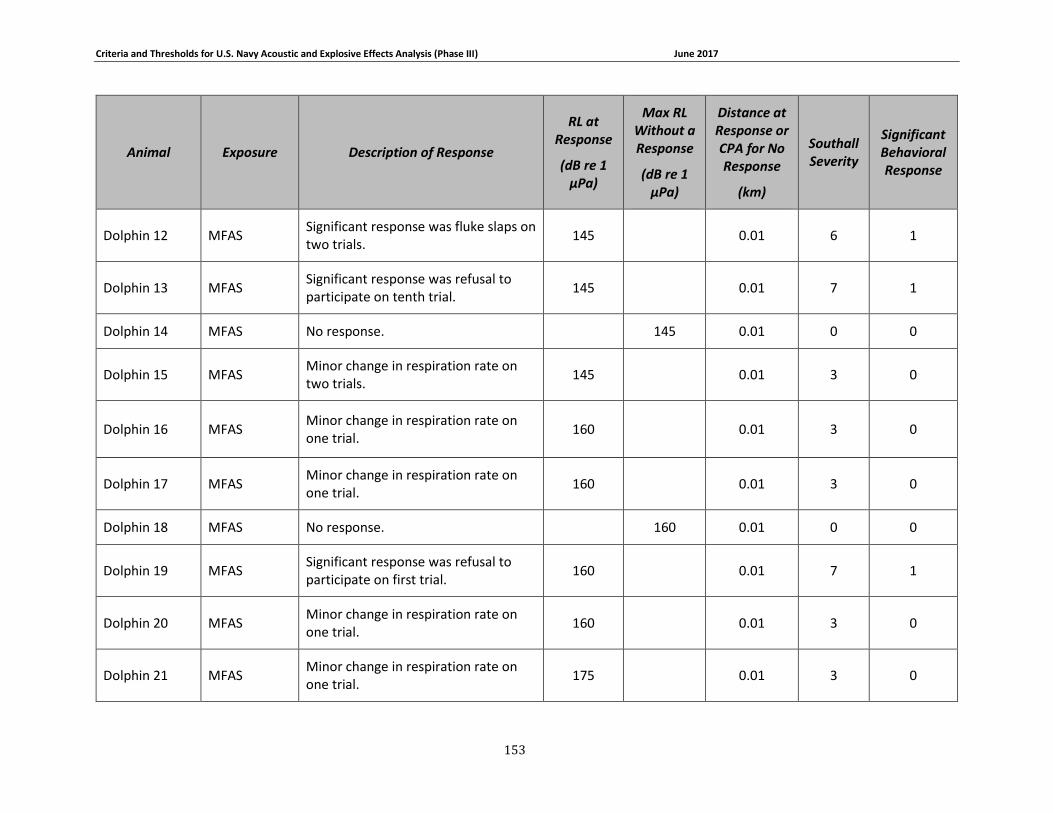
Criteria and Thresholds for U.S. Navy Acoustic and Explosive Effects Analysis (Phase III) June 2017
153
Animal Exposure Description of Response
RL at Response
(dB re 1 µPa)
Max RL Without a Response
(dB re 1 µPa)
Distance at Response or CPA for No Response
(km)
Southall Severity
Significant Behavioral Response
Dolphin 12 MFAS Significant response was fluke slaps on two trials.
145 0.01 6 1
Dolphin 13 MFAS Significant response was refusal to participate on tenth trial.
145 0.01 7 1
Dolphin 14 MFAS No response. 145 0.01 0 0
Dolphin 15 MFAS Minor change in respiration rate on two trials.
145 0.01 3 0
Dolphin 16 MFAS Minor change in respiration rate on one trial.
160 0.01 3 0
Dolphin 17 MFAS Minor change in respiration rate on one trial.
160 0.01 3 0
Dolphin 18 MFAS No response. 160 0.01 0 0
Dolphin 19 MFAS Significant response was refusal to participate on first trial.
160 0.01 7 1
Dolphin 20 MFAS Minor change in respiration rate on one trial.
160 0.01 3 0
Dolphin 21 MFAS Minor change in respiration rate on one trial.
175 0.01 3 0

Criteria and Thresholds for U.S. Navy Acoustic and Explosive Effects Analysis (Phase III) June 2017
154
Animal Exposure Description of Response
RL at Response
(dB re 1 µPa)
Max RL Without a Response
(dB re 1 µPa)
Distance at Response or CPA for No Response
(km)
Southall Severity
Significant Behavioral Response
Dolphin 22 MFAS
Significant response was refusal to participate on three trials and fluke slaps on six trials. Minor changes in respiration.
175
0.01 7 1
Dolphin 23 MFAS Significant response was refusal to participate on all trials.
175 0.01 7 1
Dolphin 24 MFAS Significant response was refusal to participate on seven trials. Minor change in respiration on nine trials.
175 0.01 7 1
Dolphin 25 MFAS Minor change in respiration rate on one trial.
175 0.01 3 0
Dolphin 26 MFAS Significant response was refusal to participate all trials.
185 0.01 7 1
Dolphin 27 MFAS Significant response was refusal to participate all trials.
185 0.01
7 1
Dolphin 28 MFAS Significant response was refusal to participate all trials.
185 0.01
7 1
Dolphin 29 MFAS Significant response was refusal to participate all trials.
185 0.01
7 1
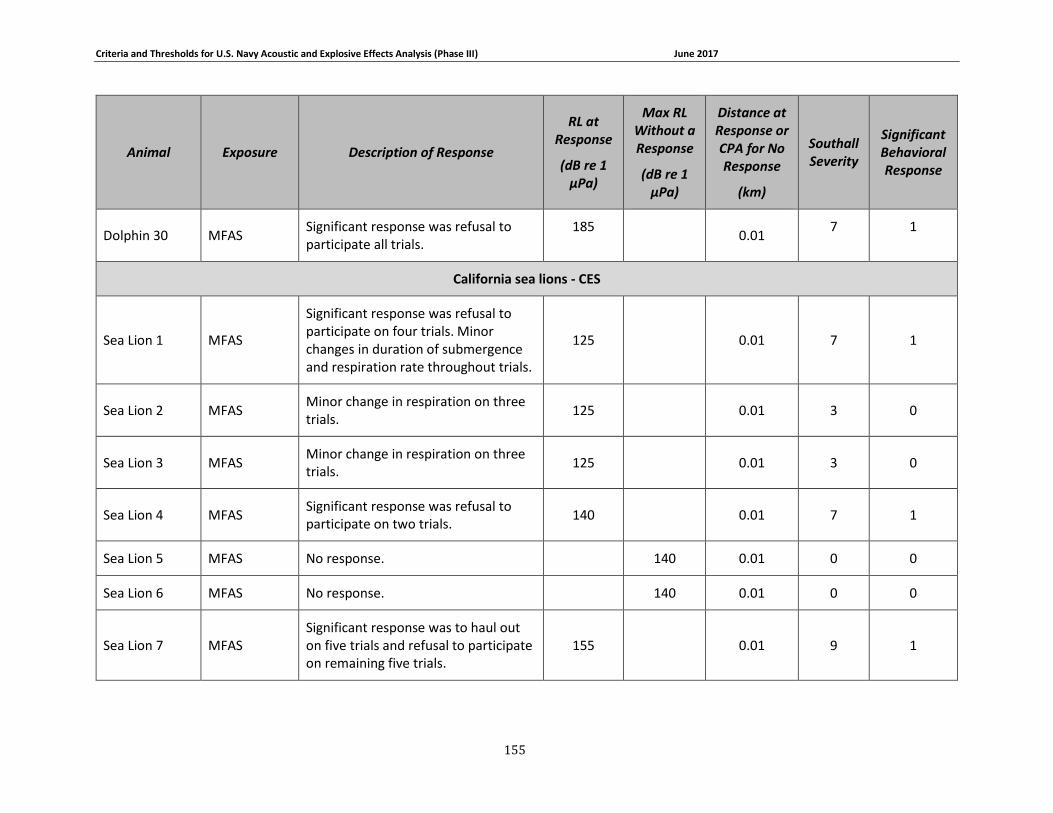
Criteria and Thresholds for U.S. Navy Acoustic and Explosive Effects Analysis (Phase III) June 2017
155
Animal Exposure Description of Response
RL at Response
(dB re 1 µPa)
Max RL Without a Response
(dB re 1 µPa)
Distance at Response or CPA for No Response
(km)
Southall Severity
Significant Behavioral Response
Dolphin 30 MFAS Significant response was refusal to participate all trials.
185 0.01
7 1
California sea lions - CES
Sea Lion 1 MFAS
Significant response was refusal to participate on four trials. Minor changes in duration of submergence and respiration rate throughout trials.
125 0.01 7 1
Sea Lion 2 MFAS Minor change in respiration on three trials.
125 0.01 3 0
Sea Lion 3 MFAS Minor change in respiration on three trials.
125 0.01 3 0
Sea Lion 4 MFAS Significant response was refusal to participate on two trials.
140 0.01 7 1
Sea Lion 5 MFAS No response. 140 0.01 0 0
Sea Lion 6 MFAS No response. 140 0.01 0 0
Sea Lion 7 MFAS Significant response was to haul out on five trials and refusal to participate on remaining five trials.
155 0.01 9 1
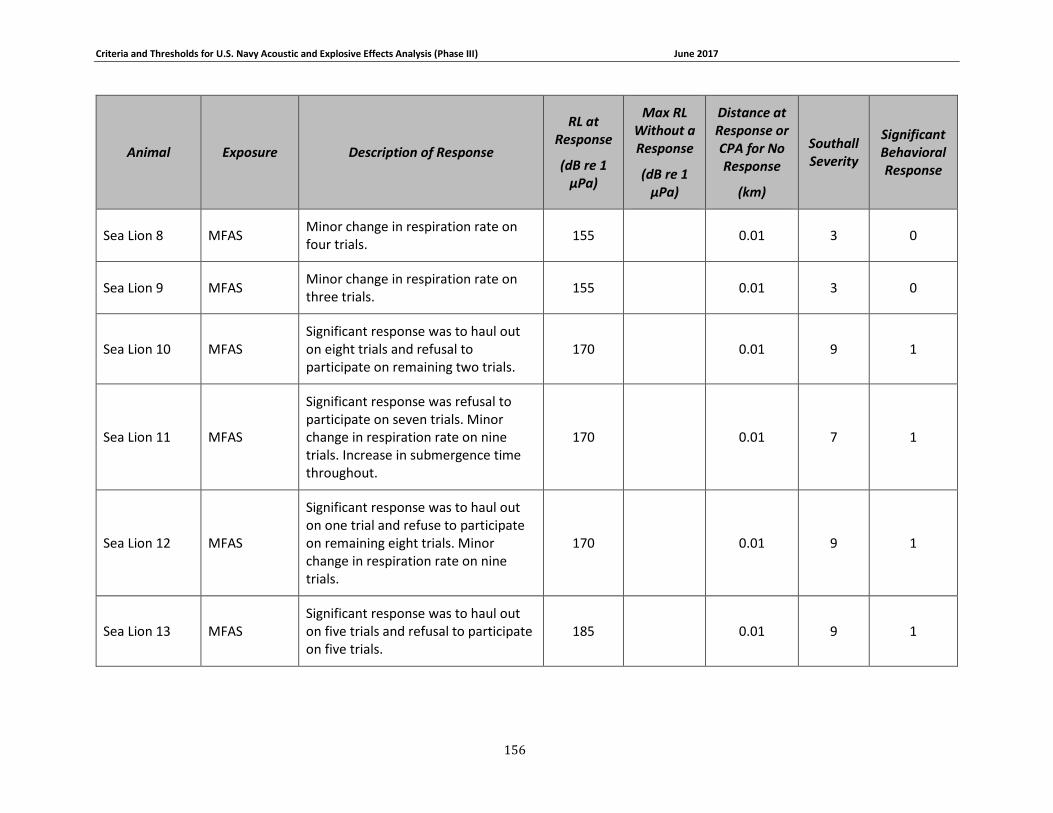
Criteria and Thresholds for U.S. Navy Acoustic and Explosive Effects Analysis (Phase III) June 2017
156
Animal Exposure Description of Response
RL at Response
(dB re 1 µPa)
Max RL Without a Response
(dB re 1 µPa)
Distance at Response or CPA for No Response
(km)
Southall Severity
Significant Behavioral Response
Sea Lion 8 MFAS Minor change in respiration rate on four trials.
155 0.01 3 0
Sea Lion 9 MFAS Minor change in respiration rate on three trials.
155 0.01 3 0
Sea Lion 10 MFAS Significant response was to haul out on eight trials and refusal to participate on remaining two trials.
170 0.01 9 1
Sea Lion 11 MFAS
Significant response was refusal to participate on seven trials. Minor change in respiration rate on nine trials. Increase in submergence time throughout.
170 0.01 7 1
Sea Lion 12 MFAS
Significant response was to haul out on one trial and refuse to participate on remaining eight trials. Minor change in respiration rate on nine trials.
170 0.01 9 1
Sea Lion 13 MFAS Significant response was to haul out on five trials and refusal to participate on five trials.
185 0.01 9 1
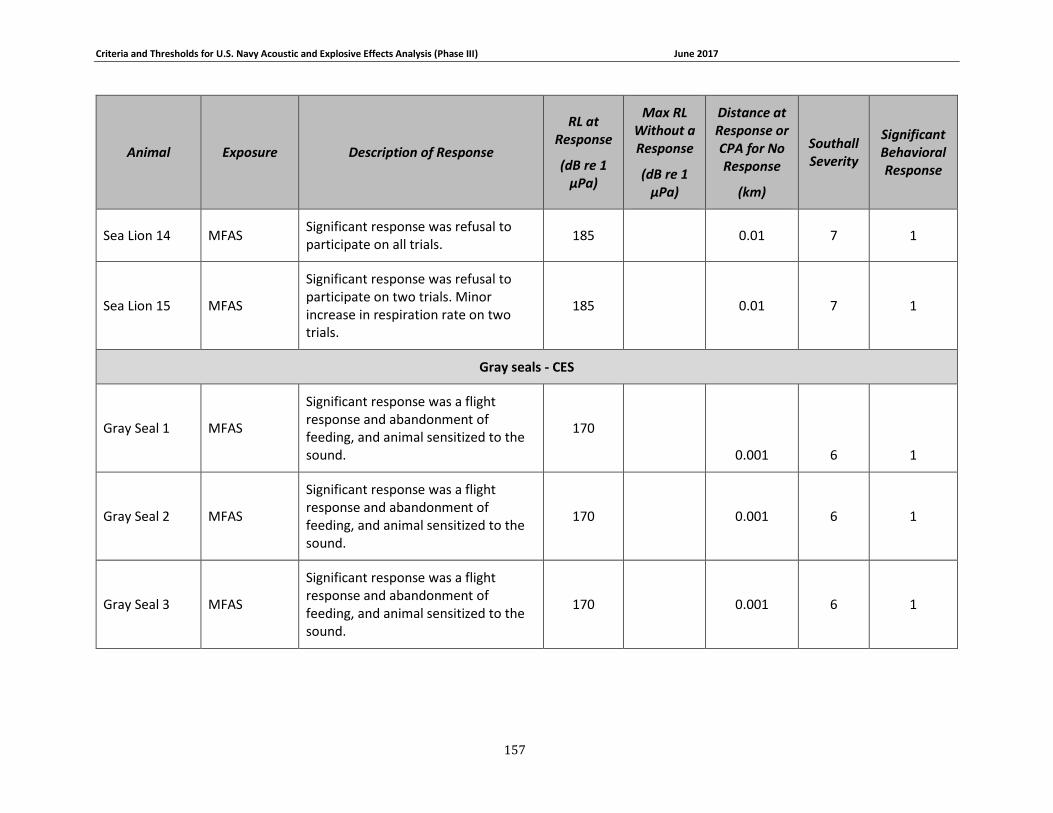
Criteria and Thresholds for U.S. Navy Acoustic and Explosive Effects Analysis (Phase III) June 2017
157
Animal Exposure Description of Response
RL at Response
(dB re 1 µPa)
Max RL Without a Response
(dB re 1 µPa)
Distance at Response or CPA for No Response
(km)
Southall Severity
Significant Behavioral Response
Sea Lion 14 MFAS Significant response was refusal to participate on all trials.
185 0.01 7 1
Sea Lion 15 MFAS
Significant response was refusal to participate on two trials. Minor increase in respiration rate on two trials.
185 0.01 7 1
Gray seals - CES
Gray Seal 1 MFAS
Significant response was a flight response and abandonment of feeding, and animal sensitized to the sound.
170
0.001 6 1
Gray Seal 2 MFAS
Significant response was a flight response and abandonment of feeding, and animal sensitized to the sound.
170 0.001 6 1
Gray Seal 3 MFAS
Significant response was a flight response and abandonment of feeding, and animal sensitized to the sound.
170 0.001 6 1

Criteria and Thresholds for U.S. Navy Acoustic and Explosive Effects Analysis (Phase III) June 2017
158
Animal Exposure Description of Response
RL at Response
(dB re 1 µPa)
Max RL Without a Response
(dB re 1 µPa)
Distance at Response or CPA for No Response
(km)
Southall Severity
Significant Behavioral Response
Gray Seal 4 MFAS
Significant response was a flight response and abandonment of feeding, and animal sensitized to the sound.
170 0.001 6 1
Gray Seal 5 MFAS
Significant response was a flight response and abandonment of feeding, and animal sensitized to the sound.
170 0.001 6 1
Gray Seal 6 MFAS No response occurred, and animal habituated to the sound.
170 0.001 0 0
Gray Seal 7 MFAS No response occurred, and animal habituated to the sound.
170 0.001 0 0
Gray Seal 1 MFAS Significant response was a flight response and abandonment of feeding.
160 0.001 6 1
Gray Seal 2 MFAS Significant response was a flight response and abandonment of feeding.
155 0.001 6 1
Gray Seal 3 MFAS Significant response was a flight response and abandonment of feeding.
160 0.001 6 1
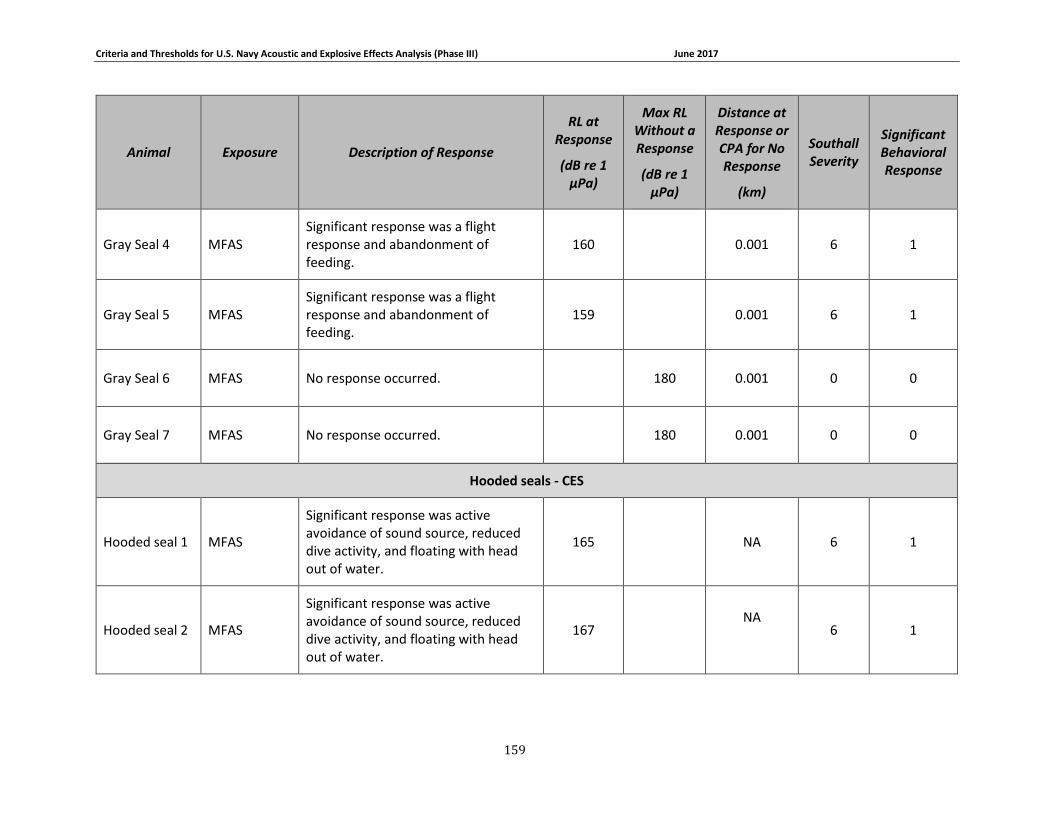
Criteria and Thresholds for U.S. Navy Acoustic and Explosive Effects Analysis (Phase III) June 2017
159
Animal Exposure Description of Response
RL at Response
(dB re 1 µPa)
Max RL Without a Response
(dB re 1 µPa)
Distance at Response or CPA for No Response
(km)
Southall Severity
Significant Behavioral Response
Gray Seal 4 MFAS Significant response was a flight response and abandonment of feeding.
160 0.001 6 1
Gray Seal 5 MFAS Significant response was a flight response and abandonment of feeding.
159 0.001 6 1
Gray Seal 6 MFAS No response occurred. 180 0.001 0 0
Gray Seal 7 MFAS No response occurred. 180 0.001 0 0
Hooded seals - CES
Hooded seal 1 MFAS
Significant response was active avoidance of sound source, reduced dive activity, and floating with head out of water.
165 NA 6 1
Hooded seal 2 MFAS
Significant response was active avoidance of sound source, reduced dive activity, and floating with head out of water.
167 NA
6 1
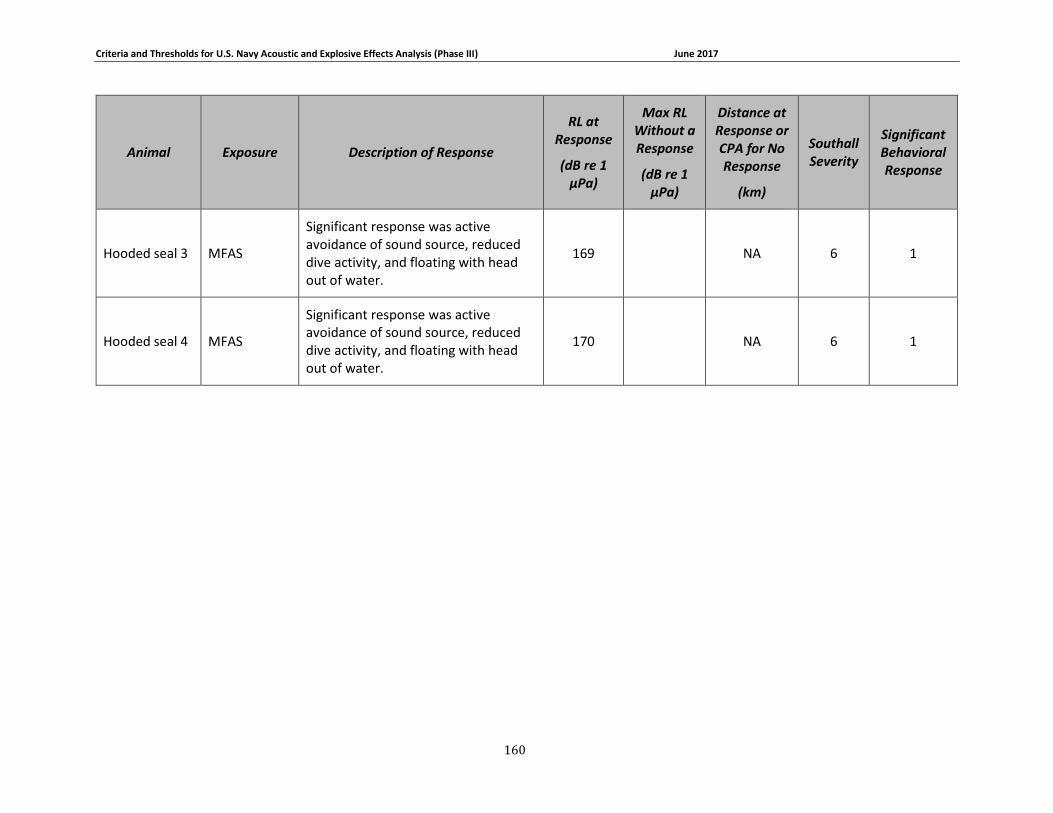
Criteria and Thresholds for U.S. Navy Acoustic and Explosive Effects Analysis (Phase III) June 2017
160
Animal Exposure Description of Response
RL at Response
(dB re 1 µPa)
Max RL Without a Response
(dB re 1 µPa)
Distance at Response or CPA for No Response
(km)
Southall Severity
Significant Behavioral Response
Hooded seal 3 MFAS
Significant response was active avoidance of sound source, reduced dive activity, and floating with head out of water.
169 NA 6 1
Hooded seal 4 MFAS
Significant response was active avoidance of sound source, reduced dive activity, and floating with head out of water.
170 NA 6 1
Criteria and Thresholds for U.S. Navy Acoustic and Explosive Effects Analysis (Phase III) June 2017
161
APPENDIX C. PHASE III SUMMARY OF CRITERIA FOR DETERMINING ACOUSTIC AND EXPLOSIVE EFFECTS TO MARINE SPECIES FROM NAVY SOUND SOURCES
C.1. Introduction
The following is a brief summary of the Navy’s proposed Phase III Physiological and Behavioral Criteria and Thresholds for predicting acoustic and explosive effects to marine species. It is primarily meant to guide the NAEMO analysts in order to begin the Phase III acoustic and explosive modeling.
C.2. General
The highest order effect predicted is the one that is reported: mortality > non-auditory injury > PTS > TTS > behavioral response.
Sound exposure levels (SEL) and root-mean-square (rms) sound pressure levels (SPL) will be calculated based on the actual signal duration. For impulsive sounds, SEL at the receiver shall be calculated based on 90% of the weighted received energy over the duration of an individual pulse. (Note that this differs from Phase II SEL calculation for explosives, which consisted of calculating SEL using the rms received level over an assumed one-second duration rather than the actual pulse duration.)

Criteria and Thresholds for U.S. Navy Acoustic and Explosive Effects Analysis (Phase III) June 2017
162
C.3. Marine Species Hearing Groups
Table C.1. Species group designations for Navy Phase III auditory weighting functions.
Code Name Members
LF Low-frequency cetaceans
Family Balaenidae (right and bowhead whales)
Family Balaenopteridae (rorquals)
Family Eschrichtiidae (gray whale)
Family Neobalaenidae (pygmy right whale)
MF Mid-frequency cetaceans
Family Ziphiidae (beaked whales)
Family Physeteridae (Sperm whale)
Family Monodontidae (Irrawaddy dolphin, beluga, narwhal)
Subfamily Delphininae (white-beaked/white-sided/ Risso’s/bottlenose/spotted/spinner/striped/common dolphins)
Subfamily Orcininae (melon-headed whales, false/pygmy killer whale, killer whale, pilot whales)
Subfamily Stenoninae (rough-toothed/humpback dolphins)
Genus Lissodelphis (right whale dolphins)
Lagenorhynchus albirostris (white-beaked dolphin)
Lagenorhynchus acutus (Atlantic white-sided dolphin)
Lagenorhynchus obliquidens (Pacific white-sided dolphin)
Lagenorhynchus obscurus (dusky dolphin)
HF High-frequency cetaceans
Family Phocoenidae (porpoises)
Family Platanistidae (Indus/Ganges river dolphins)
Family Iniidae (Amazon river dolphins)
Family Pontoporiidae (Baiji/ La Plata river dolphins)
Family Kogiidae (Pygmy/dwarf sperm whales)
Genus Cephalorhynchus (Commerson’s, Chilean, Heaviside’s, Hector’s dolphins)
Lagenorhynchus australis (Peale’s or black-chinned dolphin)
Lagenorhynchus cruciger (hourglass dolphin)
OW Otariids and other non-phocid marine carnivores (water)
Family Otariidae (eared seals and sea lions)
Family Odobenidae (walrus)
Enhydra lutris (sea otter)
Ursus maritimus (polar bear)
PW Phocids (water) Family Phocidae (true seals)
SI Sirenians Family Trichechidae (manatees)
Family Dugongidae (dugongs)
TU Sea turtles Family Cheloniidae (loggerhead, green, hawksbill, Kemp's ridley, olive ridley, flatback sea turtle)
Family Dermochelyidae (leatherback sea turtle)
OA Otariids and other non-phocid marine carnivores (air)
Family Otariidae (eared seals and sea lions)
Family Odobenidae (walrus)
Enhydra lutris (sea otter)
Ursus maritimus (polar bear)
PA Phocids (air) Family Phocidae (true seals)
Criteria and Thresholds for U.S. Navy Acoustic and Explosive Effects Analysis (Phase III) June 2017
163
C.4. Auditory Weighting Functions and Temporary & PTS For all Analyzed Navy Sound Sources
In Phase III, auditory weighting functions will be used to adjust the received SEL before comparing that level to thresholds for TTS and PTS for both impulsive and non-impulsive sounds (See Table C.2 and Figure C.1). Auditory weighting functions will not be applied when calculating SPL in any instance. TTS and PTS use the weighted SEL for both non-impulsive and impulsive sound types.
For sonar and other transducers, pings and active transmissions are summed to a cumulative SEL (cSEL) during an event or over 24 hours for multiday events. The cSEL is then weighted using the appropriate weighting function for that hearing group, before being compared to the threshold for determining TTS or PTS (See Figure C.2). Similarly, for broadband sources (i.e., explosives, airguns, impact pile driving, and vibratory pile driving), cumulative SEL is summed across the full frequency range and then weighted using the appropriate weighting function for that hearing group before being compared to the threshold for determining TTS or PTS (See Figure C.3).
Although frequency weighting is applied, upper and lower frequency cutoffs will be considered as to what sources and events should be assessed for a hearing group.
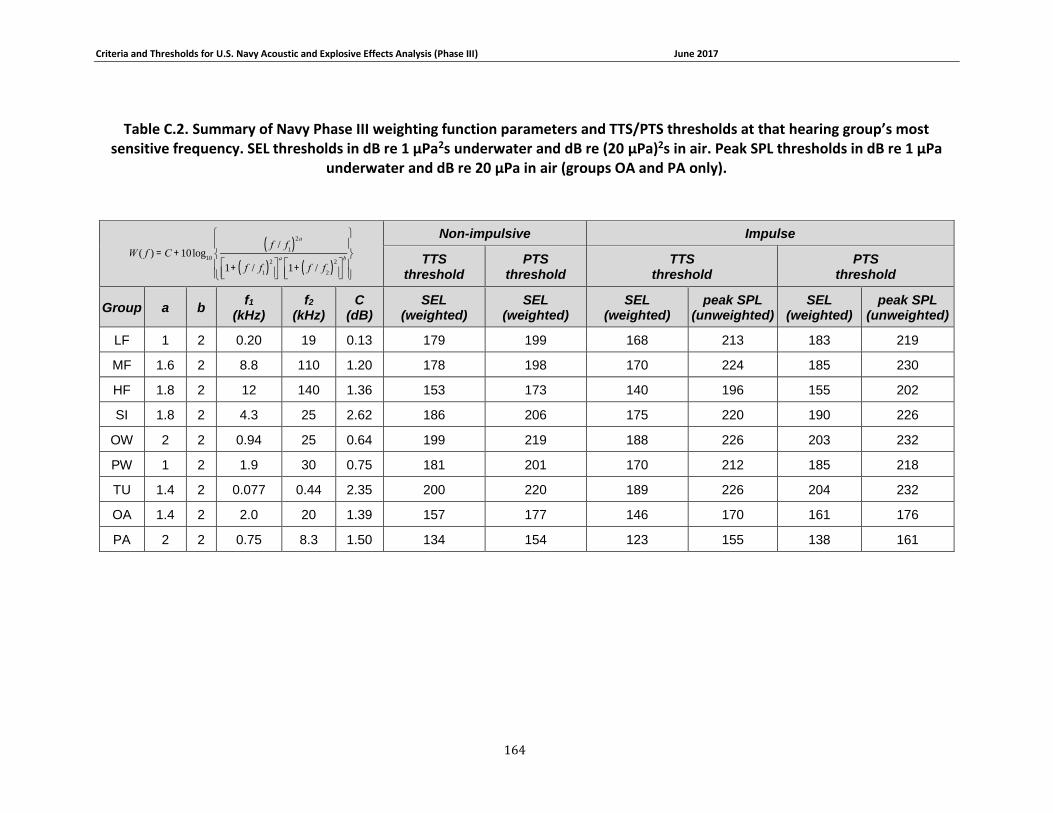
Criteria and Thresholds for U.S. Navy Acoustic and Explosive Effects Analysis (Phase III) June 2017
164
Table C.2. Summary of Navy Phase III weighting function parameters and TTS/PTS thresholds at that hearing group’s most sensitive frequency. SEL thresholds in dB re 1 μPa2s underwater and dB re (20 μPa)2s in air. Peak SPL thresholds in dB re 1 μPa
underwater and dB re 20 μPa in air (groups OA and PA only).
W ( f ) = C +10log10
f / f1( )
2a
1+ f / f1( )
2éëê
ùûú
a
1+ f / f2( )
2éëê
ùûú
b
ì
íï
îïï
ü
ýï
þïï
Non-impulsive Impulse
TTS threshold
PTS threshold
TTS threshold
PTS threshold
Group a b f1
(kHz) f2
(kHz) C
(dB) SEL
(weighted) SEL
(weighted) SEL
(weighted) peak SPL
(unweighted) SEL
(weighted) peak SPL
(unweighted)
LF 1 2 0.20 19 0.13 179 199 168 213 183 219
MF 1.6 2 8.8 110 1.20 178 198 170 224 185 230
HF 1.8 2 12 140 1.36 153 173 140 196 155 202
SI 1.8 2 4.3 25 2.62 186 206 175 220 190 226
OW 2 2 0.94 25 0.64 199 219 188 226 203 232
PW 1 2 1.9 30 0.75 181 201 170 212 185 218
TU 1.4 2 0.077 0.44 2.35 200 220 189 226 204 232
OA 1.4 2 2.0 20 1.39 157 177 146 170 161 176
PA 2 2 0.75 8.3 1.50 134 154 123 155 138 161
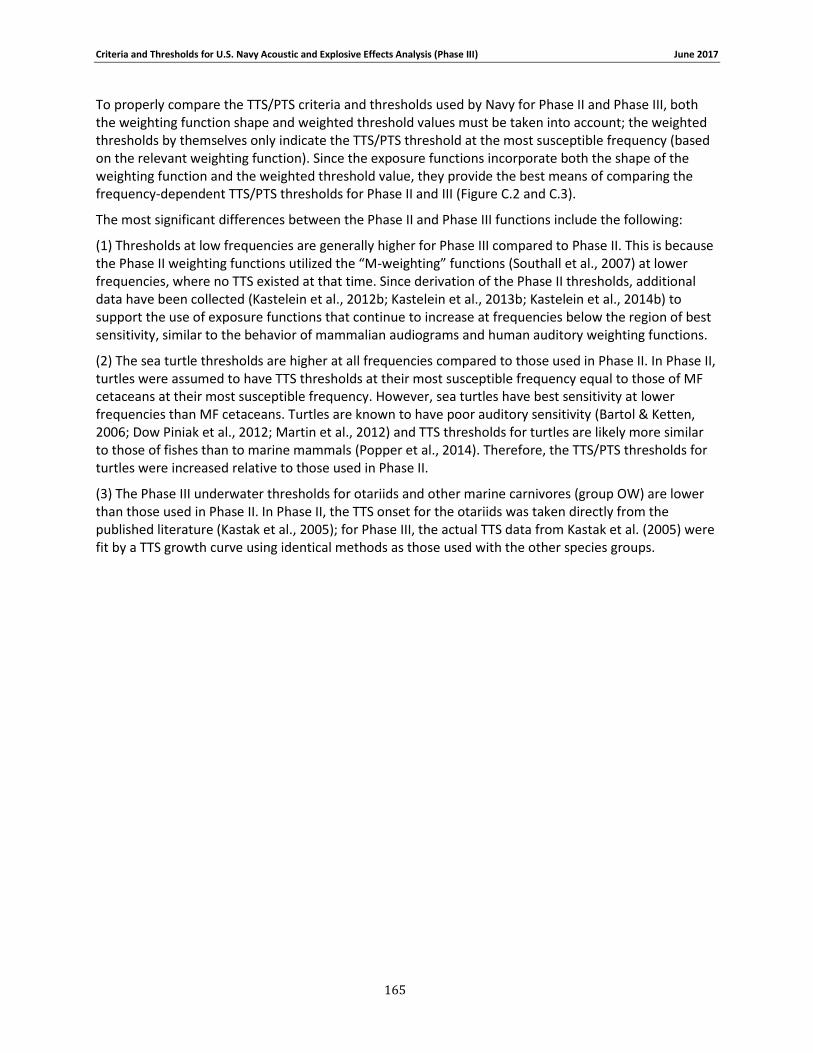
Criteria and Thresholds for U.S. Navy Acoustic and Explosive Effects Analysis (Phase III) June 2017
165
To properly compare the TTS/PTS criteria and thresholds used by Navy for Phase II and Phase III, both the weighting function shape and weighted threshold values must be taken into account; the weighted thresholds by themselves only indicate the TTS/PTS threshold at the most susceptible frequency (based on the relevant weighting function). Since the exposure functions incorporate both the shape of the weighting function and the weighted threshold value, they provide the best means of comparing the frequency-dependent TTS/PTS thresholds for Phase II and III (Figure C.2 and C.3).
The most significant differences between the Phase II and Phase III functions include the following:
(1) Thresholds at low frequencies are generally higher for Phase III compared to Phase II. This is because the Phase II weighting functions utilized the “M-weighting” functions (Southall et al., 2007) at lower frequencies, where no TTS existed at that time. Since derivation of the Phase II thresholds, additional data have been collected (Kastelein et al., 2012b; Kastelein et al., 2013b; Kastelein et al., 2014b) to support the use of exposure functions that continue to increase at frequencies below the region of best sensitivity, similar to the behavior of mammalian audiograms and human auditory weighting functions.
(2) The sea turtle thresholds are higher at all frequencies compared to those used in Phase II. In Phase II, turtles were assumed to have TTS thresholds at their most susceptible frequency equal to those of MF cetaceans at their most susceptible frequency. However, sea turtles have best sensitivity at lower frequencies than MF cetaceans. Turtles are known to have poor auditory sensitivity (Bartol & Ketten, 2006; Dow Piniak et al., 2012; Martin et al., 2012) and TTS thresholds for turtles are likely more similar to those of fishes than to marine mammals (Popper et al., 2014). Therefore, the TTS/PTS thresholds for turtles were increased relative to those used in Phase II.
(3) The Phase III underwater thresholds for otariids and other marine carnivores (group OW) are lower than those used in Phase II. In Phase II, the TTS onset for the otariids was taken directly from the published literature (Kastak et al., 2005); for Phase III, the actual TTS data from Kastak et al. (2005) were fit by a TTS growth curve using identical methods as those used with the other species groups.
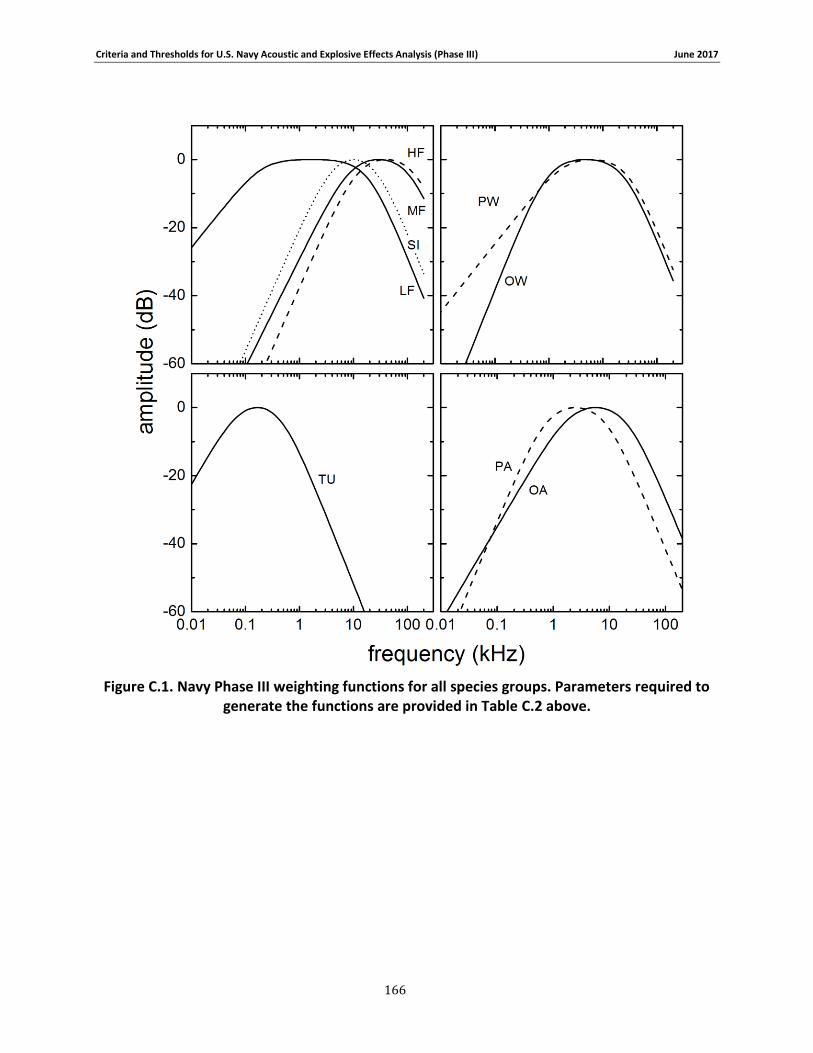
Criteria and Thresholds for U.S. Navy Acoustic and Explosive Effects Analysis (Phase III) June 2017
166
Figure C.1. Navy Phase III weighting functions for all species groups. Parameters required to generate the functions are provided in Table C.2 above.
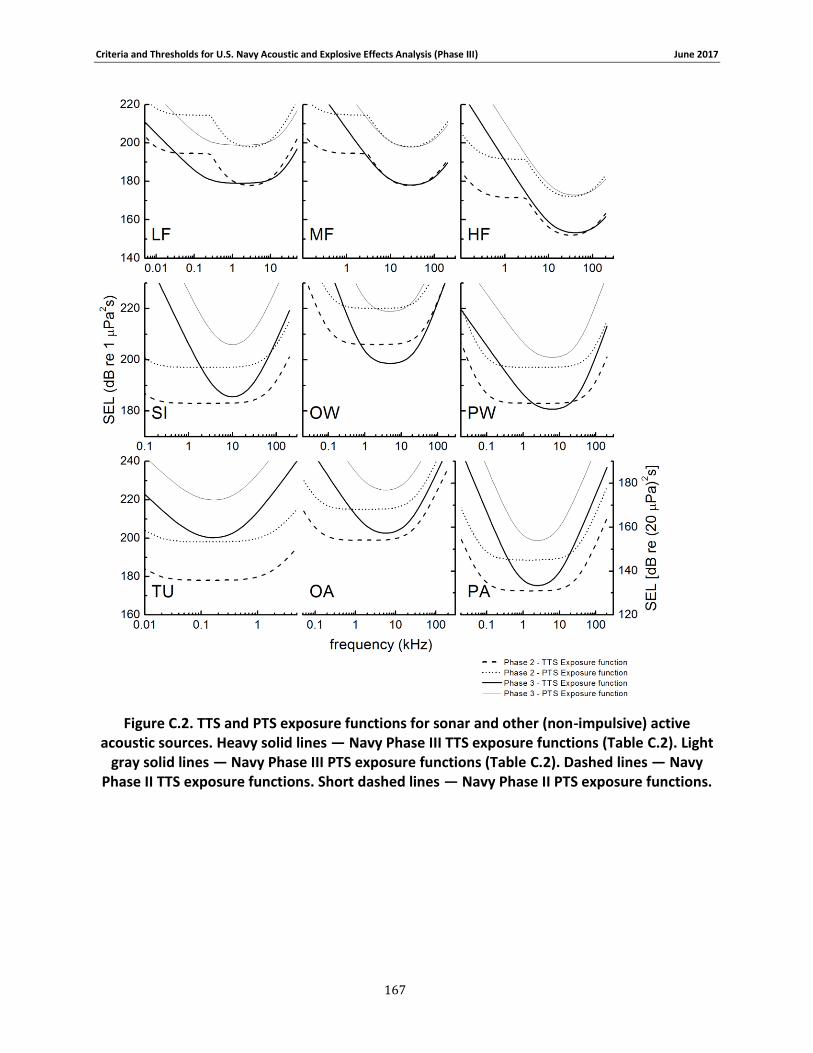
Criteria and Thresholds for U.S. Navy Acoustic and Explosive Effects Analysis (Phase III) June 2017
167
Figure C.2. TTS and PTS exposure functions for sonar and other (non-impulsive) active acoustic sources. Heavy solid lines — Navy Phase III TTS exposure functions (Table C.2). Light
gray solid lines — Navy Phase III PTS exposure functions (Table C.2). Dashed lines — Navy Phase II TTS exposure functions. Short dashed lines — Navy Phase II PTS exposure functions.
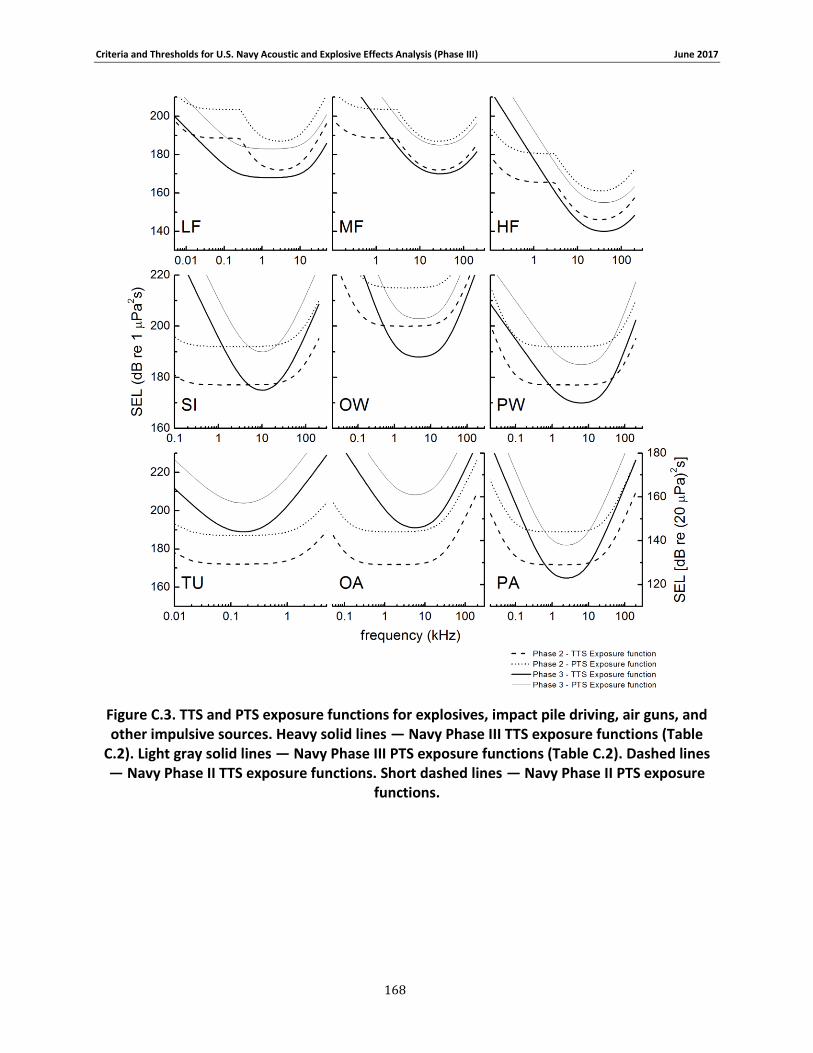
Criteria and Thresholds for U.S. Navy Acoustic and Explosive Effects Analysis (Phase III) June 2017
168
Figure C.3. TTS and PTS exposure functions for explosives, impact pile driving, air guns, and other impulsive sources. Heavy solid lines — Navy Phase III TTS exposure functions (Table
C.2). Light gray solid lines — Navy Phase III PTS exposure functions (Table C.2). Dashed lines — Navy Phase II TTS exposure functions. Short dashed lines — Navy Phase II PTS exposure
functions.
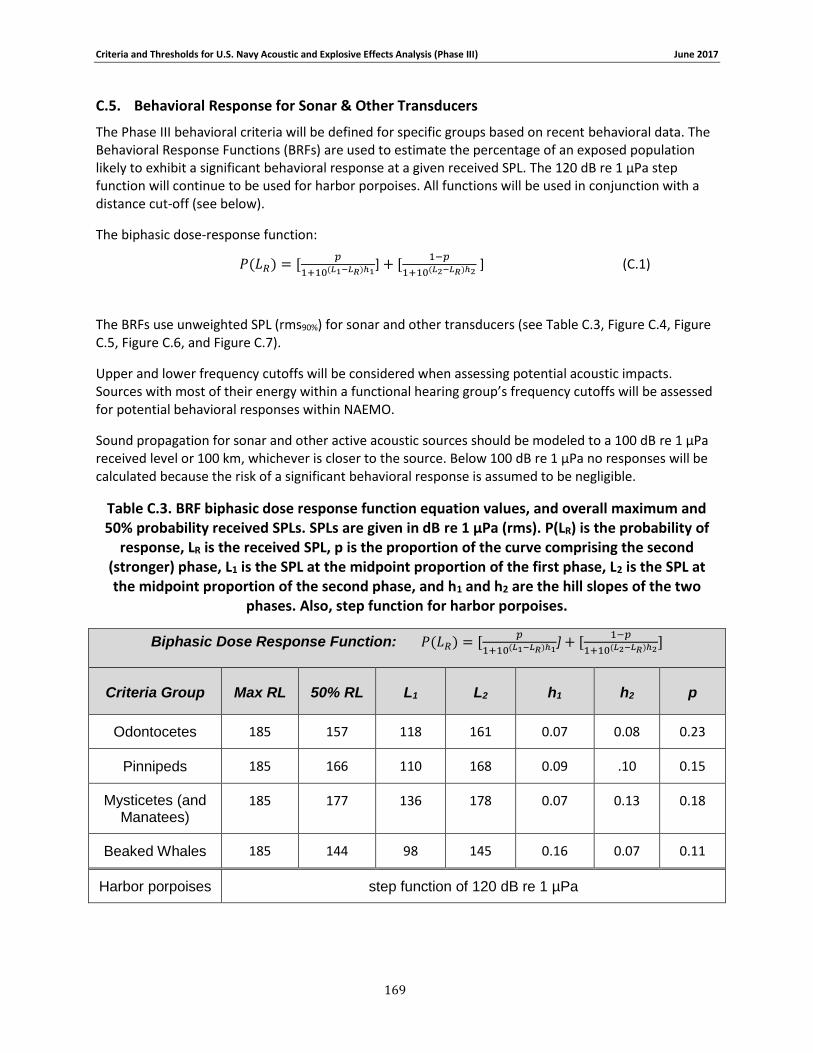
Criteria and Thresholds for U.S. Navy Acoustic and Explosive Effects Analysis (Phase III) June 2017
169
C.5. Behavioral Response for Sonar & Other Transducers
The Phase III behavioral criteria will be defined for specific groups based on recent behavioral data. The Behavioral Response Functions (BRFs) are used to estimate the percentage of an exposed population likely to exhibit a significant behavioral response at a given received SPL. The 120 dB re 1 µPa step function will continue to be used for harbor porpoises. All functions will be used in conjunction with a distance cut-off (see below).
The biphasic dose-response function:
𝑃(𝐿𝑅) = [𝑝
1+10(𝐿1−𝐿𝑅)ℎ1] + [
1−𝑝
1+10(𝐿2−𝐿𝑅)ℎ2 ] (C.1)
The BRFs use unweighted SPL (rms90%) for sonar and other transducers (see Table C.3, Figure C.4, Figure C.5, Figure C.6, and Figure C.7).
Upper and lower frequency cutoffs will be considered when assessing potential acoustic impacts. Sources with most of their energy within a functional hearing group’s frequency cutoffs will be assessed for potential behavioral responses within NAEMO.
Sound propagation for sonar and other active acoustic sources should be modeled to a 100 dB re 1 µPa received level or 100 km, whichever is closer to the source. Below 100 dB re 1 µPa no responses will be calculated because the risk of a significant behavioral response is assumed to be negligible.
Table C.3. BRF biphasic dose response function equation values, and overall maximum and 50% probability received SPLs. SPLs are given in dB re 1 µPa (rms). P(LR) is the probability of
response, LR is the received SPL, p is the proportion of the curve comprising the second (stronger) phase, L1 is the SPL at the midpoint proportion of the first phase, L2 is the SPL at the midpoint proportion of the second phase, and h1 and h2 are the hill slopes of the two
phases. Also, step function for harbor porpoises.
Biphasic Dose Response Function: 𝑃(𝐿𝑅) = [𝑝
1+10(𝐿1−𝐿𝑅)ℎ1] + [
1−𝑝
1+10(𝐿2−𝐿𝑅)ℎ2]
Criteria Group Max RL 50% RL L1 L2 h1 h2 p
Odontocetes 185 157 118 161 0.07 0.08 0.23
Pinnipeds 185 166 110 168 0.09 .10 0.15
Mysticetes (and Manatees)
185 177 136 178 0.07 0.13 0.18
Beaked Whales 185 144 98 145 0.16 0.07 0.11
Harbor porpoises step function of 120 dB re 1 µPa
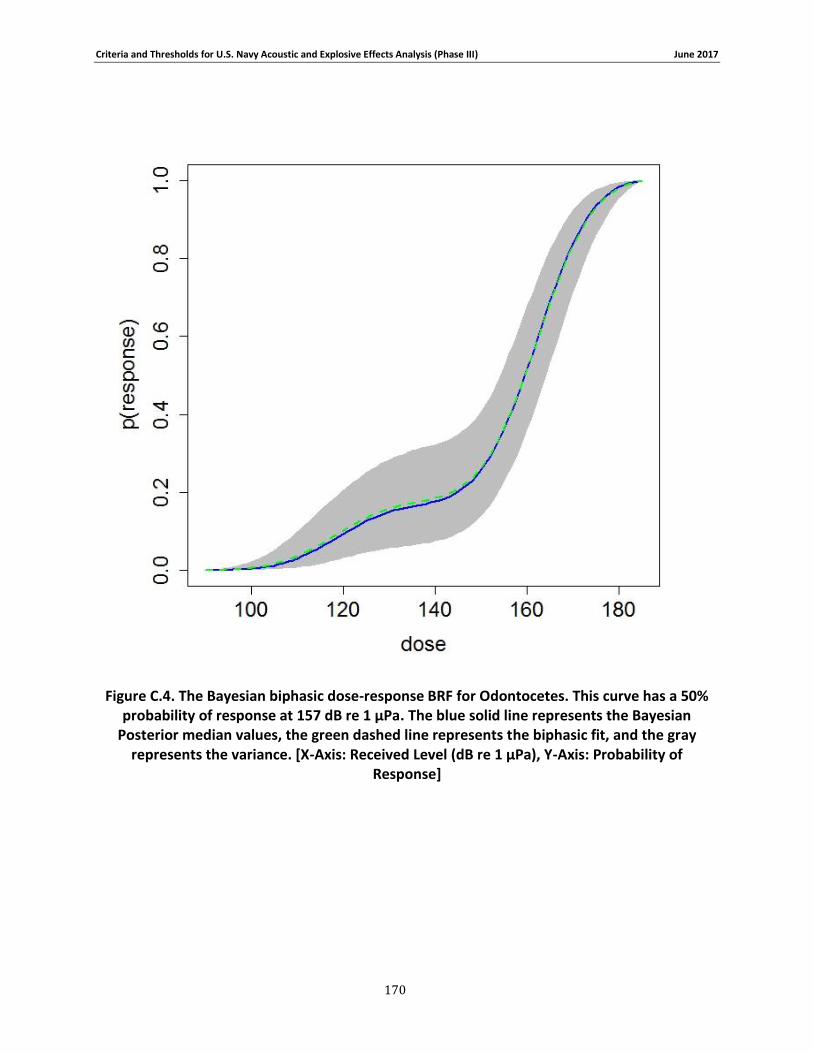
Criteria and Thresholds for U.S. Navy Acoustic and Explosive Effects Analysis (Phase III) June 2017
170
Figure C.4. The Bayesian biphasic dose-response BRF for Odontocetes. This curve has a 50% probability of response at 157 dB re 1 µPa. The blue solid line represents the Bayesian
Posterior median values, the green dashed line represents the biphasic fit, and the gray represents the variance. [X-Axis: Received Level (dB re 1 μPa), Y-Axis: Probability of
Response]
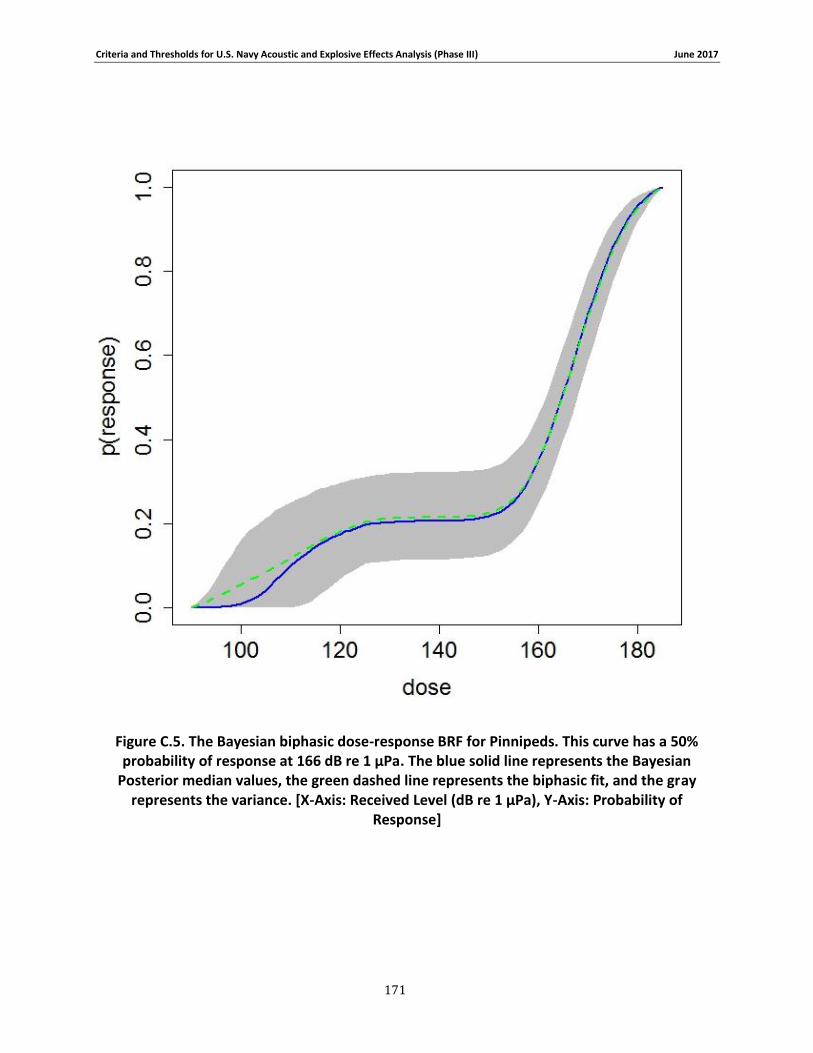
Criteria and Thresholds for U.S. Navy Acoustic and Explosive Effects Analysis (Phase III) June 2017
171
Figure C.5. The Bayesian biphasic dose-response BRF for Pinnipeds. This curve has a 50% probability of response at 166 dB re 1 µPa. The blue solid line represents the Bayesian
Posterior median values, the green dashed line represents the biphasic fit, and the gray represents the variance. [X-Axis: Received Level (dB re 1 μPa), Y-Axis: Probability of
Response]
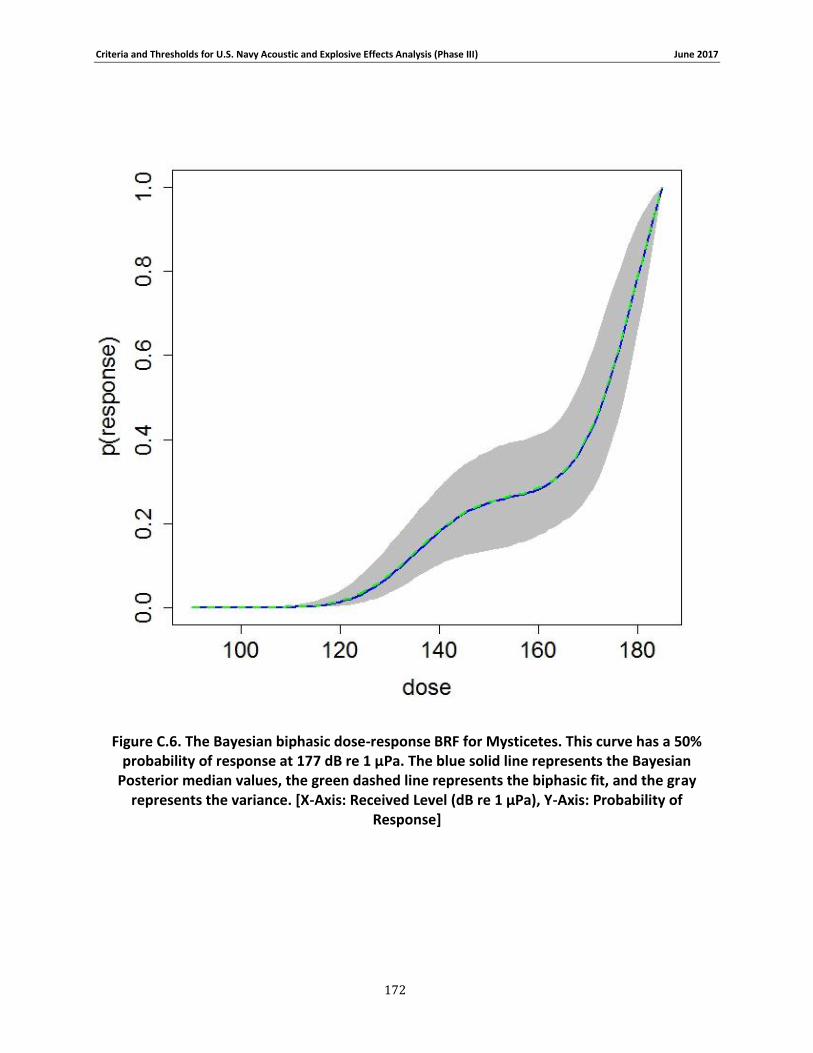
Criteria and Thresholds for U.S. Navy Acoustic and Explosive Effects Analysis (Phase III) June 2017
172
Figure C.6. The Bayesian biphasic dose-response BRF for Mysticetes. This curve has a 50% probability of response at 177 dB re 1 µPa. The blue solid line represents the Bayesian
Posterior median values, the green dashed line represents the biphasic fit, and the gray represents the variance. [X-Axis: Received Level (dB re 1 μPa), Y-Axis: Probability of
Response]
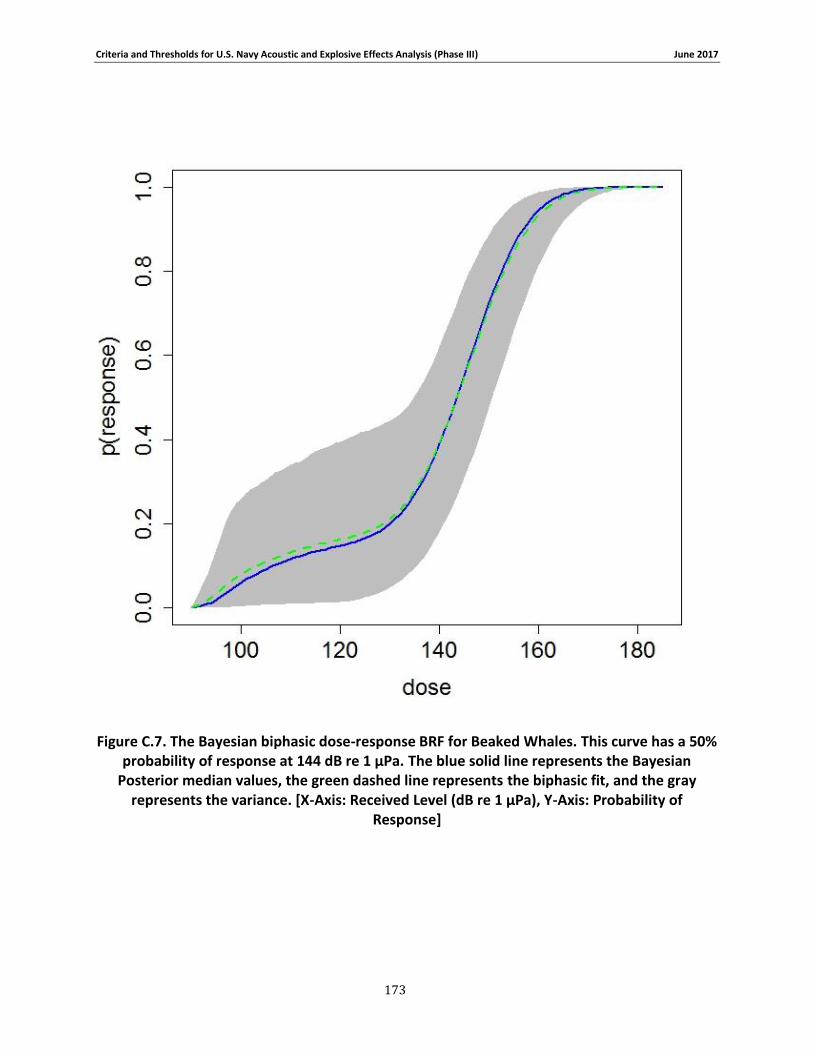
Criteria and Thresholds for U.S. Navy Acoustic and Explosive Effects Analysis (Phase III) June 2017
173
Figure C.7. The Bayesian biphasic dose-response BRF for Beaked Whales. This curve has a 50% probability of response at 144 dB re 1 µPa. The blue solid line represents the Bayesian
Posterior median values, the green dashed line represents the biphasic fit, and the gray represents the variance. [X-Axis: Received Level (dB re 1 μPa), Y-Axis: Probability of
Response]
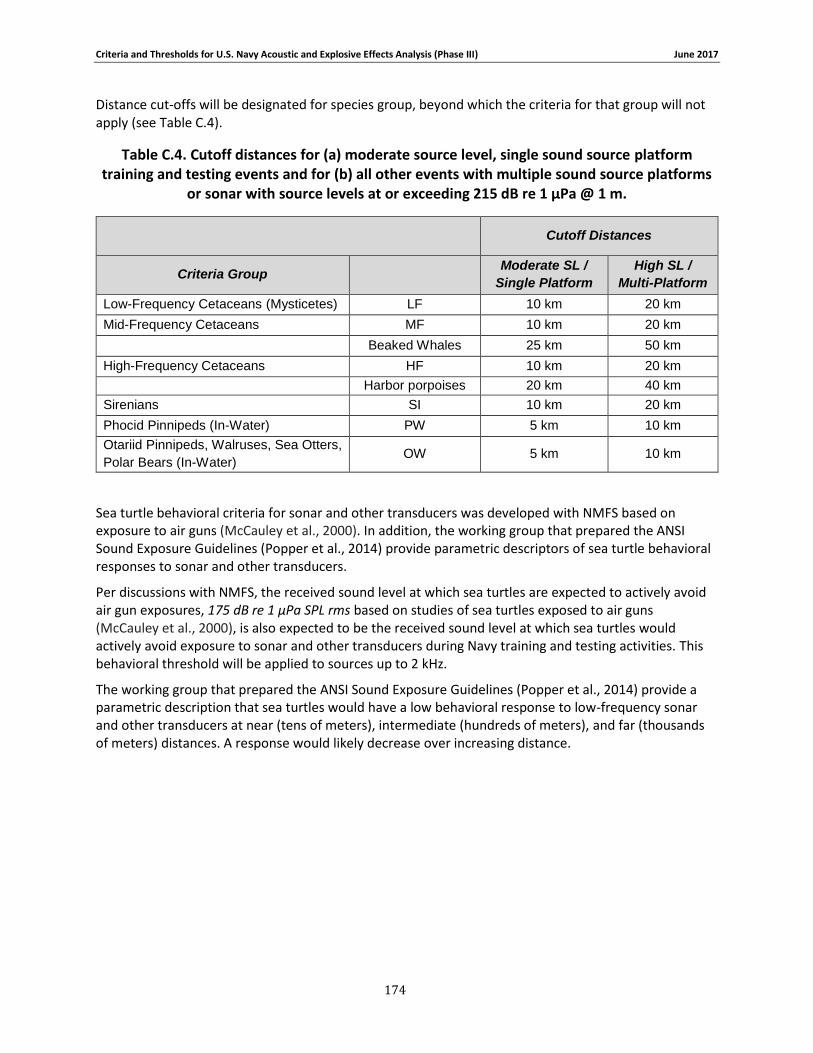
Criteria and Thresholds for U.S. Navy Acoustic and Explosive Effects Analysis (Phase III) June 2017
174
Distance cut-offs will be designated for species group, beyond which the criteria for that group will not apply (see Table C.4).
Table C.4. Cutoff distances for (a) moderate source level, single sound source platform training and testing events and for (b) all other events with multiple sound source platforms
or sonar with source levels at or exceeding 215 dB re 1 µPa @ 1 m.
Cutoff Distances
Criteria Group
Moderate SL /
Single Platform
High SL /
Multi-Platform
Low-Frequency Cetaceans (Mysticetes) LF 10 km 20 km
Mid-Frequency Cetaceans MF 10 km 20 km
Beaked Whales 25 km 50 km
High-Frequency Cetaceans HF 10 km 20 km
Harbor porpoises 20 km 40 km
Sirenians SI 10 km 20 km
Phocid Pinnipeds (In-Water) PW 5 km 10 km
Otariid Pinnipeds, Walruses, Sea Otters,
Polar Bears (In-Water) OW 5 km 10 km
Sea turtle behavioral criteria for sonar and other transducers was developed with NMFS based on exposure to air guns (McCauley et al., 2000). In addition, the working group that prepared the ANSI Sound Exposure Guidelines (Popper et al., 2014) provide parametric descriptors of sea turtle behavioral responses to sonar and other transducers.
Per discussions with NMFS, the received sound level at which sea turtles are expected to actively avoid air gun exposures, 175 dB re 1 µPa SPL rms based on studies of sea turtles exposed to air guns (McCauley et al., 2000), is also expected to be the received sound level at which sea turtles would actively avoid exposure to sonar and other transducers during Navy training and testing activities. This behavioral threshold will be applied to sources up to 2 kHz.
The working group that prepared the ANSI Sound Exposure Guidelines (Popper et al., 2014) provide a parametric description that sea turtles would have a low behavioral response to low-frequency sonar and other transducers at near (tens of meters), intermediate (hundreds of meters), and far (thousands of meters) distances. A response would likely decrease over increasing distance.
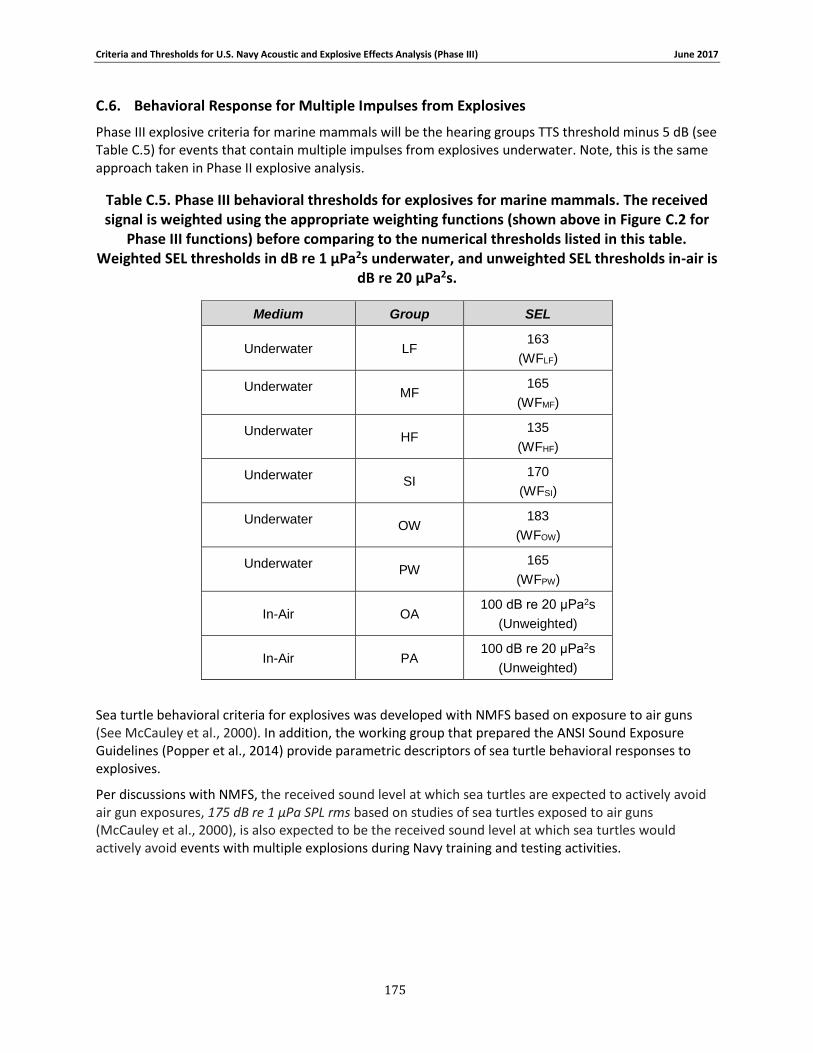
Criteria and Thresholds for U.S. Navy Acoustic and Explosive Effects Analysis (Phase III) June 2017
175
C.6. Behavioral Response for Multiple Impulses from Explosives
Phase III explosive criteria for marine mammals will be the hearing groups TTS threshold minus 5 dB (see Table C.5) for events that contain multiple impulses from explosives underwater. Note, this is the same approach taken in Phase II explosive analysis.
Table C.5. Phase III behavioral thresholds for explosives for marine mammals. The received signal is weighted using the appropriate weighting functions (shown above in Figure C.2 for
Phase III functions) before comparing to the numerical thresholds listed in this table. Weighted SEL thresholds in dB re 1 μPa2s underwater, and unweighted SEL thresholds in-air is
dB re 20 μPa2s.
Sea turtle behavioral criteria for explosives was developed with NMFS based on exposure to air guns (See McCauley et al., 2000). In addition, the working group that prepared the ANSI Sound Exposure Guidelines (Popper et al., 2014) provide parametric descriptors of sea turtle behavioral responses to explosives.
Per discussions with NMFS, the received sound level at which sea turtles are expected to actively avoid air gun exposures, 175 dB re 1 µPa SPL rms based on studies of sea turtles exposed to air guns (McCauley et al., 2000), is also expected to be the received sound level at which sea turtles would actively avoid events with multiple explosions during Navy training and testing activities.
Medium Group SEL
Underwater LF 163
(WFLF)
Underwater MF
165
(WFMF)
Underwater HF
135
(WFHF)
Underwater SI
170
(WFSI)
Underwater OW
183
(WFOW)
Underwater PW
165
(WFPW)
In-Air OA 100 dB re 20 μPa2s
(Unweighted)
In-Air PA 100 dB re 20 μPa2s
(Unweighted)
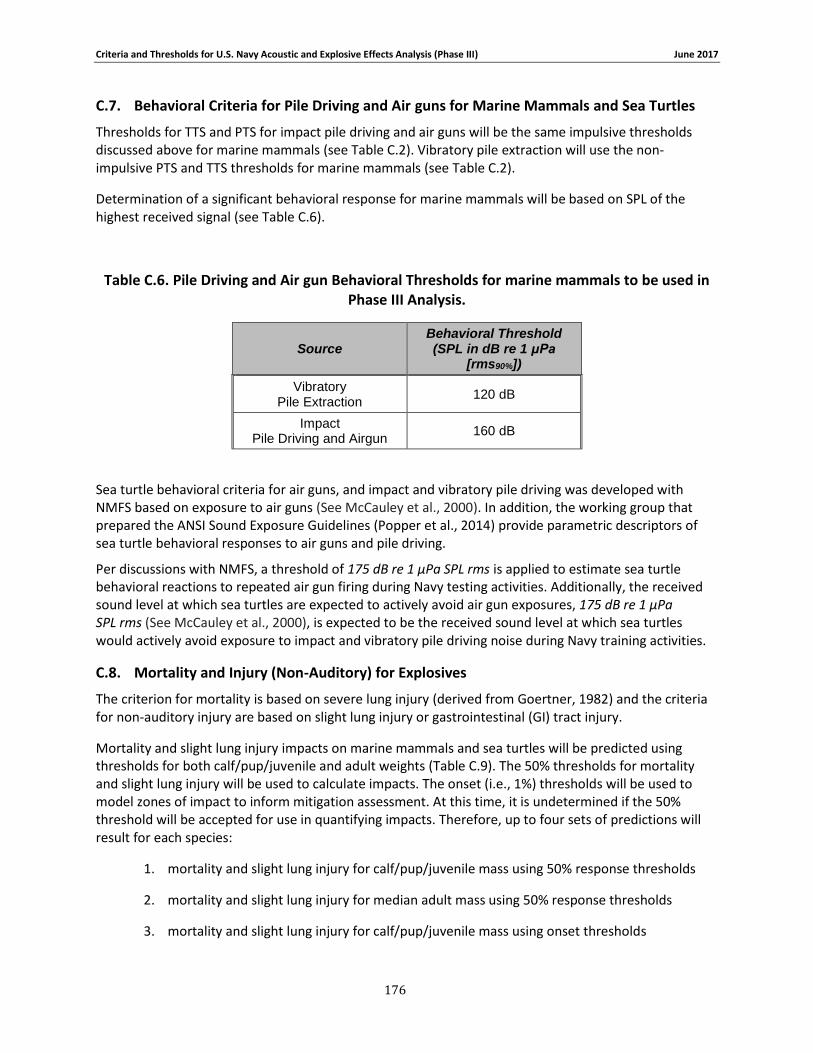
Criteria and Thresholds for U.S. Navy Acoustic and Explosive Effects Analysis (Phase III) June 2017
176
C.7. Behavioral Criteria for Pile Driving and Air guns for Marine Mammals and Sea Turtles
Thresholds for TTS and PTS for impact pile driving and air guns will be the same impulsive thresholds discussed above for marine mammals (see Table C.2). Vibratory pile extraction will use the non-impulsive PTS and TTS thresholds for marine mammals (see Table C.2).
Determination of a significant behavioral response for marine mammals will be based on SPL of the highest received signal (see Table C.6).
Table C.6. Pile Driving and Air gun Behavioral Thresholds for marine mammals to be used in Phase III Analysis.
Source Behavioral Threshold (SPL in dB re 1 μPa
[rms90%])
Vibratory Pile Extraction
120 dB
Impact Pile Driving and Airgun
160 dB
Sea turtle behavioral criteria for air guns, and impact and vibratory pile driving was developed with NMFS based on exposure to air guns (See McCauley et al., 2000). In addition, the working group that prepared the ANSI Sound Exposure Guidelines (Popper et al., 2014) provide parametric descriptors of sea turtle behavioral responses to air guns and pile driving.
Per discussions with NMFS, a threshold of 175 dB re 1 µPa SPL rms is applied to estimate sea turtle behavioral reactions to repeated air gun firing during Navy testing activities. Additionally, the received sound level at which sea turtles are expected to actively avoid air gun exposures, 175 dB re 1 µPa SPL rms (See McCauley et al., 2000), is expected to be the received sound level at which sea turtles would actively avoid exposure to impact and vibratory pile driving noise during Navy training activities.
C.8. Mortality and Injury (Non-Auditory) for Explosives
The criterion for mortality is based on severe lung injury (derived from Goertner, 1982) and the criteria for non-auditory injury are based on slight lung injury or gastrointestinal (GI) tract injury.
Mortality and slight lung injury impacts on marine mammals and sea turtles will be predicted using thresholds for both calf/pup/juvenile and adult weights (Table C.9). The 50% thresholds for mortality and slight lung injury will be used to calculate impacts. The onset (i.e., 1%) thresholds will be used to model zones of impact to inform mitigation assessment. At this time, it is undetermined if the 50% threshold will be accepted for use in quantifying impacts. Therefore, up to four sets of predictions will result for each species:
1. mortality and slight lung injury for calf/pup/juvenile mass using 50% response thresholds
2. mortality and slight lung injury for median adult mass using 50% response thresholds
3. mortality and slight lung injury for calf/pup/juvenile mass using onset thresholds
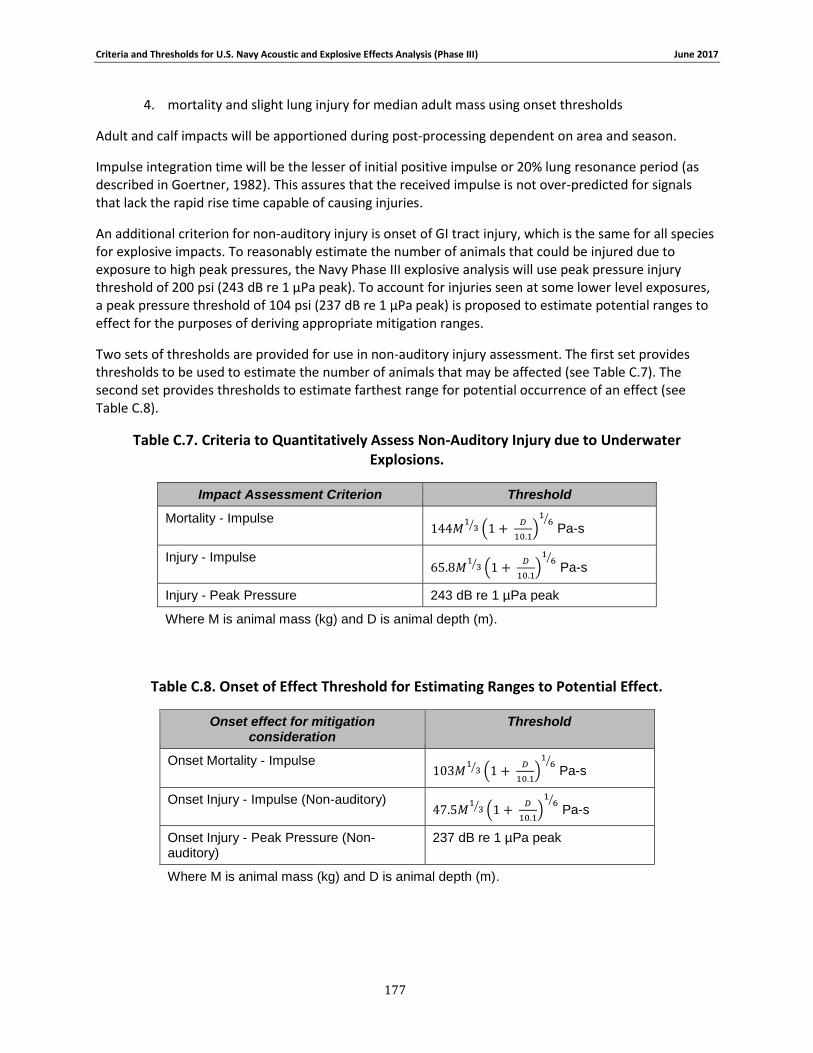
Criteria and Thresholds for U.S. Navy Acoustic and Explosive Effects Analysis (Phase III) June 2017
177
4. mortality and slight lung injury for median adult mass using onset thresholds
Adult and calf impacts will be apportioned during post-processing dependent on area and season.
Impulse integration time will be the lesser of initial positive impulse or 20% lung resonance period (as described in Goertner, 1982). This assures that the received impulse is not over-predicted for signals that lack the rapid rise time capable of causing injuries.
An additional criterion for non-auditory injury is onset of GI tract injury, which is the same for all species for explosive impacts. To reasonably estimate the number of animals that could be injured due to exposure to high peak pressures, the Navy Phase III explosive analysis will use peak pressure injury threshold of 200 psi (243 dB re 1 µPa peak). To account for injuries seen at some lower level exposures, a peak pressure threshold of 104 psi (237 dB re 1 µPa peak) is proposed to estimate potential ranges to effect for the purposes of deriving appropriate mitigation ranges.
Two sets of thresholds are provided for use in non-auditory injury assessment. The first set provides thresholds to be used to estimate the number of animals that may be affected (see Table C.7). The second set provides thresholds to estimate farthest range for potential occurrence of an effect (see Table C.8).
Table C.7. Criteria to Quantitatively Assess Non-Auditory Injury due to Underwater Explosions.
Impact Assessment Criterion Threshold
Mortality - Impulse 144𝑀
13⁄ (1 +
𝐷
10.1)
16⁄
Pa-s
Injury - Impulse 65.8𝑀
13⁄ (1 +
𝐷
10.1)
16⁄
Pa-s
Injury - Peak Pressure 243 dB re 1 µPa peak
Where M is animal mass (kg) and D is animal depth (m).
Table C.8. Onset of Effect Threshold for Estimating Ranges to Potential Effect.
Onset effect for mitigation consideration
Threshold
Onset Mortality - Impulse 103𝑀
13⁄ (1 +
𝐷
10.1)
16⁄
Pa-s
Onset Injury - Impulse (Non-auditory) 47.5𝑀
13⁄ (1 +
𝐷
10.1)
16⁄
Pa-s
Onset Injury - Peak Pressure (Non-auditory)
237 dB re 1 µPa peak
Where M is animal mass (kg) and D is animal depth (m).
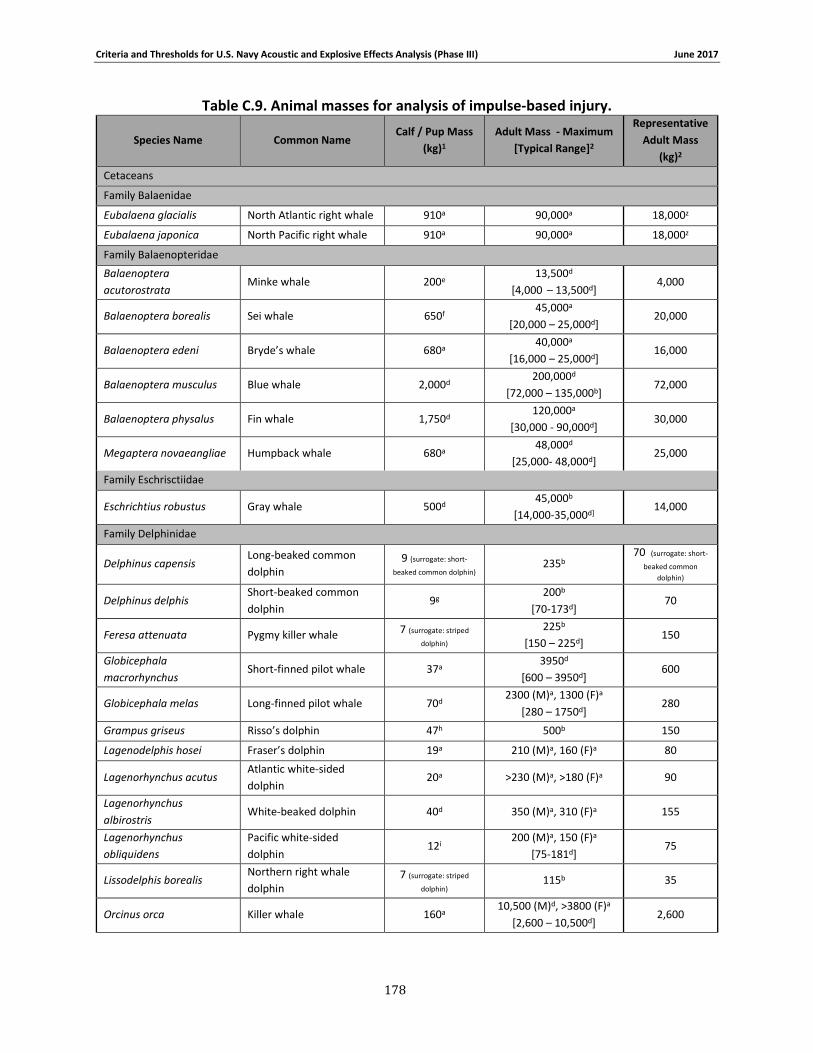
Criteria and Thresholds for U.S. Navy Acoustic and Explosive Effects Analysis (Phase III) June 2017
178
Table C.9. Animal masses for analysis of impulse-based injury.
Species Name Common Name Calf / Pup Mass
(kg)1
Adult Mass - Maximum
[Typical Range]2
Representative
Adult Mass
(kg)2
Cetaceans
Family Balaenidae
Eubalaena glacialis North Atlantic right whale 910a 90,000a 18,000z
Eubalaena japonica North Pacific right whale 910a 90,000a 18,000z
Family Balaenopteridae
Balaenoptera
acutorostrata Minke whale 200e
13,500d
[4,000 – 13,500d] 4,000
Balaenoptera borealis Sei whale 650f 45,000a
[20,000 – 25,000d] 20,000
Balaenoptera edeni Bryde’s whale 680a 40,000a
[16,000 – 25,000d] 16,000
Balaenoptera musculus Blue whale 2,000d 200,000d
[72,000 – 135,000b] 72,000
Balaenoptera physalus Fin whale 1,750d 120,000a
[30,000 - 90,000d] 30,000
Megaptera novaeangliae Humpback whale 680a 48,000d
[25,000- 48,000d] 25,000
Family Eschrisctiidae
Eschrichtius robustus Gray whale 500d 45,000b
[14,000-35,000d] 14,000
Family Delphinidae
Delphinus capensis Long-beaked common
dolphin 9 (surrogate: short-
beaked common dolphin) 235b
70 (surrogate: short-
beaked common
dolphin)
Delphinus delphis Short-beaked common
dolphin 9g
200b
[70-173d] 70
Feresa attenuata Pygmy killer whale 7 (surrogate: striped
dolphin)
225b
[150 – 225d] 150
Globicephala
macrorhynchus Short-finned pilot whale 37a
3950d
[600 – 3950d] 600
Globicephala melas Long-finned pilot whale 70d 2300 (M)a, 1300 (F)a
[280 – 1750d] 280
Grampus griseus Risso’s dolphin 47h 500b 150
Lagenodelphis hosei Fraser’s dolphin 19a 210 (M)a, 160 (F)a 80
Lagenorhynchus acutus Atlantic white-sided
dolphin 20a >230 (M)a, >180 (F)a 90
Lagenorhynchus
albirostris White-beaked dolphin 40d 350 (M)a, 310 (F)a 155
Lagenorhynchus
obliquidens
Pacific white-sided
dolphin 12i
200 (M)a, 150 (F)a
[75-181d] 75
Lissodelphis borealis Northern right whale
dolphin 7 (surrogate: striped
dolphin) 115b 35
Orcinus orca Killer whale 160a 10,500 (M)d, >3800 (F)a
[2,600 – 10,500d] 2,600
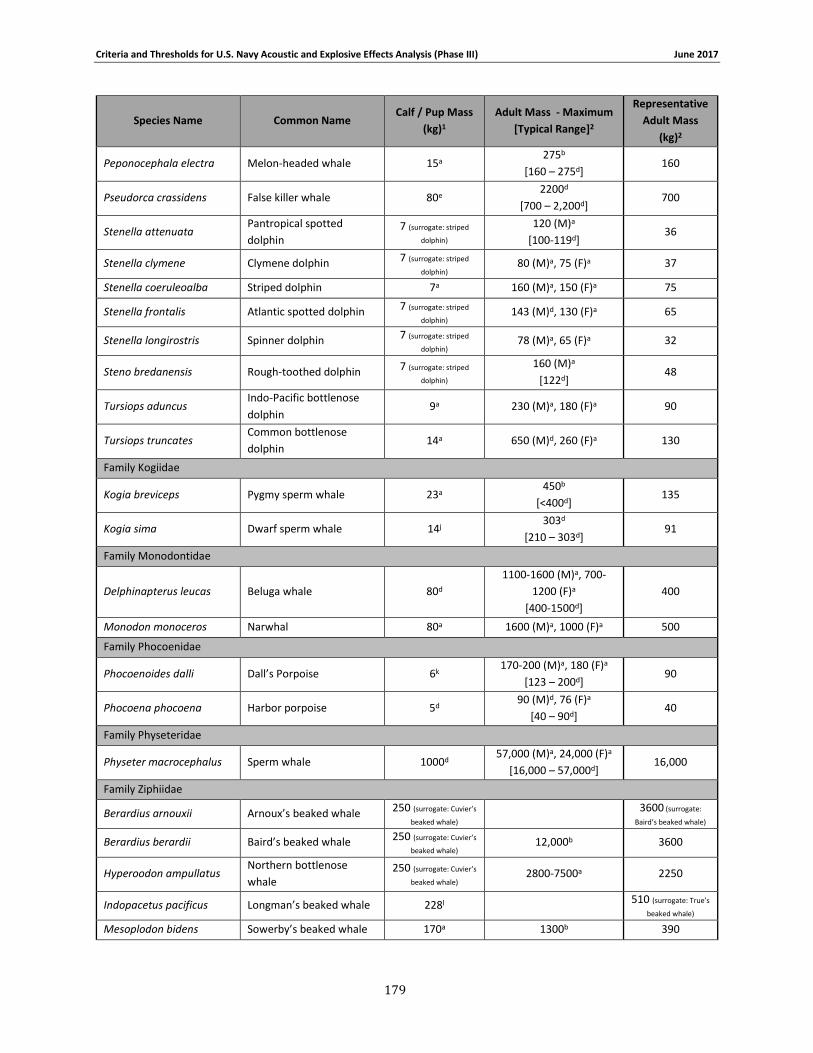
Criteria and Thresholds for U.S. Navy Acoustic and Explosive Effects Analysis (Phase III) June 2017
179
Species Name Common Name Calf / Pup Mass
(kg)1
Adult Mass - Maximum
[Typical Range]2
Representative
Adult Mass
(kg)2
Peponocephala electra Melon-headed whale 15a 275b
[160 – 275d] 160
Pseudorca crassidens False killer whale 80e 2200d
[700 – 2,200d] 700
Stenella attenuata Pantropical spotted
dolphin 7 (surrogate: striped
dolphin)
120 (M)a
[100-119d] 36
Stenella clymene Clymene dolphin 7 (surrogate: striped
dolphin) 80 (M)a, 75 (F)a 37
Stenella coeruleoalba Striped dolphin 7a 160 (M)a, 150 (F)a 75
Stenella frontalis Atlantic spotted dolphin 7 (surrogate: striped
dolphin) 143 (M)d, 130 (F)a 65
Stenella longirostris Spinner dolphin 7 (surrogate: striped
dolphin) 78 (M)a, 65 (F)a 32
Steno bredanensis Rough-toothed dolphin 7 (surrogate: striped
dolphin)
160 (M)a
[122d] 48
Tursiops aduncus Indo-Pacific bottlenose
dolphin 9a 230 (M)a, 180 (F)a 90
Tursiops truncates Common bottlenose
dolphin 14a 650 (M)d, 260 (F)a 130
Family Kogiidae
Kogia breviceps Pygmy sperm whale 23a 450b
[<400d] 135
Kogia sima Dwarf sperm whale 14j 303d
[210 – 303d] 91
Family Monodontidae
Delphinapterus leucas Beluga whale 80d
1100-1600 (M)a, 700-
1200 (F)a
[400-1500d]
400
Monodon monoceros Narwhal 80a 1600 (M)a, 1000 (F)a 500
Family Phocoenidae
Phocoenoides dalli Dall’s Porpoise 6k 170-200 (M)a, 180 (F)a
[123 – 200d] 90
Phocoena phocoena Harbor porpoise 5d 90 (M)d, 76 (F)a
[40 – 90d] 40
Family Physeteridae
Physeter macrocephalus Sperm whale 1000d 57,000 (M)a, 24,000 (F)a
[16,000 – 57,000d] 16,000
Family Ziphiidae
Berardius arnouxii Arnoux’s beaked whale 250 (surrogate: Cuvier’s
beaked whale) 3600 (surrogate:
Baird’s beaked whale)
Berardius berardii Baird’s beaked whale 250 (surrogate: Cuvier’s
beaked whale) 12,000b 3600
Hyperoodon ampullatus Northern bottlenose
whale 250 (surrogate: Cuvier’s
beaked whale) 2800-7500a 2250
Indopacetus pacificus Longman’s beaked whale 228l 510 (surrogate: True’s
beaked whale)
Mesoplodon bidens Sowerby’s beaked whale 170a 1300b 390
Criteria and Thresholds for U.S. Navy Acoustic and Explosive Effects Analysis (Phase III) June 2017
180
Species Name Common Name Calf / Pup Mass
(kg)1
Adult Mass - Maximum
[Typical Range]2
Representative
Adult Mass
(kg)2
Mesoplodon carlhubbsi Hubb’s beaked whale 170 (surrogate:
Sowerby’s beaked whale) 1500a 450
Mesoplodon densirostris Blainville’s beaked whale 60d >800 (M)a, >1000 (F)a 400
Mesoplodon europaeus Gervais’ beaked whale 49d >1200a 366
Mesoplodon ginkgodens Ginkgo-toothed beaked
whale 60 (surrogate:
Blainville’s beaked whale)
400 (surrogate:
Blainville’s beaked
whale)
Meosplodon hectori Hector’s beaked whale 60 (surrogate:
Blainville’s beaked whale) [<800d] 240
Mesoplodon layardii Strap-toothed whale 170 (surrogate:
Sowerby’s beaked whale) >1300b 390
Mesoplodon mirus True’s beaked whale 136d >1020 (M)a, 1400 (F)a 510
Mesoplodon perrini Perrin’s beaked whale 60 (surrogate:
Blainville’s beaked whale) 400
Mesoplodon peruvianus Pygmy beaked whale 49 (surrogate: Gervais’
beaked whale) 240
Mesoplodon stejnegeri Stejneger’s beaked whale 80b 1600b 480
Tasmacetus shepherdi Shepherd’s beaked whale 170 (surrogate:
Sowerby’s beaked whale)
390 (surrogate:
Sowerby’s beaked
whale)
Ziphius cavirostris Cuvier’s beaked whale 250a 2600 (M)a, 3000 (F)a 1300
Carnivores
Family Mustelidae
Enhydra lutris Sea otter 2a 45 (M)a, 33 (F)a 16
Family Phocidae
Cystophora cristata Hooded seal 22a, w, x, nn
400 (M)a, 300 (F)a
[192-352 (M)b, 145-300
(F)b]
145
Erignathus barbatus Bearded seal 29m, y, oo, pp, qq 260 (M)a, 425 (F)c
[250-300c] 130
Halichoerus grypus Gray seal 13n, z, rr, ss, tt, uu, vv,
ww
400 (M)c, 250 (F)c
[170-310 (M)b, 105-186
(F)b]
105
Histriophoca fasciata Ribbon seal 22kk, ll 90b-148b
[72 – 90c] 72
Mirounga angustirostris Northern elephant seal 88mm 2500 (M)b, 710 (F)b
[2000(M)-600(F)1] 355
Monachus schauinslandi Hawaiian monk seal 50aa, bb 230 (M)a, 270 (F)a
[170 – 240c] 165
Pagophilus groenlandicus Harp seal 18b, z, cc, dd, ee 140 (M)a, 130 (F)a
[135 (M)b, 120 (F)b] 65
Phoca vitulina Harbor seal 8b, ff, ll
170 (M)a, 130 (F)a
[70-150 (M)b, 60-110
(F)b]
60
Pusa hispida Ringed seal 20y 110a
[50-70b] 50
Phoca largha Spotted seal 20gg 130a
[82-123b] 82
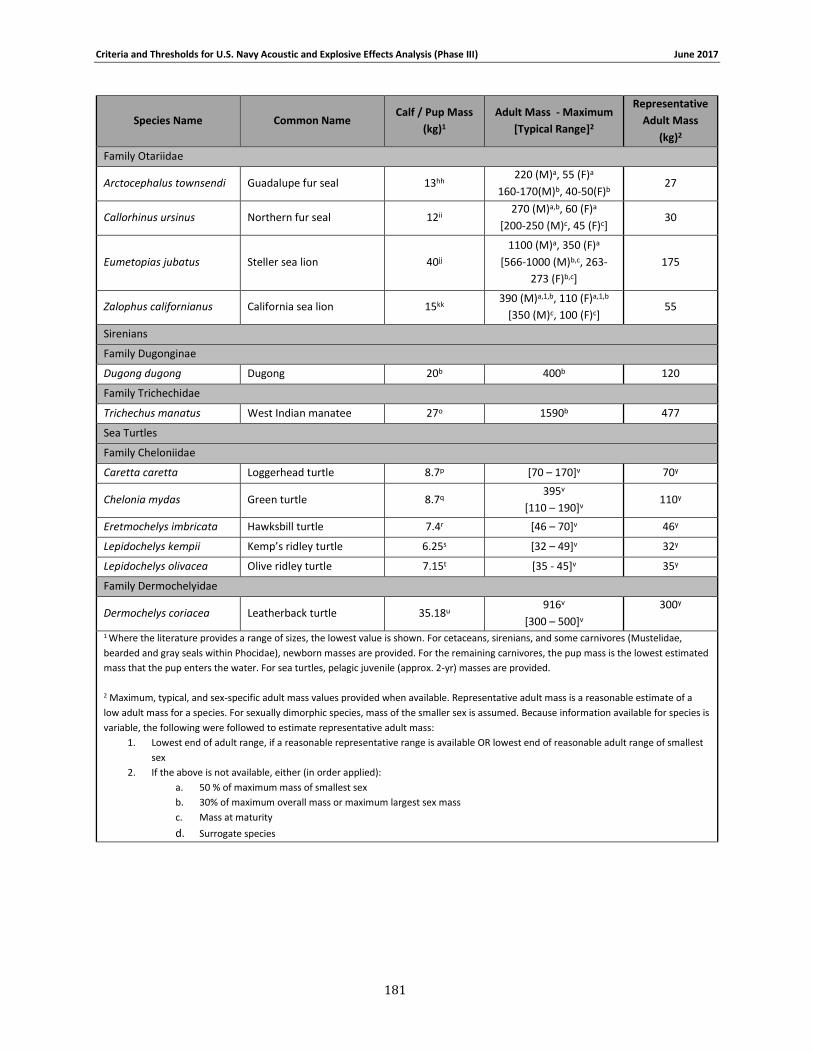
Criteria and Thresholds for U.S. Navy Acoustic and Explosive Effects Analysis (Phase III) June 2017
181
Species Name Common Name Calf / Pup Mass
(kg)1
Adult Mass - Maximum
[Typical Range]2
Representative
Adult Mass
(kg)2
Family Otariidae
Arctocephalus townsendi Guadalupe fur seal 13hh 220 (M)a, 55 (F)a
160-170(M)b, 40-50(F)b 27
Callorhinus ursinus Northern fur seal 12ii 270 (M)a,b, 60 (F)a
[200-250 (M)c, 45 (F)c] 30
Eumetopias jubatus Steller sea lion 40jj
1100 (M)a, 350 (F)a
[566-1000 (M)b,c, 263-
273 (F)b,c]
175
Zalophus californianus California sea lion 15kk 390 (M)a,1,b, 110 (F)a,1,b
[350 (M)c, 100 (F)c] 55
Sirenians
Family Dugonginae
Dugong dugong Dugong 20b 400b 120
Family Trichechidae
Trichechus manatus West Indian manatee 27o 1590b 477
Sea Turtles
Family Cheloniidae
Caretta caretta Loggerhead turtle 8.7p [70 – 170]v 70y
Chelonia mydas Green turtle 8.7q 395v
[110 – 190]v 110y
Eretmochelys imbricata Hawksbill turtle 7.4r [46 – 70]v 46y
Lepidochelys kempii Kemp’s ridley turtle 6.25s [32 – 49]v 32y
Lepidochelys olivacea Olive ridley turtle 7.15t [35 - 45]v 35y
Family Dermochelyidae
Dermochelys coriacea Leatherback turtle 35.18u 916v
[300 – 500]v
300y
1 Where the literature provides a range of sizes, the lowest value is shown. For cetaceans, sirenians, and some carnivores (Mustelidae,
bearded and gray seals within Phocidae), newborn masses are provided. For the remaining carnivores, the pup mass is the lowest estimated
mass that the pup enters the water. For sea turtles, pelagic juvenile (approx. 2-yr) masses are provided.
2 Maximum, typical, and sex-specific adult mass values provided when available. Representative adult mass is a reasonable estimate of a
low adult mass for a species. For sexually dimorphic species, mass of the smaller sex is assumed. Because information available for species is
variable, the following were followed to estimate representative adult mass:
1. Lowest end of adult range, if a reasonable representative range is available OR lowest end of reasonable adult range of smallest
sex
2. If the above is not available, either (in order applied):
a. 50 % of maximum mass of smallest sex
b. 30% of maximum overall mass or maximum largest sex mass
c. Mass at maturity
d. Surrogate species
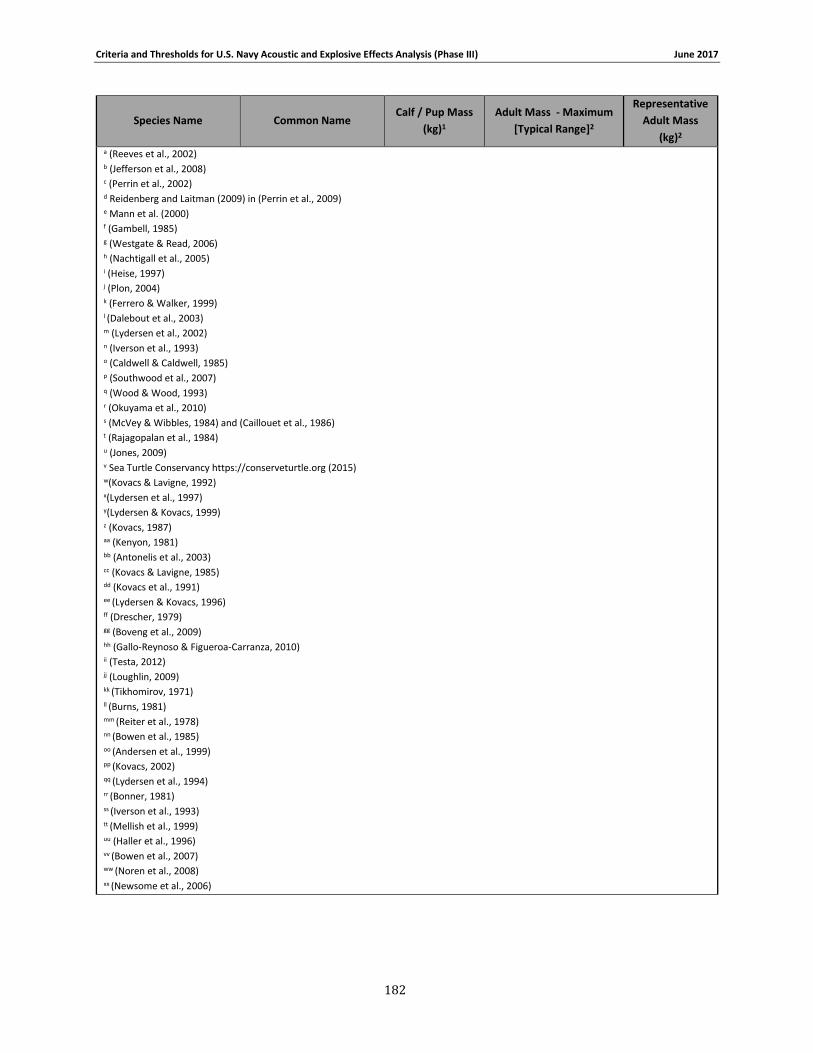
Criteria and Thresholds for U.S. Navy Acoustic and Explosive Effects Analysis (Phase III) June 2017
182
Species Name Common Name Calf / Pup Mass
(kg)1
Adult Mass - Maximum
[Typical Range]2
Representative
Adult Mass
(kg)2 a (Reeves et al., 2002) b (Jefferson et al., 2008) c (Perrin et al., 2002) d Reidenberg and Laitman (2009) in (Perrin et al., 2009) e Mann et al. (2000) f (Gambell, 1985) g (Westgate & Read, 2006) h (Nachtigall et al., 2005) i (Heise, 1997) j (Plon, 2004) k (Ferrero & Walker, 1999) l (Dalebout et al., 2003) m (Lydersen et al., 2002) n (Iverson et al., 1993) o (Caldwell & Caldwell, 1985) p (Southwood et al., 2007) q (Wood & Wood, 1993) r (Okuyama et al., 2010) s (McVey & Wibbles, 1984) and (Caillouet et al., 1986) t (Rajagopalan et al., 1984) u (Jones, 2009) v Sea Turtle Conservancy https://conserveturtle.org (2015) w(Kovacs & Lavigne, 1992) x(Lydersen et al., 1997) y(Lydersen & Kovacs, 1999) z (Kovacs, 1987) aa (Kenyon, 1981) bb (Antonelis et al., 2003) cc (Kovacs & Lavigne, 1985) dd (Kovacs et al., 1991) ee (Lydersen & Kovacs, 1996) ff (Drescher, 1979) gg (Boveng et al., 2009) hh (Gallo-Reynoso & Figueroa-Carranza, 2010) ii (Testa, 2012) jj (Loughlin, 2009) kk (Tikhomirov, 1971) ll (Burns, 1981) mm (Reiter et al., 1978) nn (Bowen et al., 1985) oo (Andersen et al., 1999) pp (Kovacs, 2002) qq (Lydersen et al., 1994) rr (Bonner, 1981) ss (Iverson et al., 1993) tt (Mellish et al., 1999) uu (Haller et al., 1996) vv (Bowen et al., 2007) ww (Noren et al., 2008) xx (Newsome et al., 2006)
Criteria and Thresholds for U.S. Navy Acoustic and Explosive Effects Analysis (Phase III) June 2017
183
LIST OF PREPARERS
Authors
James Finneran, PhD. (Space and Naval Warfare Systems Command), Bioacoustic Scientist
Elizabeth Henderson, PhD. (Space and Naval Warfare Systems Command), Bioacoustic Scientist
Dorian Houser, PhD. (Space and Naval Warfare Systems Command), Bioacoustic Scientist
Keith Jenkins (Space and Naval Warfare Systems Command), Marine Resources Specialist
Sarah Kotecki (Space and Naval Warfare Systems Command), Environmental Engineer
Jason Mulsow, PhD. (National Marine Mammal Foundation), Bioacoustic Scientist
Editors
Victoria Bowman (National Marine Mammal Foundation), Environmental Scientist
Cameron Martin (National Marine Mammal Foundation), Environmental Scientist
Sarah Rider (G2 Software Systems), Marine Resources Specialist
Jennie Shield (Space and Naval Warfare Systems Command), Biotechnician
Michelle Tishler (National Marine Mammal Foundation), Marine Resources Specialist
Rebecca Weeks (National Marine Mammal Foundation), Marine Resources Specialist